As filed with the Securities and Exchange Commission on January 8, 2010
1933 Act Registration File No. 333-163870
SECURITIES AND EXCHANGE COMMISSION
Washington, D.C. 20549
FORM N-14
REGISTRATION STATEMENT
UNDER
THE SECURITIES ACT OF 1933
Pre-Effective Amendment No. 1
Post-Effective Amendment No.
ASTON FUNDS
formerly known as ABN AMRO Funds
(Exact Name of Registrant as Specified in Charter)
120 North LaSalle Street
Chicago, Illinois 60602
(Address of Principal Executive Offices, including Zip Code)
Registrant’s Telephone Number, including Area Code: (312) 268-1400
| | |
(Name and Address of Agent for Service) Kenneth C. Anderson, President Aston Funds 120 North LaSalle Street Chicago, Illinois 60602 | | Copy to: Cathy G. O’Kelly Vedder Price P.C. 222 North LaSalle Street Chicago, Illinois 60601 |
Approximate date of proposed public offering: As soon as practicable after the effective date of this Registration Statement.
No filing fee is required because an indefinite number of shares have previously been registered pursuant to Rule 24f-2 under the Investment Company Act of 1940.
| | |
 | | January , 2010 |
ASTON FUNDS
120 NORTH LASALLE STREET
CHICAGO, ILLINOIS 60602
Aston Balanced Fund
Aston/Barings International Fund
Aston/Cardinal Mid Cap Value Fund
Aston Dynamic Allocation Fund
Aston/Fasciano Small Cap Fund
Aston/Fortis Real Estate Fund
Aston Growth Fund
Aston/Lake Partners LASSO Alternatives Fund
Aston/M.D. Sass Enhanced Equity Fund
Aston/Montag & Caldwell Balanced Fund
Aston/Montag & Caldwell Growth Fund
Aston/Montag & Caldwell Mid Cap Growth Fund
Aston/Neptune International Fund
Aston/New Century Absolute Return ETF Fund
Aston/Optimum Large Cap Opportunity Fund
Aston/Optimum Mid Cap Fund
Aston/River Road Dividend All Cap Value Fund
Aston/River Road Small-Mid Cap Fund
Aston/River Road Small Cap Value Fund
Aston/TAMRO Diversified Equity Fund
Aston/TAMRO Small Cap Fund
Aston/TCH Fixed Income Fund
Aston Value Fund
Aston/Veredus Aggressive Growth Fund
Aston/Veredus Select Growth Fund
(each a “Fund” and collectively, the “Funds”)
Dear Fellow Shareholder:
The Funds listed above will jointly hold a Special Meeting of Shareholders (the “Special Meeting”) on March 15, 2010, at 9:00 a.m. Eastern time, at the offices of PNC Global Investment Servicing, 4400 Computer Drive, Westborough, Massachusetts 01581-5120. The investment adviser to the Funds is Aston Asset Management LLC (“Aston”), a wholly-owned subsidiary of Highbury Financial Inc. (“Highbury”). Affiliated Managers Group, Inc. (“AMG”), a diversified asset management company, has entered into a definitive agreement to
acquire a majority equity interest in Aston, through the acquisition of Highbury, Aston’s parent company. The proposed transaction, which is described in detail in the enclosed materials, will not result in any material changes to Aston’s management, personnel or processes, the way in which it manages your Fund, or the fees and expenses of your Fund, or in your Fund’s subadviser.
Under applicable law, the investment advisory agreement between Aston Funds (the “Trust”), on behalf of each Fund, and Aston, will automatically terminate upon the completion of the transaction. In order for Aston to continue to serve as investment adviser to your Fund, shareholders must approve a new investment advisory agreement. If you are a shareholder of record as of the close of business on January 5, 2010, you are entitled to vote on a proposal to approve a new investment advisory agreement with Aston, which will have the effect of re-appointing Aston as the investment adviser to your Fund.
While we encourage you to read the Questions and Answers section and the full text of the enclosed proxy statement/prospectus, the following is a summary of the proposals we are asking you to consider:
| | • | | To approve a new investment advisory agreement with Aston; |
| | • | | To approve an amendment to the By-Laws of the Trust relating to the retirement age of trustees; |
| | • | | To elect ten trustees to the Board of Trustees of the Trust; |
| | • | | For Aston Balanced Fund, to approve the reorganization of your Fund into Aston/Montag & Caldwell Balanced Fund; and |
| | • | | For Aston Growth Fund, to approve the reorganization of your Fund into Aston/Montag & Caldwell Growth Fund. |
Your Fund’s Board of Trustees has approved these proposals in connection with the sale of Highbury and the reorganizations of two of the Funds and urges you to vote “FOR” each proposal.
YOUR VOTE IS IMPORTANT! Please review the attached proxy statement/prospectus carefully. Enclosed is a proxy card that we ask you to complete, sign, date and return as soon as possible in the postage-paid envelope. You may also vote by telephone or over the Internet using the toll-free telephone number or web address printed on your proxy card.
Thank you for your attention and your vote with regard to this important proposal. Please call proxy services at - - if you need more information. Thank you for your response, and we look forward to serving your future investment needs.
Sincerely,
Kenneth C. Anderson
President
January , 2010
IMPORTANT NOTICE TO FUND SHAREHOLDERS
While we encourage you to read the full text of the enclosed Proxy Statement/Prospectus, here is a brief overview of the proposals that are being presented to shareholders for a vote.
QUESTIONS AND ANSWERS
| Q. | Why am I receiving this Proxy Statement/Prospectus? |
| A. | The adviser of your Fund is Aston Asset Management LLC (“Aston”), a wholly-owned subsidiary of Highbury Financial Inc. (“Highbury”). You are being asked to consider a number of proposals in connection with the proposed sale of Highbury to Affiliated Managers Group, Inc. (“AMG”), whereby AMG will acquire a majority interest in Aston (the “Transaction”). |
HIGHBURY TRANSACTION
| Q. | Why is a vote on the proposed new investment advisory agreement required? |
| A. | Your Fund is managed by Aston pursuant to an investment advisory agreement (the “Current Advisory Agreement”). Due to the requirements of certain federal securities laws, your Fund’s Current Advisory Agreement will automatically terminate at the closing of the Transaction. As a result, Fund shareholders are being asked to approve a new Investment Advisory Agreement between Aston and Aston Funds (the “Trust”), on behalf of each Fund (each a “New Advisory Agreement”), so that Aston may continue to serve as the investment adviser for your Fund. |
| Q. | When would the New Advisory Agreement with Aston take effect? |
| A. | If approved by Fund shareholders, the New Advisory Agreement would take effect if and when the sale of Highbury is completed. If the sale of Highbury is not completed, your Current Advisory Agreement will remain in effect. |
| Q. | Who is acquiring Highbury? |
| A. | Affiliated Managers Group, Inc. (or a subsidiary thereof) is acquiring Highbury. AMG is an asset management company with interests in asset management firms, in a structure that retains the autonomy of each of the firms in which it has invested. As of September 30, 2009, AMG’s affiliated managers had approximately $205 billion in assets under management. |
| Q. | Will the investment advisory fees or other fees change under the New Advisory Agreement? |
| A. | No. There will be no change to the contractual fee rate applicable to your Fund under the New Advisory Agreement. In addition, Aston has no present intention to reduce or eliminate any contractual expense limitations or reimbursements currently in effect for the Funds. |
| Q. | Will the New Advisory Agreement be the same as the Current Advisory Agreement? |
| A. | Yes. The New Advisory Agreement for each Fund will be substantially the same as the Current Advisory Agreement. The New Advisory Agreement requires Aston to provide the same services to your Fund as it does under the Current Advisory Agreement. |
| Q. | Will I need to approve new subadvisory agreements? |
| A. | No. Aston operates as a “manager-of-managers” of the Trust pursuant to an exemptive order (the “Manager-of-Managers Order”) issued by the Securities and Exchange Commission. The Manager-of-Managers Order enables Aston, subject to the approval of the Board of Trustees of the Trust (the “Board”), but without the need for shareholder approval, to enter into subadvisory agreements with respect to the Funds. Each current sub-investment advisory agreement will automatically terminate along with the Current Advisory Agreement upon the closing of the Transaction. Aston has recommended and the Board has approved new sub-investment advisory agreements with each Fund’s subadviser(s). If the New Advisory Agreement is approved by the shareholders of your Fund, a new sub-investment advisory agreement relating to your Fund will |
2
| | take effect upon the closing of the Transaction. Under the Manager-of-Managers Order, shareholders will be notified of any future changes to the Funds’ subadvisers. |
| Q. | How will the sale of Highbury affect Fund shareholders? |
| A. | Aston and AMG believe that AMG’s platform will offer additional resources to Aston that may benefit the Funds such as a broader distribution network, access to legal and compliance services and potential economies of scale in purchasing services from service providers. AMG has no present intention to cause Aston to make any material changes in the operations of the Funds, other than the board-related proposals described in the Proxy Statement/Prospectus. Your subadviser will remain the same. |
| Q. | Who are being nominated to serve as trustees? |
| A. | The Board has proposed ten nominees, three of whom currently serve as trustees of the Trust and seven of whom were recommended to the Board to serve if the Transaction is consummated. The seven nominees who are not current trustees are Messrs. Jeffrey S. Murphy, Jack W. Aber, William E. Chapman II, Edward J. Kaier, Steven J. Paggioli, Eric Rakowski and Thomas R. Schneeweis. Messrs. Aber, Chapman, Kaier, Paggioli, Rakowski and Schneeweis are being nominated to serve as independent trustees; Mr. Murphy is being nominated to serve as an interested trustee. To allow each nominee to stand for election, you are being asked to consider an amendment to the By-Laws changing the retirement age of trustees of the Trust from 72 to 75. |
REORGANIZATIONS
| Q. | I am a shareholder of the Aston Balanced Fund or the Aston Growth Fund. Why has the reorganization proposal been made for my Fund? |
| A. | The proposed reorganizations are intended to consolidate funds that have substantially similar investment objectives and investment policies and similar portfolios. The Board believes that the Fund into which your Fund is being reorganized should provide substantially |
3
| | the same investment opportunity as your current Fund and that the reorganization may result in economies of scale. Shareholders of the Funds that are proposed to be reorganized are not expected to recognize any gain or loss for federal income tax purposes as a result of the exchange of shares pursuant to the reorganizations. |
| Q. | When would the reorganizations take place? |
| A. | If approved, each reorganization would occur on or about March 30, 2010, or as soon as reasonably practicable after shareholder approval is obtained. Each reorganization is not contingent on any of the other proposals in the Proxy Statement/Prospectus. |
GENERAL
| Q. | How do the trustees suggest that I vote in connection with the proposals? |
| A. | After careful consideration of the proposals, your Board, including all of the independent trustees, approved the proposals related to the Transaction and the reorganizations. The reasons for the Board’s recommendations are discussed in more detail in the enclosed Proxy Statement/Prospectus. |
| Q. | What happens if the proposals are not approved? |
| A. | The closing of the Transaction is contingent upon a number of customary conditions, including approval by shareholders of the Funds of New Advisory Agreements for each Fund and the election of the proposed nominees to the Board. If the closing conditions are not satisfied or waived, the Transaction will not close. If the Transaction does not close, Proposals 1, 2 and 3 will not take effect. |
The reorganizations are not related to the Transaction. If the reorganization for a Fund is not approved, the Board will take such action as it deems to be in the best interest of that Fund.
4
| Q. | Who will pay for the proxy solicitation and legal costs associated with this solicitation? |
| A. | Highbury will pay for the proxy solicitation, legal and other costs associated with the solicitation of the proposals. The Funds will not bear any of these costs. In connection with the reorganizations, the participating Funds may bear certain other expenses, which are expected to be immaterial. |
| Q. | Whom do I call for more information? |
| A. | Please call ’s Shareholder Services toll free at ( ) . |
5
ASTON FUNDS
120 NORTH LASALLE STREET
CHICAGO, ILLINOIS 60602
Aston Balanced Fund
Aston/Barings International Fund
Aston/Cardinal Mid
Cap Value Fund
Aston Dynamic Allocation Fund
Aston/Fasciano Small Cap Fund
Aston/Fortis Real Estate Fund
Aston Growth Fund
Aston/Lake Partners LASSO Alternatives Fund
Aston/M.D. Sass Enhanced Equity Fund
Aston/Montag &
Caldwell Balanced Fund
Aston/Montag &
Caldwell Growth Fund
Aston/Montag &
Caldwell Mid Cap Growth Fund
Aston/Neptune International Fund
Aston/New Century Absolute Return ETF Fund
Aston/Optimum Large Cap Opportunity Fund
Aston/Optimum Mid Cap Fund
Aston/River Road Dividend All Cap Value Fund
Aston/River Road Small-Mid Cap Fund
Aston/River Road Small
Cap Value Fund
Aston/TAMRO Diversified Equity Fund
Aston/TAMRO Small
Cap Fund
Aston/TCH Fixed Income Fund
Aston Value Fund
Aston/Veredus Aggressive Growth Fund
Aston/Veredus Select
Growth Fund
(each a “Fund” and collectively, the “Funds”)
NOTICE OF SPECIAL MEETING OF SHAREHOLDERS
TO BE HELD ON MARCH 15, 2010
To the Shareholders of the Above Funds:
A Special Meeting of the Shareholders of the Funds will be held at the offices of the subadministrator of Aston Funds (the “Trust”), PNC Global Investment Servicing, 4400 Computer Drive, Westborough, Massachusetts 01581-5120, on March 15, 2010 at 9:00 a.m. Eastern time (the “Special Meeting”), for the purposes of considering and voting upon the following matters:
| | 1. | To approve a new investment advisory agreement with Aston Asset Management, LP; |
| | 2. | To approve an amendment to the By-Laws of the Trust to increase the mandatory retirement age of trustees; |
| | 3. | To elect ten trustees to the Board of Trustees of the Trust; |
| | 4. | For Aston Balanced Fund and Aston Growth Fund, to approve (a) a proposed reorganization of Aston Balanced Fund into Aston/Montag & Caldwell Balanced Fund, and (b) a proposed reorganization of Aston Growth Fund into Aston/Montag & Caldwell Growth Fund, respectively; and |
| | 5. | To transact such other business as may properly come before the Special Meeting including whether or not to adjourn the Special Meeting, and any adjournment or postponement of the Special Meeting. |
The Board of Trustees has fixed the close of business on January 5, 2010 as the record date for the determination of shareholders entitled to notice of and to vote at the Special Meeting or any adjournment thereof. The persons named as proxies will vote in their discretion on any other business that may properly come before the Meeting or any adjournments or postponements thereof.
|
By Order of the Board of Trustees, Gerald F. Dillenburg Senior Vice President, Secretary and Treasurer |
January , 2010
Shareholders are requested to execute and return promptly the accompanying proxy card, which is being solicited by the Board of Trustees of the Trust. You may execute the proxy card using the methods described in the proxy card. Executing the proxy card is important to ensure a quorum at the special meeting. Shareholders also have the option to provide their vote by telephone or over the internet by following the instructions accompanying the proxy card. Proxies may be revoked at any time before they are exercised by submitting a written notice of revocation or a subsequently executed proxy or by attending the special meeting and voting in person.
INSTRUCTIONS FOR VOTING
The following general rules apply to voting by mail and will help you to properly sign your proxy card. Please read carefully, because if you do not sign your proxy card properly your vote will be invalidated.
1. Individual Accounts: Sign your name exactly as it appears in the registration on the proxy card.
2. Joint Accounts: Both parties must sign, and the name of each party signing should conform exactly to the name shown in the registration on the proxy card.
3. All Other Accounts: The capacity of the individual signing the proxy card should be indicated unless it is reflected in the form of registration. For example:
| | | | |
| Registration | | Valid Signature |
| |
| Corporate Accounts | | |
| | |
| (1) | | ABC Corp. | | ABC Corp. by John Doe, Treasurer |
| (2) | | ABC Corp. | | |
| | |
| | John Doe, Treasurer | | John Doe |
| | |
| (3) | | ABC Corp. Profit Sharing Plan | | John Doe |
| |
| Trust Accounts | | |
| | |
| (1) | | ABC Trust | | Jane B. Doe, Trustee |
| | |
| (2) | | Jane B. Doe, Trustee | | |
| | |
| | u/t/d 12/28/78 | | Jane B. Doe |
| |
| Custodial or Estate Accounts | | |
| | |
| (1) | | John B. Smith, Cust. | | |
| | |
| | f/b/o John B. Smith, Jr. UGMA | | John B. Smith |
| | |
| (2) | | Estate of John B. Smith | | John B. Smith, Jr., Executor |
Rather than mailing in your proxy, you may vote by telephone or over the Internet using the toll-free telephone number or web address printed on your proxy card. These options require you to input the control number located on your proxy card. After inputting the control number, you may enter your vote on the proposal. You will have an opportunity to review your vote and make any necessary changes before submitting your vote and terminating the telephone call or Internet link.
January , 2010
ASTON FUNDS
120 NORTH LASALLE STREET
CHICAGO, ILLINOIS 60602
(312) 268-1400
Aston Balanced Fund
Aston/Barings International Fund
Aston/Cardinal Mid Cap Value Fund
Aston Dynamic Allocation Fund
Aston/Fasciano Small Cap Fund
Aston/Fortis Real Estate Fund
Aston Growth Fund
Aston/Lake Partners LASSO Alternatives Fund
Aston/M.D. Sass Enhanced Equity Fund
Aston/Montag & Caldwell Balanced Fund
Aston/Montag & Caldwell Growth Fund
Aston/Montag & Caldwell Mid Cap Growth Fund
Aston/Neptune International Fund
Aston/New Century Absolute Return ETF Fund
Aston/Optimum Large Cap Opportunity Fund
Aston/Optimum Mid Cap Fund
Aston/River Road Dividend All Cap Value Fund
Aston/River Road Small-Mid Cap Fund
Aston/River Road Small Cap Value Fund
Aston/TAMRO Diversified Equity Fund
Aston/TAMRO Small Cap Fund
Aston/TCH Fixed Income Fund
Aston Value Fund
Aston/Veredus Aggressive Growth Fund
Aston/Veredus Select Growth Fund
(each a “Fund” and collectively, the “Funds”)
SPECIAL MEETING OF SHAREHOLDERS
TO BE HELD ON MARCH 15, 2010
PROXY STATEMENT/PROSPECTUS
This Proxy Statement/Prospectus is furnished in connection with the solicitation of proxies by the Board of Trustees (the “Board”) of Aston Funds, a Delaware statutory trust (the “Trust”), on behalf of each of the Funds, for use at a Special Meeting of Shareholders of the Funds to be held at 9:00 a.m. Eastern time on March 15, 2010, at the offices of the Trust’s subadministrator, PNC Global Investment Servicing, 4400
Computer Drive, Westborough, Massachusetts 01581-5120, and any adjournments or postponements thereof (the “Special Meeting”).
This Proxy Statement/Prospectus and the accompanying Notice of Special Meeting and proxy card are expected to be sent to shareholders on or about January , 2010 or as soon as practicable thereafter.
This Proxy Statement/Prospectus explains concisely what you should know before voting on the proposals described in this Proxy Statement/Prospectus or investing in the Aston/Montag & Caldwell Growth Fund or the Aston/Montag & Caldwell Balanced Fund (the “Acquiring Funds”), each of which is a series of the Trust, an open-end, registered management investment company. Please read it carefully and keep it for future reference.
The securities offered by this Proxy Statement/Prospectus have not been approved or disapproved by the Securities and Exchange Commission (“SEC”), nor has the SEC passed upon the accuracy or adequacy of this Proxy Statement/Prospectus. Any representation to the contrary is a criminal offense.
If the enclosed proxy card is properly executed and returned in time to be voted at the Special Meeting, the shares of beneficial interest represented by the proxy will be voted in accordance with the instructions marked thereon. If no specification is made, the shares will be voted FOR the proposals. Any shareholder who has given a proxy has the right to revoke it at any time prior to its exercise by attending the Special Meeting and voting his or her shares in person, by submitting a letter of revocation or by submitting a later-dated proxy to the Trust at the above address prior to the date of the Special Meeting.
Shareholders of the Funds are entitled to one vote for each full share held and fractional votes for fractional shares. One-third of the aggregate number of shares entitled to vote, present in person or by proxy, constitutes a quorum for the transaction of business, except that where any provision of law or the governing documents of the Trust permits or requires that holders shall vote as a series, then one-third of the aggregate number of shares of that series entitled to vote shall constitute a quorum. Any lesser number is sufficient for adjournment. Abstentions and broker “non-votes” (that is, proxies from brokers or nominees indicating that
ii
such persons have not received instructions from the beneficial owner or other persons entitled to vote shares on a particular matter with respect to which the brokers or nominees do not have discretionary voting power) will be treated as shares that are present for purposes of determining the presence of a quorum for transacting business at the Special Meeting but will not be deemed shares voted for purposes of determining the approval of any matter submitted to shareholders for a vote. In the event that a quorum is not present at the Special Meeting, or in the event that a quorum is present but sufficient votes to approve the proposal are not received, the persons named as proxies on the enclosed proxy card may propose one or more adjournments of the Special Meeting to permit further solicitation of proxies. The persons named as proxies will vote upon such adjournment after consideration of all circumstances that may bear upon a decision to adjourn the Special Meeting. Any business that might have been transacted at the Special Meeting originally called may be transacted at any such adjourned session(s) at which a quorum is present. If a quorum is present, any adjournment will require the affirmative vote of a majority of the shares voted at the Special Meeting in person or by proxy.
iii
The following table indicates whether or not shareholders of each Fund vote separately or together with shareholders of all the Funds with respect to each proposal. The following table also indicates the shareholder vote required for approval with respect to each proposal.
| | | | |
Proposal | | How Votes are Aggregated | | Vote Required for Approval |
| | |
| Proposal 1(1) | | Shareholders of Each Fund Vote Separately | | “Majority of the Outstanding Voting Securities”(2) |
| | |
| Proposal 2(1) | | Shareholders of All Funds Vote Together | | Affirmative Vote of a Majority of the Shares Voted in Person or By Proxy(3) |
| | |
| Proposal 3(1) | | Shareholders of All Funds Vote Together | | Affirmative Vote of a Plurality of the Shares Voted in Person or By Proxy(3) |
| | |
| Proposal 4 | | Shareholders of Each Applicable Fund Vote Separately | | Affirmative Vote of a Majority of the Shares Voted in Person or By Proxy(3) |
| (1) | Proposals 1, 2 and 3 will not take effect if the Transaction (as defined below) does not close. |
| (2) | The term “majority of the outstanding voting securities,” under the Investment Company Act of 1940, as amended (the “1940 Act”), means the affirmative vote of the lesser of (i) 67% of the voting securities of the Fund present at the meeting if more than 50% of the outstanding voting securities of the Fund are present in person or by proxy or (ii) more than 50% of the outstanding voting securities of the Fund. Abstentions and broker non-votes will have the effect of a “no” vote for purposes of obtaining the requisite approval of the proposal. |
| (3) | Abstentions and broker non-votes will not have any effect on the vote for purposes of obtaining the requisite approval of the proposal. |
iv
The following table indicates which shareholders are solicited with respect to each proposal:
| | |
Proposal | | Funds Affected |
| |
| To approve a new Investment Advisory Agreement between the Trust, on behalf of each Fund, and Aston Asset Management, LP (Proposal 1). | | All Funds |
| |
| To approve an amendment to the By-Laws of the Trust (Proposal 2). | | All Funds |
| |
| To elect ten trustees to the Board of Trustees of the Trust (Proposal 3). | | All Funds |
| |
| To approve a proposed merger of the Fund into an existing Fund of the Trust (Proposal 4). | | Aston Growth Fund
Aston Balanced Fund |
The Board has fixed the close of business on January 5, 2010 as the record date (the “Record Date”) for the determination of shareholders of each Fund entitled to notice of, and to vote at, the Special Meeting and all adjournments thereof. As of the Record Date, the Funds have issued and outstanding shares as follows:
| | | | | | |
| | | Class of Shares |
Fund | | Class I | | Class N | | Class R |
Aston Balanced Fund | | — | | 2,985,625 | | — |
Aston/Barings International Fund | | 5,637,207 | | — | | — |
Aston/Cardinal Mid Cap Value Fund | | — | | 128,209 | | — |
Aston Dynamic Allocation Fund | | — | | 5,606,458 | | — |
Aston/Fasciano Small Cap Fund | | — | | 202,001 | | — |
Aston/Fortis Real Estate Fund | | 3,890,899 | | 677,696 | | — |
Aston Growth Fund | | 1,432,862 | | 4,415,600 | | 46,973 |
Aston/Lake Partners LASSO Alternatives Fund | | 542,212 | | — | | — |
v
| | | | | | |
| | | Class of Shares |
Fund | | Class I | | Class N | | Class R |
Aston/M.D. Sass Enhanced Equity Fund | | — | | 3,427,971 | | — |
Aston/Montag & Caldwell Balanced Fund | | 65,490 | | 770,669 | | — |
Aston/Montag & Caldwell Growth Fund | | 56,091,184 | | 65,171,181 | | 268,467 |
Aston/Montag & Caldwell Mid Cap Growth Fund | | — | | 419,581 | | — |
Aston/Neptune International Fund | | 172,150 | | 47,127 | | — |
Aston/New Century Absolute Return ETF Fund | | — | | 1,968,903 | | — |
Aston/Optimum Large Cap Opportunity Fund | | — | | 543,956 | | — |
Aston/Optimum Mid Cap Fund | | 7,434,805 | | 39,268,815 | | — |
Aston/River Road Dividend All Cap Value Fund | | 10,245,597 | | 9,740,770 | | — |
Aston/River Road Small-Mid Cap Fund | | 22,245,746 | | 5,510,219 | | — |
Aston/River Road Small Cap Value Fund | | 26,575,628 | | 21,106,285 | | — |
Aston/TAMRO Diversified Equity Fund | | — | | 1,069,864 | | — |
Aston/TAMRO Small Cap Fund | | 34,491,085 | | 17,440,621 | | — |
Aston/TCH Fixed Income Fund | | 1,955,636 | | 4,446,391 | | — |
Aston Value Fund | | 24,887,162 | | 2,398,394 | | — |
Aston/Veredus Aggressive Growth Fund | | 1,444,549 | | 3,559,728 | | — |
Aston/Veredus Select Growth Fund | | 5,167,255 | | 4,001,328 | | — |
As of the Record Date, no shareholder beneficially owned more than 5% of any class of shares of any Fund, except as shown in Appendix A. As of November 30, 2009, the officers and trustees of the Trust as a group beneficially owned less than 1% of the outstanding shares of any class of each Fund, except for 4.40% of Aston/TAMRO Diversified Equity Fund-Class N, 2.80% of Aston/Cardinal Mid Cap Value Fund-Class N, 73.39% of Aston/Neptune International Fund-Class N, 5.62% of Neptune International Fund-Class I and 4.03% of Aston/Montag & Caldwell Growth Fund-Class R. As of November 30, 2009, no trustee, nominee (as
vi
discussed below) or officer beneficially owned more than 1% of any class of shares of any Fund, except as shown in Appendix B.
For your convenience, you may submit your vote by mail. If you are mailing your proxy card, you are requested to:
| | • | | indicate your instructions on the enclosed proxy card; |
| | • | | date and sign the proxy card; |
| | • | | mail the proxy card promptly in the enclosed envelope, which requires no postage if mailed in the United States; and |
| | • | | allow sufficient time for the proxy card to be received on or before 9:00 a.m. Eastern time March 15, 2010. |
Instead of mailing your proxy, you may vote by telephone or over the Internet using the toll-free telephone number or web address printed on your proxy card. These options require you to input the control number located on your proxy card. After inputting the control number, you may enter your vote on the proposal. You will have an opportunity to review your vote and make any necessary changes before submitting your vote and terminating the telephone call or Internet link.
The following documents have been filed with the SEC and are incorporated into this Proxy Statement/Prospectus by reference: (i) the prospectuses of the Trust, dated March 1, 2009, as supplemented from time to time, for Class N shares, Class I shares and Class R shares relating to Aston/Montag & Caldwell Growth Fund, Aston/Montag & Caldwell Balanced Fund, Aston Growth Fund and Aston Balanced Fund (the “Reorganization Funds”), as applicable (File No. 033-68666), copies of which, if applicable, are included with this Proxy Statement/Prospectus; (ii) the statement of additional information of the Trust, dated March 1, 2009, as supplemented from time to time, for Class N shares, Class I shares and Class R shares relating to the Reorganization Funds, as applicable (File No. 033-68666); (iii) the statement of additional information relating to the proposed reorganization, dated January , 2010 (the “Reorganization SAI”) (File No. 333-163870); and (iv) the audited financial statements and related report of the independent registered public accounting firm relating to the Reorganization Funds included in the Trust’s Annual Reports to Shareholders for the fiscal year ended October 31, 2009 (File No. 811-08004). No other parts of the
vii
prospectuses, statements of additional information or Annual Report are incorporated by reference herein.
Shares of the Acquiring Funds are not deposits or obligations of, or guaranteed or endorsed by, any financial institution, are not insured by the Federal Deposit Insurance Corporation, the Federal Reserve Board or any other agency, and involve risk, including the possible loss of the principal amount invested.
Each Fund’s most recent annual report and semi-annual report is available upon request without charge by writing the Trust at P.O. Box 9765, Providence, Rhode Island 02940, or by calling toll-free 1-800-992-8151 or by downloading such information from www.astonfunds.com. The website does not form a part of the Proxy Statement/Prospectus or the Reorganization SAI. To help reduce Fund expenses and environmental waste, the Funds combine mailings for multiple accounts going to a single address by delivering the Funds’ reports (annual and semi-annual reports) and proxy statements/prospectuses in a single envelope. If you do not want to continue consolidating your Fund mailings and prefer to receive separate mailings with multiple copies of Fund reports and proxy statements/prospectuses, or if you currently receive multiple copies and would like to request a single copy, please call one of the Funds’ representatives at 1-800-992-8151.
This document is designed to give you the information you need to vote on the proposals. Much of the information is required disclosure under rules of the SEC; some of it is technical. If there is anything you don’t understand, please contact shareholder services at 1-800-922-8151.
The Trust is subject to the informational requirements of the Securities Exchange Act of 1934, as amended, and the Investment Company Act of 1940, as amended (the “1940 Act”), and in accordance therewith files reports, proxy statements and other information with the SEC. You may review and copy information about the Funds, including the prospectuses and the statements of additional information (for a duplication fee), at the SEC’s public reference room at 100 F Street, N.E., Washington, D.C. 20549; at the Northeast Regional Office (3 World Financial Center, New York, New York 10281) and at the Midwest Regional Office (175 West Jackson Boulevard, Suite 900, Chicago,
viii
Illinois 60661). You may call the SEC at 1-202-551-5850 for information about the operation of the public reference room. You may obtain copies of this information, with payment of a duplication fee, by electronic request at the following e-mail address: publicinfo@sec.gov, or by writing the SEC’s Public Reference Branch, Office of Consumer Affairs and Information Services, Securities and Exchange Commission, Washington, D.C. 20549. You may also access reports and other information about the Funds on the EDGAR database on the SEC’s Internet site at http://www.sec.gov.
ix
TABLE OF CONTENTS
x
INDEX OF APPENDICES
xi
BACKGROUND
Aston Asset Management LLC (“Aston”) provides investment management, administration services, and marketing and distribution-related services to each Fund. Aston is a wholly-owned subsidiary of Highbury Financial Inc. (“Highbury”). On December 14, 2009, Highbury entered into a definitive merger agreement with Affiliated Managers Group, Inc. (“AMG”) and its wholly-owned subsidiary, Manor LLC (“Merger Sub”), pursuant to which the parties agreed to merge Highbury with and into Merger Sub, resulting in AMG’s acquisition of Highbury (the “Transaction”). Currently, senior management and certain key employees of Aston hold equity interests in Highbury, which in turn owns 100% of Aston. Immediately prior to the closing of the Transaction, Aston will issue equity interests to senior management and certain key employees of Aston. Consequently, as a result of the Transaction, AMG will own a majority equity interest in Aston, with such members of senior management and key employees of Aston retaining an equity interest in Aston. In connection with the Transaction, Aston will be converted to a Delaware limited partnership and change its name to “Aston Asset Management, LP”.
The Transaction is expected to close during the second quarter of 2010 and is subject to the satisfaction or waiver of certain conditions, including, among others: (1) the approval of the Transaction by the stockholders of Highbury, (2) the parties obtaining certain required regulatory approvals, (3) Aston maintaining a specified percentage of its revenues between signing and closing, (4) approval by the shareholders of each Fund of a new investment advisory agreement between Aston and the Trust, on behalf of the Fund, (5) approval by the shareholders of all of the Funds of the election of no less than nine of the trustee nominees being proposed at the Special Meeting, and such elected trustee nominees shall constitute all of the trustees immediately following the closing, and (6) members of senior management and certain other key employees remaining employed with Aston at and after the closing.
As part of the Transaction, members of senior management and certain other key employees of Aston have entered into long-term employment agreements, to be effective at the closing of the Transaction, which provide for the continued service of each of them to Aston for a specified period after the closing. These employment agreements and related agreements provide for these individuals to be subject to non-competition and non-solicitation provisions following the closing of
the Transaction and also provide, subject to certain restrictions specified therein, management owners of Aston with the right to sell their equity interests in Aston to AMG over a specified period beginning on the fourth anniversary of the closing of the Transaction (and AMG with the right to repurchase this equity upon termination of employment of a management owner and in certain other instances).
Upon the closing of the Transaction, Aston expects to have substantially the same personnel with substantially the same responsibilities as before, with no change in its day-to-day operations or the services provided to its clients. Each Fund’s current subadviser(s) are expected to continue to manage each Fund, and the investment objective(s) of the Funds will remain the same. The advisory fee rate payable to Aston for each Fund will not change as a result of the Transaction, and Aston will remain responsible for paying subadvisory fees.
If the Transaction is not completed, Proposals 1, 2 and 3 will not take effect. Proposal 4 is unrelated to the Transaction and will take effect if approved by shareholders of a Fund.
The Board recommends that shareholders vote FOR Proposals 1, 2 and 3 in connection with the Transaction and FOR Proposal 4.
2
PROPOSAL 1: APPROVAL OF NEW INVESTMENT
ADVISORY AGREEMENT
Introduction
Under an investment advisory agreement between Aston and the Trust, on behalf of each Fund (each a “Current Advisory Agreement” and collectively, the “Current Advisory Agreements”), Aston currently serves as the investment adviser to each Fund. Aston manages each Fund by selecting one or more other investment managers to manage the Fund’s portfolio on a sub-advisory basis. Aston is responsible for identifying and selecting each Fund’s investment managers, monitoring the performance of such managers, and terminating managers. The date of each Fund’s Current Advisory Agreement and the date on which it was last approved by shareholders and last approved for continuance by the Board is provided in Appendix C.
As required by the 1940 Act, each Current Advisory Agreement provides for its automatic termination in the event of its assignment. Consummation of the Transaction would constitute an “assignment,” as that term is defined in the 1940 Act, of each Fund’s Current Advisory Agreement. In anticipation of the Transaction, shareholders of each Fund are being asked to approve a new investment advisory agreement (each a “New Advisory Agreement” and collectively, the “New Advisory Agreements”) between the Trust, on behalf of the Fund, and Aston, to be effective upon the consummation of the Transaction. The Form of New Advisory Agreement for each Fund is attached hereto as Appendix D. The New Advisory Agreement for each Fund will be the same in all material respects as the Fund’s Current Advisory Agreement.
The material terms of the Current Advisory Agreements and the New Advisory Agreements are described under “Comparison of the Current Advisory Agreements and New Advisory Agreements” below.
The 1940 Act provides that, in order for an investment advisory agreement to become effective, it must be approved by the Board, including the trustees who are not “interested persons” (as defined in Section 2(a)(9) of the 1940 Act) of the Fund or Aston (the “Independent Trustees”), and by the Fund’s shareholders. In anticipation of the Transaction, the Board or its committees met in person on November 20, 2009, December 2, 2009 and December 6, 2009 for the purpose of, among
3
other things, considering whether it would be in the best interests of each Fund to approve a New Advisory Agreement with respect to the Fund. At the Board meeting, and for the reasons discussed below, the Board, including a majority of the Independent Trustees, approved the New Advisory Agreement with respect to each Fund and recommended its approval by shareholders.
Aston and the Trust have received from the Securities and Exchange Commission (“SEC”) an exemptive order that allows Aston to allocate and reallocate the assets of the Funds between and among any subadvisers selected pursuant to a “manager-of-managers” structure. Under this structure, Aston has the authority to retain and terminate subadvisers, engage new subadvisers and make material revisions to the terms of the subadvisory agreements subject to the approval of the Board, without a requirement of shareholder approval. At the December 6, 2009 Board Meeting, the Board, including a majority of the Independent Trustees, approved new sub-investment advisory agreements between Aston and each Fund’s subadviser(s). Shareholder approval of the sub-investment advisory agreements is not requested or required.
Comparison of Current Advisory Agreements and New Advisory Agreements
The terms of the New Advisory Agreement are the same as those of the Current Advisory Agreement for each Fund, except for the date of effectiveness and the initial term. There is no change in the advisory fee rate payable by any Fund. If approved by shareholders and assuming the Transaction is completed, each New Advisory Agreement will be effective as of the closing date of the Transaction and will have an initial term ending no more than two years from the date of its effectiveness. Each New Advisory Agreement will continue in effect from year to year thereafter if its continuance is approved, on behalf of a Fund, at least annually in the manner required by the 1940 Act and the rules and regulations thereunder. Below is a comparison of certain terms of the Current Advisory Agreement to the terms of the New Advisory Agreement for each Fund.
Investment Management Services. The investment management services to be provided by Aston to each Fund under the New Advisory Agreement will be the same as the services currently provided by Aston to
4
each Fund under the Current Advisory Agreement. Both the Current Advisory Agreement and the New Advisory Agreement for each Fund provide that the investment adviser shall manage the investment and reinvestment of each Fund’s assets in accordance with the Fund’s investment objective(s), policies and limitations and administer the Fund’s affairs to the extent requested by and subject to the oversight of the Board.
Brokerage. Both the Current Advisory Agreement and the New Advisory Agreement for each Fund authorize the investment adviser to select brokers or dealers that will execute the purchases and sales of portfolio securities for the Funds, subject to their obligation to obtain best execution under the circumstances, which may take account of the overall quality of brokerage and research services provided to the investment adviser. Both advisory agreements permit the investment adviser to rely on Section 28(e) of the Securities Exchange Act of 1934, as amended, in placing brokerage transactions. Under that Section, a commission paid to a broker may be higher than that which another qualified broker would have charged for effecting the same transaction, provided the investment adviser determines in good faith that the commission is reasonable in terms of either the transaction or the overall responsibility of the investment adviser to the Funds and its other clients, and provided that the total commissions paid by each Fund will be reasonable in relation to the benefits to the Fund over the long term.
Expenses. The Current Advisory Agreement and the New Advisory Agreement for each Fund provide that the investment adviser shall pay all its own costs and expenses incurred in fulfilling its obligations under the advisory agreement, as well as pay for all necessary services, facilities and personnel. The Current Advisory Agreement and the New Advisory Agreement provide that a Fund shall pay all expenses incidental to its operation and business not specifically assumed or agreed to be paid by the investment adviser, and each advisory agreement sets forth a non-exclusive list of such expenses.
Compensation. In return for the services provided under each Current Advisory Agreement, each Fund pays Aston an advisory fee, which is accrued daily and payable monthly. Under the New Advisory Agreement for each Fund, the Fund will pay an advisory fee to Aston at the same rate currently in effect. The advisory fee rates for each Fund, the fees paid by each Fund to Aston during each Fund’s last fiscal year and each Fund’s
5
net assets as of October 31, 2009 are set forth in Appendix E to this Proxy Statement/Prospectus.
Limitation on Liability. Under the Current Advisory Agreement and the New Advisory Agreement for each Fund, the investment adviser and its directors, officers, shareholders, employees and agents will not be liable for any error of judgment or mistake of law or for any loss suffered by the investment adviser or the Funds in connection with any matters to which the advisory agreement relates or for any other act or omission in the performance by the investment adviser of its duties under the advisory agreement, except that nothing in the advisory agreement shall be construed to protect the investment adviser against any liability by reason of its willful misfeasance, bad faith or gross negligence in the performance of its duties or for its reckless disregard of its obligations or duties under the advisory agreement.
Continuance. The Current Advisory Agreement of each Fund originally was in effect for an initial term and was eligible to be continued thereafter for successive one-year periods if such continuance was specifically approved at least annually in the manner required by the 1940 Act. If the shareholders of each Fund approve the New Advisory Agreement and the Transaction is consummated, the New Advisory Agreement with respect to the Fund will be effective as of the closing date of the Transaction and have an initial term, with respect to the Fund, ending up to two years from the closing date of the Transaction. Thereafter, the New Advisory Agreement for each Fund may be continued for successive one-year periods if approved at least annually in the manner required by the 1940 Act.
Termination. The Current Advisory Agreement and the New Advisory Agreement for each Fund provide that the advisory agreement may be terminated at any time without the payment of any penalty by the Fund or investment adviser on sixty (60) days’ written notice to the other party. A Fund may terminate the advisory agreement by action of the Board or by vote of a majority of the outstanding voting securities of the Fund, accompanied by appropriate notice.
Reliance on Section 15(f) of the 1940 Act
The Board has been advised that, in connection with carrying out the Transaction, the parties to the merger agreement are obligated to use their
6
best efforts to ensure reliance on Section 15(f) of the 1940 Act, which provides a non-exclusive safe harbor for an investment adviser to an investment company, and any of the investment adviser’s affiliated persons (as that term is defined in the 1940 Act), to receive any amount or benefit in connection with a change in control of the investment adviser, provided that two conditions are met.
First, for a period of three years after the closing of the Transaction, at least 75% of the board must be comprised of persons who are not “interested persons” of the predecessor or successor adviser. Second, for a period of two years following the closing of the Transaction, there must not be imposed on the Funds any “unfair burden” as a result of the Transaction or any express or implied terms, conditions or understandings related to it. An “unfair burden” would include any arrangement whereby an adviser, or any “interested person” of the adviser, would receive or be entitled to receive any compensation, directly or indirectly, from the Funds or their shareholders (other than fees for bona fide investment advisory or other services) or from any person in connection with the purchase or sale of securities or other property to, from or on behalf of the Funds (other than bona fide ordinary compensation as principal underwriter for a Fund).
Information about the Investment Adviser
Aston Asset Management LLC, 120 North LaSalle Street, 25th Floor, Chicago, Illinois 60602, is the investment adviser and administrator to twenty-five series of the Trust with total assets of approximately $5.9 billion as of October 31, 2009. Aston currently is a wholly-owned subsidiary of Highbury. Highbury is a Delaware corporation formed on July 13, 2005 with a principal place of business at 990 Eighteenth Street, Suite 3000, Denver, Colorado 80202. Upon the closing of the Transaction, Aston will be converted from a limited liability company to a limited partnership and a subsidiary of AMG will own a majority equity interest in Aston. In addition, Merger Sub, a wholly-owned subsidiary of AMG, will serve as general partner of Aston. Aston’s day-to-day management and operations will continue to be directed and overseen by Aston’s current management team, described below.
Stuart D. Bilton, CFA, serves as Chairman and Chief Executive Officer of Aston. In this role, he directs and executes Aston’s growth strategy. Mr. Bilton is Chairman of the Board of the Trust. Mr. Bilton has
7
served as a director of Highbury since August 2009. In 1993, while Mr. Bilton was President and CEO of Alleghany Asset Management, he founded the Alleghany Funds with Kenneth Anderson. Prior to joining Aston, Mr. Bilton was associated with ABN AMRO Asset Management and its predecessors and/or affiliates from 1972 to November 2006. He served as President and Chief Executive Officer of ABN AMRO Asset Management Holdings, Inc. from 2001 to 2003 and as Vice Chairman of ABN AMRO Asset Management, Inc. from 2003 to November 2006. Prior to its acquisition by ABN AMRO, Mr. Bilton was President and Chief Executive Officer of Alleghany Asset Management, the parent company of Blairlogie Capital Management, Chicago Capital Management, Chicago Deferred Exchange Corporation, The Chicago Trust Company, Montag & Caldwell, Inc., TAMRO Capital Management, Inc. and Veredus Asset Management, LLC. He earned a B.Sc. (Econ) from the London School of Economics in 1967 and an M.S. from the University of Wisconsin in 1970.
Kenneth C. Anderson, CPA, serves as President of Aston and is responsible for the overall management of Aston’s business, including sales, marketing, operations, client service and financial profitability. Mr. Anderson is President and CEO of the Trust. Mr. Anderson has served as a director of Highbury since August 2009. He is a member of the Investment Company Institute’s Sales Force Committee and a past Chairman of the Board of Governors for the Mutual Fund Education Alliance. Prior to launching the Alleghany Funds in 1993, Mr. Anderson specialized in the Financial Services Practice at KPMG. He received a B.B.A. in Accounting from Loyola University of Chicago.
Gerald F. Dillenburg, CPA, serves as Chief Financial Officer and Chief Compliance Officer of Aston. Mr. Dillenburg is the Chief Compliance Officer, Chief Financial Officer, Secretary and Treasurer of the Trust. Prior to joining Aston, Mr. Dillenburg had been with ABN AMRO Investment Fund Services, Inc. and its predecessors from 1996 to November 2006, where he was the Compliance Officer and Director of Operations of the ABN AMRO Funds. Prior to joining ABN AMRO in 1996, he spent approximately seven years at KPMG LLP in the audit division specializing in investment companies and mutual funds. He is a member of the Investment Company Institute’s Operations and Chief Compliance Officer Committees. He is a graduate with high honors from the University of Illinois at Champaign with a B.S. in Accountancy.
8
Mr. Bilton, Chairman of the Board, and certain officers of Aston Funds, including Mr. Anderson and Mr. Dillenburg, are beneficial owners of Series B Preferred Stock of Highbury. Series B Preferred Stock of Highbury was issued to members of management of Aston, including Mr. Bilton, in exchange for all of their ownership interests in Aston pursuant to an Exchange Agreement with Highbury in August 2009. Mr. Bilton owned 13% of Aston prior to the exchange and has owned 37.14% of Series B Preferred Stock of Highbury since the exchange. In September 2009, holders of Series B Preferred Stock entered into an Exchange Agreement with Highbury whereby such holders agreed to automatically exchange Series B Preferred Stock for shares of common stock of Highbury if holdings of certain other shareholders exceed specified thresholds. The Series B Preferred Stock is convertible into common stock of Highbury upon certain trigger events including a change of control of Highbury, and will convert to common stock of Highbury immediately prior to the closing of the Transaction. Assuming full conversion of all outstanding Series B Preferred Stock and based on outstanding shares of Highbury as of December 31, 2009, Messrs. Bilton, Anderson and Dillenburg would beneficially own approximately 8.35%, 6.42%, and 3.21%, respectively, of the outstanding common stock of Highbury.
Information about Affiliated Managers Group, Inc.
AMG, a Delaware corporation with a principal place of business at 600 Hale Street, Prides Crossing, Massachusetts 01965, is an asset management company that holds interests in investment management firms (its “Affiliates”). AMG’s transaction structure allows the members of the management team of each Affiliate to retain or receive significant direct equity ownership in their firm while maintaining operating autonomy. In addition, AMG provides centralized assistance to its Affiliates in strategic matters, marketing, distribution, product development and operations.
Factors Considered by the Board of Trustees in Approving the Investment Advisory Agreement
The Independent Trustees met in executive session on November 20, 2009 and December 2, 2009, and the Board met in person on December 6, 2009 to consider the proposals in connection with the Transaction. The Board considered information about the Transaction that had been
9
provided by Aston, AMG and Highbury. The Board noted that upon completion of the Transaction, Aston would be converted from a limited liability company to a limited partnership and that AMG would hold a majority of the equity interests in Aston. The Board considered that completion of the Transaction would result in the “assignment” of the Current Advisory Agreement then in effect for each Fund, causing those agreements to automatically terminate.
In anticipation of the termination of the Current Advisory Agreements in connection with the Transaction, the Board, including the Independent Trustees, determined that the terms of the New Advisory Agreements between the Trust, on behalf of each Fund, and Aston are fair and reasonable and approved each New Advisory Agreement, as being in the best interests of each Fund. The Independent Trustees met separately from the “interested” Trustee of the Trust to consider the approval of the New Advisory Agreements with respect to each Fund and were assisted by independent legal counsel in their deliberations.
In determining whether to approve the New Advisory Agreement for each Fund in connection with the Transaction and whether to recommend the approval of the New Advisory Agreements to shareholders, the Board received information and made inquiries into all matters deemed relevant and considered the following factors, among others:
| | • | | Based on representations from Aston and AMG, the Transaction is not expected to result in any changes to the senior management team or key personnel of Aston or otherwise affect the nature, extent and quality of services to be provided by Aston, nor is the Transaction expected to result in any changes to the subadvisers of the Funds. |
| | • | | Based on representations from Aston and AMG, neither Aston nor AMG have any present intention to make any material changes in the operations of the Funds, except for such changes which the Board discussed and determined to be consistent with the best interests of the Funds and their shareholders. |
| | • | | The Board compared the platform that AMG would provide for Aston, the subadvisers and the Funds with the platform currently provided by Highbury and concluded that AMG’s platform offers greater stability and longevity, |
10
| | and was likely to provide a more supportive environment for members of Aston’s management in performing their duties for the Funds. |
| | • | | AMG’s platform offers additional resources to Aston that are likely to benefit the Funds, such as a broader distribution network, access to in-house legal and compliance services, potential economies of scale in purchasing services from service providers, and the additional breadth of skills and experience that the new trustees who have been recommended to serve upon closing of the Transaction would bring to the Board. |
| | • | | The terms of each New Advisory Agreement with Aston were substantially the same as the Current Advisory Agreement, and the investment advisory fee rate would remain the same. |
| | • | | The Funds will not bear any of the costs relating to the Transaction, including the costs of preparing, printing and mailing a proxy statement to shareholders of the Funds and related solicitation expenses. |
The Board considered that it had renewed the Current Advisory Agreements pursuant to an extensive process that concluded at its December 2008 meeting, or pursuant to an extensive initial contract approval process in the last year, and that the Board was in the process of completing this year’s contract renewal process. The Board also determined that it was appropriate to take into consideration the extensive information received throughout the year regarding performance and operating results of the Funds, given the continuity of management of Aston and retention of the subadvisers to the Funds expected following the Transaction. The Board concluded, based upon all of these considerations, along with the conclusions the Board reached with respect to the initial approval or last renewal of each current investment advisory agreement, that it need not reconsider all of the factors that it would typically consider in connection with an initial contract approval or contract renewal.
Based upon its evaluation of all information and factors it deemed relevant and assisted by the advice of independent legal counsel, the Board, including all of the Independent Trustees, concluded that the terms
11
of the New Advisory Agreements, including the proposed advisory fees, were fair and reasonable, and that the New Advisory Agreement on behalf of each Fund should be approved.
Required Vote
Approval of this proposal requires the affirmative vote of a “majority of the outstanding voting securities” of each Fund as defined under the 1940 Act, which means the affirmative vote of the lesser of (i) 67% of the voting securities of the Fund present at the meeting if more than 50% of the outstanding voting securities of the Fund are present in person or by proxy, or (ii) more than 50% of the outstanding voting securities of the Fund.
PROPOSAL 2: APPROVAL OF AN AMENDMENT TO THE BY-LAWS OF THE TRUST
Introduction
The Trust is a Delaware statutory trust governed by the laws of the State of Delaware, its Trust Instrument, as amended (the “Trust Instrument”), and its By-Laws, as amended (the “By-Laws”). Section 3.11 of the By-Laws currently provides that a trustee shall cease to serve as such on the last day of the fiscal year of the Trust in which he or she attains seventy-two years of age. Section 3.11 may be amended only upon the approval of shareholders.
You are being asked to consider the election of ten individuals to serve as trustees upon the closing of the Transaction (See Proposal 3). The purpose of the amendment to the By-Laws is to allow all of the nominees proposed for election at the Special Meeting to be eligible for such election. The Board considered these proposals in light of the overall potential benefits of the Transaction described in Proposal 1 above. The Board also considered the breadth of skills and experience of the proposed nominees, as well as generally positive developments in health and longevity in the U.S. since the initial adoption of the retirement policy.
In connection with the election of the proposed nominees to serve as trustees, you are being asked to approve a change to Section 3.11 so that it will provide that a trustee shall cease to serve as such on the last day of the
12
fiscal year of the Trust in which he or she attains seventy-five years of age. The proposed amendment to the By-Laws will become effective upon the closing of the Transaction. If the proposed amendment to the By-Laws is not approved, proposed nominee Mr. Jack W. Aber will not serve. If the Transaction is not completed, the current By-Laws of the Trust will remain in effect.
Required Vote
Approval of this proposal requires the affirmative vote of a majority of the shares voted by the shareholders of all of the Funds (voting as a single class) in person or by proxy.
PROPOSAL 3: ELECT TEN TRUSTEES TO THE BOARD OF TRUSTEES OF THE TRUST
Introduction
The ten individuals shown below have been nominated by the Board for election, to serve upon the closing of the Transaction. The nominees, if elected at the Special Meeting, will hold office until their respective successors are chosen and qualified. The individuals named as proxies on your voting proxy card will vote for the election of all of the individuals listed below unless authority to vote for any or all of the nominees is withheld in the proxy card. The nominees, if elected, will take office concurrently with the closing of the Transaction. If the Transaction is not completed, the current trustees of the Trust will continue to serve as trustees. All of the nominees listed below have consented to serve as trustees, if elected. However, if any nominee should become unavailable for election due to events not known or anticipated, the individuals named as proxies will vote for such other nominees as the current Board may recommend. If the proposed amendment to the By-Laws is not approved, proposed nominee Mr. Jack W. Aber will not serve.
Three of the nominees currently serve as trustees. Messrs. Stuart D. Bilton and Gregory T. Mutz have served as trustees of the Trust since the organizational meeting of the Trust held on December 13, 1993. Mr. Robert B. Scherer was nominated by the Board as a trustee at a Board meeting held on March 18, 1999 and was last elected to the Board by shareholders at a special meeting of shareholders held on June 17, 1999.
13
Messrs. Jeffrey S. Murphy, Jack W. Aber, William E. Chapman II, Edward J. Kaier, Steven J. Paggioli, Eric Rakowski and Thomas R. Schneeweis were nominated by the Board at a Board meeting held on December 6, 2009. If elected, Mr. Murphy will be an interested trustee and Messrs. Aber, Chapman, Kaier, Paggioli, Rakowski and Schneeweis will be Independent Trustees.
The Nominating and Governance Committee of the Board nominated each trustee candidate to the Board as part of the package of proposals presented in connection with the Transaction. Prior to each nomination being made, the Nominating and Governance Committee met with each candidate and reviewed the candidate’s background and qualifications to serve on the Board. The Nominating and Governance Committee concluded that each candidate was well qualified to serve on the Board and would ably represent the interests of the Funds and their shareholders. The following are the names of the nominees, their ages and their principal occupations during the past five years. The address of each nominee is 120 North LaSalle Street, 25th Floor, Chicago, IL 60602.
14
Nominees
| | | | | | | | | | |
Name and Age(1) | | Position Held with the Trust | | Term of
Office(2) and
Length of Time
Served(1) | | Principal Occupations During the Past Five Years | | Number of
Funds in Fund
Complex to be
Overseen by
Nominee | | Other Directorships Held by Nominee |
| | | | | |
| Interested Nominees | | | | | | | | | | |
| | | | | |
Stuart D. Bilton,(3) 63 | | Chairman, Trustee and Nominee | | 15 years | | Chief Executive Officer, Aston Asset Management LLC, since 2006; Director, Highbury Financial Inc., since August 2009; Vice Chairman of ABN AMRO Asset Management Holdings, Inc. 2003-2006; President and Chief Executive Officer of ABN AMRO Asset Management Holdings, Inc. 2001-2003; President of Alleghany Asset Management, Inc. 1996-2001 (purchased by ABN AMRO in February 2001). | | 25 | | Director, Baldwin & Lyons, Inc. (property and casualty insurance firm). |
| | | | | |
| Jeffrey S. Murphy,(3) 43 | | Nominee | | N/A | | Senior Vice President, Affiliated Managers Group, Inc. since 2007, Vice President, Affiliated Managers Group, Inc. 1995-2007. | | 25 | | None. |
15
| | | | | | | | | | |
Name and Age(1) | | Position Held with the Trust | | Term of
Office(2) and
Length of Time
Served(1) | | Principal Occupations During the Past Five Years | | Number of
Funds in Fund
Complex to be
Overseen by
Nominee | | Other Directorships Held by Nominee |
| | | | | |
| Independent Nominees | | | | | | | | | | |
| | | | | |
Gregory T. Mutz, 63 | | Lead Independent Trustee and Nominee | | 15 years | | CEO of AMLI Residential Properties Trust (a Multifamily REIT), a successor company to AMLI Realty Co. since 2004 and a wholly-owned subsidiary of PRIME Property Fund, LLC, an instructional real estate co-mingled fund managed by Morgan Stanley Real Estate, Inc.; Vice Chairman of UICI (NYSE: UCI) (an insurance holding company) 2003-2004; President and CEO of UICI 1999-2003; Chairman of Academic Management Service Corp. (a student loans and finance company) 2000-2003. | | 25 | | Director of Alico, Inc. (NASDAQ: ALCO) (agribusiness); Member of Board of Genesis Financial Solutions (a privately-held company based in Portland, Oregon providing debt recovery, consumer lending and credit card services); a member of the Board of WAN S.A., a residential real estate company headquartered in Warsaw, Poland; a member of the Board of Suknip International Limited, a residential real estate company headquartered in St. Petersburg, Russia. |
| | | | | |
Robert B. Scherer, 68 | | Trustee and Nominee | | 10 years | | President of The Rockridge Group, Ltd (title insurance industry consulting services) since 1994. | | 25 | | Director, Title Reinsurance Company (insurance for title agents). |
16
| | | | | | | | | | |
Name and Age(1) | | Position Held with the Trust | | Term of
Office(2) and
Length of Time
Served(1) | | Principal Occupations During the Past Five Years | | Number of
Funds in Fund
Complex to be
Overseen by
Nominee | | Other Directorships Held by Nominee |
| | | | | |
Jack W. Aber, 72 | | Nominee | | N/A | | Professor of Finance, Boston University School of Management since 1972. | | 25 | | Trustee of Appleton Growth Fund (1 portfolio); Trustee of Third Avenue Trust (5 portfolios); Trustee of Third Avenue Variable Trust (1 portfolio); Trustee of The Managers Funds, Managers AMG Funds, Managers Trust I and Managers Trust II (34 portfolios). |
| | | | | |
William E. Chapman II, 68 | | Nominee | | N/A | | President and Owner, Longboat Retirement Planning Solutions since 1998; Trustee of Bowdoin College since 2002. | | 25 | | Director of Harding, Loevner Funds, Inc. (6 portfolios); Trustee of Third Avenue Trust (5 portfolios); Trustee of Third Avenue Variable Trust (1 portfolio); Trustee of The Managers Funds, Managers AMG Funds, Managers Trust I and Managers Trust II (34 portfolios). |
| | | | | |
Edward J. Kaier, 64 | | Nominee | | N/A | | Attorney at Law and Partner, Teeters Harvey Gilboy & Kaier, LLP since 2007; Attorney at Law and Partner, Hepburn Willcox Hamilton & Putnam, LLP 1977-2007. | | 25 | | Trustee of Third Avenue Trust (5 portfolios); Trustee of Third Avenue Variable Trust (1 portfolio); Trustee of The Managers Funds, Managers AMG Funds, Managers Trust I and Managers Trust II (34 portfolios). |
17
| | | | | | | | | | |
Name and Age(1) | | Position Held with the Trust | | Term of
Office(2) and
Length of Time
Served(1) | | Principal Occupations During the Past Five Years | | Number of
Funds in Fund
Complex to be
Overseen by
Nominee | | Other Directorships Held by Nominee |
| | | | | |
Steven J. Paggioli, 59 | | Nominee | | N/A | | Consultant since 2001; Executive Vice President and Director, The Wadsworth Group 1986-2001; Executive Vice President, Secretary and Director, Investment Company Administration, LLC 1990-2001; Vice President, Secretary and Director, First Fund Distributors, Inc. 1991-2001. | | 25 | | Trustee, Professionally Managed Portfolios (22 portfolios); Advisory Board Member, Sustainable Growth Advisors, LP; Independent Director, Chase Investment Counsel; Trustee of The Managers Funds, Managers AMG Funds, Managers Trust I and Managers Trust II (34 portfolios). |
| | | | | |
Eric Rakowski, 51 | | Nominee | | N/A | | Professor, University of California at Berkeley School of Law since 1990. | | 25 | | Director of Harding, Loevner Funds, Inc. (6 portfolios); Trustee of Third Avenue Trust (5 portfolios); Trustee of Third Avenue Variable Trust (1 Portfolio); Trustee of The Managers Funds, Managers AMG Funds, Managers Trust I and Managers Trust II (34 portfolios). |
18
| | | | | | | | | | |
Name and Age(1) | | Position Held with the Trust | | Term of
Office(2) and
Length of Time
Served(1) | | Principal Occupations During the Past Five Years | | Number of
Funds in Fund
Complex to be
Overseen by
Nominee | | Other Directorships Held by Nominee |
| | | | | |
Thomas R. Schneeweis, 62 | | Nominee | | N/A | | Professor of Finance, University of Massachusetts since 1977; Director, CISDM at the University of Massachusetts since 1996; President, Alternative Investment Analytics, LLC (formerly Schneeweis Partners, LLC) since 2001; Partner, White Bear Partners, LLC since 2007; Partner, Schneeweis Capital Management, LLC since 2007; Partner, Schneeweis Associates, LLC since 2007; Partner, Northampton Capital Management, LLC since 2004; Partner, TRS Associates since 2007. | | 25 | | Trustee of The Managers Funds, Managers AMG Funds, Managers Trust I and Managers Trust II (34 portfolios). |
| (1) | As of October 31, 2009. |
| (2) | Currently, a trustee serves for an indefinite term until the earliest of: (i) removal by two-thirds of the Board or shareholders, (ii) resignation, death or incapacity, (iii) the election and qualification of his successor, in accordance with the By-Laws or (iv) the last day of the fiscal year in which he attains the age of 72 years. If the proposed amendment to the By-Laws takes effect, the mandatory retirement age for trustees will change to the last day of the fiscal year in which he attains the age of 75 years. |
| (3) | “Interested person” of the Trust as defined in the 1940 Act. Mr. Bilton is considered an “interested person” because of affiliations with Aston and related entities, which act as the Funds’ investment adviser. Mr. Murphy will be considered an “interested person” after the consummation of the Transaction due to affiliations with AMG and related entities. |
19
Board and Committees
Under the Declaration of Trust and the laws of the State of Delaware, the business and affairs of the Trust are managed under the direction of the Board. The Board held nine meetings during the fiscal year ended October 31, 2009. Each trustee attended 75% or more of the respective meetings of the full Board and of any committees of which he was a member that were held during the fiscal year ended October 31, 2009. The Board has established an Audit Committee, Nominating and Governance Committee and Valuation Committee.
The Audit Committee is currently comprised of four members, including a Chairman of the Committee. The current members of the Audit Committee are Mr. Scherer (Chairman), Leonard F. Amari, Mr. Mutz and Denis Springer. The Audit Committee’s function is to oversee the integrity of the Trust’s accounting policies, financial reporting process and system of internal controls regarding finance and accounting. The Audit Committee also monitors the independence and performance of the Trust’s independent registered public accounting firm. The Audit Committee held two meetings during the fiscal year ended October 31, 2009.
The Nominating and Governance Committee is currently comprised of four members, including a Chairman of the Committee. The current members of the Nominating and Governance Committee are Messrs. Amari (Chairman), Scherer, Mutz and Springer. The Nominating and Governance Committee’s function is to put forth names for nomination as trustee when deemed necessary. The Nominating and Governance Committee will consider nominees recommended by shareholders whose resumes have been submitted by U.S. mail or courier service to the Trust’s Secretary for the attention of the Chairman of the Nominating and Governance Committee. The Nominating and Governance Committee held one meeting during the fiscal year ended October 31, 2009. A current copy of the Nominating and Governance Committee Charter is available on the Funds’ website at astonfunds.com.
The Valuation Committee is currently comprised of at least three Trustees, including at least one Independent Trustee. The current members of the Valuation Committee are Messrs. Bilton (Chairman), Scherer and Springer. The Valuation Committee is responsible for fair valuing
20
securities of the Funds as may be necessary from time to time. The Valuation Committee held no meetings during the fiscal year ended October 31, 2009.
Board Member Compensation
The trustees of the Trust who are not affiliated with Aston or any subadvisers receive an annual retainer and meeting fees. The Lead Independent Trustee and committee chairs receive an additional retainer. The trustees of the Trust who are not affiliated with Aston or any subadvisers receive meeting fees and are reimbursed for out-of-pocket expenses for each meeting of the Board they attend. No officer or employee of Aston or any subadviser or any of their respective affiliates receives any compensation from the Funds for acting as a trustee of the Trust.
21
The table below shows the total fees that were paid to each of the trustees during the fiscal year ended October 31, 2009. There were no “compensated persons” who received more than $120,000 in aggregate compensation from the Trust for the same period.
| | | | | | | | | |
Trustee/ Nominee | | Aggregate Compensation from the Trust | | Pension
Retirement
Benefits Accrued
as Part of Fund
Expenses | | Estimated Annual
Benefits Upon
Retirement | | Total Compensation
from the Trust | |
| | | | |
Independent Trustees | | | | | | | | | |
Leonard F. Amari | | $82,000* | | N/A | | N/A | | $82,000 | * |
Gregory T. Mutz | | 99,500* | | N/A | | N/A | | 99,500 | * |
Robert B. Scherer | | 89,500* | | N/A | | N/A | | 89,500 | * |
Denis Springer | | 76,500* | | N/A | | N/A | | 76,500 | * |
Interested Trustee | | | | | | | | | |
Stuart D. Bilton | | 0 | | N/A | | N/A | | 0 | |
| * | The Trustee also received special meeting fees of $3,000 in the fiscal year ended October 31, 2009 for special meetings that occurred during the previous fiscal year. |
22
Trustee/Nominee Ownership of Fund Shares
The dollar range of shares beneficially owned in each Fund as well as the aggregate dollar range of shares beneficially owned in all the Funds is shown in Appendix B for each nominee.
Officers of the Trust
Except for Mr. Bilton (Chairman of the Trust), information about the current officers, their ages and their principal occupations during the past five years is provided below. The address of each current officer listed below is 120 North LaSalle Street, 25th Floor, Chicago, Illinois 60602. The officers of the Trust receive no compensation directly from the Funds for performing the duties of their offices, except that the Funds compensate the administrator for providing an officer to serve as the Funds’ Chief Compliance Officer.
23
| | | | |
Name, Age(1) and Position(s) with Trust | | Term of Office(2) and
Length of Time
Served(1) | | Principal Occupation(s) During Past Five Years |
| | |
Kenneth C. Anderson, 45,
President (Chief Executive Officer) | | 16 years | | President, Aston Asset Management LLC, since 2006; Director, Highbury Financial Inc., since August 2009; President and Chief Executive Officer of ABN AMRO Investment Fund Services, Inc. (formerly known as Alleghany Investment Services, Inc.) 1995-2006; Executive Vice President of ABN AMRO Asset Management (USA) LLC 2001-2005; Director, ABN AMRO Trust Services Company 2001-2005; Director, TAMRO Capital Partners LLC and Veredus Asset Management LLC 2001- 2006; Officer of the Trust since 1993; CPA. |
| | |
Gerald F. Dillenburg, 42,
Senior Vice President, Secretary and Treasurer (Chief Financial Officer, Chief Operating Officer and Chief Compliance Officer) | | 13 years | | Chief Compliance Officer and Chief Financial Officer, Aston Asset Management LLC, since 2006; Senior Managing Director (“SMD”) of ABN AMRO Investment Fund Services, Inc. (formerly known as Alleghany Investment Services, Inc.) 1996-2006; SMD of ABN AMRO Asset Management Holdings, Inc. and ABN AMRO Asset Management, Inc. (formerly known as Chicago Capital Management, Inc.) 2001-2006; operations manager and compliance officer of ABN AMRO mutual funds 1996-2006; CPA. |
| (1) | As of October 31, 2009. |
| (2) | Officers serve for an indefinite term until the earliest of: (i) removal by the Board, (ii) resignation, death or incapacity, or (iii) the election and qualification of their successor, in accordance with the By-Laws. |
24
Shareholder Communications
The Board provides a process for shareholders to communicate with the Board as a whole and/or each of the trustees individually. Shareholders should forward such correspondence by U.S. mail or other courier service to the Secretary of the Trust. Correspondence addressed to the Board will be forwarded to each trustee, and correspondence addressed to a particular trustee will be forwarded to that trustee.
Independent Registered Public Accounting Firm
Ernst & Young LLP (“E&Y”) serves as the Trust’s independent registered public accounting firm. E&Y performs an annual audit of the financial statements of the Trust and provides other accounting and tax services to the Trust. Representatives of E&Y are not expected to be present at the Special Meeting.
Audit Fees. For the fiscal year ended October 31, 2009, E&Y billed the Trust $364,700 for professional services rendered for the audit of the Trust’s annual financial statements or services that are normally provided in connection with statutory and regulatory filings. For the fiscal year ended October 31, 2008, E&Y billed the Trust $459,500 for professional services rendered for the audit of the Trust’s annual financial statements or services that are normally provided in connection with statutory and regulatory filings.
Audit-Related Fees. For the fiscal years ended October 31, 2009 and 2008, E&Y billed the Trust $22,000 and $40,500, respectively, for assurance and related services that are reasonably related to the performance of the audit of the Trust’s financial statements and that are not reported above.
Tax Fees. For the fiscal years ended October 31, 2009 and 2008, E&Y did not bill the Trust for professional services rendered for tax compliance, tax advice, tax planning and tax training.
All Other Fees. For the fiscal years ended October 31, 2009 and 2008, E&Y did not bill the Trust for products and services other than the services reported above.
25
Audit Committee Pre-Approval Policies and Procedures
Pursuant to the Audit Committee Charter, the Audit Committee is responsible for pre-approving all audit services and permissible non-audit services to be provided to the Trust by E&Y, including the fees and other compensation to be paid to E&Y to provide non-audit services to the Trust’s investment adviser or any affiliate of the Trust’s investment adviser, if the engagement relates directly to the operations and financial reporting of the Trust, provided that the amount of such services constitutes no more than 5% of the total amount of revenues paid to E&Y by the Trust, Aston and any affiliate of Aston that provides ongoing services to the Trust that would have to be preapproved by the Committee pursuant to the Audit Committee Charter. All such delegated pre-approvals will be presented to the Audit Committee no later than the next Audit Committee meeting.
Pre-approval for a permitted non-audit service is not required if: (1) the aggregate amount of all non-audit services is not more than 5% of the total revenues paid by the Trust to E&Y in that fiscal year; (2) such services were not recognized by the Trust to be non-audit services; and (3) such non-audit services were brought to the attention of the Audit Committee and approved prior to completion.
Non-Audit Fees. For the fiscal years ended October 31, 2009 and 2008, E&Y did not bill the Trust or Aston for non-audit services rendered.
For the fiscal years ended October 31, 2009 and 2008, E&Y did not provide any non-audit services to Aston. Accordingly, the Audit Committee has not had to consider whether the provision of such non-audit services is compatible with maintaining E&Y’s independence.
Required Vote
Approval of this proposal requires the affirmative vote of a plurality of the shares voted by the shareholders of all of the Funds (voting as a single class) in person or by proxy.
26
PROPOSAL 4: APPROVAL OF PROPOSED REORGANIZATIONS
| | | | |
Acquired Fund | | | | Acquiring Fund |
| Aston Growth Fund | | into | | Aston/Montag & Caldwell Growth Fund |
| Aston Balanced Fund | | into | | Aston/Montag & Caldwell Balanced Fund |
A. SYNOPSIS
The responses to the questions that follow provide an overview of key points typically of concern to shareholders considering a proposed reorganization that would have the effect of merging mutual funds. These responses are qualified in their entirety by the remainder of this Proxy Statement/Prospectus, which you should read carefully because it contains additional information and further details regarding the proposed reorganizations.
1. What is being proposed?
The Board of Trustees of Aston Funds recommends that shareholders approve the transactions contemplated by an Agreement and Plan of Reorganization (as described below and a form of which is attached hereto as Appendix G), each of which we refer to as a “reorganization” of an acquired Fund (the “Acquired Fund”) into the corresponding acquiring Fund (the “Acquiring Fund”). If approved by shareholders, all the assets of an Acquired Fund will be transferred to the corresponding Acquiring Fund solely in exchange for the issuance and delivery to the Acquired Fund of voting shares of beneficial interest of the corresponding Acquiring Fund (“Acquiring Fund Shares”) with a value equal to the value of the Acquired Fund’s assets net of liabilities, and for the assumption by the corresponding Acquiring Fund of all liabilities of the Acquired Fund. As soon as practicable following the transfer, the Acquiring Fund Shares received by each Acquired Fund will be distributed pro-rata to its shareholders of record.
2. What will happen to my investment in the Acquired Fund as a result of the reorganization?
You will receive shares of the corresponding Acquiring Fund in exchange for your shares in the Acquired Fund. Although the number of
27
shares owned by each shareholder will most likely change, the total value of your investment in the Acquiring Fund will equal the total value of your investment in your Acquired Fund at the time of the reorganization. Even though the net asset value per share of each Fund is likely to be different, the total value of your holdings will not change as a result of the reorganization.
3. Why has the Board recommended that shareholders approve the reorganizations?
Aston advised the Board that it believes the proposed reorganization to be in the best interest of each Acquired Fund. Aston recommended the reorganizations in order to consolidate substantially similar product offerings. Prior to January 2008, the Acquired Funds were managed by different subadvisers and offered shareholders different investment styles than the Acquiring Funds. Since January 2008, Montag & Caldwell, Inc. (“Montag & Caldwell”) has managed Aston/Montag & Caldwell Growth Fund and Aston Growth Fund (collectively, the “Growth Funds”), Aston/Montag & Caldwell Balanced Fund and the equity portion of Aston Balanced Fund. Aston believes that following the reorganizations the Acquiring Fund will provide the corresponding Acquired Fund’s shareholders with an investment style that is substantially similar to that of the Acquired Fund. Aston also believes the reorganizations may result in lower total operating expenses, taking into account the effect of expense waivers, for the corresponding Acquired Fund through economies of scale, which may subsequently lead to additional sales and additional economies of scale.
4. How do the investment objectives of the Funds compare?
Growth Funds. While not identical, these two Funds have substantially similar investment objectives. Aston Growth Fund seeks long-term total return through a combination of capital appreciation and current income, by investing primarily in a combination of stocks and bonds. Aston/Montag & Caldwell Growth Fund seeks long-term capital appreciation and, secondarily, current income, by investing primarily in common stocks and bonds.
Balanced Funds. While not identical, Aston/Montag & Caldwell Balanced Fund and Aston Balanced Fund (collectively, the “Balanced Funds”) have substantially similar investment objectives. The Aston
28
Balanced Fund seeks growth of capital with current income by investing in a combination of equity and fixed income securities. The Aston/Montag & Caldwell Balanced Fund seeks long-term total return.
5. How do the expense ratios and management fee rates of the Funds compare, and what are they estimated to be following each reorganization?
Growth Funds. The table below describes the fees and expenses that you may pay if you buy and hold shares of these Funds. As shown below, the proposed reorganization may result in lower total operating expenses for shareholders of the Aston Growth Fund. However, there can be no assurance that the reorganization will result in expense savings.
29
Annual Fund Operating Expenses(1)
(expenses that you pay each year as a percentage
of the value of your investment)
| | | | | | | | | | | | | | |
| | | Management
Fee | | | Distribution
(12b-1) Fee | | | Acquired
Fund Fees
and
Expenses | | Other
Expenses | | | Total Annual
Fund
Operating
Expenses | |
Aston Growth Fund | | | | | | | | | | | | | | |
Class N Shares | | 0.70 | % | | 0.25 | % | | — | | 0.21 | % | | 1.16 | % |
Class I Shares | | 0.70 | % | | None | | | — | | 0.21 | % | | 0.91 | % |
Class R Shares | | 0.70 | % | | 0.50 | % | | — | | 0.21 | % | | 1.41 | % |
Aston/Montag & Caldwell Growth Fund | | | | | | | | | | | | | | |
Class N Shares | | 0.69 | % | | 0.25 | % | | — | | 0.17 | % | | 1.11 | % |
Class I Shares | | 0.69 | % | | None | | | — | | 0.17 | % | | 0.86 | % |
Class R Shares | | 0.69 | % | | 0.50 | % | | — | | 0.17 | % | | 1.36 | % |
Aston/Montag & Caldwell Growth Fund (Pro forma combined, assuming consummation of the
reorganization) | | | | | | | | | | | | | | |
Class N Shares | | 0.68 | % | | 0.25 | % | | — | | 0.17 | % | | 1.10 | % |
Class I Shares | | 0.68 | % | | None | | | — | | 0.17 | % | | 0.85 | % |
Class R Shares | | 0.68 | % | | 0.50 | % | | — | | 0.17 | % | | 1.35 | % |
| (1) | The Annual Fund Operating Expenses table is presented as of each Fund’s fiscal year end (October 31, 2009). The pro forma combined figures assume the consummation of the reorganization on October 31, 2009 and reflects average net asset levels for the 12-month period ended as of that date. |
30
The tables are provided to help you understand the expenses of investing in the Funds and your share of the operating expenses that each Fund incurs and that Aston expects the Aston/Montag & Caldwell Growth Fund to incur in the first year following the reorganization.
Example
This example is intended to help you compare the cost of investing in the Funds with the cost of investing in other mutual funds. The example shows the operating expenses you would incur as a shareholder if you invested $10,000 in the Funds over the time periods shown and you redeem all your shares at the end of those periods. The example assumes you reinvested all dividends and distributions, that the average annual return was 5% and that operating expenses remained the same.
Although your actual costs may be higher or lower, based on the above assumptions, your costs would be:
| | | | | | | | | | | | |
| | | 1 Year | | 3 Years | | 5 Years | | 10 Years |
Aston Growth Fund | | | | | | | | | | | | |
Class N Shares | | $ | 118 | | $ | 368 | | $ | 638 | | $ | 1,409 |
Class I Shares | | $ | 93 | | $ | 290 | | $ | 504 | | $ | 1,120 |
Class R Shares | | $ | 144 | | $ | 446 | | $ | 771 | | $ | 1,691 |
Aston/Montag & Caldwell Growth Fund | | | | | | | | | | | | |
Class N Shares | | $ | 113 | | $ | 353 | | $ | 612 | | $ | 1,352 |
Class I Shares | | $ | 88 | | $ | 274 | | $ | 477 | | $ | 1,061 |
Class R Shares | | $ | 138 | | $ | 431 | | $ | 745 | | $ | 1,635 |
Aston/Montag & Caldwell Growth Fund (Pro forma combined, assuming consummation of the reorganization) | | | | | | | | | | | | |
Class N Shares | | $ | 112 | | $ | 350 | | $ | 606 | | $ | 1,340 |
Class I Shares | | $ | 87 | | $ | 271 | | $ | 471 | | $ | 1,049 |
Class R Shares | | $ | 137 | | $ | 428 | | $ | 739 | | $ | 1,624 |
Balanced Funds. The table below describes the fees and expenses that you may pay if you buy and hold shares of these Funds. As shown below, the proposed reorganization may result in lower total operating expenses for shareholders of the Aston Balanced Fund. However, there can be no assurance that the reorganization will result in expense savings.
31
Annual Fund Operating Expenses
(expenses that you pay each year as a percentage
of the value of your investment)
| | | | | | | | | | | | | | | | | | | | | |
| | | Management
Fee | | | Distribution
(12b-1)
Fee(1) | | | Acquired
Fund
Fees and
Expenses | | | Other
Expenses | | | Total
Annual
Fund
Operating
Expenses | | | Fee Waiver
and/or Expense
Reimbursement(2) | | | Totals Annual
Fund Operating
Expenses after
Fee Waiver and/
or Expense
Reimbursement(2) | |
Aston Balanced Fund | | | | | | | | | | | | | | | | | | | | | |
Class N Shares | | 0.70 | % | | 0.25 | % | | 0.02 | % | | 0.76 | % | | 1.73 | % | | (0.31 | )% | | 1.42 | % |
Aston/Montag & Caldwell Balanced Fund | | | | | | | | | | | | | | | | | | | | | |
Class N Shares | | 0.75 | % | | 0.25 | % | | 0.01 | % | | 0.82 | % | | 1.83 | % | | (0.47 | )% | | 1.36 | % |
Aston/Montag & Caldwell Balanced Fund (Pro forma combined, assuming consummation of the reorganization) | | | | | | | | | | | | | | | | | | | | | |
Class N Shares | | 0.75 | % | | 0.25 | % | | 0.01 | % | | 0.55 | % | | 1.56 | % | | (0.20 | )% | | 1.36 | % |
| (1) | The Annual Fund Operating Expenses table is presented as of each Fund’s fiscal year end (October 31, 2009). The pro forma combined figures assume the consummation of the reorganization on October 31, 2009 and reflects average net asset levels for the 12-month period ended as of that date. Rule 12b-1 fees in the table reflect the maximum amount of fees payable under each plan, while the Trust’s financial statements reflect actual fees paid. Accordingly, the financial statements will vary to the extent of voluntary reductions in the period. Actual 12b-1 fees paid during the fiscal year ended October 31, 2009 for Aston Balanced Fund and Aston/Montag & Caldwell Balanced Fund were 0.03% and 0.16%, respectively. |
| (2) | The adviser is contractually obligated to waive management fees and/or reimburse ordinary operating expenses through February 28, 2011 at the rates shown in the table, not including fees and expenses from investments in other investment companies (acquired fund fees and expenses). Prior to February 28, 2011, the arrangement may be terminated only by a vote of the Board of Trustees of the Trust. |
The tables are provided to help you understand the expenses of investing in the Funds and your share of the operating expenses that each Fund incurs and that Aston expects the Aston/Montag & Caldwell Balanced Fund to incur in the first year following the reorganization.
32
Example
This example is intended to help you compare the cost of investing in the Funds with the cost of investing in other mutual funds. The example shows the operating expenses you would incur as a shareholder if you invested $10,000 in the Funds over the time periods shown and you redeem all your shares at the end of those periods. The example assumes you reinvested all dividends and distributions, that the average annual return was 5% and that operating expenses remained the same.
Although your actual costs may be higher or lower, based on the above assumptions, your costs would be:
| | | | | | | | | | | | |
| | | 1 Year | | 3 Years | | 5 Years | | 10 Years |
Aston Balanced Fund | | | | | | | | | | | | |
Class N Shares | | $ | 145 | | $ | 515 | | $ | 910 | | $ | 2,015 |
Aston/Montag & Caldwell Balanced Fund | | | | | | | | | | | | |
Class N Shares | | $ | 138 | | $ | 530 | | $ | 947 | | $ | 2,109 |
Aston/Montag & Caldwell Balanced Fund (Pro forma combined, assuming consummation of the reorganization) | | | | | | | | | | | | |
Class N Shares | | $ | 138 | | $ | 473 | | $ | 851 | | $ | 1,839 |
6. How does the portfolio turnover of the Funds compare?
Growth Funds. Each Fund pays transaction costs, such as commissions, when it buys and sells securities (or “turns over” its portfolio). A higher portfolio turnover rate may indicate higher transaction costs and may result in higher taxes when Fund shares are held in a taxable account. These costs, which are not reflected in annual fund operating expenses or in the example, affect each Fund’s performance. During the most recent fiscal year, the Aston Growth Fund’s and Aston/Montag & Caldwell Growth Fund’s portfolio turnover rates were 37.59% and 35.09%, respectively.
Balanced Funds. Each Fund pays transaction costs, such as commissions, when it buys and sells securities (or “turns over” its portfolio). A higher portfolio turnover rate may indicate higher transaction costs and may result in higher taxes when Fund shares are held in a taxable account. These costs, which are not reflected in annual fund operating expenses or in the example, affect each Fund’s performance. During the most recent fiscal year, the Aston Balanced Fund’s and Aston/Montag & Caldwell Balanced Fund’s portfolio turnover rates were 43.33% and 38.72%, respectively.
33
7. How do the investment strategies of the Funds compare?
Growth Funds. Each Fund invests primarily in common stocks and bonds. Each Fund’s portfolio manager uses a bottom-up approach to stock selection and seeks high quality, well-established large-cap companies that the portfolio manager believes are growing their near-term earnings at an above average rate. The portfolio manager emphasizes valuation to find companies selling at a discount to their intrinsic value. These companies must pass an initial capitalization screen and:
| | • | | have a strong history of earnings growth |
| | • | | be attractively priced, relative to the company’s potential for above average long-term earnings and revenue growth |
| | • | | have strong balance sheets |
| | • | | have a sustainable competitive advantage |
| | • | | be currently, or have the potential to become, industry leaders |
| | • | | have the potential to outperform during market downturns |
Each Fund may invest in foreign securities (directly and through depositary receipts). To manage risk, each Fund’s portfolio manager limits sector and individual security exposure and adheres to a strong sell discipline. For a more detailed description of the investment techniques used by each Fund, please see the Fund’s prospectus and statement of additional information.
Balanced Funds. Aston Balanced Fund’s investment adviser retains two subadvisers dedicated to managing the equity and fixed income portions of the Fund’s portfolio. The investment adviser determines the allocation of assets between the equity and fixed income portions of the Aston Balanced Fund’s portfolio. The investment adviser generally rebalances the portfolio quarterly and, under normal circumstances, allocates between 50% and 70% of the Fund’s total assets to the equity portion and at least 25% to the fixed income portion.
Aston/Montag & Caldwell Balanced Fund invests primarily in a combination of equity, fixed income and short-term securities. Generally, between 50% and 70% of the Fund’s total assets will be invested in equity securities and at least 25% will be invested in fixed income securities to
34
provide a stable flow of income. The portfolio allocation will vary based upon the portfolio manager’s assessment of the return potential of each asset class.
For equity investments, each Fund’s portfolio manager uses a bottom-up approach to stock selection and seeks high quality, well-established large-cap companies that the portfolio manager believes are growing their near-term earnings at an above average rate. The portfolio manager emphasizes valuation to find companies selling at a discount to their intrinsic value. These companies must pass an initial capitalization screen and:
| | • | | have a strong history of earnings growth |
| | • | | be attractively priced, relative to the company’s potential for above average long-term earnings and revenue growth |
| | • | | have strong balance sheets |
| | • | | have a sustainable competitive advantage |
| | • | | be currently, or have the potential to become, industry leaders |
| | • | | have the potential to outperform during market downturns |
Each Fund may invest in foreign securities (directly and through depositary receipts). When selecting equity securities, each Fund’s portfolio manager limits sector and individual security exposure and adheres to a strong sell discipline in order to minimize risk.
With respect to fixed income securities, each Fund may invest in securities of the U.S. government and its agencies, corporate notes and bonds, mortgage- and asset-backed securities and short-term money market instruments. The fixed income portfolio managers select securities based on various methods of quantitative and fundamental analysis and research. The fixed income portfolio managers seek to maintain an average weighted portfolio maturity of three to ten years. Aston Balanced Fund emphasizes investment grade fixed income securities but may invest in high yield securities, while Aston/Montag &Caldwell Balanced Fund will only invest in securities rated “A” or better.
The Aston Balanced Fund’s fixed income portfolio managers manage risk through ongoing monitoring of sector, quality and issuer exposures, and ongoing analysis of duration, convexity and maturity. When selecting
35
fixed income securities, the Aston/Montag & Caldwell Balanced Fund’s portfolio manager strives to maximize total return and minimize risk primarily through actively adjusting the portfolio’s duration and sector weightings. Emphasis is also placed on diversification and credit analysis.
Each Balanced Fund may use futures, swaps and other derivatives for hedging purposes or to seek total return. Derivatives may consist primarily of futures contracts, interest rate swaps and credit default swaps. Derivatives may be used to hedge interest rate risk and credit risk. Derivatives may also be used to seek exposure to asset classes in which the Aston Balanced Fund is authorized to invest. For example, derivatives may provide exposure to specific credits that are not available in the cash markets or may provide more efficient access to such credits. Derivatives will not be used to seek exposure to asset classes that the Aston Balanced Fund may not invest in directly. The net notional (or market exposure) of derivatives instruments will not exceed the net assets of the Aston Balanced Fund. While each Balanced Fund may use futures, swaps and other derivatives for hedging purposes or to seek total return, the Balanced Funds currently do not invest in such instruments.
For a more detailed description of the investment techniques used by each Fund, please see the Fund’s prospectus and statement of additional information.
8. How does the management of the Funds compare?
Growth Funds. Management of the Growth Funds is the same. Aston Asset Management LLC serves as investment adviser to the Funds. Montag & Caldwell, Inc. serves as the subadviser to the Funds.
Mr. Ronald E. Canakaris, President and Chief Investment Officer of Montag & Caldwell, has served as the Aston/Montag & Caldwell Growth Fund’s portfolio manager since the Fund’s inception and as the Aston Growth Fund’s portfolio manager since January 2008.
Balanced Funds. Aston Asset Management LLC serves as investment adviser to these Funds. Montag & Caldwell serves as the subadviser to the Aston/Montag & Caldwell Balanced Fund and to the equity portion of the Aston Balanced Fund’s portfolio. Taplin, Canida & Habacht, LLC (“TCH”) serves as the subadviser to the fixed income portion of the Aston Balanced Fund’s portfolio.
36
Mr. Ronald E. Canakaris, Chairman, President and Chief Investment Officer of Montag & Caldwell, has served as portfolio manager of the Aston/Montag & Caldwell Balanced Fund since its inception. Mr. Canakaris has served as portfolio manager for the equity portion of the Aston Balanced Fund’s portfolio since January 2008.
Ms. Tere Alvarez Canida, President and Managing Principal of TCH, Mr. Alan M. Habacht, Principal of TCH, and Mr. William J. Canida, Principal of TCH, serve as portfolio managers for the fixed income portion of the Aston Balanced Fund’s portfolio. Ms. Canida, Mr. Habacht, and Mr. Canida have served as the Aston Balanced Fund’s portfolio managers since December 1, 2006.
9. Do the procedures for purchasing, redeeming and exchanging shares of the Funds differ?
No. The Funds have identical procedures for purchasing, redeeming and exchanging shares. Shares of the Fund may be purchased, exchanged or redeemed on any business day by written request (Aston Funds, P.O Box 9765, Providence, RI 02940), wire transfer, online access (astonfunds.com), or telephone (800-992-8151). Investors who wish to purchase, exchange or redeem Fund shares through a broker-dealer should contact the broker-dealer directly.
The shares of each Fund are purchased and redeemed at the net asset value of the Fund’s shares next determined. No fee is charged to shareholders when they purchase or redeem shares of the Funds, nor will a fee be charged to shareholders when they purchase or redeem shares of the Acquiring Funds. The minimum initial investment is $2,500 for Class N and R shares ($500 for IRA, ESAs, UGMA and UTMA Accounts) and $1,000,000 for Class I shares. The minimum subsequent investment is $50 for Class N and R shares. Class R shares are only intended for use within retirement plans offered through a financial representative or a plan sponsor. Please see a Fund’s prospectus for additional information.
10. How does the tax information and financial intermediary compensation of the Funds compare?
Tax Information. Each Fund’s distributions are generally taxable as ordinary income or capital gains for federal income tax purposes, unless
37
you are investing through a tax-deferred account such as a 401(k) or individual retirement account.
Payments to Broker-Dealers and Other Financial Intermediaries. If you purchase shares of a Fund through a broker-dealer or other financial intermediary (such as a bank), the Fund and its related companies may pay the intermediary for the sale of shares and related services. These payments may create a conflict of interest by influencing the broker-dealer or other intermediary and your salesperson to recommend a Fund over another investment. Ask your salesperson or visit your financial intermediary’s website for more information.
11. How does the distribution arrangements of the Funds compare?
The distribution arrangements for Class N, R and I shares are the same for each of the Acquired Funds and Acquiring Funds.
12. What are the federal income tax consequences of the proposed reorganizations?
For federal income tax purposes, no gain or loss is expected to be recognized by an Acquired Fund or its shareholders as a direct result of a proposed reorganization. As a result of the proposed reorganizations, however, each Acquired Fund and its shareholders may lose the benefit of certain tax losses that otherwise could have been used to offset or defer future gains. In addition, the proposed reorganizations will require each Acquired Fund to distribute all of its undistributed net investment income and net capital gains as of the reorganization date to its shareholders. Such distribution will generally be taxable to shareholders for federal income tax purposes unless the shareholder is investing through a tax-deferred account, such as a 401(k) or individual retirement account. For more information, please see “Information about the Proposed Reorganizations—Certain Federal Income Tax Consequences,” below.
13. Will my dividends be affected by the reorganizations?
No. The Growth Funds declare and distribute dividends from their net investment income and net capital gains, if any, annually. The Balanced Funds declare and distribute dividends from their net investment income and net capital gains, if any, quarterly. The reorganizations,
38
however, will require each Acquired Fund to distribute all of its undistributed net investment income and net capital gain as of the reorganization date.
B. ADDITIONAL INFORMATION REGARDING THE FUNDS
Investment Adviser. Aston is the investment adviser to the Funds. Please see Proposal 1 for more information about Aston, a description of the Current Advisory Agreement and New Advisory Agreement and a description of the transaction.
As of October 31, 2009, the Aston/Montag & Caldwell Growth Fund and the Aston Growth Fund had net assets of $2,486,823,315 and $201,697,414, respectively. For the fiscal year ended October 31, 2009, Aston/Montag & Caldwell Growth Fund and the Aston Growth Fund paid an aggregate net management fee expressed as a percentage of net assets of 0.69% and 0.69%, respectively. The table below compares the annual management fee schedules of the Funds expressed as a percentage of average daily net assets.
| | | | |
Aston Growth Fund
Management Fee | | Aston/Montag & Caldwell Growth Fund
Management Fee |
| | |
0.70% | | First $800 million | | 0.80% |
| | Over $800 million | | 0.60% |
As of October 31, 2009, the Aston/Montag & Caldwell Balanced Fund and the Aston Balanced Fund had net assets of $16,086,414 and $16,804,970, respectively. For the fiscal year ended October 31, 2009, Aston/Montag & Caldwell Balanced Fund and the Aston Balanced Fund paid an aggregate net management fee expressed as a percentage of net assets of 0.28% and 0.70%, respectively.
| | |
| Aston Balanced Fund | | Aston/Montag & Caldwell Balanced Fund |
Management Fee | | Management Fee |
| |
0.70% | | 0.75% |
39
Subadvisers. Montag & Caldwell is the subadviser for the Aston/Montag & Caldwell Growth Fund, Aston/Montag & Caldwell Balanced Fund, Aston Balanced Fund (equity portion), and Aston Growth Fund. Montag & Caldwell, 3455 Peachtree Road NE Suite 1200, Atlanta, Georgia 30326, was founded in 1945. Montag & Caldwell is a wholly-owned direct subsidiary of Fortis Bank SA/NV (“Fortis Bank”). As of October 31, 2009, Montag & Caldwell managed approximately $ billion in assets in institutional accounts and mutual funds.
Ronald E. Canakaris, CFA, CIC, has been the portfolio manager of Aston/Montag & Caldwell Growth Fund and Aston/Montag & Caldwell Balanced Fund since these Funds’ inceptions in 1994. Mr. Canakaris is the Chairman, President and Chief Investment Officer of Montag & Caldwell. He has been with Montag & Caldwell since 1972 and is responsible for developing the firm’s investment process. He has a BS and BA from the University of Florida. Ronald E. Canakaris has also been the portfolio manager of the Aston Growth Fund and Aston Balanced Fund (equity portion) since January 2008.
TCH is the subadviser for the Aston Balanced Fund (fixed income portion). TCH, 1001 Brickell Bay Drive, Suite 2100 Miami, Florida 33131, was founded in 1985 and as of October 31, 2009 had approximately $ billion in assets under management. TCH is a majority-owned subsidiary of Marshall & Ilsley Corporation. TCH provides investment management services to investment companies, high net worth individuals and institutional accounts.
Tere Alvarez Canida, CFA, has been the co-portfolio manager of the Aston Balanced Fund (fixed income portion) since December 2006 and is President and Managing Principal of TCH. Ms. Canida has over 28 years of investment experience. She previously served as Vice President and Senior Investment Officer of Southeast Bank. She received her BS from Georgetown University and her MBA from The George Washington University.
Alan M. Habacht has been the co-portfolio manager of the Aston Balanced Fund (fixed income portion) since December 2006 and is a Principal of TCH. Mr. Habacht has over 35 years of investment experience. Before joining TCH, he served as Senior Vice President and portfolio manager for INVESCO Capital Management. He also served as
40
a security analyst for Weiss, Peck & Greer, Alliance Capital Management, and Bache & Company. He received his BA in Finance from Boston University.
William J. Canida, CFA, has been the co-portfolio manager of the Aston Balanced Fund (fixed income portion) since December 2006 and is a Principal of TCH. Mr. Canida has over 30 years of investment experience. Prior to joining TCH, he served as Vice President and Senior Investment Officer for Harris Trust Company of Florida. He also was Vice President and Treasurer of AmeriFirst Florida Trust Company and Southeast Bank. Mr. Canida received his BA and his MBA from Indiana University. He has also attended the National Graduate Trust School of Northwestern University.
Investment Strategies. In addition to the principal investment strategies described in the Fund Summaries above, there may be times when the Funds use secondary investment strategies in seeking to achieve their investment objectives. Information regarding such secondary strategies, as well as additional information regarding certain principal strategies, is shown below.
Asset-Backed Securities (component of principal investment strategy for Aston/Montag & Caldwell Balanced Fund and Aston Balanced Fund). Asset-backed securities are payable from pools of obligations other than mortgages. Most asset-backed securities involve consumer or commercial debts with maturities of less than ten years. However, almost any type of fixed income assets (including other fixed income securities) may be used to create an asset-backed security. Asset-backed securities may take the form of notes or pass through certificates. Asset-backed securities have prepayment risks.
Below Investment Grade (High Yield) Securities (Aston Balanced Fund). Below investment grade (high yield) securities are lower rated, higher yielding securities issued by corporations. They are generally rated below investment-grade (i.e., Ba1/BB+ and below) by national bond rating agencies, or if unrated, are judged by an adviser or a subadviser to be of equivalent quality. They are considered speculative and are sometimes called “junk bonds.”
CMOs (Aston/Montag & Caldwell Balanced Fund and Aston Balanced Fund). CMOs are fixed income securities secured by mortgage
41
loans and other mortgage-backed securities. CMOs carry general fixed income securities risks and risks associated with mortgage-backed securities.
Commercial Paper (All Funds). Commercial paper are short-term fixed income securities issued by banks, corporations and other borrowers. There is the risk that the issuer of the commercial paper will not be able to make principal and/or interest payments. Commercial paper may include securities issued in reliance on the private placement exemption under Section 4(2) of the Securities Act of 1933, as amended. Section 4(2) paper is generally sold to an institutional investor, such as a Fund, that agrees that it is purchasing the paper for investment and not with a view to public distribution. Any resale of Section 4(2) commercial paper must similarly be in an exempt transaction.
Convertible Securities (component of principal investment strategy for all Funds). Convertible securities are fixed income or equity securities that pay interest or dividends and that may be exchanged on certain terms into common stock of the same corporation.
Because of the conversion feature, the market value of convertible securities tends to move together with the market value of the underlying stock. The value of convertible securities is also affected by prevailing interest rates, the credit quality of the issuer and any call provisions. There is the risk that the issuer of the security will not be able to make principal and/or interest payments as well as the risk that the holder of the security may not take advantage of the convertible features in the appropriate time frame.
Corporate Debt Securities (All Funds and component of principal investment strategy for Aston/Montag & Caldwell Balanced Fund and Aston Balanced Fund). Corporate debt securities are fixed income securities issued by businesses. Notes, bonds, debentures and commercial paper are the most prevalent types of corporate debt securities. A Fund may also purchase interests in bank loans made to companies. The credit risks of corporate debt securities vary widely among issuers.
In addition, the credit risk of an issuer’s debt security may vary based on its priority for repayment. For example, higher ranking (senior) debt securities have a higher priority than lower ranking (subordinated)
42
securities. This means that the issuer might not make payments on subordinated securities while continuing to make payments on senior securities. In addition, in the event of bankruptcy, holders of senior securities may receive amounts otherwise payable to the holders of subordinated securities.
Some subordinated securities, such as trust preferred and capital securities notes, also permit the issuer to defer payments under certain circumstances. For example, insurance companies issue securities known as surplus notes that permit the insurance company to defer any payment that would reduce its capital below regulatory requirements.
Debentures (All Funds and component of principal investment strategy for Aston Balanced Fund). Debentures are bonds or promissory notes that are secured by the general credit of the issuer, but not secured by specific assets of the issuer. There is the risk that the issuer of the security will not be able to make principal and/or interest payments.
Defensive Strategy (All Funds). There may be times when a Fund takes temporary positions that may not achieve its investment objective or follow its principal investment strategies for defensive reasons. This includes investing all or a portion of its total assets in cash or cash equivalents, such as money market securities and repurchase agreements. Although a Fund would do this in seeking to avoid losses, following a defensive strategy could reduce the benefit from any market upswings.
Depositary Receipts of Foreign Securities (All Funds). A Fund may invest in foreign securities in the form of depositary receipts and/or securities traded directly on U.S. exchanges. Depositary receipts represent ownership of securities in foreign companies and are held in banks and trust companies. They can include American depository receipts (“ADRs”), which are traded on U.S. exchanges and are U.S. dollar-denominated, European depository receipts (“EDRs”), which are traded on European exchanges and may not be denominated in the same currency as the security they represent, and global depository receipts (“GDRs”), which are issued globally and evidence a similar ownership arrangement.
Although ADRs, EDRs and GDRs do not eliminate the risks inherent in investing in the securities of foreign issuers, which include market, political, currency and regulatory risk, by investing in ADRs, EDRs or
43
GDRs rather than directly in securities of foreign issuers, a Fund may avoid currency risks during the settlement period for purchases or sales. In general, there is a large, liquid market in the United States for many ADRs. The information available for ADRs is subject to the accounting, auditing and financial reporting standards of the domestic market or exchange on which they are traded, in which standards are more uniform and more exacting than those to which many foreign issuers may be subject. A Fund may invest in ADRs sponsored or unsponsored by the issuer of the underlying security. In the case of an unsponsored ADR, a Fund may bear higher expenses and encounter greater difficulty in receiving shareholder communications than it would have with a sponsored ADR.
Derivatives (All Funds). The Funds may engage in derivatives primarily for hedging purposes, to maintain liquidity or in anticipation of changes in portfolio composition. Derivatives have a return tied to a formula based upon an interest rate, index, price of a security, or other measurement. Derivatives include options, futures, forward contracts, swaps and related products.
Hedging involves using derivatives to offset a potential loss in one position by establishing an interest in an opposite position. Any loss generated by the derivative should be offset by gains in the hedged investment. While hedging can reduce or eliminate losses, it can also reduce or eliminate gains. A Fund may realize a loss if interest rates, security prices or indices move in the opposite direction than the portfolio manager anticipates.
Derivatives will only be used when consistent with the objectives and strategy of a Fund. The portfolio manager(s) will ensure that the effective market exposure resulting from the use of derivatives will not exceed the total amount available for investment within a Fund (i.e., the use of derivatives will not result in a Fund being leveraged). All derivative positions will be covered by that Fund’s existing assets. The portfolio manager(s) will place a limit on the derivative exposure as a proportion of assets.
Equity Securities (component of principal investment strategy for all Funds). Equity securities represent a share of an issuer’s earnings and assets, after the issuer pays its liabilities. A Fund cannot predict the
44
income it will receive from equity securities because issuers generally have discretion as to the payment of any dividends or distributions. However, equity securities offer greater potential for appreciation than many other types of securities because their value may increase with the value of the issuer’s business. Types of equity securities include common stocks, preferred stocks, warrants and rights, convertible securities and other securities that represent underlying local shares, such as depositary receipts.
Fixed Income Securities (All Funds and component of principal investment strategy for Aston/Montag & Caldwell Balanced Fund and Aston Balanced Fund). Fixed income securities pay interest, dividends or distributions at a specified rate. The rate may be a fixed percentage of the principal or adjusted periodically. In addition, the issuer of a fixed income security must repay the principal amount of the security, normally within a specified time. Fixed income securities provide more regular income than equity securities. However, the returns on fixed income securities are limited and normally do not increase with the issuer’s earnings. This limits the potential appreciation of fixed income securities as compared to equity securities.
A security’s yield measures the annual income earned on a security as a percentage of its price. A security’s yield will increase or decrease depending upon whether it costs less (a discount) or more (a premium) than the principal amount. If the issuer may redeem the security before its scheduled maturity, the price and yield on a discount or premium security may change based upon the probability of an early redemption. Securities with higher risks generally have higher yields. Aston Montag/Caldwell Growth Fund and Aston Growth Fund may invest in fixed income securities to offset the volatility of the stock market. Fixed income securities provide a stable flow of income for a Fund.
Foreign Securities (All Funds). Foreign securities are securities issued by corporations, governments and other issuers located outside the United States. Foreign securities are subject to additional risks.
Mortgage-Backed Securities (component of principal investment strategy for Aston/Montag & Caldwell Balanced Fund and Aston Balanced Fund). Mortgage-backed securities represent interests in pools of mortgages. The mortgages that comprise a pool normally have similar
45
interest rates, maturities and other terms. Mortgages may have fixed or adjustable interest rates. Interests in pools of adjustable rate mortgages are known as ARMs. Mortgage-backed securities come in a variety of forms. Many have extremely complicated terms. The simplest type of mortgage-backed securities are pass-through certificates. An issuer of pass-through certificates gathers monthly payments from an underlying pool of mortgages. Then, the issuer deducts its fees and expenses and passes the balance of the payments onto the certificate holders once a month. Holders of pass-through certificates receive a pro rata share of all payments and pre-payments from the underlying mortgages. As a result, the holders assume all the prepayment risks of the underlying mortgages.
Other Investment Companies (All Funds). The Funds may invest in securities of other investment companies, including exchange traded funds (“ETFs”), open-end funds and closed-end funds. An ETF is an investment company that seeks to track the performance of an index by holding in its portfolio shares of all the companies, or a representative sample of the companies, that are components of a particular index. Closed-end funds are investment companies that typically issue a fixed number of shares that trade on a securities exchange or over-the-counter. The risks of investment in other investment companies typically reflect the risk of the types of securities in which the funds invest. Investments in ETFs and closed-end funds are subject to the additional risk that shares of the fund may trade at a premium or discount to their net asset value per share. When a Fund invests in another investment company, shareholders of the Fund bear their proportionate share of the other investment company’s fees and expenses as well as their share of the Fund’s fees and expenses.
Preferred Stocks (All Funds). Preferred stocks are stocks that pay dividends at a specified rate. Dividends are paid on preferred stocks before they are paid on common stocks. In addition, preferred stockholders have priority over common stockholders as to the proceeds from the liquidation of a company’s assets, but are subordinate to the claims of all creditors.
Repurchase Agreements (All Funds). Repurchase agreements, or repos, are transactions in which a security (usually a government security) is purchased with a simultaneous commitment to sell it back to the seller (a commercial bank or recognized securities dealer) at an agreed upon price on an agreed upon date, usually the next day. If the seller of the underlying security under the repurchase agreement should default on its
46
obligation to repurchase the underlying security, a Fund may experience delay or difficulty in exercising its right to realize upon the security. Additionally, a Fund may incur a loss if the value of the security should decline, as well as any disposition costs in liquidating the security.
Rule 144A Securities (All Funds). Rule 144A securities are restricted securities that can be sold to qualified institutional buyers under the Securities Act of 1933, as amended. Investing in Rule 144A securities may increase the illiquidity of a Fund’s investments in the event that an adequate trading market does not exist for these securities. To the extent there is an adequate trading market for lower-rated securities, Rule 144A securities generally are not subject to an increase in illiquidity.
U.S. Government Securities (All Funds and component of principal investment strategy for Aston/Montag & Caldwell Balanced Fund and Aston Balanced Fund). These are fixed income obligations of the U.S. government and its various agencies. U.S. government securities issued by the U.S. Treasury (bills, notes and bonds) are backed by the full faith and credit of the federal government. Some government securities not issued by the U.S. Treasury also carry the government’s full faith and credit backing on principal or interest payments. Some securities are backed by the issuer’s right to borrow from the U.S. Treasury and some are backed only by the credit of the issuing organization. All government securities are considered highly creditworthy. This guarantee, however, does not extend to the market prices for such securities, which can fluctuate.
Primary Risks. You could lose money by investing in a Fund. There can be no assurance that a Fund’s investment objective will be achieved. The following is a summary of certain risks of investing in the Funds.
Below Investment Grade (High Yield) Securities Risk. (Aston Balanced Fund) Bonds and other fixed income securities are rated by national ratings agencies. These ratings generally assess the ability of the issuer to pay principal and interest. Issuers of securities that are rated below investment grade (i.e., Ba1/BB+ or lower) and their unrated equivalents are typically in poor financial health, and their ability to pay interest and principal is uncertain. The prices of such securities may be more vulnerable to bad economic news, or even the expectation of bad news, than higher rated or investment grade bonds and other fixed income securities.
47
Call Risk. (Aston Balanced Fund) Call risk is the possibility that an issuer may redeem a fixed income security before maturity (a call) at a price below its current market price. An increased likelihood of a call may reduce the security’s price. If a fixed income security is called, the Fund may have to reinvest the proceeds in other fixed income securities with lower interest rates, higher credit risks or other less favorable characteristics.
Credit Risk. (Each Acquiring Fund and Aston Balanced Fund) Credit risk (also called default risk) is the risk that the issuer of a security will not be able to make principal and interest payments on a debt issue. The credit ratings of issuers could change and negatively affect a Fund’s share price or yield.
Derivatives Risk. (All Funds) Risks associated with derivatives may include the risk that the derivative is not well correlated with the security, index or currency to which it relates, the risk that derivatives may not have the intended effects and may result in losses or missed opportunities, the risk that the Fund will be unable to sell the derivative because of an illiquid secondary market, the risk that a counterparty is unwilling or unable to meet its obligations, and the risk that the derivative transaction could expose the Fund to the effects of leverage, which could increase the Fund’s exposure to the market and magnify potential losses. There is no guarantee that derivatives, to the extent employed, will have the intended effect, and their use could cause lower returns or even losses to the Fund. The use of derivatives by the Fund to hedge risk may reduce the opportunity for gain by offsetting the positive effect of favorable price movements. The use of over-the-counter derivatives subjects the Fund to credit risk of the counterparty of the instrument. The use of certain derivatives provides exposure to the underlying market or other reference asset in excess of the cash investment of the Fund. The use of derivatives can magnify gains and losses.
Foreign Securities Risk. (All Funds) Investing in the securities of foreign issuers involves special risks and considerations not typically associated with investing in U.S. companies. The securities of foreign companies may be less liquid and may fluctuate more widely than those traded in U.S. markets. Foreign companies and markets may also have less governmental supervision. There may be difficulty in enforcing contractual obligations and little public information about the companies.
48
Trades typically take more time to settle and clear, and the cost of buying and selling foreign securities is generally higher than similar costs associated with U.S. traded securities.
The value of the securities held by a Fund may be affected by changes in exchange rates or control regulations. If a local currency gains against the U.S. dollar, the value of the holding increases in U.S. dollar terms. If a local currency declines against the U.S. dollar, the value of the holding decreases in U.S. dollar terms. Changes in economic, tax or foreign investment policies, or other political, governmental or economic actions can adversely affect the value of the securities in the Fund. In foreign countries, accounting, auditing and financial reporting standards and other regulatory practices and requirements are generally different from those required for U.S. companies.
Growth Style Risk. (All Funds) Growth investing involves buying stocks that have relatively high price-to-earnings ratios. Growth stocks may be more volatile than other stocks because they are generally more sensitive to investor perceptions and market moves. During periods of growth stock underperformance, a Fund’s performance may suffer.
Interest Rate Risk. (Each Acquiring Fund and Aston Balanced Fund) If interest rates rise, bond prices will fall. The longer the maturity of a bond, the more sensitive a bond’s price will be to changes in interest rates. In other words, a long-term bond (30-year) will have greater price sensitivity than a short-term bond (2-year). Short-term and long-term bond prices and interest rates do not typically move the same amount or for the same reasons. Interest rate changes will impact high yield bonds in different ways depending on credit ratings. BB rated bonds are more vulnerable to prevailing rates and act more like their investment grade counterparts. For bonds rated B and below, credit risk is more significant than interest rate risk.
Liquidity Risk. (All Funds) When there is no willing buyer and investments cannot be readily sold at the desired time or price, a Fund may need to accept a lower price or may not be able to sell the security at all. An inability to sell securities can adversely affect a Fund’s value or prevent the Fund from being able to take advantage of other investment opportunities. Recent instability in certain credit and fixed income markets has adversely affected and is expected to continue to affect the
49
liquidity of certain asset classes of securities including, in particular, certain types of asset-backed, mortgage-backed and real-estate related securities. Less liquid securities are more difficult to dispose of at their recorded values and are subject to increased spreads and volatility.
Manager Risk. (All Funds) The performance of a Fund is dependent upon the investment adviser’s skill in selecting managers and the portfolio manager’s skill in making appropriate investments. As a result, a Fund may underperform its benchmark or its peers.
Market Risk. (All Funds) Each Fund’s share price can move down in response to stock market conditions, changes in the economy or changes in a particular company’s stock price. An individual stock may decline in value even when the value of stocks in general is rising.
Prepayment Risk. (Aston/Montag & Caldwell Balanced Fund and Aston Balanced Fund) Mortgage-backed securities carry prepayment risk. Prices and yields of mortgage-backed securities assume that the underlying mortgages will be paid off according to a preset schedule. If the underlying mortgages are paid off early, such as when homeowners refinance as interest rates decline, a Fund may be forced to reinvest the proceeds in lower yielding, higher priced securities. This may reduce a Fund’s total return.
U.S. Government Agency Securities Risk. (Aston/Montag & Caldwell Balanced Fund and Aston Balanced Fund) Certain U.S. government agency securities are backed by the right of the issuer to borrow from the U.S. Treasury, while others are supported only by the credit of the issuer or instrumentality. While the U.S. government may provide financial support to U.S. government-sponsored agencies or instrumentalities, such as various actions taken to stabilize the Federal National Mortgage Association and Federal Home Loan Mortgage Corporation in 2008, no assurance can be given that it will always do so. Such securities are neither issued nor guaranteed by the U.S. Treasury.
Performance Information. The bar charts show how the performance of the Class N shares of each Fund has varied from year-to-year over the periods shown. The classes of shares for a Fund are invested in the same portfolio of securities, so the annual returns would differ only to the extent that the classes do not have the same expenses. The annual returns of the
50
Class I shares would be higher than the returns of the Class N shares, due to distribution fees paid by Class N shares. This information may help illustrate the risks of investing in each Fund. Each Fund makes updated performance information available at the Funds’ Web site, www.astonfunds.com, or by calling 800-992-8151. As with all mutual funds, past performance (before and after taxes) does not guarantee future performance.
Aston Growth Fund—Aston/Montag & Caldwell Growth Fund
Calendar Year Total Returns (%)
Aston/Montag & Caldwell Growth Fund – Class N Shares
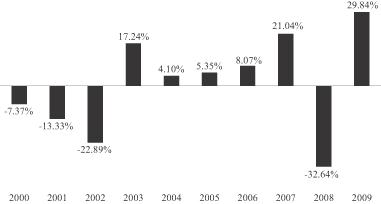
For the periods included in the bar chart:
| | |
| Best Quarter: 14.92% (06/09) | | Worst Quarter: (20.35)% (12/08) |
51
Aston Growth Fund – Class N Shares*
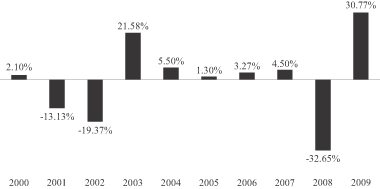
For the periods included in the bar chart:
| | |
| Best Quarter: 16.27% (12/01) | | Worst Quarter: (20.26)% (12/08) |
The following table indicates how each Fund’s average annual returns for different calendar periods compared to the returns of a broad-based securities market index. Performance reflects expense limitations that were in effect during one or more of the periods presented. If expense limitations had not been in place, each Fund’s performance would have been reduced. All figures assume reinvestment of dividends and distributions. It is not possible to invest in an index.
Average Annual Total Return
(For the periods ended December 31, 2009)
| | | | | | | | | |
Aston/Montag & Caldwell Growth Fund | | 1 Year | | | 5 Years | | | 10 Years | |
| | | |
Class N Shares (Inception 11/2/94): | | | | | | | | | |
Return Before Taxes | | 29.84 | % | | 3.80 | % | | (0.93 | )% |
Return After Taxes on Distributions | | 29.77 | % | | 3.19 | % | | (1.50 | )% |
Return After Taxes on Distributions and Sale of Fund Shares | | 19.48 | % | | 3.25 | % | | (0.86 | )% |
Class I Shares (Inception 6/28/96): | | | | | | | | | |
Return Before Taxes | | 30.15 | % | | 4.09 | % | | (0.66 | )% |
Class R Shares (Inception 12/31/02): | | | | | | | | | |
Return Before Taxes | | 29.47 | % | | 3.57 | % | | N/A | |
Russell 1000 Growth Index (Reflects no deduction for taxes, expenses or fees) | | 37.21 | % | | 1.63 | % | | (3.99 | )% |
52
Average Annual Total Return*
(For the periods ended December 31, 2009)
| | | | | | | | | |
Aston Growth Fund | | 1 Year | | | 5 Years | | | 10 Years | |
| | | |
Class N Shares (Inception 12/13/93): | | | | | | | | | |
Return Before Taxes | | 30.77 | % | | (0.81 | )% | | (1.26 | )% |
Return After Taxes on Distributions | | 30.51 | % | | (2.19 | )% | | (2.17 | )% |
Return After Taxes on Distributions and Sale of Fund Shares | | 20.35 | % | | (0.60 | )% | | (1.06 | )% |
Class I Shares (Inception 7/31/00): | | | | | | | | | |
Return Before Taxes | | 31.14 | % | | (0.53 | )% | | N/A | |
Class R Shares (Inception 12/31/02): | | | | | | | | | |
Return Before Taxes | | 30.54 | % | | (1.01 | )% | | N/A | |
Russell 1000 Growth Index (Reflects no deduction for taxes, expenses or fees) | | 37.21 | % | | 1.63 | % | | (3.99 | )% |
| * | Montag & Caldwell, Inc. became the subadviser as of January 1, 2008. Performance prior to that date reflects the performance of a previous subadviser. |
After-tax returns are calculated using the highest historical marginal individual federal income tax rates and do not reflect the impact of state and local taxes. In some instances, the “Return After Taxes on Distributions and Sale of Fund Shares” may be greater than “Return Before Taxes” because the investor is assumed to be able to use the capital loss on the sale of Fund shares to offset other taxable gains. After-tax returns depend on an investor’s tax situation and may differ from those shown. After-tax returns shown are not relevant to investors who hold their shares through tax-deferred arrangements, such as 401(k) plans or individual retirement accounts. After-tax returns are shown only for Class N shares. After-tax returns for Class I shares and Class R shares will vary.
53
Aston Balanced Fund—Aston/Montag & Caldwell Balanced Fund
Calendar Year Total Returns (%)
Aston/Montag & Caldwell Balanced Fund – Class N Shares
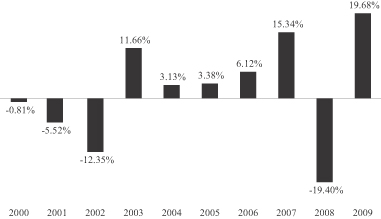
For the periods included in the bar chart:
| | |
| Best Quarter: 9.21% (06/09) | | Worst Quarter: (10.36)% (12/08) |
Aston Balanced Fund – Class N Shares
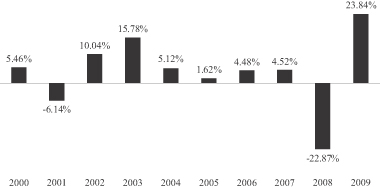
For the periods included in the bar chart:
| | |
| Best Quarter: 11.98% (06/09) | | Worst Quarter: (11.60)% (12/08) |
54
The following table indicates how each Fund’s average annual returns for different calendar periods compared to the returns of a broad-based securities market index and blended index. Performance reflects expense limitations that were in effect during one or more of the periods presented. If expense limitations had not been in place, each Fund’s performance would have been reduced. All figures assume reinvestment of dividends and distributions. It is not possible to invest in an index.
Average Annual Total Returns
(For the periods ended December 31, 2009)
| | | | | | | | | |
Aston/Montag & Caldwell Balanced Fund | | 1 Year | | | 5 Years | | | 10 Years | |
| | | |
Class N Shares (Inception 11/2/94): | | | | | | | | | |
Return Before Taxes | | 19.68 | % | | 4.07 | % | | 1.45 | % |
Return After Taxes on Distributions | | 19.30 | % | | 3.73 | % | | 0.90 | % |
Return After Taxes on Distributions and Sale of Fund Shares | | 12.99 | % | | 3.35 | % | | 0.96 | % |
S&P 500 Index (Reflects no deduction for taxes, expenses or fees) | | 26.47 | % | | 0.42 | % | | (0.95 | )% |
Barclays Capital U.S. Government Credit Bond Index (Reflects no deduction for taxes, expenses or fees) | | 4.52 | % | | 4.71 | % | | 6.34 | % |
60% S&P 500 Index/40% Barclays Capital U.S. Government Credit Bond Index (Reflects no deduction for taxes, expenses or fees) | | 17.74 | % | | 2.43 | % | | 2.27 | % |
55
Average Annual Total Returns*
(For the periods ended December 31, 2009)
| | | | | | | | | |
Aston Balanced Fund | | 1 Year | | | 5 Years | | | 10 Years | |
| | | |
Class N Shares (Inception 9/21/95): | | | | | | | | | |
Return Before Taxes | | 23.84 | % | | 1.17 | % | | 1.40 | % |
Return After Taxes on Distributions | | 23.46 | % | | (1.03 | )% | | (0.33 | )% |
Return After Taxes on Distributions and Sale of Fund Shares | | 15.68 | % | | 0.71 | % | | 0.78 | % |
S&P 500 Index (Reflects no deduction for taxes, expenses or fees) | | 26.47 | % | | 0.42 | % | | (0.95 | )% |
Barclays Capital U.S. Aggregate Bond Index (Reflects no deduction for taxes, expenses or fees) | | 5.93 | % | | 4.97 | % | | 6.33 | % |
60% S&P 500 Index/40% Barclays Capital U.S. Aggregate Bond Index (Reflects no deduction for taxes, expenses or fees) | | 18.39 | % | | 2.52 | % | | 2.24 | % |
| * | Taplin, Canida & Habacht, LLC has managed the fixed income portion of the portfolio since December 1, 2006. Montag & Caldwell, Inc. has managed the equity portion of the portfolio since January 1, 2008. The performance of the Fund prior to December 1, 2006 and January 1, 2008 may have been different if the current subadvisers had been employed. |
After-tax returns are calculated using the highest historical marginal individual federal income tax rates and do not reflect the impact of state and local taxes. In some instances, the “Return After Taxes on Distributions and Sale of Fund Shares” may be greater than “Return Before Taxes” because the investor is assumed to be able to use the capital loss on the sale of Fund shares to offset other taxable gains. After-tax returns depend on an investor’s tax situation and may differ from those shown. After-tax returns shown are not relevant to investors who hold their shares through tax-deferred arrangements, such as 401(k) plans or individual retirement accounts.
Distribution and Shareholder Services. PFPC Distributors, Inc. (the “Distributor”), 760 Moore Road, King of Prussia, PA 19406, and the Trust are parties to a distribution agreement dated September 27, 2001, as amended (the “Distribution Agreement”), under which the Distributor serves as statutory underwriter and facilitates the registration and distribution shares of the Funds on a continuous basis. To pay for the cost
56
of promoting the Funds and servicing your shareholder account, the Funds have adopted a Rule 12b-1 distribution plan for Class N and Class R shares. Under this plan, a Fund pays a fee at an annual rate of not more than 0.25% of each Fund’s Class N shares’ average daily net assets and 0.50% of Class R shares’ average daily net assets to the Distributor for certain expenses associated with the distribution of Fund shares and other services. The fee is accrued daily and payable monthly. Over time, these fees may increase the cost of your investment and may cost more than paying other types of sales charges.
From the 12b-1 fees, the Distributor may make payments to financial institutions and intermediaries such as banks, savings and loan associations, insurance companies, investment counselors, broker-dealers, and the Distributor’s affiliates and subsidiaries as compensation for services and reimbursement of expenses incurred in connection with distribution assistance, or provision of shareholder services. The Rule 12b-1 distribution plan for Class N shares is characterized as a reimbursement plan and is directly tied to expenses incurred by the Distributor; the payments the Distributor receives during any year may not exceed its actual expenses. The Rule 12b-1 distribution plan for Class R shares is characterized as a compensation plan and is not directly tied to expenses incurred by the Distributor; the payments the Distributor receives during any year may exceed its actual expenses.
C. OTHER COMPARISONS BETWEEN THE FUNDS
Trustees and Officers. The same Trustees oversee all of the Funds. The Trustees currently are Stuart D. Bilton (Chairman), Gregory T. Mutz, Leonard F. Amari, Robert B. Scherer and Denis Springer. The officers of all of the Funds are also the same.
Independent Registered Public Accounting Firm. Ernst & Young LLP, with offices at Willis Tower, 233 South Wacker Drive, Chicago, IL 60606 is the Trust’s independent registered public accounting firm for each Fund.
Charter Documents. Each Fund is a series of the Trust, which was formed as a Delaware statutory trust on September 10, 1993. Additional information about the Trust Instrument is provided below.
57
Voting Rights. Each issued and outstanding full and fractional share of a Fund is entitled to one full and fractional vote. Shares of a Fund participate equally in regard to dividends, distributions and liquidations with respect to that Fund subject to preferences (such as Rule 12b-1 distribution fees), rights or privileges of any share class. Shareholders have equal non-cumulative voting rights. Class N and Class R shares have exclusive voting rights with respect to the distribution plans for their class. On any matter submitted to a vote of shareholders, shares of each Fund will vote separately except when a vote of shareholders in the aggregate is required by law, or when the Trustees have determined that the matter affects the interests of more than one Fund, in which case the shareholders of all such Funds shall be entitled to vote thereon.
Shareholders have the power to vote only (i) for the election of Trustees, (ii) for the removal of Trustees, and (iii) with respect to such additional matters relating to the Trust as may be required by law, by the Trust Instrument, or as the Trustees may consider desirable.
Shareholder Meetings. The Board does not intend to hold annual meetings of shareholders of the Funds. The Trust Instrument provides that the Board will call a meeting for the purpose of voting upon the question of removal of any Trustee when requested to do so by shareholders owning not less than 10% of the outstanding shares of the Funds entitled to vote. In addition, subject to certain conditions, shareholders of the Funds may apply to the Trust to communicate with other shareholders to request a shareholders’ meeting to vote upon the removal of a Trustee or Trustees.
One-third of shares entitled to vote in person or by proxy shall be a quorum for the transaction of business at a shareholders’ meeting. Any lesser number is sufficient for adjournments. Any adjourned session or sessions may be held without the necessity of further notice. Except when a larger vote is required by law or by any provision of the Trust Instrument, a majority of the shares voted in person or by proxy shall decide any questions, and a plurality will elect a Trustee.
Shareholder Liability. Under Delaware law, the shareholders of the Funds will not be personally liable for the obligations of any Fund; a shareholder is entitled to the same limitation of personal liability extended to shareholders of corporations. To guard against the risk that the
58
Delaware law might not be applied in other states, the Trust Instrument requires that every written obligation of the Trust or a Fund contain a statement that such obligation may only be enforced against the assets of the Trust or Fund and provides for indemnification out of Trust or Fund property of any shareholder nevertheless held personally liable for Trust or Fund obligations.
The foregoing is a very general summary of certain provisions of the Trust Instrument governing the Trust. It is qualified in its entirety by reference to the Trust Instrument.
D. INFORMATION ABOUT THE PROPOSED REORGANIZATIONS
General. The shareholders of each Acquired Fund are being asked to approve a reorganization between their Acquired Fund and its corresponding Acquiring Fund pursuant to the Agreement and Plan of Reorganization entered into by the Trust, on behalf of the Acquired Funds and the Acquiring Funds (the “Agreement”), the form of which is attached to this Proxy Statement/Prospectus as Appendix G, and is summarized below.
Each Acquired Fund’s shareholders will vote separately on the reorganization of their Fund into the corresponding Acquiring Fund. The reorganization of one Acquired Fund into an Acquiring Fund is not contingent upon the approval of the other Acquired Fund’s shareholders. Each reorganization is separate and distinct from the other.
In the event that a reorganization does not receive the required shareholder approval, each applicable Acquired Fund and Acquiring Fund will continue to be managed as a separate Fund in accordance with its current investment objective and policies, and the Board may consider such alternatives as may be in the best interests of each Fund.
Background and Board’s Considerations Relating to the Proposed Reorganizations. Aston proposed to the Board a reorganization that would have the effect of merging each Acquired Fund with an Acquiring Fund that Aston believes has substantially similar investment objectives. The Board, including the Independent Trustees, approved the
59
terms of each reorganization and recommended that the reorganizations be approved by the shareholders of each Acquired Fund. In determining to recommend that the shareholders of each Acquired Fund approve its reorganization, the Board considered the factors described below:
| | • | | Each Acquired Fund’s and its corresponding Acquiring Fund’s investment goals, policies and restrictions are substantially similar, and that the reorganization would permit the shareholders of each Acquired Fund to pursue substantially similar objectives in a larger fund with similar performance; |
| | • | | Services available to Acquired Fund shareholders will be substantially the same on a class level basis; |
| | • | | The reorganizations will result in the elimination of investment products that have become substantially similar over time; |
| | • | | The estimated total annual operating expense ratios for each Acquiring Fund are expected to be lower than the current total annual operating expense ratios of its corresponding Acquired Fund, taking into account the effect of contractual expense limitations, and a larger combined fund offers the opportunity for economies of scale; |
| | • | | Highbury has committed to bear the reorganization costs and expenses related to proxy solicitation, legal and other costs associated with the solicitation including special meetings of the board of trustees, preparation of this Proxy Statement/Prospectus, printing and mailing costs, and Aston has committed to reimburse the Funds for other expenses in connection with the reorganizations, including legal and accounting expenses, to the extent that (i) such expenses cause total operating expenses of the Funds to exceed operating expense caps in effect for a Fund through February 28, 2011, or (ii) such expenses exceed one basis point (.01%) of average net assets if operating expense caps are not in effect for any Fund; and |
| | • | | For federal income tax purposes, each reorganization is generally not expected to result in a taxable event for an Acquired Fund or its shareholders. |
Based on all of the foregoing, the Board concluded that each Acquired Fund’s participation in its proposed reorganization would be in the best interests of such Acquired Fund and would not dilute the interests of such Acquired Fund’s existing shareholders.
60
Agreement and Plan of Reorganization. Each proposed reorganization will be governed by the Agreement, the form of which is attached as Appendix G. The Agreement provides that each Acquired Fund will transfer all of its assets to the corresponding Acquiring Fund solely in exchange for the issuance of full and fractional Acquiring Fund Shares and the assumption of all the Acquired Fund’s liabilities. The Acquiring Fund Shares will be issued on March 30, 2010 or such other date as may be agreed upon by the parties (the “Closing Date”). The following discussion of the Agreement is qualified in its entirety by the full text of the Agreement.
Each Acquired Fund will transfer all of its assets to its corresponding Acquiring Fund, and in exchange, such Acquiring Fund will assume all liabilities of the Acquired Fund and deliver to such Acquired Fund a number of full and fractional Acquiring Fund Shares of such Acquiring Fund having a net asset value equal to the value of the assets of the Acquired Fund less the liabilities of the Acquired Fund assumed by the Acquiring Fund. On or as soon after the Closing Date as is practicable, but in no event later than 12 months after the Closing Date (the “Liquidation Date”), each Acquired Fund will distribute in complete liquidation of the Acquired Fund, pro rata to its shareholders of record, all the Acquiring Fund Shares received by such Acquired Fund. This distribution will be accomplished by the transfer of Acquiring Fund Shares credited to the account of the Acquired Fund on the books of the Acquiring Fund to open accounts on the share records of the Acquiring Fund in the name of the Acquired Fund shareholders, and representing the respective pro rata number of Acquiring Fund Shares due each such shareholder. All issued and outstanding shares of the Acquired Fund will simultaneously be canceled on the books of the Acquired Fund. As a result of the proposed transaction, each Acquired Fund shareholder will receive a number of Acquiring Fund Shares equal in value as of the Valuation Date (as defined in the Agreement) to the value of the Acquired Fund shares surrendered by such shareholder.
The consummation of each reorganization is subject to the terms and conditions and on the representations and warranties being true as set forth in the Agreement. With respect to each reorganization, the Agreement may be terminated by mutual agreement of the Acquiring Fund and the corresponding Acquired Fund. The Agreement may be terminated with respect to one or both of the reorganizations. In addition, either an
61
Acquired Fund or an Acquiring Fund may at its option terminate the Agreement with respect to its corresponding reorganization at or before the Closing Date due to (i) a breach by any other party to such reorganization of any representation, warranty, or agreement to be performed at or before the Closing Date, if not cured within 30 days; (ii) a condition precedent to the obligations of the terminating party that has not been met and it reasonably appears that it can or will not or cannot be met; or (iii) a determination by the Board that the consummation of the transactions contemplated therein with respect to a reorganization is not in the best interests of a Fund.
Each Acquired Fund will, within a reasonable period of time before the Closing Date, furnish the corresponding Acquiring Fund with a list of the Acquired Fund’s portfolio securities and other investments. Each Acquiring Fund will, within a reasonable period of time before the Closing Date, furnish the corresponding Acquired Fund with a list of the securities, if any, on the Acquired Fund’s list referred to above that do not conform to the Acquiring Fund’s investment objective, policies and restrictions. The Acquired Fund, if requested by its corresponding Acquiring Fund, will dispose of securities on the Acquiring Fund’s list before the Closing Date. In addition, if it is determined that the portfolios of the Acquired Fund and its corresponding Acquiring Fund, when aggregated, would contain investments exceeding certain percentage limitations imposed upon the Acquiring Fund with respect to such investments, the Acquired Fund, if requested by the Acquiring Fund, will dispose of a sufficient amount of such investments as may be necessary to avoid violating such limitations as of the Closing Date.
Certain Federal Income Tax Consequences. As a condition to each Fund’s obligation to consummate the reorganizations, each Fund will receive a tax opinion from Vedder Price P.C. with respect to its reorganization (which opinion will be based on certain factual representations of the Funds and certain customary assumptions), substantially to the effect that, on the basis of the existing provisions of the Internal Revenue Code of 1986, as amended (the “Code”), current administrative rules and court decisions, for federal income tax purposes:
(a) The transfer of all the assets of the Acquired Fund to its corresponding Acquiring Fund in exchange solely for Acquiring Fund Shares and the assumption by the Acquiring Fund of all the liabilities of
62
the Acquired Fund followed by the pro rata distribution by the Acquired Fund of all the Acquiring Fund Shares to the Acquired Fund shareholders in complete liquidation of the Acquired Fund will constitute a “reorganization” within the meaning of Section 368(a) of the Code, and the Acquiring Fund and the Acquired Fund will each be a “party to a reorganization,” within the meaning of Section 368(b) of the Code, with respect to the reorganization.
(b) No gain or loss will be recognized by the Acquiring Fund upon the receipt of all the assets of its corresponding Acquired Fund solely in exchange for Acquiring Fund Shares and the assumption by the Acquiring Fund of all the liabilities of the Acquired Fund.
(c) No gain or loss will be recognized by the Acquired Fund upon the transfer of all the Acquired Fund’s assets to its corresponding Acquiring Fund solely in exchange for Acquiring Fund Shares and the assumption by the Acquiring Fund of all the liabilities of the Acquired Fund or upon the distribution (whether actual or constructive) of such Acquiring Fund Shares to the Acquired Fund shareholders solely in exchange for such shareholders’ shares of the Acquired Fund in complete liquidation of the Acquired Fund.
(d) No gain or loss will be recognized by the Acquired Fund shareholders upon the exchange of their Acquired Fund shares solely for Acquiring Fund Shares in the reorganization.
(e) The aggregate basis of the Acquiring Fund Shares received by each Acquired Fund shareholder pursuant to the reorganization will be the same as the aggregate basis of the Acquired Fund shares exchanged therefor by such shareholder. The holding period of the Acquiring Fund Shares received by each Acquired Fund shareholder will include the period during which the Acquired Fund shares exchanged therefor were held by such shareholder, provided such Acquired Fund shares are held as capital assets at the time of the reorganization.
(f) The basis of the Acquired Fund’s assets acquired by its corresponding Acquiring Fund will be the same as the basis of such assets to the Acquired Fund immediately before the reorganization. The holding period of the assets of the Acquired Fund in the hands of the Acquiring Fund will include the period during which those assets were held by the Acquired Fund.
63
This description of the federal income tax consequences of the reorganizations is made without regard to the particular facts and circumstances of any shareholder. Shareholders are urged to consult their own tax advisers as to the specific consequences to them of a reorganization, including the applicability and effect of state, local and foreign tax laws.
If a proposed reorganization is approved by an Acquired Fund’s shareholders, the Acquired Fund will distribute to its shareholders all of its undistributed net investment income and undistributed realized net capital gains (after reduction by any available capital loss carryforwards), if any, immediately prior to the Closing (as defined in the Agreement). Additional distributions may be made if necessary.
Capitalization. The following table shows the capitalization of each Fund as of October 31, 2009 and of each Acquiring Fund on a pro forma unaudited combined basis, giving effect to each proposed acquisition of assets at net asset value as of that date:
64
ASTON GROWTH FUND—ASTON/MONTAG & CALDWELL GROWTH FUND
| | | | | | | | | | | | |
| | | Aston Growth
Fund | | Aston/Montag &
Caldwell Growth
Fund | | Pro Forma
Adjustments(1) | | | Aston/Montag &
Caldwell Growth
Fund—Pro
Forma
Combined
(assuming
consummation of
the
reorganization)(2) |
| | | | |
Net Assets | | | | | | | | | | | | |
Class N Shares | | $ | 56,304,527 | | $ | 1,277,345,869 | | | | | $ | 1,333,650,396 |
Class I Shares | | | 144,805,253 | | | 1,205,637,140 | | | | | | 1,350,442,393 |
Class R Shares | | | 587,634 | | | 3,840,306 | | | | | | 4,427,940 |
| | | | | | | | | | | | |
Total Net Assets | | | 201,697,414 | | | 2,486,823,315 | | | | | | 2,688,520,729 |
Shares Outstanding | | | | | | | | | | | | |
Class N Shares | | | 4,447,220 | | | 61,198,083 | | (1,749,651 | )(3) | | | 63,895,652 |
Class I Shares | | | 11,228,146 | | | 57,491,570 | | (4,323,017 | )(3) | | | 64,396,699 |
Class R Shares | | | 47,183 | | | 185,293 | | (18,830 | )(3) | | | 213,646 |
Net Asset Value Per Share | | | | | | | | | | | | |
Class N Shares | | $ | 12.66 | | $ | 20.87 | | | | | $ | 20.87 |
Class I Shares | | | 12.90 | | | 20.97 | | | | | | 20.97 |
Class R Shares | | | 12.45 | | | 20.73 | | | | | | 20.73 |
| (1) | Pro forma adjustments do not include reorganization expenses borne by the Funds, which are expected to be immaterial. |
| (2) | Assumes the reorganization had been consummated on October 31, 2009, and is for information purposes only. No assurance can be given as to how many shares of the Aston/Montag & Caldwell Growth Fund will be received by the shareholders of the Aston Growth Fund on the date the reorganization takes place, and the foregoing should not be relied upon to reflect the number of shares of the Aston/Montag & Caldwell Growth Fund that actually will be received on or after such date. |
| (3) | Class N, Class I and Class R shares of the Aston Growth Fund are being exchanged for Class N, Class I and Class R shares of the Aston/Montag & Caldwell Growth Fund, respectively. |
65
ASTON BALANCED FUND—ASTON/MONTAG & CALDWELL BALANCED FUND
| | | | | | | | | | | | |
| | | Aston Balanced
Fund | | Aston/Montag &
Caldwell
Balanced Fund | | Pro Forma
Adjustments(1) | | | Aston/Montag &
Caldwell
Balanced
Fund—Pro
Forma
Combined
(assuming
consummation of
the
reorganization)(2) |
| | | | |
Net Assets | | | | | | | | | | | | |
Class N Shares | | $ | 16,804,970 | | $ | 14,937,504 | | | | | $ | 31,742,474 |
Class I Shares | | | — | | | 1,148,910 | | | | | | 1,148,910 |
| | | | | | | | | | | | |
Total Net Assets | | | 16,804,970 | | | 16,086,414 | | | | | | 32,891,384 |
Shares Outstanding | | | | | | | | | | | | |
Class N Shares | | | 3,032,269 | | | 842,474 | | (2,084,470 | )(3) | | | 1,790,273 |
Class I Shares | | | — | | | 64,972 | | — | | | | 64,972 |
Net Asset Value Per Share | | | | | | | | | | | | |
Class N Shares | | $ | 5.54 | | $ | 17.73 | | | | | $ | 17.73 |
Class I Shares | | | — | | | 17.68 | | | | | | 17.68 |
| (1) | Pro forma adjustments do not include reorganization expenses borne by the Funds, which are expected to be immaterial. |
| (2) | Assumes the reorganization had been consummated on October 31, 2009, and is for information purposes only. No assurance can be given as to how many shares of the Aston/Montag & Caldwell Balanced Fund will be received by the shareholders of the Aston Balanced Fund on the date the reorganization takes place, and the foregoing should not be relied upon to reflect the number of shares of the Aston/Montag & Caldwell Balanced that actually will be received on or after such date. |
| (3) | Class N shares of the Aston Balanced Fund are being exchanged for Class N shares of the Aston/Montag & Caldwell Balanced Fund. |
66
Required Vote.
Approval of each reorganization requires the affirmative vote of a majority of the shares voted in person or by proxy of the applicable Acquired Fund entitled to vote on this proposal.
The Board believes that the proposed reorganizations are in the best interests of each Acquired Fund. Accordingly, the Board unanimously recommends that shareholders vote FOR approval of the proposed reorganizations.
GENERAL INFORMATION
Submission of Shareholder Proposals
Under Delaware law, the Trust is not required to hold annual shareholders’ meetings, but it will hold special meetings as required or deemed desirable, or upon the request of holders of at least 10% of the Trust’s shares entitled to vote. Because the Trust does not hold regular meetings of shareholders, the anticipated date of the next special shareholder meeting cannot be provided. Any shareholder who wishes to submit a proposal for consideration at a subsequent shareholders’ meeting should mail the proposal promptly to the Trust. Any proposal to be considered for submission to shareholders must comply with Rule 14a-8 under the Securities Exchange Act of 1934, as amended, and must be received by the Trust within a reasonable time before the solicitation of proxies for that meeting. The timely submission of a proposal does not guarantee its inclusion.
Other Matters to Come Before the Special Meeting
The Board is not aware of any matters that will be presented for action at the Special Meeting other than the matters set forth herein. Should any other matters requiring a vote of shareholders arise, it is intended that the proxies that do not contain specific instructions to the contrary will be voted in accordance with the judgment of the persons named in the enclosed form of proxy.
67
Distributor and Administrator
Set forth below are the names and addresses of the Trust’s administrator and distributor.
| | |
ADMINISTRATOR | | DISTRIBUTOR |
| |
Aston Asset Management LLC 120 North LaSalle Street Chicago, IL 60602 | | PFPC Distributors, Inc. 760 Moore Road King of Prussia, PA 19406 |
During the fiscal years ended October 31, 2009 and 2008, the Trust paid Aston, on behalf of the Funds, $2,726,357 and $2,752,230, respectively, for providing administrative services to the Funds, of which $1,264,183 and $1,286,612, respectively, was paid to PNC Global Investment Servicing (U.S.) Inc., as subadministrator.
Expenses of Proxy Solicitation
It is expected that the solicitation of proxies will be primarily by mail. Officers and service contractors of the Trust may also solicit proxies by telephone, telegraph, facsimile or Internet or in person. The cost of preparing, printing and mailing the enclosed proxy card and Proxy Statement/Prospectus and all other costs incurred in connection with the solicitation of proxies for the proposals will be paid by Highbury and not by the Funds. The Trust has engaged to assist in the solicitation of proxies at an estimated cost of approximately $350,000, plus reasonable expenses.
Brokerage Commissions to Affiliates
During the fiscal year ended October 31, 2009, no brokerage commissions were paid to affiliated brokers.
PLEASE COMPLETE, SIGN AND RETURN THE ENCLOSED PROXY CARD PROMPTLY. NO POSTAGE IS REQUIRED IF MAILED IN THE UNITED STATES.
|
| By Order of the Board, |
|
| Gerald F. Dillenburg |
| Senior Vice President, Secretary and Treasurer |
68
INDEX OF APPENDICES
| | |
| APPENDIX A: | | BENEFICIAL OWNERS OF 5% OR MORE OF FUND SHARES |
| |
| APPENDIX B: | | FUND SHARES OWNED BY TRUSTEES, NOMINEES AND OFFICERS |
| |
| APPENDIX C: | | DATES RELATED TO CURRENT ADVISORY AGREEMENTS |
| |
| APPENDIX D: | | FORM OF INVESTMENT ADVISORY AGREEMENT |
| |
| APPENDIX E: | | ADVISORY FEE RATES AND AGGREGATE ADVISORY FEES PAID DURING LAST FISCAL YEAR |
| |
| APPENDIX F: | | SUMMARY OF SUB-INVESTMENT ADVISORY AGREEMENTS |
| |
| APPENDIX G: | | FORM OF AGREEMENT AND PLAN OF REORGANIZATION |
APPENDIX A
Beneficial Owners of 5% or More of Fund Shares
| | | | | | | | |
Fund | | Title of
Class | | Name and Address of Beneficial Owner | | Number of
Shares Owned | | Percent of
Class |
| Aston/TCH Fixed Income Fund | | Class N | | DCGT as TTEE and/or CUST FBO Various Qualified Plans 711 High Street Des Moines, IA 50303 | | 1,532,686.72 | | 34.47% |
| | | | |
| | | | Charles Schwab & Co Inc Special Custody Acct for Exclusive of Customers 101 Montgomery St San Francisco, CA 94104-4122 | | 276,796.05 | | 6.23% |
| | | | |
| | | | National Financial Services Corp (FBO) Our Customers 200 Liberty Street One World Financial Center New York NY 10281 | | 270,599.70 | | 6.09% |
| | | | |
| Aston/Montag & Caldwell Balanced Fund | | Class N | | Charles Schwab & Co Inc Special Custody Acct for Exclusive of Customers 101 Montgomery St San Francisco, CA 94104-4122 | | 109,294.84 | | 14.18% |
A-1
| | | | | | | | |
Fund | | Title of
Class | | Name and Address of Beneficial Owner | | Number of
Shares Owned | | Percent of
Class |
| | | | B Franklin Skinner 675 Tuxedo Pl NW Atlanta GA 30342-3616 | | 52,393.65 | | 6.80% |
| | | | |
| | | | Merrill Lynch Pierce Fenner & Smith Inc for the Sole Benefit of it’s Customers 4800 Deer Lake Dr East 3rd Fl Jacksonville, FL 32246 | | 46,497.30 | | 6.03% |
| | | | |
| | | | National Financial Services Corp (FBO) Our Customers 200 Liberty Street One World Financial Center New York NY 10281 | | 45,136.77 | | 5.86% |
| | | | |
| | | | Central Baptist Church Robert L Lee TTEE PO Box 1221 Newnan, GA 30264-1221 | | 43,047.12 | | 5.59% |
| | | | |
| Aston Balanced Fund | | Class N | | DCGT as TTEE and/or Cust FBO Various Qualified Plans 711 High Street Des Moines, IA 50303 | | 1,290,591.54 | | 43.23% |
A-2
| | | | | | | | |
Fund | | Title of
Class | | Name and Address of Beneficial Owner | | Number of
Shares Owned | | Percent of
Class |
| Aston/Optimum Mid Cap Fund | | Class N | | Charles Schwab & Co Inc Special Custody Acct for Exclusive of Customers 101 Montgomery St San Francisco, CA 94104-4122 | | 6,936,121.77 | | 17.66% |
| | | | |
| | | | National Financial Services Corp (FBO) Our Customers 200 Liberty Street One World Financial Center New York NY 10281 | | 6,645,816.57 | | 16.92% |
| | | | |
| | | | New York Life Trust Co 169 Lackawanna Ave Parsippany NJ 07054-1007 | | 4,168,997.40 | | 10.62% |
| | | | |
| | | | Wells Fargo Bank NA FBO RPS ABN AMRO Mid Cap P.O. BOX 1533 Minneapolis, MN 55480 | | 2,025,059.25 | | 5.16% |
| | | | |
| Aston Growth Fund | | Class N | | Charles Schwab & Co Inc Special Custody Acct for Exclusive of Customers 101 Montgomery St San Francisco, CA 94104-4122 | | 1,024,865.11 | | 23.21% |
A-3
| | | | | | | | |
Fund | | Title of
Class | | Name and Address of Beneficial Owner | | Number of
Shares Owned | | Percent of
Class |
| | | | National Financial Services Corp (FBO) Our Customers 200 Liberty Street One World Financial Center New York, NY 10281 | | 524,924.26 | | 11.89% |
| | | | |
| | | | MCB Trust Services TTEE FBO Western States Envelope Co 700 17th St Ste 300 Denver, CO 80202 | | 336,149.38 | | 7.61% |
| | | | |
| | | | DCGT as TTEE and/or CUST FBO Various Qualified Plans 711 High Street Des Moines, IA 50303 | | 301,080.91 | | 6.82% |
| | | | |
| Aston/Montag & Caldwell Growth Fund | | Class N | | National Financial Services Corp (FBO) Our Customers 200 Liberty Street One World Financial Center New York NY 10281 | | 31,601,435.31 | | 48.49% |
| | | | |
| | | | Charles Schwab & Co Inc Special Custody Acct for Exclusive of Customers 101 Montgomery St San Francisco, CA 94104-4122 | | 8,422,420.68 | | 12.92% |
A-4
| | | | | | | | |
Fund | | Title of
Class | | Name and Address of Beneficial Owner | | Number of
Shares Owned | | Percent of
Class |
| | | | Citigroup Global Markets Inc 333 West 34th St - 3rd Floor New York, NY 10001 | | 5,555,561.45 | | 8.52% |
| | | | |
| Aston/Veredus Aggressive Growth Fund | | Class N | | Charles Schwab & Co Inc Special Custody Acct for Exclusive of Customers 101 Montgomery St San Francisco, CA 94104-4122 | | 867,047.54 | | 24.36% |
| | | | |
| | | | Citigroup Global Markets Inc 333 West 34th St - 3rd Floor New York, NY 10001 | | 454,511.13 | | 12.77% |
| | | | |
| | | | National Financial Services Corp (FBO) Our Customers 200 Liberty Street One World Financial Center New York NY 10281 | | 397,044.78 | | 11.15% |
| | | | |
| Aston/TAMRO Small Cap Fund | | Class N | | National Financial Services Corp (FBO) Our Customers 200 Liberty Street One World Financial Center New York NY 10281 | | 5,393,320.28 | | 30.92% |
A-5
| | | | | | | | |
Fund | | Title of
Class | | Name and Address of Beneficial Owner | | Number of
Shares Owned | | Percent of
Class |
| | | | Charles Schwab & Co Inc Special Custody Acct for Exclusive of Customers 101 Montgomery St San Francisco, CA 94104-4122 | | 3,145,070.91 | | 18.03% |
| | | | |
| | | | Community Bank NA Cust FBO Hanys Downstate Retirement Plans 6 Rhoads Dr Ste 7 Utica NY 13502-6315 | | 1,109,760.74 | | 6.36% |
| | | | |
| | | | Vanguard Fiduciary Trust Co ABN AMRO Funds PO BOX 2600 Valley Forge, PA 19482 | | 1,089,616.47 | | 6.25% |
| | | | |
| | | | Wells Fargo Bank NA FBO Retirement Plan Services PO Box 1533 Minneapolis, MN 55480 | | 925,064.95 | | 5.30% |
| | | | |
| Aston/TAMRO Diversified Equity Fund | | Class N | | Charles Schwab & Co Inc Special Custody Acct for Exclusive of Customers 101 Montgomery St San Francisco, CA 94104-4122 | | 206,906.47 | | 19.34% |
A-6
| | | | | | | | |
Fund | | Title of
Class | | Name and Address of Beneficial Owner | | Number of
Shares Owned | | Percent of
Class |
| | | | DCGT as TTEE and/or CUST FBO Various Qualified Plans 711 High Street Des Moines, IA 50303 | | 160,405.70 | | 14.99% |
| | | | |
| | | | National Financial Services Corp (FBO) Our Customers 200 Liberty Street One World Financial Center New York NY 10281 | | 121,569.66 | | 11.36% |
| | | | |
| Aston Value Fund | | Class N | | DCGT as TTEE and/or CUST FBO Various Qualified Plans 711 High Street Des Moines, IA 50303 | | 774,260.26 | | 32.28% |
| | | | |
| | | | DCGT as TTEE and/or CUST FBO Principal Financial Group Omnibus Qualified 711 High Street Des Moines, IA 50303 | | 628,964.34 | | 26.22% |
| | | | |
| | | | National Financial Services for the Exclusive Benefit of Our Customers 200 Liberty St 1 World Financial CE New York, NY 10281 | | 318,368.38 | | 13.27% |
A-7
| | | | | | | | |
Fund | | Title of
Class | | Name and Address of Beneficial Owner | | Number of
Shares Owned | | Percent of
Class |
| Aston/Fortis Real Estate Fund | | Class N | | Charles Schwab & Co Inc Special Custody Acct for Exclusive of Customers 101 Montgomery St San Francisco, CA 94104-4122 | | 116,071.15 | | 17.13% |
| | | | |
| | | | National Financial Services Corp (FBO) Our Customers 200 Liberty Street One World Financial Center New York NY 10281 | | 90,437.43 | | 13.34% |
| | | | |
| | | | Ameritrade Inc for the Exclusive Benefit of our Clients PO Box 2226 Omaha NE 68103-2226 | | 67,291.50 | | 9.93% |
| | | | |
| | | | DCGT as TTEE and/or CUST FBO Various Qualified Plans 711 High Street Des Moines, IA 50303 | | 43,858.45 | | 6.47% |
| | | | |
| Aston/Veredus Select Growth Fund | | Class N | | Charles Schwab & Co Inc Special Custody Acct for Exclusive of Customers 101 Montgomery St San Francisco, CA 94104-4122 | | 2,228,509.38 | | 55.69% |
A-8
| | | | | | | | |
Fund | | Title of
Class | | Name and Address of Beneficial Owner | | Number of
Shares Owned | | Percent of
Class |
| | | | National Financial Services Corp (FBO) Our Customers 200 Liberty Street One World Financial Center New York NY 10281 | | 306,137.68 | | 7.65% |
| | | | |
| Aston Dynamic Allocation Fund | | Class N | | National Financial Services Corp (FBO) Our Customers 200 Liberty Street One World Financial Center New York NY 10281 | | 3,169,804.67 | | 56.54% |
| | | | |
| | | | Charles Schwab & Co Inc Special Custody Acct for Exclusive of Customers 101 Montgomery St San Francisco, CA 94104-4122 | | 1,897,948.13 | | 33.85% |
| | | | |
| Aston/M.D. Sass Enhanced Equity Fund | | Class N | | Charles Schwab & Co Inc Special Custody Acct for Exclusive of Customers 101 Montgomery St San Francisco, CA 94104-4122 | | 1,494,672.59 | | 43.60% |
| | | | |
| | | | National Financial Services Corp (FBO) Our Customers 200 Liberty Street One World Financial Center New York NY 10281 | | 1,170,865.16 | | 34.16% |
A-9
| | | | | | | | |
Fund | | Title of
Class | | Name and Address of Beneficial Owner | | Number of
Shares Owned | | Percent of
Class |
| | | | Independance Trust Company 325 Bridge Street Franklin TN 37064-2609 | | 383,013.83 | | 11.17% |
| | | | |
| Aston/New Century Absolute Return ETF Fund | | Class N | | Charles Schwab & Co Inc Special Custody Acct for Exclusive of Customers 101 Montgomery St San Francisco, CA 94104-4122 | | 1,550,420.65 | | 78.75% |
| | | | |
| Aston/River Road Small Cap Value Fund | | Class N | | National Financial Services Corp (FBO) Our Customers 200 Liberty Street One World Financial Center New York NY 10281 | | 14,006,033.74 | | 66.36% |
| | | | |
| | | | Charles Schwab & Co Inc Special Custody Acct for Exclusive of Customers 101 Montgomery St San Francisco, CA 94104-4122 | | 2,608,564.83 | | 12.36% |
| | | | |
| | | | PFPC Inc as Agent for PFPC Trust FBO Morningstar Wrap Program Customers 760 Moore Road King of Prussia, PA 19406 | | 1,914,796.49 | | 9.07% |
A-10
| | | | | | | | |
Fund | | Title of
Class | | Name and Address of Beneficial Owner | | Number of
Shares Owned | | Percent of
Class |
| Aston/River Road Dividend All Cap Value Class | | Class N | | National Financial Services Corp (FBO) Our Customers 200 Liberty Street One World Financial Center New York NY 10281 | | 3,705,172.08 | | 38.04% |
| | | | |
| | | | PFPC Inc as Agent for PFPC Trust FBO Morningstar Wrap Program Customers 760 Moore Road King of Prussia, PA 19406 | | 3,240,082.26 | | 33.26% |
| | | | |
| | | | Charles Schwab & Co Inc Special Custody Acct for Exclusive of Customers 101 Montgomery St San Francisco, CA 94104-4122 | | 1,277,242.19 | | 13.11% |
| | | | |
| Aston/River Road Small-Mid Cap Fund | | Class N | | PFPC Inc as Agent for PFPC Trust FBO Morningstar Wrap Program Customers 760 Moore Road King of Prussia, PA 19406 | | 3,963,252.02 | | 71.92% |
| | | | |
| | | | Charles Schwab & Co Inc Special Custody Acct for Exclusive of Customers 101 Montgomery St San Francisco, CA 94104-4122 | | 791,045.27 | | 14.36% |
A-11
| | | | | | | | |
Fund | | Title of
Class | | Name and Address of Beneficial Owner | | Number of
Shares Owned | | Percent of
Class |
| Aston/Fasciano Small Cap Fund | | Class N | | Highbury Financial Inc 999 18th St Ste 3000 Denver CO 80202-2449 | | 100,000.00 | | 49.50% |
| | | | |
| | | | Michael F Fasciano TTEE Michael F Fasciano 2003 Living Trust 1300 W Kennicott Dr Lake Forest IL 60045-1552 | | 100,000.00 | | 49.50% |
| | | | |
| Aston/Optimum Large Cap Opportunity FD | | Class N | | Charles Schwab & Co Inc Special Custody Acct for Exclusive of Customers 101 Montgomery St San Francisco, CA 94104-4122 | | 387,230.05 | | 71.19% |
| | | | |
| | | | Ameritrade Inc for the Exclusive Benefit of our Clients PO Box 2226 Omaha NE 68103-2226 | | 97,079.77 | | 17.85% |
| | | | |
| Aston/Montag & Caldwell Mid Cap Growth Fund | | Class N | | Charles Schwab & Co Inc Special Custody Acct for Exclusive of Customers 101 Montgomery St San Francisco, CA 94104-4122 | | 76,033.33 | | 18.12% |
| | | | |
| | | | William Vogel 2410 Spalding Dr Atlanta GA 30350-3617 | | 67,177.68 | | 16.01% |
A-12
| | | | | | | | |
Fund | | Title of
Class | | Name and Address of Beneficial Owner | | Number of
Shares Owned | | Percent of
Class |
| | | | Merrill Lynch Pierce Fenner & Smith Inc for the Sole Benefit of it’s Customers 4800 Deer Lake Dr East 3rd Fl Jacksonville, FL 32246 | | 64,537.80 | | 15.38% |
| | | | |
| | | | TD Ameritrade Trust Company PO Box 17748 Denver, CO 80217-0748 | | 40,236.05 | | 9.59% |
| | | | |
| | | | National Financial Services Corp (FBO) Our Customers 200 Liberty Street One World Financial Center New York NY 10281 | | 24,809.12 | | 5.91% |
| | | | |
Aston/Cardinal Mid Cap Value Fund | | Class N | | Amy Minella 215 Clapboard Ridge Rd Greenwich CT 06831-3305 | | 100,000.00 | | 77.99% |
| | | | |
| | | | Charles Schwab & Co Inc Special Custody Acct for Exclusive of Customers 101 Montgomery St San Francisco, CA 94104-4122 | | 22,368.63 | | 17.45% |
| | | | |
| Aston/Neptune International Fund | | Class N | | Stuart D Bilton & Bette E Bilton JT Ten 72 Brinker Rd Barrington, IL 60010-5135 | | 32,071.19 | | 68.05% |
A-13
| | | | | | | | |
Fund | | Title of
Class | | Name and Address of Beneficial Owner | | Number of
Shares Owned | | Percent of
Class |
| | | | NASR Enterprise LLC 2562 Silver State Pkwy Ste F2 Minden NV 89423-8937 | | 8,556.63 | | 18.16% |
| | | | |
| | | | Charles Schwab & Co Inc Special Custody Acct for Exclusive of Customers 101 Montgomery St San Francisco, CA 94104-4122 | | 2,605.30 | | 5.53% |
| | | | |
| Aston/TCH Fixed Income Fund | | Class I | | DCGT as TTEE and/or CUST FBO Various Qualified Plans 711 High Street Des Moines, IA 50303 | | 1,020,570.59 | | 52.19% |
| | | | |
| | | | National Financial Services Corp (FBO) Our Customers 200 Liberty Street One World Financial Center New York NY 10281 | | 713,317.22 | | 36.45% |
| | | | |
| | | | Wells Fargo Bank NA FBO Amerimax Retirement Plan P.O. Box 1533 MINNEAPOLIS, MN 55480 | | 168,266.27 | | 8.60% |
A-14
| | | | | | | | |
Fund | | Title of
Class | | Name and Address of Beneficial Owner | | Number of
Shares Owned | | Percent of
Class |
| Aston/Montag & Caldwell Balanced Fund | | Class I | | National Financial Services Corp (FBO) Our Customers 200 Liberty Street One World Financial Center New York NY 10281 | | 43,735.52 | | 66.78% |
| | | | |
| | | | PFPC Trust Co CUST FBO James B Thomas Rollover IRA 2401 Pennsylvania Ave Unit 205 Wilmington DE 19806-1403 | | 9,342.64 | | 14.26% |
| | | | |
| | | | TD Ameritrade Trust Company CO # 00T71 Montag & Caldwell PO Box 17748 Denver CO 80217-0748 | | 4,861.71 | | 7.42% |
| | | | |
| | | | Citigroup Global Markets Inc 333 West 34th St - 3rd Floor New York, NY 10001 | | 3,828.28 | | 5.84% |
| | | | |
| Aston/Optimum Mid Cap Fund | | Class I | | James M Carn TTEE Standard Insurance Co. 1100 SW Sixth Avenue Portland, OR 97204-1093 | | 2,147,334.76 | | 28.88% |
A-15
| | | | | | | | |
Fund | | Title of
Class | | Name and Address of Beneficial Owner | | Number of
Shares Owned | | Percent of
Class |
| | | | Charles Schwab & Co Inc Special Custody Acct for Exclusive of Customers 101 Montgomery St San Francisco, CA 94104-4122 | | 923,098.56 | | 12.41% |
| | | | |
| | | | National Financial Services Corp (FBO) Our Customers 200 Liberty Street One World Financial Center New York NY 10281 | | 677,270.68 | | 9.10% |
| | | | |
| | | | Wells Fargo Bank NA FBO Retirement Plan Svcs PO Box 1533 Minneapolis, MN 55480 | | 404,043.63 | | 5.43% |
| | | | |
| Aston Growth Fund | | Class I | | Bank of America NA TTEE FBO Lasalle Pension Plan & Trust PO Box 831575 Dallas TX 75283-1575 | | 741,878.54 | | 51.78% |
| | | | |
| | | | State St Bank & Tr CO FBO ABN AMRO North America Retirement Trust 805 Pennsylvania Ave Kansas City MO 64105-1340 | | 568,741.02 | | 39.69% |
A-16
| | | | | | | | |
Fund | | Title of
Class | | Name and Address of Beneficial Owner | | Number of
Shares Owned | | Percent of
Class |
| Aston/Montag & Caldwell Growth Fund | | Class I | | National Financial Services Corp (FBO) Our Customers 200 Liberty Street One World Financial Center New York NY 10281 | | 13,263,259.56 | | 23.65% |
| | | | |
| | | | Charles Schwab & Co Inc Special Custody Acct for Exclusive of Customers 101 Montgomery St San Francisco, CA 94104-4122 | | 9,942,997.96 | | 17.73% |
| | | | |
| | | | SEI Private Trust Co c/o First Tennessee ID 683 One Freedom Valley Dr. Oaks, PA 19456 | | 3,539,153.68 | | 6.31% |
| | | | |
| | | | Citigroup Global Markets Inc 333 West 34th St - 3rd Floor New York, NY 10001 | | 3,205,191.99 | | 5.71% |
| | | | |
| Aston/Veredus Aggressive Growth Fund | | Class I | | Bank of America NA TTEE FBO Lasalle Pension Plan & Trust PO Box 831575 Dallas TX 75283-1575 | | 1,085,466.97 | | 75.14% |
A-17
| | | | | | | | |
Fund | | Title of
Class | | Name and Address of Beneficial Owner | | Number of
Shares Owned | | Percent of
Class |
| | | | DCGT as TTEE and/or CUST FBO Various Qualified Plans 711 High Street Des Moines, IA 50303 | | 178,642.45 | | 12.37% |
| | | | |
| | | | State St Bank & Tr CO FBO ABN AMRO North America Retirement Trust 805 Pennsylvania Ave Kansas City MO 64105-1340 | | 80,365.89 | | 5.56% |
| | | | |
| Aston/TAMRO Small Cap | | Class I | | The Northern Trust Co as Trustee FBO Advocate-DV PO Box 92994 Chicago, IL 60675-2994 | | 4,434,709.09 | | 12.86% |
| | | | |
| | | | Sheldon & Co c/o National City PO Box 94984 Cleveland OH 44101-4984 | | 3,015,436.13 | | 8.74% |
| | | | |
| | | | Wachovia Bank FBO Various Retirement Plans 1525 West WT Harris BLVD Charlotte, NC 28288-1076 | | 1,980,241.42 | | 5.74% |
A-18
| | | | | | | | |
Fund | | Title of
Class | | Name and Address of Beneficial Owner | | Number of
Shares Owned | | Percent of
Class |
| | | | Merrill Lynch Pierce Fenner & Smith Inc for the Sole Benefit of it’s Customers 4800 Deer Lake Dr East 3rd Fl Jacksonville, FL 32246 | | 1,925,888.61 | | 5.58% |
| | | | |
| Aston Value Fund | | Class I | | Bank of America NA TTEE FBO Lasalle Pension Plan & Trust PO Box 831575 Dallas TX 75283-1575 | | 21,926,596.23 | | 88.10% |
| | | | |
| | | | State St Bank & TR CO FBO ABN AMRO North America Retirement Trust 805 Pennsylvania Ave Kansas City MO 64105-1340 | | 1,623,403.15 | | 6.52% |
| | | | |
| | | | Bank of America NA TTEE FBO Lasalle Pension Plan & Trust PO Box 831575 Dallas TX 75283-1575 | | 1,324,985.41 | | 5.32% |
| | | | |
| Aston/Fortis Real Estate Fund | | Class I | | Bank of America NA TTEE FBO Lasalle Pension Plan & Trust PO Box 831575 Dallas TX 75283-1575 | | 3,616,881.66 | | 92.96% |
A-19
| | | | | | | | |
Fund | | Title of
Class | | Name and Address of Beneficial Owner | | Number of
Shares Owned | | Percent of
Class |
| | | | State St Bank & Tr Co FBO ABN AMRO North America Retirement Trust 805 Pennsylvania Ave Kansas City MO 64105-1340 | | 267,786.99 | | 6.88% |
| | | | |
| Aston/Veredus Select Growth Fund | | Class I | | Charles Schwab & Co Inc Special Custody Acct for Exclusive of Customers 101 Montgomery St San Francisco, CA 94104-4122 | | 4,417,628.46 | | 85.49% |
| | | | |
| | | | National City Bank Allegheny Co Police Pension PO Box 94984 Cleveland OH 44101-4984 | | 260,116.79 | | 5.03% |
| | | | |
| Aston/River Road Small Cap Value Fund | | Class I | | National Financial Services Corp (FBO) Our Customers 200 Liberty Street One World Financial Center New York NY 10281 | | 5,944,926.13 | | 22.37% |
| | | | |
| | | | Charles Schwab & Co Inc Special Custody Acct for Exclusive of Customers 101 Montgomery St San Francisco, CA 94104-4122 | | 3,955,340.45 | | 14.88% |
A-20
| | | | | | | | |
Fund | | Title of
Class | | Name and Address of Beneficial Owner | | Number of
Shares Owned | | Percent of
Class |
| | | | Minnesota Life 400 Robert St N Saint Paul MN 55101-2006 | | 2,188,706.97 | | 8.23% |
| | | | |
| Aston/River Road Dividend All Cap Value Fund | | Class I | | National Financial Services Corp (FBO) Our Customers 200 Liberty Street One World Financial Center New York NY 10281 | | 3,659,677.75 | | 35.72% |
| | | | |
| | | | Charles Schwab & Co Inc Special Custody Acct for Exclusive of Customers 101 Montgomery St San Francisco, CA 94104-4122 | | 2,526,030.34 | | 24.65% |
| | | | |
| | | | Strafe & Co FBO Credit Suisse Omnibus Mutual Fund P.O.BOX 160 Westerville, OH, 43086 | | 1,120,652.70 | | 10.94% |
| | | | |
| | | | Wells Fargo Bank NA FBO Stuart, H&M Foundation - Custody PO Box 1533 Minneapolis, MN 55480 | | 971,922.25 | | 9.49% |
A-21
| | | | | | | | |
Fund | | Title of
Class | | Name and Address of Beneficial Owner | | Number of
Shares Owned | | Percent of
Class |
| | | | Wells Fargo Bank, NA FBO Stuart, Brett Living Trust PO Box 1533 Minneapolis, MN 55480 | | 543,773.79 | | 5.30% |
| | | | |
| | | | Wells Fargo Bank, NA FBO Stuart, Nan Living Trust - CUST(M) PO Box 1533 Minneapolis, MN 55480 | | 543,773.79 | | 5.31% |
| | | | |
| Aston/River Road Small-Mid Cap Fund | | Class I | | National Financial Services Corp (FBO) Our Customers 200 Liberty Street One World Financial Center New York NY 10281 | | 5,288,316.54 | | 23.77% |
| | | | |
| | | | Charles Schwab & Co Inc Special Custody Acct for Exclusive of Customers 101 Montgomery St San Francisco, CA 94104-4122 | | 4,588,177.53 | | 20.62% |
| | | | |
| | | | SEI Private Trust Co. c/o Suntrust One Freedom Valley Drive Oaks, PA 19456 | | 2,291,050.01 | | 10.30% |
A-22
| | | | | | | | |
Fund | | Title of
Class | | Name and Address of Beneficial Owner | | Number of
Shares Owned | | Percent of
Class |
| | | | SEI Private Trust Company c/o Hale & Dorr One Freedom Valley Drive Oaks, PA 19456 | | 1,642,812.54 | | 7.38% |
| | | | |
| | | | US Bancorp FBO City of Milwaukee Deferred Compensation Plan PO Box 182029 Columbus OH 43218-2029 | | 1,327,521.49 | | 5.97% |
| | | | |
| Aston/Lake Partners LASSO Alternatives Fund | | Class I | | Charles Schwab & Co Inc Special Custody Acct for Exclusive of Customers 101 Montgomery St San Francisco, CA 94104-4122 | | 409,178.33 | | 75.46% |
| | | | |
| | | | Prudential Invest Mgmt Serv FBO Mutual Fund Clients 100 Mulberry Street Gateway Center FL 11 Newark NJ 07102 | | 63,148.18 | | 11.64% |
| | | | |
| | | | National Financial Services Corp (FBO) Our Customers 200 Liberty Street One World Financial Center New York NY 10281 | | 37,981.54 | | 7.00% |
A-23
| | | | | | | | |
Fund | | Title of
Class | | Name and Address of Beneficial Owner | | Number of
Shares Owned | | Percent of
Class |
| Aston/Neptune International Fund | | Class I | | State Street Nominees Ltd 525 Ferry Rd Edinburgh Scotland EH5 2AW | | 160,003.66 | | 92.94% |
| | | | |
| Aston/Barings International Fund | | Class I | | National Financial Services Corp (FBO) Our Customers 200 Liberty Street One World Financial Center New York NY 10281 | | 2,490,131.20 | | 44.14% |
| | | | |
| | | | Strafe & Co FBO Credit Suisse Omnibus Mutual Fund P.O.Box 160 Westerville, OH, 43086 | | 1,445,290.13 | | 25.64% |
| | | | |
| | | | Wells Fargo Bank NA FBO Scott & White Endow PO Box 1533 Minneapolis, MN 55480 | | 509,827.69 | | 9.04% |
| | | | |
| | | | Charles Schwab & Co Inc Special Custody Acct for Exclusive of Customers 101 Montgomery St San Francisco, CA 94104-4122 | | 334,553.80 | | 5.93% |
A-24
| | | | | | | | |
Fund | | Title of
Class | | Name and Address of Beneficial Owner | | Number of
Shares Owned | | Percent of
Class |
| | | | Ameritrade Inc for the Exclusive Benefit of our Clients PO Box 2226 Omaha NE 68103-2226 | | 291,950.91 | | 5.18% |
| | | | |
| Aston Growth Fund | | Class R | | Merrill Lynch Pierce Fenner & Smith Inc for the Sole Benefit of it’s Customers 4800 Deer Lake Dr East 3rd Fl Jacksonville, FL 32246 | | 28,690.00 | | 61.08% |
| | | | |
| | | | Nationwide Trust Company FSB c/o IPO Portfolio Accounting PO Box 182029 Columbus, OH 43218-2029 | | 16,210.15 | | 34.51% |
| | | | |
| Aston/Montag & Caldwell Growth Fund | | Class R | | PIMS/Prudential Retirement as Nominee for the TTEE/CUST Kenny Industries, Inc. 2215 Sanders Road Ste 400 Northbrook IL 60062 | | 103,856.32 | | 38.68% |
| | | | |
| | | | Merrill Lynch Pierce Fenner & Smith Inc for the Sole Benefit of it’s Customers 4800 Deer Lake Dr East 3rd Fl Jacksonville, FL 32246 | | 94,378.70 | | 35.15% |
A-25
| | | | | | | | |
Fund | | Title of
Class | | Name and Address of Beneficial Owner | | Number of
Shares Owned | | Percent of
Class |
| | | | Reliance Trust Company FBO Diesel Truck P.O. Box 48529 Atlanta GA 30362 | | 17,569.61 | | 6.54% |
| | | | |
| | | | Nationwide Trust Company FSB c/o IPO Portfolio Accounting PO Box 182029 Columbus, OH 43218-2029 | | 16,181.27 | | 6.03% |
A-26
APPENDIX B
Trustees, Nominees and Officers Beneficially Owning 1% or More of Fund Shares as of November 30, 2009
| | | | | | | | |
Fund | | Title of Class | | Name and Address of
Beneficial Owner | | Number of
Shares Owned | | Percent of
Class |
Aston/TAMRO Diversified Equity Fund | | Class N | | Stuart D. Bilton
120 North LaSalle Street 25th Floor
Chicago, Illinois 60602 | | 24,228 | | 2.24% |
| | | | |
Aston/TAMRO Diversified Equity Fund | | Class N | | Leonard F. Amari
120 North LaSalle Street 25th Floor
Chicago, Illinois 60602 | | 12,304 | | 1.14% |
| | | | |
Aston/Cardinal Mid Cap Value Fund | | Class N | | Gerald F. Dillenburg
120 North LaSalle Street 25th Floor
Chicago, Illinois 60602 | | 3,570 | | 2.80% |
| | | | |
Aston/Neptune International Fund | | Class N | | Stuart D. Bilton
120 North LaSalle Street 25th Floor
Chicago, Illinois 60602 | | 30,374 | | 73.39% |
| | | | |
Aston/Neptune International Fund | | Class I | | Gerald F. Dillenburg
120 North LaSalle Street 25th Floor
Chicago, Illinois 60602 | | 9,207 | | 5.62% |
| | | | |
Aston/Montag & Caldwell Growth Fund | | Class R | | Kenneth C. Anderson
120 North LaSalle Street 25th Floor
Chicago, Illinois 60602 | | 9,987 | | 3.42% |
B-1
Fund Shares Owned by Nominees
The following table sets forth, for each nominee that beneficially owned shares of any Fund as of November 30, 2009, the dollar range of shares beneficially owned in each Fund, as well as the aggregate dollar range of shares beneficially owned in all of the Funds as of the same date. Nominees Jeffrey S. Murphy, Edward J. Kaier, Steven J. Paggioli, Eric Rakowski, Jack W. Aber and Thomas R. Schneeweis did not beneficially own shares of any Fund as of November 30, 2009.
| | | | | | | | |
| | | Interested Trustee/
Nominee | | Independent Trustees/Nominees |
Name of Fund | | Stuart D. Bilton | | Gregory T. Mutz | | Robert B. Scherer | | William E. Chapman II |
Aston Balanced Fund | | $0 | | $0 | | $0 | | $0 |
| | | | |
Aston/Barings International Fund | | $0 | | $0 | | $0 | | $0 |
| | | | |
Aston/Cardinal Mid Cap Value Fund | | $0 | | $0 | | $0 | | $0 |
| | | | |
Aston Dynamic Allocation Fund | | $0 | | $0 | | $0 | | $0 |
| | | | |
Aston/Fasciano Small Cap Fund | | $0 | | $0 | | $0 | | $0 |
| | | | |
Aston/Fortis Real Estate Fund | | $0 | | $0 | | $0 | | $0 |
| | | | |
Aston Growth Fund | | $0 | | $0 | | $0 | | $50,001-$100,000 |
| | | | |
Aston/Lake Partners LASSO Alternatives Fund | | $0 | | $0 | | $0 | | $0 |
| | | | |
Aston/M.D. Sass Enhanced Equity Fund | | $0 | | $0 | | $0 | | $0 |
| | | | |
Aston/Montag & Caldwell Balanced Fund | | $0 | | $0 | | $0 | | $0 |
| | | | |
Aston/Montag & Caldwell Growth Fund | | Over $100,000 | | Over $100,000 | | $10,001-$50,000 | | $50,001-$100,000 |
| | | | |
Aston/Montag & Caldwell Mid Cap Growth Fund | | $0 | | $0 | | $0 | | $0 |
B-2
| | | | | | | | |
| | | Interested Trustee/
Nominee | | Independent Trustees/Nominees |
Name of Fund | | Stuart D. Bilton | | Gregory T. Mutz | | Robert B. Scherer | | William E. Chapman II |
Aston/Neptune International Fund | | Over $100,000 | | $0 | | $0 | | $0 |
| | | | |
Aston/New Century Absolute Return ETF Fund | | $0 | | $0 | | $0 | | $0 |
| | | | |
Aston/Optimum Large Cap Opportunity Fund | | $0 | | $0 | | $0 | | $0 |
| | | | |
Aston/Optimum Mid Cap Fund | | Over $100,000 | | $10,001-$50,000 | | $0 | | $0 |
| | | | |
Aston/River Road Dividend All Cap Value Fund | | Over $100,000 | | $50,001-$100,000 | | $10,001-$50,000 | | $0 |
| | | | |
Aston/River Road Small-Mid Cap Fund | | $0 | | $0 | | $0 | | $0 |
| | | | |
Aston/River Road Small Cap Value Fund | | Over $100,000 | | $0 | | $10,001-$50,000 | | $0 |
| | | | |
Aston/TAMRO Diversified Equity Fund | | Over $100,000 | | $50,001-$100,000 | | $1-$10,000 | | $0 |
| | | | |
Aston/TAMRO Small Cap Fund | | Over $100,000 | | $10,001-$50,000 | | $10,001-$50,000 | | $0 |
| | | | |
Aston/TCH Fixed Income Fund | | $0 | | $0 | | $0 | | $0 |
| | | | |
Aston Value Fund | | $0 | | $0 | | $0 | | $0 |
| | | | |
Aston/Veredus Aggressive Growth Fund | | $0 | | $0 | | $0 | | $0 |
| | | | |
Aston/Veredus Select Growth Fund | | $0 | | $10,001-$50,000 | | $0 | | $0 |
| | | | |
Aggregate Dollar Range of Fund Shares Owned by Nominees in Fund Complex | | Over $100,000 | | Over $100,000 | | Over $100,000 | | Over $100,000 |
B-3
APPENDIX C
Dates Related to Current Advisory Agreements
| | | | | | |
Fund Name | | Date of Current Advisory Agreement | | Date Current Advisory Agreement Was Last Approved by Shareholders | | Date Current Advisory
Agreement Was Last Approved by Board |
| | | |
| Aston Balanced Fund | | November 30, 2006 | | August 25, 2006 | | December 17, 2009 |
| | | |
| Aston/Barings International Fund | | November 1, 2007 | | November 1, 2007 | | December 17, 2009 |
| | | |
| Aston/Cardinal Mid Cap Value Fund | | November 1, 2007 | | November 1, 2007 | | December 17, 2009 |
| | | |
| Aston Dynamic Allocation Fund | | January 7, 2008 | | January 7, 2008 | | December 17, 2009 |
| | | |
| Aston/Fasciano Small Cap Fund | | December 21, 2009 | | December 21, 2009 | | December 17, 2009 |
| | | |
| Aston/Fortis Real Estate Fund | | November 30, 2006 | | August 25, 2006 | | December 17, 2009 |
| | | |
| Aston Growth Fund | | November 30, 2006 | | August 25, 2006 | | December 17, 2009 |
| | | |
| Aston/Lake Partners LASSO Alternatives Fund | | March 30, 2009 | | March 30, 2009 | | March 19, 2009 |
| | | |
| Aston/M.D. Sass Enhanced Equity Fund | | January 9, 2008 | | January 9, 2008 | | December 17, 2009 |
| | | |
| Aston/Montag & Caldwell Balanced Fund | | November 30, 2006 | | August 25, 2006 | | December 17, 2009 |
C-1
| | | | | | |
Fund Name | | Date of Current Advisory Agreement | | Date Current Advisory Agreement Was Last Approved by Shareholders | | Date Current Advisory
Agreement Was Last Approved by Board |
| | | |
| Aston/Montag & Caldwell Growth Fund | | November 30, 2006 | | August 25, 2006 | | December 17, 2009 |
| | | |
| Aston/Montag & Caldwell Mid Cap Growth Fund | | November 1, 2007 | | November 1, 2007 | | December 17, 2009 |
| | | |
| Aston/Neptune International Fund | | July 20, 2007 | | July 20, 2007 | | December 17, 2009 |
| | | |
| Aston/New Century Absolute Return ETF Fund | | February 29, 2008 | | February 29, 2008 | | December 17, 2009 |
| | | |
| Aston/Optimum Large Cap Opportunity Fund | | December 26, 2006 | | December 26, 2006 | | December 17, 2009 |
| | | |
| Aston/Optimum Mid Cap Fund | | November 30, 2006 | | September 20, 2006 | | December 17, 2009 |
| | | |
| Aston/River Road Dividend All Cap Value Fund | | November 30, 2006 | | August 25, 2006 | | December 17, 2009 |
| | | |
| Aston/River Road Small-Mid Cap Fund | | March 28, 2007 | | March 28, 2007 | | December 17, 2009 |
| | | |
| Aston/River Road Small Cap Value Fund | | November 30, 2006 | | September 20, 2006 | | December 17, 2009 |
C-2
| | | | | | |
Fund Name | | Date of Current Advisory Agreement | | Date Current Advisory Agreement Was Last Approved by Shareholders | | Date Current Advisory
Agreement Was Last Approved by Board |
| | | |
| Aston/TAMRO Diversified Equity Fund | | November 30, 2006 | | August 25, 2006 | | December 17, 2009 |
| | | |
| Aston/TAMRO Small Cap Fund | | November 30, 2006 | | September 20, 2006 | | December 17, 2009 |
| | | |
| Aston/TCH Fixed Income Fund | | November 30, 2006 | | August 25, 2006 | | December 17, 2009 |
| | | |
| Aston Value Fund | | November 30, 2006 | | August 25, 2006 | | December 17, 2009 |
| | | |
| Aston/Veredus Select Growth Fund | | November 30, 2006 | | August 25, 2006 | | December 17, 2009 |
| | | |
| Aston/Veredus Aggressive Growth Fund | | November 30, 2006 | | September 20, 2006 | | December 17, 2009 |
C-3
APPENDIX D
Form of Investment Advisory Agreement
AGREEMENT made this day of , 20 by and between ASTON FUNDS, a Delaware statutory trust (the “Trust”), on behalf of each series of the Trust set forth on Schedule A hereto as may be amended from time to time (each, a “Fund” and collectively, the “Funds”) and ASTON ASSET MANAGEMENT, LP, a Delaware limited liability company (the “Adviser”).
WHEREAS, the Trust is registered under the Investment Company Act of 1940, as amended (the “1940 Act”), as an open-end management investment company; and
WHEREAS, the Trust wishes to retain the Adviser to render investment advisory services to each Fund, and the Adviser is willing to furnish such services to each Fund.
NOW THEREFORE, in consideration of the promises and mutual covenants herein contained, it is agreed between the Trust and the Adviser as follows:
1. Appointment. The Trust hereby appoints the Adviser to act as investment adviser to each Fund for the periods and on the terms set forth in this Agreement. The Adviser accepts such appointment and agrees to furnish the services herein set forth, for the compensation herein provided.
2. Duties of Adviser. As investment adviser, the Adviser shall: (i) manage the investment and reinvestment of the assets of each Fund, (ii) continuously review, supervise and administer the investment program of each Fund, (iii) determine, in its discretion, the assets to be held uninvested, (iv) provide the Trust with records concerning the Adviser’s activities which are required to be maintained by the Trust and (v) render regular reports to the Trust’s officers and Board of Trustees concerning the Adviser’s discharge of the foregoing responsibilities. The Adviser shall discharge the foregoing responsibilities subject to the oversight of the officers and the Board of Trustees of the Trust and in compliance with the objectives, policies and limitations set forth in each Fund’s then effective prospectus and statement of additional information. The
D-1
Adviser shall determine from time to time what securities and other investments will be purchased, retained, sold or exchanged by each Fund and what portion of the assets of the Fund’s portfolio will be held in the various securities and other investments in which the Fund invests, and shall implement those decisions, all subject to the provisions of the Trust’s Declaration of Trust and By-Laws, as amended from time to time, the 1940 Act, and the applicable rules and regulations promulgated thereunder by the Securities and Exchange Commission (the “SEC”) and interpretive guidance issued thereunder by the SEC staff and any other applicable federal and state law, as well as the investment objectives, policies and restrictions of the Fund referred to above, and any other specific policies adopted by the Board and communicated to the Adviser. Subject to applicable provisions of the 1940 Act and direction from the Board, the investment program to be provided hereunder may entail the investment of all or substantially all of the assets of a Fund in one or more investment companies. The Adviser shall also provide advice and recommendations with respect to other aspects of the business and affairs of the Funds, shall exercise voting rights, rights to consent to corporate action and any other rights pertaining to a Fund’s portfolio securities subject to such direction as the Board may provide, and shall perform such other functions of investment management and supervision as may be directed by the Board.
3. Delegation of Duties. Subject to the Board’s approval, the Adviser and/or a Fund may enter into contracts with one or more investment subadvisers, including without limitation, affiliates of the Adviser, in which the Adviser delegates to such investment subadvisers any or all its duties specified hereunder, on such terms as the Adviser will determine to be necessary, desirable or appropriate, provided that in each case the Adviser shall supervise the activities of each such subadviser and further provided that such contracts are entered into in accordance with and meet all applicable requirements of the 1940 Act and rules thereunder. Any such delegation shall not relieve the Adviser of any of its duties hereunder.
4. Manager-of-Managers Structure. The Adviser shall also have the authority, upon the approval of the Board and subject to applicable provisions of the 1940 Act and the regulations thereunder, to select one or more subadvisers to provide day-to-day portfolio management with respect to all or a portion of the assets of any of the Funds and to allocate and reallocate the assets of a Fund between and among any subadvisers so
D-2
selected pursuant to a “manager-of-managers” structure. The Fund acknowledges that the Adviser would have the authority to retain and terminate subadvisers, engage new subadvisers and make material revisions to the terms of the subadvisory agreements subject to approval of the Board of Trustees, but not shareholder approval, under this structure.
5. Portfolio Transactions. The Adviser shall select and monitor the selection of the brokers or dealers that will execute the purchases and sales of securities for the Funds and is directed to use its best efforts to ensure that the best available price and most favorable execution of securities transactions for the Funds is obtained. Subject to policies established by the Board of Trustees of the Trust and communicated to the Adviser, it is understood that the Adviser will not be deemed to have acted unlawfully, or to have breached a fiduciary duty to the Trust or in respect of a Fund, or be in breach of any obligation owing to the Trust or in respect of a Fund under this Agreement, or otherwise, solely by reason of its having caused a Fund to pay a member of a securities exchange, a broker or a dealer a commission for effecting a securities transaction for the Fund in excess of the amount of commission another member of an exchange, broker or dealer would have charged if the Adviser determines in good faith that the commission paid was reasonable in relation to the brokerage or research services (as those terms are defined in Section 28(e) of the Securities Exchange Act of 1934 and interpretive guidance issued by the SEC thereunder) provided by such member, broker or dealer, viewed in terms of that particular transaction or the Adviser’s overall responsibilities with respect to the accounts, including the Funds, as to which it exercises investment discretion. The Adviser will promptly communicate to the officers and Trustees of the Trust such information relating to Fund transactions as they may reasonably request.
6. Expenses. The Adviser shall bear all expenses, and shall furnish all necessary services, facilities and personnel, in connection with its responsibilities under this Agreement. Other than as herein specifically indicated, the Adviser shall not be responsible for a Fund’s expenses, including, without limitation: advisory fees; distribution fees; interest; taxes; governmental fees; voluntary assessments and other expenses incurred in connection with membership in investment company organizations; organizational costs of the Fund; the cost (including brokerage commissions, transaction fees or charges, if any) in connection
D-3
with the purchase or sale of the Fund’s securities and other investments and any losses in connection therewith; fees and expenses of custodians, transfer agents, administrators, registrars, independent pricing vendors or other agents; legal expenses; loan commitment fees; expenses relating to share certificates; expenses relating to the issuing and redemption or repurchase of the Fund’s shares and servicing shareholder accounts; expenses of registering and qualifying the Fund’s shares for sale under applicable federal and state law; expenses of preparing, setting in print, printing and distributing prospectuses and statements of additional information and any supplements thereto, reports, proxy statements, notices and dividends to the Fund’s shareholders; costs of stationery; website costs; costs of meetings of the Board or any committee thereof, meetings of shareholders and other meetings of the Fund except as otherwise determined by the Trustees; Board fees; audit fees; travel expenses of officers, Trustees and employees of the Trust who are not officers, employees or directors of the Adviser or its affiliates, if any; and the Trust’s pro rata portion of premiums on any fidelity bond and other insurance covering the Trust and its officers, Trustees and employees; litigation expenses and any non-recurring or extraordinary expenses as may arise, including, without limitation, those relating to actions, suits or proceedings to which the Fund is a party and the legal obligation which the Fund may have to indemnify the Trust’s Trustees and officers with respect thereto.
The Adviser shall authorize and permit any of its directors, officers and employees, who may be elected as Trustees or officers of the Trust, to serve in the capacities in which they are elected. No officer or employee of the Trust or a Fund shall receive from the Trust or a Fund any salary or other compensation as such Trustee, officer or employee while he is at the same time a director, officer, or employee of the Adviser or any affiliated company of the Adviser, except as the Board may decide.
7. Compensation of the Adviser. For the services to be rendered by the Adviser as provided in this Agreement, each Fund shall pay to the Adviser within five business days after the end of each calendar month a monthly fee of one-twelfth the annual rate set forth opposite the Fund’s name on Schedule B hereto based on the Fund’s average daily net assets for that month. For the purposes of this Agreement, each Fund’s “net assets” shall be determined as provided in the Fund’s then-current Prospectus and Statement of Additional Information.
D-4
In the event of termination of this Agreement, the fee provided in this Section 7 shall be paid on a pro-rata basis, based on the number of days during which this Agreement was in effect.
8. Reports. The Trust, on behalf of each Fund, and the Adviser agree to furnish to each other such information regarding their operations with regard to their affairs as each may reasonably request. Information and reports furnished by the Adviser to the Board and the officers of the Trust shall be at the Adviser’s expense. In compliance with the requirements of Rule 31a-3 under the 1940 Act, the Adviser hereby agrees that any records that it maintains for a Fund are the property of the Fund, and further agrees to surrender promptly to the Fund any of such records upon the Fund’s request; provided, however, that the Adviser may retain for its records copies of the records so surrendered. The Adviser further agrees to arrange for the preservation of any such records for the periods prescribed by Rule 31a-2 under the 1940 Act.
9. Status of Adviser. The services of the Adviser to the Funds are not to be deemed exclusive, and the Adviser shall be free to render similar services to others so long as its services to the Funds are not impaired thereby. In addition, nothing in this Agreement shall limit or restrict the right of any director, officer or employee of the Adviser who may also be a Trustee, officer or employee of the Trust or a Fund, to engage in any other business or to devote his or her time and attention in part to the management or other aspects of any other business, whether of a similar nature or a dissimilar nature.
10. Liability of Adviser. In the absence of willful misfeasance, bad faith, gross negligence or reckless disregard by the Adviser of its obligations and duties hereunder, the Adviser shall not be subject to any liability whatsoever to a Fund, or to any shareholder of a Fund, for any error of judgment, mistake of law or any other act or omission in the course of, or connected with, rendering services hereunder including, without limitation, for any losses that may be sustained in connection with the purchase, holding, redemption or sale of any security on behalf of the Fund.
11. Duration and Termination. The term of this Agreement shall commence with respect to a Fund on the date set forth opposite the Fund’s name as set forth on Schedule A hereto (the “Effective Date”), provided
D-5
that first it is approved by the Board of Trustees of the Trust, including a majority of those Trustees who are not parties to this Agreement or interested persons of any party hereto, in the manner provided in Section 15(c) of the 1940 Act, and by the holders of a majority of the outstanding voting securities of the Fund, and shall continue in effect for the initial term set forth in Schedule A. This Agreement shall continue in effect with respect to a Fund after its initial term, provided such continuance is approved at least annually by (i) the Trust’s Board of Trustees or (ii) the vote of a majority of the outstanding voting securities of the Fund; and in either event by a vote of a majority of those Trustees of the Trust who are not parties to this Agreement or interested persons of any such party in the manner provided in Section 15(c) of the 1940 Act. Notwithstanding the foregoing, this Agreement may be terminated with respect to a Fund: (a) at any time without penalty by the Fund upon the vote of a majority of the Trustees or by vote of the majority of the Fund’s outstanding voting securities, upon sixty (60) days’ written notice to the Adviser or (b) by the Adviser at any time without penalty, upon sixty (60) days’ written notice to the Fund. This Agreement will also terminate automatically in the event of its assignment (as defined in the 1940 Act). Any notice under this Agreement shall be given in writing, addressed and delivered or mailed postpaid, to the other party at the principal office of such party.
As used in this Section 11, the terms “assignment,” “interested person” and “a vote of a majority of the outstanding voting securities” shall have the respective meanings set forth in Section 2(a)(4), Section 2(a)(19) and Section 2(a)(42) of the 1940 Act and Rule 18f-2 thereunder, subject to such exemptions as may be granted by the SEC by any rule, regulation, order or interpretive guidance.
12. Declaration of Trust. The Adviser agrees that for services rendered to a Fund, or for any claim by it in connection with services rendered to a Fund, it shall look only to assets of that Fund for satisfaction and that it shall have no claim against the assets of any other portfolios of the Trust.
13. Governing Law. This Agreement shall be construed and the provisions thereof interpreted under and in accordance with the laws of the State of Delaware.
D-6
14. Severability. If any provisions of this Agreement shall be held or made invalid by a court decision, statute, rule or otherwise, the remainder of this Agreement shall not be affected thereby.
15. Amendments. No provision of this Agreement may be changed, waived, discharged or terminated orally, but only by an instrument in writing signed by the party against which enforcement of the change, waiver, discharge or termination is sought, and with such approvals as required by applicable law.
[The Remainder of Page Intentionally Left Blank]
D-7
IN WITNESS WHEREOF, the parties hereto have caused this Agreement to be executed as of the day and year first above written.
| | | | | | |
| ATTEST: | | | | ASTON FUNDS on behalf of the series set forth in Schedule A |
| | | |
| | | | By: | | |
| | | | Title: | | |
| | |
| ATTEST: | | | | ASTON ASSET MANAGEMENT, LP |
| | | |
| | | | By: | | |
| | | | Title: | | |
D-8
SCHEDULE A
| | | | |
Fund | | Effective Date | | Initial Term |
| | |
Aston Balanced Fund | | | | |
| | |
Aston Value Fund | | | | |
| | |
Aston Growth Fund | | | | |
| | |
Aston/Fortis Real Estate Fund | | | | |
| | |
Aston/Montag & Caldwell Balanced Fund | | | | |
| | |
Aston/Montag & Caldwell Growth Fund | | | | |
| | |
Aston/Optimum Mid Cap Fund | | | | |
| | |
Aston/River Road Dividend All Cap Value Fund | | | | |
| | |
Aston/River Road Small Cap Value Fund | | | | |
| | |
Aston/TAMRO Diversified Equity Fund | | | | |
| | |
Aston/TAMRO Small Cap Fund | | | | |
| | |
Aston/TCH Fixed Income Fund | | | | |
| | |
Aston/Veredus Aggressive Growth Fund | | | | |
| | |
Aston/Veredus Select Growth Fund | | | | |
| | |
Aston/Optimum Large Cap Opportunity Fund | | | | |
| | |
Aston/River Road Small-Mid Cap Fund | | | | |
| | |
Aston/Neptune International Fund | | | | |
| | |
Aston/Montag & Caldwell Mid Cap Growth Fund | | | | |
| | |
Aston/Barings International Fund | | | | |
| | |
Aston/Cardinal Mid Cap Value Fund | | | | |
| | |
Aston Dynamic Allocation Fund | | | | |
| | |
Aston/M.D. Sass Enhanced Equity Fund | | | | |
| | |
Aston/New Century Absolute Return ETF Fund | | | | |
| | |
Aston/Lake Partners LASSO Alternatives Fund | | | | |
| | |
Aston/Fasciano Small Cap Fund | | | | |
D-9
SCHEDULE B
| | |
Fund | | Annual Fee Rate |
| |
Aston Balanced Fund | | 0.70% of the Fund’s average daily net assets |
| |
Aston Value Fund | | 0.80% of the Fund’s average daily net assets |
| |
Aston Growth Fund | | 0.70% of the Fund’s average daily net assets |
| |
Aston/Fortis Real Estate Fund | | 1.00% of the Fund’s average daily net assets |
| |
Aston/Montag & Caldwell Balanced Fund | | 0.75% of the Fund’s average daily net assets |
| |
Aston/Montag & Caldwell Growth Fund | | 0.80% for the first $800 million 0.60% over $800 million |
| |
Aston/Optimum Mid Cap Fund | | 0.80% for the first $100 million 0.75% for the next $300 million 0.70% over $400 million |
| |
Aston/River Road Dividend All Cap Value Fund | | 0.70% of the Fund’s average daily net assets |
| |
Aston/River Road Small Cap Value Fund | | 0.90% of the Fund’s average daily net assets |
| |
Aston/TAMRO Diversified Equity Fund | | 0.80% of the Fund’s average daily net assets |
| |
Aston/TAMRO Small Cap Fund | | 0.90% of the Fund’s average daily net assets |
| |
Aston/TCH Fixed Income Fund | | 0.55% of the Fund’s average daily net assets |
| |
Aston/Veredus Aggressive Growth Fund | | 1.00% of the Fund’s average daily net assets |
| |
Aston/Veredus Select Growth Fund | | 0.80% of the Fund’s average daily net assets |
| |
Aston/Optimum Large Cap Opportunity Fund | | 0.80% of the Fund’s average daily net assets |
| |
Aston/River Road Small-Mid Cap Fund | | 1.00% of the Fund’s average daily net assets |
| |
Aston/Neptune International Fund | | 1.00% of the Fund’s average daily net assets |
| |
Aston/Montag & Caldwell Mid Cap Growth Fund | | 0.85% of the Fund’s average daily net assets |
| |
Aston/Barings International Fund | | 1.00% of the Fund’s average daily net assets |
| |
Aston/Cardinal Mid Cap Value Fund | | 0.90% of the Fund’s average daily net assets |
| |
Aston Dynamic Allocation Fund | | 0.80% of the Fund’s average daily net assets |
| |
Aston/M.D. Sass Enhanced Equity Fund | | 0.70% of the Fund’s average daily net assets |
| |
Aston/New Century Absolute Return ETF Fund | | 1.00% of the Fund’s average daily net assets |
| |
Aston/Lake Partners LASSO Alternatives Fund | | 1.00% of the Fund’s average daily net assets |
| |
Aston/Fasciano Small Cap Fund | | 1.00% of the Fund’s average daily net assets |
D-10
APPENDIX E
Advisory Fee Rates and Aggregate Advisory Fees Paid During Last Fiscal Year
| | | | | | | | | |
Fund | | Annual Gross Advisory Fee Rate | | Fees Paid to the
Adviser During
Last Fiscal Year | | | Net Assets as of
10/31/09 |
Aston Balanced Fund | | 0.70% | | $ | 115,902 | | | $ | 16,804,970 |
Aston/Barings International Fund | | 1.00% | | $ | 23,307 | (1) | | $ | 28,276,692 |
Aston/Cardinal Mid Cap Value Fund | | 0.90% | | $ | 0 | (2) | | $ | 916,100 |
Aston Dynamic Allocation Fund | | 0.80% | | $ | 94,470 | (3) | | $ | 39,190,617 |
Aston/Fasciano Small Cap Fund(4) | | N/A | | | N/A | | | | N/A |
Aston/Fortis Real Estate Fund | | 1.00% | | $ | 93,901 | (5) | | $ | 25,916,242 |
Aston Growth Fund | | 0.70% | | $ | 1,249,027 | (6) | | $ | 201,697,414 |
Aston/Lake Partners LASSO Alternatives Fund | | 1.00% | | $ | 0 | (7) | | $ | 1,844,834 |
Aston/M.D. Sass Enhanced Equity Fund | | 0.70% | | $ | 0 | (8) | | $ | 22,551,815 |
Aston/Montag & Caldwell Balanced Fund | | 0.75% | | $ | 48,359 | (9) | | $ | 16,086,414 |
Aston/Montag & Caldwell Growth Fund | | 0.80% on first $800,000,000 0.60% over $800,000,000 | | $ | 12,553,027 | | | $ | 2,486,823,315 |
Aston/Montag & Caldwell Mid Cap Growth Fund | | 0.85% | | $ | 0 | (10) | | $ | 2,959,374 |
Aston/Neptune International Fund | | 1.00% | | $ | 0 | (11) | | $ | 1,486,850 |
Aston/New Century Absolute Return ETF Fund | | 1.00% | | $ | 1,736 | (12) | | $ | 17,706,406 |
Aston/Optimum Large Cap Opportunity Fund | | 0.80% | | $ | 0 | (13) | | $ | 4,333,664 |
Aston/Optimum Mid Cap Fund | | 0.80% on first $100,000,000 0.75% next $300,000,000 0.70% over $400,000,000 | | $ | 5,092,843 | | | $ | 993,185,657 |
Aston/River Road Dividend All Cap Value Fund | | 0.70% | | $ | 736,901 | | | $ | 159,027,298 |
Aston/River Road Small-Mid Cap Fund | | 1.00% | | $ | 1,733,222 | (14) | | $ | 209,134,875 |
Aston/River Road Small Cap Value Fund | | 0.90% | | $ | 3,273,962 | | | $ | 498,763,125 |
Aston/TAMRO Diversified Equity Fund | | 0.80% | | $ | 4,734 | (15) | | $ | 10,485,972 |
Aston/TAMRO Small Cap Fund | | 0.90% | | $ | 4,722,659 | (16) | | $ | 757,115,466 |
Aston/TCH Fixed Income Fund | | 0.55% | | $ | 137,429 | (17) | | $ | 67,283,501 |
E-1
| | | | | | | | | |
Fund | | Annual Gross Advisory Fee Rate | | Fees Paid to the
Adviser During
Last Fiscal Year | | | Net Assets as of
10/31/09 |
Aston Value Fund | | 0.80% | | $ | 1,336,466 | (18) | | $ | 225,753,541 |
Aston/Veredus Aggressive Growth Fund | | 1.00% | | $ | 304,509 | (19) | | $ | 45,496,186 |
Aston/Veredus Select Growth Fund | | 0.80% | | $ | 557,943 | (20) | | $ | 87,136,460 |
| (1) | Amount is net of waived fees and/or reimbursed expenses by Aston. Aston waived fees of $139,755 during the Fund’s last fiscal year. |
| (2) | Amount is net of waived fees and/or reimbursed expenses by Aston. Aston waived fees of $7,138 and reimbursed expenses of $70,425 during the Fund’s last fiscal year. |
| (3) | Amount is net of waived fees and/or reimbursed expenses by Aston. Aston waived fees of $89,827 during the Fund’s last fiscal year. |
| (4) | Aston/Fasciano Small Cap Fund commenced investment operations on December 23, 2009. |
| (5) | Amount is net of waived fees and/or reimbursed expenses by Aston. Aston waived fees of $125,181 during the Fund’s last fiscal year. |
| (6) | Amount is net of waived fees and/or reimbursed expenses by Aston. Aston waived fees of $23,157 during the Fund’s last fiscal year. |
| (7) | Amount is net of waived fees and/or reimbursed expenses by Aston. Aston waived fees of $5,595 and reimbursed expenses of $88,476 during the Fund’s last fiscal year. |
| (8) | Amount is net of waived fees and/or reimbursed expenses by Aston. Aston waived fees of $116,321 and reimbursed expenses of $26,892 during the Fund’s last fiscal year. |
| (9) | Amount is net of waived fees and/or reimbursed expenses by Aston. Aston waived fees of $83,255 during the Fund’s last fiscal year. |
| (10) | Amount is net of waived fees and/or reimbursed expenses by Aston. Aston waived fees of $18,726 and reimbursed expenses of $60,922 during the Fund’s last fiscal year. |
| (11) | Amount is net of waived fees and/or reimbursed expenses by Aston. Aston waived fees of $86,401 and reimbursed expenses of $31,599 during the Fund’s last fiscal year. |
| (12) | Amount is net of waived fees and/or reimbursed expenses by Aston. Aston waived fees of $38,745 and reimbursed expenses of $5,128 during the Fund’s last fiscal year. |
| (13) | Amount is net of waived fees and/or reimbursed expenses by Aston. Aston waived fees of $27,352 and reimbursed expenses of $40,987 during the Fund’s last fiscal year. |
| (14) | Amount includes net expenses recouped from prior fiscal years pursuant to the contractual expense reimbursement agreement. |
| (15) | Amount is net of waived fees and/or reimbursed expenses by Aston. Aston waived fees of $65,041 during the Fund’s last fiscal year. |
| (16) | Amount is net of waived fees and/or reimbursed expenses by Aston. Aston waived fees of $63,074 during the Fund’s last fiscal year. |
| (17) | Amount is net of waived fees and/or reimbursed expenses by Aston. Aston waived fees of $237,026 during the Fund’s last fiscal year. |
| (18) | Amount is net of waived fees and/or reimbursed expenses by Aston. Aston waived fees of $276,845 during the Fund’s last fiscal year. |
| (19) | Amount is net of waived fees and/or reimbursed expenses by Aston. Aston waived fees of $151,505 during the Fund’s last fiscal year. |
| (20) | Amount is net of waived fees and/or reimbursed expenses by Aston. Aston waived fees of $51,192 during the Fund’s last fiscal year. |
E-2
APPENDIX F
Summary of Sub-Investment Advisory Agreements
| | |
Fund Name | | Subadviser |
| |
Aston Balanced Fund | | Montag & Caldwell, Inc. (Equity Portion); Taplin, Canida & Habacht, LLC (Income Portion) |
| |
Aston/Barings International Fund | | Baring International Investment Limited |
| |
Aston/Cardinal Mid Cap Value Fund | | Cardinal Capital Management, L.L.C. |
| |
Aston Dynamic Allocation Fund | | Smart Portfolios, LLC |
| |
Aston Growth Fund | | Montag & Caldwell, Inc. |
| |
Aston/Fasciano Small Cap Fund | | Fasciano Associates, LLC |
| |
Aston/Fortis Real Estate Fund | | Fortis Investment Management USA, Inc. |
| |
Aston/Lake Partners LASSO Alternatives Fund | | Lake Partners, Inc. |
| |
Aston/M.D. Sass Enhanced Equity Fund | | M.D. Sass Investors Services, Inc. |
| |
Aston/Montag & Caldwell Balanced Fund Aston/Montag & Caldwell Growth Fund Aston/Montag & Caldwell Mid Cap Growth Fund | | Montag & Caldwell, Inc. |
| |
Aston/Neptune International Fund | | Neptune Investment Management Limited |
| |
Aston/New Century Absolute Return ETF Fund | | New Century Capital Management, LLC |
F-1
| | |
Fund Name | | Subadviser |
| |
Aston/Optimum Large Cap Opportunity Fund Aston/Optimum Mid Cap Fund | | Optimum Investment Advisors, LLC |
| |
Aston/River Road Dividend All Cap Value Fund Aston/River Road Small Cap Value Fund Aston/River Road Small-Mid Cap Fund | | River Road Asset Management, LLC |
| |
Aston/TAMRO Diversified Equity Fund Aston/TAMRO Small Cap Fund | | TAMRO Capital Partners, LLC |
| |
Aston/TCH Fixed Income Fund | | Taplin, Canida & Habacht, LLC |
| |
Aston Value Fund | | MFS Institutional Advisors Inc. |
| |
Aston/Veredus Select Growth Fund Aston/Veredus Aggressive Growth Fund | | Todd-Veredus Asset Management LLC |
F-2
APPENDIX G
FORM OF AGREEMENT AND PLAN OF REORGANIZATION
THIS AGREEMENT AND PLAN OF REORGANIZATION (the “Agreement”) is made as of this day of , by and between Aston Funds, a Delaware statutory trust (the “Trust”), on behalf of and among Aston/Montag & Caldwell Balanced Fund and Aston/Montag & Caldwell Growth Fund (each an “Acquiring Fund” and collectively, the “Acquiring Funds”); Aston Balanced Fund and Aston Growth Fund (each an “Acquired Fund” and collectively, the “Acquired Funds”) (each Acquiring Fund and Acquired Fund referred to herein as a “Fund” and collectively, the “Funds”); and Aston Asset Management LLC (the “Adviser”), the investment adviser to the Funds (for purposes of Section 9.1 of the Agreement only). The principal place of business of the Trust is 120 North LaSalle Street, Chicago, Illinois 60602.
For each Reorganization (as defined below), this Agreement is intended to be, and is adopted as, a plan of reorganization within the meaning of Section 368 of the Internal Revenue Code of 1986, as amended (the “Code”), and the Treasury Regulations promulgated thereunder. The reorganization will consist of: (i) the transfer of all the assets of each Acquired Fund to its corresponding Acquiring Fund, as identified in Schedule A attached hereto, in exchange solely for voting common shares of beneficial interest, no par value per share, of its corresponding Acquiring Fund (“Acquiring Fund Shares”) and the assumption by each Acquiring Fund of all the liabilities of its corresponding Acquired Fund; and (ii) the distribution, after the Closing Date(s) hereinafter referred to, of such Acquiring Fund Shares to the shareholders of the corresponding Acquired Fund in complete liquidation and termination of each Acquired Fund as provided herein, all upon the terms and conditions set forth in this Agreement (each a “Reorganization”).
WHEREAS, each Fund is a separate series of the Trust, and the Trust is an open-end management investment company registered under the Investment Company Act of 1940, as amended (the “1940 Act”), and each Acquired Fund owns securities that generally are assets of the character in which its corresponding Acquiring Fund is permitted to invest;
G-1
WHEREAS, each Acquiring Fund is authorized to issue its shares of beneficial interests; and
WHEREAS, the Board of Trustees of the Trust (the “Board”) has determined that the Reorganization, with respect to each Fund, is in the best interests of such Fund and that the interests of the existing shareholders of each Fund will not be diluted as a result of the Reorganization.
NOW, THEREFORE, in consideration of the premises and of the covenants and agreements hereinafter set forth, the parties hereto covenant and agree as follows:
ARTICLE I
TRANSFER OF ASSETS OF THE ACQUIRED FUND IN EXCHANGE FOR ACQUIRING
FUND SHARES AND THE ASSUMPTION OF THE ACQUIRED FUND LIABILITIES AND
LIQUIDATION AND TERMINATION OF THE ACQUIRED FUND
1.1 THE EXCHANGE. Subject to the terms and conditions contained herein and on the basis of the representations and warranties contained herein, each Acquired Fund agrees to transfer all its assets, as set forth in Section 1.2, to its corresponding Acquiring Fund as set forth on Schedule A. In exchange, each Acquiring Fund agrees: (i) to deliver to the corresponding Acquired Fund the number of full and fractional Acquiring Fund Shares, computed in the manner set forth in Section 2.3; and (ii) to assume all the liabilities of the corresponding Acquired Fund, as set forth in Section 1.3. Such transactions shall take place at the closing provided for in Section 3.1 (each a “Closing”).
1.2 ASSETS TO BE ACQUIRED. The assets of each Acquired Fund to be acquired by its corresponding Acquiring Fund shall consist of all property, including, without limitation, all cash, securities, commodities, options, interests in futures and dividends or interest receivables, owned by the Acquired Fund and any deferred or prepaid expenses shown as an asset on the books of the Acquired Fund on the Closing Date, as such term is defined in Section 3.1.
G-2
Each Acquired Fund will, within a reasonable period of time before the Closing Date, furnish the corresponding Acquiring Fund with a list of the Acquired Fund’s portfolio securities and other investments. Each Acquiring Fund will, within a reasonable period of time before the Closing Date, furnish the corresponding Acquired Fund with a list of the securities, if any, on the Acquired Fund’s list referred to above that do not conform to the Acquiring Fund’s investment objective, policies and restrictions. The Acquired Fund, if requested by its corresponding Acquiring Fund, will dispose of securities on such Acquiring Fund’s list before the Closing Date. In addition, if it is determined that the portfolios of an Acquired Fund and its Acquiring Fund, when aggregated, would contain investments exceeding certain percentage limitations imposed upon such Acquiring Fund with respect to such investments, the Acquired Fund, if requested by the Acquiring Fund, will dispose of a sufficient amount of such investments as may be necessary to avoid violating such limitations as of the Closing Date. Notwithstanding the foregoing, nothing herein will require an Acquired Fund to dispose of any investments or securities if, in the reasonable judgment of the Board or the adviser, such disposition would adversely affect the status of the Reorganization as a “reorganization” as such term is used in the Code or would otherwise not be in the best interest of the Acquired Fund.
1.3 LIABILITIES TO BE ASSUMED. Each Acquired Fund will endeavor to discharge all of its known liabilities and obligations to the extent possible before the Closing Date. Notwithstanding the foregoing, any liabilities not so discharged shall be assumed by the corresponding Acquiring Fund, which assumed liabilities shall include all of the corresponding Acquired Fund’s liabilities, debts, obligations, and duties of whatever kind or nature, whether absolute, accrued, contingent, or otherwise, whether or not arising in the ordinary course of business, whether or not determinable at the Closing Date, and whether or not specifically referred to in this Agreement.
1.4 LIQUIDATION AND DISTRIBUTION. On or as soon after its Closing Date as is practicable (the “Liquidation Date”): (a) each Acquired Fund will distribute in complete liquidation of the Acquired Fund, pro rata to its shareholders of record, determined as of the close of business on the Valuation Date (as defined in Section 2.1) (the “Acquired Fund Shareholders”), all the Acquiring Fund Shares received by such Acquired Fund pursuant to Section 1.1; and (b) such Acquired Fund will thereupon
G-3
proceed to terminate as set forth in Section 1.7 below. Such distribution will be accomplished by the transfer of Acquiring Fund Shares credited to the account of the corresponding Acquired Fund on the books of the Acquiring Fund to open accounts on the share records of the Acquiring Fund in the name of the Acquired Fund Shareholders, and representing the respective pro rata number of Acquiring Fund Shares due such shareholders. All issued and outstanding shares of an Acquired Fund will simultaneously be canceled on the books of the Acquired Fund. The Acquiring Fund shall not issue certificates representing Acquiring Fund Shares in connection with such transfer.
1.5 OWNERSHIP OF SHARES. Ownership of Acquiring Fund Shares will be shown on the books of each Acquiring Fund’s transfer agent. Shares of each Acquiring Fund will be issued simultaneously to its corresponding Acquired Fund, in an amount computed in the manner set forth in Section 2.3, to be distributed to such Acquired Fund Shareholders.
1.6 TRANSFER TAXES. Any transfer taxes payable upon the issuance of Acquiring Fund Shares in a name other than the registered holder of the corresponding Acquired Fund shares on the books of such Acquired Fund as of that time shall, as a condition of such issuance and transfer, be paid by the person to whom such Acquiring Fund Shares are to be issued and transferred.
1.7 TERMINATION. Each Acquired Fund shall completely liquidate, terminate and have its affairs wound up in accordance with Delaware state law, promptly following its Closing Date and the making of all distributions pursuant to Section 1.4.
1.8 BOARD REPORTING. Any reporting responsibility of each Acquired Fund including, without limitation, the responsibility for filing of regulatory reports, tax returns or other documents with the Securities and Exchange Commission (the “Commission”), any state securities commission and any federal, state or local tax authorities or any other relevant regulatory authority, is and shall remain the responsibility of each Acquired Fund.
1.9 BOOKS AND RECORDS. All books and records of each Acquired Fund, including all books and records required to be maintained under the 1940 Act, and the rules and regulations thereunder, shall be
G-4
available to each Acquiring Fund from and after the Closing Date and shall be turned over to each Acquiring Fund as soon as practicable following the Closing Date.
1.10 RELATIONSHIP OF TRANSACTIONS. Subject to the conditions set forth in this Agreement, the failure of one of the Acquired Funds to consummate the transactions contemplated hereby shall not affect the consummation or validity of the Reorganization with respect to the other Acquired Fund, and the provisions of this Agreement shall be construed to effect this intent, including, without limitation, as the context requires, construing the terms “Acquiring Fund” and “Acquired Fund” as meaning only those series of the Trust which are involved in the Reorganizations as of the Closing Date(s).
ARTICLE II
VALUATION
2.1 VALUATION OF ASSETS. The value of an Acquired Fund’s net assets shall be the value of all such Acquired Fund’s assets as of the close of regular trading on the New York Stock Exchange (“NYSE”) on the business day immediately prior to its Closing Date (such time and date being hereinafter called the “Valuation Date”), less the amount of all such Acquired Fund’s liabilities. The value of an Acquired Fund’s assets shall be determined by using the valuation procedures set forth in the Trust’s Trust Instrument and its corresponding Acquiring Fund’s then current prospectus and statement of additional information or such other valuation procedures as shall be mutually agreed upon by the parties.
2.2 VALUATION OF SHARES. The net asset value per share of Acquiring Fund Shares shall be the net asset value per share computed on the Valuation Date, using the valuation procedures set forth in the Trust’s Trust Instrument and the corresponding Acquiring Fund’s then current prospectus and statement of additional information, or such other valuation procedures as shall be mutually agreed upon by the parties.
2.3 SHARES TO BE ISSUED. The number of Acquiring Fund Shares to be issued (including fractional shares, if any) in exchange for the corresponding Acquired Fund’s assets shall be determined by dividing such Acquired Fund’s net assets determined in accordance with
G-5
Section 2.1, by the Acquiring Fund’s net asset value per share determined in accordance with Section 2.2.
2.4 EFFECT OF SUSPENSION IN TRADING. In the event that on the Valuation Date, either: (a) the NYSE or another primary exchange on which the portfolio securities of the Acquiring Fund or its corresponding Acquired Fund are purchased or sold, shall be closed to trading or trading on such exchange shall be restricted; or (b) trading or the reporting of trading on the NYSE or elsewhere shall be disrupted so that accurate appraisal of the value of the net assets of the Acquiring Fund or its corresponding Acquired Fund is impracticable, the Valuation Date shall be postponed until the first business day after the day when trading is fully resumed and reporting is restored.
ARTICLE III
CLOSINGS AND CLOSING DATE
3.1 CLOSING DATE. Each Closing shall occur on March 30, 2010 or such other date(s) as the parties may agree (each a “Closing Date”). Unless otherwise provided, all acts taking place at the Closing(s) shall be deemed to take place as of immediately after the close of regular trading on the Valuation Date. Each Closing shall be held as of :00 a.m. Central time (the “Effective Time”) at the offices of , , or at such other time and/or place as the parties may agree.
3.2 CUSTODIAN’S CERTIFICATE. Each Acquired Fund shall cause PFPC Trust Company, as custodian for such Acquired Fund (the “Custodian”), to deliver to its corresponding Acquiring Fund at the Closing a certificate of an authorized officer stating that: (a) the Acquired Fund’s portfolio securities, cash, and any other assets shall have been delivered in proper form to its corresponding Acquiring Fund on the Closing Date; and (b) all necessary taxes including all applicable federal and state stock transfer stamps, if any, shall have been paid, or provision for payment shall have been made, in conjunction with the delivery of portfolio securities by the Acquired Fund.
3.3 TRANSFER AGENT’S CERTIFICATE. Each Acquired Fund shall cause PNC Global Investment Services (U.S.) Inc., as transfer agent
G-6
for such Acquired Fund, to deliver to its corresponding Acquiring Fund at the Closing a certificate of an authorized officer stating that its records contain the names and addresses of the Acquired Fund Shareholders, and the number and percentage ownership of outstanding shares owned by each such shareholder immediately prior to the Closing. Each Acquiring Fund shall issue and deliver or cause PNC Global Investment Services (U.S.) Inc., its transfer agent, to issue and deliver to its corresponding Acquired Fund a confirmation evidencing the Acquiring Fund Shares to be credited on the Closing Date to the Secretary of the Trust or provide evidence satisfactory to the Acquired Fund that such Acquiring Fund Shares have been credited to the Acquired Fund’s account on the books of the Acquiring Fund.
3.4 DELIVERY OF ADDITIONAL ITEMS. At the Closing, each party shall deliver to the other such bills of sale, checks, assignments, share certificates, receipts and other documents, if any, as such other party or its counsel may reasonably request to effect the transactions contemplated by this Agreement.
ARTICLE IV
REPRESENTATIONS AND WARRANTIES
4.1 REPRESENTATIONS OF THE ACQUIRED FUNDS. The Trust, on behalf of each Acquired Fund, represents and warrants to the corresponding Acquiring Fund as follows:
(a) The Trust is a statutory trust duly organized, validly existing and in good standing under the laws of the State of Delaware.
(b) The Acquired Fund is a separate series of the Trust duly authorized in accordance with the applicable provisions of the Trust’s Trust Instrument.
(c) The Trust is registered as an open-end management investment company under the 1940 Act, and such registration is in full force and effect.
G-7
(d) The Acquired Fund is not, and the execution, delivery, and performance of this Agreement (subject to shareholder approval) will not result, in the violation of any provision of the Trust’s Trust Instrument or By-Laws or of any material agreement, indenture, instrument, contract, lease, or other undertaking to which the Acquired Fund is a party or by which it is bound.
(e) Except as otherwise disclosed in writing to and accepted by the Acquiring Fund, the Acquired Fund has no material contracts or other commitments that will be terminated with liability to it before the Closing Date.
(f) No litigation, administrative proceeding, or investigation of or before any court or governmental body is presently pending or to its knowledge threatened against the Acquired Fund or any of its properties or assets, which, if adversely determined, would materially and adversely affect its financial condition, the conduct of its business, or the ability of the Acquired Fund to carry out the transactions contemplated by this Agreement. The Acquired Fund knows of no facts that might form the basis for the institution of such proceedings and is not a party to or subject to the provisions of any order, decree, or judgment of any court or governmental body that materially and adversely affects its business or its ability to consummate the transactions herein contemplated.
(g) The audited financial statements of the Acquired Fund as of October 31, 2009, and for the year then ended, have been prepared in accordance with generally accepted accounting principles and have been audited by independent auditors, and such statements (copies of which have been furnished to the Acquiring Fund) fairly reflect the financial condition of the Acquired Fund as of October 31, 2009, and there are no known contingent liabilities of the Acquired Fund as of such date that are not disclosed in such statements.
(h) Since October 31, 2009, there have been no material adverse changes in the Acquired Fund’s financial condition, assets, liabilities or business (other than changes occurring in the ordinary course of business), and there are no known contingent liabilities of the Acquired Fund arising after such date. For the purposes of this subsection (h), a decline in the net asset value of the Acquired Fund shall not constitute a material adverse change.
G-8
(i) At the date hereof, all federal, state, local and other tax returns and reports of the Acquired Fund required by law to be filed by it (taking into account permitted extensions for filing) have been timely filed and are complete and correct in all material respects. All federal, state, local and other taxes of the Acquired Fund required to be paid (whether or not shown on any such return or report) have been paid, or provision shall have been made for the payment thereof, and any such unpaid taxes are properly reflected on the financial statements referred to in subsection (g) above. To the best of the Acquired Fund’s knowledge, no tax authority is currently auditing or preparing to audit the Acquired Fund, and no assessment for taxes, interest, additions to tax or penalties has been asserted against the Acquired Fund.
(j) All issued and outstanding shares of the Acquired Fund are duly and validly issued and outstanding, fully paid and non-assessable by the Acquired Fund. All the issued and outstanding shares of the Acquired Fund will, at the time of the Closing, be held by the persons and in the amounts set forth in the records of the Acquired Fund’s transfer agent as provided in Section 3.3. The Acquired Fund has no outstanding options, warrants or other rights to subscribe for or purchase any shares of the Acquired Fund and has no outstanding securities convertible into shares of the Acquired Fund.
(k) At the Closing Date, the Acquired Fund will have good and marketable title to the Acquired Fund’s assets to be transferred to the Acquiring Fund pursuant to Section 1.2, and full right, power and authority to sell, assign, transfer and deliver such assets, and the Acquiring Fund will acquire good and marketable title thereto, subject to no restrictions on the full transfer thereof, including such restrictions as might arise under the Securities Act of 1933, as amended (the “1933 Act”) and the 1940 Act, except those restrictions as to which the Acquiring Fund has received notice and necessary documentation at or prior to the Closing.
(l) The execution, delivery and performance of this Agreement have been duly authorized by all necessary action on the part of the Acquired Fund. Subject to approval by the Acquired Fund shareholders, this Agreement constitutes a valid and binding obligation of the Acquired Fund, enforceable in accordance with its terms, subject, as to enforcement, to bankruptcy, insolvency, reorganization, moratorium, and other laws relating to or affecting creditors’ rights and to general equity principles.
G-9
(m) The information to be furnished by the Acquired Fund for use in no-action letters, applications for orders, registration statements, proxy materials and other documents that may be necessary in connection with the transactions contemplated herein shall be accurate and complete in all material respects and shall comply in all material respects with federal securities and other laws and regulations.
(n) From the effective date of the Registration Statement (as defined in Section 5.7), through the time of the meeting of the Acquired Fund shareholders and on the Closing Date, any written information furnished by the Trust with respect to the Acquired Fund for use in the Proxy Materials (as defined in Section 5.7), or any other materials provided in connection with the Reorganization, does not and will not contain any untrue statement of a material fact or omit to state a material fact required to be stated or necessary to make the statements, in light of the circumstances under which such statements were made, not misleading.
(o) For each taxable year of its operation (including the taxable year ending on the Closing Date), the Acquired Fund has been treated as a separate corporation for federal income tax purposes pursuant to Section 851(g) of the Code, has met the requirements of Subchapter M of the Code for qualification as a regulated investment company and has elected to be treated as such, has been eligible to compute and has computed its federal income tax under Section 852 of the Code, and will have distributed on or prior to the Closing Date all its investment company taxable income (determined without regard to the deduction for dividends paid) and net capital gain (as such terms are defined in the Code) that has accrued or will accrue through the Closing Date.
4.2 REPRESENTATIONS OF THE ACQUIRING FUNDS. The Trust, on behalf of each Acquiring Fund, represents and warrants to its corresponding Acquired Fund as follows:
(a) The Trust is a statutory trust, duly organized, validly existing and in good standing under the laws of the State of Delaware.
(b) The Acquiring Fund is a separate series of the Trust duly authorized in accordance with the applicable provisions of the Trust’s Trust Instrument.
G-10
(c) The Trust is registered as an open-end management investment company under the 1940 Act, and such registration is in full force and effect.
(d) The Acquiring Fund is not, and the execution, delivery and performance of this Agreement will not result, in a violation of the Trust’s Trust Instrument or By-Laws or of any material agreement, indenture, instrument, contract, lease, or other undertaking to which the Acquiring Fund is a party or by which it is bound.
(e) No litigation, administrative proceeding or investigation of or before any court or governmental body is presently pending or to its knowledge threatened against the Acquiring Fund or any of its properties or assets, which, if adversely determined, would materially and adversely affect its financial condition, the conduct of its business or the ability of the Acquiring Fund to carry out the transactions contemplated by this Agreement. The Acquiring Fund knows of no facts that might form the basis for the institution of such proceedings, and it is not a party to or subject to the provisions of any order, decree, or judgment of any court or governmental body that materially and adversely affects its business or its ability to consummate the transaction herein contemplated.
(f) The audited financial statements of the Acquiring Fund as of October 31, 2009, and for the fiscal year then ended, have been prepared in accordance with generally accepted accounting principles and have been audited by independent auditors, and such statements (copies of which have been furnished to the Acquired Fund) fairly reflect the financial condition of the Acquiring Fund as of October 31, 2009, and there are no known contingent liabilities of the Acquiring Fund as of such date that are not disclosed in such statements.
(g) Since October 31, 2009, there have been no material adverse changes in the Acquiring Fund’s financial condition, assets, liabilities or business (other than changes occurring in the ordinary course of business), and there are no known contingent liabilities of the Acquiring Fund arising after such date. For the purposes of this subsection (g), a decline in the net asset value of the Acquiring Fund shall not constitute a material adverse change.
(h) At the date hereof, all federal, state, local and other tax returns and reports of the Acquiring Fund required by law to be filed by it (taking
G-11
into account permitted extensions for filing) have been timely filed and are complete and correct in all material respects. All federal, state, local and other taxes of the Acquiring Fund required to be paid (whether or not shown on any such return or report) have been paid or provision shall have been made for their payment, and any such unpaid taxes are properly reflected on the financial statements referred to in subsection (f) above. To the best of the Acquiring Fund’s knowledge, no tax authority is currently auditing or preparing to audit the Acquiring Fund, and no assessment for taxes, interest, additions to tax or penalties has been asserted against the Acquiring Fund.
(i) All issued and outstanding Acquiring Fund Shares are duly and validly issued and outstanding, fully paid and non-assessable by the Acquiring Fund. The Acquiring Fund has no outstanding options, warrants, or other rights to subscribe for or purchase shares of the Acquiring Fund, and there are no outstanding securities convertible into shares of the Acquiring Fund.
(j) The execution, delivery and performance of this Agreement have been duly authorized by all necessary action on the part of the Acquiring Fund, and this Agreement constitutes a valid and binding obligation of the Acquiring Fund, enforceable in accordance with its terms, subject, as to enforcement, to bankruptcy, insolvency, reorganization, moratorium, and other laws relating to or affecting creditors’ rights and to general equity principles.
(k) The Acquiring Fund Shares to be issued and delivered to the Acquired Fund for the account of the Acquired Fund Shareholders pursuant to the terms of this Agreement will, at the Closing Date, have been duly authorized. When so issued and delivered, such shares will be duly and validly issued shares of the Acquiring Fund and will be fully paid and non-assessable.
(l) The information to be furnished by the Acquiring Fund for use in no-action letters, applications for orders, registration statements, proxy materials and other documents that may be necessary in connection with the transactions contemplated herein shall be accurate and complete in all material respects and shall comply in all material respects with federal securities and other laws and regulations.
G-12
(m) From the effective date of the Registration Statement (as defined in Section 5.7), through the time of the meeting of the Acquired Fund shareholders and on the Closing Date, any written information furnished by the Trust with respect to the Acquiring Fund for use in the Proxy Materials (as defined in Section 5.7), or any other materials provided in connection with the Reorganization, does not and will not contain any untrue statement of a material fact or omit to state a material fact required to be stated or necessary to make the statements, in light of the circumstances under which such statements were made, not misleading.
(n) For each taxable year of its operation, the Acquiring Fund has been treated as a separate corporation for federal income tax purposes pursuant to Section 851(g) of the Code, has met the requirements of Subchapter M of the Code for qualification as a regulated investment company and has elected to be treated as such, has been eligible to compute and has computed its federal income tax under Section 852 of the Code and will be eligible to, and will, do so for the taxable year that includes the Closing Date.
(o) The Acquiring Fund agrees to use all reasonable efforts to obtain the approvals and authorizations required by the 1933 Act, the 1940 Act and any state securities laws as it may deem appropriate in order to continue its operations after the Closing Date.
ARTICLE V
COVENANTS OF ACQUIRING FUND AND ACQUIRED FUND WITH RESPECT TO THEIR
RESPECTIVE REORGANIZATION
5.1 OPERATION IN ORDINARY COURSE. Subject to Sections 1.2 and 8.5, each Acquiring Fund and each Acquired Fund will operate its respective business in the ordinary course between the date of this Agreement and the Closing Date, it being understood that such ordinary course of business will include customary dividends and distributions, any other distribution necessary or desirable to avoid federal income or excise taxes, and shareholder purchases and redemptions.
5.2 APPROVAL OF SHAREHOLDERS. The Trust will call a special meeting of shareholders of each Acquired Fund to consider and act
G-13
upon this Agreement (or transactions contemplated thereby) and to take all other appropriate action necessary to obtain approval of the transactions contemplated herein.
5.3 INVESTMENT REPRESENTATION. Each Acquired Fund covenants that the Acquiring Fund Shares to be issued pursuant to this Agreement are not being acquired for the purpose of making any distribution, other than in connection with the Reorganization and in accordance with the terms of this Agreement.
5.4 ADDITIONAL INFORMATION. Each Acquired Fund will assist its corresponding Acquiring Fund in obtaining such information as the Acquiring Fund reasonably requests concerning the beneficial ownership of the Acquired Fund’s shares.
5.5 FURTHER ACTION. Subject to the provisions of this Agreement, each Fund will take or cause to be taken all action and do or cause to be done, all things reasonably necessary, proper or advisable to consummate and make effective the transactions contemplated by this Agreement, including any actions required to be taken after the Closing Date.
5.6 STATEMENT OF EARNINGS AND PROFITS. As promptly as practicable, but in any case within 60 days after the Closing Date, each Acquired Fund shall furnish the corresponding Acquiring Fund, in such form as is reasonably satisfactory to the Acquiring Fund and which will be certified by the Trust’s Treasurer, a statement of the earnings and profits of the Acquired Fund for federal income tax purposes, as well as any net operating loss carryovers and capital loss carryovers, that will be carried over to the Acquiring Fund pursuant to Section 381 of the Code.
5.7 PREPARATION OF REGISTRATION STATEMENT AND PROXY MATERIALS. The Trust will prepare and file with the Commission a registration statement on Form N-14 relating to the Acquiring Fund Shares to be issued to the Acquired Fund Shareholders (the “Registration Statement”). The Registration Statement shall include a proxy statement and a prospectus of each Acquiring Fund relating to the transaction contemplated by this Agreement. The Registration Statement shall be in compliance with the 1933 Act, the Securities Exchange Act of 1934, as amended (the “1934 Act”), and the 1940 Act, as applicable. Each
G-14
party will provide the other party with the materials and information necessary to prepare the proxy statement and related materials (the “Proxy Materials”), for inclusion therein, in connection with each meeting of Acquired Fund shareholders to consider the approval of this Agreement and the transactions contemplated herein.
5.8 TAX STATUS OF REORGANIZATIONS. The intention of the parties is that each Reorganization will qualify as a reorganization within the meaning of Section 368(a) of the Code. None of the Acquired Funds, the Trust or the Acquiring Funds shall take any action, or cause any action to be taken (including, without limitation, the filing of any tax return), that is inconsistent with such treatment or results in the failure of the transaction to qualify as a reorganization within the meaning of Section 368(a) of the Code. At or prior to the Closing Date, the Acquired Funds, the Trust and the Acquiring Funds will take such action, or cause such action to be taken, as is reasonably necessary to enable counsel to render the tax opinion contemplated herein in section 8.8.
ARTICLE VI
CONDITION PRECEDENT TO OBLIGATIONS OF EACH ACQUIRED FUND
The obligations of each Acquired Fund to consummate the transactions provided for herein with respect to a Reorganization shall be subject to the following condition:
6.1 All representations, covenants and warranties of the corresponding Acquiring Fund contained in this Agreement shall be true and correct in all material respects as of the date hereof and as of the Closing Date, with the same force and effect as if made on and as of the Closing Date. The Acquiring Fund shall have delivered to its corresponding Acquired Fund a certificate executed in the Acquiring Fund’s name by the Trust’s President or Senior Vice President and its Treasurer, in form and substance satisfactory to the Acquired Fund and dated as of the Closing Date, to such effect and as to such other matters as the Acquired Fund shall reasonably request.
G-15
ARTICLE VII
CONDITIONS PRECEDENT TO OBLIGATIONS OF EACH ACQUIRING FUND
The obligations of each Acquiring Fund to consummate the transactions provided for herein with respect to a Reorganization shall be subject to the following conditions:
7.1 All representations, covenants and warranties of the corresponding Acquired Fund contained in this Agreement shall be true and correct in all material respects as of the date hereof and as of the Closing Date, with the same force and effect as if made on and as of the Closing Date. The Acquired Fund shall have delivered to its corresponding Acquiring Fund on the Closing Date a certificate executed in the Acquired Fund’s name by the Trust’s President or Senior Vice President and its Treasurer, in form and substance satisfactory to the Acquiring Fund and dated as of the Closing Date, to such effect and as to such other matters as the Acquiring Fund shall reasonably request.
7.2 The Acquired Fund shall have delivered to its corresponding Acquiring Fund a statement of the Acquired Fund’s assets and liabilities, together with a list of the Acquired Fund’s portfolio securities showing the tax basis of such securities by lot and the holding periods of such securities, as of the Closing Date, certified by the Treasurer of the Trust.
ARTICLE VIII
FURTHER CONDITIONS PRECEDENT WITH RESPECT TO EACH REORGANIZATION
The obligations of each Acquired Fund and its corresponding Acquiring Fund with respect to a Reorganization hereunder shall also be subject to the following:
8.1 This Agreement and the transactions contemplated herein, with respect to the Acquired Fund, shall have been approved by the requisite vote of the holders of the outstanding shares of such Acquired Fund in accordance with applicable law and the provisions of the Trust’s Trust
G-16
Instrument and By-Laws. Notwithstanding anything herein to the contrary, neither the Acquiring Fund nor the corresponding Acquired Fund may waive the conditions set forth in this Section 8.1.
8.2 On the Closing Date, the Commission shall not have issued an unfavorable report under Section 25(b) of the 1940 Act or instituted any proceeding seeking to enjoin the consummation of the transactions contemplated by this Agreement under Section 25(c) of the 1940 Act. Furthermore, no action, suit or other proceeding shall be threatened or pending before any court or governmental agency in which it is sought to restrain or prohibit, or obtain damages or other relief in connection with, this Agreement or the transactions contemplated herein.
8.3 All required consents of other parties and all other consents, orders and permits of federal, state and local regulatory authorities (including those of the Commission and of state securities authorities, including any necessary “no-action” positions and exemptive orders from such federal and state authorities) to permit consummation of the transactions contemplated herein shall have been obtained.
8.4 The Registration Statement shall have become effective under the 1933 Act, and no stop orders suspending the effectiveness thereof shall have been issued. To the best knowledge of the parties to this Agreement, no investigation or proceeding for that purpose shall have been instituted or be pending, threatened or contemplated under the 1933 Act.
8.5 The Acquired Fund shall have declared and paid a dividend or dividends which, together with all previous such dividends, shall have the effect of distributing to its shareholders all of such Acquired Fund’s investment company taxable income for all taxable periods ending on or before the Closing Date (computed without regard to any deduction for dividends paid), if any, plus the excess of its interest income excludible from gross income under Section 103(a) of the Code, if any, over its deductions disallowed under Sections 265 and 171(a)(2) of the Code for all taxable periods ending on or before the Closing Date and all of its net capital gains realized in all taxable periods ending on or before the Closing Date (after reduction for any available capital loss carry forward).
8.6 Each Fund shall have delivered to its corresponding Acquired Fund or Acquiring Fund on the Closing Date a certificate executed in its
G-17
name by the Trust’s President or Senior Vice President, in a form reasonably satisfactory to the corresponding Acquired Fund or Acquiring Fund and dated as of the Closing Date, to the effect that the representations and warranties of the Trust, on behalf of the Fund, made in this Agreement are true and correct on and as of the Closing Date and as to such other matters as the Fund shall reasonably request.
8.7 The Funds shall have received on the Closing Date an opinion from Vedder Price P.C., counsel to the Trust, dated as of the Closing Date, substantially to the effect that:
(a) Each Fund is a legally designated, separate series of the Trust, and the Trust is a statutory trust, validly existing under the laws of the State of Delaware, which, to such counsel’s knowledge, has the power to own all its properties and assets and to carry on its business as presently conducted.
(b) The Trust is registered as an investment company under the 1940 Act, and, to such counsel’s knowledge, such registration under the 1940 Act is in full force and effect.
(c) Assuming that each Acquiring Fund Shares have been issued in accordance with the terms of this Agreement, the Acquiring Fund Shares to be issued and delivered to the corresponding Acquired Fund on behalf of the Acquired Fund Shareholders, as provided by this Agreement, are duly authorized and upon such delivery will be legally issued and outstanding and fully paid and non-assessable, and no shareholder of the Acquiring Fund has any preemptive rights with respect to the Acquiring Fund Shares.
(d) The Registration Statement is effective, and to such counsel’s knowledge, no stop order under the 1933 Act pertaining thereto has been issued, and to the knowledge of such counsel, no consent, approval, authorization or order of any court or governmental authority of the United States or the State of Delaware is required for consummation by the Funds of the transactions contemplated herein, except as have been obtained.
(e) The execution and delivery of this Agreement did not, and the consummation of the transactions contemplated herein will not, result in a
G-18
violation of the Trust’s Trust Instrument (assuming approval of Acquired Fund shareholders has been obtained) or By-Laws or any provision of any material agreement, indenture, instrument, contract, lease or other undertaking (in each case known to such counsel) to which a Fund is a party or by which a Fund or any of its properties may be bound.
8.8 The Funds shall have received an opinion of Vedder Price P.C. addressed to each Acquiring Fund and its corresponding Acquired Fund substantially to the effect that with respect to each Reorganization for federal income tax purposes:
(a) The transfer of all the Acquired Fund’s assets to its corresponding Acquiring Fund in exchange solely for Acquiring Fund Shares and the assumption by the corresponding Acquiring Fund of all the liabilities of the Acquired Fund, followed by the pro rata distribution by the Acquired Fund of all the Acquiring Fund Shares received to the Acquired Fund Shareholders in complete liquidation of the Acquired Fund will constitute a “reorganization” within the meaning of Section 368(a) of the Code, and the Acquiring Fund and the Acquired Fund will each be a “party to a reorganization,” within the meaning of Section 368(b) of the Code, with respect to the Reorganization.
(b) No gain or loss will be recognized by the Acquiring Fund upon the receipt of all the assets of its corresponding Acquired Fund solely in exchange for Acquiring Fund Shares and the assumption by the Acquiring Fund of all the liabilities of the corresponding Acquired Fund.
(c) No gain or loss will be recognized by the Acquired Fund upon the transfer of all the Acquired Fund’s assets to its corresponding Acquiring Fund solely in exchange for Acquiring Fund Shares and the assumption by the corresponding Acquiring Fund of all the liabilities of the Acquired Fund or upon the distribution (whether actual or constructive) of Acquiring Fund Shares to the Acquired Fund Shareholders solely in exchange for such shareholders’ shares of the Acquired Fund.
(d) No gain or loss will be recognized by the Acquired Fund Shareholders upon the exchange of their Acquired Fund shares solely for Acquiring Fund Shares in the Reorganization.
(e) The aggregate basis of the Acquiring Fund Shares received by each Acquired Fund Shareholder pursuant to the Reorganization will be
G-19
the same as the aggregate basis of the Acquired Fund shares exchanged therefor by such shareholder. The holding period of the Acquiring Fund Shares received by each Acquired Fund Shareholder will include the period during which the Acquired Fund shares exchanged therefor were held by such shareholder, provided such Acquired Fund shares are held as capital assets at the time of the Reorganization.
(f) The basis of the Acquired Fund’s assets acquired by its corresponding Acquiring Fund will be the same as the basis of such assets to the Acquired Fund immediately before the Reorganization. The holding period of the assets of the Acquired Fund in the hands of the Acquiring Fund will include the period during which those assets were held by the Acquired Fund.
No opinion will be expressed as to (1) the effect of a Reorganization on (A) an Acquired Fund or an Acquiring Fund with respect to any asset as to which any unrealized gain or loss is required to be recognized for federal income tax purposes at the end of a taxable year (or on the termination or transfer thereof) under a mark-to-market system of accounting, (B) any Acquired Fund shareholder or any Acquiring Fund shareholder that is required to recognize unrealized gains and losses for federal income tax purposes under a mark-to-market system of accounting, or (C) an Acquired Fund or an Acquiring Fund with respect to any stock held in a passive foreign investment company as defined in Section 1297(a) of the Code or (2) any other federal tax issues (except those set forth above) and all state, local or foreign tax issues of any kind.
Such opinion shall be based on customary assumptions and such representations as Vedder Price P.C. may reasonably request of the Funds, and each Acquired Fund and each Acquiring Fund will cooperate to make and certify the accuracy of such representations. Notwithstanding anything herein to the contrary, neither an Acquiring Fund nor its corresponding Acquired Fund may waive the conditions set forth in this Section 8.8.
G-20
ARTICLE IX
EXPENSES
9.1 The Adviser will bear or cause its parent, Highbury Financial Inc., to bear, all expenses of the Funds in connection with the reorganizations related to the proxy solicitation, legal and other costs associated with the solicitation including special meetings of the board of trustees, preparation of a proxy statement/prospectus, printing and mailing costs. Each Fund will bear other expenses of the reorganizations, including legal and accounting fees and expenses, provided that the Adviser will reimburse the Funds for expenses in connection with the reorganizations, including legal and accounting expenses, to the extent that such expenses (i) cause total operating expenses of a Fund to exceed operating expense caps in effect for a Fund through February 28, 2011, or (ii) exceed one basis point (.01%) of average net assets if operating expense caps are not in effect for any Fund.
9.2 Each party represents and warrants to the other that there is no person or entity entitled to receive any broker’s fees or similar fees or commission payments in connection with the transactions provided for herein.
9.3 Notwithstanding the foregoing, expenses will in any event be paid by the party directly incurring such expenses if and to the extent that the payment by the other party of such expenses would result in the disqualification of an Acquired Fund or an Acquiring Fund, as the case may be, as a registered investment company within the meaning of Section 851 of the Code.
ARTICLE X
ENTIRE AGREEMENT; SURVIVAL OF WARRANTIES
10.1 The parties to each Reorganization agree that no party has made to the other parties any representation, warranty and/or covenant not set forth herein, and that this Agreement constitutes the entire agreement between and among the parties.
10.2 The representations, warranties, and covenants contained in this Agreement or in any document delivered pursuant to or in connection with this Agreement shall not survive the consummation of the transactions contemplated hereunder.
G-21
ARTICLE XI
TERMINATION
11.1 With respect to each Reorganization, this Agreement may be terminated by the mutual agreement of the parties to such Reorganization, and such termination may be effected by the Trust’s President without further action by the Board. This Agreement may be terminated with respect to one or both of the Reorganizations. In addition, either the Acquiring Fund with respect to its corresponding Acquired Fund or the Acquired Fund with respect to its corresponding Acquiring Fund may at its option terminate this Agreement with respect to its corresponding Reorganization at or before the Closing Date due to:
(a) a breach by any other party to such Reorganization of any representation, warranty, or agreement contained herein to be performed at or before the Closing Date, if not cured within 30 days;
(b) a condition precedent to the obligations of the terminating party that has not been met and it reasonably appears that it will not or cannot be met; or
(c) a determination by the Board that the consummation of the transactions contemplated herein with respect to a Reorganization is not in the best interests of an Acquiring Fund or Acquired Fund.
11.2 In the event of any such termination, in the absence of willful default, there shall be no liability for damages on the part of the Trust, the Trustees, the Acquiring Funds, the Acquired Funds, the Adviser, or the Trust’s or Adviser’s officers.
ARTICLE XII
AMENDMENTS
12.1 This Agreement may be amended, modified or supplemented in such manner as may be mutually agreed upon in writing by the officers of the Trust as specifically authorized by the Board of Trustees; provided, however, that following the meeting of the Acquired Fund shareholders called by each Acquired Fund pursuant to Section 5.2 of this Agreement,
G-22
no such amendment may have the effect of changing the provisions for determining the number of Acquiring Fund Shares to be issued to the Acquired Fund Shareholders under this Agreement to the detriment of such shareholders without their further approval.
ARTICLE XIII
HEADINGS; COUNTERPARTS; GOVERNING LAW; ASSIGNMENT;
LIMITATION OF LIABILITY
13.1 The article and section headings contained in this Agreement are for reference purposes only and shall not affect in any way the meaning or interpretation of this Agreement.
13.2 This Agreement may be executed in any number of counterparts, each of which shall be deemed an original.
13.3 This Agreement shall be governed by and construed in accordance with the laws of the State of Delaware.
13.4 This Agreement shall bind and inure to the benefit of the parties hereto and their respective successors and assigns, but, except as provided in this section, no assignment or transfer hereof or of any rights or obligations hereunder shall be made by any party without the written consent of the other parties. Nothing herein expressed or implied is intended or shall be construed to confer upon or give any person, firm or corporation, other than the parties hereto and their respective successors and assigns, any rights or remedies under or by reason of this Agreement.
13.5 It is expressly agreed that the obligations of each Fund hereunder shall not be binding upon any of the Trustees, shareholders, nominees, officers, agents or employees of the Trust personally, but shall bind only the trust property of the respective Fund, as provided in the Trust’s Trust Instrument. The execution and delivery of this Agreement have been authorized by the Trustees of the Trust on behalf of each Fund and signed by authorized officers of the Trust acting as such. Neither the authorization by such Trustees nor the execution and delivery by such officers shall be deemed to have been made by any of them individually or to impose any liability on any of them personally, but shall bind only the trust property of the respective Fund as provided in the Trust’s Trust Instrument.
G-23
IN WITNESS WHEREOF, the parties have duly executed this Agreement, all as of the date first written above.
| | |
| ASTON FUNDS on behalf of Aston/Montag & Caldwell Balanced Fund and Aston/Montag & Caldwell Growth Fund |
| |
| By: | | |
| Name: | | |
| Title: | | |
| | |
| ACKNOWLEDGED: |
| |
| By: | | |
| Name: | | |
| Title: | | |
| | |
| ASTON FUNDS on behalf of Aston Balanced Fund and Aston Growth Fund |
| |
| By: | | |
| Name: | | |
| Title: | | |
| | |
| ACKNOWLEDGED: |
| |
| By: | | |
| Name: | | |
| Title: | | |
G-24
| | |
| The undersigned is a party to this Agreement for the purposes of Section 9.1 only: |
|
| ASTON ASSET MANAGEMENT LLC |
| |
| By: | | |
| Name: | | |
| Title: | | |
| | |
| ACKNOWLEDGED: |
| |
| By: | | |
| Name: | | |
| Title: | | |
G-25
Schedule A to the Agreement and Plan of Reorganization
SUMMARY OF THE REORGANIZATIONS
(shareholders of each Acquired Fund will receive shares
of the Acquiring Fund as designated below)
| | |
Acquired Fund | | Acquiring Fund |
| Aston Balanced Fund | | Aston/Montag & Caldwell Balanced Fund |
| |
| Aston Growth Fund | | Aston/Montag & Caldwell Growth Fund |
YOUR VOTE IS VERY IMPORTANT!
PLEASE SIGN, DATE AND RETURN THIS
PROXY CARD IN THE
ENCLOSED ENVELOPE TODAY.
| | |
| | Your Proxy Vote is important! |
| |
| | And now you can Vote your Proxy on the PHONE or the INTERNET. |
| |
| | It saves Money! Telephone and Internet voting saves postage costs. These savings can help minimize fund expenses. |
| |
| | It saves Time! Telephone and Internet voting is instantaneous – 24 hours a day. |
| |
| | It’s Easy! Just follow these simple steps: |
| |
| | 1. Read your proxy statement and have it at hand. |
| |
| | 2. Call toll-free 1-866-241-6192 or go to website: www.proxy-direct.com |
| |
| | 3. Enter the 14-digit number located in the shaded box from your Proxy Card. |
| |
| | 4. Follow the recorded or on-screen directions. |
| |
| | 5. Do not mail your Proxy Card when you vote by phone or Internet. |
Please detach at perforation before mailing.
ASTON [GROWTH/BALANCED] FUND
PROXY FOR SPECIAL MEETING OF SHAREHOLDERS TO BE HELD ON FEBRUARY , 2010
This Proxy is solicited on behalf of the Board of Trustees of Aston Funds
The undersigned hereby appoints Teresa Hamlin and Emily Harris, and each of them, as proxies, with the power to appoint her substitute, and hereby authorizes them to represent and to vote all shares of Aston [Growth/Balanced] Fund (the “Fund”) held of record by the undersigned on , 2010, at the Special Meeting of Shareholders to be held on , 2010 at :00 . . Eastern time, and any postponement or adjournments thereof.
By signing and dating the lower portion of this card, you authorize the proxies to vote each proposal as marked, or if not marked, to vote “FOR” the proposal, and to use their discretion to vote any other matter as may properly come before the meeting. If you do not intend to personally attend the meeting, please complete and mail this card at once in the enclosed envelope. The undersigned hereby revokes any proxy previously given. Receipt of the Notice of Special Meeting of Shareholders and Proxy Statement/Prospectus is hereby acknowledged.
This proxy when properly executed will be voted in the manner directed herein by the undersigned shareholder(s). IF NO DIRECTION IS MADE WITH RESPECT TO A PROPOSAL, THIS PROXY WILL BE VOTED “FOR” THE PROPOSAL.
| | | | |
VOTE VIA THE INTERNET: www.proxy-direct.com VOTE VIA THE TELEPHONE: 1-866-241-6192 |
| | | |
| | | | | |
|
| NOTE: Please sign name or names as printed on the proxy to authorize the voting of your shares as indicated. Where shares are registered with joint owners, all joint owners should sign. Persons signing as executors, administrators, trustees, etc. should so indicate. |
|
|
| Signature | | | | |
|
|
| Signature (if held jointly) |
|
|
| Date | | | | [Code] |
YOUR VOTE IS VERY IMPORTANT!
PLEASE SIGN, DATE AND RETURN THIS
PROXY CARD IN THE
ENCLOSED ENVELOPE TODAY.
Please detach at perforation before mailing.
In their discretion, the proxies are authorized to vote upon such other business as may properly come before the Special Meeting.
The Board of Trustees of Aston Funds (the “Trust”) recommends that you vote “FOR” each proposal. Properly executed proxies will be voted as specified. If no specification is made with respect to a proposal, such shares will be voted “FOR” the proposal.
Please fill in box(es) as shown using black or blue ink or number 2 pencil. x
PLEASE DO NOT USE FINE POINT PENS.
| | | | | | | | | | | | |
| | | | FOR | | AGAINST | | ABSTAIN |
| | | | |
| 1. | | To approve a new Investment Advisory Agreement between the Trust, on behalf of the Fund, and Aston Asset Management, LP. | | ¨ | | ¨ | | ¨ |
| | | | |
| | | | FOR | | AGAINST | | ABSTAIN |
| | | | |
| 2. | | To approve an amendment to the By-Laws of the Trust, as amended. | | ¨ | | ¨ | | ¨ |
| | | | |
| 3. | | To elect ten trustees to the Board of Trustees of the Trust. | | FOR ALL NOMINEES | | WITHHOLD FROM ALL NOMINEES | | FOR ALL EXCEPT as indicated at left |
| | | | | | |
| | (01) Stuart D. Bilton | | (05) Jack W. Aber | | (09) Eric Rakowski | | | | | | |
| | (02) Jeffrey S. Murphy | | (06) William E. Chapman II | | (10) Thomas R. Schneeweis | | | | | | |
| | (03) Gregory T. Mutz | | (07) Edward J. Kaier | | | | | | | | |
| | (04) Robert B. Scherer | | (08) Steven J. Paggioli | | | | ¨ | | ¨ | | ¨ |
| | | | |
| | (Instruction: To withhold authority to vote for any individual nominee(s), write the number(s) of the nominee(s) on the line below.) | | | | | | |
| | | | |
| | | | FOR | | AGAINST | | ABSTAIN |
| | | | |
| 4. | | To approve a proposed reorganization of the Fund into Aston/Montag & Caldwell [Growth/Balanced] Fund. | | ¨ | | ¨ | | ¨ |
| | | | | |
| | | | | | PLEASE SIGN AND DATE THE REVERSE SIDE [Code] | | | | |
[LOGO]
Aston Funds
Class N Shares
Prospectus
March 1, 2009
[LOGO]
NOT FDIC INSURED. NO BANK GUARANTEE. MAY LOSE VALUE.
The Securities and Exchange Commission has not approved or disapproved these or
any mutual fund's shares or determined if this prospectus is accurate or
complete. Any representation to the contrary is a crime.
[ASTON FUNDS LOGO]
EQUITY FUNDS TICKER SYMBOL
Large Cap
Aston/Montag & Caldwell Growth Fund MCGFX
Aston/Veredus Select Growth Fund AVSGX
Aston Growth Fund CHTIX
Aston/Optimum Large Cap Opportunity Fund AOLCX
Aston Value Fund RVALX
Multi Cap
Aston/TAMRO All Cap Fund ATLVX
Aston/River Road Dividend All Cap Value Fund ARDEX
Mid Cap
Aston/Optimum Mid Cap Fund CHTTX
Aston/Montag & Caldwell Mid Cap Growth Fund AMCMX
Aston/Cardinal Mid Cap Value Fund ACDMX
Small-Mid Cap
Aston/River Road Small-Mid Cap Fund ARSMX
Small Cap
Aston/Veredus Aggressive Growth Fund VERDX
Aston/TAMRO Small Cap Fund ATASX
Aston/River Road Small Cap Value Fund ARSVX
GLOBAL/INTERNATIONAL FUNDS
Aston/Neptune International Fund ANINX
Aston/Fortis Global Real Estate Fund AGRNX
ALTERNATIVE FUNDS
Aston/Smart Portfolios Fund ASENX
Aston/New Century Absolute Return ETF Fund ANENX
Aston/MB Enhanced Equity Income Fund AMBEX
SECTOR FUND
Aston/Fortis Real Estate Fund ARFCX
BALANCED FUNDS
Aston/Montag & Caldwell Balanced Fund MOBAX
Aston Balanced Fund CHTAX
FIXED INCOME FUND
Aston/TCH Fixed Income Fund CHTBX
MONEY MARKET FUND
Aston/Fortis Investor Money Market Fund CITXX
[ASTON FUNDS LOGO]
Thank you for your interest in Aston Funds. Our diversified family of
funds offers you a variety of investment opportunities to help you build
wealth and meet financial goals such as retirement, home buying or
education funding. This prospectus pertains only to the Class N shares of
the listed Aston Funds. Please read this prospectus carefully and keep it
for future reference.
For a list of terms with definitions that you may find helpful as you read
this prospectus, please refer to the "Investment Terms" Section.
Mutual fund shares are not bank deposits and are not guaranteed, endorsed
or insured by any financial institution, government entity or the Federal
Deposit Insurance Corporation (FDIC).
TABLE OF CONTENTS
Page
CATEGORIES OF ASTON FUNDS 3
FUND SUMMARIES 4
Investment Summaries 4
EQUITY FUNDS
Large Cap
Aston/Montag & Caldwell Growth Fund 4
Aston/Veredus Select Growth Fund 4
Aston Growth Fund 4
Aston/Optimum Large Cap Opportunity Fund 5
Aston Value Fund 5
Multi Cap
Aston/TAMRO All Cap Fund 6
Aston/River Road Dividend All Cap Value Fund 6
Mid Cap
Aston/Optimum Mid Cap Fund 7
Aston/Montag & Caldwell Mid Cap Growth Fund 7
Aston/Cardinal Mid Cap Value Fund 7
Small-Mid Cap
Aston/River Road Small-Mid Cap Fund 8
Small Cap
Aston/Veredus Aggressive Growth Fund 8
Aston/TAMRO Small Cap Fund 9
Aston/River Road Small Cap Value Fund 9
GLOBAL/INTERNATIONAL FUNDS
Aston/Neptune International Fund 10
Aston/Fortis Global Real Estate Fund 10
ALTERNATIVE FUNDS
Aston/Smart Portfolios Fund 11
Aston/New Century Absolute Return ETF Fund 11
Aston/MB Enhanced Equity Income Fund 12
SECTOR FUND
Aston/Fortis Real Estate Fund 13
BALANCED FUNDS
Aston/Montag & Caldwell Balanced Fund 13
Aston Balanced Fund 14
FIXED INCOME FUND
Aston/TCH Fixed Income Fund 15
MONEY MARKET FUND
Aston/Fortis Investor Money Market Fund 15
Principal Investment Risks 17
Fund Performance 22
Fund Expenses 34
Additional Information Regarding Investment
Strategies 37
PORTFOLIO HOLDINGS 41
INVESTMENT TERMS 42
MANAGEMENT OF THE FUNDS 45
The Investment Advisers 45
The Subadvisers 45
Portfolio Managers 47
Management Fees 55
SHAREHOLDER INFORMATION 58
Opening an Account: Buying Shares 58
Exchanging Shares 60
Selling/Redeeming Shares 61
Transaction Policies 64
Account Policies and Dividends 67
Additional Investor Services 67
Distribution Plan 12b-1 Fees 68
Portfolio Transactions and Brokerage
Commissions 68
DIVIDENDS, DISTRIBUTIONS AND TAXES 69
FINANCIAL HIGHLIGHTS 70
GENERAL INFORMATION 94
(This page intentionally left blank)
Categories of Aston Funds
Aston Funds (the "Trust") is an open-end management investment company that
currently offers 29 separate investment portfolios, including equity,
global/international, alternative, sector, balanced, fixed income and money
market funds. Class N shares of 24 of the portfolios (the "Funds") are offered
in this prospectus; other funds and classes are offered under separate
prospectuses.
Aston Asset Management LLC ("Aston" or "Adviser") is the investment adviser,
administrator and sponsor of the Funds, except for the Aston/Fortis Investor
Money Market Fund of which Aston is not the investment adviser. Aston manages
each Fund (except Aston/Fortis Investor Money Market Fund) by retaining one or
more subadvisers ("Subadvisers") to manage each Fund. Fortis Investment
Management USA, Inc. ("FIM") serves as investment adviser to the Aston/Fortis
Investor Money Market Fund.
EQUITY FUNDS
EQUITY FUNDS invest principally in stocks and other equity securities. Equity
funds may have greater total return potential than non-equity funds, but they
also have greater risk.
GLOBAL/INTERNATIONAL FUNDS
GLOBAL AND INTERNATIONAL FUNDS invest principally in stocks and other securities
issued by foreign companies throughout the world. Global and international funds
invest in foreign securities that are subject to currency, regulatory,
information and political risks.
ALTERNATIVE FUNDS
ALTERNATIVE FUNDS invest principally in stocks or other securities that seek or
follow nontraditional strategies. Alternative funds may have greater total
return potential than traditional funds, but they also could have greater risk.
SECTOR FUNDS
SECTOR FUNDS invest principally in stocks and other securities of issuers that
operate in a particular industry or sector of the economy. Because the holdings
of this type of fund focus on one or more related industries or sectors, the
share price of a sector fund may be more volatile than a fund with more
diversified holdings.
BALANCED FUNDS
BALANCED FUNDS invest in a mix of stocks and fixed income securities and combine
the benefits of both types of securities - capital appreciation or growth from
stocks and income from fixed income securities. Like most other mutual funds,
the share price of a balanced fund moves up and down in response to changes in
the stock market and interest rates.
FIXED INCOME FUNDS
FIXED INCOME FUNDS invest in corporate and government bonds and other fixed
income securities. These funds provide regular income.
MONEY MARKET FUNDS
MONEY MARKET FUNDS invest in short-term, high quality money market securities.
They provide stable principal and regular income. The income provided by a money
market fund varies with interest rate movements.
No single fund is intended to be a complete investment program, but
individual funds can be an important part of a balanced and diversified
investment program. Mutual funds have the following general risks:
- the value of fund shares will fluctuate
- you could lose money
- you cannot be certain that a fund will achieve its investment objective
3
Investment Summaries
EQUITY FUNDS
LARGE CAP
ASTON/MONTAG & CALDWELL GROWTH FUND
INVESTMENT OBJECTIVE
The Fund seeks long-term capital appreciation and, secondarily, current income,
by investing primarily in common stocks and convertible securities.
PRINCIPAL INVESTMENT STRATEGIES
The Fund invests primarily in common stocks and convertible securities. The
portfolio manager uses a bottom-up approach to stock selection and seeks high
quality, well-established large-cap companies that the portfolio manager
believes are growing their near-term earnings at an above average rate. The
portfolio manager emphasizes valuation to find companies selling at a discount
to their intrinsic value. These companies must pass an initial capitalization
screen and:
- have a strong history of earnings growth
- are attractively priced, relative to the company's potential for above average
long-term earnings and revenue growth
- have strong balance sheets
- have a sustainable competitive advantage
- are currently, or have the potential to become, industry leaders
- have the potential to outperform during market downturns
The Fund may invest in foreign securities (directly and through depositary
receipts).
To manage risk, the portfolio manager limits sector and individual security
exposure, and adheres to a strong sell discipline.
PRINCIPAL RISKS OF INVESTING IN THIS FUND
You could lose money by investing in the Fund. There can be no assurance that
the Fund's investment objective will be achieved.
RISKS. These principal investment risks apply to the Fund: foreign securities,
growth style, liquidity, manager and market risks. See the next Section,
"Principal Investment Risks," for a more detailed discussion of these risks and
other principal risks common to all Funds.
ASTON/VEREDUS SELECT GROWTH FUND
INVESTMENT OBJECTIVE
The Fund seeks to provide capital appreciation.
PRINCIPAL INVESTMENT STRATEGIES
The Fund invests primarily in growth stocks of mid-cap and large-cap companies
whose earnings are growing, or are expected to grow, at an accelerating rate.
The Fund defines a mid-cap company as one having a market capitalization of
between approximately $2.5 and $9 billion at the time of acquisition. The
portfolio managers define a large-cap company as one having a market
capitalization of approximately $9 billion or more at the time of acquisition.
The portfolio managers look for inefficiencies in the market caused by
inaccurate expectations (e.g., positive earnings surprises, estimate revisions).
The focus is on companies that have:
- expanding unit volume growth
- expanding profit margin potential
- high or improving cash flow return on investment
- large markets with high barriers to entry
The Fund may invest in ETFs and foreign securities (directly and through
depositary receipts).
To help manage risk, the portfolio managers adhere to a strong sell discipline.
In the course of implementing its principal investment strategies, the Fund will
likely experience a high annual turnover rate (350% or more).
PRINCIPAL RISKS OF INVESTING IN THIS FUND
You could lose money by investing in the Fund. There can be no assurance that
the Fund's investment objective will be achieved.
RISKS. These principal investment risks apply to the Fund: foreign securities,
growth style, liquidity, manager, market, mid-cap company and portfolio turnover
risks. See the next Section, "Principal Investment Risks," for a more detailed
discussion of these risks and other principal risks common to all Funds.
ASTON GROWTH FUND
(Formerly Aston/ABN AMRO Growth Fund)
INVESTMENT OBJECTIVE
The Fund seeks long-term total return through a combination of capital
appreciation and current income by investing primarily in a combination of
stocks and bonds.
4
PRINCIPAL INVESTMENT STRATEGIES
The Fund invests primarily in common stocks and convertible securities. The
portfolio manager uses a bottom-up approach to stock selection and seeks high
quality, well-established large-cap companies that the portfolio manager
believes are growing their near-term earnings at an above average rate. The
portfolio manager emphasizes valuation to find companies selling at a discount
to their intrinsic value. These companies must pass an initial capitalization
screen and:
- have a strong history of earnings growth
- are attractively priced, relative to the company's potential for above average
long-term earnings and revenue growth
- have strong balance sheets
- have a sustainable competitive advantage
- are currently, or have the potential to become, industry leaders
- have the potential to outperform during market downturns
The Fund may invest in foreign securities (directly and through depositary
receipts).
To manage risk, the portfolio manager limits sector and individual security
exposure, and adheres to a strong sell discipline.
PRINCIPAL RISKS OF INVESTING IN THIS FUND
You could lose money by investing in this Fund. There can be no assurance that
the Fund's investment objective will be achieved.
RISKS. These principal investment risks apply to the Fund: foreign securities,
growth style, liquidity, manager and market risks. See the next
Section,"Principal Investment Risks," for a more detailed discussion of these
risks and other principal risks common to all Funds.
ASTON/OPTIMUM LARGE CAP OPPORTUNITY FUND
INVESTMENT OBJECTIVE
The Fund seeks to provide long-term capital appreciation.
PRINCIPAL INVESTMENT STRATEGIES
Under normal conditions, the Fund invests at least 80% of its assets in stocks
of large-cap companies that offer growth potential at a reasonable price. The
Fund pursues its objective by investing primarily in common stocks selected for
their capital appreciation potential. The Fund defines a large-cap company as an
established, better-known company having a market capitalization of $7 billion
or more.
The portfolio managers employ a GARP strategy to build a portfolio primarily of
common stocks. GARP investing involves buying stocks that have a reasonable
price/earnings ratio in relationship to a company's earnings growth rate. Growth
stocks will generally have higher valuations (e.g. price-to-earnings ratios)
than value stocks. Security selection is based on the following top-down and
bottom-up criteria:
Top-down -- Strategic Analysis:
- economic and investment outlook
- theme assessment
- diversification (sector and industry weightings)
Bottom-up -- Stock Selection:
- quantitative screenings -- innovative industry leaders
- proprietary GARP Scoring Model
- fundamental research -- strong management, high profitability and earnings
growth, low leverage and price-to-growth ratio
The Fund may invest in foreign securities (directly and through depositary
receipts).
To manage risk, the portfolio managers employ a strategy of diversification
among sectors, and adhere to a strong sell discipline.
PRINCIPAL RISKS OF INVESTING IN THIS FUND
You could lose money by investing in the Fund. There can be no assurance that
the Fund's investment objective will be achieved.
RISKS. These principal investment risks apply to the Fund: foreign securities,
GARP style, liquidity, manager and market risks. See the next Section,
"Principal Investment Risks," for a more detailed discussion of these risks and
other principal risks common to all Funds.
ASTON VALUE FUND
INVESTMENT OBJECTIVE
The Fund seeks to provide total return through long-term capital appreciation
and current income.
PRINCIPAL INVESTMENT STRATEGIES
The Fund normally invests primarily in equity securities of companies that its
portfolio managers believe are undervalued compared to their perceived worth
(value companies). Value companies tend to have stock prices that are low
relative to their earnings, dividends, assets, or other financial measures.
While the Fund may invest its assets in companies of any size, the
portfolio managers generally focus on companies with large capitalizations.
The portfolio managers use a bottom-up investment approach in buying and selling
investments for the Fund. Investments are selected primarily based on
fundamental analysis of issuers and their potential in light of their current
financial condition and industry position, and market, economic, political, and
regulatory conditions. Factors considered may include analysis of:
- Earnings
- Cash flow
- Competitive position
- Management ability
Quantitative analysis of these and other factors may also be considered.
5
The Fund may also invest in REITS, convertible securities, preferred stocks and
foreign securities (directly and through depositary receipts).
To help manage risk, the portfolio managers generally limit position sizes,
diversify among sectors, and adhere to a strong sell discipline.
PRINCIPAL RISKS OF INVESTING IN THIS FUND
You could lose money by investing in the Fund. There can be no assurance that
the Fund's investment objective will be achieved.
RISKS. These principal investment risks apply to the Fund: foreign securities,
liquidity, manager, market, REIT and value style risks. See the next Section,
"Principal Investment Risks," for a more detailed discussion of these risks and
other principal risks common to all Funds.
MULTI CAP
ASTON/TAMRO ALL CAP FUND
INVESTMENT OBJECTIVE
The Fund seeks to provide long-term capital appreciation.
PRINCIPAL INVESTMENT STRATEGIES
The Fund invests in a diversified, multi-cap portfolio consisting primarily of
common stocks. The portfolio manager seeks opportunities across the growth/value
spectrum, resulting in what is generally considered a "core" portfolio.
The portfolio manager's investment process focuses on bottom-up stock selection
with the goal of identifying companies that possess a sustainable competitive
advantage combined with an attractive valuation. A sustainable competitive
advantage may be derived from a unique product or service offering, a capable
and proven management team, and sound financials.
Through the use of both qualitative and quantitative evaluation, the portfolio
manager seeks securities that meet the specific criteria of one of three
investment categories:
- Leaders (best of class)
- Laggards (companies undergoing a restructuring)
- Innovators (dedication to introducing new products or services)
The Fund may invest in REITs, foreign securities (directly and through
depositary receipts), convertible bonds and, to a limited extent, options may be
used for hedging or to seek total return. The Fund may invest in options on
securities and securities indices for hedging purposes or to seek capital
appreciation. For example, the portfolio manager may purchase call options on
securities he believes possess appreciation potential. Conversely, the portfolio
manager may sell covered call options on securities held in the portfolio. See
"Additional Information Regarding Investment Strategies."
To manage risk, the portfolio manager limits position sizes, diversifies across
both market sectors and capitalization, and adheres to a strong sell discipline.
PRINCIPAL RISKS OF INVESTING IN THIS FUND
You could lose money by investing in the Fund. There can be no assurance that
the Fund's investment objective will be achieved.
RISKS. These principal investment risks apply to the Fund: below investment
grade securities, credit, derivatives, foreign securities, growth style,
liquidity, manager, market, mid-cap company, REIT, small-cap company and value
style risks. See the next Section, "Principal Investment Risks," for a more
detailed discussion of these risks and other principal risks common to all
Funds.
ASTON/RIVER ROAD DIVIDEND ALL CAP VALUE FUND
(FORMERLY ASTON/RIVER ROAD DYNAMIC EQUITY INCOME FUND)
INVESTMENT OBJECTIVE
The Fund seeks to provide high current income and, secondarily, long-term
capital appreciation.
PRINCIPAL INVESTMENT STRATEGIES
Under normal conditions, the Fund invests at least 80% of its assets in equity
securities. The Fund invests in a diversified, all-cap portfolio of income-
producing equity securities with yields that the portfolio managers believe will
exceed the Russell 3000 Value Index. The Fund invests primarily in dividend
paying common and convertible preferred stocks and REITs. The Fund may also
invest in foreign securities (directly and through depositary receipts), closed-
end funds or other investment companies, publicly traded partnerships and
royalty income trusts. Using systematic and dynamic internal research through
multiple sources, the portfolio managers narrow the field of companies into a
more refined working universe. The portfolio managers then employ a value-
driven, bottom-up approach that seeks to identify companies that they believe
have the following characteristics:
- high, growing dividend yield
- financial strength
- priced at a discount to absolute value
- attractive business model
- shareholder-oriented management
- undiscovered, underfollowed, misunderstood companies
To manage risk, the portfolio managers employ a structured sell discipline and a
strategy of diversification across market sectors, capitalization size,
sovereignty and security type.
6
PRINCIPAL RISKS OF INVESTING IN THIS FUND
You could lose money by investing in the Fund. There can be no assurance that
the Fund's investment objective will be achieved.
RISKS. These principal investment risks apply to the Fund: foreign securities,
liquidity, manager, market, mid-cap company, REIT, small-cap company and value
style risks. See the next Section, "Principal Investment Risks," for a more
detailed discussion of these risks and other principal risks common to all
Funds.
MID CAP
ASTON/OPTIMUM MID CAP FUND
INVESTMENT OBJECTIVE
The Fund seeks long-term total return through capital appreciation by investing
primarily in common and preferred stocks and convertible securities.
PRINCIPAL INVESTMENT STRATEGIES
Under normal conditions, the Fund invests at least 80% of its assets in mid-cap
stocks of companies with an improving revenue and earnings growth outlook. The
Fund defines a mid-cap company as one having a market capitalization of between
$1 and $12 billion at the time of acquisition. The portfolio manager selects
approximately 40 stocks based on bottom-up fundamental analysis.
Important investment criteria include:
- market share growth
- attractive valuation
- low relative leverage
- focused business franchise
- experienced management
- strong or improving financials
The portfolio manager takes a long-term approach with a focus on maximizing
after-tax returns.
The Fund may invest in foreign securities (directly and through depositary
receipts).
To manage risk, the portfolio manager employs a valuation discipline to limit
downside risk, limits position sizes and sector exposure, and adheres to a
strong sell discipline.
PRINCIPAL RISKS OF INVESTING IN THIS FUND
You could lose money by investing in the Fund. There can be no assurance that
the Fund's investment objective will be achieved.
RISKS. These principal investment risks apply to the Fund: foreign securities,
growth style, liquidity, manager, market, mid-cap company, small-cap company and
value style risks. See the next Section, "Principal Investment Risks," for a
more detailed discussion of these risks and other principal risks common to all
Funds.
ASTON/MONTAG & CALDWELL MID CAP GROWTH FUND
INVESTMENT OBJECTIVE
The Fund seeks to provide long-term capital appreciation and, secondarily,
current income, by investing primarily in common stocks and convertible
securities.
PRINCIPAL INVESTMENT STRATEGIES
The Fund invests primarily in common stocks and convertible securities. Under
normal circumstances, the Fund invests at least 80% of its assets in securities
of mid-cap companies. The Fund defines a mid-cap company as one having a market
capitalization, at the time of acquisition, of between $2.5 billion and $10
billion.
The portfolio managers use a bottom-up approach to stock selection and seek high
quality, well-established mid-cap companies that:
- offer a compelling combination of earnings growth and attractive value
- sell at a discount to intrinsic value
- exhibit above-median near-term relative earnings strength
- are leading franchises and have proven management teams, strong finances and
attractive long-term secular growth characteristics
The Fund may invest in foreign securities (directly and through depositary
receipts).
To help manage risk, the portfolio managers adhere to a strong sell discipline.
PRINCIPAL RISKS OF INVESTING IN THIS FUND
You could lose money by investing in the Fund. There can be no assurance that
the Fund's investment objective will be achieved.
RISKS. These principal investment risks apply to the Fund: foreign securities,
growth style, liquidity, manager, market and mid-cap company risks. See the next
Section, "Principal Investment Risks," for a more detailed discussion of these
risks and other principal risks common to all Funds.
ASTON/CARDINAL MID CAP VALUE FUND
INVESTMENT OBJECTIVE
The Fund seeks to provide a high level of total return.
PRINCIPAL INVESTMENT STRATEGIES
Under normal conditions, the Fund invests at least 80% of its assets in common
stocks and other equity securities of mid-cap companies. The Fund defines a mid-
cap company as one having a market capitalization, at the time of acquisition,
within the range of market capitalizations of companies constituting the Russell
Midcap(R) Value Index.
7
The portfolio managers use a value investment strategy based on proprietary
fundamental research. Value investing involves buying stocks that are out of
favor or undervalued relative to their peers. The portfolio managers emphasize
companies with the ability to generate free cash flow and to redeploy such cash
to enhance value. The portfolio managers also look for the following
characteristics:
- Stable and predictable business model
- Motivated and competent management
- Unduly depressed valuation
- Catalyst for positive market reevaluation
The Fund may also invest in foreign securities (through depositary receipts).
To manage risk, the portfolio managers adhere to a strong buy, hold and sell
discipline.
PRINCIPAL RISKS OF INVESTING IN THIS FUND
You could lose money by investing in the Fund. There can be no assurance that
the Fund's investment objective will be achieved.
RISKS. These principal investment risks apply to the Fund: foreign securities,
liquidity, manager, market, mid-cap company and value style risks. See the next
Section, "Principal Investment Risks," for a more detailed discussion of these
risks and other principal risks common to all Funds.
SMALL-MID CAP
ASTON/RIVER ROAD SMALL-MID CAP FUND
INVESTMENT OBJECTIVE
The Fund seeks to provide long-term capital appreciation.
PRINCIPAL INVESTMENT STRATEGIES
Under normal conditions, the Fund invests at least 80% of its assets in common
stocks and other equity securities of small- and mid-cap companies with market
capitalizations of less than $6 billion at the time of acquisition that the
portfolio managers believe are undervalued. Value investing involves buying
stocks that are out of favor and/or undervalued in comparison to their peers or
their prospects for growth. The Fund may also invest in common stock of
companies with market capitalizations that exceed $6 billion, REITs, convertible
securities and foreign securities (directly and through depositary receipts).
Using systematic and dynamic internal research, the portfolio managers narrow
the field of small- and mid-cap companies into a more refined working universe.
The portfolio managers then employ a value-driven, bottom-up fundamental
approach that seeks to identify the following characteristics:
- priced at a discount to absolute value
- attractive business model
- shareholder-oriented management
- financial strength
- undiscovered, underfollowed or misunderstood companies
To manage risk, the portfolio managers employ a strategy of diversification, and
adhere to a structured sell discipline.
PRINCIPAL RISKS OF INVESTING IN THIS FUND
You could lose money by investing in the Fund. There can be no assurance that
the Fund's investment objective will be achieved.
RISKS. These principal investment risks apply to the Fund: foreign securities,
liquidity, manager, market, mid-cap company, REIT, small-cap company and value
style risks. See the next Section, "Principal Investment Risks," for a more
detailed discussion of these and other principal risks common to all Funds.
SMALL CAP
ASTON/VEREDUS AGGRESSIVE GROWTH FUND
INVESTMENT OBJECTIVE
The Fund seeks to provide capital appreciation.
PRINCIPAL INVESTMENT STRATEGIES
The Fund invests primarily in growth stocks of small-cap companies whose
earnings are growing, or are expected to grow, at an accelerating rate. The Fund
defines a small-cap company as one having a market capitalization of less than
$2.5 billion at the time of acquisition. The portfolio managers look for
inefficiencies in the market caused by inaccurate expectations (e.g., positive
earnings surprises, estimate revisions). The focus is on companies that have:
- expanding unit volume growth
- expanding profit margin potential
- high or improving cash flow return on investment
- large markets with high barriers to entry
The Fund may also invest in equity securities of mid-cap companies. The
portfolio managers define a mid-cap company as one having a market
capitalization of between approximately $2.5 to $9 billion at the time of
acquisition.
The Fund may also invest in ETFs and foreign securities (directly and through
depositary receipts).
To help manage risk, the portfolio managers adhere to a strong sell discipline.
In the course of implementing its principal investment strategies, the Fund will
likely experience a high annual turnover rate (200% or more).
8
The Fund has entered into a program with ReFlow Fund LLC to provide cash
liquidity for redemptions under certain circumstances. The program is described
in the Funds' statement of additional information ("SAI").
PRINCIPAL RISKS OF INVESTING IN THIS FUND
You could lose money by investing in the Fund. There can be no assurance that
the Fund's investment objective will be achieved.
RISKS. These principal investment risks apply to the Fund: foreign securities,
growth style, liquidity, manager, market, mid-cap company, portfolio turnover
and small-cap company risks. See the next Section, "Principal Investment Risks,"
for a more detailed discussion of these risks and other principal risks common
to all Funds.
ASTON/TAMRO SMALL CAP FUND
INVESTMENT OBJECTIVE
The Fund seeks to provide long-term capital appreciation.
PRINCIPAL INVESTMENT STRATEGIES
Under normal market conditions, the Fund invests at least 80% of its assets in a
blended portfolio of growth and value stocks of small-cap companies. The Fund
considers companies with market capitalizations of up to $2.75 billion, at the
time of acquisition to be small-cap companies. The portfolio manager seeks
opportunities across the growth/value spectrum, resulting in what is generally
considered a "core" portfolio.
The portfolio manager's investment process focuses on bottom-up stock selection
with the goal of identifying companies that possess a sustainable competitive
advantage combined with an attractive valuation. A sustainable competitive
advantage may be derived from a unique product or service offering, a capable
and proven management team, and sound financials.
Through the use of both qualitative and quantitative evaluation, the portfolio
manager seeks securities that meet the specific criteria of one of three
investment categories:
- Leaders (best of class)
- Laggards (companies undergoing a restructuring)
- Innovators (dedication to introducing new products or services)
The Fund may also invest in REITs, foreign securities (directly and through
depositary receipts), convertible bonds, securities outside the small-cap range
and cash-equivalent securities.
To manage risk, the portfolio manager limits position sizes, diversifies across
market sectors and adheres to a strong sell discipline.
PRINCIPAL RISKS OF INVESTING IN THIS FUND
You could lose money by investing in the Fund. There can be no assurance that
the Fund's investment objective will be achieved.
RISKS. These principal investment risks apply to the Fund: below investment
grade (high yield) securities, credit, foreign securities, growth style,
liquidity, manager, market, REIT, small-cap company and value style risks. See
the next Section, "Principal Investment Risks," for a more detailed discussion
of these risks and other principal risks common to all Funds.
ASTON/RIVER ROAD SMALL CAP VALUE FUND
INVESTMENT OBJECTIVE
The Fund seeks to provide long-term capital appreciation.
PRINCIPAL INVESTMENT STRATEGIES
Under normal conditions, the Fund invests at least 80% of its assets in common
stocks and other equity securities of small-cap companies that the portfolio
managers believe are undervalued. Value investing involves buying stocks that
are out of favor and/or undervalued in comparison to their peers or their
prospects for growth. The Fund considers companies with market capitalizations
below $3 billion at the time of acquisition to be small-cap. The Fund may also
invest in mid-cap stocks, REITs, convertible securities and foreign securities
(directly and through depositary receipts). Using systematic and dynamic
internal research, the portfolio managers narrow the field of small- and mid-cap
companies into a more refined working universe. The portfolio managers employ a
value-driven, bottom-up fundamental approach that seeks to identify the
following characteristics:
- priced at a discount to absolute value
- attractive business model
- shareholder-oriented management
- financial strength
- undiscovered, underfollowed or misunderstood companies
To manage risk, the portfolio managers employ a strategy of diversification, and
adhere to a structured sell discipline.
PRINCIPAL RISKS OF INVESTING IN THIS FUND
You could lose money by investing in the Fund. There can be no assurance that
the Fund's investment objective will be achieved.
RISKS. These principal investment risks apply to the Fund: foreign securities,
liquidity, manager, market, mid-cap company, REIT, small-cap company and value
style risks. See the next Section, "Principal Investment Risks," for a more
detailed discussion of these risks and other principal risks common to all
Funds.
9
GLOBAL/INTERNATIONAL FUNDS
ASTON/NEPTUNE INTERNATIONAL FUND
INVESTMENT OBJECTIVE
The Fund seeks to provide long-term capital appreciation.
PRINCIPAL INVESTMENT STRATEGIES
Under normal circumstances, the Fund invests at least 80% of its assets in
securities of non-U.S. companies located throughout the world, including
emerging markets. The Fund emphasizes securities of issuers in EAFE countries,
but may invest in securities of issuers in any country, including the Russian
Federation.
The portfolio manager employs a disciplined team-based investment process that
combines a top-down industry sector analysis and bottom-up stock selection. The
Fund invests primarily in common stocks, but may invest to a lesser degree in
convertible securities, preferred stocks and other equity securities.
The investment process is based on a global sector view. The portfolio manager
uses top-down analysis to evaluate key global sectors with an emphasis on
macroeconomics and growth prospects for different industries. Allocation among
countries or geographic areas is a residual of the investment process. As a
result of this process, the Fund may invest a material amount of its assets in a
single country and/or geographical area. Under normal circumstances, the Fund
will invest in at least five countries outside of the U.S.
Within the targeted sectors, individual stocks are selected based on bottom-up
fundamental analysis. The portfolio manager emphasizes stocks with above-average
sustainable growth rates (i.e., growth stocks). The portfolio manager seeks to
identify companies with one or more of the following characteristics:
- strong competitive position
- market leader in industry with strong growth prospects
- potential for future growth
The market capitalization of companies held by the Fund will be a residual of
the investment process. Although the Fund may invest in companies across all
market capitalizations, the investment process is biased towards mid- to large-
cap stocks.
PRINCIPAL RISKS OF INVESTING IN THIS FUND
You could lose money by investing in the Fund. There can be no assurance that
the Fund's investment objective will be achieved.
RISKS. These principal investment risks apply to the Fund: emerging market,
foreign securities, growth style, liquidity, manager, market and mid-cap company
risks. See the next Section, "Principal Investment Risks," for a more detailed
discussion of these risks and other principal risks common to all Funds.
ASTON/FORTIS GLOBAL REAL ESTATE FUND
(Formerly Aston/ABN AMRO Global Real Estate Fund)
INVESTMENT OBJECTIVE
The Fund seeks total return through a combination of growth and income.
PRINCIPAL INVESTMENT STRATEGIES
Under normal circumstances, the Fund invests at least 80% of its assets in REITs
and similar non-U.S. vehicles, common stocks and other equity securities of U.S.
and foreign companies principally engaged in the real estate sector. Under
normal circumstances, the Fund will invest at least 40% of its invested assets
in securities of issuers located outside the U.S. The Fund will invest in the
securities of issuers located in several different countries throughout the
world, in addition to the U.S. The portfolio managers use a combination of a
top-down and a bottom-up approach when selecting securities. The Fund is
classified as non-diversified.
Top-down approach involves:
- analyzing global demographic and economic trends
- reviewing the real estate cycle to identify favorable geographic regions and
property types
Bottom-up approach involves analyzing individual companies, focusing on
companies with:
- revenues primarily derived from real estate related activities
- a significant portion of revenues from rental income
- management stake in performance
- a strong balance sheet and/or consistent earnings
- internal growth prospects
- potential growth from acquisition or development
- free cash flow
The Fund may invest in foreign securities (directly and through depositary
receipts).
To manage risk, the portfolio managers limit sector and position size, and
adhere to a strong sell discipline.
PRINCIPAL RISKS OF INVESTING IN THIS FUND
You could lose money by investing in the Fund. There can be no assurance that
the Fund's investment objective will be achieved.
RISKS. These principal investment risks apply to the Fund: foreign securities,
GARP Style, liquidity, manager, market, non-diversification, REIT and sector
concentrations risks. See the next Section, "Principal Investment Risks," for a
more detailed discussion of these and other principal risks common to all Funds.
10
ALTERNATIVE FUNDS
ASTON/SMART PORTFOLIOS FUND
(Formerly Aston/Smart Allocation ETF Fund)
INVESTMENT OBJECTIVE
The Fund seeks to provide long-term capital appreciation.
PRINCIPAL INVESTMENT STRATEGIES
The Fund pursues its objective by investing primarily in ETFs that represent a
variety of asset classes and investment styles. Under normal circumstances, the
Fund invests at least 80% of its assets in shares of ETFs. An ETF is an
investment company that seeks to track the performance of an index (before fees
and expenses) by holding in its portfolio either the securities that comprise
the index or a representative sample of the securities in the index. ETFs offer
investment in a wide variety of asset classes, including: large-cap, mid-cap,
small-cap, equity, international, commodities, real estate, fixed income,
derivatives and currency. As new ETF products become available, the asset
classes available to the Fund will expand.
The portfolio managers use quantitative and qualitative fundamental analysis to
select securities from the available universe of ETFs traded on U.S. markets.
The portfolio is constructed by applying a proprietary mathematical investment
process to select a portfolio of ETFs in a more efficient combination than the
Fund's composite market benchmark. The goal of the proprietary mathematical
process is to create an optimal portfolio that is designed to produce returns in
excess of its market benchmark with an equal or lesser amount of risk.
Because the Fund places primary emphasis on capital appreciation, the Fund
expects to allocate a significant portion of its assets to underlying funds that
emphasize stocks and to allocate a lesser proportion of its assets to underlying
funds that emphasize bonds. The Fund may invest without limit in cash, cash
equivalents and money market instruments when favorable investment opportunities
are not available.
In the course of implementing its principal investment strategies, the Fund may
experience a high turnover rate (500% or more).
PRINCIPAL RISKS OF INVESTING IN THIS FUND
You could lose money by investing in the Fund. There can be no assurance that
the Fund's investment objective will be achieved.
RISKS. These principal investment risks apply to the Fund: aggressive ETF
investment technique, commodity ETF, credit ETF, equity ETF, fixed income ETF,
fund-of-funds structure, manager, market, portfolio turnover, REIT, sector
concentration, tracking and trading discount risks. See the next Section,
"Principal Investment Risks," for a more detailed discussion of these risks
applicable to ETF Funds and other principal risks common to all Funds.
ASTON/NEW CENTURY ABSOLUTE RETURN ETF FUND
INVESTMENT OBJECTIVE
The Fund seeks to provide positive total return.
PRINCIPAL INVESTMENT STRATEGIES
Under normal circumstances, the Fund invests at least 80% of its assets in
shares of ETFs. An ETF is an investment company that seeks to track the
performance of an index (before fees and expenses) by holding in its portfolio
either the securities that comprise the index or a representative sample of the
securities in the index. ETFs offer investment in a wide variety of asset
classes, including: large-cap, mid-cap, small-cap, equity, international,
commodities, real estate, fixed income, derivatives and currency. ETFs may also
offer inverse (or short) exposure to a particular asset class. As new ETF
products become available, the asset classes available to the Fund will expand.
The portfolio manager uses a quantitative investment process to select
securities and construct the portfolio. The portfolio manager first determines
the eligible universe of securities for investment. To be eligible for inclusion
in the portfolio, shares of ETFs must be traded on a U.S. exchange. The
portfolio manager also considers correlation with other ETFs in the universe.
The portfolio manager then determines the securities in the universe that are
candidates for the portfolio, based on minimum liquidity and trading
requirements. The candidates are analyzed daily for buy and sell signals. The
strategy seeks to identify patterns of price behavior and trading volume, which
the subadviser believes are indicative of stock price.
The portfolio manager determines whether or not to implement a buy signal based
on the availability of cash for investment, trading costs and other factors.
Full positions may be implemented gradually and may take up to three buy signals
to complete.
Although the Fund normally expects to hold ETFs representing a range of asset
classes and investment styles, allocations among asset classes and styles are a
residual of the investment process. In some circumstances, the Fund may hold
ETFs representing a limited number of asset classes or investment styles.
To manage risk, the portfolio manager adheres to a strong sell discipline. With
each sell signal, the portfolio manager will sell a portion of a position,
generally with the entire position liquidated by the third sell signal. The
portfolio manager may seek to hedge its exposure to certain asset classes by
investing in ETFs that seek inverse (or short) exposure to that asset class.
11
The Fund may write (sell) exchange-listed covered call options on long ETF
positions held in the Fund's portfolio as a means of seeking to enhance return.
Call options are contracts that give the holder (buyer) of the option, in return
for payment of a premium, the right, but not the obligation, to purchase from
the writer of the option the security underlying the option at a specified
exercise price prior to the expiration date. As the writer of a call option, the
Fund receives the premium from the purchaser of the option and has the
obligation, upon exercise of the option, to deliver the underlying security upon
payment of the exercise price. If the option expires without being exercised,
the Fund is not required to deliver the underlying security but retains the
premium received.
The Fund generally writes covered call options that are out-of-the money to
generate premium income for the Fund. A call option is out-of-the money if the
exercise price is above the current market price for the underlying security.
The Fund expects to use covered call options in declining markets as a means of
seeking to enhance return.
The firm's strategy seeks to identify ETFs with high probability of producing
positive returns over an extended period of time within certain risk
constraints. During periods in which sufficient opportunities are not identified
to fully invest the portfolio, residual assets will be held in cash or cash
equivalents.
In the course of implementing its principal investment strategies, the Fund may
experience a relatively high turnover rate (200% or more).
PRINCIPAL RISKS OF INVESTING IN THIS FUND
You could lose money by investing in the Fund. There can be no assurance that
the Fund's investment objective will be achieved.
RISKS. These principal investment risks apply to the Fund: aggressive ETF
investment technique, commodity ETF, covered call option, credit ETF,
derivatives, equity ETF, fixed income ETF, fund-of-funds structure, manager,
market, portfolio turnover, REIT, sector concentration, tracking and trading
discount risks. See the next Section, "Principal Investment Risks," for a more
detailed discussion of these risks applicable to ETF Funds and other principal
risks common to all Funds.
ASTON/MB ENHANCED EQUITY INCOME FUND
INVESTMENT OBJECTIVE
The Fund seeks total return through a combination of a high level of current
income and capital appreciation.
PRINCIPAL INVESTMENT STRATEGIES
The Fund pursues its objective by investing primarily in a diversified portfolio
of equity securities traded in U.S. markets and by writing covered call options
on a substantial portion of the Fund's long equity portfolio. The Fund places
primary emphasis on the generation of income. Option premiums and dividend
income are expected to constitute a significant portion of total return. Under
normal circumstances, the Fund invests at least 80% of its assets in equity
securities.
EQUITY SELECTION
The portfolio managers select equity securities using a bottom-up investment
approach focusing on the fundamentals of each company. The portfolio managers
emphasize current dividend yield, free cash flow and stability. The portfolio
managers focus on companies with regular quarterly dividends and with market
capitalizations of $4 billion or more. The Fund may invest in equity securities
of foreign issuers that are traded in U.S. markets.
COVERED CALL STRATEGY
On an ongoing and consistent basis, the portfolio managers intend to write
(sell) covered call options on a substantial portion of the Fund's long equity
portfolio as a means of enhancing return. Call options are contracts that give
the holder (buyer) of the option, in return for payment of a premium, the right,
but not the obligation, to purchase from the writer of the option the security
underlying the option at a specified exercise price prior to the expiration
date. As the writer of a call option, the Fund receives the premium from the
purchaser of the option and has the obligation, upon exercise of the option, to
deliver the underlying security upon payment of the exercise price. If the
option expires without being exercised, the Fund is not required to deliver the
underlying security but retains the premium received.
The Fund generally writes covered call options that are out-of-the money to
generate premium income for the Fund. A call option is out-of-the money if the
exercise price is above the current market price for the underlying security.
MORE ABOUT COVERED CALL OPTIONS
For the right to purchase the underlying stock, the buyer of a call option pays
a fee or "premium" to the Fund. The premium is paid at the time the option is
purchased, and is not refundable to the buyer regardless of what happens to the
stock price. Premiums received for writing various call options may decrease as
a result of certain factors, such as a reduction in interest rates, a decline in
stock market volumes or a decrease in the price volatility of the underlying
securities on which the call options are written.
The buyer of the option may elect to exercise the option at the exercise price
at any time before the option expires. The Fund is then obligated to deliver the
shares at that price. Options are normally exercised if the market price of the
stock exceeds the exercise price of the option.
If the market price of the stock does not exceed the exercise price, the call
option will likely expire without being exercised. The Fund then keeps the
premium. The Fund may continue to hold the underlying stock, write a new call or
may sell the position.
In addition to writing covered call options, the Fund may also use certain
derivatives transactions for hedging purposes or to seek total return. The
portfolio managers currently intend to purchase put options on securities in the
Fund's portfolio and put options on securities indices.
12
The portfolio managers actively manage risk and adhere to a strong sell
discipline.
The Fund is not expected to have annual portfolio turnover that exceeds 100%.
Portfolio turnover rate does not, however, take into account short-term capital
gains generated from premiums on the sale of call options. See "Covered Call
Option Risk" below.
PRINCIPAL RISKS OF INVESTING IN THIS FUND
You could lose money by investing in the Fund. There can be no assurance that
the Fund's investment objective will be achieved.
RISKS. These principal investment risks apply to the Fund: covered call option,
derivatives, manager, market and mid-cap company risks. See the next Section,
"Principal Investment Risks," for a more detailed discussion of these risks and
other principal risks common to all Funds.
SECTOR FUND
ASTON/FORTIS REAL ESTATE FUND
(Formerly Aston/ABN AMRO Real Estate Fund)
INVESTMENT OBJECTIVE
The Fund seeks total return through a combination of growth and income.
PRINCIPAL INVESTMENT STRATEGIES
Under normal conditions, the Fund invests at least 80% of its assets in REITs
and common stocks and other equity securities of U.S. and foreign companies
principally engaged in the real estate sector. The portfolio managers do not
invest the Fund's assets in real estate directly. In selecting securities for
the Fund, the portfolio managers analyze long-term trends in property types and
geographic regions. The portfolio managers use a combination of a top-down and a
bottom-up approach. The Fund is classified as non-diversified.
Top-down approach involves:
- analyzing demographic and economic trends
- reviewing the real estate cycle to identify favorable geographic regions and
property types
Bottom-up approach involves researching individual companies, focusing on
companies with:
- revenues primarily derived from real estate related activities
- a significant portion of revenues from rental income
- management stake in performance
- a strong balance sheet and/or consistent earnings
- internal growth prospects
- potential growth from acquisition or development
- free cash flow
The Fund may invest in foreign securities (directly and through depositary
receipts).
To manage risk, the portfolio managers employ a strategy of sector and position
constraints, and adhere to a strong sell discipline.
PRINCIPAL RISKS OF INVESTING IN THIS FUND
You could lose money by investing in the Fund. There can be no assurance that
the Fund's investment objective will be achieved.
RISKS. These principal investment risks apply to the Fund: foreign securities,
GARP style, liquidity, manager, market, non-diversification, REIT and sector
concentration risks. See the next Section, "Principal Investment Risks," for a
more detailed discussion of these risks and other principal risks common to all
Funds.
BALANCED FUNDS
ASTON/MONTAG & CALDWELL BALANCED FUND
INVESTMENT OBJECTIVE
The Fund seeks long-term total return.
PRINCIPAL INVESTMENT STRATEGIES
The Fund invests primarily in a combination of equity, fixed income and short-
term securities. Generally, between 50% and 70% of the Fund's total assets will
be invested in equity securities and at least 25% will be invested in fixed
income securities to provide a stable flow of income. The portfolio allocation
will vary based upon the portfolio manager's assessment of the return potential
of each asset class. For equity investments, the portfolio manager uses a
bottom-up approach to stock selection and seeks high quality, well-established
large-cap companies that the portfolio manager believes are growing their near-
term earnings at an above average rate. The portfolio manager emphasizes
valuation to find companies selling at a discount to their intrinsic value.
These companies must pass an initial capitalization screen and:
- have a strong history of earnings growth
- are attractively priced, relative to the company's potential for above average
long-term earnings and revenue growth
- have strong balance sheets
- have a sustainable competitive advantage
- are currently, or have the potential to become, industry leaders
- have the potential to outperform during market downturns
The Fund may invest in foreign securities (directly and through depositary
receipts).
When selecting equity securities, the portfolio manager limits sector and
individual security exposure and adheres to a strong sell discipline in order to
minimize risk.
13
When selecting fixed income securities, the portfolio manager strives to
maximize total return and minimize risk primarily through actively adjusting the
portfolio's duration and sector weightings. Emphasis is also placed on
diversification and credit analysis.
The Fund will invest only in fixed income securities with an "A" or better
rating. Investments will include:
- U.S. government securities
- corporate bonds
- mortgage/asset-backed securities
- money market securities and repurchase agreements
PRINCIPAL RISKS OF INVESTING IN THIS FUND
You could lose money by investing in the Fund. There can be no assurance that
the Fund's investment objective will be achieved.
RISKS. These principal investment risks apply to the Fund: credit, foreign
securities, growth style, interest rate, liquidity, manager, market, prepayment
and U.S. government agency securities risks. See the next Section, "Principal
Investment Risks," for a more detailed discussion of these risks and other
principal risks common to all Funds.
ASTON BALANCED FUND
INVESTMENT OBJECTIVE
The Fund seeks growth of capital with current income by investing in a
combination of equity and fixed income securities.
PRINCIPAL INVESTMENT STRATEGIES
The Fund retains two subadvisers dedicated to managing the equity and fixed
income portions of the portfolio, respectively. The Adviser determines the
allocation of assets between the equity and fixed income portions of the
portfolio. The Adviser generally rebalances the portfolio quarterly and under
normal circumstances, allocates between 50% and 70% of the Fund's total assets
in equity securities and at least 25% in fixed income securities.
For equity investments, the portfolio manager uses a bottom-up approach to stock
selection and seeks high quality, well-established large-cap companies that the
portfolio manager believes are growing their near-term earnings at an above
average rate. The portfolio manager emphasizes valuation to find companies
selling at a discount to their intrinsic value. These companies must pass an
initial capitalization screen and:
- have a strong history of earnings growth
- are attractively priced, relative to the company's potential for above average
long-term earnings and revenue growth
- have strong balance sheets
- have a sustainable competitive advantage
- are currently, or have the potential to become, industry leaders
- have the potential to outperform during market downturns
The Fund may invest in foreign securities (directly and through depositary
receipts).
When selecting equity securities, the portfolio manager limits sector and
individual security exposure and adheres to a strong sell discipline in order to
minimize risk.
With respect to fixed income securities, the Fund may invest in securities of
the U.S. government and its agencies, corporate notes and bond, mortgage- and
asset-backed securities and short-term money market instruments. The fixed
income portfolio managers select securities based on various methods of
quantitative and fundamental analysis and research. The fixed income portfolio
managers seek to maintain an average weighted portfolio maturity of three to ten
years. The fixed income portfolio managers emphasize investment grade fixed
income securities but may invest in high yield securities.
The Fund may use futures, swaps and other derivatives for hedging purposes or to
seek total return. Derivatives will consist primarily of futures contracts,
interest rate swaps and credit default swaps. Derivatives will be used to hedge
interest rate risk and credit risk. Derivatives may also be used to seek
exposure to asset classes in which the Fund is authorized to invest. For
example, derivatives may provide exposure to specific credits that are not
available in the cash markets, or may provide more efficient access to such
credits. Derivatives will not be used to seek exposure to asset classes that the
Fund may not invest in directly. The net notional (or market exposure) of
derivatives instruments will not exceed the net assets of the Fund. See
"Additional Information Regarding Investment Strategies."
The fixed income portfolio managers manage risk through ongoing monitoring of
sector, quality and issuer exposures, and ongoing analysis of duration,
convexity and maturity.
PRINCIPAL RISKS OF INVESTING IN THIS FUND
You could lose money by investing in this Fund. There can be no assurance that
the Fund's investment objective will be achieved.
RISKS. These principal investment risks apply to the Fund: below investment-
grade (high yield) securities, call, credit, derivatives, foreign securities,
growth style, interest rate, liquidity, manager, market, prepayment and U.S.
government agency securities risks. See the next Section, "Principal Investment
Risks," for a more detailed discussion of these risks and other principal risks
common to all Funds.
14
FIXED INCOME FUND
ASTON/TCH FIXED INCOME FUND
INVESTMENT OBJECTIVE
The Fund seeks high current income consistent with prudent risk of capital.
PRINCIPAL INVESTMENT STRATEGIES
Under normal conditions, the Fund invests at least 80% of its assets in bonds,
primarily intermediate-term investment-grade fixed income securities. The Fund
may invest in securities of the U.S. government and its agencies, corporate
notes and bonds, mortgage- and asset-backed securities and short-term money
market instruments. The portfolio managers select securities based on various
methods of quantitative and fundamental analysis and research.
The portfolio managers seek to maintain an average weighted portfolio maturity
of three to ten years. The portfolio managers emphasize investment grade fixed
income securities, but may invest in high yield securities. The Fund may use
futures, swaps and other derivatives for hedging purposes, to manage portfolio
duration or to seek total return. Derivatives will consist primarily of futures
contracts, interest rate swaps and credit default swaps. Derivatives will be
used to hedge interest rate risk and credit risk. Derivatives may also be used
to seek exposure to asset classes in which the Fund is authorized to invest. For
example, derivatives may provide exposure to specific credits that are not
available in the cash markets, or may provide more efficient access to such
credits. Derivatives will not be used to seek exposure to asset classes that the
Fund may not invest in directly. The net notional (or market exposure) of
derivatives instruments will not exceed the net assets of the Fund. See
"Additional Information Regarding Investment Strategies."
The Fund may also invest in foreign securities.
The portfolio managers manage risk through ongoing monitoring of sector, quality
and issuer exposures, and ongoing analysis of duration, convexity, and maturity.
PRINCIPAL RISKS OF INVESTING IN THIS FUND
You could lose money by investing in the Fund. There can be no assurance that
the Fund's investment objective will be achieved.
RISKS. These principal investment risks apply to the Fund: below investment
grade (high yield) securities, call, credit, derivatives, foreign securities,
interest rate, liquidity, manager, prepayment and U.S. government agency
securities risks. See the next Section, "Principal Investment Risks," for a more
detailed discussion of these risks and other principal risks common to all
Funds.
MONEY MARKET FUND
ASTON/FORTIS INVESTOR MONEY MARKET FUND
(Formerly Aston/ABN AMRO Investor Money Market Fund)
INVESTMENT OBJECTIVE
The Fund seeks as high a level of current interest income as is consistent with
maintaining liquidity and stability of principal.
PRINCIPAL INVESTMENT STRATEGIES
The Fund invests substantially all of its assets in high quality money market
instruments issued by corporations, banks and the U.S. government or its
agencies or instrumentalities and repurchase agreements involving these
instruments. The Fund may also invest in U.S. dollar-denominated securities of
foreign issuers. The dollar-weighted average maturity of the securities in the
Fund is 90 days or less.
The portfolio manager:
- structures the Fund's portfolio based on interest rates, market conditions and
liquidity needs
- monitors the credit quality ratings of the Fund's investments and may adjust
the Fund's average maturity in anticipation of changes in short-term interest
rates
- selects securities that:
- are denominated in U.S. dollars
- have high credit quality and minimal credit risk
- mature or reset in 397 days or less
PRINCIPAL RISKS OF INVESTING IN THIS FUND
An investment in the Fund is not a bank deposit and is not insured or guaranteed
by the Federal Deposit Insurance Corporation (FDIC) or any other government
agency. (See "Participation in the U.S. Department of Treasury Temporary
Guarantee Program" below). Although the Fund seeks to preserve the value of your
investment at $1.00 per share, it is possible to lose money by investing in the
Fund. The Fund's yield will change as a result of movements in short-term
interest rates and market conditions. There can be no assurance that the Fund's
investment objective will be achieved.
RISKS. These principal investment risks apply to the Fund: credit, foreign
securities, inflation, interest rate, liquidity, manager, market, sector
concentration and U.S. government agency securities risks. See the next Section,
"Principal Investment Risks," for a more detailed discussion of these risks and
other principal risks common to all Funds.
PARTICIPATION IN U.S. DEPARTMENT OF THE TREASURY TEMPORARY GUARANTEE PROGRAM
On October 3, 2008, the Board of Trustees of the Trust approved the Fund's
participation in U.S. Department of the Treasury's
15
Temporary Guarantee Program ("Program") for money market funds. The Program is
designed to protect the net asset value of certain shares of a shareholder of
record in the Fund at the close of business on September 19, 2008. The number of
covered shares is the lesser of the number of shares owned on September 19, 2008
or the number of shares owned on the date when the payment is triggered
("Covered Shares"). Payment is triggered if the Fund's net asset value falls
below $0.995 and the Fund liquidates. Eligible shareholders will receive a
payment from the Program in the amount of the shortfall between the Fund's net
asset value and $1.00 per share for each Covered Share. Shares which are not
considered Covered Shares are not entitled to any payment under the Program.
Guarantee payments under the Program will not exceed the amount available within
the U.S. Department of the Treasury's Exchange Stabilization Fund ("ESF") on the
date of payment. Currently, ESF assets are approximately $50 billion. The U.S.
Department of Treasury and the Secretary of the Treasury have the authority to
use assets from the ESF for purposes other than those of the Program.
The Program terminates on April 30, 2009, but may be extended by the Treasury
Department up to September 18, 2009. If the Treasury Department extends the
Program, the Board will consider whether to continue to participate.
The Fund will bear the expense of its participation in the Program. The fee for
participation in the Program for the initial period and the period from December
19, 2008 to April 30, 2009 is 0.01% and 0.015%, respectively, of the NAV of a
Participating Fund as of September 19, 2008.
16
Principal Investment Risks
RISKS THAT APPLY TO THE FUNDS
BELOW INVESTMENT GRADE (HIGH YIELD) SECURITIES RISK: Bonds and other fixed
income securities are rated by national ratings agencies. These ratings
generally assess the ability of the issuer to pay principal and interest.
Issuers of securities that are rated below investment grade (i.e., Ba1/BB+ or
lower) and their unrated equivalents are typically in poor financial health, and
their ability to pay interest and principal is uncertain. The prices of such
securities may be more vulnerable to bad economic news, or even the expectation
of bad news, than higher rated or investment grade bonds and other fixed income
securities.
CALL RISK: Call risk is the possibility that an issuer may redeem a fixed income
security before maturity (a call) at a price below its current market price. An
increased likelihood of a call may reduce the security's price. If a fixed
income security is called, a fund may have to reinvest the proceeds in other
fixed income securities with lower interest rates, higher credit risks, or other
less favorable characteristics.
COVERED CALL OPTION RISK: Investments in covered calls involve certain risks.
These risks include:
- By selling covered call options, a fund limits its opportunity to profit from
an increase in the price of the underlying stock above the exercise price, but
continues to bear the risk of a decline in the value of the underlying stock.
While a fund receives a premium for writing the call option, the price the
fund realizes from the sale of stock upon exercise of the option could be
substantially below its current market price.
- A liquid market may not exist for options held by a fund. If a fund is not
able to close out an options transaction, the fund will not be able to sell
the underlying security until the option expires or is exercised.
- A fund's investment strategy may also result in a lack of liquidity of the
purchase and sale of portfolio securities. Because a fund generally will hold
the stocks underlying the call options, the fund may be less likely to sell
the stocks in its portfolio to take advantage of new investment opportunities.
- Because a fund will have no control over the exercise of the call options, it
may be forced to realize the capital gains or losses at inopportune times and
it will not be able to control whether such gains or losses are short-term or
long-term for federal income tax purposes.
If a fund generates premiums from its sale of call options, these premiums
typically will result in short-term capital gains for federal income tax
purposes. Distributions of net short-term capital gain are taxable to
shareholders as ordinary income for federal income tax purposes. Transactions
involving the disposition of a fund's underlying securities (whether pursuant to
the exercise of a call option or otherwise) will give rise to capital gains or
losses. Because a fund will have no control over the exercise of the call
options, it may be forced to realize capital gains or losses at inopportune
times and it will not be able to control whether such gains or losses are short-
term or long-term for federal income tax purposes. Such funds are not designed
for investors seeking a tax efficient investment.
CREDIT RISK: Credit risk (also called default risk) is the risk that the issuer
of a security will not be able to make principal and interest payments on a debt
issue. The credit ratings of issuers could change and negatively affect a fund's
share price or yield.
When a Fund uses derivatives instruments to seek credit exposure to underlying
issuers, it is subject to the credit risk of both the underlying issuer(s) and
the counterparty (typically a broker or bank) to the instrument. When a Fund
invests in asset-backed securities, mortgage-backed securities and CMOs, it is
subject to the credit risks of the underlying assets that collateralize the
instrument. Recent instability in the credit markets has resulted in increased
delinquencies and credit losses on certain types of asset-backed and mortgage-
backed securities.
DERIVATIVES RISK: Risks associated with derivatives include the risk that the
derivative is not well correlated with the security, index or currency to which
it relates, the risk that derivatives may not have the intended effects and may
result in losses or missed opportunities, the risk that a fund will be unable to
sell the derivative because of an illiquid secondary market, the risk that a
counterparty is unwilling or unable to meet its obligations, and the risk that
the derivative transaction could expose a fund to the effects of leverage, which
could increase the fund's exposure to the market and magnify potential losses.
There is no guarantee that derivatives, to the extent employed, will have the
intended effect, and their use could cause lower returns or even losses to a
fund. The use of derivatives by a fund to hedge risk may reduce the opportunity
for gain by offsetting the positive effect of favorable price movements.
The use of certain derivatives provides exposure to the underlying credit market
or other reference asset in excess of the cash investment of a fund. The use of
derivatives can magnify gains and losses.
EMERGING MARKET RISK: In addition to the general foreign securities risks,
investing in emerging market countries is subject to a number of risks,
including:
- economic structures that are less diverse and mature than developed countries
- less stable political systems and less developed legal systems
- national policies that may restrict foreign investment
- wide fluctuations in the value of investments
- smaller securities markets making investments less liquid
- special custody arrangements
17
FOREIGN SECURITIES RISK: Investing in the securities of foreign issuers involves
special risks and considerations not typically associated with investing in U.S.
companies. The securities of foreign companies may be less liquid and may
fluctuate more widely than those traded in U.S. markets. Foreign companies and
markets may also have less governmental supervision. There may be difficulty in
enforcing contractual obligations and little public information about the
companies. Trades typically take more time to settle and clear, and the cost of
buying and selling foreign securities is generally higher than similar costs
associated with U.S. traded securities.
- CURRENCY RISK: The value of the securities held by a fund may be affected by
changes in exchange rates or control regulations. If a local currency gains
against the U.S. dollar, the value of the holding increases in U.S. dollar
terms. If a local currency declines against the U.S. dollar, the value of the
holding decreases in U.S. dollar terms.
- POLITICAL/ECONOMIC RISK: Changes in economic, tax or foreign investment
policies, or other political, governmental or economic actions can adversely
affect the value of the securities in a fund.
- REGULATORY RISK: In foreign countries, accounting, auditing and financial
reporting standards and other regulatory practices and requirements are
generally different from those required for U.S. companies.
GARP STYLE RISK: GARP investing involves buying stocks that have a reasonable
price/earnings ratio in relationship to a company's earnings growth rate. Growth
stocks may be more volatile than other stocks because they are generally more
sensitive to investor perceptions and market moves. During periods of growth
stock underperformance, a fund's performance may suffer.
GROWTH STYLE RISK: Growth investing involves buying stocks that have relatively
high price-to-earnings ratios. Growth stocks may be more volatile than other
stocks because they are generally more sensitive to investor perceptions and
market moves. During periods of growth stock underperformance, a fund's
performance may suffer.
INFLATION RISK: Inflation risk is the risk that inflation may erode the real
value of an investment in a fund.
INTEREST RATE RISK: If interest rates rise, bond prices will fall. The longer
the maturity of a bond, the more sensitive a bond's price will be to changes in
interest rates. In other words, a long-term bond (30-year) will have greater
price sensitivity than a short-term bond (2-year). Short-term and long-term bond
prices and interest rates do not typically move the same amount or for the same
reasons. Interest rate changes will impact high yield bonds in different ways
depending on credit ratings. BB rated bonds are more vulnerable to prevailing
rates and act more like their investment grade counterparts. For bonds rated B
and below, credit risk is more significant than interest rate risk. Therefore, a
fund that maintains a minimum B rating should anticipate higher interest rate
risks but lower credit risks than a fund that invests in lower quality issuers.
LIQUIDITY RISK: When there is no willing buyer and investments cannot be readily
sold at the desired time or price, a fund may need to accept a lower price or
may not be able to sell the security at all. An inability to sell securities can
adversely affect a fund's value or prevent a fund from being able to take
advantage of other investment opportunities. Recent instability in certain
credit and fixed income markets has adversely affected and is expected to
continue to affect the liquidity of certain asset classes of securities
including, in particular, certain types of asset-backed, mortgage-backed and
real-estate related securities. Less liquid securities are more difficult to
dispose of at their recorded values and are subject to increased spreads and
volatility.
MANAGER RISK: The performance of a fund is dependent upon the investment
adviser's skill in selecting managers and the portfolio manager's skill in
making appropriate investments. As a result, a fund may underperform its
benchmark or its peers.
MARKET RISK: A fund's share price can move down in response to stock market
conditions, changes in the economy or changes in a particular company's stock
price. An individual stock may decline in value even when the value of stocks in
general is rising.
MID-CAP COMPANY RISK: Investments in mid-cap companies may entail greater risks
than investments in larger, more established companies. Mid-cap companies
generally have narrower product lines, more limited financial resources and a
more limited trading market for their stocks compared with larger companies. As
a result, their stock prices may experience greater volatility and may decline
significantly in market downturns.
NON-DIVERSIFICATION RISK: A non-diversified fund may invest a larger percentage
of its assets in a given security than a diversified fund. As a result, it may
be more susceptible to a single adverse economic, political or regulatory
occurrence affecting one or more issuers in which a large percentage of its
assets is invested and may experience increased volatility due to its
investments in those securities.
PORTFOLIO TURNOVER RISK: Frequent trading of a fund's securities may result in a
higher than average level of capital gains, including short-term gains, and will
result in greater transaction costs to a fund. High portfolio turnover may
increase the level of short-term capital gains. To the extent distributions to
shareholders are made from net short-term capital gains of a fund (i.e., net
capital gain on securities held or treated as held by a fund for one year or
less minus any net capital losses on securities held or treated as held by a
fund for more than one year), the distributions will be taxed at ordinary income
rates for federal income tax purposes, rather than at lower long-term capital
gains rates. Greater transaction costs and higher expenses as a result of
portfolio turnover can negatively impact a fund's performance.
18
PREPAYMENT RISK: Mortgage-backed securities carry prepayment risk. Prices and
yields of mortgage-backed securities assume that the underlying mortgages will
be paid off according to a preset schedule. If the underlying mortgages are paid
off early, such as when homeowners refinance as interest rates decline, a fund
may be forced to reinvest the proceeds in lower yielding, higher priced
securities. This may reduce a fund's total return.
REIT RISK: Securities of REITs may be affected by changes in the value of their
underlying properties and by defaults by borrowers or tenants. Some REITs may
have limited diversification and may be subject to risks inherent in investments
in a limited number of properties, in a narrow geographic area, or in a single
property type. Real estate is also affected by general economic conditions. When
growth is slowing, demand for property decreases and prices may decline. Rising
interest rates, which drive up mortgage and financing costs, can restrain
construction and buying and selling activity, and may reduce the appeal of real
estate investments. REITs depend generally on their ability to generate cash
flow to make distributions to shareholders or unitholders, and may be subject to
defaults by borrowers and self-liquidations. A REIT's return may be adversely
affected when interest rates are high or rising. Distributions from REITs
generally are taxed as ordinary income for federal income purposes. See
"Dividends, Distributions and Taxes."
SECTOR CONCENTRATION RISK: Investing in sector-specific funds may entail greater
risks than investing in funds diversified across sectors. Because such a fund
may invest in a limited number of industries within a sector, the fund may be
subject to a greater level of market risk and its performance may be more
volatile than a fund that does not concentrate its investments in a specific
sector.
SMALL-CAP COMPANY RISK: Investing in securities of small-cap companies may
involve greater risks than investing in securities of larger, more established
issuers. Small-cap companies generally have limited product lines, markets and
financial resources. Their securities may trade less frequently and in more
limited volume than the securities of larger, more established companies. Also,
small-cap companies are typically subject to greater changes in earnings and
business prospects than larger companies. As a result, their stock prices may
experience greater volatility and may decline significantly in market downturns.
U.S. GOVERNMENT AGENCY SECURITIES RISK: Certain U.S. government agency
securities are backed by the right of the issuer to borrow from the U.S.
Treasury while others are supported only by the credit of the issuer or
instrumentality. While the U.S. government may provide financial support to U.S.
government-sponsored agencies or instrumentalities, such as various actions
taken to stabilize the Federal National Mortgage Association and Federal Home
Loan Mortgage Corporation in 2008, no assurance can be given that it will always
do so. Such securities are neither issued nor guaranteed by the U.S. Treasury.
VALUE STYLE RISK: Value investing involves buying stocks that are out of favor
and/or undervalued in comparison to their peers or their prospects for growth.
Typically, their valuation levels are less than those of growth stocks. Because
different types of stocks go out of favor with investors depending on market and
economic conditions, a fund's return may be adversely affected during a market
downturn and when value stocks are out of favor.
RISKS THAT APPLY TO FUNDS THAT INVEST IN ETFS
AGGRESSIVE ETF INVESTMENT TECHNIQUE RISK: Investing in ETFs that use investment
techniques and financial instruments that may be considered aggressive,
including the use of futures contracts, options on futures contracts, securities
and indices, forward contracts, swap agreements and similar instruments expose a
fund to potentially dramatic changes (losses) in the value of its portfolio
holdings. Such techniques may include short sales or other techniques that are
intended to provide inverse exposure to a particular market or other asset
class.
COMMODITY ETF RISK: Investing in ETFs that invest long or short in the
commodities market and investing in commodity linked instruments, such as
exchange traded notes, may subject a fund to greater volatility than investments
in traditional securities. Commodities include energy, metals, agricultural
products, livestock and minerals. ETFs may buy certain commodities (such as
gold) or may invest in commodity-linked derivative instruments. The value of
commodities and commodity contracts are affected by a variety of factors,
including global supply and demand, changes in interest rates, commodity index
volatility, and factors affecting a particular industry or commodity, such as
drought, floods, weather livestock disease, embargos, government regulation,
tariffs and taxes, world events and economic, political and regulatory
developments. A fund's ability to invest in ETFs that invest in the commodities
market and its ability to invest in commodity linked instruments may be
significantly limited by the federal income tax rules applicable to regulated
investment companies.
CREDIT ETF RISK: Credit risk (also called default risk) is the risk that the
issuer of a security will not be able to make principal and interest payments on
a debt issue. The credit ratings of issuers could change and negatively affect a
Fund's share price or yield. When underlying ETFs use derivatives instruments to
seek credit exposure to underlying issuers, it is subject to the credit risk of
both the underlying issuer(s) and the counterparty (typically a broker or bank)
to the instrument. When underlying ETFs invest in asset-backed securities,
mortgage-backed securities and CMOs, the ETF is subject to the credit risks of
the underlying assets that collateralize the instrument. Recent instability in
the credit markets has resulted in increased delinquencies and credit losses on
certain asset-backed and mortgage-backed securities.
19
EQUITY ETF RISK:
- MARKET RISK. Overall stock market risks affect the value of ETFs, and thus the
share price of a fund. Factors such as domestic economic growth and market
conditions, interest rate levels and political events affect the securities
markets.
- SMALL AND MID-CAP COMPANY RISK. Investing in ETFs that own securities of small
and mid-cap companies may involve greater risks than investing in securities of
larger, more established issuers. Small and mid-cap companies generally have
limited product lines, markets and financial resources. Their securities may
trade less frequently and in more limited volume than the securities of larger,
more established companies. Also, small and mid-cap companies are typically
subject to greater changes in earnings and business prospects than larger
companies. As a result, their stock prices may experience greater volatility and
may decline significantly in market downturns.
- FOREIGN SECURITIES RISK. Investing in ETFs that invest in foreign issuers
involves risks not associated with U.S. investments, including settlement risks,
currency fluctuation, local withholding and other taxes, different financial
reporting practices and regulatory standards, high costs of trading, changes in
political conditions, expropriation, investment and repatriation restrictions
and settlement and custody risks.
- EMERGING MARKET RISK. A fund may invest in ETFs that invest in issuers located
in emerging markets. Emerging market countries may have relatively unstable
governments, less diverse economies and less liquid securities markets.
Companies in emerging markets are often smaller, less seasoned and more recently
organized.
FIXED INCOME ETF RISK: Investing in ETFs that own fixed income securities
subject a fund to additional risks, which include credit risk, interest risk,
maturity risk, investment grade securities risk, municipal securities risk and
prepayment risk. These risks could affect the value of a particular investment
by a fund, possibly causing the fund's share price and total return to be
reduced and fluctuate more than other types of investments. Additional
information about fixed income risks can be found in the SAI.
FUND-OF-FUNDS STRUCTURE RISK: Your cost of investing in a fund that invests in
ETFs will be higher than the cost of investing directly in the underlying ETFs
and may be higher than mutual funds that invest directly in stocks and bonds.
Shareholders of a Fund bear their proportionate share of an ETF's fees and
expenses as well as their share of the Fund's fees and expenses. Also, the fund
may be prevented from fully allocating assets to an ETF due to fund-of-funds
investment limitations. The risks of investing in ETFs typically reflect the
risks of the types of securities in which the ETFs invest.
TRACKING RISK: ETFs in which a fund invests will not be able to replicate
exactly the performance of the indices they track because the total return
generated by the securities will be reduced by transaction costs incurred in
adjusting the actual balance of the securities. In addition, ETFs in which a
fund invests will incur expenses not incurred by their applicable indices.
Certain securities comprising the indices tracked by ETFs may, from time to
time, temporarily be unavailable, which may further impede an ETFs' ability to
track their applicable indices.
TRADING DISCOUNT RISK: The market value of ETF shares may differ from net asset
value. This difference in price may be due to the fact that ETF shares supply
and demand is not always identical to supply and demand for an ETF's underlying
basket of securities. At times, an ETF's shares may trade at a premium or
discount to its net asset value.
20
RISK SUMMARY
The following chart compares the principal risks of investing in each Aston
Fund. More information about the risks associated with investing in Aston Funds
can also be found in the SAI.
Below
Investment
Grade
(High Covered
Yield) Call Deri- Emerging Foreign GARP Growth Infla- Interest
FUND Securities Call Option Credit vatives Market Securities Style Style tion Rate Liquidity Manager
Aston/Montag & Caldwell
Growth X X X X
Aston/Veredus Select
Growth X X X X
Aston Growth X X X X
Aston/Optimum Large Cap
Opportunity X X X X
Aston Value X X X
Aston/TAMRO All Cap X X X X X X X
Aston/River Road
Dividend All Cap Value X X X
Aston/Optimum Mid Cap X X X X
Aston/Montag & Caldwell
Mid Cap Growth X X X X
Aston/Cardinal Mid Cap
Value X X
Aston/River Road Small-
Mid Cap X X X
Aston/Veredus Aggressive
Growth X X X X
Aston/TAMRO Small Cap X X X X X X
Aston/River Road Small
Cap Value X X X
Aston/Neptune
International X X X X X
Aston/Fortis Global Real
Estate X X X X
Aston/Smart Portfolios X
Aston/New Century
Absolute Return ETF X X X
Aston/MB Enhanced Equity
Income X X
Aston/Fortis Real Estate X X X X
Aston/Montag & Caldwell
Balanced X X X X X X
Aston Balanced X X X X X X X X X
Aston/TCH Fixed Income X X X X X
Fund X X X
Aston/Fortis Investor
Money Market X X X X X X
U.S. Aggressive
Non- Port- Government ETF
Mid-Cap Diversi- folio Pre- Sector Small-Cap Agency Value Investment
FUND Market Company fication Turnover payment REIT Concentration Company Securities Style Technique
Aston/Montag & Caldwell
Growth X
Aston/Veredus Select
Growth X X X
Aston Growth X
Aston/Optimum Large Cap
Opportunity X
Aston Value X X X
Aston/TAMRO All Cap X X X X X
Aston/River Road
Dividend All Cap Value X X X X X
Aston/Optimum Mid Cap X X X X
Aston/Montag & Caldwell
Mid Cap Growth X X
Aston/Cardinal Mid Cap
Value X X X
Aston/River Road Small-
Mid Cap X X X X X
Aston/Veredus Aggressive
Growth X X X X
Aston/TAMRO Small Cap X X X X
Aston/River Road Small
Cap Value X X X X X
Aston/Neptune
International X X
Aston/Fortis Global Real
Estate X X X X
Aston/Smart Portfolios X X X X X
Aston/New Century
Absolute Return ETF X X X X X
Aston/MB Enhanced Equity
Income X X
Aston/Fortis Real Estate X X X X
Aston/Montag & Caldwell
Balanced X X X
Aston Balanced X X X
Aston/TCH Fixed Income
Fund X X X
Aston/Fortis Investor
Money Market X X X
Fixed Fund-of-
Commodity Credit Equity Income Funds Trading
ETF ETF ETF ETF Structure Tracking Discount
Aston/Montag & Caldwell
Growth
Aston/Veredus Select
Growth
Aston Growth
Aston/Optimum Large Cap
Opportunity
Aston Value
Aston/TAMRO All Cap
Aston/River Road
Dividend All Cap Value
Aston/Optimum Mid Cap
Aston/Montag & Caldwell
Mid Cap Growth
Aston/Cardinal Mid Cap
Value
Aston/River Road Small-
Mid Cap
Aston/Veredus Aggressive
Growth
Aston/TAMRO Small Cap
Aston/River Road Small
Cap Value
Aston/Neptune
International
Aston/Fortis Global Real
Estate
Aston/Smart Portfolios X X X X X X X
Aston/New Century
Absolute Return ETF X X X X X X X
Aston/MB Enhanced Equity
Income
Aston/Fortis Real Estate
Aston/Montag & Caldwell
Balanced
Aston Balanced
Aston/TCH Fixed Income
Fund
Aston/Fortis Investor
Money Market
21
Fund Performance
ASTON/MONTAG & CALDWELL GROWTH FUND
FUND PERFORMANCE
The bar chart shows how the Fund's performance has varied from year-to-year over
the periods shown. This information may help illustrate the risks of investing
in the Fund. As with all mutual funds, past performance (before and after taxes)
does not guarantee future performance.
CALENDAR YEAR TOTAL RETURN
1999 22.51%
2000 (7.37%)
2001 (13.33%)
2002 (22.89%)
2003 17.24%
2004 4.10%
2005 5.35%
2006 8.07%
2007 21.04%
2008 (32.64%)
Best quarter: 12/99 17.71%
Worst quarter: 12/08 (20.35)%
The following table indicates how the Fund's average annual returns for
different calendar periods compared to the returns of a broad-based securities
market index. All figures assume reinvestment of dividends and distributions. It
is not possible to invest in an index.
AVERAGE ANNUAL TOTAL RETURN
(For the periods ended December 31, 2008)
1 Year 5 Years 10 Years
---------------------------------------------------
Aston/Montag &
Caldwell Growth
Fund:(a)
Return Before
Taxes (32.64)% (0.68)% (1.50)%
Return After
Taxes on
Distributions (33.02)% (1.27)% (2.15)%
Return After
Taxes on
Distributions
and Sale of
Fund Shares (20.74)% (0.45)% (1.23)%
---------------------------------------------------
Russell 1000
Growth Index(b) (38.44)% (3.42)% (4.27)%
---------------------------------------------------
(a)Performance reflects expense limitations that were in effect during one or
more of the periods presented. If expense limitations had not been in place, the
Fund's performance would have been reduced.
(b)Reflects no deduction for taxes, expenses or fees.
ASTON/VEREDUS SELECT GROWTH FUND
FUND PERFORMANCE
The bar chart shows how the Fund's performance has varied from year-to-year over
the periods shown. This information may help illustrate the risks of investing
in the Fund. As with all mutual funds, past performance (before and after taxes)
does not guarantee future performance.
CALENDAR YEAR TOTAL RETURN
2002 (29.40%)
2003 38.53%
2004 17.38%
2005 9.27%
2006 5.19%
2007 24.33%
2008 (45.09%)
-------------------------------------
Best quarter: 6/03 17.21%
Worst quarter: 12/08 (25.56)%
-------------------------------------
The following table indicates how the Fund's average annual returns for
different calendar periods compared to the returns of a broad-based securities
market index. All figures assume reinvestment of dividends and distributions. It
is not possible to invest in an index.
AVERAGE ANNUAL TOTAL RETURN
(For the periods ended December 31, 2008)
Since
1 Year 5 Years Inception(a)
------------------------------------------------------
Aston/Veredus
Select Growth
Fund:(b)
Return Before
Taxes (45.09)% (1.63)% (1.48)%
Return After
Taxes on
Distributions (45.09)% (2.56)% (2.14)%
Return After
Taxes on
Distributions
and Sale of
Fund Shares (29.31)% (1.60)% (1.41)%
------------------------------------------------------
Russell 1000
Growth Index(c) (38.44)% (3.42)% (3.38)%
------------------------------------------------------
(a)Fund's inception: December 31, 2001. Index data computed from December 31,
2001.
(b)Performance reflects expense limitations that were in effect during one or
more of the periods presented. If expense limitations had not been in place, the
Fund's performance would have been reduced.
(c)Reflects no deduction for taxes, expenses or fees.
After-tax returns are calculated using the highest historical marginal
individual federal income tax rates and do not reflect the impact of state and
local taxes. In some instances, the "Return After Tax on Distributions and Sale
of Fund Shares" may be greater than "Return Before Taxes" because the investor
is assumed to be able to use the capital loss of the sale of Fund shares to
offset other taxable gains. After-tax returns depend on an investor's tax
situation and may differ from those shown. After-tax returns shown are not
relevant to investors who hold their shares through tax-deferred arrangements,
such as 401(k) plans or individual retirement accounts.
22
ASTON GROWTH FUND
(Formerly Aston/ABN AMRO Growth Fund)
FUND PERFORMANCE
The bar chart shows how the Fund's performance has varied from year-to-year over
the periods shown. This information may help illustrate the risks of investing
in the Fund. As with all mutual funds, past performance (before and after taxes)
does not guarantee future performance.
CALENDAR YEAR TOTAL RETURN*
1999 23.30%
2000 2.10%
2001 (13.13%)
2002 (19.37%)
2003 21.58%
2004 5.50%
2005 1.30%
2006 3.27%
2007 4.50%
2008 (32.65%)
-------------------------------------
Best quarter: 12/01 16.27%
Worst quarter: 12/08 (20.26)%
-------------------------------------
The following table indicates how the Fund's average annual returns for
different calendar periods compared to the returns of a broad-based securities
market index. All figures assume reinvestment of dividends and distributions. It
is not possible to invest in an index.
AVERAGE ANNUAL TOTAL RETURN*
(For the periods ended December 31, 2008)
1 Year 5 Years 10 Years
-----------------------------------------------------
Aston Growth
Fund:(a)
Return Before
Taxes (32.65)% (4.98)% (1.84)%
Return After
Taxes on
Distributions (32.67)% (6.27)% (2.86)%
Return After
Taxes on
Distributions
and Sale of
Fund Shares (21.19)% (3.75)% (1.33)%
-----------------------------------------------------
Russell 1000
Growth Index(b) (38.44)% (3.42)% (4.27)%
-----------------------------------------------------
(a)Performance reflects expense limitations that were in effect during one or
more of the periods presented. If expense limitations had not been in place, the
Fund's performance would have been reduced.
(b)Reflects no deduction for taxes, expenses or fees.
*Montag & Caldwell, Inc. became the subadviser as of January 1, 2008.
Performance prior to that date reflects the performance of a previous
subadviser.
ASTON/OPTIMUM LARGE CAP OPPORTUNITY FUND
FUND PERFORMANCE
The bar chart shows the Fund's performance has varied from year-to-year over the
periods shown. This information may help illustrate the risks of investing in
the Fund. As with all mutual funds, past performance (before and after taxes)
does not guarantee future performance.
CALENDAR YEAR TOTAL RETURN
2007 20.36%
2008 (46.77%)
-------------------------------------
Best quarter: 06/07 11.47%
Worst quarter: 12/08 (28.89)%
-------------------------------------
The following table indicates how the Fund's average annual returns for
different calendar periods compared to the returns of a broad-based securities
market index. All figures assume reinvestment of dividends and distributions. It
is not possible to invest in an index.
AVERAGE ANNUAL TOTAL RETURN
(For the periods ended December 31, 2008)
Since
1 Year Inception(a)
----------------------------------------------------
Aston/Optimum Large Cap
Opportunity Fund:(b)
Return Before Taxes (46.77)% (20.18)%
Return After Taxes on
Distributions (46.77)% (20.19)%
Return After Taxes on
Distributions and
Sale of Fund Shares (30.40)% (16.84)%
----------------------------------------------------
S&P 500 Index(c) (36.99)% (18.47)%
----------------------------------------------------
(a)Fund's inception: December 28, 2006. Index data computed from December 31,
2006.
(b)Performance reflects expense limitations that were in effect during the
periods presented. If expense limitations had not been in place, the Fund's
performance would have been reduced.
(c)Reflects no deduction for taxes, expenses or fees.
After-tax returns are calculated using the highest historical marginal
individual federal income tax rates and do not reflect the impact of state and
local taxes. In some instances, the "Return After Tax on Distributions and Sale
of Fund Shares" may be greater than "Return Before Taxes" because the investor
is assumed to be able to use the capital loss of the sale of Fund shares to
offset other taxable gains. After-tax returns depend on an investor's tax
situation and may differ from those shown. After-tax returns shown are not
relevant to investors who hold their shares through tax-deferred arrangements,
such as 401(k) plans or individual retirement accounts.
23
ASTON VALUE FUND
FUND PERFORMANCE
The bar chart shows how the Fund's performance has varied from year-to-year over
the periods shown. This information may help illustrate the risks of investing
in the Fund. As with all mutual funds, past performance (before and after taxes)
does not guarantee future performance. The Common share class and Investor share
class of Aston Value Fund were reorganized into Class N shares of the Fund on
September 27, 2001, and the Fund adopted the name of its predecessor.
Performance figures shown below include the performance of the Common share
class of the predecessor fund.
CALENDAR YEAR TOTAL RETURN
1999 11.15%
2000 (0.68%)
2001 (12.25%)
2002 (13.88%)
2003 25.12%
2004 15.38%
2005 6.27%
2006 20.91%
2007 8.10%
2008 (34.65%)
-------------------------------------
Best quarter: 06/03 14.52%
Worst quarter: 12/08 (19.32)%
-------------------------------------
The following table indicates how the Fund's average annual returns for
different calendar periods compared to the returns of a broad-based securities
market index. All figures assume reinvestment of dividends and distributions. It
is not possible to invest in an index.
AVERAGE ANNUAL TOTAL RETURN
(For the periods ended December 31, 2008)
1 Year 5 Years 10 Years
-----------------------------------------------------
Aston Value
Fund:(a)
Return Before
Taxes (34.65)% 0.93% 0.90%
Return After
Taxes on
Distributions (36.16)% (0.16)% (0.18)%
Return After
Taxes on
Distributions
and Sale of
Fund Shares (20.54)% 0.99% 0.63%
----------------------------------------------------
Russell 1000 Value
Index(b) (36.85)% (0.79)% 1.36%
----------------------------------------------------
(a)Performance reflects expense limitations that were in effect during one or
more of the periods presented. If expense limitations had not been in place, the
Fund's performance would have been reduced.
(b)Reflects no deduction for taxes, expenses or fees.
ASTON/TAMRO ALL CAP FUND
FUND PERFORMANCE
The bar chart shows how the Fund's performance has varied from year-to-year over
the periods shown. This information may help illustrate the risks of investing
in the Fund. As with all mutual funds, past performance (before and after taxes)
does not guarantee future performance.
CALENDAR YEAR TOTAL RETURN
2001 (0.17%)
2002 (18.86%)
2003 29.10%
2004 12.55%
2005 4.71%
2006 13.20%
2007 7.89%
2008 (37.12%)
-------------------------------------
Best quarter: 6/03 19.96%
Worst quarter: 12/08 (23.58)%
-------------------------------------
The following table indicates how the Fund's average annual returns for
different calendar periods compared to the returns of broad-based securities
market index. All figures assume reinvestment of dividends and distributions. It
is not possible to invest in an index.
AVERAGE ANNUAL TOTAL RETURN
(For the period ended December 31, 2008)
Since
1 Year 5 Years Inception(a)
----------------------------------------------------------
Aston/TAMRO All Cap
Fund:(b)(c)
Return Before
Taxes (37.12)% (1.97)% 0.14%
Return After
Taxes on
Distributions (37.16)% (2.65)% (0.36)%
Return After
Taxes on
Distributions
and Sale of
Fund Shares (24.07)% (1.41)% 0.24%
----------------------------------------------------------
Russell 3000
Index(d) (37.31)% (1.95)% (2.15)%
----------------------------------------------------------
(a)Fund's inception: November 30, 2000. Index data computed from November 30,
2000.
(b)As of January 1, 2008, the Fund changed its name from Aston/TAMRO Large Cap
Value Fund to Aston/TAMRO All Cap Fund. Performance prior to that time reflects
the Fund's former strategy of emphasizing large cap value stocks and the
performance may have differed if the current strategy was in place.
(c)Performance reflects expense limitations that were in effect during the
periods presented. If expense limitations had not been in place, the Fund's
performance would have been reduced.
(d)Reflects no deduction for taxes, expenses or fees.
After-tax returns are calculated using the highest historical marginal
individual federal income tax rates and do not reflect the impact of state and
local taxes. In some instances, the "Return After Tax on Distributions and Sale
of Fund Shares" may be greater than "Return Before Taxes" because the investor
is assumed to be able to use the capital loss of the sale of Fund shares to
offset other taxable gains. After-tax returns depend on an investor's tax
situation and may differ from those shown. After-tax returns shown are not
relevant to investors who hold their shares through tax-deferred arrangements,
such as 401(k) plans or individual retirement accounts.
24
ASTON/RIVER ROAD DIVIDEND ALL CAP VALUE FUND
(Formerly Aston/River Road Dynamic Equity Income Fund)
FUND PERFORMANCE
The bar chart shows how the Fund's performance has varied from year-to-year over
the periods shown. This information may help illustrate the risks of investing
in the Fund. As with all mutual funds, past performance (before and after taxes)
does not guarantee future performance.
CALENDAR YEAR TOTAL RETURN
2006 25.51%
2007 0.55%
2008 (28.65%)
-------------------------------------
Best quarter: 12/06 8.18%
Worst quarter: 12/08 (19.54)%
-------------------------------------
The following table indicates how the Fund's average annual returns for
different calendar periods compared to the returns of a broad-based securities
market index. All figures assume reinvestment of dividends and distributions. It
is not possible to invest in an index.
AVERAGE ANNUAL TOTAL RETURN
(For the periods ended December 31, 2008)
Since
1 Year Inception(a)
-----------------------------------------------------
Aston/River Road Dividend
All Cap Value
Fund:(b)(c)
Return Before Taxes (28.65)% (1.84)%
Return After Taxes on
Distributions (28.97)% (2.84)%
Return After Taxes on
Distributions and
Sale of Fund Shares (18.05)% (1.57)%
-----------------------------------------------------
Russell 3000 Value
Index(d) (36.25)% (5.80)%
-----------------------------------------------------
(a)Fund's inception: June 28, 2005. Index data computed from June 30, 2005.
(b)Effective September 30, 2008, the Fund changed its name from Aston/River Road
Dynamic Equity Income Fund to Aston/River Road Dividend All Cap Fund. There was
no change in the Fund's investment objective, investment policies or portfolio
management team.
(c)Performance reflects expense limitations that were in effect during the
periods presented. If expense limitations had not been in place, the Fund's
performance would have been reduced.
(d)Reflects no deduction for taxes, expenses or fees.
ASTON/OPTIMUM MID CAP FUND
FUND PERFORMANCE
The bar chart shows how the Fund's performance has varied from year-to-year over
the periods shown. This information may help illustrate the risks of investing
in the Fund. As with all mutual funds, past performance (before and after taxes)
does not guarantee future performance.
CALENDAR YEAR TOTAL RETURN*
1999 11.44%
2000 27.46%
2001 14.21%
2002 (16.71%)
2003 41.42%
2004 18.88%
2005 1.32%
2006 20.92%
2007 12.91%
2008 (42.86%)
-------------------------------------
Best quarter: 6/03 30.10%
Worst quarter: 12/08 (29.83)%
-------------------------------------
The following table indicates how the Fund's average annual returns for
different calendar periods compared to the returns of a broad-based securities
market index. All figures assume reinvestment of dividends and distributions. It
is not possible to invest in an index.
AVERAGE ANNUAL TOTAL RETURN*
(For the periods ended December 31, 2008)
1 Year 5 Years 10 Years
-----------------------------------------------------
Aston/Optimum Mid
Cap:(a)
Return Before
Taxes (42.86)% (1.24)% 6.04%
Return After
Taxes on
Distributions (43.10)% (1.92)% 5.16%
Return After
Taxes on
Distributions
and Sale of
Fund Shares (27.56)% (0.79)% 5.20%
-----------------------------------------------------
S&P MidCap 400
Index(b) (36.23)% (0.08)% 4.46%
-----------------------------------------------------
(a)Performance reflects expense limitations that were in effect during one or
more of the periods presented. If expense limitations had not been in place, the
Fund's performance would have been reduced.
(b)Reflects no deduction for taxes, expenses or fees.
*Optimum Investment Advisors, LLC became the subadviser in October 2003.
Performance prior to that date reflects the performance of a previous
subadviser. However, the Fund's portfolio manager has not changed.
After-tax returns are calculated using the highest historical marginal
individual federal income tax rates and do not reflect the impact of state and
local taxes. In some instances, the "Return After Tax on Distributions and Sale
of Fund Shares" may be greater than "Return Before Taxes" because the investor
is assumed to be able to use the capital loss of the sale of Fund shares to
offset other taxable gains. After-tax returns depend on an investor's tax
situation and may differ from those shown. After-tax returns shown are not
relevant to investors who hold their shares through tax-deferred arrangements,
such as 401(k) plans or individual retirement accounts.
25
ASTON/MONTAG & CALDWELL MID CAP GROWTH FUND
FUND PERFORMANCE
The bar chart shows the Fund's performance for the period shown. This
information may help illustrate the risks of investing in the Fund. As with all
mutual funds, past performance (before and after taxes) does not guarantee
future performance.
CALENDAR YEAR TOTAL RETURN
2008 (45.81%)
-------------------------------------
Best quarter: 6/08 2.27%
Worst quarter: 12/08 (31.59)%
-------------------------------------
The following table indicates how the Fund's average annual return for the
calendar period compared to the returns of a broad-based securities market
index. All figures assume reinvestment of dividends and distributions. It is not
possible to invest in an index.
AVERAGE ANNUAL TOTAL RETURN
(For the periods ended December 31, 2008)
Since
1 Year Inception(a)
--------------------------------------------------------
Aston/Montag & Caldwell Mid Cap
Growth Fund:(b)
Return Before Taxes (45.81)% (41.37)%
Return After Taxes on
Distributions (45.81)% (41.37)%
Return After Taxes on
Distributions and Sale of
Fund Shares (29.78)% (34.92)%
--------------------------------------------------------
Russell Midcap Growth Index(c) (44.32)% (41.62)%
--------------------------------------------------------
(a)Fund's inception: November 2, 2007. Index data computed from October 31,
2007.
(b)Performance reflects expense limitations that were in effect during the
periods presented. If expense limitations had not been in place, the Fund's
performance would have been reduced.
(c)Reflects no deduction for taxes, expenses or fees.
ASTON/CARDINAL MID CAP VALUE FUND
FUND PERFORMANCE
The bar chart shows the Fund's performance for the period shown. This
information may help illustrate the risks of investing in the Fund. As with all
mutual funds, past performance (before and after taxes) does not guarantee
future performance.
CALENDAR YEAR TOTAL RETURN
2008 (36.75%)
-------------------------------------
Best quarter: 6/08 (6.35)%
Worst quarter: 12/08 (23.86)%
-------------------------------------
The following table indicates how the Fund's average annual return for the
calendar period compared to the returns of a broad-based securities market
index. All figures assume reinvestment of dividends and distributions. It is not
possible to invest in an index.
AVERAGE ANNUAL TOTAL RETURN
(For the periods ended December 31, 2008)
Since
1 Year Inception(a)
--------------------------------------------------------------
Aston/Cardinal Mid Cap Value
Fund:(b)
Return Before Taxes (36.75)% (34.67)%
Return After Taxes on
Distributions (36.86)% (34.77)%
Return After Taxes on
Distributions and Sale of
Fund Shares (23.75)% (29.31)%
--------------------------------------------------------------
Russell Midcap Value Index(c) (38.44)% (37.62)%
--------------------------------------------------------------
(a)Fund's inception: November 2, 2007. Index data computed from October 31,
2007.
(b)Performance reflects expense limitations that were in effect during the
periods presented. If expense limitations had not been in place, the Fund's
performance would have been reduced.
(c)Reflects no deduction for taxes, expenses or fees.
After-tax returns are calculated using the highest historical marginal
individual federal income tax rates and do not reflect the impact of state and
local taxes. In some instances, the "Return After Tax on Distributions and Sale
of Fund Shares" may be greater than "Return Before Taxes" because the investor
is assumed to be able to use the capital loss of the sale of Fund shares to
offset other taxable gains. After-tax returns depend on an investor's tax
situation and may differ from those shown. After-tax returns shown are not
relevant to investors who hold their shares through tax-deferred arrangements,
such as 401(k) plans or individual retirement accounts.
26
ASTON/RIVER ROAD SMALL-MID CAP FUND
FUND PERFORMANCE
The bar chart shows the Fund's performance for the period shown. This
information may help illustrate the risks of investing in the Fund. As with all
mutual funds, past performance (before and after taxes) does not guarantee
future performance.
CALENDAR YEAR TOTAL RETURN
2008 (27.31%)
-------------------------------------
Best quarter: 6/08 3.38%
Worst quarter: 12/08 (22.40)%
-------------------------------------
The following table indicates how the Fund's average annual return for the
calendar period compared to the returns of a broad-based securities market
index. All figures assume reinvestment of dividends and distributions. It is not
possible to invest in an index.
AVERAGE ANNUAL TOTAL RETURN
(For the periods ended December 31, 2008)
Since
1 Year Inception(a)
--------------------------------------------------------
Aston/River Road Small-Mid Cap
Fund:(b)
Return Before Taxes (27.31)% (19.81)%
Return After Taxes on
Distributions (27.33)% (19.82)%
Return After Taxes on
Distributions and Sale of
Fund Shares (17.73)% (16.61)%
--------------------------------------------------------
Russell 2500 Value Index(c) (31.99)% (24.48)%
--------------------------------------------------------
(a)Fund's inception: March 29, 2007. Index data computed from March 31, 2007.
(b)Performance reflects expense limitations that were in effect during the
periods presented. If expense limitations had not been in place, the Fund's
performance would have been reduced.
(c)Reflects no deduction for taxes, expenses or fees.
ASTON/VEREDUS AGGRESSIVE GROWTH FUND
FUND PERFORMANCE
The bar chart shows how the Fund's performance has varied from year-to-year over
the periods shown. This information may help illustrate the risks of investing
in the Fund. As with all mutual funds, past performance (before and after taxes)
does not guarantee future performance.
CALENDAR YEAR TOTAL RETURN
1999 112.57%
2000 30.18%
2001 (13.16%)
2002 (43.91%)
2003 44.48%
2004 20.69%
2005 2.29%
2006 (2.44%)
2007 12.20%
2008 (45.37%)
-------------------------------------
Best quarter: 12/99 44.67%
Worst quarter: 12/08 (26.00)%
-------------------------------------
The following table indicates how the Fund's average annual returns for
different calendar periods compared to the returns of a broad-based securities
market index. All figures assume reinvestment of dividends and distributions. It
is not possible to invest in an index.
AVERAGE ANNUAL TOTAL RETURN
(For the periods ended December 31, 2008)
1 Year 5 Years 10 Years
-----------------------------------------------------
Aston/Veredus
Aggressive
Growth Fund:(a)
Return Before
Taxes (45.37)% (5.89)% 3.70%
Return After
Taxes on
Distributions (45.43)% (7.36)% 1.85%
Return After
Taxes on
Distributions
and Sale of
Fund Shares (29.43)% (4.74)% 2.79%
-----------------------------------------------------
Russell 2000
Growth Index(b) (38.54)% (2.35)% (0.76)%
-----------------------------------------------------
(a)Performance reflects expense limitations that were in effect during one or
more of the periods presented. If expense limitations had not been in place, the
Fund's performance would have been reduced.
(b)Reflects no deduction for taxes, expenses or fees.
After-tax returns are calculated using the highest historical marginal
individual federal income tax rates and do not reflect the impact of state and
local taxes. In some instances, the "Return After Tax on Distributions and Sale
of Fund Shares" may be greater than "Return Before Taxes" because the investor
is assumed to be able to use the capital loss of the sale of Fund shares to
offset other taxable gains. After-tax returns depend on an investor's tax
situation and may differ from those shown. After-tax returns shown are not
relevant to investors who hold their shares through tax-deferred arrangements,
such as 401(k) plans or individual retirement accounts.
27
ASTON/TAMRO SMALL CAP FUND
FUND PERFORMANCE
The bar chart shows how the Fund's performance has varied from year-to-year over
the periods shown. This information may help illustrate the risks of investing
in the Fund. As with all mutual funds, past performance (before and after taxes)
does not guarantee future performance.
CALENDAR YEAR TOTAL RETURN
2001 13.57%
2002 (11.08%)
2003 56.86%
2004 11.95%
2005 2.34%
2006 27.84%)
2007 0.27%
2008 (33.19%)
-------------------------------------
Best quarter: 6/03 25.28%
Worst quarter: 12/08 (25.91)%
-------------------------------------
The following table indicates how the Fund's average annual returns for
different calendar periods compared to the returns of a broad-based securities
market index. All figures assume reinvestment of dividends and distributions. It
is not possible to invest in an index.
AVERAGE ANNUAL TOTAL RETURN
(For the periods ended December 31, 2008)
Since
1 Year 5 Years Inception(a)
---------------------------------------------------------
Aston/TAMRO Small
Cap Fund:(b)
Return Before
Taxes (33.19)% (0.38)% 6.76%
Return After
Taxes on
Distributions (33.19)% (0.93)% 5.93%
Return After
Taxes on
Distributions
and Sale of
Fund Shares (21.57)% (0.24)% 5.77%
---------------------------------------------------------
Russell 2000
Index(c) (33.79)% (0.93)% 2.73%
---------------------------------------------------------
(a)Fund's inception: November 30, 2000. Index data computed from November 30,
2000.
(b)Performance reflects expense limitations that were in effect during one or
more of the periods presented. If expense limitations had not been in place, the
Fund's performance would have been reduced.
(c)Reflects no deduction for taxes, expenses or fees.
ASTON/RIVER ROAD SMALL CAP VALUE FUND
FUND PERFORMANCE
The bar chart shows how the Fund's performance has varied from year-to-year over
the periods shown. This information may help illustrate the risks of investing
in the Fund. As with all mutual funds, past performance (before and after taxes)
does not guarantee future performance.
CALENDAR YEAR TOTAL RETURN
2006 30.83%
2007 (5.96%)
2008 (30.23%)
-------------------------------------
Best quarter: 3/06 10.91%
Worst quarter: 12/08 (22.89)%
-------------------------------------
The following table indicates the Fund's average annual returns for different
calendar periods compared to the returns of a broad-based securities market
index. All figures assume reinvestment of dividends and distributions. It is not
possible to invest in an index.
AVERAGE ANNUAL TOTAL RETURN
(For the periods ended December 31, 2008)
Since
1 Year Inception(a)
-----------------------------------------------------
Aston/River Road Small
Cap Value Fund:(b)
Return Before Taxes (30.23)% (1.85)%
Return After Taxes on
Distributions (30.24)% (2.24)%
Return After Taxes on
Distributions and
Sale of Fund Shares (19.64)% (1.65)%
-----------------------------------------------------
Russell 2000 Value
Index(c) (28.92)% (5.45)%
-----------------------------------------------------
(a)Fund's inception: June 28, 2005. Index data computed from June 30, 2005.
(b)Performance reflects expense limitations that were in effect during one or
more of the periods presented. If expense limitations had not been in place, the
Fund's performance would have been reduced.
(c)Reflects no deduction for taxes, expenses or fees.
After-tax returns are calculated using the highest historical marginal
individual federal income tax rates and do not reflect the impact of state and
local taxes. In some instances, the "Return After Tax on Distributions and Sale
of Fund Shares" may be greater than "Return Before Taxes" because the investor
is assumed to be able to use the capital loss of the sale of Fund shares to
offset other taxable gains. After-tax returns depend on an investor's tax
situation and may differ from those shown. After-tax returns shown are not
relevant to investors who hold their shares through tax-deferred arrangements,
such as 401(k) plans or individual retirement accounts.
28
ASTON/NEPTUNE INTERNATIONAL FUND
FUND PERFORMANCE
The bar chart shows the performance of Class I shares of the Fund for the period
shown. The returns shown are for Class I shares that are not offered in this
prospectus. Class N shares are new and do not yet have a calendar year of
operations. Class I shares and Class N shares are invested in the same portfolio
of securities, so the annual returns would differ only to the extent that Class
I shares and Class N shares do not have the same expenses. The annual returns of
the Class N shares would be lower than the returns of the Class I shares, due to
distribution fees paid by Class N shares. This information may help illustrate
the risks of investing in the Fund. As with all mutual funds, past performance
(before and after taxes) does not guarantee future performance.
CALENDAR YEAR TOTAL RETURN
2008 (52.96%)
------------------------------------
Best quarter: 6/08 4.85%
Worst quarter: 9/08 (30.22)%
------------------------------------
The following table indicates how the Fund's average annual return of Class I
shares of the Fund for the calender period compared to the returns of a broad-
based securities market index. All figures assume reinvestment of dividends and
distributions. It is not possible to invest in an index.
AVERAGE ANNUAL TOTAL RETURN
(For the period ended December 31, 2008)
Since
1 Year Inception(a)
--------------------------------------------------------
Aston/Neptune International
Fund -- Class I:(b)
Return Before Taxes (52.96)% (34.23)%
Return After Taxes on
Distributions (53.02)% (34.47)%
Return After Taxes on
Distributions and Sale of
Fund Shares (34.35)% (28.71)%
--------------------------------------------------------
MSCI EAFE and Emerging Markets
Index(c) (45.52)% (33.07)%
--------------------------------------------------------
(a)Inception of Class I shares: August 6, 2007. Index data computed from July
31, 2007.
(b)Performance reflects expense limitations that were in effect during the
periods presented. If expense limitations had not been in place, the Fund's
performance would have been reduced.
(c)Reflects no deduction for taxes, expenses or fees.
ASTON/FORTIS GLOBAL REAL ESTATE FUND
(Formerly Aston/ABN AMRO Global Real Estate Fund)
FUND PERFORMANCE
The bar chart shows the Fund's performance for the period shown. This
information may help illustrate the risks of investing in the Fund. As with all
mutual funds, past performance (before and after taxes) does not guarantee
future performance.
CALENDAR YEAR TOTAL RETURN
2008 (48.40%)
-------------------------------------
Best quarter: 3/08 (3.61)%
Worst quarter: 12/08 (33.80)%
-------------------------------------
The following table indicates how the Fund's average annual return for the
calendar period compared to the returns of a broad-based securities market
index. All figures assume reinvestment of dividends and distributions. It is not
possible to invest in an index.
AVERAGE ANNUAL TOTAL RETURN
(For the periods ended December 31, 2008)
Since
1 Year Inception(a)
--------------------------------------------------------
Aston/Fortis Global Real Estate
Fund:(b)
Return Before Taxes (48.40)% (39.04)%
Return After Taxes on
Distributions (48.53)% (39.44)%
Return After Taxes on
Distributions and Sale of
Fund Shares (31.29)% (32.70)%
--------------------------------------------------------
Global Property Research 250 Net
Index(c) (46.90)% (37.36)%
--------------------------------------------------------
(a)Fund's inception: August 3, 2007. Index data computed from July 31, 2007.
(b)Performance reflects expense limitations that were in effect during the
periods presented. If expense limitations had not been in place, the Fund's
performance would have been reduced.
(c)Reflects no deduction for taxes, expenses or fees.
After-tax returns are calculated using the highest historical marginal
individual federal income tax rates and do not reflect the impact of state and
local taxes. In some instances, the "Return After Tax on Distributions and Sale
of Fund Shares" may be greater than "Return Before Taxes" because the investor
is assumed to be able to use the capital loss of the sale of Fund shares to
offset other taxable gains. After-tax returns depend on an investor's tax
situation and may differ from those shown. After-tax returns shown are not
relevant to investors who hold their shares through tax-deferred arrangements,
such as 401(k) plans or individual retirement accounts.
29
ASTON/SMART PORTFOLIOS FUND
(Formerly Aston/Smart Allocation ETF Fund)
FUND PERFORMANCE
The Fund is new and does not have a full calendar year of operations.
Performance information was included in the Fund's annual report dated October
31, 2008.
ASTON/NEW CENTURY ABSOLUTE RETURN ETF FUND
FUND PERFORMANCE
The Fund is new and does not have a full calendar year of operations.
Performance information was included in the Fund's annual report dated October
31, 2008.
After-tax returns are calculated using the highest historical marginal
individual federal income tax rates and do not reflect the impact of state and
local taxes. In some instances, the "Return After Tax on Distributions and Sale
of Fund Shares" may be greater than "Return Before Taxes" because the investor
is assumed to be able to use the capital loss of the sale of Fund shares to
offset other taxable gains. After-tax returns depend on an investor's tax
situation and may differ from those shown. After-tax returns shown are not
relevant to investors who hold their shares through tax-deferred arrangements,
such as 401(k) plans or individual retirement accounts.
30
ASTON/MB ENHANCED EQUITY INCOME FUND
FUND PERFORMANCE
The Fund is new and does not have a full calendar year of operations.
Performance information was included in the Fund's annual report dated October
31, 2008.
ASTON/FORTIS REAL ESTATE FUND
(Formerly Aston/ABN AMRO Real Estate Fund)
FUND PERFORMANCE
The bar chart shows how the Fund's performance has varied from year-to-year over
the periods shown. This information may help illustrate the risks of investing
in the Fund. As with all mutual funds, past performance (before and after taxes)
does not guarantee future performance. The Common share class and Investor share
class of Aston/Fortis Real Estate Fund were reorganized into Class N shares of
the Fund on September 27, 2001, and the Fund adopted the name of its
predecessor. Performance figures shown below include the performance of the
Common share class of the predecessor fund.
CALENDAR YEAR TOTAL RETURN
1999 (3.32%)
2000 28.77%
2001 7.29%
2002 4.60%
2003 36.28%
2004 33.39%
2005 13.17%
2006 35.95%
2007 (19.14%)
2008 (41.88%)
-------------------------------------
Best quarter: 12/04 16.96%
Worst quarter: 12/08 (39.07)%
-------------------------------------
The following table indicates how the Fund's average annual returns for
different calendar periods compared to the returns of a broad-based securities
market index. All figures assume reinvestment of dividends and distributions. It
is not possible to invest in an index.
AVERAGE ANNUAL TOTAL RETURN
(For the periods ended December 31, 2008)
1 Year 5 Years 10 Years
--------------------------------------------------------
Aston/Fortis Real
Estate Fund:(a)
Return Before Taxes (41.88)% (0.72)% 6.27%
Return After Taxes
on Distributions (42.55)% (3.51)% 3.84%
Return After Taxes
on Distributions
and Sale of Fund
Shares (27.18)% 0.10% 5.28%
--------------------------------------------------------
MSCI US REIT Index(b) (37.97)% 0.67% 5.23%
--------------------------------------------------------
(a)Performance reflects expense limitations that were in effect during one or
more of the periods presented. If expense limitations had not been in place, the
Fund's performance would have been reduced.
(b)Reflects no deduction for taxes, expenses or fees.
After-tax returns are calculated using the highest historical marginal
individual federal income tax rates and do not reflect the impact of state and
local taxes. In some instances, the "Return After Tax on Distributions and Sale
of Fund Shares" may be greater than "Return Before Taxes" because the investor
is assumed to be able to use the capital loss of the sale of Fund shares to
offset other taxable gains. After-tax returns depend on an investor's tax
situation and may differ from those shown. After-tax returns shown are not
relevant to investors who hold their shares through tax-deferred arrangements,
such as 401(k) plans or individual retirement accounts.
31
ASTON/MONTAG & CALDWELL BALANCED FUND
FUND PERFORMANCE
The bar chart shows how the Fund's performance has varied from year-to-year over
the periods shown. This information may help illustrate the risks of investing
in the Fund. As with all mutual funds, past performance (before and after taxes)
does not guarantee future performance.
CALENDAR YEAR TOTAL RETURN
1999 12.64%
2000 (0.81%)
2001 (5.52%)
2002 (12.35%)
2003 11.66%
2004 3.13%
2005 3.38%
2006 6.12%
2007 15.34%
2008 (19.40%)
-------------------------------------
Best quarter: 12/99 10.77%
Worst quarter: 12/08 (10.36)%
-------------------------------------
The following table indicates how the Fund's average annual returns for
different calendar periods compared to the returns of broad-based securities
market indices. All figures assume reinvestment of dividends and distributions.
It is not possible to invest in an index.
AVERAGE ANNUAL TOTAL RETURN
(For the periods ended December 31, 2008)
1 Year 5 Years 10 Years
-----------------------------------------------------
Aston/Montag &
Caldwell
Balanced
Fund:(a)
Return Before
Taxes (19.40)% 1.02% 0.85%
Return After
Taxes on
Distributions (19.64)% 0.67% 0.20%
Return After
Taxes on
Distributions
and Sale of
Fund Shares (12.45)% 0.75% 0.44%
-----------------------------------------------------
S&P 500 Index(b) (36.99)% (2.19)% (1.38)%
-----------------------------------------------------
Barclays Capital
U.S. Government
Credit Bond
Index(b) 5.70% 4.64% 5.64%
-----------------------------------------------------
60% S&P 500
Index/40%
Barclays Capital
U.S. Government
Credit Bond
Index(b) (21.91)% 0.72% 1.71%
-----------------------------------------------------
(a)Performance reflects expense limitations that were in effect during one or
more of the periods presented. If expense limitations had not been in place, the
Fund's performance would have been reduced.
(b)Reflects no deduction for taxes, expenses or fees.
ASTON BALANCED FUND
FUND PERFORMANCE
The bar chart shows how the Fund's performance has varied from year-to-year over
the periods shown. This information may help illustrate the risks of investing
in the Fund. As with all mutual funds, past performance (before and after taxes)
does not guarantee future performance.
CALENDAR YEAR TOTAL RETURN*
1999 12.89%
2000 5.46%
2001 (6.14%)
2002 10.04%
2003 15.78%
2004 5.12%
2005 1.62%
2006 4.48%
2007 4.52%
2008 (22.87%)
-------------------------------------
Best quarter: 12/01 9.29%
Worst quarter: 12/08 (11.60)%
-------------------------------------
The following table indicates how the Fund's average annual returns for
different calendar periods compared to the returns of broad-based securities
market indices. All figures assume reinvestment of dividends and distributions.
It is not possible to invest in an index.
AVERAGE ANNUAL TOTAL RETURN*
(For the periods ended December 31, 2008)
1 Year 5 Years 10 Years
------------------------------------------------------
Aston Balanced
Fund:(a)
Return Before
Taxes (22.87)% (2.09)% 0.46%
Return After
Taxes on
Distributions (23.12)% (4.40)% (1.36)%
Return After
Taxes on
Distributions
and Sale of
Fund Shares (14.69)% (1.68)% 0.17%
------------------------------------------------------
S&P 500 Index(b) (36.99)% (2.19)% (1.38)%
------------------------------------------------------
Barclays Capital
U.S. Aggregate
Bond Index(b) 5.24% 4.65% 5.63%
------------------------------------------------------
60% S&P 500
Index/40%
Barclays Capital
U.S. Aggregate
Bond Index(b) (22.07)% 0.71% 1.68%
------------------------------------------------------
(a)Performance reflects expense limitations that were in effect during one or
more of the periods presented. If expense limitations had not been in place, the
Fund's performance would have been reduced.
(b)Reflects no deduction for taxes, expenses or fees.
*The Fund adopted a multi-manager structure as of December 1, 2006. Taplin,
Canida & Habacht, LLC has managed the fixed income portion of the portfolio
since December 1, 2006. As of January 1, 2008, Montag & Caldwell, Inc. manages
the equity component of the portfolio. Performance from December 1, 2006 through
December 31, 2007 reflects the performance of the previous subadviser of the
equity component of the portfolio. The performance of the Fund prior to December
1, 2006 and January 1, 2008 may have been different if the current multi-manager
structure had been in place.
After-tax returns are calculated using the highest historical marginal
individual federal income tax rates and do not reflect the impact of state and
local taxes. In some instances, the "Return After Tax on Distributions and Sale
of Fund Shares" may be greater than "Return Before Taxes" because the investor
is assumed to be able to use the capital loss of the sale of Fund shares to
offset other taxable gains. After-tax returns depend on an investor's tax
situation and may differ from those shown. After-tax returns shown are not
relevant to investors who hold their shares through tax-deferred arrangements,
such as 401(k) plans or individual retirement accounts.
32
ASTON/TCH FIXED INCOME FUND
FUND PERFORMANCE
The bar chart shows how the Fund's performance has varied from year-to-year over
the periods shown. This information may help illustrate the risks of investing
in the Fund. As with all mutual funds, past performance (before and after taxes)
does not guarantee future performance.
CALENDAR YEAR TOTAL RETURN*
1999 (0.43%)
2000 10.85%
2001 7.46%
2002 6.66%
2003 3.89%
2004 4.58%
2005 1.36%
2006 6.38%
2007 4.16%
2008 (1.73%)
------------------------------------
Best quarter: 9/01 4.09%
Worst quarter: 9/08 (4.95)%
------------------------------------
The following table indicates how the Fund's average annual returns for
different calendar periods compared to the returns of a broad-based securities
market index. All figures assume reinvestment of dividends and distributions. It
is not possible to invest in an index.
AVERAGE ANNUAL TOTAL RETURN*
(For the periods ended December 31, 2008)
1 Year 5 Years 10 Years
------------------------------------------------------
Aston/TCH Fixed
Income Fund:(a)
Return Before
Taxes (1.73)% 2.91% 4.26%
Return After
Taxes on
Distributions (3.49)% 1.12% 2.21%
Return After
Taxes on
Distributions
and Sale of
Fund Shares (1.11)% 1.44% 2.39%
------------------------------------------------------
Barclays Capital
U.S. Aggregate
Bond Index(b) 5.24% 4.65% 5.63%
------------------------------------------------------
(a)Performance reflects expense limitations that were in effect during one or
more of the periods presented. If expense limitations had not been in place, the
Fund's performance would have been reduced.
(b)Reflects no deduction for taxes, expenses or fees.
*Taplin, Canida & Habacht, LLC became the subadviser as of December 1, 2006.
Performance prior to that date reflects the performance of a previous investment
adviser.
ASTON/FORTIS INVESTOR MONEY MARKET FUND
(Formerly Aston/ABN AMRO Investor Money Market Fund)
FUND PERFORMANCE
The bar chart shows how the Fund's performance has varied from year-to-year over
the periods shown. This information may help illustrate the risks of investing
in the Fund. As with all mutual funds, past performance (before and after taxes)
does not guarantee future performance.
CALENDAR YEAR TOTAL RETURN
1999 4.80%
2000 6.07%
2001 3.62%
2002 1.27%
2003 0.70%
2004 0.87%
2005 2.70%
2006 4.50%
2007 4.54%
2008 1.62%
-----------------------------------
Best quarter: 12/00 1.56%
Worst quarter: 12/08 0.08%
-----------------------------------
The following table indicates how the Fund's average annual returns for
different calendar periods compared to the returns of the iMoneyNet First Tier
Retail Average. All figures assume reinvestment of dividends and distributions.
It is not possible to invest in an index.
AVERAGE ANNUAL TOTAL RETURN
(For the periods ended December 31, 2008)
1 Year 5 Years 10 Years
---------------------------------------------------
Aston/Fortis
Investor Money
Market Fund:(a) 1.62% 2.84% 3.05%
---------------------------------------------------
iMoneyNet First
Tier Retail
Average 2.14% 2.81% 2.95%
---------------------------------------------------
(a)Performance reflects expense limitations that were in effect during one or
more of the periods presented. If expense limitations had not been in place, the
Fund's performance would have been reduced.
To obtain the Fund's current yield, please call 800 992-8151 or visit our Web
site at www.astonfunds.com.
After-tax returns are calculated using the highest historical marginal
individual federal income tax rates and do not reflect the impact of state and
local taxes. In some instances, the "Return After Tax on Distributions and Sale
of Fund Shares" may be greater than "Return Before Taxes" because the investor
is assumed to be able to use the capital loss of the sale of Fund shares to
offset other taxable gains. After-tax returns depend on an investor's tax
situation and may differ from those shown. After-tax returns shown are not
relevant to investors who hold their shares through tax-deferred arrangements,
such as 401(k) plans or individual retirement accounts.
33
Fund Expenses
As an investor in the Funds, you pay certain indirect fees and expenses, which
are described in the table below.
SHAREHOLDER FEES
As a benefit of investing in Class N shares of Aston Funds, you do not incur any
sales loads or exchange fees and generally no redemption fees. HOWEVER, A
REDEMPTION FEE OF 2.00% OF THE AMOUNT REDEEMED IS CHARGED ON REDEMPTIONS WITHIN
90 DAYS OF PURCHASE TO SHAREHOLDERS OF ASTON/FORTIS REAL ESTATE FUND,
ASTON/NEPTUNE INTERNATIONAL FUND AND ASTON/FORTIS GLOBAL REAL ESTATE FUND UNLESS
AN EXCEPTION IS AVAILABLE. See "Redemption Fees" in the "Shareholder
Information" Section for more details.
ANNUAL FUND OPERATING EXPENSES
Operating expenses are the normal costs of operating any mutual fund. These
expenses are not charged directly to investors. They are paid from a Fund's
assets and are expressed as an expense ratio, which is a percentage of average
daily net assets.
ACQUIRED TOTAL NET
MANAGEMENT DISTRIBUTION OTHER FUND FEES EXPENSE FEE EXPENSE
FUND FEES (12b-1) FEES EXPENSES AND EXPENSES RATIO WAIVERS RATIO
Aston/Montag & Caldwell
Growth(a) 0.69% 0.25% 0.14% --% 1.08% --% 1.08%
Aston/Veredus Select Growth(a) 0.80 0.25 0.29 0.02 1.36(d)(e) (0.04) 1.32(b)(e)
Aston Growth(a) 0.70 0.25 0.19 -- 1.14(e) -- 1.14(e)(f)
Aston/Optimum Large Cap
Opportunity 0.80 0.25 0.82 0.01 1.88(d)(e) (0.65) 1.23(b)(e)(f)
Aston Value(a) 0.80 0.25 0.13 -- 1.18 -- 1.18(h)
Aston/TAMRO All Cap 0.80 0.25 0.83 -- 1.88 (0.68) 1.20(b)
Aston/River Road Dividend All
Cap Value(a) 0.70 0.25 0.40 0.06 1.41(d)(e) (0.05) 1.36(b)(e)
Aston/Optimum Mid Cap(a) 0.73 0.25 0.18 -- 1.16 -- 1.16
Aston/Montag & Caldwell Mid Cap
Growth 0.85 0.25 3.21(c) 0.01 4.32(d)(e) (2.91) 1.41(b)(e)
Aston/Cardinal Mid Cap Value 0.90 0.25 6.60(c) 0.01 7.76(d)(e) (6.35) 1.41(b)(e)
Aston/River Road Small-Mid
Cap(a) 1.00 0.25 0.28(c) 0.02 1.55(d)(e) (0.03) 1.52(b)(e)
Aston/Veredus Aggressive
Growth(a) 1.00 0.25 0.30 0.01 1.56(d)(e) (0.06) 1.50(b)(e)
Aston/TAMRO Small Cap(a) 0.90 0.25 0.17 0.02 1.34(d)(e) -- 1.34(e)
Aston/River Road Small Cap
Value(a) 0.90 0.25 0.30 0.02 1.47(d)(e) -- 1.47(e)
Aston/Neptune International(a) 1.00 0.25 1.55(c) 0.03 2.83(d)(e) (1.53) 1.30(b)(e)
Aston/Fortis Global Real Estate 1.00 0.25 0.82(c) 0.01 2.08(d)(e) (0.57) 1.51(b)(e)
Aston/Smart Portfolios 0.80 0.25 2.53(c) 0.21 3.79(d)(e) (2.28) 1.51(b)(e)(f)
Aston/New Century Absolute
Return ETF(g) 1.00 0.25 1.77(c) 0.26 3.28(d)(e) (1.52) 1.76(b)(e)
Aston/MB Enhanced Equity Income 0.70 0.25 1.07(c) -- 2.02 (0.92) 1.10(b)
Aston/Fortis Real Estate(a) 1.00 0.25 0.32 -- 1.57 (0.20) 1.37(b)
Aston/Montag & Caldwell
Balanced(a) 0.75 0.25 0.74 0.01 1.75(d)(e) -- 1.75(e)(h)
Aston Balanced 0.70 0.25 0.54 0.01 1.50(d)(e) -- 1.50(e)(f)(h)
Aston/TCH Fixed Income(a) 0.55 0.25 0.26 0.02 1.08(d)(e) (0.32) 0.76(b)(e)
Aston/Fortis Investor Money
Market 0.40 N/A 0.44(j) 0.01 0.85(d)(e) -- 0.85(e)(i)
(a)The Fund offers multiple classes of shares. Expenses and performance may vary
between classes. The information set forth in the table above and the example
below relates only to Class N shares, which are offered in this prospectus.
Other classes of shares are offered in separate prospectuses.
(b)Aston is contractually obligated to waive management fees and/or reimburse
ordinary operating expenses through February 28, 2010 at the rates shown in the
table, not including fees and expenses from investments in other investment
companies (acquired fund fees and expenses). As shown in the table, expenses
would be higher without such agreement. For a period of three years subsequent
to the commencement of operations of the Aston/Optimum Large Cap Opportunity
Fund, Aston/River Road Small-Mid Cap Fund, Aston/Neptune International Fund,
Aston/Fortis Global Real Estate Fund, Aston/Montag & Caldwell Mid Cap Growth
Fund, Aston/Cardinal Mid Cap Value Fund, Aston/Smart Portfolios Fund, Aston/MB
Enhanced Equity Income Fund and Aston/New Century Absolute Return ETF Fund,
Aston is entitled to be reimbursed by each Fund for previously waived fees and
reimbursed expenses to the extent that each Fund's expense ratio, not including
acquired fund fees and expenses, remains below the operating expense cap after
such reimbursement.
(c)Other expenses have been restated to reflect the effect of offering costs in
the current year's expense ratio.
34
(d)Total expenses are the sum of a Fund's direct annual operating expenses and
the Fund's indirect fees and expenses from investments in other investment
companies (acquired fund fees and expenses).
(e)The expense ratio may not equal a Fund's ratio of expenses to average net
assets before reimbursement and/or waiver of expenses by the Adviser in the
"Financial Highlights" Section, which reflects the operating expenses of the
Funds including interest expenses and does not include fees and expenses from
investments in other investment companies (acquired fund fees and expenses).
(f)The expense ratios do not include interest expenses incurred by the Fund from
utilizing a line of credit. If interest expenses were included, the net expense
ratio would be as follows for the following Funds: Aston Growth, 1.15%;
Aston/Optimum Large Cap Opportunity, 1.25%; Aston/Smart Portfolios, 1.52%; and
Aston Balanced, 1.52%.
(g)The subadviser has agreed that for the period from the Fund's commencement of
operations through, and including, December 31, 2008, and for each subsequent
full calendar year of operations thereafter, if in any such period the Fund had
a total return (before taxes) of less than zero, then the subadviser will waive
its fee in its entirety for the next succeeding calendar year. For any period
when this waiver is in effect, the adviser has agreed to reduce its advisory fee
to 0.15%. For the period ended December 31, 2008, the Fund's total return was
less than zero, therefore the adviser will reduce its advisory fee to 0.15% for
the 2009 calendar year, and the subadviser will reduce its fees to zero.
(h)The Adviser has voluntarily waived management fees and/or reimbursed expenses
for the following Funds:
VOLUNTARY
EXPENSE
EFFECTIVE DATE LIMITATION
-------------- ----------
Aston/Montag & Caldwell
Balanced 11/01/2006 1.35%
Aston Balanced 12/19/2008 1.50%
Aston Value 3/01/2009 1.07%
These voluntary waivers do not include fees and expenses from investment in
other investment companies (acquired funds fees and expenses) or interest
expense. The Adviser may terminate such voluntary waivers/reimbursements at any
time.
(i)From time to time, FIM may limit expenses to the extent it deems appropriate
to enhance the yield of the Fund during periods when fixed expenses have a
significant impact on the yield of the Fund because of low interest rates. This
expense limitation policy is voluntary and temporary and may be revised or
terminated by FIM at any time without notice.
(j)Other expenses include amounts incurred by the Fund in connection with the
Fund's participation in the U.S. Department of Treasury Temporary Guarantee
Program (the "Program"). For this fiscal year, actual expenses may be higher due
to asset changes and/or the extension of the Program. The Program terminates on
April 30, 2009 but may be extended by the Treasury Department to September 18,
2009. If the Treasury Department extends the Program, the Board of Trustees will
consider whether to participate.
35
EXAMPLE
This hypothetical example shows the operating expenses you would incur as a
shareholder if you invested $10,000 in a Fund over the time periods shown and
you redeem all your shares at the end of the period. The example assumes you
reinvested all dividends and distributions, that the average annual return was
5% and that operating expenses remained the same and expenses were capped for
one year in each period, if applicable, as noted above. The example is for
comparison purposes only and does not represent a Fund's actual or future
expenses and returns.
FUND 1 YEAR 3 YEARS 5 YEARS 10 YEARS
Aston/Montag & Caldwell Growth $110 $ 343 $ 595 $1,317
Aston/Veredus Select Growth 134 427 741 1,632
Aston Growth 116 362 628 1,386
Aston/Optimum Large Cap Opportunity 125 528 956 2,148
Aston Value 120 375 649 1,432
Aston/TAMRO All Cap 122 525 953 2,146
Aston/River Road Dividend All Cap Value 138 441 766 1,687
Aston/Optimum Mid Cap 118 368 638 1,409
Aston/Montag & Caldwell Mid Cap Growth 144 1,045 1,958 4,296
Aston/Cardinal Mid Cap Value 144 1,707 3,186 6,539
Aston/River Road Small-Mid Cap 155 487 842 1,843
Aston/Veredus Aggressive Growth 153 487 844 1,851
Aston/TAMRO Small Cap 136 425 734 1,613
Aston/River Road Small Cap Value 150 465 803 1,757
Aston/Neptune International 132 732 1,358 3,046
Aston/Fortis Global Real Estate 154 597 1,066 2,365
Aston/Smart Portfolios 154 948 1,761 3,882
Aston/New Century Absolute Return ETF 179 868 1,581 3,473
Aston/MB Enhanced Equity Income 112 545 1,003 2,274
Aston/Fortis Real Estate 139 476 836 1,850
Aston/Montag & Caldwell Balanced 178 551 949 2,062
Aston Balanced 153 474 818 1,791
Aston/TCH Fixed Income 78 312 564 1,288
Aston/Fortis Investor Money Market 87 271 471 1,049
36
Additional Information Regarding Investment Strategies
The investment policies of Aston/River Road Dividend All Cap Value Fund,
Aston/Optimum Large Cap Opportunity Fund, Aston/Optimum Mid Cap Fund,
Aston/Montag & Caldwell Mid Cap Growth Fund, Aston/Cardinal Mid Cap Value Fund,
Aston/River Road Small-Mid Cap Fund, Aston/River Road Small Cap Value Fund,
Aston/TAMRO Small Cap Fund, Aston/Fortis Real Estate Fund, Aston/Neptune
International Fund, Aston/Fortis Global Real Estate Fund, Aston/Smart Portfolios
Fund, Aston/New Century Absolute Return ETF Fund, Aston/MB Enhanced Equity
Income Fund and Aston/TCH Fixed Income Fund relating to the type of securities
in which 80% of each Fund's assets must be invested may be changed by the Board
of Trustees without shareholder approval. Shareholders will, however, receive at
least 60 days notice of such changes.
In addition to the principal investment strategies described in the Fund
Summaries, there may be times when the Funds use secondary investment strategies
in seeking to achieve their investment objectives. Information regarding such
secondary strategies, as well as additional information regarding certain
principal strategies, is shown below.
DEPOSITARY RECEIPTS OF FOREIGN SECURITIES
A Fund may invest in foreign securities in the form of depositary receipts
and/or securities traded directly on U.S. exchanges. Depositary receipts
represent ownership of securities in foreign companies and are held in banks and
trust companies. They can include ADRs, which are traded on U.S. exchanges and
are U.S. dollar-denominated, EDRs, which are traded on European exchanges and
may not be denominated in the same currency as the security they represent, and
GDRs, which are issued globally and evidence a similar ownership arrangement.
Although ADRs, EDRs and GDRs do not eliminate the risks inherent in investing in
the securities of foreign issuers, which include market, political, currency and
regulatory risk, by investing in ADRs, EDRs or GDRs rather than directly in
securities of foreign issuers, a Fund may avoid currency risks during the
settlement period for purchases or sales. In general, there is a large, liquid
market in the United States for many ADRs. The information available for ADRs is
subject to the accounting, auditing and financial reporting standards of the
domestic market or exchange on which they are traded, in which standards are
more uniform and more exacting than those to which many foreign issuers may be
subject. A Fund may invest in ADRs sponsored or unsponsored by the issuer of the
underlying security. In the case of an unsponsored ADR, a Fund may bear higher
expenses and encounter greater difficulty in receiving shareholder
communications than it would have with a sponsored ADR.
ASSET-BACKED SECURITIES
Asset-backed securities are payable from pools of obligations other than
mortgages. Most asset-backed securities involve consumer or commercial debts
with maturities of less than ten years. However, almost any type of fixed income
assets (including other fixed income securities) may be used to create an asset-
backed security. Asset-backed securities may take the form of notes or pass
through certificates. Asset-backed securities have prepayment risks.
BELOW INVESTMENT GRADE (HIGH YIELD) SECURITIES
Below investments grade (high yield) securities are lower rated, higher yielding
securities issued by corporations. They are generally rated below investment-
grade (i.e., Ba1/BB+ and below) by national bond rating agencies, or if unrated,
are judged by an adviser or a subadviser to be of equivalent quality. They are
considered speculative and are sometimes called "junk bonds."
CMOS
CMOs are fixed income securities secured by mortgage loans and other mortgage-
backed securities. CMOs carry general fixed income securities risks and risks
associated with mortgage-backed securities.
COMMERCIAL PAPER
Commercial paper are short-term fixed income securities issued by banks,
corporations and other borrowers. There is the risk that the issuer of the
commercial paper will not be able to make principal and/or interest payments.
Commercial paper may include securities issued in reliance on the private
placement exemption under Section 4(2) of the Securities Act of 1933, as
amended. Section 4(2) paper is generally sold to an institutional investor, such
as a Fund, that agrees that it is purchasing the paper for investment and not
with a view to public distribution. Any resale of Section 4(2) commercial paper
must similarly be in an exempt transaction.
CONVERTIBLE SECURITIES
Convertible securities are fixed income or equity securities that pay interest
or dividends and that may be exchanged on certain terms into common stock of the
same corporation.
Because of the conversion feature, the market value of convertible securities
tends to move together with the market value of the underlying stock. The value
of convertible securities is also affected by prevailing interest rates, the
credit quality of the issuer and any call provisions. There is the risk that the
issuer of the security will not be able to make principal and/or interest
payments as well as the risk that the holder of the security may not take
advantage of the convertible features in the appropriate time frame.
37
CORPORATE DEBT SECURITIES
Corporate debt securities are fixed income securities issued by businesses.
Notes, bonds, debentures and commercial paper are the most prevalent types of
corporate debt securities. A Fund may also purchase interests in bank loans made
to companies. The credit risks of corporate debt securities vary widely among
issuers.
In addition, the credit risk of an issuer's debt security may vary based on its
priority for repayment. For example, higher ranking (senior) debt securities
have a higher priority than lower ranking (subordinated) securities. This means
that the issuer might not make payments on subordinated securities while
continuing to make payments on senior securities. In addition, in the event of
bankruptcy, holders of senior securities may receive amounts otherwise payable
to the holders of subordinated securities.
Some subordinated securities, such as trust preferred and capital securities
notes, also permit the issuer to defer payments under certain circumstances. For
example, insurance companies issue securities known as surplus notes that permit
the insurance company to defer any payment that would reduce its capital below
regulatory requirements.
DEBENTURES
Debentures are bonds or promissory notes that are secured by the general credit
of the issuer, but not secured by specific assets of the issuer. There is the
risk that the issuer of the security will not be able to make principal and/or
interest payments.
DEFENSIVE STRATEGY
There may be times when a Fund takes temporary positions that may not achieve
its investment objective or follow its principal investment strategies for
defensive reasons. This includes investing all or a portion of its total assets
in cash or cash equivalents, such as money market securities and repurchase
agreements. Although a Fund would do this in seeking to avoid losses, following
a defensive strategy could reduce the benefit from any market upswings.
DERIVATIVES
The Funds may engage in derivatives primarily for hedging purposes, to maintain
liquidity or in anticipation of changes in portfolio composition. Derivatives
have a return tied to a formula based upon an interest rate, index, price of a
security, or other measurement. Derivatives include options, futures, forward
contracts, swaps and related products.
Hedging involves using derivatives to offset a potential loss in one position by
establishing an interest in an opposite position. Any loss generated by the
derivative should be offset by gains in the hedged investment. While hedging can
reduce or eliminate losses, it can also reduce or eliminate gains. A Fund may
realize a loss if interest rates, security prices or indices move in the
opposite direction than the portfolio manager anticipates.
Derivatives will only be used when consistent with the objectives and strategy
of a Fund. The portfolio manager(s) will ensure that the effective market
exposure resulting from the use of derivatives will not exceed the total amount
available for investment within a Fund (i.e., the use of derivatives will not
result in a Fund being leveraged). All derivative positions will be covered by
that Fund's existing assets. The portfolio manager(s) will place a limit on the
derivative exposure as a proportion of assets.
EQUITY SECURITIES
Equity securities represent a share of an issuer's earnings and assets, after
the issuer pays its liabilities. A Fund cannot predict the income it will
receive from equity securities because issuers generally have discretion as to
the payment of any dividends or distributions. However, equity securities offer
greater potential for appreciation than many other types of securities, because
their value may increase with the value of the issuer's business. Types of
equity securities include common stocks, preferred stocks, warrants and rights,
convertible securities and other securities that represent underlying local
shares, such as depositary receipts.
ETFS
A Fund may invest in ETFs, which are shares of other investment companies. An
ETF is an investment company that seeks to track the performance of an index by
holding in its portfolio shares of all the companies, or a representative sample
of the companies, that are components of a particular index. ETFs are traded on
a securities exchange based on their market value. When a Fund invests in
another investment company, shareholders of the Fund bear their proportionate
share of the other investment company's fees and expenses, including operating,
registration, trustee, licensing and marketing, as well as their share of the
Funds' fees and expenses. A Fund may not purchase more than 3% of an ETF's
outstanding shares unless the ETF and/or the Fund has received an order for an
exemptive relief from such limitations from the Securities and Exchange
Commission ("SEC") and the ETF and the Fund take appropriate steps to comply
with any conditions in such order.
FIXED INCOME SECURITIES
Fixed income securities pay interest, dividends or distributions at a specified
rate. The rate may be a fixed percentage of the principal or adjusted
periodically. In addition, the issuer of a fixed income security must repay the
principal amount of the security, normally within a specified time. Fixed income
securities provide more regular income than equity securities. However, the
returns on fixed income securities are limited and normally do not increase with
the issuer's earnings. This limits the potential appreciation of fixed income
securities as compared to equity securities.
A security's yield measures the annual income earned on a security as a
percentage of its price. A security's yield will increase or decrease depending
upon whether it costs less (a discount) or more (a premium) than the principal
amount. If the issuer may redeem the security before its scheduled maturity, the
price and yield on a discount or premium security may change based upon the
probability of an early redemption. Securities with higher risks generally have
higher yields. The Equity Funds may invest in fixed income securities to offset
the volatility of the stock market. Fixed income securities provide a stable
flow of income for a Fund.
38
FOREIGN SECURITIES
Foreign securities are securities issued by corporations, governments and other
issuers located outside the United States. Foreign securities are subject to
additional risks.
MORTGAGE-BACKED SECURITIES
Mortgage-backed securities represent interests in pools of mortgages. The
mortgages that comprise a pool normally have similar interest rates, maturities
and other terms. Mortgages may have fixed or adjustable interest rates.
Interests in pools of adjustable rate mortgages are known as ARMs. Mortgage-
backed securities come in a variety of forms. Many have extremely complicated
terms. The simplest form of mortgage-backed securities are pass-through
certificates. An issuer of pass-through certificates gathers monthly payments
from an underlying pool of mortgages. Then, the issuer deducts its fees and
expenses and passes the balance of the payments onto the certificate holders
once a month. Holders of pass-through certificates receive a pro rata share of
all payments and pre-payments from the underlying mortgages. As a result, the
holders assume all the prepayment risks of the underlying mortgages.
OTHER INVESTMENT COMPANIES
The Funds may invest in securities of other investment companies, including
ETFs, open-end funds and closed-end funds. An ETF is an investment company that
seeks to track the performance of an index by holding in its portfolio shares of
all the companies, or a representative sample of the companies, that are
components of a particular index. Closed-end funds are investment companies that
typically issue a fixed number of shares that trade on a securities exchange or
over-the-counter. The risks of investment in other investment companies
typically reflect the risk of the types of securities in which the funds invest.
Investments in ETFs and closed-end funds are subject to the additional risk that
shares of the fund may trade at a premium or discount to their net asset value
per share. When a Fund invests in another investment company, shareholders of
the Fund bear their proportionate share of the other investment company's fees
and expenses as well as their share of the Fund's fees and expenses.
PREFERRED STOCKS
Preferred stocks are stocks that pay dividends at a specified rate. Dividends
are paid on preferred stocks before they are paid on common stocks. In addition,
preferred stockholders have priority over common stockholders as to the proceeds
from the liquidation of a company's assets, but are subordinate to the claims of
all creditors.
PTPS
A Fund may invest in equity securities of PTPs that are taxed as partnerships
for federal income tax purposes. These include master limited partnerships and
certain other partnerships that meet conditions contained in the Internal
Revenue Code of 1986, as amended (the "Code"). In order to be treated as a
partnership for federal income tax purposes, a PTP must generally derive a
substantial amount of its income and gains from certain sources, including from
the exploration, development, mining or production, processing, refining,
transportation or marketing of minerals or natural resources. Other PTPs may be
treated as partnerships for federal income tax purposes if certain other limited
exceptions under the Code apply. PTPs are typically organized as either limited
partnerships or limited liability companies and are listed and traded on a U.S.
securities exchange.
REITS
REITs are generally publicly traded entities that invest in office buildings,
apartment complexes, industrial facilities, shopping centers and other
commercial spaces. REITs are pooled investment vehicles that typically invest
directly in real estate, in mortgages and loans collateralized by real estate,
or in a combination of the two. "Equity" REITs invest primarily in real estate
that produces income from rentals. "Mortgage" REITs invest primarily in
mortgages and derive their income from interest payments. REITs usually
specialize in a particular type of property and may concentrate their
investments in particular geographical areas. REITs issue stocks and most REIT
stocks trade on the major stock exchanges or over-the-counter.
REPURCHASE AGREEMENTS
Repurchase agreements, or repos, are transactions in which a security (usually a
government security) is purchased with a simultaneous commitment to sell it back
to the seller (a commercial bank or recognized securities dealer) at an agreed
upon price on an agreed upon date, usually the next day. If the seller of the
underlying security under the repurchase agreement should default on its
obligation to repurchase the underlying security, a Fund may experience delay or
difficulty in exercising its right to realize upon the security. Additionally, a
Fund may incur a loss if the value of the security should decline, as well as
any disposition costs in liquidating the security.
ROYALTY INCOME TRUSTS
Royalty income trusts can be organized in a variety of ways in the U.S., Canada
and other countries. Beneficial units in royalty and income trusts generally
represent a profits interest in the production of oil or other minerals.
RULE 144A SECURITIES
Rule 144A securities are restricted securities that can be sold to qualified
institutional buyers under the Securities Act of 1933, as amended. Investing in
Rule 144A securities may increase the illiquidity of a Fund's investments in the
event that an adequate trading market does not exist for these securities. To
the extent there is an adequate trading market for lower-rated securities, Rule
144A securities generally are not subject to an increase in illiquidity.
39
U.S. GOVERNMENT SECURITIES
These are fixed income obligations of the U.S. government and its various
agencies. U.S. government securities issued by the U.S. Treasury (bills, notes
and bonds) are backed by the full faith and credit of the federal government.
Some government securities not issued by the U.S. Treasury also carry the
government's full faith and credit backing on principal or interest payments.
Some securities are backed by the issuer's right to borrow from the U.S.
Treasury and some are backed only by the credit of the issuing organization. All
government securities are considered highly creditworthy. This guarantee,
however, does not extend to the market prices for such securities which can
fluctuate.
40
Commercial
Paper
Below and
Depositary Investment Securities
Receipts Asset- Grade of
of Mortage (High Other Convert- Corporate
Foreign Backed Yield) Investment ible Debt
FUND Securities Securities Securities Cmo's Companies Securities Securities
Aston/Montag & Caldwell
Growth X X XP X
Aston/Veredus Select
Growth X X X
Aston Growth X X XP X
Aston/Optimum Large Cap
Opportunity X X X
Aston Value X X X
Aston/TAMRO All Cap X X X X
Aston/River Road
Dividend All Cap Value X X XP
Aston/Optimum Mid Cap X X XP X
Aston/Montag & Caldwell
Mid Cap Growth X X X
Aston/Cardinal Mid Cap
Value X X X
Aston/River Road Small-
Mid Cap X X X
Aston/Veredus Aggressive
Growth X X X
Aston/TAMRO Small Cap X X X X
Aston/River Road Small
Cap Value X X X
Aston/Neptune
International X X X
Aston/Fortis Global Real
Estate X X
Aston/Smart Portfolios X
Aston/New Century
Absolute Return ETF X
Aston/MB Enhanced Equity
Income X
Aston/Fortis Real Estate X X
Aston/Montag & Caldwell
Balanced X XP X X XP XP
Aston Balanced X XP X X X XP XP
Aston/TCH Fixed Income
Fund XP X X X X XP
Aston/Fortis Investor
Money Market XP X
Deriva-
tives
(E.G.,
Options, ETFS as a
Forwards, Principal Fixed
Defensive Futures, Equity investment Income
FUND Debentures Strategy Swaps) Securities Strategy Securities
Aston/Montag & Caldwell
Growth X X X XP X
Aston/Veredus Select
Growth X X X XP
Aston Growth X X X XP X
Aston/Optimum Large Cap
Opportunity X X XP
Aston Value X X XP
Aston/TAMRO All Cap X X XP
Aston/River Road
Dividend All Cap Value X X XP X
Aston/Optimum Mid Cap X X X XP X
Aston/Montag & Caldwell
Mid Cap Growth X X XP
Aston/Cardinal Mid Cap
Value X X XP
Aston/River Road Small-
Mid Cap X X XP
Aston/Veredus Aggressive
Growth X X X XP
Aston/TAMRO Small Cap X XP
Aston/River Road Small
Cap Value X X XP
Aston/Neptune
International X X XP
Aston/Fortis Global Real
Estate X X XP
Aston/Smart Portfolios X XP
Aston/New Century
Absolute Return ETF X X XP
Aston/MB Enhanced Equity
Income X XP XP
Aston/Fortis Real Estate X X XP
Aston/Montag & Caldwell
Balanced X X X XP XP
Aston Balanced XP X X XP XP
Aston/TCH Fixed Income
Fund XP X X XP
Aston/Fortis Investor
Money Market X X XP
Royalty
and Rule
Foreign Preferred Repurchase Income 144A
FUND Securities Stocks PTPs REIT Agreements Trusts Securities
Aston/Montag & Caldwell
Growth X X X X
Aston/Veredus Select
Growth X X X X
Aston Growth X X X X
Aston/Optimum Large Cap
Opportunity X X X X X
Aston Value X X X X X
Aston/TAMRO All Cap X X X X X
Aston/River Road
Dividend All Cap Value X X X XP X X X
Aston/Optimum Mid Cap X XP X X
Aston/Montag & Caldwell
Mid Cap Growth X X X X X
Aston/Cardinal Mid Cap
Value X X X X
Aston/River Road Small-
Mid Cap X X X X X
Aston/Veredus Aggressive
Growth X X X X
Aston/TAMRO Small Cap X X X X X
Aston/River Road Small
Cap Value X X X X X
Aston/Neptune
International XP X X X
Aston/Fortis Global Real
Estate XP X X XP X X X
Aston/Smart Portfolios X X
Aston/New Century
Absolute Return ETF X X
Aston/MB Enhanced Equity
Income X X
Aston/Fortis Real Estate XP X XP X X
Aston/Montag & Caldwell
Balanced X X X X
Aston Balanced X X X X
Aston/TCH Fixed Income
Fund X X X
Aston/Fortis Investor
Money Market X XP XP
U.S.
Government
FUND Securities
Aston/Montag & Caldwell
Growth X
Aston/Veredus Select
Growth X
Aston Growth X
Aston/Optimum Large Cap
Opportunity X
Aston Value X
Aston/TAMRO All Cap X
Aston/River Road
Dividend All Cap Value X
Aston/Optimum Mid Cap X
Aston/Montag & Caldwell
Mid Cap Growth X
Aston/Cardinal Mid Cap
Value X
Aston/River Road Small-
Mid Cap X
Aston/Veredus Aggressive
Growth X
Aston/TAMRO Small Cap X
Aston/River Road Small
Cap Value X
Aston/Neptune
International X
Aston/Fortis Global Real
Estate X
Aston/Smart Portfolios X
Aston/New Century
Absolute Return ETF X
Aston/MB Enhanced Equity
Income X
Aston/Fortis Real Estate X
Aston/Montag & Caldwell
Balanced XP
Aston Balanced XP
Aston/TCH Fixed Income
Fund XP
Aston/Fortis Investor
Money Market XP
X = Investment strategy applicable to a Fund.
P = Components of a Fund's principal investment strategy.
Portfolio Holdings
A description of the policies and procedures with respect to the disclosure of
each Fund's portfolio holdings is available in the SAI and on our Web site at
www.astonfunds.com.
41
Investment Terms
The following is a list of terms with definitions that you may find helpful as
you read this prospectus.
AMERICAN DEPOSITARY RECEIPTS (ADRS). ADRs represent ownership of securities in
foreign stock and are issued by U.S. banks and trust companies. ADRs are
denominated in U.S. dollars and are traded on a U.S. exchange.
BANK DEPOSITS. Cash, checks or drafts deposited in a financial institution for
credit to a customer's account. Banks differentiate between demand deposits
(checking accounts on which the customer may draw) and time deposits, which pay
interest and have a specified maturity or require 30 days' notice before
withdrawal.
BARCLAYS CAPITAL U.S. AGGREGATE BOND INDEX. An unmanaged index representing more
than 5,000 taxable government, investment-grade corporate and mortgage-backed
securities.
BARCLAYS CAPITAL U.S. GOVERNMENT/CREDIT BOND INDEX. An unmanaged index that
includes U.S. Government and investment-grade corporate securities with at least
one year to maturity.
BOTTOM-UP INVESTING. An investing approach in which securities are researched
and chosen individually with less consideration given to economic or market
cycles.
CALL OPTION. An agreement that gives an investor the right (but not the
obligation) to buy a stock, bond, commodity, or other instrument at a specified
price within a specific time period.
CITIGROUP BROAD INVESTMENT-GRADE BOND INDEX. A market-capitalization weighted
index that includes fixed-rate Treasury, government-sponsored, mortgage, asset-
backed and investment-grade issues (BBB- or Baa3) with a maturity of one year or
longer.
COLLATERALIZED MORTGAGE OBLIGATIONS (CMOS). CMOs are fixed income securities
secured by mortgage loans and other mortgage-backed securities.
CONVEXITY. Convexity is a measure of how the duration of a bond changes as
interest rates change. The greater the convexity of a bond, the greater the
exposure of interest rate risk to the portfolio.
CORPORATE BONDS. Fixed income securities issued by corporations.
CORRELATION. A statistical measure of how two securities move in relation to
each other.
COVERED CALL. An options strategy whereby an investor holds a long position in
an asset and writes (sells) call options on the same asset in an attempt to
generate increased income from the asset.
DERIVATIVE. A security whose price is dependent upon or derived from one or more
underlying assets. The derivative itself is merely a contract between two or
more parties.
DIVERSIFICATION. The practice of investing in a broad range of securities to
reduce risk.
DURATION. A calculation of the average life of a bond (or portfolio of bonds)
that is a useful measure of the bond's price sensitivity to interest rate
changes. The higher the duration number, the greater the risk and reward
potential of the bond.
EAFE COUNTRIES. Countries located in Europe, Australasia and the Far East.
EUROPEAN DEPOSITARY RECEIPTS (EDRS). EDRs represent ownership of securities in
foreign stock and are issued by a foreign bank. EDRs are generally denominated
in foreign currencies and may not be denominated in the same currency as the
securities they represent. Generally, EDRs are designed for use in the foreign
securities markets.
EMERGING MARKETS. Countries whose economy and securities markets are considered
by the World Bank to be emerging or developing. Emerging market countries may be
located in such regions as Asia, Latin America, the Middle East, Southern
Europe, Eastern Europe and Africa.
EXCHANGE-TRADED FUND (ETF). An ETF is an investment company that seeks to track
the performance of an index by holding in its portfolio either the contents of
the index or a representative sample of the securities in the index.
EXPENSE RATIO. A fund's cost of doing business, expressed as a percentage of its
net assets and disclosed in a prospectus.
GLOBAL DEPOSITARY RECEIPTS (GDRS). GDRs represent ownership of securities in
foreign stock and are issued by a foreign bank. GDRs are generally denominated
in foreign currencies and may not be denominated in the same currency as the
securities they represent. Generally, GDRs are designed for use in the foreign
securities markets.
GLOBAL PROPERTY RESEARCH (GPR) 250 NET INDEX. An Index containing approximately
250 of the most liquid property companies in the world as measured by the
highest twelve-month trading volume in U.S. dollars.
GROWTH AT A REASONABLE PRICE (GARP). GARP investing involves buying stocks that
have a reasonable price/earnings ratio in relationship to a company's earning
growth rate.
GROWTH STYLE INVESTING. An investing approach that involves buying stocks of
companies that are generally industry leaders with above-average, sustainable
growth rates. Typically, growth stocks are the stocks of the fastest growing
companies in the most rapidly growing sectors of the economy. Growth stock
valuation levels (e.g., price-to-earnings ratio) will generally be higher than
value stocks.
42
IMONEYNET FIRST TIER RETAIL AVERAGE. An average consisting of non-government
funds that hold commercial paper considered to be of the highest credit quality
by at least one nationally recognized statistical rating organization.
INVESTMENT OBJECTIVE. The goal that an investor and a mutual fund seek together.
Examples include current income, total return, long-term capital growth, etc.
ISSUER. The company, municipality or government agency that issues a security,
such as a stock, bond or money market security.
LARGE-CAP STOCKS. Stocks issued by large companies. Unless otherwise defined by
a portfolio manager, subadviser or the adviser, a large-cap company is defined
as one with a market capitalization of $5 billion or more. Typically, large-cap
companies are established, well-known companies; some may be multinationals.
LIMITED PARTNERSHIPS. A business organization with one or more general partners
who manage the business and are personally liable for the partnership's debts,
and one or more limited partners who are liable only to the extent of their
investment in the partnership.
MANAGEMENT FEE. The amount that a mutual fund pays to the investment adviser for
its services.
MARKET CAPITALIZATION. Value of a corporation or other entity as determined by
the market price of its securities.
MID-CAP STOCKS. Stocks issued by mid-sized companies. Unless otherwise defined
by a portfolio manager, subadviser or the adviser, a mid-cap company is defined
as one with a market capitalization between $1.5 billion and $5 billion, which
is similar to the range of the Standard & Poor's MidCap 400 Index (S&P 400).
MONEY MARKET SECURITIES. Short-term fixed income securities of federal and local
governments, banks and corporations.
MSCI AWCI, EX U.S. INDEX. The Morgan Stanley Capital International Index All
Country World Index excluding U.S. Index is a free-float adjusted market
capitalization index that is designed to measure equity market performance in
the global and emerging markets excluding the U.S.
MSCI EAFE AND EMERGING MARKETS INDEX. The Morgan Stanley Capital International
("MSCI") Europe, Australasia and Far East ("EAFE") and Emerging Markets Index,
is designed to measure market performance in the global developed and emerging
markets excluding the U.S. and Canada.
MSCI US REIT INDEX. An unmanaged index that tracks the returns of REITs.
MSCI WORLD EX-US INDEX. A free float-adjusted market capitalization index that
is designed to measure global developed market equity performance excluding the
U.S.
MSCI WORLD INDEX. A free float-adjusted market capitalization index that is
designed to measure global developed market equity performance.
MULTI-CAP STRATEGY A multi-cap strategy invests in the equity securities of
issuers of any market capitalization, and generally will hold securities of
issuers representing a range of sizes.
MUTUAL FUND. An investment company that stands ready to buy back its shares at
their current net asset value. Most mutual funds continuously offer new shares
to investors.
NET ASSET VALUE (NAV). The per share value of a mutual fund, found by
subtracting the fund's liabilities from its assets and dividing by the number of
shares outstanding. Mutual funds calculate their NAVs at least once a day.
PUBLICLY TRADED PARTNERSHIPS (PTPS). PTPs are limited partnerships that also
have interests traded in the equity securities market.
REAL ESTATE INVESTMENT TRUSTS (REITS). REITs are pooled investment vehicles that
typically invest directly in real estate, in mortgages and loans collateralized
by real estate, or in a combination of the two.
RISK/REWARD TRADE-OFF. The principle that an investment must offer higher
potential returns as compensation for the likelihood of increased volatility.
RUSSELL 1000 GROWTH INDEX. An unmanaged index measuring the performance of those
Russell 1000 companies with higher price-to-book ratios and higher forecasted
growth values.
RUSSELL 1000 VALUE INDEX. An unmanaged index comprised of securities in the
Russell 1000 Index. Companies in this index tend to exhibit lower price-to-book
ratios and lower cost-to-growth values.
RUSSELL 2000 INDEX. An unmanaged index that contains the 2,000 smallest common
stocks in the Russell 3000 Index (which contains the 3,000 largest stocks in the
U.S. based on total market capitalization).
RUSSELL 2000 GROWTH INDEX. An unmanaged index comprised of securities in the
Russell 2000 Index with a greater than average growth orientation. Companies in
this index tend to exhibit higher price-to-book and price-earnings ratios.
RUSSELL 2000 VALUE INDEX. An unmanaged index comprised of securities in the
Russell 2000 Index with lower price-to-book ratios and lower forecasted growth
values.
RUSSELL 2500 VALUE INDEX. An unmanaged index comprised of the 2500 smallest
companies (measured by market capitalization) in the Russell 3000 Index. The
Russell 2500 Value Index measures the performance of those Russell 2500
companies with lower price-to-book ratios and lower forecasted growth.
43
RUSSELL 3000 INDEX. The Russell 3000 Index offers investors access to the broad
U.S. equity universe representing approximately 98% of the U.S. market. The
Russell 3000 Index is constructed to provide a comprehensive, unbiased and
stable barometer of the broad market and is completely reconstituted annually to
ensure new and growing equities are reflected.
RUSSELL 3000 VALUE INDEX. An index that measures the performance of those
Russell 3000 companies with lower price-to-book ratios and lower forecasted
growth values.
RUSSELL MIDCAP GROWTH INDEX. An unmanaged index comprised of securities in the
Russell Midcap Index with a greater than average growth orientation. Companies
in this index tend to exhibit higher price-to-book and price-to-earnings ratios.
RUSSELL MIDCAP VALUE INDEX. The Russell Midcap Index offers investors access to
the mid-cap value segment of the U.S. equity universe. It is an unmanaged index
comprised of securities in the Russell Midcap Index constructed to provide a
comprehensive and unbiased barometer for the mid-cap value segment.
SMALL-CAP STOCKS. Stocks issued by smaller companies. Unless otherwise defined
by a portfolio manager, subadviser or the adviser, a small-cap company is
defined as one with a market capitalization of less than $1.5 billion, which
approximates the size of the largest company in the Russell 2000 Index.
STANDARD & POOR'S (S&P) 500 INDEX. An unmanaged index of 500 widely traded
industrial, transportation, financial and public utility stocks.
S&P MIDCAP 400 INDEX. An unmanaged market value weighted index that consists of
400 domestic stocks chosen for market size, liquidity and industry group
representation.
TOP-DOWN INVESTING. An investing approach in which securities are chosen by
looking at the industry or sector level based on market trends and/or economic
forecasts.
TOTAL RETURN. A measure of a fund's performance that encompasses all elements of
return: dividends, capital gains distributions and changes in net asset value.
Total return is the change in value of an investment over a given period,
assuming investment of dividends and capital gains distributions, expressed as a
percentage of the initial investment.
12B-1 FEE. A mutual fund fee, named for the SEC rule that permits it, used to
pay for distribution costs, such as advertising and commissions paid to dealers.
If a fund has a 12b-1 fee, it is found in the fee table of its prospectus. (See
"Distribution Plan 12b-1 Fees" in the "Shareholder Information" Section.)
VALUE STYLE INVESTING. An investing approach that involves buying stocks that
are out of favor and/or undervalued compared to their peers. Generally, value
stock valuation levels are lower than growth stock valuation levels.
VARIABLE RATE SECURITIES. Securities that have interest rates that may be
adjusted periodically to reflect changes in interest rates. Interest rate
adjustments can either raise or lower the income generated by the securities.
YANKEE BONDS. Dollar-denominated bonds issued in the U.S. by foreign banks and
corporations.
YIELD. A measure of net income (dividends and interest) earned by the securities
in a fund's portfolio, less a fund's expenses, during a specified period. A
fund's yield is expressed as a percentage of the maximum offering price per
share on a specified day.
ZERO-COUPON BONDS. Debt securities that do not pay interest at regular intervals
and are issued at a discount from face value. The discount approximates the
total amount of interest the bond will accrue from the date of issuance to
maturity.
44
Management of the Funds
THE INVESTMENT ADVISERS
ASTON ASSET MANAGEMENT LLC
Aston Asset Management LLC, 120 N. LaSalle Street, 25th Floor, Chicago, IL
60602, is the investment adviser to the Funds with the exception of Aston/Fortis
Investor Money Market Fund. Aston, a majority owned subsidiary of Highbury
Financial Inc., was formed for the purpose of acquiring the mutual fund and
separately managed account business of ABN AMRO Asset Management, Inc. and its
affiliates ("ABN AMRO"). More information on Highbury Financial Inc. is
available in the SAI. Aston was formed in April 2006 and as of December 31,
2008, Aston had approximately $3.4 billion in assets under management.
Aston provides investment advisory, mutual fund administration and distribution-
related services to the Aston Funds. Aston manages each Fund by selecting one or
more other investment managers to manage the Fund's portfolio on a sub-advisory
basis. Aston is responsible for identifying and selecting the Fund's investment
managers, monitoring the performance of such managers, and terminating managers.
Aston and the Aston Funds have received from the SEC an exemptive order that
allows Aston to allocate and reallocate the assets of the Funds between and
among any subadvisers so selected pursuant to a "manager of managers" structure.
Under this structure, Aston has the authority to retain and terminate
subadvisers, engage new subadvisers and make material revisions to the terms of
the subadvisory agreements subject to the approval of the Board of Trustees, but
not shareholder approval.
FORTIS INVESTMENT MANAGEMENT USA, INC.
Prior to August 1, 2008, ABN AMRO served as the investment adviser to
Aston/Fortis Investor Money Market Fund. On August 1, 2008, ABN AMRO merged into
Fortis Investment Management USA, Inc. ("FIM") and FIM became the investment
adviser to Aston/Fortis Investor Money Market Fund. FIM is a wholly-owned
indirect subsidiary of Fortis Bank SA/NV ("Fortis Bank"). Since October 2008,
the Belgian government has owned substantially all of the outstanding capital
and voting rights of Fortis Bank pending a sale to a private buyer. Fortis Bank
and its affiliates subsequently announced a transaction in which BNP Paribas SA
would acquire approximately 75% of the outstanding capital and voting rights of
Fortis Bank. The BNP Paribas transaction is subject to legal challenges and
numerous closing conditions, and remains pending as of the date of this
prospectus. FIM is located at 75 State Street, Boston, Massachusetts 02109. As
of December 31, 2008, FIM had approximately $21.8 billion of assets under
management consisting of primarily institutional accounts, including insurance,
pension and profit-sharing trusts.
GENERAL
As the investment adviser to the Funds, each investment adviser is paid an
annual management fee based on the average daily net assets of a Fund. Out of
its fee, Aston pays the subadviser(s) of each Fund. The table, later in this
"Management of the Funds" Section, shows the management fees paid by each Fund
to its adviser for the most recent fiscal year. The investment advisory
agreement with each adviser may be terminated at any time by the Fund or the
adviser upon 60 days written notice to the other party. A Fund may effect
termination by an action of the Board of Trustees or by a vote of a majority of
the Fund's outstanding voting securities.
A discussion regarding the basis for the Board of Trustees approval of the
Funds' investment advisory agreements and subadvisory agreements (as applicable)
will be included in the Funds' next annual or semiannual report to shareholders
following such approval.
THE SUBADVISERS
The accompanying information highlights each Fund's subadviser and its portfolio
manager(s). Additional information about the portfolio managers' compensation,
other accounts managed by the portfolio managers and the portfolio managers'
ownership of securities in the Funds is available in the SAI.
ASTON/MONTAG & CALDWELL GROWTH FUND
ASTON/MONTAG & CALDWELL BALANCED FUND
ASTON/MONTAG & CALDWELL MIDCAP GROWTH FUND
ASTON BALANCED FUND (EQUITY PORTION)
ASTON GROWTH FUND
Montag & Caldwell, Inc. ("Montag & Caldwell"), 3455 Peachtree Road NE Suite
1200, Atlanta, Georgia 30326, was founded in 1945. Montag & Caldwell is a
wholly-owned direct subsidiary of Fortis Bank. As of December 31, 2008, Montag &
Caldwell managed approximately $10.4 billion in assets in institutional accounts
and mutual funds.
ASTON/FORTIS REAL ESTATE FUND
ASTON/FORTIS GLOBAL REAL ESTATE FUND
FIM serves as subadviser to the above Funds and is a wholly-owned indirect
subsidiary of Fortis Bank.
In rendering investment advisory services to the Aston/Fortis Global Real Estate
Fund, FIM may use the resources of affiliates located outside of the U.S. in
reliance on the terms of a no-action letter granted to ABN AMRO by the SEC in
1997 governing the use of "Participating Affiliates." Non-U.S. affiliates and
their associated persons who provide services to U.S. clients are subject to the
supervision of FIM and other conditions of the no-action letter.
45
ASTON/VEREDUS SELECT GROWTH FUND
ASTON/VEREDUS AGGRESSIVE GROWTH FUND
Veredus Asset Management LLC ("Veredus"), 6060 Dutchmans Lane, Louisville,
Kentucky 40205, was founded in 1998. As of December 2008, B. Anthony Weber is
the majority shareholder of the firm. As of December 31, 2008, Veredus managed
approximately $450 million in assets.
ASTON/TAMRO ALL CAP FUND
ASTON/TAMRO SMALL CAP FUND
TAMRO Capital Partners, LLC ("TAMRO") is located at 1660 Duke Street,
Alexandria, Virginia 22314, and was founded in 2000. TAMRO is majority-owned by
the principals of the firm. As of December 31, 2008, TAMRO managed approximately
$670.5 million in assets.
ASTON/RIVER ROAD DIVIDEND ALL CAP VALUE FUND
ASTON/RIVER ROAD SMALL CAP VALUE FUND
ASTON/RIVER ROAD SMALL-MID CAP FUND
River Road Asset Management, LLC ("River Road"), Meidinger Tower, Suite 1600,
462 South Fourth Street, Louisville, Kentucky 40202, was founded in 2005. River
Road is a wholly-owned subsidiary of River Road Partners, LLC ("RRP"), which is
majority-owned by employees of River Road. As of December 31, 2008, River Road
managed approximately $2.6 billion in assets.
ASTON/NEPTUNE INTERNATIONAL FUND
Neptune Investment Management Limited ("Neptune"), 1 Lyric Square, Hammersmith
Grove, London W6 ONB, was founded in May 2002. Robin Geffen is the majority
shareholder of the firm. As of December 31, 2008, Neptune managed approximately
$3.9 billion in assets under management. Except for the Fund, Neptune had not
previously managed U.S. mutual funds.
ASTON/NEW CENTURY ABSOLUTE RETURN ETF FUND
New Century Capital Management, LLC ("New Century"), 36 South Washington Street,
Hinsdale, Illinois 60521, was founded in 2005 and is wholly owned and controlled
by Jim R. Porter. As of December 31, 2008, New Century managed approximately
$84.5 million in assets for separated and institutional accounts. Except for the
Aston/New Century Absolute Return ETF Fund, New Century has not previously
managed mutual funds accounts.
New Century has agreed that for any full calendar year of operations, if in any
such period the Aston/New Century Absolute Return ETF Fund had a total return
(before taxes) of less than zero, then New Century will waive its fee in its
entirety for the next succeeding calendar year. For any period when this waiver
is in effect, Aston has agreed to reduce its advisory fee to 0.15%.
ASTON/OPTIMUM LARGE CAP OPPORTUNITY FUND
ASTON/OPTIMUM MID CAP FUND
Optimum Investment Advisors, LLC ("Optimum") is located at 100 South Wacker
Drive, Suite 2100, Chicago, Illinois 60606. Optimum is majority-owned by Optimum
Investment Group, LLC. As of December 31, 2008, Optimum managed more than $1.2
billion in assets for investment companies, institutional and high net-worth
clients.
ASTON VALUE FUND
MFS Institutional Advisors Inc. ("MFSI"), 500 Boylston Street, Boston,
Massachusetts 02116, is a wholly-owned subsidiary of Massachusetts Financial
Services Company ("MFS"). MFS, a Delaware corporation, is a subsidiary of Sun
Life of Canada (U.S.) Financial Services Holdings, Inc., which in turn is an
indirect majority-owned subsidiary of Sun Life Financial Inc. (a diversified
financial services company). Net assets under the management of the MFS
organization were approximately $128 billion as of December 31, 2008.
ASTON/SMART PORTFOLIOS FUND
Smart Portfolios, LLC, 17865 Ballinger Way NE, Lake Forest Park, Washington
98155, was formed in April, 2002 as Asset Labs, LLC. The firm was registered as
an investment adviser in 2004 as Star Investment Advisors, LLC and changed its
name to Smart Portfolios LLC in 2005. The firm is wholly owned by Shield
Holdings, LLC. Shield Holdings, LLC is owned by Bryce James. As of December 31,
2008, Smart Portfolios had approximately $78 million is assets under management.
Except for Aston/Smart Portfolios Fund, Smart has not previously managed mutual
fund accounts.
ASTON/MB ENHANCED EQUITY INCOME FUND
MB Investment Partners, Inc. ("MB Investment Partners"), 825 Third Avenue, New
York, New York 10022 was founded in 1983 and is primarily owned by MB Investment
Partners & Associates, LLC. As of December 31, 2008, MB Investment Partner
managed approximately $270.3 million is assets in institutional accounts. Except
for Aston/MB Enhanced Equity Income Fund, MB has not previously managed mutual
fund accounts, however, a portfolio manager, Ronald Altman, has managed a mutual
fund account at a previous firm.
ASTON/CARDINAL MID CAP VALUE FUND
Cardinal Capital Management, L.L.C. ("Cardinal"), One Greenwich Office Park,
Greenwich, Connecticut 06831, is wholly owned by senior investment professionals
and controlled by Amy K. Minella. As of December 31, 2008, Cardinal managed
approximately $892 million in assets.
46
ASTON BALANCED FUND (FIXED INCOME PORTION)
ASTON/TCH FIXED INCOME FUND
Taplin, Canida & Habacht LLC ("Taplin"), 1001 Brickell Bay Drive, Suite 2100
Miami, Florida 33131, was founded in 1985 and as of December 31, 2008 had
approximately $7.3 billion in assets under management. As of November 2008,
Taplin is a majority-owned subsidiary of Marshall & Ilsley Corporation. Taplin
provides investment management services to investment companies, high net worth
individuals and institutional accounts.
PORTFOLIO
FUND NAME MANAGER(S) INVESTMENT EXPERIENCE
--------------------------------------------------------------------------------------
ASTON/MONTAG & CALDWELL GROWTH FUND
ASTON/MONTAG & CALDWELL BALANCED FUND
Ronald E. Canakaris, CFA, CIC Portfolio Manager since the Funds' inceptions
in 1994; Chairman, President and Chief
Investment Officer of Montag & Caldwell. He has
been with the firm since 1972 and is
responsible for developing the firm's
investment process. He has a BS and BA from the
University of Florida.
--------------------------------------------------------------------------------------
ASTON/MONTAG & CALDWELL MID CAP
GROWTH FUND
M. Scott Thompson, CFA Co-Portfolio Manager since the Fund's
inception, Vice President and Security Analyst.
Mr. Thompson joined Montag & Caldwell in 1992
upon graduating from the University of the
South with a BA in Economics. He has an MBA
from Emory University. His professional
affiliations include the CFA Institute and the
CFA Society of Atlanta, current Trustee.
Andrew W. Jung, CFA Co-Portfolio Manager since the Fund's
inception, Vice President and Security Analyst.
Mr. Jung joined Montag & Caldwell in 2001 as a
research analyst. Prior to joining Montag &
Caldwell, he was an analyst at Strong Capital
Management, following the financial services
sector for several large cap growth funds, and
at the Robinson-Humphrey Company in Atlanta,
where he followed banks and thrifts. He has a
BA from Marquette University and an MBA from
Emory University. His professional affiliations
include the CFA Institute and the CFA Society
of Atlanta.
--------------------------------------------------------------------------------------
ASTON GROWTH FUND
ASTON BALANCED FUND (EQUITY PORTION)
Ronald E. Canakaris, CFA, CIC Portfolio Manager of the Funds since January
2008. Please see above.
--------------------------------------------------------------------------------------
47
PORTFOLIO
FUND NAME MANAGER(S) INVESTMENT EXPERIENCE
--------------------------------------------------------------------------------------
ASTON/FORTIS REAL ESTATE FUND
Joseph Pavnica Co-Portfolio Manager since October 2005. Mr.
Pavnica joined the property team of FIM and its
predecessors in March 2001 and was employed by
a predecessor firm from 1997-2001. During his
tenure, Mr. Pavnica has been responsible for
analyzing and providing investment
recommendations for various property sectors
including: retail, multi-family, hotels,
industrial, and self-storage. Mr. Pavnica
received his BS in Accounting from St. Joseph's
College and his MBA from Indiana University
Northwest.
James Hardman Co-Portfolio Manager since January 2009. Mr.
Hardman joined FIM and its predecessors and/or
affiliates in April 2005 as an investment
analyst. During his tenure, Mr. Hardman has
been responsible for analyzing and providing
recommendations for the diversified,
healthcare, industrial, lodging, office, self
storage, and net lease sectors. From May 2000
to April 2005, Mr. Hardman worked as an
investment and strategy analyst for Security
Capital Research & Management. While there Mr.
Hardman conducted detailed valuation analysis,
performed fundamental research, and designed
and implemented portfolio management tools. Mr.
Hardman was a real estate consultant for Ernst
& Young Real Estate Advisory Group from May
1998 to April 2000, where he developed
strategic solutions for various real estate
firms. Mr. Hardman has a BS degree in
Accounting and Finance from Indiana University.
--------------------------------------------------------------------------------------
ASTON/FORTIS GLOBAL REAL ESTATE FUND
Joseph Pavnica Co-Portfolio Manager since the Fund's
inception. Please see above.
Menno Sloterdijk Co-Portfolio Manager since the Fund's
inception. Mr. Sloterdijk joined FIM in March
2001 and is currently the Head of European
Property. Mr. Sloterdijk holds a Master's
degree in Social Geography from the University
of Groningen.
Matthew Hoult Co-Portfolio Manager since the Fund's
inception. Mr. Hoult joined FIM in March 2004
as an Australian Equity Analyst. Prior to this
experience, he worked for Jenkins Investment
Management for three years as a senior analyst
covering the LPT, infrastructure and utility,
telecommunications, and technology stocks. Mr.
Hoult held various contract positions during
the period between his role at Jenkins and FIM.
Mr. Hoult has a Bachelor of Business from the
University of Technology -- Sydney and has
completed the Securities Institute of Australia
Graduate Diploma in Applied Finance and
Investment.
--------------------------------------------------------------------------------------
ASTON/FORTIS INVESTOR MONEY MARKET
FUND
William Anderson, CFA Portfolio Manager of the Fund since April 2005
and has been with FIM or its predecessors since
June 2004. Previously, Mr. Anderson served as
Vice President of Global Short Term Investments
at Aon Advisors, where he managed and directed
money market and short-term fiduciary fund
investments. Prior to that, he was Director of
Investment Research at Aon Capital Markets. Mr.
Anderson earned his BA from Dartmouth College
and his Master of Management in Finance,
Accounting and Strategy from Northwestern
University.
--------------------------------------------------------------------------------------
48
PORTFOLIO
FUND NAME MANAGER(S) INVESTMENT EXPERIENCE
--------------------------------------------------------------------------------------
ASTON/VEREDUS AGGRESSIVE GROWTH FUND
B. Anthony Weber Portfolio Manager since the Fund's inception in
1998; President and Chief Investment Officer of
Veredus. He is responsible for the day-to-day
management of the Fund. Mr. Weber was President
and Senior Portfolio Manager of SMC Capital,
Inc. from 1993-1998. He has over 25 years of
investment management experience. He received a
BA from Centre College of Kentucky.
Charles F. Mercer, Jr., CFA Portfolio Manager of the Fund since January
2009; Mr. Mercer is Executive Vice President
and founding partner of Veredus. Mr. Mercer was
the Director of Research from 1998 to 2003.
Prior experience includes research analyst at
SMC Capital, Inc. and a trader at Suntrust Bank
from 1996 to 1998. Mr. Mercer has a BA from
Vanderbilt University.
Michael E. Johnson, CFA Portfolio Manager of the Fund and Vice
President of Veredus since January 2009. Mr.
Johnson joined Veredus in March of 2000 as a
research analyst. From August 2003 through
December 2008, he was the Director of Research.
Previously he was a portfolio manager at Stock
Yards Bank and Trust from 1997 to 2000.
Additionally, Mr. Johnson has prior experience
at Charles Schwab. He received a BS in Finance
from Ball State University.
--------------------------------------------------------------------------------------
ASTON/VEREDUS SELECT GROWTH FUND
B. Anthony Weber Portfolio Manager of the Fund since September
21, 2002. Please see above.
Charles F. Mercer, Jr., CFA Portfolio Manager of the Fund since the Fund's
inception in December 2001. Please see above.
Michael E. Johnson, CFA Portfolio Manager of the Fund since January
2009. Please see above.
--------------------------------------------------------------------------------------
ASTON/TAMRO ALL CAP FUND
ASTON/TAMRO SMALL CAP FUND
Philip D. Tasho, CFA Portfolio Manager since the Funds' inception in
November 2000; Chief Executive Officer and
Chief Investment Officer of TAMRO. He is
responsible for the day-to-day management of
the Funds. Most recently, Mr. Tasho served as
Chief Executive Officer and Chief Investment
Officer of Riggs Investment Management Corp.
(RIMCO), from 1995 to 2000. He began his
investment management career in 1980. He
received his MBA from George Washington
University.
--------------------------------------------------------------------------------------
49
PORTFOLIO
FUND NAME MANAGER(S) INVESTMENT EXPERIENCE
--------------------------------------------------------------------------------------
ASTON/RIVER ROAD DIVIDEND ALL CAP
VALUE FUND
James C. Shircliff, CFA Portfolio Manager since the Fund's inception
and CEO and Chief Investment Officer of River
Road. Mr. Shircliff was formerly employed as
Portfolio Manager and Director of Research for
Commonwealth SMC (SMC Capital, Inc.) from 1998-
2005. Additionally, Mr. Shircliff has served as
Special Situations Analyst and Fund Manager for
Oppenheimer Management and Partner and Director
of Research for Southeastern Asset Management.
Mr. Shircliff has more than 30 years of
investment management experience. He received
his BS from the University of Louisville and
holds the Chartered Financial Analyst
designation.
Henry W. Sanders, III, CFA Portfolio Manager since the Fund's inception
and Executive Vice President of River Road. Mr.
Sanders was formerly employed as Senior Vice
President and Portfolio Manager for
Commonwealth SMC from 2002-2005. Additionally,
Mr. Sanders has served as President for Bridges
Capital Management and Vice President for
PRIMCO Capital Management. He received his BS
from Bellarmine University, his MBA from Boston
College and holds the Chartered Financial
Analyst designation.
Thomas S. Forsha, CFA Portfolio Manager of the Fund since June 2007
and Vice President of River Road. Mr. Forsha
was formerly employed by ABN AMRO from 1998-
2005, where he served as Equity Analyst and
Portfolio Manager and was responsible for
management of the North America equity
allocation of the firm's Global High Income
Equity Fund. He received his BS in Finance from
The Ohio State University's Fisher College of
Business and his MBA from The University of
Chicago's Graduate School of Business in 2006.
Mr. Forsha is a member of the CFA Institute and
the CFA Society of Louisville.
--------------------------------------------------------------------------------------
ASTON/RIVER ROAD SMALL CAP VALUE FUND
ASTON/RIVER ROAD SMALL-MID CAP FUND
James C. Shircliff, CFA Portfolio Manager since each Fund's inception.
Please see above.
R. Andrew Beck Portfolio Manager since each Fund's inception
and President of River Road. Mr. Beck was
formerly employed as Senior Vice President and
Portfolio Manager for Commonwealth SMC (SMC
Capital, Inc.) from 1999-2005. Mr. Beck
received his BS from the University of
Louisville and his MBA from Babson College.
Henry W. Sanders, III, CFA Portfolio Manager since each Fund's inception.
Please see above.
--------------------------------------------------------------------------------------
ASTON/NEPTUNE INTERNATIONAL FUND
Robin Geffen Portfolio Manager since the Fund's inception.
Mr. Geffen has also served as Managing Director
and Chief Investment Officer of Neptune since
the firm's inception in May 2002. Prior to
launching Neptune, Mr. Geffen was the CIO and
most recently Global ClO-Pensions at Orbitex,
managing a number of funds. Mr. Geffen, a
graduate of Keble College, Oxford, began his
investment career in 1979.
--------------------------------------------------------------------------------------
ASTON/NEW CENTURY ABSOLUTE RETURN ETF
FUND
Jim R. Porter Portfolio Manager since the Fund's inception.
Mr. Porter co-founded New Century in 2005 and
serves as Chief Executive Officer. Mr. Porter
also founded New Century Investment Research
and Management, Inc. to which he returned in
2004. From 1997 to 2004, Mr. Porter served as
Chairman and Chief Executive Officer of PC
Quote and Hyper Feed Technologies. In total, he
has over 38 years of investment industry
experience. He received a BS in Physics from
the University of Arkansas with majors in both
Math and Physics. He also received an MS in
Astronomy from the University of Iowa.
--------------------------------------------------------------------------------------
50
PORTFOLIO
FUND NAME MANAGER(S) INVESTMENT EXPERIENCE
--------------------------------------------------------------------------------------
ASTON/OPTIMUM LARGE CAP OPPORTUNITY
FUND
Andrew Goodwin Co-Portfolio Manager since the Fund's
inception. Chairman and Co-founder of Optimum.
Prior to co-founding Optimum in 1989, Mr.
Goodwin held positions at First Boston Corp.
and Smith Barney. Mr. Goodwin graduated from
Princeton University and received his MBA from
Northwestern University's Kellogg School of
Management.
Keith Pinsoneault, CFA Co-Portfolio Manager since the Fund's
inception. Mr. Pinsoneault has been employed by
Optimum since 1997 and currently serves as the
firm's President. Prior to Mr. Pinsoneault's
tenure with Optimum, he served in senior
executive capacities at several Wall Street
brokerage firms. Other experience includes:
President of Sutro & Company and a Senior
Portfolio Manager at Harris, Bretall, Sullivan
and Smith in San Francisco. Mr. Pinsoneault
graduated from Marquette University and is an
accredited Chartered Financial Analyst.
--------------------------------------------------------------------------------------
ASTON/OPTIMUM MID CAP FUND
Thyra E. Zerhusen Portfolio Manager of the Fund since May 1999.
Ms. Zerhusen joined the investment team of
Optimum in October 2003. From April 1999 to
September 2003 she was on the investment team
of Talon Asset Management and from 1993 to 1999
she was Senior Vice President and Principal at
the Burridge Group. She has a Diplom Ingenieur
from the Swiss Federal Institute of Technology
and an MA in Economics from the University of
Illinois.
Marie L. Lorden Co-Portfolio Manager of the Fund since March
2009; Ms. Lorden joined Optimum in September of
2003. Ms. Lorden is responsible for research
and analysis of existing and potential
holdings, as well as mutual fund, institutional
relationship, and portfolio management.
Previously, Ms. Lorden held positions
specializing in equity product analysis with
Zurich Insurance Group, Driehaus Capital
Management, and The Burridge Group where she
was responsible for equity maintenance research
and institutional client relationships. Prior
to joining Optimum, Ms. Lorden was a Project
Manager at Radio Free Europe in Prague, Czech
Republic. Ms. Lorden received her BS from
Elmhurst College in 1982 and her MBA from the
Keller Graduate School of Management in 1990.
Mary L. Pierson Co-Portfolio Manager of the Fund since March
2009; Ms. Pierson joined Optimum in May of
2004. Ms. Pierson is responsible for research
and analysis of existing and potential
holdings, as well as mutual fund, institutional
relationship, and portfolio management. Her
prior experience includes fifteen years with
Harris Bancorp and Harris Futures Corporation.
While General Manager at Harris Futures
Corporation, she was responsible for managing
all aspects of the institution, which operated
as a financial futures broker. In prior
positions at Harris, Ms. Pierson conducted in-
depth international economic research and
analysis of foreign exchange exposure issues,
along with currency trends and foreign
political conditions related to investments.
Ms. Pierson received her BA in Economics from
DePauw University, her MA in Economics from
Northwestern University and her MBA in Finance
from The University of Chicago.
--------------------------------------------------------------------------------------
51
PORTFOLIO
FUND NAME MANAGER(S) INVESTMENT EXPERIENCE
--------------------------------------------------------------------------------------
ASTON VALUE FUND
Nevin P. Chitkara Portfolio Manager of the Fund as of May 2006;
Investment Officer of MFSI. Mr. Chitkara joined
MFSI in 1997 as an equity research analyst. He
holds an MBA from the MIT Sloan School of
Management and a BS in Business Administration
from Boston University.
Steven R. Gorham, CFA Portfolio Manager of the Fund since January
2002; Investment Officer of the Subadviser. Mr.
Gorham joined MFSI in 1989 and became an equity
research analyst in 1992. From 1995 and 2000,
he worked as an international analyst. He holds
an MBA from Boston College and a BS from the
University of New Hampshire.
Brooks A. Taylor Portfolio Manager of the Fund since March 2008;
Investment Officer of the Subadviser. Mr.
Taylor joined MFSI in 1996 as an equity
research analyst and was named portfolio
manager in 2000. He holds an MBA from the
University of Pennsylvania and a BA from Yale
University.
Jonathan W. Sage, CFA Portfolio Manager of the Fund since March 2008;
Investment Officer of the Subadviser. Mr. Sage
joined MFSI in 2000 as a quantitative equity
research analyst and was named portfolio
manager in 2005. He holds a BA from Tufts
University.
--------------------------------------------------------------------------------------
ASTON/SMART PORTFOLIOS FUND
Bryce James Portfolio Manager since the Fund's inception.
Mr. James co-founded Smart Portfolios LLC in
2002 and serves as President and Chief
Compliance Officer. Mr. James has over 24 years
of investment experience and is the head of the
Fund's investment committee. He received a BS
in Accounting, Finance and Marketing from
Central Washington University.
Shawn Bird Portfolio Manager since the Fund's inception.
Mr. Bird co-founded Smart Portfolios LLC and
serves as Chief Technology Officer. Mr. Bird
has over 15 years of advanced technology
experience and oversees the Fund's asset
allocation model. He received a BS in Physics
from the University of Iowa, an MBA from Texas
Tech University and a PhD in Business from
Texas Tech University.
John Rosenthal Portfolio Manager since the Fund's inception.
Mr. Rosenthal joined Smart Portfolios in August
2007 as Senior Portfolio Manager, From 2004 to
2006, he was the Director of Risk Management
for Boeing Capital Corporation and a Principal
of Boeing Capital Securities, Inc. From 1999 to
2004, he was Treasurer of Boeing Capital
Corporation. Mr. Rosenthal provides day-to-day
portfolio management of the Fund. He received a
BS in Mathematics from Creighton University and
an MBA from the University of Chicago.
--------------------------------------------------------------------------------------
52
PORTFOLIO
FUND NAME MANAGER(S) INVESTMENT EXPERIENCE
--------------------------------------------------------------------------------------
ASTON/MB ENHANCED EQUITY INCOME FUND
Ronald L. Altman Portfolio Manager since the Fund's inception.
Mr. Altman joined MB Investment Partners in
2005 as a partner and portfolio manager of the
enhanced equity income strategy. From 1999 to
2005, Mr. Altman was a Senior Managing Director
and Director of Research at Victory SBSF. Mr.
Altman has over 40 years experience in the
investment research and money management
business in various positions.
Paul F. Pfeiffer Portfolio Manager since the Fund's inception.
Mr. Pfeiffer joined MB Investment Partners in
2002 as a partner and portfolio manager. Prior
to joining MB Investment Partners, Mr. Pfeiffer
was a partner at Eagle Growth Investors, LLC
and was a principal at McCowan & Associates.
Mr. Pfeiffer received his BA from the
University of Washington and his MBA from New
York University.
--------------------------------------------------------------------------------------
ASTON/CARDINAL MID CAP VALUE FUND
Amy K. Minella Co-Portfolio Manager since the Fund's
inception. Ms. Minella is the Managing Partner
at Cardinal and founded the firm in 1995. Ms.
Minella is a portfolio manager and analyst, and
has over 25 years of investment experience. Ms.
Minella received a BA from Mount Holyoke
College and an MBA from Standard University.
Eugene Fox, III Co-Portfolio Manager since the Fund's
inception. Mr. Fox is a partner at Cardinal and
joined the firm in 1995. Mr. Fox is a portfolio
manager and analyst, and has over 20 years of
investment experience. Mr. Fox received a BA
from the University of Virginia and an MBA from
the University of Chicago.
Robert B. Kirkpatrick, CFA Co-Portfolio Manager since the Fund's
inception. Mr. Kirkpatrick is a partner at
Cardinal and joined the firm in 2000. Mr.
Kirkpatrick is a portfolio manager and analyst,
and has over 20 years of investment experience.
Mr. Kirkpatrick received a BA from Williams
College.
--------------------------------------------------------------------------------------
53
PORTFOLIO
FUND NAME MANAGER(S) INVESTMENT EXPERIENCE
--------------------------------------------------------------------------------------
ASTON/TCH FIXED INCOME FUND
ASTON BALANCED FUND (FIXED INCOME PORTION)
Tere Alvarez Canida, CFA Co-Portfolio Manager of each Fund since
December 1, 2006 and President and Managing
Principal of Taplin. Ms. Canida has over 28
years of investment experience. She previously
served as Vice President and Senior Investment
Officer of Southeast Bank. She received her BS
from Georgetown University in 1975, and her MBA
from The George Washington University in 1976.
She became a Chartered Financial Analyst in
1983.
Alan M. Habacht Co-Portfolio Manager of each Fund since
December 1, 2006 and Principal of Taplin. Mr.
Habacht has over 37 years of investment
experience. Before joining Taplin, he served as
Senior Vice President and portfolio manager for
INVESCO Capital Management. He also served as a
security analyst for Weiss, Peck & Greer,
Alliance Capital Management, and Bache &
Company. He received his BA in Finance from
Boston University in 1968.
William J. Canida, CFA Co-Portfolio Manager of each Fund since
December 1, 2006 and Principal of Taplin. Mr.
Canida has over 30 years of investment
experience. Prior to joining Taplin, he served
as Vice President and Senior Investment Officer
for Harris Trust Company of Florida. He also
was Vice President and Treasurer of AmeriFirst
Florida Trust Company and Southeast Bank. Mr.
Canida received his BA in 1973 and his MBA in
1975, both from Indiana University. He has also
attended the National Graduate Trust School of
Northwestern University, and became a Chartered
Financial Analyst in 1982.
Additional information about the portfolio managers' compensation, other
accounts managed by the portfolio manager and the portfolio managers' ownership
of securities in the Funds is available in the SAI.
54
MANAGEMENT FEE PAID FOR
FUND NAME MANAGEMENT FEE FISCAL YEAR ENDED 10/31/08
(as a percentage of net assets) (as a percentage of net assets)
Aston/Montag & Caldwell Growth Fund First $800 million 0.80%
Over $800 million 0.60% 0.69%
Aston/Veredus Select Growth Fund 0.80% 0.76%(a)
Aston Growth Fund 0.70% 0.69%(a)
Aston/Optimum Large Cap Opportunity Fund 0.80% 0.03%(a)
Aston Value Fund 0.80% 0.64%(a)
Aston/TAMRO All Cap Fund 0.80% 0.12%(a)
Aston/River Road Dividend All Cap Value Fund 0.70% 0.65%(a)
Aston/Optimum Mid Cap Fund First $100 million 0.80%
Next $300 million 0.75%
Over $400 million 0.70% 0.73%
Aston/Montag & Caldwell Mid Cap Growth Fund 0.85% 0.00%(a)
Aston/Cardinal Mid Cap Value Fund 0.90% 0.00%(a)
Aston/River Road Small-Mid Cap Fund 1.00% 0.94%(a)
Aston/Veredus Aggressive Growth Fund 1.00% 0.94%(a)
Aston/TAMRO Small Cap Fund 0.90% 0.88%(a)
Aston/River Road Small Cap Value Fund 0.90% 0.90%
Aston/Neptune International Fund 1.00% 0.00%(a)
Aston/Fortis Global Real Estate Fund 1.00% 0.24%(a)
Aston/Smart Portfolios Fund 0.80% 0.00%(a)
Aston/New Century Absolute Return ETF Fund 1.00% 0.00%(a)
Aston/MB Enhanced Equity Income Fund 0.70% 0.00%(a)
Aston/Fortis Real Estate Fund 1.00% 0.80%(a)
Aston/Montag & Caldwell Balanced Fund 0.75% 0.36%(a)
Aston Balanced Fund 0.70% 0.70%
Aston/TCH Fixed Income Fund 0.55% 0.14%(a)
Aston/Fortis Investor Money Market Fund 0.40% 0.40%
(a)Taking into account fee waivers then in effect.
55
RELATED PERFORMANCE
ASTON/MB ENHANCED EQUITY INCOME FUND
The following is a composite of equity accounts managed by MB Investment
Partners. As of December 31, 2008, the composite was composed of 7 accounts and
assets of $19.5 million, which represents all separately managed accounts
following the enhanced equity income strategy. The investment objectives,
policies and strategies of Aston/MB Enhanced Equity Income Fund are
substantially similar to those of the accounts comprising the composite.
TOTAL RETURN
Year End Composite Benchmark(a)
-----------------------------------------------
2008 (25.36)% (17.20)%
-----------------------------------------------
2007 2.85% 6.50%
-----------------------------------------------
2006 15.97% 9.96%
-----------------------------------------------
AVERAGE ANNUAL TOTAL RETURN
(For the periods ended December 31, 2008)
Composite Benchmark(a)(b)
--------------------------------------------------
One Year (25.36)% (17.20)%
--------------------------------------------------
Three Years (3.80)% (1.02)%
--------------------------------------------------
Since Inception(c) (3.00)% (-0.52)%
--------------------------------------------------
(a)The benchmark combines 50% of the S&P 500 Index and 50% of the Citigroup
Broad Investment Grade Bond Index.
(b)The benchmark reflects the total return of securities comprising the index,
including changes in the market prices as well as accrued investment income,
which is presumed to be reinvested. Performance figures for the index do not
reflect the deduction of transaction costs or expenses, including management
fees.
(c)Composite's inception: September 30, 2005. Benchmark data computed from
September 30, 2005.
The performance of the composite does not represent the historical performance
of the Aston/MB Enhanced Equity Income Fund and should not be considered
indicative of future performance of the Fund. Results may differ because of,
among other things, differences in brokerage commissions, account expenses
including management fees, the size of positions taken in relation to account
size, diversification of securities, timing of purchases and sales, and
availability of cash for new investment. Composite results are shown net of
management fees of accounts comprising the composite. If the Fund's fees and
expenses had been used in calculating the composite's performance, the
performance of the composite would have been lower. In addition, the accounts
comprising the composite are not subject to certain investment limitations,
diversification requirements and other restrictions imposed by the Investment
Company Act of 1940, as amended, and the Code which if applicable, may have
adversely affected the performance results of the composite. The results for
different products may vary.
ASTON/FORTIS GLOBAL REAL ESTATE FUND
The performance figures shown below represent the total return for an offshore
fund ("Offshore Fund") organized in the Netherlands and managed by Fortis
Investment Management Netherlands NV, an indirect subsidiary of Fortis
Investment Management SA. As of December 31, 2008, the Offshore Fund had $451.8
million in assets. The investment objectives, policies and strategies of
Aston/Fortis Global Real Estate Fund are substantially similar to those of the
Offshore Fund. In addition, the Offshore Fund and Aston/Fortis Global Real
Estate Fund are generally managed by the same team of portfolio managers,
although individual portfolio managers may change from time to time.
TOTAL RETURN
Year End Offshore Fund GPR 250(a)
-----------------------------------------------------------
2008 (50.45)% (47.34)%
-----------------------------------------------------------
2007 (20.20) (17.50)
-----------------------------------------------------------
2006 50.55 48.86
-----------------------------------------------------------
2005 11.15 11.82
-----------------------------------------------------------
2004 39.70 39.83
-----------------------------------------------------------
2003 40.98 40.68
-----------------------------------------------------------
2002 10.63 8.75
-----------------------------------------------------------
2001 (1.78) 2.05
-----------------------------------------------------------
2000 14.12 13.25
-----------------------------------------------------------
1999 (2.31) (1.82)
-----------------------------------------------------------
AVERAGE ANNUAL TOTAL RETURN
(For the periods ended December 31, 2008)
Offshore Fund GPR 250(a)
-----------------------------------------------------------
One Year (50.45)% (47.34)%
-----------------------------------------------------------
Three Year (15.88) (13.52)
-----------------------------------------------------------
Five Year (1.56) 0.22
-----------------------------------------------------------
Ten Year 4.67 5.78
-----------------------------------------------------------
Since Inception 5.28 5.18
-----------------------------------------------------------
(a)The GPR 250 reflects performance of the GPR 250 Adjusted Net Index managed by
Global Property Research. The Fund intends to use the GPR 250 Net Index, which
differs primarily with respect to the weighting of the Aston markets. Numbers
are net of unrecoverable dividend withholding tax and reflect the reinvestment
of interest and other earnings. Performance figures for the index do not reflect
deduction of transaction costs or expenses, including management fees.
The performance of the Offshore Fund does not represent the historical
performance of the Aston/Fortis Global Real Estate Fund and should not be
considered indicative of future performance of the Fund. Results may differ
because of, among other things differences in brokerage commissions, account
expenses including management fees, the size of positions taken in relation to
account size, diversification of securities, timing of purchase and sales, and
availability of cash for new investment. Performance is shown net of actual fees
and expenses of the Offshore Fund. If the Fund's fees and expenses had been used
in calculating the Offshore Fund's performance, the performance of
56
the Offshore Fund would have been lower. In addition, the Offshore Fund is not
subject to certain investment limitations, diversification requirements and
other restrictions imposed by the Investment Company Act of 1940, as amended,
and the Code, which if applicable, may have adversely affected the performance
results of the Offshore Fund. The results for different products may vary.
Returns of the Offshore Fund reflect Netherlands Guilders converted to Euros
based upon the actual exchange rate. Euros are then translated into U.S. Dollars
using the Bloomberg month-end Euro spot rate. Shares of the Offshore Fund are
not offered or sold in the U.S.
57
Shareholder Information
OPENING AN ACCOUNT
- Read this prospectus carefully.
- Determine how much you want to invest. The minimum initial investment
requirements for each Aston Fund are as follows:
- Regular accounts: $2,500
- Individual Retirement Accounts (IRAs): $500
- Education Savings Accounts: $500
- Uniform Gift to Minor Accounts/Uniform Transfer to Minor Accounts
(UGMA/UTMA) (custodial accounts for minors): $500
- The minimum initial investment requirement may be waived for Trustees of the
Trust and employees of Aston and its affiliates, as well as their spouses. The
Trust reserves the right to waive a Fund's minimum initial investment
requirement for any reason.
- Complete the account application and carefully follow the instructions. If you
have any questions, please call 800 992-8151. Remember to complete the
"Purchase, Exchange and Redemption Authorization" section of the account
application to establish your account privileges, and to avoid any delay and
inconvenience of requesting these in writing at a later date.
- Purchase, exchange and redemption requests received and processed before the
New York Stock Exchange ("NYSE") market close, typically 4:00 p.m. Eastern
Time ("ET"), receive that business day's closing NAV. Trades received after
that time receive the following business day's NAV.
- Make your initial investment using the following table as a guideline.
- All account openings and subsequent transaction requests must be in "good
order."
BUY, EXCHANGE AND SELL REQUESTS ARE IN "GOOD ORDER" WHEN
- The account number and Fund name are included.
- The amount of the transaction is specified in dollars or shares.
- Signatures of all owners appear exactly as they are registered on the account
in original form, as photocopies are not acceptable.
- Any required Medallion Signature Guarantees are included.
- Other supporting legal documents (as necessary) are present, including such
"Requirements For Written Requests" as described later in this "Shareholder
Information" Section.
58
BUYING SHARES TO OPEN AN ACCOUNT TO ADD TO AN ACCOUNT ($50 MINIMUM)
--------------------------------------------------------------------------------------
THROUGH YOUR - Your financial - Your financial representative is responsible
FINANCIAL representative is for transmitting the order promptly.
REPRESENTATIVE responsible for
transmitting the
order promptly.
BY MAIL - Complete and sign - Return the investment slip from a statement
your application. with your check in the envelope provided and
ASTON FUNDS mail to us at the address at the left.
P.O. BOX 9765 - Make your check
PROVIDENCE, RI payable to Aston - We accept checks, bank drafts, money orders,
02940 Funds and mail to wires and ACH for purchases (see "Other
us at the address Features" later in this "Shareholder
OR at the left. Information" Section). Checks must be drawn
on U.S. banks. There is a minimum $20 charge
OVERNIGHT - We accept checks, for returned checks.
DELIVERY bank drafts and
money orders for - Give the following wire/ACH information to
ASTON FUNDS purchases. Checks your bank:
101 SABIN STREET must be drawn on PNC Bank
PAWTUCKET, RI U.S. banks to ABA #031-000-053
02860 avoid any fees or For: Aston Funds
delays in A/C 8611758079
processing. FBO "Aston Fund Number" "Your Account
Number"
- We do not accept
travelers, - Include your name, account number, taxpayer
temporary, post- identification number or social security
dated, credit card number, address and the Fund(s) you wish to
courtesy, second purchase in the wiring instructions.
or third party
checks (which are - We do not accept travelers, temporary, post-
checks made dated, credit card courtesy, second or third
payable to someone party checks (which are checks made payable
other than the to someone other than the Funds, including
Funds, including you).
you).
- For your protection, our current Internet
capabilities allow you to check balances and
transfer monies only between Aston Funds.
Please contact us via mail with a signed
letter of instruction for all other changes
to your account.
--------------------------------------------------------------------------------------
BY PHONE - Obtain a Fund and - Verify that your bank or credit union is a
account number by member of the ACH.
800 992-8151 calling Aston
Funds at the - To place your request with an Investor
number at the Services Associate, call between 9 a.m. and
left. 7 p.m. ET, Monday - Friday.
- Instruct your bank - You should complete the "Bank Account
(who may charge a Information" section of your account
fee) to wire or application.
ACH the amount of
your investment. - When you are ready to add to your account,
call Aston Funds and tell the representative
- Give the following the Fund name, account number, the name(s)
wire/ACH in which the account is registered and the
information to amount of your investment.
your bank:
PNC Bank - Instruct your bank (who may charge a fee) to
ABA #031-000-053 wire or ACH the amount of your investment.
For: Aston Funds
A/C 8611758079 - Give the following wire/ACH information to
FBO "Aston Fund your bank:
Number" "Your PNC Bank
Account Number" ABA #031-000-053
For: Aston Funds
- Return your A/C 8611758079
completed and FBO "Aston Fund Number" "Your Account
signed application Number"
to:
Aston Funds - Include your name, account number, taxpayer
P.O. Box 9765 identification number or social security
Providence, RI number, address and the Fund(s) you wish to
02940 purchase in the wire instructions.
--------------------------------------------------------------------------------------
59
BUYING SHARES TO OPEN AN ACCOUNT TO ADD TO AN ACCOUNT ($50 MINIMUM)
--------------------------------------------------------------------------------------
BY INTERNET - To open a new - Verify that your bank or credit union is a
account you'll member of the ACH.
WWW.ASTONFUNDS.COM - need to provide
bank account - Complete the "Purchase, Exchange and
information plus Redemption Authorization" section of your
the social account application.
security number
and date of birth - Self-register for online account access at
for each account www.astonfunds.com. Your social security
owner and number or employer identification number,
beneficiary. account number and other security validating
information will be required for
- Open an account registration.
online by
completing the - When you are ready to add to your account,
Aston Funds online access your account through Aston Funds' Web
account site and enter your purchase instructions in
application. the highly secure area for shareholders only
called "Account Access." ACH purchases on
or the Internet may take 3 or 4 business days.
- Download the
appropriate
account
application(s)
from the Web site.
Complete and sign
the
application(s).
Make your check
payable to Aston
Funds and mail it
to the address
under "By Mail"
above.
--------------------------------------------------------------------------------------
Other share classes of Aston Funds are available through separate prospectuses.
Please call 800 992-8151 for more information.
EXCHANGING SHARES
After you have opened an account with us, you can exchange your shares within
Aston Funds to meet your changing investment goals or other needs. This
privilege is not designed for frequent trading (which may subject you to a
redemption fee) and may be difficult to implement in times of drastic market
changes.
You can exchange shares from one Aston Fund to another within the same class of
shares. You may also exchange between Class N and Class S shares of the Aston
Funds. All exchanges to open new accounts must meet the minimum initial
investment requirements. Exchanges may be made by mail, through the Internet or
by phone at 800 992-8151 if you chose this option when you opened your account.
For federal income tax purposes, each exchange into a different fund is treated
as a sale and a new purchase. As a result, an investor holding shares in a non
tax-deferred account generally is subject to federal income tax on any
appreciation on the shares exchanged.
HOW DOES AN EXCHANGE TAKE PLACE?
When you exchange your shares, you authorize the sale of your shares in one fund
to purchase shares of another fund. In other words, you are requesting a sale
and then a purchase. The exchange of your shares may be a taxable event for
federal income tax purposes if the shares are not held in a tax deferred account
and may subject you to a redemption fee.
Aston Funds reserves the right to limit, impose charges upon, terminate or
otherwise modify the exchange privilege by sending written notice to
shareholders. All exchange requests must be in "good order."
60
SELLING/REDEEMING SHARES
Once you have opened an account with us, you can sell your shares to meet your
changing investment goals or other needs. All redemption requests must be in
"good order."
The following table shows guidelines for selling shares.
SELLING SHARES DESIGNED FOR... TO SELL SOME OR ALL OF YOUR SHARES...
--------------------------------------------------------------------------------------
THROUGH YOUR - Accounts of any - Your financial representative is responsible
FINANCIAL type for transmitting the order promptly.
REPRESENTATIVE
--------------------------------------------------------------------------------------
BY MAIL - Accounts of any - Write and sign a letter of instruction
type indicating the Fund name, Fund number, your
ASTON FUNDS account number, the name(s) in which the
P.O. BOX 9765 - Sales or account is registered and the dollar value
PROVIDENCE, RI redemptions of any or number of shares you wish to sell.
02940 size (For
redemptions over - Include all signatures and any additional
OR $50,000 please see documents that may be required. (See
Medallion "Selling Shares in Writing" later in this
OVERNIGHT Signature "Shareholder Information" Section).
DELIVERY Guarantee later in Signatures must be in original form, as
this "Shareholder photocopies are not accepted.
ASTON FUNDS Information"
101 SABIN STREET Section) - Mail to us at the address at the left.
PAWTUCKET, RI
02860 - A check will be mailed to the name(s) and
address in which the account is registered.
If you would like the check mailed to a
different address, you must write a letter
of instruction and have it Medallion
Signature Guaranteed.
- Proceeds may also be sent by wire or ACH
(see "Other Features" later in this
"Shareholder Information" Section).
--------------------------------------------------------------------------------------
BY PHONE - Non-retirement - For automated service 24 hours a day using
accounts your touch-tone phone, call 800 992-8151.
800 992-8151
- Sales of up to - To place your request with an Investor
$50,000 (for Services Associate, call between 9 a.m. and
accounts with 7 p.m. ET, Monday - Friday.
telephone account
privileges) - A check will be mailed to the name(s) and
address in which the account is registered.
If you would like the check mailed to a
different address, you must write a letter
of instruction and have it Medallion
Signature Guaranteed.
- Proceeds may also be sent by wire or ACH
(see "Other Features" later in this
"Shareholder Information" Section).
- The Funds reserve the right to refuse any
telephone sales request and may modify the
procedures at any time. The Funds make
reasonable attempts to verify that telephone
instructions are genuine, but you are
responsible for any loss that you may bear
from telephone requests.
--------------------------------------------------------------------------------------
61
SELLING SHARES DESIGNED FOR... TO SELL SOME OR ALL OF YOUR SHARES...
--------------------------------------------------------------------------------------
BY INTERNET - Non-retirement - Complete the "Purchase, Exchange and
accounts Redemption Authorization" section of your
WWW.ASTONFUNDS.COM account application.
- Self-register online for account access at
www.astonfunds.com. Your social security
number or employer identification number,
account number and other security validating
information will be required for
registration.
- When you are ready to redeem a portion of
your account, access your account through
Aston Funds' Web site and enter your
redemption instructions in the highly secure
area for shareholders only called "Account
Access." A check for the proceeds will be
mailed to you at your address of record.
- Proceeds may also be sent by wire or ACH
(see "Other Features" later in this
"Shareholder Information" Section).
--------------------------------------------------------------------------------------
BY MONEY MARKET - Non-retirement - Request the free checkwriting privilege on
CHECKWRITING accounts your application.
- Aston/Fortis - Verify that the shares to be sold were
Investor Money purchased more than 15 days earlier or were
Market Fund only purchased by wire, otherwise there can be up
to a 15-day hold on checks.
- You may write unlimited checks, each for
$100 or more. You cannot close an account by
writing a check.
- You continue to earn dividends until checks
are presented for payment. There is a $30
charge for returned checks.
- Currently, there is no charge for this
privilege, but the Fund reserves the right
to add one.
- Canceled checks are available upon request
but there is a fee to receive them.
- The Fund may cancel this privilege at any
time by giving notice to you.
--------------------------------------------------------------------------------------
62
SELLING SHARES IN WRITING
In certain circumstances, you must make your request to sell shares in writing.
You may need to include a Medallion Signature Guarantee (which protects you
against fraudulent orders) and additional items with your request, as shown in
the table below.
WE REQUIRE MEDALLION SIGNATURE GUARANTEES IF:
- your address of record has changed within the past 30 days
- you are selling more than $50,000 worth of shares
- you are requesting payment other than by a check mailed to the address of
record and payable to the registered owner(s) or other than wire or ACH sent
to the bank account of the registered owner(s)
SELLER REQUIREMENTS FOR WRITTEN REQUESTS
-------------------------------------------------------------------------------------
Owners of individual, - Letter of instruction
joint, sole - On the letter, the signatures and titles of all persons
proprietorship, authorized to sign for the account, exactly as the account
UGMA/UTMA, or general is registered, must be in original form, as photocopies are
partner accounts not accepted
- MEDALLION SIGNATURE GUARANTEE, if applicable (see next page
for more details)
-------------------------------------------------------------------------------------
Owners of corporate or - Letter of instruction
association accounts - Corporate resolution certified within the past 12 months
- On the letter, the signatures and titles of all persons
authorized to sign for the account, exactly as the account
is registered, must be in original form, as photocopies are
not accepted
- MEDALLION SIGNATURE GUARANTEE, if applicable (see next page
for more details)
-------------------------------------------------------------------------------------
Owners or trustees of - Letter of instruction
trust accounts - On the letter, the signature of the trustee(s) must be in
original form, as photocopies are not accepted
- If the names of all trustees are not registered on the
account, a copy of the trust document certified within the
past 12 months
- MEDALLION SIGNATURE GUARANTEE, if applicable (see next page
for more details)
-------------------------------------------------------------------------------------
Joint tenancy - Letter of instruction signed by the surviving tenant must
shareholders whose co- be in original form, as photocopies are not accepted
tenants are deceased - Certified copy of death certificate
- MEDALLION SIGNATURE GUARANTEE, if applicable (see next page
for more details)
-------------------------------------------------------------------------------------
Executors of - Letter of instruction signed by executor must be in
shareholder estates original form, as photocopies are not accepted
- Certified copy of order appointing executor
- MEDALLION SIGNATURE GUARANTEE, if applicable (see next page
for more details)
-------------------------------------------------------------------------------------
Administrators, - Call 800 992-8151 for instructions
conservators, - MEDALLION SIGNATURE GUARANTEE, if applicable (see next page
guardians and other for more details)
sellers or account
types not listed above
-------------------------------------------------------------------------------------
IRA accounts - IRA distribution request form completed and signed. Call
800 992-8151 for a form, or download from our website,
www.astonfunds.com.
-------------------------------------------------------------------------------------
In addition to the situations described above, Aston Funds may require Medallion
Signature Guarantees in other circumstances based on the amount of the
redemption request or other factors.
OTHER FEATURES
The following other features are also available to buy and sell shares of the
Funds.
WIRE. To purchase and sell shares via the Federal Reserve Wire System:
- You must authorize Aston Funds to honor wire instructions before using this
feature. Complete the appropriate section on the application when opening your
account or call 800 992-8151 to add the feature after your account is opened.
Call 800 992-8151 before your first use to verify that this feature is set up
on your account.
- To sell shares by wire, you must designate the U.S. commercial bank account(s)
into which you wish the redemption proceeds deposited.
For accounts with existing wire instructions, wire redemptions may be placed
over the phone. Consult your banking institution for any fees they may charge
associated with wire transfers. Any changes made to existing wire instructions
will only be accepted with a Medallion Signature Guaranteed letter of
instruction.
AUTOMATED CLEARING HOUSE (ACH). To transfer money between your bank account and
your Aston Funds account(s):
- You must authorize Aston Funds to honor ACH instructions before using this
feature. Complete the appropriate section on the application when opening your
account or call 800 992-8151 to add the feature after your account is opened.
Call 800 992-8151 before your first use to verify that this feature is set up
on your account.
63
- Most transfers are completed within three business days of your call. ACH
purchases will receive the NAV calculated on the day the money is received.
- There is no fee to your account for this transaction and generally, no fee
from your bank.
REDEMPTIONS IN KIND
The Funds have elected, under Rule 18f-1 under the Investment Company Act of
1940, as amended, to pay sales proceeds in cash up to $250,000 or 1% of each
Fund's total value during any 90-day period for any one shareholder, whichever
is less.
Larger redemptions may be detrimental to existing shareholders. While we intend
to pay all sales proceeds in cash, we reserve the right to make payments for
larger redemptions to you in the form of certain marketable securities of a
Fund. This is called a "redemption in kind." You may need to pay certain sales
charges related to a redemption in kind, such as brokerage commissions, when you
sell the securities. For shares that are not held in a tax deferred account,
redemptions in kind are taxable for federal income tax purposes in the same
manner as when the sales proceeds are paid in cash.
INVOLUNTARY REDEMPTIONS
To reduce expenses, we may sell your shares and close your fund position(s) if
its value falls below $1,500 for any reason. Unless you did not meet the minimum
initial investment, we will give you 30 days notice before we sell your shares.
This gives you an opportunity to purchase enough shares to raise the value of
your fund position above $2,500 (the minimum initial investment for regular
accounts) to avoid closing it out. We will not close out fund positions in IRAs,
Education Savings Accounts, custodial accounts for minors, or active Automatic
Investment Plans. Redemption fees will not be assessed on involuntary
redemptions.
WHAT IS A MEDALLION SIGNATURE GUARANTEE?
A Medallion Signature Guarantee verifies the authenticity of your signature and
may be obtained from a domestic bank or trust company, broker, dealer, clearing
agency, savings association or other financial institution which is
participating in a Medallion Program recognized by the Securities Transfer
Association.
Medallion Signature Guarantees help ensure that major transactions or changes to
your account are in fact authorized by you. For example, we require a Medallion
Signature Guarantee on written redemption requests for more than $50,000. The
three recognized medallion programs are Securities Transfer Agents Medallion
Program (STAMP), Stock Exchanges Medallion Program (SEMP) and New York Stock
Exchange, Inc. Medallion Signature Program (NYSE MSP). Signature guarantees from
financial institutions which are not participating in one of these programs will
not be accepted.
A NOTARY PUBLIC STAMP OR SEAL CANNOT BE SUBSTITUTED FOR A MEDALLION SIGNATURE
GUARANTEE.
TRANSACTION POLICIES
CALCULATING SHARE PRICE
When you buy, exchange or sell shares, the NAV next determined is used to price
your purchase or sale. The NAV for each share class of a Fund is determined each
business day at the close of regular trading on the NYSE (typically 4 p.m. ET)
by dividing the net assets of a Fund by the number of shares outstanding.
Currently, the Funds observe the following holidays: New Year's Day, Martin
Luther King, Jr. Day, Presidents' Day, Good Friday, Memorial Day, Independence
Day, Labor Day, Thanksgiving Day and Christmas Day. Generally, market quotes are
used to price securities. If market quotations are not available or are deemed
unreliable, securities are valued at fair value as determined by the investment
adviser in accordance with guidelines adopted and periodically reviewed by the
Board of Trustees. These circumstances may arise, for instance, when trading in
a security is suspended, the exchange or market on which a security is traded
closes early, or the trading volume in a security is limited, calling into
question the reliability of market quotations. In such a case, the Fund's value
for a security is likely to be different from the last quoted market price. In
addition, due to the subjective and variable nature of fair value pricing, it is
possible that the fair value determined for a particular security may be
materially different from the value realized upon such security's sale. The
Board of Trustees receives a report of any actions taken under the Funds' fair
valuation procedures.
Quotations of foreign securities denominated in foreign currency are converted
to U.S. dollar equivalents using foreign exchange quotations received from
independent dealers. Events affecting the values of portfolio securities that
occur between the time their prices are determined and the close of regular
trading on the NYSE may not be reflected in the calculation of NAV. If events
materially affecting the value of such securities occur during such period, then
these securities may be valued at fair value as determined by the investment
adviser in accordance with guidelines adopted by the Board of Trustees.
Certain Funds may invest in certain securities which are primarily listed on
foreign exchanges that trade on weekends and other days when a Fund does not
price its shares. Therefore the value of a Fund's holdings may change on days
when you will not be able to purchase or redeem its shares.
In addition, changes in values in the U.S. markets subsequent to the close of a
foreign market may affect the values of securities traded in the foreign market.
Under a Fund's fair value pricing policies, the values of foreign securities may
be adjusted from their last closing prices if such movements in the U.S. market
exceed a specified threshold. As a result of the foregoing, it is possible that
fair value prices will be used by a Fund to a significant extent. The Funds have
retained an independent statistical fair value pricing service to assist in the
fair valuation of securities principally traded in a foreign market in order to
adjust for possible changes in value that may occur between the close of the
foreign exchange and the time as of which Fund shares are priced.
64
ASTON/FORTIS INVESTOR MONEY MARKET FUND uses the amortized cost method to value
its investments. Portfolio securities are valued at their purchase price and
adjustments for discounts or premiums are reflected in their acquisition cost.
The amortized cost method of valuation is designed to help the Fund maintain a
constant price of $1.00 per share.
EXECUTION OF REQUESTS
Each Fund is open on each business day that the NYSE is open for trading. The
NYSE is not open on weekends or national holidays. Buy, exchange and sell
requests are executed at the NAV next calculated after Aston Funds or an
authorized broker or designee receives your mail, telephone or Internet request
in "good order." Purchase orders and redemption requests for each Fund, except
the Aston/Fortis Investor Money Market Fund, must be received by the close of
regular trading on the NYSE (typically 4 p.m. ET) for same day processing.
Purchase orders and redemption requests for the Aston/Fortis Investor Money
Market Fund must be received by 1 p.m. (ET) for same day processing. On days
when the Federal Reserve Cash Settlement System closes earlier than normal,
these times may be accelerated. Sales proceeds are normally sent the next
business day, but are always sent within seven days of receipt of a request in
"good order." Brokers and their authorized designees are responsible for
forwarding purchase orders and redemption requests to the Funds.
Shares of Aston Funds can also be purchased through broker-dealers, banks and
trust departments that may charge you a transaction or other fee for their
services. These fees are not charged if you purchase shares directly from Aston
Funds.
A Fund may be required to "freeze" your account if there appears to be
suspicious activity or if account information matches information on a
government list of known terrorists or other suspicious persons.
Aston Funds reserves the right to:
- refuse any purchase or exchange of shares if it could adversely affect a Fund
or its operations;
- suspend the offering of Fund shares;
- change the initial and additional investment minimums or waive these minimums
for any investor;
- delay sending you your sales proceeds for up to 15 days if you purchased
shares by check. A minimum $20 charge will be assessed if any check used to
purchase shares is returned;
- change, withdraw or waive various services, fees and account policies.
CUSTOMER IDENTIFICATION PROGRAM
Federal law requires Aston Funds to obtain, verify and record identifying
information for each investor who opens or reopens an account with Aston Funds.
An investor may be an individual or a person other than an individual (such as a
corporation, partnership or trust). Such identifying information may include the
name, residential or business street address, principal place of business, local
office or other physical location (for a person other than an individual), date
of birth (for an individual), social security or taxpayer identification number
or other identifying information. Applications without the required information,
or without any indication that a social security or taxpayer identification
number has been applied for, may not be accepted. After acceptance, to the
extent permitted by applicable law or its customer identification program, Aston
Funds reserves the right (a) to place limits on transactions in any account
until the identity of the investor is verified; or (b) to refuse an investment
in Aston Funds or to involuntarily redeem an investor's shares and close an
account in the event that an investor's identity is not verified. Aston Funds
and its agents will not be responsible for any loss in an investor's account
resulting from the investor's delay in providing all required identifying
information or from closing an account and redeeming an investor's shares when
an investor's identity cannot be verified.
MONEY MARKET TRADING
For Aston/Fortis Investor Money Market Fund, your purchase will be processed at
the NAV calculated after your investment has been converted to federal funds. On
days when the NYSE is open for trading and federal banks are closed (currently,
Columbus Day and Veterans' Day), conversion into federal funds does not occur
until the next business day. If you invest by check or a non-federal funds wire,
you should allow one business day after receipt for conversion into federal
funds. Checks must be made payable to "Aston Funds."
SHORT-TERM AND EXCESSIVE TRADING
Except for the Aston/Fortis Investor Money Market Fund, the Funds are designed
for long-term investors. Each Fund discourages and does not knowingly
accommodate short-term and excessive trading. Such trading increases brokerage
and administrative costs, may result in increased taxable gains to remaining
shareholders and may disrupt portfolio management. For example, the Funds may be
unable to effectively invest the proceeds from certain purchase or exchange
requests under certain market conditions or may incur losses on the sale of
investments. These risks may be more pronounced for Funds investing in
securities that are more difficult to value or that are susceptible to pricing
arbitrage (e.g., foreign securities, high yield securities and small cap
securities). Thus, such trading may negatively impact a Fund's NAV and result in
dilution to long-term shareholders.
65
In an effort to protect long-term shareholders, the Funds' Board of Trustees has
adopted policies and procedures which seek to deter short-term trading and
excessive trading and to detect such trading activity at levels that may be
detrimental to the Funds. These policies and procedures include the following:
- Certain Funds have adopted a redemption fee of 2.00% for shares held less than
90 calendar days;
- The Funds (except the Aston/Fortis Investor Money Market Fund) have adopted
certain fair valuation practices intended to protect the Funds from time zone
arbitrage with respect to foreign securities and other trading practices that
seek to exploit stale prices;
- The Funds or their agents will not be responsible for any unauthorized
telephone or online order when reasonable procedures designed to verify the
identity of the investor are followed.
- The Funds reserve the right to:
- Reject any purchase, including exchange purchases, that could adversely
affect the Funds or their operations;
- Limit, terminate or otherwise modify the exchange privilege of any
shareholder deemed to be engaged in activities that may be detrimental to
the Funds;
- Reject any purchase, including exchange purchases, from investors if there
appears to be evidence of short-term trading or excessive trading;
Permanently prevent future purchases and exchanges from occurring in
accounts where short-term trading or excessive trading is apparent;
- Delay sending redemption proceeds for up to seven days (generally applies
only in cases of very large redemptions, excessive trading, or during
unusual market conditions);
- Suspend redemptions as permitted by law (e.g., emergency situations).
In making the determination to exercise these rights, the Funds may consider an
investor's trading history in the Funds and accounts under common ownership or
control. The Funds seek to employ reasonable measures to detect short-term and
excessive trading at levels that may be detrimental to the Funds. Accordingly,
the Funds use certain materiality and volume thresholds in applying the policies
and procedures, but otherwise seek to apply the policies and procedures
uniformly to all shareholders. With respect to accounts held through
intermediaries, such intermediaries generally are contractually obligated to
provide the Funds with certain shareholder trading information. However, the
Funds cannot directly control activity through all channels and are dependent on
intermediaries to enforce the Funds' policies and procedures. In certain cases,
intermediaries may be unable to implement these policies or may not be able to
implement policies and procedures in the same manner as the Funds due to system
or other constraints or issues. Shareholders who invest through omnibus accounts
may be subject to policies and procedures that differ from those applied by the
Funds to direct shareholders. The Funds reserve the right to limit an
intermediary's future access to the Funds, up to and including termination of
the Selling Agreement held with said intermediary. There is no assurance that
the Funds' policies and procedures will be effective in limiting and deterring
short-term and excessive trading in all circumstances.
Unlike the other Funds, the Aston/Fortis Investor Money Market Fund is designed
for liquidity needs and is not actively monitored for market timing. As a
result, the Fund's Board of Trustees has determined that it would be appropriate
for the Aston/Fortis Investor Money Market Fund not to adopt policies and
procedures with respect to short-term and excessive trading. Nevertheless, the
Aston/Fortis Investor Money Market Fund reserves the right to reject or limit
any purchase, including exchange purchases, or to terminate or limit exchange
privileges if it appears that the Aston/Fortis Investor Money Market Fund is
being used to facilitate short-term and excessive trading with other Aston
Funds.
REDEMPTION FEES
The following Aston Funds assess a 2.00% fee on redemptions (including
exchanges) of Fund shares sold or exchanged within 90 calendar days of purchase:
Aston/Fortis Real Estate Fund, Aston/Neptune International Fund and Aston/Fortis
Global Real Estate Fund.
Redemption fees are paid to the respective Fund to help offset transaction costs
and to protect the Fund's long-term shareholders. Each Fund will use the "first-
in, first-out" (FIFO) method to determine the holding period. Under this method,
the date of the redemption or exchange will be compared to the earliest purchase
date of shares held in the account. If this holding period is less than the
required holding period, the fee will be charged.
The Funds will notify intermediaries, such as broker-dealers or plan
administrators, of the Funds' policies and procedures and request the
intermediaries to track and remit redemption fees to the Fund. However, due to
limitations with system capabilities, certain broker-dealers, banks, plan
administrators and other intermediaries may not be able to track and collect
redemption fees at this time or their method for tracking and calculating
redemption fees may differ from those of the Funds. There is no assurance that
the Funds' redemption fee policies and procedures will be effective in limiting
and deterring short-term and excessive trading in all circumstances. Redemption
fees may not be assessed in certain circumstances, including the following:
shares purchased through reinvested distributions; certain distributions
required by law or due to shareholder hardship; redemptions through a Systematic
Withdrawal Plan; redemption of shares through an Automatic Investment Plan;
accounts held through intermediaries that are unable or unwilling to assess
redemption fees and do not report sufficient information to the Funds to impose
a redemption fee (as discussed above); and circumstances where the Funds'
Administrator believes it to be in the best interest of the Funds and in
accordance with the Funds' policies and procedures to waive the redemption fee
on behalf of the Funds.
66
ACCOUNT POLICIES AND DIVIDENDS
ACCOUNT STATEMENTS
In general, you will receive quarterly account statements. In addition, you will
also receive account statements:
- after every transaction that affects your account balance (except for dividend
reinvestments, automatic investment plans or systematic withdrawal plans);
- after any change of name or address of the registered owner(s).
You will also receive an annual statement that describes the federal income tax
characteristics of any dividends and distributions your Fund has paid to the
investor during the year.
Aston Funds may charge a fee for certain services, such as providing historical
account documents.
MAILINGS TO SHAREHOLDERS
To help reduce Fund expenses and environmental waste, Aston Funds combines
mailings for multiple accounts going to a single household by delivering Fund
reports (annual and semi-annual reports, prospectuses, etc.) in a single
envelope. If you do not want us to continue consolidating your Fund mailings and
would prefer to receive separate mailings with multiple copies of Fund reports,
please call one of our Investor Services Associates at 800 992-8151.
DISTRIBUTIONS
The Funds distribute income dividends and net capital gains. Income dividends
represent the earnings from a Fund's investments less its expenses; capital
gains generally occur when a Fund sells a portfolio security for more than the
original purchase price.
DIVIDENDS
The following table shows the Funds' dividend and distribution schedule.
DISTRIBUTION SCHEDULE
FUNDS DIVIDENDS, IF ANY CAPITAL GAINS DISTRIBUTIONS, IF ANY
Equity, - Declared and paid - Distributed at least once a year,
Global/International annually generally in December
and Sector Funds
(except Aston/River
Road Dividend All Cap
Value Fund and Aston
Value Fund)
Alternative Funds, - Declared and paid - Distributed at least once a year,
Balanced Funds and quarterly generally in December
Aston Value Fund
(except the Aston/MB
Enhanced Equity
Income Fund)
Fixed Income Fund, - Declared and paid - Distributed at least once a year,
Aston/River Road monthly generally in December
Dividend All Cap
Value Fund and
Aston/MB Enhanced
Equity Income Fund
Money Market Fund - Declared daily and - Distributed at least once a year,
paid monthly generally in December
UNCASHED CHECKS
Checks should be cashed upon receipt, as interest will not be paid on uncashed
checks. State escheat laws generally require the Trust to remit uncashed checks
to the appropriate state after a specific period of time.
DIVIDEND REINVESTMENTS
Investors may have their dividends and distributions reinvested in additional
shares of the same Fund. If you choose this option, or if you do not indicate a
choice, your dividends and distributions will be automatically reinvested on the
dividend payable date. You can also choose to have a check for your dividends
and distributions mailed to you by choosing this option on your account
application.
ADDITIONAL INVESTOR SERVICES
AUTOMATIC INVESTMENT PLAN
The Automatic Investment Plan allows you to set up a regular transfer of funds
from your bank account to the Aston Fund(s) of your choice. You determine the
amount of your investment (minimum: $50 as long as you meet the account
minimum), and you can terminate the program at any time. To take advantage of
this feature, complete the appropriate sections of the account application.
ASTON FUNDS WEB SITE
The Funds maintain a Web site located at www.astonfunds.com. You can purchase,
exchange and redeem shares, and access information such as your account balance
and the Funds' NAVs through our Web site. Self-register online for account
access at www.astonfunds.com. Your social security number or employer
identification number, account number and other security validity information
will be required for registration. You may also need to have bank account
information, wire instructions, ACH instructions or other options established on
your account.
Aston Funds has procedures in place to try to prevent unauthorized access to
your account information. The Funds and their agents will not be responsible for
any losses resulting from unauthorized transactions on our Web site.
67
SYSTEMATIC WITHDRAWAL PLAN
This plan may be used for periodic withdrawals (at least $50 by check or ACH)
from your account. To take advantage of this feature:
- you must have at least $50,000 in your account;
- determine the schedule: monthly, quarterly, semi-annually or annually;
- call 800 992-8151 to add a systematic withdrawal plan to your account.
RETIREMENT PLANS AND EDUCATION SAVINGS ACCOUNTS
Aston Funds offer a range of retirement plans, including Traditional, Roth,
SIMPLE IRAs and SEP IRAs. Aston Funds also offers Education Savings Accounts,
which allow you to save for qualified elementary, secondary and higher education
costs. Using these plans, you can invest in any Aston Fund with a low minimum
investment of $500. The annual maintenance fee for IRAs and Education Savings
Accounts is $15 per account (not to exceed $30), but it is waived if you have
$35,000 or more in assets. The fee is assessed every December for the current
calendar year. To find out more, call Aston Funds at 800 992-8151.
DISTRIBUTION PLAN 12B-1 FEES
To pay for the cost of promoting the Funds and servicing your shareholder
account, the Funds, except for Aston/Fortis Investor Money Market Fund, have
adopted a Rule 12b-1 distribution plan. Under this plan, a Fund pays a fee at an
annual rate of not more than 0.25% of each Fund's Class N shares' average daily
net assets to the distributor for certain expenses associated with the
distribution of Fund shares and other services. The fee is accrued daily and
payable monthly. Over time, these fees may increase the cost of your investment
and may cost more than paying other types of sales charges.
In addition to distribution and service fees paid by the Funds, Aston may pay
compensation to intermediaries that distribute and/or service investors in the
Funds out of its own assets and not as an additional charge to the Funds. These
additional payments, which are sometimes referred to as "revenue sharing," may
represent a premium over payments made by other fund families, and may create an
added incentive for investment professionals to sell or recommend the Funds over
other funds offered by competing fund families. The revenue sharing payments may
differ for each fund within the Aston family of funds, including within the same
intermediary, and across intermediaries.
In addition, representatives of the distributor may be compensated through
Adviser incentive programs in a manner that favors one Aston Fund or group of
funds over another fund.
PORTFOLIO TRANSACTIONS AND BROKERAGE COMMISSIONS
The subadvisers attempt to obtain the best possible price and most favorable
execution of transactions in their portfolio securities. There may be times when
a subadviser may pay one broker-dealer a commission that is greater than the
amount that another broker-dealer may charge for the same transaction. The
Subadvisers generally determine in good faith if the commission paid was
reasonable in relation to the brokerage or research services provided by the
broker-dealer. In selecting and monitoring broker-dealers and negotiating
commissions, the subadvisers consider a broker-dealer's reliability,
availability of research, the quality of its execution services and its
financial condition.
68
Dividends, Distributions and Taxes
The Funds pay dividends and distribute capital gains at different intervals. All
dividends and distributions are automatically reinvested at NAV unless you
choose to receive them in a cash payment. You can change your payment options at
any time by writing to us.
Certain tax considerations may apply to your investment in an Aston Fund. The
following is a general description of certain federal income tax considerations.
If you have any tax-related questions relating to your investment in an Aston
Fund, please consult your tax adviser. Further information regarding the federal
income tax consequences of investing in the Funds is included in the SAI.
TAXES
For federal income tax purposes:
- The tax treatment of dividends and distributions is the same whether you
reinvest the dividends and distributions or elect to receive them in cash. You
will receive a statement with the federal income tax status of your dividends
and distributions for the prior year by January 31.
- Distributions of any net investment income, other than "qualified dividend
income," are taxable to you as ordinary income.
- Distributions of qualified dividend income (i.e., generally dividends received
by a Fund from domestic corporations and certain foreign corporations)
generally will be taxed to individuals and other non-corporate investors in
the Funds at federal income tax rates applicable to long-term capital gains,
provided you meet certain holding period and other requirements contained in
the Internal Revenue Code of 1986 (the "Code") with respect to your Fund
shares and the Fund meets similar holding period and other requirements with
respect to the dividend paying stock. The favorable treatment of qualified
dividend income will expire for taxable years beginning after December 31,
2010. Dividends received by a Fund from most REITs and certain foreign
corporations are not expected to qualify for treatment as qualified dividend
income when distributed by a Fund. Therefore, it is not expected that a
significant amount of the Aston/Fortis Real Estate Fund's and Aston/Fortis
Global Real Estate Fund's distributions will qualify for treatment as
qualified dividend income when distributed by these Funds.
- If a Fund receives dividends from an ETF that qualifies as a regulated
investment company for federal income tax purposes and the ETF designates such
dividends as qualified dividend income, then the Fund may in turn designate
that portion of its distributions derived from those dividends as qualified
dividend income as well, provided the Fund meets certain holding period and
other requirements with respect to the shares of the ETF.
- Distributions of net capital gain (net long-term capital gain less any net
short-term capital loss) are taxable as long-term capital gain regardless of
how long you may have held shares of a Fund. In contrast, distributions of net
short-term capital gain (net short-term capital gain less any net long-term
capital loss) are taxable as ordinary income regardless of how long you may
have held shares of a Fund. Because distributions of net short-term capital
gain are taxable as ordinary income, you generally cannot offset net short-
term capital gain distributions you receive from a Fund with capital losses.
- A Fund's use of a fund-of-funds structure could affect the amount, timing and
type of distributions from the Fund and, therefore, may increase the amount of
taxes payable by you. Generally, the character of the dividends and
distributions a Fund receives from an underlying fund will "pass through" to
you, subject to certain exceptions, as long as the Fund and the underlying
fund each qualify as a regulated investment company under the Code.
- Distributions declared to the shareholders of record in October, November or
December and paid on or before January 31 of the succeeding year will be
treated for federal income tax purposes as if received by shareholders on
December 31 of the year in which the distribution was declared.
- When you sell or exchange shares (other than shares held in a tax-deferred
account) it generally is considered a taxable event for you. Depending on the
purchase price and the sale price of the shares you sell or exchange, you may
have a gain or a loss on the transaction. The gain or loss will generally be
treated as a long-term capital gain or loss if you held your shares for more
than one year. If you held your shares for one year or less, the gain or loss
will generally be treated as a short-term capital gain or loss. Short-term
capital gains are taxable at ordinary federal income tax rates. For taxable
years beginning on or before December 31, 2010, long-term capital gains are
taxable to individuals and other non-corporate investors at a maximum federal
income tax rate of 15%. You are responsible for any tax liabilities generated
by your transactions.
- If you do not provide Aston Funds with your complete and correct taxpayer
identification number and required certification, or if the Internal Revenue
Service so notifies us, you may be subject to backup withholding tax on
dividends, distributions and redemption proceeds.
- If you purchase shares of a Fund just before a dividend or distribution, you
will pay the full price for the shares and receive a portion of the purchase
price back as a taxable distribution. This is referred to as "buying a
dividend."
- If a Fund qualifies (by having more than 50% of the value of its total assets
at the close of the taxable year consist of stock or securities in foreign
corporations) and elects to pass through foreign taxes paid on its investments
during the year, such taxes will be reported to you as income. You may,
however, be able to claim an offsetting tax credit or deduction on your
federal income tax return, depending on your particular circumstances and
provided you meet certain holding period and other requirements.
69
Financial Highlights
These financial highlights tables are to help you understand the Funds'
financial performance. The following schedules present financial highlights for
one share of each Fund outstanding throughout the periods indicated. The total
returns in the tables represent the rate that an investor would have earned or
lost on an investment in a Fund (assuming reinvestment of all dividends and
distributions). This information has been derived from the Funds' financial
statements as of October 31, 2008. The Aston/Fortis Investor Money Market Fund's
financial statements for the fiscal year ended October 31, 2008 have been
audited by KPMG LLP, whose report, along with the Aston/Fortis Investor Money
Market Fund's financial statements, is included in the Fund's Annual Report,
which is available upon request. The Aston/Fortis Investor Money Market Fund's
schedules for the years ended prior to October 31, 2008 have been audited by the
Fund's former independent registered public accounting firm, whose reports
expressed an unqualified opinion on the financial highlights.
The financial statements for the other Funds in this prospectus have been
audited by Ernst & Young LLP, whose report along with those Funds' financial
statements, is included in the Funds' Annual Report, which is available upon
request.
ASTON/MONTAG & CALDWELL GROWTH FUND
Year Year Year Year Year
Ended Ended Ended Ended Ended
10/31/08 10/31/07 10/31/06 10/31/05 10/31/04
-------- -------- -------- -------- --------
Net Asset Value, Beginning of Period $31.51 $25.15 $23.35 $21.53 $20.74
------ ------ ------ ------ ------
INCOME FROM INVESTMENT OPERATIONS:
Net investment income 0.07(a) 0.06(a) 0.07(a) 0.05(a) 0.04(a)
Net realized and unrealized gain (loss) on
investments (8.66) 6.54 1.80 1.83 0.77
------ ------ ------ ------ ------
Total from investment operations (8.59) 6.60 1.87 1.88 0.81
------ ------ ------ ------ ------
LESS DISTRIBUTIONS:
Distributions from and in excess of net
investment income (0.05) (0.06) (0.07) (0.06) (0.02)
Distributions from net realized gain on
investments (4.03) (0.18) -- -- --
------ ------ ------ ------ ------
Total distributions (4.08) (0.24) (0.07) (0.06) (0.02)
------ ------ ------ ------ ------
Net increase (decrease) in net asset value (12.67) 6.36 1.80 1.82 0.79
------ ------ ------ ------ ------
Net Asset Value, End of Period $18.84 $31.51 $25.15 $23.35 $21.53
====== ====== ====== ====== ======
TOTAL RETURN (31.13)% 26.41% 8.02% 8.72% 3.89%
RATIOS/SUPPLEMENTAL DATA:
Net Assets, End of Period (in 000's) $602,905 $759,567 $846,100 $992,229 $1,018,935
Ratios of expenses to average net assets:
Before reimbursement and/or waiver of
expenses by Adviser 1.08%(b) 1.07%(b) 1.06%(b) 1.03% 1.02%
After reimbursement and/or waiver of
expenses by Adviser 1.08%(b) 1.07%(b) 1.06%(b) 1.03% 1.02%
Ratios of net investment income to average net
assets:
Before reimbursement and/or waiver of
expenses by Adviser 0.26% 0.23% 0.28% 0.20% 0.20%
After reimbursement and/or waiver of
expenses by Adviser 0.26% 0.23% 0.28% 0.20% 0.20%
Portfolio Turnover 52.32% 69.02% 68.74% 52.16% 52.86%
------------------------
(a)The selected per share data was calculated using the weighted average shares
outstanding method for the period.
(b)Ratios of expenses to average net assets include interest expense of less
than 0.005% for the years ended October 31, 2008, October 31, 2007 and October
31, 2006. The interest expense is from utilizing the line of credit.
70
ASTON/VEREDUS SELECT GROWTH FUND
Year Year Year Year Year
Ended Ended Ended Ended Ended
10/31/08 10/31/07 10/31/06 10/31/05 10/31/04
-------- -------- -------- -------- --------
Net Asset Value, Beginning of Period $16.77 $13.08 $11.88 $10.31 $9.33
------ ------ ------ ------ ------
INCOME FROM INVESTMENT OPERATIONS:
Net investment loss (0.06) (0.08) (0.03)(a) (0.02) (0.06)
Net realized and unrealized gain (loss) on
investments (5.60) 3.77 1.24 1.59 1.04
------ ------ ------ ------ ------
Total from investment operations (5.66) 3.69 1.21 1.57 0.98
------ ------ ------ ------ ------
LESS DISTRIBUTIONS:
Distributions from net realized gain on
investments (2.42) -- (0.01) -- --
------ ------ ------ ------ ------
Total distributions (2.42) -- (0.01) -- --
------ ------ ------ ------ ------
Net increase (decrease) in net asset value (8.08) 3.69 1.20 1.57 0.98
------ ------ ------ ------ ------
Net Asset Value, End of Period $8.69 $16.77 $13.08 $11.88 $10.31
====== ====== ====== ====== ======
TOTAL RETURN (39.09)% 28.14% 10.22% 15.23% 10.50%
RATIOS/SUPPLEMENTAL DATA:
Net Assets, End of Period (in 000's) $37,142 $50,783 $34,687 $13,270 $2,684
Ratios of expenses to average net assets:
Before reimbursement and/or waiver of
expenses by Adviser 1.34% 1.52% 1.75% 2.57% 3.82%
After reimbursement and/or waiver of
expenses by Adviser 1.30% 1.30% 1.30% 1.30% 1.30%
Ratios of net investment loss to average net
assets:
Before reimbursement and/or waiver of
expenses by Adviser (0.55)% (0.81)% (0.72)% (1.76)% (3.17)%
After reimbursement and/or waiver of
expenses by Adviser (0.51)% (0.59)% (0.27)% (0.49)% (0.65)%
Portfolio Turnover 387.57% 283.38% 269.88% 202.37% 308.13%
------------------------
(a)The selected per share data was calculated using the weighted average shares
outstanding method for the period.
71
ASTON GROWTH FUND
Year Year Year Year Year
Ended Ended Ended Ended Ended
10/31/08 10/31/07 10/31/06 10/31/05 10/31/04
-------- -------- -------- -------- --------
Net Asset Value, Beginning of Period $22.49 $22.82 $22.66 $21.76 $21.14
------ ------ ------ ------ ------
INCOME FROM INVESTMENT OPERATIONS:
Net investment income (loss) 0.02 0.05(a) --(b) 0.05(a) (0.05)(a)
Net realized and unrealized gain (loss) on
investments (5.93) 2.39 1.25 0.90 0.67
------ ------ ------ ------ ------
Total from investment operations (5.91) 2.44 1.25 0.95 0.62
------ ------ ------ ------ ------
LESS DISTRIBUTIONS:
Distributions from and in excess of net
investment income -- (0.03) -- (0.05) --
Distributions from net realized gain on
investments (5.63) (2.74) (1.09) -- --
------ ------ ------ ------ ------
Total distributions (5.63) (2.77) (1.09) (0.05) --
------ ------ ------ ------ ------
Net increase (decrease) in net asset value (11.54) (0.33) 0.16 0.90 0.62
------ ------ ------ ------ ------
Net Asset Value, End of Period $10.95 $22.49 $22.82 $22.66 $21.76
====== ====== ====== ====== ======
TOTAL RETURN (33.76)% 11.85% 5.55% 4.38% 2.93%
RATIOS/SUPPLEMENTAL DATA:
Net Assets, End of Period (in 000's) $62,674 $172,436 $446,884 $888,248 $962,036
Ratios of expenses to average net assets:
Before reimbursement and/or waiver of
expenses by Adviser 1.15%(c) 1.11%(c) 1.10%(c) 1.10% 1.09%
After reimbursement and/or waiver of
expenses by Adviser 1.15%(c) 1.11%(c) 1.10%(c) 1.10% 1.09%
Ratios of net investment income (loss) to
average net assets:
Before reimbursement and/or waiver of
expenses by Adviser 0.09% 0.23% 0.01% 0.21% (0.22)%
After reimbursement and/or waiver of
expenses by Adviser 0.09% 0.23% 0.01% 0.21% (0.22)%
Portfolio Turnover 122.68% 47.46% 29.07% 31.30%(d) 18.59%
------------------------
(a)The selected per share data was calculated using the weighted average shares
outstanding method for the period.
(b)Represents less than $0.005 per share.
(c)Ratios of expenses to average net assets include interest expense of 0.01%
for the year ended October 31, 2008 and less than 0.005% for the years ended
October 31, 2007 and October 31, 2006. The interest expense is from utilizing
the line of credit.
(d)Portfolio turnover rate excludes securities delivered from processing a
redemption-in-kind.
72
ASTON/OPTIMUM LARGE CAP OPPORTUNITY FUND
Year Period
Ended Ended
10/31/08 10/31/07(a)
-------- -----------
Net Asset Value, Beginning of Period $12.56 $10.00
------ ------
INCOME FROM INVESTMENT OPERATIONS:
Net investment income (0.02) (0.01)
Net realized and unrealized gain (loss) on investments (5.74) 2.57
------ ------
Total from investment operations (5.76) 2.56
------ ------
LESS DISTRIBUTIONS:
Distributions from and in excess of net investment income (0.01) --
------ ------
Total distributions (0.01) --
------ ------
Net increase (decrease) in net asset value (5.77) 2.56
------ ------
Net Asset Value, End of Period $6.79 $12.56
====== ======
TOTAL RETURN (45.90)% 25.60%(b)
RATIOS/SUPPLEMENTAL DATA:
Net Assets, End of Period (in 000's) $3,691 $40,563
Ratios of expenses to average net assets:
Before reimbursement and/or waiver of expenses by Adviser 1.89%(c) 2.30%(c)(d)
After reimbursement and/or waiver of expenses by Adviser 1.12%(c) 1.13%(c)(d)(e)
Ratios of net investment loss to average net assets:
Before reimbursement and/or waiver of expenses by Adviser (0.86)% (1.31)%(c)
After reimbursement and/or waiver of expenses by Adviser (0.09)% (0.14)%(c)
Portfolio Turnover 48.87% 76.40%(b)
------------------------
(a)Aston/Optimum Large Cap Opportunity Fund-Class N commenced investment
operations on December 28, 2006.
(b)Not Annualized.
(c)Ratios of expenses to average net assets include interest expense of 0.02%
for the year ended October 31, 2008 and the period ended October 31, 2007, which
is not included in the voluntary expense limitation. The interest expense is
from utilizing the line of credit.
(d)Annualized.
(e)The Adviser's expense reimbursement level, which affects the net expense
ratio, was implemented on May 1, 2007.
73
ASTON VALUE FUND
Year Year Year Year Year
Ended Ended Ended Ended Ended
10/31/08 10/31/07 10/31/06 10/31/05 10/31/04
-------- -------- -------- -------- --------
Net Asset Value, Beginning of Period $15.57 $14.06 $12.15 $11.05 $9.66
------ ------ ------ ------ ------
INCOME FROM INVESTMENT OPERATIONS:
Net investment income 0.15 0.19 0.21 0.17(a) 0.14
Net realized and unrealized gain (loss) on
investments (5.08) 2.09 2.09 1.10 1.39
------ ------ ------ ------ ------
Total from investment operations (4.93) 2.28 2.30 1.27 1.53
------ ------ ------ ------ ------
LESS DISTRIBUTIONS:
Distributions from and in excess of net
investment income (0.16) (0.20) (0.20) (0.17) (0.14)
Distributions from net realized gain on
investments (1.41) (0.57) (0.19) -- --
------ ------ ------ ------ ------
Total distributions (1.57) (0.77) (0.39) (0.17) (0.14)
------ ------ ------ ------ ------
Net increase (decrease) in net asset value (6.50) 1.51 1.91 1.10 1.39
------ ------ ------ ------ ------
Net Asset Value, End of Period $9.07 $15.57 $14.06 $12.15 $11.05
====== ====== ====== ====== ======
TOTAL RETURN (34.85)% 16.77% 19.35% 11.48% 15.88%
RATIOS/SUPPLEMENTAL DATA:
Net Assets, End of Period (in 000's) $19,704 $130,476 $103,819 $95,624 $229,979
Ratios of expenses to average net assets:
Before reimbursement and/or waiver of
expenses by Adviser 1.18%(b) 1.16% 1.16% 1.16% 1.16%
After reimbursement and/or waiver of
expenses by Adviser 1.02%(b) 0.94% 0.94% 0.94% 0.94%
Ratios of net investment income to average net
assets:
Before reimbursement and/or waiver of
expenses by Adviser 1.22% 1.06% 1.37% 1.19% 1.10%
After reimbursement and/or waiver of
expenses by Adviser 1.38% 1.28% 1.59% 1.41% 1.32%
Portfolio Turnover 67.57% 28.05% 26.86% 21.84% 38.29%
------------------------
(a)The selected per share data was calculated using the weighted average shares
outstanding method for the period.
(b)Ratios of expenses to average net assets include interest expense of less
than 0.005% for the year ended October 31, 2008, which is not included in the
contractual expense limitation. The interest expense is from utilizing the line
of credit.
74
ASTON/TAMRO ALL CAP FUND
Year Year Year Year Year
Ended Ended Ended Ended Ended
10/31/08 10/31/07 10/31/06 10/31/05 10/31/04
-------- -------- -------- -------- --------
Net Asset Value, Beginning of Period $14.41 $13.91 $12.40 $11.35 $10.27
------ ------ ------ ------ ------
INCOME FROM INVESTMENT OPERATIONS:
Net investment income 0.04 0.03 0.09 0.08 0.07
Net realized and unrealized gain (loss) on
investments (4.94) 2.13 1.53 1.05 1.08
------ ------ ------ ------ ------
Total from investment operations (4.90) 2.16 1.62 1.13 1.15
------ ------ ------ ------ ------
LESS DISTRIBUTIONS:
Distributions from and in excess of net
investment income (0.01) (0.03) (0.11) (0.08) (0.07)
------ ------ ------ ------ ------
Distribution from net realized gain on
investments (1.16) (1.63) -- -- --
Total distributions (1.17) (1.66) (0.11) (0.08) (0.07)
------ ------ ------ ------ ------
Net increase (decrease) in net asset value (6.07) 0.50 1.51 1.05 1.08
------ ------ ------ ------ ------
Net Asset Value, End of Period $8.34 $14.41 $13.91 $12.40 $11.35
====== ====== ====== ====== ======
TOTAL RETURN (36.75)% 16.98% 13.10% 9.98% 11.17%
RATIOS/SUPPLEMENTAL DATA:
Net Assets, End of Period (in 000's) $8,562 $15,359 $15,864 $21,590 $17,574
Ratios of expenses to average net assets:
Before reimbursement and/or waiver of
expenses by Adviser 1.88% 1.74%(a) 1.54%(a) 1.54% 1.76%
After reimbursement and/or waiver of
expenses by Adviser 1.20% 1.20%(a) 1.22%(a) 1.20% 1.20%
Ratios of net investment income (loss) to
average net assets:
Before reimbursement and/or waiver of
expenses by Adviser (0.37)% (0.30)% 0.36% 0.35% 0.00%
After reimbursement and/or waiver of
expenses by Adviser 0.31% 0.24% 0.68% 0.69% 0.56%
Portfolio Turnover 93.82% 37.87% 43.88% 36.84% 38.34%
------------------------
(a)Ratios of expenses to average net assets include interest expense of less
than 0.005% for the year ended October 31, 2007 and 0.02% for the year ended
October 31, 2006, which is not included in the contractual expense limitation.
The interest expense is from utilizing the line of credit.
75
ASTON/RIVER ROAD DIVIDEND ALL CAP VALUE FUND
Year Year Year Period
Ended Ended Ended Ended
10/31/08 10/31/07 10/31/06 10/31/05(a)
-------- -------- -------- -----------
Net Asset Value, Beginning of Period $12.58 $11.81 $9.91 $10.00
------ ------ ------ ------
INCOME FROM INVESTMENT OPERATIONS:
Net investment income 0.38 0.46(b) 0.42 0.13
Short-term capital gains distributions received -- -- --(c) --
Net realized and unrealized loss on investments (3.54) 0.81 1.89 (0.10)
------ ------ ------ ------
Total from investment operations (3.16) 1.27 2.31 0.03
------ ------ ------ ------
LESS DISTRIBUTIONS:
Distributions from and in excess of net investment
income (0.32) (0.37) (0.41) (0.12)
Return of capital (0.01) -- -- --
Distributions from net realized gain on investments (0.66) (0.13) -- --
------ ------ ------ ------
Total distributions (0.99) (0.50) (0.41) (0.12)
------ ------ ------ ------
Net increase (decrease) in net asset value (4.15) 0.77 1.90 (0.09)
------ ------ ------ ------
Net Asset Value, End of Period $8.43 $12.58 $11.81 $9.91
====== ====== ====== ======
TOTAL RETURN (26.82)% 10.89% 23.71% 0.30%(d)
RATIOS/SUPPLEMENTAL DATA:
Net Assets, End of Period (in 000's) $51,504 $32,313 $15,899 $5,326
Ratios of expenses to average net assets:
Before reimbursement and/or waiver of expenses by
Adviser 1.35%(e) 1.53% 2.48% 2.71%(f)
After reimbursement and/or waiver of expenses by
Adviser 1.30%(e) 1.30% 1.30% 1.30%(f)
Ratios of net investment income to average net
assets:
Before reimbursement and/or waiver of expenses by
Adviser 3.81% 3.48% 2.77% 2.65%(f)
After reimbursement and/or waiver of expenses by
Adviser 3.86% 3.71% 3.95% 4.06%(f)
Portfolio Turnover 48.95% 114.56% 45.50% 14.37%(d)
------------------------
(a)Aston/River Road Dividend All Cap Value Fund-Class N commenced investment
operations on June 28, 2005.
(b)The selected per share data was calculated using the weighted average shares
outstanding method for the period.
(c)Represents less than $0.005 per share.
(d)Not Annualized.
(e)Ratios of expenses to average net assets include interest expense of less
than 0.005% for the year ended October 31, 2008, which is not included in the
contractual expense limitation. The interest expense is from utilizing the line
of credit.
(f)Annualized.
76
ASTON/OPTIMUM MID CAP FUND
Year Year Year Year Year
Ended Ended Ended Ended Ended
10/31/08 10/31/07 10/31/06 10/31/05 10/31/04
-------- -------- -------- -------- --------
Net Asset Value, Beginning of Period $32.32 $27.16 $23.21 $22.93 $20.18
------ ------ ------ ------ ------
INCOME FROM INVESTMENT OPERATIONS:
Net investment loss 0.05 (0.02) (0.02) (0.02) (0.08)(a)
Net realized and unrealized gain (loss) on
investments (12.93) 7.01 4.88 1.04 2.90
------ ------ ------ ------ ------
Total from investment operations (12.88) 6.99 4.86 1.02 2.82
------ ------ ------ ------ ------
LESS DISTRIBUTIONS:
Distributions from net realized gain on
investments (2.19) (1.83) (0.91) (0.74) (0.07)
------ ------ ------ ------ ------
Total distributions (2.19) (1.83) (0.91) (0.74) (0.07)
------ ------ ------ ------ ------
Net increase (decrease) in net asset value (15.07) 5.16 3.95 0.28 2.75
------ ------ ------ ------ ------
Net Asset Value, End of Period $17.25 $32.32 $27.16 $23.21 $22.93
====== ====== ====== ====== ======
TOTAL RETURN (42.50)% 27.08% 21.39% 4.43% 14.08%
RATIOS/SUPPLEMENTAL DATA:
Net Assets, End of Period (in 000's) $508,886 $823,036 $577,891 $548,595 $385,325
Ratios of expenses to average net assets:
Before reimbursement and/or waiver of
expenses by Adviser 1.16%(b) 1.15%(b) 1.16% 1.23% 1.29%(c)
After reimbursement and/or waiver of
expenses by Adviser 1.16%(b) 1.15%(b) 1.16% 1.23% 1.29%(c)
Ratios of net investment income (loss) to
average net assets:
Before reimbursement and/or waiver of
expenses by Adviser 0.18% (0.09)% (0.09)% (0.08)% (0.38)%
After reimbursement and/or waiver of
expenses by Adviser 0.18% (0.09)% (0.09)% (0.08)% (0.38)%
Portfolio Turnover 22.58% 26.15% 30.65% 27.42% 26.64%
------------------------
(a)The selected per share data was calculated using the weighted average shares
outstanding method for the period.
(b)Ratios of expenses to average net assets include interest expense of less
than 0.005% for the year ended October 31, 2008 and the year ended October 31,
2007, which is not included in the contractual expense limitation. The interest
expense is from utilizing the line of credit.
(c)The Adviser's Fee, which affects the expense ratios, changed on December 22,
2003 from a flat fee of 0.80% of average net assets to a scaled fee arrangement
of 0.80% of the first $100 million, 0.75% of the next $300 million and 0.70%
over $400 million of the average daily net assets.
77
ASTON/MONTAG & CALDWELL MID CAP GROWTH FUND
Period
Ended
10/31/08(a)
-----------
Net Asset Value, Beginning of Period $10.00
------
INCOME FROM INVESTMENT OPERATIONS:
Net investment income (0.05)
Net realized and unrealized loss on investments (4.10)
------
Total from investment operations (4.15)
------
Net decrease in net asset value (4.15)
------
Net Asset Value, End of Period $5.85
======
TOTAL RETURN (41.50)%(b)
RATIOS/SUPPLEMENTAL DATA:
Net Assets, End of Period (in 000's) $1,815
Ratios of expenses to average net assets:
Before reimbursement and/or waiver of expenses by Adviser 5.80%(c)
After reimbursement and/or waiver of expenses by Adviser 1.40%(c)
Ratios of net investment loss to average net assets:
Before reimbursement and/or waiver of expenses by Adviser (5.07)%(c)
After reimbursement and/or waiver of expenses by Adviser (0.67)%(c)
Portfolio Turnover 63.66%(b)
------------------------
(a)Aston/Montag & Caldwell Mid Cap Growth Fund-Class N commenced investment
operations on November 2, 2007.
(b)Not Annualized.
(c)Annualized.
78
ASTON/CARDINAL MID CAP VALUE FUND
Period
Ended
10/31/08(a)
-----------
Net Asset Value, Beginning of Period $10.00
------
INCOME FROM INVESTMENT OPERATIONS:
Net investment income 0.01
Net realized and unrealized loss on investments (3.78)
------
Total from investment operations (3.77)
------
Net decrease in net asset value (3.77)
------
Net Asset Value, End of Period $6.23
======
TOTAL RETURN (37.70)%(b)
RATIOS/SUPPLEMENTAL DATA:
Net Assets, End of Period (in 000's) $783
Ratios of expenses to average net assets:
Before reimbursement and/or waiver of expenses by Adviser 11.20%(c)
After reimbursement and/or waiver of expenses by Adviser 1.40%(c)
Ratios of net investment income (loss) to average net assets:
Before reimbursement and/or waiver of expenses by Adviser (9.64)%(c)
After reimbursement and/or waiver of expenses by Adviser 0.16%(c)
Portfolio Turnover 51%(b)
------------------------
(a)Aston/Cardinal Mid Cap Value Fund-Class N commenced investment operations on
November 2, 2007.
(b)Not Annualized.
(c)Annualized.
79
ASTON/RIVER ROAD SMALL-MID CAP FUND
Year Period
Ended Ended
10/31/08 10/31/07(a)
-------- -----------
Net Asset Value, Beginning of Period $10.13 $ 10.00
------ -------
INCOME FROM INVESTMENT OPERATIONS:
Net investment income --(b)(c) 0.01
Net realized and unrealized loss on investments (3.00) 0.12
------ -------
Total from investment operations (3.00) 0.13
------ -------
Net increase (decrease) in net asset value (3.00) 0.13
------ -------
Net Asset Value, End of Period $7.13 $ 10.13
====== =======
TOTAL RETURN (29.62)% 1.30%(d)
RATIOS/SUPPLEMENTAL DATA:
Net Assets, End of Period (in 000's) $26,714 $10,292
Ratios of expenses to average net assets:
Before reimbursement and/or waiver of expenses by Adviser 1.56% 3.18%(e)
After reimbursement and/or waiver of expenses by Adviser 1.50% 1.50%(e)
Ratios of net investment income (loss) to average net assets:
Before reimbursement and/or waiver of expenses by Adviser (0.08)% (1.43)%(e)
After reimbursement and/or waiver of expenses by Adviser (0.02)% 0.25%(e)
Portfolio Turnover 54.93% 41.51%(d)
------------------------
(a)Aston/River Road Small-Mid Cap Fund-Class N commenced investment operations
on March 29, 2007.
(b)Represents less than $0.005 per share.
(c)The selected per share data was calculated using the weighted average shares
outstanding method for the period.
(d)Not Annualized.
(e)Annualized.
80
ASTON/VEREDUS AGGRESSIVE GROWTH FUND
Year Year Year Year Year
Ended Ended Ended Ended Ended
10/31/08 10/31/07 10/31/06 10/31/05 10/31/04
-------- -------- -------- -------- --------
Net Asset Value, Beginning of Period $22.42 $18.44 $18.35 $16.26 $15.24
------ ------ ------ ------ ------
INCOME FROM INVESTMENT OPERATIONS:
Net investment loss (0.17) (0.24)(a) (0.22)(a) (0.20) (0.18)
Net realized and unrealized gain (loss) on
investments (8.31) 5.45 0.31 2.29 1.20
------ ------ ------ ------ ------
Total from investment operations (8.48) 5.21 0.09 2.09 1.02
------ ------ ------ ------ ------
LESS DISTRIBUTIONS:
Distribution from net realized gain on
investments (5.56) (1.23) -- -- --
------ ------ ------ ------ ------
Total distributions (5.56) (1.23) -- -- --
------ ------ ------ ------ ------
Net increase (decrease) in net asset value (14.04) 3.98 0.09 2.09 1.02
------ ------ ------ ------ ------
Net Asset Value, End of Period $8.38 $22.42 $18.44 $18.35 $16.26
====== ====== ====== ====== ======
TOTAL RETURN (47.87)% 30.01% 0.49% 12.85% 6.69%
RATIOS/SUPPLEMENTAL DATA:
Net Assets, End of Period (in 000's) $43,149 $114,803 $367,113 $549,452 $524,737
Ratios of expenses to average net assets:
Before reimbursement and/or waiver of
expenses by Adviser 1.55%(b) 1.48%(b) 1.41%(b) 1.42% 1.43%
After reimbursement and/or waiver of
expenses by Adviser 1.49%(b) 1.48%(b) 1.41%(b) 1.42% 1.43%
Ratios of net investment loss to average net
assets:
Before reimbursement and/or waiver of
expenses by Adviser (1.21)% (1.27)% (1.15)% (1.06)% (1.18)%
After reimbursement and/or waiver of
expenses by Adviser (1.15)% (1.27)% (1.15)% (1.06)% (1.18)%
Portfolio Turnover 166.19% 126.54% 133.21% 140.04% 118.89%
------------------------
(a)The selected per share data was calculated using the weighted average shares
outstanding method for the period.
(b)Ratios of expenses to average net assets include interest expense of less
than 0.005% for the year ended October 31, 2008, 0.02% for the year ended
October 31, 2007 and less than 0.005% for the year ended October 31, 2006, which
is not included in the contractual expense limitation. The interest expense is
from utilizing the line of credit.
81
ASTON/TAMRO SMALL CAP FUND
Year Year Year Year Year
Ended Ended Ended Ended Ended
10/31/08 10/31/07 10/31/06 10/31/05 10/31/04
-------- -------- -------- -------- --------
Net Asset Value, Beginning of Period $20.99 $19.73 $15.63 $15.25 $15.75
------ ------ ------ ------ ------
INCOME FROM INVESTMENT OPERATIONS:
Net investment income (loss) 0.05 (0.08)(a) (0.07)(a) (0.07)(a) (0.09)
Net realized and unrealized gain (loss) on
investments (6.43) 2.48 4.17 1.45 1.62
------ ------ ------ ------ ------
Total from investment operations (6.38) 2.40 4.10 1.38 1.53
------ ------ ------ ------ ------
LESS DISTRIBUTIONS:
Distributions from net realized gain on
investments (0.97) (1.14) -- (1.00) (2.03)
------ ------ ------ ------ ------
Total distributions (0.97) (1.14) -- (1.00) (2.03)
------ ------ ------ ------ ------
Net increase (decrease) in net asset value (7.35) 1.26 4.10 0.38 (0.50)
------ ------ ------ ------ ------
Net Asset Value, End of Period $13.64 $20.99 $19.73 $15.63 $15.25
====== ====== ====== ====== ======
TOTAL RETURN (31.58)% 12.56% 26.23% 9.16% 10.17%
RATIOS/SUPPLEMENTAL DATA:
Net Assets, End of Period (in 000's) $159,965 $235,242 $182,462 $148,950 $112,809
Ratios of expenses to average net assets:
Before reimbursement and/or waiver of
expenses by Adviser 1.32% 1.33%(b) 1.42% 1.41% 1.42%
After reimbursement and/or waiver of
expenses by Adviser 1.30% 1.30%(b) 1.30% 1.30% 1.30%
Ratios of net investment (loss) to average
net assets:
Before reimbursement and/or waiver of
expenses by Adviser 0.29% (0.42)% (0.51)% (0.58)% (0.89)%
After reimbursement and/or waiver of
expenses by Adviser 0.31% (0.39)% (0.39)% (0.47)% (0.77)%
Portfolio Turnover 66.65% 58.88% 58.28% 56.28% 102.56%
------------------------
(a)The selected per share data was calculated using the weighted average shares
outstanding method for the period.
(b)Ratios of expenses to average net assets include interest expenses of less
than 0.005% for the year ended October 31, 2007, which is not included in the
contractual expense limitation. The interest expense is from utilizing the line
of credit.
82
ASTON/RIVER ROAD SMALL CAP VALUE FUND
Year Year Year Period
Ended Ended Ended Ended
10/31/08 10/31/07 10/31/06 10/31/05(a)
-------- -------- -------- -----------
Net Asset Value, Beginning of Period $14.37 $13.46 $10.28 $10.00
------ ------ ------ ------
INCOME FROM INVESTMENT OPERATIONS:
Net investment loss 0.01(b) 0.05(b) 0.02 --(c)
Net realized and unrealized gain (loss) on
investments (4.54) 1.04 3.16 0.28
------ ------ ------ ------
Total from investment operations (4.53) 1.09 3.18 0.28
------ ------ ------ ------
LESS DISTRIBUTIONS:
Distributions from and in excess of net
investment income -- (0.05) -- --
Distribution from net realized gain on
investments (0.54) (0.13) -- --
------ ------ ------ ------
Total Distributions (0.54) (0.18) -- --
------ ------ ------ ------
Net increase (decrease) in net asset value (5.07) 0.91 3.18 0.28
------ ------ ------ ------
Net Asset Value, End of Period $9.30 $14.37 $13.46 $10.28
====== ====== ====== ======
TOTAL RETURN (32.51)% 8.12% 30.93% 2.80%(d)
RATIOS/SUPPLEMENTAL DATA:
Net Assets, End of Period (in 000's) $160,245 $237,695 $167,438 $6,299
Ratios of expenses to average net assets:
Before reimbursement and/or waiver of
expenses by Adviser 1.45%(e) 1.44%(e) 1.78% 2.86%(f)
After reimbursement and/or waiver of
expenses by Adviser 1.45%(e) 1.44%(e) 1.43% 1.50%(f)
Ratios of net investment (income) loss to
average net assets:
Before reimbursement and/or waiver of
expenses by Adviser 0.08% 0.38% 0.25% (1.41)%(f)
After reimbursement and/or waiver of
expenses by Adviser 0.08% 0.38% 0.60% (0.05)%(f)
Portfolio Turnover 57.32% 74.18% 51.63% 20.82%(d)(g)
------------------------
(a)Aston/River Road Small Cap Value Fund-Class N commenced investment operations
on June 28, 2005.
(b)The selected per share data was calculated using the weighted average shares
outstanding method for the period.
(c)Represents less than $(0.005) per share.
(d)Not Annualized.
(e)Ratios of expenses to average net assets include interest expenses of less
than 0.005% for the year ended October 31, 2008 and the year ended October 31,
2007, which is not included in the contractual expense limitation. The interest
expense is from utilizing the line of credit.
(f)Annualized
(g)Portfolio turnover rate excludes securities from processing a subscription-
in-kind.
83
ASTON/NEPTUNE INTERNATIONAL FUND
Period
Ended
10/31/08(a)
-----------
Net Asset Value, Beginning of Period $11.14
------
INCOME FROM INVESTMENT OPERATIONS:
Net investment income 0.02(b)
Net realized and unrealized loss on investments (5.31)
------
Total from investment operations (5.29)
------
LESS DISTRIBUTIONS:
Distributions from and in excess of net investment income --
------
Total distributions --
------
Net decrease in net asset value (5.29)
------
Net Asset Value, End of Period $5.85
======
TOTAL RETURN (47.49)%(c)
RATIOS/SUPPLEMENTAL DATA:
Net Assets, End of Period (in 000's) $225
Ratios of expenses to average net assets:
Before reimbursement and/or waiver of expenses by Adviser 3.15%(d)
After reimbursement and/or waiver of expenses by Adviser 1.27%(d)
Ratios of net investment income (loss) to average net assets:
Before reimbursement and/or waiver of expenses by Adviser (1.24)%(d)
After reimbursement and/or waiver of expenses by Adviser 0.64%(d)
Portfolio Turnover 7.39%(c)
------------------------
(a)Aston/Neptune International Fund-Class N commenced investment operations on
June 18, 2008.
(b)The selected per share data was calculated using the weighted average shares
outstanding method for the period.
(c)Not Annualized.
(d)Annualized.
84
ASTON/FORTIS GLOBAL REAL ESTATE FUND
Year Period
Ended Ended
10/31/08 10/31/07(a)
-------- -----------
Net Asset Value, Beginning of Period $11.08 $10.00
------ ------
INCOME FROM INVESTMENT OPERATIONS:
Net investment income 0.14 0.05
Net realized and unrealized loss on investments (5.75) 1.03
------ ------
Total from investment operations (5.61) 1.08
------ ------
LESS DISTRIBUTIONS:
Distributions from and in excess of net investment income (0.15) --
Distributions from net realized gain on investments (0.05) --
------ ------
Total distributions (0.20) --
------ ------
Net increase (decrease) in net asset value (5.81) 1.08
------ ------
Net Asset Value, End of Period $5.27 $11.08
====== ======
TOTAL RETURN (51.45)% 10.80%(b)
RATIOS/SUPPLEMENTAL DATA:
Net Assets, End of Period (in 000's) $11,187 $21,635
Ratios of expenses to average net assets:
Before reimbursement and/or waiver of expenses by Adviser 2.26% 2.35%(c)
After reimbursement and/or waiver of expenses by Adviser 1.50% 1.50%(c)
Ratios of net investment income to average net assets:
Before reimbursement and/or waiver of expenses by Adviser 0.87% 1.30%(c)
After reimbursement and/or waiver of expenses by Adviser 1.63% 2.15%(c)
Portfolio Turnover 88.36% 22.83%(b)
------------------------
(a)Aston/Fortis Global Real Estate Fund-Class N commenced investment operations
on August 3, 2007.
(b)Not Annualized.
(c)Annualized.
85
ASTON/SMART PORTFOLIOS FUND
Period
Ended
10/31/08(a)
-----------
Net Asset Value, Beginning of Period $10.00
------
INCOME FROM INVESTMENT OPERATIONS:
Net investment income 0.07
Net realized and unrealized loss on investments (1.76)
------
Total from investment operations (1.69)
------
LESS DISTRIBUTIONS:
Net investment income (0.07)
------
Total distributions (0.07)
------
Net decrease in net asset value (1.76)
------
Net Asset Value, End of Period $8.24
======
TOTAL RETURN (16.98)%(b)
RATIOS/SUPPLEMENTAL DATA:
Net Assets, End of Period (in 000's) $6,070
Ratios of expenses to average net assets:
Before reimbursement and/or waiver of expenses by Adviser 5.11%(d)(e)
After reimbursement and/or waiver of expenses by Adviser 1.31%(d)(e)
Ratios of net investment income (loss) to average net assets:
Before reimbursement and/or waiver of expenses by Adviser (2.48)%(d)(e)
After reimbursement and/or waiver of expenses by Adviser 1.32%(d)(e)
Portfolio Turnover 498.68%(b)
------------------------
(a)Aston/Smart Portfolios Fund-Class N commenced investment operations on
January 10, 2008.
(b)Not Annualized.
(c)Does not include expenses of the underlying funds in which the Fund invests.
(d)Ratios of expenses to average net assets include interest expense of 0.01%
for the period ended October 31, 2008, which is not included in the contractual
expense limitation. The interest expense is from utilizing the line of credit.
(e)Annualized.
86
ASTON/NEW CENTURY ABSOLUTE RETURN ETF FUND
Period
Ended
10/31/08(a)
-----------
Net Asset Value, Beginning of Period $10.00
------
INCOME FROM INVESTMENT OPERATIONS:
Net investment income 0.01
Net realized and unrealized loss on investments (1.37)
------
Total from investment operations (1.36)
------
Net decrease in net asset value (1.36)
------
Net Asset Value, End of Period $8.64
======
TOTAL RETURN (13.60)%(b)
RATIOS/SUPPLEMENTAL DATA:
Net Assets, End of Period (in 000's) $13,748
Ratios of expenses to average net assets:
Before reimbursement and/or waiver of expenses by Adviser 3.77%(d)
After reimbursement and/or waiver of expenses by Adviser 1.50%(d)
Ratios of net investment income (loss) to average net assets:
Before reimbursement and/or waiver of expenses by Adviser (2.02)%(d)
After reimbursement and/or waiver of expenses by Adviser 0.25%(d)
Portfolio Turnover 172.11%(b)
------------------------
(a)Aston/New Century Absolute Return ETF Fund-Class N commenced investment
operations on March 4, 2008.
(b)Not Annualized.
(c)Does not include expenses of the underlying funds in which the Fund invests.
(d)Annualized.
87
ASTON/MB ENHANCED EQUITY INCOME FUND
Period
Ended
10/31/08(a)
-----------
Net Asset Value, Beginning of Period $10.00
------
INCOME FROM INVESTMENT OPERATIONS:
Net investment income 0.14
Net realized and unrealized loss on investments (1.91)
------
Total from investment operations (1.77)
------
LESS DISTRIBUTIONS:
Distributions from and in excess of net investment income (0.14)
------
Total distributions (0.14)
------
Net decrease in net asset value (1.91)
------
Net Asset Value, End of Period $8.09
======
TOTAL RETURN (17.91)%(b)
RATIOS/SUPPLEMENTAL DATA:
Net Assets, End of Period (in 000's) $14,389
Ratios of expenses to average net assets:
Before reimbursement and/or waiver of expenses by Adviser 2.38%(c)
After reimbursement and/or waiver of expenses by Adviser 1.10%(c)
Ratios of net investment income to average net assets:
Before reimbursement and/or waiver of expenses by Adviser 0.86%(c)
After reimbursement and/or waiver of expenses by Adviser 2.14%(c)
Portfolio Turnover 23.68%(b)
------------------------
(a)Aston/MB Enhanced Equity Income Fund-Class N commenced investment operations
on January 15, 2008.
(b)Not Annualized.
(c)Annualized.
88
ASTON/FORTIS REAL ESTATE FUND
Year Year Year Year Year
Ended Ended Ended Ended Ended
10/31/08 10/31/07 10/31/06 10/31/05 10/31/04
-------- -------- -------- -------- --------
Net Asset Value, Beginning of Period $15.59 $19.99 $16.23 $14.56 $11.52
------ ------ ------ ------ ------
INCOME FROM INVESTMENT OPERATIONS:
Net investment income 0.07(a) 0.30(a) 0.32(a) 0.46(a) 0.44
Net realized and unrealized gain (loss) on
investments (5.50) (0.40) 5.42 2.10 3.02
------ ------ ------ ------ ------
Total from investment operations (5.43) (0.10) 5.74 2.56 3.46
------ ------ ------ ------ ------
LESS DISTRIBUTIONS:
Distributions from and in excess of net
investment income (0.09) (0.05) (0.13) (0.26) (0.30)
Distributions from net realized gain on
investments (3.99) (4.25) (1.85) (0.63) (0.12)
------ ------ ------ ------ ------
Total distributions (4.08) (4.30) (1.98) (0.89) (0.42)
------ ------ ------ ------ ------
Net increase (decrease) in net asset value (9.51) (4.40) 3.76 1.67 3.04
------ ------ ------ ------ ------
Net Asset Value, End of Period $6.08 $15.59 $19.99 $16.23 $14.56
====== ====== ====== ====== ======
TOTAL RETURN (43.76)% (1.41)% 39.19% 18.06% 30.73%
RATIOS/SUPPLEMENTAL DATA:
Net Assets, End of Period (in 000's) $6,030 $49,123 $72,506 $54,851 $72,451
Ratios of expenses to average net assets:
Before reimbursement and/or waiver of
expenses by Adviser 1.57%(b) 1.46%(b) 1.46%(b) 1.45% 1.46%
After reimbursement and/or waiver of
expenses by Adviser 1.37%(b) 1.37%(b) 1.37%(b) 1.37% 1.37%
Ratios of net investment income to average net
assets:
Before reimbursement and/or waiver of
expenses by Adviser 0.49% 1.73% 1.77% 2.91% 3.50%
After reimbursement and/or waiver of
expenses by Adviser 0.69% 1.82% 1.86% 2.99% 3.59%
Portfolio Turnover 85.08% 88.75% 83.15% 43.14% 24.28%
------------------------
(a)The selected per share data was calculated using the weighted average shares
outstanding method for the period.
(b)Ratios of expenses to average net assets include interest expense of less
than 0.005% for the years ended October 31, 2008, October 31, 2007 and October
31, 2006, which is not included in the contractual expense limitation. The
interest expense is from utilizing the line of credit.
89
ASTON/MONTAG & CALDWELL BALANCED FUND
Year Year Year Year Year
Ended Ended Ended Ended Ended
10/31/08 10/31/07 10/31/06 10/31/05 10/31/04
-------- -------- -------- -------- --------
Net Asset Value, Beginning of Period $19.98 $17.21 $16.41 $15.81 $15.57
------ ------ ------ ------ ------
INCOME FROM INVESTMENT OPERATIONS:
Net investment income(a) 0.29 0.19(a) 0.18(a) 0.17(a) 0.19(a)
Net realized and unrealized gain (loss) on
investments(a) (4.42) 2.82 0.87 0.67 0.30
------ ------ ------ ------ ------
Total from investment operations (4.13) 3.01 1.05 0.84 0.49
------ ------ ------ ------ ------
LESS DISTRIBUTIONS:
Distributions from and in excess of net
investment income (0.24) (0.24) (0.25) (0.24) (0.25)
------ ------ ------ ------ ------
Total distributions (0.24) (0.24) (0.25) (0.24) (0.25)
------ ------ ------ ------ ------
Net increase (decrease) in net asset value (4.37) 2.77 0.80 0.60 0.24
------ ------ ------ ------ ------
Net Asset Value, End of Period $15.61 $19.98 $17.21 $16.41 $15.81
====== ====== ====== ====== ======
TOTAL RETURN (20.87)% 17.63% 6.56% 5.27% 3.15%
RATIOS/SUPPLEMENTAL DATA:
Net Assets, End of Period (in 000's) $16,586 $16,703 $23,355 $48,759 $93,935
Ratios of expenses to average net assets:
Before reimbursement and/or waiver of
expenses by Adviser 1.74% 1.72%(b) 1.33%(b) 1.16% 1.13%
After reimbursement and/or waiver of
expenses by Adviser 1.35% 1.36%(b) 1.33%(b) 1.16% 1.13%
Ratios of net investment income to average net
assets:
Before reimbursement and/or waiver of
expenses by Adviser(a) 0.74% 0.71% 1.07% 1.04% 1.18%
After reimbursement and/or waiver of
expenses by Adviser(a) 1.13% 1.07% 1.07% 1.04% 1.18%
Portfolio Turnover 43.65% 36.25% 33.70% 33.43% 35.90%
------------------------
(a)The selected per share data was calculated using the weighted average shares
outstanding method for the period.
(b)Ratios of expenses to average net assets include interest expense of less
than 0.01% for the year ended October 31, 2007 and less than 0.005% for the year
ended October 31, 2006, which is not included in the voluntary expense
limitation. The interest expense is from utilizing the line of credit.
90
ASTON BALANCED FUND
Year Year Year Year Year
Ended Ended Ended Ended Ended
10/31/08 10/31/07 10/31/06 10/31/05 10/31/04
-------- -------- -------- -------- --------
Net Asset Value, Beginning of Period $7.97 $10.65 $10.84 $11.32 $11.07
------ ------ ------ ------ ------
INCOME FROM INVESTMENT OPERATIONS:
Net investment income 0.08 0.12 0.12 0.16 0.14
Net realized and unrealized gain (loss) on
investments (1.73) 0.69 0.45 0.20 0.27
------ ------ ------ ------ ------
Total from investment operations (1.65) 0.81 0.57 0.36 0.41
------ ------ ------ ------ ------
LESS DISTRIBUTIONS:
Distributions from and in excess of net
investment income (0.09) (0.14) (0.17) (0.19) (0.16)
Distributions from net realized gain on
investments (1.40) (3.35) (0.59) (0.65) --
------ ------ ------ ------ ------
Total distributions (1.49) (3.49) (0.76) (0.84) (0.16)
------ ------ ------ ------ ------
Net increase (decrease) in net asset value (3.14) (2.68) (0.19) (0.48) 0.25
------ ------ ------ ------ ------
Net Asset Value, End of Period $4.83 $7.97 $10.65 $10.84 $11.32
====== ====== ====== ====== ======
TOTAL RETURN (24.76)% 10.47% 5.33% 3.20% 3.73%
RATIOS/SUPPLEMENTAL DATA:
Net Assets, End of Period (in 000's) $17,673 $35,924 $60,831 $173,051 $230,244
Ratios of expenses to average net assets:
Before reimbursement and/or waiver of
expenses by Adviser 1.50%(a) 1.31%(a) 1.14%(a) 1.09% 1.07%
After reimbursement and/or waiver of
expenses by Adviser 1.50%(a) 1.31%(a) 1.14%(a) 1.09% 1.07%
Ratios of net investment income to average net
assets:
Before reimbursement and/or waiver of
expenses by Adviser 1.33% 1.48% 1.38% 1.53% 1.20%
After reimbursement and/or waiver of
expenses by Adviser 1.33% 1.48% 1.38% 1.53% 1.20%
Portfolio Turnover 106.18% 60.93% 36.66% 28.76% 28.32%
------------------------
(a)Ratios of expenses to average net assets include interest expense of 0.01%
for the year ended October 31, 2008, less than 0.01% for the year ended October
31, 2007 and less than 0.005% for the year ended October 31, 2006. The interest
expense is from utilizing the line of credit.
91
ASTON/TCH FIXED INCOME FUND
Year Year Year Year Year
Ended Ended Ended Ended Ended
10/31/08 10/31/07 10/31/06 10/31/05 10/31/04
-------- -------- -------- -------- --------
Net Asset Value, Beginning of Period $9.73 $9.62 $9.69 $10.13 $10.07
----- ----- ----- ------ ------
INCOME FROM INVESTMENT OPERATIONS:
Net investment income 0.47 0.48(a) 0.45(a) 0.42(a) 0.43
Net realized and unrealized gain (loss) on
investments (1.10) 0.14 (0.04) (0.38) 0.13
----- ----- ----- ------ ------
Total from investment operations (0.63) 0.62 0.41 0.04 0.56
----- ----- ----- ------ ------
LESS DISTRIBUTIONS:
Distributions from and in excess of net
investment income (0.50) (0.51) (0.48) (0.48) (0.50)
----- ----- ----- ------ ------
Total distributions (0.50) (0.51) (0.48) (0.48) (0.50)
----- ----- ----- ------ ------
Net increase (decrease) in net asset value (1.13) 0.11 (0.07) (0.44) 0.06
----- ----- ----- ------ ------
Net Asset Value, End of Period $8.60 $9.73 $9.62 $9.69 $10.13
===== ===== ===== ====== ======
TOTAL RETURN (6.89)% 6.56% 4.42% 0.40% 5.66%
RATIOS/SUPPLEMENTAL DATA:
Net Assets, End of Period (in 000's) $42,765 $52,662 $77,096 $138,807 $154,079
Ratios of expenses to average net assets:
Before reimbursement and/or waiver of
expenses by Adviser 1.06% 1.04%(b) 0.96%(b) 0.95% 0.92%
After reimbursement and/or waiver of
expenses by Adviser 0.65% 0.73%(b)(c) 0.75%(b) 0.74% 0.74%
Ratios of net investment income to average net
assets:
Before reimbursement and/or waiver of
expenses by Adviser 4.59% 4.63% 4.45% 3.98% 4.08%
After reimbursement and/or waiver of
expenses by Adviser 5.00% 4.94% 4.66% 4.19% 4.26%
Portfolio Turnover 78.39% 71.61% 71.19% 41.33% 46.80%
------------------------
(a)The selected per share data was calculated using the weighted average shares
outstanding method for the period.
(b)Ratios of expenses to average net assets include interest expense of less
than 0.005% for the years ended October 31, 2007 and October 31, 2006, which is
not included in the contractual or voluntary expense limitation. The interest
expense is from utilizing the line of credit.
(c)The Adviser's expense reimbursement level, which effects the net expense
ratio was changed from 0.74% to 0.64% on September 1, 2007. Subsequently, on
October 1, 2008, the Adviser's expense reimbursement level changed from 0.64% to
0.74%.
92
ASTON/FORTIS INVESTOR MONEY MARKET FUND
Year Year Year Year Year
Ended Ended Ended Ended Ended
10/31/08 10/31/07 10/31/06 10/31/05 10/31/04
-------- -------- -------- -------- --------
Net Asset Value, Beginning of Period $1.00 $1.00 $1.00 $1.00 $1.00
----- ----- ----- ----- -----
INCOME FROM INVESTMENT OPERATIONS:
Net investment income 0.02 0.05 0.04 0.02 0.01
----- ----- ----- ----- -----
LESS DISTRIBUTIONS FROM:
Net investment income (0.02) (0.05) (0.04) (0.02) (0.01)
Net realized gain on investments -- -- --(a) -- --
----- ----- ----- ----- -----
Net Asset Value, End of Year $1.00 $1.00 $1.00 $1.00 $1.00
===== ===== ===== ===== =====
TOTAL RETURN 2.28% 4.67% 4.30% 2.36% 0.71%
RATIOS/SUPPLEMENTAL DATA:
Net Assets, End of Period (in 000's) $35,508 $36,959 $84,778 $117,039 $219,891
Ratios of expenses to average net assets:
Before reimbursement and/or waiver of
expenses by Adviser 0.84% 0.68% 0.61% 0.55% 0.53%
After reimbursement and/or waiver of
expenses by Adviser 0.84% 0.68% 0.61% 0.55% 0.53%
Ratios of net investment income to average net
assets:
Before reimbursement and/or waiver of
expenses by Adviser 2.25% 4.62% 4.18% 2.19% 0.71%
After reimbursement and/or waiver of
expenses by Adviser 2.25% 4.62% 4.18% 2.19% 0.71%
------------------------
(a)Represents less than $0.005 per share.
93
General Information
If you wish to know more about Aston Funds, you will find additional information
in the following documents:
SHAREHOLDER REPORTS
You will receive an unaudited semi-annual report dated April 30 and an annual
report dated October 31 which is audited by an independent registered public
accounting firm. The annual report contains a discussion of the market
conditions and investment strategies that significantly affected each Fund's
performance during its last fiscal year.
STATEMENT OF ADDITIONAL INFORMATION (SAI)
The SAI, which is incorporated into this prospectus by reference and dated March
1, 2009, as amended from time to time, is available to you without charge and
can be mailed to you upon request. It contains more detailed information about
the Funds.
HOW TO OBTAIN REPORTS
-------------------------------------------------------------------------------
CONTACTING ASTON FUNDS
You can get free copies of the reports and SAI, request other information and
get answers to your questions about the Funds by contacting:
Address: Aston Funds
P.O. Box 9765
Providence, RI 02940
Phone: Shareholder Services & 800 992-8151
Fund Literature
Investment Advisor Services 800 597-9704
Web site: www.astonfunds.com
OBTAINING INFORMATION FROM THE SEC
You can visit the EDGAR Database on the SEC's Web site at http://www.sec.gov to
view the SAI and other information. You can also view and copy information about
the Funds at the SEC's Public Reference Room in Washington, D.C. To find out
more about the Public Reference Room, you can call the SEC at 202 551-8090.
Also, you can obtain copies of this information after paying a duplicating fee,
by electronic request at the following E-mail address: publicinfo@sec.gov, or by
writing the SEC's Public Reference Section, Washington D.C. 20549-0102.
Investment Company Act File Number: 811-8004
94
[LOGO]
Aston Funds
P.O. Box 9765
Providence, RI 02940
(ASTON FUNDS LOGO)
Aston Funds
Class I Shares
Prospectus
March 1, 2009 - Institutional Funds
(GRAPHIC)
NOT FDIC INSURED. NO BANK GUARANTEE. MAY LOSE VALUE.
The Securities and Exchange Commission has not approved or disapproved these or
any mutual fund's shares or determined if this prospectus is accurate or
complete. Any representation to the contrary is a crime.
(ASTON FUNDS LOGO)
EQUITY FUNDS TICKER SYMBOL
Large Cap
Montag & Caldwell Growth Fund MCGIX
Aston/Veredus Select Growth Fund AVISX
Aston Growth Fund CTGIX
Aston Value Fund AAVIX
Multi Cap
Aston/River Road Dividend All Cap Value Fund ARIDX
Mid Cap
Aston/Optimum Mid Cap Fund ABMIX
Small-Mid Cap
Aston/River Road Small-Mid Cap Fund ARIMX
Small Cap
Aston/Veredus Aggressive Growth Fund AVEIX
Aston/TAMRO Small Cap Fund ATSIX
Aston/River Road Small Cap Value Fund ARSIX
INTERNATIONAL FUNDS
Aston/Neptune International Fund ANIIX
Aston/Barings International Fund ABIIX
SECTOR FUND
Aston/Fortis Real Estate Fund AARIX
BALANCED FUND
Montag & Caldwell Balanced Fund MOBIX
FIXED INCOME FUND
Aston/TCH Fixed Income Fund CTBIX
(ASTON FUNDS LOGO)
Thank you for your interest in Aston Funds. This prospectus pertains only
to Class I shares of the funds listed here in the Table of Contents.
Please read this prospectus carefully and keep it for future reference.
For a list of terms with definitions that you may find helpful as you read
this prospectus, please refer to the "Investment Terms" Section.
Mutual fund shares are not bank deposits and are not guaranteed, endorsed
or insured by any financial institution, government entity or the Federal
Deposit Insurance Corporation (FDIC).
TABLE OF CONTENTS
--------------------------------------------------------------------------------
Page
CATEGORIES OF ASTON FUNDS 3
FUND SUMMARIES
Investment Summaries 4
EQUITY FUNDS 4
Large Cap
Montag & Caldwell Growth Fund 4
Aston/Veredus Select Growth Fund 4
Aston Growth Fund 4
Aston Value Fund 5
Multi Cap
Aston/River Road Dividend All Cap Value Fund 5
Mid Cap
Aston/Optimum Mid Cap Fund 6
Small-Mid Cap
Aston/River Road Small-Mid Cap Fund 6
Small Cap
Aston/Veredus Aggressive Growth Fund 6
Aston/TAMRO Small Cap Fund 7
Aston/River Road Small Cap Value Fund 7
INTERNATIONAL FUNDS
Aston/Neptune International Fund 8
Aston/Barings International Fund 8
SECTOR FUND
Aston/Fortis Real Estate Fund 9
BALANCED FUND
Montag & Caldwell Balanced Fund 9
FIXED INCOME FUND
Aston/TCH Fixed Income Fund 10
Principal Investment Risks 11
Fund Performance 15
Fund Expenses 23
Additional Information Regarding Investment
Strategies 25
PORTFOLIO HOLDINGS 29
INVESTMENT TERMS 30
MANAGEMENT OF THE FUNDS
The Investment Adviser 33
The Subadvisers 33
The Portfolio Managers 35
Management Fees 40
SHAREHOLDER INFORMATION
Opening an Account 42
Buying Shares 43
Exchanging Shares 44
Selling/Redeeming Shares 45
Transaction Policies 48
Account Policies and Dividends 50
Additional Investor Services 51
Compensation to Intermediaries 51
Portfolio Transactions and Brokerage
Commissions 51
DIVIDENDS, DISTRIBUTIONS AND TAXES 52
FINANCIAL HIGHLIGHTS 53
GENERAL INFORMATION 68
(This page intentionally left blank)
Categories of Aston Funds
--------------------------------------------------------------------------------
Aston Funds (the "Trust") is an open-end management investment company that
currently offers 29 separate investment portfolios, including equity, balanced,
international, sector, fixed income and money market funds. Class I shares of 15
of the portfolios (the "Funds") are offered in this prospectus; other funds and
classes are offered under separate prospectuses.
Aston Asset Management LLC ("Aston" or "Adviser") is the investment adviser,
administrator and sponsor of the Funds. Aston manages each Fund by retaining one
or more subadvisers ("Subadvisers") to manage each Fund.
EQUITY FUNDS
--------------------------------------------------------------------------------
EQUITY FUNDS invest principally in stocks and other equity securities. Equity
funds may have greater total return potential than non-equity funds, but they
also have greater risk.
INTERNATIONAL FUNDS
--------------------------------------------------------------------------------
INTERNATIONAL FUNDS invest principally in stocks and other securities issued by
foreign companies throughout the world. International funds invest in foreign
securities that are subject to currency, regulatory, information and political
risks.
SECTOR FUNDS
--------------------------------------------------------------------------------
SECTOR FUNDS invest primarily in stocks and other securities of issuers that
operate in a particular industry or sector of the economy. Because the holdings
of this type of fund focus on one or more related industries or sectors, the
share price of a sector fund may be more volatile than a fund with more
diversified holdings.
BALANCED FUNDS
--------------------------------------------------------------------------------
BALANCED FUNDS invest in a mix of stocks and fixed income securities and combine
the benefits of both types of securities -- capital appreciation or growth from
stocks and income from fixed income securities. Like most other mutual funds,
the share price of a balanced fund moves up and down in response to charges in
the stock market and interest rates.
FIXED INCOME FUNDS
--------------------------------------------------------------------------------
FIXED INCOME FUNDS invest in corporate and government bonds and other fixed
income securities. These funds provide regular income.
No single fund is intended to be a complete investment program, but
individual funds can be an important part of a balanced and diversified
investment program. Mutual funds have the following general risks:
- the value of fund shares will fluctuate
- you could lose money
- you cannot be certain that a fund will achieve its investment objective
3
Investment Summaries
--------------------------------------------------------------------------------
EQUITY FUNDS
LARGE CAP
MONTAG & CALDWELL GROWTH FUND
INVESTMENT OBJECTIVE
--------------------------------------------------------------------------------
The Fund seeks long-term capital appreciation and, secondarily, current income,
by investing primarily in common stocks and convertible securities.
PRINCIPAL INVESTMENT STRATEGIES
--------------------------------------------------------------------------------
The Fund invests primarily in common stocks and convertible securities. The
portfolio manager uses a bottom-up approach to stock selection and seeks high
quality, well-established large-cap companies that the portfolio manager
believes are growing their near-term earnings at an above average rate. The
portfolio manager emphasizes valuation to find companies selling at a discount
to their intrinsic value. These companies must pass an initial capitalization
screen and:
- have a strong history of earnings growth
- are attractively priced, relative to the company's potential for above
average long-term earnings and revenue growth
- have strong balance sheets
- have a sustainable competitive advantage
- are currently, or have the potential to become, industry leaders
- have the potential to outperform during market downturns
The Fund may invest in foreign securities (directly and through depositary
receipts).
To manage risk, the portfolio manager limits sector and individual security
exposure, and adheres to a strong sell discipline.
PRINCIPAL RISKS OF INVESTING IN THIS FUND
--------------------------------------------------------------------------------
You could lose money by investing in the Fund. There can be no assurance that
the Fund's investment objective will be achieved.
RISKS. These principal investment risks apply to the Fund:
foreign securities, growth style, liquidity, manager and market risks. See the
next Section, "Principal Investment Risks," for a more detailed discussion of
these risks and other principal risks common to all Funds.
ASTON/VEREDUS SELECT GROWTH FUND
INVESTMENT OBJECTIVE
--------------------------------------------------------------------------------
The Fund seeks to provide capital appreciation.
PRINCIPAL INVESTMENT STRATEGIES
--------------------------------------------------------------------------------
The Fund invests primarily in growth stocks of mid-cap and large-cap companies
whose earnings are growing, or are expected to grow, at an accelerating rate.
The Fund defines a mid-cap company as one having a market capitalization of
between approximately $2.5 and $9 billion at the time of acquisition. The
portfolio managers define a large-cap company as one having a market
capitalization of approximately $9 billion or more at the time of acquisition.
The portfolio managers look for inefficiencies in the market caused by
inaccurate expectations (e.g., positive earnings surprises, estimate revisions).
The focus is on companies that have:
- expanding unit volume growth
- expanding profit margin potential
- high or improving cash flow return on investment
- large markets with high barriers to entry
The Fund may invest in ETFs and foreign securities (directly and through
depositary receipts).
To help manage risk, the portfolio managers adhere to a strong sell discipline.
In the course of implementing its principal investment strategies, the Fund will
likely experience a high annual turnover rate (350% or more).
PRINCIPAL RISKS OF INVESTING IN THIS FUND
--------------------------------------------------------------------------------
You could lose money by investing in the Fund. There can be no assurance that
the Fund's investment objective will be achieved.
RISKS. These principal investment risks apply to the Fund:
foreign securities, growth style, liquidity, manager, market, mid-cap company
and portfolio turnover risks. See the next Section, "Principal Investment
Risks," for a more detailed discussion of these risks and other principal risks
common to all Funds.
ASTON GROWTH FUND
(Formerly Aston/ABN AMRO Growth Fund)
INVESTMENT OBJECTIVE
--------------------------------------------------------------------------------
The Fund seeks long-term total return through a combination of capital
appreciation and current income by investing primarily in a combination of
stocks and bonds.
PRINCIPAL INVESTMENT STRATEGIES
--------------------------------------------------------------------------------
The Fund invests primarily in common stocks and convertible securities. The
portfolio manager uses a bottom-up approach to stock selection and seeks high
quality, well-established large-cap companies that the portfolio manager
believes are growing their near-term earnings at an above average rate. The
portfolio
4
Investment Summaries (continued)
--------------------------------------------------------------------------------
manager emphasizes valuation to find companies selling at a discount to their
intrinsic value. These companies must pass an initial capitalization screen and:
- have a strong history of earnings growth
- are attractively priced, relative to the company's potential for above
average long-term earnings and revenue growth
- have strong balance sheets
- have a sustainable competitive advantage
- are currently, or have the potential to become, industry leaders
- have the potential to outperform during market downturns
The Fund may invest in foreign securities (directly and through depositary
receipts).
To manage risk, the portfolio manager limits sector and individual security
exposure, and adheres to a strong sell discipline.
PRINCIPAL RISKS OF INVESTING IN THIS FUND
--------------------------------------------------------------------------------
You could lose money by investing in this Fund. There can be no assurance that
the Fund's investment objective will be achieved.
RISKS. These principal investment risks apply to the Fund:
foreign securities, growth style, liquidity, manager and market risks. See the
next Section,"Principal Investment Risks," for a more detailed discussion of
these risks and other principal risks common to all Funds.
ASTON VALUE FUND
INVESTMENT OBJECTIVE
--------------------------------------------------------------------------------
The Fund seeks to provide total return through long-term capital appreciation
and current income.
PRINCIPAL INVESTMENT STRATEGIES
--------------------------------------------------------------------------------
The Fund normally invests primarily in equity securities of companies that its
portfolio managers believe are undervalued compared to their perceived worth
(value companies). Value companies tend to have stock prices that are low
relative to their earnings, dividends, assets, or other financial measures.
While the Fund may invest its assets in companies of any size, the portfolio
managers generally focus on companies with large capitalizations.
The portfolio managers use a bottom-up investment approach in buying and selling
investments for the Fund. Investments are selected primarily based on
fundamental analysis of issuers and their potential in light of their current
financial condition and industry position, and market, economic, political, and
regulatory conditions. Factors considered may include analysis of:
- Earnings
- Cash flow
- Competitive position
- Management ability
Quantitative analysis of these and other factors may also be considered.
The Fund may also invest in REITS, convertible securities, preferred stocks, and
foreign securities (directly and through depositary receipts).
To help manage risk the portfolio managers generally limit position sizes,
diversify among sectors, and adhere to a strong sell discipline.
PRINCIPAL RISKS OF INVESTING IN THIS FUND
--------------------------------------------------------------------------------
You could lose money by investing in the Fund. There can be no assurance that
the Fund's investment objective will be achieved.
RISKS. These principal investment risks apply to the Fund:
foreign securities, liquidity, manager, market, REIT and value style risks. See
the next Section, "Principal Investment Risks," for a more detailed discussion
of these risks and other principal risks common to all Funds.
MULTI CAP
ASTON/RIVER ROAD DIVIDEND ALL CAP VALUE FUND (Formerly Aston/River Road Dynamic
Equity Income Fund)
INVESTMENT OBJECTIVE
--------------------------------------------------------------------------------
The Fund seeks to provide high current income and, secondarily, long-term
capital appreciation.
PRINCIPAL INVESTMENT STRATEGIES
--------------------------------------------------------------------------------
Under normal conditions, the Fund invests at least 80% of its assets in equity
securities. The Fund invests in a diversified, all - cap portfolio of income-
producing equity securities with yields that the portfolio managers believe will
exceed the Russell 3000 Value Index. The Fund invests primarily in dividend
paying common and convertible preferred stocks and REITs. The Fund may also
invest in foreign securities (directly and through depositary receipts), closed-
end funds or other investment companies, publicly traded partnerships and
royalty income trusts. Using systematic and dynamic internal research through
multiple sources, the portfolio managers narrow the field of companies into a
more refined working universe. The portfolio managers then employ a value-
driven, bottom-up approach that seeks to identify the following characteristics:
- high, growing dividend yield
- financial strength
- priced at a discount to absolute value
- attractive business model
- shareholder-oriented management
- undiscovered, underfollowed, misunderstood companies
To manage risk, the portfolio managers employ a structured sell discipline and a
strategy of diversification across market sectors, capitalization size,
sovereignty and security type.
5
Investment Summaries (continued)
--------------------------------------------------------------------------------
PRINCIPAL RISKS OF INVESTING IN THIS FUND
--------------------------------------------------------------------------------
You could lose money by investing in the Fund. There can be no assurance that
the Fund's investment objective will be achieved.
RISKS. These principal investment risks apply to the Fund:
foreign securities, liquidity, manager, market, mid-cap company, REIT, small-cap
company and value style risks. See the next Section, "Principal Investment
Risks," for a more detailed discussion of these risks and other principal risks
common to all Funds.
MID CAP
ASTON/OPTIMUM MID CAP FUND
INVESTMENT OBJECTIVE
--------------------------------------------------------------------------------
The Fund seeks long-term total return through capital appreciation by investing
primarily in common and preferred stocks and convertible securities.
PRINCIPAL INVESTMENT STRATEGIES
--------------------------------------------------------------------------------
Under normal conditions, the Fund invests at least 80% of its assets in mid-cap
stocks of companies with an improving revenue and earnings growth outlook. The
Fund defines a mid-cap company as one having a market capitalization of between
$1 and $12 billion at the time of acquisition. The portfolio manager selects
approximately 40 stocks based on bottom-up fundamental analysis.
Important investment criteria include:
- market share growth
- attractive valuation
- low relative leverage
- focused business franchise
- experienced management
- strong or improving financials
The Fund may invest in foreign securities (directly and through depositary
receipts).
The portfolio manager takes a long-term approach with a focus on maximizing
after-tax returns.
To manage risk, the portfolio manager employs a valuation discipline to limit
downside risk, limits position sizes and sector exposure, and adheres to a
strong sell discipline.
PRINCIPAL RISKS OF INVESTING IN THIS FUND
--------------------------------------------------------------------------------
You could lose money by investing in the Fund. There can be no assurance that
the Fund's investment objective will be achieved.
RISKS. These principal investment risks apply to the Fund:
foreign securities, growth style, liquidity, manager, market, mid-cap company,
small-cap company and value style risks. See the next Section, "Principal
Investment Risks," for a more detailed discussion of these risks and other
principal risks common to all Funds.
SMALL-MID CAP
ASTON/RIVER ROAD SMALL-MID CAP FUND
INVESTMENT OBJECTIVE
--------------------------------------------------------------------------------
The Fund seeks to provide long-term capital appreciation.
PRINCIPAL INVESTMENT STRATEGIES
--------------------------------------------------------------------------------
Under normal conditions, the Fund invests at least 80% of its assets in common
stocks and other equity securities of small- and mid-cap companies with market
capitalizations of less than $6 billion at the time of acquisition that the
portfolio managers believe are undervalued. Value investing involves buying
stocks that are out of favor and/or undervalued in comparison to their peers or
their prospects for growth. The Fund may also invest in common stock of
companies with market capitalizations that exceed $6 billion, REITs, convertible
securities and foreign securities (directly and through depositary receipts).
Using systematic and dynamic internal research, the portfolio managers narrow
the field of small- and mid-cap companies into a more refined working universe.
The portfolio managers then employ a value-driven, bottom-up fundamental
approach that seeks to identify the following characteristics:
- financial strength
- priced at a discount to absolute value
- attractive business model
- shareholder-oriented management
- undiscovered, underfollowed or misunderstood companies
To manage risk, the portfolio managers employ a strategy of diversification, and
adhere to a structured sell discipline.
PRINCIPAL RISKS OF INVESTING IN THIS FUND
--------------------------------------------------------------------------------
You could lose money by investing in the Fund. There can be no assurance that
the Fund's investment objective will be achieved.
RISKS. These principal investment risks apply to the Fund:
foreign securities, liquidity, manager, market, mid-cap company, REIT, small-cap
company and value style risks. See the next Section, "Principal Investment
Risks," for a more detailed discussion of these risks and other principal risks
common to all Funds.
SMALL CAP
ASTON/VEREDUS AGGRESSIVE GROWTH FUND
INVESTMENT OBJECTIVE
--------------------------------------------------------------------------------
The Fund seeks to provide capital appreciation.
6
Investment Summaries (continued)
--------------------------------------------------------------------------------
PRINCIPAL INVESTMENT STRATEGIES
--------------------------------------------------------------------------------
The Fund invests primarily in growth stocks of small-cap companies whose
earnings are growing, or are expected to grow, at an accelerating rate. The Fund
defines a small-cap company as one having a market capitalization of less than
$2.5 billion at the time of acquisition. The Fund looks for inefficiencies in
the market caused by inaccurate expectations (e.g., positive earnings surprises,
estimate revisions). The focus is on companies that have:
- expanding unit volume growth
- expanding profit margin potential
- high or improving cash flow return on investment
- large markets with high barriers to entry
The Fund may also invest in equity securities of mid-cap companies. The
portfolio managers define a mid-cap company as one having a market
capitalization of between approximately $2.5 to $9 billion at the time of
acquisition.
The Fund may also invest in ETFs and foreign securities (directly and through
depositary receipts).
To help manage risk, the portfolio managers adhere to a strong sell discipline.
In the course of implementing its principal investment strategies, the Fund will
likely experience a high annual turnover rate (200% or more).
The Fund has entered into a program with ReFlow Fund LLC ("ReFlow") to provide
cash liquidity for redemptions under certain circumstances. The program is
described in the Funds' statement of additional information ("SAI").
PRINCIPAL RISKS OF INVESTING IN THIS FUND
--------------------------------------------------------------------------------
You could lose money by investing in the Fund. There can be no assurance that
the Fund's investment objective will be achieved.
RISKS. These principal investment risks apply to the Fund:
foreign securities, growth style, liquidity, manager, market, mid-cap company,
portfolio turnover and small-cap company risks. See the next Section, "Principal
Investment Risks," for a more detailed discussion of these risks and other
principal risks common to all Funds.
ASTON/TAMRO SMALL CAP FUND
INVESTMENT OBJECTIVE
--------------------------------------------------------------------------------
The Fund seeks to provide long-term capital appreciation.
PRINCIPAL INVESTMENT STRATEGIES
--------------------------------------------------------------------------------
Under normal market conditions, the Fund invests at least 80% of its assets in a
blended portfolio of growth and value stocks of small-cap companies. The Fund
considers companies with market capitalizations of up to $2.75 billion, at the
time of acquisition to be small-cap companies. The portfolio manager seeks
opportunities across the growth/value spectrum, resulting in what is generally
considered a "core" portfolio.
The portfolio manager's investment process focuses on bottom-up stock selection
with the goal of identifying companies that possess a sustainable competitive
advantage combined with an attractive valuation. A sustainable competitive
advantage may be derived from a unique product or service offering, a capable
and proven management team, and sound financials.
Through the use of both qualitative and quantitative evaluation, the portfolio
manager seeks securities that meet the specific criteria of one of three
investment categories:
- Leaders (best of class)
- Laggards (companies undergoing a restructuring)
- Innovators (dedication to introducing new products or services)
The Fund may also invest in REITs, foreign securities (directly and through
depositary receipts), convertible bonds, securities outside the small-cap range
and cash-equivalent securities.
To manage risk, the portfolio manager limits position sizes, diversifies across
market sectors and adheres to a strong sell discipline.
PRINCIPAL RISKS OF INVESTING IN THIS FUND
--------------------------------------------------------------------------------
You could lose money by investing in the Fund. There can be no assurance that
the Fund's investment objective will be achieved.
RISKS. These principal investment risks apply to the Fund: below investment
grade (high yield) securities, credit, foreign securities, growth style,
liquidity, manager, market, REIT, small-cap company and value style risks. See
the next Section, "Principal Investment Risks," for a more detailed discussion
of these risks and other principal risks common to all Funds.
ASTON/RIVER ROAD SMALL CAP VALUE FUND
INVESTMENT OBJECTIVE
--------------------------------------------------------------------------------
The Fund seeks to provide long-term capital appreciation.
PRINCIPAL INVESTMENT STRATEGIES
--------------------------------------------------------------------------------
Under normal conditions, the Fund invests at least 80% of its assets in common
stocks and other equity securities of small-cap companies that the portfolio
managers believe are undervalued. Value investing involves buying stocks that
are out of favor and/or undervalued in comparison to their peers or their
prospects for growth. The portfolio managers consider companies with market
capitalizations below $3 billion at the time of acquisition to be small-cap. The
Fund may also invest in mid-cap stocks, REITs, convertible securities and
foreign securities (directly and through depositary receipts). Using systematic
and dynamic internal research, the portfolio managers narrow the field of
small-and
7
Investment Summaries (continued)
--------------------------------------------------------------------------------
mid-cap companies into a more refined working universe. The portfolio managers
employ a value-driven, bottom-up fundamental approach that seeks to identify the
following characteristics:
- priced at a discount to absolute value
- attractive business model
- shareholder-oriented management
- financial strength
- undiscovered, underfollowed or misunderstood companies
To manage risk, the portfolio managers employ a strategy of diversification, and
adhere to a structured sell discipline.
PRINCIPAL RISKS OF INVESTING IN THIS FUND
--------------------------------------------------------------------------------
You could lose money by investing in the Fund. There can be no assurance that
the Fund's investment objective will be achieved.
RISKS. These principal investment risks apply to the Fund:
foreign securities, liquidity, manager, market, mid-cap company, REIT, small-cap
company and value style risks. See the next Section, "Principal Investment
Risks," for a more detailed discussion of these risks and other principal risks
common to all Funds.
INTERNATIONAL FUNDS
ASTON/NEPTUNE INTERNATIONAL FUND
INVESTMENT OBJECTIVE
--------------------------------------------------------------------------------
The Fund seeks to provide long-term capital appreciation.
PRINCIPAL INVESTMENT STRATEGIES
--------------------------------------------------------------------------------
Under normal circumstances, the Fund invests at least 80% of its assets in
securities of non-U.S. companies located throughout the world, including
emerging markets. The Fund emphasizes securities of issuers in EAFE countries,
but may invest in securities of issuers in any country, including the Russian
Federation.
The portfolio manager employs a disciplined team-based investment process that
combines a top-down industry sector analysis and bottom-up stock selection. The
Fund invests primarily in common stocks, but may invest to a lesser degree in
convertible securities, preferred stocks and other equity securities.
The investment process is based on a global sector view. The portfolio manager
uses top-down analysis to evaluate key global sectors with an emphasis on
macroeconomics and growth prospects for different industries. Allocation among
countries or geographic areas is a residual of the investment process. Under
normal circumstances, the Fund will invest in at least five countries outside of
the U.S.
Within the targeted sectors, individual stocks are selected based on bottom-up
fundamental analysis. The portfolio manager emphasizes stocks with above-average
sustainable growth rates (i.e., growth stocks). The portfolio manager seeks to
identify companies with one or more of the following characteristics:
- strong competitive position
- market leader in industry with strong growth prospects
- potential for future growth
The market capitalization of companies held by the Fund will be a residual of
the investment process. Although the Fund may invest in companies across all
market capitalizations, the investment process is biased towards mid- to large-
cap stocks.
PRINCIPAL RISKS OF INVESTING IN THIS FUND
--------------------------------------------------------------------------------
You could lose money by investing in the Fund. There can be no assurance that
the Fund's investment objective will be achieved.
RISKS. These principal investment risks apply to the Fund:
emerging market, foreign securities, growth style, liquidity, manager, market
and mid-cap company risks. See the next Section, "Principal Investment Risks,"
for a more detailed discussion of these risks and other principal risks common
to all Funds.
ASTON/BARINGS INTERNATIONAL FUND
INVESTMENT OBJECTIVE
--------------------------------------------------------------------------------
The Fund seeks to provide total return.
PRINCIPAL INVESTMENT STRATEGIES
--------------------------------------------------------------------------------
Under normal conditions, the Fund invests at least 80% of its assets in common
stock and other equity securities of non-U.S. companies.
The portfolio managers employ a GARP strategy. GARP investing involves buying
stocks that have a reasonable price/earnings ratio in relationship to a
company's earnings growth rate. The investment process combines bottom-up and
top-down analysis. Bottom-up analysis is based on global company research that
seeks to identify positive catalysts for outperformance or earnings surprise
based on both growth and value factors. Top-down analysis seeks to assess the
relative attractiveness of countries and sectors.
The Fund may invest in companies of all sizes, and market capitalization is a
residual of the investment process. The Fund invests primarily in companies in
EAFE countries and emerging markets. Under normal conditions, the Fund will
invest in issuers from at least five countries excluding the U.S.
8
Investment Summaries (continued)
--------------------------------------------------------------------------------
PRINCIPAL RISKS OF INVESTING IN THIS FUND
--------------------------------------------------------------------------------
You could lose money by investing in the Fund. There can be no assurance that
the Fund's investment objective will be achieved.
RISKS. These principal investment risks apply to the Fund:
emerging market, foreign securities, GARP style, liquidity, manager, market,
portfolio turnover, small-cap company and mid-cap company risks. See the next
Section, "Principal Investment Risks," for a more detailed discussion of these
risks and other principal risks common to all Funds.
SECTOR FUND
ASTON/FORTIS REAL ESTATE FUND
(Formerly Aston/ABN AMRO Real Estate Fund)
INVESTMENT OBJECTIVE
--------------------------------------------------------------------------------
The Fund seeks total return through a combination of growth and income.
PRINCIPAL INVESTMENT STRATEGIES
--------------------------------------------------------------------------------
Under normal conditions, the Fund invests at least 80% of its assets in REITs
and common stocks and other equity securities of U.S. and foreign companies
principally engaged in the real estate sector. The portfolio managers do not
invest in real estate directly. In selecting securities for the Fund, the
portfolio managers analyze long-term trends in property types and geographic
regions. The portfolio managers use a combination of a top-down and a bottom-up
approach. The Fund is classified as non-diversified.
Top-down approach involves:
- analyzing demographic and economic trends
- reviewing the real estate cycle to identify favorable geographic regions
and property types
Bottom-up approach involves researching individual companies, focusing on
companies with:
- revenues primarily derived from real estate related activities
- a significant portion of revenues from rental income
- management stake in performance
- a strong balance sheet and/or consistent earnings
- internal growth prospects
- potential growth from acquisition or development
- free cash flow
The Fund may invest in foreign securities (directly and through depositary
receipts).
To manage risk, the portfolio managers employ a strategy of sector and position
constraints, and adhere to a strong sell discipline.
PRINCIPAL RISKS OF INVESTING IN THIS FUND
--------------------------------------------------------------------------------
You could lose money by investing in the Fund. There can be no assurance that
the Fund's investment objective will be achieved.
RISKS. These principal investment risks apply to the Fund:
foreign securities, GARP style, liquidity, manager, market, non-diversification,
REIT and sector concentration risks. See the next Section, "Principal Investment
Risks," for a more detailed discussion of these risks and other principal risks
common to all Funds.
BALANCED FUND
MONTAG & CALDWELL BALANCED FUND
INVESTMENT OBJECTIVE
--------------------------------------------------------------------------------
The Fund seeks long-term total return.
PRINCIPAL INVESTMENT STRATEGIES
--------------------------------------------------------------------------------
The Fund invests primarily in a combination of equity, fixed income and short-
term securities. Generally, between 50% and 70% of the Fund's total assets will
be invested in equity securities and at least 25% will be invested in fixed
income securities to provide a stable flow of income. The portfolio allocation
will vary based upon the portfolio manager's assessment of the return potential
of each asset class. For equity investments, the portfolio manager uses a
bottom-up approach to stock selection and seeks high quality, well-established
large-cap companies that the portfolio manager believes are growing their near-
term earnings at an above average rate. The portfolio manager emphasizes
valuation to find companies selling at a discount to their intrinsic value.
These companies must pass an initial capitalization screen and:
- have a strong history of earnings growth
- are attractively priced, relative to the company's potential for above
average long-term earnings and revenue growth
- have strong balance sheets
- have a sustainable competitive advantage
- are currently, or have the potential to become, industry leaders
- have the potential to outperform during market downturns
The Fund may invest in foreign securities (directly and through depositary
receipts).
When selecting equity securities, the portfolio manager limits sector and
individual security exposure and adheres to a strong sell discipline in order to
minimize risk.
When selecting fixed income securities, the portfolio manager strives to
maximize total return and minimize risk primarily through actively adjusting the
portfolio's duration and sector weightings. Emphasis is also placed on
diversification and credit analysis.
The Fund will invest only in fixed income securities with an "A" or better
rating. Investments will include:
- U.S. government securities
- corporate bonds
- mortgage/asset-backed securities
- money market securities and repurchase agreements
9
Investment Summaries (continued)
--------------------------------------------------------------------------------
PRINCIPAL RISKS OF INVESTING IN THIS FUND
--------------------------------------------------------------------------------
You could lose money by investing in the Fund. There can be no assurance that
the Fund's investment objective will be achieved.
RISKS. These principal investment risks apply to the Fund: credit, foreign
securities, growth style, interest rate, liquidity, manager, market, prepayment
and U.S. government agency securities risks. See the next Section, "Principal
Investment Risks," for a more detailed discussion of these risks and other
principal risks common to all Funds.
FIXED INCOME FUND
ASTON/TCH FIXED INCOME FUND
INVESTMENT OBJECTIVE
--------------------------------------------------------------------------------
The Fund seeks high current income consistent with prudent risk of capital.
PRINCIPAL INVESTMENT STRATEGIES
--------------------------------------------------------------------------------
Under normal conditions, the Fund invests at least 80% of its assets in bonds,
primarily intermediate-term investment-grade fixed income securities. The Fund
may invest in securities of the U.S. government and its agencies, corporate
notes and bonds, mortgage- and asset-backed securities and short-term money
market instruments. The portfolio managers select securities based on various
methods of quantitative and fundamental analysis and research.
The portfolio managers seek to maintain an average weighted portfolio maturity
of three to ten years. The portfolio managers emphasize investment grade fixed
income securities, but may invest in high yield securities. The Fund may use
futures, swaps and other derivatives for hedging purposes, to manage portfolio
duration or to seek total return. Derivatives will consist primarily of futures
contracts, interest rate swaps and credit default swaps. Derivatives will be
used to hedge interest rate risk and credit risk. Derivatives may also be used
to seek exposure to asset classes in which the Fund is authorized to invest. For
example, derivatives may provide exposure to specific credits that are not
available in the cash markets, or may provide more efficient access to such
credits. Derivatives will not be used to seek exposure to asset classes that the
Fund may not invest in directly and will not be used for leverage purposes. The
net notional (or market exposure) of derivatives instruments will not exceed the
net assets of the Fund. See "Additional Information Regarding Investment
Strategies."
The Fund may also invest in foreign securities.
The portfolio managers manage risk through ongoing monitoring of sector, quality
and issuer exposures, and ongoing analysis of duration, convexity, and maturity.
PRINCIPAL RISKS OF INVESTING IN THIS FUND
--------------------------------------------------------------------------------
You could lose money by investing in the Fund. There can be no assurance that
the Fund's investment objective will be achieved.
RISKS. These principal investment risks apply to the Fund: below investment
grade (high yield) securities, call, credit, derivatives, foreign securities,
interest rate, liquidity, manager, prepayment and U.S. government agency
securities risks. See the next Section, "Principal Investment Risks," for a more
detailed discussion of these risks and other principal risks common to all
Funds.
10
Principal Investment Risks
--------------------------------------------------------------------------------
RISKS THAT APPLY TO THE FUNDS
--------------------------------------------------------------------------------
BELOW INVESTMENT GRADE (HIGH YIELD) SECURITIES RISK: Bonds and other fixed
income securities are rated by national ratings agencies. These ratings
generally assess the ability of the issuer to pay principal and interest.
Issuers of securities that are rated below investment grade (i.e., Ba1/BB+ or
lower) and their unrated equivalents are typically in poor financial health, and
their ability to pay interest and principal is uncertain. The prices of such
securities may be more vulnerable to bad economic news, or even the expectation
of bad news, than higher rated or investment grade bonds and other fixed income
securities.
CALL RISK: Call risk is the possibility that an issuer may redeem a fixed income
security before maturity (a call) at a price below its current market price. An
increased likelihood of a call may reduce the security's price. If a fixed
income security is called, a fund may have to reinvest the proceeds in other
fixed income securities with lower interest rates, higher credit risks, or other
less favorable characteristics.
CREDIT RISK: Credit risk (also called default risk) is the risk that the issuer
of a security will not be able to make principal and interest payments on a debt
issue. The credit ratings of issuers could change and negatively affect a fund's
share price or yield.
When a Fund uses derivatives instruments to seek credit exposure to underlying
issuers, it is subject to the credit risk of both the underlying issuer(s) and
the counterparty (typically a broker or bank) to the instrument. When a Fund
invests in asset-backed securities, mortgage-backed securities and CMOs, it is
subject to the credit risks of the underlying assets that collateralize the
instrument. Recent instability in the credit markets has resulted in increased
delinquencies and credit losses on certain types of asset-backed and mortgage-
backed securities.
DERIVATIVES RISK: Risks associated with derivatives include the risk that the
derivative is not well correlated with the security, index or currency to which
it relates, the risk that derivatives may not have the intended effects and may
result in losses or missed opportunities, the risk that a fund will be unable to
sell the derivative because of an illiquid secondary market, the risk that a
counterparty is unwilling or unable to meet its obligation, and the risk that
the derivative transaction could expose a fund to the effects of leverage, which
could increase the fund's exposure to the market and magnify potential losses.
There is no guarantee that derivatives, to the extent employed, will have the
intended effect, and their use could cause lower returns or even losses to a
fund. The use of derivatives by a fund to hedge risk may reduce the opportunity
for gain by offsetting the positive effect of favorable price movements.
The use of certain derivatives provides exposure to the underlying credit market
or other reference asset in excess of the cash instrument of a Fund. The use of
derivatives can magnify gains and losses.
EMERGING MARKET RISK: In addition to the general foreign securities risks,
investing in emerging market countries is subject to a number of risks,
including:
- economic structures that are less diverse and mature than developed
countries
- less stable political systems and less developed legal systems
- national policies that may restrict foreign investment
- wide fluctuations in the value of investments
- smaller securities markets making investments less liquid
- special custody arrangements
FOREIGN SECURITIES RISK: Investing in the securities of foreign issuers involves
special risks and considerations not typically associated with investing in U.S.
companies. The securities of foreign companies may be less liquid and may
fluctuate more widely than those traded in U.S. markets. Foreign companies and
markets may also have less governmental supervision. There may be difficulty in
enforcing contractual obligations and little public information about the
companies. Trades typically take more time to settle and clear, and the cost of
buying and selling foreign securities is generally higher than similar costs
associated with U.S. traded securities.
- CURRENCY RISK: The value of the securities held by a Fund may be affected
by changes in exchange rates or control regulations. If a local currency
gains against the U.S. dollar, the value of the holding increases in U.S.
dollar terms. If a local currency declines against the U.S. dollar, the
value of the holding decreases in U.S. dollar terms.
- POLITICAL/ECONOMIC RISK: Changes in economic, tax or foreign investment
policies, or other political, governmental or economic actions can
adversely affect the value of the securities in a fund.
- REGULATORY RISK: In foreign countries, accounting, auditing and financial
reporting standards and other regulatory practices and requirements are
generally different from those required for U.S. companies.
GARP STYLE RISK: GARP investing involves buying stocks that have a reasonable
price/earnings ratio in relationship to a company's earnings growth rate. Growth
stocks may be more volatile than other stocks because they are generally more
sensitive to investor perceptions and market moves. During periods of growth
stock underperformance, the fund's performance may suffer.
GROWTH STYLE RISK: Growth investing involves buying stocks that have relatively
high price-to-earnings ratios. Growth stocks may be more volatile than other
stocks because they are generally more sensitive to investor perceptions and
market moves. During periods of growth stock underperformance, a fund's
performance may suffer.
11
Principal Investment Risks (continued)
--------------------------------------------------------------------------------
INTEREST RATE RISK: If interest rates rise, bond prices will fall. The longer
the maturity of a bond, the more sensitive a bond's price will be to changes in
interest rates. In other words, a long-term bond (30-year) will have greater
price sensitivity than a short-term bond (2-year). Short-term and long-term bond
prices and interest rates do not typically move the same amount or for the same
reasons. Interest rate changes will impact high yield bonds in different ways
depending on credit ratings. BB rated bonds are more vulnerable to prevailing
rates and act more like their investment grade counterparts. For bonds rated B
and below, credit risk is more significant than interest rate risk. Therefore, a
fund that maintains a minimum B rating should anticipate higher interest rate
risks but lower credit risks than a fund that invests in lower quality issuers.
LIQUIDITY RISK: When there is no willing buyer and investments cannot be readily
sold at the desired time or price, a fund may need to accept a lower price or
may not be able to sell the security at all. An inability to sell securities can
adversely affect a fund's value or prevent a fund from being able to take
advantage of other investment opportunities. Recent instability in certain
credit and fixed income markets has adversely affected and is expected to
continue to affect the liquidity of certain asset classes of securities
including, in particular, certain types of asset-backed, mortgage-backed and
real-estate related securities. Less liquid securities are more difficult to
dispose of at their recorded values and are subject to increased spreads and
volatility.
MANAGER RISK: The performance of a fund is dependent upon the investment
adviser's skill in selecting managers and the portfolio manager's skill in
making appropriate investments. As a result, a fund may underperform its
benchmark or its peers.
MARKET RISK: A fund's share price can move down in response to stock market
conditions, changes in the economy or changes in a particular company's stock
price. An individual stock may decline in value even when the value of stocks in
general is rising.
MID-CAP COMPANY RISK: Investments in mid-cap companies may entail greater risks
than investments in larger, more established companies. Mid-cap companies
generally have narrower product lines, more limited financial resources and a
more limited trading market for their stocks compared with larger companies. As
a result, their stock prices may experience greater volatility and may decline
significantly in market downturns.
NON-DIVERSIFICATION RISK: If a fund is a non-diversified, it may invest a larger
percentage of its assets in a given security than a diversified fund. As a
result, it may be more susceptible to a single adverse economic, political or
regulatory occurrence affecting one or more issuers in which a large percentage
of its assets is invested and may experience increased volatility due to its
investments in those securities.
PORTFOLIO TURNOVER RISK: Frequent trading of a fund's securities may result in a
higher than average level of capital gains, including short-term gains, and will
result in greater transaction costs to a fund. High portfolio turnover may
increase the level of short-term capital gains. To the extent distributions to
shareholders are made from net short-term capital gains of a fund (i.e., net
capital gain on securities held or treated as held by a fund for one year or
less minus any net capital losses on securities held or treated as held by a
fund for more than one year), the distributions will be taxed at ordinary income
rates for federal income tax purposes, rather than at lower long-term capital
gains rates. Greater transaction costs and higher expenses as a result of
portfolio turnover can negatively impact a fund's performance.
PREPAYMENT RISK: Mortgage-backed securities carry prepayment risk. Prices and
yields of mortgage-backed securities assume that the underlying mortgages will
be paid off according to a preset schedule. If the underlying mortgages are paid
off early, such as when homeowners refinance as interest rates decline, a fund
may be forced to reinvest the proceeds in lower yielding, higher priced
securities. This may reduce a fund's total return.
REIT RISK: Securities of REITs may be affected by changes in the value of their
underlying properties and by defaults by borrowers or tenants. Some REITs may
have limited diversification and may be subject to risks inherent in investments
in a limited number of properties, in a narrow geographic area, or in a single
property type. Real estate is also affected by general economic conditions. When
growth is slowing, demand for property decreases and prices may decline. Rising
interest rates, which drive up mortgage and financing costs, can restrain
construction and buying and selling activity, and may reduce the appeal of real
estate investments. REITs depend generally on their ability to generate cash
flow to make distributions to shareholders or unitholders, and may be subject to
defaults by borrowers and self-liquidations. A REIT's return may be adversely
affected when interest rates are high or rising. Distributions from REITs
generally are taxed as ordinary income for federal income tax purposes. See
"Dividends, Distributions and Taxes."
SECTOR CONCENTRATION RISK: Investing in sector-specific funds may entail greater
risks than investing in funds diversified across sectors. Because such a fund
may invest in a limited number of industries within a sector, the fund may be
subject to a greater level of market risk and its performance may be more
volatile than a fund that does not concentrate in a specific sector.
SMALL-CAP COMPANY RISK: Investing in securities of small-cap companies may
involve greater risks than investing in securities of larger, more established
issuers. Small-cap companies generally have limited product lines, markets and
financial resources. Their securities may trade less frequently and in more
limited volume than the securities of larger, more established
12
Principal Investment Risks (continued)
--------------------------------------------------------------------------------
companies. Also, small-cap companies are typically subject to greater changes in
earnings and business prospects than larger companies. As a result, their stock
prices may experience greater volatility and may decline significantly in market
downturns.
U.S. GOVERNMENT AGENCY SECURITIES RISK: Certain U.S. government agency
securities are backed by the right of the issuer to borrow from the U.S.
Treasury while others are supported only by the credit of the issuer or
instrumentality. While the U.S. government may provide financial support to U.S.
government-sponsored agencies or instrumentalities, such as various actions
taken to stabilize the Federal National Mortgage Association and Federal Home
Loan Mortgage Corporation in 2008, no assurance can be given that it will always
do so. Such securities are neither issued nor guaranteed by the U.S. Treasury.
VALUE STYLE RISK: Value investing involves buying stocks that are out of favor
and/or undervalued in comparison to their peers or their prospects for growth.
Typically, their valuation levels are less than those of growth stocks. Because
different types of stocks go out of favor with investors depending on market and
economic conditions, a fund's return may be adversely affected during a market
downturn and when value stocks are out of favor.
13
Principal Investment Risks (continued)
--------------------------------------------------------------------------------
RISK SUMMARY
--------------------------------------------------------------------------------
The following chart compares the principal risks of investing in each Fund. More
information about the risks associated with investing in Aston Funds can also be
found in the SAI.
Below
Investment
Grade
(High
Yield) Deri- Emerging Foreign GARP Growth Interest
FUND Securities Call Credit vatives Market Securities Style Style Rate Liquidity Manager
Montag & Caldwell Growth X X X X
Aston/Veredus Select
Growth X X X X
Aston Growth X X X X
Aston Value X X X
Aston/River Road
Dividend All Cap Value X X X
Aston/Optimum Mid Cap X X X X
Aston/River Road Small-
Mid Cap X X X
Aston/Veredus Aggressive
Growth X X X X
Aston/TAMRO Small Cap X X X X X X
Aston/River Road Small
Cap Value X X X
Aston/Neptune
International X X X X X
Aston/Barings
International Fund X X X X X
Aston/Fortis Real Estate X X X X
Montag & Caldwell
Balanced X X X X X X
Aston/TCH Fixed Income X X X X X X X X
U.S.
Non- Port- Government
Mid-Cap Diversi- folio Pre- Sector Small-Cap Agency Value
FUND Market Company fication Turnover payment REIT Concentration Company Secutities Style
Montag & Caldwell Growth X
Aston/Veredus Select
Growth X X X
Aston Growth X
Aston Value X X X
Aston/River Road
Dividend All Cap Value X X X X X
Aston/Optimum Mid Cap X X X X
Aston/River Road Small-
Mid Cap X X X X X
Aston/Veredus Aggressive
Growth X X X X
Aston/TAMRO Small Cap X X X X
Aston/River Road Small
Cap Value X X X X X
Aston/Neptune
International X X
Aston/Barings
International Fund X X X X
Aston/Fortis Real Estate X X X X X
Montag & Caldwell
Balanced X X X
Aston/TCH Fixed Income X X
14
Fund Performance
--------------------------------------------------------------------------------
MONTAG & CALDWELL GROWTH FUND
FUND PERFORMANCE
--------------------------------------------------------------------------------
The bar chart shows how the Fund's performance has varied from year-to-year over
the periods shown. This information may help illustrate the risks of investing
in the Fund. As with all mutual funds, past performance (before and after taxes)
does not guarantee future performance.
CALENDAR YEAR TOTAL RETURN
1999 22.90%
2000 (7.07%)
2001 (13.11%)
2002 (22.67%)
2003 17.57%
2004 4.39%
2005 5.65%
2006 8.37%
2007 21.42%
2008 (32.48)%
Best quarter: 12/99 17.84%
Worst quarter: 12/08 (20.31)%
The following table indicates how the Fund's average annual returns for
different calendar periods compared to the returns of a broad-based securities
market index. All figures assume reinvestment of dividends and distributions. It
is not possible to invest in an index.
AVERAGE ANNUAL TOTAL RETURN
(For the periods ended December 31, 2008)
1 Year 5 Years 10 Years
------- -------- --------
Montag & Caldwell Growth
Fund:(a)
Return Before Taxes (32.48)% (0.40)% (1.22)%
Return After Taxes on
Distributions (32.89)% (1.04)% (1.95)%
Return After Taxes on
Distributions and Sale of
Fund Shares (20.59)% (0.22)% (1.03)%
------ ----- -----
Russell 1000 Growth Index(b) (38.44)% (3.42)% (4.27)%
------ ----- -----
(a)Performance reflects expense limitations that were in effect during one or
more of the periods presented. If expense limitations had not been in place, the
Fund's performance would have been reduced.
(b)Reflects no deduction for taxes, expenses or fees.
ASTON/VEREDUS SELECT GROWTH FUND
FUND PERFORMANCE
--------------------------------------------------------------------------------
The bar chart shows how the Fund's performance has varied from year-to-year over
for the periods shown. This information may help illustrate the risks of
investing in the Fund. As with all mutual funds, past performance (before and
after taxes) does not guarantee future performance.
CALENDAR YEAR TOTAL RETURN
2007 24.71%
2008 (44.97%)
Best quarter: 06/07 7.60%
Worst quarter: 12/08 (25.58)%
The following table indicates how the Fund's average annual returns for the
different calendar periods compared to the returns of a broad-based securities
market index. All figures assume reinvestment of dividends and distributions. It
is not possible to invest in an index.
AVERAGE ANNUAL TOTAL RETURN
(For the periods ended December 31, 2008)
Since
1 Year Inception(a)
------- ------------
Aston/Veredus Select Growth Fund:(b)
Return Before Taxes (44.97)% (11.38)%
Return After Taxes on Distributions (44.97)% (13.16)%
Return After Taxes on Distributions and
Sale of Fund Shares (29.23)% (9.98)%
------ ------
Russell 1000 Growth Index(c) (38.44)% (11.64)%
------ ------
(a)Inception of Class I shares: September 11, 2006. Index data computed from
August 31, 2006.
(b)Performance reflects expense limitations that were in effect during one or
more of the periods presented. If expense limitations had not been in place, the
Fund's performance would have been reduced.
(c)Reflects no deduction for taxes, expenses or fees.
After-tax returns are calculated using the highest historical marginal
individual federal income tax rates and do not reflect the impact of state and
local taxes. In some instances, the "Return After Taxes on Distributions and
Sale of Fund Shares" may be greater than "Return Before Taxes" because the
investor is assumed to be able to use the capital loss of the sale of Fund
shares to offset other taxable capital gains. After-tax returns depend on an
investor's tax situation and may differ from those shown. After-tax returns
shown are not relevant to investors who hold their shares through tax-deferred
arrangements, such as 401(k) plans or individual retirement accounts.
15
Fund Performance (continued)
--------------------------------------------------------------------------------
ASTON GROWTH FUND
(Formerly Aston/ABN AMRO Growth Fund)
FUND PERFORMANCE
--------------------------------------------------------------------------------
The bar chart shows how the Fund's performance has varied from year-to-year over
the periods shown. This information may help illustrate the risks of investing
in the Fund. As with all mutual funds, past performance (before and after taxes)
does not guarantee future performance.
CALENDAR YEAR TOTAL RETURN*
2001 (12.91%)
2002 (19.11%)
2003 21.92%)
2004 5.67%
2005 1.33%
2006 3.56%
2007 4.81%
2008 (32.05%)
Best quarter: 12/01 16.35%
Worst quarter: 12/08 (20.28)%
The following table indicates how the Fund's average annual returns for
different calendar periods compared to the returns of a broad-based securities
market index. All figures assume reinvestment of dividends and distributions. It
is not possible to invest in an index.
AVERAGE ANNUAL TOTAL RETURN*
(For the periods ended December 31, 2008)
Since
1 Year 5 Years Inception(a)
------- -------- ------------
Aston Growth Fund:(b)
Return Before Taxes (32.50)% (4.72)% (4.40)%
Return After Taxes on Distributions (32.56)% (6.04)% (5.44)%
Return After Taxes on Distributions
and Sale of Fund Shares (21.04)% (3.54)% (3.40)%
------ ----- -----
Russell 1000 Growth Index(c) (38.44)% (3.42)% (8.22)%
------ ----- -----
(a)Inception of Class I shares: July 31, 2000. Index data computed from July 31,
2000.
(b)Performance reflects expense limitations that were in effect during one or
more of the periods presented. If expense limitations had not been in place, the
Fund's performance would have been reduced.
(c)Reflects no deduction for taxes, expenses or fees.
*Montag & Caldwell Inc. became the subadviser as of January 1, 2008.
Performance prior to that date reflects the performance of a previous
subadviser.
ASTON VALUE FUND
FUND PERFORMANCE
--------------------------------------------------------------------------------
The bar chart shows how the Fund's performance has varied from year-to-year over
for the periods shown. This information may help illustrate the risks of
investing in the Fund. As with all mutual funds, past performance (before and
after taxes) does not guarantee future performance.
CALENDAR YEAR TOTAL RETURN
2006 21.30%
2007 8.29%
2008 (34.53%)
Best quarter: 12/06 7.90%
Worst quarter: 12/08 (19.27)%
The following table indicates how the Fund's average annual returns for
different calendar periods compared to the returns of a broad-based securities
market index. All figures assume reinvestment of dividends and distributions. It
is not possible to invest in an index.
AVERAGE ANNUAL TOTAL RETURN
(For the periods ended December 31, 2008)
Since
1 Year Inception(a)
------- ------------
Aston Value Fund:(b)
Return Before Taxes (34.53)% (4.14)%
Return After Taxes on Distributions (36.07)% (5.77)%
Return After Taxes on Distributions and Sale
of Fund Shares (20.41)% (3.34)%
------ -----
Russell 1000 Value Index(c) (36.85)% (7.34)%
------ -----
(a)Inception of Class I shares: September 20, 2005. Index data computed from
September 30, 2005.
(b)Performance reflects expense limitations that were in effect during one or
more of the periods presented. If expense limitations had not been in place, the
Fund's performance would have been reduced.
(c)Reflects no deduction for taxes, expenses or fees.
After-tax returns are calculated using the highest historical marginal
individual federal income tax rates and do not reflect the impact of state and
local taxes. In some instances, the "Return After Taxes on Distributions and
Sale of Fund Shares" may be greater than "Return Before Taxes" because the
investor is assumed to be able to use the capital loss of the sale of Fund
shares to offset other taxable capital gains. After-tax returns depend on an
investor's tax situation and may differ from those shown. After-tax returns
shown are not relevant to investors who hold their shares through tax-deferred
arrangements, such as 401(k) plans or individual retirement accounts.
16
Fund Performance (continued)
--------------------------------------------------------------------------------
ASTON/RIVER ROAD DIVIDEND ALL CAP VALUE FUND
(Formerly Aston/River Road Dynamic Equity Income Fund)
FUND PERFORMANCE
--------------------------------------------------------------------------------
The bar chart shows how the Fund's performance for the period shown. This
information may help illustrate the risks of investing in the Fund. As with all
mutual funds, past performance (before and after taxes) does not guarantee
future performance.
CALENDAR YEAR TOTAL RETURN
2008 (28.41%)
Best quarter: 3/08 (3.63)%
Worst quarter: 12/08 (19.41)%
The following table indicates how the Fund's average annual return for the
calendar period compared to the returns of a broad-based securities market
index. All figures assume reinvestment of dividends and distributions. It is not
possible to invest in an index.
AVERAGE ANNUAL TOTAL RETURN
(For the period ended December 31, 2008)
Since
1 Year Inception(a)
------- ------------
Aston/River Road Dividend All Cap Value Funds(b)(c)
Return Before Taxes (28.41)% (23.10)%
Return After Taxes on Distributions (28.76)% (24.13)%
Return After Taxes on Distributions and Sale of
Fund Shares (17.85)% (19.34)%
------ ------
Russell 3000 Value Index(d) (36.25)% (29.24)%
------ ------
(a)Inception of Class I shares: June 28, 2007. Index data computed from June 30,
2007.
(b)Performance reflects expense limitations that were in effect during the
periods presented. If expense limitations had not been in place, the Fund's
performance would have been reduced.
(c)Effective September 30, 2008, the Fund changed its name from Aston/River Road
Dynamic Equity Income Fund to Aston/River Road Dividend All Cap Fund. There was
no change in the Fund's investment objective, investment policies or current
portfolio management team.
(d)Reflects no deduction for taxes, expenses or fees.
ASTON/OPTIMUM MID CAP FUND
FUND PERFORMANCE
--------------------------------------------------------------------------------
The bar chart shows how the Fund's performance has varied from year-to-year over
the periods shown. This information may help illustrate the risks of investing
in the Fund. As with all mutual funds, past performance (before and after taxes)
does not guarantee future performance.
CALENDAR YEAR TOTAL RETURN
2005 1.61%
2006 21.20%
2007 13.21%
2008 (42.74%)
Best quarter: 12/06 12.70%
Worst quarter: 12/08 (29.82)%
The following table indicates how the Fund's average annual returns for
different calendar periods compared to the returns of a broad-based securities
market index. All figures assume reinvestment of dividends and distributions. It
is not possible to invest in an index.
AVERAGE ANNUAL TOTAL RETURN
(For the periods ended December 31, 2008)
Since
1 Year Inception(a)
------- ------------
Aston/Optimum Mid Cap Fund:(b)
Return Before Taxes (42.74)% (3.45)%
Return After Taxes on Distributions (43.01)% (4.20)%
Return After Taxes on Distributions and Sale of
Fund Shares (27.44)% (2.63)%
------ -----
S&P MidCap 400 Index(c) (36.23)% (1.39)%
------ -----
(a)Inception of Class I shares: July 6, 2004. Index data computed from June 30,
2004.
(b)Performance reflects expense limitations that were in effect during one or
more of the periods presented. If expense limitations had not been in place, the
Fund's performance would have been reduced.
(c)Reflects no deduction for taxes, expenses or fees.
After-tax returns are calculated using the highest historical marginal
individual federal income tax rates and do not reflect the impact of state and
local taxes. In some instances, the "Return After Taxes on Distributions and
Sale of Fund Shares" may be greater than "Return Before Taxes" because the
investor is assumed to be able to use the capital loss of the sale of Fund
shares to offset other taxable capital gains. After-tax returns depend on an
investor's tax situation and may differ from those shown. After-tax returns
shown are not relevant to investors who hold their shares through tax-deferred
arrangements, such as 401(k) plans or individual retirement accounts.
17
Fund Performance (continued)
--------------------------------------------------------------------------------
ASTON/RIVER ROAD SMALL-MID CAP FUND
FUND PERFORMANCE
--------------------------------------------------------------------------------
The bar chart shows the Fund's performance for the period shown. This
information may help illustrate the risks of investing in the Fund. As with all
mutual funds, past performance (before and after taxes) does not guarantee
future performance.
CALENDAR YEAR TOTAL RETURN
2008 (27.08%)
Best quarter: 6/08 3.50%
Worst quarter: 12/08 (22.33)%
The following table indicates how the Fund's average annual return for the
calendar period compared to the returns of a broad-based securities market
index. All figures assume reinvestment of dividends and distributions. It is not
possible to invest in an index.
AVERAGE ANNUAL TOTAL RETURN
(For the periods ended December 31, 2008)
Since
1 Year Inception(a)
-------- -----------
Aston/River Road Small-Mid Cap Fund:(b)
Return Before Taxes (27.08)% (25.02)%
Return After Taxes on Distributions (27.11)% (25.05)%
Return After Taxes on Distributions and Sale of
Fund Shares (17.57)% (21.02)%
------ ------
Russell 2500 Value Index(c) (31.99)% (29.30)%
------ ------
(a)Inception of Class I shares: June 28, 2007. Index data computed from June 30,
2007.
(b)Performance reflects expense limitations that were in effect during the
periods presented. If expense limitations had not been in place, the Fund's
performance would have been reduced.
(c)Reflects no deduction for taxes, expenses or fees.
ASTON/VEREDUS AGGRESSIVE GROWTH FUND
FUND PERFORMANCE
--------------------------------------------------------------------------------
The bar chart shows how the Fund's performance has varied from year-to-year over
the periods shown. This information may help illustrate the risks of investing
in the Fund. As with all mutual funds, past performance (before and after taxes)
does not guarantee future performance.
CALENDAR YEAR TOTAL RETURN
2002 (43.73%)
2003 44.87%
2004 21.07%
2005 2.53%
2006 (2.15%)
2007 12.46%
2008 (45.21%)
Best quarter: 6/03 26.57%
Worst quarter: 12/08 (25.95)%
The following table indicates how the Fund's average annual returns for
different calendar periods compared to the returns of a broad-based securities
market index. All figures assume reinvestment of dividends and distributions. It
is not possible to invest in an index.
AVERAGE ANNUAL TOTAL RETURN
(For the periods ended December 31, 2008)
1 5 Since
Year Years Inception(a)
------- ------- ------------
Aston/Veredus Aggressive Growth Fund:(b)
Return Before Taxes (45.21)% (5.63)% (5.66)%
Return After Taxes on Distributions (45.27)% (7.07)% (6.67)%
Return After Taxes on Distributions
and Sale of Fund Shares (29.33)% (4.54)% (4.56)%
------ ----- -----
Russell 2000 Growth Index(c) (38.54)% (2.35)% 2.07%
------ ----- -----
(a)Inception of Class I shares: October 5, 2001. Index data computed from
September 30, 2001.
(b)Performance reflects expense limitations that were in effect during one or
more of the periods presented. If expense limitations had not been in place, the
Fund's performance would have been reduced.
(c)Reflects no deduction for taxes, expenses or fees.
After-tax returns are calculated using the highest historical marginal
individual federal income tax rates and do not reflect the impact of state and
local taxes. In some instances, the "Return After Taxes on Distributions and
Sale of Fund Shares" may be greater than "Return Before Taxes" because the
investor is assumed to be able to use the capital loss of the sale of Fund
shares to offset other taxable capital gains. After-tax returns depend on an
investor's tax situation and may differ from those shown. After-tax returns
shown are not relevant to investors who hold their shares through tax-deferred
arrangements, such as 401(k) plans or individual retirement accounts.
18
Fund Performance (continued)
--------------------------------------------------------------------------------
ASTON/TAMRO SMALL CAP FUND
FUND PERFORMANCE
--------------------------------------------------------------------------------
The bar chart shows how the Fund's performance has varied from year-to-year over
the periods shown. This information may help illustrate the risks of investing
in the Fund. As with all mutual funds, past performance (before and after taxes)
does not guarantee future performance.
CALENDAR YEAR TOTAL RETURN
2006 28.33%
2007 0.48%
2008 (32.99%)
Best quarter: 3/06 19.54%
Worst quarter: 12/08 (25.81)%
The following table indicates how the Fund's average annual returns for
different calendar periods compared to the returns of a broad-based securities
market index. All figures assume reinvestment of dividends and distributions. It
is not possible to invest in an index.
AVERAGE ANNUAL TOTAL RETURN
(For the periods ended December 31, 2008)
Since
1 Year Inception(a)
-------- ------------
Aston/TAMRO Small Cap Fund:(b)
Return Before Taxes (32.99)% (2.21)%
Return After Taxes on Distributions (33.01)% (2.60)%
Return After Taxes on Distributions and Sale of
Fund Shares (21.42)% (1.71)%
------ -----
Russell 2000 Index(c) (33.79)% (5.23)%
------ -----
(a)Inception of Class I shares: January 4, 2005. Index data computed from
December 31, 2004.
(b)Performance reflects expense limitations that were in effect during one or
more of the periods presented. If expense limitations had not been in place, the
Fund's performance would have been reduced.
(c)Reflects no deduction for taxes, expenses or fees.
ASTON/RIVER ROAD SMALL CAP VALUE FUND
FUND PERFORMANCE
--------------------------------------------------------------------------------
The bar chart shows the Fund's performance has varied from year-to-year over the
periods shown. This information may help illustrate the risks of investing in
the Fund. As with all mutual funds, past performance (before and after taxes)
does not guarantee future performance.
CALENDAR YEAR TOTAL RETURN
2007 (5.72%)
2008 (30.02%)
Best quarter: 03/07 3.28%
Worst quarter: 12/08 (22.79)%
The following table indicates how the Fund's average annual returns for
different calendar periods compared to the returns of a broad-based securities
market index. All figures assume reinvestment of dividends and distributions. It
is not possible to invest in an index.
AVERAGE ANNUAL TOTAL RETURN
(For the periods ended December 31, 2008)
Since
1 Year Inception(a)
-------- ------------
Aston/River Road Small Cap Value Fund:(b)
Return Before Taxes (30.02)% (17.67)%
Return After Taxes on Distributions (30.06)% (18.27)%
Return After Taxes on Distributions and Sale of
Fund Shares (19.46)% (14.89)%
------ ------
Russell 2000 Value Index(c) (28.92)% (18.87)%
------ ------
(a)Inception of Class I shares: December 13, 2006. Index data computed from
November 30, 2006.
(b)Performance reflects expense limitations that were in effect during one or
more of the periods presented. If expense limitations had not been in place, the
Fund's performance would have been reduced.
(c)Reflects no deduction for taxes, expenses or fees.
After-tax returns are calculated using the highest historical marginal
individual federal income tax rates and do not reflect the impact of state and
local taxes. In some instances, the "Return After Taxes on Distributions and
Sale of Fund Shares" may be greater than "Return Before Taxes" because the
investor is assumed to be able to use the capital loss of the sale of Fund
shares to offset other taxable capital gains. After-tax returns depend on an
investor's tax situation and may differ from those shown. After-tax returns
shown are not relevant to investors who hold their shares through tax-deferred
arrangements, such as 401(k) plans or individual retirement accounts.
19
Fund Performance (continued)
--------------------------------------------------------------------------------
ASTON/NEPTUNE INTERNATIONAL FUND
FUND PERFORMANCE
--------------------------------------------------------------------------------
The bar chart shows the Fund's performance for the period shown. This
information may help illustrate the risks of investing in the Fund. As with all
mutual funds, past performance (before and after taxes) does not guarantee
future performance.
CALENDAR YEAR TOTAL RETURN
2008 (52.96%)
Best quarter: 6/08 4.85%
Worst quarter: 9/08 (30.22)%
The following table indicates how the Fund's average annual return for the
calendar period compared to the returns of a broad-based securities market
index. All figures assume reinvestment of dividends and distributions. It is not
possible to invest in an index.
AVERAGE ANNUAL TOTAL RETURN
(For the periods ended December 31, 2008)
Since
1 Year Inception(a)
-------- ------------
Aston/Neptune International Fund:(b)
Return Before Taxes (52.96)% (34.23)%
Return After Taxes on Distributions (53.02)% (34.47)%
Return After Taxes on Distributions and Sale of
Fund Shares (34.35)% (28.71)%
------ ------
MSCI EAFE and Emerging Markets Index(c) (45.52)% (33.07)%
------ ------
(a)Fund's inception: August 6, 2007. Index data computed from July 31, 2007.
(b)Performance reflects expense limitations that were in effect during the
periods presented. If expense limitations had not been in place, the Fund's
performance would have been reduced.
(c)Reflects no deduction for taxes, expenses or fees.
ASTON/BARINGS INTERNATIONAL FUND
FUND PERFORMANCE
--------------------------------------------------------------------------------
The bar chart shows the Fund's performance for the period shown. This
information may help illustrate the risks of investing in the Fund. As with all
mutual funds, past performance (before and after taxes) does not guarantee
future performance.
CALENDAR YEAR TOTAL RETURN
2008 (44.34%)
Best quarter: 6/08 0.83
Worst quarter: 9/08 (22.66)%
The following table indicates how the Fund's average annual return for the
calendar period compared to the returns of a broad-based securities market
index. All figures assume reinvestment of dividends and distributions. It is not
possible to invest in an index.
AVERAGE ANNUAL TOTAL RETURN
(For the periods ended December 31, 2008)
Since
1 Year Inception(a)
-------- -------------
Aston/Barings International Fund:(b)
Return Before Taxes (44.34)% (41.88)%
Return After Taxes on Distributions (44.35)% (41.89)%
Return After Taxes on Distributions and Sale of
Fund Shares (28.81)% (35.34)%
------ -------
MSCI EAFE and Emerging Markets Index(c) (43.38)% (41.47)%
------ -------
(a)Fund's inception: November 2, 2007. Index data computed from October 31,
2007.
(b)Performance reflects expense limitations that were in effect during the
periods presented. If expense limitations had not been in place, the Fund's
performance would have been reduced.
(c)Reflects no deduction for taxes, expenses or fees.
After-tax returns are calculated using the highest historical marginal
individual federal income tax rates and do not reflect the impact of state and
local taxes. In some instances, the "Return After Taxes on Distributions and
Sale of Fund Shares" may be greater than "Return Before Taxes" because the
investor is assumed to be able to use the capital loss of the sale of Fund
shares to offset other taxable capital gains. After-tax returns depend on an
investor's tax situation and may differ from those shown. After-tax returns
shown are not relevant to investors who hold their shares through tax-deferred
arrangements, such as 401(k) plans or individual retirement accounts.
20
Fund Performance (continued)
--------------------------------------------------------------------------------
ASTON/FORTIS REAL ESTATE FUND
(Formerly Aston/ABN AMRO Real Estate Fund)
FUND PERFORMANCE
--------------------------------------------------------------------------------
The bar chart shows how the Fund's performance has varied from year-to-year over
the periods shown. This information may help illustrate the risks of investing
in the Fund. As with all mutual funds, past performance (before and after taxes)
does not guarantee future performance.
CALENDAR YEAR TOTAL RETURN
2006 36.17%
2007 (18.91%)
2008 (41.77%)
Best quarter: 3/06 14.37%
Worst quarter: 12/08 (39.03)%
The following table indicates how the Fund's average annual returns for
different calendar periods compared to the returns of a broad-based securities
market index. All figures assume reinvestment of dividends and distributions. It
is not possible to invest in an index.
AVERAGE ANNUAL TOTAL RETURN
(For the periods ended December 31, 2008)
Since
1 Year Inception(a)
-------- ------------
Aston/Fortis Real Estate Fund:(b)
Return Before Taxes (41.77)% (11.82)%
Return After Taxes on Distributions (42.60)% (15.27)%
Return After Taxes on Distributions and Sale of
Fund Shares (27.11)% (8.86)%
------ -----
MSCI US REIT Index(c) (37.97)% (9.88)%
------ -----
(a)Inception of Class I shares: September 20, 2005. Index date computed from
September 30, 2005.
(b)Performance reflects expense limitations that were in effect during one or
more of the periods presented. If expense limitations had not been in place, the
Fund's performance would have been reduced.
(c)Reflects no deduction for taxes, expenses or fees.
MONTAG & CALDWELL BALANCED FUND
FUND PERFORMANCE
--------------------------------------------------------------------------------
The bar chart shows how the Fund's performance has varied from year-to-year over
the periods shown. This information may help illustrate the risks of investing
in the Fund. As with all mutual funds, past performance (before and after taxes)
does not guarantee future performance.
CALENDAR YEAR TOTAL RETURN
1999 13.10%
2000 (0.50%)
2001 (5.27%)
2002 (12.10%)
2003 11.95%
2004 3.40%
2005 3.61%
2006 6.43%
2007 15.51%
2008 (19.20%)
Best quarter: 12/99 10.80%
Worst quarter: 12/08 (10.32)%
The following table indicates how the Fund's average annual returns for
different calendar periods compared to the returns of broad-based securities
market indices. All figures assume reinvestment of dividends and distributions.
It is not possible to invest in an index.
AVERAGE ANNUAL TOTAL RETURN
(For the periods ended December 31, 2008)
1 Year 5 Years 10 Years
-------- -------- ---------
Montag & Caldwell Balanced Fund:(a)
Return Before Taxes (19.20)% 1.25% 1.09%
Return After Taxes on Distributions (19.49)% 0.84% 0.36%
Return After Taxes on Distributions and Sale
of Fund Shares (12.29)% 0.93% 0.60%
------ ----- -----
S&P 500 Index(b) (36.99)% (2.19)% (1.38)%
------ ----- -----
Barclays Capital U.S. Government Credit Bond
Index(b) 5.70% 4.64% 5.64%
------ ----- -----
60% S&P 500 Index/40% Barclays Capital U.S.
Government Credit Bond Index(b) (21.91)% 0.72% 1.71%
------ ----- -----
(a)Performance reflects expense limitations that were in effect during one or
more of the periods presented. If expense limitations had not been in place, the
Fund's performance would have been reduced.
(b)Reflects no deduction for taxes, expenses or fees.
After-tax returns are calculated using the highest historical marginal
individual federal income tax rates and do not reflect the impact of state and
local taxes. In some instances, the "Return After Taxes on Distributions and
Sale of Fund Shares" may be greater than "Return Before Taxes" because the
investor is assumed to be able to use the capital loss of the sale of Fund
shares to offset other taxable capital gains. After-tax returns depend on an
investor's tax situation and may differ from those shown. After-tax returns
shown are not relevant to investors who hold their shares through tax-deferred
arrangements, such as 401(k) plans or individual retirement accounts.
21
Fund Performance (continued)
--------------------------------------------------------------------------------
ASTON/TCH FIXED INCOME FUND
FUND PERFORMANCE
--------------------------------------------------------------------------------
The bar chart shows how the Fund's performance has varied from year-to-year over
the periods shown. This information may help illustrate the risks of investing
in the Fund. As with all mutual funds, past performance (before and after taxes)
does not guarantee future performance.
CALENDAR YEAR TOTAL RETURN*
2001 7.73%
2002 6.69%
2003 4.16%
2004 4.84%
2005 1.61%
2006 6.65%
2007 4.43%
2008 (1.48%)
Best quarter: 9/01 4.17%
Worst quarter: 9/08 (4.89)%
The following table indicates how the Fund's average annual returns for
different calendar periods compared to the returns of a broad-based securities
market index. All figures assume reinvestment of dividends and distributions. It
is not possible to invest in an index.
AVERAGE ANNUAL TOTAL RETURN*
(For the periods ended December 31, 2008)
Since
1 Year 5 Years Inception(a)
------- ------- ------------
Aston/TCH Fixed Income Fund:(b)
Return Before Taxes (1.48)% 3.17% 4.84%
Return After Taxes on Distributions (3.34)% 1.29% 2.78%
Return After Taxes on Distributions
and Sale of Fund Shares (0.95)% 1.61% 2.91%
----- ---- ----
Barclays Capital U.S. Aggregate Bond
Index(c) 5.24% 4.65% 6.22%
----- ---- ----
(a)Inception of Class I shares: July 31, 2000. Index data computed from July 31,
2000.
(b)Performance reflects expense limitations that were in effect during one or
more of the periods presented. If expense limitations had not been in place, the
Fund's performance would have been reduced.
(c)Reflects no deduction for taxes, expenses or fees.
* Taplin, Canida & Habacht, LLC became the subadviser as of December 1, 2006.
Performance prior to that date reflects the performance of a previous investment
adviser.
After-tax returns are calculated using the highest historical marginal
individual federal income tax rates and do not reflect the impact of state and
local taxes. In some instances, the "Return After Taxes on Distributions and
Sale of Fund Shares" may be greater than "Return Before Taxes" because the
investor is assumed to be able to use the capital loss of the sale of Fund
shares to offset other taxable capital gains. After-tax returns depend on an
investor's tax situation and may differ from those shown. After-tax returns
shown are not relevant to investors who hold their shares through tax-deferred
arrangements, such as 401(k) plans or individual retirement accounts.
22
Fund Expenses
--------------------------------------------------------------------------------
As an investor in the Funds, you pay certain indirect fees and expenses, which
are described in the table below.
SHAREHOLDER FEES
As a benefit of investing in Class I shares of Aston Funds, you do not incur any
sales loads or exchange fees and generally no redemption fees. HOWEVER, A
REDEMPTION FEE OF 2.00% OF THE AMOUNT REDEEMED IS CHARGED ON CERTAIN REDEMPTIONS
WITHIN 90 DAYS OF PURCHASE TO SHAREHOLDERS OF ASTON/FORTIS REAL ESTATE FUND,
ASTON/NEPTUNE INTERNATIONAL FUND AND ASTON/BARINGS INTERNATIONAL FUND UNLESS AN
EXCEPTION IS AVAILABLE. See "Redemption Fees" in the "Shareholder Information"
Section later in this prospectus for more details.
ANNUAL FUND OPERATING EXPENSES
Operating expenses are the normal costs of operating any mutual fund. These
expenses are not charged directly to investors. They are paid from a Fund's
assets and are expressed as an expense ratio, which is a percentage of average
daily net assets.
ACQUIRED
FUND FEES TOTAL NET
MANAGEMENT OTHER AND EXPENSE FEE EXPENSE
FUND(A) FEES EXPENSES EXPENSES RATIO WAIVERS RATIO
Montag & Caldwell Growth 0.69% 0.14% --% 0.83% --% 0.83%
Aston/Veredus Select Growth 0.80 0.29 0.02 1.11(d)(e) (0.04) 1.07(b)(e)
Aston Growth 0.70 0.19 -- 0.89(e) -- 0.89(e)(f)
Aston Value 0.80 0.13 -- 0.93 -- 0.93(g)
Aston/River Road Dividend All Cap Value 0.70 0.40 0.06 1.16(d)(e) (0.05) 1.11(b)(e)
Aston/Optimum Mid Cap 0.73 0.18 -- 0.91 -- 0.91
Aston/River Road Small-Mid Cap 1.00 0.28(c) 0.02 1.30(d)(e) (0.03) 1.27(b)(e)
Aston/Veredus Aggressive Growth 1.00 0.30 0.01 1.31(d)(e) (0.06) 1.25(b)(e)
Aston/TAMRO Small Cap 0.90 0.17 0.02 1.09(d)(e) -- 1.09(e)
Aston/River Road Small Cap Value 0.90 0.30 0.02 1.22(d)(e) -- 1.22(e)
Aston/Neptune International 1.00 1.55(c) 0.03 2.58(d)(e) (1.53) 1.05(b)(e)
Aston/Barings International 1.00 2.34(c) 0.02 3.36(d)(e) (2.19) 1.27(b)(e)(g)
Aston/Fortis Real Estate 1.00 0.32 -- 1.32 (0.20) 1.12(b)
Montag & Caldwell Balanced 0.75 0.74 0.01 1.50(d)(e) -- 1.50(e)(g)
Aston/TCH Fixed Income 0.55 0.26 0.02 0.83(d)(e) (0.32) 0.51(b)(e)
(a)All Funds except Aston/Barings International Fund, Montag & Caldwell Growth
Fund and Aston Growth Fund offer two classes of shares that invest in the same
portfolio of securities. Aston/Barings International Fund offers one class of
shares and Montag & Caldwell Growth Fund and Aston Growth Fund offer three
classes of shares. Shareholders of Class I shares are not subject to a 12b-1
distribution plan; shareholders of Class N and R shares are subject to a 12b-1
distribution plan; therefore, expenses and performance figures will vary between
the classes. The information set forth in the table above and the example below
relates only to Class I shares, which are offered in this prospectus. Class N
and R shares are offered in separate prospectuses.
(b)Aston is contractually obligated to waive management fees and/or reimburse
ordinary operating expenses through February 28, 2010 at the rates shown in the
table, not including fees and expenses from investments in other investment
companies (acquired fund fees and expenses). As shown in the table, expenses
would be higher without such agreement. For a period of three years subsequent
to the commencement of operations of the Aston/River Road Small-Mid Cap Fund,
the Aston/Neptune International Fund and the Aston/Barings International Fund,
Aston is entitled to be reimbursed by each Fund for previously waived fees and
reimbursed expenses to the extent that each Fund's expense ratio, not including
acquired fund fees and expenses, remains below the operating expense cap after
such reimbursement.
(c)Other expenses have been restated to reflect the effect of offering costs in
the current year's expense ratio.
(d)Total expenses are the sum of a Fund's direct annual operating expenses and
the Fund's indirect fees and expenses from investments in other investment
companies (acquired fund fees and expenses).
(e)The expense ratio may not equal a Fund's ratio of expenses to average net
assets before reimbursement and/or waiver of expenses by the Adviser in the
"Financial Highlights" Section, which reflects the operating expenses of the
Funds including interest expenses and does not include fees and expenses from
investments in other investment companies (acquired funds fees and expenses).
(f)The expense ratio does not include interest expense incurred by the Aston
Growth Fund from utilizing a line of credit. If interest expense was included,
the net expense ratio for the Fund would be 0.90%.
23
Fund Expenses (continued)
--------------------------------------------------------------------------------
(g)The Adviser has voluntarily waived management fees and/or reimbursed expenses
for the following Funds:
VOLUNTARY
EXPENSE
EFFECTIVE DATE LIMITATION
-------------- ----------
Montag & Caldwell Balanced 11/01/2006 1.10%
Aston/Barings International 3/31/2008 1.15%
Aston Value 3/01/2009 0.82%
These voluntary waivers do not include fees and expenses from investments in
other investment companies (acquired funds fees and expenses) or interest
expense. The Adviser may terminate such voluntary waivers/reimbursements at any
time.
EXAMPLE
This hypothetical example shows the operating expenses you would incur as a
shareholder if you invested $10,000 in a Fund over the time periods shown and
you redeem all your shares at the end of the period. The example assumes you
reinvested all dividends and distributions, that the average annual return was
5%, that operating expenses remained the same and expenses were capped for one
year in each period, if applicable. The example is for comparison purposes only
and does not represent a Fund's actual or future expenses and returns.
FUND 1 YEAR 3 YEARS 5 YEARS 10 YEARS
Montag & Caldwell Growth $ 85 $265 $ 460 $1,025
Aston/Veredus Select Growth 109 349 608 1,348
Aston Growth 91 284 493 1,096
Aston Value 95 296 515 1,143
Aston/River Road Dividend All Cap Value 113 364 633 1,405
Aston/Optimum Mid Cap 93 290 504 1,120
Aston/River Road Small-Mid Cap 129 409 710 1,565
Aston/Veredus Aggressive Growth 127 409 712 1,574
Aston/TAMRO Small Cap 111 347 601 1,329
Aston/River Road Small Cap Value 124 387 670 1,477
Aston/Neptune International 107 657 1,233 2,800
Aston/Barings International Fund 129 838 1,570 3,507
Aston/Fortis Real Estate 114 399 704 1,573
Montag & Caldwell Balanced 153 474 818 1,791
Aston/TCH Fixed Income 52 233 429 996
24
Additional Information Regarding Investment Strategies
--------------------------------------------------------------------------------
The investment policies of Aston/River Road Dividend All Cap Value Fund,
Aston/Optimum Mid Cap Fund, Aston/River Road Small-Mid Cap Fund, Aston/TAMRO
Small Cap Fund, Aston/River Road Small Cap Value Fund, Aston/Fortis Real Estate
Fund, Aston/Neptune International Fund, Aston/Barings International Fund and
Aston/TCH Fixed Income Fund, relating to the type of securities in which 80% of
each Fund's assets must be invested may be changed by the Board of Trustees
without shareholder approval. Shareholders will, however, receive at least 60
days notice of such changes.
In addition to the principal investment strategies described in the Fund
Summaries, there may be times when the Funds use secondary investment strategies
in seeking to achieve their investment objectives. Information regarding such
secondary strategies, as well as additional information regarding certain
principal strategies, is shown below.
DEPOSITARY RECEIPTS OF FOREIGN SECURITIES
A Fund may invest in foreign securities in the form of depositary receipts
and/or securities traded directly on U.S. exchanges. Depositary receipts
represent ownership of securities in foreign companies and are held in banks and
trust companies. They can include ADRs which are traded on U.S. exchanges and
are U.S. dollar-denominated, EDRs, which are traded on European exchanges and
may not be denominated in the same currency as the security they represent, and
GDRs, which are issued globally and evidence a similar ownership arrangement.
Although ADRs, EDRs and GDRs do not eliminate the risks inherent in investing in
the securities of foreign issuers, which include market, political, currency and
regulatory risk, by investing in ADRs, EDRs or GDRs rather than directly in
securities of foreign issuers, a Fund may avoid currency risks during the
settlement period for purchases or sales. In general, there is a large, liquid
market in the United States for many ADRs. The information available for ADRs is
subject to the accounting, auditing and financial reporting standards of the
domestic market or exchange on which they are traded, in which standards are
more uniform and more exacting than those to which many foreign issuers may be
subject. A Fund may invest in ADRs sponsored or unsponsored by the issuer of the
underlying security. In the case of an unsponsored ADR, a Fund may bear higher
expenses and encounter greater difficulty in receiving shareholder
communications than they would have with a sponsored ADR.
ASSET-BACKED SECURITIES
Asset-backed securities are payable from pools of obligations other than
mortgages. Most asset-backed securities involve consumer or commercial debts
with maturities of less than ten years. However, almost any type of fixed income
assets (including other fixed income securities) may be used to create an asset-
backed security. Asset-backed securities may take the form of notes or pass
through certificates. Asset-backed securities have prepayment risks.
BELOW INVESTMENT GRADE (HIGH YIELD) SECURITIES
Below investment grade (high yield) securities are lower rated, higher yielding
securities issued by corporations. They are generally rated below investment-
grade (i.e., Ba1/BB+ and below) by national bond rating agencies or, if unrated,
are judged by the adviser or a subadviser to be of equivalent quality. They are
considered speculative and are sometimes called "junk bonds."
CMOS
CMOs are fixed income securities secured by mortgage loans and other mortgage-
backed securities. CMOs carry general fixed income securities risks and risks
associated with mortgage-backed securities.
COMMERCIAL PAPER
Commercial paper are short-term fixed income securities issued by banks,
corporations and other borrowers. There is the risk that the issuer of the
commercial paper will not be able to make principal and/or interest payments.
Commercial paper may include securities issued in reliance on the private
placement exemption under Section 4(2) of the Securities Act of 1933, as
amended. Section 4(2) paper is generally sold to an institutional investor, such
as a Fund, that agrees that it is purchasing the paper for investment and not
with a view to public distribution. Any resale of Section 4(2) commercial paper
must similarly be in an exempt transaction.
CONVERTIBLE SECURITIES
Convertible securities are fixed income or equity securities that pay interest
or dividends and that may be exchanged on certain terms into common stock of the
same corporation.
Because of the conversion feature, the market value of convertible securities
tends to move together with the market value of the underlying stock. The value
of convertible securities is also affected by prevailing interest rates, the
credit quality of the issuer and any call provisions. There is the risk that the
issuer of the security will not be able to make principal and/or interest
payments as well as the risk that the holder of the security may not take
advantage of the convertible features in the appropriate time frame.
CORPORATE DEBT SECURITIES
Corporate debt securities are fixed income securities issued by businesses.
Notes, bonds, debentures and commercial paper are the most prevalent types of
corporate debt securities. A Fund may also purchase interests in bank loans made
to companies.
25
Additional Information Regarding Investment Strategies (continued)
--------------------------------------------------------------------------------
The credit risks of corporate debt securities vary widely among issuers.
In addition, the credit risk of an issuer's debt security may vary based on its
priority for repayment. For example, higher ranking (senior) debt securities
have a higher priority than lower ranking (subordinated) securities. This means
that the issuer might not make payments on subordinated securities while
continuing to make payments on senior securities. In addition, in the event of
bankruptcy, holders of senior securities may receive amounts otherwise payable
to the holders of subordinated securities.
Some subordinated securities, such as trust preferred and capital securities
notes, also permit the issuer to defer payments under certain circumstances. For
example, insurance companies issue securities known as surplus notes that permit
the insurance company to defer any payment that would reduce its capital below
regulatory requirements.
DEBENTURES
Debentures are bonds or promissory notes that are secured by the general credit
of the issuer, but not secured by specific assets of the issuer. There is the
risk that the issuer of the security will not be able to make principal and/or
interest payments.
DEFENSIVE STRATEGY
There may be times when a Fund takes temporary positions that may not achieve
its investment objective or follow its principal investment strategies for
defensive reasons. This includes investing all or a portion of its total assets
in cash or cash equivalents, such as money market securities and repurchase
agreements. Although a Fund would do this in seeking to avoid losses, following
a defensive strategy could reduce the benefit from any market upswings.
DERIVATIVES
The Funds may engage in derivatives primarily for hedging purposes, to maintain
liquidity or in anticipation of changes in portfolio composition. Derivatives
have a return tied to a formula based upon an interest rate, index, price of a
security, or other measurement. Derivatives include options, futures, forward
contracts, swaps and related products.
Hedging involves using derivatives to offset a potential loss in one position by
establishing an interest in an opposite position. Any loss generated by the
derivative should be offset by gains in the hedged investment. While hedging can
reduce or eliminate losses, it can also reduce or eliminate gains. A Fund may
realize a loss if interest rates, security prices or indices move in the
opposite direction than the portfolio manager anticipates.
Derivatives will only be used when consistent with the objectives and strategy
of a Fund. The portfolio manager(s) will ensure that the effective market
exposure resulting from the use of derivatives will not exceed the total amount
available for investment within a Fund (i.e., the use of derivatives will not
result in a Fund being leveraged). All derivative positions will be covered by
that Fund's existing assets. The portfolio manager(s) will place a limit on the
derivative exposure as a proportion of assets.
EQUITY SECURITIES
Equity securities represent a share of an issuer's earnings and assets, after
the issuer pays its liabilities. A Fund cannot predict the income it will
receive from equity securities because issuers generally have discretion as to
the payment of any dividends or distributions. However, equity securities offer
greater potential for appreciation than many other types of securities, because
their value may increase with the value of the issuer's business. Types of
equity securities include common stocks, preferred stocks, warrants and rights,
convertible securities and other securities that represent underlying local
shares, such as depositary receipts.
ETFS
A Fund may invest in ETFs, which are shares of other investment companies. An
ETF is an investment company that seeks to track the performance of an index by
holding in its portfolio shares of all the companies, or a representative sample
of the companies, that are components of a particular index. ETFs are traded on
a securities exchange based on their market value. When a Fund invests in
another investment company, shareholders of the Fund bear their proportionate
share of the other investment company's fees and expenses, including operating,
registration, trustee, licensing and marketing, as well as their share of the
Funds' fees and expenses. A Fund may not purchase more than 3% of an ETF's
outstanding shares unless the ETF and/or the Fund has received an order for an
exemptive relief from such limitations from the Securities and Exchange
Commission ("SEC") and the ETF and the Fund take appropriate steps to comply
with any conditions in such order.
FIXED INCOME SECURITIES
Fixed income securities pay interest, dividends or distributions at a specified
rate. The rate may be a fixed percentage of the principal or adjusted
periodically. In addition, the issuer of a fixed income security must repay the
principal amount of the security, normally within a specified time. Fixed income
securities provide more regular income than equity securities. However, the
returns on fixed income securities are limited and normally do not increase with
the issuer's earnings. This limits the potential appreciation of fixed income
securities as compared to equity securities.
A security's yield measures the annual income earned on a security as a
percentage of its price. A security's yield will increase or decrease depending
upon whether it costs less (a
26
Additional Information Regarding Investment Strategies (continued)
--------------------------------------------------------------------------------
discount) or more (a premium) than the principal amount. If the issuer may
redeem the security before its scheduled maturity, the price and yield on a
discount or premium security may change based upon the probability of an early
redemption. Securities with higher risks generally have higher yields. The
Equity Funds may invest in fixed income securities to offset the volatility of
the stock market. Fixed income securities provide a stable flow of income for a
Fund.
FOREIGN SECURITIES
Foreign securities are securities issued by corporations, governments and other
issuers located outside the United States. Foreign securities are subject to
additional risks.
MORTGAGE-BACKED SECURITIES
Mortgage-backed securities represent interests in pools of mortgages. The
mortgages that comprise a pool normally have similar interest rates, maturities
and other terms. Mortgages may have fixed or adjustable interest rates.
Interests in pools of adjustable rate mortgages are known as ARMs.
Mortgage backed securities come in a variety of forms. Many have extremely
complicated terms. The simplest form of mortgage backed securities are pass-
through certificates. An issuer of pass-through certificates gathers monthly
payments from an underlying pool of mortgages. Then, the issuer deducts its fees
and expenses and passes the balance of the payments onto the certificate holders
once a month. Holders of pass-through certificates receive a pro rata share of
all payments and pre-payments from the underlying mortgages. As a result, the
holders assume all the prepayment risks of the underlying mortgages.
OTHER INVESTMENT COMPANIES
The Funds may invest in securities of other investment companies, including
ETFs, open-end funds and closed-end funds. An ETF is an investment company that
seeks to track the performance of an index by holding in its portfolio shares of
all the companies, or a representative sample of the companies, that are
components of a particular index. Closed-end funds are investment companies that
typically issue a fixed number of shares that trade on a securities exchange or
over-the-counter. The risks of investment in other investment companies
typically reflect the risk of the types of securities in which the funds invest.
Investments in ETFs and closed-end funds are subject to the additional risk that
shares of the fund may trade at a premium or discount to their net asset value
per share. When a Fund invests in another investment company, shareholders of
the Fund bear their proportionate share of the other investment company's fees
and expenses as well as their share of the Fund's fees and expenses.
PREFERRED STOCKS
Preferred stocks are stocks that pay dividends at a specified rate. Dividends
are paid on preferred stocks before they are paid on common stocks. In addition,
preferred stockholders have priority over common stockholders as to the proceeds
from the liquidation of a company's assets, but are subordinate to the claims of
all creditors.
PTPS
A Fund may invest in equity securities of PTPs that are taxed as partnerships
for federal income tax purposes. These include master limited partnerships and
certain other partnerships that meet conditions contained in the Internal
Revenue Code of 1986, as amended (the "Code"). In order to be treated as a
partnership for federal income tax purposes, a PTP must generally derive a
substantial amount of its income and capital gains from certain sources,
including from the exploration, development, mining or production, processing,
refining, transportation or marketing of minerals or natural resources. Other
PTPs may be treated as partnerships for federal income tax purposes if certain
other limited exceptions under the Code apply. PTPs are typically organized as
either limited partnerships or limited liability companies and are listed and
traded on a U.S. securities exchange.
REITS
REITs are generally publicly traded entities that invest in office buildings,
apartment complexes, industrial facilities, shopping centers and other
commercial spaces. REITs are pooled investment vehicles that typically invest
directly in real estate, in mortgages and loans collateralized by real estate,
or in a combination of the two. "Equity" REITs invest primarily in real estate
that produces income from rentals. "Mortgage" REITs invest primarily in
mortgages and derive their income from interest payments. REITs usually
specialize in a particular type of property and may concentrate their
investments in particular geographical areas. REITs issue stocks and most REIT
stocks trade on the major stock exchanges or over-the-counter.
REPURCHASE AGREEMENTS
Repurchase agreements, or repos, are transactions in which a security (usually a
government security) is purchased with a simultaneous commitment to sell it back
to the seller (a commercial bank or recognized securities dealer) at an agreed
upon price on an agreed upon date, usually the next day. If the seller of the
underlying security under the repurchase agreement should default on its
obligation to repurchase the underlying security, a Fund may experience delay or
difficulty in exercising its right to realize upon the security. Additionally, a
Fund may incur a loss if the value of the security should decline, as well as
any disposition costs in liquidating the security.
ROYALTY INCOME TRUSTS
A Fund may invest in royalty income trusts. Royalty income trusts can be
organized in a variety of ways in the U.S., Canada and other countries.
Beneficial units in royalty and income trusts generally represent a profits
interest in the production of oil or other minerals.
27
Additional Information Regarding Investment Strategies (continued)
--------------------------------------------------------------------------------
RULE 144A SECURITIES
Rule 144A securities are restricted securities that can be sold to qualified
institutional buyers under the Securities Act of 1933, as amended. Investing in
Rule 144A securities may increase the illiquidity of a Fund's investments in the
event that an adequate trading market does not exist for these securities. To
the extent there is an adequate trading market for lower-rated securities, Rule
144A securities generally are not subject to an increase in illiquidity.
U.S. GOVERNMENT SECURITIES
These are fixed income obligations of the U.S. government and its various
agencies. U.S. government securities issued by the U.S. Treasury (bills, notes
and bonds) are backed by the full faith and credit of the federal government.
Some government securities not issued by the U.S. Treasury also carry the
government's full faith and credit backing on principal or interest payments.
Some securities are backed by the issuer's right to borrow from the U.S.
Treasury and some are backed only by the credit of the issuing organization. All
government securities are considered highly creditworthy. This guarantee,
however, does not extend to the market price for such securities which can
fluctuate.
28
Additional Information Regarding Investment Strategies (continued)
--------------------------------------------------------------------------------
OTHER INVESTMENT STRATEGIES
--------------------------------------------------------------------------------
Commercial
Paper
Below and
Investment Securities
Depositary Asset/- Grade of
Receipts Mortage (High Other Convert- Corporate
of Foreign Backed Yield) Investment ible Debt
Fund Securities Securities Securities Cmos Companies Securities Securities
Montag & Caldwell
Growth X X XP X
Aston/Veredus
Select Growth X X X
Aston Growth X X XP X
Aston Value X X X
Aston/River Road
Dividend All
Cap Value X X XP
Aston/Optimum Mid
Cap X X XP X
Aston/River Road
Small-Mid Cap X X X
Aston/Veredus
Aggressive
Growth X X X
Aston/TAMRO Small
Cap X X X X
Aston/River Road
Small Cap Value X X X
Aston/Neptune
International X X X
Aston/Barings
International X X X
Aston/Fortis Real
Estate X X
Montag & Caldwell
Balanced X XP X X XP XP
Aston/TCH Fixed
Income XP X X X X XP
Deriva-
tives
(e.g.,
Options,
Forwards, Fixed
Defensive Futures, Equity Income Foreign Preferred
Fund Debentures Strategy Swaps) Securities Securities Securities Stocks
Montag & Caldwell
Growth X X X XP X X X
Aston/Veredus
Select Growth X X X XP X X
Aston Growth X X X XP X X X
Aston Value X X XP X X
Aston/River Road
Dividend All
Cap Value X X XP X X X
Aston/Optimum Mid
Cap X X X XP X X XP
Aston/River Road
Small-Mid Cap X X XP X X
Aston/Veredus
Aggressive
Growth X X X XP X X
Aston/TAMRO Small
Cap X XP X X
Aston/River Road
Small Cap Value X X XP X X
Aston/Neptune
International X X XP XP X
Aston/Barings
International X X XP XP X
Aston/Fortis Real
Estate X X XP XP X
Montag & Caldwell
Balanced X X X XP XP X X
Aston/TCH Fixed
Income XP X X XP X
Royalty Rule U.S.
Repurchase Income 144A Government
Fund PTPS REIT Agreements Trusts Securities Securities
Montag & Caldwell
Growth X X X
Aston/Veredus
Select Growth X X X
Aston Growth X X X
Aston Value X X X X
Aston/River Road
Dividend All
Cap Value X XP X X X X
Aston/Optimum Mid
Cap X X X
Aston/River Road
Small-Mid Cap X X X X
Aston/Veredus
Aggressive
Growth X X X
Aston/TAMRO Small
Cap X X X X
Aston/River Road
Small Cap Value X X X X
Aston/Neptune
International X X X
Aston/Barings
International X X X
Aston/Fortis Real
Estate XP X X X
Montag & Caldwell
Balanced X X XP
Aston/TCH Fixed
Income X X XP
X = Investment strategy applicable to a Fund.
P = Components of a Fund's principal investment strategy.
Portfolio Holdings
--------------------------------------------------------------------------------
A description of the policies and procedures with respect to the disclosure of
each Fund's portfolio holdings is available in the SAI and on our Web site at
www.astonfunds.com.
29
Investment Terms
--------------------------------------------------------------------------------
The following is a list of terms with definitions that you may find helpful as
you read this prospectus.
AMERICAN DEPOSITARY RECEIPTS (ADRS). ADRs represent ownership of securities in
foreign stock and are issued by U.S. banks and trust companies. ADRs are
denominated in U.S. dollars and are traded on a U.S. exchange.
BANK DEPOSITS. Cash, checks or drafts deposited in a financial institution for
credit to a customer's account. Banks differentiate between demand deposits
(checking accounts on which the customer may draw) and time deposits, which pay
interest and have a specified maturity or require 30 days notice before
withdrawal.
BARCLAYS CAPITAL U.S. AGGREGATE BOND INDEX. An unmanaged index representing
more than 5,000 taxable government, investment-grade corporate and mortgage-
backed securities.
BARCLAYS CAPITAL U.S. GOVERNMENT/CREDIT BOND INDEX. An unmanaged index that
includes U.S. Government and investment-grade corporate securities with at least
one year to maturity.
BOTTOM-UP INVESTING. An investing approach in which securities are researched
and chosen individually with less consideration given to economic or market
cycles.
COLLATERALIZED MORTGAGE OBLIGATIONS (CMOS). CMOs are fixed income securities
secured by mortgage loans and other mortgage-backed securities.
CONVEXITY. Convexity is a measure of how the duration of a bond changes as
interest rates change. The greater the convexity of a bond, the greater the
exposure of interest rate risk to the portfolio.
CORPORATE BONDS. Fixed income securities issued by corporations.
DERIVATIVE. A security where price is dependent upon or derived from one or more
underlying assets. The derivative itself is merely a contract between two or
more parties.
DIVERSIFICATION. The practice of investing in a broad range of securities to
reduce risk.
DURATION. A calculation of the average life of a bond (or portfolio of bonds)
that is a useful measure of a bond's price sensitivity to interest rate changes.
The higher the duration number, the greater the risk and reward potential of the
bond.
EAFE COUNTRIES. Countries located in Europe, Australasia and the Far East.
EMERGING MARKETS. Countries whose economy and securities markets are considered
by the World Bank to be emerging or developing. Emerging market countries may be
located in such regions as Asia, Latin America, the Middle East, Southern
Europe, Eastern Europe and Africa.
EUROPEAN DEPOSITARY RECEIPTS (EDRS). EDRs represent ownership of securities in
foreign stock and are issued by a foreign bank. EDRs are generally denominated
in foreign currencies and may not be denominated in the same currency as the
securities they represent. Generally, EDRs are designed for use in the foreign
securities markets.
EXCHANGE-TRADED FUND (ETF). An ETF is an investment company that seeks to track
the performance of an index by holding in its portfolio either the contents of
the index or a representative sample of the securities in the index.
EXPENSE RATIO. A fund's cost of doing business, expressed as a percentage of its
net assets and disclosed in a prospectus.
GLOBAL DEPOSITARY RECEIPTS (GDRS). GDRs represent ownership of securities in
foreign stock and are issued by a foreign bank. GDRs are generally denominated
in foreign currencies and may not be denominated in the same currency as the
securities they represent. Generally, GDRs are designed for use in the foreign
securities markets.
GROWTH STYLE INVESTING. An investing approach that involves buying stocks of
companies that are generally industry leaders with above-average, sustainable
growth rates. Typically, growth stocks are the stocks of the fastest growing
companies in the most rapidly growing sectors of the economy. Growth stock
valuation levels (e.g., price-to-earnings ratio) will generally be higher than
value stocks.
INVESTMENT OBJECTIVE. The goal that an investor and a mutual fund seek together.
Examples include current income, total return, long-term capital appreciation,
etc.
ISSUER. The company, municipality or government agency that issues a security,
such as a stock, bond or money market security.
LARGE-CAP STOCKS. Stocks issued by large companies. Unless otherwise defined by
a portfolio manager, subadviser or the adviser, a large-cap company is defined
as one with a market capitalization of $5 billion or more. Typically, large-cap
companies are established, well-known companies; some may be multinationals.
LIMITED PARTNERSHIPS. A business organization with one or more general partners
who manage the business and are personally liable for the partnership's debts,
and one or more limited partners who are liable only to the extent of their
investment in the partnership.
MANAGEMENT FEE. The amount that a mutual fund pays to the investment adviser for
its services.
MARKET CAPITALIZATION. Value of a corporation or other entity as determined by
the market price of its securities.
30
Investment Terms (continued)
--------------------------------------------------------------------------------
MID-CAP STOCKS. Stocks issued by mid-sized companies. Unless otherwise defined
by a portfolio manager, subadviser or the adviser, a mid-cap company is defined
as one with a market capitalization between $1.5 billion and $5 billion, which
is similar to the range of the Standard & Poor's MidCap 400 Index (S&P 400).
MONEY MARKET SECURITIES. Short-term fixed income securities of federal and local
governments, banks and corporations.
MSCI EAFE AND EMERGING MARKETS INDEX. The Morgan Stanley Capital International
("MSCI") Europe, Australasia and Far East ("EAFE") and Emerging Markets Index,
is designed to measure market performance in the global developed and emerging
markets, excluding the U.S. and Canada.
MSCI U.S. REIT INDEX. An unmanaged index that tracks the returns of REITs.
MULTI-CAP STRATEGY. A multi-cap strategy invests in the equity securities of
issuers of any market capitalization, and generally will hold securities of
issuers representing a range of sizes.
MUTUAL FUND. An investment company that stands ready to buy back its shares at
their current net asset value. Most mutual funds continuously offer new shares
to investors.
NET ASSET VALUE (NAV). The per share value of a mutual fund, found by
subtracting the fund's liabilities from its assets and dividing by the number of
shares outstanding. Mutual funds calculate their NAVs at least once a day.
PUBLICLY TRADED PARTNERSHIPS (PTPS). PTPs are limited partnerships that also
have interests traded in the equity securities market.
REAL ESTATE INVESTMENT TRUSTS (REITS). REITs are pooled investment vehicles that
typically invest directly in real estate, in mortgages and loans collateralized
by real estate, or in a combination of the two.
RISK/REWARD TRADE-OFF. The principle that an investment must offer higher
potential returns as compensation for the likelihood of increased volatility.
RUSSELL 1000 GROWTH INDEX. An unmanaged index measuring the performance of those
Russell 1000 companies with higher price-to-book ratios and higher forecasted
growth values.
RUSSELL 1000 VALUE INDEX. An unmanaged index comprised of securities in the
Russell 1000 Index. Companies in this index tend to exhibit lower price-to-book
ratios and lower cost-to-growth values.
RUSSELL 2000 INDEX. An unmanaged index that contains the 2,000 smallest common
stocks in the Russell 3000 Index (which contains the 3,000 largest stocks in the
U.S. based on total market capitalization).
RUSSELL 2000 GROWTH INDEX. An unmanaged index comprised of securities in the
Russell 2000 Index with a greater than average growth orientation. Companies in
this index tend to exhibit higher price-to-book and price-earnings ratios.
RUSSELL 2500 VALUE INDEX. An unmanaged index comprised of the 2,500 smallest
companies (measured by market capitalization) in the Russell 3000 Index. The
Russell 2500 Value Index measures the performance of those Russell 2500
companies with lower price-to-book ratios and lower forecasted growth.
RUSSELL 3000 INDEX. An unmanaged index that contains the 3,000 largest U.S.
companies based on total market capitalization.
RUSSELL 3000 VALUE INDEX. An unmanaged index that measures the performance of
those Russell 3000 companies with lower price-to-book ratios and lower
forecasted growth.
SMALL-CAP STOCKS. Stocks issued by smaller companies. Unless otherwise defined
by a portfolio manager, subadviser or the adviser, a small-cap company is
defined as one with a market capitalization of less than $1.5 billion, which
approximates the size of the largest company in the Russell 2000 Index.
STANDARD & POOR'S (S&P) 500 INDEX. An unmanaged index of 500 widely traded
industrial, transportation, financial and public utility stocks.
S&P MIDCAP 400 INDEX. An unmanaged market-value weighted index that consists of
400 domestic stocks chosen for market size, liquidity, and industry group
representation.
TOP-DOWN INVESTING. An investing approach in which securities are chosen by
looking at the industry or sector level based on market trends and/or economic
forecasts.
TOTAL RETURN. A measure of a fund's performance that encompasses all elements of
return: dividends, capital gains distributions and changes in net asset value.
Total return is the change in value of an investment over a given period,
assuming investment of dividends and capital gains distributions, expressed as a
percentage of the initial investment.
VALUE STYLE INVESTING. An investing approach that involves buying stocks that
are out of favor and/or undervalued compared to their peers. Generally, value
stock valuation levels are lower than growth stock valuation levels.
YANKEE BONDS. Dollar-denominated bonds issued in the U.S. by foreign banks and
corporations.
YIELD. A measure of net income (dividends and interest) earned by the securities
in a fund's portfolio, less a fund's expenses, during a specified period. A
fund's yield is expressed as a
31
Investment Terms (continued)
--------------------------------------------------------------------------------
percentage of the maximum offering price per share on a specified day.
ZERO-COUPON BONDS. Debt securities that do not pay interest at regular intervals
and are issued at a discount from face value. The discount approximates the
total amount of interest the bond will accrue from the date of issuance to
maturity.
32
Management of the Funds
--------------------------------------------------------------------------------
THE INVESTMENT ADVISER
--------------------------------------------------------------------------------
ASTON ASSET MANAGEMENT LLC
Aston Asset Management LLC, 120 N. LaSalle Street, 25th Floor, Chicago, Illinois
60602, is the investment adviser to the Funds. Aston, a majority-owned
subsidiary of Highbury Financial Inc., was formed for the purpose of acquiring
the mutual fund and separately managed account business of ABN AMRO Asset
Management, Inc. and its affiliates ("ABN AMRO"). More information on Highbury
Financial Inc. is available in the SAI. Aston was formed in April 2006 and as of
December 31, 2008, Aston had approximately $3.4 billion in assets under
management.
Aston provides investment advisory, mutual fund administration and distribution-
related services to the Aston Funds. Aston manages each Fund by selecting one or
more other investment managers to manage the Fund's portfolio on a sub-advisory
basis. Aston is responsible for identifying and selecting the Fund's investment
managers, monitoring the performance of such managers, and terminating managers.
Aston and the Aston Funds have received from the SEC an exemptive order that
allows Aston to allocate and reallocate the assets of the Funds between and
among any subadvisers so selected pursuant to a "manager of managers" structure.
Under this structure, Aston has the authority to retain and terminate
subadvisers, engage new subadvisers and make material revisions to the terms of
the subadvisory agreements subject to the approval of the Board of Trustees, but
not shareholder approval.
GENERAL
As the investment adviser to the Funds, Aston is paid an annual management fee
based on the average daily net assets of a Fund. Out of its fee, Aston pays the
subadviser(s) of each Fund. The table, later in this "Management of the Funds"
Section, shows the management fees paid by each Fund to Aston for the most
recent fiscal year.
The investment advisory agreement with Aston may be terminated at any time by
the Fund or Aston upon 60 days written notice to the other party. A Fund may
effect termination by an action of the Board of Trustees or by a vote of a
majority of the Fund's outstanding voting securities.
A discussion regarding the basis for the Board of Trustees approval of the
Funds' investment advisory agreements and subadvisory agreements (as applicable)
will be included in the Funds' next annual or semiannual report to shareholders
following such approval.
THE SUBADVISERS
--------------------------------------------------------------------------------
The accompanying information highlights each Fund's subadviser and its portfolio
manager(s). Additional information about the portfolio managers' compensation,
other accounts managed by the portfolio managers and the portfolio managers'
ownership of securities in the Funds is available in the SAI.
MONTAG & CALDWELL GROWTH FUND
MONTAG & CALDWELL BALANCED FUND
ASTON GROWTH FUND
Montag & Caldwell, Inc. ("Montag & Caldwell"), 3455 Peachtree Road NE, Suite
1200, Atlanta, Georgia 30326, was founded in 1945. Montag & Caldwell is a
wholly-owned direct subsidiary of Fortis Bank SA/NV ("Fortis Bank"). Since
October 2008, the Belgian government has owned substantially all of the
outstanding capital and voting rights of Fortis Bank pending a sale to a private
buyer. Fortis Bank and its affiliates subsequently announced a transaction in
which BNP Paribas SA would acquire approximately 75% of the outstanding capital
and voting rights of Fortis Bank. The BNP Paribas transaction is subject to
legal challenges and numerous closing conditions, and remains pending as of the
date of this prospectus. As of December 31, 2008, Montag & Caldwell managed
approximately $10.4 billion in assets.
ASTON/FORTIS REAL ESTATE FUND
Fortis Investment Management USA, Inc. ("FIM"), is located at 75 State Street
Boston, Massachusetts 02109. FIM is a wholly owned indirect subsidiary of Fortis
Bank. Since October 2008, the Belgian government has owned substantially all of
the outstanding capital and voting rights of Fortis Bank pending a sale to a
private buyer. Fortis Bank and its affiliates subsequently announced a
transaction in which BNP Paribas SA would acquire approximately 75% of the
outstanding capital and voting rights of Fortis Bank. The BNP Paribas
transaction is subject to legal challenges and numerous closing conditions, and
remains pending as of the date of this prospectus. As of December 31, 2008, FIM
managed approximately $21.8 billion in assets, consisting primarily of
institutional accounts, including insurance, pension and profit sharing trusts.
ASTON/VEREDUS SELECT GROWTH FUND
ASTON/VEREDUS AGGRESSIVE GROWTH FUND
Veredus Asset Management LLC ("Veredus"), 6060 Dutchmans Lane, Louisville,
Kentucky 40205, was founded in 1998. As of December 2008, B. Anthony Weber is
currently the majority shareholder of the firm. As of December 31, 2008, Veredus
managed approximately $450 million in assets.
ASTON/TAMRO SMALL CAP FUND
TAMRO Capital Partners, LLC ("TAMRO"), is located at 1660 Duke Street,
Alexandria, Virginia 22314 and was founded in 2000. TAMRO is majority-owned by
the principles of the firm. As of December 31, 2008, TAMRO managed approximately
$670.5 million in assets.
33
Management of the Funds (continued)
--------------------------------------------------------------------------------
ASTON/RIVER ROAD DIVIDEND ALL CAP VALUE FUND
ASTON/RIVER ROAD SMALL-MID CAP FUND
ASTON/RIVER ROAD SMALL CAP VALUE FUND
River Road Asset Management, LLC ("River Road") Meidinger Tower, Suite 1600,
462 South Fourth Street, Louisville, Kentucky 40202, was founded in 2005. River
Road is a wholly-owned subsidiary of River Road Partners, LLC ("RRP") which is
majority- owned by employees of River Road. As of December 31, 2008, River Road
managed approximately $2.6 billion in assets.
ASTON/OPTIMUM MID CAP FUND
Optimum Investment Advisors, LLC ("Optimum") is located at 100 South Wacker
Drive, Suite 2100, Chicago, Illinois 60606. Optimum is majority-owned by Optimum
Investment Group, LLC. As of December 31, 2008, Optimum managed more than $1.2
billion in assets for investment companies, institutional and high net-worth
clients.
ASTON VALUE FUND
MFS Institutional Advisors Inc. ("MFSI"), 500 Boylston Street, Boston,
Massachusetts 02116, is a wholly-owned subsidiary of Massachusetts Financial
Services Company ("MFS"). MFS, a Delaware corporation, is a subsidiary of Sun
Life of Canada (U.S.) Financial Services Holdings, Inc., which in turn is an
indirect majority-owned subsidiary of Sun Life Financial Inc. (a diversified
financial services company). Net assets under the management of the MFS
organization were approximately $128 billion as of December 31, 2008.
ASTON/TCH FIXED INCOME FUND
Taplin, Canida & Habacht, LLC ("Taplin"), 1001 Brickell Bay Drive, Suite 2100,
Miami, Florida 33131, was founded in 1985 and as of December 31, 2008 had
approximately $7.3 billion in assets under management. As of November 2008,
Taplin is a majority-owned subsidiary of Marshall & IIsley Corporation. Taplin
provides investment management services to investment companies, high net worth
individuals and institutional accounts.
ASTON/NEPTUNE INTERNATIONAL FUND
Neptune Investment Management Limited ("Neptune"), 1 Hammersmith Grove, London
W6 ONB, was founded in May 2002. Robin Geffen is the majority shareholder of the
firm. As of December 31, 2008, Neptune managed approximately $3.9 billion in
assets under management outside of the United States. Except for the Fund,
Neptune had not previously managed U.S. mutual funds.
ASTON/BARINGS INTERNATIONAL FUND
Barings International Investment Limited, 155 Bishopsgate, London, EC2M 3XY,
United Kingdom, the Subadviser, is a subsidiary of Baring Asset Management
Limited (together with its subsidiaries and Baring Asset Management, Inc.
constitute the "Barings Group"). As of December 31, 2008, Barings Group managed
approximately $32.4 billion in assets, in institutional accounts and mutual
funds.
34
Management of the Funds (continued)
--------------------------------------------------------------------------------
PORTFOLIO MANAGERS
--------------------------------------------------------------------------------
Portfolio
FUND NAME Manager(s) Investment Experience
--------------------------------------------------------------------------------------
MONTAG & CALDWELL GROWTH FUND
MONTAG & CALDWELL BALANCED FUND
Ronald E. Canakaris, CFA, CIC Portfolio Manager since the Funds' inceptions
in 1994; Chairman, Chief Executive Officer and
Chief Investment Officer of Montag & Caldwell.
He has been with the firm since 1972 and is
responsible for developing the firm's
investment process. He has a BS and BA from the
University of Florida.
ASTON GROWTH FUND
Ronald E. Canakaris, CFA, CIC Portfolio Manager of the Fund since January
2008. Please see above.
ASTON/FORTIS REAL ESTATE FUND
Joseph Pavnica Co-Portfolio Manager since October 2005. Mr.
Pavnica joined the property team of FIM and its
predecessors in March 2001 and was employed by
its predecessor firm from 1997-2001. During his
tenure, Mr. Pavnica has been responsible for
analyzing and providing investment
recommendations for various property sectors
including: retail, multi-family, hotels,
industrial, and self-storage. Mr. Pavnica
received his BS in Accounting from St. Joseph's
College and his MBA from Indiana University
Northwest.
James Hardman Co-Portfolio Manager since January 2009. Mr.
Hardman joined FIM and its predecessors and/or
affiliates in April 2005 as an investment
analyst. During his tenure, Mr. Hardman has
been responsible for analyzing and providing
recommendations for the diversified,
healthcare, industrial, lodging, office, self
storage, and net lease sectors. From May 2000
to April 2005, Mr. Hardman worked as an
investment and strategy analyst for Security
Capital Research & Management. While there Mr.
Hardman conducted detailed valuation analysis,
performed fundamental research, and designed
and implemented portfolio management tools. Mr.
Hardman was a real estate consultant for Ernst
& Young Real Estate Advisory Group from May
1998 to April 2000, where he developed
strategic solutions for various real estate
firms. Mr. Hardman has a BS degree in
Accounting and Finance from Indiana University.
ASTON/VEREDUS AGGRESSIVE GROWTH FUND
B. Anthony Weber Portfolio Manager since the Fund's inception in
1998; President and Chief Investment Officer of
Veredus. He is responsible for the day-to-day
management of the Fund. Mr. Weber was President
and Senior Portfolio Manager of SMC Capital,
Inc. from 1993-1998. He has over 25 years of
investment management experience. He received a
BA from Centre College of Kentucky.
Charles F. Mercer, Jr., CFA Portfolio Manager of the Fund since January
2009; Mr. Mercer is Executive Vice President
and founding partner of Veredus. Mr. Mercer was
the Director of Research from 1998 to 2003.
Prior experience includes research analyst at
SMC Capital, Inc. and a trader at Suntrust Bank
from 1996 to 1998. Mr. Mercer has a BA from
Vanderbilt University.
Michael E. Johnson, CFA Portfolio Manager of the Fund and Vice
President of Veredus since January 2009. Mr.
Johnson joined Veredus in March of 2000 as a
research analyst. From August 2003 through
December 2008, he was the Director of Research.
Previously he was a portfolio manager at Stock
Yards Bank and Trust from 1997 to 2000.
Additionally, Mr. Johnson has prior experience
at Charles Schwab. He received a BS in Finance
from Ball State University.
ASTON/VEREDUS SELECT GROWTH FUND
B. Anthony Weber Portfolio Manager of the Fund since September
21, 2002. Please see above.
Charles F. Mercer, Jr., CFA Portfolio Manager of the Fund since the Fund's
inception in December 2001. Please see above.
Michael E. Johnson, CFA Portfolio Manager of the Fund since January
2009. Please see above.
35
Management of the Funds (continued)
--------------------------------------------------------------------------------
PORTFOLIO
FUND NAME MANAGER(S) INVESTMENT EXPERIENCE
--------------------------------------------------------------------------------------
ASTON/TAMRO SMALL CAP FUND
Philip D. Tasho, CFA Portfolio Manager since the Fund's inception in
November 2000; President and Chief Investment
Officer of TAMRO. He is responsible for the
day-to-day management of the Fund. Most
recently, Mr. Tasho served as Chief Executive
Officer and Chief Investment Officer of Riggs
Investment Management Corp. (RIMCO), from 1995
to 2000. He began his investment management
career in 1980. He received his MBA from George
Washington University.
ASTON/RIVER ROAD SMALL-MID CAP FUND
ASTON/RIVER ROAD SMALL CAP VALUE FUND
James C. Shircliff, CFA Portfolio Manager since the Funds' inception
and CEO and Chief Investment Officer of River
Road. Mr. Shircliff was formerly employed as
Portfolio Manager and Director of Research for
Commonwealth SMC (SMC Capital, Inc.) from 1998-
2005. Additionally, Mr. Shircliff has served
as Special Situations Analyst and Fund Manager
for Oppenheimer Management and Partner and
Director of Research for Southeastern Asset
Management. Mr. Shircliff has more than 30
years of investment management experience. He
received his BS from the University of
Louisville and holds the Chartered Financial
Analyst designation.
R. Andrew Beck Portfolio Manager since the Funds' inception
and President of River Road. Mr. Beck was
formerly employed as Senior Vice President and
Portfolio Manager for Commonwealth SMC (SMC
Capital, Inc.) from 1999-2005. Mr. Beck
received his BS from the University of
Louisville and his MBA from Babson College.
Henry W. Sanders, III, CFA Portfolio Manager since the Funds' inception
and Executive Vice President of River Road.
Mr. Sanders was formerly employed as Senior
Vice President and Portfolio Manager for
Commonwealth SMC from 2002-2005. Additionally,
Mr. Sanders has served as President for Bridges
Capital Management and Vice President for
PRIMCO Capital Management. He received his BS
from Bellarmine University, his MBA from Boston
College and holds the Chartered Financial
Analyst designation.
ASTON/RIVER ROAD DIVIDEND ALL CAP
VALUE FUND
James C. Shircliff, CFA Portfolio Manager since the Fund's inception.
Please see above.
Henry W. Sanders, III, CFA Portfolio Manager since the Fund's inception.
Please see above.
Thomas S. Forsha, CFA Portfolio Manager of the Fund since June 2007
and Vice President of River Road. Mr. Forsha
was formerly employed by ABN AMRO from 1998-
2005, where he served as Equity Analyst and
Portfolio Manager and was responsible for
management of the North America equity
allocation of the firm's Global High Income
Equity Fund. He received his BS in Finance from
The Ohio State University's Fisher College of
Business and his MBA from The University of
Chicago's Graduate School of Business in 2006.
Mr. Forsha is a member of the CFA Institute and
the CFA Society of Louisville.
36
Management of the Funds (continued)
--------------------------------------------------------------------------------
PORTFOLIO
FUND NAME MANAGER(S) INVESTMENT EXPERIENCE
--------------------------------------------------------------------------------------
ASTON/OPTIMUM MID CAP FUND
Thyra E. Zerhusen Portfolio Manager of the Fund since May 1999;
Ms. Zerhusen joined the investment team of
Optimum in October 2003. From April 1999 to
September 2003 she was on the investment team
of Talon Asset Management and from 1993 to 1999
she was Senior Vice President and Principal at
the Burridge Group. She has a Diplom Ingenieur
from the Swiss Federal Institute of Technology
and an MA in Economics from the University of
Illinois.
Marie L. Lorden Co-Portfolio Manager of the Fund since March
2009; Ms. Lorden joined Optimum in September of
2003. Ms. Lorden is responsible for research
and analysis of existing and potential
holdings, as well as mutual fund, institutional
relationship, and portfolio management.
Previously, Ms. Lorden held positions
specializing in equity product analysis with
Zurich Insurance Group, Driehaus Capital
Management, and The Burridge Group where she
was responsible for equity maintenance research
and institutional client relationships. Prior
to joining Optimum, Ms. Lorden was a Project
Manager at Radio Free Europe in Prague, Czech
Republic. Ms. Lorden received her BS from
EImhurst College in 1982 and her MBA from the
Keller Graduate School of Management.
Mary L. Pierson Co-Portfolio Manager of the Fund since March
2009; Ms. Pierson joined Optimum in May of
2004. Ms. Pierson is responsible for research
and analysis of existing and potential
holdings, as well as mutual fund, institutional
relationship, and portfolio management. Her
prior experience includes 15 years with Harris
Bancorp and Harris Futures Corporation. While
general manager at Harris Futures Corporation,
she was responsible for managing all aspects of
the institution, which operated as a financial
futures broker. In prior positions at Harris,
Ms. Pierson conducted in-depth international
economic research and analysis of foreign
exchange exposure issues, along with currency
trends and foreign political conditions related
to investments. Ms. Pierson received her BA in
Economics from DePauw University, her MA in
Economics from Northwestern University and her
MBA in Finance from The University of Chicago.
37
Management of the Funds (continued)
--------------------------------------------------------------------------------
PORTFOLIO
FUND NAME MANAGER(S) INVESTMENT EXPERIENCE
--------------------------------------------------------------------------------------
ASTON VALUE FUND
Nevin P. Chitkara Portfolio Manager of the Fund as of May 2006;
Vice President for MFSI. Mr. Chitkara joined
the Subadviser in 1997 as an equity research
analyst. He holds an MBA from the MIT Sloan
School of Management and a BS in Business
Administration from Boston University.
Steven R. Gorham, CFA Portfolio Manager of the Fund since January
2002; Senior Vice President for the Subadviser.
Mr. Gorham joined the Subadviser in 1989 and
became an equity research analyst in 1992. From
1995 and 2000, he worked as an international
analyst. He holds an MBA from Boston College
and a BS from the University of New Hampshire.
Brooks A. Taylor Portfolio Manager of the Fund since March 2008.
Investment Officer of the Subadviser. Mr.
Taylor joined MFSI in 1996 as an equity
research analyst and was named portfolio
manager in 2000. He holds an MBA from the
University of Pennsylvania and a BA from Yale
University.
Jonathan W. Sage, CFA Portfolio Manager of the Fund since March 2008.
Investment Officer of the Subadviser. Mr. Sage
joined MFSI in 2000 as a quantitative equity
research analyst and was named portfolio
manager in 2005. He holds a BA from Tufts
University.
ASTON/TCH FIXED INCOME FUND
Tere Alvarez Canida, CFA Co-Portfolio Manager of the Fund since December
1, 2006 and President and Managing Principal of
Taplin. Ms. Canida has over 28 years of
investment experience. She previously served as
Vice President and Senior Investment Officer of
Southeast Bank. She received her BS from
Georgetown University in 1975, and her MBA from
The George Washington University in 1976. She
became a Chartered Financial Analyst in 1983.
Alan M. Habacht Co-Portfolio Manager of the Fund since December
1, 2006 and Principal of Taplin. Mr. Habacht
has over 37 years of investment experience.
Before joining Taplin, he served as Senior Vice
President and portfolio manager for INVESCO
Capital Management. He also served as a
security analyst for Weiss, Peck & Greer,
Alliance Capital Management, and Bache &
Company. He received his BA in Finance from
Boston University in 1968.
William J. Canida, CFA Co-Portfolio Manager of the Fund since December
1, 2006 and Principal of Taplin. Mr. Canida has
over 30 years of investment experience. Prior
to joining Taplin, he served as Vice President
and Senior Investment Officer for Harris Trust
Company of Florida. He also was Vice President
and Treasurer of AmeriFirst Florida Trust
Company and Southeast Bank. Mr. Canida received
his BA in 1973 and his MBA in 1975, both from
Indiana University. He has also attended the
National Graduate Trust School of Northwestern
University, and became a Chartered Financial
Analyst in 1982.
38
Management of the Funds (continued)
--------------------------------------------------------------------------------
PORTFOLIO
FUND NAME MANAGER(S) INVESTMENT EXPERIENCE
--------------------------------------------------------------------------------------
ASTON/NEPTUNE INTERNATIONAL FUND
Robin Geffen Portfolio Manager since the Fund's inception.
Mr. Geffen has also served as Managing Director
and Chief Investment Officer of Neptune since
the firm's inception in May 2002. Prior to
launching Neptune, Mr. Geffen was the CIO and
most recently Global CIO-Pensions at Orbitex,
managing a number of funds. Mr. Geffen, a
graduate of Keble College, Oxford, began his
investment career in 1979.
ASTON/BARINGS INTERNATIONAL FUND
David Bertocchi, CFA Portfolio Manager of the Fund since April 2008,
Mr. Bertocchi joined Barings Asset Management
in 2000 and was appointed Divisional Director
in 2004. With over ten years of investment
experience, Mr. Bertocchi is responsible for
international equity focused on EAFE markets
and global portfolios. Previously, he managed
the Baring Global Equity Unit Trust and the
Global Institutional Funds. He is a past member
of Barings European and UK equity teams. Mr.
Bertocchi holds an MBA from London Business
School and a Bachelor of Science in Mechanical
Engineering from the University of Calgary
(Canada).
Additional information about the portfolio managers' compensation, other
accounts managed by the portfolio manager and the portfolio managers' ownership
of securities in the Funds is available in the SAI.
39
Management of the Funds (continued)
--------------------------------------------------------------------------------
MANAGEMENT FEE PAID FOR
FUND NAME MANAGEMENT FEE FISCAL YEAR ENDED 10/31/08
(as a percentage of net assets) (as a percentage of net assets)
Montag & Caldwell Growth Fund First $800 million 0.80%
Over $800 million 0.60% 0.69%
Aston/Veredus Select Growth Fund 0.80% 0.76%(a)
Aston Growth Fund 0.70% 0.69%
Aston Value Fund 0.80% 0.64%(a)
Aston/River Road Dividend All Cap Value 0.70% 0.65%(a)
Aston/Optimum Mid Cap Fund First $100 million 0.80%
Next $300 million 0.75%
Over $400 million 0.70% 0.73%
Aston/River Road Small-Mid Cap Fund 1.00% 0.94%(a)
Aston/Veredus Aggressive Growth Fund 1.00% 0.94%(a)
Aston/TAMRO Small Cap Fund 0.90% 0.88%(a)
Aston/River Road Small Cap Value Fund 0.90% 0.90%
Aston/Neptune International Fund 1.00% 0.00%(a)
Aston/Barings International Fund 1.00% 0.00%(a)
Aston/Fortis Real Estate Fund 1.00% 0.80%(a)
Montag & Caldwell Balanced Fund 0.75% 0.36%(a)
Aston/TCH Fixed Income Fund 0.55% 0.14%(a)
(a)Taking into account fee waivers then in effect.
40
Management of the Funds (continued)
--------------------------------------------------------------------------------
RELATED PERFORMANCE
--------------------------------------------------------------------------------
ASTON/BARINGS INTERNATIONAL FUND
The following is a composite of international equity accounts managed by Baring
Asset Management. As of December 31, 2008, the composite was composed of 5
accounts and assets of $293 million, which represents all separately managed
accounts following the international equity strategy. The investment objective,
policies and strategies of Aston/Barings International Fund are substantially
similar to those of the accounts comprising the composite.
TOTAL RETURN
MSCI EAFE
Year End Composite(a) Index(a)
-------- ------------ ----------
2008 (40.01)% (43.38)%
2007 20.31% 11.17%
2006 31.29% 26.34%
2005 14.32% 13.54%
2004 22.69% 20.25%
2003 38.91% 38.59%
2002 (12.96)% (15.94)%
2001 (25.97)% (21.44)%
2000 (22.50)% (14.17)%
1999 35.27% 26.97%
AVERAGE ANNUAL TOTAL RETURN
(For the periods ended December 31, 2008)
MSCI EAFE
Composite(a) Index(a)
------------ ---------
One Year (40.01)% (43.38)%
Three Year (1.78)% (7.35)%
Five Year 5.86% 1.66%
Ten Year 2.23% 0.80%
(a)The MSCI EAFE Index reflects the total return of securities comprising the
index, including changes in the market prices as well as accrued investment
income, which is presumed to be reinvested. Performance figures for the index do
not reflect the deduction of transaction costs or expenses, including management
fees.
The performance of the composite does not represent the historical performance
of the Aston/Barings International Fund and should not be considered indicative
of future performance of the Fund. Results may differ because of, among other
things, differences in brokerage commissions, account expenses including
management fees, the size of positions taken in relation to account size,
diversification of securities, timing of purchases and sales, and availability
of cash for new investment. Composite results are shown net of management fees
of accounts comprising the composite. If the Fund's fees and expenses had been
used in calculating the composite's performance, the performance of the
composite would have been lower. In addition, the accounts comprising the
composite are not subject to certain investment limitations, diversification
requirements and other restrictions imposed by the Investment Company Act of
1940, as amended, and the Internal Revenue Code of 1986, as amended, which if
applicable, may have adversely affected the performance results of the
composite. The results for different products may vary.
41
Shareholder Information
--------------------------------------------------------------------------------
OPENING AN ACCOUNT
--------------------------------------------------------------------------------
- Read this prospectus carefully.
- Determine how much you want to invest. The minimum initial investment
requirements for Class I shares of each Fund are as follows:
o Montag & Caldwell Growth Fund: $5 million
o Aston/Veredus Select Growth Fund: $2 million
o Aston Growth Fund: $5 million
o Aston Value Fund: $2 million
o Aston/River Road Dividend All Cap Value Fund: $1 million
o Aston/Optimum Mid Cap Fund: $2 million
o Aston/River Road Small-Mid Cap Fund: $1 million
o Aston/Veredus Aggressive Growth Fund: $2 million
o Aston/TAMRO Small Cap Fund: $2 million
o Aston/River Road Small Cap Value Fund Fund: $1 million
o Aston/Neptune International Fund: $1 million
o Aston/Barings International Fund: $1 million
o Aston/Fortis Real Estate Fund: $2 million
o Montag & Caldwell Balanced Fund: $1 million
o Aston/TCH Fixed Income Fund: $2 million
- Balances within the same Fund can be aggregated to meet the minimum
initial investment requirements for the accounts of:
o clients of a financial consultant
o immediate family members (i.e., a person's spouse, parents,
children, siblings and in-laws)
o a corporation or other legal entity
- Minimum initial investment requirements may be waived:
o for Trustees of the Trust and employees of the Adviser, its
affiliates, and the Subadvisers, as well as their spouses.
o with a "letter of intent" explaining how the investor/financial
consultant would purchase shares over a Board-approved specified
period of time to meet the minimum investment requirement.
o The Trust reserves the right to waive a Fund's minimum initial
investment requirement for any reason.
- Purchase, exchange and redemption requests received and processed before
the New York Stock Exchange ("NYSE") market close, typically 4:00 p.m.
Eastern Time ("ET"), receive that business day's closing NAV. Trades
received after that time receive the following business day's NAV.
- Complete the account application and carefully follow the instructions. If
you have any questions, please call 800 992-8151. Remember to complete the
"Purchase, Exchange and Redemption Authorization" section of the account
application to establish your account privileges and to avoid any delay
and inconvenience of requesting these in writing at a later date.
- Make your initial investment using the following table as a guideline.
- All account openings and subsequent investment requests must be in "good
order."
BUY, EXCHANGE AND SELL REQUESTS ARE IN "GOOD ORDER" WHEN
- The account number and Fund name are included.
- The amount of the transaction is specified in dollars or shares.
- Signatures of all owners appear exactly as they are registered on the
account in original form, as photocopies are not acceptable.
- Any required Medallion Signature Guarantees are included.
- Other supporting legal documents (as necessary) are present, including
such "Requirements For Written Requests" as described later in this
"Shareholder Information" Section.
42
Shareholder Information (continued)
--------------------------------------------------------------------------------
TO ADD TO AN ACCOUNT
BUYING SHARES TO OPEN AN ACCOUNT (NO MINIMUM FOR SUBSEQUENT INVESTMENTS)
---------------------------------------------------------------------------------------
THROUGH YOUR - Your financial - Your financial representative is
FINANCIAL representative is responsible for transmitting the order
REPRESENTATIVE responsible for promptly.
transmitting the
order promptly.
BY MAIL - Complete and sign - Return the investment slip from a
your application. statement with your check in the envelope
ASTON FUNDS provided and mail to us at the address at
P.O. BOX 9765 - Make your check the left.
PROVIDENCE, RI payable to Aston
02940 Funds and mail to - We accept checks, bank drafts, money
us at the address orders, wires and ACH for purchases (see
OR at the left. "Other Features" later in this
"Shareholder Information" Section). Checks
OVERNIGHT DELIVERY - We accept checks, must be drawn on U.S. banks. There is a
bank drafts, money minimum $20 charge for returned checks.
ASTON FUNDS orders, wires and
101 SABIN STREET ACH for purchases. - Give the following wire/ACH information to
PAWTUCKET, RI 02860 Checks must be your bank:
drawn on U.S. PNC Bank
banks to avoid any ABA #031-000-053
fees or delays in For: Aston Funds
processing. A/C 8611758079
FBO "Aston Fund Number" "Your Account
- We do not accept Number"
travelers,
temporary, post- - Include your name, account number,
dated, credit card taxpayer identification number or social
courtesy, second security number, address and the Fund(s)
or third party you wish to purchase in the wire
checks (which are instructions.
checks made
payable to someone - We do not accept travelers, temporary,
other than the post-dated, credit card courtesy, second
Funds, including or third party checks (which are checks
you). made payable to someone other than the
Funds, including you).
- For your protection, our current Internet
capabilities allow you to check balances
and transfer monies only between Aston
Funds. Please contact us via mail with a
signed letter of instruction for all other
changes to your account.
BY PHONE - Obtain a Fund and - Verify that your bank or credit union is a
account number by member of the ACH.
800 992-8151 calling Aston
Funds at the - To place your request with an Investor
number at the Services Associate, call between 9 a.m.
left. and 7 p.m. ET, Monday - Friday.
- Instruct your bank - You should complete the "Bank Account
(who may charge a Information" section of your account
fee) to wire or application.
ACH the amount of
your investment. - When you are ready to add to your account,
call Aston Funds and tell the
- Give the following representative the Fund name, account
wire/ACH number, the name(s) in which the account
information to is registered and the amount of your
your bank: investment.
PNC Bank - Instruct your bank (who may charge a fee)
ABA #031-000-053 to wire or ACH the amount of your
For: Aston Fund investment.
A/C 8611758079
FBO "Aston Fund - Give the following wire/ACH information to
Number" "Your your bank:
Account Number" PNC Bank
ABA #031-000-053
- Return your For: Aston Funds
completed and A/C 8611758079
signed application FBO "Aston Fund Number" "Your Account
to: Number"
Aston Funds - Include your name, account number,
P.O. Box 9765 taxpayer identification number or social
Providence, RI security number, address and the Fund(s)
02940 you wish to purchase in the wire
instructions.
43
Shareholder Information (continued)
--------------------------------------------------------------------------------
TO ADD TO AN ACCOUNT
BUYING SHARES TO OPEN AN ACCOUNT (NO MINIMUM FOR SUBSEQUENT INVESTMENTS)
---------------------------------------------------------------------------------------
BY INTERNET - Download the - Verify that your bank or credit union is a
appropriate member of the ACH.
WWW.ASTONFUNDS.COM account
application(s) - Complete the "Purchase, Exchange and
from our Web site. Redemption Authorization" section of your
account application.
- Complete and sign
the - Self-register for online account access at
application(s). www.astonfunds.com. Your social security
Make your check number or employer identification number,
payable to Aston account number and other security
Funds and mail it validating information will be required
to the address for registration.
under "By Mail"
above. - When you are ready to add to your account,
access your account through Aston Funds'
Web site and enter your purchase
instructions in the highly secure area for
shareholders only called "Account Access."
ACH purchases on the Internet may take 3
to 4 business days.
Other funds in the Aston family of funds and share classes of Aston Funds are
available through separate prospectuses. Please call 800 992-8151 for more
information.
EXCHANGING SHARES
--------------------------------------------------------------------------------
After you have opened an account with us, you can exchange your shares within
Aston Funds to meet your changing investment goals or other needs. This
privilege is not designed for frequent trading (which may subject you to a
redemption fee) and may be difficult to implement in times of drastic market
changes.
You can exchange shares from one Aston Fund to another within the same class of
shares. (For example, from Aston Growth Fund Class I shares to Aston Value Fund
Class I shares.) All exchanges to open new fund accounts must meet the minimum
initial investment requirements. Exchanges may be made by mail, through the
Internet or by phone at 800 992-8151 if you chose this option when you opened
your account. For federal income tax purposes, each exchange into a different
fund is treated as a sale and a new purchase. As a result, an investor holding
shares in a non-tax deferred account is subject to federal income tax on any
appreciation on the shares exchanged.
Aston Funds reserves the right to limit, impose charges upon, terminate or
otherwise modify the exchange privilege by sending written notice to
shareholders. All exchange requests must be in "good order."
HOW DOES AN EXCHANGE TAKE PLACE?
When you exchange your shares, you authorize the sale of your shares in one fund
to purchase shares of another fund. In other words, you are requesting a sale
and then a purchase. The exchange of your shares may be a taxable event for
federal income tax purposes if the shares are not held in a tax deferred account
and may subject you to a redemption fee.
44
Shareholder Information (continued)
--------------------------------------------------------------------------------
SELLING/REDEEMING SHARES
--------------------------------------------------------------------------------
Once you have opened an account with us, you can sell your shares to meet your
changing investment goals or other needs. All redemption requests must be in
"good order." The following table shows guidelines for selling shares.
SELLING SHARES DESIGNED FOR... TO SELL SOME OR ALL OF YOUR SHARES...
--------------------------------------------------------------------------------------
THROUGH YOUR - Accounts of any - Your financial representative is responsible
FINANCIAL type for transmitting the order promptly.
REPRESENTATIVE
BY MAIL - Accounts of any - Write and sign a letter of instruction
type indicating the Fund name, Fund number, your
ASTON FUNDS account number, the name(s) in which the
P.O. BOX 9765 - Sales or account is registered and the dollar value
PROVIDENCE, RI redemptions of any or number of shares you wish to sell.
02940 size (For
redemptions over - Include all signatures and any additional
OR $50,000, please documents that may be required (see "Selling
see Medallion Shares in Writing" on the next page).
OVERNIGHT Signature Signatures must be in original form, as
DELIVERY Guarantee on the photocopies are not accepted.
next page)
ASTON FUNDS - Mail to us at the address at the left.
101 SABIN STREET
PAWTUCKET, RI - A check will be mailed to the name(s) and
02860 address in which the account is registered.
If you would like the check mailed to a
different address, you must write a letter
of instruction and have it Medallion
Signature Guaranteed.
- Proceeds may also be sent by wire or ACH
(see "Other Features" later in this
"Shareholder Information" Section).
BY PHONE - Non-retirement - For automated service 24 hours a day using
accounts your touch-tone phone, call us at the number
800 992-8151 to the left.
- Sales of up to
$50,000 (for - To place your request with an Investor
accounts with Services Associate, call between 9 a.m. and
telephone account 7 p.m. ET, Monday - Friday.
privileges)
- A check will be mailed to the name(s) and
address in which the account is registered.
If you would like the check mailed to a
different address, you must write a letter
of instruction and have it Medallion
Signature Guaranteed.
- Proceeds may also be sent by wire or ACH
(see "Other Features" later in this
"Shareholder Information" Section).
- The Funds reserve the right to refuse any
telephone sales request and may modify the
procedures at any time. The Funds make
reasonable attempts to verify that telephone
instructions are genuine, but you are
responsible for any loss that you may incur
from telephone requests.
45
Shareholder Information (continued)
--------------------------------------------------------------------------------
SELLING SHARES DESIGNED FOR... TO SELL SOME OR ALL OF YOUR SHARES...
--------------------------------------------------------------------------------------
BY INTERNET - Non-retirement - Complete the "Purchase, Exchange and
accounts Redemption Authorization" section of your
WWW.ASTONFUNDS.- COM account application.
- Self-register for an online account at
www.astonfunds.com. Your social security
number or employer identification number,
account number and other security validating
information will be required for
registration.
- When you are ready to redeem a portion of
your account, access your account through
Aston Funds' Web site and enter your
redemption instructions in the highly secure
area for shareholders only called "Account
Access." A check for the proceeds will be
mailed to you at your address of record.
- Proceeds may also be sent by wire or ACH
(see "Other Features" later in this
"Shareholder Information" Section).
SELLING SHARES IN WRITING
In certain circumstances, you must make your request to sell shares in writing.
You may need to include a Medallion Signature Guarantee (which protects you
against fraudulent orders) and additional items with your request, as shown in
the table below. WE REQUIRE MEDALLION SIGNATURE GUARANTEES IF:
- your address of record has changed within the past 30 days
- you are selling more than $50,000 worth of shares (except for Montag &
Caldwell Growth Fund and Montag & Caldwell Balanced Fund)
- you are requesting payment other than by a check mailed to the address of
record and payable to the registered owner(s) or other than wire or ACH
sent to the bank account of the registered owner(s)
WHAT IS A MEDALLION SIGNATURE GUARANTEE?
A Medallion Signature Guarantee verifies the authenticity of your signature and
may be obtained from a domestic bank or trust company, broker, dealer, clearing
agency, savings association or other financial institution which is
participating in a Medallion Program recognized by the Securities Transfer
Association.
Medallion Signature Guarantees help ensure that major transactions or changes to
your account are in fact authorized by you. For example, we require a Medallion
Signature Guarantee on written redemption requests for more than $50,000. The
three recognized medallion programs are Securities Transfer Agents Medallion
Program (STAMP), Stock Exchanges Medallion Program (SEMP) and New York Stock
Exchange, Inc. Medallion Signature Program (NYSE MSP). Signature guarantees from
financial institutions which are not participating in one of these programs will
not be accepted.
A NOTARY PUBLIC STAMP OR SEAL CANNOT BE SUBSTITUTED FOR A MEDALLION SIGNATURE
GUARANTEE.
46
Shareholder Information (continued)
--------------------------------------------------------------------------------
SELLER REQUIREMENTS FOR WRITTEN REQUESTS
-------------------------------------------------------------------------------------
Owners of individual, - Letter of instruction
joint, sole
proprietorship, - On the letter, the signatures and titles of all persons
UGMA/UTMA, or general authorized to sign for the account, exactly as the account
partner accounts is registered, must be in original form, as photocopies are
not accepted
- MEDALLION SIGNATURE GUARANTEE, if applicable (see previous
page for more details)
Owners of corporate or - Letter of instruction
association accounts
- Corporate resolution certified within the past 12 months
- On the letter, the signatures and titles of all persons
authorized to sign for the account, exactly as the account
is registered, must be in original form, as photocopies are
not accepted
- MEDALLION SIGNATURE GUARANTEE, if applicable (see previous
page for more details)
Owners or trustees of - Letter of instruction
trust accounts
- On the letter, the signature of the trustee(s) must be in
original form, as photocopies are not accepted
- If the names of all trustees are not registered on the
account, a copy of the trust document certified within the
past 12 months
- MEDALLION SIGNATURE GUARANTEE, if applicable (see previous
page for more details)
Joint tenancy - Letter of instruction signed by the surviving tenant must
shareholders whose co- be in original form, as photocopies are not accepted
tenants are deceased
- Certified copy of death certificate
- MEDALLION SIGNATURE GUARANTEE, if applicable (see previous
page for more details)
Executors of - Letter of instruction signed by executor must be in
shareholder estates original form, as photocopies are not accepted
- Certified copy of order appointing executor
- MEDALLION SIGNATURE GUARANTEE, if applicable (see previous
page for more details)
Administrators, - Call 800 992-8151 for instructions
conservators,
guardians and other - MEDALLION SIGNATURE GUARANTEE, if applicable (see previous
sellers or account page for more details)
types not listed above
IRA accounts - IRA distribution request form completed and signed. Call
800 992-8151 for a form, or download a form from our
website at www.astonfunds.com.
In addition to the situations described above, Aston Funds may require Medallion
Signature Guarantees in other circumstances based on the amount of the
redemption request or other factors.
OTHER FEATURES
The following other features are also available to buy and sell shares of the
Funds.
WIRE. To purchase and sell shares via the Federal Reserve Wire System:
- You must authorize Aston Funds to honor wire instructions before using
this feature. Complete the appropriate section on the application when
opening your account or call 800 992-8151 to add the feature after your
account is opened. Call 800 992-8151 before your first use to verify that
this feature is set up on your account.
- To sell shares by wire, you must designate the U.S. commercial bank
account(s) into which you wish the redemption proceeds deposited.
For accounts with existing wire instructions, wire redemptions may be placed
over the phone. Consult your banking institution for any fees they may charge
associated with wire transfers. Any changes made to existing wire instructions
will only be accepted with a Medallion Signature Guaranteed letter of
instruction.
AUTOMATED CLEARING HOUSE (ACH). To transfer money between your bank account and
your Aston Funds account(s):
- You must authorize Aston Funds to honor ACH instructions before using this
feature. Complete the appropriate section on
47
Shareholder Information (continued)
--------------------------------------------------------------------------------
the application when opening your account or call 800 992-8151 to add the
feature after your account is opened. Call 800 992-8151 before your first
use to verify that this feature is set up on your account.
- Most transfers are completed within three business days of your call. ACH
purchases will receive the NAV calculated on the day the money is
received.
- There is no fee to your account for this transaction and generally, no fee
from your bank.
REDEMPTIONS IN KIND
The Funds have elected, under Rule 18f-1 under the Investment Company Act of
1940, as amended, to pay sales proceeds in cash up to $250,000 or 1% of each
Fund's total value during any 90-day period for any one shareholder, whichever
is less.
Larger redemptions may be detrimental to existing shareholders. While we intend
to pay all sales proceeds in cash, we reserve the right to make payments for
larger redemptions to you in the form of certain marketable securities of a
Fund. This is called a "redemption in kind." You may pay certain sales charges
related to a redemption in kind, such as brokerage commissions, when you sell
the securities. For shares that are not held in a tax deferred account,
redemptions in kind are taxable for federal income tax purposes in the same
manner as when sales proceeds are paid in cash.
INVOLUNTARY CONVERSIONS/REDEMPTIONS
To reduce expenses, we may transfer your account to Class N shares of the
respective Fund, if applicable, if its value falls below the minimum initial
investment. Additionally, we may sell your shares and close your fund account(s)
if its value falls below the minimum initial investment as a result of your
transaction activity. Unless you did not meet the minimum initial investment, we
will give you 30 days notice before we convert your shares. This gives you an
opportunity to purchase enough shares to raise the value of your fund position
above the minimum initial investment to avoid transferring your account to a
different class. We will not convert fund positions where there is an approved
"letter of intent." Redemption fees will not be assessed on involuntary
conversions.
TRANSACTION POLICIES
--------------------------------------------------------------------------------
CALCULATING SHARE PRICE
When you buy, exchange or sell shares, the NAV next determined is used to price
your purchase or sale. The NAV for each share class of a Fund is determined each
business day at the close of regular trading on the NYSE (typically 4 p.m. ET)
by dividing the net assets of the class by the number of shares outstanding.
Currently, the Funds observe the following holidays: New Year's Day, Martin
Luther King, Jr. Day, Presidents' Day, Good Friday, Memorial Day, Independence
Day, Labor Day, Thanksgiving Day and Christmas Day. Generally, market quotes are
used to price securities. If market quotations are not available or are deemed
unreliable, securities are valued at fair value as determined by the investment
adviser in accordance with guidelines adopted and periodically reviewed by the
Board of Trustees. These circumstances may arise, for instance, when trading in
a security is suspended, the exchange or market on which a security is traded
closes early, or the trading volume in a security is limited, calling into
question the reliability of market quotations. In such a case, the Fund's value
for a security is likely to be different from the last quoted market price. In
addition, due to the subjective and variable nature of fair value pricing, it is
possible that the fair value determined for a particular security may be
materially different from the value realized upon such security's sale. The
Board of Trustees receives a report of any actions taken under the Funds' fair
valuation procedures.
Quotations of foreign securities denominated in foreign currency are converted
to U.S. dollar equivalents using foreign exchange quotations received from
independent dealers. Events affecting the values of portfolio securities that
occur between the time their prices are determined and the close of regular
trading on the NYSE may not be reflected in the calculation of NAV. If events
materially affecting the value of such securities occur during such period, then
these securities may be valued at fair value as determined by the Investment
Adviser in accordance with guidelines adopted by the Board of Trustees.
Certain Funds may invest in certain securities which are primarily listed on
foreign exchanges that trade on weekends and other days when a Fund does not
price its shares. Therefore the value of a Fund's holdings may change on days
when you will not be able to purchase or redeem its shares.
In addition, changes in values in the U.S. markets subsequent to the close of a
foreign market may affect the values of securities traded in the foreign market.
Under a Fund's fair value pricing policies, the values of foreign securities may
be adjusted from their last closing prices if such movements in the U.S. market
exceed a specified threshold. As a result of the foregoing, it is possible that
fair value prices will be used by a Fund to a significant extent. The Funds have
retained an independent statistical fair value pricing service to assist in the
fair valuation of securities principally traded in a foreign market in order to
adjust for possible changes in value that may occur between the close of the
foreign exchange and the time as of which Fund shares are priced.
EXECUTION OF REQUESTS
Each Fund is open on each business day that the NYSE is open for trading. The
NYSE is not open on weekends or national holidays. Buy, exchange and sell
requests are executed at the NAV next calculated after Aston Funds or an
authorized broker or designee receives your mail, telephone or Internet request
in "good order." Purchase orders and redemption requests must be received by the
close of regular trading on the NYSE (typically
48
Shareholder Information (continued)
--------------------------------------------------------------------------------
4 p.m. ET) for same day processing. On days when the Federal Reserve Cash
Settlement System closes earlier than normal, these times may be accelerated.
Sales proceeds are normally sent the next business day, but are always sent
within seven days of receipt of a request in "good order." Brokers and their
authorized designees are responsible for forwarding purchase orders and
redemption requests to the Funds.
Shares of Aston Funds can also be purchased through broker-dealers, banks and
trust departments that may charge you a transaction or other fee for their
services. These fees are not charged if you purchase shares directly from Aston
Funds.
A Fund may be required to "freeze" your account if there appears to be
suspicious activity or if account information matches information on a
government list of known terrorists or other suspicious persons.
Aston Funds reserves the right to:
- refuse any purchase or exchange of shares if it could adversely affect a
Fund or its operations;
- suspend the offering of Fund shares;
- change the initial and additional investment minimums or to waive these
minimums for any investor;
- delay sending you your sales proceeds for up to 15 days if you purchased
shares by check. A minimum $20 charge will be assessed if any check used
to purchase shares is returned;
- change, withdraw or waive various services, fees and account policies.
CUSTOMER IDENTIFICATION PROGRAM
Federal law requires Aston Funds to obtain, verify and record identifying
information for each investor who opens or reopens an account with Aston Funds.
An investor may be an individual or a person other than an individual (such as a
corporation, partnership or trust). Such identifying information may include the
name, residential or business street address, principal place of business, local
office or other physical location (for a person other than an individual), date
of birth (for an individual), social security or taxpayer identification number
or other identifying information. Applications without the required information,
or without any indication that a social security or taxpayer identification
number has been applied for, may not be accepted. After acceptance, to the
extent permitted by applicable law or its customer identification program, Aston
Funds reserves the right (a) to place limits on transactions in any account
until the identity of the investor is verified; or (b) to refuse an investment
in Aston Funds or to involuntarily redeem an investor's shares and close an
account in the event that an investor's identity is not verified. Aston Funds
and its agents will not be responsible for any loss in an investor's account
resulting from the investor's delay in providing all required identifying
information or from closing an account and redeeming an investor's shares when
an investor's identity cannot be verified.
SHORT-TERM AND EXCESSIVE TRADING
The Funds are designed for long-term investors. Each Fund discourages and does
not knowingly accommodate short-term and excessive trading. Such trading
increases brokerage and administrative costs, may result in increased taxable
gains to remaining shareholders and may disrupt portfolio management. For
example, the Funds may be unable to effectively invest the proceeds from certain
purchase or exchange requests under certain market conditions or may incur
losses on the sale of investments. These risks may be more pronounced for Funds
investing in securities that are more difficult to value or that are susceptible
to pricing arbitrage (e.g., foreign securities, high yield securities and small
cap securities). Thus, such trading may negatively impact a Fund's NAV and
result in dilution to long-term shareholders.
In an effort to protect long-term shareholders, the Funds' Board of Trustees has
adopted policies and procedures which seek to deter short-term trading and
excessive trading and to detect such trading activity at levels that may be
detrimental to the Funds. These policies and procedures include the following:
- Aston/Fortis Real Estate Fund, Aston/Neptune International Fund and
Aston/Barings International Fund have adopted a redemption fee for shares
held less than 90 calendar days;
- The Funds have adopted certain fair valuation practices intended to
protect the Funds from time zone arbitrage with respect to foreign
securities and other trading practices that seek to exploit stale prices;
- The Funds or their agents will not be responsible for any unauthorized
telephone or online order when reasonable procedures designed to verify
the identity of the investor are followed.
- The Funds reserve the right to:
o Reject any purchase, including exchange purchases, that could
adversely affect the Funds or their operations;
o Limit, terminate or otherwise modify the exchange privilege of any
shareholder deemed to be engaged in activities that may be
detrimental to the Funds;
o Reject any purchase, including exchange purchases, from investors if
there appears to be evidence of short-term trading or excessive
trading;
o Permanently prevent future purchases and exchanges from occurring in
accounts where short-term trading or excessive trading is apparent.
o Delay sending redemption proceeds for up to seven days (generally
applies only in cases of very large redemptions, excessive trading,
or during unusual market conditions)
o Suspend redemptions as permitted by law (e.g., emergency situations)
In making the determination to exercise these rights, the Funds may consider an
investor's trading history in the Funds and accounts under common ownership or
control. The Funds seek to employ reasonable measures to detect short-term and
excessive
49
Shareholder Information (continued)
--------------------------------------------------------------------------------
trading at levels that may be detrimental to the Funds. Accordingly, the Funds
use certain materiality and volume thresholds in applying the policies and
procedures, but otherwise seek to apply the policies and procedures uniformly to
all shareholders. With respect to accounts held through intermediaries, such
intermediaries generally are contractually obligated to provide the Funds with
certain shareholder trading information. However, the Funds cannot directly
control activity through all channels and are dependent on intermediaries to
enforce the Funds' policies and procedures. In certain cases, intermediaries may
not be able to implement policies and procedures in the same manner as the Funds
due to system or other constraints or issues. Shareholders who invest through
omnibus accounts may be subject to policies and procedures that differ from
those applied by the Funds to direct shareholders. The Funds reserve the right
to limit an intermediary's future access to the Funds, up to and including
termination of the Selling Agreement held with said intermediary. There is no
assurance that the Funds' policies and procedures will be effective in limiting
and deterring short-term and excessive trading in all circumstances.
REDEMPTION FEES
Aston/Fortis Real Estate Fund, Aston/Neptune International Fund and
Aston/Barings International Fund assess a 2.00% fee on redemptions (including
exchanges) of Fund shares sold or exchanged within 90 calendar days of purchase.
Redemption fees are paid to the respective Fund to help offset transaction costs
and to protect the Fund's long-term shareholders. Each Fund will use the "first-
in, first-out" (FIFO) method to determine the holding period. Under this method,
the date of the redemption or exchange will be compared to the earliest purchase
date of shares held in the account. If this holding period is less than the
required holding period, the fee will be charged.
The Funds will notify intermediaries, such as broker-dealers or plan
administrators, of the Funds' policies and procedures and request the
intermediaries to track and remit redemption fees to the Fund. However, due to
limitations with system capabilities, certain broker-dealers, banks, plan
administrators and other intermediaries may not be able to track and collect
redemption fees at this time or their method for tracking and calculating
redemption fees may differ from those of the Funds. There is no assurance that
the Funds' redemption fee policies and procedures will be effective in limiting
and deterring short-term and excessive trading in all circumstances. Redemption
fees may not be assessed in certain circumstances, including the following:
shares purchased through reinvested distributions; certain distributions
required by law or due to shareholder hardship; redemptions through a Systematic
Withdrawal Plan; redemptions of shares through an Automatic Investment Plan;
accounts held through intermediaries that are unable or unwilling to assess
redemption fees and do not report sufficient information to the Funds to impose
a redemption fee (as discussed above); and circumstances where the Funds'
Administrator believes it to be in the best interest of the Funds and in
accordance with the Funds' policies and procedures to waive the redemption fee
on behalf of the Funds.
ACCOUNT POLICIES AND DIVIDENDS
--------------------------------------------------------------------------------
ACCOUNT STATEMENTS
In general, you will receive quarterly account statements. In addition, you will
also receive account statements:
- after every transaction that affects your account balance (except for
dividend reinvestments, automatic investment plans or systematic
withdrawal plans);
- after any change of name or address of the registered owner(s).
You will also receive an annual statement that describes the federal income tax
characteristics of any dividends and distributions your Fund has paid to the
investor during the year.
Aston Funds may charge a fee for certain services, such as providing historical
account documents.
MAILINGS TO SHAREHOLDERS
To help reduce Fund expenses and environmental waste, Aston Funds combines
mailings for multiple accounts going to a single household by delivering Fund
reports (annual and semi-annual reports, prospectuses, etc.) in a single
envelope. If you do not want us to continue consolidating your Fund mailings and
would prefer to receive separate mailings with multiple copies of Fund reports,
please call one of our Investor Services Associates at 800 992-8151.
DISTRIBUTIONS
The Funds distribute income dividends and net capital gains. Income dividends
represent the earnings from a Fund's investments less its expenses; capital
gains generally occur when a Fund sells a portfolio security for more than the
original purchase price.
DIVIDENDS
The table on the next page shows the Funds' dividend and distribution schedule.
DIVIDEND REINVESTMENTS
Investors may have their dividends and distributions reinvested in additional
shares of a Fund. If you choose this option, or if you do not indicate a choice,
your dividends and distributions will be automatically reinvested on the
dividend payable date. You can also choose to have a check for your dividends
and distributions mailed to you by choosing this option on your account
application.
50
Shareholder Information (continued)
--------------------------------------------------------------------------------
DISTRIBUTION SCHEDULE
FUNDS DIVIDENDS, IF ANY CAPITAL GAINS DISTRIBUTIONS, IF ANY
Equity, International and Sector Funds, (except - Declared and paid - Distributed at least once a year,
Aston/River Road Dividend All Cap Value annually generally in December
Fund and Aston Value Fund)
Balanced Fund and Aston Value Fund - Declared and paid - Distributed at least once a year,
quarterly generally in December
Fixed Income Fund and Aston/River Road - Declared and paid - Distributed at least once a year,
Dividend All Cap Value Fund monthly generally in December
UNCASHED CHECKS
Checks should be cashed upon receipt, as interest will not be paid on uncashed
checks. State escheat laws generally require the Trust to remit uncashed checks
to the appropriate state after a specific period of time.
ADDITIONAL INVESTOR SERVICES
--------------------------------------------------------------------------------
ASTON FUNDS WEB SITE
The Funds maintain a Web site located at www.astonfunds.com. You can purchase,
exchange and redeem shares and access information such as your account balance
and a Funds' NAVs through our Web site. Self-register for an online account at
www.astonfunds.com. Your social security number or employer identification
number, account number and other security validity information will be required
to register. You may also need to have bank account information, wire
instructions, ACH instructions or other options established on your account.
Aston Funds has procedures in place to try to prevent unauthorized access to
your account information. The Funds and their agents will not be responsible for
any losses resulting from unauthorized transactions on our Web site.
COMPENSATION TO INTERMEDIARIES
--------------------------------------------------------------------------------
In addition to distribution and service fees paid by the Funds, the Adviser may
pay compensation to intermediaries that distribute and/or service investors in
the Funds out of its own assets and not as an additional charge to the Funds.
These additional payments, which are sometimes referred to as "revenue sharing,"
may represent a premium over payments made by other fund families, and may
create an added incentive for investment professionals to sell or recommend the
Funds over other funds offered by competing fund families. The revenue sharing
payments may differ for each fund within the Aston family of funds, including
within the same intermediary, and across intermediaries.
In addition, representatives of the distributor may be compensated through
incentive programs of Aston in a manner that favors one Aston Fund or group of
Funds over another Aston Fund.
PORTFOLIO TRANSACTIONS AND BROKERAGE COMMISSIONS
--------------------------------------------------------------------------------
The Subadvisers attempt to obtain the best possible price and most favorable
execution of transactions in their portfolio securities. There may be times when
a Subadviser may pay one broker-dealer a commission that is greater than the
amount that another broker-dealer may charge for the same transaction. The
Subadviser generally determines in good faith if the commission paid was
reasonable in relation to the brokerage or research services provided by the
broker-dealer. In selecting and monitoring broker-dealers and negotiating
commissions, the Subadviser considers, among other factors, a broker-dealer's
reliability, availability of research, the quality of its execution services and
its financial condition.
51
Dividends, Distributions and Taxes
--------------------------------------------------------------------------------
The Funds pay dividends and distribute capital gains at different intervals. All
dividends and distributions are automatically reinvested at NAV unless you
choose to receive them in a cash payment. You can change your payment options at
any time by writing to us.
Certain tax considerations may apply to your investment in an Aston Fund. The
following is a general description of certain federal income tax considerations.
If you have any tax-related questions relating to your investments in an Aston
Fund, please consult your tax adviser. Further information regarding the federal
income tax consequences of investing in the Funds is included in the SAI.
TAXES
For federal income tax purposes:
- The tax treatment of dividends and distributions is the same whether you
reinvest the dividends and distributions or elect to receive them in cash.
You will receive a statement with the federal income tax status of your
dividends and distributions for the prior year by January 31.
- Distributions of any net investment income, other than "qualified dividend
income," are taxable to you as ordinary income.
- Distributions of qualified dividend income (i.e., generally dividends
received by a Fund from domestic corporations and certain foreign
corporations) generally will be taxed to individuals and other
non-corporate investors in the Funds at federal income tax rates
applicable to long-term capital gains, provided you meet certain holding
period and other requirements contained in the Code with respect to your
Fund shares and the Fund meets similar holding period and other
requirements with respect to the dividend paying stock. The favorable
treatment of qualified dividend income will expire for taxable years
beginning after December 31, 2010. Dividends received by a Fund from most
REITs and certain foreign corporations are not expected to qualify for
treatment as qualified dividend income when distributed by a Fund.
Therefore, it is not expected that a significant amount of the
Aston/Fortis Real Estate Fund's distributions will qualify for treatment
as qualified dividend income when distributed by the Fund.
- Distributions of net capital gain (net long-term capital gain less any net
short-term capital loss) are taxable as long-term capital gain regardless
of how long you may have held the shares of a Fund. In contrast,
distributions of net short-term capital gain (net short-term capital gain
less any net long- term capital loss) are taxable as ordinary income
regardless of how long you have held shares of a Fund. Because
distributions of net short-term capital gain are taxable as ordinary
income, you generally cannot offset short-term capital gain distributions
you receive from a Fund with capital losses.
- Distributions declared to shareholders of record in October, November or
December and paid on or before January 31 of the succeeding year will be
treated for federal income tax purposes as if received by shareholders on
December 31 of the year in which the distribution was declared.
- When you sell or exchange shares (other than shares held in a tax-deferred
account), it generally is considered a taxable event for you. Depending on
the purchase price and the sale price of the shares you sell or exchange,
you may have a gain or a loss on the transaction. The gain or loss will
generally be treated as a long-term capital gain or loss if you held your
shares for more than one year. If you held your shares for one year or
less, the gain or loss will generally be treated as a short-term capital
gain or loss. Short-term capital gains are taxable at ordinary federal
income tax rates. For taxable years beginning on or before December 31,
2010, long-term capital gains are taxable to individuals and other
non-corporate investors at a maximum federal income tax rate of 15%. You
are responsible for any tax liabilities generated by your transactions.
- If you do not provide Aston Funds with your complete and correct taxpayer
identification number and required certification, or if the Internal
Revenue Service so notifies us, you may be subject to backup withholding
tax on dividends, distributions and redemption proceeds.
- If you purchase shares of a Fund just before a dividend or distribution,
you will pay the full price for the shares and receive a portion of the
purchase price back as a taxable distribution. This is referred to as
"buying a dividend."
- If a Fund qualifies (by having more than 50% of the value of its total
assets at the close of the taxable year consist of stock or securities in
foreign corporations) and elects to pass through foreign taxes paid on its
investments during the year, such taxes will be reported to you as income.
You may, however, be able to claim an offsetting tax credit or deduction
on your federal income tax return, depending on your particular
circumstances and provided you meet certain holding period and other
requirements.
52
Financial Highlights
--------------------------------------------------------------------------------
These financial highlights tables are to help you understand the Funds'
financial performance. The following schedules present financial highlights for
one share of the Funds outstanding throughout the periods indicated. The total
returns in the tables represent the rate that an investor would have earned or
lost on an investment in a Fund (assuming reinvestment of all dividends and
distributions). This information has been derived from the Funds' financial
statements as of October 31, 2008 which have been audited by Ernst & Young LLP,
whose report, along with the Funds' financial statements, is included in the
Funds' Annual Report, which is available upon request.
MONTAG & CALDWELL GROWTH FUND
--------------------------------------------------------------------------------
Year Year Year Year Year
Ended Ended Ended Ended Ended
10/31/08 10/31/07 10/31/06 10/31/05 10/31/04
-------- -------- -------- -------- --------
Net Asset Value, Beginning of Period $31.61 $25.24 $23.44 $21.61 $20.84
INCOME FROM INVESTMENT OPERATIONS:
Net investment income 0.13(a) 0.14(a) 0.13(a) 0.11(a) 0.10(a)
Net realized and unrealized gain (loss)
on investments (8.70) 6.55 1.82 1.83 0.77
------ ------ ------ ------ ------
Total from investment operations (8.57) 6.69 1.95 1.94 0.87
------ ------ ------ ------ ------
LESS DISTRIBUTIONS:
Distributions from and in excess of net
investment income (0.07) (0.14) (0.15) (0.11) (0.10)
Distributions from net realized gain on
investments (4.03) (0.18) -- -- --
------ ------ ------ ------ ------
Total distributions (4.10) (0.32) (0.15) (0.11) (0.10)
------ ------ ------ ------ ------
Net increase (decrease) in net asset value (12.67) 6.37 1.80 1.83 0.77
------ ------ ------ ------ ------
Net Asset Value, End of Period $18.94 $31.61 $25.24 $23.44 $21.61
====== ====== ====== ====== ======
TOTAL RETURN (30.96)% 26.72% 8.36% 8.99% 4.19%
RATIOS/SUPPLEMENTAL DATA:
Net Assets, End of Period (in 000's) $754,671 $1,254,382 $1,246,683 $1,727,848 $2,184,511
Ratios of expenses to average net assets:
Before reimbursement and/or waiver of
expenses by Adviser 0.83%(b) 0.79%(b) 0.78%(b) 0.75% 0.74%
After reimbursement and/or waiver of
expenses by Adviser 0.83%(b) 0.79%(b) 0.78%(b) 0.75% 0.74%
Ratios of net investment income to average
net assets:
Before reimbursement and/or waiver of
expenses by Adviser 0.51% 0.51% 0.56% 0.48% 0.48%
After reimbursement and/or waiver of
expenses by Adviser 0.51% 0.51% 0.56% 0.48% 0.48%
Portfolio Turnover 52.32% 69.02% 68.74% 52.16% 52.86%
------------------------
(a)The selected per share data was calculated using the weighted average shares
outstanding method for the period.
(b)Ratios of expenses to average net assets include interest expense of less
than 0.005% for the years ended October 31, 2008, October 31,2007 and October
31, 2006. The interest expense is from utilizing the line of credit.
53
Financial Highlights (continued)
--------------------------------------------------------------------------------
ASTON/VEREDUS SELECT GROWTH FUND
--------------------------------------------------------------------------------
Year Year Period
Ended Ended Ended
10/31/08 10/31/07 10/31/06(a)
-------- -------- -----------
Net Asset Value, Beginning of Period $16.83 $13.08 $11.97
------ ------
INCOME FROM INVESTMENT OPERATIONS:
Net investment income (0.02) (0.02) --(b)(c)
Net realized and unrealized loss on investments (5.65) 3.77 1.11
------ ------ ------
Total from investment operations (5.67) 3.75 1.11
------ ------ ------
LESS DISTRIBUTIONS:
Distributions from net realized gain on
investments (2.42) -- --
------ ------ ------
Total from investment operations (2.42) -- --
------ ------ ------
Net increase (decrease) in net asset value (8.09) 3.75 1.11
------ ------ ------
Net Asset Value, End of Period $8.74 $16.83 $13.08
====== ====== ======
TOTAL RETURN (38.96)% 28.52% 9.27%(d)
RATIOS/SUPPLEMENTAL DATA:
Net Assets, End of Period (in 000's) $46,040 $3,216 $1,015
Ratios of expenses to average net assets:
Before reimbursement and/or waiver of expenses
by Adviser 1.09% 1.19% 1.43%(e)
After reimbursement and/or waiver of expenses
by Adviser 1.05% 0.97% 0.98%(e)
Ratios of net investment loss to average net
assets:
Before reimbursement and/or waiver of expenses
by Adviser (0.30)% (0.48)% (0.55)%(e)
After reimbursement and/or waiver of expenses
by Adviser (0.26)% (0.26)% (0.10)%(e)
Portfolio Turnover 387,57% 283.38% 269.88%
------------------------
(a)Aston/Veredus Select Growth Fund - Class I commenced investment operations on
September 11, 2006.
(b)The selected per share data was calculated using the weighted average shares
outstanding method for the period.
(c)Represents less than $0.005 per share.
(d)Not Annualized.
(e)Annualized.
54
Financial Highlights (continued)
--------------------------------------------------------------------------------
ASTON GROWTH FUND
--------------------------------------------------------------------------------
Year Year Year Year Year
Ended Ended Ended Ended Ended
10/31/08 10/31/07 10/31/06 10/31/05 10/31/04
-------- -------- -------- -------- --------
Net Asset Value, Beginning of Period $22.83 $23.14 $22.97 $22.02 $21.33
INCOME FROM INVESTMENT OPERATIONS:
Net investment income (loss) 0.06 0.11(a) 0.07 0.11(a) 0.01(a)
Net realized and unrealized gain (loss) on
investments (6.04) 2.43 1.27 0.92 0.68
------ ------ ------ ------ ------
Total from investment operations (5.98) 2.54 1.34 1.03 0.69
------ ------ ------ ------ ------
LESS DISTRIBUTIONS:
Distributions from and in excess of net
investment income (0.05) (0.11) (0.08) (0.08) --
Distributions from net realized gain on
investments (5.63) (2.74) (1.09) -- --
------ ------ ------ ------ ------
Total distributions (5.68) (2.85) (1.17) (0.08) --
------ ------ ------ ------ ------
Net increase (decrease) in net asset value (11.66) (0.31) 0.17 0.95 0.69
------ ------ ------ ------ ------
Net Asset Value, End of Period $11.17 $22.83 $23.14 $22.97 $22.02
====== ====== ====== ====== ======
TOTAL RETURN (33.61)% 12.19% 5.87% 4.69% 3.23%
RATIOS/SUPPLEMENTAL DATA:
Net Assets, End of Period (in 000's) $125,727 $247,258 $459,965 $449,492 $358,377
Ratios of expenses to average net assets:
Before reimbursement and/or waiver of
expenses by Adviser 0.90%(b) 0.83%(b) 0.81%(b) 0.82% 0.82%
After reimbursement and/or waiver of expenses
by Adviser 0.90%(b) 0.83%(b) 0.81%(b) 0.82% 0.82%
Ratios of net investment income to average net
assets:
Before reimbursement and/or waiver of
expenses by Adviser 0.34% 0.51% 0.30% 0.49% 0.05%
After reimbursement and/or waiver of expenses
by Adviser 0.34% 0.51% 0.30% 0.49% 0.05%
Portfolio Turnover 122.68% 47.46% 29.07% 31.30%(c) 18.59%
------------------------
(a)The selected per share data was calculated using the weighted average shares
outstanding method for the period.
(b)Ratios of expenses to average net assets include interest expense of 0.01%
for the year ended October 31,2008 and of less than 0.005% for the years ended
October 31, 2007 and October 31, 2006. The interest expense is from utilizing
the line of credit.
(c)Portfolio turnover rate excludes securities delivered from processing a
redemption-in-kind.
55
Financial Highlights (continued)
--------------------------------------------------------------------------------
ASTON VALUE FUND
--------------------------------------------------------------------------------
Year Year Year Period
Ended Ended Ended Ended
10/31/08 10/31/07 10/31/06 10/31/05(a)
-------- -------- -------- -----------
Net Asset Value, Beginning of Period $15.57 $14.07 $12.16 $12.36
------ ------ ------ ------
INCOME FROM INVESTMENT OPERATIONS:
Net investment income 0.20 0.23 0.24 0.01(b)
Net realized and unrealized loss on
investments (5.10) 2.07 2.09 (0.21)
------ ------ ------ ------
Total from investment operations (4.90) 2.30 2.33 (0.20)
------ ------ ------ ------
LESS DISTRIBUTIONS:
Distributions from and in excess of net
investment income (0.20) (0.23) (0.23) --
Distributions from net realized gain on
investment (1.41) (0.57) (0.19) --
------ ------ ------ ------
Total distributions (1.61) (0.80) (0.42) --
------ ------ ------ ------
Net increase (decrease) in net asset
value (6.51) 1.50 1.91 (0.20)
====== ====== ====== ======
Net Asset Value, End of Period $9.06 $15.57 $14.07 $12.16
====== ====== ====== ======
TOTAL RETURN (34.73)% 16.98% 19.64% (1.62)%(c)
RATIOS/SUPPLEMENTAL DATA:
Net Assets, End of Period (in 000's) $188,688 $289,024 $247,667 $192,662
Ratios of expenses to average net assets:
Before reimbursement and/or waiver of
expenses by Adviser 0.93%(e) 0.91% 0.91% 0.91%(d)
After reimbursement and/or waiver of
expenses by Adviser 0.77%(e) 0.69% 0.69% 0.69%(d)
Ratios of net investment income to
average net assets:
Before reimbursement and/or waiver of
expenses by Adviser 1.47% 1.31% 1.62% 0.40%(d)
After reimbursement and/or waiver of
expenses by Adviser 1.63% 1.53% 1.84% 0.62%(d)
Portfolio Turnover 67.57% 28.05% 26.86% 21.84%
------------------------
(a)Aston Value Fund - Class I commenced investment operations on September 20,
2005.
(b)The selected per share data was calculated using the weighted average shares
outstanding method for the period.
(c)Not Annualized.
(d)Annualized.
(e)Ratios of expense to average net assets included interest expense of less
than 0.005% of the year ended October 31, 2008, which is not included in the
contractual expense limitation. The interest expenses is from utilizing the line
of credit.
56
Financial Highlights (continued)
--------------------------------------------------------------------------------
ASTON/RIVER ROAD DIVIDEND ALL CAP VALUE FUND
--------------------------------------------------------------------------------
Year Period
Ended Ended
10/31/08 10/31/07(a)
-------- -----------
Net Asset Value, Beginning of Period $12.57 $12.94
------- ------
INCOME FROM INVESTMENT OPERATIONS:
Net investment income 0.41 0.16(b)
Net realized and unrealized loss on investments (3.55) (0.37)
------- ------
Total from investment operations (3.14) (0.21)
------- ------
LESS DISTRIBUTIONS:
Distributions from and in excess of net investment
income (0.34) (0.16)
Return of capital (0.01) --
Distributions from net realized gain on investments (0.66) --
------- ------
Total Distributions (1.01) (0.16)
------- ------
Net decrease in net asset value (4.15) (0.37)
------- ------
Net Asset Value, End of Period $8.42 $12.57
======= ======
TOTAL RETURN (26.66)% (1.58)%(c)
RATIOS/SUPPLEMENTAL DATA:
Net Assets, End of Period (in 000's) $144 $197
Ratios of expenses to average net assets:
Before reimbursement and/or waiver of expenses by
Adviser 1.10%(d) 1.42%(e)
After reimbursement and/or waiver of expenses by
Adviser 1.05%(d) 0.96%(e)
Ratios of net investment income to average net assets:
Before reimbursement and/or waiver of expenses by
Adviser 4.06% 2.86%(e)
After reimbursement and/or waiver of expenses by
Adviser 4.11% 3.33%(e)
Portfolio Turnover 48.95% 114.56%
------------------------
(a)Aston/River Road Dividend All Cap Value Fund - Class I commenced investment
operations on June 28, 2007.
(b)The selected per share data was calculated using the weighted average shares
outstanding method for the period.
(c)Not Annualized.
(d)Ratios of expenses to average net assets include interest expense of less
than 0.005% for the year ended October 31, 2008, which is not included in the
contractual expense limitation. The interest expense is from utilizing the line
of credit.
(e)Annualized.
57
Financial Highlights (continued)
--------------------------------------------------------------------------------
ASTON/OPTIMUM MID CAP FUND
--------------------------------------------------------------------------------
Year Year Year Year Period
Ended Ended Ended Ended Ended
10/31/08 10/31/07 10/31/06 10/31/05 10/31/04(a)
-------- -------- -------- -------- -----------
Net Asset Value, Beginning of Period $32.64 $27.34 $23.30 $22.96 $23.61
------ ------ ------ ------ ------
INCOME FROM INVESTMENT OPERATIONS:
Net investment income (loss) 0.11 0.05 0.05 0.04 --(b)(c)
Net realized and unrealized gain (loss) on
investments (13.09) 7.08 4.90 1.04 (0.65)
------ ------ ------ ------ ------
Total from investment operations (12.98) 7.13 4.95 1.08 (0.65)
------ ------ ------ ------ ------
LESS DISTRIBUTIONS:
Distributions from net realized gain on
investments (2.19) (1.83) (0.91) (0.74) --
------ ------ ------ ------ ------
Total distributions (2.19) (1.83) (0.91) (0.74) --
------ ------ ------ ------ ------
Net increase (decrease) in net asset value (15.17) 5.30 4.04 0.34 (0.65)
------ ------ ------ ------ ------
Net Asset Value, End of Period $17.47 $32.64 $27.34 $23.30 $22.96
====== ====== ====== ====== ======
TOTAL RETURN (42.39)% 27.43% 21.76% 4.69% (2.80)%(d)
RATIOS/SUPPLEMENTAL DATA:
Net Assets, End of Period (in 000's) $93,176 $126,691 $81,670 $73,293 $26,202
Ratios of expenses to average net assets:
Before reimbursement and/or waiver of
expenses by Adviser 0.91%(e) 0.87%(e) 0.89% 0.94% 0.98%(f)
After reimbursement and/or waiver of
expenses by Adviser 0.91%(e) 0.87%(e) 0.89% 0.94% 0.98%(f)
Ratios of net investment income (loss) to
average net assets:
Before reimbursement and/or waiver of
expenses by Adviser 0.43% 0.19% 0.18% 0.21% (0.04)%(f)
After reimbursement and/or waiver of
expenses by Adviser 0.43% 0.19% 0.18% 0.21% (0.04)%(f)
Portfolio Turnover 22.58% 26.15% 30.65% 27.42% 26.64%
------------------------
(a)Aston/Optimum Mid Cap Fund - Class I commenced investment operations on July
6, 2004.
(b)The selected per share data was calculated using the weighted average shares
outstanding method for the period.
(c)Represents less than $0.005 per share.
(d)Not Annualized.
(e)Ratios of expenses to average net assets include interest expense of less
than 0.005% for the year ended October 31, 2008 and the year ended October 31,
2007, which is not included in the contractual expense limitation. The interest
expense is from utilizing the line of credit.
(f)Annualized.
58
Financial Highlights (continued)
--------------------------------------------------------------------------------
ASTON/RIVER ROAD SMALL-MID CAP FUND
--------------------------------------------------------------------------------
Year Period
Ended Ended
10/31/08 10/31/07(a)
-------- -----------
Net Asset Value, Beginning of Period $10.13 $10.51
------- ------
INCOME FROM INVESTMENT OPERATIONS:
Net investment income 0.02(b) 0.01
Net realized and unrealized loss on investments (3.00) (0.39)
------- ------
Total from investment operations (2.98) (0.38)
------- ------
LESS DISTRIBUTIONS:
Distributions from net investment income (0.01) --
------- ------
Total Distributions (0.01) --
------- ------
Net decrease in net asset value (2.99) (0.38)
------- ------
Net Asset Value, End of Period $7.14 $10.13
======= ======
TOTAL RETURN (29.49)% (3.52)%(c)
RATIOS/SUPPLEMENTAL DATA:
Net Assets, End of Period (in 000's) $84,002 $7,482
Ratios of expenses to average net assets:
Before reimbursement and/or waiver of expenses by
Adviser 1.31% 2.57%(d)
After reimbursement and/or waiver of expenses by
Adviser 1.25% 1.24%(d)
Ratios of net investment income (loss) to average net
assets:
Before reimbursement and/or waiver of expenses by
Adviser 0.17% (0.91)%(d)
After reimbursement and/or waiver of expenses by
Adviser 0.23% 0.42%(d)
Portfolio Turnover 54.93% 41.51%(c)
------------------------
(a)Aston/River Road Small-Mid Cap Fund - Class I commenced investment operations
on June 28, 2007.
(b)The selected per share data was calculated using the weighted average shares
outstanding method for the period.
(c)Not Annualized.
(d)Annualized.
59
Financial Highlights (continued)
--------------------------------------------------------------------------------
ASTON/VEREDUS AGGRESSIVE GROWTH FUND
--------------------------------------------------------------------------------
Year Year Year Year Year
Ended Ended Ended Ended Ended
10/31/08 10/31/07 10/31/06 10/31/05 10/31/04
-------- -------- -------- -------- --------
Net Asset Value, Beginning of Period $22.83 $18.71 $18.57 $16.40 $15.33
------ ------ ------ ------ ------
INCOME FROM INVESTMENT OPERATIONS:
Net investment loss (0.21) (0.19)(a) (0.17)(a) (0.12) (0.15)
Net realized and unrealized gain on
investments (8.45) 5.54 0.31 2.29 1.22
------ ------ ------ ------ ------
Total from investment operations (8.66) 5.35 0.14 2.17 1.07
------ ------ ------ ------ ------
LESS DISTRIBUTIONS:
Distributions from net realized gain on
investments (5.56) (1.23) -- -- --
------ ------ ------ ------ ------
Total distributions (5.56) (1.23) -- -- --
------ ------ ------ ------ ------
Net increase (decrease) in net asset value (14.22) 4.12 0.14 2.17 1.07
------ ------ ------ ------ ------
Net Asset Value, End of Period $8.61 $22.83 $18.71 $18.57 $16.40
====== ====== ====== ====== ======
TOTAL RETURN (47.77)% 30.34% 0.75% 13.23% 6.98%
RATIOS/SUPPLEMENTAL DATA:
Net Assets, End of Period (in 000's) $16,719 $115,942 $150,697 $156,286 $114,607
Ratios of expenses to average net assets:
Before reimbursement and/or waiver of expenses
by Adviser 1.30%(b) 1.19%(b) 1.13%(b) 1.14% 1.15%
After reimbursement and/or waiver of expenses
by Adviser 1.24%(b) 1.19%(b) 1.13%(b) 1.14% 1.15%
Ratios of net investment loss to average net
assets:
Before reimbursement and/or waiver of expenses
by Adviser (0.96)% (0.98)% (0.87)% (0.78)% (0.90)%
After reimbursement and/or waiver of expenses
by Adviser (0.90)% (0.98)% (0.87)% (0.78)% (0.90)%
Portfolio Turnover 166.19% 126.54% 133.21% 140.04% 118.89%
------------------------
(a)The selected per share data was calculated using the weighted average shares
outstanding method for the period.
(b)Ratios of expenses to average net assets include interest expense of less
than 0.005% for the year ended October 31, 2008, 0.02% for the year ended
October 31, 2007 and less than 0.005% for the year ended October 31, 2006, which
is not included in the contractual expense limitation. The interest expense is
from utilizing the line of credit.
60
Financial Highlights (continued)
--------------------------------------------------------------------------------
ASTON/TAMRO SMALL CAP FUND
--------------------------------------------------------------------------------
Year Year Year Period
Ended Ended Ended Ended
10/31/08 10/31/07 10/31/06 10/31/05(a)
-------- -------- -------- -----------
Net Asset Value, Beginning of Period $21.16 $19.83 $15.67 $15.32
------ ------ ------ ------
INCOME FROM INVESTMENT OPERATIONS:
Net investment loss 0.02 (0.02)(b) (0.02)(b) (0.04)(b)
Net realized and unrealized gain on
investments (6.42) 2.49 4.18 0.39
------ ------ ------ ------
Total from investment operations (6.40) 2.47 4.16 0.35
------ ------ ------ ------
LESS DISTRIBUTIONS:
Distributions from net realized gain
on investments (0.97) (1.14) -- --
------ ------ ------ ------
Net increase (decrease) in net asset
value (7.37) 1.33 4.16 0.35
------ ------ ------ ------
Net Asset Value, End of Period $13.79 $21.16 $19.83 $15.67
====== ====== ====== ======
TOTAL RETURN (31.42)% 12.86% 26.55% 2.28%(c)
RATIOS/SUPPLEMENTAL DATA:
Net Assets, End of Period (in 000's) $238,399 $137,059 $63,982 $11,432
Ratios of expenses to average net
assets:
Before reimbursement and/or waiver of
expenses by Adviser 1.07% 1.05%(d) 1.11% 1.16%(e)
After reimbursement and/or waiver of
expenses by Adviser 1.05% 1.02%(d) 0.99% 1.05%(e)
Ratios of net investment income (loss)
to average net assets:
Before reimbursement and/or waiver of
expenses by Adviser 0.54% (0.14)% (0.20)% (0.39)%(e)
After reimbursement and/or waiver of
expenses by Adviser 0.56% (0.11)% (0.08)% (0.28)%(e)
Portfolio Turnover 66.65% 58.88% 58.28% 56.28%
------------------------
(a)Aston/TAMRO Small Cap Fund - Class I commenced investment operations on
January 4, 2005.
(b)The selected per share data was calculated using the weighted average shares
outstanding method for the period.
(c)Not Annualized.
(d)Ratios of expenses to average net assets include interest expenses of less
than 0.005% for the year ended October 31, 2007, which is not included in the
contractual expense limitation. The interest expense is from utilizing the line
of credit.
(e)Annualized.
61
Financial Highlights (continued)
--------------------------------------------------------------------------------
RIVER ROAD SMALL CAP VALUE FUND
--------------------------------------------------------------------------------
Year Period
Ended Ended
10/31/08 10/31/07(a)
-------- -----------
Net Asset Value, Beginning of Period $14.37 $14.04
------- ------
INCOME FROM INVESTMENT OPERATIONS:
Net investment income 0.04(b) 0.09(b)
Net realized and unrealized loss on investments (4.54) 0.46
------- ------
Total from investment operations (4.50) 0.55
------- ------
LESS DISTRIBUTIONS:
Distributions from and in excess of net investment
income (0.01) (0.09)
Distributions from net realized gain on investments (0.54) (0.13)
------- ------
Total Distributions (0.55) (0.22)
------- ------
Net increase (decrease) in net asset value (5.05) 0.33
------- ------
Net Asset Value, End of Period $9.32 $14.37
======= ======
TOTAL RETURN (32.34)% 3.91%(c)
RATIOS/SUPPLEMENTAL DATA:
Net Assets, End of Period (in 000's) $114,666 $64,525
Ratios of expenses to average net assets:
Before reimbursement and/or waiver of expenses by
Adviser 1.20%(d) 1.16%(d)(e)
After reimbursement and/or waiver of expenses by
Adviser 1.20%(d) 1.16%(d)(e)
Ratios of net investment income to average net assets:
Before reimbursement and/or waiver of expenses by
Adviser 0.33% 0.31%(e)
After reimbursement and/or waiver of expenses by
Adviser 0.33% 0.31%(e)
Portfolio Turnover 57.32% 74.18%
------------------------
(a)River Road Small Cap Value Fund-Class I commenced investment operations on
December 13, 2006.
(b)The selected per share data was calculated using the weighted average shares
outstanding method for the period.
(c)Not Annualized.
(d)Ratios of expenses to average net assets include interest expenses of less
than 0.005% for the year ended October 31, 2008 and the period ended October 31,
2007, which is not included in the contractual expense limitation. The interest
expense is from utilizing the line of credit.
(e)Annualized.
62
Financial Highlights (continued)
--------------------------------------------------------------------------------
ASTON/NEPTUNE INTERNATIONAL FUND
--------------------------------------------------------------------------------
Year Period
Ended Ended
10/31/08 10/31/07(a)
-------- -----------
Net Asset Value, Beginning of Period $12.24 $10.00
------- ------
INCOME FROM INVESTMENT OPERATIONS:
Net investment income 0.17(b) 0.03
Net realized and unrealized loss on investments (6.42) 2.21
------- ------
Total from investment operations (6.25) 2.24
------- ------
LESS DISTRIBUTIONS:
Distributions from and in excess of net investment
income (0.14) --
------- ------
Total Distributions (0.14) --
------- ------
Net increase in net asset value (6.39) 2.24
------- ------
Net Asset Value, End of Period $5.85 $12.24
======= ======
TOTAL RETURN (51.55)% 22.30%(c)
RATIOS/SUPPLEMENTAL DATA:
Net Assets, End of Period (in 000's) $8,378 $2,370
Ratios of expenses to average net assets:
Before reimbursement and/or waiver of expenses by
Adviser 3.02% 11.72%(d)
After reimbursement an/or waiver of expenses by
Adviser 1.04%(e) 1.25%(d)
Ratios of net investment income to average net assets:
Before reimbursement and/or waiver of expenses by
Adviser (0.24)% (9.21)%(d)
After reimbursement and/or waiver of expenses by
Adviser 1.74% 1.26%(d)
Portfolio Turnover 7.39% 5.14%(c)
------------------------
(a)Aston/Neptune International Fund-Class I, commenced investment operations on
August 6, 2007.
(b)The selected per share data was calculated using the weighted average shares
outstanding method for the period.
(c)Not Annualized.
(d)Annualized.
(e)Effective February 11, 2008, the contractual expense limitation of 1.40% was
removed and Aston agreed to voluntarily waive management fees and/or reimburse
expenses for the Fund so that the net expense ratio is no more than 1.02% for
Class I Shares. This voluntary waiver became the contractual expense limitation
on February 29, 2008.
63
Financial Highlights (continued)
--------------------------------------------------------------------------------
ASTON/BARINGS INTERNATIONAL FUND
--------------------------------------------------------------------------------
Period
Ended
10/31/08(a)
-----------
Net Asset Value, Beginning of Period $10.00
-------
INCOME FROM INVESTMENT OPERATIONS:
Net investment income 0.10
Net realized and unrealized loss on investments (5.02)
-------
Total from investment operations (4.92)
-------
LESS DISTRIBUTIONS:
Distributions from and in excess of net investment income --
Distributions from net realized gain on investments --
-------
Total Distributions --
-------
Net decrease in net asset value (4.92)
-------
Net Asset Value, End of Period $5.08
=======
TOTAL RETURN (49.20)%(b)
RATIOS/SUPPLEMENTAL DATA:
Net Assets, End of Period (in 000's) $5,517
Ratios of expenses to average net assets:
Before reimbursement and/or waiver of expenses by Adviser 3.95%(c)(d)
After reimbursement an/or waiver of expenses by Adviser 1.18%(c)(d)
Ratios of net investment income (loss) to average net assets:
Before reimbursement and/or waiver of expenses by Adviser (1.11)%(d)
After reimbursement and/or waiver of expenses by Adviser 1.66%(d)
Portfolio Turnover 121.99%(b)
------------------------
(a)Aston/Barings International Fund - Class I commenced investment operations on
November 2, 2007.
(b)Not Annualized.
(c)Ratios of expenses to average net assets include interest expense of less
than 0.01% for the period ended October 31, 2008, which is not included in the
contractual or voluntary expense limitation. The interest expense is from
utilizing the line of credit.
(d)Annualized.
64
Financial Highlights (continued)
--------------------------------------------------------------------------------
ASTON/FORTIS REAL ESTATE FUND
--------------------------------------------------------------------------------
Year Year Year Period
Ended Ended Ended Ended
10/31/08 10/31/07 10/31/06 10/31/05(a)
-------- -------- -------- -----------
Net Asset Value, Beginning of Period $15.62 $20.00 $16.23 $16.64
------- ------ ------ ------
INCOME FROM INVESTMENT OPERATIONS:
Net investment income 0.09(b) 0.34(b) 0.36(b) 0.10(b)
Net realized and unrealized loss on
investments (5.51) (0.40) 5.42 (0.51)
------- ------ ------ ------
Total from investment operations (5.42) (0.06) 5.78 (0.41)
------- ------ ------ ------
LESS DISTRIBUTIONS:
Distributions from and in excess of
net investment income (0.13) (0.07) (0.16) --
Distributions from net realized gain
on investments (3.99) (4.25) (1.85) --
------- ------ ------ ------
Total distributions (4.12) (4.32) (2.01) --
------- ------ ------ ------
Net increase (decrease) in net asset
value (9.54) (4.38) 3.77 (0.41)
------- ------ ------ ------
Net Asset Value, End of Period $6.08 $15.62 $20.00 $16.23
======= ====== ====== ======
TOTAL RETURN (43.58)% (1.18)% 39.54% (2.46)%(c)
RATIOS/SUPPLEMENTAL DATA:
Net Assets, End of Period (in 000's) $23,411 $41,545 $46,025 $32,711
Ratios of expenses to average net
assets:
Before reimbursement and/or waiver of
expenses by Adviser 1.32%(d) 1.20%(d) 1.21%(d) 1.32%(e)
After reimbursement and/or waiver of
expenses by Adviser 1.12%(d) 1.11%(d) 1.12%(d) 1.11%(e)
Ratios of net investment income to
average net assets:
Before reimbursement and/or waiver of
expenses by Adviser 0.74% 1.99% 2.02% 5.11%(e)
After reimbursement and/or waiver of
expenses by Adviser 0.94% 2.08% 2.11% 5.32%(e)
Portfolio Turnover 85.08% 88.75% 83.15% 43.14%
------------------------
(a)Aston/Fortis Real Estate Fund - Class I commenced investment operations on
September 20, 2005.
(b)The selected per share data was calculated using the weighted average shares
outstanding method for the period.
(c)Not Annualized.
(d)Ratios of expenses to average net assets include interest expense of less
than 0.005% for the years ended October 31, 2008, October 31, 2007 and October
31, 2006, which is not included in the contractual expense limitation. The
interest expense is from utilizing the line of credit.
(e)Annualized.
65
Financial Highlights (continued)
--------------------------------------------------------------------------------
MONTAG & CALDWELL BALANCED FUND
--------------------------------------------------------------------------------
Year Year Year Year Year
Ended Ended Ended Ended Ended
10/31/08 10/31/07 10/31/06 10/31/05 10/31/04
-------- -------- -------- -------- --------
Net Asset Value, Beginning of Period $19.94 $17.19 $16.39 $15.81 $15.57
------ ------ ------ ------ ------
INCOME FROM INVESTMENT OPERATIONS:
Net investment income 0.27 0.24(a) 0.22(a) 0.21(a) 0.23(a)
Net realized and unrealized gain (loss) on
investments (4.35) 2.80 0.88 0.66 0.30
------ ------ ------ ------ ------
Total from investment operations (4.08) 3.04 1.10 0.87 0.53
------ ------ ------ ------ ------
LESS DISTRIBUTIONS:
Distributions from and in excess of net
investment income (0.29) (0.29) (0.30) (0.29) (0.29)
------ ------ ------ ------ ------
Total distributions (0.29) (0.29) (0.30) (0.29) (0.29)
------ ------ ------ ------ ------
Net increase (decrease) in net asset value (4.37) 2.75 0.80 0.58 0.24
------ ------ ------ ------ ------
Net Asset Value, End of Period $15.57 $19.94 $17.19 $16.39 $15.81
====== ====== ====== ====== ======
TOTAL RETURN (20.71)% 17.87% 6.80% 5.50% 3.41%
RATIOS/SUPPLEMENTAL DATA:
Net Assets, End of Period (in 000's) $919 $1,158 $7,640 $19,609 $79,936
Ratios of expenses to average net assets:
Before reimbursement and/or waiver of expenses
by Adviser 1.49% 1.44%(b) 1.07%(b) 0.91% 0.87%
After reimbursement and/or waiver of expenses
by Adviser 1.10% 1.08%(b) 1.07%(b) 0.91% 0.87%
Ratios of net investment income to average net
assets:
Before reimbursement and/or waiver of expenses
by Adviser 0.99% 0.99% 1.33% 1.29% 1.44%
After reimbursement and/or waiver of expenses
by Adviser 1.38% 1.35% 1.33% 1.29% 1.44%
Portfolio Turnover 43.65% 36.25% 33.70% 33.43% 35.90%
------------------------
(a)The selected per share data was calculated using the weighted average shares
outstanding method for the period.
(b)Ratios of expenses to average net assets include interest expense of less
than 0.01% for the year ended October 31, 2007 and less than 0.005% for the year
ended October 31, 2006, which is not included in the voluntary expense
limitation. The interest expense is from utilizing the line of credit.
66
Financial Highlights (continued)
--------------------------------------------------------------------------------
ASTON/TCH FIXED INCOME FUND
--------------------------------------------------------------------------------
Year Year Year Year Year
Ended Ended Ended Ended Ended
10/31/08 10/31/07 10/31/06 10/31/05 10/31/04
-------- -------- -------- -------- --------
Net Asset Value, Beginning of Period $9.73 $9.62 $9.69 $10.13 $10.07
----- ----- ----- ------ ------
INCOME FROM INVESTMENT OPERATIONS:
Net investment income 0.48 0.51(a) 0.47(a) 0.44(a) 0.45
Net realized and unrealized gain
(loss) on investments (1.09) 0.13 (0.03) (0.37) 0.13
----- ----- ----- ------ ------
Total from investment operations (0.61) 0.64 0.44 0.07 0.58
----- ----- ----- ------ ------
LESS DISTRIBUTIONS:
Distributions from and in excess of
net investment income (0.52) (0.53) (0.51) (0.51) (0.52)
----- ----- ----- ------ ------
Total distributions (0.52) (0.53) (0.51) (0.51) (0.52)
----- ----- ----- ------ ------
Net increase (decrease) in net asset
value (1.13) 0.11 (0.07) (0.44) 0.06
----- ----- ----- ------ ------
Net Asset Value, End of Period $8.60 $9.73 $9.62 $9.69 $10.13
===== ===== ===== ====== ======
TOTAL RETURN (6.65)% 6.84% 4.68% 0.65% 5.93%
RATIOS/SUPPLEMENTAL DATA:
Net Assets, End of Period (in 000's) $25,891 $39,318 $43,148 $72,876 $278,712
Ratios of expenses to average net
assets:
Before reimbursement and/or waiver of
expenses by Adviser 0.81% 0.78%(b) 0.71%(b) 0.70% 0.67%
After reimbursement and/or waiver of
expenses by Adviser 0.40% 0.47%(b)(c) 0.50%(b) 0.49% 0.49%
Ratios of net investment income to
average net assets:
Before reimbursement and/or waiver of
expenses by Adviser 4.84% 4.89% 4.70% 4.23% 4.34%
After reimbursement and/or waiver of
expenses by Adviser 5.25% 5.20% 4.91% 4.44% 4.52%
Portfolio Turnover 78.39% 71.61% 71.19% 41.33% 46.80%
------------------------
(a)The selected per share data was calculated using the weighted average shares
outstanding method for the period.
(b)Ratios of expenses to average net assets include interest expense of less
than 0.005% for the years ended October 31, 2007 and October 31, 2006, which is
not included in the contractual or voluntary expense limitation. The interest
expense is from utilizing the line of credit.
(c)The Adviser's expense reimbursement level, which affects the net expense
ratio, was changed from 0.49% to 0.39% on September 1, 2007. Subsequently, on
October 1, 2008, the Adviser's expense reimbursement level changed from 0.39% to
0.49%.
67
General Information
--------------------------------------------------------------------------------
If you wish to know more about Aston Funds, you will find additional information
in the following documents:
SHAREHOLDER REPORTS
--------------------------------------------------------------------------------
You will receive an unaudited semi-annual report dated April 30 and an annual
report dated October 31 which is audited by an independent registered public
accounting firm. The annual report contains a discussion of the market
conditions and investment strategies that significantly affected each Fund's
performance during its last fiscal year.
STATEMENT OF ADDITIONAL INFORMATION (SAI)
--------------------------------------------------------------------------------
The SAI, which is incorporated into this prospectus by reference and dated March
1, 2009, as amended from time to time, is available to you without charge and
can be mailed to you upon request. It contains more detailed information about
the Funds.
HOW TO OBTAIN REPORTS
--------------------------------------------------------------------------------
CONTACTING ASTON FUNDS
You can get free copies of the reports and SAI, request other information and
get answers to your questions about the Funds by contacting:
Address: Aston Funds
P.O. Box 9765
Providence, RI 02940
Phone: Shareholder Services & 800 992-8151
Fund Literature
Investment Advisor Services 800 597-9704
Web site: www.astonfunds.com
OBTAINING INFORMATION FROM THE SEC
You can visit the EDGAR Database on the SEC's Web site at http://www.sec.gov to
view the SAI and other information. You can also view and copy information about
the Funds at the SEC's Public Reference Room in Washington D.C. To find out more
about the Public Reference Room, you can call the SEC at 202 551-8090. Also, you
can obtain copies of this information after paying a duplicating fee, by
electronic request at the following E-mail address: publicinfo@sec.gov, or by
writing the SEC's Public Reference Section, Washington D.C. 20549-0102.
Investment Company Act File Number: 811-8004
68
(ASTON FUNDS LOGO)
Aston Funds
P. O. Box 9765
Providence, RI 02940
(GRAPHIC)
(ASTON ASSET MANAGEMENT LOGO)
Aston Funds
Class R Shares
Prospectus
March 1, 2009
(GRAPHIC)
NOT FDIC INSURED. NO BANK GUARANTEE. MAY LOSE VALUE.
The Securities and Exchange Commission has not approved or disapproved these or
any mutual fund's shares or determined if this prospectus is accurate or
complete. Any representation to the contrary is a crime.
(ASTON FUNDS LOGO)
EQUITY FUNDS TICKER SYMBOL
Aston/Montag & Caldwell Growth Fund MCRGX
Aston Growth Fund CCGRX
(ASTON FUNDS LOGO)
Thank you for your interest in Aston Funds. Our diversified family of
funds offers you a variety of investment opportunities to help you build
wealth and meet financial goals such as retirement. This prospectus
pertains only to the Class R Shares of Aston Funds. Please read this
prospectus carefully and keep it for future reference.
For a list of terms with definitions that you may find helpful as you read
this prospectus, please refer to the "Investment Terms" Section.
Mutual fund shares are not bank deposits and are not guaranteed, endorsed
or insured by any financial institution, government entity or the Federal
Deposit Insurance Corporation (FDIC).
TABLE OF CONTENTS
--------------------------------------------------------------------------------
Page
ASTON/MONTAG & CALDWELL GROWTH FUND 3
Investment Objective, Principal Investment
Strategies and Risks 3
Fund Performance 4
Fund Expenses 5
ASTON GROWTH FUND 6
Investment Objective, Principal Investment
Strategies and Risks 6
Fund Performance 7
Fund Expenses 8
ADDITIONAL INFORMATION REGARDING INVESTMENT
STRATEGIES 9
INVESTMENT TERMS 12
PORTFOLIO HOLDINGS 13
MANAGEMENT OF THE FUNDS 14
The Investment Adviser 14
The Subadviser 14
Portfolio Manager 15
Management Fees 15
SHAREHOLDER INFORMATION 16
Opening An Account 16
Buying Shares 16
Exchanging Shares 17
Selling/Redeeming Shares 18
Transaction Policies 21
Account Policies and Dividends 23
Additional Investor Services 23
Distribution Plan 12b-1 Fees 24
Portfolio Transactions and Brokerage
Commissions 24
DIVIDENDS, DISTRIBUTIONS AND TAXES 25
FINANCIAL HIGHLIGHTS 26
GENERAL INFORMATION 28
No single fund is intended to be a complete investment program, but
individual funds can be an important part of a balanced and diversified
investment program. Mutual funds have the following general risks:
- the value of fund shares will fluctuate
- you could lose money
- you cannot be certain that a fund will achieve its investment objective
(This page intentionally left blank)
Aston/Montag & Caldwell Growth Fund
--------------------------------------------------------------------------------
INVESTMENT OBJECTIVE
--------------------------------------------------------------------------------
The Fund seeks long-term capital appreciation and, secondarily, current income,
by investing primarily in common stocks and convertible securities.
PRINCIPAL INVESTMENT STRATEGIES
--------------------------------------------------------------------------------
The Fund invests primarily in common stocks and convertible securities. The
portfolio manager uses a bottom-up approach to stock selection and seeks high
quality, well-established large-cap companies that the portfolio manager
believes are growing their near-term earnings at an above average rate. The
portfolio manager emphasizes valuation to find companies selling at a discount
to their intrinsic value. These companies must pass an initial capitalization
screen and:
- have a strong history of earnings growth
- are attractively priced, relative to the company's potential for above
average long-term earnings and revenue growth
- have strong balance sheets
- have a sustainable competitive advantage
- are currently, or have the potential to become, industry leaders
- have the potential to outperform during market downturns
The Fund may invest in foreign securities (directly and through depositary
receipts).
To manage risk, the portfolio manager limits sector and individual security
exposure, and adheres to a strong sell discipline.
PRINCIPAL RISKS OF INVESTING IN THIS FUND
--------------------------------------------------------------------------------
You could lose money by investing in the Fund. There can be no assurance that
the Fund's investment objective will be achieved.
FOREIGN SECURITIES RISK: Investing in the securities of foreign issuers involves
special risks and considerations not typically associated with investing in U.S.
companies. The securities of foreign companies may be less liquid and may
fluctuate more widely than those traded in U.S. markets. Foreign companies and
markets may also have less governmental supervision. There may be difficulty in
enforcing contractual obligations and little public information about the
companies. Trades typically take more time to settle and clear, and the cost of
buying and selling foreign securities is generally higher than similar costs
associated with U.S. traded securities.
- CURRENCY RISK: The value of the securities held by the Fund may be
affected by changes in exchange rates or control regulations. If a local
currency gains against the U.S. dollar, the value of the holding increases
in U.S. dollar terms. If a local currency declines against the U.S.
dollar, the value of the holding decreases in U.S. dollar terms.
- POLITICAL/ECONOMIC RISK: Changes in economic, tax or foreign investment
policies, or other political, governmental or economic actions can
adversely affect the value of the securities in the Fund.
- REGULATORY RISK: In foreign countries, accounting, auditing and financial
reporting standards and other regulatory practices and requirements are
generally different from those required for U.S. companies.
GROWTH STYLE RISK: Growth investing involves buying stocks that have relatively
high price-to-earnings ratios. Growth stocks may be more volatile than other
stocks because they are generally more sensitive to investor perceptions and
market moves. During periods of growth stock underperformance, the Fund's
performance may suffer.
LIQUIDITY RISK: When there is no willing buyer and investments cannot be readily
sold at the desired time or price, the Fund may need to accept a lower price or
may not be able to sell the security at all. An inability to sell securities can
adversely affect the Fund's value or prevent the Fund from being able to take
advantage of other investment opportunities.
MANAGER RISK: The performance of the Fund is dependent upon the investment
adviser's skill in selecting managers and the portfolio manager's skill in
making appropriate investments. As a result, the Fund may underperform its
benchmark or its peers.
MARKET RISK: The Fund's share price can move down in response to stock market
conditions, changes in the economy or changes in a particular company's stock
price. An individual stock may decline in value even when the value of stocks in
general are rising.
For additional information regarding the Fund, please refer to the "Investment
Terms" and "Additional Information Regarding Investment Strategies" Sections.
3
Aston/Montag & Caldwell Growth Fund (continued)
--------------------------------------------------------------------------------
FUND PERFORMANCE
--------------------------------------------------------------------------------
The bar chart shows how the Fund's performance has varied from year-to-year over
the periods shown. This information may help illustrate the risks of investing
in the Fund. As with all mutual funds, past performance (before and after taxes)
does not guarantee future performance.
CALENDAR YEAR TOTAL RETURN
2003 16.98%
2004 3.87%
2005 5.10%
2006 7.86%
2007 20.78%
2008 (32.76%)
Best Quarter: 9/07 9.18%
Worst Quarter: 12/08 (20.37)%
The following table indicates how the Fund's average annual returns for
different calendar periods compared to the returns of a broad-based securities
market index. All figures assume reinvestment of dividends and distributions. It
is not possible to invest in an index.
AVERAGE ANNUAL TOTAL RETURN
(For the periods ended December 31, 2008)
Since
1 Year 5 Years Inception(a)
------ ------- ------------
Aston/Montag & Caldwell Growth Fund:
Return Before Taxes (32.76)% (0.89)% 1.89%
Return After Taxes on Distributions (33.11)% (1.45)% 1.40%
Return After Taxes on Distributions and
Sale of Fund Shares (20.85)% (0.63)% 1.72%
------ ----- ----
Russell 1000 Growth Index(b) (38.44)% (3.42)% 1.45%
------ ----- ----
(a) Inception of Class R shares: December 31, 2002, Index data computed from
December 31, 2002.
(b) Reflects no deduction for taxes, fees and expenses.
After-tax returns are calculated using the highest historical marginal
individual federal income tax rates and do not reflect the impact of state and
local taxes. In some instances, the "Return After Taxes on Distributions and
Sale of Fund Shares" may be greater than "Return Before Taxes" because the
investor is assumed to be able to use the capital loss of the sale of Fund
shares to offset other taxable gains. After-tax returns depend on an investor's
tax situation and may differ from those shown. After-tax returns shown are not
relevant to investors who hold their shares through tax-deferred arrangements,
such as 401(k) plans or individual retirement accounts.
4
Fund Expenses
--------------------------------------------------------------------------------
As an investor in the Fund, you pay certain indirect fees and expenses, which
are described in the table below.
SHAREHOLDER FEES
As a benefit of investing in Class R shares of the Fund, you do not incur any
sales loads, exchange fees, or redemption fees.
ANNUAL FUND OPERATING EXPENSES
Operating expenses are the normal costs of operating any mutual fund. These
expenses are not charged directly to investors. They are paid from the Fund's
assets and are expressed as an expense ratio, which is a percentage of average
daily net assets.
ACQUIRED TOTAL
MANAGEMENT DISTRIBUTION OTHER FUND FEES EXPENSE
FUND FEES (12B-1) FEES EXPENSES AND EXPENSES RATIO
Aston/Montag & Caldwell Growth Fund(a) 0.69% 0.50% 0.14% -- 1.33%
(a)In addition to Class R shares, the Fund offers two other classes of shares
that invest in the same portfolio of securities. Shareholders of Class N shares
are subject to a 12b-1 distribution fee and shareholders of Class I shares are
not subject to a 12b-1 distribution fee; therefore expense and performance
figures will vary among the classes. The information in the table above and the
example below relate to the Class R shares, which are offered in this
prospectus. Class N shares and Class I shares are offered in separate
prospectuses.
EXAMPLE
This hypothetical example shows the operating expenses you would incur as a
shareholder if you invested $10,000 in the Fund over the time periods shown and
you redeem all your shares at the end of the period. The example assumes you
reinvested all dividends and distributions, that the average annual return was
5% and that operating expenses remained the same. The example is for comparison
purposes only and does not represent the Fund's actual or future expenses and
returns.
1 YEAR 3 YEARS 5 YEARS 10 YEARS
Aston/Montag & Caldwell Growth Fund $135 $421 $729 $1,601
5
Aston Growth Fund
--------------------------------------------------------------------------------
(Formerly Aston/ABN AMRO Growth Fund)
INVESTMENT OBJECTIVE
--------------------------------------------------------------------------------
The Fund seeks long-term total return through a combination of capital
appreciation and current income by investing primarily in a combination of
stocks and bonds.
PRINCIPAL INVESTMENT STRATEGIES
--------------------------------------------------------------------------------
The Fund invests primarily in common stocks and convertible securities. The
portfolio manager uses a bottom-up approach to stock selection and seeks high
quality, well-established large-cap companies that the portfolio manager
believes are growing their near-term earnings at an above average rate. The
portfolio manager emphasizes valuation to find companies selling at a discount
to their intrinsic value. These companies must pass an initial capitalization
screen and:
- have a strong history of earnings growth
- are attractively priced, relative to the company's potential for above
average long-term earnings and revenue growth
- have strong balance sheets
- have a sustainable competitive advantage
- are currently, or have the potential to become, industry leaders
- have the potential to outperform during market downturns
The Fund may invest in foreign securities (directly and through depositary
receipts).
To manage risk, the portfolio manager limits sector and individual security
exposure, and adheres to a strong sell discipline.
PRINCIPAL RISKS OF INVESTING IN THIS FUND
--------------------------------------------------------------------------------
You could lose money by investing in the Fund. There can be no assurance that
the Fund's investment objective will be achieved.
FOREIGN SECURITIES RISK: Investing in the securities of foreign issuers involves
special risks and considerations not typically associated with investing in U.S.
companies. The securities of foreign companies may be less liquid and may
fluctuate more widely than those traded in U.S. markets. Foreign companies and
markets may also have less governmental supervision. There may be difficulty in
enforcing contractual obligations and little public information about the
companies. Trades typically take more time to settle and clear, and the cost of
buying and selling foreign securities is generally higher than similar costs
associated with U.S. traded securities.
- CURRENCY RISK: The value of the securities held by the Fund may be
affected by changes in exchange rates or control regulations. If a local
currency gains against the U.S. dollar, the value of the holding increases
in U.S. dollar terms. If a local currency declines against the U.S.
dollar, the value of the holding decreases in U.S. dollar terms.
- POLITICAL/ECONOMIC RISK: Changes in economic, tax or foreign investment
policies, or other political, governmental or economic actions can
adversely affect the value of the securities in the Fund.
- REGULATORY RISK: In foreign countries, accounting, auditing and financial
reporting standards and other regulatory practices and requirements are
generally different from those required for U.S. companies.
GROWTH STYLE RISK: Growth investing involves buying stocks that have relatively
high price-to-earnings ratios. Growth stocks may be more volatile than other
stocks because they are generally more sensitive to investor perceptions and
market moves. During periods of growth stock underperformance, the Fund's
performance may suffer.
LIQUIDITY RISK: When there is no willing buyer and investments cannot be readily
sold at the desired time or price, the Fund may need to accept a lower price or
may not be able to sell the security at all. An inability to sell securities can
adversely affect the Fund's value or prevent the Fund from being able to take
advantage of other investment opportunities.
MANAGER RISK: The performance of the Fund is dependent upon the investment
adviser's skill in selecting managers and the portfolio manager's skill in
making appropriate investments. As a result, the Fund may underperform its
benchmark or its peers.
MARKET RISK: The Fund's share price can move down in response to stock market
conditions, changes in the economy or a particular company's stock price. An
individual stock may decline in value even when the value of stocks in general
is rising.
For additional information regarding the Fund, please refer to the "Investment
Terms" and "Additional Information Regarding Investment Strategies" Sections.
6
Aston Growth Fund (continued)
--------------------------------------------------------------------------------
FUND PERFORMANCE
--------------------------------------------------------------------------------
The bar chart shows how the Fund's performance has varied from year-to-year over
the periods shown. This information may help illustrate the risks of investing
in the Fund. As with all mutual funds, past performance (before and after taxes)
does not guarantee future performance.
CALENDAR YEAR TOTAL RETURN*
2003 21.25%
2004 5.30%
2005 0.79%
2006 3.07%
2007 4.28%
2008 (32.80%)
Best Quarter: 6/03 10.79%
Worst Quarter: 12/08 (20.30)%
The following table indicates how the Fund's average annual total returns for
different calendar periods compared to the returns of a broad-based securities
market index. All figures assume reinvestment of dividends and distributions. It
is not possible to invest in an index.
AVERAGE ANNUAL TOTAL RETURN*
(For the period ended December 31, 2008)
Since
1 Year 5 Years Inception(a)
------ ------- ------------
Aston Growth Fund:
Return Before Taxes (32.80)% (5.18)% (1.21)%
Return After Taxes on Distributions (32.81)% (6.46)% (2.33)%
Return After Taxes on Distributions and
Sale of Fund Shares (21.31)% (3.90)% (0.65)%
------ ----- -----
Russell 1000 Growth Index(b) (38.44)% (3.42)% 1.45%
------ ----- -----
(a)Inception of Class R shares: December 31, 2002. Index data computed from
December 31, 2002.
(b)Reflects no deduction for taxes, fees or expenses.
* Montag & Caldwell, Inc. became the subadviser as of January 1, 2008.
Performance prior to that date reflects the performance of a previous
subadviser.
After-tax returns are calculated using the highest historical marginal
individual federal income tax rates and do not reflect the impact of state and
local taxes. In some instances, the "Return After Taxes on Distributions and
Sale of Fund Shares" may be greater than "Return Before Taxes" because the
investor is assumed to be able to use the capital loss of the sale of Fund
shares to offset other taxable gains. After-tax returns depend on an investor's
tax situation and may differ from those shown. After-tax returns shown are not
relevant to investors who hold their shares through tax-deferred arrangements,
such as 401(k) plans or individual retirement accounts.
7
Fund Expenses
--------------------------------------------------------------------------------
As an investor in the Fund, you pay certain indirect fees and expenses, which
are described in the table below.
SHAREHOLDER FEES
As a benefit of investing in Class R shares of the Fund, you do not incur any
sales loads, exchange fees, or redemption fees.
ANNUAL FUND OPERATING EXPENSES
Operating expenses are the normal costs of operating any mutual fund. These
expenses are not charged directly to investors. They are paid from the Fund's
assets and are expressed as an expense ratio, which is a percentage of average
daily net assets.
ACQUIRED TOTAL
MANAGEMENT DISTRIBUTION OTHER FUND FEES EXPENSE
FUND FEES (12B-1) FEES EXPENSES AND EXPENSES RATIO
Aston Growth Fund(a) 0.70%() 0.50% 0.19% -- 1.39%(b)
(a)In addition to Class R shares, the Fund offers two other classes of shares
that invest in the same portfolio of securities. Shareholders of Class N shares
are subject to a 12b-1 distribution fee and no shareholder service fee, and
shareholders of Class I shares are not subject to a 12b-1 distribution fee or a
shareholder service fee; therefore expense and performance figures will vary
among the classes. The information in the table above and the example below
relate to the Class R shares, which are offered in this prospectus. Class N
shares and Class I shares are offered in separate prospectuses.
(b)The expense ratio does not include interest expense incurred by the Fund from
utilizing a line of credit. If interest expense was included, the net expense
ratio for the Fund would be 1.40%.
EXAMPLE
This hypothetical example shows the operating expenses you would incur as a
shareholder if you invested $10,000 in the Fund over the time periods shown and
you redeem all your shares at the end of the period. The example assumes you
reinvested all dividends and distributions, that the average annual return was
5% and that operating expenses remained the same. The example is for comparison
purposes only and does not represent the Fund's actual or future expenses and
returns.
1 YEAR 3 YEARS 5 YEARS 10 YEARS
Aston Growth Fund $142 $440 $761 $1,669
8
Additional Information Regarding Investment Strategies
--------------------------------------------------------------------------------
In addition to the principal investment strategies described in the Fund
Summaries, there may be times when the Funds use secondary investment strategies
in seeking to achieve their investment objectives. Information regarding such
secondary strategies, as well as additional information regarding certain
principal strategies, is shown below.
DEPOSITARY RECEIPTS OF FOREIGN SECURITIES
The Funds may invest in foreign securities in the form of depositary receipts
and/or securities traded directly on U.S. exchanges. Depositary receipts
represent ownership of securities in foreign companies and are held in banks and
trust companies. They can include ADRs, which are traded on U.S. exchanges and
are U.S. dollar-denominated, EDRs, which are traded on European exchanges and
may not be denominated in the same currency as the security they represent, and
GDRs, which are issued globally and evidence a similar ownership arrangement.
Although ADRs, EDRs and GDRs do not eliminate the risks inherent in investing in
the securities of foreign issuers, which include market, political, currency and
regulatory risk, by investing in ADRs, EDRs or GDRs rather than directly in
securities of foreign issuers, the Funds may avoid currency risks during the
settlement period for purchases or sales. In general, there is a large, liquid
market in the United States for many ADRs. The information available for ADRs is
subject to the accounting, auditing and financial reporting standards of the
domestic market or exchange on which they are traded, in which standards are
more uniform and more exacting than those to which many foreign issuers may be
subject. A Fund may invest in ADRs sponsored or unsponsored by the issuer of the
underlying security. In the case of an unsponsored ADR, a Fund may bear higher
expenses and encounter greater difficulty in receiving shareholder
communications than it would have with a sponsored ADR.
COMMERCIAL PAPER
Commercial paper are short-term fixed income securities issued by banks,
corporations and other borrowers. There is the risk that the issuer of the
commercial paper will not be able to make principal and/or interest payments.
Commercial paper may include securities issued in reliance on the private
placement exemption under Section 4(2) of the Securities Act of 1933, as
amended. Section 4(2) paper is generally sold to an institutional investor, such
as a Fund, that agrees that it is purchasing the paper for investment and not
with a view to public distribution. Any resale of Section 4(2) commercial paper
must similarly be in an exempt transaction.
CONVERTIBLE SECURITIES
Convertible securities are fixed income or equity securities that pay interest
or dividends and that may be exchanged on certain terms into common stock of the
same corporation.
Because of the conversion feature, the market value of convertible securities
tends to move together with the market value of the underlying stock. The value
of convertible securities is also affected by prevailing interest rates, the
credit quality of the issuer and any call provisions. There is the risk that the
issuer of the security will not be able to make principal and/or interest
payments as well as the risk that the holder of the security may not take
advantage of the convertible features in the appropriate time frame.
CORPORATE DEBT SECURITIES
Corporate debt securities are fixed income securities issued by businesses.
Notes, bonds, debentures and commercial paper are the most prevalent types of
corporate debt securities. A Fund may also purchase interests in bank loans made
to companies. The credit risks of corporate debt securities vary widely among
issuers.
In addition, the credit risk of an issuer's debt security may vary based on its
priority for repayment. For example, higher ranking (senior) debt securities
have a higher priority than lower ranking (subordinated) securities. This means
that the issuer might not make payments on subordinated securities while
continuing to make payments on senior securities. In addition, in the event of
bankruptcy, holders of senior securities may receive amounts otherwise payable
to the holders of subordinated securities.
Some subordinated securities, such as trust preferred and capital securities
notes, also permit the issuer to defer payments under certain circumstances. For
example, insurance companies issue securities known as surplus notes that permit
the insurance company to defer any payment that would reduce its capital below
regulatory requirements.
DEBENTURES
Debentures are bonds or promissory notes that are secured by the general credit
of the issuer, but not secured by specific assets of the issuer. There is the
risk that the issuer of the security will not be able to make principal and/or
interest payments.
DEFENSIVE STRATEGY
There may be times when a Fund takes temporary positions that may not achieve
its investment objective or follow its principal investment strategies for
defensive reasons. This includes investing all or a portion of its total assets
in cash or cash equivalents, such as money market securities and repurchase
agreements. Although a Fund would do this in seeking to avoid losses, following
a defensive strategy could reduce the benefit from any market upswings.
9
Additional Information Regarding Investment Strategies (continued)
--------------------------------------------------------------------------------
DERIVATIVES
The Funds may engage in derivatives primarily for hedging purposes, to maintain
liquidity or in anticipation of changes in portfolio composition. Derivatives
have a return tied to a formula based upon an interest rate, index, price of a
security, or other measurement. Derivatives include options, futures, forward
contracts, swaps and related products.
Hedging involves using derivatives to offset a potential loss in one position by
establishing an interest in an opposite position. Any loss generated by the
derivative should be offset by gains in the hedged investment. While hedging can
reduce or eliminate losses, it can also reduce or eliminate gains. A Fund may
realize a loss if interest rates, security prices or indices move in the
opposite direction than the portfolio manager anticipates.
Derivatives will only be used when consistent with the objectives and strategy
of a Fund. The portfolio manager(s) will ensure that the effective market
exposure resulting from the use of derivatives will not exceed the total amount
available for investment within a Fund (i.e., the use of derivatives will not
result in a Fund being leveraged). All derivative positions will be covered by
that Fund's existing assets. The portfolio manager(s) will place a limit on the
derivative exposure as a proportion of assets.
EQUITY SECURITIES
Equity securities represent a share of an issuer's earnings and assets, after
the issuer pays its liabilities. A Fund cannot predict the income it will
receive from equity securities because issuers generally have discretion as to
the payment of any dividends or distributions. However, equity securities offer
greater potential for appreciation than many other types of securities, because
their value may increase with the value of the issuer's business. Types of
equity securities include common stocks, preferred stocks, warrants and rights,
convertible securities and other securities that represent underlying total
shares, such as depositary receipts.
FIXED INCOME SECURITIES
Fixed income securities pay interest, dividends or distributions at a specified
rate. The rate may be a fixed percentage of the principal or adjusted
periodically. In addition, the issuer of a fixed income security must repay the
principal amount of the security, normally within a specified time. Fixed income
securities provide more regular income than equity securities. However, the
returns on fixed income securities are limited and normally do not increase with
the issuer's earnings. This limits the potential appreciation of fixed income
securities as compared to equity securities.
A security's yield measures the annual income earned on a security as a
percentage of its price. A security's yield will increase or decrease depending
upon whether it costs less (a discount) or more (a premium) than the principal
amount. If the issuer may redeem the security before its scheduled maturity, the
price and yield on a discount or premium security may change based upon the
probability of an early redemption. Securities with higher risks generally have
higher yields. The Funds may invest in fixed income securities to offset the
volatility of the stock market. Fixed income securities provide a stable flow of
income for a Fund.
FOREIGN SECURITIES
Foreign securities are securities issued by corporations, governments and other
issuers located outside the United States. Foreign securities are subject to
additional risks.
OTHER INVESTMENT COMPANIES
The Funds may invest in securities of other investment companies, including
ETFs, open-end funds and closed-end funds. An ETF is an investment company that
seeks to track the performance of an index by holding in its portfolio shares of
all the companies, or a representative sample of the companies, that are
components of a particular index. Closed-end funds are investment companies that
typically issue a fixed number of shares that trade on a securities exchange or
over-the-counter. The risks of investment in other investment companies
typically reflect the risk of the types of securities in which the funds invest.
Investments in ETFs and closed-end funds are subject to the additional risk that
shares of the fund may trade at a premium or discount to their net asset value
per share. When a Fund invests in another investment company, shareholders of
the Fund bear their proportionate share of the other investment company's fees
and expenses as well as their share of the Fund's fees and expenses.
PREFERRED STOCKS
Preferred stocks are stocks that pay dividends at a specified rate. Dividends
are paid on preferred stocks before they are paid on common stocks. In addition,
preferred stockholders have priority over common stockholders as to the proceeds
from the liquidation of a company's assets, but are subordinate to the claims of
all creditors.
REPURCHASE AGREEMENTS
Repurchase agreements, or repos, are transactions in which a security (usually a
government security) is purchased with a simultaneous commitment to sell it back
to the seller (a commercial bank or recognized securities dealer) at an agreed
upon price on an agreed upon date, usually the next day. If the seller of the
underlying security under the repurchase agreement should default on its
obligation to repurchase the underlying security, a Fund may experience delay or
difficulty in exercising its right to realize upon the security. Additionally, a
Fund may incur a
10
Additional Information Regarding Investment Strategies (continued)
--------------------------------------------------------------------------------
loss if the value of the security should decline, as well as any disposition
costs in liquidating the security.
RULE 144A SECURITIES
Rule 144A securities are restricted securities that can be sold to qualified
institutional buyers under the Securities Act of 1933, as amended. Investing in
Rule 144A securities may increase the illiquidity of a Fund's investments in the
event that an adequate trading market does not exist for these securities. To
the extent there is an adequate trading market for lower-rated securities, Rule
144A securities generally are not subject to an increase in illiquidity.
U.S. GOVERNMENT SECURITIES
These are fixed income obligations of the U.S. government and its various
agencies. U.S. government securities issued by the U.S. Treasury (bills, notes
and bonds) are backed by the full faith and credit of the federal government.
Some government securities not issued by the U.S. Treasury also carry the
government's full faith and credit backing on principal or interest payments.
Some securities are backed by the issuer's right to borrow from the U.S.
Treasury and some are backed only by the credit of the issuing organization. All
government securities are considered highly creditworthy. This guarantee,
however, does not extend to the market prices for such securities which can
fluctuate.
More information about the risks associated with investing in the Funds can also
be found in the Funds' statement of additional information ("SAI").
11
Investment Terms
--------------------------------------------------------------------------------
The following is a list of terms with definitions that you may find helpful as
you read this prospectus.
AMERICAN DEPOSITARY RECEIPTS (ADRS). ADRs represent ownership of securities in
foreign stock and are issued by U.S. banks and trust companies. ADRs are
denominated in U.S. dollars and are traded on a U.S. exchange.
BOTTOM-UP INVESTING: An investing approach in which securities are researched
and chosen individually with less consideration given to economic or market
cycles.
CORPORATE BONDS: Fixed income securities issued by corporations.
DIVERSIFICATION: The practice of investing in a broad range of securities to
reduce risk.
EUROPEAN DEPOSITARY RECEIPTS (EDRS). EDRs represent ownership of securities in
foreign stock and are issued by a foreign bank. EDRs are generally denominated
in foreign currencies and may not be denominated in the same currency as the
securities they represent. Generally, EDRs are designed for use in the foreign
securities markets.
EXCHANGE-TRADED FUND (ETF). An ETF is an investment company that seeks to track
the performance of an index by holding in its portfolio either the contents of
the index or a representative sample of the securities in the index.
EXPENSE RATIO: A fund's cost of doing business, expressed as a percentage of its
net assets and disclosed in a prospectus.
GLOBAL DEPOSITARY RECEIPTS (GDRS). GDRs represent ownership of securities in
foreign stock and are issued by a foreign bank. GDRs are generally denominated
in foreign currencies and may not be denominated in the same currency as the
securities they represent. Generally, GDRs are designed for use in the foreign
securities markets.
GROWTH STYLE INVESTING: An investing approach that involves buying stocks of
companies that are generally industry leaders with above-average, sustainable
growth rates. Typically, growth stocks are the stocks of the fastest growing
companies in the most rapidly growing sectors of the economy. Growth stock
valuation levels (e.g., price-to-earnings ratio) will generally be higher than
value stocks.
INVESTMENT OBJECTIVE: The goal that an investor and a mutual fund seek together.
Examples include current income, total return, long-term capital growth, etc.
ISSUER: The company that issues a security, such as a stock, bond or money
market security.
LARGE-CAP STOCKS: Stocks issued by large companies. Unless otherwise defined by
a portfolio manager, subadviser or the adviser, a large-cap company is defined
as one with a market capitalization of $5 billion or more. Typically, large-cap
companies are established, well-known companies; some may be multi-nationals.
MANAGEMENT FEE: The amount that a mutual fund pays to the investment adviser for
its services.
MARKET CAPITALIZATION: Value of a corporation or other entity as determined by
the market price of its securities.
MUTUAL FUND: An investment company that stands ready to buy back its shares at
their current net asset value. Most mutual funds continuously offer new shares
to investors.
NET ASSET VALUE (NAV): The per share value of a mutual fund, found by
subtracting the fund's liabilities from its assets and dividing by the number of
shares outstanding. Mutual funds calculate their NAVs at least once a day.
RISK/REWARD TRADE-OFF: The principle that an investment must offer higher
potential returns as compensation for the likelihood of increased volatility.
RUSSELL 1000 GROWTH INDEX. An unmanaged index measuring the performance of those
Russell 1000 companies with higher price-to-book ratios and higher forecasted
growth values.
TOTAL RETURN: A measure of a fund's performance that encompasses all elements of
return: dividends, capital gains distributions and changes in net asset value.
Total return is the change in value of an investment over a given period,
assuming re-investment of dividends and capital gains distributions, expressed
as a percentage of the initial investment.
12B-1 FEE: A mutual fund fee, named for the Securities and Exchange Commission
("SEC") rule that permits it, used to pay for distribution costs, such as
advertising and commissions paid to dealers. (See "Distribution Plan 12b-1 Fees"
in the "Shareholder Information" Section.)
12
Portfolio Holdings
--------------------------------------------------------------------------------
A description of the policies and procedures with respect to the
disclosure of each Fund's portfolio holdings is available in the SAI
and on our Web site at www.astonfunds.com.
13
Management of the Funds
--------------------------------------------------------------------------------
THE INVESTMENT ADVISER
--------------------------------------------------------------------------------
ASTON ASSET MANAGEMENT LLC
Aston Asset Management LLC ("Aston" or "Adviser"), 120 N. LaSalle Street, 25th
Floor, Chicago, IL 60602, is the investment adviser to the Funds. Aston, a
majority owned subsidiary of Highbury Financial Inc., was formed for the purpose
of acquiring the mutual fund and separately managed account business of ABN AMRO
Asset Management, Inc. and its affiliates ("ABN AMRO"). More information on
Highbury Financial Inc. is available in the SAI. Aston was formed in April 2006
and as of December 31, 2008, Aston had approximately $3.4 billion in assets
under management.
Aston provides investment advisory, mutual fund administration and distribution-
related services to the Aston Funds. Aston manages each Fund by selecting one or
more other investment managers to manage the Fund's portfolio on a sub-advisory
basis. Aston is responsible for identifying and selecting each Fund's investment
managers, monitoring the performance of such managers, and terminating managers.
Aston and the Aston Funds have received from the SEC an exemptive order that
allows Aston to allocate and reallocate the assets of each Fund between and
among any subadvisers so selected pursuant to a "manager of managers" structure.
Under this structure, Aston has the authority to retain and terminate
subadvisers, engage new subadvisers and make material revisions to the terms of
the subadvisory agreements subject to the approval of the Board of Trustees, but
not shareholder approval.
GENERAL
As the investment adviser to the Funds, Aston is paid an annual management fee
based on the average daily net assets of a Fund. Out of its fee, Aston pays the
subadviser of each Fund. The table, later in this "Management of the Funds"
Section, shows the management fees paid by each Fund to Aston for the most
recent fiscal year. The investment advisory agreement with Aston may be
terminated at any time by the Fund or Aston upon 60 days' written notice to the
other party. A Fund may effect termination by an action of the Board of Trustees
or by a vote of a majority of the Fund's outstanding voting securities.
A discussion regarding the basis for the Board of Trustees' approval of the
Funds' investment advisory agreements and subadvisory agreements (as applicable)
will be included in the Funds' next annual or semiannual report following such
approval.
THE SUBADVISER
--------------------------------------------------------------------------------
The accompanying information highlights each Fund's subadviser and its portfolio
manager. Additional information about the portfolio manager's compensation,
other accounts managed by the portfolio manager and the portfolio manager's
ownership of securities in the Funds is available in the SAI.
ASTON/MONTAG & CALDWELL GROWTH FUND
ASTON GROWTH FUND
Montag & Caldwell, Inc., ("Montag & Caldwell"), 3455 Peachtree Road NE Suite
1200, Atlanta, Georgia 30326, was founded in 1945. Montag & Caldwell is a
wholly-owned direct subsidiary of Fortis Bank SA/NV ("Fortis Bank"). Since
October 2008, the Belgian government has owned substantially all of the
outstanding capital and voting rights of Fortis Bank pending a sale to a private
buyer. Fortis Bank and its affiliates subsequently announced a transaction in
which BNP Paribas SA would acquire approximately 75% of the outstanding capital
and voting rights of Fortis Bank. The BNP Paribas transaction is subject to
legal challenges and numerous closing conditions, and remains pending as of the
date of this prospectus. Montag & Caldwell is the subadviser to the above Funds,
and as of December 31, 2008, managed approximately $10.4 billion in assets in
institutional accounts and mutual funds.
14
Management of the Funds (continued)
--------------------------------------------------------------------------------
PORTFOLIO MANAGER
--------------------------------------------------------------------------------
Portfolio
FUND NAME Manager Investment Experience
--------------------------------------------------------------------------------------
ASTON/MONTAG & CALDWELL GROWTH FUND
Ronald E. Portfolio Manager since the Fund's inception in
Canakaris, CFA, 1994; Chairman, President and Chief Investment
CIC Officer of Montag & Caldwell. He has been with
the firm since 1972 and is responsible for
developing the firm's investment process. He
has a BS and BA from the University of Florida.
ASTON GROWTH FUND
Ronald E. Portfolio Manager of the Fund since January
Canakaris, CFA, 2008. Please see above.
CIC
Additional information about the portfolio manager's compensation, other
accounts managed and the portfolio manager's ownership of securities in the
Funds is available in the SAI.
MANAGEMENT FEES
--------------------------------------------------------------------------------
MANAGEMENT FEE PAID FOR
MANAGEMENT FEE FISCAL YEAR ENDED 10/31/08
FUND NAME (AS A PERCENTAGE OF NET ASSETS) (AS A PERCENTAGE OF NET ASSETS)
Aston/Montag & Caldwell First $800 million 0.80% 0.69%
Growth Fund Over $800 million 0.60%
Aston Growth Fund 0.70% 0.69%
15
Shareholder Information
--------------------------------------------------------------------------------
OPENING AN ACCOUNT
--------------------------------------------------------------------------------
- Class R shares are sold primarily to qualified retirement plans,
retirement savings programs and other similar programs offered primarily
through financial intermediaries. Contact your financial representative or
plan sponsor.
- Read this prospectus carefully.
- Determine how much you want to invest. The minimum initial investment
requirements for the Funds are as follows:
o Regular accounts: $2,500
o Individual Retirement Accounts (IRAs): $500
- Complete the account application with your financial representative.
- Purchase, exchange and redemption requests received and processed before
New York Stock Exchange ("NYSE") market close, typically 4:00 p.m. Eastern
time ("ET"), receive that business day's closing NAV. Trades received
after that time receive the following business day's NAV.
- Make your initial investment through your financial representative.
- All account openings and subsequent transaction requests must be in "good
order."
BUYING SHARES
--------------------------------------------------------------------------------
You may purchase additional shares through your financial representative or
directly from the Aston Funds. The price of Class R shares is the NAV.
After your initial investment, additional investments of $50 or more may be
made. You may also make automatic investments under the Automatic Investment
Plan described in "Automatic Investment Plan" later in this "Shareholder
Information" Section.
Make additional investments using the following table as a guideline. All buy
requests and subsequent transaction requests must be in "good order."
BUYING SHARES TO ADD TO AN ACCOUNT ($50 MINIMUM)
-------------------------------------------------------------------------------------
THROUGH YOUR - Your financial representative is responsible for transmitting the
FINANCIAL order promptly.
REPRESENTATIVE
BY MAIL - Return the investment slip from a statement with your check in
the envelope provided and mail to us at the address at the left.
ASTON FUNDS
P.O. BOX 9765 - We accept checks, bank drafts, money orders, wires and ACH for
PROVIDENCE, RI purchases (see "Other Features" later in this "Shareholder
02940 Information" Section). Checks must be drawn on U.S. banks. There
is a minimum $20 charge for returned checks.
OR
- We do not accept travelers, temporary, post-dated, credit card
OVERNIGHT courtesy, second or third party checks (which are checks made
DELIVERY payable to someone other than the Funds, including you).
ASTON FUNDS - Give the following wire/ACH information to your bank:
101 SABIN STREET PNC Bank
PAWTUCKET, RI ABA #031-000-053
02860 For: Aston Funds
A/C 8611758079
FBO "Aston Fund Number"
"Your Account Number"
- Include your name, account number, taxpayer identification number
or social security number, address and the Fund(s) you wish to
purchase in the wiring instructions.
16
Shareholder Information (continued)
--------------------------------------------------------------------------------
BUYING SHARES TO ADD TO AN ACCOUNT ($50 MINIMUM)
-------------------------------------------------------------------------------------
BY PHONE - Verify that your bank or credit union is a member of the ACH.
800 992-8151 - To place your request with an Investor Services Associate, call
between 9 a.m. and 7 p.m. ET, Monday - Friday.
- You should complete the "Bank Account Information" section of
your account application.
- When you are ready to add to your account, call Aston Funds and
tell the representative the Fund name, account number, the
name(s) in which the account is registered and the amount of your
investment.
- Instruct your bank (who may charge a fee) to wire or ACH the
amount of your investment.
- Give the following wire/ACH information to your bank:
PNC Bank
ABA #031-000-053
For: Aston Funds
A/C 8611758079
FBO "Aston Fund Number"
"Your Account Number"
- Include your name, account number, taxpayer identification number
or social security number, address and the Fund(s) you wish to
purchase in the wire instructions.
BY INTERNET - Verify that your bank or credit union is a member of the ACH.
WWW.ASTONFUNDS. COM - Complete the "Purchase, Exchange and Redemption Authorization"
section of your account application.
- Self-register for online account access at www.astonfunds.com.
Your social security number or employer identification number,
account number and other security validating information will be
required for registration.
- When you are ready to add to your account, access your account
through Aston Funds' Web site and enter your purchase
instructions in the highly secure area for shareholders only
called "Account Access." ACH purchases on Internet may take 3 to
4 business days.
Other share classes of Aston Funds are available through separate prospectuses.
Please call 800 992-8151 for more information.
BUY, EXCHANGE AND SELL REQUESTS ARE IN "GOOD ORDER" WHEN
- The account number and Fund name are included.
- The amount of the transaction is specified in dollars or shares
- Signatures of all owners appear exactly as they are registered on the
account in original form, as photocopies are not acceptable.
- Any required Medallion Signature Guarantees (if applicable) are included.
- Other supporting legal documents (as necessary) are present, including
such "Requirements for Written Requests" as described later in the
"Shareholder Information" Section.
EXCHANGING SHARES
--------------------------------------------------------------------------------
After you have opened an account with us, you can exchange your shares within
Aston Funds to meet your changing investment goals or other needs. This
privilege is not designed for frequent trading and may be difficult to implement
in times of drastic market changes.
You can exchange shares from one Aston Fund to another within the same class of
shares. All exchanges to open new accounts must meet the minimum initial
investment requirements. Exchanges may be made by mail, through the Internet or
by phone at 800 992-8151 if you chose this option when you opened your account.
For federal income tax purposes, each exchange into a different fund is treated
as a sale and a new purchase. As a result, an investor, except with respect to
shares held in tax-deferred accounts, generally is subject to federal income tax
on any appreciation on the shares exchanged.
17
Shareholder Information (continued)
--------------------------------------------------------------------------------
HOW DOES AN EXCHANGE TAKE PLACE?
When you exchange your shares, you authorize the sale of your shares in one fund
to purchase shares of another fund. In other words, you are requesting a sale
and then a purchase. The exchange of your shares may be a taxable event for
federal income tax purposes if the shares are not held in a tax deferred
account.
Aston Funds reserves the right to limit, impose charges upon, terminate or
otherwise modify the exchange privilege by sending written notice to
shareholders. All exchange requests must be in "good order."
SELLING/REDEEMING SHARES
--------------------------------------------------------------------------------
Once you have opened an account with us, you can sell your shares to meet your
changing investment goals or other needs. To redeem shares, contact your
financial representative or you may redeem directly from Aston Funds. All
redemption requests must be in "good order." The following table shows
guidelines for selling shares.
SELLING SHARES DESIGNED FOR . . . TO SELL SOME OR ALL OF YOUR SHARES . . .
---------------------------------------------------------------------------------------
THROUGH YOUR - Accounts of any - Your financial representative is
FINANCIAL type responsible for transmitting the order
REPRESENTATIVE promptly.
BY MAIL - Accounts of any - Write and sign a letter of instruction
type indicating the Fund name, Fund number,
ASTON FUNDS your account number, the name(s) in which
P.O. BOX 9765 - Sales or the account is registered and the dollar
PROVIDENCE, RI redemptions of any value or number of shares you wish to
02940 size (for sell.
OR redemptions over
$50,000, please - Include all signatures and any additional
OVERNIGHT DELIVERY see Medallion documents that may be required. (see
Signature "Selling Shares in Writing" later in this
ASTON FUNDS Guarantee later in "Shareholder Information" Section.)
101 SABIN STREET this "Shareholder Signatures must be in original form, as
PAWTUCKET, RI 02860 Information" photocopies are not accepted.
Section)
- Mail to us at the address at the left.
- A check will be mailed to the name(s) and
address in which the account is
registered. If you would like the check
mailed to a different address, you must
write a letter of instruction and have it
Medallion Signature Guaranteed.
- Proceeds may also be sent by wire or ACH
(see "Other Features" later in this
"Shareholder Information" Section).
BY PHONE - Non-retirement - For automated service 24 hours a day using
accounts your touch-tone phone, call 800 992-8151.
800 992-8151
- Sales of up - To place your request with an Investor
$50,000 (for Services Associate, call between 9 a.m.
accounts with and 7 p.m. ET, Monday - Friday.
telephone account
privileges) - A check will be mailed to the name(s) and
address in which the account is
registered. If you would like the check
mailed to a different address, you must
write a letter of instruction and have it
Medallion Signature Guaranteed.
- Proceeds may also be sent by wire or ACH
(see "Other Features" later in this
"Shareholder Information" Section).
- The Funds reserve the right to refuse any
telephone sales request and may modify the
procedures at any time. The Funds make
reasonable attempts to verify that
telephone instructions are genuine, but
you are responsible for any loss that you
may bear from telephone requests.
18
Shareholder Information (continued)
--------------------------------------------------------------------------------
SELLING SHARES DESIGNED FOR . . . TO SELL SOME OR ALL OF YOUR SHARES . . .
---------------------------------------------------------------------------------------
BY INTERNET - Non-retirement - Complete the "Purchase, Exchange and
accounts Redemption Authorization" section of your
WWW.ASTONFUNDS.COM account application.
- Self-register for online account access at
www.astonfunds.com. Your social security
number or employer identification number,
account number and other security
validating information will be required
for registration.
- When you are ready to redeem a portion of
your account, access your account through
Aston Funds' Web site and enter your
redemption instructions in the highly
secure area for shareholders only called
"Account Access." A check for the proceeds
will be mailed to you at your address of
record.
- Proceeds may also be sent by wire or ACH
(see "Other Features" later in this
"Shareholder Information" Section).
SELLING SHARES IN WRITING
In certain circumstances, you must make your request to sell shares in writing.
You may need to include a Medallion Signature Guarantee (which protects you
against fraudulent orders) and additional items with your request, as shown in
the table below.
WE REQUIRE MEDALLION SIGNATURE GUARANTEES IF:
- your address of record has changed within the past 30 days
- you are selling more than $50,000 worth of shares
- you are requesting payment other than by a check mailed to the address of
record and payable to the registered owner(s) or other than wire or ACH
sent to the bank account of the registered owner(s)
19
Shareholder Information (continued)
--------------------------------------------------------------------------------
SELLER REQUIREMENTS FOR WRITTEN REQUESTS
Owners of individual, - Letter of instruction
joint, sole
proprietorship, or - On the letter, the signatures and titles of all persons
general partner authorized to sign for the account, exactly as the account
accounts is registered, must be in original form, as photocopies are
not accepted
- MEDALLION SIGNATURE GUARANTEE, if applicable (see next page
for more details)
Owners of corporate or - Letter of instruction
association accounts
- Corporate resolution certified within the past 12 months
- On the letter, the signatures and titles of all persons
authorized to sign for the account, exactly as the account
is registered, must be in original form as photocopies are
not accepted
- MEDALLION SIGNATURE GUARANTEE, if applicable (see next page
for more details)
Owners or trustees of - Letter of instruction
trust accounts
- On the letter, the signature of the trustee(s) must be in
original form, as photocopies are not accepted
- If the names of all trustees are not registered on the
account, a copy of the trust document certified within the
past 12 months
- MEDALLION SIGNATURE GUARANTEE, if applicable (see next page
for more details)
Joint tenancy - Letter of instruction signed by the surviving tenant must
shareholders whose co- be in original form, as photocopies are not accepted
tenants are deceased
- Certified copy of death certificate
- MEDALLION SIGNATURE GUARANTEE, if applicable (see next page
for more details)
Executors of - Letter of instruction signed by executor must be in
shareholder estates original form, as photocopies are not accepted
- Certified copy of order appointing executor
- MEDALLION SIGNATURE GUARANTEE, if applicable (see next page
for more details)
Administrators, - Call 800 992-8151 for instructions
conservators,
guardians and other - MEDALLION SIGNATURE GUARANTEE, if applicable (see next page
sellers or account for more details)
types not listed above
IRA accounts - IRA distribution request form completed and signed. Call
800 992-8151 for a form, or download a form from our
website www.astonfunds.com.
In addition to the situations described above, Aston Funds may require Medallion
Signature Guarantees in other circumstances based on the amount of the
redemption request or other factors.
OTHER FEATURES
The following other features are also available to buy and sell shares of the
Funds.
WIRE. To purchase and sell shares via the Federal Reserve Wire System:
- You must authorize Aston Funds to honor wire instructions before using
this feature. Complete the appropriate section on the application when
opening your account or call 800 992-8151 to add the feature after your
account is opened. Call 800 992-8151 before your first use to verify that
this feature is set up on your account.
- To sell shares by wire, you must designate the U.S. commercial bank
account(s) into which you wish the redemption proceeds deposited.
For accounts with existing wire instructions, wire redemptions may be placed
over the phone. Consult your banking institution for any fees they may charge
associated with wire transfers. Any changes made to existing wire instructions
will only be accepted with a Medallion Signature Guaranteed letter of
instruction.
20
Shareholder Information (continued)
--------------------------------------------------------------------------------
WHAT IS A MEDALLION SIGNATURE GUARANTEE?
A Medallion Signature Guarantee verifies the authenticity of your signature and
may be obtained from a domestic bank or trust company, broker, dealer, clearing
agency, savings association or other financial institution which is
participating in a Medallion Program recognized by the Securities Transfer
Association.
Medallion Signature Guarantees help ensure that major transactions or changes to
your account are in fact authorized by you. For example, we require a Medallion
Signature Guarantee on written redemption requests for more than $50,000. The
three recognized medallion programs are Securities Transfer Agents Medallion
Program (STAMP), Stock Exchanges Medallion Program (SEMP) and New York Stock
Exchange, Inc. Medallion Signature Program (NYSE MSP). Signature guarantees from
financial institutions which are not participating in one of these programs will
not be accepted.
A NOTARY PUBLIC STAMP OR SEAL CANNOT BE SUBSTITUTED FOR A MEDALLION SIGNATURE
GUARANTEE.
AUTOMATED CLEARING HOUSE (ACH). To transfer money between your bank account and
your Aston Funds account(s):
- You must authorize Aston Funds to honor ACH instructions before using this
feature. Complete the appropriate section on the application when opening
your account or call 800 992-8151 to add the feature after your account is
opened. Call 800 992-8151 before your first use to verify that this
feature is set up on your account.
- Most transfers are completed within three business days of your call. ACH
purchases will receive the NAV calculated on the day the money is
received.
- There is no fee to your account for this transaction and generally, no fee
from your bank.
REDEMPTIONS IN KIND
The Funds have elected, under Rule 18f-1 under the Investment Company Act of
1940, as amended, to pay sales proceeds in cash up to $250,000 or 1% of a Fund's
total value during any 90-day period for any one shareholder, whichever is less.
Larger redemptions may be detrimental to existing shareholders. While we intend
to pay all sales proceeds in cash, we reserve the right to make payments to you
for larger redemptions in the form of certain marketable securities of a Fund.
This is called a "redemption in kind." You may need to pay certain sales charges
related to a redemption in kind, such as brokerage commissions, when you sell
the securities. For shares that are not held in a tax deferred account,
redemptions in kind are taxable for federal income tax purposes in the same
manner as when sales proceeds are paid in cash.
INVOLUNTARY REDEMPTIONS
To reduce expenses, we may sell your shares and close your fund position(s) if
its value falls below $1,500 for any reason. Unless you did not meet the minimum
initial investment, we will give you 30 days notice before we sell your shares.
This gives you an opportunity to purchase enough shares to raise the value of
your fund position above $2,500 (the minimum initial investment for regular
accounts) to avoid closing it out. We will not close out fund positions in IRAs
or active Automatic Investment Plans.
TRANSACTION POLICIES
--------------------------------------------------------------------------------
CALCULATING SHARE PRICE
When you buy, exchange or sell shares, the NAV next determined is used to price
your purchase or sale. The NAV for each share class of a Fund is determined each
business day at the close of regular trading on the NYSE (typically 4 p.m. ET)
by dividing the class's net assets by the number of its shares outstanding.
Currently, each Fund observes the following holidays: New Year's Day, Martin
Luther King, Jr. Day, Presidents' Day, Good Friday, Memorial Day, Independence
Day, Labor Day, Thanksgiving Day and Christmas Day. Generally, market quotes are
used to price securities. If market quotations are not available or are deemed
unreliable, securities are valued at fair value as determined by the investment
adviser in accordance with guidelines adopted and periodically reviewed by the
Board of Trustees. These circumstances may arise, for instance, when trading in
a security is suspended, the exchange or market on which a security is traded
closes early, or the trading volume in a security is limited, calling into
question the reliability of market quotations. In such a case, the Fund's value
for a security is likely to be different from the last quoted market price. In
addition, due to the subjective and variable nature of fair value pricing, it is
possible that the fair value determined for a particular security may be
materially different from the value realized upon such security's sale. The
Board of Trustees receives a report of any actions taken under the Funds' fair
valuation procedures.
Quotations of foreign securities denominated in foreign currency are converted
to U.S. dollar equivalents using foreign exchange quotations received from
independent dealers. Events affecting the values of portfolio securities that
occur between the time their prices are determined and the close of regular
trading on the NYSE may not be reflected in the calculation of NAV. If events
materially affecting the value of such securities occur during such period, then
these securities may be valued at fair value as determined by the investment
adviser in accordance with guidelines adopted by the Board of Trustees.
21
Shareholder Information (continued)
--------------------------------------------------------------------------------
EXECUTION OF REQUESTS
Each Fund is open on each business day that the NYSE is open for trading. The
NYSE is not open on weekends or national holidays. Buy, exchange and sell
requests are executed at the NAV next calculated after Aston Funds or an
authorized broker or designee receives your mail, telephone or Internet request
in "good order". Purchase orders and redemption requests must be received by the
close of regular trading on the NYSE (typically 4 p.m. ET) for same day
processing. On days when the Federal Reserve Cash Settlement System closes
earlier than normal, these times may be accelerated. Sales proceeds are normally
sent the next business day, but are always sent within seven days of receipt of
a request in "good order." Brokers and their authorized designees are
responsible for forwarding purchase orders and redemption requests to the Funds.
Shares of Aston Funds can also be purchased through broker-dealers, banks and
trust departments that may charge you a transaction or other fee for their
services. These fees are not charged if you purchase shares directly from Aston
Funds.
A Fund may be required to "freeze" your account if there appears to be
suspicious activity or if account information matches information on a
government list of known terrorists or other suspicious persons.
Aston Funds reserves the right to:
- refuse any purchase or exchange of shares if it could adversely affect a
Fund or its operations
- suspend the offering of Fund shares
- change the initial and additional investment minimums or waive these
minimums for any investor
- delay sending you your sales proceeds for up to 15 days if you purchased
shares by check. A minimum $20 charge will be assessed if any check used
to purchase shares is returned
- change, withdraw or waive various services, fees and account policies
CUSTOMER IDENTIFICATION PROGRAM
Federal law requires Aston Funds to obtain, verify and record identifying
information for each investor who opens or reopens an account with Aston Funds.
An investor may be an individual or a person other than an individual (such as a
corporation, partnership or trust). Such identifying information may include the
name, residential or business street address, principal place of business, local
office or other physical location (for a person other than an individual), date
of birth (for an individual), social security or taxpayer identification number
or other identifying information. Applications without the required information,
or without any indication that a social security or taxpayer identification
number has been applied for, may not be accepted. After acceptance, to the
extent permitted by applicable law or its customer identification program, Aston
Funds reserves the right (a) to place limits on transactions in any account
until the identity of the investor is verified; or (b) to refuse an investment
in Aston Funds or to involuntarily redeem an investor's shares and close an
account in the event that an investor's identity is not verified. Aston Funds
and its agents will not be responsible for any loss in an investor's account
resulting from the investor's delay in providing all required identifying
information or from closing an account and redeeming an investor's shares when
an investor's identity cannot be verified.
SHORT-TERM AND EXCESSIVE TRADING
The Funds are designed for long-term investors. Each Fund discourages and does
not knowingly accommodate short-term and excessive trading. Such trading
increases brokerage and administrative costs, may result in increased taxable
gains to remaining shareholders and may disrupt portfolio management. For
example, the Funds may be unable to effectively invest the proceeds from certain
purchase or exchange requests under certain market conditions or may incur
losses on the sale of investments. These risks may be more pronounced for Funds
investing in securities that are more difficult to value or that are susceptible
to pricing arbitrage (e.g., foreign securities, high yield securities and small
cap securities). Thus, such trading may negatively impact a Fund's NAV and
result in dilution to long-term shareholders.
In an effort to protect long-term shareholders, the Funds' Board of Trustees has
adopted policies and procedures which seek to deter short-term trading and
excessive trading and to detect such trading activity at levels that may be
detrimental to the Funds. These policies and procedures include the following:
- The Funds have adopted certain fair valuation practices intended to
protect the Funds from time zone arbitrage with respect to foreign
securities and other trading practices that seek to exploit stale prices;
- The Funds or their agents will not be responsible for any unauthorized
telephone or online order when reasonable procedures designed to verify
the identity of the investor are followed.
- The Funds reserve the right to:
o Reject any purchase, including exchange purchases, that could
adversely affect the Funds or their operations;
o Limit, terminate or otherwise modify the exchange privilege of any
shareholder deemed to be engaged in activities that may be
detrimental to the Funds;
o Reject any purchase, including exchange purchases, from investors if
there appears to be evidence of short-term trading or excessive
trading;
o Permanently prevent future purchases and exchanges from occurring in
accounts where short-term trading or excessive trading is apparent;
22
Shareholder Information (continued)
--------------------------------------------------------------------------------
- Delay sending redemption proceeds for up to seven days (generally applies
only in cases of very large redemptions, excessive trading, or during
unusual market conditions);
- Suspend redemptions as permitted by law (e.g., emergency situations).
In making the determination to exercise these rights, the Funds may consider an
investor's trading history in the Funds and accounts under common ownership or
control. The Funds seek to employ reasonable measures to detect short-term and
excessive trading at levels that may be detrimental to the Funds.
Accordingly, the Funds use certain materiality and volume thresholds in applying
the policies and procedures, but otherwise seek to apply the policies and
procedures uniformly to all shareholders. With respect to accounts held through
intermediaries, such intermediaries generally are contractually obligated to
provide the Funds with certain shareholder trading information. However, the
Funds cannot directly control activity through all channels and are dependent on
intermediaries to enforce the Funds' policies and procedures. In certain cases,
intermediaries may be unable to implement these policies or may not be able to
implement policies and procedures in the same manner as the Funds due to system
or other constraints or issues. Shareholders who invest through omnibus accounts
may be subject to policies and procedures that differ from those applied by the
Funds to direct shareholders. The Funds reserve the right to limit an
intermediary's future access to the Funds, up to and including termination of
the Selling Agreement held with said intermediary. There is no assurance that
the Funds' policies and procedures will be effective in limiting and deterring
short-term and excessive trading in all circumstances.
ACCOUNT POLICIES AND DIVIDENDS
--------------------------------------------------------------------------------
ACCOUNT STATEMENTS
In general, you will receive quarterly account statements. In addition, you will
also receive account statements:
- after every transaction that affects your account balance (except for
dividend reinvestments, automatic investment plans or systematic
withdrawal plans)
- after any change of name or address of the registered owner(s)
You will also receive an annual statement that describes the federal income tax
characteristics of any dividends and distributions your Fund has paid to the
investor during the year.
Aston Funds may charge a fee for certain services, such as providing historical
account documents.
MAILINGS TO SHAREHOLDERS
To help reduce Fund expenses and environmental waste, Aston Funds combines
mailings for multiple accounts going to a single household by delivering Fund
reports (annual and semi-annual reports, prospectuses, etc.) in a single
envelope. If you do not want us to continue to consolidate your Fund mailings
and would prefer to receive separate mailings with multiple copies of Fund
reports, please call one of our Investor Services Associates at 800 992-8151.
DISTRIBUTIONS
The Funds distribute income dividends and net capital gains. Income dividends
represent the earnings from a Fund's investments less its expenses; capital
gains generally occur when a Fund sells a portfolio security for more than the
original purchase price.
DIVIDENDS
Dividends, if any, will be declared and paid annually. Capital gains, if any,
will be distributed at least once a year, generally in December.
UNCASHED CHECKS
Checks should be cashed upon receipt, as interest will not be paid on uncashed
checks. State escheat laws generally require the Trust to remit uncashed checks
to the appropriate state after a specific period of time.
DIVIDEND REINVESTMENTS
Investors may have their dividends and distributions reinvested in additional
shares of the same Fund. If you choose this option, or if you do not indicate a
choice, your dividends and distributions will be automatically reinvested on the
dividend payable date. You can also choose to have a check for your dividends
and distributions mailed to you by choosing this option on your account
application.
ADDITIONAL INVESTOR SERVICES
--------------------------------------------------------------------------------
AUTOMATIC INVESTMENT PLAN
The Automatic Investment Plan allows you to set up a regular transfer of funds
from your bank account to the Aston Fund(s) of your choice. You determine the
amount of your investment (minimum: $50, as long as you meet the account
minimum), and you can terminate the program at any time. To take advantage of
this feature, complete the appropriate sections of the account application.
ASTON FUNDS WEB SITE
The Funds maintain a Web site located at www.astonfunds.com. You can purchase,
exchange and redeem shares, and access information such as your account balance
and a Fund's NAV through our Web site. Self-register online for account access
at www.astonfunds.com. Your social security number or employer identification
number, account number and other security
23
Shareholder Information (continued)
--------------------------------------------------------------------------------
validating information will be required to register. You may also need to have
bank account information, wire instructions, ACH instructions or other options
established on your account.
Aston Funds has procedures in place to try to prevent unauthorized access to
your account information. Each Fund and its agents will not be responsible for
any losses resulting from unauthorized transactions on our Web site.
SYSTEMATIC WITHDRAWAL PLAN
This plan may be used for periodic withdrawals (at least $50 by check or ACH)
from your account. To take advantage of this feature:
- you must have at least $50,000 in your account
- determine the schedule: monthly, quarterly, semi-annually or annually
- call 800 992-8151 to add a systematic withdrawal plan to your account
RETIREMENT PLANS
Aston Funds offer a range of retirement plans, including Traditional, Roth,
SIMPLE IRAs and SEP IRAs. Using these plans, you can invest in any Aston Fund
with a low minimum investment of $500. The annual maintenance fee for IRAs is
$15 per account (not to exceed $30), but it is waived if you have $35,000 or
more in assets. The fee is assessed every December for the current calendar
year. To find out more, call Aston Funds at 800 992-8151.
DISTRIBUTION PLAN 12B-1 FEES
--------------------------------------------------------------------------------
To pay for the cost of promoting the Funds and servicing your shareholder
account, each Fund has adopted a Rule 12b-1 distribution plan for its Class R
shares. Under this plan, the Fund pays a fee at an annual rate of not more than
0.50% of each Fund's Class R shares' average daily net assets to the distributor
for distribution of Class R shares and other services. The fee is accrued daily
and payable monthly. Over time, these fees will increase the cost of your
investment and may cost more than paying other types of sales charges.
In addition to distribution and service fees paid by the Funds, Aston may pay
compensation to intermediaries that distribute and/or service investors in the
Funds out of its own assets and not as an additional charge to the Funds. These
additional payments, which are sometimes referred to as "revenue sharing," may
represent a premium over payments made by other fund families, and may create an
added incentive for investment professionals to sell or recommend the Funds over
other funds offered by competing fund families. The revenue sharing payments may
differ for each fund within the Aston family of funds, including within the same
intermediary, and across intermediaries.
In addition, representatives of the distributor may be compensated through
Adviser incentive programs in a manner that favors an Aston fund or group of
funds over another Aston fund.
PORTFOLIO TRANSACTIONS AND BROKERAGE COMMISSIONS
--------------------------------------------------------------------------------
The subadviser attempts to obtain the best possible price and most favorable
execution of transactions in their portfolio securities. There may be times when
the subadviser may pay one broker-dealer a commission that is greater than the
amount that another broker-dealer may charge for the same transaction. The
subadviser generally determines in good faith if the commission paid was
reasonable in relation to the brokerage or research services provided by the
broker-dealer. In selecting and monitoring broker-dealers and negotiating
commissions, the subadviser considers, among other factors, a broker-dealer's
reliability, availability of research, the quality of its execution services and
its financial condition.
24
Dividends, Distributions and Taxes
--------------------------------------------------------------------------------
Each Fund pays dividends and distributes capital gains at different intervals.
All dividends and distributions are automatically reinvested at NAV unless you
choose to receive them in a cash payment. You can change your payment options at
any time by writing to us.
Certain tax considerations may apply to your investment in an Aston Fund. The
following is a general description of certain federal income tax considerations.
If you have any tax-related questions relating to your investment in an Aston
Fund, please consult your tax adviser. Further information regarding the federal
income tax consequences of investing in a Fund is included in the SAI.
TAXES
For federal income tax purposes:
- Dividends and distributions on Class R shares will generally not be
subject to current federal income taxation provided such shares are held
in a qualified tax-deferred retirement plan. Distributions to you from a
qualified tax- deferred retirement plan, however, will generally be
subject to federal income tax and possibly federal withholding tax. In
addition, backup withholding tax (see below) may apply to dividend
distribution and redemption proceeds received by a qualified tax-deferred
retirement plan unless the required certification is provided to the Aston
Funds. To the extent Fund shares are not held in a qualified tax-deferred
retirement plan, the following federal income tax consequences will
generally apply. Please consult with your plan administrator regarding the
tax status of your retirement plan.
- The tax treatment of dividends and distributions is the same whether you
reinvest the dividends and distributions or elect to receive them in cash.
You will receive a statement with the federal income tax status of your
dividends and distributions for the prior year by January 31.
- Distributions of any net investment income, other than "qualified dividend
income," are taxable to you as ordinary income.
- Distributions of qualified dividend income (i.e., generally dividends
received by a Fund from domestic corporations and certain foreign
corporations) generally will be taxed to individuals and other
non-corporate investors in the Funds at federal income tax rates
applicable to long-term capital gains, provided you meet certain holding
period and other requirements contained in the Internal Revenue Code of
1986, as amended, with respect to your Fund shares and the Fund meets
similar holding period and other requirements with respect to the dividend
paying stock. The favorable treatment of qualified dividend income will
expire for taxable years beginning after December 31, 2010. Dividends
received by a Fund from most real estate investment trusts and certain
foreign corporations are not expected to qualify for treatment as
qualified dividend income when distributed by a Fund.
- Distributions of net capital gain (net long-term capital gain less any net
short-term capital loss) are taxable as long-term capital gain regardless
of how long you may have held shares of a Fund. In contrast, distributions
of net short-term capital gain (net short-term capital gain less any net
long-term capital loss) are taxable as ordinary income regardless of how
long you may have held shares of a Fund. Because distributions of net
short-term capital gains are taxable as ordinary income, you generally
cannot offset net short- term capital gain distributions you receive from
a Fund with capital losses.
- Distributions declared to the shareholders of record in October, November
or December and paid on or before January 31 of the succeeding year will
be treated for federal income tax purposes as if received by shareholders
on December 31 of the year in which the distribution was declared.
- When you sell or exchange shares, it generally is considered a taxable
event for you, unless you are a tax-exempt holder of Fund shares, such as
a qualified retirement plan. Depending on the purchase price and the sale
price of the shares you sell or exchange, you may have a gain or a loss on
the transaction. The gain or loss will generally be treated as a long-term
capital gain or loss if you held your shares for more than one year. If
you held your shares for one year or less, the gain or loss will generally
be treated as a short-term capital gain or loss. Short-term capital gains
are taxable at ordinary federal income tax rates. For taxable years
beginning on or before December 31, 2010, long-term capital gains are
taxable to individuals and other non-corporate investors at a maximum
federal income tax rate of 15%. You are responsible for any tax
liabilities generated by your transactions.
- If you do not provide Aston Funds with your complete and correct taxpayer
identification number and required certification, or if the Internal
Revenue Service so notifies us, you may be subject to backup withholding
tax on dividends, distributions and redemption proceeds.
- If you purchase shares of a Fund just before a dividend or distribution,
you will pay the full price for the shares and receive a portion of the
purchase price back as a taxable distribution. This is referred to as
"buying a dividend."
- If a Fund qualifies (by having more than 50% of the value of its total
assets at the close of the taxable year consist of stock or securities in
foreign corporations) and elects to pass through foreign taxes paid on its
investments during the year, such taxes will be reported to you as income.
You may, however, be able to claim an offsetting tax credit or deduction
on your federal income tax return, depending on your particular
circumstances and provided you meet certain holding period and other
requirements. Tax-exempt holders of Fund shares, such as qualified
retirement plans, will not benefit from such a deduction or credit.
25
Financial Highlights
--------------------------------------------------------------------------------
These financial highlights tables are to help you understand the Funds'
financial performance. The following schedules present financial highlights for
one share of each Fund outstanding throughout the periods indicated. The total
returns in the tables represent the rate that an investor would have earned or
lost on an investment in a Fund (assuming reinvestment of all dividends and
distributions). This information has been derived from the Funds' financial
statements as of October 31, 2008, which have been audited by Ernst & Young LLP,
whose report, along with those Funds' financial statements, is included in the
Aston Funds' Annual Report, which is available upon request.
ASTON/MONTAG & CALDWELL GROWTH FUND
--------------------------------------------------------------------------------
Year Year Year Year Year
Ended Ended Ended Ended Ended
10/31/08 10/31/07 10/31/06 10/31/05 10/31/04
-------- -------- -------- -------- --------
Net Asset Value, Beginning of period $31.33 $25.04 $23.23 $21.43 $20.69
INCOME FROM INVESTMENT OPERATIONS:
Net investment income (loss) --(a)(b) --(a)(b) 0.01(a) (0.01)(a) (0.01)(a)
Net realized and unrealized gain (loss) on
investments (8.58) 6.49 1.80 1.83 0.77
------ ------ ------ ------ ------
Total from investment operations (8.58) 6.49 1.81 1.82 0.76
------ ------ ------ ------ ------
LESS DISTRIBUTIONS:
Distributions from and in excess of net
investment income (0.03) (0.02) -- (0.02) (0.02)
Distributions from net realized gain on
investments (4.03) (0.18) -- -- --
------ ------ ------ ------ ------
Total distributions (4.06) (0.20) -- (0.02) (0.02)
------ ------ ------ ------ ------
Net increase (decrease) in net asset value (12.64) 6.29 1.81 1.80 0.74
------ ------ ------ ------ ------
Net Asset Value, End of period $18.69 $31.33 $25.04 $23.23 $21.43
====== ====== ====== ====== ======
TOTAL RETURN (31.28)% 26.06% 7.79% 8.50% 3.65%
RATIOS/SUPPLEMENTAL DATA:
Net Assets, End of period (in 000's) $266 $4,062 $693 $703 $459
Ratios of expenses to average net assets:
Before reimbursement and/or waiver of
expenses by Adviser 1.33%(c) 1.29%(c) 1.28%(c) 1.25% 1.24%
After reimbursement and/or waiver of expenses
by Adviser 1.33%(c) 1.29%(c) 1.28%(c) 1.25% 1.24%
Ratios of net investment income (loss) to
average net assets:
Before reimbursement and/or waiver of
expenses by Adviser 0.01% 0.01% 0.06% (0.02) % (0.02)%
After reimbursement and/or waiver of expenses
by Adviser 0.01% 0.01% 0.06% (0.02) % (0.02)%
Portfolio Turnover 52.32% 69.02% 68.74% 52.16% 52.86%
------------------------
(a)The selected per share data was calculated using the weighted average shares
outstanding method for the period.
(b)Represents less than $0.005 per share.
(c)Ratios of expenses to average net assets include interest expense of less
than 0.005% for the years ended October 31, 2008, October 31, 2007 and October
31, 2006. The interest expense is from utilizing the line of credit.
26
Financial Highlights (continued)
--------------------------------------------------------------------------------
ASTON GROWTH FUND
--------------------------------------------------------------------------------
Year Year Year Year Year
Ended Ended Ended Ended Ended
10/31/08 10/31/07 10/31/06 10/31/05 10/31/04
---------- ---------- ---------- ---------- ----------
Net Asset Value, Beginning of period $22.28 $22.64 $22.53 $21.66 $21.09
INCOME FROM INVESTMENT OPERATIONS:
Net investment income (loss) 0.04 --(a)(b) (0.04) --(a)(b) (0.10)(a)
Net realized and unrealized gain (loss) on
investments (5.91) 2.38 1.24 0.90 0.67
------ ------ ------ ------ ------
Total from investment operations (5.87) 2.38 1.20 0.90 0.57
------ ------ ------ ------ ------
LESS DISTRIBUTIONS:
Distributions from and in excess of net
investment income -- -- -- (0.03) --
Distributions from net realized gain on
investments (5.63) (2.74) (1.09) -- --
------ ------ ------ ------ ------
Total distributions (5.63) (2.74) (1.09) (0.03) --
------ ------ ------ ------ ------
Net increase (decrease) in net asset value (11.50) (0.36) 0.11 0.87 0.57
------ ------ ------ ------ ------
Net Asset Value, End of period $10.78 $22.28 $22.64 $22.53 $21.66
====== ====== ====== ====== ======
TOTAL RETURN (33.93)% 11.61% 5.35% 4.16% 2.70%
RATIOS/SUPPLEMENTAL DATA:
Net Assets, End of period (in 000's) $560 $684 $1,679 $1,122 $573
Ratios of expenses to average net assets:
Before reimbursement and/or waiver of
expenses by Adviser 1.40%(c) 1.32%(c) 1.31%(c) 1.31% 1.31%
After reimbursement and/or waiver of
expenses by Adviser 1.40%(c) 1.32%(c) 1.31%(c) 1.31% 1.31%
Ratios of net investment income (loss) to
average net assets:
Before reimbursement and/or waiver of
expenses by Adviser (0.16)% 0.01% (0.20)% 0.00% (0.44)%
After reimbursement and/or waiver of
expenses by Adviser (0.16)% 0.01% (0.20)% 0.00% (0.44)%
Portfolio Turnover 122.68% 47.46% 29.07% 31.30%(d) 18.59%
------------------------
(a)The selected per share data was calculated using the weighted average shares
outstanding method for the period.
(b)Represents less than $0.005 per share.
(c)Ratios of expenses to average net assets include interest expense of 0.01%
for the year ended October 31, 2008 and less than 0.005% for the years ended
October 31, 2007 and October 31, 2006. The interest expense is from utilizing
the line of credit.
(d)Portfolio turnover rate excludes securities delivered from processing a
redemption-in-kind.
27
General Information
--------------------------------------------------------------------------------
If you wish to know more about Aston Funds, you will find additional information
in the following documents:
SHAREHOLDER REPORTS
--------------------------------------------------------------------------------
You will receive an unaudited semi-annual report dated April 30 and an annual
report dated October 31 which is audited by an independent registered public
accounting firm. The annual report contains a discussion of the market
conditions and investment strategies that significantly affected the Funds'
performance during its last fiscal year.
STATEMENT OF ADDITIONAL INFORMATION (SAI)
--------------------------------------------------------------------------------
The SAI, which is incorporated into this prospectus by reference to the extent
that it relates to the Funds and dated March 1, 2009 as amended from time to
time, is available to you without charge and can be mailed to you upon request.
It contains more detailed information about each Fund.
HOW TO OBTAIN REPORTS
--------------------------------------------------------------------------------
CONTACTING ASTON FUNDS
You can get free copies of the reports and SAI, request other information and
get answers to your questions about the Funds by contacting:
Address: Aston Funds
P.O. Box 9765
Providence, RI 02940
Phone: Shareholder Services & 800 992-8151
Fund Literature
Investment Advisor Services 800 597-9704
Web site: www.astonfunds.com
OBTAINING INFORMATION FROM THE SECURITIES AND EXCHANGE COMMISSION
You can visit the EDGAR Database on the SEC's Web site at http://www.sec.gov to
view the SAI and other information. You can also view and copy information about
the Funds at the SEC's Public Reference Room in Washington, D.C. To find out
more about the Public Reference Room, you can call the SEC at 202 551-8090.
Also, you can obtain copies of this information after paying a duplicating fee,
by electronic request at the following E-mail address: publicinfo@sec.gov, or by
writing the SEC's Public Reference Section, Washington D.C. 20549-0102.
Investment Company Act File Number: 811-8004
28
(ASTON ASSET MANAGEMENT LOGO)
Aston Funds
P. O. Box 9765
Providence, RI 02940
(GRAPHIC)
Aston Funds
(the “Trust”)
Aston/Montag & Caldwell Growth Fund
Aston/Veredus Select Growth Fund
Aston Growth Fund
Aston/Optimum Large Cap Opportunity Fund
Aston Value Fund
Aston/TAMRO Diversified Equity Fund
Aston/River Road Dividend All Cap Value Fund
Aston/Optimum Mid Cap Fund
Aston/Montag & Caldwell Mid Cap Growth Fund
Aston/Cardinal Mid Cap Value Fund
Aston/River Road Small-Mid Cap Fund
Aston/Veredus Aggressive Growth Fund
Aston/TAMRO Small Cap Fund
Aston/River Road Small Cap Value Fund
Aston/Neptune International Fund
Aston Dynamic Allocation Fund
Aston/New Century Absolute Return ETF Fund
Aston/M.D. Sass Enhanced Equity Fund
Aston/Fortis Real Estate Fund
Aston/Montag & Caldwell Balanced Fund
Aston Balanced Fund
Aston/TCH Fixed Income Fund
(each an “Aston Fund” and collectively, the “Aston Funds”)
Supplement dated July 7, 2009 to the Class N Shares Prospectus dated March 1, 2009
IMPORTANT NOTICE
This supplement provides new and additional information beyond that contained in the Prospectus and should be retained and read in conjunction with the Prospectus. Keep it for future reference.
ADDITIONAL EXCHANGE OPTION
Effective June 22, 2009, the Aston/Fortis Money Market Fund, Fortis Government Money Market Fund, Fortis Tax-Exempt Money Market Fund and Fortis Treasury Money Market Fund (the “Money Market Funds”) are no longer available as an exchange option. The Board of Trustees of Aston Funds approved a plan to liquidate and terminate each Money Market Fund on or about July 30, 2009. The last date to place orders to exchange shares of each Money Market Fund for shares of other Aston Funds is July 28, 2009.
Effective July 15, 2009, the Aston Money Market Fund — Bedford Shares of the Money Market Portfolio of The RBB Fund, Inc. offered in connection with the Aston Funds (the “Aston Money Market Fund”) will be available as an exchange option for shareholders of the Aston Funds. Existing shareholders of the Money Market Funds or the intermediaries through which shares are held must take affirmative action to exchange their shares from the Money Market Funds into the Aston Money Market Fund. The Aston Money Market Fund prospectus, including applicable investment minimums, is available by contacting Aston Funds by mail, through the Internet or by phone at (800) 992-8151. Please read the Aston Money Market Fund prospectus carefully before investing.
For federal income tax purposes, each exchange into a different fund is treated as a sale and a new purchase. As a result, an investor holding shares in a non tax-deferred account generally is subject to federal income tax on any appreciation on the shares exchanged.
Aston Funds reserves the right to limit, impose charges upon, terminate or otherwise modify the exchange privilege by sending written notice to shareholders. All exchange requests must be in “good order,” as described in the Prospectus.
For more information, please call Aston Funds: 800 992-8151 or visit our Web site at www.astonfunds.com.
SUP AMMF 709
ASTON FUNDS
Class N Shares
Aston/Montag & Caldwell Growth Fund
Aston Growth Fund
Aston/Montag & Caldwell Balanced Fund
Aston Balanced Fund
Class R Shares
Aston/Montag & Caldwell Growth Fund
Aston Growth Fund
Class I Shares
Aston/Montag & Caldwell Growth Fund
Aston Growth Fund
(Each a “Fund” and collectively, the “Funds”)
STATEMENT OF ADDITIONAL INFORMATION
January , 2010
This statement of additional information dated January , 2010 (“SAI”) provides information pertaining to shares representing interests in the following investment portfolios of Aston Funds, formerly known as ABN AMRO Funds (the “Trust”): Aston/Montag & Caldwell Growth Fund, Aston Growth Fund, Aston/Montag & Caldwell Balanced Fund, and Aston Balanced Fund.
This SAI is not a prospectus and should be read only in conjunction with each Fund’s current Proxy Statement/Prospectus dated January , 2010, for the Special Meeting of Shareholders of the Funds, to be held on , 2010, into which this SAI is hereby incorporated by reference. No investments in any of the Funds should be made without first reading the Proxy Statement/Prospectus.
The audited financial statements for the fiscal year ended October 31, 2009 for the Funds and the Report of the Independent Registered Public Accounting Firm thereon are incorporated herein by reference to the Funds’ Annual Reports dated October 31, 2009 as filed with the Securities and Exchange Commission (“SEC”) insofar as it is related to a Fund’s participation in a reorganization (File No. 811-08004). No other parts of the Annual Reports are incorporated by reference herein. This SAI is incorporated by reference to the Proxy Statement/Prospectus.
You may obtain a prospectus, annual report or semi-annual report, when available, at no charge by contacting the Trust at Aston Funds, P. O. Box 9765, Providence, RI 02940 or 800-992-8151 or by downloading such information from www.astonfunds.com. The website does not form a part of the Proxy Statement/Prospectus or SAI.
Further information about the Funds is contained in the Funds’ Statement of Additional Information dated March 1, 2009 as supplemented from time to time, which is attached to this SAI as Appendix A.
The unaudited pro forma combined financial statements for the reorganization of Aston Balanced Fund into Aston/Montag & Caldwell Balanced Fund, which are attached hereto, are intended to present the financial condition and related results of operations of the Aston/Montag & Caldwell Balanced Fund, as if such reorganization had been consummated on October 31, 2009.
The date of this SAI is January , 2010.
Aston Balanced Fund – Aston/Montag & Caldwell Balanced Fund
Proforma Combined Schedule of Investments as of October 31, 2009 (Unaudited)
| | | | | | | | | | | | | | | | |
| | | | | | | Aston
Balanced
Fund Shares/
Par Value ($) | | Aston/
Montag &
Caldwell
Balanced
Fund Shares/
Par Value ($) | | Combined
Pro Forma
Shares/
Par Value ($) | | Aston
Balanced
Fund
Value ($) | | Aston/
Montag &
Caldwell
Balanced
Fund Value ($) | | Combined
Pro Forma
Value ($) |
| | Coupon Rate | | Maturity Date | | | | | | | | | | | | |
| Common Stocks – 61.48% | | | | | | | | | | | | | | | | |
| Consumer Discretionary – 6.60% | | | | | | | | | | | | | | | | |
| McDonald’s | | | | | | 7,100 | | 7,100 | | 14,200 | | 416,131 | | 416,126 | | 832,257 |
| NIKE, Class B | | | | | | 3,650 | | 3,750 | | 7,400 | | 226,957 | | 233,175 | | 460,132 |
| TJX | | | | | | 7,550 | | 7,350 | | 14,900 | | 281,993 | | 274,523 | | 556,516 |
| Walt Disney | | | | | | 5,750 | | 6,000 | | 11,750 | | 157,378 | | 164,220 | | 321,598 |
| | | | | | | | | | | | | | | | |
| Total Consumer Discretionary | | | | | | 24,050 | | 24,200 | | 48,250 | | 1,082,459 | | 1,088,044 | | 2,170,503 |
| | | | | | | | | | | | | | | | |
| Consumer Staples – 13.85% | | | | | | | | | | | | | | | | |
| Coca-Cola | | | | | | 8,450 | | 8,800 | | 17,250 | | 450,470 | | 469,128 | | 919,598 |
| Colgate-Palmolive | | | | | | 4,050 | | 3,850 | | 7,900 | | 318,451 | | 302,726 | | 621,177 |
| Costco Wholesale | | | | | | 5,450 | | 5,650 | | 11,100 | | 309,832 | | 321,203 | | 631,035 |
| CVS Caremark | | | | | | 4,500 | | 5,000 | | 9,500 | | 158,850 | | 176,500 | | 335,350 |
| PepsiCo | | | | | | 6,600 | | 6,920 | | 13,520 | | 399,630 | | 419,006 | | 818,636 |
| Procter & Gamble | | | | | | 3,700 | | 3,950 | | 7,650 | | 214,600 | | 229,100 | | 443,700 |
| Wal-Mart Stores | | | | | | 7,750 | | 8,050 | | 15,800 | | 385,020 | | 399,924 | | 784,944 |
| | | | | | | | | | | | | | | | |
| Total Consumer Staples | | | | | | 40,500 | | 42,220 | | 82,720 | | 2,236,853 | | 2,317,587 | | 4,554,440 |
| | | | | | | | | | | | | | | | |
| Energy – 5.78% | | | | | | | | | | | | | | | | |
| Cameron International* | | | | | | 7,600 | | 8,100 | | 15,700 | | 280,972 | | 299,457 | | 580,429 |
| Occidental Petroleum | | | | | | 3,300 | | 3,350 | | 6,650 | | 250,404 | | 254,198 | | 504,602 |
| Schlumberger | | | | | | 6,400 | | 6,700 | | 13,100 | | 398,080 | | 416,740 | | 814,820 |
| | | | | | | | | | | | | | | | |
| Total Energy | | | | | | 17,300 | | 18,150 | | 35,450 | | 929,456 | | 970,395 | | 1,899,851 |
| | | | | | | | | | | | | | | | |
| Financials – 3.56% | | | | | | | | | | | | | | | | |
| Charles Schwab | | | | | | 19,650 | | 20,400 | | 40,050 | | 340,731 | | 353,736 | | 694,467 |
| JPMorgan Chase | | | | | | 5,600 | | 5,850 | | 11,450 | | 233,912 | | 244,355 | | 478,267 |
| | | | | | | | | | | | | | | | |
| Total Financials | | | | | | 25,250 | | 26,250 | | 51,500 | | 574,643 | | 598,091 | | 1,172,734 |
| | | | | | | | | | | | | | | | |
| Health Care – 10.03% | | | | | | | | | | | | | | | | |
| Abbott Laboratories | | | | | | 8,300 | | 8,600 | | 16,900 | | 419,731 | | 434,902 | | 854,633 |
| Allergan | | | | | | 5,500 | | 5,250 | | 10,750 | | 309,375 | | 295,313 | | 604,688 |
| Gilead Sciences* | | | | | | 7,100 | | 7,350 | | 14,450 | | 302,105 | | 312,743 | | 614,848 |
| Schering-Plough | | | | | | 15,650 | | 16,250 | | 31,900 | | 441,330 | | 458,250 | | 899,580 |
| Stryker | | | | | | 3,450 | | 3,600 | | 7,050 | | 158,700 | | 165,600 | | 324,300 |
| | | | | | | | | | | | | | | | |
| Total Health Care | | | | | | 40,000 | | 41,050 | | 81,050 | | 1,631,241 | | 1,666,808 | | 3,298,049 |
| | | | | | | | | | | | | | | | |
| Industrials – 4.06% | | | | | | | | | | | | | | | | |
| 3M | | | | | | 3,500 | | 3,600 | | 7,100 | | 257,495 | | 264,852 | | 522,347 |
| Burlington Northern Santa Fe | | | | | | 1,700 | | 1,750 | | 3,450 | | 128,044 | | 131,810 | | 259,854 |
| Emerson Electric | | | | | | 2,800 | | 2,950 | | 5,750 | | 105,700 | | 111,363 | | 217,063 |
| Fluor | | | | | | 3,650 | | 3,950 | | 7,600 | | 162,133 | | 175,459 | | 337,592 |
| | | | | | | | | | | | | | | | |
| Total Industrials | | | | | | 11,650 | | 12,250 | | 23,900 | | 653,372 | | 683,484 | | 1,336,856 |
| | | | | | | | | | | | | | | | |
| Information Technology – 17.09% | | | | | | | | | | | | | | | | |
| Apple* | | | | | | 2,650 | | 2,750 | | 5,400 | | 499,525 | | 518,375 | | 1,017,900 |
| Google, Class A* | | | | | | 910 | | 973 | | 1,883 | | 487,869 | | 521,645 | | 1,009,514 |
| Hewlett-Packard | | | | | | 10,100 | | 10,500 | | 20,600 | | 479,346 | | 498,330 | | 977,676 |
| Juniper Networks * | | | | | | 9,000 | | 9,350 | | 18,350 | | 229,590 | | 238,519 | | 468,109 |
| QUALCOMM | | | | | | 9,850 | | 10,300 | | 20,150 | | 407,888 | | 426,523 | | 834,411 |
| Research In Motion* | | | | | | 3,650 | | 3,450 | | 7,100 | | 214,365 | | 202,619 | | 416,984 |
| Visa, Class A | | | | | | 5,800 | | 6,050 | | 11,850 | | 439,408 | | 458,348 | | 897,756 |
| | | | | | | | | | | | | | | | |
| Total Information Technology | | | | | | 41,960 | | 43,373 | | 85,333 | | 2,757,991 | | 2,864,359 | | 5,622,350 |
| | | | | | | | | | | | | | | | |
| Materials – 0.51% | | | | | | | | | | | | | | | | |
Aston Balanced Fund – Aston/Montag & Caldwell Balanced Fund
Proforma Combined Schedule of Investments as of October 31, 2009 (Unaudited)
| | | | | | | | | | | | | | | | | | |
| | | | | | | | | Aston
Balanced
Fund Shares/
Par Value ($) | | Aston/
Montag &
Caldwell
Balanced
Fund Shares/
Par Value ($) | | Combined
Pro Forma
Shares/
Par Value ($) | | Aston
Balanced
Fund
Value ($) | | Aston/
Montag &
Caldwell
Balanced
Fund Value ($) | | Combined
Pro Forma
Value ($) |
| | | | Coupon Rate | | Maturity Date | | | | | | | | | | | | |
| Monsanto | | | | | | | | 1,200 | | 1,300 | | 2,500 | | 80,616 | | 87,334 | | 167,950 |
| | | | | | | | | | | | | | | | | | |
| Total Materials | | | | | | | | 1,200 | | 1,300 | | 2,500 | | 80,616 | | 87,334 | | 167,950 |
| | | | | | | | | | | | | | | | | | |
| Total Common Stocks | | | | | | | | 201,910 | | 208,793 | | 410,703 | | 9,946,631 | | 10,276,102 | | 20,222,733 |
| | | | | | | | | | | | | | | | | | |
| U.S. Government and Agency Obligations – 14.39% | | | | | | | | | | | | | | | | | | |
| Federal National Mortgage Association – 3.29% | | | | | | | | | | | | | | | | | | |
| Federal National Mortgage Association | | | | 6.000 | | 15-May-11 | | — | | 100,000 | | 100,000 | | — | | 107,901 | | 107,901 |
| Federal National Mortgage Association | | | | 4.375 | | 15-Sep-12 | | — | | 75,000 | | 75,000 | | — | | 80,711 | | 80,711 |
| Federal National Mortgage Association | | Pool # 787557 | | 7.500 | | 01-Feb-35 | | 41,516 | | — | | 41,516 | | 45,988 | | — | | 45,988 |
| Federal National Mortgage Association | | Pool # 819231 | | 7.500 | | 01-Apr-35 | | 17,629 | | — | | 17,629 | | 19,529 | | — | | 19,529 |
| Federal National Mortgage Association | | Pool # 844078 | | 6.000 | | 01-Nov-35 | | 146,302 | | — | | 146,302 | | 156,071 | | — | | 156,071 |
| Federal National Mortgage Association | | Pool # 888029 | | 6.000 | | 01-Dec-36 | | 271,600 | | — | | 271,600 | | 289,311 | | — | | 289,311 |
| Federal National Mortgage Association | | Pool # 918778 | | 5.500 | | 01-Jun-37 | | 166,682 | | — | | 166,682 | | 175,696 | | — | | 175,696 |
| Federal National Mortgage Association | | Pool # 962344 | | 5.500 | | 01-Mar-38 | | 195,407 | | — | | 195,407 | | 205,944 | | — | | 205,944 |
| | | | | | | | | | | | | | | | | | |
| Total Fannie Mae | | | | | | | | 839,136 | | 175,000 | | 1,014,136 | | 892,539 | | 188,612 | | 1,081,151 |
| | | | | | | | | | | | | | | | | | |
| Federal Home Loan Mortgage – 2.70% | | | | | | | | | | | | | | | | | | |
| Federal Home Loan Mortgage | | Gold Pool # G18083 | | 5.500 | | 01-Nov-20 | | 244,995 | | — | | 244,995 | | 261,491 | | — | | 261,491 |
| Federal Home Loan Mortgage | | Gold Pool # G11820 | | 5.500 | | 01-Dec-20 | | 43,472 | | — | | 43,472 | | 46,399 | | — | | 46,399 |
| Federal Home Loan Mortgage | | Gold Pool # G03202 | | 5.500 | | 01-Sep-37 | | 180,529 | | — | | 180,529 | | 190,433 | | — | | 190,433 |
| Federal Home Loan Mortgage | | Gold Pool # G04334 | | 5.000 | | 01-Apr-38 | | 218,420 | | — | | 218,420 | | 226,662 | | — | | 226,662 |
| Federal Home Loan Mortgage | | | | 4.500 | | 15-Jan-13 | | — | | 150,000 | | 150,000 | | — | | 163,108 | | 163,108 |
| | | | | | | | | | | | | | | | | | |
| Total Freddie Mac | | | | | | | | 687,416 | | 150,000 | | 837,416 | | 724,985 | | 163,108 | | 888,093 |
| | | | | | | | | | | | | | | | | | |
| Government National Mortgage Association – 1.00% | | | | | | | | | | | | | | | | | | |
| Government National Mortgage Association | | Pool # 4015 | | 5.000 | | 20-Aug-37 | | 193,827 | | — | | 193,827 | | 201,756 | | — | | 201,756 |
| Government National Mortgage Association | | Pool # 698060 | | 5.500 | | 15-Feb-39 | | 122,394 | | — | | 122,394 | | 129,430 | | — | | 129,430 |
| | | | | | | | | | | | | | | | | | |
| Total Government National Mortgage Association | | | | | | | | 316,221 | | — | | 316,221 | | 331,186 | | — | | 331,186 |
| | | | | | | | | | | | | | | | | | |
| U.S. Treasury Bills – 3.04% | | | | | | | | | | | | | | | | | | |
| Treasury Bill (a) | | | | 0.140 | | 03-Dec-09 | | 500,000 | | — | | 500,000 | | 499,982 | | — | | 499,982 |
| Treasury Bill (a) | | | | 0.060 | | 28-Jan-10 | | 500,000 | | — | | 500,000 | | 499,939 | | — | | 499,939 |
| | | | | | | | | | | | | | | | | | |
| Total U.S. Treasury Bills | | | | | | | | 1,000,000 | | — | | 1,000,000 | | 999,921 | | — | | 999,921 |
| | | | | | | | | | | | | | | | | | |
| U.S. Treasury Bonds – 1.77% | | | | | | | | | | | | | | | | | | |
| U.S. Treasury Bonds | | | | 8.125 | | 15-Aug-19 | | — | | 150,000 | | 150,000 | | — | | 208,313 | | 208,313 |
| U.S. Treasury Bonds | | | | 8.000 | | 15-Nov-21 | | — | | 100,000 | | 100,000 | | — | | 140,859 | | 140,859 |
| U.S. Treasury Bonds | | | | 5.375 | | 15-Feb-31 | | — | | 200,000 | | 200,000 | | — | | 232,344 | | 232,344 |
| | | | | | | | | | | | | | | | | | |
| Total U.S. Treasury Bonds | | | | | | | | — | | 450,000 | | 450,000 | | — | | 581,516 | | 581,516 |
| | | | | | | | | | | | | | | | | | |
| U.S. Treasury Notes – 2.59% | | | | | | | | | | | | | | | | | | |
| U.S. Treasury Notes | | | | 4.000 | | 15-Feb-15 | | — | | 175,000 | | 175,000 | | — | | 188,918 | | 188,918 |
| U.S. Treasury Notes | | | | 4.500 | | 15-Feb-16 | | — | | 225,000 | | 225,000 | | — | | 247,922 | | 247,922 |
| U.S. Treasury Notes | | | | 2.625 | | 30-Apr-16 | | — | | 225,000 | | 225,000 | | — | | 222,047 | | 222,047 |
| U.S. Treasury Notes | | | | 4.625 | | 15-Feb-17 | | — | | 175,000 | | 175,000 | | — | | 193,416 | | 193,416 |
| | | | | | | | | | | | | | | | | | |
| Total U.S. Treasury Notes | | | | | | | | — | | 800,000 | | 800,000 | | — | | 852,303 | | 852,303 |
| | | | | | | | | | | | | | | | | | |
| Total U.S. Government and Agency Obligations | | | | | | | | 2,842,773 | | 1,575,000 | | 4,417,773 | | 2,948,631 | | 1,785,539 | | 4,734,170 |
| | | | | | | | | | | | | | | | | | |
| Corporate Notes and Bonds – 20.37% | | | | | | | | | | | | | | | | | | |
| Consumer Discretionary – 1.51% | | | | | | | | | | | | | | | | | | |
| Darden Restaurants | | Senior Unsecured Notes | | 6.800 | | 15-Oct-37 | | 70,000 | | — | | 70,000 | | 72,456 | | — | | 72,456 |
| Home Depot | | Senior Unsecured Notes | | 5.875 | | 16-Dec-36 | | 50,000 | | — | | 50,000 | | 48,935 | | — | | 48,935 |
| Macy’s Retail Holdings | | | | 6.375 | | 15-Mar-37 | | 250,000 | | — | | 250,000 | | 205,000 | | — | | 205,000 |
Aston Balanced Fund – Aston/Montag & Caldwell Balanced Fund
Proforma Combined Schedule of Investments as of October 31, 2009 (Unaudited)
| | | | | | | | | | | | | | | | | | |
| | | | | | | | | Aston
Balanced
Fund Shares/
Par Value ($) | | Aston/
Montag &
Caldwell
Balanced
Fund Shares/
Par Value ($) | | Combined
Pro Forma
Shares/
Par Value ($) | | Aston
Balanced
Fund
Value ($) | | Aston/
Montag &
Caldwell
Balanced
Fund Value ($) | | Combined
Pro Forma
Value ($) |
| | | | Coupon Rate | | Maturity Date | | | | | | | | | | | | |
| Time Warner Cable | | | | 8.250 | | 14-Feb-14 | | 50,000 | | — | | 50,000 | | 58,682 | | — | | 58,682 |
| Whirlpool, MTN | | Senior Unsecured Notes | | 8.600 | | 01-May-14 | | 50,000 | | — | | 50,000 | | 57,118 | | — | | 57,118 |
| Wyndham Worldwide | | Senior Unsecured Notes | | 6.000 | | 01-Dec-16 | | 60,000 | | — | | 60,000 | | 54,695 | | — | | 54,695 |
| | | | | | | | | | | | | | | | | | |
Total Consumer Discretionary | | | | | | | | 530,000 | | — | | 530,000 | | 496,886 | | — | | 496,886 |
| | | | | | | | | | | | | | | | | | |
| Consumer Staples – 2.81% | | | | | | | | | | | | | | | | | | |
| Coca-Cola (The) | | | | 5.350 | | 15-Nov-17 | | — | | 250,000 | | 250,000 | | — | | 271,998 | | 271,998 |
| Kroger | | | | 8.050 | | 01-Feb-10 | | 50,000 | | — | | 50,000 | | 50,837 | | — | | 50,837 |
| PepsiCo | | | | 5.000 | | 01-Jun-18 | | — | | 250,000 | | 250,000 | | — | | 266,562 | | 266,562 |
| Reynolds American | | | | 7.750 | | 01-Jun-18 | | 50,000 | | — | | 50,000 | | 54,073 | | — | | 54,073 |
| Wal-Mart Stores | | | | 4.125 | | 01-Jul-10 | | — | | 275,000 | | 275,000 | | — | | 281,713 | | 281,713 |
| | | | | | | | | | | | | | | | | | |
Total Consumer Staples | | | | | | | | 100,000 | | 775,000 | | 875,000 | | 104,910 | | 820,273 | | 925,183 |
| | | | | | | | | | | | | | | | | | |
| Energy – 2.27% | | | | | | | | | | | | | | | | | | |
| ConocoPhillips | | | | 4.750 | | 01-Feb-14 | | — | | 200,000 | | 200,000 | | — | | 214,949 | | 214,949 |
| Hess | | Senior Unsecured Notes | | 8.125 | | 15-Feb-19 | | 50,000 | | — | | 50,000 | | 60,756 | | — | | 60,756 |
| Hess | | Senior Unsecured Notes | | 7.875 | | 01-Oct-29 | | 50,000 | | — | | 50,000 | | 59,082 | | — | | 59,082 |
| Kinder Morgan Energy Partners | | Senior Unsecured Notes | | 9.000 | | 01-Feb-19 | | 50,000 | | — | | 50,000 | | 61,017 | | — | | 61,017 |
| Marathon Oil Canada | | Senior Secured Notes | | 8.375 | | 01-May-12 | | 50,000 | | — | | 50,000 | | 56,526 | | — | | 56,526 |
| Nabors Industries | | | | 9.250 | | 15-Jan-19 | | 50,000 | | — | | 50,000 | | 60,463 | | — | | 60,463 |
| Nexen | | Senior Unsecured Notes | | 7.500 | | 30-Jul-39 | | 125,000 | | — | | 125,000 | | 138,430 | | — | | 138,430 |
| Trans-Canada Pipelines | | Senior Unsecured Notes | | 7.625 | | 15-Jan-39 | | 25,000 | | — | | 25,000 | | 32,001 | | — | | 32,001 |
| Weatherford International | | | | 9.625 | | 01-Mar-19 | | 50,000 | | — | | 50,000 | | 61,962 | | — | | 61,962 |
| | | | | | | | | | | | | | | | | | |
Total Energy | | | | | | | | 450,000 | | 200,000 | | 650,000 | | 530,237 | | 214,949 | | 745,186 |
| | | | | | | | | | | | | | | | | | |
| Financials – 4.85% | | | | | | | | | | | | | | | | | | |
| American Financial Group | | Senior Unsecured Notes | | 9.875 | | 15-Jun-19 | | 50,000 | | — | | 50,000 | | 56,666 | | — | | 56,666 |
| Blackstone Holdings Finance (b) | | | | 6.625 | | 15-Aug-19 | | 100,000 | | — | | 100,000 | | 100,919 | | — | | 100,919 |
| General Electric Capital, | | MTN, Series A | | 5.875 | | 15-Feb-12 | | — | | 175,000 | | 175,000 | | — | | 188,790 | | 188,790 |
| Goldman Sachs Capital I | | | | 6.345 | | 15-Feb-34 | | 150,000 | | — | | 150,000 | | 142,519 | | — | | 142,519 |
| Goldman Sachs Group | | | | 5.150 | | 15-Jan-14 | | — | | 225,000 | | 225,000 | | — | | 237,924 | | 237,924 |
| Jefferies Group | | Senior Unsecured Notes | | 8.500 | | 15-Jul-19 | | 100,000 | | — | | 100,000 | | 108,706 | | — | | 108,706 |
| JPMorgan Chase | | | | 4.750 | | 01-May-13 | | — | | 250,000 | | 250,000 | | — | | 265,105 | | 265,105 |
| Marsh & McLennan | | Senior Unsecured Notes | | 9.250 | | 15-Apr-19 | | 50,000 | | — | | 50,000 | | 62,305 | | — | | 62,305 |
| Rio Tinto Finance | | | | 8.950 | | 01-May-14 | | 50,000 | | — | | 50,000 | | 59,136 | | — | | 59,136 |
| SLM, MTN | | Senior Unsecured Notes | | 5.625 | | 01-Aug-33 | | 250,000 | | — | | 250,000 | | 171,549 | | — | | 171,549 |
| Wells Fargo | | | | 4.200 | | 15-Jan-10 | | — | | 200,000 | | 200,000 | | — | | 201,261 | | 201,261 |
| | | | | | | | | | | | | | | | | | |
Total Financials | | | | | | | | 750,000 | | 850,000 | | 1,600,000 | | 701,800 | | 893,080 | | 1,594,880 |
| | | | | | | | | | | | | | | | | | |
| Health Care – 3.29% | | | | | | | | | | | | | | | | | | |
| Abbott Laboratories | | | | 4.350 | | 15-Mar-14 | | — | | 250,000 | | 250,000 | | — | | 263,544 | | 263,544 |
| Boston Scientific | | Senior Unsecured Notes | | 7.000 | | 15-Nov-35 | | 110,000 | | — | | 110,000 | | 107,800 | | — | | 107,800 |
| Johnson & Johnson | | | | 5.950 | | 15-Aug-37 | | — | | 200,000 | | 200,000 | | — | | 224,926 | | 224,926 |
| McKesson | | Senior Unsecured Notes | | 7.500 | | 15-Feb-19 | | 50,000 | | — | | 50,000 | | 58,880 | | — | | 58,880 |
| Medtronic | | Senior Unsecured Notes | | 6.500 | | 15-Mar-39 | | 50,000 | | — | | 50,000 | | 58,339 | | — | | 58,339 |
| Pfizer | | | | 4.450 | | 15-Mar-12 | | — | | 200,000 | | 200,000 | | — | | 212,200 | | 212,200 |
| UnitedHealth Group (c) | | Senior Unsecured Notes | | 1.768 | | 07-Feb-11 | | 100,000 | | — | | 100,000 | | 100,163 | | — | | 100,163 |
| WellPoint | | Senior Unsecured Notes | | 6.800 | | 01-Aug-12 | | 50,000 | | — | | 50,000 | | 55,003 | | — | | 55,003 |
| | | | | | | | | | | | | | | | | | |
Total Health Care | | | | | | | | 360,000 | | 650,000 | | 1,010,000 | | 380,185 | | 700,670 | | 1,080,855 |
| | | | | | | | | | | | | | | | | | |
| Industrials – 0.78% | | | | | | | | | | | | | | | | | | |
| Embraer Overseas | | | | 6.375 | | 15-Jan-20 | | 100,000 | | — | | 100,000 | | 95,250 | | — | | 95,250 |
| FedEx | | Senior Notes | | 8.000 | | 15-Jan-19 | | 50,000 | | — | | 50,000 | | 60,637 | | — | | 60,637 |
| Tyco International Finance | | | | 4.125 | | 15-Oct-14 | | 100,000 | | — | | 100,000 | | 102,267 | | — | | 102,267 |
| | | | | | | | | | | | | | | | | | |
Total Industrials | | | | | | | | 250,000 | | — | | 250,000 | | 258,154 | | — | | 258,154 |
| | | | | | | | | | | | | | | | | | |
Aston Balanced Fund – Aston/Montag & Caldwell Balanced Fund
Proforma Combined Schedule of Investments as of October 31, 2009 (Unaudited)
| | | | | | | | | | | | | | | | | | | | | |
| | | | | | | | | Aston
Balanced
Fund Shares/
Par Value ($) | | Aston/
Montag &
Caldwell
Balanced
Fund Shares/
Par Value ($) | | Combined
Pro Forma
Shares/
Par Value ($) | | Aston
Balanced
Fund Value ($) | | Aston/
Montag &
Caldwell
Balanced
Fund Value ($) | | Combined
Pro Forma
Value ($) |
| | | | Coupon Rate | | Maturity Date | | | | | | | | | | | | | | | |
| Information Technology – 2.11% | | | | | | | | | | | | | | | | | | | | | |
| Cisco Systems | | | | 5.500 | | 22-Feb-16 | | — | | 200,000 | | 200,000 | | | — | | | 220,109 | | | 220,109 |
| Hewlett-Packard | | | | 4.500 | | 01-Mar-13 | | — | | 200,000 | | 200,000 | | | — | | | 214,207 | | | 214,207 |
| Motorola | | Senior Unsecured Notes | | 6.625 | | 15-Nov-37 | | 50,000 | | — | | 50,000 | | | 42,748 | | | — | | | 42,748 |
| Oracle | | | | 4.950 | | 15-Apr-13 | | — | | 200,000 | | 200,000 | | | — | | | 216,684 | | | 216,684 |
| | | | | | | | | | | | | | | | | | | | | |
Total Information Technology | | | | | | | | 50,000 | | 600,000 | | 650,000 | | | 42,748 | | | 651,000 | | | 693,748 |
| | | | | | | | | | | | | | | | | | | | | |
Materials – 0.46% | | | | | | | | | | | | | | | | | | | | | |
| ArcelorMittal | | Senior Unsecured Notes | | 7.000 | | 15-Oct-39 | | 100,000 | | — | | 100,000 | | | 94,812 | | | — | | | 94,812 |
| Bemis | | Senior Unsecured Notes | | 6.800 | | 01-Aug-19 | | 50,000 | | — | | 50,000 | | | 56,107 | | | — | | | 56,107 |
| | | | | | | | | | | | | | | | | | | | | |
Total Materials | | | | | | | | 150,000 | | — | | 150,000 | | | 150,919 | | | — | | | 150,919 |
| | | | | | | | | | | | | | | | | | | | | |
| Telecommunication Services – 1.77% | | | | | | | | | | | | | | | | | | | | | |
| BellSouth Capital Funding | | | | 7.750 | | 15-Feb-10 | | — | | 200,000 | | 200,000 | | | — | | | 204,135 | | | 204,135 |
| Rogers Wireless | | Senior Subordinated Notes | | 8.000 | | 15-Dec-12 | | 50,000 | | | | 50,000 | | | 51,510 | | | | | | 51,510 |
| Telus | | Senior Unsecured Notes | | 8.000 | | 01-Jun-11 | | 50,000 | | | | 50,000 | | | 54,527 | | | | | | 54,527 |
| Verizon Communications | | | | 5.550 | | 15-Feb-16 | | — | | 250,000 | | 250,000 | | | — | | | 270,985 | | | 270,985 |
| | | | | | | | | | | | | | | | | | | | | |
Total Telecommunication Services | | | | | | | | 100,000 | | 450,000 | | 550,000 | | | 106,037 | | | 475,120 | | | 581,157 |
| | | | | | | | | | | | | | | | | | | | | |
| Utilities – 0.52% | | | | | | | | | | | | | | | | | | | | | |
| Allegheny Energy Supply (b) | | Senior Unsecured Notes | | 6.750 | | 15-Oct-39 | | 50,000 | | — | | 50,000 | | | 48,053 | | | — | | | 48,053 |
| FPL Group Capital | | | | 7.875 | | 15-Dec-15 | | 50,000 | | — | | 50,000 | | | 60,807 | | | — | | | 60,807 |
| Sempra Energy | | Senior Unsecured Notes | | 9.800 | | 15-Feb-19 | | 50,000 | | — | | 50,000 | | | 63,886 | | | — | | | 63,886 |
| | | | | | | | | | | | | | | | | | | | | |
Total Utilities | | | | | | | | 150,000 | | — | | 150,000 | | | 172,746 | | | — | | | 172,746 |
| | | | | | | | | | | | | | | | | | | | | |
Total Corporate Notes and Bonds | | | | | | | | 2,890,000 | | 3,525,000 | | 6,415,000 | | | 2,944,622 | | | 3,755,092 | | | 6,699,714 |
| | | | | | | | | | | | | | | | | | | | | |
| Investment Company – 2.93% | | | | | | | | | | | | | | | | | | | | | |
| BlackRock Liquidity Funds TempCash Portfolio | | | | | | | | 962,607 | | — | | 962,607 | | | 962,607 | | | — | | | 962,607 |
| | | | | | | | | | | | | | | | | | | | | |
Total Investment Company | | | | | | | | 962,607 | | — | | 962,607 | | | 962,607 | | | — | | | 962,607 |
| | | | | | | | | | | | | | | | | | | | | |
| Total Investments – 99.17% | | | | | | | | 6,897,290 | | 5,308,793 | | 12,206,083 | | $ | 16,802,491 | | $ | 15,816,733 | | $ | 32,619,224 |
| Net Other Assets and Liabilities – 0.83% | | | | | | | | | | | | | | | 2,479 | | | 269,681 | | | 272,160 |
| | | | | | | | | | | | | | | | | | | | | |
| Net Assets – 100.00% | | | | | | | | | | | | | | $ | 16,804,970 | | $ | 16,086,414 | | $ | 32,891,384 |
| | | | | | | | | | | | | | | | | | | | | |
| * | Non-income producing security. |
| (a) | Annualized yield at time of purchase. |
| (b) | Securities exempt from registration under Rule 144A of the Securities Act of 1933, as amended. These securities are purchased in accordance with guidelines approved by the Fund’s Board of Trustees and may only be resold, in transactions exempt from registration, to qualified institutional buyers. At October 31, 2009, these securities amounted to $148,972 or 0.89% of net assets of the Aston Balanced Fund. These securities have been determined by the Adviser to be liquid securities. |
| (c) | Floating rate note. The interest rate shown reflects the rate in effect at October 31, 2009. |
MTN Medium Term Note
Aston Balanced Fund – Aston/Montag & Caldwell Balanced Fund
Proforma Combined Statement of Assets and Liabilities as of October 31, 2009 (Unaudited)
| | | | | | | | | | | | | | | | |
| | | Aston
Balanced
Fund | | | Aston / Montag &
Caldwell Balanced
Fund | | | Pro Forma
Adjustments(1) | | | Pro Forma
Combined | |
ASSETS: | | | | | | | | | | | | | | | | |
Investments: | | | | | | | | | | | | | | | | |
Investments at cost | | $ | 15,403,027 | | | $ | 14,992,111 | | | $ | — | | | $ | 30,395,138 | |
Net unrealized appreciation | | | 1,399,464 | | | | 824,622 | | | | — | | | | 2,224,086 | |
| | | | | | | | | | | | | | | | |
Total investments at value | | | 16,802,491 | | | | 15,816,733 | | | | — | | | | 32,619,224 | |
| | | | | | | | | | | | | | | | |
Receivables: | | | | | | | | | | | | | | | | |
Dividends and interest | | | 68,988 | | | | 79,216 | | | | — | | | | 148,204 | |
Fund shares sold | | | 2,821 | | | | 5,686 | | | | — | | | | 8,507 | |
Investments sold | | | 62,197 | | | | 531,874 | | | | — | | | | 594,071 | |
Other assets | | | 208 | | | | 221 | | | | — | | | | 429 | |
| | | | | | | | | | | | | | | | |
Total assets | | | 16,936,705 | | | | 16,433,730 | | | | — | | | | 33,370,435 | |
| | | | | | | | | | | | | | | | |
LIABILITIES: | | | | | | | | | | | | | | | | |
Payables: | | | | | | | | | | | | | | | | |
Due to custodian | | | — | | | | 82,961 | | | | — | | | | 82,961 | |
Investments purchased | | | 90,377 | | | | 38,402 | | | | — | | | | 128,779 | |
Fund shares redeemed | | | — | | | | 190,420 | | | | — | | | | 190,420 | |
Due to Adviser, net | | | 10,088 | | | | 4,612 | | | | — | | | | 14,700 | |
Administration fees | | | 3,184 | | | | 2,723 | | | | — | | | | 5,907 | |
Audit and tax fees | | | 17,717 | | | | 17,848 | | | | — | | | | 35,565 | |
Custodian fees | | | 1,966 | | | | 1,617 | | | | — | | | | 3,583 | |
Transfer agent fees | | | 4,195 | | | | 6,438 | | | | — | | | | 10,633 | |
Trustees fees and related expenses | | | 201 | | | | 157 | | | | — | | | | 358 | |
Accrued expenses and other payables | | | 4,007 | | | | 2,138 | | | | — | | | | 6,145 | |
| | | | | | | | | | | | | | | | |
Total liabilities | | | 131,735 | | | | 347,316 | | | | — | | | | 479,051 | |
| | | | | | | | | | | | | | | | |
NET ASSETS | | $ | 16,804,970 | | | $ | 16,086,414 | | | $ | — | | | $ | 32,891,384 | |
| | | | | | | | | | | | | | | | |
NET ASSETS CONSIST OF: | | | | | | | | | | | | | | | | |
Paid in capital | | $ | 18,178,289 | | | $ | 23,304,810 | | | $ | — | | | $ | 41,483,099 | |
Accumulated undistributed (distribution in excess of) net investment income (loss) | | | 295,561 | | | | (232,269 | ) | | | — | | | | 63,292 | |
Accumulated net realized loss on investments | | | (3,068,344 | ) | | | (7,810,749 | ) | | | — | | | | (10,879,093 | ) |
Net unrealized appreciation on investments | | | 1,399,464 | | | | 824,622 | | | | — | | | | 2,224,086 | |
| | | | | | | | | | | | | | | | |
| | $ | 16,804,970 | | | $ | 16,086,414 | | | $ | — | | | $ | 32,891,384 | |
| | | | | | | | | | | | | | | | |
Class N: | | | | | | | | | | | | | | | | |
Net Assets | | $ | 16,804,970 | | | $ | 14,937,504 | | | $ | — | | | $ | 31,742,474 | |
Shares of beneficial interest outstanding (unlimited authorization) | | | 3,032,269 | | | | 842,474 | | | | (2,084,470 | )(2) | | | 1,790,273 | |
NET ASSET VALUE Offering and redemption price per share (Net Assets / Shares Outstanding) | | $ | 5.54 | | | $ | 17.73 | | | $ | — | | | $ | 17.73 | |
Class I: | | | | | | | | | | | | | | | | |
Net Assets | | $ | — | | | $ | 1,148,910 | | | $ | — | | | $ | 1,148,910 | |
Shares of beneficial interest outstanding (unlimited authorization) | | | — | | | | 64,972 | | | | — | | | | 64,972 | |
NET ASSET VALUE Offering and redemption price per share (Net Assets / Shares Outstanding) | | $ | — | | | $ | 17.68 | | | $ | — | | | $ | 17.68 | |
| (1) | Pro forma adjustments do not include reorganization expenses borne by the Funds, which are expected to be immaterial. |
| (2) | Class N shares of the Aston Balanced Fund are being exchanged for Class N shares of the Aston/Montag & Caldwell Balanced Fund. |
Aston Balanced Fund – Aston/Montag & Caldwell Balanced Fund
Pro Forma Combined Statement of Operations for the Year Ended October 31, 2009 (Unaudited)
| | | | | | | | | | | | | | | | |
| | | Aston
Balanced
Fund | | | Aston / Montag
& Caldwell
Balanced Fund | | | Pro Forma
Adjustments | | | Pro Forma
Combined | |
INVESTMENT INCOME: | | | | | | | | | | | | | | | | |
Dividends | | $ | 176,256 | | | $ | 178,581 | | | $ | — | | | $ | 354,837 | |
Interest | | | 308,053 | | | | 268,327 | | | | — | | | | 576,380 | |
| | | | | | | | | | | | | | | | |
Total investment income | | | 484,309 | | | | 446,908 | | | | — | | | | 931,217 | |
| | | | | | | | | | | | | | | | |
EXPENSES: | | | | | | | | | | | | | | | | |
Investment advisory fees | | | 115,902 | | | | 131,614 | | | | 8,277 | (1) | | | 255,793 | |
Distribution expenses | | | 5,447 | | | | 26,926 | | | | 21,501 | (1) | | | 53,874 | |
Transfer agent fees | | | 28,095 | | | | 50,943 | | | | (16,800 | )(1) | | | 62,238 | |
Administration fees | | | 39,568 | | | | 27,338 | | | | (24,000 | )(1) | | | 42,906 | |
Registration expenses | | | 16,047 | | | | 25,122 | | | | (16,047 | )(1) | | | 25,122 | |
Custodian fees | | | 5,411 | | | | 4,146 | | | | | | | | 9,557 | |
Audit and tax fees | | | 23,209 | | | | 23,404 | | | | (23,209 | )(1) | | | 23,404 | |
Legal fees | | | 1,229 | | | | 1,299 | | | | | | | | 2,528 | |
Reports to shareholder expense | | | 2,438 | | | | 2,431 | | | | | | | | 4,869 | |
Trustees fees and related expenses | | | 900 | | | | 1,281 | | | | | | | | 2,181 | |
Other expenses | | | 8,782 | | | | 8,710 | | | | (3,335 | )(1) | | | 14,157 | |
| | | | | | | | | | | | | | | | |
Total expenses before waivers/reimbursements | | | 247,028 | | | | 303,214 | | | | (53,613 | )(2) | | | 496,629 | |
| | | | | | | | | | | | | | | | |
Less: Investment advisory fees waived | | | — | | | | (83,255 | ) | | | 15,663 | | | | (67,592 | ) |
| | | | | | | | | | | | | | | | |
Net expenses | | | 247,028 | | | | 219,959 | | | | (37,950 | ) | | | 429,037 | |
| | | | | | | | | | | | | | | | |
NET INVESTMENT INCOME | | | 237,281 | | | | 226,949 | | | | 37,950 | | | | 502,180 | |
| | | | | | | | | | | | | | | | |
NET REALIZED AND UNREALIZED GAIN (LOSS) ON INVESTMENTS: | | | | | | | | | | | | | | | | |
Net realized loss on investments | | | (1,968,862 | ) | | | (505,443 | ) | | | — | | | | (2,474,305 | ) |
Net change in unrealized appreciation of investments | | | 4,255,574 | | | | 2,858,743 | | | | — | | | | 7,114,317 | |
| | | | | | | | | | | | | | | | |
NET REALIZED AND UNREALIZED GAIN ON INVESTMENTS | | | 2,286,712 | | | | 2,353,300 | | | | — | | | | 4,640,012 | |
| | | | | | | | | | | | | | | | |
NET INCREASE IN NET ASSETS FROM OPERATIONS | | $ | 2,523,993 | | | $ | 2,580,249 | | | $ | 37,950 | (2) | | $ | 5,142,192 | |
| | | | | | | | | | | | | | | | |
| (1) | Pro Forma operating expenses are based on actual expenses of Aston Balanced Fund and Aston/Montag & Caldwell Balanced Fund, with certain expenses adjusted to reflect the expected expenses of the combined entity. The management fee has been calculated for the Combined Fund based on the fee schedule in effect for the Aston/Montag & Caldwell Balanced Fund at the combined level of average net assets for the fiscal year ended October 31, 2009. |
| (2) | Pro forma adjustments do not include reorganization expenses borne by the Funds, which are expected to be immaterial. |
Aston / Montag & Caldwell Balanced Fund
Aston Balanced Fund
Notes to Pro Forma Combined Financial Statements (Unaudited)
These financial statements set forth the unaudited Proforma Combined Schedule of Investments as of October 31, 2009 and the unaudited Proforma Combined Statement of Assets and Liabilities as of October 31, 2009, and the unaudited Pro Forma Combined Statement of Operations for the year ended October 31, 2009 for Aston Balanced Fund (“Balanced Fund”) into Aston/Montag & Caldwell Balanced Fund (“Montag & Caldwell Balanced Fund,” or “Surviving Fund” and collectively with the Balanced Fund, the “Funds”), as adjusted, giving effect to the reorganization as if it had occurred as of the beginning of the fiscal year.
Under the terms of the Agreement and Plan of Reorganization, the combination of the Balanced Fund and the Montag & Caldwell Balanced Fund (the “Combined Fund”) will be accounted for by the method of accounting for tax-free mergers of investment companies. The reorganization would be accomplished by an acquisition of the net assets of the Balanced Fund in exchange for shares of Class N of the Montag & Caldwell Balanced Fund at net asset value. The statements of assets and liabilities and the related statements of operations of the Balanced Fund and the Montag & Caldwell Balanced Fund have been combined as of and for the year ended October 31, 2009. Following the acquisition, the Montag & Caldwell Balanced Fund will be the accounting survivor. In accordance with accounting principles generally accepted in the United States, the historical cost of investment securities will be carried forward to the surviving fund and the results of operations for pre-combination periods of the Surviving Fund will not be restated. The pro forma statements do not reflect the expenses borne by either fund in carrying out its obligations under the proposed Agreement and Plan of Reorganization, which are expected to be immaterial. As of October 31, 2009, the Balanced Fund’s portfolio did not contain securities, either individually or when aggregated with the Montag & Caldwell Balanced Fund’s portfolio, that violated the investment policies or restrictions of the Montag & Caldwell Balanced Fund.
The accompanying pro forma combined financial statements and notes to pro forma combined financial statements should be read in conjunction with the financial statements and accompanying notes of the Balanced Fund and the Montag & Caldwell Balanced Fund included in their annual report dated October 31, 2009.
| 2. | General Information and Significant Accounting Policies |
The Aston Funds (the “Trust) was organized as a Delaware statutory trust under a Declaration of Trust dated September 10, 1993. The Trust is registered under the Investment Company Act of 1940, as amended, (the “1940 Act”) as an open-end management investment company with 24 separate portfolios established by the Board of Trustees as of October 31, 2009.
The following is a summary of significant accounting policies followed by the Combined Fund in the preparation of its pro forma combined financial statements in accordance with accounting principles generally accepted in the United States.
Security Valuation
Equity securities traded on a national securities exchange and over-the-counter securities listed on the NASDAQ National Market System are valued at the last sale price or the NASDAQ Official Closing Price (“NOCP”), if applicable. If no last sale price or NOCP, if applicable, is reported, the mean of the last bid and asked prices may be used. Fixed income securities, except short-term investments, are valued on the basis of mean prices provided by a pricing service when such prices are believed by Aston Asset Management LLC (the “Adviser”) to reflect the current market value of such securities in accordance with guidelines adopted. If accurate market quotations are not available, securities are valued at fair value as determined by the Adviser in accordance with guidelines adopted by the Board of Trustees. Short-term investments, that is, those with maturities of 60 days or less, are valued at amortized cost, which approximates fair value. Repurchase agreements are valued at cost. Investments in money market funds are valued at the underlying fund’s net asset value (“NAV”) at the date of valuation. The Combined Fund invests in securities of other investment companies including open-end funds. Open-end funds are investment companies that issue new shares continuously and redeem shares daily. The risks of investment in other investment companies typically reflect the risk of the types of securities in which the Combined Fund invests. When the
Aston / Montag & Caldwell Balanced Fund
Aston Balanced Fund
Notes to Pro Forma Combined Financial Statements (Unaudited)—(Continued)
Combined Fund invests in another investment company, shareholders of the Combined Fund bear their proportionate share of the investment company’s fees and expenses, including operating, registration, trustee, licensing and marketing, as well as their share of the Combined Fund’s fees and expenses.
Repurchase Agreements
The Combined Fund may enter into repurchase agreements with financial institutions deemed to be creditworthy by the Combined Fund’s Adviser or sub-adviser, subject to the seller’s agreement to repurchase and the Combined Fund’s agreement to resell such securities at a mutually agreed upon price. Securities purchased subject to repurchase agreements are deposited with the Combined Fund’s custodian and, pursuant to the terms of the repurchase agreement, must have an aggregate market value greater than or equal to the repurchase price plus accrued interest at all times. If the value of the underlying securities falls below the value of the repurchase price plus accrued interest, the Combined Fund will require the seller to deposit additional collateral by the next business day. If the request for additional collateral is not met, or the seller defaults on its repurchase obligation, the Combined Fund has the right to sell the underlying securities at market value and may claim any resulting loss against the seller. At October 31, 2009, the Combined Fund did not own any repurchase agreements.
When Issued/Delayed Delivery Securities
The Combined Fund may purchase and sell securities on a “when issued” or “delayed delivery” basis, with settlement to occur at a later date. The value of the security so purchased is subject to market fluctuations during this period. The Combined Fund segregates assets having an aggregate value at least equal to the amount of when issued or delayed delivery purchase commitments until payment is made. At October 31, 2009, the Combined Fund did not own any when issued or delayed delivery securities.
Mortgage-Backed Securities
The Combined Fund may invest in mortgage-backed securities (“MBS”), representing interests in pools of mortgage loans. These securities provide shareholders with payments consisting of both principal and interest as the mortgages in the underlying mortgage pools are paid. The timely payment of principal and interest on mortgage-backed securities issued or guaranteed by Ginnie Mae (formerly known as Government National Mortgage Association) is backed by Ginnie Mae and the full faith and credit of the U.S. government. MBS issued by U.S. government agencies or instrumentalities other than Ginnie Mae are not “full faith and credit” obligations. Certain obligations, such as those issued by the Federal Home Loan Banks, Fannie Mae (formerly known as the Federal National Mortgage Association) and Freddie Mac (formerly known as the Federal Home Loan Mortgage Corporation) are supported only by the credit of the issuer. MBS issued by private agencies are not government securities and are not directly guaranteed by any government agency. They are secured by the underlying collateral of the private issuer. Yields on privately issued MBS tend to be higher than those of government backed issues. However, risk of loss due to default and sensitivity to interest rate fluctuations are also higher. The Combined Fund may also invest in collateralized mortgage obligations (“CMO”) and real estate mortgage investment conduits (“REMIC”). A CMO is a bond that is collateralized by a pool of MBS, and a REMIC is similar in form to a CMO. These MBS pools are divided into classes with each class having its own characteristics. The different classes are retired in sequence as the underlying mortgages are repaid.
Investment Income and Securities Transactions
Dividend income is recorded on the ex-dividend date, except for certain dividends from foreign securities where the ex-dividend date may have passed, which are recorded as soon as the Combined Fund is informed of the ex-dividend date. Interest income is accrued daily and is captured in dividends and interest receivable. Premiums and discounts
Aston / Montag & Caldwell Balanced Fund
Aston Balanced Fund
Notes to Pro Forma Combined Financial Statements (Unaudited)—(Continued)
are amortized or accreted on an effective yield method on fixed income securities. The Combined Fund may be subject to foreign taxes on income, gains on investments or currency repatriation, a portion of which may be recoverable. The Combined Fund will accrue such taxes and reclaims as applicable, based upon their current interpretation of tax rules and regulations that exist in the markets in which the Combined Fund invests. Securities are accounted for on a trade date basis. The cost of securities sold is determined using the First In First Out (“FIFO”) method.
Federal Income Taxes
The Balanced Fund and Montag & Caldwell Balanced Fund have elected to be treated as a “regulated investment company” under Subchapter M of the Internal Revenue Code of 1986, as amended, and to distribute substantially all of its respective net taxable income. Accordingly, no provisions for federal income taxes have been made in the accompanying pro forma combined financial statements. After the acquisition, Montag & Caldwell Balanced Fund intends to continue to qualify as a regulated investment company.
Multi-Class Operations
With respect to Montag & Caldwell Balanced Fund, the Surviving Fund, each class offered by this Fund has equal rights as to net assets. Income, fund and trust level expenses and realized and unrealized capital gains and losses, if any, are allocated to each class of shares based on the relative net assets of each class. Class specific expenses are allocated to each class and include distribution fees.
Dividends from Net Investment Income and Distributions of Capital Gains
Dividends and distributions to shareholders are recorded on the ex-dividend date. The Montag & Caldwell Balanced Fund distributes dividends from net investment income to shareholders quarterly and net realized gains from investment transactions, if any, are generally distributed annually, usually in December.
Advisory, Administration, Distribution Services and Trustee Agreements
Aston Asset Management LLC serves as Investment Adviser and Administrator to the Funds. Under terms of each Fund’s investment advisory agreement, fees are accrued daily and paid monthly, based on specific annual rates of average daily net assets. The factors considered by the Board of Trustees in approving the current investment advisory agreement for the Funds are included in the Funds’ annual or semi-annual report to shareholders covering the period during which the approval occurred. The Adviser has voluntarily waived management fees and/or reimbursed expenses for the Montag & Caldwell Balanced Fund, which caps annual ordinary operating expenses for Class N shareholders at 1.35% of average daily net assets.
For the year ended October 31, 2009 the Montag & Caldwell Balanced Fund’s investment advisory fee was computed based on the annual rate of 0.75% of its average daily net assets. The administration fee was computed based on the annual rate of 0.049% of the first $7.4 billion of the Trust’s combined average daily net assets and 0.0465% of the Trust’s combined average daily net assets in excess of $7.4 billion, and was allocated to the Montag & Caldwell Balanced Fund based on the relative net assets of the Trust.
Pursuant to a Rule 12b-1 distribution plan (the “Plan”) adopted by the Montag & Caldwell Balanced Fund with respect to Class N Shares, the Montag & Caldwell Balanced Fund pays certain expenses associated with the distribution of its shares. Under the Plan, the Fund may pay actual expenses not exceeding, on an annual basis, 0.25% of the Montag & Caldwell Balanced Fund’s average daily net assets.
The Trustees of the Trust who are not affiliated with the Adviser or sub-advisers receive an annual retainer and per meeting fees. The Lead Independent Trustee and Committee Chairs receive an additional retainer. The Trustees of the Trust who are not affiliated with the Adviser or sub-advisers receive fees and are reimbursed for out-of-pocket expenses for each meeting of the Board of Trustees they attend. No officer or employee of the Adviser, sub-advisers or their affiliates receives any compensation from the Funds for acting as a Trustee of the Trust. The officers of the Trust receive no compensation directly from the Funds for performing the duties of their offices, except that the Funds compensate the Administrator for providing an officer to serve as the Funds’ Chief Compliance Officer.
Aston / Montag & Caldwell Balanced Fund
Aston Balanced Fund
Notes to Pro Forma Combined Financial Statements (Unaudited)—(Continued)
The pro forma net asset value per share assumes the issuance of shares of Montag & Caldwell Balanced Fund that would have been issued at October 31, 2009, in connection with the proposed reorganization. The number of shares assumed to be issued is equal to the net asset value of Class N shares of Balanced Fund, as of October 31, 2009, divided by the net asset value per share of the Class N shares of Montag & Caldwell Balanced Fund as of October 31, 2009. The pro forma number of shares outstanding, by class, for the Combined Fund consists of the following at October 31, 2009:
| | | | | | |
Class of Shares | | Shares of
Acquiring
Fund Pre-
Combination | | Additional
Shares
Assumed
Issued In
Reorganization | | Total
Outstanding
Shares Post
Combination |
Class N | | 842,474 | | 947,799 | | 1,790,273 |
| 4. | Pro forma Adjustments and Pro forma Combined Columns |
The pro forma adjustments and pro forma combined columns of the statement of operations reflect the adjustments necessary to show expenses at the rates which would have been in effect for the fiscal year ended October 31, 2009, giving effect to the reorganization as if it had occurred at the beginning of the fiscal year. Investment Advisory, Administration and 12b-1 fees in the pro forma combined column are calculated at the rates in effect for the Montag & Caldwell Balanced Fund based upon the combined net assets of the Balanced Fund and Montag & Caldwell Balanced Fund.
The pro forma combined Statement of Assets and Liabilities and pro forma combined Schedule of Investments give effect to the proposed transfer of such assets as if the reorganization had occurred at October 31, 2009.
| 5. | Costs of Reorganization |
The Adviser will bear or cause its parent, Highbury Financial Inc., to bear, all expenses of the Funds in connection with the reorganization related to the proxy solicitation, legal and other costs associated with the solicitation including special meetings of the board of trustees, preparation of a proxy statement/prospectus, printing and mailing costs. Each Fund will bear other expenses of the reorganization, including legal and accounting fees and expenses, provided that the Adviser will reimburse the Funds for expenses in connection with the reorganization, including legal and accounting expenses, to the extent that such expenses (i) cause total operating expenses of a Fund to exceed operating expense caps in effect for a Fund through February 28, 2011, or (ii) exceed one basis point (.01%) of average net assets if operating expense caps are not in effect for any Fund.
Reorganization expenses borne by the Funds may include, without limitation: (a) accounting fees; (b) legal fees incurred by each Fund; and (c) brokerage cost of any necessary rebalancing of the Funds’ investment portfolios, if any.
[ASTON FUNDS LOGO]
ASTON FUNDS
CLASS N SHARES
Aston/Montag & Caldwell Growth Fund
Aston/Veredus Select Growth Fund
Aston Growth Fund
Aston/Optimum Large Cap Opportunity Fund
Aston Value Fund
Aston/TAMRO All Cap Fund
Aston/River Road Dividend All Cap Value Fund
Aston/Optimum Mid Cap Fund
Aston/Montag & Caldwell Mid Cap Growth Fund
Aston/Cardinal Mid Cap Value Fund
Aston/River Road Small-Mid Cap Fund
Aston/Veredus Aggressive Growth Fund
Aston/TAMRO Small Cap Fund
Aston/River Road Small Cap Value Fund
Aston/Neptune International Fund
Aston/Fortis Global Real Estate Fund
Aston/Smart Portfolios Fund
Aston/New Century Absolute Return ETF Fund
Aston/MB Enhanced Equity Income Fund
Aston/Fortis Real Estate Fund
Aston/Montag & Caldwell Balanced Fund
Aston Balanced Fund
Aston/TCH Fixed Income Fund
Aston/Fortis Investor Money Market Fund
CLASS R SHARES
Aston/Montag & Caldwell Growth Fund
Aston Growth Fund
CLASS I SHARES
Montag & Caldwell Growth Fund
Aston/Veredus Select Growth Fund
Aston Growth Fund
Aston Value Fund
Aston/River Road Dividend All Cap Value Fund
Aston/Optimum Mid Cap Fund
Aston/River Road Small-Mid Cap Fund
Aston/Veredus Aggressive Growth Fund
Aston/TAMRO Small Cap Fund
Aston/River Road Small Cap Value Fund
Aston/Neptune International Fund
Aston/Barings International Fund
Aston/Fortis Real Estate Fund
Montag & Caldwell Balanced Fund
Aston/TCH Fixed Income Fund
Fortis Government Money Market Fund
Fortis Tax-Exempt Money Market Fund
Fortis Treasury Money Market Fund
CLASS S SHARES
Fortis Government Money Market Fund
Fortis Tax-Exempt Money Market Fund
Fortis Treasury Money Market Fund
CLASS Y SHARES
Fortis Institutional Prime Money Market Fund
CLASS YS SHARES
Fortis Institutional Prime Money Market Fund
(Each a "Fund" and collectively, the "Funds")
STATEMENT OF ADDITIONAL INFORMATION
MARCH 1, 2009
This statement of additional information dated March 1, 2009 ("SAI")
provides supplementary information pertaining to shares representing interests
in the twenty-nine currently available investment portfolios of Aston Funds,
formerly known as ABN AMRO Funds (the "Trust").
This SAI is not a prospectus and should be read only in conjunction with
each Fund's current Prospectus dated March 1, 2009, as amended or supplemented
from time to time. No investment in any of the Funds should be made without
first reading the appropriate prospectus.
The audited financial statements for the fiscal year ended October 31,
2008 for the Funds are incorporated herein by reference to the Funds' Annual
Reports as filed with the Securities and Exchange Commission ("SEC"). This SAI
is incorporated by reference to the Prospectuses.
You may obtain a prospectus, annual report or semi-annual report, when
available, at no charge by contacting the Trust at ASTON FUNDS, P.O. BOX 9765,
PROVIDENCE, RI 02940 OR 800-992-8151 or by downloading such information from
www.astonfunds.com. The website does not form a part of the prospectuses or SAI.
TABLE OF CONTENTS
PAGE
----
THE FUNDS ....................................................... 1
INVESTMENT OBJECTIVES, STRATEGIES AND RISK CONSIDERATIONS ....... 1
INVESTMENT RESTRICTIONS ......................................... 40
NON-FUNDAMENTAL INVESTMENT POLICIES ............................. 43
TRUSTEES AND OFFICERS OF THE TRUST .............................. 44
PROXY VOTING POLICIES AND PROCEDURES ............................ 48
CONTROL PERSONS AND PRINCIPAL HOLDERS OF SECURITIES ............. 49
INVESTMENT ADVISORY AND OTHER SERVICES .......................... 69
The Investment Advisers ..................................... 69
The Subadvisers ............................................. 78
The Administrator ........................................... 102
The Subadministrator ........................................ 104
Subadministration Fees ...................................... 104
The Underwriter ............................................. 104
The Distribution Plan ....................................... 104
Shareholder Servicing Plan .................................. 108
Redemption Fees ............................................. 109
Custodian ................................................... 109
Transfer Agent and Dividend Paying Agent .................... 109
Counsel and Independent Registered Public Accounting Firm ... 109
PORTFOLIO TRANSACTIONS AND BROKERAGE COMMISSIONS .... 110
DISCLOSURE OF PORTFOLIO HOLDINGS ................................ 114
DESCRIPTION OF SHARES ........................................... 115
NET ASSET VALUE ................................................. 118
REDEMPTIONS-IN-KIND ............................................. 120
FEDERAL INCOME TAXES ................... 120
PERFORMANCE INFORMATION ......................................... 128
FINANCIAL STATEMENTS ............................................ 128
OTHER INFORMATION .................... 128
APPENDIX A ...................................................... A-1
APPENDIX B ...................................................... B-1
NO PERSON HAS BEEN AUTHORIZED TO GIVE ANY INFORMATION OR TO MAKE ANY
REPRESENTATIONS NOT CONTAINED IN THIS SAI OR IN THE PROSPECTUSES IN CONNECTION
WITH THE OFFERINGS MADE BY THE PROSPECTUSES. IF GIVEN OR MADE, SUCH INFORMATION
OR REPRESENTATIONS MUST NOT BE RELIED UPON AS HAVING BEEN AUTHORIZED BY THE
TRUST OR THE DISTRIBUTOR. THE PROSPECTUSES DO NOT CONSTITUTE AN OFFERING BY THE
TRUST OR THE DISTRIBUTOR IN ANY JURISDICTION IN WHICH SUCH OFFERING MAY NOT
LAWFULLY BE MADE.
THE FUNDS
Aston Funds, 120 N. LaSalle Street, 25th Floor, Chicago, Illinois 60602,
is an open-end management investment company. Each Fund is classified as
diversified under the Investment Company Act of 1940, as amended (the "1940
Act"), except Aston/Fortis Real Estate Fund and Aston/Fortis Global Real Estate
Fund, which are classified as non-diversified. Each Fund is a series of the
Trust, which was formed as a Delaware statutory trust on September 10, 1993.
The Aston/Fortis Investor Money Market Fund, Fortis Government Money
Market Fund, Fortis Tax-Exempt Money Market Fund, Fortis Treasury Money Market
Fund and Fortis Institutional Prime Money Market Fund are referred to
collectively herein as the "Fortis Money Market Funds."
INVESTMENT OBJECTIVES, STRATEGIES AND RISK CONSIDERATIONS
The following supplements the information contained in each prospectus
concerning the investment objectives, strategies and risks of investing in the
Funds. Except as otherwise stated below or in the applicable prospectus, a Fund
may invest in the portfolio investments included in this section. The investment
practices described below, except as further set forth in "Investment
Restrictions" are not fundamental and may be changed by the Board of Trustees
without the approval of shareholders.
AMERICAN DEPOSITARY RECEIPTS ("ADRS"), CONTINENTAL DEPOSITARY RECEIPTS ("CDRS"),
EUROPEAN DEPOSITARY RECEIPTS ("EDRS") AND GLOBAL DEPOSITARY RECEIPTS ("GDRS")
ADRs are securities, typically issued by a U.S. financial institution (a
"depositary"), that evidence ownership interest in a security or a pool of
securities issued by a foreign issuer and deposited with the depositary. EDRs,
which are sometimes referred to as CDRs, are securities, typically issued by a
non-U.S. financial institution, that evidence ownership interest in a security
or a pool of securities issued by either a U.S. or foreign issuer. GDRs are
issued globally and evidence a similar ownership arrangement. Generally, ADRs
are designed for trading in the U.S. securities market. EDRs are designed for
trading in European Securities Markets and GDRs are designed for trading in
non-U.S. securities markets. Generally, depositary receipts may be available
through "sponsored" or "unsponsored" facilities. A sponsored facility is
established jointly by the issuer of the security underlying the receipt and a
depositary, whereas an unsponsored facility may be established by a depositary
without participation by the issuer of the underlying security. Holders of
unsponsored depositary receipts generally bear all the costs of the unsponsored
facility. The depositary of an unsponsored facility frequently is under no
obligation to distribute shareholder communications received from the issuer of
the deposited security or to pass through, to the holders of the receipts,
voting rights with respect to the deposited securities.
ASSET-BACKED SECURITIES
Asset-backed securities are securities backed by installment contracts,
credit card and other receivables or other financial type assets. Asset-backed
securities represent interests in "pools" of assets in which payments of both
interest and principal on the securities are made monthly, thus in effect
"passing through" monthly payments made by the individual borrowers on the
assets underlying securities, net of any fees paid to the issuer or guarantor of
the securities. The average life of asset-backed securities varies with the
maturities of the underlying instruments. An asset-backed security's stated
maturity may be shortened, and the security's total return may be difficult to
predict precisely. The risk that recovery on repossessed collateral might be
unavailable or inadequate to support payments on asset-backed securities is
greater than in the case for mortgage-backed securities. Falling interest rates
generally result in an increase in the rate of prepayments while rising interest
rates generally decrease the rate of prepayments. An acceleration in prepayments
in response to sharply falling interest rates will shorten the security's
average maturity and limit the potential appreciation in the security's value
relative to a conventional debt security.
1
BELOW INVESTMENT-GRADE (HIGH YIELD) DEBT SECURITIES
Fixed income securities rated Ba or lower by Moody's Investor Service
("Moody's") or BB or lower by Standard & Poor's ("S&P"), frequently referred to
as "junk bonds," are considered to be of poor standing and predominantly
speculative. They generally offer higher yields than higher rated bonds. Such
securities are subject to a substantial degree of credit risk. Such medium- and
low-grade bonds held by a Fund may be issued as a consequence of corporate
restructurings, such as leveraged buy-outs, mergers, acquisitions, debt
recapitalizations or similar events. Additionally, high-yield bonds are often
issued by smaller, less creditworthy companies or by highly leveraged firms,
which are generally less able than more financially stable firms to make
scheduled payments of interest and principal. The risks posed by bonds issued
under such circumstances are substantial. Changes by recognized rating agencies
in their rating of any security and in the ability of an issuer to make payments
of interest and principal will ordinarily have a more dramatic effect on the
values of these investments than on the values of higher-rated securities. Such
changes in value will not affect cash income derived from these securities,
unless the issuers fail to pay interest or dividends when due. Such changes
will, however, affect a Fund's net asset value per share.
In the past, the high yields from low-grade bonds have more than
compensated for the higher default rates on such securities. However, there can
be no assurance that diversification will protect a Fund from widespread bond
defaults brought about by a sustained economic downturn, or that yields will
continue to offset default rates on high-yield bonds in the future. Issuers of
these securities are often highly leveraged, so that their ability to service
their debt obligations during an economic downturn or during sustained periods
of rising interest rates may be impaired. In addition, such issuers may not have
more traditional methods of financing available to them and may be unable to
repay debt at maturity by refinancing.
The value of lower-rated debt securities will be influenced not only by
changing interest rates, but also by the bond market's perception of credit
quality and the outlook for economic growth. When economic conditions appear to
be deteriorating, low- and medium-rated bonds may decline in market value due to
investors' heightened concern over credit quality, regardless of prevailing
interest rates. Adverse publicity and investor perceptions, whether or not based
on fundamental analysis, may decrease the value and liquidity of lower-rated
securities held by a Fund, especially in a thinly traded market. Illiquid or
restricted securities held by a Fund may involve valuation difficulties. Trading
in the secondary market for high-yield bonds may become thin and market
liquidity may be significantly reduced. Even under normal conditions, the market
for high-yield bonds may be less liquid than the market for investment-grade
corporate bonds. There are fewer securities dealers in the high-yield market,
and purchasers of high-yield bonds are concentrated among a smaller group of
securities dealers and institutional investors. In periods of reduced market
liquidity, high-yield bond prices may become more volatile.
LOWER-RATED SECURITIES MARKET - An economic downturn or increase in
interest rates is likely to have an adverse effect on the lower-rated securities
market generally (resulting in more defaults) and on the value of lower-rated
securities contained in the portfolios of a Fund which holds these securities.
SENSITIVITY TO ECONOMIC AND INTEREST RATE CHANGES - The economy and
interest rates can affect lower-rated securities differently from other
securities. For example, the prices of lower-rated securities are more sensitive
to adverse economic changes or individual corporate developments than are the
prices of higher-rated investments. Also, during an economic downturn or
substantial period of rising interest rates, highly leveraged issuers may
experience financial stress which would adversely affect their ability
2
to service their principal and interest payment obligations, to meet projected
business goals or to obtain additional financing. If the issuer of a lower-rated
security defaulted, a Fund may incur additional expenses to seek recovery. In
addition, periods of economic uncertainty and changes can be expected to result
in increased volatility of market prices of lower-rated securities and a Fund's
net asset values.
LIQUIDITY AND VALUATION - To the extent that an established secondary
market does not exist and a particular obligation is thinly traded, the
obligation's fair value may be difficult to determine because of the absence of
reliable, objective data. As a result, a Fund's valuation of the obligation and
the price it could obtain upon its disposition could differ.
CREDIT RATINGS - The credit ratings of Moody's and S&P are evaluations of
the safety of principal and interest payments of lower-rated securities. There
is a risk that credit rating agencies may fail to timely change the credit
ratings to reflect subsequent events. Therefore, in addition to using recognized
rating agencies and other sources, the investment adviser or subadviser also
performs its own analysis of issuers in selecting investments for a Fund. The
investment adviser or subadviser's analysis of issuers may include, among other
things, historic and current financial condition, current and anticipated cash
flow and borrowing strength of management, responsiveness to business
conditions, credit standing and current and anticipated results of operations.
YIELDS AND RATINGS - The yields on certain obligations are dependent on a
variety of factors, including general market conditions, conditions in the
particular market for the obligation, the financial condition of the issuer, the
size of the offering, the maturity of the obligation and the ratings of the
issue. The ratings of Moody's and S&P represent their respective opinions as to
the quality of the obligations they undertake to rate. Ratings, however, are
general and are not absolute standards of quality. Consequently, obligations
with the same rating, maturity and interest rate may have different market
prices.
While any investment carries some risk, certain risks associated with
lower-rated securities are different from those for investment-grade securities.
The risk of loss through default is greater because lower-rated securities are
usually unsecured and are often subordinate to an issuer's other obligations.
Additionally, the issuers of these securities frequently have high debt levels
and are thus more sensitive to difficult economic conditions, individual
corporate developments and rising interest rates. Consequently, the market price
of these securities may be quite volatile and may result in wider fluctuations
of a Fund's net asset value per share.
BORROWING
A Fund may not borrow money or issue senior securities, except as
described in this paragraph or as described in "Investment Restrictions." Any
policy under "Investment Restrictions" which contradicts policies described in
this paragraph governs that applicable Fund's policy on borrowing. A Fund may
borrow from banks or enter into reverse repurchase agreements for temporary
purposes in amounts up to 10% of the value of its total assets. A Fund may not
mortgage, pledge or hypothecate any assets, except that each Fund may do so in
connection with borrowings for temporary purposes in amounts not in excess of
the lesser of the dollar amounts borrowed or 10% of the value of the total
assets of a Fund. A Fund may also borrow money for extraordinary purposes or to
facilitate redemptions in amounts up to 25% of the value of total assets. A Fund
will not purchase securities while its borrowings (including reverse repurchase
agreements) exceed 5% of its total assets. A Fund has no intention of increasing
its net income through borrowing. Any borrowing will be done from a bank with
the required asset coverage of at least 300%. In the event that such asset
coverage shall at any time fall below 300%, a Fund shall, within three days
thereafter (not including Sundays or holidays) or such longer period as the SEC
may prescribe by rules and regulations, reduce the amount of its borrowings to
such an extent that the asset coverage of such borrowings shall be at least
300%.
3
CASH LIQUIDATION FOR REDEMPTION
The Aston/Veredus Aggressive Growth Fund may participate in a program with
ReFlow Fund LLC ("ReFlow"), which is designed to provide an alternative
liquidity source for mutual funds experiencing redemptions of their shares. In
order to pay cash to shareholders who redeem their shares on a given day, a
mutual fund typically must hold cash in its portfolio, liquidate portfolio
securities, or borrow money, all of which impose certain costs on the Fund.
ReFlow provides participating mutual funds with another source of cash by
standing ready to purchase shares from a fund equal to the amount of the fund's
net redemptions on a given day. ReFlow then generally redeems those shares when
the Fund experiences net sales or when the shares have been outstanding for the
holding limit of 28 days, whichever comes first. In return for this service, the
Fund will pay a fee to ReFlow at a rate determined by a daily auction with other
participating mutual funds.
The costs to the Fund for participating in ReFlow are expected to be
influenced by and comparable to the cost of other sources of liquidity, such as
the Fund's short-term lending arrangements or the costs of selling portfolio
securities to meet redemptions. ReFlow will be prohibited from acquiring more
than 3% of the outstanding voting securities of the Fund.
COLLATERALIZED MORTGAGE OBLIGATIONS ("CMOS"), REAL ESTATE MORTGAGE INVESTMENT
CONDUITS ("REMICS") AND MULTI-CLASS PASS-THROUGHS
CMOs and REMICs are debt instruments issued by special-purpose entities
which are secured by pools or mortgage loans or other mortgage-backed
securities. Multi-class pass-through securities are equity interests in a trust
composed of mortgage loans or other mortgage-backed securities. CMOs, REMICs and
multi-class pass-through securities (collectively, CMOs unless the context
indicates otherwise) may be issued by agencies or instrumentalities of the U.S.
government or by private organizations.
In a CMO, a series of bonds or certificates is issued in multiple classes.
Each class of CMOs, often referred to as a "tranche," is issued at a specified
coupon rate or adjustable rate tranche and has a stated maturity or final
distribution date. Principal prepayments on collateral underlying a CMO may
cause it to be retired substantially earlier than the stated maturities or final
distribution dates. Interest is paid or accrued on all classes of a CMO on a
monthly, quarterly or semi-annual basis. The principal and interest on the
underlying mortgages may be allocated among several classes of a series of a CMO
in many ways. In a common structure, payments of principal, including any
principal prepayments, on the underlying mortgages are applied to the classes of
a series of a CMO in the order of their respective stated maturities or final
distribution dates, so that no payment of principal will be made on any class of
a CMO until all other classes having an earlier stated maturity or final
distribution date have been paid in full.
One or more tranches of a CMO may have coupon rates which reset
periodically at a specified increment over an index such as the London Interbank
Offered Rate ("LIBOR"). These adjustable-rate tranches, known as "floating-rate
CMOs," will be considered adjustable-rate mortgage securities ("ARMs") by a
Fund. Floating-rate CMOs may be backed by fixed-rate or adjustable-rate
mortgages; to date, fixed-rate mortgages have been more commonly utilized for
this purpose. Floating-rate CMOs are typically issued with lifetime "caps" on
the coupon rate thereon. These caps, similar to the caps on adjustable-rate
mortgages, represent a ceiling beyond which the coupon rate on a floating-rate
CMO may not be increased regardless of increases in the interest rate index to
which the floating-rate CMO is geared. The structure and performance of
floating-rate tranches will vary widely as interest rates change.
REMICs are private entities formed for the purpose of holding a fixed pool
of mortgages secured by an interest in real property. REMICs are similar to CMOs
in that they issue multiple classes of securities. As with CMOs, the mortgages
that collateralize the REMIC in which a Fund may invest include mortgages backed
by Ginnie Mae certificates or other mortgage pass-throughs issued or guaranteed
by the U.S. government, its agencies or instrumentalities or issued by private
entities, which are not guaranteed by any government agency.
4
Yields on privately issued CMOs as described above have been historically
higher than the yields on CMOs issued or guaranteed by U.S. government agencies.
However, the risk of loss due to default on such instruments is higher since
they are not guaranteed by the U.S. government. These Funds will not invest in
subordinated privately issued CMOs.
RESETS - The interest rates paid on the ARMs and CMOs in which these Funds
may invest generally are readjusted at intervals of one year or less to an
increment over some predetermined interest rate index. There are three main
categories of indices: those based on U.S. Treasury securities, those derived
from a calculated measure such as a cost of funds index or a moving average of
mortgage rates. Commonly utilized indices include: the one-year, three-year and
five-year constant maturity Treasury rates, the three-month Treasury bill rate,
the six-month Treasury bill rate, rates on longer-term Treasury securities, the
11th District Federal Home Loan Bank Cost of Funds, the National Median Cost of
Funds, the one-, three- or six-month or one-year LIBOR, the prime rate of a
specific bank or commercial paper rates. Some indices, such as the one-year
constant maturity Treasury rate, closely mirror changes in market interest rate
levels. Others, such as the 11th District Federal Home Loan Bank Cost of Funds
index, tend to lag behind changes in market rate levels and tend to be somewhat
less volatile.
CAPS AND FLOORS - The underlying mortgages which collateralize the ARMs
and CMOs in which these Funds may invest will frequently have caps and floors
which limit the maximum amount by which the loan rate to the residential
borrower may change up or down (1) per reset or adjustment interval and (2) over
the life of the loan. Some residential mortgage loans restrict periodic
adjustments by limiting changes in the borrower's monthly principal and interest
payments rather than limiting interest rate changes. These payment caps may
result in negative amortization.
CMOs are subject to credit risk and interest rate risk. Generally, CMOs
have lower credit risk because the underlying mortgages are either guaranteed by
the U.S. government or carry an implicit guarantee of a government-sponsored
enterprise. Private label CMOs may carry higher credit risk, depending on the
underlying collateral. The degree of credit risk will be reflected in the credit
rating of the security. Sub-prime collateral is subject to a high degree of
credit risk. Certain private label CMOs have experienced significant ratings
downgrades during the credit crisis beginning in late 2007 and continuing in
2008. A significant ratings downgrade may adversely affect the liquidity and
valuation of private-label CMOs.
CMOs have a high degree of interest rate risk. The value of a CMO will
fluctuate more widely in response to interest rate changes than a standard debt
security. Liquidity risk is the risk that the investor will be unable to find a
buyer interested in purchasing the security or willing to pay a decent price for
the security. If a Fund has to sell the security before maturity, some of the
principal could be lost. The liquidity of certain CMOs, particularly private
label CMOs, have been adversely affected by the credit crisis beginning in late
2007 and continuing into 2008.
Other risks are reinvestment risk and extension risk. Reinvestment risk is
the risk that, in a falling interest rate environment, a Fund will receive
principal and interest payments earlier than expected and be forced to reinvest
at a lower interest rate. Extension risk is the risk that interest rates will
rise and prepayment speeds will slow, and the Fund will be left holding the
security longer than expected and miss out on opportunities to earn higher rates
in the new interest rate environment.
5
CONVERTIBLE SECURITIES
Common stock occupies the most junior position in a company's capital
structure. Convertible securities entitle the holder to exchange the securities
for a specified number of shares of common stock, usually of the same company,
at specified prices within a certain period of time and to receive interest or
dividends until the holder elects to convert. The provisions of any convertible
security determine its ranking in a company's capital structure. In the case of
subordinated convertible debentures, the holder's claims on assets and earnings
are subordinated to the claims of other creditors and are senior to the claims
of preferred and common shareholders. In the case of preferred stock and
convertible preferred stock, the holder's claims on assets and earnings are
subordinated to the claims of all creditors but are senior to the claims of
common shareholders.
DERIVATIVE INVESTMENTS
The term "derivatives" has been used to identify a range and variety of
financial instruments. In general, a derivative is commonly defined as a
financial instrument whose performance and value are derived, at least in part,
from another source, such as the performance of an underlying asset, a specific
security or an index of securities. As is the case with other types of
investments, a Fund's derivative instruments may entail various types and
degrees of risk, depending upon the characteristics of the derivative instrument
and a Fund's overall portfolio.
Each Fund may use derivative instruments for hedging purposes, to maintain
liquidity or in anticipation of changes in the composition of its portfolio
holdings or as otherwise provided in a Fund's prospectus. No Fund will engage in
derivative investments purely for speculative purposes. A Fund will invest in
one or more derivatives only to the extent that the instrument under
consideration is judged by an investment adviser or subadviser to be consistent
with a Fund's overall investment objective and policies. In making such
judgment, the potential benefits and risks will be considered in relation to a
Fund's other portfolio investments.
Where not specified, investment limitations with respect to a Fund's
derivative instruments will be consistent with such Fund's existing percentage
limitations with respect to its overall investment policies and restrictions.
The types of derivative securities in which certain Funds are permitted to
invest include, but are not limited to, forward commitments, foreign currency
contracts, futures contracts, options, and swap agreements. Whenever a Fund is
required to segregate assets for 1940 Act purposes, notations on the books of
the Trust's custodian or fund accounting agent are sufficient to constitute a
segregated account.
DOLLAR ROLLS
Dollar roll transactions consist of the sale of mortgage-backed securities
to a bank or broker-dealer, together with a commitment to purchase similar, but
not necessarily identical, securities at a future date. Any difference between
the sale price and the purchase price is netted against the interest income
foregone on the securities to arrive at an implied borrowing (reverse
repurchase) rate. Alternatively, the sale and purchase transactions that
constitute the dollar roll can be executed at the same price, with a Fund being
paid a fee as consideration for entering into the commitment to purchase. Dollar
rolls may be renewed after cash settlement and initially may involve only a firm
commitment agreement by a Fund to buy a security. A Fund will segregate cash or
liquid securities in an amount at least equal to the dollar roll transaction.
Whenever a Fund is required to segregate assets for 1940 Act purposes, notations
on the books of the Trust's custodian or fund accounting agent are sufficient to
constitute a segregated account.
6
If the broker-dealer to whom a Fund sells the security becomes insolvent,
a Fund's right to purchase or repurchase the security may be restricted. Also,
the value of the security may change adversely over the term of the dollar roll,
such that the security that a Fund is required to repurchase may be worth less
than the security that a Fund originally held.
EQUITY SECURITIES
Equity securities represent a share of an issuer's earnings and assets,
after the issuer pays its liabilities. The Funds cannot predict the income they
will receive from equity securities because issuers generally have discretion as
to the payment of any dividends or distributions. However, equity securities
offer greater potential for appreciation than many other types of securities,
because their value may increase with the value of the issuer's business. The
following describes various types of equity securities in which the Funds
invest.
COMMON STOCKS
Common stocks are the most prevalent type of equity security. Common
stocks receive the issuer's earnings after the issuer pays its creditors and any
preferred stockholders. As a result, changes in an issuer's earnings may
influence the value of its common stock.
PREFERRED STOCKS
Preferred stocks have the right to receive specified dividends or
distributions before the issuer makes payments on its common stock. Some
preferred stocks also participate in dividends and distributions paid on common
stock. Preferred stocks may also permit the issuer to redeem the stock. A Fund
may treat such redeemable preferred stock as a fixed income security.
WARRANTS AND RIGHTS
Warrants give a Fund the option to buy the issuer's equity securities at a
specified price (the exercise price) at a specified future date (the expiration
date). A Fund may buy the designated securities by paying the exercise price
before the expiration date. Warrants may become worthless if the price of the
stock does not rise above the exercise price by the expiration date. This
increases the market risks of warrants as compared to the underlying security.
Rights are the same as warrants, except companies typically issue rights
to existing stockholders.
FIXED INCOME SECURITIES
Fixed income securities pay interest, dividends or distributions at a
specified rate. The rate may be a fixed percentage of the principal or adjusted
periodically. In addition, the issuer of a fixed income security must repay the
principal amount of the security, normally within a specified time. Fixed income
securities provide more regular income than equity securities. However, the
returns on fixed income securities are limited and normally do not increase with
the issuer's earnings. This limits the potential appreciation of fixed income
securities as compared to equity securities.
A security's yield measures the annual income earned on a security as a
percentage of its price. A security's yield will increase or decrease depending
upon whether it costs less (a discount) or more (a premium) than the principal
amount. If the issuer may redeem the security before its scheduled maturity, the
price and yield on a discount or premium security may change based upon the
probability of an early redemption. Securities with higher risks generally have
higher yields.
7
The following describes various types of fixed income securities in which
a Fund may invest.
TREASURY SECURITIES
Treasury securities are direct obligations of the federal government of
the U.S. Government Treasury securities are generally regarded as having the
lowest credit risks.
AGENCY SECURITIES
Agency securities are issued or guaranteed by a federal agency or other
government sponsored entity (a "GSE") acting under federal authority. The U.S.
Government supports some GSEs with its full faith and credit. Other GSEs receive
support through federal subsidies, loans or other benefits. A few GSEs have no
explicit financial support, but are regarded as having implied support because
the federal government sponsors their activities. Agency securities are
generally regarded as having low credit risks, but not as low as treasury
securities.
Although a GSE guarantee protects against credit risks, it does not reduce
the market and prepayment risks of these mortgage-backed securities.
CORPORATE DEBT SECURITIES
Corporate debt securities are fixed income securities issued by
businesses. Notes, bonds, debentures and commercial paper are the most prevalent
types of corporate debt securities. A Fund may also purchase interests in bank
loans to companies. The credit risks of corporate debt securities vary widely
among issuers.
In addition, the credit risk of an issuer's debt security may vary based
on its priority for repayment. For example, higher ranking (senior) debt
securities have a higher priority than lower ranking (subordinated) securities.
This means that the issuer might not make payments on subordinated securities
while continuing to make payments on senior securities. In addition, in the
event of bankruptcy, holders of senior securities may receive amounts otherwise
payable to the holders of subordinated securities. Some subordinated securities,
such as trust preferred and capital securities notes, also permit the issuer to
defer payments under certain circumstances. For example, insurance companies
issue securities known as surplus notes that permit the insurance company to
defer any payment that would reduce its capital below regulatory requirements.
COMMERCIAL PAPER
Commercial paper is an issuer's obligation with a maturity of less than
nine months. Companies typically issue commercial paper to pay for current
expenditures. Most issuers constantly reissue their commercial paper and use the
proceeds (or bank loans) to repay maturing paper. If the issuer cannot continue
to obtain liquidity in this fashion, its commercial paper may default. Subject
to each Fund's limit on investing in illiquid securities, the Fortis Money
Market Funds may invest, without limit, in commercial paper issued in reliance
upon the "private placement" exemption from registration under Section 4(2) of
the Securities Act of 1933, as amended (the "1933 Act").
DEMAND INSTRUMENTS
Demand instruments are corporate debt securities that the issuer must
repay upon demand. Other demand instruments require a third party, such as a
dealer or bank, to repurchase the security for its face value upon demand. The
Funds treat demand instruments as short-term securities, even though their
stated maturity may extend beyond one year.
8
POOLED VEHICLES
The Funds may invest in debt securities indirectly through pooled products
typically organized as trust structures (e.g., TRAINS and TRACERS) and typically
sold pursuant to Rule 144A under the 1933 Act. TRAINS, TRACERS and similar
products contain a basket of debt securities that are designed to provide broad
credit exposure in a single product. The Funds will incur transaction costs
associated with such products and may be subject to credit risk of the
sponsoring entity.
FORWARD FOREIGN CURRENCY EXCHANGE CONTRACTS
Many international equity securities in which a Fund may invest will be
traded in foreign currencies. These Funds may engage in certain foreign currency
transactions, such as forward foreign currency exchange contracts, to guard
against fluctuations in currency exchange rates in relation to the U.S. dollar
or to the weighting of particular foreign currencies. In addition, a Fund may
buy and sell foreign currency futures contracts and options on foreign
currencies and foreign currency futures. A Fund may use such investments for
hedging purposes only. A Fund will not engage in such investments purely for
speculative purposes.
A forward foreign currency exchange contract involves an obligation to
purchase or sell a specific currency at a future date, which may be any fixed
number of days from the date of the contract agreed upon by the parties, at a
price set at the time of the contract. By entering into a forward foreign
currency exchange contract, a Fund "locks in" the exchange rate between the
currency it will deliver and the currency it will receive for the duration of
the contract. As a result, a Fund reduces its exposure to changes in the value
of the currency it will deliver and increases its exposure to changes in the
value of the currency it will exchange into. Contracts to sell foreign
currencies would limit any potential gain which might be realized by a Fund if
the value of the hedged currency increases. A Fund may enter into these
contracts for the purpose of hedging against foreign exchange risks arising from
a Fund's investment or anticipated investment in securities denominated in
foreign currencies. Such hedging transactions may not be successful and may
eliminate any chance for a Fund to benefit from favorable fluctuations in
relevant foreign currencies. In the case of a forward foreign currency exchange
contract, a Fund will segregate cash or liquid securities at least in an amount
equal to its obligation under the contract. Whenever a Fund is required to
segregate assets for 1940 Act purposes, notations on the books of the Trust's
custodian or fund accounting agent are sufficient to constitute a segregated
account.
A Fund may also enter into forward foreign currency exchange contracts for
purposes of increasing exposure to a foreign currency or to shift exposure to
foreign currency fluctuations from one currency to another. To the extent that
it does so, a Fund will be subject to the additional risk that the relative
value of currencies will be different than anticipated by the particular Fund's
investment adviser or subadviser. A Fund may use one currency (or a basket of
currencies) to hedge against adverse changes in the value of another currency
(or a basket of currencies) when exchange rates between the two currencies are
positively correlated. A Fund may also use foreign currency futures contracts
and related options on currencies for the same reasons for which forward foreign
currency exchange contracts are used.
The use of currency transactions can result in a Fund incurring losses as
a result of a number of factors including the imposition of exchange controls,
suspension of settlements, or the inability to deliver or receive a specified
currency.
9
FOREIGN SECURITIES
Foreign securities may subject a Fund to investment risks that differ in
some respects from those related to investments in obligations of U.S. domestic
issuers. Such risks may include costs in connection with conversions between
various currencies, limited publicly available information regarding foreign
issuers, lack of uniformity in accounting, auditing and financial standards and
requirements, greater securities market volatility, less liquidity of
securities, less government supervision and regulations of securities markets,
future adverse political and economic developments, the possible imposition of
withholding taxes on interest, dividends or other income, possible seizure,
nationalization, or expropriation of foreign deposits, the possible
establishment of exchange controls or taxation at the source, greater
fluctuations in value due to changes in exchange rates, or the adoption of other
foreign governmental restrictions which might adversely affect the payment of
principal and interest on such obligations. Such investments may also entail
higher custodial fees and sales commissions than domestic investments. Foreign
issuers of securities or obligations are often subject to accounting treatment
and engage in business practices different from those with respect to domestic
issuers of similar securities or obligations. Foreign branches of U.S. banks and
foreign banks may be subject to less stringent reserve requirements than those
applicable to domestic branches of U.S. banks. Government regulation in many of
the countries of interest to a Fund may limit the extent of a Fund's investments
in companies in those countries. Further, it may be more difficult for a Fund's
agents to keep currently informed about corporate actions that may affect the
prices of portfolio securities. Communications between the U.S. and foreign
countries may be less reliable than within the U.S., increasing the risk of
delayed settlements of portfolio securities. Certain markets may require payment
for securities before delivery. A Fund's ability and decisions to purchase and
sell portfolio securities may be affected by laws or regulations relating to the
convertibility of currencies and repatriation of assets. Some countries restrict
the extent to which foreigners may invest in their securities markets.
Investments in securities of foreign issuers are frequently denominated in
foreign currencies (including the Euro and other multinational currency units)
and the value of a Fund's assets measured in U.S. dollars may be affected
favorably or unfavorably by changes in currency rates and in exchange control
regulations, and a Fund may incur costs in connection with conversions between
various currencies. A Fund may enter into forward foreign currency contracts as
a hedge against possible variations in foreign exchange rates or to hedge a
specific security transaction or portfolio position. Currently, only a limited
market, if any, exists for hedging transactions relating to currencies in
emerging markets, including Latin American and Asian markets. This may limit a
Fund's ability to effectively hedge its investments in such markets if it
chooses to do so.
Securities of issuers located in countries with developing securities
markets pose greater liquidity risks and other risks than securities of issuers
located in developed countries and traded in more established markets. Low
liquidity in markets may adversely affect a Fund's ability to buy and sell
securities and cause increased volatility. Developing countries may at various
times have less stable political environments than more developed nations.
Changes of control may adversely affect the pricing of securities from time to
time. Some developing countries may afford only limited opportunities for
investing. In certain developing countries, a Fund may be able to invest solely
or primarily through ADRs or similar securities and government approved
investment vehicles, including closed-end investment companies.
The settlement systems in certain emerging markets, including Asian and
Eastern European countries such as Russia, are less developed than in more
established markets. As a result, there may be a risk that settlement may be
delayed and that cash or securities of a Fund may be in jeopardy because of
failures or of defects in the systems used. In particular, market practice may
require that payment be made prior to receipt of the security which is being
purchased or that delivery of a security must be made before payment is
received. In such cases, default by the executing broker or bank might result in
a loss to a Fund investing in emerging market securities.
10
In making investment decisions for a Fund, an investment adviser or
subadviser evaluates the risks associated with investing Fund assets in a
particular country, including risks stemming from a country's financial
infrastructure and settlement practices; the likelihood of expropriation,
nationalization or confiscation of invested assets; prevailing or developing
custodial practices in the country; the country's laws and regulations regarding
the safekeeping, maintenance and recovery of invested assets; the likelihood of
government-imposed exchange control restrictions which could impair the
liquidity of Fund assets maintained with custodians in that country, as well as
risks from political acts of foreign governments ("country risks"). Of course,
an investment adviser's or subadviser's decisions regarding these risks may not
be correct or may prove to be unwise and any losses resulting from investing in
foreign countries will be borne by the Fund.
Holding Fund assets in foreign countries presents additional risks
including, but not limited to, the risks that a particular foreign custodian or
depositary will not exercise proper care with respect to Fund assets or will not
have the financial strength or adequate practices and procedures to properly
safeguard Fund assets. A Fund may be precluded from investing in certain foreign
countries until such time as adequate custodial arrangements can be established.
FORWARD COMMITMENTS, WHEN-ISSUED SECURITIES AND DELAYED DELIVERY TRANSACTIONS
A Fund may purchase or sell securities on a when-issued or
delayed-delivery basis and make contracts to purchase or sell securities for a
fixed price at a future date beyond customary settlement time. Securities
purchased or sold on a when-issued, delayed-delivery or forward commitment basis
involve a risk of loss if the value of the security to be purchased declines
prior to the settlement date. Although a Fund would generally purchase
securities on a when-issued, delayed-delivery or forward commitment basis with
the intention of acquiring the securities, a Fund may dispose of such securities
prior to settlement if its investment adviser or subadviser deems it appropriate
to do so.
A Fund may dispose of or re-negotiate a when-issued or forward commitment
after entering into these transactions. A Fund will normally realize a capital
gain or loss in connection with these transactions. For purposes of determining
a Fund's average dollar-weighted maturity, the maturity of when-issued or
forward commitment securities will be calculated from the commitment date.
When a Fund purchases securities on a when-issued, delayed-delivery or
forward commitment basis, a Fund will segregate cash or liquid securities having
a value (determined daily) at least equal to the amount of a Fund's purchase
commitments. In the case of a forward commitment to sell portfolio securities, a
Fund will segregate the portfolio securities while the commitment is
outstanding. Whenever a Fund is required to segregate assets for 1940 Act
purposes, notations on the books of the Trust's custodian or fund accounting
agent are sufficient to constitute a segregated account.
These procedures are designed to ensure that a Fund will maintain
sufficient assets at all times to cover its obligations under when-issued
purchases, forward commitments and delayed-delivery transactions.
FUTURES CONTRACTS
Futures contracts are generally considered to be derivative securities.
Each Fund may engage in such practices for hedging purposes or to maintain
liquidity or as otherwise provided in a Fund's prospectus. The Trust has claimed
exclusion from the definition of the term "commodity pool operator" adopted by
the Commodity Futures Trading Commission and the National Futures Association,
which
11
regulate trading in the futures markets, on behalf of the Funds. Therefore, the
Trust is not subject to commodity pool operator registration and regulation
under the Commodity Exchange Act. Typically, maintaining a futures contract or
selling an option thereon requires a Fund to deposit with a financial
intermediary as security for its obligations an amount of cash or other
specified assets (initial margin) which initially is typically 1% to 10% of the
face amount of the contract (but may be higher in some circumstances).
Additional cash or assets (variation margin) may be required to be deposited
thereafter on a daily basis as the marked- to- market value of the contract
fluctuates.
At maturity, a futures contract obligates a Fund to take or make delivery
of certain securities or the cash value of a securities index. A Fund may sell a
futures contract in order to offset a decrease in the market value of its
portfolio securities that might otherwise result from a market decline. A Fund
may do so either to hedge the value of its portfolio of securities as a whole,
or to protect against declines, occurring prior to sales of securities, in the
value of the securities to be sold. Conversely, a Fund may purchase a futures
contract in anticipation of purchases of securities. In addition, a Fund may
utilize futures contracts in anticipation of changes in the composition of its
portfolio holdings.
For federal income tax purposes, some gains derived by a Fund from the use
of such instruments will be treated as a combination of short-term and long-term
capital gains and, if not offset by realized capital losses incurred by a Fund,
will be distributed to shareholders and will be taxable to shareholders as a
combination of ordinary income and long-term capital gain.
A Fund may purchase and sell call and put options on futures contracts
traded on an exchange or board of trade. When a Fund purchases an option on a
futures contract, it has the right to assume a position as a purchaser or seller
of a futures contract at a specified exercise price at any time during the
option period. When a Fund sells an option on a futures contract, it becomes
obligated to purchase or sell a futures contract if the option is exercised. In
anticipation of a market advance, a Fund may purchase call options on futures
contracts as a substitute for the purchase of futures contracts to hedge against
a possible increase in the price of securities that a Fund intends to purchase.
Similarly, if the market is expected to decline, a Fund might purchase put
options or sell call options on futures contracts rather than sell futures
contracts. In connection with a Fund's position in a futures contract or option
thereon, a Fund will segregate cash or liquid securities or will otherwise cover
its position in accordance with applicable requirements of the SEC. Whenever a
Fund is required to segregate assets for 1940 Act purposes, notations on the
books of the Trust's custodian or fund accounting agent are sufficient to
constitute a segregated account.
A Fund may enter into a contract for the purchase or sale for future
delivery of securities, including index contracts. While futures contracts
provide for the delivery of securities, deliveries usually do not occur.
Contracts are generally terminated by entering into offsetting transactions.
A Fund may enter into such futures contracts to protect against the
adverse effects of fluctuations in security prices or interest rates without
actually buying or selling the securities. For example, if interest rates are
expected to increase, a Fund might enter into futures contracts for the sale of
debt securities. Such a sale would have much the same effect as selling an
equivalent value of the debt securities owned by a Fund. If interest rates did
increase, the value of the debt securities in the portfolio would decline, but
the value of the futures contracts to a Fund would increase at approximately the
same rate, thereby keeping the net asset value of a Fund from declining as much
as it otherwise would have. Similarly, when it is expected that interest rates
may decline, futures contracts may be purchased to hedge in anticipation of
subsequent purchases of securities at higher prices. Since the fluctuations in
the value of futures contracts should be similar to those of debt securities, a
Fund could take advantage of the anticipated rise in value of debt securities
without actually buying them until the market had stabilized.
12
At that time, the futures contracts could be liquidated and a Fund could then
buy debt securities on the cash market.
A stock index futures contract obligates the seller to deliver (and the
purchaser to take) an amount of cash equal to a specific dollar amount times the
difference between the value of a specific stock index at the close of the last
trading day of the contract and the price at which the agreement was made. Open
futures contracts are valued on a daily basis and a Fund may be obligated to
provide or receive cash reflecting any decline or increase in the contract's
value. No physical delivery of the underlying stocks in the index is made in the
future.
With respect to options on futures contracts, when a Fund is temporarily
not fully invested, it may purchase a call option on a futures contract to hedge
against a market advance. The purchase of a call option on a futures contract is
similar in some respects to the purchase of a call option on an individual
security. Depending on the pricing of the option compared to either the price of
the futures contract upon which it is based, or the price of the underlying debt
securities, it may or may not be less risky than ownership of the futures
contract or underlying debt securities. As with the purchase of futures
contracts, when a Fund is not fully invested, it may purchase a call option on a
futures contract to hedge against a market advance.
The writing of a call option on a futures contract constitutes a partial
hedge against the declining price of the security or foreign currency that is
deliverable upon exercise of the futures contract. If the futures price at the
expiration of the option is below the exercise price, a Fund will retain the
full amount of the option premium which provides a partial hedge against any
decline that may have occurred in the value of a Fund's portfolio holdings. The
writing of a put option on a futures contract constitutes a partial hedge
against the increasing price of the security or foreign currency, which is
deliverable upon exercise of the futures contract. If the futures price at the
expiration of the option is higher than the exercise price, a Fund will retain
the full amount of the option premium, which provides a partial hedge against
any increase in the price of securities that a Fund intends to purchase.
Call and put options on stock index futures are similar to options on
securities except that, rather than the right to purchase or sell stock at a
specified price, options on a stock index future give the holder the right to
receive cash. Upon exercise of the option, the delivery of the futures position
by the writer of the option to the holder of the option will be accompanied by
delivery of the accumulated balance in the writer's futures margin account,
which represents the amount by which the market price of the futures contract,
at exercise, exceeds (in the case of a call) or is less than (in the case of a
put) the exercise price of the futures contract. If an option is exercised on
the last trading day prior to the expiration date of the option, the settlement
will be made entirely in cash equal to the difference between the exercise price
of the option and the closing price of the futures contract on the expiration
date.
If a put or call option which a Fund has written is exercised, that Fund
may incur a loss which will be reduced by the amount of the premium it received.
Depending on the degree of correlation between changes in the value of its
portfolio securities and changes in the value of its options positions, a Fund's
losses from existing options on futures may to some extent be reduced or
increased by changes in the value of portfolio securities.
To the extent that market prices move in an unexpected direction, a Fund
may not achieve the anticipated benefits of futures contracts or options on
futures contracts or may realize a loss. For example, if a Fund is hedged
against the possibility of an increase in interest rates and interest rates
decrease instead, that Fund would lose part or all of the benefit of the
increased value, which it has because it would have offsetting losses in its
futures position. In addition, in such situations, if a Fund had insufficient
cash, it may be required to sell securities from its portfolio to meet daily
variation margin requirements. Such sales of securities may, but will not
necessarily, be at increased prices which reflect the rising market. A Fund may
be required to sell securities at a time when it may be disadvantageous to do
so.
13
Options on securities, futures contracts, options on futures contracts and
options on currencies may be traded on foreign exchanges. Such transactions may
not be regulated as effectively as similar transactions in the U.S., may not
involve a clearing mechanism and related guarantees and are subject to the risk
of governmental actions affecting trading in or the prices of foreign
securities. Some foreign exchanges may be principal markets so that no common
clearing facility exists and a trader may look only to the broker for
performance of the contract. The value of such positions also could be adversely
affected by (i) other complex foreign political, legal and economic factors,
(ii) lesser availability than in the U.S. of data on which to make trading
decisions, (iii) delays in the Trust's ability to act upon economic events
occurring in foreign markets during non-business hours in the U.S., (iv) the
imposition of different exercise and settlement terms and procedures and margin
requirements than in the U.S. and (v) lesser trading volume. In addition, unless
a Fund hedges against fluctuations in the exchange rate between the U.S. dollar
and the currencies in which trading is done on foreign exchanges, any profits
that a Fund might realize in trading could be eliminated by adverse changes in
the exchange rate, or a Fund could incur losses as a result of those changes.
Further, with respect to options on futures contracts, a Fund may seek to
close out an option position by writing or buying an offsetting position
covering the same securities or contracts and have the same exercise price and
expiration date. The ability to establish and close out positions on options
will be subject to the maintenance of a liquid secondary market, which cannot be
assured.
ILLIQUID SECURITIES
A Fund may invest up to 15% (10% for the money market funds) of its net
assets in securities that are illiquid. Securities are generally considered
illiquid if they cannot be disposed of within seven days in the ordinary course
of business at approximately the price at which a Fund values the security.
Illiquid securities will generally include but are not limited to: insurance
funding agreements, repurchase agreements and time deposits with
notice/termination dates in excess of seven days; unlisted over-the-counter
options; swap agreements, interest rate caps, floors and collars; and certain
securities which are subject to trading restrictions because they are not
registered under the 1933 Act. Foreign securities that are restricted as to
resale in the U.S., but are freely tradable in their local market, are not
considered illiquid.
INSURANCE FUNDING AGREEMENTS
An insurance funding agreement is an agreement that requires a Fund to
make cash contributions to a deposit fund of an insurance company's general
account. The insurance company then credits interest to the Fund for a set
period. Funding agreements have put provisions that allow the owner of a funding
agreement to receive back its investment in a specified number of days. A Fund
may invest in funding agreements issued by insurance companies that meet quality
and credit standards established by the adviser. Funding agreements are not
insured or backed by a government agency - they are backed only by the insurance
company that issues them. As a result, they are subject to default risk. In
addition, there normally is no active secondary market for funding agreements.
This means that it may be difficult to sell funding agreements at an appropriate
price and therefore funding agreements normally are treated as illiquid
securities.
14
INVESTMENT COMPANY SHARES
Investments by the Funds in other investment companies, including
closed-end funds and exchange-traded funds ("ETFs"), will be subject to the
limitations of the 1940 Act, the rules and regulations thereunder and in certain
circumstances SEC exemptive orders. By investing in securities of an investment
company, Fund shareholders will indirectly bear the fees of that investment
company in addition to a Fund's own fees and expenses. The Funds may rely on SEC
orders that permit them to invest in certain ETFs beyond the limits contained in
the 1940 Act, subject to certain terms and conditions of those orders. Pursuant
to SEC rules, the Funds may invest in shares of affiliated and unaffiliated
money market funds. To the extent that a Fund is permitted to invest in shares
of an Aston Funds money market fund for cash management purposes, the investment
adviser or subadviser waives management fees with respect to Fund assets
invested therein.
MONEY MARKET INSTRUMENTS
Money market instruments include but are not limited to the following:
short-term corporate obligations, Certificates of Deposit ("CDs"), Eurodollar
Certificates of Deposit ("Euro CDs"), Yankee Certificates of Deposit ("Yankee
CDs"), foreign bankers' acceptances, foreign commercial paper, letter of
credit-backed commercial paper, time deposits, loan participations ("LPs"),
variable- and floating-rate instruments and master demand notes. The Fortis
Institutional Prime Money Market Fund may also invest in insurance funding
agreements. Bank obligations may include bankers' acceptances, negotiable
certificates of deposit and non-negotiable time deposits earning a specified
return, issued for a definite period of time by a U.S. bank that is a member of
the Federal Reserve System or is insured by the Federal Deposit Insurance
Corporation ("FDIC"), or by a savings and loan association or savings bank that
is insured by the FDIC. Bank obligations also include U.S. dollar-denominated
obligations of foreign branches of U.S. banks or of U.S. branches of foreign
banks, all of the same type as domestic bank obligations. Investments in bank
obligations are limited to the obligations of financial institutions having more
than $1 billion in total assets at the time of purchase.
Domestic and foreign banks are subject to extensive but different
government regulations, which may limit the amount and types of their loans and
the interest rates that may be charged. In addition, the profitability of the
banking industry is largely dependent upon the availability and cost of funds to
finance lending operations and the quality of underlying bank assets.
Investments in obligations of foreign branches of U.S. banks and of U.S.
branches of foreign banks may subject a Fund to additional investment risks,
including future political and economic developments, possible imposition of
withholding taxes on interest income, possible seizure or nationalization of
foreign deposits, possible establishment of exchange controls or the adoption of
other foreign governmental restrictions which might adversely affect the payment
of principal and interest on such obligations. In addition, foreign branches of
U.S. banks and U.S. branches of foreign banks may be subject to less stringent
reserve requirements and to different accounting, auditing, reporting and record
keeping standards than those applicable to domestic branches of U.S. banks.
Investments in the obligations of U.S. branches of foreign banks or foreign
branches of U.S. banks will be made only when the investment adviser or
subadviser believes that the credit risk with respect to the investment is
minimal.
Euro CDs, Yankee CDs and foreign bankers' acceptances involve risks that
are different from investments in securities of U.S. banks. The major risk,
which is sometimes referred to as "sovereign risk," pertains to possible future
unfavorable political and economic developments, possible withholding taxes,
seizures of foreign deposits, currency controls, interest limitations or other
governmental restrictions which might affect payment of principal or interest.
Investment in foreign commercial paper also involves risks that are different
from investments in securities of commercial paper issued by U.S. companies.
Non-U.S. securities markets generally are not as developed or efficient as those
in the U.S. Such securities may be less liquid and more volatile than securities
of comparable U.S. corporations. Non-U.S. issuers are not generally subject to
uniform accounting and financial reporting standards, practices and requirements
comparable to those applicable to U.S. issuers. In addition, there may be less
public information available about foreign banks, their branches and other
issuers.
15
Time deposits usually trade at a premium over Treasuries of the same
maturity. Investors regard such deposits as carrying some credit risk, which
Treasuries do not. Also, investors regard time deposits as being sufficiently
less liquid than Treasuries; hence, investors demand some extra yield for buying
time deposits rather than Treasuries.
Commercial paper may include variable- and floating-rate instruments,
which are unsecured instruments that permit the interest on indebtedness
thereunder to vary. Variable-rate instruments provide for periodic adjustments
in the interest rate. Floating-rate instruments provide for automatic adjustment
of the interest rate whenever some other specified interest rate changes. Some
variable- and floating-rate obligations are direct lending arrangements between
the purchaser and the issuer and there may be no active secondary market.
However, in the case of variable- and floating-rate obligations with the demand
feature, a Fund may demand payment of principal and accrued interest at a time
specified in the instrument or may resell the instrument to a third party. In
the event an issuer of a variable- or floating-rate obligation defaulted on its
payment obligation, a Fund might be unable to dispose of the note because of the
absence of a secondary market and could, for this or other reasons, suffer a
loss to the extent of the default. Substantial holdings of variable- and
floating-rate instruments could reduce portfolio liquidity.
BANKERS' ACCEPTANCES - Bankers' acceptances are bills of exchange or time
drafts drawn on and accepted by a commercial bank. Bankers' acceptances are used
by corporations to finance the shipment and storage of goods. Maturities are
generally six months or less.
COMMERCIAL PAPER - Commercial paper is a term used to describe unsecured
short-term promissory notes issued by banks, municipalities, corporations and
other entities. Maturities on these issues vary from a few to 270 days. Fortis
Institutional Prime Money Market Fund invests in asset backed commercial paper
which is bank sponsored and has underlying assets of trade receivables which
would include auto loans, credit card receivables and student loans,.
EURODOLLAR CERTIFICATES OF DEPOSIT - A Euro CD is a receipt from a bank
for funds deposited at that bank for a specific period of time at some specific
rate of return and denominated in U.S. dollars. It is the liability of a U.S.
bank branch or foreign bank located outside the U.S. Almost all Euro CDs are
issued in London.
FOREIGN BANKERS' ACCEPTANCES - A money market Fund's purchases are limited
by the quality standards of Rule 2a-7 under the 1940 Act. Foreign bankers'
acceptances are short-term (270 days or less), non-interest-bearing notes sold
at a discount and redeemed by the accepting foreign bank at maturity for full
face value and denominated in U.S. dollars. Foreign bankers' acceptances are the
obligations of the foreign bank involved to pay a draft drawn on it by a
customer. These instruments reflect the obligation both of the bank and the
drawer to pay the face amount of the instrument upon maturity.
FOREIGN COMMERCIAL PAPER - A money market Fund's purchases are limited by
the quality standards of Rule 2a-7 under the 1940 Act. Foreign commercial paper
consists of short-term unsecured promissory notes denominated in U.S. dollars,
issued directly by a foreign firm in the U.S. or issued by a "domestic shell"
subsidiary of a foreign firm established to raise dollars for the firm's
operations abroad or for its U.S. subsidiary. Like commercial paper issued by
U.S. companies, foreign commercial paper is rated by the rating agencies
(Moody's or S&P) as to the issuer's creditworthiness. Foreign commercial paper
can potentially provide the investor with a greater yield than domestic
commercial paper.
16
LOAN PARTICIPATIONS - LPs are loans sold by the lending bank to an
investor. The loan participant borrower may be a company with highly-rated
commercial paper that finds it can obtain cheaper funding through an LP than
with commercial paper and can also increase the company's name recognition in
the capital markets. LPs often generate greater yield than commercial paper. The
investor in a loan participation has a dual credit risk to both the borrower and
also the selling bank. The second risk arises because it is the selling bank
that collects interest and principal and sends it to the investor.
The borrower of the underlying loan will be deemed to be the issuer except
to the extent a Fund derives its rights from the intermediary bank that sold the
LPs. Because LPs are undivided interests in a loan made by the issuing bank, a
Fund may not have the right to proceed against the LP borrower without the
consent of other holders of the LPs. In addition, LPs will be treated as
illiquid if, in the judgment of an investment adviser or subadviser, they cannot
be sold within seven days.
VARIABLE- AND FLOATING-RATE INSTRUMENTS AND RELATED RISKS - With respect
to the variable- and floating-rate instruments that may be acquired by a Fund,
an investment adviser or subadviser will consider the earning power, cash flows
and other liquidity ratios of the issuers and guarantors of such instruments
and, if the instruments are subject to demand features, will monitor their
financial status with respect to the ability of the issuer to meet its
obligation to make payment on demand. Where necessary to ensure that a variable-
or floating-rate instrument meets a Fund's quality requirements, the issuer's
obligation to pay the principal of the instrument will be backed by an
unconditional bank letter or line of credit, guarantee or commitment to lend.
Because variable- and floating-rate instruments are direct lending
arrangements between the lender and the borrower, it is not contemplated that
such instruments will generally be traded. There is generally no established
secondary market for these obligations, although they are redeemable at face
value. Accordingly, where these obligations are not secured by letters of credit
or other credit support arrangements, a Fund's right to redeem is dependent on
the ability of the borrower to pay principal and interest on demand.
The same credit research must be done for master demand notes as in
accepted names for potential commercial paper issuers to reduce the chances of a
borrower getting into serious financial difficulties.
The Fortis Money Market Funds may invest in high quality floating rate
instruments which reset off the following money market indices: U.S. Treasury
Bills, Fed Funds, Prime and LIBOR.
STRIPS - Separately traded interest and principal securities ("STRIPS")
are component parts of U.S. Treasury Securities traded through the Federal
Book-Entry System. An investment adviser or subadviser will purchase only STRIPS
that it determines are liquid or, if illiquid, that do not violate a Fund's
investment policy concerning investments in illiquid securities. Consistent with
Rule 2a-7, the investment adviser or subadviser will purchase for money market
funds only STRIPS that have a remaining maturity of 397 days or less. While
there is no limitation on the percentage of the Fund's assets that may be
comprised of STRIPS, an investment adviser or subadviser will monitor the level
of such holdings to avoid the risk of impairing shareholders' redemption rights
and of deviation in the value of shares of the money market funds.
YANKEE CERTIFICATES OF DEPOSIT - Yankee CDs are certificates of deposit
that are issued domestically by foreign banks. It is a means by which foreign
banks may gain access to U.S. markets through their branches that are located in
the U.S., typically in New York. These CDs are treated as domestic securities.
17
MORTGAGE-BACKED SECURITIES AND MORTGAGE PASS-THROUGH SECURITIES
The timely payment of principal and interest on mortgage-backed securities
issued or guaranteed by Ginnie Mae (formerly known as the Government National
Mortgage Association) is backed by Ginnie Mae and the full faith and credit of
the U.S. government. Securities issued by Ginnie Mae and other mortgage-backed
securities may be purchased at a premium over the maturity value of the
underlying mortgages. This premium is not guaranteed and would be lost if
prepayment occurs. Mortgage-backed securities issued by U.S. government agencies
or instrumentalities other than Ginnie Mae are not "full faith and credit"
obligations. Certain obligations, such as those issued by the Federal Home Loan
Banks, Fannie Mae (formerly known as the Federal National Mortgage Association)
and Freddie Mac (formerly known as the Federal Home Loan Mortgage Corporation),
are supported only by the credit of the issuer. Unscheduled or early payments on
the underlying mortgages may shorten the securities' effective maturities and
reduce returns. A Fund may agree to purchase or sell these securities with
payment and delivery taking place at a future date.
Other mortgage-backed securities are issued by private issuers, generally
originators of and investors in mortgage loans, including savings associations,
mortgage bankers, commercial banks, investment bankers and special purpose
entities. These private mortgage-backed securities may be supported by U.S.
government mortgage-backed securities or some form of non-government credit
enhancement. Mortgage-backed securities have either fixed or adjustable interest
rates. The rate of return on mortgage-backed securities may be affected by
prepayments of principal on the underlying loans, which generally increase as
interest rates decline. As a result, when interest rates decline, holders of
these securities normally do not benefit from appreciation in market value to
the same extent as holders of other non-callable debt securities. In addition,
like other debt securities, the values of mortgage-related securities, including
government and government-related mortgage pools, generally will fluctuate in
response to market interest rates.
Mortgage-backed securities have greater market volatility than other types
of debt securities. In addition, because prepayments often occur at times when
interest rates are low or are declining, a Fund may be unable to reinvest such
funds in securities that offer comparable yields. The yields provided by these
mortgage securities have historically exceeded the yields on other types of U.S.
government securities with comparable maturities in large measure due to the
risks associated with prepayment features. (See "General Risks of Mortgage
Securities" described below).
The mortgage securities which are issued or guaranteed by Ginnie Mae,
Freddie Mac or Fannie Mae ("certificates") are called pass-through certificates
because a pro-rata share of both regular interest and principal payments (less
Ginnie Mae's, Freddie Mac's or Fannie Mae's fees and any applicable loan
servicing fees), as well as unscheduled early prepayments on the underlying
mortgage pool, are passed through monthly to the holder of the certificate
(i.e., the portfolio).
Certain Funds may also invest in pass-through certificates issued by
non-governmental issuers. Pools of conventional residential mortgage loans
created by such issuers generally offer a higher rate of interest than
government and government-related pools because there are no direct or indirect
government guarantees of payment. Timely payment of interest and principal of
these pools is, however, generally supported by various forms of insurance or
guarantees, including individual loan, title, pool and hazard insurance. The
insurance and guarantees are issued by government entities, private insurance
and the mortgage poolers. Such insurance and guarantees and the creditworthiness
of the issuers thereof will be considered in determining whether a
mortgage-related security meets a Fund's quality standards. A Fund may buy
mortgage-related securities without insurance or guarantees if through an
examination of the loan experience and practices of the poolers, an investment
adviser or subadviser determines that the securities meet a Fund's quality
standards.
18
OTHER MORTGAGE-BACKED SECURITIES - The investment adviser or subadviser
expects that governmental, government-related or private entities may create
mortgage loan pools and other mortgage-related securities offering mortgage
pass-through and mortgage-collateralized investments in addition to those
described above. The mortgages underlying these securities may include
alternative mortgage instruments, that is, mortgage instruments whose principal
or interest payments may vary or whose terms to maturity may differ from
customary long-term fixed-rate mortgages. As new types of mortgage-related
securities are developed and offered to investors, the investment adviser or
subadviser will, consistent with a Fund's investment objective, policies and
quality standards, consider making investments in such new types of
mortgage-related securities.
GENERAL RISKS OF MORTGAGE SECURITIES - The mortgage securities in which a
Fund invests differ from conventional bonds in that principal is paid back over
the life of the mortgage security rather than at maturity. As a result, the
holder of the mortgage securities (i.e., the Fund) receives monthly scheduled
payments of principal and interest and may receive unscheduled principal
payments representing prepayments on the underlying mortgages. When the holder
reinvests the payments and any unscheduled prepayments of principal it receives,
it may receive a rate of interest that is lower than the rate on the existing
mortgage securities. For this reason, mortgage securities may be less effective
than other types of securities as a means of "locking in" long-term interest
rates.
A decline in interest rates may lead to a faster rate of repayment of the
underlying mortgages and expose a Fund to a lower rate of return upon
reinvestment. To the extent that such mortgage-backed securities are held by a
Fund, the prepayment right of mortgagors may decrease or limit the increase in
net asset value of a Fund because the value of the mortgage-backed securities
held by a Fund may decline more than or may not appreciate as much as the price
of non-callable debt securities. To the extent market interest rates increase
beyond the applicable cap or maximum rate on a mortgage security, the market
value of the mortgage security would likely decline to the same extent as a
conventional fixed-rate security. The volatility of the security would likely
increase, however, because the expected decline in prepayments would lead to
longer effective maturity of the underlying mortgages.
In addition, to the extent mortgage securities are purchased at a premium,
mortgage foreclosures and unscheduled principal prepayments may result in some
loss of the holder's principal investment to the extent of the premium paid. On
the other hand, if mortgage securities are purchased at a discount, both a
scheduled payment of principal and an unscheduled prepayment of principal will
increase current and total returns and, in the case of an unscheduled payment of
principal, will accelerate the recognition of income which when distributed to
shareholders will be taxable as ordinary income for federal income tax purposes.
With respect to pass-through mortgage pools issued by non-governmental
issuers, there can be no assurance that the private insurers associated with
such securities can meet their obligations under the policies. Securities issued
by certain private organizations may not be readily marketable. The purchase of
such securities is subject to each Fund's limit with respect to investment in
illiquid securities.
MUNICIPAL SECURITIES
Municipal securities consist of (i) debt obligations issued by or on
behalf of public authorities to obtain funds to be used for various public
facilities, for refunding outstanding obligations, for general operating
expenses, and for lending such funds to other public institutions and
facilities, and (ii) certain private activity and industrial development bonds
issued by or on behalf of public authorities to obtain funds to provide for the
construction, equipment, repair, or improvement of privately operated
facilities. General obligation bonds are backed by the taxing power of the
issuing municipality. Revenue bonds are backed by the revenues of a project or
facility; tolls from a toll bridge for example. The payment of principal and
interest on private activity and industrial development bonds generally is
dependent solely on the ability of the facility's user to meet its financial
obligations and the pledge, if any, of real and personal property so financed as
security for such payment.
19
Municipal securities include both municipal notes and municipal bonds.
Municipal notes include general obligation notes, tax anticipation notes,
revenue anticipation notes, bond anticipation notes, certificates of
indebtedness, demand notes and construction loan notes. Municipal bonds include
general obligation bonds, revenue or special obligation bonds, private activity
and industrial development bonds.
A Fund's investments in any of the notes described above is limited to
those obligations (i) rated in the highest two rating categories by a nationally
recognized statistical rating organization ("NRSRO") or (ii) if not rated, of
equivalent quality in the investment adviser's or subadviser's judgment.
Municipal bonds must be rated in the highest four rating categories by an
NRSRO at the time of investment or, if unrated, must be deemed by an investment
adviser or subadviser to have essentially the same characteristics and quality
as bonds rated in the above rating categories. If permitted by a Fund's
investment policies, the investment adviser or subadviser, as applicable, may
purchase industrial development and pollution control bonds if the interest paid
is exempt from regular federal income tax. These bonds are issued by or on
behalf of public authorities to raise money to finance various
privately-operated facilities for business and manufacturing, housing, sports,
and pollution control. These bonds are also used to finance public facilities
such as airports, mass transit systems, ports and parking facilities. The
payment of the principal and interest on such bonds is dependent solely on the
ability of the facility's user to meet its financial obligations and the pledge,
if any, of real and personal property so financed as security for such payment.
OPTIONS
A call option enables the purchaser, in return for the premium paid, to
purchase securities from the writer of the option at an agreed price up to an
agreed date. The advantage is that the purchaser may hedge against an increase
in the price of securities it ultimately wishes to buy or may take advantage of
a rise in a particular index. A Fund will only purchase call options to the
extent premiums paid on all outstanding call options do not exceed 20% of such
Fund's total assets. A Fund will only sell or write call options on a covered
basis (e.g., on securities it holds in its portfolio). A put option enables the
purchaser of the option, in return for the premium paid, to sell the security
underlying the option to the writer at the exercise price during the option
period. The writer of the option has the obligation to purchase the security
from the purchaser of the option. The advantage is that the purchaser can be
protected should the market value of the security decline or should a particular
index decline. Except as otherwise provided in a Fund's prospectus or in this
SAI, a Fund will only purchase put options to the extent that the premiums on
all outstanding put options do not exceed 20% of that Fund's total assets. A
Fund will only purchase put options on a covered basis and write put options on
a secured basis. Cash or other collateral will be segregated by a Fund for such
options. Whenever a Fund is required to segregate assets for 1940 Act purposes,
notations on the books of the Trust's custodian or fund accounting agent are
sufficient to constitute a segregated account. A Fund will receive premium
income from writing put options, although it may be required, when the put is
exercised, to purchase securities at higher prices than the current market
price. At the time of purchase, a Fund will receive premium income from writing
call options, which may offset the cost of purchasing put options and may also
contribute to that Fund's total return. A Fund may lose potential market
appreciation if the judgment of its investment adviser or subadviser is
incorrect with respect to interest rates, security prices or the movement of
indices.
An option on a securities index gives the purchaser of the option, in
return for the premium paid, the right to receive cash from the seller equal to
the difference between the closing price of the index and the exercise price of
the option.
20
Closing transactions essentially let a Fund offset put options or call
options prior to exercise or expiration. If a Fund cannot effect a closing
transaction, it may have to hold a security it would otherwise sell or deliver a
security it might want to hold.
A Fund may use exchange-traded options, and as permitted by law, options
traded over-the-counter. It is the position of the SEC that over-the-counter
options are illiquid. Accordingly, a Fund will invest in such options only to
the extent consistent with its 15% limit on investments in illiquid securities.
Options are generally considered to be derivative securities. Options may
relate to particular securities, stock indices or financial instruments and may
or may not be listed on a national securities exchange and may or may not be
issued by the Options Clearing Corporation. Options trading is a highly
specialized activity which entails greater than ordinary investment risk.
Options on particular securities may be more volatile than the underlying
securities, and on a percentage basis, an investment in options may be subject
to greater fluctuation than an investment in the underlying securities
themselves.
A Fund will write call options only if they are "covered." In the case of
a call option on a security, the option is "covered" if a Fund owns the security
underlying the call or has an absolute and immediate right to acquire that
security without additional cash consideration (or, if additional cash
consideration is required, cash or liquid securities in such amount will be
segregated by a Fund) upon conversion or exchange of other securities held by
it. For a call option on an index, the option is covered if a Fund maintains
with its custodian a diversified stock portfolio or liquid assets equal to the
contract value.
A call option is also covered if a Fund holds a call on the same security
or index as the call written where the exercise price of the call held is (i)
equal to or less than the exercise price of the call written or (ii) greater
than the exercise price of the call written provided the difference is
maintained by a Fund in cash or liquid securities in a segregated account with
its custodian or fund accounting agent. A Fund will write put options only if
they are "secured" by liquid assets maintained in a segregated account by the
Trust's custodian or fund accounting agent in an amount not less than the
exercise price of the option at all times during the option period. Whenever a
Fund is required to segregate assets for 1940 Act purposes, notations on the
books of the Trust's custodian or fund accounting agent are sufficient to
constitute a segregated account.
A Fund's obligation to sell a security subject to a covered call option
written by it, or to purchase a security subject to a secured put option written
by it, may be terminated prior to the expiration date of the option by a Fund's
execution of a closing purchase transaction, which is effected by purchasing on
an exchange an option of the same series as the previously written option. Such
a purchase does not result in the ownership of an option. A closing purchase
transaction will ordinarily be effected to realize a profit on an outstanding
option, to prevent an underlying security from being called, to permit the sale
of the underlying security or to permit the writing of a new option containing
different terms on such underlying security. The cost of such a liquidation
purchase plus transaction costs may be greater than the premium received upon
the original option, in which event a Fund will have incurred a loss in the
transaction.
There is no assurance that a liquid secondary market will exist for any
particular option. An option writer, unable to effect a closing purchase
transaction, will not be able to sell the underlying security (in the case of a
covered call option) or liquidate the segregated securities (in the case of a
secured put option) until the option expires or the optioned security is
delivered upon exercise with the result that the writer in such circumstances
will be subject to the risk of market decline or appreciation in the security
during such period.
21
PURCHASING CALL OPTIONS - Except as otherwise provided in a Fund's
prospectus or in this SAI, each Fund may purchase call options to the extent
that premiums paid by a Fund do not aggregate more than 20% of that Fund's total
assets. When a Fund purchases a call option, in return for a premium paid by the
Fund to the writer of the option, that Fund obtains the right to buy the
security underlying the option at a specified exercise price at any time during
the term of the option. The writer of the call option, who receives the premium
upon writing the option, has the obligation, upon exercise of the option, to
deliver the underlying security against payment of the exercise price. The
advantage of purchasing call options is that a Fund may alter portfolio
characteristics and modify portfolio maturities without incurring the cost
associated with transactions, except the cost of the option.
Following the purchase of a call option, a Fund may liquidate its position
by effecting a closing sale transaction by selling an option of the same series
as the option previously purchased. A Fund will realize a profit from a closing
sale transaction if the price received on the transaction is more than the
premium paid to purchase the original call option; a Fund will realize a loss
from a closing sale transaction if the price received on the transaction is less
than the premium paid to purchase the original call option.
Although a Fund will generally purchase only those call options for which
there appears to be an active secondary market, there is no assurance that a
liquid secondary market on an exchange will exist for any particular option, or
at any particular time, and for some options no secondary market on an exchange
may exist. In such event, it may not be possible to effect closing transactions
in particular options, with the result that a Fund would have to exercise its
options in order to realize any profit and would incur brokerage commissions
upon the exercise of such options and upon the subsequent disposition of the
underlying securities acquired through the exercise of such options. Further,
unless the price of the underlying security changes sufficiently, a call option
purchased by a Fund may expire without any value to a Fund, in which event a
Fund would realize a capital loss which will be short-term unless the option was
held for more than one year.
COVERED CALL WRITING - A Fund may write covered call options from time to
time on such portions of their portfolios, without limit, as an investment
adviser or subadviser determines is appropriate in pursuing a Fund's investment
objective. The advantage to a Fund of writing covered calls is that the Fund
receives a premium that is additional income. However, if the security rises in
value, a Fund may not fully participate in the market appreciation.
During the option period, a covered call option writer may be assigned an
exercise notice by the broker-dealer through whom such call option was sold,
requiring the writer to deliver the underlying security against payment of the
exercise price. This obligation is terminated upon the expiration of the option
or upon entering a closing purchase transaction. A closing purchase transaction,
in which a Fund, as writer of an option, terminates its obligation by purchasing
an option of the same series as the option previously written, cannot be
effected with respect to an option once the option writer has received an
exercise notice for such option.
Closing purchase transactions will ordinarily be effected to realize a
profit on an outstanding call option, to prevent an underlying security from
being called, to permit the sale of the underlying security or to enable a Fund
to write another call option on the underlying security with either a different
exercise price or expiration date or both. A Fund may realize a net gain or loss
from a closing purchase transaction depending upon whether the net amount of the
original premium received on the call option is more or less than the cost of
effecting the closing purchase transaction. Any loss incurred in a closing
purchase transaction may be partially or entirely offset by the premium received
from a sale of a different call option on the same underlying security. Such a
loss may also be wholly or partially offset by unrealized appreciation in the
market value of the underlying security. Conversely, a gain resulting from a
closing purchase transaction could be offset in whole or in part by a decline in
the market value of the underlying security.
22
If a call option expires unexercised, a Fund will realize a short-term
capital gain in the amount of the premium on the option less the commission
paid. Such a gain, however, may be offset by depreciation in the market value of
the underlying security during the option period if such security is sold or
there is another recognition event. If a call option is exercised, a Fund will
realize a gain or loss from the sale of the underlying security equal to the
difference between the cost of the underlying security and the proceeds of the
sale of the security plus the amount of the premium on the option less the
commission paid.
A Fund will write call options only on a covered basis, which means that a
Fund will own the underlying security subject to a call option at all times
during the option period. Unless a closing purchase transaction is effected, a
Fund would be required to continue to hold a security which it might otherwise
wish to sell or deliver a security it would want to hold. The exercise price of
a call option may be below, equal to, or above the current market value of the
underlying security at the time the option is written.
PURCHASING PUT OPTIONS - A Fund may invest up to 20% of its total assets
in the purchase of put options. A Fund will, at all times during which it holds
a put option, own the security covered by such option. Except as otherwise
provided in a Fund's prospectus or in this SAI, with regard to the writing of
put options, each Fund will limit the aggregate value of the obligations
underlying such put options to 50% of its total assets. The purchase of the put
option on substantially identical securities held by a Fund will constitute a
short sale for federal income tax purposes, which may result in a short-term
capital gain on the sale of the security if such substantially identical
securities were held by that Fund for not more than one year as of the date of
the short sale or were acquired by that Fund after the short sale and on or
before the closing date of the short sale.
A put option purchased by a Fund gives it the right to sell one of its
securities for an agreed price up to an agreed date. A Fund would purchase put
options in order to protect against a decline in the market value of the
underlying security below the exercise price less the premium paid for the
option ("protective puts"). The ability to purchase put options allows a Fund to
protect unrealized gains in an appreciated security in their portfolios without
actually selling the security. If the security does not drop in value, a Fund
will lose the value of the premium paid. A Fund may sell a put option which it
has previously purchased prior to the sale of the securities underlying such
option. Such sale will result in a net gain or loss depending on whether the
amount received on the sale is more or less than the premium and other
transaction costs paid on the put option which is sold.
A Fund may sell a put option purchased on individual portfolio securities.
Additionally, a Fund may enter into closing sale transactions. A closing sale
transaction is one in which a Fund, when it is the holder of an outstanding
option, liquidates its position by selling an option of the same series as the
option previously purchased.
WRITING PUT OPTIONS - A Fund may also write put options on a secured basis
which means that a Fund will segregate liquid assets with its custodian or fund
accounting agent in an amount not less than the exercise price of the option at
all times during the option period. Whenever a Fund is required to segregate
assets, notations on the books of the Trust's custodian or fund accounting agent
are sufficient to constitute a segregated account. The amount of cash or U.S.
government securities held in the segregated account will be adjusted on a daily
basis to reflect changes in the market value of the securities covered by the
put option written by a Fund. Secured put options will generally be written in
circumstances where the investment adviser or subadviser wishes to purchase the
underlying security for a Fund's portfolio at a price lower than the current
market price of the security. In such event, that Fund would write a secured put
option at an exercise price which, reduced by the premium received on the
option, reflects the lower price it is willing to pay.
23
Following the writing of a put option, a Fund may wish to terminate the
obligation to buy the security underlying the option by effecting a closing
purchase transaction. This is accomplished by buying an option of the same
series as the option previously written. However, a Fund may not effect such a
closing transaction after it has been notified of the exercise of the option.
FOREIGN CURRENCY OPTIONS - A Fund may buy or sell put and call options on
foreign currencies either on exchanges or in the over-the-counter market. A put
option on a foreign currency gives the purchaser of the option the right to sell
a foreign currency at the exercise price until the option expires. A call option
on a foreign currency gives the purchaser of the option the right to purchase
the currency at the exercise price until the option expires. Currency options
traded on U.S. or other exchanges may be subject to position limits that may
limit the ability of a Fund to reduce foreign currency risk using such options.
PUBLICLY TRADED PARTNERSHIPS
Publicly traded partnerships are generally limited partnerships (or
limited liability companies), the units of which may be listed and traded on a
securities exchange or are readily tradeable on a secondary market (or its
substantial equivalent). The Funds may invest in publicly traded partnerships
that are treated as partnerships for federal income tax purposes, subject to
certain limitations contained in the Internal Revenue Code of 1986, as amended
(the "Code"), for qualification as a regulated investment company. These include
master limited partnerships ("MLPs") and other entities qualifying under limited
exceptions in the Code. Many MLPs derive income and gain from the exploration,
development, mining or production, processing, refining, transportation or
marketing of any mineral or natural resource or from real property. The value of
MLP units fluctuates predominantly based on prevailing market conditions and the
success of the MLP. The Funds may purchase common units of a MLP on an exchange
as well as directly from the MLP or other parties in private placements. Unlike
owners of common stock of a corporation, owners of common units of a MLP have
limited voting rights and have no ability to annually elect directors. MLPs
generally distribute all available cash flow (cash flow from operations less
maintenance capital expenditures) in the form of quarterly distributions, but a
Fund will be required to include in its taxable income its allocable share of
the MLP's income regardless of whether any distributions are made by the MLP.
Thus, if the distributions received by a Fund are less than that Fund's
allocable share of the MLP's income, the Fund may be required to sell other
securities so that it may satisfy the requirements to qualify as a regulated
investment company and avoid federal income and excise taxes. Common units
typically have priority as to minimum quarterly distributions. In the event of
liquidation, common units have preference over subordinated units, but not debt
or preferred units, to the remaining assets of the MLP.
An investment in MLP units involves some risks that differ from an
investment in the common stock of a corporation. Holders of MLP units have
limited control and voting rights on matters affecting the partnership. Holders
of MLP units of a particular MLP are also exposed to a remote possibility of
liability for the obligations of that MLP under limited circumstances not
expected to be applicable to the Fund. The Fund will not acquire any interests
in MLPs that are believed to expose the assets of the Fund to liabilities
incurred by the MLP. In addition, the value of a Fund's investment in MLPs
depends largely on the MLPs being treated as partnerships for federal income tax
purposes. If an MLP does not meet current law requirements to maintain
partnership status, or if it is unable to do so because of tax law changes, it
would be taxed as a corporation. In that case, the MLP would be obligated to pay
income tax at the entity level and distributions received by a Fund generally
would be taxed as dividend income. As a result, there could be a reduction in a
Fund's cash flow and there could be a material decrease in the value of that
Fund's shares.
24
REAL ESTATE INVESTMENT TRUSTS
Securities of real estate investment trusts ("REITs") may be affected by
changes in the value of their underlying properties and by defaults by borrowers
or tenants. Mortgage REITs may be affected by the quality of the credit
extended. Furthermore, REITs are dependent on specialized management skills.
Some REITs may have limited diversification and may be subject to risks inherent
in investments in a limited number of properties, in a narrow geographic area,
or in a single property type. REITs depend generally on their ability to
generate cash flow to make distributions to shareholders or unitholders, and may
be subject to defaults by borrowers and to self-liquidations. Investment in
REITs may subject a Fund to risks associated with the direct ownership of real
estate, such as decreases in real estate values, overbuilding, increased
competition and other risks related to local or general economic conditions,
increases in operating costs and property taxes, changes in zoning laws,
casualty or condemnation losses, possible environmental liabilities, regulatory
limitations on rent and fluctuations in rental income. Equity REITs generally
experience these risks directly through fee or leasehold interests, whereas
mortgage REITs generally experience these risks indirectly through mortgage
interests unless the mortgage REIT forecloses on the underlying real estate.
Changes in interest rates may also affect the value of a Fund's investment in
REITs. In addition, the performance of a REIT may be affected by its failure to
qualify for tax-free pass-through of income under the Code, or its failure to
maintain exemption from registration under the 1940 Act. Rising interest rates
may cause the value of the REIT securities in which a Fund may invest to fall.
Conversely, falling interest rates may cause their value to rise. Changes in the
value of portfolio securities does not necessarily affect cash income derived
from these securities but may affect a Fund's net asset value.
REPURCHASE AGREEMENTS
A Fund may enter into repurchase agreements pursuant to which a Fund
purchases portfolio assets from a bank or broker-dealer concurrently with an
agreement by the seller to repurchase the same assets from a Fund at a later
date at a fixed price. If the seller should default on its obligation to
repurchase the underlying security, a Fund may experience delay or difficulty in
exercising its right to realize upon the security. Additionally, a Fund may
incur a loss if the value of the security should decline, as well as disposition
costs in liquidating the security.
The repurchase price generally equals the price paid by a Fund plus
interest negotiated on the basis of current short-term rates (which may be more
or less than the rate on the securities underlying the repurchase agreement).
The financial institutions with which a Fund may enter into repurchase
agreements are banks and non-bank dealers of U.S. government securities that are
listed on the Federal Reserve Bank of New York's list of reporting dealers and
banks, if such banks and non-bank dealers are deemed creditworthy by the
investment adviser or subadviser. The investment adviser or subadviser will
continue to monitor the creditworthiness of the seller under a repurchase
agreement and will require the seller to maintain during the term of the
agreement the value of the securities subject to the agreement at not less than
the repurchase price.
A Fund will only enter into a repurchase agreement where the market value
of the underlying security, including interest accrued, will at all times equal
or exceed the repurchase price. The securities held subject to a repurchase
agreement by a money market fund may have stated maturities exceeding 13 months,
provided the repurchase agreement itself matures in less than 13 months. The
taxable money market funds may enter into repurchase agreements that are
collateralized by equity securities, high-yield bonds and other non-traditional
forms of collateral provided that the repurchase agreement is an eligible
security under Rule 2a-7.
25
RESTRICTED SECURITIES
Each Fund will limit investments in securities of issuers which a Fund is
restricted from selling to the public without registration under the 1933 Act to
no more than 5% of a Fund's total assets, excluding restricted securities
eligible for resale pursuant to Rule 144A under the 1933 Act and, with respect
to a money market fund, commercial paper issued in reliance upon "private
placement" exemption from registration under Section 4(2) of the 1933 Act that
has been determined to be liquid by the Fund's investment adviser or subadviser,
pursuant to guidelines adopted by the Trust's Board of Trustees. Securities of
foreign issuers that are restricted as to resale in the U.S., but are freely
tradeable in their local market, are not subject to this restriction.
REVERSE REPURCHASE AGREEMENTS
Reverse repurchase agreements involve the sale of securities held by a
Fund pursuant to that Fund's agreement to repurchase the securities at an agreed
upon price, date and rate of interest. During the reverse repurchase agreement
period, a Fund continues to receive principal and interest payments on these
securities. Such agreements are considered to be borrowings under the 1940 Act
and may be entered into only for temporary or emergency purposes. While reverse
repurchase transactions are outstanding, a Fund will segregate cash or liquid
securities in an amount at least equal to the market value of the securities,
plus accrued interest. (Liquid securities as used in each prospectus and this
SAI include equity securities and debt securities that are unencumbered and
marked-to-market daily.) Whenever a Fund is required to segregate assets for
1940 Act purposes, notations on the books of the Trust's custodian or fund
accounting agent are sufficient to constitute a segregated account. Reverse
repurchase agreements involve the risk that the market value of the securities
sold by a Fund may decline below the price at which a Fund is obligated to
repurchase such securities.
ROYALTY INCOME TRUSTS
A royalty income trust is a trust whose securities are listed on a
securities exchange, generally in Canada or the U.S., and which controls an
underlying company whose business is the acquisition, exploitation, production
and sale of oil and natural gas. Royalty income trusts generally pay out to unit
holders the majority of the cash flow that they receive from the production and
sale of underlying oil and natural gas reserves. The amount of distributions
paid on royalty income trust units will vary from time to time based on
production levels, commodity prices, royalty rates and certain expenses,
deductions and costs, as well as on the distribution payout ratio policies
adopted. As a result of distributing the bulk of their cash flow to unitholders,
the ability of a royalty income trust to finance internal growth through
exploration is limited. Royalty income trusts generally grow through acquisition
of additional oil and gas properties or producing companies with proven reserves
of oil and gas, funded through the issuance of additional equity or, where the
trust is able, additional debt. Royalty income trusts are exposed to many of the
same risks as energy and natural resources companies, such as commodity pricing
risk, supply and demand risk and depletion and exploration risk.
RULE 144A SECURITIES
A Fund may purchase securities which are not registered under the 1933 Act
but which can be sold to "qualified institutional buyers" in accordance with
Rule 144A under the 1933 Act. Any such security will not be considered illiquid
so long as it is determined by the investment adviser or subadviser, under
guidelines approved by the Trust's Board of Trustees, that an adequate trading
market exists for that security. This investment practice could have the effect
of increasing the level of illiquidity in a Fund during any period that
qualified institutional buyers become uninterested in purchasing these
restricted securities.
26
SECURITIES LENDING
A Fund may seek additional income at times by lending its portfolio
securities to broker-dealers and financial institutions provided that: (1) the
loan is secured by collateral that is continuously maintained in an amount at
least equal to the current market value of the securities loaned, (2) the Fund
may call the loan at any time with proper notice and receive the securities
loaned, (3) the Fund will continue to receive interest and/or dividends paid on
the loaned securities and may simultaneously earn interest on the investment of
any cash collateral and (4) the aggregate market value of all securities loaned
by the Fund will not at any time exceed 25% of the total assets of such Fund.
Collateral will normally consist of cash or cash equivalents, securities
issued by the U.S. government or its agencies or instrumentalities or
irrevocable letters of credit. Securities lending by a Fund involves the risk
that the borrower may fail to return the loaned securities or maintain the
proper amount of collateral. Therefore, a Fund will only enter into such lending
after a review by the investment adviser or subadviser of the borrower's
financial statements, reports and other information as may be necessary to
evaluate the creditworthiness of the borrower. Such reviews will be conducted on
an ongoing basis as long as the loan is outstanding.
SHORT SALES
Selling securities short involves selling securities the seller (e.g., a
Fund) does not own (but has borrowed) in anticipation of a decline in the market
price of such securities. To deliver the securities to the buyer, the seller
must arrange through a broker to borrow the securities and, in so doing, the
seller becomes obligated to replace the securities borrowed at their market
price at the time of the replacement. In a short sale, the proceeds the seller
receives from the sale are retained by a broker until the seller replaces the
borrowed securities. The seller may have to pay a premium to borrow the
securities and must pay any dividends or interest payable on the securities
until they are replaced.
A short sale is "against the box" if, at all times during which the short
position is open, a Fund owns at least an equal amount of the securities or
securities convertible into, or exchangeable without further consideration for,
securities of the same issuer as the securities that are sold short.
A Fund may also maintain short positions in forward currency exchange
transactions, in which a Fund agrees to exchange currency that it does not own
at that time for another currency at a future date and specified price in
anticipation of a decline in the value of the currency sold short relative to
the currency that a Fund has contracted to receive in the exchange. To ensure
that any short position of a Fund is not used to achieve leverage, a Fund
segregates cash or liquid assets equal to the fluctuating market value of the
currency as to which any short position is being maintained. Whenever a Fund is
required to segregate assets for 1940 Act purposes, notations on the books of
the Trust's custodian or fund accounting agent are sufficient to constitute a
segregated account.
SHORT-TERM TRADING
Securities may be sold in anticipation of a market decline or purchased in
anticipation of a market rise and later sold. In addition, a security may be
sold and another purchased at approximately the same time to take advantage of
what a Fund believes to be a temporary disparity in the normal yield
relationship between the two securities. Such trading may be expected to
increase a Fund's portfolio turnover rate and the expenses incurred in
connection with such trading and may result in recognition of greater levels of
short-term capital gain, which is taxed to shareholders as ordinary income when
distributed by a Fund.
27
STRIPPED MORTGAGE SECURITIES
A Fund may purchase participations in trusts that hold U.S. Treasury and
agency securities and may also purchase zero coupon U.S. Treasury obligations,
Treasury receipts and other stripped securities that evidence ownership in
either the future interest payments or the future principal payments on U.S.
government obligations. These participations are issued at a discount to their
face value and may exhibit greater price volatility than ordinary debt
securities because of the manner in which their principal and interest are
returned to investors. A Fund will only invest in government-backed mortgage
securities. The investment adviser or subadviser will consider liquidity needs
of a Fund when any investment in zero coupon obligations is made. The stripped
mortgage securities in which a Fund may invest will only be issued or guaranteed
by the U.S. government, its agencies or instrumentalities. Stripped mortgage
securities have greater market volatility than other types of mortgage
securities in which a Fund invests.
Stripped mortgage securities are usually structured with two classes that
receive different proportions of the interest and principal distributions on a
pool of mortgage assets. A common type of stripped mortgage security will have
one class receiving some of the interest and most of the principal from the
mortgage assets, while the other class will receive most of the interest and the
remainder of the principal. In the most extreme case, one class will receive all
of the interest (the interest-only or "IO" class), while the other class will
receive all of the principal (the principal-only or "PO" class). The yield to
maturity on an IO class is extremely sensitive not only to changes in prevailing
interest rates but also to the rate of principal payments (including
prepayments) on the related underlying mortgage assets, and a rapid rate of
principal payments may have a material adverse effect on the yield to maturity
of any such IOs held by a Fund. If the underlying mortgage assets experience
greater than anticipated prepayments of principal, a Fund may fail to fully
recoup its initial investment in these securities even if the securities are
rated in the highest rating categories ("Aaa" or "AAA" by Moody's or S&P,
respectively).
Although stripped mortgage securities are purchased and sold by
institutional investors through several investment banking firms acting as
brokers or dealers, these securities were only recently developed. As a result,
established trading markets have not yet been fully developed. Accordingly,
certain of these securities may generally be illiquid. A Fund will treat
stripped mortgage securities as illiquid securities except for those securities
that are issued by U.S. government agencies and instrumentalities and backed by
fixed rate mortgages whose liquidity is monitored by the investment adviser or
subadviser, subject to the supervision of the Board of Trustees. The staff of
the SEC has indicated that it views such securities as illiquid. Until further
clarification of this matter is provided by the staff, a Fund's investment in
stripped mortgage securities will be treated as illiquid and will, together with
any other illiquid investments, not exceed 15% of such Fund's net assets.
SWAP AGREEMENTS
The Funds may enter into interest rate, index, credit default, equity and
currency exchange rate swap agreements. These transactions would be entered into
in an attempt to obtain a particular return when it is considered desirable to
do so, possibly at a lower cost to a Fund than if the Fund had invested directly
in the asset that yielded the desired return. Swap agreements are two-party
contracts entered into primarily by institutional investors for periods ranging
from a few weeks to more than one year. In a standard swap transaction, two
parties agree to exchange the returns (or differentials in rates of return)
earned or realized on particular predetermined investments or instruments, which
may be adjusted for an interest factor. The gross returns to be exchanged or
"swapped" between the parties are generally calculated with respect to a "normal
amount," i.e., the return on or increase in value of a particular dollar amount
invested at a particular interest rate, in a particular foreign currency, or in
a "basket" of securities representing a particular index. Forms of swap
agreements include interest rate caps, under which, in return for a premium, one
party agrees to make payments to the other to the extent that interest rates
28
exceed a specified rate, or "cap"; interest rate floors, under which, in return
for a premium, one party agrees to make payments to the other to the extent that
interest rates fall below a specified level, or "floor"; and interest rate
collars, under which a party sells a cap and purchases a floor or vice versa, in
an attempt to protect itself against interest rate movements exceeding given
minimum or maximum levels.
A Fund may enter into credit default swap agreements. The "buyer" in a
credit default contract is obligated to pay the "seller" a periodic stream of
payments over the term of the contract provided that no credit event with
respect to any underlying reference obligation has occurred. If a credit event
occurs, the seller typically must pay the buyer the "par value" (full notional
value) of the reference obligation in exchange for the reference obligation. A
Fund may either be the buyer or the seller in the transaction. If a Fund is a
buyer and no credit event occurs, the Fund loses its investment and recovers
nothing. However, if a credit event occurs, the buyer receives full notional
value for a reference obligation that may have little or no value. As a seller,
a Fund typically receives a fixed rate of income throughout the term of the
contract, which typically is between six months and three years, provided a
credit event does not occur. If a credit event occurs, the seller typically must
pay the buyer the full notional amount of the reference obligation. Credit
default swaps involve more risk than if a Fund had invested in the reference
obligation directly because the Fund can obtain credit exposure in excess of its
cash obligations under the agreement.
Most swap agreements entered into by a Fund calculate the obligations of
the parties to the agreement on a "net basis." Consequently, the Fund's current
obligations (or rights) under a swap agreement will generally be equal only to
the net amount to be paid or received under the agreement based on the relative
values of the positions held by each party to the agreement (the "net amount").
The Fund's current obligations under a swap agreement will be accrued daily
(offset against amounts owed to the Fund) and any accrued but unpaid net amounts
owed to a swap counterparty will be covered by the maintenance of a segregated
account consisting of liquid assets to limit any potential leveraging of the
Fund's portfolio. Whenever a Fund is required to segregate assets for 1940 Act
purposes, notations on the books of the Trust's custodian or fund accounting
agent are sufficient to constitute a segregated account.
Obligations under swap agreements so covered will not be construed to be
"senior securities" for purposes of the Funds' investment restriction concerning
senior securities. Except as otherwise indicated in a Fund's prospectus or in
this SAI, a Fund will not enter into a swap agreement with any single party if
the net amount owed or to be received under existing contracts with that party
would exceed 5% of the Fund's assets.
Whether a Fund's use of swap agreements will be successful in furthering
its investment objective will depend on the investment adviser or subadviser's
ability to correctly predict whether certain types of investments are likely to
produce greater returns than other investments. Because they are two-party
contracts and because they may have terms of greater than seven days, swap
agreements may be considered to be illiquid investments. Moreover, a Fund bears
the risk of loss of the amount expected to be received under a swap agreement in
the event of the default or bankruptcy of a swap agreement counterparty. A Fund
will enter into swap agreements only with counterparties that meet certain
standards for creditworthiness (generally, such counterparties would have to be
eligible counterparties under the terms of the Fund's repurchase agreement
guidelines). Certain restrictions imposed by the Code for qualification as a
regulated investment company may limit a Fund's ability to use swap agreements.
The swap market is a relatively new market and is largely unregulated. It is
possible that developments in the swap market, including potential government
regulation, could adversely affect the Fund's ability to terminate existing swap
agreements or to realize amounts to be received under such agreements.
29
TEMPORARY DEFENSIVE POSITIONING
The investments and strategies described throughout the Funds'
prospectuses are those the subadvisers intend to use under normal conditions.
When a subadviser determines that market or other conditions warrant, a Fund
(other than the money market funds) may invest up to 100% of its assets in money
market instruments or hold U.S. dollars. When a Fund is investing for temporary
or defensive purposes, it is not pursuing its investment goal.
UNIT INVESTMENT TRUSTS
A Unit Investment Trust ("UIT") is a type of investment company.
Investments in UITs are subject to regulations limiting a Fund's acquisition of
investment company securities. Standard and Poor's Depositary Receipts
("SPDRs"), DIAMONDS, MDYs and similar investments are interests in UITs that may
be obtained directly from the UIT or purchased in the secondary market. SPDRs
consist of a portfolio of securities substantially similar to the component
securities of the Standard and Poor's 500 Composite Stock Price Index. DIAMONDS
and MDYs consist of a portfolio of securities substantially similar to the
component securities of the Dow Jones Industrial Average and of the Standard and
Poor's MidCap 400 Index, respectively.
The price of a UIT interest is derived and based upon the securities held
by the UIT. Accordingly, the level of risk involved in the purchase or sale of a
UIT interest is similar to the risk involved in the purchase or sale of
traditional common stock, with the exception that the pricing mechanism for UITs
is based on a basket of stocks. Disruptions in the markets for the securities
underlying UITs purchased or sold by a Fund could result in losses on UITs.
Trading in UITs involves risks similar to those risks, described above under
"Options," involved in the writing of options on securities.
Interests in UITs are not individually redeemable, except upon termination
of the UIT. To redeem, a Fund must accumulate a certain amount of UIT interests.
The liquidity of small holdings of UITs, therefore, depends upon the existence
of a secondary market. Upon redemption of a UIT interest, a Fund receives
securities and cash identical to the deposit required of an investor wishing to
purchase a UIT interest that day.
ZERO COUPON BONDS
Zero coupon securities are debt securities issued or sold at a discount
from their face value that do not entitle the holder to any periodic payment of
interest prior to maturity, a specified redemption date or a cash payment date.
The amount of the discount varies depending on the time remaining until maturity
or cash payment date, prevailing interest rates, liquidity of the security and
perceived credit quality of the issuer.
Zero coupon securities also may take the form of debt securities that have
been stripped of their unmatured interest coupons, the coupons themselves and
receipts or certificates representing interests in such stripped debt
obligations and coupons. The market prices of zero coupon securities are
generally more volatile than the market prices of interest-bearing securities
and respond more to changes in interest rates than interest-bearing securities
with similar maturities and credit qualities. For federal income tax purposes,
the original issue discount on the zero coupon bonds must be included ratably in
the income of a Fund as the income accrues even though payment has not been
received. The Funds nevertheless intend to distribute an amount of cash equal to
the currently accrued original issue discount, and this may require liquidating
securities at times they might not otherwise do so and may result in capital
gain or loss.
30
OTHER INVESTMENTS
The Board of Trustees may, in the future, authorize a Fund to invest in
securities other than those listed here and in the Fund's Prospectus, provided
that such investment would be consistent with that Fund's investment objective
and that it would not violate any fundamental investment policies or
restrictions applicable to that Fund.
31
Aston/New Century Absolute Return ETF Fund and Aston/Smart Portfolios Fund
The following supplements the information contained above and in the
prospectus concerning the investment objective, strategies and risks of
investing in Aston/New Century Absolute Return ETF Fund and Aston/Smart
Portfolios Fund. For this portion of the SAI, the terms "Fund" and "Funds"
refers only to Aston/New Century Absolute Return ETF Fund and Aston/Smart
Portfolios Fund.
FUND-OF-FUNDS STRUCTURE
As noted in the Funds' prospectus, each Fund is a "fund-of-funds." The
term "fund-of-funds" is typically used to describe investment companies, such as
the Funds, whose principal investment strategy involves investing in other
investment companies. In reliance on Section 12(d)(1)(F) of the 1940 Act, a Fund
may not acquire shares of another investment company (including ETFs) if,
immediately after such acquisition, that Fund and its affiliated persons would
hold more than 3% of the ETF's or investment company's total outstanding stock
("3% Limitation"). The SEC has granted exemptive orders to certain ETFs which
permit other funds, such as the Funds, to invest in these ETFs in excess of the
3% Limitation. The orders contain conditions that a participating fund enter
into an agreement with the ETF. Accordingly, each Fund is subject to the 3%
Limitation unless (i) the ETF or the Fund has received an order for exemptive
relief from the 3% Limitation from the SEC that is applicable to the Funds; and
(ii) the ETF and the Funds take appropriate steps to comply with any conditions
in such order. Neither Fund has yet entered into any such agreements in reliance
on an exemptive order. The 3% Limitation may prevent a Fund from allocating its
investments in the manner that the subadviser considers optimal.
Notwithstanding the 3% Limitation, the Funds generally may purchase or
redeem, without limitation, shares of any affiliated or unaffiliated money
market funds, including unregistered money market funds, so long as the Funds do
not pay a sales load or service fee in connection with the purchase, sale or
redemption or if such fees are paid, the Fund's investment adviser must waive
its management fee in an amount necessary to offset the amounts paid.
By investing in securities of an ETF, the Funds' shareholders will
indirectly bear the fees of that ETF in addition to the Funds' own fees and
expenses.
Because the Funds initially intend to rely on Section 12(d)(1)(F) in
purchasing securities issued by another investment company, each Fund must
either seek instructions from its shareholders with regard to the voting of all
proxies with respect to its investment in such securities and vote such proxies
only in accordance with the instructions, or vote the shares held by it in the
same proportion as the vote of all other holders of the securities (echo
voting). The Funds intend to vote such other investment companies shares in the
same proportion as the vote of all other holders of such securities.
EXCHANGE-TRADED FUNDS AND OTHER INVESTMENT COMPANIES
EXCHANGE-TRADED FUNDS
Under normal circumstances, the Funds will invest at least 80% of their
assets in shares of ETFs. ETFs are typically organized as open-end investment
companies or unit investment trusts. ETFs are traded on exchanges similar to
stocks. An ETF is an investment company that seeks to track the performance of
an index (before fees and expenses) by holding in its portfolio either the
securities that comprise the index or a representative sample of the securities
in the index. ETFs offer investment in a wide variety of asset classes,
including: large-cap, mid-cap, small-cap, equity, international, commodities,
real estate, fixed income, derivatives and currency. As new ETF products become
available, the asset classes available to the Funds will expand.
32
Unlike interests in conventional mutual funds, ETFs are traded throughout
the day on a national securities exchange, whereas mutual fund interests are
typically only bought and sold at closing net asset values. ETFs are designed to
be tradable in the secondary market on a national securities exchange on an
intra-day basis, and to be created and redeemed principally in-kind in large
blocks (typically 50,000 shares), called creation units, at each day's next
calculated net asset value. The in-kind creation or redemption is for a
portfolio of the underlying securities of the ETF. There may also be a cash
component. These arrangements are designed to protect ongoing shareholders from
adverse effects on the portfolio of the ETF that could arise from frequent cash
creation and redemption transactions. In a conventional mutual fund, redemptions
can have an adverse tax impact on taxable shareholders because of the mutual
fund's need to sell portfolio securities to obtain cash to meet fund
redemptions. These sales may generate taxable gains for the shareholders of the
mutual fund, whereas an ETF's in-kind redemption mechanism generally will not
lead to a federal income tax event for a Fund or its ongoing shareholders. The
Funds do not intend to purchase and redeem creation units, but intend to
purchase and sell ETFs primarily through national securities exchanges.
There is a risk that the ETFs in which the Funds invest may terminate due
to extraordinary events that may cause any of the service providers to the ETFs,
such as the trustee or sponsor, to close or otherwise fail to perform their
obligations to the ETF. Also, because the ETFs in which the Funds intend to
principally invest may be granted licenses by agreement to use the indices as a
basis for determining their compositions and/or otherwise to use certain trade
names, the ETFs may terminate if such license agreements are terminated. In
addition, an ETF may terminate if its entire net asset value falls below a
certain amount. Although the Funds believe that, in the event of the termination
of an underlying ETF, they will be able to invest instead in shares of an
alternate ETF tracking the same market index or another market index with the
same general market, there is no guarantee that shares of an alternate ETF would
be available for investment at that time.
The general risks of investing in ETFs are as follows.
ACTIVE MANAGEMENT RISK
Unlike many investment companies, many ETFs are not currently "actively"
managed. Thus, an ETF would not necessarily sell a security because the
security's issuer was in financial trouble unless that security is removed from
the index.
TRACKING RISK
ETFs in which the Funds invest will not be able to replicate exactly the
performance of the indices they track because the total return generated by the
securities will be reduced by transaction costs incurred in adjusting the actual
balance of the securities. In addition, the ETFs in which the Funds invest will
incur expenses not incurred by their applicable indices. Certain securities
comprising the indices tracked by the ETFs may, from time to time, temporarily
be unavailable, which may further impede the ETFs' ability to track their
applicable indices.
33
TRADING DISCOUNT RISK
The market value of ETF shares may differ from net asset value. This
difference in price may be due to the fact that ETF shares supply and demand is
not always identical to supply and demand for an ETF's underlying basket of
securities. At times, an ETF's shares may trade at a premium or discount to its
net asset value.
ETFs cover a wide variety of asset classes. The risks associated with
various types of ETFs that track different asset classes are described below. As
new ETF products become available, the Funds will be able to invest in those
ETFs.
INVESTMENT RISK
AGGRESSIVE ETF INVESTMENT TECHNIQUE RISK
ETFs may use investment techniques and financial instruments that could be
considered aggressive, including the use of futures contracts, options on
futures contracts, securities and indices, forward contracts, swap agreements
and similar instruments. An ETF's investment in financial instruments may
involve a small investment relative to the amount of investment exposure assumed
and may result in losses exceeding the amounts invested in those instruments.
Such instruments, particularly when used to create leverage, may expose the ETF
to potentially dramatic changes (losses or gains) in the value of the
instruments and imperfect correlation between the value of the instruments and
the relevant security or index. The use of aggressive investment techniques also
exposes an ETF to risks different from, or possibly greater than, the risks
associated with investing directly in securities contained in an index
underlying the ETF's benchmark, including: 1) the risk that an instrument is
temporarily mispriced; 2) credit, performance or documentation risk on the
amount each ETF expects to receive from a counterparty; 3) the risk that
securities prices, interest rates and currency markets will move adversely and
an ETF will incur significant losses; 4) imperfect correlation between the price
of financial instruments and movements in the prices of the underlying
securities; 5) the risk that the cost of holding a financial instrument might
exceed its total return; and 6) the possible absence of a liquid secondary
market for any particular instrument and possible exchange imposed price
fluctuation limits, both of which may make it difficult or impossible to adjust
an ETF's position in a particular instrument when desired.
Futures Contracts. Futures contracts and options on futures contracts
provide for the future sale by one party and purchase by another party of a
specified amount of a specific security at a specified future time and at a
specified price. An option on a futures contract gives the purchaser the right,
in exchange for a premium, to assume a position in a futures contract at a
specified exercise price during the term of the option. Index futures are
futures contracts for various indices that are traded on registered securities
exchanges.
Options. The buyer of an option acquires the right to buy (a call option)
or sell (a put option) a certain quantity of a security (the underlying
security) or instrument at a certain price up to a specified point in time. The
seller or writer of an option is obligated to sell (a call option) or buy (a put
option) the owning the underlying security on which the option is written or by
owning a call option on the underlying security. Alternatively, an ETF may cover
its positions by maintaining, in a segregated account, cash or liquid securities
equal in value to the exercise price of the call options written by the ETF.
34
CURRENCY ETFS
Investing in currency ETFs involves certain risks. The value of the ETF's
shares relate directly to the value of a currency (either U.S. or foreign) held
by the ETF. Fluctuations in the price of the country's currency could materially
and adversely affect the value of the ETF's shares. The ETF's shares are
designed to reflect the price of the country's currency, plus accumulated
interest, less the ETF's expenses. The price of the currency may fluctuate
widely. Several factors may affect the price of the currency, including, but not
limited to: debt level and trade deficit; inflation rates of the United States
and foreign countries and investors' expectations concerning inflation rates;
investment and trading activities of mutual funds, hedge funds and currency
funds; and global or regional political, economic or financial events and
situations. In addition, the currency may not maintain its long-term value in
terms of purchasing power in the future. When the price of the country's
currency declines, it is expected that the price of the ETF will decline as
well.
COMMODITY ETF RISK
Investing in ETFs that invest in the commodities market may subject the
Funds to greater volatility than investments in traditional securities.
Commodities include metals, agricultural products, livestock and minerals. ETFs
may buy certain commodities (such as gold) or may invest in commodity-linked
derivative instruments. The value of commodities and commodity contracts are
affected by a variety of factors, including, but not limited to: global supply
and demand, changes in interest rates, commodity index volatility, and factors
affecting a particular industry or commodity, such as drought, floods, weather,
livestock disease, embargos, government regulation, tariffs and taxes, world
events and economic, political and regulatory developments. The Funds' ability
to invest in ETFs that invest in the commodities market may be significantly
limited by the federal income tax rules applicable to regulated investment
companies.
CONCENTRATED ETF RISK
Some ETFs may be concentrated in a narrow industry. Concentration risk
results from maintaining exposure to issuers conducting business in a specific
industry. The risk of concentrating investments in a limited number of issuers
in a particular industry is that the ETF will be more susceptible to the risks
associated with that industry than a fund that does not concentrate its
investments. An ETF may have significant exposure to an individual company that
constitutes a significant portion of that ETF's index. As a result, such an ETF
will be more susceptible to the risks associated with that specific company,
which may be different from the risks generally associated with the companies
contained in the index.
EQUITY ETF RISK
Credit Risk. Credit risk is the risk that the issuer of a security or
counterparty to a transaction will be unable or unwilling to make timely
principal and/or interest payments, or otherwise will be unable or unwilling to
honor its financial obligations. If the issuer or counterparty fails to honor
its obligations the value of that security and of the particular ETF's shares
may be reduced.
35
Market Risk. Overall stock market risks affect the value of ETFs, and thus
the share price of the Funds. Factors such as domestic economic growth and
market conditions, interest rate levels and political events affect the
securities markets.
Small and Mid-Cap Company Risk. Investing in ETFs that own securities of
small and mid-cap companies may involve greater risks than investing in
securities of larger, more established issuers. Small and mid-cap companies
generally have limited product lines, markets and financial resources. Their
securities may trade less frequently and in more limited volume than the
securities of larger, more established companies. Also, small and mid-cap
companies are typically subject to greater changes in earnings and business
prospects than larger companies. As a result, their stock prices may experience
greater volatility and may decline significantly in market downturns.
Foreign Securities Risk. Investing in ETFs that invest in foreign issuers
involves risks not associated with U.S. investments, including settlement risks,
currency fluctuation, local withholding and other taxes, different financial
reporting practices and regulatory standards, high costs of trading, changes in
political conditions, expropriation, investment and repatriation restrictions
and settlement and custody risks.
Emerging Market Risk. The Funds may invest in ETFs that invest in issuers
located in emerging markets. Emerging market countries may have relatively
unstable governments, less diverse economies and less liquid securities markets.
Companies in emerging markets are often smaller, less seasoned and more recently
organized.
FIXED INCOME ETFS
Credit Risk. Credit risk is the risk that the issuer or guarantor of a
debt security or counterparty to a transaction involving one or more bonds in an
ETF's portfolio will be unable or unwilling to make timely principal and/or
interest payments, or otherwise will be unable or unwilling to honor its
financial obligations. If the issuer, guarantor, or counterparty fails to pay
interest, an ETF's income may be reduced. If the issuer, guarantor, or
counterparty fails to repay principal, the value of that security and of the
particular ETF's shares may be reduced. ETFs may be subject to credit risk to
the extent that they invest in debt securities which involve a promise by a
third party to honor an obligation with respect to the debt security. Credit
risk is particularly significant for investments in "junk bonds" or lower than
investment-grade securities.
Interest Rate Risk. The price of a bond or a fixed income security is
dependent upon interest rates. Therefore, the share price and total return of
ETFs, when investing a significant portion of its assets in bonds or fixed
income securities, will vary in response to changes in interest rates. A rise in
interest rates generally causes the value of a bond to decrease, and vice versa.
There is the possibility that the value of the particular ETF's investment in
bonds or fixed income securities may fall because bonds or fixed income
securities generally fall in value when interest rates rise. The longer the term
of a bond or fixed income instrument, the more sensitive it will be to
fluctuations in value from interest rate changes. Changes in interest rates may
have a significant effect if the particular ETF is then holding a significant
portion of its assets in fixed income securities with long-term maturities.
In the case of mortgage-backed securities, rising interest rates tend to
extend the term to maturity of the securities, making them even more susceptible
to interest rate changes. When interest rates drop, not only can the value of
fixed income securities drop, but also the yield can drop, particularly where
the yield is tied to changes in interest rates, such as adjustable mortgages.
Also when interest rates drop, the holdings of mortgage-backed securities by an
ETF can reduce returns if the owners of the underlying mortgages pay off their
mortgages sooner than expected since the funds prepaid must be reinvested at the
then lower prevailing rates. This is known as prepayment risk. When interest
rates rise, the holdings of mortgage-backed securities by an ETF can reduce
returns if the owners of the underlying mortgages pay off their mortgages later
than anticipated. This is known as extension risk.
36
Maturity Risk. Maturity risk is another factor that can affect the value
of a particular ETF's debt holdings. Certain ETFs may not have a limitation
policy regarding the length of maturity of its debt holdings. In general, the
longer the maturity of a debt obligation, the higher its yield and the greater
its sensitivity to changes in interest rates. Conversely, the shorter the
maturity, the lower the yield, but the greater the price stability.
Investment-Grade Securities Risk. Debt securities are rated by national
bond rating agencies. Securities rated BBB by S&P or Fitch's Investor Service,
Inc. ("Fitch") or Baa by Moody's are considered investment-grade securities, but
are somewhat riskier than more highly rated investment-grade obligations (those
rated A or better by S&P or Fitch and Aa or better by Moody's) because they are
regarded as having only an adequate capacity to pay principal and interest, are
considered to lack outstanding investment characteristics, and may be
speculative. Such investment-grade securities will be subject to higher credit
risk and may be subject to greater fluctuations in value than higher-rated
securities.
Municipal Securities Risk. Municipal securities are subject to the risk
that litigation, legislation or other political events, local business or
economic conditions or the bankruptcy of the issuer could have a significant
effect on an issuer's ability to make payments of principal and/or interest.
Municipal securities can be significantly affected by political changes as
well as uncertainties in the municipal market related to taxation, legislative
changes or the rights of municipal security holders. Because many securities are
issued to finance similar projects, especially those relating to education,
health care, transportation and utilities, conditions in those sectors can
affect the overall municipal market. In addition, changes in the financial
condition of an individual municipal insurer can affect the overall municipal
market.
Municipal securities backed by current or anticipated revenues from a
specific project or specific assets can be negatively affected by the
discontinuance of the taxation supporting the project or assets or the inability
to collect revenues from the project or from the assets. If the Internal Revenue
Service ("IRS") determines an issuer of a municipal security has not complied
with applicable federal income tax requirements, interest from the security
could become taxable for federal income tax purposes and the security could
decline significantly in value.
GEOGRAPHICAL CONCENTRATED ETF RISK
Certain ETFs that focus their investments in particular countries or
geographic regions may be particularly susceptible to economic, political or
regulatory events affecting those countries or regions. In addition, currency
devaluations could occur in countries that have not yet experienced currency
devaluation to date, or could continue to occur in countries that have already
experienced such devaluations. As a result, ETFs that focus their investments in
a particular geographic region or country may be more volatile than a more
geographically diversified fund.
INVERSE CORRELATION ETF RISK
ETFs benchmarked to an inverse multiple of an index should lose value as
the index or security underlying such ETF's benchmark is increasing (gaining
value) a result that is the opposite from traditional mutual funds.
37
LEVERAGED ETF RISK
Leverage offers a means of magnifying market movements into larger changes
in an investment's value and provides greater investment exposure than an
unleveraged investment. While only certain ETFs employ leverage, many may use
leveraged investment techniques for investment purposes. The ETFs that employ
leverage will normally lose more money in adverse market environments than ETFs
that do not employ leverage.
38
REAL ESTATE INVESTMENT TRUST ETF RISK
Investing in ETFs that own securities of REITs subjects the Funds to the
risk of changes in the value of the REIT's properties and defaults by borrowers
or tenants. Some REITs may have limited diversification and may be subject to
risks inherent in investments in a limited number of properties, in a narrow
geographic area, or in a single property type. REITs depend generally on their
ability to generate cash flow to make distributions to shareholders or
unitholders, and may be subject to defaults by borrowers and self-liquidations.
A REIT's return may be adversely affected when interest rates are high or
rising.
NON-DIVERSIFIED ETF RISK
Certain ETFs have the ability to concentrate a relatively high percentage
of their investments in the securities of a small number of issuers. This would
make the performance of the ETF more susceptible to a single economic, political
or regulatory event than a diversified ETF or mutual fund might be. This risk
may be particularly acute with respect to an ETF whose index underlying its
benchmark comprises a small number of stocks or other securities.
39
INVESTMENT RESTRICTIONS
The investment objective of each Fund and investment restrictions set
forth below are fundamental policies and may not be changed as to a Fund without
the approval of a majority of the outstanding voting shares (as defined in the
1940 Act) of the Fund. Unless otherwise indicated, all percentage limitations
governing the investments of each Fund apply only at the time of transaction.
Accordingly, if a percentage restriction is adhered to at the time of
investment, a later increase or decrease in the percentage which results from a
relative change in values or from a change in a Fund's total assets will not be
considered a violation.
Each Fund except Aston/River Road Dividend All Cap Value, Aston/Montag &
Caldwell Mid Cap Growth, Aston/Cardinal Mid Cap Value, Aston/River Road Small
Cap Value, Aston/River Road Small-Mid Cap, Aston/Fortis Global Real Estate,
Aston/Neptune International, Aston/Barings International, Aston/New Century
Absolute Return ETF, Aston/Smart Portfolios and Aston/MB Enhanced Equity Income
Funds may not:
(1) Purchase or sell real estate (but this restriction shall not prevent
the Funds from investing directly or indirectly in portfolio instruments secured
by real estate or interests therein or acquiring securities of real estate
investment trusts or other issuers that deal in real estate), interests in oil,
gas and/or mineral exploration or development programs or leases.
Aston/River Road Road Dividend All Cap Value, Aston/Montag & Caldwell Mid
Cap Growth, Aston/Cardinal Mid Cap Value, Aston/River Road Small Cap Value,
Aston/River Road Small-Mid Cap, Aston/Fortis Global Real Estate, Aston/Neptune
International, Aston/Barings International, Aston/New Century Absolute Return
ETF, Aston/Smart Portfolios and Aston/MB Enhanced Equity Income Funds may not:
(2) Purchase or sell real estate (but this restriction shall not prevent
the Funds from investing directly or indirectly in portfolio instruments secured
by real estate or interest therein or acquiring securities of real estate
investment trusts or other issuers that deal in real estate).
Each Fund except Aston/New Century Absolute Return ETF and Aston/Smart
Portfolios Funds may not:
(3) Purchase the securities of issuers conducting their principal business
activities in the same industry (other than obligations issued or guaranteed by
the U.S. government, its agencies or instrumentalities) if immediately after
such purchase the value of a Fund's investments in such industry would exceed
25% of the value of the total assets of the Fund, except Aston/Fortis Real
Estate Fund and Aston/Fortis Global Real Estate Fund, which will have a
concentration in the real estate sector.
(4) Act as an underwriter of securities, except that, in connection with
the disposition of a security, a Fund may be deemed to be an "underwriter" as
that term is defined in the 1933 Act.
Aston Growth, Aston/Montag & Caldwell Growth, Aston/TAMRO All Cap,
Aston/Optimum Large Cap Opportunity, Aston/Optimum Mid Cap, Aston/TAMRO Small
Cap, Aston Balanced, Aston/Montag & Caldwell Balanced, Aston/Veredus Aggressive
Growth, Aston/Veredus Select Growth, Aston/River Road Dividend All Cap Value,
Aston/River Road Small Cap Value, Aston/TCH Fixed Income and Aston/Fortis
Investor Money Market Fund may not:
(5) As to 75% of the total assets of each Fund, with the exception of
Aston/River Road All Cap Dividend Value and Aston/Optimum Large Cap Opportunity
Funds, purchase the securities of any one issuer (other than securities issued
by the U.S. government or its agencies or instrumentalities) if immediately
after such purchase, more than 5% of the value of the Fund's total assets would
be invested in securities of such issuer.
40
(6) Except for Aston/Optimum Large Cap Opportunity Fund, borrow money or
issue senior securities, except that each Fund may borrow from banks and enter
into reverse repurchase agreements for temporary purposes in amounts up to
one-third of the value of its total assets at the time of such borrowing. The
Funds may not mortgage, pledge or hypothecate any assets, except in connection
with any such borrowing and in amounts not in excess of the lesser of the dollar
amounts borrowed or 10% of the value of the total assets of the Fund at the time
of its borrowing. All borrowings will be done from a bank and asset coverage of
at least 300% is required. A Fund will not purchase securities when borrowings
exceed 5% of that Fund's total assets.
(7) Except for Aston/River Road Dividend All Cap Value Fund invest more
than 5% of its total assets in securities of companies less than three years
old. Such three-year periods shall include the operation of any predecessor
trust or companies.
Aston Growth, Aston/Montag & Caldwell Growth, Aston/TAMRO All Cap,
Aston/Optimum Large Cap Opportunity, Aston/Optimum Mid Cap, Aston/Montag &
Caldwell Mid Cap Growth Fund, Aston/Cardinal Mid Cap Value, Aston/River Road
Small-Mid Cap, Aston/TAMRO Small Cap, Aston Balanced, Aston/Montag & Caldwell
Balanced, Aston/Veredus Aggressive Growth, Aston/Veredus Select Growth,
Aston/Fortis Global Real Estate, Aston/Neptune International, Aston/Barings
International, Aston/River Road Dividend All Cap Value, Aston/River Road Small
Cap Value, Aston/MB Enhanced Equity Income, Aston/TCH Fixed Income, Aston/New
Century Absolute Return ETF, Aston/Smart Portfolios and Aston/ Fortis Investor
Money Market Funds may not:
(8) Except for Aston/New Century Absolute Return ETF and Aston/Smart
Portfolios Funds, purchase or sell commodities or commodity contracts, except
that a Fund may enter into futures contracts and options thereon in accordance
with such Fund's investment objectives and policies.
(9) Make investments in securities for the purpose of exercising control.
(10) Except for Aston/New Century Absolute Return and Aston/Smart
Portfolios Funds, purchase the securities of any one issuer if, immediately
after such purchase, a Fund would own more than 10% of the outstanding voting
securities of such issuer.
(11) Sell securities short or purchase securities on margin, except such
short-term credits as are necessary for the clearance of transactions. For this
purpose, the deposit or payment by a Fund for initial or maintenance margin in
connection with futures contracts is not considered to be the purchase or sale
of a security on margin.
(12) Make loans, except that this restriction shall not prohibit (a) the
purchase and holding of debt instruments in accordance with a Fund's investment
objectives and policies, (b) the lending of portfolio securities or (c) entry
into repurchase agreements with banks or broker-dealers.
(13) Except for the Aston/MB Enhanced Equity Income Fund, invest in puts,
calls, straddles or combinations thereof except to the extent disclosed in the
SAI.
41
Aston/Optimum Large Cap Opportunity, Aston/Montag & Caldwell Mid Cap
Growth, Aston/Cardinal Mid Cap Value, Aston/River Road Small-Mid Cap,
Aston/Fortis Global Real Estate, Aston/Neptune International, Aston/Barings
International, Aston/New Century Absolute Return ETF, Aston/Smart Portfolios and
Aston/MB Enhanced Equity Income Funds may not:
(14) Borrow money or issue senior securities, except that the Fund may
borrow from banks and enter into reverse repurchase agreements for temporary
purposes in amounts up to one-third of the value of its total assets at the time
of such borrowing.
(15) Except for the Aston/Fortis Global Real Estate Fund, as to 75% of the
total assets of the Fund, purchase the securities of any one issuer (other than
cash, other investment companies and securities issued by the U.S. government or
its agencies or instrumentalities) if immediately after such purchase, more than
5% of the value of the Fund's total assets would be invested in securities of
such issuer.
Aston/Montag & Caldwell Mid Cap Growth, Aston/Cardinal Mid Cap Value,
Aston/Barings International, Aston/River Road Small-Mid Cap, Aston/Fortis Global
Real Estate, Aston/Neptune International, Aston/River Road Dividend All Cap,
Aston/River Road Small Cap Value, Aston/Optimum Large Cap Opportunity, Aston/New
Century Absolute Return ETF, Aston/Smart Portfolios and Aston/MB Enhanced Equity
Income Funds may not:
(16) Issue senior securities (as defined in the 1940 Act) except in
connection with permitted borrowings as described above or as permitted by rule,
regulation or order of the SEC.
Aston/New Century Absolute Return ETF Fund and Aston/Smart Portfolios Fund
may not:
(17) Purchase the securities of issuers conducting their principal
business activities in the same industry (other than obligations issued or
guaranteed by the U.S. government, its agencies or instrumentalities) if
immediately after such purchase the value of the Funds' investments in such
industry would exceed 25% of the value of the total assets of the Funds;
provided that investments in another registered investment company are not
considered to be issued by members of any industry.
(18) Act as an underwriter of securities, except that, in connection with
the disposition of a security, the Fund may be deemed to be an "underwriter" as
that term is defined in the 1933 Act.
(19) Purchase or sell commodities or commodity contracts unless acquired
as a result of ownership securities or other investments. This limitation does
not preclude the Funds from entering into futures contracts and options thereon
in accordance with the Funds' investment objective and policies, from investing
in securities or other instruments backed by commodities or from investing in
companies, which are engaged in a commodities business or have a significant
portion of their assets in commodities.
Aston Value, Aston/Fortis Real Estate, Fortis Government Money Market,
Fortis Tax-Exempt Money Market, Fortis Treasury Money Market and Fortis
Institutional Prime Money Market Funds may not:
(20) Issue senior securities (as defined in the 1940 Act) except in
connection with permitted borrowings as described above or as permitted by rule,
regulation or order of the SEC.
(21) Borrow money, except that a Fund (a) may borrow money for temporary
or emergency purposes in an amount not exceeding 5% of the Fund's total assets
determined at the time of the borrowing and (b) may borrow money from banks or
by engaging in reverse repurchase agreements.
42
Asset coverage of at least 300% is required for all borrowings, except where a
Fund has borrowed money for temporary purposes in amounts not exceeding 5% of
its total assets.
(22) Make loans, except as permitted by the 1940 Act, and the rules and
regulations thereunder.
Aston Value Fund may not:
(23) Purchase securities of any issuer (except securities issued or
guaranteed by the United States, its agencies or instrumentalities and
repurchase agreements involving such securities) if as a result more than 5% of
the total assets of the Fund would be invested in the securities of such issuer
or more than 10% of the outstanding voting securities of such issuer would be
owned by the Fund. This restriction applies to 75% of the Fund's assets.
Fortis Government Money Market, Fortis Tax-Exempt Money Market, Fortis
Treasury Money Market and Fortis Institutional Prime Money Market Funds may not:
(24) Purchase securities of any issuer if, as a result, the Fund would
violate the diversification provisions of Rule 2a-7 under the 1940 Act.
(25) Purchase securities of any issuer if, as a result, more than 25% of
the total assets of the Fund are invested in the securities of one or more
issuers whose principal business activities are in the same industry or
securities the interest upon which is paid from revenue of similar type
industrial development projects, provided that this limitation does not apply
to: (i) investment in obligations issued or guaranteed by the U.S. Government or
its agencies and instrumentalities or in repurchase agreements involving such
securities; (ii) obligations issued by domestic branches of U.S. banks or U.S.
branches of foreign banks subject to the same regulations as U.S. banks; or
(iii) tax-exempt securities issued by government or political subdivisions of
governments.
NON-FUNDAMENTAL INVESTMENT POLICIES
For purposes of Aston/Fortis Real Estate and Aston/Fortis Global Real
Estate Funds' investment policies, a company is "principally engaged" in the
real estate industry if (i) it derives at least 50% of its revenues or profits
from the ownership, construction, management, financing, or sale of residential,
commercial, or industrial real estate or (ii) it has at least 50% of the fair
market value of its assets invested in residential, commercial, or industrial
real estate. Companies in the real estate industry may include, but are not
limited to, REITs or other securitized real estate investments, MLPs that are
treated as corporations for federal income tax purposes and that invest in
interests in real estate, real estate operating companies, real estate brokers
or developers, financial institutions that make or service mortgages, and
companies with substantial real estate holdings, such as lumber and paper
companies, hotel companies, residential builders and land-rich companies.
Aston Value, Aston/Fortis Real Estate, Fortis Government Money Market,
Fortis Tax-Exempt Money Market and Fortis Treasury Money Market Funds may enter
into futures contract transactions only to the extent that obligations under
such contracts represent less than 20% of the Fund's assets. The aggregate value
of option positions may not exceed 10% of a Fund's net assets as of the time
such options are entered into by a Fund.
Aston/Montag & Caldwell Mid Cap Growth Fund, Aston/Cardinal Mid Cap Value
Fund, Aston/Barings International Fund, Aston/Optimum Large Cap Opportunity
Fund, Aston/Optimum Mid Cap Fund, Aston/TAMRO Small Cap Fund, Aston/Fortis Real
Estate Fund, Aston/Fortis Global Real Estate Fund, Aston/Neptune International
Fund, Aston/River Road Dividend All Cap Value Fund,
Aston/River Road Small Cap Value Fund, Aston/River Road Small-Mid Cap Fund,
Aston/New Century Absolute Return ETF Fund, Aston/Smart Portfolios Fund,
Aston/MB Enhanced Equity Income Fund, Aston/TCH Fixed Income Fund, Fortis
Government Money Market Fund, Fortis Tax-Exempt Money Market Fund and Fortis
Treasury Money Market Fund each have a policy to invest, under normal
circumstances, at least 80% of such Fund's assets, plus the amount of any
borrowings for investment purposes, in certain investments as described in their
prospectus. Shareholders of the applicable Fund will be given at least 60 days'
notice of any changes to this policy.
43
For purposes of Aston/Barings International Fund's investment policies,
non-U.S. companies are broadly defined to include any company that meets one of
the follwing tests: (i) it is organized, has its primary business office, or its
stock is principally traded on a market located outside the U.S.; (ii) 50% or
more of its assets are located outside the U.S.; or (iii) 50% or more of its
revenue is derived outside of the U.S.
TRUSTEES AND OFFICERS OF THE TRUST
Under Delaware law, the business and affairs of the Trust are managed
under the direction of the Board of Trustees. Information pertaining to the
Trustees and Executive Officers of the Trust is set forth below. The term
"officer" means the president, vice president, secretary, treasurer, controller
or any other officer who performs a policy making function.
TERM OF NUMBER OF
OFFICE(2) PORTFOLIOS
NAME, ADDRESS, AND LENGTH OF IN FUND COMPLEX OTHER TRUSTEESHIPS/
AGE(1) AND TIME PRINCIPAL OCCUPATION(S) OVERSEEN BY DIRECTORSHIPS HELD
POSITION(S) WITH TRUST SERVED(1) DURING PAST FIVE YEARS TRUSTEE BY TRUSTEE(3)
---------------------------- ------------- ----------------------- --------------- --------------------
DISINTERESTED TRUSTEES
Leonard F. Amari 15 years Partner at the law 29 President of the
c/o 120 N. LaSalle Street offices of Amari & Board of Trustees,
Chicago, IL 60602 Locallo, a practice John Marshall Law
Age: 66 with exclusive School
Trustee concentration in
real estate taxation
and related areas,
since 1986; Special
Assistant Attorney
General since 1986.
Gregory T. Mutz 15 years CEO of AMLI 29 Director of Alico,
c/o 120 N. LaSalle Street Residential Inc. (NASDAQ: ALCO)
Chicago, IL 60602 Properties Trust (a (agribusiness);
Age: 62 Multifamily REIT), Member of Board of
Trustee a successor company Genesis Financial
to AMLI Realty Co. Solutions (a
since 2004 and a privately-held
wholly owned company based in
subsidiary of PRIME Portland, Oregon
Property Fund, LLC, providing debt
an instutional real recovery, consumer
estate co-mingled lending and credit
fund managed by card services); a
Morgan Stanley Real member of the Board
Estate, Inc.; Vice of WAN S.A., a
Chairman of UICI residential real
(NYSE: UCI) (an estate company
insurance holding headquartered in
company) from Warsaw, Poland; a
2003-2004; member of the Board
President and CEO of Suknip
of UICI from International
1999-2003; Chairman Limited, a
of Academic residential real
Management Service estate company
Corp. (a student headquartered in
loans and finance St. Petersburg,
company) from Russia.
2000-2003.
Robert B. Scherer 9 years President of The 29 Director, Title
c/o 120 N. LaSalle Street Rockridge Group, Reinsurance Company
Chicago, IL 60602 Ltd (title (insurance for title
Age: 67 insurance industry agents)
Trustee consulting
services) since 1994.
Denis Springer 9 years Retired. Senior 29 Director, Coleman
c/o 120 N. LaSalle Street Vice President and Cable Inc. (wire
Chicago, IL 60602 Chief Financial and cable
Age: 62 Officer of manufacturer)
Trustee Burlington Northern (NASDAQ: CCIX)
Santa Fe Corp.
(railroad), 1995-1999.
44
INTERESTED TRUSTEE(4)
Stuart D. Bilton, CFA 15 years Chief Executive 29 Director, Baldwin &
c/o 120 N. LaSalle Street Officer, Aston Lyons, Inc.
Chicago, IL 60602 Asset Management (property and
Age: 62 LLC, since 2006; casualty insurance
Chairman, Board of Trustees Vice Chairman of firm)
ABN AMRO Asset
Management
Holdings, Inc.
2003-2006;
President and Chief
Executive Officer
of ABN AMRO Asset
Management
Holdings, Inc. from
2001-2003;
President of
Alleghany Asset
Management, Inc.
from 1996-2001
(purchased by ABN
AMRO in February 2001).
OFFICER(S) WHO ARE NOT TRUSTEES
Kenneth C. Anderson 15 years President, Aston N/A N/A
c/o 120 N. LaSalle Street Asset Management
Chicago, IL 60602 LLC, since 2006;
Age: 44 President and
President (Chief Chief Executive
Executive Officer) Officer of ABN
AMRO Investment
Fund Services,
Inc. (formerly
known as
Alleghany
Investment
Services, Inc.)
1995-2006;
Executive Vice
President of ABN
AMRO Asset
Management (USA)
LLC 2001-2005;
Director, ABN
AMRO Trust
Services Company
2001-2005;
Director, TAMRO
Capital Partners
LLC and Veredus
Asset Management
LLC 2001- 2006;
Officer of the
Trust since 1993; CPA.
Gerald F. Dillenburg 12 years Chief Compliance N/A N/A
c/o 120 N. LaSalle Street Officer and Chief
Chicago, IL 60602 Financial Officer,
Age: 41 Aston Asset
Senior Vice President, Management LLC,
Secretary and Treasurer since 2006; Senior
(Chief Financial Officer, Managing Director
Chief Operating ("SMD") of ABN AMRO
Officer and Chief Investment Fund
Compliance Officer) Services, Inc.
(formerly known as
Alleghany
Investment
Services, Inc.)
1996-2006; SMD of
ABN AMRO Asset
Management
Holdings, Inc. and
ABN AMRO Asset
Management, Inc.
(formerly known as
Chicago Capital
Management, Inc.)
2001-2006;
Operations manager
and compliance
officer of ABN AMRO
mutual funds
1996-2006; CPA.
----------
(1) As of December 31, 2008.
(2) Trustees serve for an indefinite term until the earliest of: (i) removal
by two-thirds of the Board of Trustees or shareholders, (ii) resignation,
death or incapacity, (iii) the election and qualification of his
successor, in accordance with the By-Laws of the Trust or (iv) the last
day of the fiscal year in which he attains the age of 72 years. Officers
serve for an indefinite term until the earliest of: (i) removal by the
Board of Trustees, (ii) resignation, death or incapacity, (iii) the
election and qualification of their successor, in accordance with the
By-Laws of the Trust.
(3) Each Trustee also serves as Trustee for ABN AMRO Structured Investment
Funds, a newly formed registered investment company, which will have two
initial series. The registration statement of the new trust is not
effective and the trust was not operational as of the date of this SAI.
Mr. Bilton also serves as Sole Trustee of the ABN AMRO Variable Insurance
Trust, a trust whose registration statement is not effective and was not
operational as of the date of this SAI.
(4) "Interested person" of the Trust as defined in the 1940 Act. Mr. Bilton is
considered an "interested person" because of affiliations with Aston Asset
Management LLC and related entities, which act as the Funds' Investment
Adviser for all the Funds except the Fortis Money Market Funds.
45
The Board of Trustees has established an Audit Committee consisting of
four members, including a Chairman of the Committee. The Audit Committee members
are Messrs. Scherer (Chairman), Amari, Mutz and Springer. The functions
performed by the Audit Committee are to oversee the integrity of the Trust's
accounting policies, financial reporting process and system of internal controls
regarding finance and accounting. The Audit Committee also monitors the
independence and performance of the Trust's independent registered public
accounting firms and provides an open avenue of communication among the
independent auditors, Trust management and the Board of Trustees. The Audit
Committee held two meetings during the fiscal year ended October 31, 2008.
The Trustees have also established a Nominating and Governance Committee
consisting of four members, including a Chairman of the Committee. The
Nominating and Governance Committee members are Messrs. Amari (Chairman),
Scherer, Mutz and Springer. The Nominating and Governance Committee's function
is to put forth names for nomination as Trustee when deemed necessary. The
Nominating and Governance Committee will consider nominees recommended by
shareholders whose resumes have been submitted by U.S. mail or courier service
to the Trust's Secretary for the attention of the Chairman of the Nominating and
Governance Committee. The Nominating and Governance Committee held one meeting
during the fiscal year ended October 31, 2008.
The Trustees have also established a Valuation Committee consisting of at
least three Trustees, including at least one Independent Trustee. Currently, the
Valuation Committee members are Messrs. Bilton (Chairman), Scherer and Springer.
The Valuation Committee is responsible for fair valuing securities of the Funds
as may be necessary from time to time. The Valuation Committee held no meetings
during the fiscal year ended October 31, 2008.
Set forth in the table below is the dollar range of equity securities held
in each Fund and the aggregate dollar range of securities in the Fund complex
beneficially owned by each current Trustee at December 31, 2008.
AGGREGATE DOLLAR RANGE OF
EQUITY SECURITIES IN ALL
REGISTERED INVESTMENT
COMPANIES OVERSEEN BY
TRUSTEE IN FAMILY OF
NAME OF TRUSTEE DOLLAR RANGE OF EQUITY SECURITIES IN THE FUND INVESTMENT COMPANIES
--------------- ------------------------------------------------------------- -------------------------
DISINTERESTED TRUSTEES
Leonard F. Amari Aston/Optimum Mid Cap Fund-$50,001-$100,000 Over $100,000
Aston/TAMRO Small Cap Fund-$10,001-$50,000
Aston/TAMRO All Cap Fund-$50,001-$100,000
Fortis Tax-Exempt Money Market Fund-$10,001-$50,000
Aston Growth Fund-$50,001-$100,000
Aston/Veredus Aggressive Growth Fund-$10,001-$50,000
Gregory T. Mutz Aston/Montag & Caldwell Growth Fund-$50,001-$100,000 Over $100,000
Aston/Optimum Mid Cap Fund-$1-$10,000
Aston/River Road Dividend All Cap Value Fund-$10,001-$50,000
Aston/TAMRO All Cap Fund-$50,001-$100,000
Aston/TAMRO Small Cap Fund-$10,001-$50,000
Aston/Veredus Select Growth Fund-$10,001-$50,000
Robert Scherer Fortis Government Money Market Fund-over $100,000 Over $100,000
Aston/River Road Small Cap Value Fund-$10,001-$50,000
Aston/River Road Dividend All Cap Value Fund-$10,001-$50,000
Aston/TCH Fixed Income Fund-$10,001-$50,000
Aston/Optimum Mid Cap Fund-$10,001-$50,000
Aston Growth Fund-$10,001-$50,000
Aston/Montag & Caldwell Growth Fund-$10,001-$50,000
Aston/Veredus Aggressive Growth Fund-$10,001-$50,000
Aston/Veredus Select Growth Fund-$10,001-$50,000
Aston/TAMRO Small Cap Fund-$10,001-$50,000
Aston/TAMRO All Cap Fund-$1-$10,000
Fortis Investor Money Market Fund-$10,001-$50,000
46
Denis Springer Aston/Montag & Caldwell Growth Fund-over $100,000 Over $100,000
Aston/Veredus Aggressive Growth Fund-$1-$10,000
INTERESTED TRUSTEE
Stuart Bilton Aston/Optimum Mid Cap Fund-over $100,000 Over $100,000
Aston/River Road Dividend All Cap Value Fund-over $100,000
Aston/TAMRO All Cap Fund-over $100,000
Aston/Montag & Caldwell Growth Fund-over $100,000
Aston/Veredus Aggressive Growth Fund-over $100,000
Aston/TAMRO Small Cap Fund-over $100,000
Aston/Neptune International Fund-over $100,000
Aston/River Road Small Cap Value Fund-over $100,000
Fortis Government Money Market Fund-over $100,000
REMUNERATION
The Trustees of the Trust who are not affiliated with the investment
advisers or subadvisers receive an annual retainer and per meeting fees. The
Lead Independent Trustee and Committee Chairs receive an additional retainer.
The Trustees of the Trust who are not affiliated with the investment advisers or
subadvisers receive fees and are reimbursed for out-of-pocket expenses for each
meeting of the Board of Trustees they attend. No officer or employee of the
investment advisers, subadvisers or their affiliates receives any compensation
from the Funds for acting as a Trustee of the Trust. The officers of the Trust
receive no compensation directly from the Funds for performing the duties of
their offices, except that the Funds compensate the Administrator for providing
an officer to serve as the Funds' Chief Compliance Officer.
The table below shows the total fees that were paid to each of the
Trustees during the fiscal year ended October 31, 2008. There were no
'compensated persons' who received more than $120,000 in aggregate compensation
from the Trust for the same period.
AGGREGATE PENSION OR
COMPENSATION RETIREMENT TOTAL
RECEIVED BENEFITS ACCRUED ESTIMATED COMPENSATION
FROM THE (AS PART OF FUND ANNUAL BENEFITS FROM TRUST AND
TRUSTEE TRUST* EXPENSES) UPON RETIREMENT FUND COMPLEX*
-------------------------- ------------ ---------------- --------------- ---------------
DISINTERESTED TRUSTEES
Leonard F. Amari $ 72,000 N/A N/A $ 72,000
Robert A. Kushner** 69,500 N/A N/A 69,500
Gregory T. Mutz 89,500 N/A N/A 89,500
Robert B. Scherer 79,500 N/A N/A 79,500
Nathan Shapiro** 69,500 N/A N/A 69,500
Denis Springer 69,500 N/A N/A 69,500
INTERESTED TRUSTEE
Stuart D. Bilton N/A N/A N/A N/A
47
----------
* Includes special meeting fees of $5,000 per Trustee paid in connection
with various changes in control transactions involving ABN AMRO Asset
Management, Inc., ("AAAM"), Fortis Investment Management USA, Inc. ("FIM")
or their affiliates. Such amounts were not paid by the Trust.
** Messrs. Kushner and Shapiro retired from the Board on October 31, 2008 in
accordance with the mandatory retirement age set forth in the By-Laws.
As of January 30, 2009, Trustees and officers of the Trust as a group
owned less than 1% of the outstanding shares of any Class of each Fund, except
for their ownership of 4.68% of the Aston/TAMRO Small Cap Fund-Class N, 1.72% of
Aston/Montag & Caldwell Mid Cap Growth Fund-Class N, 2.84% of Aston/Cardinal Mid
Cap Value Fund-Class N, 99.20% of Aston/Neptune International Fund-Class N and
1.97% of Aston/Veredus Aggressive Growth Fund-Class I.
CODE OF ETHICS
The Trust, its investment advisers, subadvisers and principal underwriter
have each adopted a code of ethics (the "Codes of Ethics") under Rule 17j-1 of
the 1940 Act. The Codes of Ethics permit personnel, subject to the Codes of
Ethics and their restrictive provisions, to invest in securities, including
securities that may be purchased or held by the Trust on behalf of the Funds.
PROXY VOTING POLICIES AND PROCEDURES
The Trust has delegated the voting of portfolio securities to its
subadvisers on behalf of the Funds. Each subadviser has adopted proxy voting
policies and procedures ("Proxy Voting Policies and Procedures") for use in
connection with determining how to vote proxies related to portfolio securities,
including the procedures to be used if a vote presents a conflict of interest
between the interests of a Fund's shareholders and those of the applicable
subadviser. The Proxy Voting Policies and Procedures are included under Appendix
B.
Information regarding how the Trust voted proxies related to portfolio
securities during the most recent 12-month period ended June 30 is available
without charge on the Trust's Web site at www.astonfunds.com and on the SEC's
Web site at www.sec.gov.
48
CONTROL PERSONS AND PRINCIPAL HOLDERS OF SECURITIES
Listed below are the names and addresses of those shareholders who, as of
January 30, 2009, owned of record or beneficially 5% or more of the shares of a
class of a Fund. Shareholders who have the power to vote a large percentage of
shares (at least 25% of the voting shares of a Fund) of a particular Fund can
control the Fund and determine the outcome of a shareholder meeting.
ASTON/MONTAG & CALDWELL GROWTH FUND
SHAREHOLDER NAME AND ADDRESS CLASS SHARES OWNED PERCENT OF CLASS
--------------------------------------- ----- -------------- ----------------
National Financial Services Corp N 10,706,227.535 31.6303%
(FBO) Our Customers
ATTN Mutual Funds Department 5th Floor
200 Liberty Street
One World Financial Center
New York, NY 10281
Charles Schwab & Co. Inc N 7,038,669.418 20.7949%
Special Custody Acct for Exclusive of Customers
ATTN Mutual Funds
101 Montgomery St
San Francisco, CA 94104-4122
CitiGroup Global Markets Inc N 4,540,316.884 13.4138%
333 West 34th St - 3rd Floor
New York, NY 10001
National Financial Services Corp I 6,472,523.680 15.2424%
(FBO) Our Customers
ATTN Mutual Funds Department 5th Floor
200 Liberty Street
One World Financial Center
New York, NY 10281
Nationwide Trust Co FBO I 4,345,757.608 10.2340%
Southwest Airlines Pilots
Retirement Savings Plan
98 San Jacinto Blvd Ste 1100
Austin, TX 78701-4255
Charles Schwab & Co. Inc I 3,728,507.667 8.7804%
Special Custody Acct for Exclusive of Customers
ATTN Mutual Funds
101 Montgomery St
San Francisco, CA 94104-4122
49
Bank of America NA TTEE I 3,512,711.026 8.2722%
FBO LaSalle Pension Plan & Trust
PO Box 831575
Dallas, TX 75283-1575
Merrill Lynch Pierce Fenner & Smith Inc. I 2,212,898.157 5.2112%
For the Sole Benefit of Its Customers
ATTN Service Team
4800 Deer Lake Dr East 3rd Fl
Jacksonville, FL 32246
Nationwide Trust Company FSB R 13,076.013 76.4327%
C/O IPO Portfolio Accounting
PO Box 182029
Columbus, OH 43218-2029
MG Trust Company Cust. FBO R 1,346.220 7.8690%
Choice Mortgage Company 401(k)
700 17th Street
Suite 300
Denver, CO 80202
Oppenheimer & Co Inc. R 1,033.310 6.0400%
FBO Charles L Wilcox IRA
Port Huron, MI 48060
MG Trust Company Cust. FBO R 930.890 5.4413%
O1 Communications, Inc. 401(k) Plan
700 17th Street
Suite 300
Denver, CO 80202
ASTON/VEREDUS SELECT GROWTH FUND
SHAREHOLDER NAME AND ADDRESS CLASS SHARES OWNED PERCENT OF CLASS
--------------------------------------- ----- -------------- ----------------
Charles Schwab & Co. Inc N 1,629,933.895 43.1327%
Special Custody Acct for Exclusive of Customers
ATTN Mutual Funds
101 Montgomery St
San Francisco, CA 94104-4122
National Financial Services Corp N 644,227.542 17.0481%
(FBO) Our Customers
ATTN Mutual Funds Department 5th Floor
200 Liberty Street
One World Financial Center
New York, NY 10281
Charles Schwab & Co. I 4,300,114.324 84.6833%
Inc Special Custody Acct for Exclusive of
Customers
ATTN Mutual Funds
101 Montgomery St
San Francisco, CA 94104-4122
50
ASTON GROWTH FUND
SHAREHOLDER NAME AND ADDRESS CLASS SHARES OWNED PERCENT OF CLASS
--------------------------------------- ----- -------------- ----------------
Charles Schwab & Co. Inc N 1,268,700.695 23.8171%
Special Custody Acct for Exclusive of Customers
ATTN Mutual Funds
101 Montgomery St
San Francisco, CA 94104-4122
DCGT as TTEE and/or CUST N 619,614.963 11.6319%
FBO Various Qualified Plans
ATTN NPIO Trade Desk
711 High Street
Des Moines, IA 50303
National Financial Services Corp N 617,346.983 11.5894%
(FBO) Our Customers
ATTN Mutual Funds Department 5th Floor
200 Liberty Street
One World Financial Center
New York, NY 10281
MCB Trust Services TTEE FBO N 353,312.464 6.6327%
Western States Envelope Co
700 17th St Ste 300
Denver, CO 80202
Bank of America NA TTEE I 10,535,838.307 93.2241%
FBO LaSalle Pension Plan & Trust
PO Box 831575
Dallas, TX 75283-1575
Merrill Lynch Pierce Fenner & Smith Inc. R 28,424.089 54.1852%
For the Sole Benefit of Its Customers
ATTN Service Team
4800 Deer Lake Dr East 3rd Fl
Jacksonville, FL 32246
Nationwide Trust Company FSB R 21,980.278 41.9013%
C/O IPO Portfolio Accounting
PO Box 182029
Columbus, OH 43218-2029
51
ASTON/OPTIMUM LARGE CAP OPPORTUNITY FUND
SHAREHOLDER NAME AND ADDRESS CLASS SHARES OWNED PERCENT OF CLASS
--------------------------------------- ----- -------------- ----------------
Charles Schwab & Co. Inc N 271,122.943 59.3204%
Special Custody Acct for Exclusive of Customers
ATTN Mutual Funds
101 Montgomery St
San Francisco, CA 94104-4122
Ameritrade Inc For the Exclusive N 111,289.158 24.3495%
Benefit of our Customers
PO Box 2226
Omaha, NE 68103-2226
National Financial Services Corp N 30,193.336 6.6062%
(FBO) Our Customers
ATTN Mutual Funds Department 5th Floor
200 Liberty Street
One World Financial Center
New York, NY 10281
ASTON VALUE FUND
SHAREHOLDER NAME AND ADDRESS CLASS SHARES OWNED PERCENT OF CLASS
--------------------------------------- ----- -------------- ----------------
DCGT as TTEE and/or CUST N 834,511.421 31.1778%
FBO Various Qualified Plans
ATTN NPIO Trade Desk
711 High Street
Des Moines, IA 50303
DCGT as TTEE and/or CUST N 675,223.138 25.2267%
FBO Principal Financial Group
Omnibus Qualified
ATTN NPIO Trade Desk
711 High Street
Des Moines, IA 50303
National Financial Services Corp N 607,131.592 22.6827%
(FBO) Our Customers
ATTN Mutual Funds
Department 5th Floor
200 Liberty Street
One World Financial Center
New York, NY 10281
Bank of America NA TTEE FBO LaSalle Pension I 22,786,729.068 93.4281%
Plan & Trust
PO Box 831575
Dallas, TX 75283-1575
State St. Bank & Tr Co I 1,509,947.451 6.5231%
FBO ABN AMRO North America
Retirement Trust
805 Pennsylvania Ave
Kansas City, MO 64105-1340
52
ASTON/TAMRO ALL CAP FUND
SHAREHOLDER NAME AND ADDRESS CLASS SHARES OWNED PERCENT OF CLASS
--------------------------------------- ----- -------------- ----------------
Charles Schwab & Co. Inc N 154,093.712 15.1513%
Special Custody Acct for
Exclusive of Customers
ATTN Mutual Funds
101 Montgomery St
San Francisco, CA 94104-4122
DCGT as TTEE and/or CUST N 143,688.391 14.1282%
FBO Various Qualified Plans
ATTN NPIO Trade Desk
711 High Street
Des Moines, IA 50303
National Financial Services Corp N 115,731.235 11.3793%
(FBO) Our Customers
ATTN Mutual Funds Department 5th Floor
200 Liberty Street
One World Financial Center
New York, NY 10281
ASTON/RIVER ROAD DIVIDEND ALL CAP VALUE FUND
SHAREHOLDER NAME AND ADDRESS CLASS SHARES OWNED PERCENT OF CLASS
--------------------------------------- ----- -------------- ----------------
National Financial Services Corp N 2,701,775.061 34.6515%
(FBO) Our Customers
ATTN Mutual Funds Department 5th Floor
200 Liberty Street
One World Financial Center
New York, NY 10281
PFPC Wrap Services FBO Morningstar N 2,694,308.679 34.5557%
760 Moore Road
King of Prussia, PA 19406
Charles Schwab & Co. Inc N 1,433,646.373 18.3872%
Special Custody Acct for Exclusive
of Customers
ATTN Mutual Funds
101 Montgomery St
San Francisco, CA 94104-4122
National Financial Services Corp I 683,927.677 87.9540%
(FBO) Our Customers
ATTN Mutual Funds Department 5th Floor
200 Liberty Street
One World Financial Center
New York, NY 10281
Strafe & Co FAO I 93,669.250 12.0460%
Credit Suisse Omnibus Mutual Fund
PO Box 160
Westerville, OH 43086
53
ASTON/OPTIMUM MID CAP FUND
SHAREHOLDER NAME AND ADDRESS CLASS SHARES OWNED PERCENT OF CLASS
--------------------------------------- ----- -------------- ----------------
Charles Schwab & Co. Inc N 5,425,855.619 17.4694%
Special Custody Acct for Exclusive
of Customers
ATTN Mutual Funds
101 Montgomery St
San Francisco, CA 94104-4122
National Financial Services Corp (FBO) N 4,245,795.126 13.6700%
Our Customers
ATTN Mutual Funds
Department 5th Floor
200 Liberty Street
One World Financial Center
New York, NY 10281
Wells Fargo Bank NA FBO N 1,727,033.386 5.5605%
PO Box 1533
Minneapolis, MN 55480
James N Carn TTEE Standard Insurance Co. I 2,324,447.358 35.6414%
1100 SW Sixth Avenue
Portland, OR 97204-1093
Charles Schwab & Co. Inc I 894,914.032 13.7220%
Special Custody Acct for Exclusive
of Customers
ATTN Mutual Funds
101 Montgomery St
San Francisco, CA 94104-4122
National Financial Services Corp I 670,928.741 10.2875%
(FBO) Our Customers
ATTN Mutual Funds
Department 5th Floor
200 Liberty Street
One World Financial Center
New York, NY 10281
Wells Fargo Bank NA FBO I 340,380.954 5.2192%
Retirement Plan Svcs
PO Box 1533
Minneapolis, MN 55480
Merrill Lynch Pierce Fenner & Smith I 337,327.051 5.1723%
Inc. For the Sole Benefit of Its Customers
ATTN Service Team
4800 Deer Lake Dr East 3rd Fl
Jacksonville, FL 32246
54
ASTON/MONTAG & CALDWELL MID CAP GROWTH FUND
SHAREHOLDER NAME AND ADDRESS CLASS SHARES OWNED PERCENT OF CLASS
--------------------------------------- ----- -------------- ----------------
Charles Schwab & Co. Inc N 70,994.822 21.1512%
Special Custody Acct for Exclusive
of Customers
ATTN Mutual Funds
101 Montgomery St
San Francisco, CA 94104-4122
William Vogel N 68,187.888 20.3149%
Atlanta, GA 30350-3617
TD Ameritrade Trust Company N 24,459.461 7.2871%
PO Box 17748
Denver, CO 80217-0748
National Financial Services Corp (FBO) N 18,848.971 5.6156%
Our Customers
ATTN Mutual Funds Department
5th Floor
200 Liberty Street
One World Financial Center
New York, NY 10281
Ronald Canakaris N 17,192.248 5.1220%
Atlanta, GA 30350-3703
ASTON/CARDINAL MID CAP VALUE FUND
SHAREHOLDER NAME AND ADDRESS CLASS SHARES OWNED PERCENT OF CLASS
--------------------------------------- ----- -------------- ----------------
Amy Minella N 100,000.000 79.4599%
Greenwich, CT 06831-3305
Charles Schwab & Co. Inc N 21,018.040 16.7009%
Special Custody Acct for Exclusive of
Customers ATTN Mutual Funds
101 Montgomery St
San Francisco, CA 94104-4122
55
ASTON/RIVER ROAD SMALL-MID CAP FUND
SHAREHOLDER NAME AND ADDRESS CLASS SHARES OWNED PERCENT OF CLASS
--------------------------------------- ----- -------------- ----------------
PFPC Wrap Services FBO Morningstar N 5,826,260.618 80.5282%
760 Moore Road
King of Prussia, PA 19406
Charles Schwab & Co. Inc N 916,464.220 12.6670%
Special Custody Acct for Exclusive
of Customers
ATTN Mutual Funds
101 Montgomery St
San Francisco, CA 94104-4122
Fidelity Investment Institutional Oper I 3,184,709.231 19.9033%
Co Inc. FIICO As Agent for Certain
Employee Benefit Plans
100 Magellan Way
Mailzone KW1c
Covington, KY 41015-1987
SEI Private Trust Co. C/O Suntrust I 2,646,981.330 16.5427%
ATTN: Mutual Funds Administrator
One Freedom Valley Drive
Oaks, PA 19456
Charles Schwab & Co. Inc Special I 2,340,248.226 14.6257%
Custody Acct for Exclusive of Customers
ATTN Mutual Funds
101 Montgomery St
San Francisco, CA 94104-4122
National Financial Services Corp (FBO) I 1,561,469.742 9.7586%
Our Customers
ATTN Mutual Funds
Department 5th Floor
200 Liberty Street
One World Financial Center
New York, NY 10281
SEI Private Trust Co. C/O Hale & Dorr I 1,078,517.079 6.7403%
One Freedom Valley Drive
Oaks, PA 19456
SEI Private Trust Co. C/O Suntrust I 974,825.641 6.0923%
ATTN: Mutual Funds Administrator
One Freedom Valley Drive
Oaks, PA 19456
Merrill Lynch Pierce Fenner & I 898,204.096 5.6134%
Smith Inc. For the Sole Benefit of Its
Customers
ATTN Service Team
4800 Deer Lake Dr East 3rd Fl
Jacksonville, FL 32246
Shepherd Center Inc. 2020 Peachtree I 885,257.921 5.5325%
Rd NW
Atlanta, GA 30309-1426
56
ASTON/VEREDUS AGGRESSIVE GROWTH FUND
SHAREHOLDER NAME AND ADDRESS CLASS SHARES OWNED PERCENT OF CLASS
--------------------------------------- ----- -------------- ----------------
Charles Schwab & Co. Inc Special N 1,050,719.929 24.2159%
Custody Acct for Exclusive of
Customers
ATTN Mutual Funds
101 Montgomery St
San Francisco, CA 94104-4122
CitiGroup Global Markets Inc 333 N 448,215.100 10.3300%
West 34th St -- 3rd Floor
New York, NY 10001
National Financial Services Corp (FBO) N 422,053.311 9.7271%
Our Customers
ATTN Mutual Funds Department 5th Floor
200 Liberty Street
One World Financial Center
New York, NY 10281
Mac & Co Mutual Fund Ops TC N 318,602.995 7.3428%
525 William Penn Place
PO Box 3198
Pittsburgh, PA 15230
Bank of America NA TTEE FBO LaSalle I 1,085,466.967 63.8643%
Pension Plan & Trust
PO Box 831575
Dallas, TX 75283-1575
DCGT as TTEE and/or CUST I 193,742.121 11.3990%
FBO Various Qualified Plans
ATTN NPIO Trade Desk
711 High Street
Des Moines, IA 50303
Fidelity Investment Institutional Oper I 115,255.651 6.7812%
Co Inc. FIICO As Agent for Certain
Employee Benefit Plans
100 Magellan Way
Mailzone KW1c
Covington, KY 41015-1987
National Financial Services Corp (FBO) I 95,001.230 5.5895%
Our Customers
ATTN Mutual Funds Department 5th Floor
200 Liberty Street
One World Financial Center
New York, NY 10281
57
ASTON/TAMRO SMALL CAP FUND
SHAREHOLDER NAME AND ADDRESS CLASS SHARES OWNED PERCENT OF CLASS
---------------------------------------------- ----- -------------- ----------------
National Financial Services Corp (FBO) N 2,906,909.723 25.5147%
Our Customers
ATTN Mutual Funds Department 5th Floor
200 Liberty Street
One World Financial Center
New York, NY 10281
Charles Schwab & Co. Inc N 1,917,440.459 16.8299%
Special Custody Acct for Exclusive
of Customers
ATTN Mutual Funds
101 Montgomery St
San Francisco, CA 94104-4122
Wells Fargo Bank NA FBO N 862,180.683 7.5676%
Retirement Plan Services
PO Box 1533
Minneapolis, MN 554808
Wachovia Bank FBO N 765,590.962 6.7198%
Various Retirement Plans
1525 West WT Harris Blvd
Charlotte, NC 28288-1151
DCGT as TTEE and/or CUST N 664,957.382 5.8365%
FBO Various Qualified Plans
ATTN NPIO Trade Desk
711 High Street
Des Moines, IA 50303
Vanguard Fiduciary Trust Co N 600,868.850 5.2740%
ABN AMRO Funds
PO Box 2600
ATTN outside Funds
Valley Forge, PA 19482
58
The Northern Trust Co as Trustee FBO I 4,328,916.266 21.9376%
Ameron -- DV
PO Box 92994
Chicago, IL 60675-2994
Sheldon & Co C/O National City I 4,128,820.700 20.9236%
ATTN Trust Mutual Funds
PO Box 94984
Cleveland, OH 44101-4984
Wachovia Bank FBO I 1,772,243.555 8.9812%
Various Retirement Plans
1525 West WT Harris Blvd
Charlotte, NC 28288-1151
Merrill Lynch Pierce Fenner & Smith I 1,706,494.168 8.6480%
Inc. For the Sole Benefit of Its
Customers
ATTN Service Team
4800 Deer Lake Dr East 3rd Fl
Jacksonville, FL 32246
DCGT as TTEE and/or CUST I 1,075,029.301 5.4479%
FBO Various Qualified Plans
ATTN NPIO Trade Desk
711 High Street
Des Moines, IA 50303
FCCI Insurance Company I 990,581.480 5.0200%
ATTN Treasury
6300 University Pkwy
Sarasota FL 34240-8424
59
ASTON/RIVER ROAD SMALL CAP VALUE FUND
SHAREHOLDER NAME AND ADDRESS CLASS SHARES OWNED PERCENT OF CLASS
------------------------------------------------- ----- -------------- ----------------
National Financial Services Corp (FBO)
Our Customers N 12,305,386.041 71.2327%
ATTN Mutual Funds Department 5th Floor
200 Liberty Street
One World Financial Center
New York, NY 10281
Charles Schwab & Co. Inc N 2,338,327.801 13.5360%
Special Custody Acct for Exclusive of Customers
ATTN Mutual Funds
101 Montgomery St
San Francisco, CA 94104-4122
National Financial Services Corp (FBO) I 3,260,024.244 23.2015%
Our Customers
ATTN Mutual Funds Department 5th Floor
200 Liberty Street
One World Financial Center
New York, NY 10281
Charles Schwab & Co. Inc I 2,544,964.712 18.1124%
Special Custody Acct for Exclusive of Customers
ATTN Mutual Funds
101 Montgomery St
San Francisco, CA 94104-4122
Minnesota Life I 1,791,293.263 12.7486%
400 Robert St N
Saint Paul, MN 55101-2006
Network Omnibus 1225 West W.T. Harris Blvd I 813,669.650 5.7909%
Charlotte, NC 28288-1076
Saxon & Co. 8800 Tinicum Blvd I 778,799.542 5.5427%
Philadelphia, PA 19153-3198
Mac & Co I 768,741.513 5.4711%
FBO NFL Player/Lipper
Mutual Fund Operations
525 William Penn Place
PO Box 3198
Pittsburgh, PA 15230
Mac & Co I 706,989.182 5.0316%
ATTN Mutual Fund Operations
525 William Penn Place
PO Box 3198
Pittsburgh, PA 15230
ASTON/NEPTUNE INTERNATIONAL FUND
SHAREHOLDER NAME AND ADDRESS CLASS SHARES OWNED PERCENT OF CLASS
------------------------------------------------- ----- -------------- ----------------
Stuart Bilton N 30,373.667 99.2042%
Barrington, IL 60010-5135
Post & Co C/O The Bank of New York Mellon I 1,268,996.638 88.6418%
Mutual Funds Reorg Department
PO Box 1066 Wall St Station
New York, NY 10268
State Street Nominees Ltd I 152,482.977 10.6512%
Designation 29J3
525 Ferry Rd
Edinburgh, Scotland EH5 2AW
60
ASTON/BARINGS INTERNATIONAL FUND
SHAREHOLDER NAME AND ADDRESS CLASS SHARES OWNED PERCENT OF CLASS
------------------------------------------------- ----- -------------- ----------------
Strafe & Co FAO I 629,477.263 42.5349%
Credit Suisse Omnibus Mutual Fund
PO Box 160
Westerville, OH 43086
National Financial Services Corp (FBO) I 475,119.985 32.1047%
Our Customers
ATTN Mutual Funds Department 5th Floor
200 Liberty Street
One World Financial Center
New York, NY 10281
Strafe & Co FAO I 209,433.490 14.1518%
FAO lena Pope Fund Custody
PO Box 160
Westerville, OH 43086
Mitra & Co 11270 West Park Place Suite 400 I 116,405.020 7.8657%
Milwaukee, WI 53224
ASTON/FORTIS GLOBAL REAL ESTATE FUND
SHAREHOLDER NAME AND ADDRESS CLASS SHARES OWNED PERCENT OF CLASS
------------------------------------------------- ----- -------------- ----------------
Fortis Investment Mgmt USA Inc N 1,951,973.600 91.9002%
75 State Street Ste 2700
Boston, MA 02109-1866
Saxon & Co. 8800 Tinicum Blvd N 143,562.101 6.7590%
Philadelphia, PA 19153-3198
ASTON/SMART PORTFOLIOS FUND
SHAREHOLDER NAME AND ADDRESS CLASS SHARES OWNED PERCENT OF CLASS
------------------------------------------------- ----- -------------- ----------------
Charles Schwab & Co. Inc N 758,089.734 46.6755%
Special Custody Acct for Exclusive of Customers
ATTN Mutual Funds
101 Montgomery St
San Francisco, CA 94104-4122
National Financial Services Corp (FBO) N 736,184.50 45.3268%
Our Customers
ATTN Mutual Funds
Department 5th Floor
200 Liberty Street
One World Financial Center
New York, NY 10281
61
ASTON/NEW CENTURY ABSOLUTE RETURN ETF FUND
SHAREHOLDER NAME AND ADDRESS CLASS SHARES OWNED PERCENT OF CLASS
------------------------------------------------- ----- -------------- ----------------
Charles Schwab & Co. Inc N 792,267.423 48.0656%
Special Custody Acct for Exclusive of Customers
ATTN Mutual Funds
101 Montgomery St
San Francisco, CA 94104-4122
National Financial Services Corp (FBO) N 91,100.010 5.5269
Our Customers
ATTN Mutual Funds
Department 5th Floor
200 Liberty Street
One World Financial Center
New York, NY 10281
ASTON/MB ENHANCED EQUITY INCOME FUND
SHAREHOLDER NAME AND ADDRESS CLASS SHARES OWNED PERCENT OF CLASS
------------------------------------------------- ----- -------------- ----------------
Charles Schwab & Co. Inc N 892,583.470 39.7759%
Special Custody Acct for Exclusive of Customers
ATTN Mutual Funds
101 Montgomery St
San Francisco, CA 94104-4122
National Financial Services Corp (FBO) N 596,968.213 26.6025%
Our Customers
ATTN Mutual Funds
Department 5th Floor
200 Liberty Street
One World Financial Center
New York, NY 10281
Independence Trust Company N 383,570.266 17.0929%
325 Bridge Street
Franklin, TN 37064-2609
62
ASTON/FORTIS REAL ESTATE FUND
SHAREHOLDER NAME AND ADDRESS CLASS SHARES OWNED PERCENT OF CLASS
------------------------------------------------- ----- -------------- ----------------
Charles Schwab & Co. Inc N 142,752.851 14.9709%
Special Custody Acct for Exclusive of Customers
ATTN Mutual Funds
101 Montgomery St
San Francisco, CA 94104-4122
Saxon & Co. 8800 Tinicum Blvd N 103,328.292 10.8363%
Philadelphia, PA 19153-3198
National Financial Services Corp (FBO) N 97,831.861 10.2599%
Our Customers
ATTN Mutual Funds
Department 5th Floor
200 Liberty Street
One World Financial Center
New York, NY 10281
Ameritrade Inc For the Exclusive Benefit of
our Customers N 72,967.360 7.6523%
PO Box 2226
Omaha, NE 68103-2226
DCGT as TTEE and/or CUST N 56,518.614 5.9273%
FBO Various Qualified Plans
ATTN NPIO Trade Desk
711 High Street
Des Moines, IA 50303
Saxon & Co. 8800 Tinicum Blvd N 53,916.886 5.6544%
Philadelphia, PA 19153-3198
Bank of America NA TTEE FBO LaSalle I 3,549,835.227 92.9575%
Pension Plan & Trust
PO Box 831575
Dallas, TX 75283-1575
State St. Bank & Tr Co FBO ABN AMRO North America I 262,823.004 6.8824%
Retirement Trust
805 Pennsylvania Ave
Kansas City, MO 64105-1340
63
ASTON/MONTAG & CALDWELL BALANCED FUND
SHAREHOLDER NAME AND ADDRESS CLASS SHARES OWNED PERCENT OF CLASS
------------------------------------------------- ----- -------------- ----------------
Merrill Lynch Pierce Fenner & Smith Inc.
For the Sole Benefit of Its Customers N 286,404.730 27.3133%
ATTN Service Team
4800 Deer Lake Dr
East 3rd Fl
Jacksonville, FL 32246
Charles Schwab & Co. Inc Special Custody N 104,208.111 9.9379%
Acct for Exclusive of Customers
ATTN Mutual Funds
101 Montgomery St
San Francisco, CA 94104-4122
National Financial Services Corp (FBO) I 43,035.324 71.4220%
Our Customers
ATTN Mutual Funds
Department 5th Floor
200 Liberty Street
One World Financial Center
New York, NY 10281
PFPC Trust Co CUST FBO James B. Thomas I 9,193.068 15.2569%
Rollover IRA
Wilmington, DE 19806-1403
DCGT as TTEE and/or CUST I 3,916.169 6.4993%
FBO Various Qualified Plans
ATTN NPIO Trade Desk
711 High Street
Des Moines, IA 50303
ASTON BALANCED FUND
SHAREHOLDER NAME AND ADDRESS CLASS SHARES OWNED PERCENT OF CLASS
------------------------------------------------- ----- -------------- ----------------
DCGT as TTEE and/or CUST N 1,583,980.880 45.8532%
FBO Various Qualified Plans
ATTN NPIO Trade Desk
711 High Street
Des Moines, IA 50303
64
ASTON/TCH FIXED INCOME FUND
SHAREHOLDER NAME AND ADDRESS CLASS SHARES OWNED PERCENT OF CLASS
------------------------------------------------- ----- -------------- ----------------
DCGT as TTEE and/or CUST N 1,970,933.177 41.2133%
FBO Various Qualified Plans
ATTN NPIO Trade Desk
711 High Street
Des Moines, IA 50303
National Financial Services Corp (FBO) N 253,769.483 5.3065%
Our Customers
ATTN Mutual Funds
Department 5th Floor
200 Liberty Street
One World Financial Center
New York, NY 10281
National Financial Services Corp (FBO)
Our Customers I 1,501,009.070 53.2107%
ATTN Mutual Funds
Department 5th Floor
200 Liberty Street
One World Financial Center
New York, NY 10281
DCGT as TTEE and/or CUST I 1,116,027.608 39.5631%
FBO Various Qualified Plans
ATTN NPIO Trade Desk
711 High Street
Des Moines, IA 50303
Wells Fargo Bank NA FBO I 168,266.265 5.9650%
PO Box 1533
Minneapolis, MN 55480
ASTON/FORTIS INVESTOR MONEY MARKET FUND
SHAREHOLDER NAME AND ADDRESS CLASS SHARES OWNED PERCENT OF CLASS
------------------------------------------------- ----- -------------- ----------------
DCGT as TTEE and/or CUST N 2,536,309.700 7.8382%
FBO Various Qualified Plans
ATTN NPIO Trade Desk
711 High Street
Des Moines, IA 50303
Principal Trust Company FBO Def Comp of Isle of N 2,256,915.220 6.9748%
Capri Casino
ATTN Susan Saggione
1013 Center Road
Wilmington, DE 19805
FORTIS TAX-EXEMPT MONEY MARKET FUND
SHAREHOLDER NAME AND ADDRESS CLASS SHARES OWNED PERCENT OF CLASS
------------------------------------------------- ----- --------------- ----------------
PFPC Trust Co CUST S 158,984.490 56.9177%
Rollover IRA
FBO Nancy Moore
Warwick, NY 10990
Bruce Crown TTEE Bruce A. Crown Grantors Trust S 63,993.170 22.9101%
Chicago, IL 60610-4466
PFPC Trust Co CUST IRA FBO Andrew R. Gelman S 19,263.760 6.8966%
Chicago, IL 60637-1717
Laba & Co I 120,498,942.850 95.6090%
ATTN Mutual Funds Operations
135 South LaSalle Street
Chicago, IL 60603
65
FORTIS GOVERNMENT MONEY MARKET FUND
SHAREHOLDER NAME AND ADDRESS CLASS SHARES OWNED PERCENT OF CLASS
------------------------------------------------- ----- ---------------- ----------------
National Financial Services Corp (FBO)
Our Customers S 200,996.640 18.1015%
ATTN Mutual Funds Department 5th Floor
200 Liberty Street
One World Financial Center
New York, NY 10281
PFPC Trust Co CUST FBO Jennifer F. Brawley S 185,382.580 16.6953%
IRA Rollover
Claremont, CA 91711-4716
PFPC Trust Co CUST FBO Deborah S. Smith S 169,286.770 15.2458%
IRA Rollover
Charlotte, NC 28214
Catholic Social Services of St. Clair County S 114,280.040 10.2919%
2601 13th Street
Port Huron, MI 48060-6593
PFPC Trust Co CUST FBO Robert J. Milonas S 84,820.060 7.6388%
Rollover IRA
Saint Louis, MO 63123-4841
Laba & Co I 279,442,238.130 85.4825%
ATTN Mutual Funds Operations
135 South LaSalle Street
Chicago, IL 60603
DCGT as TTEE and/or CUST I 31,189,078.330 9.5409%
FBO Various Qualified Plans
ATTN NPIO Trade Desk
711 High Street
Des Moines, IA 50303
66
FORTIS TREASURY MONEY MARKET FUND
SHAREHOLDER NAME AND ADDRESS CLASS SHARES OWNED PERCENT OF CLASS
------------------------------------------------- ----- ---------------- ----------------
NASR Enterprise LLC 2562 Silver State Parkway S 427,524.400 48.2764%
Suite F2
Minden, NV 89423-8937
PFPC Trust Co CUST Rollover IRA S 107,905.860 12.1848%
FBO Timothy M. Redmon
Willow Springs, IL 60480
PFPC Trust Co CUST S 84,250.580 9.5137%
FBO Robert J Milonas
Rollover IRA
Saint Louis, MO 63123-4841
Laba & Co I 134,639,318.910 99.4969%
ATTN Mutual Funds Operations
Omnibus Account
135 South LaSalle Street
Chicago, IL 60603
FORTIS INSTITUTIONAL PRIME MONEY MARKET FUND
SHAREHOLDER NAME AND ADDRESS CLASS SHARES OWNED PERCENT OF CLASS
------------------------------------------------- ----- ----------------- ----------------
Laba & Co Y 1,096,889,910.530 65.0085%
ATTN Mutual Funds Operations
135 South LaSalle Street
Chicago, IL 60603
Mellon Bank Y 208,932,842.800 12.3827%
ATTN Pamela Palmer
One Mellon Bank Center 4th Floor
Pittsburgh, PA 15258-0001
M&I Trust Maril & Co ABN AMRO Inv Trust Y 172,060,546.230 10.1974%
ATTN ACM Department
11270 W Park Place, Suite 400
Milwaukee, WI 53224-3625
Mellon Financial Markets LLC FBO United
Health Group Y 85,080,552.410 5.0424%
One Mellon Center
500 Grant Street, Suite 0475
Pittsburgh, PA 15258-0001
Equipment Financing & Leasing Corporation YS 1,299,039.840 17.6950%
2005 Hamlin Road, Suite 200
Rochester Hills, MI 48309-3380
Michigan Soft Drink Association YS 987,149.540 13.4466%
124 West Allegan Street, Suite 634
Lansing, MI 48933-1707
Laba & Co YS 458,432.430 6.2446%
ATTN Mutual Funds Operations
135 South LaSalle Street
Chicago, IL 60603
Christ Church YS 401,136.690 5.4641%
2500 Breton Road SE
Grand Rapids, MI 49546-5630
Chain -SYS Corporation YS 384,414.900 5.2364%
8530 Ember Glen Pass
Lansing, MI 48917-8844
67
INVESTMENT ADVISORY AND OTHER SERVICES
THE INVESTMENT ADVISERS
As described in the prospectuses, the Trust employs Aston Asset Management
LLC ("Aston" or the "Investment Adviser") to manage the investment and
reinvestment of the assets of the Funds (except the Fortis Money Market Funds)
and to continuously review, supervise and administer the Funds' investment
programs under an Investment Advisory Agreement dated November 30, 2006. Aston
has engaged various subadvisers to manage the day-to-day operations of the
Funds.
The advisory services provided by the Investment Adviser for each Fund and
the fees received by it for such services for the Fund's most recent fiscal year
are described in the Prospectuses.
Aston, a majority owned subsidiary of Highbury Financial Inc.
("Highbury"), was formed in April 2006 for the purpose of acquiring the U.S.
mutual fund and separately managed account business of ABN AMRO Asset
Management, Inc. and its affiliates as part of an asset purchase agreement dated
April 20, 2006 (the "Strategic Transaction"). Aston is located at 120 N. LaSalle
Street, 25th Floor, Chicago, Illinois 60602. As of December 31, 2008, Aston had
approximately $3.4 billion in assets under management.
Highbury was formed on July 13, 2005 as a blank-check company for the
purpose of acquiring one or more financial services businesses. Highbury's
registration statement for its initial public offering of its common stock was
declared effective by the SEC on January 25, 2006, and the offering generated
net proceeds of approximately $43.8 million. The common stock of Highbury is
publicly traded in the over-the-counter market under the symbol HBRF.
For the services provided and the expenses assumed pursuant to the
Investment Advisory Agreement with Aston, Aston receives a fee based on each
Fund's average daily net assets, computed daily and payable monthly, at the
following annual rates:
68
GROSS ADVISORY FEE
(AS A % OF AVERAGE DAILY
NET
FUND ASSETS)
-------------------------------------------------------------------------------- --------------------------------
0.80% for the first $800 million
Aston/Montag & Caldwell Growth 0.60% over $800 million
Aston/Veredus Select Growth 0.80%
Aston Growth 0.70%
Aston/Optimum Large Cap Opportunity 0.80%
Aston Value 0.80%
Aston/TAMRO All Cap 0.80%
Aston/River Road Dividend All Cap Value 0.70%
0.80% for the first $100 million
0.75% for next $300 million
Aston/Optimum Mid Cap 0.70% over $400 million
Aston/Montag & Caldwell Mid Cap Growth 0.85%
Aston/Cardinal Mid Cap Value 0.90%
Aston/River Road Small-Mid Cap 1.00%
Aston/Veredus Aggressive Growth 1.00%
Aston/TAMRO Small Cap 0.90%
Aston/River Road Small Cap Value 0.90%
Aston/Neptune International Fund 1.00%
Aston/Barings International 1.00%
Aston/Fortis Global Real Estate 1.00%
Aston/Smart Portfolios 0.80%
Aston/New Century Absolute Return ETF* 1.00%
Aston/MB Enhanced Equity Income 0.70%
Aston/Fortis Real Estate 1.00%
Aston/Montag & Caldwell Balanced 0.75%
Aston Balanced 0.70%
Aston/TCH Fixed Income 0.55%
----------
* The subadviser has agreed that for the period from the Fund's commencement
of operations through, and including, December 31, 2008, and for each
subsequent full calendar year of operations thereafter, if in any such
period the Fund had a total return (before taxes) of less than zero, then
the subadviser will waive its fee in its entirety for the next succeeding
calendar year. For any period when this waiver is in effect, the adviser
has agreed to reduce its advisory fee to 0.15%. For the period ended
December 31, 2008, the Fund's total return was less than zero, therefore
the adviser will reduce its advisory fee to 0.15% for the 2009 calendar
year.
Fortis Investment Management USA, Inc. ("FIM," "Investment Adviser" or
collectively with Aston, the "Investment Advisers") serves as the investment
adviser for the Fortis Money Market Funds. FIM is located at 75 State Street,
Boston, Massachusetts 02109. Prior to August 1, 2008, ABN AMRO Asset Management,
Inc. ("AAAM") or its predecessors served as the investment adviser to each
Fortis Money Market Fund since its inception. On August 1, 2008, AAAM was merged
into FIM and FIM became the Money Market Funds' adviser, which was the final
stage of a series of transactions in connection with the completion of a tender
offer for substantially all of the shares of ABN AMRO Holdings N.V., AAAM's
ultimate parent company, by a consortium including Fortis N.V. In October 2008,
Fortis SA/NV and Fortis NV ("Fortis"), the ultimate parent companies of Fortis
Bank SA/NV ("Fortis Bank"), announced that the Belgian government had acquired
substantially all of the outstanding capital and voting rights of Fortis Bank
(the "Nationalization").
Since October 2008, the Belgian government has owned substantially all of
the outstanding capital and voting rights of Fortis Bank pending a sale to a
private buyer. Fortis Bank and its affiliates subsequently announced a
transaction in which BNP Paribas SA would acquire approximately 75% of the
outstanding capital and voting rights of Fortis Bank. The BNP Paribas
transaction is subject to legal challenges and numerous closing conditions, and
remains pending as of the date of this SAI.
69
For the services provided and the expenses assumed pursuant to the
investment advisory agreement between the Fortis Money Market Funds and FIM, FIM
receives a fee based on each Fund's average daily net assets, computed daily and
payable monthly, at the following annual rates:
GROSS ADVISORY FEE
(AS A % OF AVERAGE
FUND DAILY NET ASSETS)
--------------------------------------------------------------------- -------------------
Aston/Fortis Investor Money Market 0.40%
Fortis Government Money Market 0.20%
Fortis Tax-Exempt Money Market 0.35%
Fortis Treasury Money Market 0.35%
Fortis Institutional Prime Money Market 0.10%
Aston has entered into an Expense Limitation Agreement with the Trust, on
behalf of each Fund, through February 28, 2010, for the following Funds:
FUND CLASS I CLASS N
--------------------------------------------------------------------- ------- -------
Aston/Veredus Select Growth Fund 1.05% 1.30%
Aston/TAMRO All Cap Fund -- 1.20%
Aston Value Fund 0.82% 1.07%
Aston/River Road Dividend All Cap Value Fund 1.05% 1.30%
Aston/Optimum Mid Cap Fund 1.15% 1.40%
Aston/Veredus Aggressive Growth Fund 1.24% 1.49%
Aston/River Road Small Cap Value Fund 1.25% 1.50%
Aston/Fortis Real Estate Fund 1.12% 1.37%
Aston/TCH Fixed Income Fund 0.49% 0.74%
Aston has entered into an Expense Reimbursement Agreement with the Trust,
on behalf of each Fund, through February 28, 2010, for the following Funds:
FUND CLASS I CLASS N
--------------------------------------------------------------------- ------- -------
Aston/Optimum Large Cap Opportunity Fund -- 1.40%
Aston/Montag & Caldwell Mid Cap Growth Fund -- 1.40%
Aston/Cardinal Mid Cap Value Fund -- 1.40%
Aston/River Road Small-Mid Cap Fund 1.25% 1.50%
Aston/Neptune International Fund 1.02% 1.27%
Aston/Barings International Fund 1.25% --
Aston/Fortis Global Real Estate Fund -- 1.50%
Aston/Smart Portfolios Fund -- 1.30%
Aston/New Century Absolute Return ETF Fund -- 1.50%
Aston/MB Enhanced Equity Income Fund -- 1.10%
In connection with the Expense Reimbursement Agreement for each Fund (and
its related classes) listed above, each Fund has agreed that during any of the
first three years subsequent to a Fund's commencement of operations for a period
of up to three years from the date following any waiver or reimbursement by
Aston to repay such amount to the extent that the Fund's expense ratio, not
including acquired fund fees and expenses, remains below the operating expense
cap after such reimbursement.
70
FIM has entered into an Expense Limitation Agreement with the Trust,
through February 28, 2010 for the following Funds:
FUND CLASS I CLASS S
--------------------------------------------------------------------- ------- -------
Fortis Government Money Market Fund 0.31% 0.63%
Fortis Tax-Exempt Money Market Fund 0.33% 0.58%
Fortis Treasury Money Market Fund 0.36% 0.61%
Aston may from time to time voluntarily waive a portion of its advisory
fees with respect to the Funds and/or reimburse a portion of the Funds'
expenses. These voluntary waivers do not include fees and expenses from
investment in other investment companies (acquired funds) or interest expense.
Aston may terminate such voluntary waivers/reimbursements at any time. Aston has
agreed to voluntarily waive management fees and/or reimburse expenses for the
following funds:
FUND CLASS I CLASS N
--------------------------------------------------------------------- ------- -------
Aston/Montag& Caldwell Balanced Fund 1.10% 1.35%
Aston Value Fund 0.82% 1.07%
Aston/Barings International Fund 1.15% --
Aston Balanced Fund -- 1.50%
71
The investment advisory fees earned and waived by the investment adviser for
each Fund for the fiscal years ended October 31, 2008, October 31, 2007 and
October 31, 2006 as well as any fees waived or expenses reimbursed, are set
forth below.
Fiscal year ended October 31, 2008
GROSS
ADVISORY NET ADVISORY
FEES EARNED WAIVED FEES AFTER FEE REIMBURSED
FUND BY ADVISERS FEES WAIVERS EXPENSES
----------------------------------------------- ------------ ----------- -------------- ------------
Aston/Montag & Caldwell Growth Fund $-12,363,067 $ -- $ -12,363,067 $ --
Aston/Veredus Select Growth Fund -725,571 -(31,940) -693,631 --
Aston Growth Fund -2,075,514 -(16,524) -2,058,990 --
Aston/Optimum Large Cap Opportunity Fund -124,154 -(119,883) -4,271 --
Aston Value Fund -2,531,877 -(522,630) -2,009,247 --
Aston/TAMRO All Cap Fund -100,042 -(85,322) -14,720 --
Aston/River Road Dividend All Cap Value Fund -309,748 -(23,150) -286,598 --
Aston/Optimum Mid Cap Fund -6,546,722 -- -6,546,722 --
Aston/Montag & Caldwell Mid Cap Growth Fund(1) -19,097 -(19,097) -- -(79,711)
Aston/Cardinal Mid Cap Value Fund(1) -9,463 -(9,463) -- -(93,601)
Aston/River Road Small-Mid Cap Fund -783,304 -(44,979) -738,325 --
Aston/Veredus Aggressive Growth Fund -1,347,936 -(72,302) -1,275,634 --
Aston/TAMRO Small Cap Fund -3,336,623 -(69,983) -3,266,640 --
Aston/River Road Small Cap Value Fund -2,546,901 -- -2,546,901 --
Aston/Barings International Fund(1) -62,915 -(62,915) -- -(111,373)
Aston/Neptune International Fund -91,726 -(91,726) -- -(89,973)
Aston/Fortis Global Real Estate Fund -175,972 -(133,031) -42,941 --
Aston/Smart Portfolios Fund(2) -22,154 -(22,154) -- -(83,175)
Aston/New Century Absolute Return ETF Fund(3,5) -42,774 -(42,774) -- -(54,309)
Aston/MB Enhanced Equity Income Fund(4) -69,706 -(69,706) -- -(58,235)
Aston/Fortis Real Estate Fund -555,268 -(111,488) -443,780 --
Aston/Montag & Caldwell Balanced Fund -138,320 -(72,576) -65,744 --
Aston Balanced Fund -184,165 -- -184,165 --
Aston/TCH Fixed Income Fund -461,420 -(346,661) -114,759 --
Aston/Fortis Investor Money Market Fund -136,939 -- -139,939 --
Fortis Government Money Market Fund -731,241 -(16,360) -714,881 --(9)
Fortis Tax-Exempt Money Market Fund -919,145 -(404,473) -514,672 --
Fortis Treasury Money Market Fund -721,879 -(359,011) -362,868 -(16,461)
Fortis Institutional Prime Money Market Fund -1,889,085 -- -1,889,085 --
----------
(1) Aston/Montag & Caldwell Mid Cap Growth Fund, Aston/Cardinal Mid Cap Value
Fund and Aston/Barings International Fund commenced operations on November
2, 2007.
(2) Aston/Smart Portfolios Fund commenced operations on January 10, 2008.
(3) Aston/New Century Absolute Return ETF Fund commenced operations on March
14, 2008.
(4) Aston/MB Enhanced Equity Income Fund commenced operations on January 15,
2008.
72
Fiscal year ended October 31, 2007
GROSS
ADVISORY FEES NET ADVISORY
EARNED BY WAIVED FEES AFTER FEE REIMBURSED
FUND ADVISERS FEES WAIVERS EXPENSES
----------------------------------------------- ------------- ------------ -------------- ------------
Aston/Montag & Caldwell Growth Fund(1) $ 13,171,967 $ -- $ 13,171,967 $ --
Aston Growth Fund(1) 4,537,408 -- 4,537,408 --
Aston/Veredus Select Growth Fund(1) 328,522 (90,594) 237,928 --
Aston/Optimum Large Cap Opportunity Fund(2) 95,238 (95,238) -- (44,354)
Aston/TAMRO All Cap Fund(1) 125,112 (84,623) 40,489 --
Aston Value Fund(1) 3,150,174 (872,218) 2,277,956 --
Aston/River Road Dividend All Cap Value Fund(1) 234,559 (76,712) 158,387 --
Aston/Optimum Mid Cap Fund 5,905,944 -- 5,905,944 --
Aston/River Road Small-Mid Cap Fund(3) 63,321 (63,321) -- (35,205)
Aston/Veredus Aggressive Growth Fund(1) 2,957,861 -- 2,957,861 --
Aston/TAMRO Small Cap Fund(1) 3,114,389 (108,979) 3,005,410 --
Aston/River Road Small Cap Value Fund(1) 2,856,920 -- 2,856,920 --
Aston/Fortis Real Estate Fund(1) 1,118,165 (96,979) 1,021,186 --
Aston/Fortis Global Real Estate Fund(4) 49,993 (42,416) 7,577 --
Aston/Neptune International Fund(4) 4,613 (4,613) -- (43,689)
Aston/Montag & Caldwell Balanced Fund(1) 165,101 (79,957) 85,144 --
Aston Balanced Fund(1) 298,963 -- 298,963 --
Aston/TCH Fixed Income Fund(1) 552,489 (312,985) 239,504 --
Aston/Fortis Investor Money Market Fund 242,791 -- 242,791 --
Fortis Government Money Market Fund 928,819 -- 928,819 --
Fortis Tax-Exempt Money Market Fund 997,521 (420,297) 577,224 --
Fortis Treasury Money Market Fund 364,275 (227,321) 136,954 --
Fortis Institutional Prime Money Market Fund 2,347,423 -- 2,347,423 --
----------
(1) Prior to December 1, 2006, each subadviser served as the investment
adviser to the Fund. With respect to FIM, its predecessor served as
investment adviser to the Fund.
(2) The Aston/Optimum Large Cap Opportunity Fund commenced operations on
December 28, 2006.
(3) The Aston/River Road Small-Mid Cap Fund commenced operations on March 28,
2007.
(4) The Aston/Fortis Global Real Estate Fund and Aston/Neptune International
Fund commenced operations on August 3, 2007 and August 6, 2007,
respectively.
73
Fiscal year ended October 31, 2006
GROSS
ADVISORY NET ADVISORY
FEES EARNED WAIVED FEES AFTER FEE REIMBURSED
FUND BY ADVISERS FEES WAIVERS EXPENSES
----------------------------------------------- ------------- ---------- --------------- -----------
Aston/Montag & Caldwell Growth Fund(1) $ 15,701,539 $ -- $ 15,701,539 $ --
Aston Growth Fund(1) 7,425,844 -- 7,425,844 --
Aston/Veredus Select Growth Fund(1) 212,039 (117,947) 94,092 --
Aston/TAMRO All Cap Fund(1) 153,760 (63,426) 90,334 --
Aston Value Fund(1),(2) 2,559,423 (708,841) 1,850,582 --
Aston/River Road Dividend All Cap
Value Fund(1) 53,131 (53,131) -- (36,432)
Aston/Optimum Mid Cap Fund 4,870,333 -- 4,870,333 --
Aston/TAMRO Small Cap Fund(1) 1,668,134 (220,883) 1,447,251 --
Aston/River Road Small Cap Value Fund(1) 399,699 (157,761) 241,938 --
Aston/Fortis Real Estate Fund(1),(2) 1,025,806 (94,064) 931,742 --
Aston/Veredus Aggressive Growth Fund(1) 6,741,085 -- 6,741,085 --
Aston/Montag & Caldwell Balanced Fund(1) 370,227 -- 370,227 --
Aston Balanced Fund(1) 634,456 -- 634,456 --
Aston/TCH Fixed Income Fund(1) 892,032 (353,812) 538,220 --
Aston/Fortis Investor Money Market Fund 399,969 -- 399,969 --
Fortis Government Money Market Fund 982,518 -- 982,518 --
Fortis Tax-Exempt Money Market Fund 1,030,909 (382,909) 648,000 --
Fortis Treasury Money Market Fund 596,285 (221,478) 374,807 --
Fortis Institutional Prime Money Market Fund 2,486,473 -- 2,486,473 --
----------
(1) Prior to December 1, 2006, each subadviser served as the investment
adviser to the Fund. With respect to FIM, a predecessor served as
investment adviser to the Fund.
(2) Prior to January 1, 2006, ABN AMRO Asset Management (USA) LLC ("AAAM LLC")
was the investment adviser to Aston Value Fund and Aston/Fortis Real
Estate Fund. On January 1, 2006, AAAM LLC merged into AAAM. From January
1, 2006 until November 30, 2006, AAAM assumed AAAM LLC's responsibilities
under AAAM LLC's investment advisory agreements with the Funds and related
Sub-Investment Advisory agreements and became the Funds' Investment
Adviser.
Under the Investment Advisory Agreement and the investment advisory
agreements between FIM and the Trust on behalf of each of Aston/Fortis Investor
Money Market Fund, Fortis Government Money Market Fund, Fortis Tax-Exempt Money
Market Fund, Fortis Treasury Money Market Fund and Fortis Institutional Prime
Money Market Fund (the "Investment Advisory Agreements"), the Investment Adviser
is not liable for any error of judgment or mistake of law or for any loss
suffered by the Trust or a Fund in connection with the performance of the
Investment Advisory Agreements, except a loss resulting from willful
misfeasance, bad faith or gross negligence on its part in the performance of its
duties or from reckless disregard of its duties and obligations thereunder.
The Investment Advisory Agreements between the Trust and Aston are
terminable with respect to a Fund by vote of the Board of Trustees or by the
holders of a majority of the outstanding voting securities of a Fund, at any
time without penalty, on 60 days' written notice to Aston. The Investment
Advisory Agreements between the Trust and FIM are terminable with respect to a
Fund by vote of the Board of Trustees or by the holders of a majority of the
outstanding voting securities of a Fund, at any time without penalty, on 10
days' written notice to FIM. Aston or Fortis may also terminate its advisory
relationship with respect to a Fund on 60 days' written notice to the Trust. The
Investment Advisory Agreements terminate automatically in the event of their
assignment.
74
Under the Investment Advisory Agreements, each investment adviser shall:
(i) manage the investment and reinvestment of the assets of the Funds, (ii)
continuously review, supervise and administer the investment program of the
Funds, (iii) determine in its discretion, the assets to be held uninvested, (iv)
provide the Trust with records concerning the Investment Adviser's activities
which are required to be maintained by the Trust and (v) render regular reports
to the Trust's officers and Board of Trustees concerning the Investment
Adviser's discharge of the foregoing responsibilities. Each Investment Adviser
shall discharge the foregoing responsibilities subject to the oversight of the
Trust's officers and the Board of Trustees and in compliance with the
objectives, policies and limitations set forth in the Trust's then effective
prospectuses and SAI.
The Investment Advisory Agreements continue in effect for each Fund from
year to year for so long as its continuation is approved at least annually (a)
by a majority of the Trustees who are not parties to such agreement or
interested persons of any such party except in their capacity as Trustees of the
Fund or (b) by the shareholders of the Fund or the Board of Trustees.
The Investment Advisory Agreement with Aston also provides that Aston
shall have the authority, subject to applicable provisions of the 1940 Act and
the regulations thereunder, to select one or more subadvisers to provide
day-to-day portfolio management with respect to all or a portion of the assets
of any of the Funds and to allocate and reallocate the assets of a Fund between
and among any subadviser so selected pursuant to a "manager of managers"
structure. Under this structure, Aston also has the authority to retain and
terminate subadvisers, engage new subadvisers and make material revisions to the
terms of the Sub-Investment Advisory Agreements subject to approval of the Board
of Trustees, but not shareholder approval.
As described above, Aston is paid an annual management fee based on the
average daily net assets of a Fund. Out of its fee, Aston pays the Subadviser(s)
of each Fund. Fees paid to a Subadviser of a Fund with multiple Subadvisers will
depend upon the fee rate negotiated with Aston and upon the percentage of the
Fund's assets allocated to that Subadviser by Aston. Because Aston will pay each
Subadviser's fees out of its own fees from the Funds, there will not be any
"duplication" of advisory fees paid by the Funds.
THE SUBADVISERS
On November 30, 2006, Aston entered into Sub-Investment Advisory
Agreements with MFS Institutional Advisors Inc. ("MFS") (on behalf of Aston
Value Fund) and Optimum Investment Advisors, LLC ("Optimum") (on behalf of
Aston/Optimum Mid Cap Fund). On December 26, 2006, Aston entered into a
Sub-Investment Advisory Agreement with Optimum on behalf of Aston/Optimum Large
Cap Opportunity Fund. On June 30, 2007, Aston entered into a new subadvisory
agreement with Tasho Investment, LLC (on behalf of Aston/TAMRO All Cap Fund and
Aston/TAMRO Small Cap Fund.) On July 20, 2007, Aston entered into a
Sub-Investment Advisory Agreement with Neptune Investment Management Limited
("Neptune") on behalf of Aston/Neptune International Fund. On October 17, 2007,
Aston entered into Sub-Investment Advisory Agreements with FIM (on behalf of
Aston/Fortis Real Estate Fund and Aston/Fortis Global Real Estate Fund); Montag
& Caldwell, Inc. ("Montag & Caldwell") (on behalf of Aston/Montag & Caldwell
Growth Fund and Aston/Montag & Caldwell Balanced Fund); Veredus Asset Management
LLC ("Veredus") (on behalf of Aston/Veredus Aggressive Growth Fund and
Aston/Veredus Select Growth Fund); River Road Asset Management, LLC ("River
Road") (on behalf of Aston/River Road Dividend All Cap Value Fund, Aston/River
Road Small Cap Value Fund and Aston/River Road Small-Mid Cap Fund. As of
November 1, 2007, Aston entered into Sub-
75
Investment Advisory Agreements with Baring International Investment Limited
("Barings") (on behalf of Aston/Barings International Fund), Cardinal Capital
Management, L.L.C. ("Cardinal") (on behalf of Aston/Cardinal Mid Cap Value Fund)
and Montag & Caldwell (on behalf of Aston/Montag & Caldwell Mid Cap Growth
Fund). On January 1, 2008, Aston entered into a Sub-Investment Advisory
Agreement with Montag & Caldwell on behalf of Aston Growth Fund and the equity
portion of Aston Balanced Fund. On January 7, 2008, Aston entered into a
Sub-Investment Advisory Agreement with Smart Portfolios, LLC ("Smart") on behalf
of Aston/Smart Portfolios Fund. On January 9, 2008, Aston entered into a
Sub-Investment Advisory Agreement with MB Investment Partners, Inc. ("MB") on
behalf of Aston/MB Enhanced Equity Income Fund. On February 29, 2008, Aston
entered into a Sub-Investment Advisory Agreement with New Century Capital
Management, LLC ("New Century") on behalf of Aston/New Century Absolute Return
ETF Fund. On December 3, 2008 Aston entered into a Sub-Investment Advisory
Agreement with Taplin, Canida and Habacht, LLC ("TCH") (on behalf of Aston/TCH
Fixed Income Fund and the fixed income portion of Aston Balanced Fund).
Under each Sub-Investment Advisory Agreement, each Subadviser manages a
portfolio of the Fund, selects investments and places all orders for purchases
and sales of that Fund's securities, subject to the general oversight of the
Board of Trustees of the Trust and the Investment Adviser. In addition, except
as may otherwise be prohibited by law or regulation, a Subadviser may, in its
discretion and from time to time, waive a portion of its fee.
Each Sub-Investment Advisory Agreement provides that neither a Subadviser
nor any of its directors, officers, stockholders, agents or employees shall have
any liability to a Fund or any shareholder of a Fund for any error of judgment,
mistake of law, or any loss arising out of any investment, or for any other act
or omission in the performance by a Subadviser of its duties under the
Sub-Investment Advisory Agreement except for liability resulting from willful
misfeasance, bad faith, or negligence on its part in the performance of its
duties or from reckless disregard by it of its obligations and duties under the
Sub-Investment Advisory Agreement. Each of the Sub-Investment Advisory
Agreements continues for the same term as the Investment Advisory Agreement and
is subject to the same requirements for renewal.
For the services provided pursuant to the Sub-Investment Advisory
Agreements, the Investment Adviser pays each Subadviser a fee computed daily and
payable monthly, as described below. In addition, under certain circumstances, a
Subadviser may be obligated to pay Aston in the event the formula below results
in a negative amount.
76
FUND SUB-INVESTMENT ADVISORY FEE
------------------------------------------------------- ---------------------------------------------------------
Aston/Montag & Caldwell Growth Fund 50% of: Advisory Fee Less
Expense Waivers/Reimbursements and Payments to Third-Party
Intermediaries
Aston/Veredus Select Growth Fund 50% of: Advisory Fee Less
Expense Waivers/Reimbursements and Payments to Third-Party
Intermediaries
Aston Growth Fund 50% of: Advisory Fee Less Expense
Waivers/Reimbursements and Payments to Third-Party
Intermediaries
Aston/Optimum Large Cap Opportunity Fund 50% of: Advisory Fee Less Expense
Waivers/Reimbursements and Payments to Third-Party
Intermediaries
Aston Value Fund 0.40% of 1st $125 million
0.30% over $125 million
Aston/TAMRO All Cap Fund 50% of: Advisory Fee Less Expense
Waivers/Reimbursements and Payments to Third-Party
Intermediaries
Aston/River Road Dividend All Cap Value Fund 50% of: Advisory Fee Less Expense
Waivers/Reimbursements and Payments to Third-Party
Intermediaries
Aston/Optimum Mid Cap Fund 0.30% for the first $100 million
0.25% for the next $300 million
0.20% for the next $400 million
0.30% over $1 billion
Aston/Montag & Caldwell Mid Cap Growth Fund 50% of: Advisory Fee Less Expense
Waivers/Reimbursements and Payments to Third-Party
Intermediaries
Aston/Cardinal Mid Cap Value Fund 50% of: Advisory Fee Less Expense
Waivers/Reimbursements and Payments to Third-Party
Intermediaries
Aston/River Road Small-Mid Cap Fund 50% of: Advisory Fee Less Expense
Waivers/Reimbursements and Payments to Third-Party
Intermediaries
Aston/Veredus Aggressive Growth Fund 50% of: Advisory Fee Less Expense
Waivers/Reimbursements and Payments to Third-Party
Intermediaries
Aston/TAMRO Small Cap Fund* 50% of: Advisory Fee Less Expense
Waivers/Reimbursements and Payments to Third-Party
Intermediaries
77
Aston/River Road Small Cap Value Fund 50% of: Advisory Fee Less Expense
Waivers/Reimbursements and Payments to Third-Party
Intermediaries
Aston/Barings International Fund 50% of: Advisory Fee Less Expense
Waivers/Reimbursements and Payments to Third-Party
Intermediaries
Aston/Neptune International Fund 50% of: Advisory Fee Less Expense
Waivers/Reimbursements and Payments to Third-Party
Intermediaries
Aston/Fortis Global Real Estate Fund 50% of: Advisory Fee Less Expense
Waivers/Reimbursements and Payments to Third-Party
Intermediaries (the "Base Fee Rate"), subject to the Adjusted Fee
Rate discussed below
Aston/Smart Portfolios Fund 50% of: Advisory Fee Less Expense
Waivers/Reimbursements and Payments to Third-Party
Intermediaries
Aston/New Century Absolute Return ETF Fund** 50% of: Advisory Fee Less Expense
Waivers/Reimbursements and Payments to Third-Party
Intermediaries
Aston/MB Enhanced Equity Income Fund 50% of: Advisory Fee Less Expense
Waivers/Reimbursements and Payments to Third-Party
Intermediaries
Aston/Fortis Real Estate Fund 50% of: Advisory Fee Less Expense
Waivers/Reimbursements and Payments to Third-Party
Intermediaries
Aston/Montag & Caldwell Balanced Fund 50% of: Advisory Fee Less Expense
Waivers/Reimbursements and Payments to Third-Party
Intermediaries
Aston Balanced Fund 50% of: Advisory Fee Less Expense
Waivers/Reimbursements and Payments to Third-Party
Intermediaries
Aston/TCH Fixed Income Fund 50% of: Advisory Fee Less Expense
Waivers/Reimbursements and Payments to Third-Party
Intermediaries
----------
* As of October 1, 2008, the calculation of the sub-investment advisory fee
payable to the subadviser for the Aston/TAMRO Small Cap Fund varies based
upon the level of average monthly net assets which determines the
percentage of Payments to Third Party Intermediaries borne by the
subadviser.
** The subadviser has agreed that for the period from the Aston/New Century
Absolute Return ETF Fund's commencement of operations through, and
including, December 31, 2008, and for each subsequent full calendar year
of operations thereafter, if any such period the fund has a total return
(before taxes) of less than zero, then the subaviser will waive its fee in
its entirety for the next succeeding calendar year. For the period ending
December 31, 2008, the Fund has a total return of less than zero. For
calendar year 2009, the subadviser is waiving its fee.
With respect to FIM, if the value of assets allocated to FIM with respect
to the Aston/Fortis Global Real Estate Fund is greater than $25 million as of
the calculation date, the fee payable to the
78
Subadviser shall be the higher of the Base Fee Rate or the Adjusted Fee Rate.
The Adjusted Fee Rate shall mean the average daily net assets of the assets
managed by FIM during the period multiplied by an annual rate calculated as
follows:
ASSETS ANNUAL RATE
Up to $25 million .00%
Greater than $25 million and up to $50 million .25%
Greater than $50 million and up to $100 million .35%
Greater than $100 million .50%
FORTIS INVESTMENT MANAGEMENT USA, INC.
Fortis Investment Management USA, Inc., 75 State Street, Boston,
Massachusetts 02109, is the sub-investment adviser to Aston/Fortis Global Real
Estate Fund and Aston/Fortis Real Estate Fund. FIM is a wholly-owned indirect
subsidiary of Fortis Bank.
The table below shows other accounts for which the portfolio managers of
each Fund are jointly and primarily responsible for the day-to-day portfolio
management as of January 31, 2009.
NUMBER OF
ACCOUNTS ASSETS
MANAGED WITH MANAGED WITH
NUMBER OF TOTAL ASSETS ADVISORY FEE ADVISORY FEE
ACCOUNTS MANAGED (IN BASED ON BASED ON
MANAGED MILLIONS) PERFORMANCE PERFORMANCE
--------- ------------ ------------ ------------
JOSEPH PAVNICA(1)
Registered Investment Companies 0 N/A 0 N/A
Other Pooled Investment Vehicles 8 $ 934 0 N/A
Other Accounts 9 $ 1,313 0 N/A
MENNO SLOTERDIDJK(1)
Registered Investment Companies 0 N/A 0 N/A
Other Pooled Investment Vehicles 10 $ 1,536 0 N/A
Other Accounts 9 $ 1,313 0 N/A
MATTHEW HOULT(1)
Registered Investment Companies 0 N/A 0 N/A
Other Pooled Investment Vehicles 11 $ 1,270 0 N/A
Other Accounts 10 $ 1,320 0 N/A
JAMES HARDMAN(1)
Registered Investment Companies 0 N/A 0 N/A
Other Pooled Investment Vehicles 8 $ 934 0 N/A
Other Accounts 9 $ 1,313 0 N/A
----------
(1) Mr. Pavnica and Mr. Hardman are responsible for the management of
Aston/Fortis Real Estate Fund; Messrs. Pavnica, Sloterdijk and Hoult are
jointly responsible for the management of Aston/Fortis Global Real Estate
Fund.
79
Compensation. The portfolio managers and analysts total compensation
consists of 1) a competitive base salary 2) an annual discretionary
performance-based cash bonus and 3) the eligibility to receive a deferred bonus
award.
Base salaries are reviewed annually against peer data from several market
compensation survey firms and through other sources e.g. headhunters and
industry compensation meetings to assure competitiveness. The discretionary cash
bonus awards are based on individual performance, and relevant market bonus
levels for the role. If awarded, the cash bonus award for the portfolio manager
is based on performance objectives relevant to the portfolio manager's position
and is primarily rewarded on the excess return their portfolios generate versus
peer performance and the relevant benchmark. Awards under the deferred bonus
plan are granted to the top and key employees within Fortis Investments
annually.
Other bonus criteria may include participation in portfolio company
off-sites and conference calls, publishing research, marketing activities,
budget management, as well as overall firm profitability.
Compensation is not based on the value of assets held in the Fund's
portfolio.
Material Conflicts of Interest. The portfolio managers for each Fund above
manage multiple accounts, including their respective Fund. The portfolio
managers make decisions for each account based on the investment objectives,
policies, practices and other relevant investment considerations that the
portfolio manager believes are applicable to that account. Consequently, the
portfolio managers may purchase securities for one account and not another
account, and the performance of securities purchased for one account may vary
from the performance of securities purchased for other accounts. A portfolio
manager may place transactions on behalf of other accounts that are contrary to
investment decisions made on behalf of a Fund, or make investment decisions that
are similar to those made for a Fund, both of which have the potential to
adversely affect the price paid or received by a Fund or the size of the
security position obtainable for a Fund. Fortis Investments has adopted policies
and procedures that it believes address the conflicts associated with managing
multiple accounts for multiple clients, although there is no assurance that such
policies and procedures will adequately address such conflicts.
80
MONTAG & CALDWELL, INC.
Montag & Caldwell is the Subadviser for Aston/Montag & Caldwell Growth
Fund, Aston/Montag & Caldwell Mid Cap Growth Fund, Aston/Montag & Caldwell
Balanced Fund, Aston Growth Fund and the equity portion of Aston Balanced Fund.
Montag & Caldwell is located at 3455 Peachtree Road NE, Suite 1200, Atlanta,
Georgia 30326. Montag & Caldwell is a wholly-owned indirect subsidiary of Fortis
Bank.
The table below shows other accounts for which the portfolio manager of
the Funds listed above is jointly and primarily responsible for the day-to-day
portfolio management as of October 31, 2008.
NUMBER OF ASSETS
ACCOUNTS MANAGED WITH
MANAGED WITH ADVISORY FEE
NUMBER OF TOTAL ASSETS ADVISORY FEE BASED ON
ACCOUNTS MANAGED (IN BASED ON PERFORMANCE
MANAGED MILLIONS) PERFORMANCE (IN MILLIONS)
--------- ------------ ------------ -------------
RONALD E. CANAKARIS, CFA(1)
Registered Investment Companies 1 $ 316 0 N/A
Other Pooled Investment Vehicles 0 N/A 0 N/A
Other Accounts 7 $ 946 0 N/A
M. SCOTT THOMPSON, CFA(1)
Registered Investment Companies 0 N/A 0 N/A
Other Pooled Investment Vehicles 0 N/A 0 N/A
Other Accounts 0 N/A 0 N/A
ANDREW W. JUNG, CFA(1)
Registered Investment Companies 0 N/A 0 N/A
Other Pooled Investment Vehicles 0 N/A 0 N/A
Other Accounts 0 N/A 0 N/A
----------
(1) Mr. Canakaris is responsible for the management of the Aston/Montag &
Caldwell Growth Fund, Aston Growth Fund, Aston/Montag & Caldwell Balanced
Fund and Aston Balanced Fund (Equity Portion); Messrs. Thompson and Jung
are jointly responsible for the management of the Aston/Montag & Caldwell
Mid Cap Growth Fund.
Compensation. Compensation for the portfolio managers includes an annual
fixed base salary plus incentive compensation, which may be significantly larger
than the base salary. Compensation is determined by the Executive Committee,
which is comprised of Montag & Caldwell's Chairman/President and Chief Executive
Officer, and is based on the success of the firm in achieving clients'
investment objectives and providing excellent client service. The portfolio
managers may also participate in a bonus arrangement that is partially based on
identifying new business prospects and obtaining new clients. Other components
of the portfolio managers' compensation include a 401(k) savings and profit
sharing plan. Incentive compensation is not based on performance or the value of
assets held in any Fund's portfolio.
Compensation is not directly related to the size, growth or fees received
from the management of any particular portfolios.
Material Conflicts of Interest. The portfolio managers for the Funds
manage multiple accounts following Montag & Caldwell's large cap growth, mid cap
growth and balanced strategies. The portfolio managers may place transactions on
behalf of other accounts that are contrary to investment decisions made on
behalf of a Fund, or make investment decisions that are similar to those made
for a Fund to the extent of client restrictions on accounts, both of which have
the potential to adversely affect the price paid or received by a Fund or the
size of the security position obtainable for a Fund. Some overlap in holdings
81
may exist between Montag & Caldwell's mid cap growth stratety and its large cap
growth strategy. Montag & Caldwell has adopted policies and procedures that it
believes address the conflicts associated with managing multiple accounts for
multiple clients, including policies and procedures reasonably designed to
allocate investment opportunities on a fair and equitable basis over time.
Compensation is not based on the performance of individual client accounts but
rather of the firm as a whole and the firm's Code of Ethics governs personal
trading by all employees and contains policies and procedures to ensure that
client interests are paramount.
TAMRO CAPITAL PARTNERS, LLC
TAMRO Capital Partners, LLC ("TAMRO") is the Subadviser for Aston/TAMRO
All Cap Fund and Aston/TAMRO Small Cap Fund. TAMRO is located at 1660 Duke
Street, Alexandria, Virginia 22314. TAMRO is majority-owned by the principals of
the firm.
The table below shows other accounts for which the portfolio manager of
the Funds listed above is jointly and primarily responsible for the day-to-day
portfolio management as of October 31, 2008.
NUMBER OF ASSETS
ACCOUNTS MANAGED WITH
MANAGED WITH ADVISORY FEE
NUMBER OF TOTAL ASSETS ADVISORY FEE BASED ON
ACCOUNTS MANAGED (IN BASED ON PERFORMANCE
MANAGED MILLIONS) PERFORMANCE (IN MILLIONS)
--------- ------------ ------------ ------------
PHILIP D. TASHO, CFA
Registered Investment Companies 2 $ 115.4 0 N/A
Other Pooled
Investment Vehicles 2 $ 19.2 0 N/A
Other Accounts 139 $ 264.1 0 N/A
Compensation. Compensation for the portfolio manager has three components:
base salary, performance incentive and profit sharing through equity ownership.
The performance incentive is based on an average of the investment performance
of the manager's two strategies (small cap and all cap) relative to peer
performance and the relevant benchmarks. A 25% weighting is applied to the
one-year return and a 75% weighting is applied to the three-year return. The
relevant benchmarks for the manager's two strategies are the Russell 2000 Index
and Russell 3000 Index, respectively. Full performance incentive is awarded for
top quartile performance; no incentive payment is given for below median
performance and incentive awards are interpolated for performance between the
median and the 25th percentile. As an equity owner in the firm, the portfolio
manager will receive his proportionate share of the profits of the firm. Firm
profitability is driven by assets under management which in turn is driven by
investment performance. TAMRO has identified a maximum amount of assets to be
managed in the small cap strategy.
Material Conflicts of Interest. The portfolio manager for the Funds
manages multiple accounts, including each respective Fund. The portfolio manager
makes decisions for each account based on the investment objectives, policies,
practices and other relevant investment considerations that the portfolio
manager believes are applicable to that account. Consequently, the portfolio
manager may purchase securities for one account and not another account, and the
performance of securities purchased for one account may vary from the
performance of securities purchased for other accounts. The portfolio manager
may place transactions on behalf of other accounts that are contrary to
investment decisions made on behalf of a Fund, or make investment decisions that
are similar to those made for a Fund, both of which have the potential to
adversely affect the price paid or received by a Fund or the size of the
security position obtainable for a Fund. TAMRO has adopted policies and
procedures that it believes address the
82
conflicts associated with managing multiple accounts for multiple clients,
although there is no assurance that such policies and procedures will adequately
address such conflicts.
VEREDUS ASSET MANAGEMENT LLC
Veredus is the Subadviser for Aston/Veredus Aggressive Growth Fund and
Aston/Veredus Select Growth Fund. Veredus is located at One Paragon Center, 6060
Dutchmans Lane, Louisville, Kentucky 40205. B. Anthony Weber is the majority
shareholder of the firm.
The table below shows other accounts for which the portfolio managers of
the Funds listed above are jointly and primarily responsible for the day-to-day
portfolio management as of January 31, 2009.
NUMBER OF ASSETS
ACCOUNTS MANAGED WITH
MANAGED WITH ADVISORY FEE
NUMBER OF TOTAL ASSETS ADVISORY FEE BASED ON
ACCOUNTS MANAGED (IN BASED ON PERFORMANCE
MANAGED MILLIONS) PERFORMANCE (IN MILLIONS)
--------- ------------ ------------ ------------
B. ANTHONY WEBER(1)
Registered Investment Companies 0 N/A 0 N/A
Other Pooled Investment Vehicles 1 $ 5 1 $5
Other Accounts 9 $ 297 0 N/A
MICHAEL E. JOHNSON CFA(1)
Registered Investment Companies 0 N/A 0 N/A
Other Pooled Investment Vehicles 1 $ 5 1 $5
Other Accounts 9 $ 297 0 N/A
CHARLES F. MERCER, JR. CFA(1)
Registered Investment Companies 0 N/A 0 N/A
Other Pooled Investment Vehicles 1 $ 5 1 $5
Other Accounts 9 $ 297 0 N/A
----------
(1) Messrs. Weber, Mercer and Johnson are jointly responsible for the
management of the Aston/Veredus Select Growth Fund and the Aston/Veredus
Aggressive Growth Fund.
Compensation. Compensation for the portfolio managers listed above
includes an annual base salary and a performance/ownership share. The
performance/ownership bonus, which typically represents a significant majority
of total compensation, is based on each portfolio manager's ownership share in
the firm's income. Veredus's income will be determined mainly by the investment
performance of accounts in the firm of which the Aston Funds are a significant
percentage. Compensation is not directly based on value of assets held in the
Fund's portfolio, and Veredus has already determined the maximum amount of
assets that can be managed in each investment style and communicated such
amounts to the Funds' Trustees.
Material Conflicts of Interest. The portfolio managers for each Fund
manage multiple accounts, including their respective Fund and a hedge fund from
which Veredus receives a performance based fee and in which members of Veredus
have an interest. The portfolio managers make decisions for each account based
on the investment objectives, policies, practices and other relevant investment
considerations that the portfolio managers believe are applicable to that
account. Consequently, the portfolio managers may purchase securities for one
account and not another account, and the performance of securities purchased for
one account may vary from the performance of securities purchased for other
83
accounts. A portfolio manager may place transactions on behalf of other accounts
that are contrary to investment decisions made on behalf of a Fund, or make
investment decisions that are similar to those made for a Fund, both of which
have the potential to adversely affect the price paid or received by a Fund or
the size of the security position obtainable for a Fund. Veredus has adopted
policies and procedures that it believes address the conflicts associated with
managing multiple accounts for multiple clients, although there is no assurance
that such policies and procedures will adequately address such conflicts.
RIVER ROAD ASSET MANAGEMENT, LLC
River Road is the Subadviser to Aston/River Road Dividend All Cap Value
Fund, Aston/River Road Small Cap Value Fund and Aston/River Road Small-Mid Cap
Fund. River Road is located at Meidinger Tower, Suite 1600, 462 South Fourth
Street, Louisville, Kentucky 40202, and is a wholly-owned subsidiary of River
Road Partners, LLC ("RRP"). RRP is wholly-owned by employees of River Road.
The table below shows other accounts for which the portfolio managers of
the Funds listed above are jointly and primarily responsible for the day-to-day
portfolio management as of October 31, 2008.
NUMBER OF
ACCOUNTS ASSETS
MANAGED WITH MANAGED WITH
NUMBER OF TOTAL ASSETS ADVISORY FEE ADVISORY FEE
ACCOUNTS MANAGED (IN BASED ON BASED ON
MANAGED MILLIONS) PERFORMANCE PERFORMANCE
-------- ------------ ------------ ------------
JAMES C. SHIRCLIFF, CFA(1)
Registered Investment Companies 1 $ 211 0 N/A
Other Pooled Investment Vehicles 8 $ 1,291 0 N/A
Other Accounts 93 $ 827 0 N/A
HENRY SANDERS, CFA(1)
Registered Investment Companies 1 $ 211 0 N/A
Other Pooled Investment Vehicles 8 $ 1,291 0 N/A
Other Accounts 93 $ 827 0 N/A
THOMAS S. FORSHA, CFA(1)
Registered Investment Companies 0 N/A 0 N/A
Other Pooled Investment Vehicles 5 $ 1,213 0 N/A
Other Accounts 5 $ 19 0 N/A
R. ANDREW BECK, CFA(1)
Registered Investment Companies 1 $ 211 0 N/A
Other Pooled Investment Vehicles 3 $ 78 0 N/A
Other Accounts 93 $ 808 0 N/A
----------
(1) Messrs. Shircliff, Sanders and Forsha are jointly responsible for the
management of the Aston/River Road Dividend All Cap Value Fund; Messrs.
Shircliff, Sanders and Beck are jointly responsible for the management of
the Aston/River Road Small Cap Value Fund and Aston/River Road Small-Mid
Cap Fund.
Compensation. Compensation for each portfolio manager listed above
includes an annual fixed base salary plus potential incentive compensation up to
a pre-determined fixed percentage rate of base salary. Incentive compensation is
based on multiple factors, including risk-adjusted 3- and 5-year performance for
the strategy composite, versus peer group and benchmark indices. Composite
performance criteria are not applied independently for the Fund, but are assumed
to be encompassed among the like managed accounts in the strategy composite. The
relevant index for Aston/River Road Small Cap Value Fund is the Russell 2000
Value; for Aston/River Road Dynamic Equity Income Fund,
84
the Russell 3000 Value. The Aston/River Road Small-Mid Cap Fund's relevant index
is the Russell 2500 Value. (In the absence of at least a three-year performance
record, a shorter-period may be used.) Additionally, the portfolio managers each
own a significant equity interest in River Road and, as such, participate in
overall firm profits.
Material Conflicts of Interest. The portfolio managers for each Fund
manage multiple accounts, including their respective Fund. The portfolio
managers make decisions for each account based on the investment objectives,
policies, practices and other relevant investment considerations that the
portfolio manager believes are applicable to that account. Consequently, the
portfolio managers may purchase securities for one account and not another
account, and the performance of securities purchased for one account may vary
from the performance of securities purchased for other accounts. A portfolio
manager may place transactions on behalf of other accounts that are contrary to
investment decisions made on behalf of a Fund, or make investment decisions that
are similar to those made for a Fund, both of which have the potential to
adversely affect the price paid or received by a Fund or the size of the
security position obtainable for a Fund. River Road has adopted policies and
procedures that it believes address the conflicts associated with managing
multiple accounts for multiple clients, although there is no assurance that such
policies and procedures will adequately address such conflicts.
MFS INSTITUTIONAL ADVISORS INC.
Massachusetts Financial Services Company (MFS) is the Subadviser for Aston
Value Fund. MFS is the oldest U.S. mutual fund organization. MFS and its
predecessor organizations have managed money since 1924 and founded the first
mutual fund in the United States. MFS is a direct subsidiary of Sun Life of
Canada (U.S.) Financial Services Holdings, Inc., which in turn is an indirect
majority-owned subsidiary of Sun Life Financial Inc. (a diversified financial
services organization). The principal address of MFS is 500 Boylston Street,
Boston, Massachusetts 02116. Net assets under management of the MFS organization
were approximately $161 billion as of September 30, 2008.
The table below shows other accounts for which the portfolio managers of
the Fund are jointly and primarily responsible for the day-to-day portfolio
management as of October 31, 2008.
85
NUMBER OF
ACCOUNTS ASSETS
MANAGED WITH MANAGED WITH
NUMBER OF TOTAL ASSETS ADVISORY FEE ADVISORY FEE
ACCOUNTS MANAGED (IN BASED ON BASED ON
MANAGED MILLIONS) PERFORMANCE PERFORMANCE
-------- ----------- ------------ ------------
STEVEN R. GORHAM, CFA
Registered Investment Companies 20 $ 25,965 0 N/A
Other Pooled Investment Vehicles 4 $ 1,457 0 N/A
Other Accounts 27 $ 6,783 0 N/A
NEVIN P. CHITKARA
Registered Investment Companies 20 $ 25,965 0 N/A
Other Pooled Investment Vehicles 4 $ 1,457 0 N/A
Other Accounts 27 $ 6,783 0 N/A
BROOKS A. TAYLOR
Registered Investment Companies 12 $ 14,637 0 N/A
Other Pooled Investment Vehicles 0 N/A 0 N/A
Other Accounts 0 N/A 0 N/A
JOHNATHAN W. SAGE, CFA
Registered Investment Companies 8 $ 1,599 0 N/A
Other Pooled Investment Vehicles 0 N/A 0 N/A
Other Accounts 16 $ 5,072 0 N/A
Compensation. Portfolio manager total cash compensation is a combination
of base salary and performance bonus:
Base Salary -- Base salary represents a smaller percentage of portfolio
manager total cash compensation (generally below 10%) than performance bonus.
Performance Bonus -- Generally, the performance bonus represents a majority of
portfolio manager total cash compensation.
The performance bonus is based on a combination of quantitative and
qualitative factors, with more weight given to the former (generally over 60%)
and less weight given to the latter.
The quantitative portion is based on the pre-tax performance of assets
managed by the portfolio manager over one-, three-, and five-year periods
relative to peer group universes and/or indices ("benchmarks").
The qualitative portion is based on the results of an annual internal peer
review process (conducted by other portfolio managers, analysts, and traders)
and management's assessment of overall portfolio manager contributions to
investor relations and the investment process (distinct from fund and other
account performance).
Portfolio managers also typically benefit from the opportunity to
participate in the MFS Equity Plan. Equity interests and/or options to acquire
equity interests in MFS or its parent company are awarded by management, on a
discretionary basis, taking into account tenure at MFS, contribution to the
investment process, and other factors.
86
Finally, portfolio managers are provided with a benefits package including
a defined contribution plan, health coverage and other insurance, which are
available to other employees of MFS on substantially similar terms. The
percentage such benefits represent of any portfolio manager's compensation
depends upon the length of the individual's tenure at MFS and salary level, as
well as other factors.
Material Conflicts of Interest. MFS seeks to identify potential conflicts
of interest resulting from a portfolio manager's management of both the Fund and
other accounts and has adopted policies and procedures designed to address such
potential conflicts.
The management of multiple funds and accounts (including proprietary
accounts) may give rise to potential conflicts of interest if the funds and
accounts have different objectives and strategies, benchmarks, time horizons and
fees as a portfolio manager must allocate his or her time and investment ideas
across multiple funds and accounts. In certain instances there are securities
which are suitable for the Fund's portfolio as well as for accounts of the
Subadviser or its subsidiaries with similar investment objectives. A Fund's
trade allocation policies may give rise to conflicts of interest if the Fund's
orders do not get fully executed or are delayed in getting executed due to being
aggregated with those of other accounts of the Subadviser or its subsidiaries. A
portfolio manager may execute transactions for another fund or account that may
adversely impact the value of the Fund's investments. Investments selected for
funds or accounts other than the Fund may outperform investments selected for
the Fund.
When two or more clients are simultaneously engaged in the purchase or
sale of the same security, the securities are allocated among clients in a
manner believed by MFS to be fair and equitable to each. It is recognized that
in some cases this system could have a detrimental effect on the price or volume
of the security as far as the Fund is concerned. In most cases, however, MFS
believes that the Fund's ability to participate in volume transactions will
produce better executions for the Fund.
MFS and/or a portfolio manager may have a financial incentive to allocate
favorable or limited opportunity investments or structure the timing of
investments to favor accounts other than the Fund -- for instance, those that
pay a higher advisory fee.
OPTIMUM INVESTMENT ADVISORS, LLC
Optimum is the Subadviser for Aston/Optimum Large Cap Opportunity Fund and
Aston/Optimum Mid Cap Fund. Optimum is an independent registered investment
adviser founded in 1990 with offices at 100 South Wacker Drive, Chicago,
Illinois 60606 and is majority-owned by Optimum Investment Group, LLC.
87
The table below shows other accounts for which the portfolio managers of
the Funds listed above is jointly and primarily responsible for the day-to-day
portfolio management as of January 31, 2009.
NUMBER OF
ACCOUNTS MANAGED ASSETS MANAGED
NUMBER OF TOTAL ASSETS WITH ADVISORY FEE WITH ADVISORY FEE
ACCOUNTS MANAGED BASED ON BASED ON
MANAGED (IN MILLIONS) PERFORMANCE PERFORMANCE
--------- ------------ ---------------- ------------------
THYRA ZERHUSEN(1)
Registered Investment Companies 1 $ 89.9 0 N/A
Other Pooled Investment Vehicles 0 N/A 0 N/A
Other Accounts 9 $ 168.4 0 N/A
ANDREW J. GOODWIN(1)
Registered Investment Companies 0 N/A 0 N/A
Other Pooled Investment Vehicles 0 N/A 0 N/A
Other Accounts 138 $ 161.8 0 N/A
KEITH F. PINSONEAULT, CFA(1)
Registered Investment Companies 0 N/A 0 N/A
Other Pooled Investment Vehicles 0 N/A 0 N/A
Other Accounts 253 $ 91.1 0 N/A
MARIE LORDEN(1)
Registered Investment Companies 1 $ 89.9 0 N/A
Other Pooled Investment Vehicles 0 N/A 0 N/A
Other Accounts 9 $ 168.4 0 N/A
MARY PIERSON(1)
Registered Investment Companies 1 $ 89.9 0 N/A
Other Pooled Investment Vehicles 0 N/A 0 N/A
Other Accounts 9 $ 168.4 0 N/A
----------
(1) Mses. Zerhusen, Lorden and Pierson are jointly responsible for the
management of Aston/Optimum Mid Cap Fund and Messrs. Goodwin and
Pinsoneault are jointly responsible for the management of Aston/Optimum
Large Cap Opportunity Fund.
Compensation.
Aston/Optimum Large Cap Opportunity Fund - Compensation for each portfolio
manager includes an annual fixed base salary. In addition, the portfolio
managers each own an equity interest in Optimum and, as such, participate in
overall firm profits. Compensation is neither based on the value of assets held
in the Fund's portfolio nor related to the performance of the Fund.
Aston/Optimum Mid Cap Fund -- Compensation for the portfolio manager
includes an annual fixed base salary, a percentage of revenue derived from the
Mid Cap product plus variable incentive compensation that is determined by the
relative pre-tax performance of the Fund as compared to the Morningstar Mid Cap
Category at year-end (for the 1 and 3 year periods).
88
Material Conflicts of Interest. The Portfolio Managers manage other
accounts as well as their respective Fund. The Portfolio Managers make
investment selections and account transactions consistent with each account's
objective. Such actions may be taken for one account and not another and may
result in varying performance among clients. Optimum has in place policies and
procedures designed to prevent conflicts among multiple accounts, although there
can be no assurance that conflicts may not occur.
TAPLIN, CANIDA & HABACHT, LLC
As of December 1, 2006, TCH is the Subadviser for Aston/TCH Fixed Income
Fund and the fixed income portion of Aston Balanced Fund. TCH is a registered
investment adviser founded in 1985 with offices at 1001 Brickell Bay Drive,
Suite 2100, Miami, Florida 33131. TCH is a majority-owned subsidiary of Marshall
& Ilsley Corporation.
The table below shows other accounts for which the portfolio managers of
the Funds listed above are jointly and primarily responsible for the day-to-day
portfolio management as of October 31, 2008.
NUMBER OF
ACCOUNTS ASSETS
MANAGED WITH MANAGED WITH
NUMBER OF TOTAL ASSETS ADVISORY FEE ADVISORY FEE
ACCOUNTS MANAGED (IN BASED ON BASED ON
MANAGED MILLIONS) PERFORMANCE PERFORMANCE
-------- ------------ ------------ ------------
TERE ALVAREZ CANIDA(1)
Registered Investment Companies 0 N/A 0 N/A
Other Pooled Investment Vehicles 0 N/A 0 N/A
Other Accounts 79 $7.0 0 N/A
ALAN M. HABACHT(1)
Registered Investment Companies 0 N/A 0 N/A
Other Pooled
Investment Vehicles 0 N/A 0 N/A
Other Accounts 79 $7.0 0 N/A
WILLIAM J. CANIDA(1)
Registered Investment Companies 0 N/A 0 N/A
Other Pooled Investment Vehicles 0 N/A 0 N/A
Other Accounts 79 $7.0 0 N/A
----------
(1) Ms. Canida and Messrs. Habacht and Canida are jointly responsible for the
management of Aston/TCH Fixed Income Fund and the fixed income portion of
Aston Balanced Fund. All accounts at TCH are managed on a team basis.
Compensation. Compensation for the portfolio managers listed above
includes an annual base salary with an additional bonus based on the profits of
the company. The portfolio managers' compensation is not based on the
performance of the individual Funds. Compensation is not directly based on value
of assets held in the Funds' portfolios.
Material Conflicts of Interest. TCH furnishes investment management and
advisory services to others, and TCH shall be at all times free, in its
discretion, to make recommendations to others which may be the same as, or may
be different from those made to the Funds. It is TCH's policy to allocate,
within its reasonable discretion, investment opportunities to the Funds over a
period of time on a fair and equitable basis relative to TCH's other accounts.
TCH, its affiliates, and any officer, director, stockholder, employee or any
member of their families may or may not have an interest in the securities whose
purchase and sale TCH may recommend, and that such recommendations with respect
to securities of the same kind may be the same as or different from the action
which TCH, or
89
any of its affiliates, or any partner, officer, director, stockholder, employee,
or any member of their families, or other investors may take with respect
hereto; provided, however, that TCH shall refrain from rendering any advice or
services concerning securities of companies of which any of TCH's, or affiliates
of TCH's partners, officers, directors, or employees has any economic interest,
unless TCH fully discloses such conflict to the client and is authorized upon
prior written approval by the client notwithstanding such disclosure.
TCH may aggregate certain trades done on the behalf of the client with
trades in the same security on the same day done on behalf of other clients of
TCH that utilize the same broker as the client. The purpose of such aggregation
will be to obtain for the client, where possible, a better execution price(s)
than would be the case if the client's transaction were not aggregated with the
trades of other clients.
NEPTUNE INVESTMENT MANAGEMENT LIMITED
Neptune is the Subadviser for Aston/Neptune International Fund. Neptune is
located at 1 Hammersmith Grove, London W6 0NB. Robin Geffen is the majority
shareholder of the firm.
The table below shows other accounts for which the portfolio manager of
the Fund is jointly and primarily responsible for the day-to-day portfolio
management as of October 31, 2008.
NUMBER OF ASSETS
ACCOUNTS MANAGED WITH
MANAGED WITH ADVISORY FEE
NUMBER OF TOTAL ASSETS ADVISORY FEE BASED ON
ACCOUNTS MANAGED (IN BASED ON PERFORMANCE
MANAGED MILLIONS) PERFORMANCE (IN MILLIONS)
--------- ----------- ------------ -------------
ROBIN GEFFEN
Registered Investment Companies 0 N/A 0 N/A
Other Pooled Investment Vehicles 10 $ 2.7 1 $0.6
Other Accounts 6 $ 0.3 0 N/A
Compensation. Compensation for the portfolio manager includes salary and
discretionary annual bonuses. The portfolio manager also participates in
standard company benefits including medical insurance, life insurance and
pension contributions. The portfolio manager's incentive compensation is based
on the performance of funds managed, the profitability of funds managed and the
portfolio manager's other contributions to Neptune. Compensation due to the
performance of the Fund is determined based on the Fund's performance relative
to its peer group, weighted according to the quartile in which the Fund is
ranked for the calendar year. The Fund's performance is reviewed over 1-, 3-,
and 5-years, with a greater weighting on performance within one year. Because a
portion of the incentive compensation is based on the profitability of the Fund,
the portfolio manager's compensation is partially based upon the value of assets
held in the Fund. The portfolio manager also shares in the pre-tax profits of
Neptune.
Material Conflicts of Interest. The portfolio manager for the Fund manages
multiple accounts, including the Fund. The portfolio manager makes decision for
each account based on the investment objectives, policies, practices and other
relevant investment considerations that the portfolio manager believes are
applicable to that account. The company has adopted various procedures to manage
potential conflicts including disclosure and consent and adopting procedures
designed to ensure fair treatment of all clients. The company may also manage
potential conflicts of interest by establishing and maintaining a Chinese wall.
90
BARING INTERNATIONAL INVESTMENT LIMITED
Barings serves as the Subadviser with respect to the Aston/Barings
International Fund. Barings is a subsidiary of Baring Asset Management Limited
and is located at 155 Bishopsgate, London, EC2M 3XY, United Kingdom.
The table below shows other accounts for which the portfolio manager of
the Fund is jointly and primarily responsible for the day-to-day portfolio
management as of October 31, 2008.
NUMBER OF
ACCOUNTS ASSETS
MANAGED WITH MANAGED WITH
NUMBER OF TOTAL ASSETS ADVISORY FEE ADVISORY FEE
ACCOUNTS MANAGED (IN BASED ON BASED ON
MANAGED MILLIONS) PERFORMANCE PERFORMANCE
--------- ------------ ------------ ------------
DAVID BERTOCCHI
Registered Investment Companies 0 N/A 0 N/A
Other Pooled Investment Vehicles 5 $ 414.5 0 N/A
Other Accounts 17 $ 1,221.5 0 N/A
Compensation. The portfolio manager receives a base salary, an annual
bonus and an equity-based long-term incentive award. The compensation structure
emphasizes successful firm outcomes and is oriented to make client results more
important than title or length of tenure in determining total compensation.
Analysis of the one and three year investment performance against the client's
benchmark (MSCI EAFE Index) determines at least 2/3 of the annual bonus, with
the 3-year performance accounting for approximately 70% of that amount and the
1-year performance accounting for approximately 30% of that amount. The
remainder of the annual bonus is determined by a subjective assessment of the
portfolio manger's investment insights and client service. The equity-based
long-term incentive award is calculated by a formula linked to firm revenues,
profits, and assets under management.
Material Conflicts of Interest. The portfolio managers for the Fund manage
multiple accounts, including the Fund. The portfolio manager makes decisions for
each account based on the investment objectives, policies, practices and other
relevant investment considerations that the portfolio managers believe are
applicable to that account. Consequently, the portfolio manager may purchase
securities for one account and not another account, and the performance of
securities purchased for one account may vary from the performance of securities
purchased for other accounts. The portfolio manager may place transactions on
behalf of other accounts that are contrary to investment decisions made on
behalf of the Fund, or make investment decisions that are similar to those made
for the
91
Fund, both of which have the potential to adversely affect the price paid or
received by the Fund or the size of the security position obtainable for the
Fund.
It is possible that an investment opportunity may be suitable for both the
Fund and other accounts managed by the portfolio manager, but may not be
available in sufficient quantities for both the Fund and the other accounts to
participate fully. Similarly, there may be a limited opportunity to sell an
investment held by the Fund and another account. Barings has procedures designed
to ensure fair treatment of clients in the allocation of trades. Barings has
adopted policies and procedures that it believes address the conflicts
associated with managing multiple accounts for multiple clients, although there
is no assurance that such policies and procedures will adequately address such
conflicts.
CARDINAL CAPITAL MANAGEMENT, L.L.C.
Cardinal serves as the Subadviser with respect to the Aston/Cardinal Mid
Cap Value Fund. Cardinal is owned by senior investment professionals and
controlled by Amy K. Minella. Cardinal is located at One Greenwich Office Park,
Greenwich, Connecticut 06831.
The table below shows other accounts for which the portfolio managers of
the Fund are jointly and primarily responsible for the day-to-day portfolio
management as of October 31, 2008.
NUMBER OF
ACCOUNTS ASSETS
MANAGED WITH MANAGED WITH
NUMBER OF TOTAL ASSETS ADVISORY FEE ADVISORY FEE
ACCOUNTS MANAGED (IN BASED ON BASED ON
MANAGED MILLIONS) PERFORMANCE PERFORMANCE
-------- ------------ ------------ ------------
AMY K. MINELLA
Registered Investment Companies 1 $ 76.4 0 N/A
Other Pooled Investment Vehicles 2 $ 40.9 0 N/A
Other Accounts 82 $ 819.6 0 N/A
EUGENE FOX, III
Registered Investment Companies 1 $ 76.4 0 N/A
Other Pooled Investment Vehicles 2 $ 40.9 0 N/A
Other Accounts 82 $ 819.6 0 N/A
ROBERT B. KIRKPATRICK
Registered Investment Companies 1 $ 76.4 0 N/A
Other Pooled Investment Vehicles 2 $ 40.9 0 N/A
Other Accounts 82 $ 819.6 0 N/A
Compensation. The portfolio managers receive a base salary, an annual
bonus and partnership distributions. The annual bonus is based on the net
profits of the firm. Portfolio managers also participate in standard company
benefits, including a 401(k) plan.
Material Conflicts of Interest. The portfolio managers for the Fund manage
multiple accounts, including the Fund. The portfolio managers make decisions for
each account based on the investment objectives, policies, practices and other
relevant investment considerations that the portfolio managers believe are
applicable to that account. Consequently, the portfolio managers may purchase
securities for one account and not another account, and the performance of
securities purchased for one account may vary from the performance of securities
purchased for other accounts. A portfolio manager may place transactions on
behalf of other accounts that are contrary to investment decisions made on
behalf of the Fund, or make investment decisions that are similar to those made
for the Fund, both of which have the
92
potential to adversely affect the price paid or received by the Fund or the size
of the security position obtainable for the Fund. Cardinal has adopted policies
and procedures that it believes address the conflicts associated with managing
multiple accounts for multiple clients, although there is no assurance that such
policies and procedures will adequately address such conflicts.
SMART PORTFOLIOS, LLC
Smart serves as the Subadviser to the Aston/Smart Portfolios Fund. Smart
was formed in April, 2002 as Asset Labs, LLC. The firm was registered as an
investment adviser in 2004 as Star Investment Advisors, LLC and changed its name
to Smart Portfolios LLC in 2005. The firm is wholly owned by Shield Holdings,
LLC. Shield Holdings, LLC is owned by Bryce James. Smart is located at 17865
Ballinger Way NE, Seattle, Washington 98155.
The table below shows other accounts for which the portfolio managers of
the Fund are jointly and primarily responsible for the day-to-day portfolio
management as of October 31, 2008.
NUMBER OF
ACCOUNTS ASSETS
MANAGED WITH MANAGED WITH
NUMBER OF TOTAL ASSETS ADVISORY FEE ADVISORY FEE
ACCOUNTS MANAGED (IN BASED ON BASED ON
MANAGED MILLIONS) PERFORMANCE PERFORMANCE
--------- ----------- ------------ ------------
BRYCE JAMES
Registered Investment Companies 0 N/A 0 N/A
Other Pooled Investment Vehicles 0 N/A 0 N/A
Other Accounts 108 $77.2 108 $77.2
SHAWN BIRD
Registered Investment Companies 0 N/A 0 N/A
Other Pooled Investment Vehicles 0 N/A 0 N/A
Other Accounts 108 $77.2 108 $77.2
JOHN ROSENTHAL
Registered Investment Companies 0 N/A 0 N/A
Other Pooled Investment Vehicles 0 N/A 0 N/A
Other Accounts 108 $77.2 108 $77.2
Compensation. The portfolio managers receive an annual base salary,
discretionary bonus and a stock award incentive plan. A portfolio manager's
annual base salary is based on Smart's evaluation of the market for such
portfolio manager's service to the company and the amount of that portfolio
manager's responsibility. A portfolio manager's discretionary bonus is
determined by the president and majority owner of Smart and is primarily based
on the achievement or advancement of the company's objectives and the efforts of
that portfolio manager deemed to be above normal job responsibilities or higher
than that normally expected of that portfolio manager. The discretionary bonus
may be in the form of cash, deferred profit interests or company shares. Each
portfolio manager also receives stock award incentives that are vested evenly
over a period of years and redeemable at termination of employment. The stock
award incentives are determined at the time of hiring and based on a portfolio
manager's level of responsibility. Additionally, a portfolio manager may receive
a bonus on new business generated. Mr. James also has an equity stake in Shield
Holdings, LLC and Smart, thus he will benefit from increases in Smart's income
Material Conflicts of Interest. Securities positions between the Fund and
the Subadviser's large cap growth equity strategy will overlap by approximately
50%. In addition, all separately managed account portfolios managed in the
enhanced equity income strategy will hold the same positions as the
93
Fund. The Subadviser encounters similar conflicts within and among its other
strategies and the separately managed accounts in those strategies. Therefore,
the Subadviser employs a trading rotation system for executing orders which is
designed to equitably distribute purchase and sale opportunities among the
Subadviser's clients.
MB INVESTMENT PARTNERS, INC.
MB Investment Partners, Inc. serves as the Subadviser to the Aston/MB
Enhanced Equity Income Fund. MB is solely owned by MB Investment Partners and
Associates, LLC. MB is located at 825 Third Avenue, 31st Floor, New York, New
York 10022.
The table below shows other accounts for which the portfolio managers of
the Fund are jointly
and primarily responsible for the day-to-day portfolio management as of
October 31, 2008.
NUMBER OF
ACCOUNTS ASSETS
MANAGED WITH MANAGED WITH
NUMBER OF TOTAL ASSETS ADVISORY FEE ADVISORY FEE
ACCOUNTS MANAGED (IN BASED ON BASED ON
MANAGED MILLIONS) PERFORMANCE PERFORMANCE
--------- ----------- ------------ ------------
RONALD A. ALTMAN
Registered Investment Companies 0 N/A 0 N/A
Other Pooled Investment Vehicles 0 N/A 0 N/A
Other Accounts 19 $10.46 0 N/A
PAUL F. PFEIFFER
Registered Investment Companies 0 N/A 0 N/A
Other Pooled Investment Vehicles 0 N/A 0 N/A
Other Accounts 67 $124.77 0 N/A
Compensation. Portfolio manager compensation includes a base salary,
performance bonus and benefits package. Base salaries and bonuses are determined
by MB's compensation committee. Each portfolio manager's compensation is based
on contributions to the firm with the profitability of MB determining the
aggregate amount available for bonuses. Each portfolio manager is also a member
of MB Investment Partners and Associates, LLC and receives a portion of his
bonus compensation through share ownership in that entity.
Material Conflicts of Interest. The portfolio managers for the Fund manage
multiple accounts, including the Fund. The portfolio managers make decisions for
each account based on the investment
objectives, policies, practices and other relevant investment
considerations that the portfolio managers believe are applicable to that
account. Consequently, the portfolio managers may purchase securities for one
account and not another account, and the performance of securities purchased for
one account may vary from the performance of securities purchased for other
accounts. The portfolio managers may place transactions on behalf of other
accounts that are contrary to investment decisions made on behalf of the Fund,
or make investment decisions that are similar to those made for the Fund, both
of which have the potential to adversely affect the price paid or received by
the Fund or the size of the security position obtainable for the Fund. MB has
adopted policies and procedures that it believes address the conflicts
associated with managing multiple accounts for multiple clients, although there
is no assurance that such policies and procedures will adequately address such
conflicts.
94
NEW CENTURY CAPITAL MANAGEMENT, LLC
New Century serves as the Subadviser to Aston/New Century Absolute Return
ETF Fund. New Century is wholly owned and controlled by Jim R. Porter. New
Century is located at 36 South Washington Street, Hinsdale, Illinois 60521.
The table below shows other accounts for which the portfolio manager of
the Fund is jointly and primarily responsible for the day-to-day portfolio
management as of October 31, 2008.
NUMBER OF
ACCOUNTS ASSETS
MANAGED WITH MANAGED WITH
NUMBER OF TOTAL ASSETS ADVISORY FEE ADVISORY FEE
ACCOUNTS MANAGED (IN BASED ON BASED ON
MANAGED MILLIONS) PERFORMANCE PERFORMANCE
--------- ------------ ------------ ------------
JIM R. PORTER
Registered Investment Companies. 0 N/A 0 N/A
Other Pooled Investment Vehicles 1 $ 2.7 1 $ 2.7
Other Accounts 32 $ 19.8 4 $ 1.9
Compensation. The portfolio manager receives a fixed annual salary and
bonus opportunities that are based on the overall performance of New Century.
The portfolio manager also has an equity stake in New Century, thus benefits
from increases in the net income of New Century.
Material Conflicts of Interest. The portfolio manager may manage account
for multiple clients. The portfolio manager makes investment decisions for each
account based on the investment objectives and policies and other relevant
investment considerations applicable to that portfolio. The management of
multiple accounts may result in the portfolio manager devoting unequal time and
attention to the management of each account. Even where multiple accounts are
managed by the portfolio manager within the same investment discipline, however,
the Subadviser may take action with respect to one account that may differ from
the timing or nature of action taken with respect to another account.
Accordingly, the performance of each account managed by a portfolio manager will
vary.
The Subadviser had adopted and implemented policies and procedures,
including brokerage and trade allocation policies and procedures, which it
believes address the potential conflicts associated with managing multiple
accounts for multiple clients.
Ownership of Securities. The table below shows the dollar range of equity
securities in each Fund beneficially owned by the Fund's portfolio manager(s) as
of October 31, 2008.
95
DOLLAR RANGE OF
FUND PORTFOLIO MANAGER SECURITIES IN THE FUND
-------------------------------------------- ---------------------- -----------------------
Aston/Montag & Caldwell Growth Fund Ronald Canakaris Over $1,000,000
Aston/Veredus Select Growth Fund B. Anthony Weber $ 100,001-$500,000
Charles F. Mercer, $ 100,001-$500,000
Jr. Michael E. Johnson $ 0
Aston Growth Fund Ronald Canakaris $ 0
Aston/Optimum Large Cap Opportunity Fund Andrew J. Goodwin $ 50,001-$100,000
Keith F. Pinsoneault $ 50,001-$100,000
Aston Value Fund Steve Gorham $ 0
Nevin P. Chitkara $ 0
Brooks A. Taylor $ 0
Jonathan W. Sage $ 0
Aston/TAMRO All Cap Fund Philip Tasho $ 500,001-$1,000,000
Aston/River Road Dividend All Cap Value Fund James C. Shircliff $ 100,001-500,000
Henry Sanders $ 100,001-500,000
Thomas S. Forsha $ 10,001-50,000
Aston/Optimum Mid Cap Fund Thyra Zerhusen Over $1,000,000
Marie Lorden $ 1-$10,000
Mary Pierson $ 1-$10,000
Aston/Montag & Caldwell Mid Cap Growth Fund M. Scott Thompson $ 100,001-$500,000
Andrew W. Jung $ 10,001-$50,000
Aston/Cardinal Mid Cap Value Fund Amy K. Minella $ 500,001-$1,000,000
Eugene Fox, III $ 0
Robert B. Kirkpatrick $ 0
Aston/River Road Small-Mid Cap Fund James. C. Shircliff $ 100,001-500,000
R. Andrew Beck $ 0
Henry Sanders 4 $100,001-500,000
Aston/Veredus Aggressive Growth Fund B. Anthony Weber $ 100,001-$500,000
Charles F. Mercer, Jr. $ 100,001-$500,000
Michael E. Johnson $ 100,001-$500,000
Aston/TAMRO Small Cap Fund Philip Tasho $ 100,001-$500,000
Aston/River Road Small Cap Value Fund James C. Shircliff $ 100,001-500,000
Henry Sanders $ 100,001-500,000
R. Andrew Beck $ 0
Aston/Barings International Fund David Bertocchi $ 0
Aston/Neptune International Fund Robin Geffen $ 0
Aston/Fortis Global Real Estate Fund Joseph Pavnica $ 0
Menno Sloterdijk $ 0
Matthew Hoult $ 0
Aston/Smart Portfolios Fund Bryce James $ 0
Shawn Bird $ 0
John Rosenthal $ 0
Aston/New Century Absolute Return ETF Fund Jim R. Porter $ 50,001-$100,000
Aston/MB Enhanced Equity Income Fund Ronald A. Altman $ 100,001-500,000
Paul F. Pfeiffer $ 0
Aston/Fortis Real Estate Fund Joseph Pavnica $ 0
James Hardman
Aston/Montag & Caldwell Balanced Fund Ronald Canakaris $ 0
Aston Balanced Fund Ronald Canakaris $ 0
Tere Alvarez Canida $ 0
Alan M. Habacht $ 0
William J. Canida $ 0
Aston/TCH Fixed Income Fund Tere Alvarez Canida $ 0
Alan M. Habacht $ 0
William J. Canida $ 0
96
For the fiscal years ended October 31, 2008 and October 31, 2007, Aston Funds
paid the following sub-advisory fees to each Fund's Subadviser:
NET NET
FUND FEES PAID-2008 FEES PAID-2007
----------------------------------------------- --------------- ---------------
Aston/Montag & Caldwell Growth Fund(1) $ 5,758,690 $ 5,602,788
Aston/Veredus Select Growth Fund(1) 337,094 101,192
Aston Growth Fund(1) 862,496 1,714,803
Aston/Optimum Large Cap Opportunity Fund(2) -* -*
Aston Value Fund 1,075,063 1,254,831
Aston/TAMRO All Cap Fund(1) -* 10,391
Aston/River Road Dividend All Cap Value Fund(1) 140,896 76,229
Aston/Optimum Mid Cap Fund 2,051,888 1,732,371
Aston/Montag & Caldwell Mid Cap Growth Fund(3) -* N/A
Aston/Cardinal Mid Cap Value Fund(3) -* N/A
Aston/River Road Small-Mid Cap Fund(4) 365,484 -*
Aston/Veredus Aggressive Growth Fund(1) 598,914 1,179,484
Aston/TAMRO Small Cap Fund(1) 1,464,391 1,263,758
Aston/River Road Small Cap Value Fund(1) 1,213,390 1,288,151
Aston/Barings International Fund(3) -* N/A
Aston/Neptune International Fund(5) -* -*
Aston/Fortis Global Real Estate Fund(5) 17,977 3,788
Aston/Smart Portfolios Fund(6) -* N/A
Aston/New Century Absolute Return ETF Fund(7) -* N/A
Aston/MB Enhanced Equity Income Fund(8) -* N/A
Aston/Fortis Real Estate Fund(1) 193,396 435,211
Aston/Montag & Caldwell Balanced Fund(1) 32,041 23,547
Aston Balanced Fund (Equity Portion)(9) 39,954 51,119
Aston Balanced Fund (Fixed Income Portion)(1) 21,839 31,096
Aston/TCH Fixed Income Fund(1) 15,984 66,810
----------
* The calculation of the sub-advisory fee for each Fund is based upon the
formula described on pages 75-76. The formula resulted in a negative
amount and therefore no sub-advisory fee was payable for the fiscal year.
(1) Prior to December 1, 2006, each subadviser served as the investment
adviser to the Fund. With respect to FIM, its predecessor served as
investment advisor to the Fund.
(2) Aston/Optimum Large Cap Opportunity Fund commenced operations on December
28, 2006.
(3) Aston/Barings International Fund, Aston/Cardinal Mid Cap Value Fund and
Aston/Montag & Caldwell Mid Cap Growth Fund commenced operations on
November 2, 2007.
(4) Aston/River Road Small-Mid Cap Fund commenced operations on March 28,
2007.
(5) Aston/Fortis Global Real Estate Fund and Aston/Neptune International Fund
commenced operations on August 3, 2007 and August 6, 2007, respectively.
(6) Aston/Smart Portfolios Fund commenced operations on January 10, 2008.
(7) Aston/New Century Absolute Return ETF Fund commenced operations on March
14, 2008.
(8) Aston/MB Enhanced Equity Income Fund commenced operations on January 15,
2008.
(9) On January 1, 2008, Montag & Caldwell became the subadviser for the equity
portion of the Fund. Amounts prior to that time were paid to a previous
subadviser.
Prior to November 30, 2006, only the Aston Value Fund and the
Aston/Optimum Mid Cap Fund employed a Subadviser. The Sub-Investment Advisory
fees earned and waived by the Subadvisers for these Funds for the fiscal year
ended October 31, 2006 as well as fees waived or expenses reimbursed, are set
forth below.
97
For the fiscal year ended October 31, 2006 AAAM paid MFS the following
Sub-Investment Advisory fees:
2006
---------------------
NET FEES
FUND FEES PAID WAIVED
---------------- ------------ ------
Aston Value Fund $1,244,748 $--
For the fiscal year ended and October 31, 2006 AAAM paid Optimum the
following Sub-Investment Advisory fees:
2006
---------------------
NET FEES
FUND FEES PAID WAIVED
---------------- ------------ ------
Aston/Optimum Mid Cap Fund $1,570,050 $--
THE ADMINISTRATOR
On November 30, 2006, ABN AMRO Investment Fund Services, Inc. ("AAIFS"),
the Trust and the Board of Trustees assigned the Administration Agreement
between the Aston Funds and AAIFS to Aston. After the assignment, Aston became
the Administrator to the Aston Funds.
Under the Administration Agreement between Aston and the Funds, the
Administrator is responsible for: (1) coordinating with the custodian and
transfer agent and monitoring the services they provide to the Funds, (2)
coordinating with and monitoring any other third parties furnishing services to
the Funds, (3) providing the Funds with necessary office space, telephones and
other communications facilities and personnel competent to perform
administrative and clerical functions, (4) supervising the maintenance by third
parties of such books and records of the Funds as may be required by applicable
federal or state law, (5) preparing or supervising the preparation by third
parties of all federal, state and local tax returns and reports of the Funds
required by applicable law, (6) preparing and, after approval by the Funds,
filing and arranging for the distribution of proxy materials and periodic
reports to shareholders of the Funds as required by applicable law, (7)
preparing and, after approval by the Trust, arranging for the filing of such
registration statements and other documents with the SEC and other federal and
state regulatory authorities as may be required by applicable law, (8) reviewing
and submitting to the officers of the Trust for their approval invoices or other
requests for payment of the Funds' expenses and instructing the Custodian to
issue checks in payment thereof and (9) taking such other action with respect to
the Trust or the Funds as may be necessary in the opinion of the Administrator
to perform its duties under the Administration Agreement.
As compensation for services performed under the Administration Agreement,
the Administrator receives an administration fee payable monthly at the annual
rate set forth below as a percentage of the average daily net assets of the
Trust. The Administrator also receives custody liaison fees as set forth in the
table below.
98
ADMINISTRATION FEES
The fee schedule to the Administration Agreement is as follows:
AVERAGE DAILY NET ASSETS (AGGREGATE FUND
PERCENTAGE COMPLEX)
--------------------- ----------------------------------------
0.0490% Up to $7.4 billion
0.0465% Over $7.4 billion
The Administrator also receives a monthly base fee in the amount of $1,000
per Fund.
The following are the total fees paid to the Administrator by each Fund
for the fiscal years ended October 31, 2008, October 31, 2007 and October 31,
2006:
ADMINISTRATIVE ADMINISTRATIVE ADMINISTRATIVE
FEES FYE FEES FYE OCTOBER FEES FYE OCTOBER
FUND OCTOBER 31, 2008 31, 2007(1) 31, 2006(1)
--------------------------------------------- ---------------- ----------------- ----------------
Aston/Montag & Caldwell Growth Fund $ 938,030 $ 989,541 $ 1,198,337
Aston/Veredus Select Growth Fund 61,708 34,717 27,860
Aston Growth Fund 168,554 341,662 548,612
Aston/Optimum Large Cap Opportunity Fund(2) 22,721 17,802 N/A
Aston Value Fund 182,270 215,521 178,334
Aston/TAMRO All Cap Fund 22,007 22,223 24,574
Aston/River Road Dividend All Cap Value Fund 39,300 32,769 20,248
Aston/Optimum Mid Cap Fund 478,563 422,630 345,396
Aston/Montag & Caldwell Mid Cap Growth(3) 16,243 N/A N/A
Aston/Cardinal Mid Cap Value Fund(3) 15,582 N/A N/A
Aston/River Road Small-Mid Cap Fund(4) 57,961 12,483 N/A
Aston/Veredus Aggressive Growth Fund 85,281 164,990 355,134
Aston/TAMRO Small Cap Fund 206,070 189,587 108,629
Aston/River Road Small Cap Value Fund 162,340 175,794 38,910
Aston/Barings International Fund(3) 34,928 N/A N/A
Aston/Neptune International Fund(5) 25,764 5,845 N/A
Aston/Fortis Global Real Estate Fund(5) 40,318 8,334 N/A
Aston/Smart Portfolios Fund(6) 12,639 N/A N/A
Aston/New Century Absolute Return ETF Fund(7) 11,763 N/A N/A
Aston/MB Enhanced Equity Income Fund(8) 18,075 N/A N/A
Aston/Fortis Real Estate Fund 48,565 75,562 68,247
Aston/Montag & Caldwell Balanced Fund 27,036 27,743 42,670
Aston Balanced Fund 50,392 44,679 70,737
Aston/TCH Fixed Income Fund 66,438 73,440 108,809
Aston/Fortis Investor Money Market Fund 31,005 43,153 63,421
Fortis Government Money Market Fund 202,607 247,813 260,559
Fortis Tax-Exempt Money Market Fund 151,931 161,682 164,662
Fortis Treasury Money Market Fund 120,638 65,035 98,929
Fortis Institutional Prime Money Market Fund 992,358 1,198,169 1,226,535
----------
(1) Prior to November 30, 2006, AAIFS served as the Administrator to the
Funds.
(2) Aston/Optimum Large Cap Opportunity Fund commenced operations on December
28, 2006.
(3) Aston/Montag & Caldwell Mid Cap Growth Fund, Aston/Cardinal Mid Cap Value
Fund and Aston/Barings International Fund commenced operations on November
2, 2007.
(4) Aston/River Road Small-Mid Cap Fund commenced operations on March 28,
2007.
(5) Aston/Fortis Global Real Estate Fund and Aston/Neptune International Fund
commenced operations on August 3, 2007 and August 6, 2007, respectively.
(6) Aston/Smart Portfolios Fund commenced operations on January 10, 2008.
(7) Aston/New Century Absolute Return ETF Fund commenced operations on March
14, 2008.
(8) Aston/MB Enhanced Equity Income Fund commenced operations on January 15,
2008.
99
THE SUBADMINISTRATOR
PNC Global Investment Servicing (U.S.) Inc. ("PNC" or the
"Subadministrator"), 4400 Computer Drive, Westborough, Massachusetts 01581,
provides certain administrative services for the Funds and Aston pursuant to a
Subadministration and Accounting Services Agreement ("Subadministration
Agreement") between Aston and PFPC. On November 30, 2006, the Subadministration
Agreement was assigned to Aston from AAIFS, the former administrator to the
Funds.
As Subadministrator, PNC provides the Trust with subadministrative
services, including fund accounting, regulatory reporting, necessary office
space, equipment, personnel and facilities. Compensation for these services is
paid under a Subadministration Agreement with the Administrator.
SUBADMINISTRATION FEES
The Subadministrator receives an administration fee payable monthly of
0.022% of the Fund complex average daily net assets of all series of the Trust.
The Subadministrator also receives a monthly base fee in the amount of $1,000
per Fund.
THE UNDERWRITER
PFPC Distributors, Inc. (the "Distributor"), 760 Moore Road, King of
Prussia, PA 19406, and the Trust are parties to a distribution agreement dated
September 27, 2001, as amended (the "Distribution Agreement") under which the
Distributor serves as statutory underwriter and facilitates the registration and
distribution shares of each series of the Trust on a continuous basis.
After the initial one-year term the Distribution Agreement shall be
renewed for successive one-year terms, provided such continuance is specifically
approved at least annually (i) by the Trust's Board of Trustees or (ii) by a
vote of a majority (as defined in the 1940 Act and Rule 18f-2 thereunder) of the
outstanding voting securities of the Trust, provided that in either event the
continuance is also approved by a majority of the Trustees who are not parties
to this Agreement and who are not interested persons (as defined in the 1940
Act) of any party to this Agreement, by vote cast in person at a meeting called
for the purpose of voting on such approval. This Agreement is terminable without
penalty, on at least 60 days' written notice, by the Trust's Board of Trustees,
by vote of a majority (as defined in the 1940 Act and Rule 18f-2 thereunder) of
the outstanding voting securities of the Trust, or by the Distributor. This
Agreement will also terminate automatically in the event of its assignment (as
defined in the 1940 Act and the rules thereunder).
THE DISTRIBUTION PLAN
The Board of Trustees of the Trust has adopted Plans of Distribution (the
"Plans") pursuant to Rule 12b-1 under the 1940 Act, which permit the Class N,
Class R and Class S shares of each Fund, as applicable, with the exception of
Aston/Fortis Investor Money Market Fund, to pay certain expenses associated with
the distribution of its shares. Under the Plans, each Fund may pay amounts not
exceeding, on an annual basis, 0.25% of a Fund's average daily net assets for
Class N and S shares and 0.50% of a Fund's average daily net assets for Class R
shares. From this amount, the Distributor may make payments to financial
institutions and intermediaries such as banks, savings and loan associations,
insurance companies, investment counselors, broker-dealers, and the
Distributor's affiliates and subsidiaries as compensation for services,
reimbursement of expenses incurred in connection with distribution assistance,
or provision of shareholder services. The Plans for Class N and Class S shares
are characterized as reimbursement plans and are directly tied to expenses
incurred by the Distributor; the payments the Distributor receives during any
year may not exceed its actual expenses. The Plan for Class R shares is
characterized as a compensation plan and is not directly tied to expenses
incurred by the Distributor; the payments the Distributor receives during any
year may exceed its actual expenses.
100
Rule 12b-1 regulates the circumstances under which an investment company
may directly or indirectly bear expenses relating to the distribution of its
shares. Continuance of the Plans must be approved annually by a majority of the
Trustees of the Trust and by a majority of the Trustees who are not "interested
persons" of the Trust or the Distributor, as that term is defined in the 1940
Act ("Disinterested Trustees"). The Plans require that quarterly written reports
of amounts spent under the Plans and the purposes of such expenditures be
furnished to and reviewed by the Trustees. In accordance with Rule 12b-1 under
the 1940 Act, the Plans may be terminated with respect to any Fund by a vote of
a majority of the Disinterested Trustees, or by a vote of a majority of the
outstanding shares of that Fund. The Plans may be amended by vote of the Trust's
Board of Trustees, including a majority of the Disinterested Trustees, cast in
person at a meeting called for such purpose, except that any change that would
effect a material increase in any distribution fee with respect to a Fund (or
class) requires the approval of that Fund's (or class's) shareholders. All
material amendments of the Plans will require approval by a majority of the
Trustees of the Trust and of the Disinterested Trustees.
To the Trust's knowledge, no interested person of the Trust, nor any of
its Trustees who are not "interested persons," has a direct or indirect
financial interest in the operation of the Plan.
101
Amounts spent on behalf of each Fund pursuant to such Plans during the
fiscal year ended October 31, 2008, are set forth below.
12B-1 PLAN EXPENSES
-----------------------------------------------------
COMPENSATION COMPENSATION
DISTRIBUTION TO BROKER TO SALES
FUND -- CLASS N SHARES PRINTING SERVICES DEALERS PERSONNEL
---------------------------------------------- -------- ------------ ------------ ------------
Aston/Montag & Caldwell Growth Fund $ 1,472 $ 22,155 $ 1,626,446 $0
Aston/Veredus Select Growth Fund 100 1,592 111,821 0
Aston Growth Fund 1,889 5,912 223,511 0
Aston/Optimum Large Cap Opportunity Fund 53 830 34,811 0
Aston Value Fund 5 2,537 144,205 0
Aston/TAMRO All Cap Fund 229 609 13,570 0
Aston/River Road Dividend All Cap Value Fund 681 989 99,272 0
Aston/Optimum Mid Cap Fund 1,436 22,049 1,762,833 0
Aston/Montag & Caldwell Mid Cap Growth Fund(1) 1 56 796 0
Aston/Cardinal Mid Cap Value Fund(1) 0 28 331 0
Aston/River Road Small-Mid Cap Fund 2 267 15,366 0
Aston/Veredus Aggressive Growth Fund 1,405 3,977 148,424 0
Aston/TAMRO Small Cap Fund 8 4,831 460,246 0
Aston/River Road Small Cap Value Fund 9 4,734 434,244 0
Aston/Neptune International Fund 0 3 0 0
Aston/Fortis Global Real Estate Fund 315 818 391 0
Aston/Smart Portfolios Fund(2) 1 50 4,609 0
Aston/New Century Absolute Return ETF Fund(3) 1 56 6,503 0
Aston/MB Enhanced Equity Income Fund(4) 3 187 6,271 0
Aston/Fortis Real Estate Fund 176 1,093 45,254 0
Aston/Montag & Caldwell Balanced Fund 308 767 11,475 0
Aston Balanced Fund 469 1,348 42,839 0
Aston/TCH Fixed Income Fund 897 2,384 72,227 0
----------
(1) Aston/Montag & Caldwell Mid Cap Growth Fund and Aston/Cardinal Mid Cap
Value Fund commenced operations on November 2, 2007.
(2) Aston/Smart Portfolios Fund commenced operations on January 10, 2008.
(3) Aston/New Century Absolute Return ETF Fund commenced operations on March
14, 2008.
(4) Aston/MB Enhanced Equity Income Fund commenced operations on January 15,
2008.
102
SERVICE
FUND -- CLASS N SHARES MARKETING PROVIDERS TOTAL
---------------------------------------------- --------- --------- -----------
Aston/Montag & Caldwell Growth Fund $ 166,339 $ 0 $ 1,816,413
Aston/Veredus Select Growth Fund 13,638 0 127,152
Aston Growth Fund 46,947 0 278,259
Aston/Optimum Large Cap Opportunity Fund 4,909 0 40,604
Aston Value Fund 14,262 0 161,008
Aston/TAMRO All Cap Fund 7,752 0 22,160
Aston/River Road Dividend All Cap Value Fund 10,057 0 110,999
Aston/Optimum Mid Cap Fund 135,708 0 1,922,026
Aston/Montag & Caldwell Mid Cap Growth Fund(1) 1,232 0 2,084
Aston/Cardinal Mid Cap Value Fund(1) 909 0 1,269
Aston/River Road Small-Mid Cap Fund 2,495 0 18,129
Aston/Veredus Aggressive Growth Fund 36,258 0 190,064
Aston/TAMRO Small Cap Fund 35,984 0 501,070
Aston/River Road Small Cap Value Fund 31,386 0 470,374
Aston/Neptune International Fund 33 0 36
Aston/Fortis Global Real Estate Fund 10,194 0 11,717
Aston/Smart Portfolios Fund(2) 1,904 0 6,564
Aston/New Century Absolute Return ETF Fund(3) 1,888 0 8,448
Aston/MB Enhanced Equity Income Fund(4) 8,493 0 14,954
Aston/Fortis Real Estate Fund 6,300 0 52,823
Aston/Montag & Caldwell Balanced Fund 11,166 0 23,716
Aston Balanced Fund 13,822 0 58,477
Aston/TCH Fixed Income Fund 28,716 0 104,223
----------
(1) Aston/Montag & Caldwell Mid Cap Growth Fund and Aston/Cardinal Mid Cap
Value Fund commenced operations on November 2, 2007.
(2) Aston/Smart Portfolios Fund commenced operations on January 10, 2008.
(3) Aston/New Century Absolute Return ETF Fund commenced operations on March
14, 2008.
(4) Aston/MB Enhanced Equity Income Fund commenced operations on January 15,
2008.
12B-1 PLAN EXPENSES
-----------------------------------------------------
COMPENSATION COMPENSATION
DISTRIBUTION TO BROKER TO SALES
FUND -- CLASS R SHARES PRINTING SERVICES DEALERS PERSONNEL
----------------------------------- -------- ------------ ------------ ------------
Aston/Montag & Caldwell Growth Fund $ 0 $410 $13,163 $ 0
Aston Growth Fund $ 0 $ 75 $ 2,707 $ 0
SERVICE
FUND -- CLASS R SHARES MARKETING PROVIDERS TOTAL
----------------------------------- --------- --------- -------
Aston/Montag & Caldwell Growth Fund $ 794 $ 0 $14,368
Aston Growth Fund 215 0 2,997
12B-1 PLAN EXPENSES
-----------------------------------------------------
COMPENSATION COMPENSATION
DISTRIBUTION TO BROKER TO SALES
FUND -- CLASS S SHARES PRINTING SERVICES DEALERS PERSONNEL
----------------------------------- -------- ------------ ------------ ------------
Fortis Government Money Market Fund $ 0 $ 475 $ 192,946 $0
Fortis Tax-Exempt Money Market Fund 123 1,219 167,020 0
Fortis Treasury Money Market Fund 82 666 76,787 0
103
SERVICE
FUND -- CLASS S SHARES MARKETING PROVIDERS TOTAL
----------------------------------- --------- --------- --------
Fortis Government Money Market Fund $ 748 $ 0 $194,169
Fortis Tax-Exempt Money Market Fund 1,288 0 169,650
Fortis Treasury Money Market Fund 952 0 78,487
SHAREHOLDER SERVICING PLAN
The Trust has adopted a shareholder servicing plan for the Class S and
Class YS Shares of each Fund, as applicable (the "Shareholder Servicing Plan").
Under the Shareholder Servicing Plan, the Trust pays a fee of up to 0.25% of the
average daily net assets of the Class S and Class YS Shares of the Funds. This
fee is paid to the Distributor to perform, or to compensate other service
providers for performing, the following shareholder services: maintaining client
accounts; arranging for bank wires; responding to client inquiries concerning
services provided on investments; assisting clients in changing dividend
options, account designations and addresses; subaccounting; providing
information on share positions to clients; forwarding shareholder communications
to clients; processing purchase, exchange and redemption orders; and processing
dividend payments. The Distributor may voluntarily waive all or a portion of its
shareholder servicing fee, and may discontinue its waiver at any time.
The Funds paid shareholder servicing fees in the following amounts for the
fiscal years ended October 31, 2006, October 31, 2007 and October 31, 2008.
Fiscal Year Ending October 31, 2008
FUND NET FEES
-------------------------------------------- ---------
Fortis Government Money Market Fund $ 42,784
=========
Fortis Tax-Exempt Money Market Fund --
Fortis Treasury Money Market Fund --
Fortis Institutional Prime Money Market Fund 21,106
=========
Fiscal Year Ending October 31, 2007
FUND NET FEES
-------------------------------------------- ---------
Fortis Government Money Market Fund $ 43,275
Fortis Tax-Exempt Money Market Fund --
Fortis Money Market Fund --
Fortis Institutional Prime Money Market Fund 33,554
Fiscal Year Ending October 31, 2006
FUND NET FEES
-------------------------------------------- ---------
Fortis Government Money Market Fund $ 32,618
Fortis Tax-Exempt Money Market Fund --
Fortis Treasury Money Market Fund --
Fortis Institutional Prime Money Market Fund 79,393
It is possible that an intermediary may offer different classes of shares
to its customers and differing services to the classes, and thus receive
compensation with respect to different classes. Intermediaries also may charge
separate fees to their customers. The Funds may pay third-party service
providers up to 0.15% for certain "transfer agency" services they provide. A
Fund may also pay $20 fee per account for underlying omnibus accounts when such
Fund pays no other fee to the third-party service provider.
104
REDEMPTION FEES
The Trust requests that banks, broker-dealers and other intermediaries
holding omnibus accounts with a Fund impose any applicable redemption fees at
the shareholder account level. However, the redemption fee may not apply to
certain types of accounts held through intermediaries, including: (1) certain
pension, profit-sharing and retirement plans; (2) certain broker-wrap fee and
other fee-based programs; (3) certain omnibus accounts where the omnibus account
holder does not have the systems capability to impose a redemption fee on its
underlying customers' accounts; and (4) certain intermediaries that do not have,
or do not report to the Funds, sufficient information to impose a redemption fee
on their customers' accounts.
In addition, the redemption fee does not apply to (i) premature
distributions from retirement accounts due to the disability or health of the
shareholder; (ii) minimum required distributions from retirement accounts; (iii)
return of excess contributions in retirement accounts where the excess is
reinvested into a Fund; (iv) redemptions resulting in the settlement of an
estate due to the death of the shareholder; (v) redemptions of shares purchased
through an Automatic Investment Plan; (vi) redemptions as part of a system's
withdrawal plan; and (vii) reinvested distributions (dividends and capital
gains). Contact your financial intermediary or refer to your plan documents for
more information on how the redemption fee is applied to your shares.
In addition to the circumstances noted in the preceding paragraph, the
Funds' administrator may waive the redemption fee at its discretion where it
believes such waiver is in the best interests of a Fund and in accordance with
the Funds' policies and procedures, including, but not limited to, when it
determines that imposition of the redemption fee is not necessary to deter
short-term trading.
CUSTODIAN
PFPC Trust Company, 8800 Tinicum Boulevard, Philadelphia, PA 19153, serves
as custodian of the Trust's assets on behalf of each Fund.
TRANSFER AGENT AND DIVIDEND PAYING AGENT
PNC Global Investment Servicing (U.S.) Inc., 4400 Computer Drive,
Westborough, Massachusetts 01581 serves as transfer agent and dividend paying
agent for the Trust.
COUNSEL AND INDEPENDENT REGISTERED PUBLIC ACCOUNTING FIRM
Vedder Price P.C., with offices at 222 North LaSalle Street, Chicago,
Illinois, 60601, serves as counsel to the Trust.
Mayer, Brown, LLP, with offices at 71 South Wacker Drive, Chicago,
Illinois 60606, serves as counsel to the Independent Trustees.
Ernst & Young, with offices at Sears Tower, 233 South Wacker Drive,
Chicago, IL, is the Trust's independent registered public accounting firm for
each Fund, except for the Fortis Money Market Funds. KPMG LLP is the registered
independent public accounting firm for the Fortis Money Market Funds with
offices at 303 East Wacker Drive, Chicago, IL.
105
PORTFOLIO TRANSACTIONS AND BROKERAGE COMMISSIONS
The Subadvisers are responsible for decisions to buy and sell securities
for the Funds, for the placement of their portfolio business and the negotiation
of commissions, if any, paid on such transactions. In placing trades for a Fund,
the Subadvisers will follow the Trust's policy of seeking best execution of
orders. Securities traded in the over-the-counter market are generally traded on
a net basis with dealers acting as principal for their own accounts without a
stated commission. In over-the-counter transactions, orders are placed directly
with a principal market-maker unless a better price and execution can be
obtained by using a broker. Brokerage commissions are paid on transactions in
listed securities, futures contracts and options.
The Subadvisers attempt to obtain the best overall price and most
favorable execution of transactions in portfolio securities. However, subject to
policies established by the Board of Trustees of the Trust, a Fund may pay a
broker-dealer a commission for effecting a portfolio transaction for a Fund in
excess of the amount of commission another broker-dealer would have charged if a
Subadviser determines in good faith that the commission paid was reasonable in
relation to the brokerage or research services provided by such broker-dealer,
viewed in terms of that particular transaction or such firm's overall
responsibilities with respect to the clients, including the Fund, as to which it
exercises investment discretion. In selecting and monitoring broker-dealers and
negotiating commissions, consideration will be given to a broker-dealer's
reliability, the quality of its execution services on a continuing basis and its
financial condition. Research services furnished by broker-dealers through whom
the Funds effect securities transactions may be used by the Subadvisers, as the
case may be, in servicing all of their respective accounts; not all such
services may be used in connection with the Funds. The term "research services"
may include, but is not limited to, advice as to the value of securities; the
advisability of investing in, purchasing or selling securities; the availability
of securities or purchasers or sellers of securities; and analyses or reports
concerning issuers, industries, securities, economic factors and trends,
portfolio strategy or the performance of accounts.
It is likely that the broker-dealers selected based on the foregoing
considerations will include firms that also sell shares of the Funds to their
customers. However, the Subadvisers do not consider sales of Fund shares as a
factor in the selection of broker-dealers to execute portfolio transactions for
the Funds and, accordingly, the Trust has implemented policies and procedures
reasonably designed to prevent sales of Fund shares from being considered as a
factor in the selection of broker-dealers to execute portfolio transactions for
the Funds.
The Subadvisers effect portfolio transactions for other investment
companies and advisory accounts. The Subadvisers will attempt to equitably
allocate portfolio transactions among the Funds and others whenever concurrent
decisions are made to purchase or sell securities by the Funds and other
accounts. In making such allocations between the Funds and others, the main
factors to be considered are the respective investment objectives, the relative
size of portfolio holdings of the same or comparable securities, the
availability of cash for investment, the size of investment commitments
generally held and the opinions of the persons responsible for recommending
investments to the Funds and the others. In some cases, this procedure could
have an adverse effect on the Funds. In the opinion of the Subadvisers, however,
the results of such procedures will generally be in the best interest of each of
the clients.
106
Amounts spent on behalf of each Fund for brokerage commissions during the
fiscal years ended October 31, 2008, October 31, 2007 and October 31, 2006 are
set forth below.
BROKERAGE BROKERAGE BROKERAGE
COMMISSIONS FYE COMMISSIONS FYE COMMISSIONS FYE
FUND OCTOBER 31, 2008 OCTOBER 31, 2007 OCTOBER 31, 2006
-------------------------------------------- ---------------- ---------------- ----------------
Aston/Montag & Caldwell Growth $ 1,559,339 $ 1,829,168 $2,939,198
Aston/Veredus Select Growth 549,107 177,515 152,593
Aston Growth 709,874 1,232,196 1,359,497
Aston/Optimum Large Cap Opportunity(1) 40,987 46,610 N/A
Aston Value 241,728 148,680 139,828
Aston/TAMRO All Cap 17,628 13,509 22,983
Aston/River Road Dividend All Cap Value 64,797 60,699 18,339
Aston/Optimum Mid Cap 482,024 433,382 453,968
Aston/Montag & Caldwell Mid Cap Growth(2) 1,184 N/A N/A
Aston/Cardinal Mid Cap Value(2) 2,822 N/A N/A
Aston/River Road Small-Mid Cap(3) 173,215 18,656 N/A
Aston/Veredus Aggressive Growth 664,358 1,673,767 2,985,099
Aston/TAMRO Small Cap 871,683 700,129 418,844
Aston/River Road Small Cap Value 615,112 793,907 238,719
Aston/Barings International(2) 20,225 N/A N/A
Aston/Neptune International(4) 11,151 1,558 N/A
Aston/Fortis Global Real Estate(4) 40,336 28,972 N/A
Aston/Smart Portfolios(5) 8,283 N/A N/A
Aston/New Century Absolute Return ETF(6) 10,178 N/A N/A
Aston/MB Enhanced Equity Income(7) 22,118 N/A N/A
Aston/Fortis Real Estate 111,295 191,045 194,469
Aston/Montag & Caldwell Balanced 10,731 16,722 37,030
Aston Balanced 39,709 38,327 139,805
Aston/TCH Fixed Income N/A N/A N/A
Fortis Investor Money Market N/A N/A N/A
Fortis Government Money Market N/A N/A N/A
Fortis Tax-Exempt Money Market N/A N/A N/A
Fortis Treasury Money Market N/A N/A N/A
Fortis Institutional Prime Money Market N/A N/A N/A
----------
(1) Aston/Optimum Large Cap Opportunity Fund commenced operations on December
28, 2006.
(2) Aston/Montag & Caldwell Mid Cap Growth Fund, Aston/Cardinal Mid Cap Value
Fund and Aston/Barings International Fund commenced operations on November
2, 2007.
(3) Aston/River Road Small-Mid Cap Fund commenced operations on March 28,
2007.
(4) Aston/Fortis Global Real Estate Fund and Aston/Neptune International Fund
commenced operations on August 3, 2007 and August 6, 2007, respectively.
(5) Aston/Smart Portfolios Fund commenced operations on January 10, 2008.
(6) Aston/New Century Absolute Return ETF Fund commenced operations on March
14, 2008.
(7) Aston/MB Enhanced Equity Income Fund commenced operations on January 15,
2008.
The broker-dealers who execute transactions on behalf of the Funds and who
are affiliates of the Funds' Investment Adviser and Subadvisers are brokers in
the Fortis International brokerage network. There were no brokerage commissions
paid by the Funds to any affiliates of the Funds or the Adviser or the
Subadvisers during the fiscal years ended October 31, 2008, October 31, 2007 and
October 31, 2006.
107
As of October 31, 2008 the following Funds owned securities of their
regular brokers or dealers, as defined in Rule 10b-1 under the 1940 Act, with
the following market values:
FUND BROKER DEALER MARKET VALUE
-------------------------------------------- ------------------------- ------------
Veredus Select Growth Fund JPMorgan Chase & Co. $ 3,382,500
Optimum Large Cap Opportunity Fund Goldman Sachs & Co. 120,250
Value Fund Goldman Sachs & Co. 4,932,100
Bank of America 4,339,820
JP Morgan Chase & Co. 2,479,125
Merrill Lynch & Co., Inc. 1,079,763
TAMRO All Cap Fund JP Morgan Chase & Co. 268,620
Bank of America 212,575
Goldman Sachs & Co. 94,350
River Road Dividend All Cap Value Fund Bank of America 493,672
MB Enhanced Equity Income Fund Citigroup 354,900
Bank of America 193,360
Merrill Lynch & Co., Inc. 111,540
Montag & Caldwell Balanced Fund Citigroup 256,469
Bank of America 242,137
Goldman Sachs & Co. 231,295
Balanced Fund Bear Stearns & Co. 202,235
Goldman Sachs & Co. 92,792
TCH Fixed Income Fund Bear Stearns & Co. 1,213,412
Citigroup 1,136,998
Merrill Lynch & Co., Inc. 667,253
Goldman Sachs & Co. 494,888
Bank of America 227,430
Fortis Investor Money Market Fund Bank of America 11,000,000
Deutsche Bank 11,000,000
JP Morgan Chase & Co. 1,000,075
Fortis Government Money Market Fund Bank of America 105,000,000
JP Morgan Chase & Co. 100,000,000
Deutsche Bank 39,000,000
Fortis Treasury Money Market Fund Bank of America 40,000,000
Barclays Bank 40,000,000
Deutsche Bank 40,000,000
Fortis Institutional Prime Money Market Fund Bank of America 61,231,204
Barclays Bank 37,977,333
108
The Investment Advisers and Subadvisers or their affiliates compensate many
intermediaries that distribute and/or service investors in the Funds
("Intermediaries") for various services out of their own assets, and not as
additional charges to the Funds, in connection with the sale and distribution of
shares of the Funds and/or servicing of these shares. The payments are in
addition to the payments by the Funds described in each Fund's prospectus for
distribution and/or shareholder servicing, if any. Such additional payments may
be for 1) sales of shares, 2) for services including, but not limited to,
subaccounting, marketing support, administrative and shareholder processing
services and/or for sales of shares, 3) distribution including, but not limited
to, access to a third party platform, fund offering list or other marketing
programs and/or "shelf space" ("Additional Payments"). Additional payments for
marketing programs include, but are not limited to, inclusion of a fund on
preferred or recommended sales lists, mutual fund "supermarket" platforms and
other formal sales programs granting access to the intermediary's sales force
and obtaining other forms of marketing support. These Additional Payments made
by the Investment Advisers or the Subadvisers or their affiliates may be a fixed
dollar amount; may be based on the number of customer accounts maintained by an
Intermediary; may be based on a percentage of the value of shares sold to, or
held by, customers of the Intermediary involved; or may be calculated on another
basis. These Additional Payments, sometimes referred to as "revenue sharing,"
may represent a premium over payments made by other fund families, and
Intermediary investment professionals may have an added incentive to sell or
recommend a Fund or share class over others offered by competing fund families.
The revenue sharing payments may differ for each Fund within the Aston family of
funds. In certain cases, the revenue sharing differs by Fund within the same
intermediary. For several Funds, revenue sharing differs for the same Fund
across certain intermediaries.
A number of factors are considered in determining whether to make Additional
Payments. Such factors may include, without limitation, the level or type of
services provided by the Intermediary, the level or expected level of assets or
sales of shares, the Funds status on a preferred or recommended fund list,
access to an Intermediary's personnel, and other factors. In addition to such
payments, the Advisers or their affiliates may offer other incentives, such as
sponsorship of educational or client seminars.
PORTFOLIO TURNOVER
The portfolio turnover rate for each of the Funds is calculated by
dividing the lesser of purchases or sales of portfolio investments for the
reporting period by the monthly average value of the portfolio investments owned
during the reporting period. The calculation excludes all securities, including
options, whose maturities or expiration dates at the time of acquisition are one
year or less. Portfolio turnover may vary greatly from year to year as well as
within a particular year and may be affected by cash requirements for redemption
of shares and by requirements which must be met for the Funds to receive
favorable federal income tax treatment. In any event, portfolio turnover is
generally not expected to exceed 100% in the Funds, except for Aston/Veredus
Aggressive Growth Fund, Aston/Veredus Select Growth Fund, Aston/TAMRO Small Cap
Fund, Aston/Smart Portfolios Fund, Aston/New Century Absolute Return ETF Fund
and Aston/Barings International Fund. A high rate of portfolio turnover (i.e.,
over 100%) may result in the realization of substantial net short-term capital
gains and involves correspondingly greater transaction costs. Distributions
derived from net short-term capital gains of a Fund (i.e., net short-term
capital gain in excess of net long-term capital loss) are taxable to
shareholders as ordinary income for federal income tax purposes. To the extent
that net long-term capital gains (i.e., net long-term capital gain in excess of
net short-term capital loss) are realized, distributions derived from such gains
are generally treated as capital gain dividends for federal income tax purposes
and taxed to shareholders as long-term capital gain.
The portfolio turnover rate for each Fund for its most recent fiscal
period may be found under "FINANCIAL HIGHLIGHTS" in each Fund's Prospectus. The
portfolio turnover rate for the Aston/Veredus Select Growth Fund varied
significantly between fiscal year 2008 and fiscal year 2007 due to managing the
Fund's portfolio during periods of extremely high market volatility.
109
DISCLOSURE OF PORTFOLIO HOLDINGS
Except for Aston/Neptune International Fund, Aston/New Century Absolute
Return ETF Fund and Aston/TAMRO Small Cap Fund, each Fund's portfolio holdings
as of the end of each calendar month are generally posted on the Funds' Web
site, www.astonfunds.com, on or about the twentieth day after the month-end.
Portfolio holdings for Aston/Neptune International Fund are made available
quarterly upon the filing of annual and semi-annual shareholder reports and
quarterly holding reports. Such filings are generally made within sixty (60)
days of each fiscal quarter. Portfolio holdings for Aston/New Century Absolute
Return ETF Fund and Aston/TAMRO Small Cap Fund are made available as of the end
of each calendar quarter and are generally posted on the Funds' website on or
about the twentieth day after the quarter-end. Portfolio holdings information is
made available to investors and to intermediaries selling fund shares only after
its public disclosure.
The Trust's policies and procedures governing disclosure of portfolio
holdings permit nonpublic portfolio holdings information (including portfolio
characteristics information, such as sector and portfolio allocations) to be
shared with the Funds' service providers and others who generally need access to
such information in the performance of their contractual duties and
responsibilities, the Trust's custodian, pricing services, fund accountants,
Investment Adviser, Subadvisers, Administrator, Subadministrator, independent
public accountants, attorneys, officers and Trustees and each of their
respective affiliates and advisers, and are subject to duties of
confidentiality, including a duty not to trade on nonpublic information.
Nonpublic portfolio holdings information may also be disclosed by the Funds or
their duly authorized service providers to certain third parties, including
mutual fund evaluation services, rating agencies, lenders or providers of a
borrowing facility, provided that (i) a good faith determination is made that
the Funds have a legitimate business purpose to provide the information and the
disclosure is in the Funds' best interests; (ii) the recipient does not
distribute the portfolio holdings or results of the analysis to third parties,
other departments, or persons who are likely to use the information for purposes
of purchasing or selling shares of the Funds prior to the portfolio holdings
becoming public information; (iii) the recipient signs a written confidentiality
agreement; and (iv) the Chief Compliance Officer or Chief Executive Officer of
the Trust or the applicable service provider approves of the disclosure. These
conditions do not apply to portfolio holdings information released to such third
parties after it is posted on the Web site. A list of the third parties (other
than service providers) that receive the Funds' portfolio holdings information
prior to its public disclosure as well as the frequency and the lag time between
the date of the information and the date it is disclosed to them is provided
below:
NAME FREQUENCY FUNDS LAG TIME
---------------- --------- --------------------------- --------
TRACKING SERVICE
VESTEK Monthly Aston Growth Fund None
Aston/Montag & Caldwell
Growth Fund
Aston/Optimum Mid Cap Fund
Aston/TAMRO Small Cap Fund
Aston/TAMRO All Cap Fund
Aston/Veredus Aggressive
Growth Fund
Aston Balanced Fund
Aston/Montag & Caldwell
Balanced Fund
Aston/TCH Fixed Income Fund
Disclosure of the Funds' portfolio holdings information as an exception to
the Trust's policies and procedures must be approved by the Chief Compliance
Officer or Chief Executive Officer of the Trust. No compensation or other
consideration is received by the Trust or any affiliates of the Trust for
disclosure of portfolio holdings information. The Board of Trustees receives
reports of any potential exceptions to, or violations of, the Trust's policies
and procedures governing disclosure of portfolio holdings that are deemed to
constitute a material compliance matter. The Chief Compliance Officer or his
designee is responsible for monitoring compliance with these procedures,
including requesting information from service providers.
Each Fund discloses its portfolio holdings to the extent required by law.
110
DESCRIPTION OF SHARES
The table below summarizes the class(es) of shares that each Fund offers.
FUND CLASS N CLASS I CLASS R CLASS S CLASS Y CLASS YS
-------------------------------------------- ------- ------- ------- ------- ------- --------
Aston/Montag & Caldwell Growth Fund - - -
Aston/Veredus Select Growth Fund - -
Aston Growth Fund - - -
Aston/Optimum Large Cap Opportunity Fund -
Aston Value Fund - -
Aston/TAMRO All Cap Fund -
Aston/River Road Dividend All Cap Value Fund - -
Aston/Optimum Mid Cap Fund - -
Aston/Montag & Caldwell Mid Cap Growth Fund -
Aston/Cardinal Mid Cap Value Fund -
Aston/River Road Small-Mid Cap Fund - -
Aston/Veredus Aggressive Growth Fund - -
Aston/TAMRO Small Cap Fund - -
Aston/River Road Small Cap Value Fund - -
Aston/Barings International Fund -
Aston/Neptune International Fund - -
Aston/Fortis Global Real Estate Fund -
Aston/Smart Portfolios Fund -
Aston/New Century Absolute Return ETF Fund -
Aston/MB Enhanced Equity Income Fund -
Aston/Fortis Real Estate Fund - -
Aston/Montag & Caldwell Balanced Fund - -
Aston Balanced Fund -
Aston/TCH Fixed Income Fund - -
Aston/Fortis Investor Money Market Fund -
Fortis Government Money Market Fund - -
Fortis Tax-Exempt Money Market Fund - -
Fortis Treasury Money Market Fund - -
Fortis Institutional Prime Money Market Fund - -
Each Fund is authorized to issue an unlimited number of shares of
beneficial interest without par value. Currently, there are six classes of
shares issued by the Funds of the Trust. Class N, I, R, S, Y and YS shares will
not be subject to an initial sales charge or a contingent deferred sales charge.
Class S and YS shares will be subject to a shareholder service fee with a
maximum annual fee of 0.25% of average daily net assets. Class N and S shares
will have a Rule 12b-1 fee with a maximum annual fee of 0.25% of average daily
net assets. Class R shares will be subject to a Rule 12b-1 fee with a maximum
annual fee of 0.50% of average daily net assets. Since each class has different
expenses, performance will vary. Shares of each Fund represent equal
proportionate interests in the assets of that Fund only and have identical
voting, dividend, redemption, liquidation and other rights except that Class I,
Class Y and Class YS shares have no rights with respect to a Fund's distribution
plan. All shares issued are fully paid and non-assessable, and shareholders have
no preemptive or other right to subscribe to any additional shares and no
conversion rights. Information about Class I, Class R, Class Y and Class YS
shares is available by calling 800 992-8151.
111
MINIMUM INITIAL INVESTMENTS
The minimum initial investment for Class N, Class R and Class S shares is
$2,500 for each Fund, and the subsequent minimum investment is $50.
The minimum initial investment for the Funds by Individual Retirement
Accounts, Education Savings Accounts and Uniform Gift to Minor Accounts/ Uniform
Transfer to Minor Accounts is $500. The subsequent minimum investment for each
account type is $50.
MINIMUM INITIAL
CLASS I SHARES INVESTMENT
-------------------------------------------- ---------------
Montag & Caldwell Growth Fund $5 million
Aston Growth Fund $5 million
Aston/Veredus Select Growth Fund $2 million
Aston Value Fund $2 million
Aston/River Road Dividend All Cap Value Fund $1 million
Aston/Optimum Mid Cap Fund $2 million
Aston/River Road Small-Mid Cap Fund $1 million
Aston/Veredus Aggressive Growth Fund $2 million
Aston/TAMRO Small Cap Fund $2 million
Aston/River Road Small Cap Value Fund $1 million
Aston/Fortis Real Estate Fund $2 million
Aston/Barings International Fund $1 million
Aston/Neptune International Fund $1 million
Montag & Caldwell Balanced Fund $1 million
Aston/TCH Fixed Income Fund $2 million
Fortis Government Money Market Fund $1 million
Fortis Tax-Exempt Money Market Fund $1 million
Fortis Treasury Money Market Fund $1 million
MINIMUM INITIAL
CLASS Y SHARES INVESTMENT
-------------------------------------------- ---------------
Fortis Institutional Prime Money Market Fund $5 million
MINIMUM INITIAL
CLASS YS SHARES INVESTMENT
-------------------------------------------- ---------------
Fortis Institutional Prime Money Market Fund $5 million
There is no minimum subsequent investment for Class I, Class Y and Class
YS shares. For purposes of the investment minimum, the balances of Fund accounts
of clients of a financial consultant may be aggregated in determining whether
the minimum investment has been met. This aggregation may also be applied to the
accounts of immediate family members (i.e., a person's spouse, parents,
children, siblings and in-laws). In addition, the aggregation may be applied to
the related accounts of a corporation or other legal entity. The Funds may waive
the minimum initial investment by obtaining a letter of intent, evidencing an
investor's intention of meeting the minimum initial investment in a specified
period of time as continually reviewed and approved by the Board of Trustees.
The minimum investment is waived for Trustees of the Trust and employees of the
Investment Adviser to the respective Fund, the Subadviser of each respective
Fund, the Fund's Administrator and their affiliates, as well as their spouses.
The Trust reserves the right to waive a Fund's minimum initial investment
requirement for any reason. There is no sales load or charge in connection with
the purchase of shares. The Trust reserves the right to reject any purchase
order and to suspend the offering of shares of the Funds. The Funds also reserve
the right to change the initial and subsequent investment minimums. Class I
shares are intended for accounts with balances over the minimum initial
investment.
112
ANTI-MONEY LAUNDERING LAWS
The Funds are required to comply with various federal anti-money
laundering laws and regulations. Consequently, a Fund may be required to
"freeze" the account of a shareholder if the shareholder appears to be involved
in suspicious activity or if certain account information matches information on
government lists of known terrorists or other suspicious persons, or the Fund
may be required to transfer the account or proceeds of the account to a
government agency.
CUSTOMER IDENTIFICATION PROGRAM
Federal law requires the Funds to obtain, verify and record identifying
information for each investor who opens or reopens an account with Aston Funds.
An investor may be an individual or a person other than an individual (such as a
corporation, partnership or trust). Such identifying information may include the
name, residential or business street address, principal place of business, local
office or other physical location (for a person other than an individual), date
of birth (for an individual), social security or taxpayer identification number
or other identifying information. Applications without the required information,
or without any indication that a social security or taxpayer identification
number has been applied for, may not be accepted. After acceptance, to the
extent permitted by applicable law or its customer identification program, Aston
Funds reserves the right (a) to place limits on transactions in any account
until the identity of the investor is verified; or (b) to refuse an investment
in Aston Funds or to involuntarily redeem an investor's shares and close an
account in the event that an investor's identity is not verified. Aston Funds
and its agents will not be responsible for any loss in an investor's account
resulting from the investor's delay in providing all required identifying
information or from closing an account and redeeming an investor's shares when
an investor's identity cannot be verified.
VOTING RIGHTS
Each issued and outstanding full and fractional share of a Fund is
entitled to one full and fractional vote. Shares of a Fund participate equally
in regard to dividends, distributions and liquidations with respect to that Fund
subject to preferences (such as Rule 12b-1 distribution fees), rights or
privileges of any share class. Shareholders have equal non-cumulative voting
rights. Class N, Class R and Class S shares have exclusive voting rights with
respect to the distribution plans for their class. On any matter submitted to a
vote of shareholders, shares of each Fund will vote separately except when a
vote of shareholders in the aggregate is required by law, or when the Trustees
have determined that the matter affects the interests of more than one Fund, in
which case the shareholders of all such Funds shall be entitled to vote thereon.
SHAREHOLDER MEETINGS
The Board of Trustees of the Trust does not intend to hold annual meetings
of shareholders of the Funds. The Trust Instrument provides that the Board of
Trustees will call a meeting for the purpose of voting upon the question of
removal of any Trustee when requested to do so by shareholders owning not less
than 10% of the outstanding shares of the Funds entitled to vote. In addition,
subject to certain conditions, shareholders of the Funds may apply to the Trust
to communicate with other shareholders to request a shareholders' meeting to
vote upon the removal of a Trustee or Trustees.
CERTAIN PROVISIONS OF TRUST INSTRUMENT
Under Delaware law, the shareholders of the Funds will not be personally
liable for the obligations of any Fund; a shareholder is entitled to the same
limitation of personal liability extended to shareholders of corporations. To
guard against the risk that the Delaware law might not be applied in other
states, the Trust Instrument requires that every written obligation of the Trust
or a Fund contain a statement that such obligation may only be enforced against
the assets of the Trust or Fund and provides for indemnification out of Trust or
Fund property of any shareholder nevertheless held personally liable for Trust
or Fund obligations.
113
EXPENSES
Expenses attributable to the Trust, but not to a particular Fund, will be
allocated to each fund of the Aston Funds on the basis of relative net assets.
Similarly, expenses attributable to a particular Fund, but not to a particular
class thereof, will be allocated to each class on the basis of relative net
assets. General Trust expenses may include but are not limited to: insurance
premiums, Trustee fees, expenses of maintaining the Trust's legal existence and
fees of industry organizations. General Fund expenses may include but are not
limited to: audit fees, brokerage commissions, registration of Fund shares with
the SEC, notification fees to the various state securities commissions, printing
and postage expenses related to preparing and distributing required documents
such as shareholder reports, prospectuses and proxy statements to current
shareholders, fees of the Funds' custodian, Administrator, Subadministrator and
transfer agent or other "service providers," costs of obtaining quotations of
portfolio securities and pricing of Fund shares. New class-specific expenses
relating to distribution fee payments associated with a Rule 12b-1 plan for a
particular class of shares and shareholder service fees for a particular class
of shares and any other costs relating to implementing or amending such plan
(including obtaining shareholder approval of such plan or any amendment thereto)
will be borne solely by shareholders of such class or classes. Other expense
allocations which may differ between classes, or which are determined by the
Trustees to be class specific, may include but are not limited to omnibus
account fees, litigation or other legal expenses relating to a specific class,
and expenses incurred as a result of issues relating to a specific class.
Notwithstanding the foregoing, the Investment Adviser, the Subadvisers or
other service providers may waive or reimburse the expenses of a specific class
or classes to the extent permitted under Rule 18f-3 under the 1940 Act.
NET ASSET VALUE
The net asset value per share of each Fund is computed as of the close of
regular trading on the NYSE on each day the NYSE is open for trading, typically
4:00 p.m. Eastern time. In addition, Fortis Government Money Market Fund, Fortis
Tax-Exempt Money Market Fund, Fortis Treasury Money Market Fund and Fortis
Institutional Prime Money Market Fund also calculate net asset value each
business day at 10:00 a.m. and 12:00 p.m. Eastern time for its Class S Shares
and 10 a.m., 12 p.m. and 2 p.m. Eastern time for its Class I shares. The NYSE is
closed on New Year's Day, Martin Luther King Jr. Day, Presidents' Day, Good
Friday, Memorial Day, Independence Day, Labor Day, Thanksgiving Day and
Christmas Day. The Money Market Funds also observe the following holidays:
Columbus Day and Veterans Day.
The net asset value per share is computed by adding the value of all
securities and other assets in the portfolio, deducting any liabilities
(expenses and fees are accrued daily) and dividing by the number of shares
outstanding. The portfolio securities of each Fund listed or traded on a
national securities exchange or reported on the NASDAQ National Market System
are valued at the last sale price or NASDAQ Official Closing Price, when
appropriate. If no last sale price or NASDAQ Official Closing Price, when
appropriate, is reported, the mean of the last bid and asked prices is used.
Securities traded over-the-counter are priced at the mean of the latest bid and
asked prices. When market quotations are not readily available or are deemed
unreliable, securities and other assets are valued at fair value as determined
by the Investment Adviser in accordance with guidelines adopted by the Board of
Trustees.
114
Bonds are valued through prices obtained from a commercial pricing service
or at the mean of the most recent bid and asked prices provided by investment
dealers in accordance with procedures established by the Board of Trustees.
Options, futures and options on futures are valued at the settlement price as
determined by the appropriate clearing corporation.
Quotations of foreign securities denominated in foreign currency are
converted to U.S. dollar equivalents using foreign exchange quotations received
from independent dealers. The calculation of the net asset value of each Fund
may not take place contemporaneously with the determination of the prices of
certain portfolio securities of foreign issuers used in such calculation.
Further, under the Trust's procedures, the prices of foreign securities are
determined using information derived from pricing services and other sources.
Information that becomes known to the Trust or its agents after the time that
net asset value is calculated on any Business Day may be assessed in determining
net asset value per share after the time of receipt of the information, but will
not be used to retroactively adjust the price of the security so determined
earlier or on a prior day. Events affecting the values of portfolio securities
that occur between the time their prices are determined and the close of regular
trading on the NYSE (normally 4:00 p.m., Eastern time) may not be reflected in
the calculation of net asset value. If events materially affecting the value of
such securities occur during such period, then these securities may be valued at
fair value as determined by the Investment Advisers and Subadvisers in
accordance with guidelines adopted by the Board of Trustees. Under the fair
valuation procedures adopted by the Board of Trustees, the Funds may rely
primarily on the services of a third party pricing service to determine fair
value prices for foreign securities if certain material events occur. The Board
of Trustees receives a report of any actions taken under the Funds' fair
valuation procedures.
MONEY MARKET FUNDS
The securities held in portfolios of the Fortis Money Market Funds, and
the debt securities with maturities of sixty days or less held by the other
Funds, are valued at amortized cost. When a security is valued at amortized
cost, it is valued at its cost when purchased, and thereafter by assuming a
constant amortization to maturity of any premium or accretion of discount,
unless de minimis, regardless of the impact of fluctuating interest rates on the
market value of the instrument.
A Fortis Money Market Fund's use of amortized cost and the maintenance of
such Fund's net asset value at $1.00 are permitted by Rule 2a-7 under the 1940
Act, provided that certain conditions are met. Rule 2a-7 also requires the Board
of Trustees to establish procedures which are reasonably designed to stabilize
the net asset value per share at $1.00 for the Fortis Money Market Funds. Such
procedures include the determination of the extent of deviation, if any, of the
Funds' current net asset value per share calculated using available market
quotations from the Funds' amortized cost price per share at such intervals as
the Board of Trustees deems appropriate and reasonable in light of market
conditions and periodic reviews of the amount of the deviation and the methods
used to calculate such deviation. In the event that such deviation exceeds 1/2
of 1%, the Board of Trustees is required to consider promptly what action, if
any, should be initiated, and, if the Board of Trustees believe that the extent
of any deviation may result in material dilution or other unfair results to
shareholders, the Board of Trustees is required to take such corrective action
as it deems appropriate to eliminate or reduce such dilution or unfair results
to the extent reasonably practicable. Such actions may include the sale of
portfolio instruments prior to maturity to realize capital gains or losses or to
shorten average portfolio maturity; withholding dividends; redeeming shares in
kind; or establishing a net asset value per share by using available market
quotations. In addition, if the Funds incur a significant loss or liability, the
Board of Trustees has the authority to reduce pro rata the number of shares of
the Funds in each shareholder's account and to offset each shareholder's pro
rata portion of such loss or liability from the shareholder's accrued but unpaid
dividends or from future dividends while each Fund must annually distribute at
least 90% of its investment company taxable income paid without regard to the
deduction for dividends paid by the Fund.
115
In addition, changes in values in the U.S. markets subsequent to the close
of a foreign market may affect the values of securities traded in the foreign
market. Under the Fund's fair value pricing policies, the values of foreign
securities may be adjusted from their last closing prices if such movements in
the U.S. market could exceed a specified threshold. As a result of the
foregoing, it is possible that fair value prices will be used by the Fund to a
significant extent. The Fund has retained an independent statistical fair value
pricing service to assist in the fair valuation of securities principally traded
in a foreign market in order to adjust for possible changes in value that may
occur between the close of the foreign exchange and the time as of which Fund
shares are priced.
REDEMPTIONS-IN-KIND
Larger redemptions may be detrimental to a Fund's existing shareholders.
While each Fund intends to pay all sales proceeds in cash, the Trust, on behalf
of each Fund, reserves the right to honor any request for redemption in excess
of $250,000 during any 90-day period by making payment in whole or in part in
the form of certain securities of the Fund chosen by the Fund and valued as they
are for purposes of computing the Fund's net asset value. This is called a
"redemption-in-kind." A shareholder may need to pay certain sales charges
related to a redemption-in-kind, such as brokerage commissions, when the
securities are sold. For shares that are not held in a tax deferred account,
redemptions-in-kind are taxable for federal income tax purposes in the same
manner as when sales proceeds are paid in cash.
DIVIDENDS
Income dividends and capital gain distributions are reinvested
automatically in additional shares at net asset value, unless you elect to
receive them in cash. Distribution options may be changed at any time by
requesting a change in writing. Any check in payment of dividends or other
distributions which cannot be delivered by the Post Office or which remains
uncashed for a period of more than one year may be changed from cash to
reinvest. Dividends are reinvested on the ex-dividend date at the net asset
value determined at the close of business on that date. Please note that shares
purchased shortly before the record date for a dividend or distribution may have
the effect of returning capital, although such dividends and distributions are
subject to federal income taxes.
FEDERAL INCOME TAXES
The following is intended to be a general summary of certain federal
income tax consequences of investing in the Funds. It is not intended as a
complete discussion of all such consequences or a discussion of circumstances
applicable to certain types of shareholders. Investors are therefore advised to
consult their tax advisors before making an investment decision.
FUND TAXATION
Each Fund intends to qualify or to continue to qualify each year as a
regulated investment company ("RIC") under the Internal Revenue Code of 1986, as
amended (the "Code"). In order to so qualify, a Fund must, among other things,
(i) derive at least 90% of its gross income from dividends, interest, payments
with respect to certain securities loans, gains from the sale of stock,
securities or foreign currencies, other income (including but not limited to
gains from options, futures or forward contracts) derived with respect to its
business of investing in such stock, securities or currencies and net income
derived from interests in qualified publicly traded partnerships, (ii)
distribute at least 90% of its dividend, interest and certain other taxable
income each year and 90% of its net tax-exempt income, and (iii) at the end of
each fiscal quarter (a) maintain at least 50% of the value of its total assets
in cash and cash items, U.S. government securities, securities of other
regulated investment companies, and other
116
securities of issuers which represent, with respect to each issuer, no more than
5% of the value of the Fund's total assets and 10% of the outstanding voting
securities of such issuer, and (b) have no more than 25% of the value of its
total assets invested in the securities (other than those of the U.S. government
or other regulated investment companies) of any one issuer or of two or more
issuers which the Fund controls and which are engaged in the same, similar or
related trades and businesses or the securities of one or more qualified
publicly traded partnerships. The requirements for qualification as a RIC may
limit the extent to which a Fund may invest in certain investments, including
certain commodity ETFs.
To the extent that a Fund qualifies for treatment as a RIC, it will not be
subject to federal income tax on income paid to shareholders in the form of
dividends or capital gains distributions.
A federal excise tax at the rate of 4% will be imposed on the excess, if
any, of a Fund's "required distributions" over actual distributions in any
calendar year. Generally, the "required distribution" is 98% of a Fund's
ordinary income for the calendar year plus 98% of its capital gain net income
recognized during the one-year period ending on October 31 plus undistributed
amounts from prior years. Each Fund intends to make distributions sufficient to
avoid imposition of the excise tax.
If a Fund invests in certain pay-in-kind securities, zero coupon
securities, deferred interest securities or, in general, any other securities
with original issue discount (or with market discount if the Fund elects to
include market discount in income currently), the Fund must accrue income on
such investments for each taxable year, which generally will be prior to the
receipt of the corresponding cash payments. However, a Fund must distribute to
shareholders, at least annually, all or substantially all of its investment
company taxable income (determined without regard to the deduction for dividends
paid), including such accrued income, to avoid federal income and excise taxes.
Therefore, a Fund may have to dispose of its portfolio securities under
disadvantageous circumstances to generate cash, or may have to leverage itself
by borrowing the cash, to satisfy these distribution requirements.
A Fund may acquire market discount bonds. A market discount bond is a
security acquired in the secondary market at a price below its redemption value
(or its adjusted issue price if it is also an original issue discount bond). If
a Fund invests in a market discount bond, it will be required to treat any gain
recognized on the disposition of such market discount bond as ordinary income
(instead of capital gain) to the extent of the accrued market discount, unless
the Fund elects to include the market discount in income as it accrues.
A Fund's investment in lower-rated or unrated debt securities may present
issues for the Fund if the issuers of these securities default on their
obligations because the federal income tax consequences to a holder of such
securities are not certain.
A Fund's transactions, if any, in forward contracts, options, futures
contracts and hedged investments may be subject to special provisions of the
Code that, among other things, may affect the character of gain and loss
realized by a Fund (i.e., may affect whether gain or loss is ordinary or
capital), accelerate recognition of income to a Fund, defer a Fund's losses, and
affect whether capital gain and loss is characterized as long-term or
short-term. These rules could therefore affect the character, amount and timing
of distributions to shareholders. These provisions also may require a Fund to
mark-to-market certain types of positions (i.e., treat them as if they were
closed out), which may cause a Fund to recognize income without receiving cash
with which to make distributions in amounts necessary to satisfy the
distribution requirements for avoiding federal income and excise taxes. The
Funds will monitor their transactions, make the appropriate tax elections, and
make the appropriate entries in their books and records when they acquire any
option, futures contract, forward contract, or hedged investment in order to
mitigate the effect of these rules, prevent disqualification of the Fund as a
RIC, and minimize the imposition of federal income and excise taxes.
117
A Fund may invest to a limited degree in MLPs and ETFs that are treated as
qualified publicly traded partnerships for federal income tax purposes. Net
income derived from an interest in a qualified publicly traded partnership is
included in the sources of income from which a RIC may derive 90% of its gross
income. However, no more than 25% of the value of a RIC's total assets at the
end of each fiscal quarter may be invested in securities of qualified publicly
traded partnerships. If an MLP or ETF in which a Fund invests is taxed as a
partnership for federal income tax purposes, the Fund will be taxable on its
allocable share of the MLP's or ETF's income regardless of whether the Fund
receives any distribution from the MLP or ETF. Thus, a Fund may be required to
sell other securities in order to satisfy the distribution requirements to
qualify as a RIC and to avoid federal income and excise taxes. Distributions to
a Fund from an MLP or ETF that is taxed as a partnership for federal income tax
purposes will constitute a return of capital to the extent of the Fund's basis
in its interest in the MLP or ETF. If a fund's basis is reduced to zero,
distributions will constitute capital gain for federal income tax purposes.
Aston/River Road Dividend All Cap Value Fund and Aston/Fortis Global Real
Estate Fund may invest to a limited degree in royalty and income trusts.
Distributions from such trusts will be treated as dividend income eligible under
the 90% income test described above if the trust is treated as a corporation for
U.S. federal income tax purposes. The Fund intends to invest only in royalty and
income trusts that are treated as corporations for U.S. federal income tax
purposes.
If an option which a Fund has written expires on its stipulated expiration
date, the Fund recognizes a short-term capital gain. If a Fund enters into a
closing purchase transaction with respect to an option which the Fund has
written, the Fund realizes a short-term capital gain (or loss if the cost of the
closing transaction exceeds the premium received when the option was sold)
without regard to any unrealized gain or loss on the underlying security, and
the liability related to such option is extinguished. If a call option which a
Fund has written is exercised, the Fund realizes a capital gain or loss from the
sale of the underlying security and the proceeds from such sale are increased by
the premium originally received.
If an option which a Fund has purchased expires on the stipulated
expiration date, the Fund realizes a short-term or long-term capital loss for
federal income tax purposes in the amount of the cost of the option. If a Fund
exercises a put option, it realizes a capital gain or loss (long-term or
short-term, depending on the holding period of the underlying security) from the
sale of the underlying security which will be decreased by the premium
originally paid.
Options held by a Fund at the end of each fiscal year on a broad-based
stock index are treated under the Code as Section 1256 contracts and will be
required to be "marked-to-market" (i.e., treated as if they were sold) for
federal income tax purposes. Sixty percent of any net gain or loss recognized on
such deemed sales or on any actual sales will be treated as long-term capital
gain or loss, and the remainder will be treated as short-term capital gain or
loss ("60/40 gain or loss"). Certain other options, futures contracts and
options on futures contracts utilized by the Funds are also Section 1256
contracts. Any gains or losses on these Section 1256 contracts held by the Funds
at the end of each taxable year (and on October 31 of each year for purposes of
the 4% excise tax) are also "marked-to-market" with the result that unrealized
gains or losses are treated as though they were realized and the resulting gain
or loss is treated as a 60/40 gain or loss.
Under the Code, gains or losses attributable to fluctuations in exchange
rates which occur between the time a Fund accrues income or other receivables or
accrues expenses or other liability denominated in a foreign currency and the
time the Fund actually collects such receivable or pays such liabilities
generally are treated as ordinary income or loss. Similarly, on disposition of
debt securities denominated in a foreign currency and on disposition of certain
other instruments, gains or losses attributable to fluctuations in the value of
the foreign currency between the date of acquisition of the security or contract
and the date of disposition also may be treated as ordinary gain or loss. These
gains and losses, referred to under the Code as "Section 988" gains or losses,
may increase or decrease the amount of a Fund's investment company taxable
income to be distributed to its shareholders as ordinary income.
118
If a Fund receives an "excess distribution" with respect to the stock of a
passive foreign investment company ("PFIC"), the Fund itself may be subject to
federal income tax on a portion of the excess distribution, whether or not the
corresponding income is distributed by the Fund to shareholders. In general, a
foreign corporation is classified as a PFIC for a taxable year if at least 50%
of its assets constitute certain investment-type assets or 75% or more of its
gross income is certain investment-type income.
Under the PFIC rules, an excess distribution is treated as having been
realized ratably over the period during which the Funds held the PFIC stock. A
Fund itself will be subject to U.S. federal income tax (including interest) on
the portion, if any, of an excess distribution that is so allocated to prior
taxable years. Certain distributions from a PFIC as well as gain from the sale
of PFIC stock are treated as excess distributions. Excess distributions are
characterized as ordinary income even though, absent application of the PFIC
rules, certain excess distributions might have been classified as capital gain.
Rather than being taxed on the PFIC income as discussed above, a Fund may
be eligible to elect alternative tax treatment. Under an election that currently
is available in certain circumstances, a Fund generally would be required to
include in its gross income its share of the PFIC's income and net capital gain
annually, regardless of whether distributions are received from the PFIC in a
given year. In addition, another election may be available that would involve
marking to market a Fund's PFIC shares at the end of each taxable year (and on
certain other dates prescribed in the Code), with the result that unrealized
gains are treated as though they were realized and treated as ordinary income or
loss (subject to certain limitations). If this election were made, federal
income tax at the Fund level under the PFIC rules would generally be eliminated,
but the Fund could, in limited circumstances, incur nondeductible interest
charges. A Fund's intention to qualify annually as a RIC may limit its options
with respect to PFIC shares.
Because the application of the PFIC rules may affect, among other things,
the character of gains and the amount of gain or loss and the timing of the
recognition of income with respect to PFIC shares, and may subject a Fund itself
to tax on certain income from PFIC shares, the amount that must be distributed
to shareholders and that will be taxed to shareholders as ordinary income or
long-term capital gain may be increased or decreased as compared to a fund that
did not invest in PFIC shares.
The Funds may invest in REITs that hold residual interests in real estate
mortgage investment conduits ("REMICs"). Under a notice issued by the IRS, a
portion of a Fund's income from a REIT that is attributable to the REIT's
residual interest in a REMIC (referred to in the Code as an "excess inclusion")
will be subject to federal income tax in all events. The notice provides that
excess inclusion income of a RIC, such as a Fund, will be allocated to
shareholders of the RIC in proportion to the dividends received by such
shareholders, with the same consequences as if the shareholders held the related
REMIC residual interest directly. In general, excess inclusion income allocated
to shareholders (a) cannot be offset by net operating losses (subject to a
limited exception for certain thrift institutions), (b) will constitute
unrelated business taxable income to entities (including a qualified pension
plan, an individual retirement account, a 401(k) plan, a Keogh plan or other
tax-exempt entity) subject to tax on unrelated business income, thereby
potentially requiring such an entity that is allocated excess inclusion income,
and otherwise might not be required to file a federal income tax return, to file
a tax return and pay tax on such income, and (c) in the case of a foreign
shareholder, will not qualify for any reduction in U.S. federal withholding tax.
In addition, if at any time during any taxable year a "disqualified
organization" (as defined by the Code) is a record holder of a share in a RIC,
then the RIC will be subject to a tax equal to that portion of its excess
inclusion income for the taxable year that is allocable to the disqualified
organization, multiplied by the highest federal income tax rate imposed on
corporations.
119
SHAREHOLDER TAXATION
With respect to Funds other than the Tax-Exempt Fund (see discussion
below), shareholders will be subject to federal income taxes on distributions
made by the Funds whether received in cash or additional shares of the Funds.
Distributions of net investment income (including any net short-term capital
gain in excess of any net long-term capital loss), other than "qualified
dividend income," if any, will be taxable to shareholders as ordinary income.
For taxable years beginning prior to January 1, 2011, distributions of qualified
dividend income, as such term is defined in Section 1(h)(11) of the Code
(generally dividends received from U.S. domestic corporations and qualified
foreign corporations), by a Fund to its noncorporate shareholders generally will
be taxed at the federal income tax rates applicable to net capital gain,
provided certain holding period and other requirements described below are
satisfied. Distributions of net capital gain (the excess of net long-term
capital gains over net short-term capital losses), if any, will be taxable to
noncorporate shareholders at a maximum federal income tax rate of 15%, without
regard to how long a shareholder has held shares of a Fund. Unless extended by
future legislation, the 15% federal income tax rate on net capital gain will
expire for taxable years beginning after 2010 and will be replaced by a maximum
federal income tax rate on net capital gains of 20%. Dividends paid by a Fund
may qualify in part for the 70% dividends-received deduction available to
corporate shareholders, provided that certain holding period and other
requirements under the Code are satisfied. Generally, however, dividends
received on stocks of foreign issuers that are held by the Funds are not
eligible for the dividends received deduction when distributed to the Funds'
shareholders.
To be eligible for treatment as qualified dividend income, shareholders
generally must hold their shares for more than 60 days during the 121-day period
beginning 60 days before the ex-dividend date. In order for dividends received
by a Fund's shareholders to be treated as qualified dividend income, a Fund must
also meet holding period and other requirements with respect to such dividend
paying stocks it owns. A dividend will not be treated as qualified dividend
income at the Fund level if the dividend is received with respect to any share
of stock held for 60 days or fewer during the 121-day period beginning on the
date which is 60 days before the date on which such share becomes ex-dividend
with respect to such dividend (or, in the case of certain preferred stock, 90
days or fewer during the 181-day period beginning 90 days before such date). In
addition to the above holding period requirements, a dividend will not be
treated as qualified dividend income (at either the Fund or shareholder level),
(1) to the extent that the recipient is under an obligation (whether pursuant to
a short sale or otherwise) to make related payments with respect to positions in
substantially similar or related property, (2) if the recipient elects to have
the dividend income treated as investment income for purposes of the limitation
on deductibility of investment interest, or (3) if the dividend is received from
a foreign corporation that is (a) not eligible for the benefits of a
comprehensive income tax treaty with the United States (with an exception for
stock that is readily tradable on an established securities market in the United
States) or (b) treated as a PFIC.
If a Fund receives dividends from an ETF that qualifies as a RIC and the
ETF designates such dividends as qualified dividend income, then the Fund may in
turn designate that portion of its distributions derived from those dividends as
qualified dividend income as well, provided the Fund meets the holding period
and other requirements with respect to its shares of the ETF.
Distributions declared by a Fund during October, November or December to
shareholders of record during such month and paid by January 31 of the following
year will be taxable in the year they are declared, rather than the year in
which they are received. Each Fund will notify its shareholders each year of the
amount and type of dividends and distribution it paid.
120
Gain or loss realized upon a redemption or other disposition (such as an
exchange) of shares of a Fund by a shareholder will generally be treated as
long-term capital gain or loss if the shares have been held for more than one
year and, if not held for such a period, as short-term capital gain or loss. Any
loss on the sale or exchange of shares held for six months or less will be
treated as a long-term capital loss to the extent of any long-term capital gain
dividends paid to the shareholder with respect to such shares. Any loss a
shareholder realizes on a sale or exchange of shares will be disallowed if the
shareholder acquires other shares of the Fund (whether through the automatic
reinvestment of dividends or otherwise) or substantially identical stock or
securities within a 61-day period beginning 30 days before and ending 30 days
after the shareholder's sale or exchange of the shares. In such case, the
shareholder's tax basis in the shares acquired will be adjusted to reflect the
disallowed loss. Capital losses may be subject to limitations on their use by a
shareholder.
When a shareholder opens an account, IRS regulations require that the
shareholder provide a taxpayer identification number (TIN), certify that it is
correct, and certify that he, she or it is not subject to backup withholding. If
a shareholder fails to provide a TIN or the proper tax certifications, each Fund
is required to withhold 28% of all distributions (including dividends and
capital gain distributions) and redemption proceeds paid to the shareholder.
Each Fund is also required to begin backup withholding on an account if the IRS
instructs it to do so. Amounts withheld may be applied to the shareholder's
federal income tax liability and the shareholder may obtain a refund from the
IRS if withholding results in an overpayment of federal income tax for such
year.
FOREIGN TAXATION
Income received by a Fund from sources within foreign countries may be
subject to withholding and other taxes imposed by such countries. Tax
conventions between certain countries and the U.S. may reduce or eliminate such
taxes. In addition, the Investment Adviser and Subadvisers intend to manage the
Funds with the intention of minimizing foreign taxation in cases where it is
deemed prudent to do so. If more than 50% of the value of a Fund's total assets
at the close of its taxable year consists of securities of foreign corporations,
such Fund will be eligible to elect to "pass through" to the Fund's shareholders
the amount of eligible foreign income and similar taxes paid by the Fund. If
this election is made, a shareholder generally subject to federal income tax
will be required to include in gross income (in addition to taxable dividends
actually received) his or her pro rata share of foreign taxes in computing his
or her taxable income and to use such amount as a foreign tax credit against his
or her U.S. federal income tax liability or deduct such amount in lieu of
claiming a credit, subject to certain limitations. In particular, shareholders
must hold their shares (without protection from risk of loss) for more than 15
days during the 31-day period beginning 15 days before the ex-dividend date to
be eligible to claim a foreign tax credit with respect to such dividend. These
same holding period rules also generally apply at the Fund level; thus a Fund
that makes an election to pass through any foreign tax amounts must also hold
the stock in such foreign corporations for such specified periods. No deduction
for foreign taxes may be claimed by a shareholder who does not itemize
deductions. Each shareholder will be notified within 60 days after the close of
a Fund's taxable year whether the foreign taxes paid by the Fund will "pass
through" for that year.
Generally, a credit for foreign taxes is subject to the limitation that it
may not exceed the shareholder's U.S. federal income tax attributable to his or
her total foreign source taxable income. For this purpose, if the pass-through
election is made by a Fund, the source of the electing Fund's income will flow
through to shareholders of the Fund. Gains from the sale of securities will be
treated as derived from U.S. sources and certain currency fluctuation gains,
including fluctuation gains from foreign currency-denominated debt securities,
receivables and payables will be treated as ordinary income derived from U.S.
sources. The limitation on the foreign tax credit is applied separately to
foreign source passive income. Shareholders may be unable to claim a credit for
the full amount of their proportionate share of the foreign taxes paid by a
Fund.
121
The use of a fund-of-funds structure could affect the amount, timing, and
character of distributions from an ETF Fund, and, therefore, may increase the
amount of taxes payable by shareholders. Because each ETF Fund will invest a
large portion of its assets in shares of ETFs, its distributable income and
gains will normally consist largely of distributions from the ETFs in which it
invests ("underlying ETFs") and gains and losses on disposition of shares of the
underlying ETFs. Generally, the character of the income or capital gains that an
ETF Fund receives from the underlying ETFs will pass through to the Fund's
shareholders as long as the Fund and underlying ETF qualify as RICs. However, to
the extent that an underlying ETF that qualifies as a RIC realizes net losses on
its investments for a given taxable year, an ETF Fund will not be able to
recognize its share of those losses (so as to offset distributions of net income
or capital gains from other underlying ETFs in which it invests) until it
disposes of shares of such underlying ETF. Moreover, even when an ETF Fund does
make such a disposition, a portion of its loss may be recognized as a long-term
capital loss, which will not be treated as favorably for federal income tax
purposes as an ordinary deduction. In particular, an ETF Fund will not be able
to offset any capital losses from its dispositions of underlying ETF shares
against its ordinary income (including distributions of any net short-term
capital gains from an underlying ETF that qualifies as a RIC). As a result of
the foregoing rules, and certain other special rules, it is possible that the
amounts of net investment income and net capital gains that an ETF Fund will be
required to distribute to shareholders will be greater than such amounts would
have been had the Fund invested directly in the securities held by the
underlying ETFs, rather than investing in shares of the underlying ETFs. For
similar reasons, the character of distributions from an ETF Fund (e.g.,
long-term capital gain, qualified dividend income, etc.) will not necessarily be
the same as it would have been had the Fund invested directly in the securities
held by the underlying ETFs.
Depending on an ETF Fund's percentage ownership in an underlying ETF both
before and after a redemption of the underlying ETF's shares, the Fund's
redemption of shares of such underlying ETF that qualifies as a RIC may cause
the Fund to be treated as receiving a dividend taxable as ordinary income
(although possibly eligeible for qualified dividend income treatment) on the
full amount of the distribution instead of receiving capital gain on only the
amount received in excess of the basis in the shares of the underlying ETF. This
might be the case, for example, where an ETF Fund holds a significant interest
in an underlying ETF and redeems only a small portion of such interest.
TAX-EXEMPT FUND
Fortis Tax-Exempt Money Market Fund (the "Tax-Exempt Fund") intends to
qualify to pay "exempt interest dividends" by satisfying the Code's requirement
that at the close of each quarter of its taxable year at least 50 percent of the
value of its total assets consists of obligations the interest on which is
exempt from federal income tax. So long as this and certain other requirements
are met, dividends consisting of the Fund's net tax-exempt interest income will
be exempt interest dividends, which are exempt from regular federal income tax
in the hands of the shareholders of the Fund. As discussed below, receipt of
certain exempt interest dividends may have federal alternative minimum tax
consequences. Distributions of net investment income received by this Fund from
taxable securities or from net short-term capital gains, if any, realized by the
Fund will be taxable to shareholders as ordinary income whether received in cash
or additional shares of the Fund. Gains of the Tax-Exempt Fund that are
attributable to market discount on certain municipal obligations are treated as
ordinary income to the extent of the accrued market discount on those bonds.
122
Interest on indebtedness incurred by a shareholder in order to purchase or
carry shares in the Tax-Exempt Fund is generally not deductible for federal
income tax purposes to the extent that the Fund distributes exempt-interest
dividends during the taxable year. If a shareholder receives exempt-interest
dividends with respect to any share of this Fund and if such share is held by
the shareholder for six months or less, then any loss on the sale or exchange of
such share will be disallowed to the extent of the amount of exempt-interest
dividends. In addition, the Code may require a shareholder who receives
exempt-interest dividends to treat as taxable income a portion of certain social
security and railroad retirement benefit payments. Furthermore, entities or
persons who are "substantial users" (or persons related to "substantial users")
of facilities financed by "private activity bonds" or certain industrial
development bonds should consult their tax advisers before purchasing shares in
the Tax-Exempt Fund. For these purposes, the term "substantial user" is defined
generally to include a "non-exempt person" who regularly uses in a trade or
business a part of a facility financed from the proceeds of such bonds.
Moreover, some or all dividends received from the Tax-Exempt Fund may be a
specific preference item, or a component of an adjustment item, for purposes of
the federal individual and corporate alternative minimum taxes. The receipt of
these exempt-interest dividends and distributions also may affect a foreign
corporate shareholder's federal "branch profits" tax liability, and an S
corporation shareholder's federal tax on "passive investment income."
Shareholders of the Tax-Exempt Fund should consult their tax advisers to
determine whether any portion of the income dividends received from the Fund is
considered tax exempt in their particular states. Issuers of securities
purchased by the Tax-Exempt Fund (or the beneficiary of such bonds) may have
made certain representations or covenants in connection with the issuance of
such securities to satisfy certain requirements of the Code that must be
satisfied subsequent to the issuance of such bonds. Shareholders should be aware
that exempt-interest dividends may become subject to federal income taxation
retroactively to the date of issuance of the bonds to which such dividends are
attributable if such representations are determined to have been inaccurate or
if the issuers (or the beneficiary) of the bonds fail to comply with certain
covenants made at that time.
Exempt interest dividends, as well as other distributions by the Fortis
Tax-Exempt Money Market Fund, and redemption proceeds paid to you may be subject
to backup withholding, if you fail to provide the Fund with your taxpayer
identification number and required tax certifications.
Tax legislation may, from time to time, include provisions that may affect
the supply of, and demand for, tax-exempt securities, as well as the tax-exempt
nature of interest paid thereon. It is not possible to predict with certainty
the effect of tax law changes upon the tax-exempt market, including the
availability of obligations appropriate for investment, nor is it possible to
predict any additional restrictions.
OTHER TAXES
Dividends and distributions also may be subject to state and local taxes.
Shareholders are urged to consult their tax advisers regarding the application
of federal, foreign, state and local taxes to their particular situation.
The foregoing discussion relates solely to U.S. federal income tax law as
applied to U.S. investors. Non-U.S. investors should consult their tax advisers
concerning the tax consequences of ownership of shares of the Funds, including
the possibility that distributions may be subject to a 30% U.S. withholding tax
(or a reduced rate of withholding provided by an applicable treaty). However,
effective for taxable years of a Fund beginning before January 1, 2010, a Fund
will generally not be required to withhold tax on any amounts paid to a non-U.S.
investor with respect to dividends attributable to "qualified short-term gain"
(i.e., the excess of net short-term capital gain over net long-term capital
loss) designated as such by a Fund and dividends attributable to certain U.S.
source interest income that would not be subject to federal withholding tax if
earned directly by a non-U.S. person, provided such amounts are properly
designated by the Fund. A Fund may choose not designate such amounts.
123
Special rules apply to foreign persons who receive distributions from a
Fund that are attributable to gain from "United States real property interests"
("USRPIs"). The Code defines USRPIs to include direct holdings of U.S. real
property and any interest (other than an interest solely as a creditor) in a
"United States real property holding corporation." The Code defines a United
States real property holding corporation as any corporation whose USRPIs make up
50% or more of the fair market value of its USRPIs, its interests in real
property located outside the United States, plus any other assets it uses in a
trade or business. In general, if a Fund is a United States real property
holding corporation (determined without regard to certain exceptions), the
distribution of gains from USRPIs to foreign shareholders that own more than 5%
of a class of such Fund's shares at any time during the one-year period ending
on the date of the distribution is subject to U.S. federal income tax
withholding at a rate of 35% and obligates such foreign shareholder to file a
U.S. income tax return. To the extent a distribution to such a foreign
shareholder is attributable directly or indirectly to gains from the sale or
exchange of USRPIs recognized by a REIT in which the Fund invests, the Code
treats that gain as the distribution of gain from a USRPI to the foreign
shareholder which would be subject to U.S. withholding tax of 35% and would
result in U.S. income tax filing obligations for the foreign shareholder.
PERFORMANCE INFORMATION
From time to time, the Trust may include general comparative information,
such as statistical data regarding inflation, securities indices or the features
or performance of alternative investments, in advertisements, sales literature
and reports to shareholders. The Trust may also include calculations, such as
hypothetical compounding examples or tax-free compounding examples, which
describe hypothetical investment results in such communications. Such
performance examples will be based on an express set of assumptions and are not
indicative of the performance of any Fund. In addition, the Trust may include
charts comparing various tax-free yields versus taxable yield equivalents at
different income levels.
From time to time, the yield and total return of a Fund may be quoted in
advertisements, shareholder reports or other communications to shareholders.
FINANCIAL STATEMENTS
The Funds' audited financial statements for the fiscal year ended October
31, 2008, including the report of KPMG LLP, the Fortis Money Market Funds'
independent registered public accounting firm, and Ernst & Young, the
independent registered public accounting firm for each Fund other than the
Fortis Money Market Funds, are incorporated herein by reference to the Funds'
Annual Report as filed with the SEC. The Funds' Annual and Semi-Annual Reports
are available upon request and without charge.
OTHER INFORMATION
The prospectuses and this SAI do not contain all the information included
in the Registration Statement filed with the SEC under the 1933 Act with respect
to the securities offered by the Trust's prospectuses. Certain portions of the
Registration Statement have been omitted from the prospectuses and this SAI
pursuant to the rules and regulations of the SEC. The Registration Statement
including the exhibits filed therewith, may be examined at the office of the SEC
in Washington, D.C.
Statements contained in the prospectuses or in this SAI as to the contents
of any contract or other document referred to are not necessarily complete. In
each instance reference is made to the copy of such contract or other document
filed as an exhibit to the Registration Statement of which the prospectus and
this SAI forms a part. Each such statement is qualified in all respects by such
reference.
124
APPENDIX A
Commercial Paper Ratings
A Standard & Poor's Ratings Services ("S&P") commercial paper rating is a
current opinion of the creditworthiness of an obligor with respect to financial
obligations having an original maturity of no more than 365 days. The following
summarizes the rating categories used by S&P for commercial paper:
"A-1" -- Obligations are rated in the highest category indicating that the
obligor's capacity to meet its financial commitment on the obligation is strong.
Within this category, certain obligations are designated with a plus sign (+).
This indicates that the obligor's capacity to meet its financial commitment on
these obligations is extremely strong.
"A-2" -- Obligations are somewhat more susceptible to the adverse effects
of changes in circumstances and economic conditions than obligations in higher
rating categories. However, the obligor's capacity to meet its financial
commitment on the obligation is satisfactory.
"A-3" -- Obligations exhibit adequate protection parameters. However,
adverse economic conditions or changing circumstances are more likely to lead to
a weakened capacity of the obligor to meet its financial commitment on the
obligation.
"B" -- Obligations are regarded as having significant speculative
characteristics. The obligor currently has the capacity to meet its financial
commitment on the obligation; however, it faces major ongoing uncertainties,
which could lead to the obligor's inadequate capacity to meet its financial
commitment on the obligation.
"C" -- Obligations are currently vulnerable to nonpayment and are
dependent upon favorable business, financial, and economic conditions for the
obligor to meet its financial commitment on the obligation.
"D" -- Obligations are in payment default. The "D" rating category is used
when payments on an obligation are not made on the date due even if the
applicable grace period has not expired, unless S&P believes that such payments
will be made during such grace period. The "D" rating will be used upon the
filing of a bankruptcy petition or the taking of a similar action if payments on
an obligation are jeopardized.
Moody's Investors Service, Inc. ("Moody's") commercial paper ratings are
opinions of the ability of issuers to honor senior financial obligations and
contracts. These obligations have an original maturity not exceeding one year,
unless explicitly noted. The following summarizes the rating categories used by
Moody's for commercial paper:
"Prime-1" -- Issuers (or supporting institutions) have a superior ability
for repayment of senior short-term debt obligations. Prime-1 repayment ability
will often be evidenced by many of the following characteristics: leading market
positions in well-established industries; high rates of return on funds
employed; conservative capitalization structure with moderate reliance on debt
and ample asset protection; broad margins in earnings coverage of fixed
financial charges and high internal cash generation; and well-established access
to a range of financial markets and assured sources of alternate liquidity.
"Prime-2" -- Issuers (or supporting institutions) have a strong ability
for repayment of senior short-term debt obligations. This will normally be
evidenced by many of the characteristics cited above but to a lesser degree.
Earnings trends and coverage ratios, while sound, may be more subject to
variation. Capitalization characteristics, while still appropriate, may be more
affected by external conditions. Ample alternate liquidity is maintained.
125
"Prime-3" -- Issuers (or supporting institutions) have an acceptable
ability for repayment of senior short-term debt obligations. The effect of
industry characteristics and market compositions may be more pronounced.
Variability in earnings and profitability may result in changes in the level of
debt protection measurements and may require relatively high financial leverage.
Adequate alternate liquidity is maintained.
"Not Prime" -- Issuers do not fall within any of the Prime rating
categories.
Fitch Ratings ("Fitch") short-term ratings apply to time horizons of less
than 12 months for most obligations, or up to three years for U.S. public
finance securities, and thus places greater emphasis on the liquidity necessary
to meet financial commitments in a timely manner. The following summarizes the
rating categories used by Fitch for short-term obligations:
"F1" -- Securities possess the highest credit quality. This designation
indicates the strongest capacity for timely payment of financial commitments and
may have an added "+" to denote any exceptionally strong credit feature.
"F2" -- Securities possess good credit quality. This designation indicates
a satisfactory capacity for timely payment of financial commitments, but the
margin of safety is not as great as in the case of the higher ratings.
"F3" -- Securities possess fair credit quality. This designation indicates
that the capacity for timely payment of financial commitments is adequate;
however, near-term adverse changes could result in a reduction to non-investment
grade.
"B" -- Securities possess speculative credit quality. This designation
indicates minimal capacity for timely payment of financial commitments, plus
vulnerability to near-term adverse changes in financial and economic conditions.
"C" -- Securities possess high default risk. This designation indicates a
capacity for meeting financial commitments, which is solely reliant upon a
sustained, favorable business and economic environment.
"D" -- Securities are in actual or imminent payment default.
126
Corporate and Municipal and Long Term Debt Ratings
The following summarizes the ratings used by S&P for corporate and
municipal debt:
"AAA" -- An obligation rated "AAA" has the highest rating assigned by
Standard & Poor's. The obligor's capacity to meet its financial commitment on
the obligation is extremely strong.
"AA" -- An obligation rated "AA" differs from the highest rated
obligations only in small degree. The obligor's capacity to meet its financial
commitment on the obligation is very strong.
"A" -- An obligation rated "A" is somewhat more susceptible to the adverse
effects of changes in circumstances and economic conditions than obligations in
higher-rated categories. However, the obligor's capacity to meet its financial
commitment on the obligation is still strong.
"BBB" -- An obligation rated "BBB" exhibits adequate protection
parameters. However, adverse economic conditions or changing circumstances are
more likely to lead to a weakened capacity of the obligor to meet its financial
commitment on the obligation.
Obligations rated "BB," "B," "CCC," "CC" and "C" are regarded as having
significant speculative characteristics. "BB" indicates the least degree of
speculation and "C" the highest. While such obligations will likely have some
quality and protective characteristics, these may be outweighed by large
uncertainties or major exposures to adverse conditions.
"BB" -- An obligation rated "BB" is less vulnerable to nonpayment than
other speculative issues. However, it faces major ongoing uncertainties or
exposure to adverse business, financial or economic conditions, which could lead
to the obligor's inadequate capacity to meet its financial commitment on the
obligation.
"B" -- An obligation rated "B" is more vulnerable to nonpayment than
obligations rated "BB," but the obligor currently has the capacity to meet its
financial commitment on the obligation. Adverse business, financial or economic
conditions will likely impair the obligor's capacity or willingness to meet its
financial commitment on the obligation.
"CCC" -- An obligation rated "CCC" is currently vulnerable to nonpayment,
and is dependent upon favorable business, financial and economic conditions for
the obligor to meet its financial commitment on the obligation. In the event of
adverse business, financial, or economic conditions, the obligor is not likely
to have the capacity to meet its financial commitment on the obligation.
"CC" -- An obligation rated "CC" is currently highly vulnerable to
nonpayment.
"C" -- An obligation rated "C" is currently highly vulnerable to
nonpayment. The "C" rating may be used to cover a situation where a bankruptcy
petition has been filed or similar action taken, but payments on this obligation
are being continued.
"D" -- An obligation rated "D" is in payment default. The "D" rating
category is used when payments on an obligation are not made on the date due
even if the applicable grace period has not expired, unless S&P believes that
such payments will be made during such grace period. The "D" rating also will be
used upon the filing of a bankruptcy petition or the taking of a similar action
if payments on an obligation are jeopardized.
-- PLUS (+) OR MINUS (-) -- The ratings from "AA" through "CCC" may be
modified by the addition of a plus or minus sign to show relative standing
within the major rating categories.
127
The following summarizes the ratings used by Moody's for corporate and
municipal long-term debt:
"Aaa" -- Bonds are judged to be of the best quality. They carry the
smallest degree of investment risk and are generally referred to as "gilt
edged." Interest payments are protected by a large or by an exceptionally stable
margin and principal is secure. While the various protective elements are likely
to change, such changes as can be visualized are most unlikely to impair the
fundamentally strong position of such issues.
"Aa" -- Bonds are judged to be of high quality by all standards. Together
with the "Aaa" group they comprise what are generally known as high-grade bonds.
They are rated lower than the best bonds because margins of protection may not
be as large as in "Aaa" securities or fluctuation of protective elements may be
of greater amplitude or there may be other elements present that make the
long-term risk appear somewhat larger than the "Aaa" securities.
"A" -- Bonds possess many favorable investment attributes and are to be
considered as upper-medium-grade obligations. Factors giving security to
principal and interest are considered adequate, but elements may be present that
suggest a susceptibility to impairment sometime in the future.
"Baa" -- Bonds are considered as medium-grade obligations, (i.e., they are
neither highly protected nor poorly secured). Interest payments and principal
security appear adequate for the present but certain protective elements may be
lacking or may be characteristically unreliable over any great length of time.
Such bonds lack outstanding investment characteristics and in fact have
speculative characteristics as well.
"Ba" -- Bonds are judged to have speculative elements; their future cannot
be considered as well-assured. Often the protection of interest and principal
payments may be very moderate, and thereby not well safeguarded during both good
and bad times over the future. Uncertainty of position characterizes bonds in
this class.
"B" -- Bonds generally lack characteristics of the desirable investment.
Assurance of interest and principal payments or of maintenance of other terms of
the contract over any long period of time may be small.
"Caa" -- Bonds are of poor standing. Such issues may be in default or
there may be present elements of danger with respect to principal or interest.
"Ca" -- Bonds represent obligations, which are speculative in a high
degree. Such issues are often in default or have other marked shortcomings.
"C" -- Bonds are the lowest rated Class of bonds, and issues so rated can
be regarded as having extremely poor prospects of ever attaining any real
investment standing.
Note: Moody's applies numerical modifiers 1, 2, and 3 in each generic
rating classification from "Aa" through "Caa." The modifier 1 indicates that the
obligation ranks in the higher end of its generic rating category; the modifier
2 indicates a mid-range ranking; and the modifier 3 indicates a ranking in the
lower end of its generic rating category.
The following summarizes long-term ratings used by Fitch:
"AAA" -- Securities considered to be investment grade and of the highest
credit quality. These ratings denote the lowest expectation of credit risk and
are assigned only in case of exceptionally strong capacity for timely payment of
financial commitments. This capacity is highly unlikely to be adversely affected
by foreseeable events.
128
"AA" -- Securities considered to be investment grade and of very high
credit quality. These ratings denote a very low expectation of credit risk and
indicate very strong capacity for timely payment of financial commitments. This
capacity is not significantly vulnerable to foreseeable events.
"A" -- Securities considered to be investment grade and of high credit
quality. These ratings denote a low expectation of credit risk and indicate
strong capacity for timely payment of financial commitments. This capacity may,
nevertheless, be more vulnerable to changes in circumstances or in economic
conditions than is the case for higher ratings.
"BBB" -- Securities considered to be investment grade and of good credit
quality. These ratings denote that there is currently a low expectation of
credit risk. The capacity for timely payment of financial commitments is
considered adequate, but adverse changes in circumstances and in economic
conditions are more likely to impair this capacity. This is the lowest
investment grade category.
"BB" -- Securities considered to be speculative. These ratings indicate
that there is a possibility of credit risk developing, particularly as the
result of adverse economic change over time; however, business or financial
alternatives may be available to allow financial commitments to be met.
Securities rated in this category are not investment grade.
"B" -- Securities are considered highly speculative. These ratings
indicate that significant credit risk is present, but a limited margin of safety
remains. Financial commitments are currently being met; however, capacity for
continued payment is contingent upon a sustained, favorable business and
economic environment.
"CCC," "CC" and "C" -- Securities have high default risk. Default is a
real possibility, and capacity for meeting financial commitments is solely
reliant upon sustained, favorable business or economic developments. "CC"
ratings indicate that default of some kind appears probable, and "C" ratings
signal imminent default.
"DDD," "DD" and "D" -- Securities are in default. The ratings of
obligations in this category are based on their prospects for achieving partial
or full recovery in a reorganization or liquidation of the obligor. While
expected recovery values are highly speculative and cannot be estimated with any
precision, the following serve as general guidelines. "DDD" obligations have the
highest potential for recovery, around 90%-100% of outstanding amounts and
accrued interest. "DD" indicates potential recoveries in the range of 50%-90%,
and "D" the lowest recovery potential, i.e., below 50%.
Entities rated in this category have defaulted on some or all of their
obligations. Entities rated "DDD" have the highest prospect for resumption of
performance or continued operation with or without a formal reorganization
process. Entities rated "DD" and "D" are generally undergoing a formal
reorganization or liquidation process; those rated "DD" are likely to satisfy a
higher portion of their outstanding obligations, while entities rated "D" have a
poor prospect for repaying all obligations.
MUNICIPAL NOTE RATINGS
A S&P note rating reflects the liquidity factors and market access risks
unique to notes due in three years or less. The following summarizes the ratings
used by Standard & Poor's for municipal notes:
129
"SP-1" -- The issuers of these municipal notes exhibit a strong capacity
to pay principal and interest. Those issues determined to possess a very strong
capacity to pay debt service are given a plus (+) designation.
"SP-2" -- The issuers of these municipal notes exhibit satisfactory
capacity to pay principal and interest, with some vulnerability to adverse
financial and economic changes over the term of the notes.
"SP-3" -- The issuers of these municipal notes exhibit speculative
capacity to pay principal and interest.
Moody's ratings for state and municipal notes and other short-term loans
are designated Moody's Investment Grade ("MIG") and variable rate demand
obligations are designated Variable Moody's Investment Grade ("VMIG"). Such
ratings recognize the differences between short-term credit risk and long-term
risk. The following summarizes the ratings by Moody's Investors Service, Inc.
for short-term notes:
"MIG-1"/ "VMIG-1" -- This designation denotes superior credit quality.
Excellent protection afforded by established cash flows, highly reliable
liquidity support or demonstrated broad-based access to the market for
refinancing.
"MIG-2"/ "VMIG-2" -- This designation denotes strong credit quality.
Margins of protection are ample although not so large as in the preceding group.
"MIG-3"/ "VMIG-3" -- This designation denotes acceptable credit. Liquidity
and cash flow protection may be narrow and market access for refinancing is
likely to be less well established.
"SG" -- This designation denotes speculative-grade credit quality. Debt
instruments in this category lack sufficient margins of protection.
Fitch uses the same ratings for municipal securities as described above
for other short-term credit ratings.
130
APPENDIX B
PROXY VOTING POLICIES AND PROCEDURES
Aston Funds
Fortis Investment Management
USA, Inc.
Massachusetts Financial Services Company
Montag & Caldwell, Inc.
Neptune Investment Management Limited
Summary of Optimum Investment Advisors LP
River Road Asset Management, LLC
TAMRO Capital Partners LLC
Taplin, Canida & Habacht, LLC
Veredus Asset Management LLC
New Century Capital Management LLC
Smart Portfolios LLC
Baring Asset Management Group Companies
Cardinal Capital Management L.L.C.
MB Investment Partners, Inc.
131
ASTON FUNDS
PROXY VOTING POLICIES AND PROCEDURES
1. Definitions.
"Sub-Adviser" shall mean ABN AMRO Asset Management, Inc., Montag &
Caldwell Inc., TAMRO Capital Partners, LLC, Veredus Asset Management LLC, River
Road Asset Management, LLC, MFS Institutional Advisors Inc., Optimum Investment
Advisors, LLC, Taplin, Canida & Habacht Inc., McDonnell Investment Management,
LLC, Neptune Investment Management Limited, Resolution Investment Services
Limited, Baring International Investment Limited, ClariVest Asset Management
LLC, Cardinal Capital Management L.L.C., and Strategic Global Advisors, LLC. The
term includes all sub-advisers to the Funds.
"Sub-Advisers' PROXY VOTING POLICIES AND PROCEDURES" shall mean the Proxy
Voting Policies and Procedures of each Adviser, as amended from time to time.
"Board" shall mean the Board of Trustees of Aston Funds.
"Fund" shall mean a series of Aston Funds.
"Fund Management" shall mean the Chairman of the Board of Trustees, Chief
Executive Officer or Chief Financial Officer of Aston Funds.
"Trust" shall mean Aston Funds.
2. Delegation Of Proxy Voting Authority. The Trust has delegated to the
applicable Sub-Adviser responsibility for voting all proxies for which a Fund is
entitled to vote in accordance with the Proxy Voting Policies and Procedures of
each Sub-Adviser, and each Sub-Adviser has accepted such delegation. Each
Sub-Adviser shall provide the Board with a copy of its Proxy Voting Policies and
Procedures and such other information that the Board deems necessary.
3. Limitations On The Advisers' Responsibilities.
(i) Limited Value. Each Sub-Adviser may abstain from voting a Fund proxy
if it concludes that the Fund's economic interests or the value of the portfolio
holding is indeterminable or insignificant.
(ii) Unjustifiable Costs. Each Sub-Adviser may abstain from voting a Fund
proxy for cost reasons (e.g., cost associated with voting proxies of non-U.S.
securities). In accordance with the Sub-Adviser's duties, it shall weigh the
costs and benefits of voting proxy proposals relating to foreign securities and
shall make an informed decision with respect to whether voting a given proxy
proposal is prudent. The Sub-Adviser's decision shall take into account the
effect that the Fund's vote, either by itself or together with other votes, is
expected to have on the value of the Fund's investment and whether this expected
effect would outweigh the cost of voting.
(iii) Fund Restrictions. Each Sub-Adviser shall vote Fund proxies in
accordance with any applicable investment restrictions of the affected Fund.
(iv) Board Direction. Notwithstanding the foregoing delegation to the
Sub-Advisers, the Board may from time to time direct a Sub-Adviser to vote a
Fund's proxies in a manner that is different from the guidelines set forth in
the Sub-Adviser's Proxy Voting Policies and Procedures. After its receipt of any
such direction, the Sub-Adviser shall follow any such direction for proxies
received after its receipt of such direction.
4. Subdelegation. Each Sub-Adviser may delegate its responsibilities under
these Proxy Voting Policies and Procedures to a third party, provided that no
such delegation shall relieve the Sub-Adviser of its responsibilities hereunder
and the Sub-Adviser shall retain final authority and fiduciary responsibility
for proxy voting. If a Sub-Adviser delegates such responsibilities, the
Sub-Adviser shall monitor the delegate's compliance with these Proxy Voting
Policies and Procedures.
5. Proxy VotinG Expense. Each Sub-Adviser shall bear all expenses
associated with voting its proxies and complying with applicable laws related to
voting proxies (including expenses associated with engaging third parties to
vote a Fund's proxies. Each Fund shall promptly reimburse the applicable
Sub-Adviser for any out-of-pocket expenses incurred by such Sub-Adviser in
performing services related to Institutional Shareholder Services, Inc.
maintaining a Fund's proxy voting records or filings on Form N-PX.
6. Conflicts Of Interest. Each Sub-Adviser shall follow the Conflict of
Interest provisions set forth in its Proxy Voting Policies and Procedures. Until
such time as each Sub-Adviser's Proxy Voting Policies and Procedures address
conflicts of interest, each Adviser shall comply with the following procedures:
the Sub-Adviser shall review each Fund proxy to assess the extent, if any, to
which there may be a material conflict between the interests of the applicable
Fund on the one hand and the Sub-Adviser and its affiliates, directors,
officers, employees (and other similar persons) on the other hand (a "potential
conflict"). The Sub-Adviser shall perform this assessment on a
proposal-by-proposal basis and a potential conflict with respect to one proposal
in a proxy shall not indicate that a potential conflict exists with respect to
any other proposal in such proxy. If the Sub-Adviser determines that a potential
conflict may exist, it shall promptly report the matter to Fund Management. Fund
Management shall determine whether a potential conflict exists and is authorized
to resolve any such conflict in a manner that is in the collective best
interests of the applicable Fund and Sub-Adviser's other clients (excluding any
client that may have a potential conflict). Without limiting the generality of
the foregoing, Fund Management may resolve a potential conflict in any of the
following manners:
(i) If the proposal that gives rise to a potential conflict is
specifically addressed in the applicable Sub-Adviser's Proxy Voting Policies and
Procedures, Fund Management may direct the Sub-Adviser to vote the proxy in
accordance with the pre-determined policies and guidelines set forth in the
Sub-Adviser's Proxy Voting Policies and Procedures; provided that such
pre-determined policies and guidelines involve little discretion on the part of
the Sub-Adviser;
(ii) Fund Management may disclose the potential conflict to the
Board and obtain the Board's consent before directing the Sub-Adviser to vote in
the manner approved by the Board;
(iii) Fund Management may direct the Sub-Adviser to engage an
independent third-party to determine how the proxy should be voted; or
(iv) Fund Management may direct the Sub-Adviser to establish an
ethical wall or other informational barriers between the person(s) that are
involved in the potential conflict and the person(s) making the voting decision
in order to insulate the potential conflict from the decision maker.
132
Each Sub-Adviser shall use commercially reasonable efforts to determine whether
a potential conflict may exist, and a potential conflict shall be deemed to
exist if and only if one or more of the Sub-Adviser's senior account
representatives actually knew or reasonably should have known of the potential
conflict.
7. Approval Of Material Changes. Any material changes to the Trust's Proxy
Voting Policies and Procedures shall be promptly submitted to the Board for
approval. Any material changes in the applicable Sub-Adviser's Proxy Voting
Policies and Procedures shall be reported to the Board at the next quarterly
meeting following such changes.
8. Reports To The Board. At each quarterly meeting of the Board, each
Sub-Adviser shall submit a report to the Board (Exhibit A) describing:
(i) any issues arising under these Proxy Voting Policies and
Procedures since the last report to the Board and the resolution of such issues,
including but not limited to, information about conflicts of interest not
addressed in such Policies and Procedures; and
(ii) any proxy votes taken by the Sub-Adviser on behalf of the Funds
since the last report to the Board which were exceptions from the Sub-Adviser's
Proxy Voting Policies and Procedures and the reasons for any such exceptions.
In addition, no less frequently than annually, Fund Management shall furnish to
the Board, and the Board shall consider, a written report identifying any
recommended changes in existing policies based upon the Sub-Advisers' experience
under these Proxy Voting Policies and Procedures and each Sub-Adviser's Proxy
Voting Policies and Procedures, evolving industry practices and developments in
applicable laws or regulations.
9. Maintenance Of Records. Each Sub-Adviser shall maintain at its principal
place of business the records required to be maintained by the applicable Fund
with respect to proxies by the Investment Company Act of 1940, as amended, and
the Investment Advisers Act of 1940, as amended, in accordance with the
requirements and interpretations thereof. Each Sub-Adviser must maintain proxy
statements that it receives regarding Fund securities, but need not to the
extent that such proxy statements are available on the SEC's EDGAR system. The
Sub-Advisers may also rely upon a third party to maintain certain records
required to be maintained by the Advisers Act and 1940 Act. Each Sub-Adviser
shall maintain and provide such records to the Fund in a mutually agreeable
format for filing by the Fund on Form N-PX. Each Adviser acknowledges that the
records maintained under the 1940 Act are the property of the Fund and agrees to
transfer such records to the Fund upon request.
Adopted: November 30, 2006
Amended: September 30, 2007
133
EXHIBIT A
[NAME OF ADVISER]
[ ] FUND(S)
PROXY VOTING QUARTERLY REPORT
I, the undersigned Compliance Officer of [Name of Adviser], hereby submit
the following report with respect to [ ] Fund(s):
1. During the quarter ended [ ] there have been no issues that have arisen
under [Name of Adviser]'s Proxy Voting Policies and Procedures and no conflicts
of interest that are not addressed in its policies and procedures.
2. During the quarter ended [ ] there have been no proxy votes taken by
[Name of Adviser], on behalf of [ ] Fund(s), which were exceptions to [Name of
Adviser]'s Proxy Voting Policies and Procedures.
3. During the quarter ended [ ] there have been no material changes to [Name
of Adviser]'s Proxy Voting Policies and Procedures.
----------------------------------------------
[ ]
Compliance Officer
Dated:
134
FORTIS INVESTMENT MANAGEMENT USA, INC.
PROXY VOTING
POLICIES AND PROCEDURES
INTRODUCTION
In an ever-advancing integration process of international financial markets,
international institutional investors increasingly regard it as their fiduciary
duty to exercise the voting rights of their investments in line with good
governance principles. Fortis Investments considers that proxy voting -- the
exercise of voting rights -- is a built-in element of the investment process of
an active asset manager.
This document forms the voting policy with guidelines on which the voting
recommendations of internal and external parties involved are based. However, it
should be mentioned that the current voting policy forms a dynamic set of
guidelines that evolves is continuously updated and modified to adequately
respond to market changes.
Following the start of the proxy voting process for European equities large caps
held by Belgian and Luxembourg funds in February 2003, the client base for which
proxy voting is done has been gradually broadened to funds in other
jurisdictions and to some institutional mandates.
From 1 March 2005, the scope of proxy voting was extended to US, Asian and
European small cap securities held by European portfolios. With the existing
coverage of US securities in US portfolios, Fortis Investments delivers
worldwide proxy voting services for portfolios, funds as well as institutional
mandates, under management. Besides, a process for Corporate and Social
Responsibility (CSR) reporting issues has been in place for European Equities
large caps since the start of 2004.
STATEMENT OF PRINCIPLES
In general, Fortis Investments advises its clients to delegate the power to vote
proxies to Fortis Investments aiming at enhancing shareholders interests in
respect of the issues explained in this policy.
135
Fortis Investments shall vote the proxies of its clients solely in the interest
of its clients, and ultimately for the participants in the pension funds or
shareholders of mutual funds, and for the exclusive purpose of providing
benefits to them. Fortis Investments shall not subordinate the interests of its
clients to unrelated objectives. Fortis Investments shall act with care, skill,
prudence and diligence under the circumstances then prevailing that a prudent
person acting in like capacity and familiar with such matters would use.
Fortis Investments shall analyse each proxy, using the guidelines and procedures
outlined below, subject to the requirement that all votes shall be cast solely
in the interest of our clients. These guidelines cannot and do not purport to be
exhaustive; the variety of issues appearing on proxy ballots precludes Fortis
Investments from fashioning a guideline for every potential circumstance.
Instead, these guidelines are intended to cover the most significant and
frequent proxy issues that arise. As stated above, issues not covered by these
guidelines shall be voted in the interests of the clients of Fortis Investments.
Transparency is one of the major pillars of Corporate Governance. Shareholders
must be in a position to understand the strategic, accounting, and financial
situation of the company and the corporate outlook in the business fields the
company or group operates within. Companies are also expected to disclose
evidence that their production, activities and, where applicable, research and
development activities respect social and environmental standards.
The information should be accessible via different communication channels and
should be adequate in its scope and depth. Its quality will help to guarantee
maximum transparency between the Board of Directors and the shareholder.
In assessing the voting items and their effect on the company's long-term health
particular notice is taken of the contents of the management report, the
auditor's statement, and the accounts and, depending on the Board structure, the
supervisory board report. Particular attention is paid to the following pieces
of information, which are necessary to understand the state of the company and
to assess the voting items with sufficient background:
The situation of the company/group and its activity during the past
financial year
The foreseeable evolution of the company and its future prospects
The state of employee shareholdings as of the last day of the financial
year
Any modification in the presentation of the annual accounts (or valuation
rules)
The options outstanding and exercised by employees
The number of own shares purchased and their use
The total value of dividends distributed during the last 3 financial years
Information relative to the share capital
The ownership structure of the group
The proportions of outstanding (convertible) bonds and their features
DUTY TO VOTE PROXIES
For clients that have delegated proxy authority to Fortis Investments, Fortis
Investments will make every reasonable effort to ensure that proxies are
received and are voted in accordance with these policies.
All Fortis Investments clients are informed that these policies and procedures
are in place. All clients are afforded the opportunity to obtain information
concerning the voting record of shares held for their beneficial interest.
THE FORTIS INVESTMENTS PROXY VOTING COMMITTEE
Fortis Investments has appointed a Proxy Voting Committee (PVC) that is
empowered to establish voting guidelines and is responsible to ensure that these
guidelines and procedures are followed. As proxy voting is considered as an
integral part of the investment process, the final responsibility for proxy
voting lies with the head of the investment division, the Chief Investment
Officer (CIO). The PVC consists of four officers appointed by the company's
Group Executive Committee. The current members are: the CIO, William de Vijlder;
the Head of Socially Responsible Investment, Stewart Armer; the Head of Fund
Legal Service, Paul Mestag, and the Group Compliance Officer, Paul Martin. Each
of the persons can be represented by his/her back-up.
136
Fortis Investments has executed a contract with a proxy voting service provider
(as described more fully below) that will provide Fortis Investments with in
depth analysis and recommendations with regard to voting proxies. It is expected
that the Committee will generally accept these analyses and recommendations in
making its voting decisions, especially in those matters that are deemed
routine.
PROXY VOTING PROCESS
Upon receipt of the periodical calendar with the upcoming AGM's or EGM's from
the proxy voting service provider (ISS), the relevant Investment Centre analyses
the voting recommendations using the web-based application. Based on input of
the relevant analyst, the PVC may decide to adapt the voting recommendation of
the proxy voting service. Subsequently, the PVC validates the adapted voting
recommendation, decides on the percentage of the shares to be blocked for proxy
voting - standard 100% of the shares of the positions in eligible funds if this
is the market practice -- , and forwards the decision to the Operations
department.
The proxy voting service provider requires a mandatory sign off, however, for
meetings a sign-off is not obtained by ISS, ballots will be voted according to
the vote recommendations made by ISS based on the proxy voting policy.
The Operations department is responsible for the blocking the position (if
necessary) in the order management system and updating web-based voting
application Votex through which the custodian is informed.
The proxy will be given to the chairman of the company, to a designated person
with the company (for countries where the chairman is not allowed) or to the
custodian. For extraordinary meetings/resolutions, the PVC can decide to
delegate the proxy to vote to the portfolio manager who is responsible for
analysing the company, and ask him/her to go to the shareholders meeting.
In proxy matters that are not deemed routine, the Committee will correspond (or
meet), analyse the issue and arrive at a voting decision. Voting in these
"non-routine" matters requires also the normal quorum of two Committee members.
The Committee may also decide to inform the Institutional client of the issue
and request that the client instruct Fortis Investments how to vote. The Group
Compliance Officer will maintain records of the Committee actions with regard to
these "non-routine" matters.
POTENTIAL CONFLICT OF INTEREST SITUATIONS
It is not anticipated that Fortis Investments will need to address any potential
or actual conflict of interest situations when exercising its fiduciary
obligations on behalf of its clients. The company does not engage in investment
banking activities and does not engage in proprietary trading. A transaction
with broker/dealer affiliates (Fortis Bank) is allowed but only to a limited
extent and liable to close supervision of the broker evaluation committee.
Nonetheless, the following procedures apply:
137
- In general, if the PVC comes to the opinion that there is an
appearance of a potential conflict between the company's view and
the shareholders interest, the PVC will always accept the voting
recommendation on the proxy ballot as an independent fiduciary.
- If an Alert is received for shares in Fortis, Fortis Investments
will not execute the voting rights on behalf of its clients.
(Institutional) clients may opt to execute voting rights at the
Fortis' shareholders meeting by themselves, without the interference
of Fortis Investments.
- In cases Fortis Investments receives an Alert for a company which is
a client of Fortis Investments or of another Fortis metier (or has a
close relationship with the involved company), Fortis Investments
will take an independent position in deciding how to cast votes,
taking into account what is stated at the first bullet above. Where
deemed necessary, Fortis Investments will disclose its standpoint to
individual clients.
- In cases where a PVC member may be perceived to have a less than
objective opinion or conflict of interest, that member will be
obliged to report the situation to the PVC and will not participate
in any decision making on the particular company involved. For
purposes of PVC decisions, a conflict of interest will be said to
exist if that member owns more than a de minimis number (500) of
shares of the subject company in personal investment accounts
controlled or directed by such member.
- When it is identified that a conflict of interest may arise when
resolutions are proposed by the company where the position of
shareholders and owners of corporate bonds may be contradictory (see
paragraph about "bundled proposals" on page 15). In deciding how to
cast the votes, Fortis Investments will also take account the
positions of individual clients in corporate bonds of the involved
company.
Records of all potential conflicts of interest and their resolution will be kept
as part of the PVC minutes.
PROXY VOTING SERVICE PROVIDER
Fortis Investments has executed a contract with proxy voting service providers,
ISS to obtain proxy voting recommendations and to maintain proper voting
records. In order to ensure that all reasonable efforts are made to obtain and
vote proxies, the PVC has established proxy voting process procedures as
explained in the paragraph above.
The diversity of the market practice in different countries makes it difficult
to fix a rigid all-encompassing recommendation for the voting items of all
general meetings. This sometimes demands a deviation from a threshold previously
set by the proxy voting provider. These country specific idiosyncrasies and
reasons for deviation, however, are concisely explained in the voting reports
produced.
FORTIS INVESTMENTS DUTIES:
- All customer agreements with Institutional clients contain a section
that either retains proxy-voting authority with the client or
authorizes Fortis Investments to vote proxies. The Sales departments
of the local Fortis Investments entities maintain a list of all
clients that have delegated voting authority to Fortis Investments.
For funds, this list is maintained and updated by the Funds
Secretariat departments.
- In all cases where Fortis Investments has received special voting
instructions from an Institutional client, the Sales department will
provide a copy the PVC to incorporate in the voting decisions and
other relevant records.
- In all cases where Fortis Investments has been designated, the local
Operations department provides a written notice to all client
custodians instructing that all ballots, meeting notices and other
proxy materials to be provided to Fortis Investments.
- The PVC has designated the Operations department with the authority
to submit voting instructions through the Votex application based on
the validation of adapted voting recommendations by the PVC.
ISS Duties
- Using the proxy voting guidelines of Fortis Investments as detailed
below from sections 1 -- 9, providing voting recommendations through
the web based system Votex;
- Global Voting Agent Service: Execute votes through delivery of
voting instructions to relevant custodian;
- Maintain records of votes and disclosing through reporting
functionalities in Votex.
The following section describes the general guidelines that the PVC will use to
vote proxies in the best interest of clients.
138
PROXY VOTING -- GENERAL GUIDELINES
As stated above, Fortis Investments receives detailed analysis and
recommendations used for making informed voting decisions. These guidelines,
developed by the proxy voting provider and tailor made by Fortis Investments, do
not cover every potential voting issue. Accordingly, where the guidelines do not
cover a specific issue, or where to vote in accordance with such guidelines
would be contrary to the best interest of the client, the PVC will use its best
judgment, based on the opinion of the relevant Investment Centre, to vote
proxies in the best interest of the client. As described above and as noted
below, certain issues have been deemed to be "non-routine" by the PVC and will
reviewed in every instance on a case-by-case basis.
The balance between finance and influence requires both proportionality between
the shareholder's contribution and influence ("one share, one vote") and between
the shareholder's contribution and return ("one share, one dividend). The golden
rule of shareholder rights to be followed by companies is "one share -- one vote
-- one dividend".
Fortis Investments will vote against any mechanisms that would breach the one
share, one-vote principle by favouring one or a specific group of shareholders
or entrenching them by installing such mechanisms as listed below. Depending on
the nature, severity of impact and complexity of the entrenching mechanism
Fortis Investments will vote on a case by case basis.
1. VOTING RIGHT DISTORTIONS
AGAINST:
- MULTIPLE VOTING SHARES
They can exist directly in form of two different classes of shares with equal
par-value or no par-value but with different voting rights or in form of shares
with dissimilar par-value (and different market price) and yet the same voting
right.
- NON-VOTING DEPOSITORY RECEIPTS
Depository receipts only give right to a dividend and a share in the company's
assets in case of liquidation. The voting right is separated from the security
and exercised by an "Administration office" which has to be composed of
independent members. Voting rights can in some cases be obtained but are usually
restricted by a vigorous voting right ceiling.
- OWNERSHIP CEILING
When the number of shares a shareholder can own directly or indirectly (as
proxy) and thus can vote (if voting right is attached) is restricted.
- VOTING RIGHT CEILING
When a shareholder can hold any amount of shares but the voting right will be
capped upon reaching a given threshold or progressively reduced through a series
of threshold that curb the voting right by demanding to aggregate a certain
number of shares in order to cast one vote.
- PRIORITY SHARES
Priority shares reserves certain privileges for one or more shareholders. The
holder of such a priority share may have the opportunity to appoint directors
directly to a board, to lodge multiple votes with one share or to give his or
her consent to a director's appointment.
139
- GOLDEN SHARE
One or more prerogatives are reserved for the holder of a golden share
(typically a governmental entity) such as a veto right with regard to a specific
resolution, as for example a merger, foreign participation in the share capital
and the appointment of directors.
CASE BY CASE:
- NON-VOTING SHARES
Some non-voting shares (NVS) give right to a preferred dividend in lieu of the
voting right while others do not have voting rights because of the separation of
the share into two parts, one part giving access to the dividend and the other
to the voting right (e.g. investment certificates in France).
Fortis Investments would abstain if all of the below criteria for the NVS are
met:
- the right for a preferred dividend
- the mark-up of the preferred dividend should be no more than 10% of the
regular dividend,
- the NVS represent less than 10% of the capital, and
- coherent justification for issuing NVS.
In all other cases Fortis Investments votes against the resolution.
2. ACCOUNTS AND DIVIDENDS
CASE BY CASE:
- FINANCIAL STATEMENTS & PROFIT DISTRIBUTION
A refusal to approve the accounts can be justified if statutory auditors express
reservations or refuse to certify the accounts after having discovered serious
irregularities, or, more generally, if Fortis Investments believes that the
general policy of the managers is clearly in contradiction with shareholder
interests, without, strictly speaking, being in disagreement with the accounts.
The company's profit distribution rationale needs to balance the profit
expectations of the shareholders with the financial needs of the company for a
sustainable medium and long-term development. Lack of sufficient information for
shareholders to indicate why, for example, dividends have decreased in
comparison to the previous year leads Fortis Investments to vote against the
resolution.
- SPECIAL (PREFERRED) DIVIDEND
Certain shares categories give right to a special dividend, which will be
received prior to allocating dividends to ordinary shares. Special dividends may
feature a cumulative component, i.e. if the profits are insufficient, this
dividend will be deferred. It is also possible that a special dividend is
granted to all shareholders. Special dividends may also serve as an alternative
to accepting new shares with a par value different to that of the ordinary
shares. Shareholders have the choice than of taking the shares or receiving the
dividend in cash.
To check the appropriateness of a special dividend, Fortis Investments will look
at such issues as the stability of the company's financial structure after the
pay-out, the alternative investments for the future of the company, and the
equal treatment of shareholders.
- MERGERS AND ACQUISITIONS
Votes on mergers and acquisitions are considered as non-routine items by Fortis
Investments and, as such, are always reviewed on a case by case basis from a
transparency, corporate governance as well as a financial point of view. Items
that will be taken into account include:
- The impact of the merger on shareholder value.
- Anticipated financial and operating benefits realizable through
synergies.
- The offer price i.e., cost vs. premium
- Financial viability of the combined companies as a single entity.
140
- An analysis of the arm's length nature of the transaction, potential
conflicts of interest and an assessment of the deal maker's "good
faith".
- The presence or lack of a fairness opinion.
- Proposed changes in corporate governance and their impact on
shareholder rights.
- The impact on community stakeholders and employees in both
workforces.
3. SHAREHOLDER PROPOSALS AND DERIVATIVE ACTION
The majority may in certain cases take actions that are contrary to the
company's interests. Thus in order to prevent potential abuse against the
interests of the company, minority shareholders should be able to exert
influence through such means as convening a general meeting and submitting
agenda items to take action on behalf of the company where the majority rule
governing the general meeting may cause damage to the company.
CASE BY CASE:
- SHAREHOLDER PROPOSAL -- EXTRAORDINARY GENERAL MEETING
In order to befittingly respect shareholder democracy, shareholders should be in
a position to add agenda items and convene extraordinary general meetings.
Proposing a threshold beyond 20% or below 1% of share capital for doing so will
incur an against vote in both cases.
- DERIVATIVE ACTION
Shareholders have to be allowed to take legal action whenever the company bodies
are affected by severe dysfunction or whenever the company has suffered damage.
Fortis Investments will support any resolution that would introduce or
facilitate legal proceedings to compensate shareholders for damage suffered by
the company, to cancel resolutions of a general meeting, to cancel Board
decisions, and to appoint a provisional director or expert (control function).
Any resolution curbing these or similar rights would be opposed by Fortis
Investments.
141
4. VOTING PROCEDURES
Shareholders need sufficient time to assess the items on the agenda in order to
be able to vote in an informed way. In addition, procedures should be made as
smooth and safe as possible to facilitate the voting needs of domestic as well
as international shareholders.
FOR:
- POSTAL AND INTERNET VOTING
Fortis Investments will support direct voting by mail or by electronic means as
they skip time consuming intermediaries (brokers, global and local custodians),
allow for a direct vote without proxy and, in case of the latter medium, save
delivery time.
- COUNTING OF BALLOTS
Fortis Investments will support any resolution that takes into account all votes
cast irrespective of the way the vote was delivered to the meeting, i.e. be it
mailed, electronically
transmitted or registered by a show of hands (the show of hands vote here refers
to the counting of all votes of the respective person, not the one-hand,
one-vote method as for example in the United Kingdom)
CASE BY CASE:
CONFIDENTIAL VOTING (SECRET BALLOT)
FORTIS INVESTMENTS SUPPORTS THE INTRODUCTION OF CONFIDENTIAL VOTING, IN ORDER TO
ENABLE ALL SHAREHOLDERS TO VOTE FREELY WITHOUT BEING INHIBITED BY ANY PERSONAL
OR MATERIAL TIES BUT JUDGES PROPOSALS OF COMPANIES ON A CASE BY CASE BASIS WHILE
CONFIDENTIAL VOTING MAY CONFLICT WITH THE PRINCIPLES OF TRANSPARENCY.
- PROXY VOTING
Fortis Investments favours companies that allow any person to be appointed as a
proxy. Blank proxies should neither be cancelled nor cast in favour of Board
proposals but lodged with regard to the beneficiary's voting profile, if
available to the appointed proxy.
AGAINST:
- COUNTING OF BALLOTS
Fortis Investments rejects resolutions that restrict the validity of the vote to
a specific delivery method.
5. CORPORATE RESTRUCTURING
Votes concerning corporate restructuring proposals including leveraged buyouts,
spin-offs, liquidations and asset sales are considered by Fortis Investments on
a CASE-BY-CASE basis. As noted below, Fortis Investments considers many of these
items non-routine.
SPIN-OFFS:
Fortis Investments views spin-offs as non-routine and will vote on a
CASE-BY-CASE basis through an analysis of the potential tax and regulatory
advantages, planned use of proceeds, market focus and managerial incentives.
142
ASSET SALES:
Asset Sales, considered non-routine by Fortis Investments, will be voted on a
CASE-BY-CASE basis considering such factors as the impact on the balance sheet
and working capital, the value received for the asset and the potential
elimination of diseconomies.
LIQUIDATIONS:
Votes by Fortis Investments will be made on a CASE-BY-CASE basis after
considering such factors as management's efforts to pursue other alternatives,
appraisal value of the assets and the compensation plan for executives managing
the liquidation.
6. SHARE CAPITAL
The decision to increase the share capital through the issuing of new shares or
other financial instruments such as warrants, convertible bonds and options
should be taken by the general meeting. A planned increase should attribute
subscription rights to existing shareholders and to those with rights to shares.
These so-called pre-emptive rights should only be waived in exceptional
circumstances, as they carry economic value and prevent against the dilution of
voting power, if the increase concerns voting shares. Fortis Investments puts
particular emphasis on this point as the effects of the capital increase with
the exclusion of pre-emptive rights are imminent. In weighing the
appropriateness of an exclusion of such rights, Fortis Investments will
carefully take into account the interests of both company and investors. Fortis
Investments will apply similar strict assessment criteria for the decrease of
share capital through buybacks, as delineated below.
SHARE CAPITAL INCREASE
CASE BY CASE:
- SHARE CAPITAL INCREASE WITH EXCLUSION OF PRE-EMPTIVE RIGHTS
Any share capital increase that disregards pre-emptive rights above 5% needs to
justify such an increase convincingly. A share capital increase through shares
or rights thereto without respect for pre-emptive rights over 20% of the issued
capital will generally be voted against unless the Board can give compelling
justification for this extensive increase. Such an increase might, for example,
be supported in case of an imminent acquisition but not for a possible future
acquisition or a purpose that is so vague that the authorisation may in fact be
used as an anti-takeover device to dilute a predator's voting power without
prior consent from shareholders. No authorisation should exceed two years.
AGAINST:
- AUTHORISED CAPITAL DURING A TAKEOVER
In this resolution the Board of Directors expressly asks ahead of a possible
takeover threat for shareholder authorisation to install a poison pill or issue
priority shares. It is prohibited in most countries where it is impossible to
use authorised capital once a takeover bid is launched.
SHARE BUYBACK
CASE BY CASE:
- SHARE BUYBACK
The authorisation to repurchase its own shares may be beneficial for the
company:
- to merge, to acquire or to establish strategic alliances with other
companies,
- to remunerate and motivate employees and/or directors by selling or
assigning them shares at a low price (even within the framework of stock
option plans), or eventually for free (e.g. in Italy), or
- to provide the company with anti-takeover devices (if the targeted
receiver is a 'friendly' party).
143
Fortis Investments will vote in favour of the resolution if the buyback does
not, at any time, exceed 15% of the issued capital (including shares held by
subsidiaries) and the period of authorisation is no more than 18 months. The
authorisation should furthermore not be executable during a takeover and the
maximum purchase price and minimum selling price should not surpass 5% per cent
below and above the average market price over a representative period
respectively at the moment of transaction. If the resolution refers to a day
price, a deviation of 10% is acceptable.
EMPLOYEE STOCK OWNERSHIP PLANS ("ESOPS"):
FOR:
Fortis Investments favours proposals that request shareholder approval in order
to implement an ESOP or to increase authorized shares for ESOPs except in cases
where the number of shares allocated to the ESOP is deemed excessive i.e.,
generally greater than 5 percent of outstanding shares for executive programs
and 10 percent of outstanding shares for all employees.
CAPITAL STRUCTURE
CASE BY CASE:
- DEBT RESTRUCTURING
Fortis Investments will evaluate these non-routine proposals to increase common
and/or preferred shares and to issue shares as part of a debt restructuring plan
considering the following:
- Dilution, both of the ownership interests of existing shareholders
and to future earnings.
- Whether the proposal would result in a change of control at the
company.
- The threat of bankruptcy, its potential impact on shareholder value
and if a bankruptcy is the main factor driving the restructuring.
- Support will generally be withheld if there are clear signs of
market abuse.
7. THE BOARD
Fortis Investments assumes that both the one-tier structure and the two-tier
structure have their advantages and drawbacks. There is no one structure that is
generally preferred or opposed by Fortis Investments but rather the way the
structure is applied by the company, as will be discussed below.
ELECTION OF DIRECTORS
Any director that is nominated for election or holds a directorship should be
individually judged on his/her competencies, independence and experiences. The
Board(s) should be composed of directors who have the complementary, knowledge,
skills and backgrounds necessary to run, or in the case of non-executive
directors (NEDs) supervise, consult and control, the enterprise.
CASE BY CASE:
- AGE LIMITATION
Fortis Investments sets the maximum age limitation for the eligibility of
executive directors to 65 and for non-executive directors to 70. Fortis
Investments abstains from voting if the above limitations are exceeded and if
they are not accompanied by convincing explanations of why the company feels the
nominations to be appropriate. Generally speaking, Fortis Investments favours to
limit the number of the board members who are involved in the management of the
company.
144
BEST PRACTICE COMPOSITION ON INDEPENDENCE
A) One-Tier Board best practice composition on independence:
1. At least, half of the Board composed of independent non-executive
directors. Some distinctions can be made on this general rule: in
case of a board with at least 50% of compulsory employee
representatives and for companies with a majority shareholder. In
these cases it is required to have a minimum of one-third of
independent non-executive directors in the board. Secondly for some
jurisdictions the concept of potentially independent directors is
introduced for countries that do not have a tradition of identifying
their independent directors.
2. At most, one third of the Board composed of executive directors.
3. At least three independent directors should be present on the Board
B) Two-Tier Board best practice composition on independence:
1. At least, one half of the supervisory board is composed of
independent directors
2. At least three independent directors should be included on the
supervisory board.
Depending on the movement that the Board as a whole would take if one or more
directors were elected, Fortis Investments votes as follows:
- SIZE
Fortis Investments expects that Boards should be neither so small that they lack
needed expertise or diversity in experience and independence, nor so large as to
become inefficient and hinder decision-making. Thus ideally company's board(s)
should be composed of no more then 12 or less then 8 members. Fortis Investments
does not favour a one-tier board with less than 6 or more then 18 members
(unless legally required); votes will be made on a case by case basis. For a
two-tier board, Fortis Investments will vote on a case by case basis if the
board size exceeds the number of 8 members or the supervisory board size exceeds
the number of 10 members.
- NOMINATION, RENEWAL AND APPOINTMENT OF EXECUTIVE DIRECTORS
A resolution for the nomination, renewal and appointment of executive directors,
will be approved if
- the resolution concerns an individual and not a group of people;
- there is sufficient biographical information is available
- the nomination process is fair
- the mandate does not exceed 6 years
- the nomination respects the equilibrium of the Board structure (see above)
- the function of Chairman and CEO is clearly separated.
- DISCHARGE TO THE BOARD OF DIRECTORS
As the discharge has more than only a symbolic value in some countries, Fortis
Investments treats this resolution very prudently in order not to rule out
possible legal claims.
REMUNERATION OF DIRECTORS
CASE BY CASE:
REMUNERATION OF NON-EXECUTIVE DIRECTORS (NEDS)
In order to uphold the supervisory and consultative role of NEDs that allows for
dispassionate intervention whenever necessary, Fortis Investments considers that
their remuneration should be free from the achievement of short-term financial
results. Apart from fees which should be tied to attendance, the remuneration of
NEDs can include shares to ally their interest to that of the company. The whole
remuneration package should be aligned to the commitment and dedication expected
from NEDs to fulfil their duties. Fees of NEDs could also be paid in shares if
these shares need to be held for at least the duration of the Board mandate.
145
- REMUNERATION OF EXECUTIVES
Executive directors should be motivated by variable remuneration linked to
company performance. A fixed salary, which should be determined by the Board
according to the report of the Remuneration Committee, should be in line with
both national and sectoral standards. It must be reviewed regularly by the
Remuneration Committee. Variable performance linked remuneration components are
meant to reward exceptional performance and as such should ideally be linked to
a peer group benchmark. In assessing the viability of a scheme, Fortis
Investments checks on its proportion to the issued capital, its performance
criteria and the vesting and holding periods.
- APPROVAL OF PAY PACKAGE
Depending on the markets and the respective cultures, remuneration is a
sensitive topic touching on issues such as the security and privacy of the
individuals concerned, and the competitiveness of the company in attracting,
retaining and motivating top executives. Fortis Investments favours full
disclosure of all remuneration components for each director serving on the Board
in order to vote in favour of a resolution approving the remuneration. The
different components making up the pay need to be identified and their
respective policies explained. The pay should be transparent enough for
shareholders to allow them to distinguish the remuneration of executives from
that of NEDs.
8. MISCELLANEOUS
- RATIFICATION OF AUDITORS
Auditor independence is essential for rendering objective opinions. All
proposals to ratify auditors will be examined for potential conflicts of
interest with particular attention to the fees paid to the auditor. Fortis
Investments will generally vote as follows:
- FOR proposals to ratify auditors when the amount of audit fees is greater
than that for consulting, unless: (1) an auditor has a financial interest
in or association with the company, and is therefore not independent; or
(2) there is reason to believe that the independent auditor has rendered
an opinion that is neither accurate nor indicative of the company's
financial position.
BUNDLED PROPOSALS
Fortis Investments will review bundled or "conditioned" proposals (proposals
involving different asset classes) on a CASE-BY-CASE basis. In cases where the
items are conditioned upon each other, the benefits and costs of the packaged
items will be examined. In cases when the joint impact of the conditioned items
is not in the clients' best interest, Fortis Investments will vote AGAINST the
proposals. Conversely, if the combined effect is positive, Fortis Investments
will vote FOR the proposals.
CORPORATE SOCIAL RESPONSIBILITY
This section sets out Fortis Investments Corporate Social Responsibility (CSR)
voting guidelines. The CSR Voting Service proposes guidance for an additional
filter to the Voting Profile: the Corporate Social Responsibility filter. With
this filter Fortis Investments reviews the transparency of companies on CSR
issues. Insufficient CSR transparency triggers a voting alert report. The alert
report recommends an abstention or vote against the company's request to approve
annual accounts.
Corporate Social Responsibility is the alignment of business operations with
social values. As mentioned by the EU Green Paper, CSR companies contribute
voluntarily to a better society and a cleaner environment. They recognise three
kinds of responsibility: economic, environmental and social. It is about
tackling the issues of the workplace, human rights, and the community -- all
integrated in core business strategies. These developments reflect the growing
expectations that stakeholders have regarding the role of companies. Investors
believe they have a right to transparency, not only on financial and corporate
governance issues, but also on what they call the "triple bottom line": the
environment, employees, and society as a whole. The principle underlying these
expectations is that shareholders have the right to understand the risk born by
the company they invest in. This information will of course interest other
stakeholders as well.
146
Corporate Social Responsibility, like Corporate Governance, embraces two central
concepts: accountability and transparency. Companies are expected to be more
transparent in disclosing and communicating their policies and practices as
these impact the environment, employees and communities. It is no longer
optional for a company to communicate its environmental and social impacts; such
information is demanded by stakeholders, regulators, and Non-Governmental
Organisations in an information-driven economy.
A company that is considered a good corporate citizen is one that demonstrates a
commitment to its stakeholders through socially responsible business practices
and transparent operations.
THE CSR STANDARD
Once a company recognises the importance of being a good corporate citizen, the
key to a real dialogue is trust, resulting from recognised accountability and
transparency. The CSR Standard is therefore based on disclosure. It assesses the
availability for shareholders of relevant CSR information, without providing any
judgement on the content of existing information.
The various CSR issues taken into account for the Standard are detailed below.
The Standard draws heavily on the United Nations Global Compact's nine
principles and the Global Reporting Initiative (GRI), which collaborate together
since March 2003 to foster better corporate reporting on CSR issues. The
Standard's disclosure requirements go further than the legal requirements of
most countries. Indeed, being socially responsible means doing more than the
legal minimum. Public companies should comply with the Standard to allow a truly
informed vote of investors.
The company's CSR transparency is assessed based on three key CSR factors
(environment, human resources and society) and two accountability factors (board
commitment and reporting). Each factor is divided in at least six different
aspects; namely commitment, policy, performance, targets, independent review,
and senior management responsibility (see appendix). This adds up to a total of
34 criteria, which constitute the CSR analysis grid. A score is assigned to a
company under review for each factor based on its transparency level. If the
company's total transparency level is below the alert threshold, Deminor issues
an alert report, proposing to abstain or oppose the approval of annual accounts.
For 2004, it has been decided by the Proxy Voting Committee not yet to vote
against on CRS issues on shareholder meetings in case of transparency levels are
below the threshold, but instead sending a letter to the board of the involved
company in order to disclose and explain our CSR guidelines.
CSR FACTORS
Environment Factor
- Group-wide environmental commitment: The company should clearly state that
it supports a precautionary approach to environmental challenges. (see GRI
principle Vision and Strategy 3.13 and UN Global Compact principle 7);
- Identified risk areas: The company should identify the risks its business
causes to the environment. It should mention the areas which require the
special attention of a socially responsible corporate citizen.
- Policy for managing environmental risk: The company should publish a
group-wide environmental policy. Such a policy should disclose how the
company manages the risks its business causes to the environment. It
should mentions the initiatives taken to monitor and limit risk (see GRI
principles EN 1 to 15 and UN Global Compact principle 8).
- Disclosure of environmental performance: The company should provide
up-to-date data on its environmental performance: the impact it has had in
the past year, the measures it has taken to improve its management of
environmental issues.
147
- Target setting: In addition to its past performance, the company should
disclose target settings on reducing its impact on the environment in the
coming years. (See GRI principle EN14).
- Quantifiable targets: These targets should be quantifiable, in numbers or
percentages (see GRI principle EN14).
- External & independent review: The company's environmental report should
be accredited by an independent and external audit. The external auditor
will sign the company's environmental report.
- Environmental commitment for the supplier: The company should disclose
that it promotes the adoption of environmental standards for its
suppliers. It is the company's responsibility to check if and how its
suppliers are acting in a responsible manner, especially in the context of
subcontracting.
- Responsible Board member or committee on board level: The company should
identify and name a board member or a committee on board level dealing
with environmental matters. The commitment of management is at the heart
of CSR.
- Internal monitoring system: The company should show evidence that it has
set up an internal monitoring system for its environmental performance, as
one of the steps to foster sustainable CSR.
Human Resources Factor
- Group-wide commitment to employees: The Company should clearly state that
it is committed to the general well-being of its employees. This may
include the company's support of ILO labour standards and the UN
Declaration of human rights.
- Health and safety commitment: The company should disclose a commitment to
the specific health/safety risks of its employees.
- Areas for safety/health risks: The company should identify the specific
risks its business causes to the well-being of its employees.
- Disclosure of a policy for managing safety/health risks: The company
should disclose how it manages these risks group-wide.
- Disclosure of health/safety performance: Does the company provide
quantifiable data on its performance?
- Disclosure of health/safety targets: The company should disclose its
targets set to reduce any negative impact of its activities on the
well-being of its employees.
- Commitment to equal opportunity issues: The company should disclose its
policy to support equal opportunity. The company should describe its
programmes to prevent all forms of discrimination between employees, and
show the diversity resulting from these efforts (see GRI principles
LA10-11, HR4 and UN Global Compact principle 6).
- Commitment to the principle of freedom of association: The company should
state that it recognises the right to associate, and to collective
bargaining. The company may describe the extent to which this policy is
universally applied (see GRI principles LA3-4 and UN Global Compact
principle 3).
- Existence of regular employee satisfaction surveys: The company should
disclose whether it conducted an employee satisfaction survey on health
issues or working conditions.
- Works council or similar strategic-level procedures for information: Is
there evidence that the company has set up a council or foreseen other
dispositions for workers' information, consultation and negotiation (see
GRI principles LA4).
- Existence of an independent verification process: Has the company been
accredited by a recognised external party or does it follow a recognised
standard (such as ISO10015) regarding human capital?
- Existence of a responsible senior manager or board member: The company has
a health and safety committee comprising management, and/or the company
has a senior executive responsible for HR issues (see GRI principles LA6).
148
External Social Policy Factor
- Group-wide commitment to society: The company should state its group-wide
commitment to community issues.
- International human rights: The company should state its support and
respect of international human rights standards. It should mention how it
takes into account the impact of its activities on human rights. This can
be stated in relation with human rights agreements or treaties (see GRI
principles HR1-4 and UN Global Compact principle 1-2).
- Policy referral to the importance of engagement with the stakeholders: The
company shows evidence of a voluntary involvement or investment in the
local community. The company should recognise that active dialogue with
stakeholders is crucial for the success of CSR (see GRI principles SO1).
- Is there evidence that the company is forming partnerships with external
bodies? Has the company formed any partnerships with humanitarian or
likewise organisations?
- Senior manager or Board member responsible for these issues: The company
should disclose who is responsible for all health and safety issues,
ideally on board level. A senior manager or committee may be designated
for the implementation of the social policy.
- Information on the beneficiaries of help: The company specifies the
identity of the main beneficiaries of its financial and in-kind donations.
- Disclosure of total amount of charitable donations: The company should
disclose the amount of donations to any group in terms of cash and in-kind
(see GRI principle EC10).
- Disclosure of political donations: The company should disclose its policy
regarding political donations. If the company's policy allows political
donations, it should specify the amounts paid (see GRI principle SO3 and
SO5).
Board Commitment Factor
- Board commitment to CSR factors: Is there evidence that the board takes
regular account of these CSR factors?
Reporting Factors
- Is there a separate report on sustainability/environment? The company
should report thoroughly on all CSR factors. This can be done in a special
section of the annual report, or in a separate report referred to in the
annual report. CSR reporting on the company website is also acceptable.
The report should be published annually. If not, the company should
provide additional yearly performance data on its website.
- Existence of reporting in accordance with the Global Reporting Initiative:
The adoption of a recognised reporting framework enhances trust and
accountability. We distinguish companies who report IN ACCORDANCE to the
GRI principles from those who inspire themselves from the GRI principles.
Both approaches are encouraged by the GRI.
- External review of complete report: The signature of a recognised
independent auditor enhances trust and accountability.
149
MASSACHUSETTS FINANCIAL SERVICES COMPANY
PROXY VOTING POLICIES AND PROCEDURES
June 1, 2008
Massachusetts Financial Services Company, MFS Institutional
Advisors, Inc., MFS International (UK) Limited, MFS Heritage Trust
Company, and MFS' other investment adviser subsidiaries (except Four
Pillars Capital, Inc.) (collectively, "MFS") have adopted proxy voting
policies and procedures, as set forth below ("MFS Proxy Voting Policies
and Procedures"), with respect to securities owned by the clients for
which MFS serves as investment adviser and has the power to vote proxies,
including the registered investment companies sponsored by MFS (the "MFS
Funds"). References to "clients" in these policies and procedures include
the MFS Funds and other clients of MFS, such as funds organized offshore,
sub-advised funds and separate account clients, to the extent these
clients have delegated to MFS the responsibility to vote proxies on their
behalf under the MFS Proxy Voting Policies and Procedures.
The MFS Proxy Voting Policies and Procedures include:
A. Voting Guidelines;
B. Administrative Procedures;
C. Monitoring System;
D. Records Retention; and
E. Reports.
A. VOTING GUIDELINES
1. General Policy; Potential Conflicts of Interest
MFS' policy is that proxy voting decisions are made in what MFS
believes to be the best long-term economic interests of MFS' clients, and
not in the interests of any other party or in MFS' corporate interests,
including interests such as the distribution of MFS Fund shares,
administration of 401(k) plans, and institutional relationships.
In developing these proxy voting guidelines, MFS periodically
reviews corporate governance issues and proxy voting matters that are
presented for shareholder vote by either management or shareholders of
public companies. Based on the overall principle that all votes cast by
MFS on behalf of its clients must be in what MFS believes to be the best
long-term economic interests of such clients, MFS has adopted proxy voting
guidelines, set forth below, that govern how MFS generally will vote on
specific matters presented for shareholder vote. In all cases, MFS will
exercise its discretion in voting on these matters in accordance with this
overall principle. In other words, the underlying guidelines are simply
that -- guidelines. Proxy items of significance are often considered on a
case-by-case basis, in light of all relevant facts and circumstances, and
in certain cases MFS may vote proxies in a manner different from what
otherwise be dictated by these guidelines.
As a general matter, MFS maintains a consistent voting position on
similar proxy proposals with respect to various issuers. In addition, MFS
generally votes consistently on the same matter when securities of an
issuer are held by multiple client accounts. However, MFS recognizes that
there are gradations in certain types of proposals that might result in
different voting positions being taken with respect to different proxy
statements. There also may be situations involving matters presented for
shareholder vote that are not governed by the guidelines or situations
where MFS has received explicit voting instructions from a client for its
own account. Some items that otherwise would be acceptable will be voted
against the proponent when it is seeking extremely broad flexibility
without offering a valid explanation. MFS reserves the right to override
the guidelines with respect to a particular shareholder vote when such an
override is, in MFS' best judgment, consistent with the overall principle
of voting proxies in the best long-term economic interests of MFS'
clients.
150
From time to time, MFS receives comments on these guidelines as well
as regarding particular voting issues from its clients. These comments are
carefully considered by MFS when it reviews these guidelines each year and
revises them as appropriate.
These policies and procedures are intended to address any potential material
conflicts of interest on the part of MFS or its subsidiaries that are likely to
arise in connection with the voting of proxies on behalf of MFS' clients. If
such potential material conflicts of interest do arise, MFS will analyze,
document and report on such potential material conflicts of interest (see
Sections B.2 and E below), and shall ultimately vote the relevant proxies in
what MFS believes to be the best long-term economic interests of its clients.
The MFS Proxy Voting Committee is responsible for monitoring and reporting with
respect to such potential material conflicts of interest.
2. MFS' Policy on Specific Issues
ELECTION OF DIRECTORS
MFS believes that good governance should be based on a board with at
least a simple majority of directors who are "independent" of management,
and whose key committees (E.G., compensation, nominating, and audit
committees) are comprised entirely of "independent" directors. While MFS
generally supports the board's nominees in uncontested elections, we will
withhold our vote for, or vote against, as applicable, a nominee to a
board of a U.S. issuer if, as a result of such nominee being elected to
the board, the board would be comprised of a majority of members who are
not "independent" or, alternatively, the compensation, nominating or audit
committees would include members who are not "independent."
MFS will also withhold its vote for, or vote against, as applicable,
a nominee to a board if we can determine that he or she failed to attend
at least 75% of the board and/or relevant committee meetings in the
previous year without a valid reason stated in the proxy materials. In
addition, MFS will withhold its vote for, or vote against, as applicable,
all nominees standing for re-election to a board if we can determine: (1)
since the last annual meeting of shareholders and without shareholder
approval, the board or its compensation committee has re-priced underwater
stock options; or (2) since the last annual meeting, the board has either
implemented a poison pill without shareholder approval or has not taken
responsive action to a majority shareholder approved resolution
recommending that the "poison pill" be rescinded. Responsive action would
include the rescission of the "poison pill"(without a broad reservation to
reinstate the "poison pill" in the event of a hostile tender offer), or
assurance in the proxy materials that the terms of the "poison pill" would
be put to a binding shareholder vote within the next five to seven years.
151
MFS will also withhold its vote for, or vote against, as applicable,
a nominee (other than a nominee who serves as the issuer's Chief Executive
Officer) standing for re-election if such nominee participated (as a
director or committee member) in the approval of senior executive
compensation that MFS deems to be "excessive" due to pay for performance
issues and/or poor pay practices. In the event that MFS determines that an
issuer has adopted "excessive" executive compensation, MFS may also
withhold its vote for, or vote against, as applicable, the re-election of
the issuer's Chief Executive Officer as director regardless of whether the
Chief Executive Officer participated in the approval of the package. MFS
will determine whether senior executive compensation is excessive on a
case by case basis. Examples of poor pay practices include, but are not
limited to, egregious employment contract terms or pension payouts,
backdated stock options, overly generous hiring bonuses for chief
executive officers or, excessive perks.
MFS evaluates a contested or contentious election of directors on a case-by-case
basis considering the long-term financial performance of the company relative to
its industry, management's track record, the qualifications of the nominees for
both slates, if applicable, and an evaluation of what each side is offering
shareholders.
MAJORITY VOTING AND DIRECTOR ELECTIONS
MFS votes for reasonably crafted proposals calling for directors to
be elected with an affirmative majority of votes cast and/or the
elimination of the plurality standard for electing directors (including
binding resolutions requesting that the board amend the company's bylaws),
provided the proposal includes a carve-out for a plurality voting standard
when there are more director nominees than board seats (E.G., contested
elections) ("Majority Vote Proposals"). MFS considers voting against
Majority Vote Proposals if the company has adopted, or has proposed to
adopt in the proxy statement, formal corporate governance principles that
present a meaningful alternative to the majority voting standard and
provide an adequate response to both new nominees as well as incumbent
nominees who fail to receive a majority of votes cast. MFS believes that a
company's election policy should address the specific circumstances at
that company. In determining whether the issuer has a meaningful
alternative to the majority voting standard, MFS considers whether a
company's election policy articulates the following elements to address
each director nominee who fails to receive an affirmative majority of
votes cast in an election:
- Establish guidelines for the process by which the company determines
the status of nominees who fail to receive an affirmative majority
of votes cast and disclose the guidelines in the annual proxy
statement;
- Guidelines should include a reasonable timetable for resolution of
the nominee's status and a requirement that the resolution be
disclosed together with the reasons for the resolution;
- Vest management of the process in the company's independent
directors, other than the nominee in question; and
- Outline the range of remedies that the independent directors may
consider concerning the nominee.
CLASSIFIED BOARDS
MFS opposes proposals to classify a board (E.G., a board in which only one-third
of board members are elected each year). MFS supports proposals to declassify a
board.
Non-Salary Compensation Programs
152
MFS votes against stock option programs for officers, employees or
non-employee directors that do not require an investment by the optionee,
that give "free rides" on the stock price, or that permit grants of stock
options with an exercise price below fair market value on the date the
options are granted.
MFS also opposes stock option programs that allow the board or the
compensation committee, without shareholder approval, to reprice
underwater options or to automatically replenish shares (I.E., evergreen
plans). MFS will consider on a case-by- case basis proposals to exchange
existing options for newly issued options (taking into account such
factors as whether there is a reasonable value-for-value exchange).
MFS opposes stock option programs and restricted stock plans that
provide unduly generous compensation for officers, directors or employees,
or could result in excessive dilution to other shareholders. As a general
guideline, MFS votes against restricted stock plans, stock option,
non-employee director, omnibus stock plans and any other stock plan if all
such plans for a particular company involve potential dilution, in the
aggregate, of more than 15%. However, MFS will also vote against stock
plans that involve potential dilution, in aggregate, of more than 10% at
U.S. issuers that are listed in the Standard and Poor's 100 index as of
December 31 of the previous year.
EXPENSING OF STOCK OPTIONS
MFS supports shareholder proposals to expense stock options because
we believe that the expensing of options presents a more accurate picture
of the company's financial results to investors. We also believe that
companies are likely to be more disciplined when granting options if the
value of stock options were treated as an expense item on the company's
income statements.
EXECUTIVE COMPENSATION
MFS believes that competitive compensation packages are necessary to
attract, motivate and retain executives. Therefore, MFS opposes
shareholder proposals that seek to set restrictions on executive
compensation. We believe that the election of an issuer's compensation
committee members is the appropriate mechanism to express our view on a
company's compensation practices, as outlined above. MFS also opposes
shareholder requests for disclosure on executive compensation beyond
regulatory requirements because we believe that current regulatory
requirements for disclosure of executive compensation are appropriate and
that additional disclosure is often unwarranted and costly. Although we
support linking executive stock option grants to a company's performance,
MFS opposes shareholder proposals that mandate a link of performance-based
options to a specific industry or peer group stock index. MFS believes
that compensation committees should retain the flexibility to propose the
appropriate index or other criteria by which performance-based options
should be measured.
MFS supports reasonably crafted shareholder proposals that (i)
require the issuer to adopt a policy to recover the portion of
performance-based bonuses and awards paid to senior executives that were
not earned based upon a significant negative restatement of earnings
unless the company already has adopted a clearly satisfactory policy on
the matter, or (ii) expressly prohibit any future backdating of stock
options.
153
EMPLOYEE STOCK PURCHASE PLANS
MFS supports the use of a broad-based employee stock purchase plans
to increase company stock ownership by employees, provided that shares
purchased under the plan are acquired for no less than 85% of their market
value and do not result in excessive dilution.
"GOLDEN PARACHUTES"
From time to time, shareholders of companies have submitted proxy
proposals that would require shareholder approval of severance packages
for executive officers that exceed certain predetermined thresholds. MFS
votes in favor of such shareholder proposals when they would require
shareholder approval of any severance package for an executive officer
that exceeds a certain multiple of such officer's annual compensation that
is not determined in MFS' judgment to be excessive.
ANTI-TAKEOVER MEASURES
In general, MFS votes against any measure that inhibits capital
appreciation in a stock, including proposals that protect management from
action by shareholders. These types of proposals take many forms, ranging
from "poison pills" and "shark repellents" to super-majority requirements.
MFS generally votes for proposals to rescind existing "poison pills"
and proposals that would require shareholder approval to adopt prospective
"poison pills." MFS may consider the adoption of a prospective "poison
pill" or the continuation of an existing "poison pill" if we can determine
that the following two conditions are met: (1) the "poison pill" allows
MFS clients to hold an aggregate position of up to 15% of a company's
total voting securities (and of any class of voting securities); and (2)
either (a) the "poison pill" has a term of not longer than five years,
provided that MFS will consider voting in favor of the "poison pill" if
the term does not exceed seven years and the "poison pill" is linked to a
business strategy or purpose that MFS believes is likely to result in
greater value for shareholders; or (b) the terms of the "poison pill"
allow MFS clients the opportunity to accept a fairly structured and
attractively priced tender offer (E.G., a "chewable poison pill" that
automatically dissolves in the event of an all cash, all shares tender
offer at a premium price).MFS will also consider on a case-by-case basis
proposals designed to prevent tenders which are disadvantageous to
shareholders such as tenders at below market prices and tenders for
substantially less than all shares of an issuer.
REINCORPORATION AND REORGANIZATION PROPOSALS
When presented with a proposal to reincorporate a company under the
laws of a different state, or to effect some other type of corporate
reorganization, MFS considers the underlying purpose and ultimate effect
of such a proposal in determining whether or not to support such a
measure. While MFS generally votes in favor of management proposals that
it believes are in the best long-term economic interests of its clients,
MFS may oppose such a measure if, for example, the intent or effect would
be to create additional inappropriate impediments to possible acquisitions
or takeovers.
154
Issuance of Stock
There are many legitimate reasons for the issuance of stock.
Nevertheless, as noted above under "Non-Salary Compensation Programs,"
when a stock option plan (either individually or when aggregated with
other plans of the same company) would substantially dilute the existing
equity (E.G. by approximately 15% or more), MFS generally votes against
the plan. In addition, MFS votes against proposals where management is
asking for authorization to issue common or preferred stock with no reason
stated (a "blank check") because the unexplained authorization could work
as a potential anti-takeover device. MFS may also vote against the
authorization or issuance of common or preferred stock if MFS determines
that the requested authorization is not warranted.
REPURCHASE PROGRAMS
MFS supports proposals to institute share repurchase plans in which
all shareholders have the opportunity to participate on an equal basis.
Such plans may include a company acquiring its own shares on the open
market, or a company making a tender offer to its own shareholders.
CONFIDENTIAL VOTING
MFS votes in favor of proposals to ensure that shareholder voting
results are kept confidential. For example, MFS supports proposals that
would prevent management from having access to shareholder voting
information that is compiled by an independent proxy tabulation firm.
CUMULATIVE VOTING
MFS opposes proposals that seek to introduce cumulative voting and
for proposals that seek to eliminate cumulative voting. In either case,
MFS will consider whether cumulative voting is likely to enhance the
interests of MFS' clients as minority shareholders. In our view,
shareholders should provide names of qualified candidates to a company's
nominating committee, which (for U.S. listed companies) must be comprised
solely of "independent" directors.
WRITTEN CONSENT AND SPECIAL MEETINGS
Because the shareholder right to act by written consent (without
calling a formal meeting of shareholders) can be a powerful tool for
shareholders, MFS generally opposes proposals that would prevent
shareholders from taking action without a formal meeting or would take
away a shareholder's right to call a special meeting of company
shareholders.
INDEPENDENT AUDITORS
MFS believes that the appointment of auditors for U.S. issuers is
best left to the board of directors of the company and therefore supports
the ratification of the board's selection of an auditor for the company.
Some shareholder groups have submitted proposals to limit the non-audit
activities of a company's audit firm or prohibit ANY non-audit services by
a company's auditors to that company. MFS opposes proposals recommending
the prohibition or limitation of the performance of non-audit services by
an auditor, and proposals recommending the removal of a company's auditor
due to the performance of non-audit work for the company by its auditor.
MFS believes that the board, or its audit committee, should have the
discretion to hire the company's auditor for specific pieces of non-audit
work in the limited situations permitted under current law.
155
OTHER CORPORATE GOVERNANCE, CORPORATE RESPONSIBILITY AND SOCIAL
ISSUES
There are many groups advocating social change or changes to
corporate governance or corporate responsibility standards, and many have
chosen the publicly-held corporation as a vehicle for advancing their
agenda. Generally, MFS votes with management on such proposals unless MFS
can determine that the benefit to shareholders will outweigh any costs or
disruptions to the business if the proposal were adopted. Common among the
shareholder proposals that MFS generally votes with management are
proposals requiring the company to use corporate resources to further a
particular social objective outside the business of the company, to
refrain from investing or conducting business in certain countries, to
adhere to some list of goals or principles (E.G., environmental
standards), to include in the issuer's proxy statement an annual advisory
shareholder vote as to the company's executive compensation practices
during the previous year, to permit shareholders access to the company's
proxy statement in connection with the election of directors, to disclose
political contributions made by the issuer, to separate the Chairman and
Chief Executive Officer positions, or to promulgate special reports on
various activities or proposals for which no discernible shareholder
economic advantage is evident.
The laws of various states may regulate how the interests of certain
clients subject to those laws (E.G., state pension plans) are voted with
respect to social issues. Thus, it may be necessary to cast ballots
differently for certain clients than MFS might normally do for other
clients.
FOREIGN ISSUERS
Many of the items on foreign proxies involve repetitive,
non-controversial matters that are mandated by local law. Accordingly, the
items that are generally deemed routine and which do not require the
exercise of judgment under these guidelines (and therefore voted in favor)
for foreign issuers include the following: (i) receiving financial
statements or other reports from the board; (ii) approval of declarations
of dividends; (iii) appointment of shareholders to sign board meeting
minutes; (iv) discharge of management and supervisory boards; and (v)
approval of share repurchase programs.
MFS generally supports the election of a director nominee standing
for re-election in uncontested elections unless it can be determined that
(1) he or she failed to attend at least 75% of the board and/or relevant
committee meetings in the previous year without a valid reason given in
the proxy materials; (2) since the last annual meeting of shareholders and
without shareholder approval, the board or its compensation committee has
re-priced underwater stock options; or (3) since the last annual meeting,
the board has either implemented a poison pill without shareholder
approval or has not taken responsive action to a majority shareholder
approved resolution recommending that the "poison pill" be rescinded. MFS
will also withhold its vote for, or vote against, as applicable, a
director nominee standing for re-election of an issuer that has adopted an
excessive compensation package for its senior executives as described
above in the section entitled "Voting Guidelines-MFS' Policy on Specific
Issues-Election of Directors."
156
MFS generally supports the election of auditors, but may determine
to vote against the election of a statutory auditor in certain markets if
MFS reasonably believes that the statutory auditor is not truly
independent. MFS will evaluate all other items on proxies for foreign
companies in the context of the guidelines described above, but will
generally vote against an item if there is not sufficient information
disclosed in order to make an informed voting decision.
In accordance with local law or business practices, many foreign
companies prevent the sales of shares that have been voted for a certain
period beginning prior to the shareholder meeting and ending on the day
following the meeting ("share blocking"). Depending on the country in
which a company is domiciled, the blocking period may begin a stated
number of days prior to the meeting (E.G., one, three or five days) or on
a date established by the company. While practices vary, in many countries
the block period can be continued for a longer period if the shareholder
meeting is adjourned and postponed to a later date. Similarly, practices
vary widely as to the ability of a shareholder to have the "block"
restriction lifted early (E.G., in some countries shares generally can be
"unblocked" up to two days prior to the meeting whereas in other countries
the removal of the block appears to be discretionary with the issuer's
transfer agent). Due to these restrictions, MFS must balance the benefits
to its clients of voting proxies against the potentially serious portfolio
management consequences of a reduced flexibility to sell the underlying
shares at the most advantageous time. For companies in countries with
share blocking periods, the disadvantage of being unable to sell the stock
regardless of changing conditions generally outweighs the advantages of
voting at the shareholder meeting for routine items. Accordingly, MFS will
not vote those proxies in the absence of an unusual, significant vote.
In limited circumstances, other market specific impediments to
voting shares may limit our ability to cast votes, including, but not
limited to, power of attorney requirements and late delivery of proxy
materials. In these limited instances, MFS votes non-U.S. securities on a
best efforts basis in the context of the guidelines described above.
B. ADMINISTRATIVE PROCEDURES
1. MFS PROXY VOTING COMMITTEE
The administration of these MFS Proxy Voting Policies and Procedures
is overseen by the MFS Proxy Voting Committee, which includes senior
personnel from the MFS Legal and Global Investment Support Departments.
The Proxy Voting Committee does not include individuals whose primary
duties relate to client relationship management, marketing, or sales. The
MFS Proxy Voting Committee:
157
a. Reviews these MFS Proxy Voting Policies and Procedures at least
annually and recommends any amendments considered to be necessary or
advisable;
b. Determines whether any potential material conflict of interest exist
with respect to instances in which MFS (i) seeks to override these
MFS Proxy Voting Policies and Procedures; (ii) votes on ballot items
not governed by these MFS Proxy Voting Policies and Procedures;
(iii) evaluates an excessive executive compensation issue in
relation to the election of directors; or (iv) requests a vote
recommendation from an MFS portfolio manager or investment analyst
(e.g. mergers and acquisitions); and
c. Considers special proxy issues as they may arise from time to time.
2. POTENTIAL CONFLICTS OF INTEREST
The MFS Proxy Voting Committee is responsible for monitoring potential material
conflicts of interest on the part of MFS or its subsidiaries that could arise in
connection with the voting of proxies on behalf of MFS' clients. Due to the
client focus of our investment management business, we believe that the
potential for actual material conflict of interest issues is small. Nonetheless,
we have developed precautions to ensure that all proxy votes are cast in the
best long-term economic interest of shareholders. Other MFS internal policies
require all MFS employees to avoid actual and potential conflicts of interests
between personal activities and MFS' client activities. If an employee
identifies an actual or potential conflict of interest with respect to any
voting decision that employee must recuse himself/herself from participating in
the voting process. Additionally, with respect to decisions concerning all Non
Standard Votes, as defined below, MFS will review the securities holdings
reported by the individuals that participate in such decision to determine
whether such person has a direct economic interest in the decision, in which
case such person shall not further participate in making the decision. Any
significant attempt by an employee of MFS or its subsidiaries to influence MFS'
voting on a particular proxy matter should also be reported to the MFS Proxy
Voting Committee.
158
In cases where proxies are voted in accordance with these MFS Proxy Voting
Policies and Procedures, no material conflict of interest will be deemed to
exist. In cases where (i) MFS is considering overriding these MFS Proxy Voting
Policies and Procedures, (ii) matters presented for vote are not clearly
governed by these MFS Proxy Voting Policies and Procedures, (iii) MFS evaluates
an excessive executive compensation issue in relation to the election of
directors, or (iv) a vote recommendation is requested from an MFS portfolio
manager or investment analyst (e.g. mergers and acquisitions) (collectively,
"Non Standard Votes"); the MFS Proxy Voting Committee will follow these
procedures:
a. Compare the name of the issuer of such proxy against a list of
significant current (i) distributors of MFS Fund shares, and
(ii) MFS institutional clients (the "MFS Significant Client
List");
b. If the name of the issuer does not appear on the MFS
Significant Client List, then no material conflict of interest
will be deemed to exist, and the proxy will be voted as
otherwise determined by the MFS Proxy Voting Committee;
c. If the name of the issuer appears on the MFS Significant
Client List, then the MFS Proxy Voting Committee will be
apprised of that fact and each member of the MFS Proxy Voting
Committee will carefully evaluate the proposed vote in order
to ensure that the proxy ultimately is voted in what MFS
believes to be the best long-term economic interests of MFS'
clients, and not in MFS' corporate interests; and
d. For all potential material conflicts of interest identified
under clause (c) above, the MFS Proxy Voting Committee will
document: the name of the issuer, the issuer's relationship to
MFS, the analysis of the matters submitted for proxy vote, the
votes as to be cast and the reasons why the MFS Proxy Voting
Committee determined that the votes were cast in the best
long-term economic interests of MFS' clients, and not in MFS'
corporate interests. A copy of the foregoing documentation
will be provided to MFS' Conflicts Officer.
The members of the MFS Proxy Voting Committee are responsible for creating and
maintaining the MFS Significant Client List, in consultation with MFS'
distribution and institutional business units. The MFS Significant Client List
will be reviewed and updated periodically, as appropriate.
From time to time, certain MFS Funds may own shares of other MFS Funds (the
"underlying fund"). If an underlying fund submits a matter to a shareholder
vote, the MFS Fund that owns shares of the underlying fund will vote its shares
in the same proportion as the other shareholders of the underlying fund.
3. GATHERING PROXIES
Most proxies received by MFS and its clients originate at Automatic Data
Processing Corp. ("ADP") although a few proxies are transmitted to investors by
corporate issuers through their custodians or depositories. ADP and issuers send
proxies and related material directly to the record holders of the shares
beneficially owned by MFS' clients, usually to the client's custodian or, less
commonly, to the client itself. This material will include proxy cards,
reflecting the shareholdings of Funds and of clients on the record dates for
such shareholder meetings, as well as proxy statements with the issuer's
explanation of the items to be voted upon.
MFS, on behalf of itself and the Funds, has entered into an
agreement with an independent proxy administration firm, Institutional
Shareholder Services, Inc. (the "Proxy Administrator"), pursuant to which
the Proxy Administrator performs various proxy vote related administrative
services, such as vote processing and recordkeeping functions for MFS'
Funds and institutional client accounts. The Proxy Administrator receives
proxy statements and proxy cards directly or indirectly from various
custodians, logs these materials into its database and matches upcoming
meetings with MFS Fund and client portfolio holdings, which are input into
the Proxy Administrator's system by an MFS holdings datafeed. Through the
use of the Proxy Administrator system, ballots and proxy material
summaries for all upcoming shareholders' meetings are available on-line to
certain MFS employees and the MFS Proxy Voting Committee.
159
4. ANALYZING PROXIES
Proxies are voted in accordance with these MFS Proxy Voting Policies
and Procedures. The Proxy Administrator at the prior direction of MFS
automatically votes all proxy matters that do not require the particular
exercise of discretion or judgment with respect to these MFS Proxy Voting
Policies and Procedures as determined by the MFS Proxy Voting Committee.
With respect to proxy matters that require the particular exercise of
discretion or judgment, MFS considers and votes on those proxy matters.
MFS receives research from ISS which it may take into account in deciding
how to vote. In addition, MFS expects to rely on ISS to identify
circumstances in which a board may have approved excessive executive
compensation. Representatives of the MFS Proxy Voting Committee review, as
appropriate, votes cast to ensure conformity with these MFS Proxy Voting
Policies and Procedures.
As a general matter, portfolio managers and investment analysts have
little or no involvement in specific votes taken by MFS. This is designed
to promote consistency in the application of MFS' voting guidelines, to
promote consistency in voting on the same or similar issues (for the same
or for multiple issuers) across all client accounts, and to minimize the
potential that proxy solicitors, issuers, or third parties might attempt
to exert inappropriate influence on the vote. In limited types of votes
(E.G., corporate actions, such as mergers and acquisitions), a
representative of MFS Proxy Voting Committee may consult with or seek
recommendations from MFS portfolio managers or investment analysts.(1)
However, the MFS Proxy Voting Committee would ultimately determine the
manner in which all proxies are voted.
As noted above, MFS reserves the right to override the guidelines
when such an override is, in MFS' best judgment, consistent with the
overall principle of voting proxies in the best long-term economic
interests of MFS' clients. Any such override of the guidelines shall be
analyzed, documented and reported in accordance with the procedures set
forth in these policies.
-----------
(1) From time to time, due to travel schedules and other commitments, an
appropriate portfolio manager or research analyst is not available to
provide a recommendation on a merger or acquisition proposal. If such a
recommendation cannot be obtained prior to the cut-off date of the
shareholder meeting, certain members of the MFS Proxy Voting Committee may
determine to abstain from voting.
160
5. VOTING PROXIES
In accordance with its contract with MFS, the Proxy Administrator
also generates a variety of reports for the MFS Proxy Voting Committee,
and makes available on-line various other types of information so that the
MFS Proxy Voting Committee may review and monitor the votes cast by the
Proxy Administrator on behalf of MFS' clients.
C. MONITORING SYSTEM
It is the responsibility of the Proxy Administrator and MFS' Proxy
Voting Committee to monitor the proxy voting process. When proxy materials
for clients are received, they are forwarded to the Proxy Administrator
and are input into the Proxy Administrator's system. Through an interface
with the portfolio holdings database of MFS, the Proxy Administrator
matches a list of all MFS Funds and clients who hold shares of a company's
stock and the number of shares held on the record date with the Proxy
Administrator's listing of any upcoming shareholder's meeting of that
company.
When the Proxy Administrator's system "tickler" shows that the
voting cut-off date of a shareholders' meeting is approaching, a Proxy
Administrator representative checks that the vote for MFS Funds and
clients holding that security has been recorded in the computer system. If
a proxy card has not been received from the client's custodian, the Proxy
Administrator calls the custodian requesting that the materials be
forwarded immediately. If it is not possible to receive the proxy card
from the custodian in time to be voted at the meeting, MFS may instruct
the custodian to cast the vote in the manner specified and to mail the
proxy directly to the issuer.
D. RECORDS RETENTION
MFS will retain copies of these MFS Proxy Voting Policies and
Procedures in effect from time to time and will retain all proxy voting
reports submitted to the Board of Trustees, Board of Directors and Board
of Managers of the MFS Funds for the period required by applicable law.
Proxy solicitation materials, including electronic versions of the proxy
cards completed by representatives of the MFS Proxy Voting Committee,
together with their respective notes and comments, are maintained in an
electronic format by the Proxy Administrator and are accessible on-line by
the MFS Proxy Voting Committee. All proxy voting materials and supporting
documentation, including records generated by the Proxy Administrator's
system as to proxies processed, including the dates when proxy ballots
were received and submitted, and the votes on each company's proxy issues,
are retained as required by applicable law.
161
E. REPORTS
MFS Funds
MFS publicly discloses the proxy voting records of the MFS Funds on
an annual basis, as required by law. MFS will also report the results of
its voting to the Board of Trustees, Board of Directors and Board of
Managers of the MFS Funds. These reports will include: (i) a summary of
how votes were cast; (ii) a summary of votes against management's
recommendation; (iii) a review of situations where MFS did not vote in
accordance with the guidelines and the rationale therefore; (iv) a review
of the procedures used by MFS to identify material conflicts of interest
and any matters identified as a material conflict of interest; and (v) a
review of these policies and the guidelines and, as necessary or
appropriate, any proposed modifications thereto to reflect new
developments in corporate governance and other issues. Based on these
reviews, the Trustees, Directors and Managers of the MFS Funds will
consider possible modifications to these policies to the extent necessary
or advisable.
All MFS Advisory Clients
At any time, a report can be printed by MFS for each client who has
requested that MFS furnish a record of votes cast. The report specifies
the proxy issues which have been voted for the client during the year and
the position taken with respect to each issue.
Except as described above, MFS generally will not divulge actual
voting practices to any party other than the client or its representatives
(unless required by applicable law) because we consider that information
to be confidential and proprietary to the client.
162
MONTAG & CALDWELL, INC.
PROXY VOTING POLICIES
If directed by Client, decisions on voting of proxies will be made by
Montag & Caldwell, Inc. ("M&C") in accordance with these guidelines (as amended
from time to time). M&C will consider proxies as a client asset and will vote
consistently across all client portfolios for which we have voting authority in
the manner we believe is most likely to enhance shareholder value.
If M&C is authorized to make decisions on voting of proxies, we will have
no obligation to furnish Client any proxies, notices of shareholder meetings,
annual reports or other literature customarily mailed to shareholders.
Once voting authority has been delegated to M&C, Client may not at a later
date direct how to vote the proxies. Clients who wish to adhere to a proprietary
set of voting guidelines should exercise their right to reserve voting authority
rather than delegating this responsibility to M&C.
Should the situation arise where M&C is an investment adviser to a company
whose proxy we are authorized to vote or any other potential conflict of
interest is perceived and the item falls outside the issues explicitly addressed
by these guidelines, the matter will be reviewed by the entire proxy committee.
If an item is explicitly addressed by these guidelines it will be voted
accordingly. If an item falls outside the issues explicitly addressed by these
guidelines and we would vote against management, no further review is needed. If
further review is needed the Proxy Committee will first determine if the
conflict is material. If it is material, the Proxy Committee will determine the
steps needed to resolve the conflict before the proxy is voted.
It is against M&C's policy for employees to serve on the board of
directors of a company whose stock could be purchased for M&C's advisory
clients.
The following guidelines establish our position on many common issues
addressed in proxy solicitations and represent how we will generally vote such
issues; however, all proxy proposals will be reviewed by an investment
professional to determine if shareholder interests warrant any deviation from
these guidelines or if a proposal addresses an issue not covered in the
guidelines.
ROUTINE MATTERS
Routine proxy proposals are most commonly defined as those which do not
change the structure, bylaws, or operation of the corporation to the detriment
of the shareholders.
M&C will generally support management on routine matters and will vote FOR
the following proposals:
- Increase in authorized common shares.
- Increase in authorized preferred shares as long as there are not
disproportionate voting rights per preferred share.
- Routine election or re-election of directors.
- Appointment or election of auditors.
- Directors' liability and indemnification.
- Time and location of annual meeting.
163
COMPENSATION ISSUES
M&C will review on a case by case basis the following issues:
- Compensation or salary levels.
- Incentive plans.
- Stock option plans.
- Employee stock purchase or ownership plans.
SOCIAL ISSUES
Shareholders often submit proposals to change lawful corporate activities
in order to meet the goals of certain groups or private interests that they
represent.
We will support management in instances where we feel acceptable efforts
are made on behalf of special interests of social conscience. The burden of
social responsibility rests with management. We will generally vote AGAINST
shareholder proposals regarding the following social concerns:
- Enforcing restrictive energy policies.
- Placing arbitrary restrictions on military contracting.
- Barring or placing arbitrary restrictions on trade with
communist countries.
- Barring or placing arbitrary restrictions on conducting business in
certain geographic locations.
- Restricting the marketing of controversial products.
- Limiting corporate political activities.
- Barring or restricting charitable contributions.
- Enforcing general policy regarding employment practices based on
arbitrary parameters.
- Enforcing a general policy regarding human rights based on arbitrary
parameters.
- Enforcing a general policy regarding animal rights based on
arbitrary parameters.
- Placing arbitrary restrictions on environmental practices.
BUSINESS PROPOSALS
Business proposals are resolutions which change the status of the
corporation, its individual securities, or the ownership status of these
securities. We believe it is in the best interest of the shareholders to support
managements who propose actions or measures that are supported by existing
corporate laws, or have legal precedence as common practice in corporate
America.
164
We will generally vote FOR the following proposals as long as the current
shareholder position is either enhanced or preserved:
- Changing the state of incorporation.
- Mergers, acquisitions, dissolvement.
- Indenture changes.
- Changes in capitalization.
SHAREHOLDER GOVERNANCE
These are issues that address the status of existing rights of
shareholders and proposals which tend to transfer those rights to or from
another party.
We will generally vote FOR the following management proposals:
- Majority approval of shareholders in acquisitions of a controlling
share in the corporation.
- Provisions which require 66-2/3% shareholder approval or less to
rescind a proposed change to the corporation or amend the
corporation's by-laws.
We will generally vote AGAINST the following management proposals:
- Super-majority provisions which require greater than 66-2/3%
shareholder approval to rescind a proposed change to the corporation
or to amend the corporation's by-laws.
- Fair-price amendments which do not permit a takeover unless an
arbitrary fair price that is derived from a fixed formula is offered
to all shareholders.
- The authorization of a new class of common stock or preferred stock
which may have more votes per share than the existing common stock.
- Proposals which do not allow replacements of existing members of the
board of directors.
We will generally vote FOR shareholder proposals which:
- Propose or support a majority of independent directors and/or
independent audit, compensation, and nominating committees.
- Rescind share purchase rights or require that they are submitted for
shareholder approval to 66-2/3% or less.
- Eliminate pension and benefit programs for outside directors.
- Eliminate a staggered board of directors.
165
PROXY CONTESTS
Proxy contests develop when discontented shareholders submit a proxy card
in opposition to the board of directors, frequently seeking to elect a different
slate of directors, often in an effort to effect a decided change in the
corporation. Our voting decision in a proxy contest will be in favor of the best
interests of the majority of shareholders, our clients, and beneficiaries of the
assets which we manage.
ADMINISTRATIVE ISSUES
Proxy voting guidelines will be reviewed annually and approved by the
Investment Policy Committee.
M&C will maintain a record of proxy voting guidelines and the annual
updates electronically.
M&C has established a Proxy Committee that consists of at least three
members of the Investment Policy Committee and includes at least one research
analyst and two portfolio managers.
Proxy voting decisions will be made by at least one member of the Proxy
Committee within the framework established by these guidelines that are designed
to vote in the best interests of all clients.
M&C will maintain a record of any document created by M&C or procured from
an outside party that was material to making a decision how to vote proxies on
behalf of a client or that memorializes the basis of that decision.
M&C will maintain records detailing receipt of proxies, number of shares
voted, date voted and how each issue was voted. These records will be available
upon request to those clients for whom we have proxy voting responsibility.
M&C will maintain records of all written client requests for information
on how M&C voted proxies on behalf of the client and M&C's response to the
client's written or verbal requests.
The proxy voting process will be monitored for accuracy. A voting history
report is generated by the Supervisor of Information Processing on a monthly
basis. This report is provided to the Chief Compliance Officer to verify against
ballot copies.
The Supervisor of Information Processing will provide the Chief Compliance
Officer with a quarterly statement that all ballots were received or reasonable
steps, under the circumstances, have been taken to obtain the ballots.
Reviewed May 19, 2006
166
NEPTUNE INVESTMENT MANAGEMENT LIMITED ("NEPTUNE" OR "THE
COMPANY" PROXY VOTING
POLICIES AND PROCEDURES
1. BACKGROUND
Proxy voting is an important right of shareholders and reasonable care and
diligence must be applied to ensure that such rights are exercised in a properly
and timely exercised manner.
Investment advisers registered with the SEC, and which exercise voting authority
with respect to client securities, are required by Rule 206(4)-6 of the Advisers
Act to (a) adopt and implement written policies and procedures that are
reasonably designed to ensure that client securities are voted in the best
interests of clients, which must include how an adviser addresses material
conflicts that may arise between an adviser's interests and those of its
clients; (b) to disclose to clients how they may obtain information from the
adviser with respect to the voting of proxies for their securities; (c) to
describe to clients a summary of its proxy voting policies and procedures and,
upon request, furnish a copy to its clients; and (d) maintain certain records
relating to the adviser's proxy voting activities when the adviser does have
proxy voting authority.
2. POLICY
Neptune's, policy for proxy voting, which it considers to be a vital component
of its fiduciary duty to its clients, is to fulfill its responsibility for
voting proxies for portfolio securities consistent in a manner with the best
economic interests of its clients. Neptune maintains written policies and
procedures as to the handling, research, voting and reporting of proxy voting
and makes appropriate disclosures about the Company's proxy policies and
practices. Our policy and practice includes the responsibility to monitor
corporate actions, receive and vote client proxies and disclose any potential
conflicts of interest as well as making information available to clients about
the voting of proxies for their portfolio securities and maintaining relevant
and required records.
Unless voting authority has been explicitly reserved by the governing documents
to the client or another party, Neptune will exercise discretionary voting
authority over proxies issued on securities held in client accounts.
It is the policy of Neptune to vote, focused on the investment implications of
each issue and in a manner that Neptune believes is in the best interests of its
clients.
3. RESPONSIBILITY
The Neptune Proxy Voting Policy Committee and its designated service provider, a
provider which is advised by the specific funds custodian, have the
responsibility for the implementation and monitoring of the Company's proxy
voting policy, practices, disclosures and record keeping, including outlining
our voting guidelines in our procedures.
167
4. PROCEDURES
Neptune has adopted procedures to implement the Company's policy and conduct
reviews to monitor and ensure the policy is observed, implemented properly and
amended or updated, as appropriate. These procedures may be summarized as
follows:
4.01 PROXY COMMITTEES
Neptune has established two Proxy Committees to oversee the proxy process. The
Proxy Voting Policy Committee and the Proxy Voting Procedure Committee. Their
responsibilities are as follows:
The Proxy Voting Policy Committee will establish guidelines, review special
issues and oversee the proxy voting process. The Committee consists at a minimum
of the Chief Investment Officer, the Head of Research, the Chief Compliance
Officer and the designated Proxy Officer. No less than annually, the Committee
is responsible for reviewing the guidelines it has established amending them as
required and reviewing the performance of its voting agents. Meetings may be
called by any Committee member throughout the year, based on issues that arise.
The Proxy Voting Procedure Committee will focus on operational and procedural
aspects. The Committee consists at a minimum of the Chief Compliance Officer,
designated Investment Administration personnel and the Proxy Officer. No less
than annually, the Committee is responsible for reviewing any operational or
procedural issues related to the proxy process. Meetings may be called by any
Committee member throughout the year, based on issues that arise.
4.02 VOTING
The Proxy Voting Policy Committee is advised by the custodian of the fund's
voting agent. Each voting agent provides analysis of proxy proposals, tracks and
receives proxies for which Neptune's clients are entitled to vote and votes
proxies pursuant to agreed upon guidelines. Neptune compiles and retains voting
records. A Proxy Officer has been designated to coordinate communications
between the Fund Administration personnel and each relevant voting agent. The
Proxy Officer named is Philip Keiff.
The steps for reviewing and submitting votes are as follows:
- The Proxy Officer reviews the voting agent's systems on a weekly
basis during the proxy season.
- The Proxy Officer prints copies of the upcoming voting agendas and
the number of shares as noted by the voting agent as being held by
Neptune.
- The Proxy Officer reviews the voting agendas, determines if there
are any issues to report to the relevant Portfolio Manager,
documents evidence of their review of the agenda and maintains
copies in a proxy file.
- The Compliance Department will review, on a semi-annual basis, the
Proxy Officer's proxy files to ensure there is evidence of review.
168
- For each vote, the relevant Portfolio Manager reviews the number of
shares held for reasonableness to ensure that the voting agent has
an accurate record of the shares Neptune is responsible for voting.
This process is facilitated by the Proxy Officer.
5. VOTING GUIDELINES
In the absence of specific voting guidelines from the client, Neptune will vote
proxies in the best interests of each particular client. Neptune's policy is to
vote all proxies from a specific issuer the same way for each client in the
absence of qualifying instructions or restrictions from a client. Clients are
permitted to place reasonable restrictions on Neptune's voting authority in the
same manner that they may place such restrictions on the actual selection of
account securities.
6. CONFLICTS OF INTEREST
Neptune has eliminated most actual or perceived conflicts of interest as the
majority of proxy issues are voted by an independent third party, pursuant to
the guidelines adopted by the relevant Proxy Committee. In cases where Neptune
believes there may be an actual or perceived conflict of interest, it seeks to
address such conflicts in various ways, including the following:
- Documenting fully the investment rationale for the decision, the
conflict of interest and the method in which the conflict was
addressed;
- Requiring the approval of the Chief Compliance Officer prior to
providing voting instructions to the voting agent;
- Holding special Committee meetings, where warranted, to determine
the steps to be taken, or in cases where special meetings were not
deemed warranted, requiring the Committee to review the decisions;
- Seeking legal counsel.
In situations where Neptune perceives a material conflict of interest, it may:
- Defer to the voting recommendation of the voting agent;
- Vote pursuant to client direction (following disclosure of the
conflict to the client),
- Vote reflectively (in the same proportion and manner as other
shareholders),
- Abstain from voting; or
- Take such other action which, in the considered view of the Proxy
Committee, protects the interests of its clients.
169
Circumstances necessitating such actions may include the voting of proxies on
securities issued by Neptune or the voting of proxies where Neptune or its
affiliates have a direct financial interest.
The Proxy Officer and the Compliance Department will identify any conflicts that
exist between the interests of Neptune and the client by reviewing the
relationship of Neptune with the issuer of each security to determine if Neptune
or any of its employees has any financial, business or personal relationship
with the issuer.
If a material conflict of interest exists, the Proxy Voting Policy Committee
will determine whether it is appropriate to disclose the conflict to the
affected clients, to give the clients an opportunity to vote the proxies
themselves, or to address the voting issue through other objective means such as
voting in a manner consistent with a predetermined voting policy or receiving an
independent third party voting recommendation.
Neptune will maintain a record of the voting resolution of any conflict of
interest.
7. RECORDKEEPING
The Proxy Voting Policy Committee shall retain the following proxy records in
accordance with the applicable regulator's five-year retention requirement.
- These policies and procedures and any amendments;
- Each proxy statement that Neptune receives;
- A record of each vote that Neptune casts;
- Any document that Neptune created that was material to making a
decision on how to vote proxies, or that documents that decision,
including period reports to the Trustee/Depositary;
- A copy of each written request from a client for information on how
Neptune voted such client's proxies, and a copy of any written
response.
8. DISCLOSURE
- Neptune will provide clients on request, a summary of its proxy
voting policy and procedures, including a statement, if required,
detailing how Neptune voted a client's proxies.
- The Proxy Voting Policy Committee will also send a copy of this
summary to all existing clients who have previously received
Neptune's Policies and Procedures Document; or the Proxy Voting
Policy Committee may send each client the amended Policies and
Procedures Document. Either mailing shall highlight the inclusion of
information regarding proxy voting.
9. CLIENT REQUESTS FOR INFORMATION
- All client requests for information regarding proxy votes, or
policies and procedures, received by any employee should be
forwarded to the Chief Compliance Officer, Karen Barker.
- In response to any request, the Proxy Committee will prepare a
written response to the client with the information requested and,
as appropriate will include the name of the issuer, the proposal
voted upon, and how Neptune voted the client's proxy with respect to
each proposal about which client enquired.
170
OPTIMUM INVESTMENT ADVISORS, LLC
SUMMARY OF PROXY VOTING POLICIES
AUGUST, 2006
INTRODUCTION
Optimum Investment Advisors, LLC ("Optimum") manages discretionary
accounts on behalf of a diverse group of clients, including individuals, trusts,
IRAs, ERISA plans, state and local government funds, corporations and charitable
foundations. According to the provisions of Section 4 of Optimum's Investment
Advisory Agreement, unless the client is an employee benefit plan subject to
ERISA, Optimum does not vote proxies on behalf of clients, including in the
circumstance where the client has instructed his custodian to forward proxies to
Optimum instead of to the client. Optimum does vote proxies for the ABN AMRO Mid
Cap Fund under its sub-advisory contract.
GENERAL POLICY
Optimum acts as fiduciary and votes proxies in a way that it believes will
be consistent with the best interest of the beneficial owners of the accounts
and will maximize the market value of their investments. Although Optimum may
consult with a third party on proxy issues, no outsider, including a client,
will dictate Optimum's proxy voting.
Optimum generally supports routine business matters, unless Optimum views
support as contrary to the best financial interest of the shareholders. Optimum
carefully reviews proposals for changes in status of a company, to determine
whether such changes (such as mergers or restructurings) benefit the financial
interests of the shareholders, and votes accordingly. Proposals that restrict
shareholder democracy are generally not supported if such proposals restrict the
rights of shareholders, particularly shareholders' ability to realize the value
of their investment, and proposals that increase shareholder democracy are
generally supported. Compensation proposals are reviewed individually using the
same standards. However, all such matters are reviewed on a case-by-case basis
and voted based on the financial interest of the shareholders.
CONFLICTS OF INTEREST
On occasion, it is possible that Optimum will encounter some type of
conflict between a proxy vote and a relationship Optimum has with a company or
client. Optimum is aware that such conflicts might exist; however, Optimum will
always vote in the best interest of the shareholders. In the case of a conflict,
Optimum may discuss the conflict and/or the vote with the client. Optimum will
consult with an independent third party as well. Such conflicts and the actions
taken will be documented.
RECORDKEEPING
Optimum will maintain records of its proxy votes in accordance with the
Investment Advisers Act of 1940 and preserve such records for the 6 calendar
years following the time any proxy vote is cast by Optimum, keeping the most
recent 2 full calendar years of proxy voting records in Optimum's office.
DISCLOSURE
Optimum will provide this summary of its proxy voting policy to all of its
advisory clients annually, and Optimum will provide clients with records of
proxy voting information for their own proxies at a client's request in
accordance with Rule 204-2 of the Advisers Act.
A copy of Optimum's Proxy Voting Policies and Procedures is available upon
request.
171
RIVER ROAD ASSET MANAGEMENT, LLC
PROXY VOTING
POLICIES AND PROCEDURES
SECTION
23 OF 32
POLICY
River Road Asset Management, LLC, as a matter of policy and as a fiduciary
to our clients, has responsibility for voting proxies for portfolio securities
consistent with the best economic interests of the clients. Our firm maintains
written policies and procedures as to the handling, research, voting and
reporting of proxy voting and makes appropriate disclosures about our firm's
proxy policies and practices. Our policy and practice includes the
responsibility to monitor corporate actions, receive and vote client proxies and
disclose any potential conflicts of interest as well as making information
available to clients about the voting of proxies for their portfolio securities
and maintaining relevant and required records.
Unless voting authority has been explicitly reserved by the governing
documents to the client or another party, the Adviser will exercise
discretionary voting authority over proxies issued on securities held in client
accounts.
It is the policy of the Adviser to vote, focused on the investment
implications of each issue and in a manner that the Adviser believes is in the
best interest of its clients.
BACKGROUND
Proxy voting is an important right of shareholders and reasonable care and
diligence must be undertaken to ensure that such rights are properly and timely
exercised.
Investment advisers registered with the SEC, and which exercise voting
authority with respect to client securities, are required by Rule 206(4)-6 of
the Advisers Act to (a) adopt and implement written policies and procedures that
are reasonably designed to ensure that client securities are voted in the best
interests of clients, which must include how an adviser addresses material
conflicts that may arise between an adviser's interests and those of its
clients; (b) to disclose to clients how they may obtain information from the
adviser with respect to the voting of proxies for their securities; (c) to
describe to clients a summary of its proxy voting policies and procedures and,
upon request, furnish a copy to its clients; and (d) maintain certain records
relating to the adviser's proxy voting activities when the adviser does have
proxy voting authority.
RESPONSIBILITY
The Proxy Voting Policy Committee and its designated service provider,
Institutional Shareholder Services ("ISS"), have the responsibility for the
implementation and monitoring of our proxy voting policy, practices, disclosures
and record keeping, including outlining our voting guidelines in our procedures.
172
PROCEDURE
River Road Asset Management has adopted procedures to implement the firm's
policy and reviews to monitor and insure the firm's policy is observed,
implemented properly and amended or updated, as appropriate, which may be
summarized as follows:
PROXY COMMITTEE'S
River Road Asset Management has established two Proxy Committee's to
oversee the proxy process. The Proxy Voting Policy Committee and the Proxy
Voting Procedure Committee. There responsibilities are as follows:
The Proxy Voting Policy Committee will establish guidelines, review
special issues and oversee the proxy voting process. The Committee consists at a
minimum of the Chief Investment Officer of the unit, the Director of Research
for the unit, the Director of Compliance, and the designated Proxy Officer. No
less than annually, the Committee is responsible for approving or amending the
guidelines it has established and reviewing the performance of its voting agent.
Meetings may be called by any Committee member throughout the year, based on
issues that arise.
The Proxy Voting Procedure Committee will focus on operational and
procedural aspects. The Committee consists at a minumim of the Director of
Compliance, the designated Proxy Analyst(s), designated Investment Operations
personnel, the Compliance Officer, and the Proxy Officer. No less than annually,
the committee is responsible for reviewing any operational or procedural issues
related to the proxy process. Meetings may be called by any Committee member
throughout the year, based on issues that arise.
VOTING
The Proxy Voting Policy Committee has hired Institutional Shareholder
Services (ISS) as its voting agent. ISS provides analysis of proxy proposals,
tracks and receives proxies for which River Road Asset Management's clients are
entitled to vote, votes proxies pursuant to agreed upon guidelines and compiles
and provides voting records for River Road Asset Management. A Proxy Officer has
been designated to coordinate communications between the Proxy Analysts,
Investment Operations personnel and ISS. The Proxy Officer named is Keri
Chandler.
The steps for reviewing and submitting votes are as follows:
- The Proxy Analysts reviews the ISS system on a weekly basis during
proxy season.
- The Proxy Analysts print copies of the upcoming voting agendas and
the number of shares as noted by ISS as being held by River Road
Asset Management.
- The Proxy Analysts review the voting agendas, determine if there are
any issues to report to the Head Portfolio Manager, document
evidence of their review of the agenda, and maintain the copies in a
proxy file.
- The Compliance Department will review on a semi-annually
basis, the Proxy Analyst's proxy files to ensure there is evidence
of review.
173
- For each vote, the Head Portfolio Manager reviews the number of
shares held for reasonability to ensure that ISS has an accurate
record of the shares River Road Asset Management is responsible for
voting. This process is facilitated by the Proxy Analysts.
- Once a month or more often, Investment Operations submits a file of
current clients and their holdings to ISS. Only clients that have
delegated voting to River Road Asset Management are included in this
feed.
- ISS matches the client accounts to the applicable proxy and records
the vote.
VOTING GUIDELINES
In the absence of specific voting guidelines from the client, River Road
Asset Management will vote proxies in the best interests of each particular
client. River Road Asset Management's policy is to vote all proxies from a
specific issuer the same way for each client absent qualifying restrictions from
a client. Clients are permitted to place reasonable restrictions on River Road
Asset Management's voting authority in the same manner that they may place such
restrictions on the actual selection of account securities. 2005 Approved Proxy
Voting Guidelines.
CONFLICTS OF INTEREST
River Road Asset Management has eliminated most actual or perceived
conflicts of interest as the majority of proxy issues are voted by an
independent third party, pursuant to the guidelines adopted by the Proxy
Committee. In cases where River Road Asset Management believes there may be an
actual or perceived conflict of interest the Adviser seeks to address such
conflicts in various ways, including the following:
- Documenting the investment rationale for the decision, the conflict
of interest and the method in which the conflict was addressed;
- Requiring the approval of the Department Head and the CCO prior to
providing voting instructions to the voting agent;
- Holding special Committee meetings, where warranted, to determine
the steps to be taken, or in cases where special meetings were not
deemed warranted, requiring the Committee to review the decisions;
- Seeking legal counsel.
In situations where River Road Asset Management perceives a material
conflict of interest, the Adviser may:
- Defer to the voting recommendation of ISS or another independent
third party;
- Vote pursuant to client direction (following disclosure of the
conflict to the client)
- Vote reflectively (in the same proportion and manner as other
shareholders),
- Abstain from voting; or
174
- Take such other action which protects the interests of its
clients.
Circumstances necessitating such actions may include the voting of proxies
on securities issued by River Road Asset Management's affiliated corporations or
the voting of proxies where the Adviser or its affiliates have a direct
financial interest.
The Proxy Analyst will identify any conflicts that exist between the
interests of the adviser and the client by reviewing the relationship of River
Road Asset Management with the issuer of each security to determine if River
Road Asset Management or any of its employees has any financial, business or
personal relationship with the issuer.
If a material conflict of interest exists, the Proxy Voting Policy
Committee will determine whether it is appropriate to disclose the conflict to
the affected clients, to give the clients an opportunity to vote the proxies
themselves, or to address the voting issue through other objective means such as
voting in a manner consistent with a predetermined voting policy or receiving an
independent third party voting recommendation.
ABN AMRO Asset Management will maintain a record of the voting resolution
of any conflict of interest.
RECORDKEEPING
ISS and the Proxy Voting Policy Committee shall retain the following proxy
records in accordance with the SEC's five-year retention requirement.
- These policies and procedures and any amendments;
- Each proxy statement that River Road Asset Management receives;
- A record of each vote that River Road Asset Management casts;
- Any document River Road Asset Management created that was material
to making a decision how to vote proxies, or that memorializes that
decision including period reports to the GENERAL MANAGER;
- A copy of each written request from a client for information on how
River Road Asset Management voted such client's proxies, and a copy
of any written response.
DISCLOSURE
- River Road Asset Management will provide conspicuously displayed
information in its Disclosure Document summarizing this proxy voting
policy and procedures, including a statement that clients may
request information regarding how River Road Asset Management voted
a client's proxies, and that clients may request a copy of these
policies and procedures.
- The Proxy Voting Policy Committee will also send a copy of this
summary to all existing clients who have previously received River
Road Asset Management's Disclosure Document; or the Proxy Voting
Policy Committee may send each client the amended Disclosure
Document. Either mailing shall highlight the inclusion of
information regarding proxy voting.
175
CLIENT REQUESTS FOR INFORMATION
- All client requests for information regarding proxy votes, or
policies and procedures, received by any employee should be
forwarded to the Chief Compliance Officer.
- In response to any request the Proxy Committee and its designated
service provider, ISS, will prepare a written response to the client
with the information requested, and as applicable will include the
name of the issuer, the proposal voted upon, and how River Road
Asset Management voted the client's proxy with respect to each
proposal about which client enquired.
REGULATORY REFERENCE
Proxy Voting
MANUAL VERSION RELEASE DATE: 1/5/2006 10:24:47 AM
323-A Main St. -- P.O. Box 71 -- Lakeville, CT, 06039 -- (860) 435-0200 --
fax (860) 435-0031
(C) Copyright 2005-2006, National Regulatory Services. All Rights Reserved.
176
PROXY VOTING
POLICIES AND PROCEDURES
TAMRO CAPITAL PARTNERS, LLC
POLICY
TAMRO, as a matter of policy and as a fiduciary to clients, has responsibility
for voting proxies for portfolio securities consistent with the best economic
interests of clients. The Company maintains written policies and procedures as
to the handling, research, voting and reporting of proxy voting and makes
appropriate disclosures about the Company's proxy policies and practices.
Company policy and practice includes the responsibility to monitor corporate
actions, receive and vote client proxies and disclose any potential conflicts of
interest as well as make information available to clients about the voting of
proxies for their portfolio securities and maintaining relevant and required
records.
Unless voting authority has been explicitly reserved by the governing documents
for the client or another party, TAMRO will exercise discretionary voting
authority over proxies issued on securities held in client accounts. It is TAMRO
policy to vote with a focus on the basis of the investment implications of each
issue and in a manner that the Company believes is in the best interest of its
clients.
Where possible, it is TAMRO policy to take action on behalf of clients with
regard to portfolio holdings which are subject to corporate actions (of a
non-proxy nature) so long as the Company is in a position to: (1) have reason to
know that the client portfolio holds such a security for which there is a
corporation action; and (2) have receipt of notice of corporate action from the
client custodian who maintains custody of such security on behalf of the client.
Common corporate actions include tender offers, spin-offs, mergers/de-mergers,
and name changes.
BACKGROUND
Proxy voting is an important right of shareholders and reasonable care and
diligence must be undertaken to ensure that such rights are exercised properly
and in a timely fashion. Investment advisers registered with the SEC, and who
exercise voting authority with respect to client securities, are required by
Rule 206(4)-6 of the Advisers Act to: (1) adopt and implement written policies
and procedures that are reasonably designed to ensure that client securities are
voted in the best interests of clients, which must include how an adviser
addresses material conflicts that may arise between an adviser's interests and
those of its clients; (2) disclose to clients how they may obtain information
from the adviser with respect to the voting of proxies for their securities; (3)
describe to clients a summary of its proxy voting policies and procedures and,
upon request, furnish a copy to its clients; and (4) maintain certain records
relating to the adviser's proxy voting activities when the adviser does have
proxy voting authority.
177
RESPONSIBILITY
It is the Trader's responsibility to notify the Investment Team of all pending
proxy votes. The Investment Team and its designated proxy service provider have
the responsibility for the implementation and monitoring of the Company's proxy
voting policy, practices, disclosures and record keeping. The Investment Team
considers the recommendations of the proxy service provider, but may override
such recommendations as deemed appropriate. The CIO is responsible for all
override approvals. It is the responsibility of client custodians to notify the
Company of pending corporate actions which impact securities held in client
portfolios managed by TAMRO.
PROCEDURES / INTERNAL CONTROLS
TAMRO has adopted procedures to implement, monitor, and amend as necessary the
Company's corporate action and proxy policies, as summarized below.
ROLE OF INVESTMENT TEAM
It is the responsibility of the Investment Team to oversee the proxy process. At
least annually, the Investment Team is responsible for approving or amending the
guidelines it has established, reviewing the performance of the proxy service
provider, and addressing any procedural issues that may arise in proxy voting
processes. Meetings may be called by any Investment Team member throughout the
year, based on issues that arise.
PROXY VOTING
The proxy service provider offers analysis of proxy proposals, tracks and
receives proxies for which TAMRO clients are entitled to vote, votes proxies
pursuant to agreed upon guidelines and compiles and provides voting records for
the Company.
The steps for reviewing and submitting votes are as follows:
- The Trader reviews the proxy system on a weekly basis during proxy season.
- The Trader saves copies of the upcoming voting agendas and the number of
shares held by TAMRO.
- The Trader reviews the voting agendas, determines if there are any issues
to report to the Investment Team, documents evidence of their review of the
agenda, and maintains the copies in a proxy file.
- For each vote, the Trader reviews the number of shares held for
reasonability to ensure that the provider has an accurate record of the
shares TAMRO is responsible for voting.
- If the Investment Team chooses to override the proxy service provider's
recommendations, the CIO will complete and sign a Proxy Override Form to
document the decision. Override forms are maintained in proxy files held by
the Trader.
- Once a week the Operations Department submits a file of current clients and
their holdings to the proxy provider. Only clients that have delegated
voting to TAMRO are included in this feed.
- The proxy service provider matches the client accounts to the applicable
proxy, records the vote and reconciles shares held in TAMRO client accounts
against the ballots received for the accounts. Exact matches may not occur
due to certain accounts having securities lending arrangements.
- The CCO will review on a periodic basis the Trader's proxy files to ensure
there is evidence of review.
178
VOTING GUIDELINES
In the absence of specific voting guidelines from the client, TAMRO will vote
proxies in the best interests of each particular client. The Company's policy is
to vote all proxies from a specific issuer the same way for each client absent
qualifying restrictions from a client. Clients are permitted to place reasonable
restrictions on the Company's voting authority in the same manner that they may
place such restrictions on the actual selection of account securities.
CONFLICTS OF INTEREST
There may be instances where the Company or its access persons are subject to
conflicts of interest in the voting of proxies. Conflicts of interest may exist,
for example, due to personal or familial relationships of personnel or when
TAMRO has a business relationship with, or is soliciting business from, the
issuing company (or an employee group of a company), or a third party that is a
proponent of a particular outcome on a proxy issue. TAMRO requires documentation
regarding potential conflicts of interest. In cases where it believes there may
be an actual or perceived conflict of interest, the Company requires additional
steps that may include obtaining the prior approval of the CCO, obtaining
Investment Team review or approval, deferring to the voting recommendation of a
third party, voting pursuant to client direction (following disclosure of the
conflict), abstaining from voting, voting reflectively (in the same proportion
and manner as other shareholders) or taking such other action as necessary to
protect the interests of clients. In all such cases, proxy records will fully
reflect such conflicts and their resolution, and include evidence of approvals
as necessary.
RECORDKEEPING
TAMRO and the service provider shall retain the following proxy records in
accordance with SEC retention requirements:
- These policies and procedures and any amendments.
- Each proxy statement that TAMRO receives.
- A record of each vote that TAMRO casts.
- Any document TAMRO created that was material to making a decision how to
vote proxies, or that memorializes that decision, including Proxy Override
Forms.
- A copy of each written request from a client for information on how TAMRO
voted such client's proxies, and a copy of any written response.
DISCLOSURE
- TAMRO will provide information in its ADV Form, Part II summarizing proxy
voting policy and procedures, including a statement that clients may
request information regarding how the Company voted proxies, and that
clients may request a copy of these policies and procedures. Form ADV Part
II is provided at the time of contract execution and offered annually
thereafter.
OTHER CORPORATE ACTIONS
- At the time of a new client relationship, TAMRO shall direct the client's
custodian to add the Company to the mailing/notification list should a
corporate action notice come to the attention of the custodian for a
holding in the client's TAMRO portfolio. Copies of corporate action notices
should be sent to the attention of the Trader.
179
- The Investment Team shall act upon all such corporate action notices upon
receipt, where possible, in a manner that is deemed to be in the client's
best interests.
- All copies of approved corporate action records are maintained in the
designated centralized client files maintained by the COO.
CLIENT REQUESTS FOR INFORMATION
- All client requests for information regarding proxy votes, or policies and
procedures, received by any employee should be forwarded to the CCO.
- In response to any request the Investment Team and its designated service
provider will prepare a written response to the client with the information
requested, and as applicable will include the name of the issuer, the
proposal voted upon, and the manner in which TAMRO voted the client's proxy
with respect to each proposal about which the client inquired.
180
PROXY VOTING
POLICIES AND PROCEDURES
TAPLIN, CANIDA & HABACHT, INC.
POLICY
TCH, as a matter of policy and practice, has no authority to vote proxies
on behalf of advisory clients. The Adviser may offer assistance as to proxy
matters upon a client's request, but the client in all cases has either retained
the proxy voting responsibility or designated the responsibility to the
custodian or other third party. Upon client request, TCH would consider
accepting such responsibility. Consequently, TCH would amend current disclosures
and adopt appropriate policies.
TCH's policy of having no proxy voting responsibility is disclosed to
clients in the ADV. TCH has also adopted the policy to include disclosure in all
future contracts that the Adviser does not vote proxies.
The vast majority of ERISA accounts to which TCH acts as investment
advisor are fixed-income accounts, which do not participate in proxy voting.
BACKGROUND
Proxy voting is an important right of shareholders and reasonable care and
diligence must be undertaken to ensure that such rights are property and timely
exercised.
Investment advisers registered with the SEC, and which exercise voting
authority with respect to client securities, are required by Rule 206(4)-6 of
the Investment Advisers Act to (a) adopt and implement written policies and
procedures that are reasonably designed to ensure that client securities are
voted in the best interests of clients, which must include how your address
material conflicts that may arise between your interests and those of your
client's (b) to disclose to clients how they may obtain information from you
with respect to the voting of proxies for their securities; and (c) to describe
to clients a summary of your proxy voting policies and procedures and, upon
request, furnish a copy to your clients.
181
VEREDUS ASSET MANAGEMENT
PROXY VOTING POLICIES AND PROCEDURES
AS OF MAY 31, 2005
I. POLICY
Proxy voting is an important right of shareholders and reasonable care and
diligence must be taken to ensure that such rights are properly and timely
exercised. When Veredus Asset Management (VAM) has discretion to vote the
proxies of its clients, it will vote those proxies in the best interest of its
clients and in accordance with these policies and procedures.
II. VOTING GUIDELINES
In the absence of specific voting guidelines from the client, VAM will
vote proxies in the best interests of the clients.
The key objectives of the following policies and procedures recognize that
a company's management is entrusted with the day-to-day operations and longer
term strategic planning of the company, subject to the oversight of the
company's board of directors. While "ordinary business matters" are primarily
the responsibility of management and should be approved solely by the
corporation's board of directors, these objectives also recognize that the
company's shareholders must have final say over how management and directors are
performing, and how shareholders' rights and ownership interests are handled,
especially when matters could have substantial economic implications to the
shareholders.
III. PROXY VOTING PROCEDURES
(1) In an effort to assist VAM in gathering information and voting, VAM
has outsourced proxy voting to Institutional Shareholder Services
(ISS), a leading provider of proxy voting and corporate governance
services. All proxy ballots are sent directly to ISS from the
custodian banks. ISS researches the proxy issues and provides a
voting recommendation based upon their proxy-voting manual utilized
consistently among all clients (a summary of the ISS proxy voting
manual may be obtained upon request). VAM accesses this information
via the internet and determines if we agree with the recommendations
made by ISS. VAM maintains the right to determine the final vote
made. If ISS recommends voting against management, special attention
is given to the issue to determine if VAM agrees with the
recommendation. VAM will research the issue and discuss it with the
portfolio managers and if it is determined that a vote with
management is in the best interest of the client, we will change the
vote by logging onto the ISS Proxymaster website where a manual vote
change can be made.
(2) As VAM is utilizing ISS, a third party proxy service, we must ensure
that ISS does not have a conflict through a separate relationship
with an issuer prior to VAM accepting recommendations on voting
issues. As part of our voting procedures, VAM will contact ISS and
obtain information on any services ISS has performed for the issuer
in question and the dollar amount paid for the service. VAM will
then assess the information and determine if a conflict exists. If
it is determined that a conflict does exist, VAM will perform it's
own research of the issues and make an informed decision on the
vote. If no conflict exists, VAM will consider the ISS
recommendation as usual.
182
IV. CONFLICTS OF INTEREST
(1) The Proxy Administrator will identify any conflicts that exist
between the interests of VAM and its clients. This examination will
include a review of the relationship of VAM and its affiliates with
the issuer of each security (and any of the issuer's affiliates) to
determine if the issuer is a client of VAM or an affiliate of VAM or
has some other relationship with VAM or a client of VAM.
(2) If a material conflict exists, VAM will determine whether voting in
accordance with the voting guidelines and factors described above is
in the best interests of the client. VAM will also determine whether
it is appropriate to disclose the conflict to the affected clients
and, except in the case of clients that are subject to the Employee
Retirement Income Security Act of 1974, as amended ("ERISA"), give
the clients the opportunity to vote their proxies themselves. In the
case of ERISA clients, if the Investment Management Agreement
reserves to the ERISA client the authority to vote proxies when VAM
determines it has a material conflict that affects its best judgment
as an ERISA fiduciary, VAM will give the ERISA client the
opportunity to vote the proxies themselves, or special ERISA proxy
voting procedures must provide for a pre-determined voting policy
that eliminates the discretion of VAM when voting proxies if such a
conflict exists.
V. DISCLOSURE
(1) VAM will disclose in its Form ADV Part II that clients may contact
the Proxy Administrator, Amy Benningfield, via e-mail,
abenningfield@veredus.com or telephone (502) 214-5281 in order to
obtain information on how VAM voted such client's proxies, and to
request a copy of these policies and procedures. If a client
requests this information, the Proxy Administrator will prepare a
written response to the client that lists, with respect to each
voted proxy that the client has inquired about, (1) the name of the
issuer; (2) the proposal voted upon and (3) how VAM voted the
client's proxy.
(2) A concise summary of these Proxy Voting Policies and Procedures will
be included in VAM's Form ADV Part II, and will be updated whenever
these policies and procedures are updated. The Proxy Administrator
will arrange for a copy of this summary to be sent to all existing
clients either as a separate mailing or along with a periodic
account statement or other correspondence sent to clients.
VI. RECORDKEEPING
The Proxy Administrator will maintain files relating to VAM's proxy voting
procedures in VAM's office. Records will be maintained and preserved for five
years from the end of the fiscal year during which the last entry was made on a
record, with records for the first two years kept in the offices of VAM. Records
of the following will be included in the files:
(1) Copies of these proxy voting policies and procedures, and any
amendments thereto.
(2) A copy of any document VAM created that was material to making a
decision how to vote proxies, or that memorializes that decision.
(3) A copy of each written client request for information on how VAM
voted such client's proxies, and a copy of any written response to
any (written or oral) client request for information on how VAM
voted its proxies.
As VAM has access to proxy statements and records of each vote cast via
the ISS Proxymaster website on the internet, we will not maintain paper copies
within our office.
183
PROXY VOTING GUIDELINES AND PROCEDURES
NEW CENTURY CAPITAL MANAGEMENT LLC
DECEMBER 5, 2007
The following represents the guidelines and procedures for NCCM with
respect to the voting of proxies on behalf of all clients for which NCCM has
responsibility for voting proxies and the keeping of records relating to proxy
voting.
A. GENERAL POLICY. NCCM shall vote proxies related to securities held by
clients in a manner guided solely by the best interest of the clients. NCCM
shall consider only those factors that relate to the clients' investment,
including how its vote will economically impact and affect the value of the
clients' investment. Proxy votes generally will be cast in favor of the
management recommendation that maintain or strengthen the shared interests of
shareholders and management, increase shareholder value, maintain or increase
shareholders influence over issuer's board of directors and management, and
maintain or increase the rights of shareholders; proxy votes generally will be
cast against management recommendations having the opposite effect. Accordingly,
NCCM has engaged Broadridge's ProxyEdge voting services to vote all proxies on
behalf of client accounts and recording keeping services.
B. PROXY VOTING ADMINISTRATION. The Director of Operations or her designee
works with the proxy voting service and is responsible for ensuring that all
proxies are voted.
C. VOTING AND USE OF PROXY VOTING SERVICE. NCCM has engaged Broadridge
ProxyEdge Service, an independent Proxy Voting Service, to give NCCM online
access in the voting of proxies. In addition, ProxyEdge is responsible for
maintaining copies of all proxy statements received by issuers and to promptly
provide such materials to NCCM upon request. NCCM will process all proxy votes
in accordance with the above policy. NCCM will use echo voting for investment
company shares when required by law.
D. CONFLICTS OF INTEREST. NCCM shall vote all proxies based on the best
interest of NCCM's clients in accordance with the above policy. NCCM shall
conduct periodic reviews of proxy voting records on a sample basis to ensure
that all votes are actually cast in accordance with this policy. In light of the
foregoing policies, it is not expected that any conflicts will arise in the
proxy voting process. In the unusual circumstance that NCCM is otherwise in a
position of evaluating a proposal on a case-by-case basis, the matter shall be
referred to the Chief Compliance Officer to determine whether a material
conflict exists.
E. REPORTING AND RECORD RETENTION. Upon request, on an annual basis, NCCM
will provide its clients with the proxy voting record for that client's account.
The Director of Operations or her designee shall retain records of votes cast on
behalf of clients and records of client requests for proxy voting information.
Proxy statements received from issuers are either available on the SEC's EDGAR
database or are kept by a third party voting service and are available on
request. In addition, NCCM will retain copies of its Proxy Voting Procedures and
Guidelines. All proxy voting materials and supporting documentation are retained
for a minimum of 6 years.
F. REVIEW OF POLICY. NCCM shall periodically review this policy and the
services provided by Broadridge ProxyEdge and Broadridge ProxyDisclosure to file
N-PX to determine whether the continued use of Broadridge is in the best
interest of clients.
184
SMART PORTFOLIOS LLC
IA POLICIES AND PROCEDURES MANUAL
12/04/07 TO CURRENT
PROXY VOTING
Policy
Smart Portfolios LLC, as a matter of policy and as a fiduciary to our clients,
has responsibility for voting proxies for portfolio securities consistent with
the best economic interests of the clients. Our firm maintains written policies
and procedures as to the handling, research, voting and reporting of proxy
voting and makes appropriate disclosures about our firm's proxy policies and
practices. Our policy and practice includes the responsibility to monitor
corporate actions, receive and vote client proxies and disclose any potential
conflicts of interest as well as making information available to clients about
the voting of proxies for their portfolio securities and maintaining relevant
and required records.
Background
Proxy voting is an important right of shareholders and reasonable care and
diligence must be undertaken to ensure that such rights are properly and timely
exercised.
Investment advisers registered with the SEC, and which exercise voting authority
with respect to client securities, are required by Rule 206(4)-6 of the Advisers
Act to (a) adopt and implement written policies and procedures that are
reasonably designed to ensure that client securities are voted in the best
interests of clients, which must include how an adviser addresses material
conflicts that may arise between an adviser's interests and those of its
clients; (b) to disclose to clients how they may obtain information from the
adviser with respect to the voting of proxies for their securities; (c) to
describe to clients a summary of its proxy voting policies and procedures and,
upon request, furnish a copy to its clients; and (d) maintain certain records
relating to the adviser's proxy voting activities when the adviser does have
proxy voting authority.
Responsibility
The Investment Policy Committee has the responsibility for the implementation
and monitoring of our proxy voting policy, practices, disclosures and record
keeping, including outlining our voting guidelines in our procedures.
Procedure
Smart Portfolios LLC has adopted procedures to implement the firm's policy and
reviews to monitor and insure the firm's policy is observed, implemented
properly and amended or updated, as appropriate, which include the following:
Voting Procedures
- All employees will forward any proxy materials received on behalf of
clients to the Investment Policy Committee;
185
- The Investment Policy Committee or designated personnel will determine
which client accounts hold the security to which the proxy relates;
- Absent material conflicts, the Investment Policy Committee will determine
how Smart Portfolios LLC should vote the proxy in accordance with
applicable voting guidelines, complete the proxy and vote the proxy in a
timely and appropriate manner.
Disclosure
- Smart Portfolios LLC will provide conspicuously displayed information in
its Disclosure Document summarizing this proxy voting policy and
procedures, including a statement that clients may request information
regarding how Smart Portfolios LLC voted a client's proxies, and that
clients may request a copy of these policies and procedures.
Client Requests for Information
- All client requests for information regarding proxy votes, or policies and
procedures, received by any employee should be forwarded to Investment
Policy Committee.
- In response to any request the Investment Policy Committee will prepare a
written response to the client with the information requested, and as
applicable will include the name of the issuer, the proposal voted upon,
and how Smart Portfolios LLC voted the client's proxy with respect to each
proposal about which client inquired.
Voting Guidelines
- In the absence of specific voting guidelines from the client, Smart
Portfolios LLC will vote proxies in the best interests of each particular
client. Smart Portfolios LLC's policy is to vote all proxies from a
specific issuer the same way for each client absent qualifying restrictions
from a client. Clients are permitted to place reasonable restrictions on
Smart Portfolios LLC's voting authority in the same manner that they may
place such restrictions on the actual selection of account securities.
- Smart Portfolios LLC will generally vote in favor of routine corporate
housekeeping proposals such as the election of directors and selection of
auditors absent conflicts of interest raised by an auditors non-audit
services.
- Smart Portfolios LLC will generally vote against proposals that cause board
members to become entrenched or cause unequal voting rights.
- Smart Portfolios LLC will use echo voting for investment company shares
when required by law.
- In reviewing proposals, Smart Portfolios LLC will further consider the
opinion of management and the effect on management, and the effect on
shareholder value and the issuer's business practices.
186
Conflicts of Interest
- Smart Portfolios LLC will identify any conflicts that exist between the
interests of the adviser and the client by reviewing the relationship of
Smart Portfolios LLC with the issuer of each security to determine if Smart
Portfolios LLC or any of its employees has any financial, business or
personal relationship with the issuer.
- If a material conflict of interest exists, the Investment Policy Committee
will determine whether it is appropriate to disclose the conflict to the
affected clients, to give the clients an opportunity to vote the proxies
themselves, or to address the voting issue through other objective means
such as voting in a manner consistent with a predetermined voting policy or
receiving an independent third party voting recommendation.
- Smart Portfolios LLC will maintain a record of the voting resolution of any
conflict of interest.
Recordkeeping
The Investment Policy Committee shall retain the following proxy records in
accordance with the SEC's five-year retention requirement.
- These policies and procedures and any amendments;
- Each proxy statement that Smart Portfolios LLC receives;
- A record of each vote that Smart Portfolios LLC casts;
- Any document Smart Portfolios LLC created that was material to making a
decision how to vote proxies, or that memorializes that decision including
periodic reports to the Investment Policy Committee or proxy committee, if
applicable.
- A copy of each written request from a client for information on how Smart
Portfolios LLC voted such client's proxies, and a copy of any written
response.
187
Baring Asset Management Group Companies
(the "Companies")
Proxy Voting Policies and Procedures
Executive Summary
The Companies owe fiduciary, contractual, and statutory duties to vote
proxies on the securities that they manage for many of their clients. The
Companies will vote client proxies in accordance with the procedures set forth
below unless the client retains in writing the right to vote proxies or the
Companies determine that any benefit the client may gain from voting a proxy
would be outweighed by the costs associated therewith. For many clients, the
Companies have assumed contractual responsibility to vote proxies on the
securities that they manage for those clients' accounts. For ERISA clients
(i.e., employee benefit plans formed pursuant to the Employee Retirement Income
Security Act of 1974), the Companies owe fiduciary and statutory duties to vote
proxies on ERISA client securities unless the ERISA clients have explicitly
retained the obligation to do so. The Companies also vote proxies for those
clients who have invested in certain commingled funds, but do not vote proxies
for clients who have invested in the "active/passive" commingled funds
maintained at State Street Bank and Trust ("State Street"), as State Street
retains authority to vote proxies for those clients. To ascertain whether a
particular client has delegated proxy voting responsibility to the Companies,
please contact the Global Events Department or Legal and Compliance Department.
The Companies reserve the right to amend these Proxy Voting Policies and
Procedures from time to time without prior notice to their clients.
Special Circumstances When Proxy Votes May Not Be Cast
In some cases, the Companies may determine that it is not in the best
economic interests of clients to vote proxies. For example, some non-U.S.
securities issuers impose fees on shareholders or their custodians for
exercising the right to vote proxies. Other issuers may "block," or prohibit,
shareholders from transferring or otherwise disposing of their shares for a
period of time after the securities holders have noticed their intent to vote
their proxies. Moreover, some issuers require the registration of securities in
the name of the beneficial owners before permitting proxies to be cast, and thus
mandate the disclosure of the identity of beneficial owners of securities, which
may be contrary to the wishes of the Companies' clients.
The U.S. Department of Labor (the "U.S. Labor Department"), which enforces
ERISA, recognizes that ERISA clients may incur additional costs in voting
proxies linked to shares of non-U.S. corporations. The U.S. Labor Department
advises that investment advisers, such as the Companies, should weigh the effect
of voting clients' shares against the cost of voting.
188
In these instances, the Global Events Department will notify the
appropriate portfolio managers of the costs or restrictions that may apply in
voting proxies. Portfolio managers, with guidance from the Proxy Committee if
desired, will weigh the economic benefit to the Companies' clients of voting
those proxies against the cost of doing so. The Global Events Department shall
record the reason for any proxy not being voted, which record shall be kept with
the proxy voting records of the Companies.
Institutional Shareholder Services ("ISS")
The Companies have contracted with ISS, an independent third party service
provider, to vote the Companies' clients' proxies according to ISS's proxy
voting recommendations. ISS will also provide proxy analysis, vote
recommendations, vote execution and record-keeping services for clients for
which the Companies have proxy voting responsibility.
The clients' custodians forward proxy materials to ISS for those clients
who rely on the Companies to vote proxies. ISS forwards proxy proposals along
with ISS proxy analysis and vote recommendations to the Companies. The Companies
maintain standing instructions that direct ISS to vote all proxies in accordance
with ISS recommendations.
ISS Conflict of Interest
There may be instances when ISS makes no recommendation on a proxy voting
issue or is recused due to a conflict of interest. In these situations, the
applicable portfolio manager will review the issue and, if the Companies do not
also have a conflict of interest, direct the Global Events Department to direct
ISS how to vote the proxies. If the Companies have a conflict of interest, the
Companies, in their sole discretion, shall either engage an independent third
party to provide a vote recommendation or contact the client for direction as to
how to vote the proxies.
Override of ISS Recommendation
There may be occasions where the Companies' portfolio managers seek to
override ISS's recommendations if they believe that ISS's recommendations are
not in accordance with the best economic interests of clients. In the event that
the Companies' portfolio managers disagree with an ISS recommendation on a
particular voting issue, the appropriate portfolio manager shall document in
writing the reasons that the portfolio manager believes that the ISS
recommendation is not in accordance with clients' best economic interests and
submit such written documentation to the Global Events Department.
189
The Global Events Team shall review the rationale stated to ensure that it
is expressed in clear, understandable and complete sentences. Any concerns
should be returned to the Portfolio Manager for clarification and revision of
the rationale. The Global Events Team shall ensure that when the company is a
client of Barings and we wish to vote with the company contrary to the
recommendation of ISS, that the procedure set out in this policy under
'Conflicts of Interest' is followed.
Responsibility for the provision of a clear rationale for each occasion
when ISS recommendation is not to be followed rests with the Portfolio Manager.
The Proxy Voting Committee at each meeting will collectively review and approve
the rationale given. If any rationale is judged to be inadequate, further
clarification will be requested from the Portfolio Manager.
The Global Events Team can refer the matter to the Proxy Committee where
they are concerned with the rationale for overriding ISS recommendations.
Special Client Instructions
There are instances when a client has instructed the Companies how they
would like the Companies to vote proxies on particular issues of corporate
governance or other matters. The Companies will be responsible for voting in
accordance with the client instructions. The Global Events Department will
maintain a list of clients that have provided the Companies with special proxy
voting instructions, and will ensure that the client's account is set up as a
segregated account with ISS. Furthermore, the Global Events Department is
responsible for sending a request form to the Client Service Representative
responsible for that client to obtain from the Client Service Representative the
specific voting instructions on behalf of that client.
Proxy Committee
The Companies have established a Proxy Voting Committee, which shall
include representatives from portfolio management, operations, and
legal/compliance or other functional departments as deemed appropriate who are
knowledgeable regarding the proxy process. A list of the current members of the
Proxy Voting Committee is attached hereto as Schedule A. A majority of the
members of the Proxy Committee shall constitute a quorum and the Proxy Committee
shall act by a majority vote. The Proxy Committee meetings may be conducted in
person, telephonically, or via electronic communication (e-mail). A member of
the Global Events Department will manage the proxy voting process, which
includes the taking of minutes of the Proxy Committee, the voting of proxies,
and the maintenance of appropriate records.
The Global Events Department shall call Proxy Committee meetings, prior to
the casting of a vote, to review votes where ISS is conflicted. In these
situations, the Proxy Committee shall meet to review the issue and direct ISS
how to vote the proxy. The Proxy Committee shall review information provided to
it to determine if a real or perceived conflict of interest exists and the
minutes of the Proxy Committee shall describe any real or perceived conflict of
interest and any procedures used to address such conflict of interest.
190
The Global Events Department shall also call quarterly Proxy Committee
meetings to: (i) monitor the Companies' adherence to these Procedures; (ii)
review votes against ISS recommendations or where ISS was conflicted; (iii)
review the list of client requests for a copy of these Procedures and/or the
proxy voting record; and (iv) review new corporate governance issues and
industry trends and determine whether changes to these Procedures are necessary
or appropriate.
Conflicts of Interest -- general
To avoid voting proxies in circumstances where the Companies have or may
have any conflict of interest, real or perceived, the Companies have contracted
with ISS to provide proxy analysis, vote recommendations and voting of proxies,
as discussed herein. In instances where ISS has recused itself and makes no
recommendation on a particular matter the portfolio manager can direct the
Global Events department to direct ISS how to vote proxies assuming the
portfolio manager and the Proxy Committee confirm the Companies are not
conflicted. If an override submission is requested by a portfolio manager, the
Proxy Committee shall determine how the proxy is to be voted, in which case the
Proxy Committee will determine whether a conflict of interest exists and that
the rationale to vote against ISS is reasonable and is in the best interests of
clients.
There may be occasions when a portfolio manager and/or member of its team
who are involved in the proxy voting decision may have a conflict of interest,
or the Companies have a business relationship with the company soliciting the
proxy. A person shall not be considered to have a conflict of interest if the
person did not know of the conflict of interest and did not attempt to influence
the outcome of a proxy vote. Any person with actual knowledge of a conflict of
interest relating to a particular item shall disclose that conflict to the
Global Events Department.
The following are examples of situations where a conflict of interest may
exist:
- The company soliciting the proxy is a client of the Companies;
- The company soliciting the proxy is an affiliate of the
Companies;
- An employee of the Companies is a also a director, officer or
employee of the company soliciting the proxy; and
- A portfolio manager and/or a partner/spouse of a SIT member,
who is involved in making the voting decision is a director,
officer, or employee of the company soliciting the proxy.
191
To monitor the above examples of where a conflict of interest may exist,
the Global Events Department is responsible for maintaining a list of all
publicly traded clients (and the client's parent company) of the Companies. The
Companies currently have no affiliates that are publicly traded companies. The
London Legal Department shall maintain a list of all employees of the Companies
who are directors or officers of publicly traded companies, and shall advise, as
applicable, the London Head of Compliance, who will then advise the Global
Events Department. The portfolio manager and members of the SIT who are involved
in the voting decision are responsible for notifying the Global Events
Department, via the proxy voting form, if said portfolio manager, member or said
member's partner/spouse is a director, officer or employee of the company
soliciting the proxy or if the SIT member is aware of any other possible real or
perceived conflicts of interest.
The Companies have a duty to vote proxies in the best interests of their
clients. Therefore, in situations where there is a real or perceived conflict of
interest, the Companies will either vote the securities in accordance with a
pre-determined policy based upon the recommendations of an independent third
party, such as a proxy voting service, or disclose the conflict to the client
and obtain the client's direction to vote the proxy.
CONFLICTS OF INTEREST -- BARINGS MUTUAL FUNDS
DISCRETIONARY CLIENTS.
Where the IMA requires it OR for UK mutual funds, we cannot vote our
Clients' holdings of any mutual funds or other securities managed or advised by
Barings or any other member of the MassMutual group -- an "In-House Vote" --
unless we have obtained the relevant Client's prior instructions on how to vote
that particular holding -- and irrespective of whether we are voting in line
with ISS's recommendation.
In this scenario, each Client will need to be contacted and their specific
instructions sought on how we should vote. These instructions should be obtained
in accordance with any applicable requirements as regards obtaining instructions
as specified in the relevant IMA / Authorised Signatory list, with appropriate
records maintained to demonstrate that this has been done.
The default position will be that it is assumed the client must be
contacted unless proved otherwise (note: for UK mutual funds we must always
contact the clients). Where the IMA does not require the client to be contacted,
then we can only vote in line with ISS recommendations. If the Portfolio Manager
wishes to override ISS recommendations they must get the written agreement of
the client.
MUTUAL FUNDS
In a situation where one Barings mutual fund is invested in another
Barings mutual fund then the following process should be followed.
192
UK Funds. These units cannot be voted. This is in accordance with FSA
requirements.
Non UK Funds. Voting should be undertaken in accordance with the
provisions stated in the general 'Conflict of Interest' section above. If a
Portfolio Manager wishes to override ISS (or another independent third party)
recommendation then this will be referred to the Proxy Voting Committee for
review. Any decision by the Proxy Voting Committee to override the
recommendation of an independent third party must demonstrate why it is
considered to be in the interests of Barings' clients.
ISS Proxy Voting Guidelines
A copy of ISS's proxy voting guidelines can be found on the ISS Website at
http://www.issproxy.com/policy/2006policy.jsp.
Proxy Voting Policies and Procedures and Voting Records
A copy of these Proxy Voting Policies and Procedures as well as a record
of how proxies have been voted for a client's account will be provided to the
client upon request. Clients may request a copy of these Proxy Voting Policies
and Procedures and information about how the Companies voted proxies on the
client's behalf by contacting their client service representative.
Recordkeeping
The Companies must retain the following documentation as it relates to
proxy voting:
1. Copies of all Proxy Voting policies & Procedures;
2. A copy of each proxy statement received regarding client securities;
(An adviser may satisfy this requirement by relying on a third party to
make and retain, on the adviser's behalf, a copy of a proxy statement
(provided that the adviser has obtained an undertaking from the third
party to provide a copy of the proxy statement promptly upon request) or
may rely on obtaining a copy of a proxy statement from the Commission's
Electronic Data Gathering, Analysis, and Retrieval (EDGAR) system.)
3. A record of each vote cast on behalf of a client;
(An adviser may satisfy this requirement by relying on a third party to
make and retain, on the adviser's behalf, a record of the vote cast,
provided that the adviser has obtained an undertaking from the third party
to provide a copy of the record promptly upon request.)
4. A copy of any document created by the adviser that was material to making
a decision how to vote proxies on behalf of a client or that memorializes
the basis for that decision; and
5. A copy of each written request for information on how the adviser voted
proxies on behalf of the client, and a copy of any written response by the
adviser to any (written or oral) client request for information on how the
adviser voted proxies on behalf of the requesting client.
The above records shall be maintained and preserved in an easily
accessible place for a period of not less than five years from the end of the
fiscal year during which the last entry was made on such record, the first two
years in an appropriate office of the adviser. The Companies rely on ISS and the
Global Events Department to maintain the above records.
193
CARDINAL CAPITAL MANEGEMENT, L.L.C.
PROXY VOTING POLICIES AND PROCEDURES
AS OF AUGUST 1, 2006
I. POLICY
Proxy voting is an important right of shareholders and reasonable care and
diligence must be undertaken to ensure that such rights are properly and timely
exercised. When Cardinal Capital has discretion to vote the proxies of its
clients, it will vote those proxies in the best interest of its clients and in
accordance with these policies and procedures.
II. PROXY VOTING PROCEDURES
(a) All proxies received by Cardinal Capital will be sent to Thomas J.
Spelman. Thomas J. Spelman will:
(1) Keep a record of each proxy received;
(2) Forward the proxy to the appropriate Portfolio Manager.
(3) Determine which accounts managed by Cardinal Capital hold the
security to which the proxy relates;
(4) Provide the Portfolio Manager with a list of accounts that hold
the security, together with the number of votes each account controls
(reconciling any duplications), and the date by which Cardinal Capital must vote
the proxy in order to allow enough time for the completed proxy to be returned
to the issuer prior to the vote taking place.
(5) Absent material conflicts (see Section IV), the Portfolio
Manager will determine how Cardinal Capital should vote the proxy. The Portfolio
Manager will send its decision on how Cardinal Capital will vote a proxy to
Thomas J. Spelman. Thomas J. Spelman is responsible for completing the proxy and
mailing the proxy in a timely and appropriate manner.
(6) Cardinal Capital may retain a third party to assist it in
coordinating and voting proxies with respect to client securities. If so, Thomas
J. Spelman shall monitor the third party to assure that all proxies are being
properly voted and appropriate records are being retained.
194
III. VOTING GUIDELINES
In the absence of specific voting guidelines from the client, Cardinal
Capital will vote proxies in the best interests of each particular client, which
may result in different voting results for proxies for the same issuer. Cardinal
Capital believes that voting proxies in accordance with the following guidelines
is in the best interests of its clients.
Generally, Cardinal Capital will vote in favor of routine corporate
housekeeping proposals, including election of directors (where no corporate
governance issues are implicated), selection of auditors, and increases in or
reclassification of common stock.
Generally, Cardinal Capital will vote against proposals that make it more
difficult to replace members of the issuer's board of directors, including
proposals to stagger the board, cause management to be overrepresented on the
board, introduce cumulative voting, introduce unequal voting rights, and create
supermajority voting.
For other proposals, Cardinal Capital shall determine whether a
proposal is in the best interests of its clients and may take into
account the following factors, among others:
(1) Whether the proposal was recommended by management and
Cardinal Capital's opinion of management;
(2) Whether the proposal acts to entrench existing management; and
(3) Whether the proposal fairly compensates management for past
and future performance.
IV. CONFLICTS OF INTEREST
(1) Thomas J. Spelman will identify any conflicts that exist between
the interests of Cardinal Capital and its clients. This examination will include
a review of the relationship of Cardinal Capital and its affiliates with the
issuer of each security [and any of the issuer's affiliates] to determine if the
issuer is a client of Cardinal Capital or an affiliate of Cardinal Capital or
has some other relationship with Cardinal Capital or a client of Cardinal
Capital.
(2) If a material conflict exists, the Adviser will determine
whether voting in accordance with the voting guidelines and factors described
above is in the best interests of the client. Cardinal Capital will also
determine whether it is appropriate to disclose the conflict to the affected
clients and, except in the case of clients that are subject to the Employee
Retirement Income Security Act of 1974, as amended ("ERISA"), give the clients
the opportunity to vote their proxies themselves. In the case of ERISA clients,
if the Investment Management Agreement reserves to the ERISA client the
authority to vote proxies when Cardinal Capital determines it has a material
conflict that affects its best judgment as an ERISA fiduciary, Cardinal Capital
will give the ERISA client the opportunity to vote the proxies themselves, or
special ERISA proxy voting procedures must provide for a pre-determined voting
policy that eliminates the discretion of the Adviser when voting proxies if such
a conflict exists.
195
V. DISCLOSURE
(a) Cardinal Capital will disclose in its Form ADV Part II that clients
may contact the Compliance Officer, Thomas J. Spelman via e-mail or telephone at
tspelman@cardcap.com in order to obtain information on how Cardinal Capital
voted such client's proxies, and to request a copy of these policies and
procedures. If a client requests this information, the Compliance Officer will
prepare a written response to the client that lists, with respect to each voted
proxy that the client has inquired about, (1) the name of the issuer; (2) the
proposal voted upon and (3) how Cardinal Capital voted the client's proxy.
(b) A concise summary of these Proxy Voting Policies and Procedures will
be included in Cardinal Capital's Form ADV Part II, and will be updated whenever
these policies and procedures are updated. The Compliance Officer will arrange
for a copy of this summary to be sent to all existing clients (who will already
have been sent Cardinal Capital's Form ADV Part II, which is required to be
offered to clients annually) either as a separate mailing or along with a
periodic account statement or other correspondence sent to clients.
VI. RECORDKEEPING
Thomas J. Spelman will maintain files relating to Cardinal Capital's proxy
voting procedures in an easily accessible place. Records will be maintained and
preserved for five years from the end of the fiscal year during which the last
entry was made on a record, with records for the first two years kept in the
offices of Cardinal Capital. Records of the following will be included in the
files:
(a) Copies of these proxy voting policies and procedures, and any
amendments thereto.
(b) A copy of each proxy statement that Cardinal Capital receives,
provided however that Cardinal Capital may rely on obtaining a copy of proxy
statements from the SEC's EDGAR system for those proxy statements that are so
available.
(c) A record of each vote that Cardinal Capital casts.
(d) A copy of any document Cardinal Capital created that was material to
making a decision how to vote proxies, or that memorializes that decision.
(e) A copy of each written client request for information on how Cardinal
Capital voted such client's proxies, and a copy of any written response to any
(written or oral) client request for information on how Cardinal Capital voted
its proxies.
196
PROXY VOTING POLICY AND PROCEDURES
MB INVESTMENT PARTNERS, INC.
Adopted June 2003
I. STATEMENT OF POLICY
Proxy voting is an important right of shareholders and reasonable care and
diligence must be undertaken to ensure that such rights are properly and timely
exercised. When the Adviser has discretion to vote the proxies of its clients,
it will vote those proxies in the best interest of its clients and in accordance
with these policies and procedures.
II. PROXY VOTING PROCEDURES
All proxies received by the Adviser will be sent to the Portfolio Manager who
will:
- Keep a record of each proxy received;
- Determine which accounts managed by the Adviser hold the
security to which the proxy relates;
- Absent material conflicts (see Section IV below), the Portfolio
Manager will determine how the Adviser should vote the proxy.
The Portfolio Manager will send its decision on how the Adviser
will vote a proxy to the Compliance Officer. The Portfolio
Manager is responsible for completing the proxy and delivering
the proxy in a timely and appropriate manner.
III. VOTING GUIDELINES
In the absence of specific voting guidelines from the client, the Adviser will
vote proxies in the best interests of each particular client, which may result
in different voting results for proxies for the same issuer. The Adviser
believes that voting proxies in accordance with the following guidelines is in
the best interests of its clients.
- Generally, the Adviser will vote in favor of routine corporate
housekeeping proposals, including election of directors (where
no corporate governance issues are implicated), selection of
auditors, and increases in or reclassification of common stock
- Generally, the Adviser will vote against proposals that make
it more difficult to replace members of the issuer's board of
directors, including proposals to stagger the board, cause
management to be overrepresented on the board, introduce
cumulative voting, introduce unequal voting rights, and create
supermajority voting.
For other proposals, the Adviser shall determine whether a proposal is in the
best interests of its clients and may take into account the following factors,
among others:
197
- Whether the proposal was recommended by management and the
Adviser's opinion of management;
- Whether the proposal acts to entrench existing management; and
- Whether the proposal fairly compensates management for past
and future performance.
IV. CONFLICTS OF INTEREST
1. The Portfolio Manager will identify any conflicts that exist between
the interests of the Adviser and its clients. This examination will
include a review of the relationship of the Adviser and its
affiliates with the issuer of each security and any of the issuer's
affiliates to determine if the issuer is a client of the Adviser or
an affiliate of the Adviser or has some other relationship with the
Adviser or a client of the Adviser. The Compliance Officer will
review proxy votes submitted by the Portfolio Manager for any
conflicts of the manager.
2. If a material conflict exists, the Adviser will determine whether
voting in accordance with the voting guidelines and factors
described above are in the best interests of the client. If a
material conflict exists, the Adviser will also disclose the
conflict to the affected clients and, except in the case of clients
that are subject to the Employee Retirement Income Security Act of
1974, as amended ("ERISA"), give the clients the opportunity to vote
their proxies themselves. In the case of ERISA clients, if the
Investment Management Agreement reserves to the ERISA client the
authority to vote proxies when the Adviser determines it has a
material conflict that affects its best judgment as an ERISA
fiduciary, the Adviser will give the ERISA client the opportunity to
vote the proxies themselves.
V. DISCLOSURE
1. The Adviser will disclose in its Form ADV Part II that clients may
contact the Compliance Officer, via e-mail or telephone, in order to
obtain information on how the Adviser voted such client's proxies,
and to request a copy of these policies and procedures. If a client
requests this information, the Compliance Officer will prepare a
written response to the client that lists, with respect to each
voted proxy about which the client has inquired, (a) the name of the
issuer; (b) the proposal voted upon, and (c) how the Adviser voted
the client's proxy.
2. A concise summary of this Proxy Voting Policy and Procedures will be
included in the Adviser's Form ADV Part II, and will be updated
whenever these policies and procedures are updated. The Compliance
Officer will arrange for a copy of this summary to be sent to all
existing clients (who will already have been sent Adviser's Form ADV
Part II, which is required to be offered to clients annually) either
as a separate mailing or along with a periodic account statement or
other correspondence sent to clients.
VI. RECORDKEEPING
The Compliance Officer will maintain files or ensure files are being maintained
by the appropriate personnel of the Adviser relating to the Adviser's proxy
voting procedures in an easily accessible place. Records will be maintained and
preserved for five years from the end of the fiscal year during which the last
entry was made on a record, with records for the first two years kept in the
offices of the Adviser. Records of the following will be included in the files:
- Copies of this proxy voting policy and procedures, and any
amendments thereto.
- A copy of each proxy statement that the Adviser receives.
- A record of each vote that the Adviser casts.2
- A copy of any document the Adviser created that was material to
making a decision how to vote proxies, or that memorializes
that decision.
- A copy of each written client request for information on how
the Adviser voted such client's proxies, and a copy of any
written response to any (written or oral) client request for
information on how the Adviser voted its proxies.
1 The Adviser may choose instead to have a third party retain a copy of proxy
statements (provided that third party undertakes to provide a copy of the
proxy statements promptly upon request).
2 The Adviser may also rely on a third party to retain a copy of the votes
cast (provided that the third party undertakes to provide a copy of the
record promptly upon request).
198
(ASTON ASSET MANAGEMENT LOGO)
ANNUAL REPORT 2009
October 31, 2009
CLASS N, I & R SHARES
EQUITY, INTERNATIONAL, ALTERNATIVE,
SECTOR, BALANCED & FIXED INCOME
(GRAPHIC)
Aston Funds
Aston Funds
Dear Fellow Shareholder:
What a difference a year makes.
Just twelve months ago, global financial markets were mired in one of their
worst panics since the Great Depression, most of the world's major economies
were contracting sharply and investors were flocking to high-quality
government-backed bonds, the asset class deemed most defensive in periods of
stress. Now, the global economy continues to show signs of stabilization,
liquidity has begun to return to the credit markets and investors increasingly
are exhibiting a greater appetite for riskier assets. In response, U.S. and
foreign stocks have posted some of their strongest gains in history since March
2009, and high-yield and investment-grade corporate bonds have enjoyed a sharp
rally during that span.
What can we learn from the past year?
More than any other year we can recall, the past 12 months serve as a sharp
reminder of the importance of the basic principles of investing. First, staying
the course over the long-term often is the most beneficial approach and helps
reduce the emotion of investing. As one example of this, many investors who
maintained their exposure to the U.S. stock market over the past year generally
were better off one year later than those who sold and remained out of stocks
altogether. On October 31, 2009, the Standard & Poor's 500(R) Index stood at
1036.19, up nearly 7% from a year earlier. This statistic helps illustrate the
perils of trying to time swings in market performance. Second, diversification
across asset classes still matters. Although there has been a higher-than-normal
correlation between the returns of riskier asset classes over the past several
years, high-quality equity and bond income producing investments and certain
high liquidity alternative products generally have proven to be an effective
method for diversifying a portfolio.
Where do we go from here?
Given the severity of the financial crisis and the economic downturn, a full
recovery in the global economy and financial markets may take longer than
normal. Although major challenges undoubtedly lie ahead, we remain optimistic
that long-term opportunities will, as they always do during any transition,
continue to emerge.
To continue to meet and capitalize on those challenges and the inevitable
opportunities that will emerge from them, we believe that we have assembled one
of the most talented and time-tested team of subadvisers in the business under
the Aston Funds umbrella. Each of them is a best-of-breed money manager that
pursues a disciplined, process-driven management style that helped us weather
the recent storm better than many.
In the pages that follow, we submit this annual report for Aston Funds. To our
long-standing shareholders, we extend our thanks for your continued support. And
to those who have recently joined us, we welcome you into the family.
Best wishes for a profitable and productive 2010.
Sincerely,
/s/ Kenneth Anderson
Kenneth Anderson
President
Aston Funds
The views expressed in this report reflect those of the portfolio managers only
through the end of the period covered and do not necessarily represent the views
of Aston or any other person in Aston Asset Management LLC. Any such views are
subject to change at any time based upon market or other conditions and Aston
disclaims any responsibility to update such views. These views may not be relied
on as investment advice and, because investment decisions for an Aston Fund are
based on numerous factors, may not be relied on as an indication of trading
intent on behalf of any Aston Fund.
Aston Funds
LARGE CAP FUNDS
Montag & Caldwell Growth Fund
Veredus Select Growth Fund
Growth Fund
Optimum Large Cap Opportunity Fund
Value Fund
TAMRO Diversified Equity Fund
EQUITY INCOME FUND
River Road Dividend All Cap Value Fund
MID CAP FUNDS
Optimum Mid Cap Fund
Montag & Caldwell Mid Cap Growth Fund
Cardinal Mid Cap Value Fund
SMALL-MID CAP FUND
River Road Small-Mid Cap Fund
SMALL CAP FUNDS
Veredus Aggressive Growth Fund
TAMRO Small Cap Fund
River Road Small Cap Value Fund
INTERNATIONAL FUNDS
Neptune International Fund
Barings International Fund
ALTERNATIVE FUNDS
Dynamic Allocation Fund
New Century Absolute Return ETF Fund
M.D. Sass Enhanced Equity Fund
Lake Partners LASSO Alternatives Fund
SECTOR FUND
Fortis Real Estate Fund
BALANCED FUNDS
Montag & Caldwell Balanced Fund
Balanced Fund
FIXED INCOME FUND
TCH Fixed Income Fund
TABLE OF CONTENTS
Portfolio Manager's Commentaries & Schedules of Investments .............. 2
Statements of Assets and Liabilities ..................................... 66
Statements of Operations ................................................. 72
Statements of Changes in Net Assets ...................................... 78
Financial Highlights ..................................................... 88
Notes to Financial Statements ............................................ 128
Report of Independent Registered Public Accounting Firm .................. 144
Additional Information (unaudited) ....................................... 145
THIS REPORT IS SUBMITTED FOR GENERAL INFORMATION TO THE SHAREHOLDERS
OF THE FUNDS. IT IS NOT AUTHORIZED FOR DISTRIBUTION TO PROSPECTIVE
INVESTORS IN THE FUNDS UNLESS PRECEDED OR ACCOMPANIED BY AN EFFECTIVE
PROSPECTUS WHICH INCLUDES DETAILS REGARDING THE FUNDS' OBJECTIVES,
POLICIES, EXPENSES AND OTHER INFORMATION.
ASTON FUNDS ARE DISTRIBUTED BY PFPC DISTRIBUTORS, INC., 760 MOORE
ROAD, KING OF PRUSSIA, PA 19406.
SHAREHOLDER SERVICES 800 992-8151 - www.astonfunds.com
NOT FDIC INSURED - NO BANK GUARANTEE - MAY LOSE VALUE
1
Aston Funds
MONTAG & CALDWELL GROWTH FUND
PORTFOLIO MANAGER COMMENTARY (UNAUDITED) OCTOBER 31, 2009
Ronald E. Canakaris, CFA, CIC
Q. What were the most significant market factors affecting Fund performance
and returns relative to the benchmark during the past 12 months?
A. After selling off sharply during the first months of this year, the market
experienced a remarkable rally off its March lows in anticipation of a
second-half recovery in economic activity. The Fund participated with
returns ahead of the S&P 500 Index ("S&P 500"), though it trailed its
Russell 1000(R) Growth Index ("Russell 1000 Growth") benchmark. In this
environment, many of the stocks that helped the Fund significantly
outperform both the S&P 500 and the Russell 1000 Growth during the previous
two years were a short-term drag on relative performance given a resurgence
in some of the more beaten down names and an apparent increase in
investors' appetite for risk. In our work, valuations of many of the more
cyclical and lesser quality issues appear extended based on 2010 earnings.
The biggest detractor from relative performance versus the Russell 1000
Growth this year was stock selection in the Consumer Discretionary and
Financial sectors. We would note both of these areas were contributors to
2008's positive relative returns. The Fund benefited from strong stock
selection in the Technology, Energy, and Healthcare sectors.
Q. What were the best performing holdings for the Fund during the period?
A. Schering-Plough was one of the portfolio's best performers as it agreed to
be acquired by Merck in a cash and stock transaction. The Fund also
benefited from holdings in Apple, as the company's iPhone continued to
drive growth in earnings and the company benefited from better than
expected sales of both its computers and iPods. Cameron International
performed well on a recovery in the price of oil and earnings held up
relatively well due to significant exposure to a secular trend towards
deep-water oil exploration. Google contributed to returns as top-line
growth resumed and its management demonstrated an ability to restrain
spending. Allergan benefited from an expectation that its earnings would
improve with increased expenditures on discretionary healthcare items such
as cosmetic surgery.
Q. What were the weakest performing holdings?
A. Stryker's performance lagged in 2009 as the company had several unresolved
regulatory issues. Wells Fargo hurt the Fund's results during the year as
we sold it and built a position in JPMorgan Chase. Devon was negatively
affected by ongoing weakness in the price of natural gas, which did not
recover. Gilead and Procter & Gamble were among our better performers in
2008 but did not do well in 2009 due to an investor preference for more
cyclical issues.
Q. How was the Fund positioned as of October 31, 2009?
A. We continue to believe the stock market reached a bear market low on March
9, 2009, and that a cyclical bull market is under way. While the S&P 500 is
more fairly valued after a nearly 60% increase from its March 9 low, we are
still finding plenty of attractively valued stocks. Furthermore, there is
ample fiscal and monetary liquidity to support financial markets and
promote economic growth. In our opinion, a synchronized global economic
recovery is under way amid low inflation that should contribute to higher
share prices and mitigate the stock market's risk. Also limiting risk is
the fact that with inflation low there is no reason the Federal Reserve
Board (the "Fed") should tighten its policy any time soon. Still, because
the market is more fairly valued and technically overbought, we do see an
increasing risk of a market correction over the short-term. We would view
that development as a correction within a bull market, and expect the
market subsequently to move higher with the global recovery.
In our opinion the outlook for large-cap growth stocks is good,
particularly for high-quality secular growers. Looking ahead to 2010
earnings, we believe the attractiveness of these stocks will become evident
as we transition to an earnings driven market. On anticipated 2010
earnings, these companies' growth rates appear more attainable and their
valuations more reasonable.
GROWTH OF A HYPOTHETICAL $10,000
INVESTMENT--CLASS N
(PERFORMANCE GRAPH)
Montag & Caldwell Growth Fund
Montag & Caldwell Growth Morningstar(R) Large
Fund - Class N Shares Russell 1000 index Growth Category
------------------------ ------------------ --------------------
Nov-94 10,000 10,000 10,000
Oct-95 13,187 12,921 12,469
Oct-96 17,131 15,770 14,877
Oct-97 22,925 20,575 18,950
Oct-98 27,027 25,645 21,912
Oct-99 34,958 34,428 30,004
Oct-00 34,623 37,641 35,120
Oct-01 28,608 22,603 22,252
Oct-02 24,271 18,168 18,260
Oct-03 26,452 22,131 22,125
Oct-04 27,482 22,879 22,882
Oct-05 29,878 24,895 25,225
Oct-06 32,273 27,593 27,508
Oct-07 40,795 32,899 33,442
Oct-08 28,095 20,743 20,413
Oct-09 32,331 24,375 23,546
All dividends and capital gains are reinvested. Indexes are unmanaged and do not
take into account fees, expenses or other costs.
Returns shown in the chart and table do not reflect taxes that a shareholder
would pay on Fund distributions or on the sale of the Fund shares.
RETURNS FOR PERIOD ENDED 10/31/09
Average Annual Total Returns - Class N
One Year 15.08%
Five Year 3.30%
Ten Year -0.78%
Since Inception 8.14%
Inception Date 11/02/94
Average Annual Total Returns - Class I
One Year 15.36%
Five Year 3.58%
Ten Year -0.51%
Since Inception 5.90%
Inception Date 06/28/96
Average Annual Total Returns - Class R
One Year 14.87%
Five Year 3.08%
Since Inception 4.41%
Inception Date 12/31/02
THE PERFORMANCE DATA QUOTED REPRESENTS PAST PERFORMANCE. PAST PERFORMANCE DOES
NOT GUARANTEE FUTURE RESULTS. INVESTMENT RETURN AND PRINCIPAL VALUE WILL
FLUCTUATE SO THAT AN INVESTOR'S SHARES, UPON REDEMPTION, MAY BE WORTH MORE OR
LESS THAN THEIR ORIGINAL COST. CURRENT PERFORMANCE MAY BE HIGHER OR LOWER THAN
THE PERFORMANCE DATA QUOTED. FOR PERFORMANCE DATA CURRENT TO THE MOST RECENT
MONTH-END, PLEASE VISIT OUR WEBSITE AT www.astonfunds.com.
THE TOTAL EXPENSE RATIO FOR THE N CLASS AND I CLASS IS 1.08% AND 0.83%
RESPECTIVELY, AS DISCLOSED IN THE PROSPECTUS DATED MARCH 1, 2009. PLEASE REFER
TO THE FINANCIAL HIGHLIGHTS SECTION IN THIS REPORT FOR MORE 2009 FISCAL YEAR END
RELATED INFORMATION.
2
Aston Funds
MONTAG & CALDWELL GROWTH FUND OCTOBER 31, 2009
SCHEDULE OF INVESTMENTS
(PIE CHART)
INFORMATION TECHNOLOGY 26%
CONSUMER STAPLES 22%
HEALTH CARE 16%
CONSUMER DISCRETIONARY 10%
ENERGY 9%
INDUSTRIALS 6%
FINANCIALS 6%
MATERIALS 1%
CASH & NET OTHER ASSETS AND LIABILITIES 4%
% OF TOTAL NET ASSETS
MARKET
SHARES VALUE
------------ --------------
COMMON STOCKS - 96.39%
CONSUMER DISCRETIONARY - 10.40%
1,715,700 McDonald's ..................................... $ 100,557,177
867,700 NIKE, Class B .................................. 53,953,586
1,820,000 TJX ............................................ 67,977,000
1,316,900 Walt Disney .................................... 36,043,553
--------------
258,531,316
--------------
CONSUMER STAPLES - 22.08%
2,050,000 Coca-Cola ...................................... 109,285,500
976,500 Colgate-Palmolive .............................. 76,782,195
1,325,000 Costco Wholesale ............................... 75,326,250
1,200,000 CVS Caremark ................................... 42,360,000
1,630,000 PepsiCo ........................................ 98,696,500
900,000 Procter & Gamble ............................... 52,200,000
1,900,000 Wal-Mart Stores ................................ 94,392,000
--------------
549,042,445
--------------
ENERGY - 8.99%
1,800,300 Cameron International * ........................ 66,557,091
804,400 Occidental Petroleum ........................... 61,037,872
1,541,500 Schlumberger ................................... 95,881,300
--------------
223,476,263
--------------
FINANCIALS - 5.52%
4,740,400 Charles Schwab ................................. 82,198,536
1,318,800 JPMorgan Chase ................................. 55,086,276
--------------
137,284,812
--------------
HEALTH CARE - 15.90%
2,100,000 Abbott Laboratories ............................ 106,197,000
1,340,400 Allergan ....................................... 75,397,500
1,565,000 Gilead Sciences * .............................. 66,590,750
3,675,000 Schering-Plough ................................ 103,635,000
950,000 Stryker ........................................ 43,700,000
--------------
395,520,250
--------------
MARKET
SHARES VALUE
------------ --------------
INDUSTRIALS - 6.24%
840,000 3M ............................................. $ 61,798,800
388,400 Burlington Northern Santa Fe ................... 29,254,288
662,600 Emerson Electric ............................... 25,013,150
879,700 Fluor .......................................... 39,076,274
--------------
155,142,512
--------------
INFORMATION TECHNOLOGY - 26.47%
640,000 Apple * ........................................ 120,640,000
219,000 Google, Class A * .............................. 117,410,280
2,381,000 Hewlett-Packard ................................ 113,002,260
2,151,200 Juniper Networks * ............................. 54,877,112
2,270,000 QUALCOMM ....................................... 94,000,700
877,800 Research In Motion * ........................... 51,553,194
1,410,000 Visa, Class A .................................. 106,821,600
--------------
658,305,146
--------------
MATERIALS - 0.79%
293,300 Monsanto ....................................... 19,703,894
--------------
TOTAL COMMON STOCKS
(Cost $2,128,076,237) ....................... 2,397,006,638
--------------
INVESTMENT COMPANY - 3.62%
90,080,974 BlackRock Liquidity Funds
TempCash Portfolio .......................... 90,080,974
--------------
TOTAL INVESTMENT COMPANY
(Cost $90,080,974) .......................... 90,080,974
--------------
TOTAL INVESTMENTS - 100.01%
(Cost $2,218,157,211)** .................................... 2,487,087,612
--------------
NET OTHER ASSETS AND LIABILITIES - (0.01)% .................... (264,297)
--------------
NET ASSETS - 100.00% .......................................... $2,486,823,315
==============
----------
* Non-income producing security.
** Aggregate cost for Federal income tax purposes is $2,242,002,762.
Gross unrealized appreciation.... $ 272,366,855
Gross unrealized depreciation.... (27,282,005)
-------------
Net unrealized appreciation...... $ 245,084,850
=============
SEE ACCOMPANYING NOTES TO FINANCIAL STATEMENTS.
3
Aston Funds
VEREDUS SELECT GROWTH FUND
PORTFOLIO MANAGERS COMMENTARY (UNAUDITED) OCTOBER 31, 2009
B. Anthony Weber; Charles Mercer, Jr., CFA & Michael E. Johnson, CFA
Q. What were the most significant market factors affecting Fund performance
and returns relative to the benchmark during the past 12 months?
A. The volatility that marked the end of 2008 spilled over into 2009 as the
market finally bottomed amid a panicked selloff in February and March. Off
that bottom, those stocks that had suffered the most and that were most
leveraged saw the greatest increase in price, stocks that the Fund
generally did not own. Earnings surprise and estimate revision, the core of
our strategy, were of little consequence during the period until the third
quarter of 2009. It was during that quarter that the Fund outpaced the
market and its rivals. Unfortunately, volatility was reintroduced into the
market during the fourth quarter as investors became nervous about
lackluster Gross Domestic Product ("GDP") growth.
Q. What were the best performing holdings for the Fund during the period?
A. The Fund's top three stocks for the just ended 12-month period represented
a varied group of industries. Financial firm Morgan Stanley rose
significantly and we added value trading around this name several times
before selling out of the position. Ford Motor, of all stocks, was up
substantially, as was semiconductor firm Marvell Technology Group. Overall,
Technology and the Consumer Discretionary spaces were our two best
contributing sectors.
Q. What were the weakest performing holdings?
A. We did a poor job with bank stocks as we attempted to buy high-quality
names during the fourth quarter of 2008 like JPMorgan Chase and U.S.
Bancorp. Those positions quickly went against us as lending write-offs
continued. We chose to go with Morgan Stanley and Bank of America later on
in the year because of their larger brokerage exposure. From a sector
standpoint, Healthcare was the albatross, as we sold names like Intuitive
Surgical and Illumina at inopportune times as we let the macroeconomic
influences of the state of hospital balance sheets affect our thought
process and sold them too early. Despite the fact that we were underweight
this sector due to the uncertainty of the healthcare reform bill, we still
lost significant ground relative to the benchmark in this space.
Industrials detracted from performance, with most of the shortfall coming
from the Transportation industry early on in the period.
Q. How was the Fund positioned as of October 31, 2009?
A. Early cycle sectors such as Technology and Consumer Discretionary dominate
the portfolio as we feel that we are seeing a classic "V-shaped"
recovery--where the deeper the recession the better the bounce off the
bottom. The earnings surprise and estimate revision metrics within the
portfolio indicate this. Semiconductor stocks such as Intel and Micron
Technology lead the Technology exposure, while names like Best Buy and Ford
Motor front the Consumer space. We firmly believe there is pent up demand
for certain big-ticket items as the "cash for clunkers" program proved. We
feel a major PC upgrade cycle is underway as corporate America is flush
with cash and capital spending doesn't seem to be able to go much lower as
it is now at a 40-year low as a percent of GDP. The other larger area of
exposure is in the Financials sector, which includes names like Blackstone
Group and T. Rowe Price Group.
GROWTH OF A HYPOTHETICAL
$10,000 INVESTMENT--CLASS N
(PERFORMANCE GRAPH)
Veredus Select Growth Fund
Veredus Select Growth Morningstar(R) Large
Fund Russell 1000 Growth Index Growth Category
--------------------- ------------------------- --------------------
Dec-01 10,000 10,000 10,000
Oct-02 7,290 7,347 7,470
Oct-03 9,330 8,950 9,052
Oct-04 10,310 9,252 9,363
Oct-05 11,880 10,067 10,321
Oct-06 13,094 11,159 11,256
Oct-07 16,778 13,304 13,683
Oct-08 10,219 8,388 8,352
Oct-09 10,666 9,857 9,634
All dividends and capital gains are reinvested. Indexes are unmanaged and do not
take into account fees, expenses or other costs.
Returns shown in the chart and table do not reflect taxes that a shareholder
would pay on Fund distributions or on the sale of the Fund shares.
RETURNS FOR PERIOD ENDED 10/31/09
Average Annual Total Returns - Class N
One Year 4.37%
Five Year 0.68%
Since Inception 0.83%
Inception Date 12/31/01
Average Annual Total Returns - Class I
One Year 4.81%
Since Inception -3.35%
Inception Date 09/11/06
THE PERFORMANCE DATA QUOTED REPRESENTS PAST PERFORMANCE. PAST PERFORMANCE DOES
NOT GUARANTEE FUTURE RESULTS. INVESTMENT RETURN AND PRINCIPAL VALUE WILL
FLUCTUATE SO THAT AN INVESTOR'S SHARES, UPON REDEMPTION, MAY BE WORTH MORE OR
LESS THAN THEIR ORIGINAL COST. CURRENT PERFORMANCE MAY BE HIGHER OR LOWER THAN
THE PERFORMANCE DATA QUOTED. FOR PERFORMANCE DATA CURRENT TO THE MOST RECENT
MONTH-END, PLEASE VISIT OUR WEBSITE AT www.astonfunds.com.
THE PERFORMANCE QUOTED WOULD HAVE BEEN LOWER IF WAIVERS HAD NOT BEEN IN EFFECT.
4
Aston Funds
VEREDUS SELECT GROWTH FUND OCTOBER 31, 2009
SCHEDULE OF INVESTMENTS
(PIE CHART)
INFORMATION TECHNOLOGY 44%
CONSUMER DISCRETIONARY 32%
FINANCIALS 13%
INDUSTRIALS 3%
CONSUMER STAPLES 3%
ENERGY 3%
CASH & NET OTHER ASSETS AND LIABILITIES 2%
% OF TOTAL NET ASSETS
MARKET
SHARES VALUE
------------ --------------
COMMON STOCKS - 98.00%
CONSUMER DISCRETIONARY - 31.72%
99,625 Best Buy ....................................... $ 3,803,682
52,100 Carnival ....................................... 1,517,152
203,100 CBS, Class B ................................... 2,390,487
341,300 Ford Motor * ................................... 2,389,100
140,600 International Game Technology .................. 2,508,304
112,300 J.C. Penney .................................... 3,720,499
122,400 Las Vegas Sands * .............................. 1,847,016
159,625 Macy's ......................................... 2,804,611
101,775 Royal Caribbean Cruises * ...................... 2,058,908
66,775 Starwood Hotels & Resorts Worldwide ............ 1,940,482
84,800 Urban Outfitters * ............................. 2,661,024
--------------
27,641,265
--------------
CONSUMER STAPLES - 3.01%
61,825 Estee Lauder, Class A .......................... 2,627,563
--------------
ENERGY - 2.41%
115,900 Valero Energy .................................. 2,097,790
--------------
FINANCIALS - 13.36%
151,425 Blackstone Group ............................... 2,032,123
63,225 Capital One Financial .......................... 2,314,035
267,800 Host Hotels & Resorts .......................... 2,707,458
40,500 Invesco ........................................ 856,575
42,300 Prudential Financial ........................... 1,913,229
37,300 T. Rowe Price Group ............................ 1,817,629
--------------
11,641,049
--------------
INDUSTRIALS - 3.31%
191,975 Hertz Global Holdings * ........................ 1,787,287
23,075 Manpower ....................................... 1,093,986
--------------
2,881,273
--------------
MARKET
SHARES VALUE
------------ --------------
INFORMATION TECHNOLOGY - 44.19%
100,000 Akamai Technologies * .......................... $ 2,200,000
497,625 Alcatel-Lucent, SP ADR * (France) .............. 1,836,236
45,425 Analog Devices ................................. 1,164,243
62,850 Broadcom, Class A * ............................ 1,672,438
119,900 Cisco Systems * ................................ 2,739,715
192,200 Corning ........................................ 2,808,042
143,775 Dell * ......................................... 2,083,300
53,700 Dolby Laboratories, Class A * .................. 2,252,178
117,850 EMC * .......................................... 1,940,990
142,700 Intel .......................................... 2,726,997
54,200 KLA-Tencor ..................................... 1,762,042
125,000 Marvell Technology Group * ..................... 1,715,000
235,800 Micron Technology * ............................ 1,601,082
288,575 Motorola ....................................... 2,473,088
34,700 Research In Motion * ........................... 2,037,931
83,125 SanDisk * ...................................... 1,702,400
600,000 United Microelectronics, SP ADR * (Taiwan) ..... 1,974,000
32,500 Visa, Class A .................................. 2,462,200
40,200 Western Digital * .............................. 1,353,936
--------------
38,505,818
--------------
TOTAL COMMON STOCKS
(Cost $80,409,480) .......................... 85,394,758
--------------
INVESTMENT COMPANY - 1.06%
919,496 BlackRock Liquidity Funds
TempCash Portfolio .......................... 919,496
--------------
TOTAL INVESTMENT COMPANY
(Cost $919,496) ............................. 919,496
--------------
TOTAL INVESTMENTS - 99.06%
(Cost $81,328,976)** ....................................... 86,314,254
--------------
NET OTHER ASSETS AND LIABILITIES - 0.94% ...................... 822,206
--------------
NET ASSETS - 100.00% .......................................... $ 87,136,460
==============
----------
* Non-income producing security.
** Aggregate cost for Federal income tax purposes is $81,328,976.
Gross unrealized appreciation ............... $ 9,105,551
Gross unrealized depreciation ............... (4,120,273)
-----------
Net unrealized appreciation ................. $ 4,985,278
===========
SP ADR Sponsored American Depositary Receipt
SEE ACCOMPANYING NOTES TO FINANCIAL STATEMENTS.
5
Aston Funds
GROWTH FUND
PORTFOLIO MANAGER COMMENTARY (UNAUDITED) OCTOBER 31, 2009
Robert E. Canakaris, CFA, CIC
Q. What were the most significant market factors affecting Fund performance
and returns relative to the benchmark during the past 12 months?
A. After selling off sharply during the first months of this year, the market
experienced a remarkable rally off its March lows in anticipation of a
second-half recovery in economic activity. The Fund participated with
returns ahead of the S&P 500, though it trailed its Russell 1000 Growth
benchmark. In this environment, many of the stocks that helped the Fund
significantly outperform both the S&P 500 and the Russell 1000 Growth
during the previous two years were a short-term drag on relative
performance given a resurgence in some of the more beaten down names and an
apparent increase in investors' appetite for risk. In our work, valuations
of many of the more cyclical and lesser quality issues appear extended
based on 2010 earnings. The biggest detractor from relative performance
versus the Russell 1000 Growth this year was stock selection in the
Consumer Discretionary and Financial sectors. We would note both of these
areas were contributors to 2008's positive relative returns. The Fund
benefited from strong stock selection in the Technology, Energy, and
Healthcare sectors.
Q. What were the best performing holdings for the Fund during the period?
A. Schering-Plough was one of the portfolio's best performers as it agreed to
be acquired by Merck in a cash and stock transaction. The Fund also
benefited from holdings in Apple, as the company's iPhone continued to
drive growth in earnings and the company benefited from better than
expected sales of both its computers and iPods. Cameron International
performed well on a recovery in the price of oil and earnings held up
relatively well due to significant exposure to a secular trend towards
deep-water oil exploration. Google contributed to returns as top-line
growth resumed and its management demonstrated an ability to restrain
spending. Allergan benefited from an expectation that its earnings would
improve with increased expenditures on discretionary healthcare items such
as cosmetic surgery.
Q. What were the weakest performing holdings?
A. Stryker's performance lagged in 2009 as the company had several unresolved
regulatory issues. Wells Fargo hurt the Fund's results during the year as
we sold it and built a position in JP Morgan Chase. Devon was negatively
affected by ongoing weakness in the price of natural gas, which did not
recover. Gilead Sciences and Procter & Gamble were among our better
performers in 2008 but did not do well in 2009 due to an investor
preference for more cyclical issues.
Q. How was the Fund positioned as of October 31, 2009?
A. We continue to believe the stock market reached a bear market low on March
9, 2009, and that a cyclical bull market is under way. While the S&P 500 is
more fairly valued after a nearly 60% increase from its March 9 low, we are
still finding plenty of attractively valued stocks. Furthermore, there is
ample fiscal and monetary liquidity to support financial markets and
promote economic growth. In our opinion, a synchronized global economic
recovery is under way amid low inflation that should contribute to higher
share prices and mitigate the stock market's risk. Also limiting risk is
the fact that with inflation low there is no reason the Fed should tighten
its policy any time soon. Still, because the market is more fairly valued
and technically overbought, we do see an increasing risk of a market
correction over the short-term. We would view that development as a
correction within a bull market, and expect the market subsequently to move
higher with the global recovery.
In our opinion the outlook for large-cap growth stocks is good,
particularly for high-quality secular growers. Looking ahead to 2010
earnings, we believe the attractiveness of these stocks will become evident
as we transition to an earnings driven market. On anticipated 2010
earnings, these companies' growth rates appear more attainable and their
valuations more reasonable.
GROWTH OF A HYPOTHETICAL $10,000
INVESTMENT--CLASS N
(PERFORMANCE GRAPH)
Growth Fund
Morningstar(R)
ABN AMRO Russell Large Growth
Growth Fund 1000 Index Category
----------- ---------- --------------
Dec-93 10,000 10,000 10,000
Oct-94 10,173 10,607 10,439
Oct-95 13,088 13,705 13,016
Oct-96 16,619 16,727 15,530
Oct-97 20,801 21,824 19,782
Oct-98 26,090 27,202 22,874
Oct-99 33,321 36,518 31,321
Oct-00 39,858 39,925 36,661
Oct-01 29,514 23,975 23,229
Oct-02 26,929 19,271 19,061
Oct-03 30,689 23,474 23,097
Oct-04 31,589 24,268 23,887
Oct-05 32,971 26,406 26,333
Oct-06 34,800 29,268 28,716
Oct-07 38,923 34,896 34,910
Oct-08 25,783 22,002 21,309
Oct-09 29,876 25,855 24,580
All dividends and capital gains are reinvested. Indexes are unmanaged and do not
take into account fees, expenses or other costs.
Returns shown in the chart and table do not reflect taxes that a shareholder
would pay on Fund distributions or on the sale of the Fund shares.
RETURNS FOR PERIOD ENDED 10/31/09
Average Annual Total Returns - Class N
One Year 15.87%
Five Year -1.11%
Ten Year -1.09%
Since Inception 7.13%
Inception Date 12/13/93
Average Annual Total Returns - Class I
One Year 16.21%
Five Year -0.83%
Since Inception -1.99%
Inception Date 07/31/00
Average Annual Total Returns - Class R
One Year 15.69%
Five Year -1.31%
Since Inception 1.70%
Inception Date 12/31/02
THE PERFORMANCE DATA QUOTED REPRESENTS PAST PERFORMANCE. PAST PERFORMANCE DOES
NOT GUARANTEE FUTURE RESULTS. INVESTMENT RETURN AND PRINCIPAL VALUE WILL
FLUCTUATE SO THAT AN INVESTOR'S SHARES, UPON REDEMPTION, MAY BE WORTH MORE OR
LESS THAN THEIR ORIGINAL COST. CURRENT PERFORMANCE MAY BE HIGHER OR LOWER THAN
THE PERFORMANCE DATA QUOTED. FOR PERFORMANCE DATA CURRENT TO THE MOST RECENT
MONTH-END, PLEASE VISIT OUR WEBSITE AT www.astonfunds.com.
THE TOTAL EXPENSE RATIO FOR THE N CLASS AND I CLASS IS 1.14% AND 0.89%
RESPECTIVELY, AS DISCLOSED IN THE PROSPECTUS DATED MARCH 1, 2009. PLEASE REFER
TO THE FINANCIAL HIGHLIGHTS SECTION IN THIS REPORT FOR MORE 2009 FISCAL YEAR END
RELATED INFORMATION.
6
Aston Funds
GROWTH FUND OCTOBER 31, 2009
SCHEDULE OF INVESTMENTS
(PIE CHART)
INFORMATION TECHNOLOGY 27%
CONSUMER STAPLES 22%
HEALTH CARE 16%
CONSUMER DISCRETIONARY 11%
ENERGY 9%
INDUSTRIALS 6%
FINANCIALS 6%
CASH & NET OTHER ASSETS AND LIABILITIES 2%
MATERIALS 1%
% OF TOTAL NET ASSETS
MARKET
SHARES VALUE
--------- --------------
COMMON STOCKS - 97.54%
CONSUMER DISCRETIONARY - 10.59%
140,316 McDonald's ........................................ $ 8,223,921
71,409 NIKE, Class B ..................................... 4,440,212
149,000 TJX ............................................... 5,565,150
114,200 Walt Disney ....................................... 3,125,654
--------------
21,354,937
--------------
CONSUMER STAPLES - 21.90%
167,521 Coca-Cola ......................................... 8,930,545
79,506 Colgate-Palmolive ................................. 6,251,557
107,408 Costco Wholesale .................................. 6,106,145
89,627 CVS Caremark ...................................... 3,163,833
130,314 PepsiCo ........................................... 7,890,513
73,717 Procter & Gamble .................................. 4,275,586
152,018 Wal-Mart Stores ................................... 7,552,254
--------------
44,170,433
--------------
ENERGY - 9.12%
149,215 Cameron International * ........................... 5,516,479
66,008 Occidental Petroleum .............................. 5,008,687
126,712 Schlumberger ...................................... 7,881,486
--------------
18,406,652
--------------
FINANCIALS - 5.64%
389,635 Charles Schwab .................................... 6,756,271
110,600 JPMorgan Chase .................................... 4,619,762
--------------
11,376,033
--------------
HEALTH CARE - 15.96%
162,719 Abbott Laboratories ............................... 8,228,700
109,114 Allergan .......................................... 6,137,662
139,816 Gilead Sciences * ................................. 5,949,171
309,240 Schering-Plough ................................... 8,720,568
68,514 Stryker ........................................... 3,151,644
--------------
32,187,745
--------------
MARKET
SHARES VALUE
--------- --------------
INDUSTRIALS - 6.41%
68,400 3M ................................................ $ 5,032,188
33,600 Burlington Northern Santa Fe ...................... 2,530,752
55,800 Emerson Electric .................................. 2,106,450
73,300 Fluor ............................................. 3,255,986
--------------
12,925,376
--------------
INFORMATION TECHNOLOGY - 27.11%
52,305 Apple * ........................................... 9,859,492
18,320 Google, Class A * ................................. 9,821,718
198,900 Hewlett-Packard ................................... 9,439,794
177,030 Juniper Networks * ................................ 4,516,035
196,425 QUALCOMM .......................................... 8,133,959
71,607 Research In Motion * .............................. 4,205,479
115,000 Visa, Class A ..................................... 8,712,400
--------------
54,688,877
--------------
MATERIALS - 0.81%
24,300 Monsanto .......................................... 1,632,474
--------------
TOTAL COMMON STOCKS
(Cost $189,695,879) ............................ 196,742,527
--------------
INVESTMENT COMPANY - 2.83%
5,695,805 BlackRock Liquidity Funds
TempCash Portfolio ............................. 5,695,805
--------------
TOTAL INVESTMENT COMPANY
(Cost $5,695,805) .............................. 5,695,805
--------------
TOTAL INVESTMENTS - 100.37%
(Cost $195,391,684)** ...................................... 202,438,332
--------------
NET OTHER ASSETS AND LIABILITIES - (0.37)% ................... (740,918)
--------------
NET ASSETS - 100.00% ......................................... $ 201,697,414
==============
----------
* Non-income producing security.
** Aggregate cost for Federal income tax purposes is $198,396,307.
Gross unrealized appreciation. ................................ $ 14,578,068
Gross unrealized depreciation. ................................ (10,536,043)
------------
Net unrealized appreciation ................................... $ 4,042,025
============
SEE ACCOMPANYING NOTES TO FINANCIAL STATEMENTS.
7
Aston Funds
OPTIMUM LARGE CAP OPPORTUNITY FUND
PORTFOLIO MANAGERS COMMENTARY (UNAUDITED) OCTOBER 31, 2009
Andrew J. Goodwin & Keith F. Pinsoneault, CFA
Q. What were the most significant market factors affecting Fund performance
and returns relative to the benchmark during the past 12 months?
A. During the precipitous market decline from October 31, 2008 through March
9, 2009, the Fund experienced a period of relative outperformance to its
benchmark primarily due to a significant underweight position in the
Financial sector. Since the market bottom in March, the Fund and the market
in general have reacted favorably in response to massive injections of
capital by the Fed and the US Treasury to stabilize the financial
environment. In absolute terms, the Fund benefited during the past seven
months from overweight stakes in Materials, Industrials, Energy, and
Technology--areas boosted by a falling US dollar and increasing growth
among emerging country economies.
Q. What were the best performing holdings for the Fund during the period?
A. Freeport-McMoRan Copper & Gold (no longer held) was the best performer in
the portfolio, as its stock more than doubled during the period. The
portfolio's lone holding in a financial institution, Goldman Sachs Group,
rose substantially following the market bottom in March. Apple, Google and
IBM were the big winners among the Fund's Technology holdings. Within
Industrials, major gains occurred in Precision Castparts, a manufacturer of
complex metal components and products for aerospace and industrial
applications. Although an overweight position in the Consumer area did not
add to relative performance overall, the Fund did own some solid individual
performers such as Walgreen and DIRECTV Group.
Q. What were the weakest performing holdings?
A. The biggest underperforming sector in the Fund was Healthcare, which
suffered from negative news surrounding the proposed Congressional
healthcare reform legislation. President Obama's push for healthcare reform
has created uncertainty within the group that is likely to keep stock
prices from rising in the near-term. Biotech leader Genzyme declined
significantly during the period, while holdings in Gilead Sciences, St.
Jude Medical, and healthcare equipment provider Baxter International all
fell in price as well. Other detractors included utility holding company
Exelon and Wal-Mart Stores.
Q. How was the Fund positioned as of October 31, 2009?
A. As the Fund moves into its new fiscal year, we are well positioned to
benefit from global growth as we expect U.S. GDP to lag that of most other
countries, in particular, emerging market countries. In addition, we have
positioned the portfolio to benefit from a flat to weaker dollar valuation
over the coming months. The Fund is currently overweight in Materials,
Industrials and Energy sectors. Although we have taken some profits in the
Technology area, we expect these stocks to continue to be strong earnings
performers in 2010. We have also added to Financials, though we have not
yet embraced the major banks. We continue to search for potential winners
in the Consumer space as consumer demand is expected to improve during the
next few quarters. Domestic growth in consumer goods remains uncertain due
to high and rising unemployment numbers, however. The market has
experienced a remarkable move higher in the face of numerous difficulties,
and we believe will continue to face in the year ahead. Ultimately, we feel
that large-growth stocks with good balance sheets and international
exposure will benefit the most from a rising earnings environment.
GROWTH OF A HYPOTHETICAL
$10,000 INVESTMENT--CLASS N
(PERFORMANCE GRAPH)
Optimum Large Cap Opportunity Fund
Optimum Large Cap Morningstar Large
Opportunity Fund S&P 500 Index Growth Category
----------------- ------------- -----------------
Dec-06 10,000 10,000 10,000
Oct-07 12,560 11,086 11,839
Oct-08 6,795 7,086 7,226
Oct-09 7,906 7,780 8,336
All dividends and capital gains are reinvested. Indexes are unmanaged and do not
take into account fees, expenses or other costs.
Returns shown in the chart and table do not reflect taxes that a shareholder
would pay on Fund distributions or on the sale of the Fund shares.
RETURNS FOR PERIOD ENDED 10/31/09
Average Annual Total Returns - Class N
One Year 16.35%
Since Inception -7.93%
Inception Date 12/28/2006
THE PERFORMANCE DATA QUOTED REPRESENTS PAST PERFORMANCE. PAST PERFORMANCE DOES
NOT GUARANTEE FUTURE RESULTS. INVESTMENT RETURN AND PRINCIPAL VALUE WILL
FLUCTUATE SO THAT AN INVESTOR'S SHARES, UPON REDEMPTION, MAY BE WORTH MORE OR
LESS THAN THEIR ORIGINAL COST. CURRENT PERFORMANCE MAY BE HIGHER OR LOWER THAN
THE PERFORMANCE DATA QUOTED. FOR PERFORMANCE DATA CURRENT TO THE MOST RECENT
MONTH-END, PLEASE VISIT OUR WEBSITE AT www.astonfunds.com.
THE PERFORMANCE QUOTED WOULD HAVE BEEN LOWER IF WAIVERS HAD NOT BEEN IN EFFECT.
8
Aston Funds
OPTIMUM LARGE CAP OPPORTUNITY FUND OCTOBER 31, 2009
SCHEDULE OF INVESTMENTS
(PIE CHART)
INFORMATION TECHNOLOGY 18%
INDUSTRIALS 14%
CONSUMER DISCRETIONARY 13%
HEALTH CARE 12%
ENERGY 12%
FINANCIALS 11%
CASH & NET OTHER ASSETS AND LIABILITIES 11%
CONSUMER STAPLES 6%
TELECOMMUNICATION SERVICES 3%
% OF TOTAL NET ASSETS
MARKET
SHARES VALUE
--------- --------------
COMMON STOCKS - 89.20%
CONSUMER DISCRETIONARY - 13.08%
1,600 Apollo Group, Class A * ........................... $ 91,360
4,600 DIRECTV Group * ................................... 120,980
2,000 NIKE, Class B ..................................... 124,360
5,750 Staples ........................................... 124,775
3,200 Yum! Brands ....................................... 105,440
--------------
566,915
--------------
CONSUMER STAPLES - 5.55%
2,100 Wal-Mart Stores ................................... 104,328
3,600 Walgreen .......................................... 136,188
--------------
240,516
--------------
ENERGY - 11.79%
1,350 Diamond Offshore Drilling ......................... 128,587
2,000 EnCana ............................................ 110,780
3,500 National-Oilwell Varco * .......................... 143,465
1,525 Transcocean * ..................................... 127,963
--------------
510,795
--------------
FINANCIALS - 11.24%
2,450 ACE ............................................... 125,832
3,500 American Express .................................. 121,940
700 Goldman Sachs Group ............................... 119,119
1,200 IntercontinentalExchange *......................... 120,228
--------------
487,119
--------------
HEALTH CARE - 12.13%
2,000 Baxter International .............................. 108,120
5,625 Bristol-Myers Squibb .............................. 122,625
2,050 DaVita * .......................................... 108,711
2,300 Gilead Sciences * ................................. 97,865
2,600 St. Jude Medical * ................................ 88,608
--------------
525,929
--------------
MARKET
SHARES VALUE
--------- --------------
INDUSTRIALS - 14.03%
7,125 ABB, SP ADR (Switzerland) ......................... $ 132,026
2,700 Deere ............................................. 122,985
2,130 Fluor ............................................. 94,615
2,725 Jacobs Engineering Group * ........................ 115,240
1,500 Precision Castparts ............................... 143,295
--------------
608,161
--------------
INFORMATION TECHNOLOGY - 18.40%
800 Apple * ........................................... 150,800
5,975 Cisco Systems * ................................... 136,529
275 Google, Class A * ................................. 147,433
1,100 International Business Machines ................... 132,671
4,400 Juniper Networks * ................................ 112,244
5,575 Oracle ............................................ 117,633
--------------
797,310
--------------
TELECOMMUNICATION SERVICES - 2.98%
2,925 America Movil, Series L, ADR (Mexico) ............. 129,080
--------------
TOTAL COMMON STOCKS
(Cost $3,728,306) .............................. 3,865,825
--------------
INVESTMENT COMPANY - 7.74%
335,341 BlackRock Liquidity Funds TempCash Portfolio ...... 335,341
--------------
TOTAL INVESTMENT COMPANY
(Cost $335,341) ................................ 335,341
--------------
TOTAL INVESTMENTS - 96.94%
(Cost $4,063,647)** ........................................ 4,201,166
--------------
NET OTHER ASSETS AND LIABILITIES - 3.06% 132,498
--------------
NET ASSETS - 100.00% .......................................... $ 4,333,664
==============
----------
* Non-income producing security.
** Aggregate cost for Federal income tax purposes is $4,080,235.
Gross unrealized appreciation... $ 406,829
Gross unrealized depreciation... (285,898)
---------
Net unrealized depreciation..... $ 120,931
=========
ADR American Depositary Receipt
SP ADR Sponsored American Depositary Receipt
SEE ACCOMPANYING NOTES TO FINANCIAL STATEMENTS.
9
Aston Funds
VALUE FUND
PORTFOLIO MANAGERS COMMENTARY (UNAUDITED) OCTOBER 31, 2009
Brooks A. Taylor; Johnathon W. Sage, CFA; Steven R. Gorham, CFA & Nevin
P. Chitkara
Q. What were the most significant market factors affecting Fund performance
and returns relative to the benchmark during the past 12 months?
A. Given the Fund's consistent focus on higher quality companies, major
changes in the market's appetite for risk have historically influenced
relative performance significantly. The last 12 months of incredibly
heightened volatility in the market was no exception. The financial crisis
during the first half of the period--characterized by frozen credit markets
and a significant drop in equity share prices--led to a substantial decline
in the market's appetite for risk. While this resulted in negative absolute
returns for the Fund, relative performance was quite strong given the
increased focus by investors on quality. The second half of the reporting
period--after the market bottom at the beginning of March--saw improvements
in the functioning of the credit markets and increased optimism with
regards to the prospects for the global economic environment. This
triggered one of the most powerful low-quality rallies, as the market's
appetite for risk increased substantially. The second half of the reporting
period, while delivering strong absolute performance, was one of the Fund's
most challenging relative performance periods in its history.
Q. What were the best performing holdings for the Fund during the period?
A. Security selection and, to a lesser extent, underweight positions in the
Financials and Utilities sectors contributed positively to performance
relative to its Russell 1000(R) Value Index benchmark. Not holding
poor-performing Citigroup was the most positive contributor to the
portfolio's relative results. Additionally, an underweighted position in
global financial services firm JPMorgan Chase and an overweight position in
investment banking firm Goldman Sachs Group also boosted relative
performance. An overweight position within Technology was another positive
factor, with positive results coming from IBM , Oracle, and Intel.
Q. What were the weakest performing holdings?
A. Stock selection in Consumer Discretionary was the principal detractor from
relative performance. The portfolio's positioning in cruise line operator
Royal Caribbean Cruises held back relative returns early on, and we sold
the position during the middle part of the reporting period, thereby
missing the stock's strong rebound during the second half of the period.
Grocery chain operator Kroger and the timing of our ownership in department
store chain Macy's, a relative outperformer, hurt relative performance as
well.
Elsewhere, a holding in defense contractor Lockheed Martin, the portfolio's
largest position during the period, was the top relative detractor from
performance. The timing of the portfolio's ownership of financial firms
Bank of America and Genworth Financial, plus not holding investment bank
Morgan Stanley and an overweight position in Bank of New York Mellon, all
negatively affected relative results. Indeed, Bank of America was later
sold prior to the end of the period.
Q. How was the Fund positioned as of October 31, 2009?
A. We remain optimistic regarding the prospects for the Fund's high-quality,
low-risk value portfolio looking out over the next one-to-three years.
Valuations among the highest quality companies in the market today trade
for substantial discounts to the average company in the market. Considering
that the companies owned within the Fund have strong balance sheets, are
generating significant levels of cash flow, have above-average dividend
yields, and are generally gaining market share, we feel that the current
opportunity presented among these companies is a compelling one for our
strategy.
GROWTH OF A HYPOTHETICAL
$10,000 INVESTMENT--CLASS N
(PERFORMANCE GRAPH)
Value Fund
ABN AMRO
Value Fund Morningstar(R)
- Class N Russell 1000 Large Value
Shares Value Index Category
---------- ------------ --------------
Jan-93 10,000 10,000 10,000
Dec-93 10,666 11,807 11,393
Dec-94 10,666 11,573 11,330
Dec-95 14,082 16,013 15,031
Dec-96 16,959 19,478 18,081
Dec-97 22,131 26,330 23,044
Dec-98 23,340 30,446 25,687
Dec-99 25,941 32,683 27,110
Dec-00 25,765 34,974 29,712
Oct-01 20,907 30,487 26,619
Oct-02 19,321 27,432 23,156
Oct-03 22,475 33,706 28,158
Oct-04 26,044 38,914 31,624
Oct-05 29,034 43,529 34,764
Oct-06 34,653 52,870 41,001
Oct-07 40,465 58,596 45,831
Oct-08 26,364 37,033 28,750
Oct-09 28,630 38,803 31,487
All dividends and capital gains are reinvested. Indexes are unmanaged and do not
take into account fees, expenses or other costs.
Returns shown in the chart and table do not reflect taxes that a shareholder
would pay on Fund distributions or on the sale of the Fund shares.
Value investing involves the risk that a Fund's investing in companies believed
to be undervalued will not appreciate as anticipated.
RETURNS FOR PERIOD ENDED 10/31/09
Average Annual Total Returns - Class N
One Year 8.60%
Five Year 1.91%
Ten Year 1.45%
Since Inception 6.45%
Inception Date 01/04/93
Average Annual Total Returns - Class I
One Year 9.01%
Since Inception -0.50%
Inception Date 09/20/05
THE PERFORMANCE DATA QUOTED REPRESENTS PAST PERFORMANCE. PAST PERFORMANCE DOES
NOT GUARANTEE FUTURE RESULTS. INVESTMENT RETURN AND PRINCIPAL VALUE WILL
FLUCTUATE SO THAT AN INVESTOR'S SHARES, UPON REDEMPTION, MAY BE WORTH MORE OR
LESS THAN THEIR ORIGINAL COST. CURRENT PERFORMANCE MAY BE HIGHER OR LOWER THAN
THE PERFORMANCE DATA QUOTED. FOR PERFORMANCE DATA CURRENT TO THE MOST RECENT
MONTH-END, PLEASE VISIT OUR WEBSITE AT www.astonfunds.com.
THE TOTAL EXPENSE RATIO FOR THE N CLASS AND I CLASS IS 1.18% AND 0.93%,
RESPECTIVELY, AS DISCLOSED IN THE PROSPECTUS DATED MARCH 1, 2009. PLEASE REFER
TO THE FINANCIAL HIGHLIGHTS SECTION IN THIS REPORT FOR MORE 2009 FISCAL YEAR END
RELATED INFORMATION.
10
Aston Funds
VALUE FUND OCTOBER 31, 2009
SCHEDULE OF INVESTMENTS
(PIE CHART)
FINANCIALS 21%
CONSUMER STAPLES 15%
ENERGY 14%
INDUSTRIALS 11%
HEALTH CARE 10%
INFORMATION TECHNOLOGY 9%
CONSUMER DISCRETIONARY 6%
TELECOMMUNICATION SERVICES 5%
UTILITIES 5%
MATERIALS 3%
CASH & NET OTHER ASSETS AND LIABILITIES 1%
% OF TOTAL NET ASSETS
MARKET
SHARES VALUE
------------ --------------
COMMON STOCKS - 98.77%
CONSUMER DISCRETIONARY - 6.24%
7,600 Advance Auto Parts ............................. $ 283,176
22,470 Apollo Group, Class A* ......................... 1,283,037
90,708 Walt Disney .................................... 2,482,678
91,420 Hasbro ......................................... 2,493,023
5,200 Home Depot ..................................... 130,468
7,855 Johnson Controls ............................... 187,892
70,868 Macy's ......................................... 1,245,151
44,540 NIKE, Class B .................................. 2,769,497
10,288 Omnicom Group .................................. 352,673
30,350 Sherwin-Williams ............................... 1,731,164
17,948 Staples ........................................ 389,472
4,880 Starwood Hotels & Resorts Worldwide ............ 141,813
12,410 Target ......................................... 601,016
--------------
14,091,060
--------------
CONSUMER STAPLES - 15.35%
8,900 Campbell Soup .................................. 282,575
6,320 Clorox ......................................... 374,333
96,192 CVS Caremark ................................... 3,395,578
25,020 DANONE, SP ADR (France) ........................ 300,240
51,210 Diageo, SP ADR (Britain) ....................... 3,329,674
29,063 General Mills .................................. 1,915,833
14,020 Heineken, SP ADR (Netherlands) ................. 309,281
40,600 Kimberly-Clark ................................. 2,483,096
117,960 Kroger ......................................... 2,728,415
3,880 Lorillard ...................................... 301,554
126,475 Nestle, SP ADR (Switzerland) ................... 5,883,617
54,138 PepsiCo ........................................ 3,278,056
163,480 Philip Morris International .................... 7,742,413
19,147 Procter & Gamble ............................... 1,110,505
4,471 Smucker (J.M.) ................................. 235,756
5,880 Wal-Mart Stores ................................ 292,118
18,090 Walgreen ....................................... 684,345
--------------
34,647,389
--------------
MARKET
SHARES VALUE
------------ --------------
ENERGY - 14.13%
8,950 Anadarko Petroleum ............................. $ 545,323
57,515 Apache ......................................... 5,413,312
78,671 Chevron ........................................ 6,021,478
23,490 Devon Energy ................................... 1,520,038
3,700 EOG Resources .................................. 302,142
88,730 Exxon Mobil .................................... 6,359,279
7,260 Halliburton .................................... 212,065
70,280 Hess ........................................... 3,847,127
17,005 Marathon Oil ................................... 543,650
5,900 Noble .......................................... 240,366
8,480 Noble Energy ................................... 556,542
98,280 Total, SP ADR (France) ......................... 5,903,679
6,200 Weatherford International * .................... 108,686
16,660 Williams ....................................... 314,041
--------------
31,887,728
--------------
FINANCIALS - 21.14%
5,400 Aflac .......................................... 224,046
99,880 Allstate ....................................... 2,953,451
54,930 Aon ............................................ 2,115,354
40,270 Bank of America ................................ 587,136
214,567 Bank of New York Mellon ........................ 5,720,356
23,540 Charles Schwab ................................. 408,184
51,042 Chubb .......................................... 2,476,558
19,680 Deutsche Boerse, ADR (Germany) ................. 160,392
3,383 Franklin Resources ............................. 353,963
41,070 Goldman Sachs Group ............................ 6,988,882
193,740 JPMorgan Chase ................................. 8,092,520
173,870 MetLife ........................................ 5,916,796
28,130 Prudential Financial ........................... 1,272,320
39,120 Regions Financial .............................. 189,341
90,570 State Street ................................... 3,802,129
55,100 Travelers ...................................... 2,743,429
135,160 Wells Fargo .................................... 3,719,603
--------------
47,724,460
--------------
HEALTH CARE - 10.24%
85,520 Abbott Laboratories ............................ 4,324,746
4,700 Becton, Dickinson .............................. 321,292
7,290 Genzyme * ...................................... 368,874
80,760 Johnson & Johnson .............................. 4,768,878
106,170 Medtronic ...................................... 3,790,269
107,530 Merck .......................................... 3,325,903
11,260 Merck KGaA, ADR (Germany) ...................... 354,915
301,922 Pfizer ......................................... 5,141,732
4,700 St. Jude Medical * ............................. 160,176
5,680 Waters * ....................................... 326,202
4,935 WellPoint * .................................... 230,761
--------------
23,113,748
--------------
INDUSTRIALS - 11.27%
31,650 3M ............................................. 2,328,491
8,260 Danaher ........................................ 563,580
31,125 Eaton .......................................... 1,881,506
2,400 Fluor .......................................... 106,608
3,340 Goodrich ....................................... 181,529
4,798 Grainger (W.W.) ................................ 449,716
125,420 Lockheed Martin ................................ 8,627,642
127,845 Northrop Grumman ............................... 6,408,870
4,880 Rockwell Automation ............................ 199,836
6,280 United Parcel Service, Class B ................. 337,110
70,440 United Technologies ............................ 4,328,538
1,030 Verisk Analytics, Class A * .................... 28,253
--------------
25,441,679
--------------
SEE ACCOMPANYING NOTES TO FINANCIAL STATEMENTS.
11
Aston Funds
VALUE FUND OCTOBER 31, 2009
SCHEDULE OF INVESTMENTS - CONTINUED
MARKET
SHARES VALUE
------------ --------------
INFORMATION TECHNOLOGY - 8.37%
126,535 Accenture, Class A ............................. $ 4,691,918
6,940 Agilent Technologies * ......................... 171,695
4,210 Automatic Data Processing ...................... 167,558
8,740 Cisco Systems * ................................ 199,709
17,700 Dell * ......................................... 256,473
530 Google, Class A * .............................. 284,144
19,290 Hewlett-Packard ................................ 915,503
188,060 Intel .......................................... 3,593,827
31,170 International Business Machines ................ 3,759,414
11,000 National Semiconductor ......................... 142,340
21,180 Nokia, SP ADR (Finland) ........................ 267,080
164,380 Oracle ......................................... 3,468,418
17,260 Tyco Electronics ............................... 366,775
3,840 Visa, Class A .................................. 290,918
17,580 Western Union .................................. 319,429
--------------
18,895,201
--------------
MATERIALS - 2.62%
7,055 Air Products and Chemicals ..................... 544,152
9,880 Alcoa .......................................... 122,709
93,130 PPG Industries ................................. 5,255,326
--------------
5,922,187
--------------
TELECOMMUNICATION SERVICES - 5.01%
253,370 AT&T ........................................... 6,504,008
10,890 CenturyTel ..................................... 353,489
15,960 Koninklijke (Royal) Kpn NV, SP ADR (Netherlands) 289,355
187,909 Vodafone Group, SP ADR (Britain) ............... 4,169,701
--------------
11,316,553
--------------
UTILITIES - 4.40%
8,340 Allegheny Energy ............................... 190,319
11,970 American Electric Power ........................ 361,733
10,260 CMS Energy ..................................... 136,458
14,008 FPL Group ...................................... 687,793
4,260 Northeast Utilities ............................ 98,193
14,420 NRG Energy * ................................... 331,516
87,993 PG&E ........................................... 3,598,034
8,960 PPL ............................................ 263,782
6,630 Progress Energy ................................ 248,824
117,600 Public Service Enterprise Group ................ 3,504,480
9,990 Sempra Energy .................................. 513,986
--------------
9,935,118
--------------
TOTAL COMMON STOCKS
(Cost $234,720,016) ......................... 222,975,123
--------------
MARKET
SHARES VALUE
------------ --------------
INVESTMENT COMPANY - 1.22%
2,750,721 BlackRock Liquidity Funds TempCash Portfolio ... $ 2,750,721
--------------
TOTAL INVESTMENT COMPANY
(Cost $2,750,721) ........................... 2,750,721
--------------
TOTAL INVESTMENTS - 99.99%
(Cost $237,470,737)** ...................................... 225,725,844
--------------
NET OTHER ASSETS AND LIABILITIES - 0.01% ...................... 27,697
--------------
NET ASSETS - 100.00% .......................................... $ 225,753,541
==============
----------
* Non-income producing security.
** Aggregate cost for Federal income tax purposes is $238,877,535.
Gross unrealized appreciation....... $ 11,023,482
Gross unrealized depreciation....... (24,175,173)
------------
Net unrealized depreciation......... $(13,151,691)
============
ADR American Depositary Receipt
SP ADR Sponsored American Depositary Receipt
SEE ACCOMPANYING NOTES TO FINANCIAL STATEMENTS.
12
Aston Funds
TAMRO DIVERSIFIED EQUITY FUND
PORTFOLIO MANAGER COMMENTARY (UNAUDITED) OCTOBER 31, 2009
(Formerly the TAMRO All Cap Fund) Philip Tasho, CFA
Q. What were the most significant market factors affecting Fund performance
and returns relative to the benchmark during the past 12 months?
A. The one-year period ended October 2009 saw tremendous volatility within
markets, though stocks posted positive returns overall during the period.
The Fund outpaced its Russell 1000(R) Index benchmark by a wide margin.
Stock selection in Health Care, Utilities and Energy added to performance,
as did sector allocation in Financials. Conversely, stock selection in
Consumer Discretionary detracted from performance. The Fund's benchmark
changed from the Russell 3000(R) Index to the Russell 1000(R) Index, as it
was determined the Russell 1000(R) Index to be a more appropriate
broad-based index.
Q. What were the best performing holdings for the Fund during the period?
A. Cerner, which provides information technology solutions to the health care
industry, rose on increasing demand for its products. Salesforce.com, a
leading provider of customer service software, saw continued year-over-year
growth in revenues as corporations spent to maintain state of the art
customer retention products. Rising liquidity in the capital markets led to
a quick rebound in profits for Goldman Sachs Group, a leading capital
markets company.
Q. What were the weakest performing holdings?
A. Three investments in the Financials sector detracted the most from
performance: Bank of America, JPMorgan Chase and Prudential Financial. All
three companies saw declining profitability due to the impairment of assets
in their loan portfolios.
Q. How was the Fund positioned as of October 31, 2009?
A. We believe liquidity injected into the financial system through the
Congressional stimulus package, as well as by the Fed, provided the
opportunity for the stock market to rebound. The challenge over the next
year is funneling the liquidity into the real economy and the resumption of
positive GDP growth. The potential economic recovery could be tempered by
increases in state, local and eventually Federal taxes, as well as the
continued de-leveraging of the consumer. For this reason, we have
positioned the portfolio towards best-in-class leaders that have the
opportunity to gain traction in a sluggish and increasingly competitive
market through superior execution and capital bases that will help enable
them to take market share from their peers.
GROWTH OF A HYPOTHETICAL
$10,000 INVESTMENT--CLASS N
(PERFORMANCE GRAPH)
TAMRO Diversified Equity Fund
SP 500 Morningstar
Tamro All Cap Citigroup Russell Large
Value Fund Value Index 3000 Blend
------------- ----------- ------- -----------
Nov-00 10,000 10,000 10,000 10,000
Oct-01 9,689 8,141 7,483 8,397
Oct-02 8,525 6,952 6,409 7,162
Oct-03 10,459 8,504 7,928 8,607
Oct-04 11,627 9,298 8,705 9,319
Oct-05 12,788 10,271 9,628 10,226
Oct-06 14,463 11,917 11,204 11,735
Oct-07 16,918 13,708 12,832 13,526
Oct-08 10,701 8,663 8,136 8,498
Oct-09 12,534 9,633 9,017 9,506
All dividends and capital gains are reinvested. Indexes are unmanaged and do not
take into account fees, expenses or other costs.
Returns shown in the chart and table do not reflect taxes that a shareholder
would pay on Fund distributions or on the sale of the Fund shares.
RETURNS FOR PERIOD ENDED 10/31/09
Average Annual Total Returns - Class N
One Year 17.13%
Five Year 1.51%
Since Inception 2.56%
Inception Date 11/30/00
THE PERFORMANCE DATA QUOTED REPRESENTS PAST PERFORMANCE. PAST PERFORMANCE DOES
NOT GUARANTEE FUTURE RESULTS. INVESTMENT RETURN AND PRINCIPAL VALUE WILL
FLUCTUATE SO THAT AN INVESTOR'S SHARES, UPON REDEMPTION, MAY BE WORTH MORE OR
LESS THAN THEIR ORIGINAL COST. CURRENT PERFORMANCE MAY BE HIGHER OR LOWER THAN
THE PERFORMANCE DATA QUOTED. FOR PERFORMANCE DATA CURRENT TO THE MOST RECENT
MONTH-END, PLEASE VISIT OUR WEBSITE AT www.astonfunds.com.
THE PERFORMANCE QUOTED WOULD HAVE BEEN LOWER IF WAIVERS HAD NOT BEEN IN EFFECT.
13
Aston Funds
TAMRO DIVERSIFIED EQUITY FUND OCTOBER 31, 2009
SCHEDULE OF INVESTMENTS
(PIE CHART)
INFORMATION TECHNOLOGY 19%
FINANCIALS 18%
CONSUMER DISCRETIONARY 14%
HEALTH CARE 13%
ENERGY 11%
INDUSTRIALS 10%
CONSUMER STAPLES 6%
MATERIALS 3%
CASH & NET OTHER ASSETS AND LIABILITIES 2%
UTILITIES 2%
TELECOMMUNICATION SERVICES 1%
PURCHASED OPTIONS 1%
% OF TOTAL NET ASSETS
MARKET
SHARES VALUE
--------- --------------
COMMON STOCKS - 96.97%
CONSUMER DISCRETIONARY - 14.34%
1,490 Amazon.com * ...................................... $ 177,027
5,202 BorgWarner ........................................ 157,725
9,884 CarMax * .......................................... 194,418
4,890 Dollar Tree * ..................................... 220,686
23,296 Domino's Pizza * .................................. 170,993
16,503 Gannett ........................................... 162,059
6,056 Grand Canyon Education * .......................... 98,228
3,010 M.D.C. Holdings ................................... 98,186
5,232 Mohawk Industries * ............................... 224,086
--------------
1,503,408
--------------
CONSUMER STAPLES - 5.57%
6,792 Kraft Foods, Class A .............................. 186,916
5,502 NBTY * ............................................ 200,328
4,164 Philip Morris International ....................... 197,207
--------------
584,451
--------------
ENERGY - 10.57%
3,880 Anadarko Petroleum ................................ 236,408
3,720 CONSOL Energy ..................................... 159,253
2,914 Exxon Mobil ....................................... 208,846
4,657 National-Oilwell Varco * .......................... 190,890
2,130 Range Resources ................................... 106,606
4,976 XTO Energy ........................................ 206,803
--------------
1,108,806
--------------
FINANCIALS - 18.01%
7,614 Annaly Capital Management, REIT ................... 128,753
11,603 Bank of America ................................... 169,172
50 Berkshire Hathaway, Class B * . ................... 164,150
7,639 BioMed Realty Trust, REIT ......................... 103,661
2,047 Franklin Resources ................................ 214,178
1,181 Goldman Sachs Group ............................... 200,971
7,553 JPMorgan Chase .................................... 315,489
6,630 Loews ............................................. 219,453
MARKET
SHARES VALUE
--------- --------------
FINANCIALS (CONTINUED)
4,504 T. Rowe Price Group ............................... $ 219,480
10,799 Zions Bancorporation .............................. 152,914
--------------
1,888,221
--------------
HEALTH CARE - 12.70%
3,575 Allergan .......................................... 201,094
3,243 Amgen * ........................................... 174,246
4,444 Cerner * .......................................... 337,922
4,510 Johnson & Johnson ................................. 266,316
2,119 Laboratory Corp. of America Holdings * ............ 145,978
3,373 Quality Systems 205,820
--------------
1,331,376
--------------
INDUSTRIALS - 10.20%
7,822 Advisory Board * .................................. 192,734
3,295 Boeing ............................................ 157,501
2,901 Danaher ........................................... 197,935
4,007 Joy Global ........................................ 201,993
4,316 Ryanair Holdings, SP ADR * (Ireland) .............. 117,697
3,279 United Technologies ............................... 201,495
--------------
1,069,355
--------------
INFORMATION TECHNOLOGY - 18.97%
36,624 Alcatel-Lucent, SP ADR * (France) ................. 135,142
3,970 ARM Holdings, SP ADR (Britain) .................... 28,862
6,892 Corning ........................................... 100,692
6,992 Electronic Arts * ................................. 127,534
13,925 EMC * ............................................. 229,345
3,825 F5 Networks * ..................................... 171,704
555 Google, Class A * ................................. 297,547
9,081 NVIDIA * .......................................... 108,609
5,455 Salesforce.com * .................................. 309,571
6,753 Symantec * ........................................ 118,718
3,703 VMware, Class A * ................................. 142,306
13,802 Yahoo! * .......................................... 219,452
--------------
1,989,482
--------------
MATERIALS - 3.43%
1,621 DuPont (E. I.) de Nemours ......................... 51,580
3,970 Mosaic ............................................ 185,518
3,081 Nucor ............................................. 122,778
--------------
359,876
--------------
TELECOMMUNICATION SERVICES - 1.08%
8,488 Cbeyond * ......................................... 113,315
--------------
UTILITIES - 2.10%
16,826 AES * ............................................. 219,916
--------------
TOTAL COMMON STOCKS
(Cost $8,781,890) .............................. 10,168,206
--------------
NUMBER OF
CONTRACTS
---------
PURCHASED OPTIONS - 0.34%
65 Coca-Cola - Call Strike @ $60
Exp 01/10 ...................................... 975
118 Kraft Foods, Class A - Call Strike @ $30
Exp 01/11 ...................................... 16,520
114 Wal-Mart Stores - Call Strike @ $60 Exp 01/11 ..... 18,240
--------------
TOTAL PURCHASED OPTIONS
(Cost $59,737) ................................. 35,735
--------------
SEE ACCOMPANYING NOTES TO FINANCIAL STATEMENTS.
14
Aston Funds
TAMRO DIVERSIFIED EQUITY FUND OCTOBER 31, 2009
SCHEDULE OF INVESTMENTS - CONTINUED
MARKET
SHARES VALUE
--------- --------------
INVESTMENT COMPANY - 3.01%
315,928 BlackRock Liquidity Funds
TempCash Portfolio ................................ $ 315,928
--------------
TOTAL INVESTMENT COMPANY
(Cost $315,928) ................................ 315,928
--------------
TOTAL INVESTMENTS - 100.32%
(Cost $9,157,555)** ........................................ 10,519,869
--------------
NET OTHER ASSETS AND LIABILITIES - (0.32)% .................... (33,897)
--------------
NET ASSETS - 100.00% .......................................... $ 10,485,972
==============
----------
* Non-income producing security.
** Aggregate cost for Federal income tax purposes is $9,173,553.
Gross unrealized appreciation... $1,852,033
Gross unrealized depreciation... (505,717)
----------
Net unrealized appreciation..... $1,346,316
==========
REIT Real Estate Investment Trust
SP ADR Sponsored American Depositary Receipt
SEE ACCOMPANYING NOTES TO FINANCIAL STATEMENTS.
15
Aston Funds
RIVER ROAD DIVIDEND ALL CAP VALUE FUND
PORTFOLIO MANAGERS COMMENTARY (UNAUDITED) OCTOBER 31, 2009
Henry W. Sanders, III, CFA; Thomas Forsha, CFA & James C. Shircliff, CFA
Q. What were the most significant market factors affecting Fund performance
and returns relative to the benchmark during the past 12 months?
A. The past 12 months was a volatile period for investors with equity markets
experiencing both a precipitous decline and an equally sharp rebound. The
rally that began in March 2009 was fueled in no small part by the liquidity
that the Fed pumped into the system, and the aggressive stimulus applied by
the US Treasury. The Fund outperformed its Russell 3000(R) Value benchmark
during the down months of the period by a significant amount, but lagged
once the market turned upward and investors started aggressively buying
riskier stocks.
Q. What were the best performing holdings for the Fund during the period?
A. The two holdings with the largest positive contribution to the Fund's total
return were Cracker Barrel and VF. Cracker Barrel operates nearly 600
restaurant/gift shops in 41 states. Like many restaurant operators, the
firm rebounded as the economy began to emerge from recession as the company
reported strong operating results from better cost controls. The real story
behind Cracker Barrel during the period, however, was the $56 million in
proceeds the firm received from a sale-leaseback transaction for 15 of its
restaurants and one distribution center. The firm still owns the real
estate at 400 of its stores and the deal helped to demonstrate the untapped
value of its real estate portfolio. VF designs, manufactures, and markets
branded apparel in the U.S. and internationally. The company reported
results that beat expectations during the period, as poor top-line growth
was more than offset by prudent cost cutting and inventory control.
Q. What were the weakest performing holdings?
A. The two holdings with the highest negative contribution to the Fund's total
return were NGP Capital Resources (no longer held) and Integrys Energy
Group. NGP Capital Resources is a business development company that invests
in small energy companies. During the period, a number of the investments
made by the company began to struggle under the weight of the recession and
reduced oil prices. As a result, we sold the position from the Fund in
accordance with our sell discipline. Integrys Energy Group owns and
operates six regulated utilities in the Midwestern U.S. The company also
owned a non-regulated energy marketing business that it began winding down
in February. The company's stock price has suffered as a result.
Q. How was the Fund positioned as of October 31, 2009?
A. We have long understood that there will be short periods where our style
will move out of favor and this period of aggressive risk accumulation in
the market that we have experienced since March 2009 is a good example.
Seven months into the rally signs of fatigue are beginning to show and
market fundamentals are beginning to take hold. Thus, the Fund remains
focused on capturing the long-term potential of a dividend-based all-cap
strategy, as we continue to look for companies that have a history of not
only paying a high dividend, but also have the willingness and ability to
raise it on a regular basis. We are finding a number of good opportunities
in the Consumer Staples area, which has become the largest sector in the
portfolio both in an absolute sense and relative to the benchmark. Holdings
in the Health Care have increased as well, as we have found compelling
values in this sector.
GROWTH OF A HYPOTHETICAL
$10,000 INVESTMENT--CLASS N
(PERFORMANCE GRAPH)
River Road Dividend All Cap Value Fund
ABN
AMRO/River
Road Dynamic Russell Morningstar(R)
Equity Income 3000 Value Mid Value
Fund Index Category
------------- ---------- ---------------
Jun-05 10,000 10,000 10,000
Oct-05 10,030 10,206 10,080
Oct-06 12,408 11,877 11,804
Oct-07 13,759 13,071 13,169
Oct-08 10,069 8,324 8,147
Oct-09 10,505 8,703 9,603
All dividends and capital gains are reinvested. Indexes are unmanaged and do not
take into account fees, expenses or other costs.
Returns shown in the chart and table do not reflect taxes that a shareholder
would pay on Fund distributions or on the sale of the Fund shares.
RETURNS FOR PERIOD ENDED 10/31/09
Average Annual Total Returns - Class N
One Year 4.33%
Since Inception 1.14%
Inception Date 06/28/05
Average Annual Total Returns - Class I
One Year 4.59%
Since Inception -11.31%
Inception Date 06/28/07
THE PERFORMANCE DATA QUOTED REPRESENTS PAST PERFORMANCE. PAST PERFORMANCE DOES
NOT GUARANTEE FUTURE RESULTS. INVESTMENT RETURN AND PRINCIPAL VALUE WILL
FLUCTUATE SO THAT AN INVESTOR'S SHARES, UPON REDEMPTION, MAY BE WORTH MORE OR
LESS THAN THEIR ORIGINAL COST. CURRENT PERFORMANCE MAY BE HIGHER OR LOWER THAN
THE PERFORMANCE DATA QUOTED. FOR PERFORMANCE DATA CURRENT TO THE MOST RECENT
MONTH-END, PLEASE VISIT OUR WEBSITE AT www.astonfunds.com.
THE PERFORMANCE QUOTED WOULD HAVE BEEN LOWER IF WAIVERS HAD NOT BEEN IN EFFECT.
16
Aston Funds
RIVER ROAD DIVIDEND ALL CAP VALUE FUND OCTOBER 31, 2009
SCHEDULE OF INVESTMENTS
CONSUMER STAPLES 19%
FINANCIALS 15%
ENERGY 14%
CONSUMER DISCRETIONARY 12%
INDUSTRIALS 11%
UTILITIES 7%
HEALTH CARE 6%
INFORMATION TECHNOLOGY 6%
MATERIALS 5%
TELECOMMUNICATION SERVICES 3%
CASH & NET OTHER ASSETS AND LIABILITIES 2%
% OF TOTAL NET ASSETS
MARKET
SHARES VALUE
------------ --------------
COMMON STOCKS - 98.00%
CONSUMER DISCRETIONARY - 11.45%
114,700 Cracker Barrel Old Country Store ............... $ 3,802,305
45,525 Darden Restaurants ............................. 1,379,863
60,050 Genuine Parts .................................. 2,101,149
136,400 Hillenbrand .................................... 2,725,272
42,300 McDonald's ..................................... 2,479,203
75,325 PetSmart ....................................... 1,772,397
19,150 VF ............................................. 1,360,416
78,675 Yum! Brands .................................... 2,592,341
--------------
18,212,946
--------------
CONSUMER STAPLES - 19.09%
40,300 Brown-Forman, Class B .......................... 1,967,043
59,750 Clorox ......................................... 3,538,992
30,350 Diageo, SP ADR (Britain) ....................... 1,973,357
51,075 General Mills .................................. 3,366,864
20,850 Industrias Bachoco, SP ADR (Mexico) ............ 473,712
41,075 Kimberly-Clark ................................. 2,512,147
94,400 McCormick & Co (Non-Voting Shares) ............. 3,304,944
54,900 PepsiCo ........................................ 3,324,195
45,200 Procter & Gamble ............................... 2,621,600
138,575 Sara Lee ....................................... 1,564,512
28,300 Smucker (J.M.) ................................. 1,492,259
128,125 Sysco .......................................... 3,388,906
16,650 Wal-Mart Stores ................................ 827,172
--------------
30,355,703
--------------
ENERGY - 14.05%
96,775 Alliance Resource Partners LP . ................ 3,625,192
40,300 Chevron ........................................ 3,084,562
169,000 Encore Energy Partners LP ...................... 3,042,000
45,775 Eni, SP ADR (Italy) ............................ 2,269,525
38,719 Enterprise Products Partners LP ................ 1,085,681
76,475 Magellan Midstream Partners LP ................. 2,970,289
142,900 Provident Energy Trust ......................... 881,693
176,025 Spectra Energy ................................. 3,365,598
110,975 Western Gas Partners LP ........................ 2,023,074
--------------
22,347,614
--------------
MARKET
SHARES VALUE
------------ --------------
FINANCIALS - 15.15%
88,725 BancorpSouth ................................... $ 2,003,410
45,025 Bank of Hawaii ................................. 1,999,110
62,850 Chubb .......................................... 3,049,482
69,150 Cincinnati Financial ........................... 1,753,644
45,150 Commerce Bancshares ............................ 1,731,954
41,750 Cullen/Frost Bankers ........................... 1,953,482
18,625 Erie Indemnity, Class A ........................ 656,531
107,965 Gallagher (Arthur J.) .......................... 2,408,699
29,925 PartnerRe ...................................... 2,288,664
153,100 People's United Financial ...................... 2,454,193
49,925 Safety Insurance Group ......................... 1,670,990
47,675 U.S. Bancorp ................................... 1,107,014
35,800 Zenith National Insurance ...................... 1,021,374
--------------
24,098,547
--------------
HEALTH CARE - 6.29%
24,050 Becton, Dickinson .............................. 1,644,058
48,250 Cardinal Health ................................ 1,367,405
50,400 Johnson & Johnson .............................. 2,976,120
8,575 National Healthcare ............................ 308,443
38,975 Owens & Minor .................................. 1,593,688
41,475 Pfizer ......................................... 706,319
65,075 Pharmaceutical Product Development ............ 1,402,366
--------------
9,998,399
--------------
INDUSTRIALS - 11.15%
22,150 3M ............................................ 1,629,576
26,800 General Dynamics .............................. 1,680,360
60,875 Honeywell International ....................... 2,184,804
60,800 IESI-BFC ...................................... 781,280
49,575 Norfolk Southern .............................. 2,311,187
40,575 United Parcel Service, Class B ................. 2,178,066
40,575 United Technologies ........................... 2,493,334
149,500 Waste Management .............................. 4,467,060
--------------
17,725,667
--------------
INFORMATION TECHNOLOGY - 6.27%
74,275 Automatic Data Processing ...................... 2,956,145
160,775 Intel .......................................... 3,072,410
66,150 Microsoft ...................................... 1,834,339
74,275 Paychex ........................................ 2,110,153
--------------
9,973,047
--------------
MATERIALS - 4.89%
17,250 Compass Minerals International ................. 1,075,020
57,975 International Flavors & Fragrances ............. 2,208,268
40,650 Nucor .......................................... 1,619,903
163,250 RPM International .............................. 2,876,465
--------------
7,779,656
--------------
TELECOMMUNICATION SERVICES - 2.96%
30,750 BCE ............................................ 737,385
134,375 Verizon Communications ......................... 3,976,156
--------------
4,713,541
--------------
UTILITIES - 6.70%
40,800 Avista ......................................... 773,568
159,250 Duke Energy .................................... 2,519,335
29,925 Exelon ......................................... 1,405,278
37,325 Integrys Energy Group .......................... 1,291,445
17,975 National Fuel Gas .............................. 814,986
SEE ACCOMPANYING NOTES TO FINANCIAL STATEMENTS.
17
Aston Funds
RIVER ROAD DIVIDEND ALL CAP VALUE FUND OCTOBER 31, 2009
SCHEDULE OF INVESTMENTS - CONTINUED
MARKET
SHARES VALUE
------------ --------------
UTILITIES (CONTINUED)
99,675 Portland General Electric ...................... $ 1,852,958
63,875 Southern ....................................... 1,992,261
--------------
10,649,831
--------------
TOTAL COMMON STOCKS
(Cost $141,661,526) ......................... 155,854,951
--------------
INVESTMENT COMPANY - 1.70%
2,699,166 BlackRock Liquidity Funds TempFund Portfolio ... 2,699,166
--------------
TOTAL INVESTMENT COMPANY
(Cost $2,699,166) .......................... 2,699,166
--------------
TOTAL INVESTMENTS - 99.70%
(Cost $144,360,692)* ....................................... 158,554,117
--------------
NET OTHER ASSETS AND LIABILITIES - 0.30% ...................... 473,181
--------------
NET ASSETS - 100.00% .......................................... $ 159,027,298
==============
----------
* Aggregate cost for Federal income tax purposes is $145,948,461.
Gross unrealized appreciation........ $15,425,440
Gross unrealized depreciation........ (2,819,784)
-----------
Net unrealized appreciation.......... $12,605,656
===========
LP Limited Partnership
SP ADR Sponsored American Depositary Receipt
SEE ACCOMPANYING NOTES TO FINANCIAL STATEMETNS.
18
Aston Funds
OPTIMUM MID CAP FUND
PORTFOLIO MANAGERS COMMENTARY (UNAUDITED) OCTOBER 31, 2009
Thyra E. Zerhusen, Marie L. Lorden & Mary L. Pierson
Q. What were the most significant market factors affecting Fund performance
and returns relative to the benchmark during the past 12 months?
A. The market confusion and resulting turbulence created opportunities for us
to add selectively to positions we felt were severely undervalued or
oversold. When many in the market were panicking, we reviewed our holdings,
made decisions based on specific company fundamentals, and took action.
From a sector view, the Fund's relative outperformance was helped by its
low overall exposure to financial stocks and a complete lack of exposure to
the weakest financial industries--banking and real estate investment
trusts. Much of the absolute outperformance is attributable to an
overweight position in Technology, where strong stock selection played a
key role. A headwind to relative performance was an overweight stake in the
consumer-related stocks, where the economic slowdown resulted in reduced
revenues and cautious outlooks.
Q. What were the best performing holdings for the Fund during the period?
A. The best performers in the portfolio were Technology stocks led by Akamai
Technologies and included Unisys, FactSet Research Systems, and Jabil
Circuit. These stocks staged dramatic rebounds from market bottoms in
mid-November and again in early March. Other strong performers were energy
technology company FMC Technologies, which was insulated from the effects
of weak economic conditions due to a strong order backlog, and global
staffing company Manpower, which benefited from foreign revenues. Many of
these stocks had become significantly undervalued late in 2008 due to
indiscriminate selling pressure during the credit crisis.
Q. What were the weakest performing holdings?
A. Among consumer-related stocks, Southwest Airlines in particular was down
sharply due to a combination of weak demand from business travel and
volatile fuel costs. Shares of New York Times suffered from a protracted
slump in advertising revenue, and Lexmark International Group, a printer
and ink supplies manufacturer, declined as weak demand led to pricing
pressures. Still, even these stocks rebounded significantly off their March
lows, as cost cutting efforts resulted in earnings that exceeded
expectations.
Q. How was the Fund positioned as of October 31, 2009?
A. Stocks have rebounded over the past few months in anticipation of an
economic recovery. The risk is that this recovery may be slower than
expected and may be interrupted by periods of negative surprises. While we
expect a slower growth environment than in past recoveries, we are
encouraged by recent signs of economic stabilization in the U.S., Europe,
and Asia. As usual, we will closely monitor the near-term progress of the
Fund's investments and adhere to our valuation discipline.
The majority of companies in the portfolio have implemented disciplined
cost controls, which have supported profit margins and set the stage for a
healthy profit recovery when business improves. Our recent meetings with
senior management support our view that stock performance will depend
increasingly on company-specific factors, and that execution will be
critical to success. With this in mind, we continue to invest in focused
companies with attractive valuations, strong balance sheets, proven
management, geographic diversification and earnings resilience.
GROWTH OF A HYPOTHETICAL
$10,000 INVESTMENT--CLASS N
(PERFORMANCE GRAPH)
Optimum Mid Cap Fund
S&P 400 Morningstar(R)
Optimum Mid Mid-Cap Mid-Cap
Cap Fund Index Blend Category
----------- ---------- --------------
Sep-94 10,000 10,000 10,000
Oct-94 10,250 9,921 10,009
Oct-95 12,189 12,025 11,949
Oct-96 15,420 14,111 14,111
Oct-97 20,582 18,721 18,456
Oct-98 18,413 19,974 18,312
Oct-99 18,840 24,180 22,248
Oct-00 26,201 31,833 27,839
Oct-01 27,097 27,870 24,785
Oct-02 24,963 26,538 22,933
Oct-03 35,359 34,661 30,150
Oct-04 40,338 38,487 33,720
Oct-05 42,124 45,280 38,512
Oct-06 51,136 51,361 44,474
Oct-07 64,981 60,103 51,336
Oct-08 37,361 38,190 31,243
Oct-09 50,662 45,132 36,932
All dividends and capital gains are reinvested. Indexes are unmanaged and do not
take into account fees, expenses or other costs.
Returns shown in the chart and table do not reflect taxes that a shareholder
would pay on Fund distributions or on the sale of the Fund shares.
Small-Cap and Mid-Cap Stocks may be subject to a higher degree of market risk
than the securities of more established companies because they tend to be more
volatile and less liquid.
RETURNS FOR PERIOD ENDED 10/31/09
Average Annual Total Returns - Class N
One Year 35.60%
Five Year 4.66%
Ten Year 10.40%
Since Inception 11.33%
Inception Date 09/19/94
Average Annual Total Returns - Class I
One Year 35.97%
Five Year 4.94%
Since Inception 4.07%
Inception Date 07/06/04
THE PERFORMANCE DATA QUOTED REPRESENTS PAST PERFORMANCE. PAST PERFORMANCE DOES
NOT GUARANTEE FUTURE RESULTS. INVESTMENT RETURN AND PRINCIPAL VALUE WILL
FLUCTUATE SO THAT AN INVESTOR'S SHARES, UPON REDEMPTION, MAY BE WORTH MORE OR
LESS THAN THEIR ORIGINAL COST. CURRENT PERFORMANCE MAY BE HIGHER OR LOWER THAN
THE PERFORMANCE DATA QUOTED. FOR PERFORMANCE DATA CURRENT TO THE MOST RECENT
MONTH-END, PLEASE VISIT OUR WEBSITE AT www.astonfunds.com.
THE TOTAL EXPENSE RATIO FOR THE N CLASS AND CLASS I IS 1.16% AND 0.91%
RESPECTIVELY, AS DISCLOSED IN THE PROSPECTUS DATED MARCH 1, 2009. PLEASE REFER
TO THE FINANCIAL HIGHLIGHTS SECTION IN THIS REPORT FOR MORE 2009 FISCAL YEAR END
RELATED INFORMATION.
19
Aston Funds
OPTIMUM MID CAP FUND OCTOBER 31, 2009
SCHEDULE OF INVESTMENTS
(PIE CHART)
INFORMATION TECHNOLOGY 28%
CONSUMER DISCRETIONARY 24%
INDUSTRIALS 16%
HEALTH CARE 14%
ENERGY 8%
FINANCIALS 4%
MATERIALS 2%
CONSUMER STAPLES 2%
CASH & NET OTHER ASSETS AND LIABILITIES 2%
% OF TOTAL NET ASSETS
MARKET
SHARES VALUE
------------ --------------
COMMON STOCKS - 98.10%
CONSUMER DISCRETIONARY - 23.81%
4,263,700 Belo, Class A .................................. $ 20,039,390
997,040 BorgWarner ..................................... 30,230,253
2,661,600 Gannett ........................................ 26,136,912
860,000 H&R Block ...................................... 15,772,400
2,796,500 Interpublic Group * ............................ 16,834,930
1,332,000 Mattel ......................................... 25,214,760
807,000 McGraw-Hill .................................... 23,225,460
4,618,645 New York Times, Class A ........................ 36,810,601
1,820,600 Pearson, SP ADR (Britain) ...................... 24,778,366
700,757 Scholastic ..................................... 17,427,827
--------------
236,470,899
--------------
CONSUMER STAPLES - 1.81%
222,420 Bunge .......................................... 12,691,285
107,000 Molson Coors Brewing, Class B .................. 5,239,790
--------------
17,931,075
--------------
ENERGY - 8.26%
1,183,525 Compagnie Generale de Geophysique-Veritas,
SP ADR * (France) ........................... 23,481,138
1,123,200 Denbury Resources * ............................ 16,398,720
802,246 FMC Technologies * ............................. 42,198,140
--------------
82,077,998
--------------
FINANCIALS - 3.71%
1,039,895 Cincinnati Financial ........................... 26,371,737
367,200 Eaton Vance .................................... 10,424,808
--------------
36,796,545
--------------
HEALTH CARE - 13.79%
294,100 Beckman Coulter ................................ 18,919,453
681,900 Charles River Laboratories * ................... 24,902,988
161,600 Edwards Lifesciences * ......................... 12,433,504
781,400 Lincare Holdings * ............................. 24,543,774
MARKET
SHARES VALUE
------------ --------------
HEALTH CARE (CONTINUED)
1,092,150 PerkinElmer .................................... $ 20,324,912
874,800 Varian Medical Systems * ....................... 35,849,304
--------------
136,973,935
--------------
INDUSTRIALS - 15.89%
2,270,000 Chicago Bridge & Iron .......................... 42,698,700
570,800 Con-way ........................................ 18,830,692
630,000 Manpower ....................................... 29,868,300
3,446,300 Southwest Airlines ............................. 28,948,920
443,700 URS * .......................................... 17,242,182
1,079,800 Werner Enterprises ............................. 20,246,250
--------------
157,835,044
--------------
INFORMATION TECHNOLOGY - 28.43%
2,109,000 Akamai Technologies * .......................... 46,398,000
303,500 FactSet Research Systems ....................... 19,439,175
727,725 Harris ......................................... 30,360,687
804,500 Intuit * ....................................... 23,386,815
2,147,900 Jabil Circuit .................................. 28,738,902
1,227,800 Lexmark International Group,
Class A * ................................... 31,308,900
1,226,004 Mentor Graphics * .............................. 8,949,829
1,265,570 Molex .......................................... 23,628,192
630,360 Molex, Class A ................................. 10,432,458
1,128,408 Unisys * ....................................... 32,881,809
1,074,655 Zebra Technologies * ........................... 26,866,375
--------------
282,391,142
--------------
MATERIALS - 2.40%
466,200 FMC ............................................ 23,822,819
--------------
TOTAL COMMON STOCKS
(Cost $954,917,972) ......................... 974,299,457
--------------
INVESTMENT COMPANY - 1.45%
14,390,969 BlackRock Liquidity Funds
TempCash Portfolio .......................... 14,390,969
--------------
TOTAL INVESTMENT COMPANY
(Cost $14,390,969) .......................... 14,390,969
--------------
TOTAL INVESTMENTS - 99.55%
(Cost $969,308,941)** ...................................... 988,690,426
--------------
NET OTHER ASSETS AND LIABILITIES - 0.45% ...................... 4,495,231
--------------
NET ASSETS - 100.00% .......................................... $ 993,185,657
==============
----------
* Non-income producing security.
** Aggregate cost for Federal income tax purposes is $969,702,017.
Gross unrealized appreciation ....... $ 129,837,748
Gross unrealized depreciation ....... (110,849,339)
-------------
Net unrealized appreciation ......... $ 18,988,409
=============
SP ADR Sponsored American Depositary Receipt
SEE ACCOMPANYING NOTES TO FINANCIAL STATEMENTS.
20
Aston Funds
MONTAG & CALDWELL MID CAP GROWTH FUND
PORTFOLIO MANAGERS COMMENTARY (UNAUDITED) OCTOBER 31, 2009
M. Scott Thompson, CFA & Andrew W. Jung, CFA
Q. What were the most significant market factors affecting Fund performance
and returns relative to the benchmark during the past 12 months?
A. The single biggest factor affecting the Fund's performance during the past
12 months was the "quality" factor. Our bias towards owning higher quality
growth companies hampered relative performance in a market that favored
lesser quality names. Those companies with low absolute share prices, lower
returns on equity, higher levels of debt, and poor earnings trends have
been among the best performers since the market bottom in March 2009.
According to Bank of America/Merrill Lynch Quantitative Strategy research,
for the 12 months ended October 31, 2009, those stocks ranked B or worse in
their quality rankings have outperformed those stocks ranked B+ or better
by more than 23 percentage points. With only about a quarter of the Fund's
holdings ranked B or lower (including those not ranked), our focus on
quality has been a strong headwind. Our experience, however, is that over
time superior share price performance normally accrues to those companies
that can sustain high returns and above-average profit growth without
substantial financial leverage.
Q. What were the best performing holdings for the Fund during the period?
A. Auto parts retailer O'Reilly Automotive was a strong relative performer
that benefitted from more cost-conscious consumers driving their cars
longer and performing their own maintenance. The company also benefited
from the acquisition of one of its competitors. Another strong contributor
to performance was data networking equipment supplier F5 Networks, which
experienced more-resilient demand for its high-performance application
delivery controllers, and recognized for its strategic positioning amid the
move towards data center consolidation and virtualization. Mining equipment
supplier Joy Global was a strong performer due to a sharp rebound in
commodity prices, which supports an improving profit outlook for 2010 and
beyond.
Q. What were the weakest performing holdings?
A. Two of the biggest detractors from performance were companies that,
ironically, reported relatively strong results. Both C.R. Bard, a medical
device manufacturer, and Varian Medical Systems, a maker of radiation
equipment to treat cancer, grew earnings through the recession. The
market's appetite for lower quality and more cyclical issues worked against
these two stocks during the period. Corrections Corp. of America, the
nation's largest private correctional facilities operator, was also a big
detractor from performance. We sold shares near their low following an
earnings disappointment that led us to question our prior belief that the
company would be recession-resistant. In fact, state budget woes
temporarily impeded inmate transfers, leading to facility underutilization.
Q. How was the Fund positioned as of October 31, 2009?
A. The economy is in recovery mode thanks to the efforts of policy makers
around the globe to flood the system with liquidity. We expect a
combination of a rebound in purchasing and aggressive cost reduction
efforts by businesses to lead to a meaningful profit recovery over the next
12 months--which should carry stock prices higher. We believe the portfolio
is well positioned with a healthy balance of steady, secular growers and
more cyclical growth companies likely to prosper during an economic
recovery. Importantly, we anticipate a rotation back to quality stocks to
occur as policy makers begin to withdraw stimulus and as the economy shifts
from phase one of the cycle, marked by recovery off the bottom, to a more
enduring second phase, marked by sustained, albeit below trend line,
economic expansion. Growth during this second phase is likely to be more
muted than in past recoveries due to the headwind posed by deleveraging. As
this rotation occurs, we expect the Fund's quality holdings to perform
quite well.
GROWTH OF A HYPOTHETICAL
$10,000 INVESTMENT--CLASS N
(PERFORMANCE GRAPH)
Montag & Caldwell Mid Cap Growth Fund
Morningstar
Mid Cap
M&C Mid Russell Growth
Cap Growth Mid Cap Category
---------- ------- -----------
Nov-07 10,000 10,000 10,000
Apr-08 9,370 9,156 8,912
Oct-08 5,850 5,735 5,792
Apr-09 5,870 5,891 5,743
Oct-09 6,830 7,025 6,738
All dividends and capital gains are reinvested. Indexes are unmanaged and do not
take into account fees, expenses or other costs.
Returns shown in the chart and table do not reflect taxes that a shareholder
would pay on Fund distributions or on the sale of the Fund shares.
Mid-Cap Stocks may be subject to a higher degree of market risk than the
securities of more established companies because they tend to be more volatile
and less liquid.
RETURNS FOR PERIOD ENDED 10/31/09
Average Annual Total Return - Class N
One Year 16.75%
Since Inception -17.36%
Inception Date 11/02/07
THE PERFORMANCE DATA QUOTED REPRESENTS PAST PERFORMANCE. PAST PERFORMANCE DOES
NOT GUARANTEE FUTURE RESULTS. INVESTMENT RETURN AND PRINCIPAL VALUE WILL
FLUCTUATE SO THAT AN INVESTOR'S SHARES, UPON REDEMPTION, MAY BE WORTH MORE OR
LESS THAN THEIR ORIGINAL COST. CURRENT PERFORMANCE MAY BE HIGHER OR LOWER THAN
THE PERFORMANCE DATA QUOTED. FOR PERFORMANCE DATA CURRENT TO THE MOST RECENT
MONTH-END, PLEASE VISIT OUR WEBSITE AT www.astonfunds.com.
THE PERFORMANCE QUOTED WOULD HAVE BEEN LOWER IF WAIVERS HAD NOT BEEN IN EFFECT.
21
Aston Funds
MONTAG & CALDWELL MID CAP GROWTH FUND OCTOBER 31, 2009
SCHEDULE OF INVESTMENTS
(PIE CHART)
INFORMATION TECHNOLOGY 20%
INDUSTRIALS 18%
CONSUMER DISCRETIONARY 18%
HEALTH CARE 14%
FINANCIALS 9%
ENERGY 8%
CONSUMER STAPLES 6%
MATERIALS 5%
CASH & NET OTHER ASSETS AND LIABILITIES 2%
% OF TOTAL NET ASSETS
MARKET
SHARES VALUE
--------- --------------
COMMON STOCKS - 97.82%
CONSUMER DISCRETIONARY - 17.93%
1,500 Bed Bath & Beyond * ............................... $ 52,815
2,530 Dick's Sporting Goods * ........................... 57,406
1,060 Kohl's * .......................................... 60,653
2,080 LKQ * ............................................. 35,922
903 Marriott International, Class A ................... 22,629
1,620 O'Reilly Automotive * ............................. 60,394
750 Panera Bread, Class A * ........................... 44,985
990 Polo Ralph Lauren ................................. 73,676
1,770 TJX ............................................... 66,109
1,250 Tractor Supply * .................................. 55,875
--------------
530,464
--------------
CONSUMER STAPLES - 5.56%
1,660 Alberto-Culver .................................... 44,521
2,220 Avon Products ..................................... 71,151
860 Church & Dwight ................................... 48,917
--------------
164,589
--------------
ENERGY - 8.38%
1,770 Cameron International * ........................... 65,437
575 Core Laboratories ................................. 59,973
1,230 Oceaneering International * ....................... 62,853
1,370 Southwestern Energy * ............................. 59,705
--------------
247,968
--------------
FINANCIALS - 8.69%
1,180 Affiliated Managers Group * ....................... 74,918
1,100 Eaton Vance ....................................... 31,229
1,370 Lazard, Class A ................................... 51,717
1,560 MSCI, Class A * ................................... 47,424
680 PartnerRe ......................................... 52,006
--------------
257,294
--------------
HEALTH CARE - 13.62%
750 Bard (C.R.) ....................................... 56,303
1,030 Covance * ......................................... 53,230
MARKET
SHARES VALUE
--------- --------------
HEALTH CARE (CONTINUED)
1,850 Dentsply International ............................ $ 60,976
570 Edwards Lifesciences * ............................ 43,856
900 St. Jude Medical * ................................ 30,672
550 Techne ............................................ 34,380
1,490 Varian Medical Systems * .......................... 61,060
1,090 Waters * .......................................... 62,599
--------------
403,076
--------------
INDUSTRIALS - 18.33%
1,680 Ametek ............................................ 58,615
1,150 Donaldson ......................................... 41,020
1,570 Expeditors International Washington ............... 50,585
1,510 Fastenal .......................................... 52,095
910 FTI Consulting * .................................. 37,137
1,090 Jacobs Engineering Group * ........................ 46,096
1,780 JB Hunt Transport Services ........................ 53,507
1,360 Joy Global ........................................ 68,558
730 L-3 Communications Holdings ....................... 52,772
920 Roper Industries .................................. 46,506
680 Stericycle * ...................................... 35,612
--------------
542,503
--------------
INFORMATION TECHNOLOGY - 20.39%
1,480 Altera ............................................ 29,289
2,360 Amphenol, Class A ................................. 94,683
1,220 ANSYS * ........................................... 49,508
710 F5 Networks * ..................................... 31,872
850 Factset Research Systems .......................... 54,442
1,930 Fiserv * .......................................... 88,529
3,090 Juniper Networks * ................................ 78,826
2,960 Microchip Technology .............................. 70,922
2,280 Polycom * ......................................... 48,952
2,590 Xilinx ............................................ 56,332
--------------
603,355
--------------
MATERIALS - 4.92%
860 Air Products and Chemicals ........................ 66,332
1,800 Ecolab ............................................ 79,128
--------------
145,460
--------------
TOTAL COMMON STOCKS
(Cost $2,795,222) .............................. 2,894,709
--------------
INVESTMENT COMPANY - 3.09%
91,584 BlackRock Liquidity Funds
TempCash Portfolio ............................. 91,584
--------------
TOTAL INVESTMENT COMPANY
(Cost $91,584) ................................. 91,584
--------------
TOTAL INVESTMENTS - 100.91%
(Cost $2,886,806)** ........................................ 2,986,293
--------------
NET OTHER ASSETS AND LIABILITIES - (0.91)% .................... (26,919)
--------------
NET ASSETS - 100.00% .......................................... $ 2,959,374
==============
----------
* Non-income producing security.
** Aggregate cost for Federal income tax purposes is $2,927,570.
Gross unrealized appreciation ...... $ 227,745
Gross unrealized depreciation ...... (169,022)
---------
Net unrealized appreciation ........ $ 58,723
=========
MSCI Morgan Stanley Capital International
SEE ACCOMPANYING NOTES TO FINANCIAL STATEMENTS.
22
Aston Funds
CARDINAL MID CAP VALUE FUND
PORTFOLIO MANAGERS COMMENTARY (UNAUDITED) OCTOBER 31, 2009
Amy K. Minella, Eugene Fox III & Robert Kirkpatrick, CFA
Q. What were the most significant market factors affecting Fund performance
and returns relative to the benchmark during the past 12 months?
A. The Fund outpaced its benchmark due to advantageous stock selection in the
Consumer Staples sector, little exposure to the poorly performing banking
industry, and the absence of Utilities, which badly lagged the benchmark.
These factors more than offset adverse stock selection in the Healthcare
and Industrials sectors, and the drag from the Fund's cash position.
Q. What were the best performing holdings for the Fund during the period?
A. Concho Resources was a key contributor, benefitting from higher oil prices
and significant production growth. Cable operator Virgin Media rose sharply
as much of its debt was refinanced and its operating metrics and cash flow
improved. Check Point Software Technlologies was a major positive as demand
for security software proved resilient and its acquisition of Nokia's
security software business enhanced its future prospects. Fund manager
Affiliated Managers Group also increased sharply as assets under management
at its affiliates rose with the rally in global equity markets. Clothing
retailer American Eagle Outfitters was another standout, as same store
sales trends improved and valuation expanded from depressed levels.
Q. What were the weakest performing holdings?
A. Data provider IMS Health suffered from declining revenue and earnings as
customers tightened their budgets with the uncertainty surrounding health
care reform. We sold the position as management felt improvement was
unlikely anytime soon. Publisher Scholastic Corp. saw pressure on state
budgets that crimped earnings and the adoption of e-books clouded its
prospects. We sold it early in the year. Broker Investment Technology Group
also lagged as lower trading volumes and falling commissions reduced
earnings. Pawn lender Cash America International saw its earnings growth
reduced by state restrictions on payday lending and weak retail sales.
Metal processor Carpenter Technology Group, which we also sold, suffered
losses due to lower volumes as a result of the global economic slowdown and
higher pension costs.
Q. How was the Fund positioned as of October 31, 2009?
A. Our current investment outlook is positive, but guarded, as improving
economic and credit conditions, and easier earnings comparisons, outweigh
more challenging valuations. Economic activity should benefit from
inventory restocking and a weaker dollar, but the pace of recovery is
likely to be gradual. Very low short-term interest rates and improving
credit markets are having a salutary effect on confidence but the recession
is likely to have a lasting effect on consumer and business behavior. While
the equity market seems to be anticipating a normal economic recovery, such
an outcome is far from certain. Nonetheless, funds are likely to continue
flowing into equities as long as interest rates remain near zero.
The investing environment has been volatile as equity investors have
recently developed a healthy appetite for risk. As the management teams of
most of our more economically sensitive companies have indicated their
businesses have stabilized, we have added incrementally to a few of these
holdings. We also invested in one agency-only mortgage REIT and a specialty
finance company. Other companies in the portfolio remain generally cautious
and most are building cash. Our companies have sound business models,
prudent balance sheets and the ability to generate substantial free cash
flow, which means that they are well prepared to take advantage of
opportunities that arise in these challenging economic times.
GROWTH OF A HYPOTHETICAL
$10,000 INVESTMENT--CLASS N
(PERFORMANCE GRAPH)
Cardinal Mid Cap Value Fund
Morningstar
Cardinal Mid Russell Mid Mid Cap Value
Cap Value Cap Value Funds
------------ ----------- -------------
Nov-07 10,000 10,000 10,000
Apr-08 8,960 9,080 8,995
Oct-08 6,230 6,117 6,044
Apr-09 6,324 5,741 5,957
Oct-09 7,255 7,005 7,133
All dividends and capital gains are reinvested. Indexes are unmanaged and do not
take into account fees, expenses or other costs.
Returns shown in the chart and table do not reflect taxes that a shareholder
would pay on Fund distributions or on the sale of the Fund shares.
Mid-Cap Stocks may be subject to a higher degree of market risk than the
securities of more established companies because they tend to be more volatile
and less liquid.
RETURNS FOR PERIOD ENDED 10/31/09
Average Annual Total Return - Class N
One Year 16.45%
Since Inception -14.82%
Inception Date 11/02/07
THE PERFORMANCE DATA QUOTED REPRESENTS PAST PERFORMANCE. PAST PERFORMANCE DOES
NOT GUARANTEE FUTURE RESULTS. INVESTMENT RETURN AND PRINCIPAL VALUE WILL
FLUCTUATE SO THAT AN INVESTOR'S SHARES, UPON REDEMPTION, MAY BE WORTH MORE OR
LESS THAN THEIR ORIGINAL COST. CURRENT PERFORMANCE MAY BE HIGHER OR LOWER THAN
THE PERFORMANCE DATA QUOTED. FOR PERFORMANCE DATA CURRENT TO THE MOST RECENT
MONTH-END, PLEASE VISIT OUR WEBSITE AT www.astonfunds.com.
THE PERFORMANCE QUOTED WOULD HAVE BEEN LOWER IF WAIVERS HAD NOT BEEN IN EFFECT.
23
Aston Funds
CARDINAL MID CAP VALUE FUND OCTOBER 31, 2009
SCHEDULE OF INVESTMENTS
(PIE CHART)
INFORMATION TECHNOLOGY 25%
CONSUMER DISCRETIONARY 18%
FINANCIALS 14%
INDUSTRIALS 11%
HEALTH CARE 10%
ENERGY 8%
MATERIALS 5%
CONSUMER STAPLES 4%
CASH & NET OTHER ASSETS AND LIABILITIES 3%
TELECOMMUNICATION SERVICES 2%
% OF TOTAL NET ASSETS
MARKET
SHARES VALUE
--------- --------------
COMMON STOCKS - 96.51%
CONSUMER DISCRETIONARY - 17.77%
1,211 American Eagle Outfitters ......................... $ 21,180
1,100 Interactive Data .................................. 28,930
300 International Speedway, Class A ................... 7,653
350 Jack in the Box * ................................. 6,566
10 NVR * ............................................. 6,623
1,179 Speedway Motorsports .............................. 15,964
625 Stanley Works ..................................... 28,269
300 Tiffany ........................................... 11,787
1,824 Virgin Media ...................................... 25,481
2,615 Wendy's/Arby's Group, Class A ..................... 10,329
--------------
162,782
--------------
CONSUMER STAPLES - 4.19%
250 Alberto-Culver .................................... 6,705
600 Smucker (J.M.) .................................... 31,638
--------------
38,343
--------------
ENERGY - 7.57%
900 Concho Resources * ................................ 34,299
400 Oceaneering International * ....................... 20,440
550 Plains Exploration & Production * ................. 14,575
--------------
69,314
--------------
FINANCIALS - 13.73%
546 Affiliated Managers Group * ....................... 34,665
500 Annaly Capital Management, REIT ................... 8,455
617 Cash America International ........................ 18,670
300 Entertainment Properties Trust, REIT .............. 10,206
351 Gallagher (Arthur J.) ............................. 7,831
1,100 Hudson City Bancorp ............................... 14,454
300 Investment Technology Group * ..................... 6,471
928 Willis Group Holdings ............................. 25,056
--------------
125,808
--------------
MARKET
SHARES VALUE
--------- --------------
HEALTH CARE - 10.43%
300 Beckman Coulter ................................... $ 19,299
311 Henry Schein * .................................... 16,430
417 Laboratory Corp of America Holdings * ............. 28,727
376 Quest Diagnostics ................................. 21,030
255 West Pharmaceutical Services ...................... 10,065
--------------
95,551
--------------
INDUSTRIALS - 11.26%
300 AMETEK ............................................ 10,467
541 Equifax ........................................... 14,812
100 ITT ............................................... 5,070
250 J.B. Hunt Transport Services ...................... 7,515
200 L-3 Communications Holdings ....................... 14,458
200 Roper Industries .................................. 10,110
1,346 RR Donnelley & Sons ............................... 27,028
400 Teledyne Technologies * ........................... 13,664
--------------
103,124
--------------
INFORMATION TECHNOLOGY - 25.15%
1,000 Broadridge Financial Solutions .................... 20,810
599 Check Point Software Technologies * ............... 18,611
1,900 Convergys * ....................................... 20,615
600 Fiserv * .......................................... 27,522
500 Harris ............................................ 20,860
710 Hewitt Associates * ............................... 25,219
1,010 Intuit * .......................................... 29,361
1,151 Progress Software * ............................... 26,588
296 Sybase * .......................................... 11,710
1,600 Western Union ..................................... 29,072
--------------
230,368
--------------
MATERIALS - 4.78%
100 FMC ............................................... 5,110
720 Silgan Holdings ................................... 38,700
--------------
43,810
--------------
TELECOMMUNICATION SERVICES - 1.63%
1,553 Windstream ........................................ 14,971
--------------
TOTAL COMMON STOCKS
(Cost $837,922) ................................ 884,071
--------------
INVESTMENT COMPANY - 4.58%
41,991 BlackRock Liquidity Funds TempCash Portfolio ...... 41,991
--------------
TOTAL INVESTMENT COMPANY
(Cost $41,991) ................................. 41,991
--------------
TOTAL INVESTMENTS - 101.09%
(Cost $879,913)** .......................................... 926,062
--------------
NET OTHER ASSETS AND LIABILITIES - (1.09)% .................... (9,962)
--------------
NET ASSETS - 100.00% .......................................... $ 916,100
==============
----------
* Non-income producing security.
** Aggregate cost for Federal income tax purposes is $879,973.
Gross unrealized appreciation .... $ 97,775
Gross unrealized depreciation .... (51,686)
--------
Net unrealized appreciation ...... $ 46,089
========
REIT Real Estate Investment Trust
SEE ACCOMPANYING NOTES TO FINANCIAL STATEMENTS.
24
Aston Funds
RIVER ROAD SMALL-MID CAP FUND
PORTFOLIO MANAGERS COMMENTARY (UNAUDITED) OCTOBER 31, 2009
James C. Shircliff, CFA; R. Andrew Beck & Henry W. Sanders III, CFA
Q. What were the most significant market factors affecting Fund performance
and returns relative to the benchmark during the past 12 months?
A. The past 12 months was a volatile period for investors with equity markets
experiencing both a precipitous decline and an equally sharp rebound.
Fortunately, the Fund was positive for the period delivering significant
outperformance relative to its benchmark. Five sectors contributed
positively to relative performance with the largest contributions to
relative performance coming from Consumer holdings, which benefitted from
both a higher total return and a significant overweight position. The
largest negative contribution was, not surprisingly, within the Information
Technology sector. Historically, when this high-volatility, growth-oriented
sector leads the market's advance, as it did during the period, the Fund's
low-volatility, value-oriented investment style lags the benchmark.
Q. What were the best performing holdings for the Fund during the period?
A. The two holdings with the largest positive contribution to the Fund's total
return during the period were Cracker Barrel and Big Lots. Like many
restaurant operators, Cracker Barrel rebounded as the economy began to
emerge from recession as the company reported strong operating results from
better cost controls. The real story behind Cracker Barrel, however, was
the $56 million in proceeds the firm received from a sale-leaseback
transaction for 15 of its restaurants and one distribution center. The firm
still owns the real estate at 400 of its stores and the deal helped to
demonstrate the untapped value of its real estate portfolio.
Big Lots benefited from strong earnings results, upbeat guidance, and
multiple analyst upgrades during the period. Big Lots is the nation's
largest broadline closeout retailer with approximately 1,350 stores in 47
states. Last year was the ideal environment for the firm, and the company
was able to capitalize on cash-strapped companies forced to liquidate
inventory at substantially discounted prices.
Q. What were the weakest performing holdings?
A. The two holdings with the largest negative contribution to the Fund's total
return were American Capital and NACCO Industries. American Capital is a
business development company, investing primarily in the debt and equity of
private company buyouts. The Fund sold the stock as it appeared that the
business model of distributing virtually all cash flow to shareholders and
constantly raising new capital for additional investments would no longer
be sustainable.
NACCO Industries is an operating holding company with three main
businesses--coal mining, lift trucks, and housewares--that suffered
tremendously during the downturn in early 2009, with all of its business
lines experiencing significant weakness. We liquidated the Fund's position
in the stock as we sought to manage unrealized losses in lower conviction
holdings.
Q. How was the Fund positioned as of October 31, 2009?
A. Last year we noted that while we were concerned about the short-term macro
environment, we believed lower commodity prices, unprecedented stimulus,
and attractive valuations would drive positive equity returns over the next
12 to 18 months. That belief was largely realized, although in a pattern
that was more tumultuous than we imagined. Today, stocks are far less
attractively priced than they were one year ago and, over the next 12 to 18
months, policy makers will begin the difficult task of withdrawing stimulus
against a backdrop of high secular unemployment, higher taxes, and
continuing consumer deleveraging. While we don't believe the U.S. economy
will collapse during this process, we do believe that economic growth and
earnings growth will be modest. Thus, we are positioning the Fund with an
eye toward stocks that are less correlated with the broader market, as well
as firms that can prosper in a period of modest economic growth.
GROWTH OF A HYPOTHETICAL
$10,000 INVESTMENT--CLASS N
(PERFORMANCE GRAPH)
River Road Small-Mid Cap Fund
River Road Morningstar
Small-Mid Russell 2500 Small Value
Cap Fund Value Index Category
---------- ------------ -----------
Mar-07 10,000 10,000 10,000
Oct-07 10,130 9,736 9,917
Oct-08 7,130 6,461 6,629
Oct-09 7,724 7,013 7,373
All dividends and capital gains are reinvested. Indexes are unmanaged and do not
take into account fees, expenses or other costs.
Returns shown in the chart and table do not reflect taxes that a shareholder
would pay on Fund distributions or on the sale of the Fund shares.
Small-Cap and Mid-Cap Stocks may be subject to a higher degree of market risk
than the securities of more established companies because they tend to be more
volatile and less liquid.
RETURNS FOR PERIOD ENDED 10/31/09
Average Annual Total Returns - Class N
One Year 8.33%
Since Inception -9.49%
Inception Date 03/29/2007
Average Annual Total Returns - Class I
One Year 8.52%
Since Inception -12.15%
Inception Date 06/28/2007
THE PERFORMANCE DATA QUOTED REPRESENTS PAST PERFORMANCE. PAST PERFORMANCE DOES
NOT GUARANTEE FUTURE RESULTS. INVESTMENT RETURN AND PRINCIPAL VALUE WILL
FLUCTUATE SO THAT AN INVESTOR'S SHARES, UPON REDEMPTION, MAY BE WORTH MORE OR
LESS THAN THEIR ORIGINAL COST. CURRENT PERFORMANCE MAY BE HIGHER OR LOWER THAN
THE PERFORMANCE DATA QUOTED. FOR PERFORMANCE DATA CURRENT TO THE MOST RECENT
MONTH-END, PLEASE VISIT OUR WEBSITE AT www.astonfunds.com.
THE PERFORMANCE QUOTED WOULD HAVE BEEN LOWER IF WAIVERS HAD NOT BEEN IN EFFECT.
25
Aston Funds
RIVER ROAD SMALL-MID CAP FUND OCTOBER 31, 2009
SCHEDULE OF INVESTMENTS
(PIE CHART)
CONSUMER DISCRETIONARY 25%
FINANCIALS 20%
CONSUMER STAPLES 13%
INDUSTRIALS 13%
MATERIALS 7%
HEALTH CARE 5%
ENERGY 5%
INFORMATION TECHNOLOGY 5%
UTILITIES 3%
CASH AND NET OTHER ASSETS AND LIABILITIES 3%
TELECOMMUNICATION SERVICES 1%
% OF TOTAL NET ASSETS
MARKET
SHARES VALUE
--------- --------------
COMMON STOCKS - 96.75%
CONSUMER DISCRETIONARY - 25.21%
35,890 Abercrombie & Fitch, Class A ...................... $ 1,177,910
34,640 Bank (Jos. A.) Clothiers * ........................ 1,419,547
115,300 Big Lots * ........................................ 2,888,265
206,390 Brink's Home Security Holdings * .................. 6,393,962
227,820 CKX * ............................................. 1,458,048
133,620 Cracker Barrel Old Country Store .................. 4,429,503
86,090 Dollar Tree * ..................................... 3,885,242
103,280 Dress Barn * ...................................... 1,864,204
203,350 Fred's, Class A ................................... 2,407,664
142,960 Hillenbrand ....................................... 2,856,341
64,500 International Speedway, Class A ................... 1,645,395
94,050 JAKKS Pacific * ................................... 1,338,332
87,930 Lincoln Educational Services * .................... 1,742,773
236,170 OfficeMax ......................................... 2,699,423
78,540 Papa John's International * ....................... 1,767,150
331,210 PetSmart .......................................... 7,793,371
206,390 Rent-A-Center * ................................... 3,789,320
75,230 UniFirst .......................................... 3,164,926
--------------
52,721,376
--------------
CONSUMER STAPLES - 13.14%
83,786 American Dairy * .................................. 2,424,767
242,753 Casey's General Stores ............................ 7,654,002
34,300 Coca-Cola Bottling ................................ 1,540,413
81,580 Dean Foods * ...................................... 1,487,203
96,990 Industrias Bachoco, SP ADR (Mexico) ............... 2,203,613
32,046 J & J Snack Foods ................................. 1,255,242
86,480 National Beverage * ............................... 946,956
264,750 Ruddick ........................................... 7,074,120
96,760 Village Super Market, Class A ..................... 2,902,800
--------------
27,489,116
--------------
ENERGY - 4.59%
37,380 Bristow Group * ................................... 1,089,627
92,250 Cal Dive International * .......................... 708,480
98,735 Encore Acquisition * .............................. 3,660,107
MARKET
SHARES VALUE
--------- --------------
ENERGY (CONTINUED)
133,320 Frontier Oil ...................................... $ 1,847,815
88,530 Provident Energy Trust ............................ 546,230
129,080 Rosetta Resources * ............................... 1,746,452
--------------
9,598,711
--------------
FINANCIALS - 20.59%
12,641 Alleghany * ....................................... 3,160,250
96,000 BancorpSouth ...................................... 2,167,680
53,640 Bank of Hawaii .................................... 2,381,616
55,840 Cincinnati Financial .............................. 1,416,102
103,817 Commerce Bancshares ............................... 3,982,420
73,130 FirstService * .................................... 1,299,520
215,620 Hilltop Holdings * ................................ 2,552,941
82,865 Max Capital Group ................................. 1,711,162
61,020 Navigators Group * ................................ 3,238,331
53,960 Oppenheimer Holdings, Class A ..................... 1,375,980
64,340 PartnerRe ......................................... 4,920,723
205,340 People's United Financial ......................... 3,291,600
65,260 UMB Financial ..................................... 2,595,390
238,020 W. R. Berkley ..................................... 5,883,854
7,302 White Mountains Insurance Group ................... 2,259,312
28,730 Zenith National Insurance ......................... 819,667
--------------
43,056,548
--------------
HEALTH CARE - 4.83%
103,100 Kindred Healthcare * .............................. 1,515,570
100,600 Martek Biosciences * .............................. 1,806,776
19,990 National Healthcare ............................... 719,040
67,270 Pharmaceutical Product Development ................ 1,449,669
83,290 Res-Care * ........................................ 1,001,979
90,020 STERIS ............................................ 2,633,985
24,700 West Pharmaceutical Services ...................... 974,909
--------------
10,101,928
--------------
INDUSTRIALS - 12.86%
53,355 AMERCO * .......................................... 2,255,316
211,340 Brink's ........................................... 5,015,098
82,480 Copart * .......................................... 2,653,382
68,780 Corporate Executive Board ......................... 1,651,408
194,640 Equifax ........................................... 5,329,243
211,740 Geo Group * ....................................... 4,478,301
79,095 Korn/Ferry International * ........................ 1,262,356
223,380 Pike Electric * ................................... 2,803,419
82,885 Viad .............................................. 1,450,488
--------------
26,899,011
--------------
INFORMATION TECHNOLOGY - 4.56%
45,430 Forrester Research * .............................. 1,150,742
48,040 Hewitt Associates, Class A * ...................... 1,706,381
205,210 Ingram Micro, Class A * ........................... 3,621,957
104,240 Ituran Location and Control ....................... 1,288,406
199,160 TeleCommunication Systems, Class A * .............. 1,780,490
--------------
9,547,976
--------------
MATERIALS - 6.84%
92,990 Airgas ............................................ 4,125,036
220,780 AptarGroup ........................................ 7,795,742
224,990 Glatfelter ........................................ 2,378,144
--------------
14,298,922
--------------
TELECOMMUNICATION SERVICES - 0.58%
32,920 United States Cellular * .......................... 1,205,201
--------------
SEE ACCOMPANYING NOTES TO FINANCIAL STATEMENTS.
26
Aston Funds
RIVER ROAD SMALL-MID CAP FUND OCTOBER 31, 2009
SCHEDULE OF INVESTMENTS - CONTINUED
MARKET
SHARES VALUE
--------- --------------
UTILITIES - 3.55%
66,210 Avista ............................................ $ 1,255,342
32,820 National Fuel Gas ................................. 1,488,059
128,266 Portland General Electric ......................... 2,384,465
105,072 SJW ............................................... 2,287,418
--------------
7,415,284
--------------
TOTAL COMMON STOCKS
(Cost $190,209,338) ............................ 202,334,073
--------------
INVESTMENT COMPANY - 2.96%
6,201,012 BlackRock Liquidity Funds TempFund Portfolio ...... 6,201,012
--------------
TOTAL INVESTMENT COMPANY
(Cost $6,201,012) .............................. 6,201,012
--------------
TOTAL INVESTMENTS - 99.71%
(Cost $196,410,350)** ...................................... 208,535,085
--------------
NET OTHER ASSETS AND LIABILITIES - 0.29% ...................... 599,790
--------------
NET ASSETS - 100.00% .......................................... $ 209,134,875
==============
----------
* Non-income producing security.
** Aggregate cost for Federal income tax purposed is $198,190,572.
Gross unrealized appreciation ..... $18,908,224
Gross unrealized depreciation ..... (8,563,711)
-----------
Net unrealized appreciation ....... $10,344,513
===========
SP ADR Sponsored American Depositary Receipt
SEE ACCOMPANYING NOTES TO FINANCIAL STATEMENTS.
27
Aston Funds
VEREDUS AGGRESSIVE GROWTH FUND
PORTFOLIO MANAGERS COMMENTARY (UNAUDITED) OCTOBER 31, 2009
B. Anthony Weber, Charles Mercer, Jr., CFA & Michael E. Johnson, CFA
Q. What were the most significant market factors affecting Fund performance
and returns relative to the benchmark during the past 12 months?
A. The volatility that marked the end of 2008 spilled over into 2009 as the
market finally bottomed amid a panicked selloff in February and March. Off
that bottom, those stocks that had suffered the most and that were most
leveraged saw the greatest increase in price, stocks that the Fund
generally did not own. Earnings surprise and estimate revision, the core of
our strategy, were of little consequence during the period until the third
quarter of 2009. It was during that quarter that the Fund outpaced the
market and its rivals. Unfortunately, volatility was reintroduced into the
market during the fourth quarter as investors became nervous about
lackluster GDP growth.
Q. What were the best performing holdings for the Fund during the period?
A. Technology was king for the Fund during the past year as we saw some giant
gains from names like Seagate Technology and Western Digital, two disk
drive manufacturers that were up 145% and 156% respectively. Semiconductor
stocks stood out as well, as several names saw very nice moves. Overall,
the portfolio's performance in Technology doubled that of the benchmark. We
also saw strength from the Consumer Discretionary sector, led by names such
as Aeropostale (no longer held), Carter's and American Eagle Outfitters (no
longer held).
Q. What were the weakest performing holdings?
A. Airlines, such as Continental and AMR which had been the Fund's best
performing industry group during the fourth quarter of 2008, experienced a
dramatic selloff during the first three months of 2009, as traffic numbers
slumped to levels not seen since the period just after 9/11. As a result,
Industrials was the worst sector in the portfolio, as well as in the
benchmark. A 50% underweight in Healthcare most of the year avoided the
uncertainty around the proposed healthcare reform bill but stock selection
in this area struggled from earnings disappointments primarily within
biotechnology and medical equipment.
Q. How was the Fund positioned as of October 31, 2009?
A. The Fund is still overweight early cycle sectors, as Technology and
Consumer Discretionary represent the two largest areas of exposure in the
portfolio. Semiconductors and related companies make up the bulk in
Technology as we are convinced corporate America, which is flush with cash,
will lead us out of this recession as we may be at the front edge of a
major PC upgrade cycle driven by the launch of Windows 7. Specialty retail
and apparel stocks lead the consumer space along with firms leveraged to an
upswing in ad revenue. The Industrials sector is driven by a sizable
position in car rental stocks where fleets are being reduced and residual
values are increasing given the all time highs in used-car prices. We
likely will look to move up the portfolio's stake in Healthcare during the
course of the next 12 months as the uncertainty surrounding the reform
package is removed and we start to look up the food chain for higher
quality growth stocks.
GROWTH OF A HYPOTHETICAL
$10,000 INVESTMENT--CLASS N
(PERFORMANCE GRAPH)
Veredus Aggressive Growth Fund
ABN AMRO/Veredus Morningstar(R)
Aggressive Growth Russell 2000 Small Growth
Fund - Class N Growth Index Category
----------------- ------------ ---------------
Jun-98 10,000 10,000 10,000
Oct-98 8,620 8,169 8,234
Oct-99 16,630 10,561 11,859
Oct-00 25,502 12,269 16,475
Oct-01 22,931 8,403 11,921
Oct-02 14,961 6,590 9,723
Oct-03 19,913 9,659 13,727
Oct-04 21,246 10,193 14,356
Oct-05 23,977 11,305 16,063
Oct-06 24,094 13,235 18,178
Oct-07 31,324 15,449 21,632
Oct-08 16,330 9,599 12,640
Oct-09 17,602 10,687 14,304
All dividends and capital gains are reinvested. Indexes are unmanaged and do not
take into account fees, expenses or other costs.
Returns shown in the chart and table do not reflect taxes that a shareholder
would pay on Fund distributions or on the sale of the Fund shares.
Small company stocks may be subject to a higher degree of market risk than the
securities of more established companies because they tend to be more volatile
and less liquid.
RETURNS FOR PERIOD ENDED 10/31/09
Average Annual Total Returns - Class N
One Year 7.79%
Five Year -3.69%
Ten Year 0.57%
Since Inception 5.11%
Inception Date 06/30/98
Average Annual Total Returns - Class I
One Year 8.16%
Five Year -3.43%
Since Inception -3.18%
Inception Date 10/05/01
THE PERFORMANCE DATA QUOTED REPRESENTS PAST PERFORMANCE. PAST PERFORMANCE DOES
NOT GUARANTEE FUTURE RESULTS. INVESTMENT RETURN AND PRINCIPAL VALUE WILL
FLUCTUATE SO THAT AN INVESTOR'S SHARES, UPON REDEMPTION, MAY BE WORTH MORE OR
LESS THAN THEIR ORIGINAL COST. CURRENT PERFORMANCE MAY BE HIGHER OR LOWER THAN
THE PERFORMANCE DATA QUOTED. FOR PERFORMANCE DATA CURRENT TO THE MOST RECENT
MONTH-END, PLEASE VISIT OUR WEBSITE AT www.astonfunds.com.
THE TOTAL EXPENSE RATIO FOR THE N CLASS AND CLASS I IS 1.56% AND 1.31%
RESPECTIVELY, AS DISCLOSED IN THE PROSPECTUS DATED MARCH 1, 2009. THE
PERFORMANCE QUOTED WOULD HAVE BEEN LOWER IF WAIVERS HAD NOT BEEN IN EFFECT.
PLEASE REFER TO THE FINANCIAL HIGHLIGHTS SECTION IN THIS REPORT FOR MORE 2009
FISCAL YEAR END RELATED INFORMATION.
28
Aston Funds
VEREDUS AGGRESSIVE GROWTH FUND OCTOBER 31, 2009
SCHEDULE OF INVESTMENTS
(PIE CHART)
INFORMATION TECHNOLOGY 33%
CONSUMER DISCRETIONARY 30%
INDUSTRIALS 12%
HEALTH CARE 9%
FINANCIALS 7%
ENERGY 3%
MATERIALS 3%
CASH & NET OTHER ASSETS AND LIABILITIES 3%
% OF TOTAL NET ASSETS
MARKET
SHARES VALUE
--------- --------------
COMMON STOCKS - 97.07%
CONSUMER DISCRETIONARY - 30.15%
61,200 Amerigon * ........................................ $ 393,516
34,500 AnnTaylor Stores * ................................ 447,465
75,825 bebe stores ....................................... 474,665
44,075 Brunswick ......................................... 417,831
31,975 Carter's * ........................................ 754,610
61,700 Chico's FAS * ..................................... 737,315
67,750 Coldwater Creek * ................................. 389,563
101,325 Gannett ........................................... 995,012
14,225 Guess? ............................................ 519,924
36,600 Lithia Motors, Class A * .......................... 305,244
30,375 MarineMax * ....................................... 206,854
63,400 MGM MIRAGE * ...................................... 587,718
120,750 New York Times, Class A ........................... 962,378
127,825 Office Depot * .................................... 773,341
114,250 Pacific Sunwear of California * ................... 690,070
31,050 Pier 1 Imports * .................................. 109,296
194,150 Saks * ............................................ 1,089,182
71,950 Select Comfort * .................................. 393,567
93,525 Shuffle Master * .................................. 730,430
24,000 Steak 'n Shake (The) * ............................ 279,600
37,775 Talbots ........................................... 342,619
25,875 Tempur-Pedic International * ...................... 501,199
56,050 Ulta Salon, Cosmetics & Fragrance * ............... 848,597
28,600 Under Armour, Class A * ........................... 767,910
--------------
13,717,906
--------------
ENERGY - 2.92%
19,300 Carrizo Oil & Gas * ............................... 447,374
7,300 GMX Resources * ................................... 92,929
77,075 SandRidge Energy * ................................ 788,477
--------------
1,328,780
--------------
FINANCIALS - 6.67%
9,125 FBR Capital Markets * ............................. 55,663
109,225 Janus Capital Group ............................... 1,433,032
24,825 Jefferies Group * ................................. 647,933
MARKET
SHARES VALUE
--------- --------------
FINANCIALS (CONTINUED)
87,000 KKR Financial Holdings * .......................... $ 398,460
29,100 LaSalle Hotel Properties, REIT .................... 499,356
--------------
3,034,444
--------------
HEALTH CARE - 8.73%
26,825 Align Technology * ................................ 421,689
10,625 Almost Family * ................................... 322,469
12,925 Amedisys * ........................................ 514,286
27,750 Brookdale Senior Living * ......................... 467,310
64,850 Clarient * ........................................ 210,114
84,725 LCA-Vision * ...................................... 381,263
16,525 NuVasive * ........................................ 599,692
27,550 RehabCare Group * ................................. 516,563
20,500 WellCare Health Plans * ........................... 535,665
--------------
3,969,051
--------------
INDUSTRIALS - 12.00%
88,875 AirTran Holdings * ................................ 375,941
54,500 AMR * ............................................. 293,755
121,575 Avis Budget Group * ............................... 1,021,230
25,350 CDI ............................................... 308,763
9,550 Dollar Thrifty Automotive Group * ................. 176,771
17,650 Ener1 * ........................................... 88,074
21,125 EnerNOC * ......................................... 606,921
50,300 Gol - Linhas Aereas Inteligentes SA, ADR
(Brazil) ....................................... 516,581
90,325 Hertz Global Holdings * ........................... 840,926
40,575 Kforce * .......................................... 475,945
42,850 Tutor Perini * .................................... 756,303
--------------
5,461,210
--------------
INFORMATION TECHNOLOGY - 33.55%
25,825 Aixtron AG, SP ADR (Germany) ...................... 765,453
154,675 Amkor Technology * ................................ 852,259
19,025 Avnet * ........................................... 471,440
103,975 Brightpoint * ..................................... 766,296
23,475 Cavium Networks * ................................. 445,086
27,950 Echo Global Logistics * ........................... 364,748
103,500 Fairchild Semiconductor International * ........... 774,180
87,675 Kulicke & Soffa Industries * ...................... 407,689
172,150 LSI * ............................................. 881,408
238,325 LTX-Credence * .................................... 319,356
142,250 Mattson Technology * .............................. 301,570
78,525 NetScout Systems * ................................ 965,072
11,200 Newport * ......................................... 83,328
141,550 ON Semiconductor * ................................ 946,970
181,125 RF Micro Devices * ................................ 720,878
80,925 Rubicon Technology * .............................. 1,223,586
27,625 SAVVIS * .......................................... 408,574
52,875 Seagate Technology ................................ 737,606
132,250 Sonic Solutions * ................................. 642,735
39,900 Standard Microsystems * ........................... 768,474
120,800 TriQuint Semiconductor * .......................... 651,112
51,800 TTM Technologies * ................................ 526,806
22,700 Western Digital * ................................. 764,536
45,425 Xyratex * ......................................... 474,691
--------------
15,263,853
--------------
MATERIALS - 3.05%
18,525 Globe Specialty Metals * 146,718
14,100 Koppers Holdings 368,292
SEE ACCOMPANYING NOTES TO FINANCIAL STATEMENTS.
29
Aston Funds
VEREDUS AGGRESSIVE GROWTH FUND OCTOBER 31, 2009
SCHEDULE OF INVESTMENTS - CONTINUED
MARKET
SHARES VALUE
--------- --------------
MATERIALS (CONTINUED)
84,600 PolyOne * ........................................ $ 472,068
36,475 Solutia * ........................................ 401,217
--------------
1,388,295
--------------
TOTAL COMMON STOCKS
(Cost $39,891,948) ............................ 44,163,539
--------------
INVESTMENT COMPANY - 4.03%
1,834,636 BlackRock Liquidity Funds
TempCash Portfolio ............................ 1,834,636
--------------
TOTAL INVESTMENT COMPANY
(Cost $1,834,636) ............................. 1,834,636
--------------
TOTAL INVESTMENTS - 101.10%
(Cost $41,726,584)** ...................................... 45,998,175
--------------
NET OTHER ASSETS AND LIABILITIES - (1.10)% (501,989)
--------------
NET ASSETS - 100.00% ......................................... $ 45,496,186
==============
----------
* Non-income producing security.
** Aggregate cost for Federal income tax purposes is $41,734,861.
Gross unrealized appreciation .... $ 6,635,674
Gross unrealized depreciation .... (2,372,360)
-----------
Net unrealized appreciation ...... $ 4,263,314
===========
ADR American Depositary Receipt
REIT Real Estate Investment Trust
SP ADR Sponsored American Depositary Receipt
SEE ACCOMPANYING NOTES TO FINANCIAL STATEMENTS.
30
Aston Funds
TAMRO SMALL CAP FUND
PORTFOLIO MANAGER COMMENTARY (UNAUDITED) OCTOBER 31, 2009
Philip D. Tasho, CFA
Q. What were the most significant market factors affecting Fund performance
and returns relative to the benchmark during the past 12 months?
A. The financial meltdown weighed heavily on stocks during late 2008 and early
2009, but stocks rebounded strongly, recovering into positive territory.
While the markets were unusually volatile, the Fund reported positive
absolute returns for the one-year period ending October 2009 and positive
relative returns versus its benchmark, the Russell 2000(R) Index. Strong
stock selection in Energy, Financials, Health Care and Industrials added to
performance, as well as positive sector allocation in Consumer
Discretionary. Stock selection in Technology and Consumer Discretionary
detracted from performance.
Q. What were the best performing holdings for the Fund during the period?
A. General Cable, an industrial wire and cable company, continued to execute
well thanks to its global footprint. For the second year, Quality Systems,
a health care systems software company, was another strong performer as
demand for its products resonated in the market place. The third largest
contributor to performance was F5 Networks, which benefited from a rebound
in corporate spending in technology led by demand for productivity
enhancement products.
Q. What were the weakest performing holdings?
A. While ManTech International declined with other defense-related stocks, the
loss of its well-respected Chief Operating Officer further depressed its
shares. Eclipsys, a health care systems integrator, declined due to poor
execution and the replacement of its Chief Financial Officer. SunOpta an
organic food concern, needed to restate financials due to certain incorrect
accounting treatments. All three positions were eventually sold from the
portfolio.
Q. How was the Fund positioned as of October 31, 2009?
A. We believe liquidity injected into the financial system through the
Congressional stimulus package, as well as by the Fed, provided the
opportunity for the stock market to rebound. The challenge over the next
year is funneling that liquidity into the real economy to spark the
resumption of positive GDP growth. The potential economic recovery could be
tempered by increases in state, local and eventually Federal taxes, as well
as the continued de-leveraging of the consumer. For this reason, we have
positioned the portfolio towards best-in-class leaders that have the
opportunity to gain traction in a sluggish and increasingly competitive
market through superior execution and capital bases that will help enable
them to take market share from their peers.
GROWTH OF A HYPOTHETICAL
$10,000 INVESTMENT--CLASS N
(PERFORMANCE GRAPH)
TAMRO Small Cap Fund
TAMRO Small Russell 2000 Morningstar(R) Small
Cap Fund Index Blend Category
------------ ----------- -------------------
11/30/2000 10,000 10,000 10,000
Oct-01 10,774 9,729 9,761
Oct-02 10,603 8,603 9,093
Oct-03 15,919 12,334 12,467
Oct-04 17,538 13,780 14,153
Oct-05 19,144 15,445 16,096
Oct-06 24,165 18,531 18,729
Oct-07 27,201 20,248 20,669
Oct-08 18,609 13,332 12,972
Oct-09 20,028 14,193 14,457
All dividends and capital gains are reinvested. Indexes are unmanaged and do not
take into account fees, expenses or other costs.
Returns shown in the chart and table do not reflect taxes that a shareholder
would pay on Fund distributions or on the sale of the Fund shares.
Small-Cap Stocks may be subject to a higher degree of market risk than the
securities of more established companies because they tend to be more volatile
and less liquid.
RETURNS FOR PERIOD ENDED 10/31/09
Average Annual Total Returns - Class N
One Year 7.63%
Five Year 2.69%
Since Inception 8.10%
Inception Date 11/30/00
Average Annual Total Returns - Class I
One Year 7.94%
Since Inception 1.64%
Inception Date 01/04/05
THE PERFORMANCE DATA QUOTED REPRESENTS PAST PERFORMANCE. PAST PERFORMANCE DOES
NOT GUARANTEE FUTURE RESULTS. INVESTMENT RETURN AND PRINCIPAL VALUE WILL
FLUCTUATE SO THAT AN INVESTOR'S SHARES, UPON REDEMPTION, MAY BE WORTH MORE OR
LESS THAN THEIR ORIGINAL COST. CURRENT PERFORMANCE MAY BE HIGHER OR LOWER THAN
THE PERFORMANCE DATA QUOTED. FOR PERFORMANCE DATA CURRENT TO THE MOST RECENT
MONTH-END, PLEASE VISIT OUR WEBSITE AT www.astonfunds.com.
31
Aston Funds
TAMRO SMALL CAP FUND OCTOBER 31, 2009
SCHEDULE OF INVESTMENTS
(PIE CHART)
CONSUMER DISCRETIONARY 22%
INFORMATION TECHNOLOGY 19%
FINANCIALS 18%
INDUTRIALS 13%
HEALTH CARE 8%
ENERGY 8%
CONSUMER STAPLES 8%
TELECOMMUNICATION SERVICES 2%
CASH & NET OTHER ASSETS AND LIABILITIES 2%
% OF TOTAL NET ASSETS
MARKET
SHARES VALUE
--------- --------------
COMMON STOCKS - 97.89%
CONSUMER DISCRETIONARY - 21.79%
580,320 Aaron Rents ....................................... $ 14,537,016
1,107,667 BJ's Restaurants * ................................ 17,678,365
212,324 Blue Nile * ....................................... 12,750,056
344,298 Carter's * ........................................ 8,125,433
453,919 Corinthian Colleges * ............................. 7,199,155
1,840,311 Domino's Pizza * .................................. 13,507,883
612,375 DSW, Class A * .................................... 11,757,600
845,717 E.W. Scripps, Class A ............................. 5,378,760
1,256,411 Gannett ........................................... 12,337,956
563,664 Grand Canyon Education * .......................... 9,142,630
618,569 Lumber Liquidators * .............................. 13,144,591
527,194 M.D.C. Holdings ................................... 17,197,068
211,250 Morningstar * ..................................... 10,777,975
995,525 Winnebago Industries * ............................ 11,448,538
--------------
164,983,026
--------------
CONSUMER STAPLES - 7.54%
449,354 Lance ............................................. 10,838,418
458,758 NBTY * ............................................ 16,703,379
481,937 TreeHouse Foods * ................................. 18,024,444
476,924 United Natural Foods * ............................ 11,498,638
--------------
57,064,879
--------------
ENERGY - 7.96%
329,731 Alpha Natural Resources * ......................... 11,200,962
437,324 Bill Barrett * .................................... 13,548,297
480,230 Holly ............................................. 13,931,472
416,628 Hornbeck Offshore Services * ...................... 10,128,227
875,005 Willbros Group * .................................. 11,497,566
--------------
60,306,524
--------------
MARKET
SHARES VALUE
--------- --------------
FINANCIALS - 18.44%
636,185 Bank of the Ozarks ................................ $ 14,473,209
921,113 BioMed Realty Trust, REIT ......................... 12,499,503
456,389 East West Bancorp ................................. 4,121,193
339,719 GAMCO Investors ................................... 14,332,745
973,612 Glacier Bancorp ................................... 12,744,581
1,032,834 Janus Capital Group ............................... 13,550,782
790,433 LaSalle Hotel Properties, REIT .................... 13,563,830
655,735 Raymond James Financial ........................... 15,481,903
966,501 Redwood Trust, REIT ............................... 13,473,024
3,991 Teton Advisors (a) ................................ 64,347
568,805 Washington, REIT .................................. 15,187,094
716,073 Zions Bancorporation .............................. 10,139,594
--------------
139,631,805
--------------
HEALTH CARE - 8.17%
342,297 Analogic .......................................... 12,781,370
2,369,421 Health Management Associates, Class A * ........... 14,453,468
225,063 Perrigo ........................................... 8,370,093
342,010 Teleflex .......................................... 17,014,998
216,836 United Therapeutics * ............................. 9,224,203
--------------
61,844,132
--------------
INDUSTRIALS - 12.87%
580,522 Advisory Board * .................................. 14,304,062
2,521,064 AirTran Holdings * ................................ 10,664,101
652,584 EMCOR Group * ..................................... 15,414,034
272,548 Energy Conversion Devices * ....................... 2,935,342
569,444 Forward Air ....................................... 12,151,935
427,128 General Cable * ................................... 13,300,766
184,169 Schnitzer Steel Industries, Class A ............... 7,963,468
507,212 Terex * ........................................... 10,255,827
283,734 Wabtec ............................................ 10,430,062
--------------
97,419,597
--------------
INFORMATION TECHNOLOGY - 19.24%
1,466,264 3PAR * ............................................ 13,797,544
633,894 Acme Packet * ..................................... 6,205,822
420,424 Blackboard * ...................................... 14,912,439
458,449 F5 Networks * ..................................... 20,579,776
244,262 FactSet Research Systems .......................... 15,644,981
42,234 LivePerson * ...................................... 212,437
82,901 Netezza * ......................................... 766,005
336,425 Quality Systems ................................... 20,528,653
1,205,128 RightNow Technologies * ........................... 18,390,253
896,202 SeaChange International * ......................... 6,067,288
768,939 ValueClick * ...................................... 7,566,360
1,321,229 VASCO Data Security International * ............... 8,033,072
805,543 Websense * ........................................ 12,937,021
--------------
145,641,651
--------------
TELECOMMUNICATION SERVICES - 1.88%
1,069,355 Cbeyond * ......................................... 14,275,889
--------------
TOTAL COMMON STOCKS
(Cost $666,109,823) ............................ 741,167,503
--------------
SEE ACCOMPANYING NOTES TO FINANCIAL STATEMENTS.
32
Aston Funds
TAMRO SMALL CAP FUND OCTOBER 31, 2009
SCHEDULE OF INVESTMENTS - CONTINUED
MARKET
SHARES VALUE
--------- -------------
INVESTMENT COMPANY - 1.02%
7,727,276 BlackRock Liquidity Funds
TempCash Portfolio ............................. $ 7,727,276
--------------
TOTAL INVESTMENT COMPANY
(Cost $7,727,276) .............................. 7,727,276
--------------
TOTAL INVESTMENTS - 98.91%
(Cost $673,837,099)** ..................................... 748,894,779
--------------
NET OTHER ASSETS AND LIABILITIES - 1.09% ..................... 8,220,687
--------------
NET ASSETS - 100.00% ......................................... $ 757,115,466
==============
----------
* Non-income producing security.
** Aggregate cost for Federal income tax purposes is $684,796,789.
Gross unrealized appreciation ......... $100,380,865
Gross unrealized depreciation ......... (36,282,875)
------------
Net unrealized appreciation ........... $ 64,097,990
============
(a) This security has been determined by the Adviser to be an illiquid
security. At October 31, 2009, this security amounted to $64,347 or 0.01%
of net assets.
REIT Real Estate Investment Trust
SEE ACCOMPANYING NOTES TO FINANCIAL STATEMENTS.
33
Aston Funds
RIVER ROAD SMALL CAP VALUE FUND
PORTFOLIO MANAGERS COMMENTARY (UNAUDITED) OCTOBER 31, 2009
James C. Shircliff, CFA; R. Andrew Beck & Henry W. Sanders III, CFA
Q. What were the most significant market factors affecting Fund performance
and returns relative to the benchmark during the past 12 months?
A. The past 12 months was a volatile period for investors with equity markets
experiencing both a precipitous decline and an equally sharp rebound.
Fortunately, the Fund was positive for the period delivering significant
outperformance relative to its benchmark. Seven sectors contributed
positively to relative performance with the largest contribution to
relative performance coming from Consumer Staples, which benefitted from
both a higher total return and a significant overweight position. A
significant underweight position in the Financials sector also aided
returns. The largest negative contribution was, not surprisingly, within
the Information Technology sector. Historically, when this high-volatility,
growth-oriented sector leads the market's advance, as it did during the
period, the Fund's low-volatility, value-oriented investment style lags the
benchmark.
Q. What were the best performing holdings for the Fund during the period?
A. The two holdings with the largest positive contribution to total return
during the period were American Dairy and Cracker Barrel. American Dairy, a
Utah-registered company, is a premium producer of infant formula in China
headquartered in Beijing. In September 2008, it was revealed that much of
China's raw milk powder was contaminated with melamine, a toxic chemical
that caused six infant deaths and sickened thousands. American Dairy was
one of a few companies not implicated in the melamine crisis.
Cracker Barrel operates nearly 600 restaurant/gift shops in 41 states. Like
many restaurant operators, the firm rebounded as the economy began to
emerge from recession as the company reported strong operating results from
better cost controls. The real story behind Cracker Barrel, however, was
the $56 million in proceeds the firm received from a sale-leaseback
transaction for 15 of its restaurants and one distribution center. The firm
still owns the real estate at 400 of its stores and the deal helped to
demonstrate the untapped value of its real estate portfolio.
Q. What were the weakest performing holdings?
A. The two holdings with the largest negative contribution to the Fund's total
return were NACCO Industries and JAKKS Pacific. NACCO Industries is an
operating holding company with three main businesses--coal mining, lift
trucks, and house wares--that suffered tremendously during the downturn in
early 2009, with all of its business lines experiencing significant
weakness. We liquidated the Fund's position in the stock as we sought to
manage unrealized losses in lower conviction holdings.
JAKKS Pacific underperformed the market and its peer group last year. Like
most retailers, JAKKS Pacific struggled to grow sales. Strong brands such
as Hannah Montana, WWE, and Pokemon experienced significant declines in
shelf space and ultimately revenue. Fortunately, new products such as Girl
Gourmet and Spa Factory have achieved expanded distribution that should
lead to better results this Christmas. We trimmed the portfolio's holding
in JAKKS but continue to maintain a small position.
Q. How was the Fund positioned as of October 31, 2009?
A. Last year we noted that while we were concerned about the short-term macro
environment, we believed lower commodity prices, unprecedented stimulus,
and attractive valuations would drive positive equity returns over the next
12 to 18 months. That belief was largely realized, although in a pattern
that was more tumultuous than we imagined. Today, stocks are far less
attractively priced than they were one year ago and, over the next 12 to 18
months, policy makers will begin the difficult task of withdrawing stimulus
against a backdrop of high secular unemployment, higher taxes, and
continuing consumer deleveraging. While we don't believe the US economy
will collapse during this process, we do believe that economic growth and
earnings growth will be modest. Thus, we are positioning the Fund with an
eye toward stocks that are less correlated with the broader market, as well
as firms that can prosper in a period of modest economic growth.
GROWTH OF A HYPOTHETICAL $10,000
INVESTMENT--CLASS N
(PERFORMANCE GRAPH)
River Road Small Cap Value Fund
River Road Morningstar(R)
Small Cap Russell 2000 Small Cap
Value Fund Value Index Value Category
---------- ------------ ---------------
Jun-05 10,000 10,000 10,000
Oct-05 10,280 10,050 10,123
Oct-06 13,460 12,352 11,808
Oct-07 14,553 12,605 12,464
Oct-08 9,821 8,755 8,332
Oct-09 10,803 8,927 9,267
All dividends and capital gains are reinvested. Indexes are unmanaged and do not
take into account fees, expenses or other costs.
Returns shown in the chart and table do not reflect taxes that a shareholder
would pay on Fund distributions or on the sale of the Fund shares.
Small-Cap and Mid-Cap Stocks may be subject to a higher degree of market risk
than the securities of more established companies because they tend to be more
volatile and less liquid.
Value investing involves the risk that a Fund's investing in companies believed
to be undervalued will not appreciate as anticipated.
RETURNS FOR PERIOD ENDED 10/31/09
Average Annual Total Returns - Class N
One Year 9.99%
Since Inception 1.79%
Inception Date 06/28/05
Average Annual Total Returns - Class I
One Year 10.31%
Since Inception -8.43%
Inception Date 12/13/06
THE PERFORMANCE DATA QUOTED REPRESENTS PAST PERFORMANCE. PAST PERFORMANCE DOES
NOT GUARANTEE FUTURE RESULTS. INVESTMENT RETURN AND PRINCIPAL VALUE WILL
FLUCTUATE SO THAT AN INVESTOR'S SHARES, UPON REDEMPTION, MAY BE WORTH MORE OR
LESS THAN THEIR ORIGINAL COST. CURRENT PERFORMANCE MAY BE HIGHER OR LOWER THAN
THE PERFORMANCE DATA QUOTED. FOR PERFORMANCE DATA CURRENT TO THE MOST RECENT
MONTH-END, PLEASE VISIT OUR WEBSITE AT www.astonfunds.com.
34
Aston Funds
RIVER ROAD SMALL CAP VALUE FUND OCTOBER 31, 2009
SCHEDULE OF INVESTMENTS
(PIE CHART)
CONSUMER DISCRETIONARY 27%
CONSUMER STAPLES 16%
FINANCIALS 14%
INDUSTRIALS 12%
HEALTH CARE 7%
INFORMATION TECHNOLOGY 6%
ENERGY 6%
MATERIALS 5%
CASH & NET OTHER ASSETS AND LIABILITIES 4%
UTILITIES 3%
% OF TOTAL NET ASSETS
MARKET
SHARES VALUE
---------- --------------
COMMON STOCKS - 95.59%
CONSUMER DISCRETIONARY - 26.75%
82,973 Bank (Jos. A.) Clothiers * ....................... $ 3,400,234
279,100 Big Lots * ....................................... 6,991,455
505,836 Brink's Home Security Holdings * ................. 15,670,799
606,350 CKX * ............................................ 3,880,640
339,566 Cracker Barrel Old Country Store ................. 11,256,613
144,121 Dollar Tree * .................................... 6,504,181
265,559 Dress Barn * ..................................... 4,793,340
616,208 Fred's, Class A .................................. 7,295,903
152,762 Frisch's Restaurants ............................. 3,582,269
177,174 Hampshire Group * (a) ............................ 531,522
380,860 Hillenbrand ...................................... 7,609,583
190,290 International Speedway, Class A .................. 4,854,298
271,296 JAKKS Pacific * .................................. 3,860,542
295,970 Lincoln Educational Services * ................... 5,866,125
645,588 Mac-Gray * ....................................... 5,248,630
210,680 Monarch Casino & Resort * ........................ 1,462,119
96,194 Nathan's Famous * ................................ 1,394,813
561,440 OfficeMax * ...................................... 6,417,259
205,488 Papa John's International * ...................... 4,623,480
284,817 PetMed Express ................................... 4,468,779
246,750 PetSmart ......................................... 5,806,027
462,325 Rent-A-Center * .................................. 8,488,287
223,883 UniFirst ......................................... 9,418,758
--------------
133,425,656
--------------
CONSUMER STAPLES - 15.95%
274,391 American Dairy * ................................. 7,940,876
605,519 Casey's General Stores ........................... 19,092,014
85,906 Coca-Cola Bottling ............................... 3,858,038
319,138 HQ Sustainable Maritime Industries * ............. 2,415,875
382,851 Industrias Bachoco, SP ADR (Mexico) .............. 8,698,375
91,883 J & J Snack Foods ................................ 3,599,057
295,816 National Beverage * .............................. 3,239,185
MARKET
SHARES VALUE
---------- --------------
CONSUMER STAPLES (CONTINUED)
639,341 Ruddick .......................................... $ 17,083,192
300,699 Village Super Market, Class A .................... 9,020,970
674,893 Zapata * ......................................... 4,609,519
--------------
79,557,101
--------------
ENERGY - 5.78%
112,110 Bristow Group * .................................. 3,268,006
216,852 Cal Dive International * ......................... 1,665,423
65,454 Eastern American Natural Gas Trust ............... 1,583,987
255,280 Encore Acquisition * ............................. 9,463,230
859,179 Evolution Petroleum * ............................ 2,929,800
338,450 Frontier Oil ..................................... 4,690,917
231,910 Provident Energy Trust ........................... 1,430,885
279,050 Rosetta Resources * .............................. 3,775,546
--------------
28,807,794
--------------
FINANCIALS - 14.52%
7,701 BancFirst ........................................ 278,083
286,050 BancorpSouth ..................................... 6,459,009
157,730 Bank of Hawaii ................................... 7,003,212
72,350 Dime Community Bancshares ........................ 795,126
48,745 First Citizens BancShares, Class A ............... 7,263,005
177,120 FirstService * ................................... 3,147,422
30,009 Gyrodyne Company of America REIT * ............... 1,245,373
523,150 Hilltop Holdings * ............................... 6,194,096
209,101 Max Capital Group ................................ 4,317,936
710,199 Medallion Financial .............................. 5,575,062
183,357 Navigators Group * ............................... 9,730,756
163,409 Oppenheimer Holdings, Class A .................... 4,166,929
215,650 UMB Financial .................................... 8,576,400
18,540 White Mountains Insurance Group .................. 5,736,461
68,020 Zenith National Insurance ........................ 1,940,611
--------------
72,429,481
--------------
HEALTH CARE - 6.78%
90,630 Air Methods * .................................... 2,767,840
317,966 Chindex International * .......................... 4,432,446
122,750 Ensign Group ..................................... 1,814,245
229,210 Kindred Healthcare * ............................. 3,369,387
274,370 Martek Biosciences * ............................. 4,927,685
55,940 National Healthcare .............................. 2,012,162
276,740 Res-Care * ....................................... 3,329,182
241,140 STERIS ........................................... 7,055,756
104,450 West Pharmaceutical Services ..................... 4,122,642
--------------
33,831,345
--------------
INDUSTRIALS - 12.21%
130,950 AMERCO * ......................................... 5,535,256
395,056 Brink's .......................................... 9,374,679
149,280 Copart * ......................................... 4,802,338
98,060 Cornell * ........................................ 2,239,690
167,000 Corporate Executive Board ........................ 4,009,670
494,920 Geo Group * ...................................... 10,467,558
299,153 Korn/Ferry International * ....................... 4,774,482
540,210 Pike Electric * .................................. 6,779,635
186,290 Sterling Construction * .......................... 3,004,858
239,673 Viad ............................................. 4,194,278
447,860 Volt Information Sciences * ...................... 3,632,145
512,944 WCA Waste * ...................................... 2,056,905
--------------
60,871,494
--------------
SEE ACCOMPANYING NOTES TO FINANCIAL STATEMENTS.
35
Aston Funds
RIVER ROAD SMALL CAP VALUE FUND OCTOBER 31, 2009
SCHEDULE OF INVESTMENTS - CONTINUED
MARKET
SHARES VALUE
---------- --------------
INFORMATION TECHNOLOGY - 5.87%
405,480 BigBand Networks * ............................... $ 1,500,276
67,179 Cass Information Systems ......................... 1,997,232
48,820 Computer Services (a) ............................ 1,745,315
362,980 Electro Rent ..................................... 3,887,516
140,230 Forrester Research * ............................. 3,552,026
382,783 Ingram Micro, Class A * .......................... 6,756,120
355,310 Ituran Location and Control ...................... 4,391,632
606,490 TeleCommunication Systems, Class A * ............. 5,422,021
--------------
29,252,138
--------------
MATERIALS - 5.10%
571,716 AptarGroup ....................................... 20,187,292
498,326 Glatfelter ....................................... 5,267,306
--------------
25,454,598
--------------
UTILITIES - 2.63%
83,430 Avista ........................................... 1,581,833
342,140 Portland General Electric ........................ 6,360,383
237,676 SJW .............................................. 5,174,207
--------------
13,116,423
--------------
TOTAL COMMON STOCKS
(Cost $453,355,465) ........................... 476,746,030
--------------
INVESTMENT COMPANY - 5.00%
24,936,205 BlackRock Liquidity Funds
TempCash Portfolio ............................ 24,936,205
--------------
TOTAL INVESTMENT COMPANY
(Cost $24,936,205) ............................ 24,936,205
--------------
TOTAL INVESTMENTS - 100.59%
(Cost $478,291,670)** ...................................... 501,682,235
--------------
NET OTHER ASSETS AND LIABILITIES - (0.59)% .................... (2,919,110)
--------------
NET ASSETS - 100.00% .......................................... $ 498,763,125
==============
----------
* Non-income producing security.
** Aggregate cost for Federal income tax purposes is $480,455,920.
Gross unrealized appreciation... $ 49,764,679
Gross unrealized depreciation... (28,538,364)
------------
Net unrealized appreciation..... $ 21,226,315
============
(a) These securities have been determined by the Adviser to be illiquid
securities. At October 31, 2009, these securities amounted to $2,276,837 or
0.46% of net assets.
REIT Real Estate Investment Trust
SP ADR Sponsored American Depositary Receipt
SEE ACCOMPANYING NOTES TO FINANCIAL STATEMENTS.
36
Aston Funds
NEPTUNE INTERNATIONAL FUND
PORTFOLIO MANAGER COMMENTARY (UNAUDITED) OCTOBER 31, 2009
Robin Geffen
Q. What were the most significant market factors affecting Fund performance
and returns relative to the benchmark during the past 12 months?
A. After a volatile start to the period, global markets hit their lows during
the first quarter of 2009 and began to make significant gains in response
to a number of catalysts, including the impact of fiscal stimulus and
aggressive monetary policies.
While these catalysts were positive in many respects, the Fund adopted a
cautious approach to the recovery in equity markets while we assessed the
stability of the Financials sector. We began to invest the portfolio's
defensive cash weighting at the beginning of May, reflecting our view that
the banking system losses had largely been factored into prices and the
global economy's rate of decline had reached its peak. That cautious
approach and the timing of the reinvestment of cash cost the Fund some
performance. However, given the volatility experienced across global
markets over the past year, we felt this careful approach warranted.
The savage de-rating of Emerging Markets during the final months of 2008,
also negatively affected the performance of the Fund. While disappointing,
our belief in the potential for Emerging Markets remains unshaken and we
maintained the portfolio's high weightings into 2009. This has proven
beneficial with Emerging Markets thus far significantly outperformed
developed markets.
Q. What were the best performing holdings for the Fund during the period?
A. Within Emerging Markets, some of the Fund's best performing stocks were
long-term plays on the Chinese consumer theme, in particular Chinese
Internet stocks. The Internet penetration level in China remains very
low--just over 20% compared with nearly 80% in the US--and as penetration
levels increase, the potential growth of these internet companies is
immense on top of very good profits made in the portfolio's holdings to
date.
With the recovery of the price of oil in 2009, the Fund also benefited from
its exposure to Energy. Positions in bellwether energy stocks, such as
Gazprom, Rosneft Oil and PetroChina were central to generating performance,
as was an overweight stance in Materials. In addition, Russian stocks--both
in Energy and Consumer names such as Wimm-Bill-Dann Foods and X5 Retail
Group--have performed well during 2009. We also increased exposure to
select Financials, buying banks such as HSBC Holdings and Standard
Chartered to good effect.
Q. What were the weakest performing holdings?
A. As risk appetites increased at the start of the year, the market turned its
collective back on traditionally defensive areas like Healthcare and
Consumer Staples. Holdings in British American Tobacco and pharmaceutical
stocks Roche Holding and AstraZeneca were negative contributors to
performance. In September, Japan's newly elected government announced
surprising measures that will put some cash back in the Japanese consumer's
pockets at the cost, in our opinion, of the Japanese multinational
companies that we had been favoring.
Q. How was the Fund positioned as of October 31, 2009?
A. Utilizing a combination of Neptune's in-house global sector research and
rigorous bottom-up stockpicking, the Fund is fully invested and in a strong
position to take advantage of further potential upside. In the medium term,
we anticipate a low growth environment among developed countries with
difficult operating conditions. Therefore, the Fund remains invested in
high-quality stocks able to weather these conditions.
We continue to believe that Emerging Markets will play an increasingly
central role in the global economy. Indeed, we believe that over the coming
years they will provide greater investment returns compared with their
developed market peers due to the extensive growth potential available.
GROWTH OF A HYPOTHETICAL
$10,000 INVESTMENT--CLASS I
(PERFORMANCE GRAPH)
Neptune International Fund
Neptune MSCI EAFE & Moringstar
International Emerging Foreign Large
Fund - Class I Markets Growth Category
-------------- ----------- ---------------
Aug-07 10,000 10,000 10,000
Oct-07 12,230 11,019 11,239
Oct-08 5,925 5,649 5,641
Oct-09 7,242 7,597 7,277
All dividends and capital gains are reinvested. Indexes are unmanaged and do not
take into account fees, expenses or other costs.
Returns shown in the chart and table do not reflect taxes that a shareholder
would pay on Fund distributions or on the sale of the Fund shares.
Investments made in securities of foreign companies may be less liquid and may
fluctuate more widely than those traded in U.S. markets.
Emerging market securities may be subject to additional risks such as price
volatility, currency fluctuation, financial reporting requirements as well as
political and economic instability.
RETURNS FOR PERIOD ENDED 10/31/09
Average Annual Total Returns - Class N
One Year 21.94%
Since Inception -27.68%
Inception Date 06/17/08
Average Annual Total Returns - Class I
One Year 22.23%
Since Inception -13.39%
Inception Date 08/06/07
THE PERFORMANCE DATA QUOTED REPRESENTS PAST PERFORMANCE. PAST PERFORMANCE DOES
NOT GUARANTEE FUTURE RESULTS. INVESTMENT RETURN AND PRINCIPAL VALUE WILL
FLUCTUATE SO THAT AN INVESTOR'S SHARES, UPON REDEMPTION, MAY BE WORTH MORE OR
LESS THAN THEIR ORIGINAL COST. CURRENT PERFORMANCE MAY BE HIGHER OR LOWER THAN
THE PERFORMANCE DATA QUOTED. FOR PERFORMANCE DATA CURRENT TO THE MOST RECENT
MONTH-END, PLEASE VISIT OUR WEBSITE AT www.astonfunds.com.
THE PERFORMANCE QUOTED WOULD HAVE BEEN LOWER IF WAIVERS HAD NOT BEEN IN EFFECT.
37
Aston Funds
NEPTUNE INTERNATIONAL FUND OCTOBER 31, 2009
SCHEDULE OF INVESTMENTS
(PIE CHART)
CONSUMER STAPLES 21%
ENERGY 18%
FINANCIALS 16%
MATERIALS 14%
INFORMATION TECHNOLOGY 8%
HEALTH CARE 7%
TELECOMMUNICATION SERVICES 6%
INDUSTRIALS 5%
CONSUMER DISCRETIONARY 4%
CASH & NET OTHER ASSETS AND LIABILITIES 1%
% OF TOTAL NET ASSETS
MARKET
SHARES VALUE
--------- --------------
COMMON STOCKS - 99.15%
AUSTRALIA - 1.65%
5,000 Foster's Group (a) ................................ $ 24,521
--------------
BRAZIL - 3.11%
1,000 Petroleo Brasileiro, ADR .......................... 46,220
--------------
CHINA - 28.49%
200 Baidu, SP ADR * ................................... 75,584
45,000 Bank of China (a) ................................. 26,104
35,000 China Construction Bank (a) ....................... 30,175
10,000 China Life Insurance (a) .......................... 45,978
5,000 China Mobile (a) .................................. 46,872
25,000 China Oilfield Services (a) ....................... 27,013
20,000 China South Locomotive and Rolling Stock (a) ...... 11,091
25,000 CNOOC (a) ......................................... 37,441
20,000 Mandarin Oriental International ................... 25,400
35,000 PetroChina (a) .................................... 42,115
20,000 Shangri-La Asia (a) ............................... 38,469
1,000 Tencent Holdings (a) .............................. 17,413
--------------
423,655
--------------
ITALY - 1.67%
1,000 Eni (a) ........................................... 24,767
--------------
JAPAN - 3.23%
1,000 Komatsu (a) ....................................... 19,495
5,000 Toray Industries (a) .............................. 28,484
--------------
47,979
--------------
LUXEMBOURG - 0.82%
500 Evraz Group, GDR * (a) ............................ 12,115
--------------
NETHERLANDS - 3.97%
1,000 Akzo Nobel (a) .................................... 59,044
--------------
NORWAY - 2.22%
1,000 Yara International (a) ............................ 33,057
--------------
MARKET
SHARES VALUE
--------- --------------
RUSSIA - 17.99%
1,000 Gazprom, SP ADR ................................... $ 23,630
500 LUKOIL, SP ADR .................................... 28,605
2,000 Mining and Metallurgical Company Norilsk
Nickel, ADR * .................................. 25,640
500 Mobile TeleSystems, SP ADR ........................ 22,650
2,000 Polyus Gold, SP ADR ............................... 53,340
5,000 Rosneft Oil, GDR (a) .............................. 38,019
1,000 Vimpel-Communications, SP ADR * ................... 17,930
500 Wimm-Bill-Dann Foods, ADR * ....................... 33,790
1,000 X 5 Retail Group, GDR * (a) ....................... 23,885
--------------
267,489
--------------
SWITZERLAND - 3.81%
250 Roche Holding (a) ................................. 40,041
1,000 UBS (a) ........................................... 16,675
--------------
56,716
--------------
TAIWAN - 1.28%
2,000 Taiwan Semiconductor Manufacturing, SP ADR ........ 19,080
--------------
UNITED KINGDOM - 30.91%
1,000 AstraZeneca (a) ................................... 44,892
1,000 British American Tobacco PLC (a) .................. 31,866
5,000 Diageo (a) ........................................ 81,440
1,000 GlaxoSmithKline (a) ............................... 20,513
3,000 HSBC Holdings PLC (a) ............................. 33,147
5,000 ICAP (a) .......................................... 33,231
1,000 Imperial Tobacco Group (a) ........................ 29,469
5,000 Rolls-Royce Group PLC (a) ......................... 36,874
300,000 Rolls-Royce Group PLC, C Shares * (a) (b) ......... 492
1,500 Standard Chartered PLC (a) ........................ 36,798
5,000 Tesco PLC (a) ..................................... 33,339
3,000 Tullett Prebon PLC (a) ............................ 17,805
2,000 Unilever (a) ...................................... 59,752
--------------
459,618
--------------
TOTAL COMMON STOCKS
(Cost $1,758,018) .............................. 1,474,261
--------------
TOTAL INVESTMENTS - 99.15%
(Cost $1,758,018)** ........................................ 1,474,261
--------------
NET OTHER ASSETS AND LIABILITIES - 0.85% ...................... 12,589
--------------
NET ASSETS - 100.00% .......................................... $ 1,486,850
==============
----------
* Non-income producing security.
** Aggregate cost for Federal income tax purposes is $1,758,018.
Gross unrealized appreciation .... $ 85,737
Gross unrealized depreciation .... (369,494)
---------
Net unrealized depreciation ...... $(283,757)
=========
(a) Securities with a total aggregate market value of $1,102,392 or 74.14% of
the net assets, were valued under the fair value procedures established by
the Funds' Board of Trustees.
(b) This security has been determined by the Adviser to be an illiquid
security. At October 31, 2009, this security amounted to $492 or 0.03% of
net assets.
ADR American Depositary Receipt
GDR Global Depositary Receipt
SP ADR Sponsored American Depositary Receipt
SEE ACCOMPANYING NOTES TO FINANCIAL STATEMENTS.
38
Aston Funds
BARINGS INTERNATIONAL FUND
PORTFOLIO MANAGER COMMENTARY (UNAUDITED) OCTOBER 31, 2009
David Bertocchi, CFA
Q. What were the most significant market factors affecting Fund performance
and returns relative to the benchmark during the past 12 months?
A. The past 12 months have been a period of extreme volatility for
International Equity markets, with several substantial macro economic
factors affecting both absolute and relative performance. The Fund's total
return during the period was more than 27% in US Dollar terms,
approximately 2% ahead of the benchmark. During the November to March
period, relative performance was very strong. The focus on cash generative
and stable growth companies at the expense of those with cyclical exposure,
as well as banks, helped performance as the developing financial crisis
caused economic growth to collapse around the world. Following the lows of
March, relative performance suffered as Western banks and Industrial
companies with high leverage to a recovery rallied strongly in anticipation
of improved fundamentals. Relative performance turned positive once more
from the end of August as companies with strong growth prospects were
rewarded. In addition, the aggressively expansionary fiscal and monetary
policies pursued by the U.S. government and the Fed helped push gold prices
to all-time highs, boosting the gold miners held in the Fund.
Q. What were the best performing holdings for the Fund during the period?
A. The Materials sector provided the best performing holdings during the
period. In particular, gold miners Petropavlovsk (previously Peter Hambro
Mining), Randgold Resources, and Lihir Gold (no longer held) all rose
strongly, driven by record gold prices. Both have strong production
profiles in coming years and so are not entirely dependent on the outlook
for the price of gold. Diversified miner Xstrata was also a very strong
performer, rising more than 150% from purchase in December 2008 as base
metal prices recovered due to strong demand from China. In addition,
Canadian based oil and gas explorer Niko Resources performed well, as
production began at its giant gas field and it continued to enjoy
exploration success in the region.
Q. What were the weakest performing holdings?
A. The worst performing stock was Genmab, the Danish biotechnology company.
Despite gaining approvals for some indications of their key cancer drug,
poor design of other key tests have substantially delayed development and
revenues, leading us to sell the stock. Emaar Properties, a UAE property
developer, was also a weak performer as the financial crisis sent Dubai
into oversupply. Nintendo performed poorly, and was sold, as software sales
failed to offset anticipated lower console sales. We sold Stagecoach Group,
as the outlook deteriorated due to lower passenger volumes and a more
difficult regulatory environment. German medical technology company
Fresenius underperformed owing to what we believe was due to a rotation
towards cyclical stocks and the Fund retained the holding, which has
performed well in recent weeks.
Q. How was the Fund positioned as of October 31, 2009?
A. Our expectation for Western economies is for lower growth over the coming
years relative to the past decade. Households remain highly indebted, while
populations are aging. Because of these headwinds we remain significantly
underweight the Consumer Discretionary sector. At the same time, we believe
companies able to deliver strong top-line growth will outperform in a
slower economic environment. Growth stocks have been overlooked during the
course of 2009 and offer significant value relative to history and the
broader market, and so we are increasing our weighting to secular growth
companies. The offset of the subdued economic growth is that fiscal and
monetary conditions are set to remain extremely loose for some time to
come. In this environment, "real assets" with limited supply, such as gold,
metals and oil should continue to inflate as creditors seek higher returns.
As a result, we retain significant overweight positions in the Materials
and Energy sectors. Finally, the combination of stronger economic growth
and lower debt levels lead us to favor Asian and Emerging Market financials
over Western and Japanese counterparts.
GROWTH OF A HYPOTHETICAL
$10,000 INVESTMENT--CLASS I
(PERFORMANCE GRAPH)
Barings International Fund
Neptune MSCI EAFE & Moringstar
International Emerging Foreign Large
Fund - Class I Markets Growth Category
-------------- ----------- ---------------
Nov-07 10,000 10,000 10,000
Apr-08 9,040 9,078 8,968
Oct-08 5,080 5,337 5,234
Apr-09 5,166 5,196 5,062
Oct-09 6,457 6,816 6,540
All dividends and capital gains are reinvested. Indexes are unmanaged and do not
take into account fees, expenses or other costs.
Returns shown in the chart and table do not reflect taxes that a shareholder
would pay on Fund distributions or on the sale of the Fund shares.
Investments made in securities of foreign companies may be less liquid and may
fluctuate more widely than those traded in U.S. markets.
Emerging market securities may be subject to additional risks such as price
volatility, currency fluctuation, financial reporting requirements as well as
political and economic instability.
RETURNS FOR PERIOD ENDED 10/31/09
Average Annual Total Returns - Class I
One Year 27.11%
Since Inception -19.64%
Inception Date 11/02/07
THE PERFORMANCE DATA QUOTED REPRESENTS PAST PERFORMANCE. PAST PERFORMANCE DOES
NOT GUARANTEE FUTURE RESULTS. INVESTMENT RETURN AND PRINCIPAL VALUE WILL
FLUCTUATE SO THAT AN INVESTOR'S SHARES, UPON REDEMPTION, MAY BE WORTH MORE OR
LESS THAN THEIR ORIGINAL COST. CURRENT PERFORMANCE MAY BE HIGHER OR LOWER THAN
THE PERFORMANCE DATA QUOTED. FOR PERFORMANCE DATA CURRENT TO THE MOST RECENT
MONTH-END, PLEASE VISIT OUR WEBSITE AT www.astonfunds.com.
THE TOTAL EXPENSE RATIO FOR THE I CLASS IS 3.36%, AS DISCLOSED IN THE PROSPECTUS
DATED MARCH 1, 2009. THE PERFORMANCE QUOTED WOULD HAVE BEEN LOWER IF WAIVERS HAD
NOT BEEN IN EFFECT. PLEASE REFER TO THE FINANCIAL HIGHLIGHTS SECTION IN THIS
REPORT FOR MORE 2009 FISCAL YEAR END RELATED INFORMATION.
39
Aston Funds
BARINGS INTERNATIONAL FUND OCTOBER 31, 2009
SCHEDULE OF INVESTMENTS
(PIE CHART)
FINANCIALS 24%
MATERIALS 17%
ENERGY 12%
INDUSTRIALS 12%
HEALTH CARE 8%
TELECOMMUNICATION SERVICES 8%
CONSUMER STAPLES 7%
INFORMATION TECHNOLOGY 5%
CASH & NET OTHER ASSETS AND LIABILITIES 2%
EXCHANGE TRADED FUND 2%
UTILITIES 2%
CONSUMER DISCRETIONARY 1%
% OF TOTAL NET ASSETS
MARKET
SHARES VALUE
--------- --------------
COMMON STOCKS - 95.60%
AUSTRALIA - 3.55%
275,144 Centamin Egypt * (a) .............................. $ 548,461
8,216 Rio Tinto (a) ..................................... 455,419
--------------
1,003,880
--------------
BELGIUM - 1.86%
11,229 Anheuser-Busch InBev (a) .......................... 527,203
--------------
BRAZIL - 4.44%
24,313 Itau Unibanco Banco Multiplo, ADR ................. 465,351
9,180 Petroleo Brasileiro, ADR .......................... 424,300
24,900 Redecard .......................................... 365,528
--------------
1,255,179
--------------
CANADA - 1.62%
5,655 Niko Resources .................................... 457,814
--------------
CHINA - 1.40%
184,000 China National Building Material (a) .............. 395,057
--------------
FRANCE - 5.74%
6,437 BNP Paribas (a) ................................... 484,941
4,368 Compagnie de Saint-Gobain (a) ..................... 212,851
21,519 Suez Environnement (a) ............................ 478,207
7,477 Total (a) ......................................... 447,426
--------------
1,623,425
--------------
GERMANY - 9.27%
7,045 Bayer (a) ......................................... 488,785
5,227 Deutsche Boerse (a) ............................... 423,348
30,420 Deutsche Telekom (a) .............................. 415,701
7,737 Fresenius (a) ..................................... 449,480
7,363 K+S (a) ........................................... 401,921
2,787 Muenchener Rueckversicherungs-Gesellschaft (a) .... 440,939
--------------
2,620,174
--------------
MARKET
SHARES VALUE
--------- --------------
HONG KONG - 3.85%
248,500 BOC Hong Kong Holdings (a) ........................ $ 572,018
34,000 Sun Hung Kai Properties (a) ....................... 515,117
--------------
1,087,135
--------------
JAPAN - 14.72%
6,100 East Japan Railway (a) ............................ 390,637
42,000 Hitachi Metals (a) ................................ 400,709
11,400 Kurita Water Industries (a) ....................... 348,656
32,400 Mitsui (a) ........................................ 425,508
6,300 Nidec (a) ......................................... 531,926
62,700 Nomura Holdings (a) ............................... 441,924
246 NTT DoCoMo (a) .................................... 356,765
9,100 Secom (a) ......................................... 424,584
7,400 Shin-Etsu Chemical (a) ............................ 392,432
4,700 UniCharm (a) ...................................... 450,421
--------------
4,163,562
--------------
NETHERLANDS - 6.13%
5,853 Akzo Nobel (a) .................................... 345,587
29,693 Koninklijke (Royal) (a) ........................... 538,593
5,700 Koninklijke Vopak * (a) ........................... 384,563
15,052 Unilever (a) ...................................... 463,798
--------------
1,732,541
--------------
NORWAY - 1.55%
13,259 Yara International (a) ............................ 438,304
--------------
PAGUA NEW GUINEA - 1.54%
84,143 Oil Search (a) .................................... 436,395
--------------
RUSSIA - 1.77%
21,224 Gazprom, SP ADR ................................... 501,523
--------------
SINGAPORE - 1.56%
48,000 DBS Group Holdings (a) ............................ 439,563
--------------
SPAIN - 3.28%
27,262 Banco Santander (a) ............................... 438,707
17,547 Telefonica (a) .................................... 490,026
--------------
928,733
--------------
SWITZERLAND - 8.34%
7,465 Actelion * (a) .................................... 411,493
11,298 Julius Baer Group ................................. 425,313
3,858 Lonza Group (a) ................................... 300,004
1,629 Syngenta (a) ...................................... 385,717
24,315 UBS * (a) ......................................... 405,446
1,875 Zurich Financial Services (a) ..................... 429,361
--------------
2,357,334
--------------
UNITED KINGDOM - 24.98%
23,478 Admiral Group (a) ................................. 394,661
18,842 Autonomy * (a) .................................... 414,274
23,996 BG Group (a) ...................................... 413,051
222,500 BT Group (a) ...................................... 476,808
17,500 Capita Group (a) .................................. 218,569
17,579 Dana Petroleum * (a) .............................. 367,792
25,673 De La Rue (a) ..................................... 384,514
45,600 HSBC Holdings (a) ................................. 503,550
35,454 Petropavlovsk * (a) ............................... 608,833
50,138 Prudential (a) .................................... 455,424
8,521 Reckitt Benckiser Group (a) ....................... 423,280
59,003 Rolls-Royce Group (a) ............................. 435,137
3,540,180 Rolls-Royce Group, C Shares * (a) (b) ............. 5,810
27,325 Shire (a) ......................................... 483,262
SEE ACCOMPANYING NOTES TO FINANCIAL STATEMENTS.
40
Aston Funds
BARINGS INTERNATIONAL FUND OCTOBER 31, 2009
SCHEDULE OF INVESTMENTS - CONTINUED
MARKET
SHARES VALUE
--------- --------------
UNITED KINGDOM (CONTINUED)
103,441 Tui Travel (a) .................................... $ 394,139
18,400 Tullow Oil (a) .................................... 356,445
14,626 Wolseley * (a) .................................... 295,855
30,064 Xstrata * (a) ..................................... 433,029
--------------
7,064,433
--------------
TOTAL COMMON STOCKS
(Cost $22,712,766) ............................. 27,032,255
--------------
EXCHANGE TRADED FUND - 2.49%
UNITED STATES - 2.49%
13,200 iShares MSCI EAFE Index Fund ...................... 703,560
--------------
TOTAL EXCHANGE TRADED FUND
(Cost $715,003) ................................ 703,560
--------------
INVESTMENT COMPANY - 1.48%
419,474 BlackRock Liquidity Funds TempCash Portfolio ...... 419,474
--------------
TOTAL INVESTMENT COMPANY
(Cost $419,474) ................................ 419,474
--------------
TOTAL INVESTMENTS - 99.57%
(Cost $23,847,243)** ....................................... 28,155,289
--------------
NET OTHER ASSETS AND LIABILITIES - 0.43% ...................... 121,403
--------------
NET ASSETS - 100.00% .......................................... $ 28,276,692
==============
----------
* Non-income producing security.
** Aggregate cost for Federal income tax purposes is $24,695,882.
Gross unrealized appreciation ... $4,288,988
Gross unrealized depreciation ... (829,581)
----------
Net unrealized appreciation ..... $3,459,407
==========
(a) Securities with a total aggregate market value of $24,392,426 or 86.26% of
the net assets, were valued under the fair value procedures established by
the Funds' Board of Trustees.
(b) This security has been determined by the Adviser to be an illiquid
security. At October 31, 2009, this security amounted to $5,810 or 0.02% of
net assets.
ADR American Depositary Receipt
EAFE Europe, Australasia, and Far East
MSCI Morgan Stanley Capital International
SP ADR Sponsored American Depositary Receipt
SEE ACCOMPANYING NOTES TO FINANCIAL STATEMENTS.
41
Aston Funds
DYNAMIC ALLOCATION FUND
PORTFOLIO MANAGERS COMMENTARY (UNAUDITED) OCTOBER 31, 2009
(Formerly the Smart Portfolios Fund) Bryce James, Shawn Bird & John Rosenthal
Q. What were the most significant market factors affecting Fund performance
and returns relative to the benchmark during the past 12 months?
A. The global economic crisis of the past 12 months affected all segments of
the global market, but not all identically. The crisis fits the definition
of an extreme or "fat tail" market event, the sort of event that the Fund's
investment model is designed to monitor and forecast. Our strategy seeks to
dynamically reallocate investments to different areas of the overall market
when and where it forecasts best risk-adjusted returns and change its
degree of conservatism or aggressiveness. The Fund was down 4.4% for the
first four months of the period and up 16.7% for the next eight compared
with a composite Index of domestic equity, fixed income, and foreign equity
that was down 14.4% and up 27.9%, respectively. The Fund was down 30% as
much as the index in the first four months and up 60% as much as the index
in the last eight months. That difference--half the participation in a
negative market than in a positive market--reflects the strategy's design
and objectives. Overall, the Fund's increase of 13% equaled 90% of the
Index's 14.4% return, but with significantly less volatility and was
achieved while having had, on average, 63% of the portfolio invested
defensively in cash and a 1-3 year Treasury ETF.
The Fund's year can be summarized by its average allocations, by category
and by period (first four and last eight months). Foreign equities
represented 9% of assets during the first four months, and 15% during the
last eight; broad domestic equities 6% and 10% respectively;
sector-specific equities 3% and 6%; fixed-income (other than the 1-3 year
Treasury ETF) 2% and 4%; non-Energy-related commodities 1% and 4%; Real
Estate 5% during both periods; and Energy-related (equity plus commodity)
less than 1% in both periods. All categories contributed positively for the
full year except energy-related.
Q. What were the best performing holdings for the Fund during the period?
A. International Equities were the strongest performers by a wide margin led
by Brazil, iShares MSCI Brazil Index fund EWZ (no longer held), South
Korea, and broad Latin America. Non-energy commodities came next, led by
the Powershares DB Silver Fund (DBS) and base metals. Some broad domestic
equities did well and others poorly, led by two value-oriented ETFs, the
iShares Russell 2000(R) Value Index Fund (IWN) and the iShares S&P Small
Cap 600 Value Index Fund (IJS), and by a growth fund, the iShares
Morningstar Mid Growth Index Fund (JKH). Sector-specific equity and other
fixed-income were other contributing categories.
Q. What were the weakest performing holdings?
A. The energy-related category, combining commodity ETFs and energy industry
stock ETFs, were major negative contributors during the past twelve months.
Q. How was the Fund positioned as of October 31, 2009?
A. As of October 31, 2009, the Fund was still positioned cautiously, with 36%
of assets in cash and 1-3 year Treasuries. Relatively high caution was
still called for by the investment model's own analysis and by the degree
of market choppiness seen in recent weeks. Roughly 18% remained invested in
broad Domestic Equities, 17% in International Equities, 10% in Commodities,
8% in sector-specific equities, 7% in other fixed-income, and 2% in Real
Estate.
GROWTH OF A HYPOTHETICAL
$10,000 INVESTMENT--CLASS N
(PERFORMANCE GRAPH)
Dynamic Allocation Fund
35% Russell
3000, 35%
MSCI World Barclays
Ex US, 30% Capital
Dynamic Barclays MSCI U.S. Morningstar
Allocation Capital U.S. Russell World Aggregate Conservative
Fund - Aggregate 3000 Ex US Bond Allocation
Class N Bond Index Index Index Index Category
---------- ------------ ------- ------ --------- ------------
Jan-08 10,000 10,000 10,000 10,000 10,000 10,000
Apr-08 9,990 9,770 9,019 9,635 10,408 9,799
Oct-08 8,302 7,141 6,340 5,471 10,031 8,175
Apr-09 8,336 7,082 5,867 5,341 10,807 8,276
Oct-09 9,379 8,442 7,027 6,993 11,413 9,468
All dividends and capital gains are reinvested. Indexes are unmanaged and do not
take into account fees, expenses or other costs.
Returns shown in the chart and table do not reflect taxes that a shareholder
would pay on Fund distributions or on the sale of the Fund shares.
Investments in ETFs are subject to higher costs than investing directly in the
underlying security. There are also certain investment limitations with fund of
funds.
RETURNS FOR PERIOD ENDED 10/31/09
Average Annual Total Returns - Class N
One Year 12.98%
Since Inception -3.48%
Inception Date 01/10/08
THE PERFORMANCE DATA QUOTED REPRESENTS PAST PERFORMANCE. PAST PERFORMANCE DOES
NOT GUARANTEE FUTURE RESULTS. INVESTMENT RETURN AND PRINCIPAL VALUE WILL
FLUCTUATE SO THAT AN INVESTOR'S SHARES, UPON REDEMPTION, MAY BE WORTH MORE OR
LESS THAN THEIR ORIGINAL COST. CURRENT PERFORMANCE MAY BE HIGHER OR LOWER THAN
THE PERFORMANCE DATA QUOTED. FOR PERFORMANCE DATA CURRENT TO THE MOST RECENT
MONTH-END, PLEASE VISIT OUR WEBSITE AT www.astonfunds.com.
THE TOTAL EXPENSE RATIO FOR THE N CLASS IS 3.79%, AS DISCLOSED IN THE PROSPECTUS
DATED MARCH 1, 2009. THE PERFORMANCE QUOTED WOULD HAVE BEEN LOWER IF WAIVERS HAD
NOT BEEN IN EFFECT. PLEASE REFER TO THE FINANCIAL HIGHLIGHTS SECTION IN THIS
REPORT FOR MORE 2009 FISCAL YEAR END RELATED INFORMATION.
42
Aston Funds
DYNAMIC ALLOCATION FUND OCTOBER 31, 2009
SCHEDULE OF INVESTMENTS
(PIE CHART)
DOMESTIC FIXED INCOME 43%
DOMESTIC EQUITIES 26%
INTERNATIONAL EQUITIES 17%
COMMODITIES 10%
REAL ESTATE 2%
CASH & NET OTHER ASSETS AND LIABILITIES 2%
% OF TOTAL NET ASSETS
MARKET
SHARES VALUE
--------- --------------
EXCHANGE TRADED FUNDS - 97.54%
COMMODITIES - 9.89%
20,087 iPATH Dow Jones-UBS Commodity Index Total
Return ETN * ................................... $ 801,672
31,233 PowerShares DB Agriculture Fund * ................. 798,628
32,593 PowerShares DB Commodity Index Tracking Fund * .... 768,706
21,337 PowerShares DB Precious Metals Fund * ............. 770,692
25,260 PowerShares DB Silver Fund * ...................... 737,845
--------------
3,877,543
--------------
DOMESTIC EQUITIES - 26.29%
24,321 Ishares Dow Jones US Basic Materials Sector
Index Fund ..................................... 1,284,635
14,028 iShares Russell 2000 Value Index Fund ............. 741,660
44,346 iShares Russell Midcap Value Index Fund ........... 1,491,799
18,851 iShares S&P MidCap 400 Value Index Fund ........... 1,119,372
14,131 iShares S&P SmallCap 600 Value Index Fund ......... 745,128
15,657 Midcap SPDR Trust Series 1 ........................ 1,871,638
53,914 Utilities Select Sector SPDR Fund ................. 1,530,619
15,321 Vanguard Health Care ETF .......................... 763,139
15,966 Vanguard Industrials ETF .......................... 753,116
--------------
10,301,106
--------------
DOMESTIC FIXED INCOME - 42.71%
166,146 iShares Barclays 1-3 Year Treasury Bond Fund ...... 13,966,233
7,735 iShares Barclays Aggregate Bond Fund .............. 810,705
18,572 iShares iBoxx $ Investment Grade Corporate
Bond Fund ...................................... 1,962,689
--------------
16,739,627
--------------
MARKET
SHARES VALUE
--------- --------------
INTERNATIONAL EQUITIES - 16.69%
44,941 iShares FTSE/Xinhua China 25 Index Fund ........... $ 1,874,489
77,123 iShares MSCI Canada Index Fund .................... 1,839,384
21,546 iShares MSCI EAFE Index Fund ...................... 1,148,402
22,005 iSHares MSCI South Korea Index Fund ............... 943,574
17,050 iShares S&P Latin America 40 Index Fund ........... 734,344
--------------
6,540,193
--------------
REAL ESTATE - 1.96%
16,639 iShares Cohen & Steers Realty Majors Index Fund ... 769,055
--------------
TOTAL EXCHANGE TRADED FUNDS
(Cost $38,101,698) ............................. 38,227,524
--------------
INVESTMENT COMPANY - 2.08%
816,012 BlackRock Liquidity Funds TempCash Portfolio ...... 816,012
--------------
TOTAL INVESTMENT COMPANY
(Cost $816,012) ................................ 816,012
--------------
TOTAL INVESTMENTS - 99.62%
(Cost $38,917,710)** ....................................... 39,043,536
--------------
NET OTHER ASSETS AND LIABILITIES - 0.38% ...................... 147,081
--------------
NET ASSETS - 100.00% .......................................... $ 39,190,617
==============
----------
* Non-income producing security.
** Aggregate cost for Federal income tax purposes is $38,966,418.
Gross unrealized appreciation .. $ 777,599
Gross unrealized depreciation .. (700,481)
---------
Net unrealized appreciation .... $ 77,118
=========
DB Deutsche Bank
EAFE Europe, Australasia, and Far East
ETF Exchange-Traded Fund
ETN Exchange-Traded Note
FTSE Financial Times Stock Exchange
MSCI Morgan Stanley Capital International
S&P Standard & Poor
SPDR Standard & Poor's Depositary Receipt
SEE ACCOMPANYING NOTES TO FINANCIAL STATEMENTS.
43
Aston Funds
NEW CENTURY ABSOLUTE RETURN ETF FUND
PORTFOLIO MANAGER COMMENTARY (UNAUDITED) OCTOBER 31, 2009
Jim R. Porter
Q. What were the most significant factors affecting Fund performance from
November 1, 2008 through October 31, 2009?
A. During the last year, the most significant factor has been the sharp market
decline from the end of 2008 through the first two months of 2009 that
turned into a strong market advance which lasted for the remainder of the
period. In order to deal with such a move, the strategy had to rotate from
being aggressively defensive to being aggressively offensive. That
transition had to be performed amid a highly volatile market, both during
the decline and the advance. The most difficult period to compete against a
benchmark, which by definition is fully invested, is during such transition
periods, and the Fund lagged during those periods.
Q. What were the best-performing holdings for the Fund during the period?
A. In evaluating the best-performing holdings during the period, it is
necessary to break the period into two parts, the decline and the advance.
The major advantage of exchange traded funds ("ETFs") is the ability to
invest in a variety of asset classes at various times in an economic cycle.
During the decline, our best performing holdings were the various Treasury
bond ETFs. The strategy held the T-Bill, the 1-3 year, the 3-5 year, 7-10
year, and the 20+ year T-bond ETFs. Large cash positions also enhanced
returns relative to the benchmark, but the most effective offensive part of
the strategy during the decline were hedging positions using inverse ETFs
to capitalize on a market decline.
As the market rebounded beginning in early March, leadership totally
changed initially to Domestic Equities. As the market advance continued,
our systems began to favor International Equities along with Domestic
Equities. Favored among those were the Emerging Market ETFs and various
regions such the Pacific Basin without Japan, Latin America, and some
specific countries such as China, Brazil, and Australia. Over a number of
weeks ETFs beyond the broad indices were added in a variety of narrower
sectors and industries such as Basic Materials, Transportation,
Pharmaceuticals, Biotech, Software, and Technology. In addition, the
strategy invested in Foreign Currencies and Commodities, notably the
Australian Dollar and industrial materials, as the US Dollar continued its
decline that began in February of 2009.
Q. What were the weakest-performing holdings?
A. The weakest holdings were the sector ETFs that were the better performers
at the beginning of the market recovery. Those became stagnate as the
advance continued and leading indicators became more confusing or
disappointing. Those sectors included Telecommunication, Real Estate,
Financial, and Consumer ETFs, which were ultimately removed from the
portfolio after the initial enthusiasm faded into mediocre performance.
Q. How was the portfolio positioned as of October 31, 2009?
A. At the end of October, the portfolio held the smallest cash positions of
the eight month period following the market bottom. Domestically, the
portfolio held mostly Equity ETFs, with no Fixed Income ETFs. The
International Equity segment held the largest position it has held
historically at just over 25% of assets. The growing number of
International ETFs available has made it possible to structure such a
global posture. The portfolio is weighted toward the growth style with a
distribution across the large-, mid-, and small-capitalization segments.
Large-cap equities are just over 50% of the Domestic Equity weighting, and
every element of the style grid is represented by no less than 4% of an
allocation. The portfolio has 2% real estate, 2% natural resources, one
foreign currency at 2%, and although the portfolio frequently has
commodities, there were none in the portfolio at the end of the period.
GROWTH OF A HYPOTHETICAL
$10,000 INVESTMENT--CLASS N
(PERFORMANCE GRAPH)
New Century Absolute Return ETF Fund
New Century Morningstar
Absolute Russell Moderate
Return Class N 3000 Index Allocation
-------------- ---------- -----------
Mar-08 10,000 10,000 10,000
Apr-08 10,360 10,438 10,226
Oct-08 8,640 7,338 7,735
Apr-09 7,852 6,791 7,642
Oct-09 8,972 8,133 8,945
All dividends and capital gains are reinvested. Indexes are unmanaged and do not
take into account fees, expenses or other costs.
Returns shown in the chart and table do not reflect taxes that a shareholder
would pay on Fund distributions or on the sale of the Fund shares.
Investments in ETFs are subject to higher costs than investing directly in the
underlying security. There are also certain investment limitations with fund of
funds.
RETURNS FOR PERIOD ENDED 10/31/09
Average Annual Total Returns - Class N
One Year 3.85%
Since Inception -6.31%
Inception Date 03/04/08
THE PERFORMANCE DATA QUOTED REPRESENTS PAST PERFORMANCE. PAST PERFORMANCE DOES
NOT GUARANTEE FUTURE RESULTS. INVESTMENT RETURN AND PRINCIPAL VALUE WILL
FLUCTUATE SO THAT AN INVESTOR'S SHARES, UPON REDEMPTION, MAY BE WORTH MORE OR
LESS THAN THEIR ORIGINAL COST. CURRENT PERFORMANCE MAY BE HIGHER OR LOWER THAN
THE PERFORMANCE DATA QUOTED. FOR PERFORMANCE DATA CURRENT TO THE MOST RECENT
MONTH-END, PLEASE VISIT OUR WEBSITE AT www.astonfunds.com.
THE PERFORMANCE QUOTED WOULD HAVE BEEN LOWER IF WAIVERS HAD NOT BEEN IN EFFECT.
44
Aston Funds
NEW CENTURY ABSOLUTE RETURN ETF FUND OCTOBER 31, 2009
SCHEDULE OF INVESTMENTS
(PIE CHART)
DOMESTIC EQUITIES 51%
INTERNATIONAL EQUITIES 25%
CASH & NET OTHER ASSETS AND LIABILITIES 20%
ASSET ALLOCATION 2%
REAL ESTATE 2%
% OF TOTAL NET ASSETS
MARKET
SHARES VALUE
--------- --------------
EXCHANGE TRADED FUNDS - 80.15%
ASSET ALLOCATION - 2.12%
4,160 CurrencyShares Australian Dollar Trust ............ $ 375,232
--------------
375,232
--------------
DOMESTIC EQUITIES - 50.64%
6,580 Consumer Staples Select Sector SPDR Fund .......... 169,961
3,040 Energy Select Sector SPDR Fund .................... 168,294
12,170 Financial Select Sector SPDR Fund ................. 170,623
9,800 First Trust NASDAQ - 100 Equal Weighted
Index Fund * ................................... 173,264
6,720 Industrial Select Sector SPDR Fund ................ 169,814
13,290 iShares Dow Jones U.S. Insurance Index Fund ....... 338,762
6,890 iShares Dow Jones U.S. Technology Sector
Index Fund ..................................... 354,490
4,950 iShares Dow Jones U.S. Transportation Average
Index Fund ..................................... 320,314
6,450 iShares Russell 1000 Value Index Fund ............. 346,430
3,150 iShares Russell 2000 Growth Index Fund ............ 192,497
5,970 iShares Russell 2000 Index Fund ................... 336,410
9,660 iShares Russell 2000 Value Index Fund ............. 510,724
9,410 iShares Russell Microcap Index Fund ............... 337,348
4,230 iShares Russell Midcap Growth Index Fund .......... 172,796
10,190 iShares Russell Midcap Value Index Fund ........... 342,792
4,990 iShares S&P MidCap 400 Growth Index Fund .......... 355,538
MARKET
SHARES VALUE
--------- --------------
DOMESTIC EQUITIES (CONTINUED)
8,280 iShares S&P North American Technology-Software
Index Fund * ...................................... $ 357,199
3,420 iShares S&P SmallCap 600 Growth Index Fund ........ 176,164
4,910 KBW Insurance ETF ................................. 163,847
4,410 Market Vectors Agribusiness ETF ................... 168,197
5,910 Market Vectors-Coal ETF ........................... 177,891
5,880 Materials Select Sector SPDR Trust ................ 172,225
1,460 Midcap SPDR Trust Series 1 ........................ 174,528
3,100 Oil Service HOLDRS Trust .......................... 362,886
2,800 Pharmaceutical HOLDRs Trust ....................... 170,996
10,350 PowerShares Financial Preferred Portfolio ......... 158,459
12,090 PowerShares Preferred Portfolio ................... 158,016
8,480 PowerShares QQQ ................................... 347,341
16,270 Powershares Wilderhill Clean Energy Portfolio * ... 157,331
4,930 Rydex S&P Equal Weight ETF ........................ 177,086
8,050 SPDR KBW Regional Banking ETF ..................... 163,657
12,490 SPDR S&P Homebuilders ETF ......................... 172,237
3,850 SPDR S&P Metals & Mining ETF ...................... 163,625
6,650 SPDR S&P Oil & Gas Equipment & Services ETF ....... 181,479
5,000 SPDR S&P Oil & Gas Exploration & Production ETF ... 192,250
10,780 SPDR S&P Retail ETF ............................... 363,933
4,120 Ultra Technology ProShares Fund ................... 174,688
3,160 Vanguard Mid-Cap ETF .............................. 171,841
--------------
8,965,933
--------------
INTERNATIONAL EQUITIES - 25.46%
4,460 BLDRS Emerging Markets 50 ADR Index Fund .......... 180,541
8,620 iShares FTSE/Xinhua China 25 Index Fund ........... 359,540
8,400 iShares MSCI Australia Index Fund ................. 184,212
8,300 iShares MSCI Brazil Index Fund .................... 571,289
7,120 iShares MSCI Canada Index Fund .................... 169,812
5,370 iShares MSCI Emerging Markets Index Fund .......... 201,697
8,410 iShares MSCI Germany Index Fund ................... 177,367
13,720 iShares MSCI Pacific ex-Japan Index Fund .......... 543,175
4,030 iShares MSCI South Korea Index Fund ............... 172,806
7,290 IShares MSCI Spain Index Fund ..................... 353,419
15,120 iShares MSCI Taiwan Index Fund .................... 175,543
4,660 iShares S&P Asia 50 Index Fund .................... 172,280
4,370 iShares S&P Latin American 40 Index Fund .......... 188,216
4,350 Market Vectors Brazil Small-Cap ETF * ............. 180,047
2,260 Vanguard FTSE All World ex-US Index Fund * ........ 176,619
4,210 Vanguard FTSE All World ex-US Small-Cap ETF ....... 176,104
SEE ACCOMPANYING NOTES TO FINANCIAL STATEMENTS.
45
Aston Funds
NEW CENTURY ABSOLUTE RETURN ETF FUND OCTOBER 31, 2009
SCHEDULE OF INVESTMENTS - CONTINUED
MARKET
SHARES VALUE
--------- --------------
INTERNATIONAL EQUITIES (CONTINUED)
9,010 WisdomTree India Earnings Fund .................... $ 173,082
12,620 WisdomTree International Real Estate Fund ......... 352,729
--------------
4,508,478
--------------
REAL ESTATE - 1.93%
7,410 iShares Cohen & Steers Realty Majors Index
Fund ........................................... 342,490
--------------
342,490
--------------
TOTAL EXCHANGE TRADED FUNDS
(Cost $13,011,455) ............................. 14,192,133
--------------
INVESTMENT COMPANY - 19.85%
3,514,061 BlackRock Liquidity Funds TempCash Portfolio ...... 3,514,061
--------------
TOTAL INVESTMENT COMPANY
(Cost $3,514,061) .............................. 3,514,061
--------------
TOTAL INVESTMENTS - 100.00%
(Cost $16,525,516)** ....................................... 17,706,194
--------------
NET OTHER ASSETS AND LIABILITIES - 0.00% ...................... 212
--------------
NET ASSETS - 100.00% .......................................... $ 17,706,406
==============
----------
* Non-income producing security.
** Aggregate cost for Federal income tax purposes is $16,551,262.
Gross unrealized appreciation ... $1,349,521
Gross unrealized depreciation ... (194,589)
----------
Net unrealized appreciation ..... $1,154,932
==========
ADR American Depositary Receipt
BLDRS Baskets of Listed Depositary Receipts
ETF Exchange-Traded Fund
FTSE Financial Times Stock Exchange
HOLDRS Holding Company Depositary Receipts
MSCI Morgan Stanley Capital International
NASDAQ National Association of Securities Dealers Automated Quotations
S&P Standard & Poor
SPDR Standard & Poor's Depositary Receipt
Transactions in written call options for the year ended October 31, 2009 were as
follows:
NUMBER OF
CONTRACTS PREMIUM
--------- --------
BEGINNING OF PERIOD 0 $ 0
CALL OPTIONS WRITTEN 160 53,600
CALL OPTIONS CLOSED (160) (53,600)
---- --------
OUTSTANDING, OCTOBER 31, 2009 0 $ 0
==== ========
SEE ACCOMPANYING NOTES TO FINANCIAL STATEMENTS.
46
Aston Funds
M.D. SASS ENHANCED EQUITY FUND
PORTFOLIO MANAGERS COMMENTARY (UNAUDITED) OCTOBER 31, 2009
(Formerly the MB Enhanced Equity Income Fund) Ronald L. Altman & Martin D. Sass
Q. What were the most significant market factors affecting Fund performance
and returns relative to the benchmark during the past 12 months?
A. The Fund's solid returns relative to the S&P 500 during the period came
equally from stock selection and sector allocation for the equity-only
portion of the strategy. Selling call options against individual holdings
provided a significant boost during the first half of the fiscal year, but
became a slight drag during the second half as the extended market rally
caused a number of stocks in the portfolio to exceed the strike price of
the call options that we sold. From a sector point of view, Energy and
Consumer Staples were the biggest positive contributors, while Financials
was the worst area.
Q. What were the best performing holdings for the Fund during the period?
A. In terms of individual holdings, the top five contributors were
Caterpillar, Corning, Transocean, American Express and Kohls.
Q. What were the weakest performing holdings?
A. In terms of individual holdings, the bottom five weakest contributors were
Citigroup, Dow Chemical, SunTrust, Wells Fargo and General Electric.
Q. How was the Fund positioned as of October 31, 2009?
A. As we assessed the portfolio in September, amid the strong extended market
rally, we concluded that it was time to begin to reposition holdings given
the change in the risk environment. We sold several positions from the Fund
that exceeded price targets, and where the value of the calls written had
little return potential in selling at their intrinsic value. In addition,
we reviewed the list of equities that fit our criteria for investment and
found several companies that appeared better suited to the strategy.
Interestingly, the equities added tended to have much higher current
dividend yields and lower price/earnings ratios than the portfolio average,
so we began to rotate the portfolio in that direction.
In the process, stakes in Consumer Discretionary, Industrials, and
Technology decreased, while we increased holdings in Telecommunications and
established a position in electrical utilities. Within Healthcare, Abbot
Labs replaced PPDI, and serves as a prime example of how a change lowered
the portfolio's average price/earnings and increased its average yield. We
continue to assess the portfolio's current holdings in light of the shifts
that have occurred in the overall distribution of values within the equity
market, which at the beginning of the year favored lower yielding stocks
but today suggests that the higher yielding sectors are more attractive.
In terms of risk, we began to buy put options on the S&P 500 Index as a
risk control because the cost of that insurance became reasonable compared
with any time in the previous 12 months. We view these puts, which comprise
1% of Fund assets, as a potential hedge against any unforeseen events that
should occur in this still uncertain economic environment. Combined with
the shift we recently made in individual holdings, we believe the risk
profile of the Fund has been reduced significantly. Therefore, if the
market advance continues, we would expect the Fund to lag the broader
market slightly, though it should hold its value much more effectively than
most if we enter another corrective phase.
GROWTH OF A HYPOTHETICAL
$10,000 INVESTMENT--CLASS N
(PERFORMANCE GRAPH)
M.D. Sass Enhanced Equity Fund
50% S&P
500 Index / 50%
M.D. Sass Citigroup Citigroup
Enhanced Broad Broad Morningstar
Equity - Investment S&P 500 Investment Large-Blend
Class N Grade Bond Index Index Grade Bond Index Category
--------- ---------------- ------- ---------------- -----------
Jan-08 10,000 10,000 10,000 10,000 10,000
Apr-08 10,596 9,911 9,497 10,443 10,106
Oct-08 8,210 8,243 6,717 10,112 7,043
Apr-09 8,155 8,257 6,145 10,966 6,570
Oct-09 9,512 9,287 7,375 11,535 7,876
All dividends and capital gains are reinvested. Indexes are unmanaged and do not
take into account fees, expenses or other costs.
Returns shown in the chart and table do not reflect taxes that a shareholder
would pay on Fund distributions or on the sale of the Fund shares.
Investing in covered call options involves the risk of a lack of liquidity and
can be negatively impacted by market price fluctuations.
RETURNS FOR PERIOD ENDED 10/31/09
Average Annual Total Returns - Class N
One Year 15.86%
Since Inception -2.75%
Inception Date 01/15/08
THE PERFORMANCE DATA QUOTED REPRESENTS PAST PERFORMANCE. PAST PERFORMANCE DOES
NOT GUARANTEE FUTURE RESULTS. INVESTMENT RETURN AND PRINCIPAL VALUE WILL
FLUCTUATE SO THAT AN INVESTOR'S SHARES, UPON REDEMPTION, MAY BE WORTH MORE OR
LESS THAN THEIR ORIGINAL COST. CURRENT PERFORMANCE MAY BE HIGHER OR LOWER THAN
THE PERFORMANCE DATA QUOTED. FOR PERFORMANCE DATA CURRENT TO THE MOST RECENT
MONTH-END, PLEASE VISIT OUR WEBSITE AT www.astonfunds.com.
THE PERFORMANCE QUOTED WOULD HAVE BEEN LOWER IF WAIVERS HAD NOT BEEN IN EFFECT.
47
Aston Funds
M.D. SASS ENHANCED EQUITY FUND OCTOBER 31, 2009
SCHEDULE OF INVESTMENTS
(PIE CHART)
INDUSTRIALS 22%
INFORMATION TECHNOLOGY 17%
ENERGY 12%
FINANCIALS 10%
TELECOMMUNICATION SERVICES 9%
UTILITIES 8%
CONSUMER DISCRETIONARY 8%
HEALTH CARE 7%
MATERIALS 6%
PURCHASED OPTIONS 1%
% OF TOTAL NET ASSETS
MARKET
SHARES VALUE
--------- --------------
COMMON STOCKS - 99.87%
CONSUMER DISCRETIONARY - 8.22%
18,000 Carnival (a) ...................................... $ 524,160
27,000 Home Depot (a) .................................... 677,430
30,000 Staples (a) ....................................... 651,000
--------------
1,852,590
--------------
ENERGY - 11.82%
24,000 Halliburton (a) ................................... 701,040
11,000 Schlumberger (a) .................................. 684,200
22,000 Smith International (a) ........................... 610,060
8,000 Transcocean * (a) ................................. 671,280
--------------
2,666,580
--------------
FINANCIALS - 9.72%
18,800 American Express (a) .............................. 654,992
17,004 Bank of America (a) ............................... 247,918
30,000 Citigroup (a) ..................................... 122,700
18,000 Comerica (a) ...................................... 499,500
12,000 SunTrust Banks (a) ................................ 229,320
15,902 Wells Fargo (a) ................................... 437,623
--------------
2,192,053
--------------
HEALTH CARE - 6.68%
15,000 Abbott Laboratories (a) ........................... 758,550
22,000 Eli Lilly (a) ..................................... 748,220
--------------
1,506,770
--------------
INDUSTRIALS - 22.51%
12,000 Caterpillar (a) ................................... 660,720
12,000 Fluor (a) ......................................... 533,040
29,500 General Electric (a) .............................. 420,670
13,000 Jacobs Engineering Group * (a) .................... 549,770
13,000 Norfolk Southern (a) .............................. 606,060
25,000 Quanta Services * (a) ............................. 530,000
15,000 Raytheon .......................................... 679,200
25,000 Shaw Group * ...................................... 641,500
8,500 United Parcel Service, Class B (a) ................ 456,280
--------------
5,077,240
--------------
MARKET
SHARES VALUE
--------- --------------
INFORMATION TECHNOLOGY - 17.42%
15,000 Automatic Data Processing (a) ..................... $ 597,000
48,000 Corning (a) ....................................... 701,280
40,000 EMC * (a) ......................................... 658,800
35,000 Intel (a) ......................................... 668,850
25,000 Microsoft (a) ..................................... 693,250
28,000 Xilinx (a) ........................................ 609,000
--------------
3,928,180
--------------
MATERIALS - 5.83%
20,000 duPont (E. I.) de Nemours (a) ..................... 636,400
12,000 PPG Industries (a) ................................ 677,160
--------------
1,313,560
--------------
TELECOMMUNICATION SERVICES - 9.12%
26,000 AT&T (a) .......................................... 667,420
20,000 CenturyTel (a) .................................... 649,200
25,000 Verizon Communications (a) ........................ 739,750
--------------
2,056,370
--------------
UTILITIES - 8.55%
17,000 Dominion Resources (a) ............................ 579,530
16,000 FirstEnergy (a) ................................... 692,480
22,000 Public Service Enterprise Group ................... 655,600
--------------
1,927,610
--------------
TOTAL COMMON STOCKS
(Cost $24,095,685) ............................. 22,520,953
--------------
NUMBER OF
CONTRACTS
---------
PURCHASED OPTIONS - 1.11%
SPDR Trust Series I
1,300 Strike @ $93 Exp 12/09 ............................ 153,400
500 Strike @ $93 Exp 01/10 ............................ 97,500
--------------
TOTAL PURCHASED OPTIONS
(Cost $272,907) ................................ 250,900
--------------
SHARES
---------
INVESTMENT COMPANY - 5.70%
1,285,564 BlackRock Liquidity Funds FedFund Portfolio ....... 1,285,564
--------------
TOTAL INVESTMENT COMPANY
(Cost $1,285,564) .............................. 1,285,564
--------------
TOTAL INVESTMENTS - 106.68%
(Cost $25,654,156)** ....................................... 24,057,417
--------------
NET OTHER ASSETS AND LIABILITIES - (6.68)% .................... (1,505,602)
--------------
NET ASSETS - 100.00% .......................................... $ 22,551,815
==============
----------
* Non-income producing security.
** Aggregate cost for Federal income tax purposes is $25,748,849.
Gross unrealized appreciation .... $ 1,235,408
Gross unrealized depreciation .... (2,926,840)
-----------
Net unrealized depreciation ...... $(1,691,432)
===========
(a) These securities are pledged as collateral for call options written.
SPDR Standard & Poor's Depositary Receipt
SEE ACCOMPANYING NOTES TO FINANCIAL STATEMENTS.
48
Aston Funds
M.D. SASS ENHANCED EQUITY FUND OCTOBER 31, 2009
SCHEDULE OF INVESTMENTS - CONTINUED
Transactions in written call options for the period ended October 31, 2009 were
as follows:
NUMBER OF
CONTRACTS PREMIUM
--------- -----------
BEGINNING OF PERIOD 4,003 $ 705,618
CALL OPTIONS WRITTEN 29,946 4,150,753
CALL OPTIONS CLOSED OR EXPIRED (26,959) (4,010,336)
CALL OPTIONS EXERCISED (75) (5,617)
------- -----------
OUTSTANDING, OCTOBER 31, 2009 6,915 $ 840,418
======= ===========
Premiums received and value of written equity options outstanding as of October
31, 2009.
NUMBER OF PREMIUM MARKET
CONTRACTS DESCRIPTION RECEIVED VALUE
--------- ------------------------------- -------- ----------
Abbott Laboratories
50 Strike @ $52.5 Exp 05/10 ...... $ 6,125 $ 12,750
100 Strike @ $55 Exp 05/10 ........ 10,999 16,500
American Express
188 Strike @ $26 Exp 01/10 ........ 37,316 174,840
AT&T
180 Strike @ $29 Exp 04/10 ........ 11,139 9,000
Automatic Data Processing
100 Strike @ $40 Exp 02/10 ........ 13,999 19,250
50 Strike @ $41 Exp 02/10 ........ 6,125 7,750
Bank of America
100 Strike @ $18 Exp 02/10 ........ 8,349 6,700
70 Strike @ $20 Exp 02/10 ........ 3,464 2,380
Carnival
140 Strike @ $30 Exp 01/10 ........ 19,949 26,600
40 Strike @ $36 Exp 04/10 ........ 5,295 4,400
Caterpillar
120 Strike @ $50 Exp 02/10 ........ 15,979 96,000
CenturyTel
200 Strike @ $35 Exp 04/10 ........ 23,249 16,000
Citigroup
300 Strike @ $7 Exp 03/10 ......... 6,726 1,800
Comerica
142 Strike @ $25 Exp 01/10 ........ 25,061 59,640
38 Strike @ $30 Exp 01/10 ........ 3,553 5,700
Corning
250 Strike @ $19 Exp 05/10 ........ 18,373 10,000
230 Strike @ $20 Exp 05/10 ........ 12,304 5,750
Dominion Resources
170 Strike @ $35 Exp 04/10 ........ 28,574 22,100
duPont (E.I.) de Nemours
100 Strike @ $32 Exp 01/10 ........ 10,549 17,500
100 Strike @ $33 Exp 01/10 ........ 10,299 14,000
Eli Lilly
100 Strike @ $37.5 Exp 04/10 ...... 8,849 7,500
EMC
400 Strike @ $16 Exp 01/10 ........ 17,612 54,000
NUMBER OF PREMIUM MARKET
CONTRACTS DESCRIPTION RECEIVED VALUE
--------- ------------------------------- -------- ----------
FirstEnergy
150 Strike @ $50 Exp 04/10 ........ $24,624 $12,000
Fluor
120 Strike @ $60 Exp 04/10 ........ 40,412 12,600
General Electric
295 Strike @ $20 Exp 03/10 ........ 20,055 5,605
Halliburton
140 Strike @ $26 Exp 01/10 ........ 14,619 58,800
100 Strike @ $27 Exp 01/10 ........ 9,499 34,400
Home Depot
50 Strike @ $27.5 Exp 01/10 ...... 5,625 3,000
70 Strike @ $27 Exp 02/10 ........ 8,924 6,650
100 Strike @ $30 Exp 02/10 ........ 5,849 2,700
50 Strike @ $29 Exp 05/10 ........ 4,475 4,225
Intel
110 Strike @ $19 Exp 01/10 ........ 7,864 12,980
220 Strike @ $20 Exp 01/10 ........ 18,038 16,280
Jacobs Engineering Group
82 Strike @ $50 Exp 01/10 ........ 15,184 6,970
48 Strike @ $55 Exp 01/10 ........ 4,680 2,160
Microsoft
115 Strike @ $24 Exp 01/10 ........ 16,389 45,425
135 Strike @ $26 Exp 01/10 ........ 10,056 32,535
Norfolk Southern
130 Strike @ $45 Exp 12/09 ........ 28,209 41,080
PPG Industries
120 Strike @ $50 Exp 01/10 ........ 22,199 84,000
Quanta Services
150 Strike @ $25 Exp 05/10 ........ 25,374 20,250
100 Strike @ $30 Exp 05/10 ........ 6,849 4,500
Schlumberger
110 Strike @ $60 Exp 01/10 ........ 35,913 64,900
Smith International
150 Strike @ $30 Exp 01/10 ........ 19,874 22,500
20 Strike @ $31 Exp 01/10 ........ 3,450 2,550
50 Strike @ $35 Exp 01/10 ........ 3,675 2,250
Staples
20 Strike @ $24 Exp 03/10 ........ 3,045 1,800
268 Strike @ $24 Exp 06/10 ........ 38,188 37,520
SunTrust Banks
120 Strike @ $25 Exp 01/10 ........ 7,794 4,200
Transocean
80 Strike @ $90 Exp 02/10 ........ 23,799 40,400
United Parcel Service, Class B
50 Strike @ $55 Exp 01/10 ........ 11,999 9,600
35 Strike @ $60 Exp 01/10 ........ 4,112 1,785
Verizon Communications
150 Strike @ $32 Exp 04/10 ........ 12,149 10,800
Wells Fargo
159 Strike @ $26 Exp 01/10 ........ 53,660 55,650
Xilinx
50 Strike @ $20 Exp 12/09 ........ 8,750 10,250
100 Strike @ $22.5 Exp 01/10 ...... 12,249 10,500
100 Strike @ $23 Exp 03/10 ........ 8,949 12,600
-------- ----------
TOTAL WRITTEN CALL OPTIONS .... $840,418 $1,283,625
======== ==========
SEE ACCOMPANYING NOTES TO FINANCIAL STATEMENTS.
49
Aston Funds
LAKE PARTNERS LASSO ALTERNATIVES FUND
PORTFOLIO MANAGERS COMMENTARY (UNAUDITED) OCTOBER 31, 2009
Frederick C. Lake & Ronald A. Lake
Q. What were the most significant market factors affecting Fund performance
and returns relative to the benchmark since the Fund's inception on April
1, 2009?
A. The Fund outperformed its benchmark, the HFRX Equity Hedge Index, gaining
11.5% versus 8.3%, as it took advantage of improvements in the equity and
credit markets. From the Fund's launch on April 1, 2009 through October 31,
there was a significant rebound in the financial markets, not only in the
U.S. but also globally, as investors steadily regained their confidence
that the world economy was on the mend. Furthermore, inflation concerns
receded into the background, which was supportive of equities and bonds. In
contrast, fears over rising US Federal debts weighed down the US dollar.
While fundamentals appear to be improving, albeit slowly, markets have been
stimulated by another important but sometimes overlooked factor. With
short-term interest rates pinned at rock-bottom levels by the Federal
Reserve Board, investors have been motivated to seek returns elsewhere.
Quite simply, the "flight to safety" has become the flight to returns or
the flight to risk.
Q. What were the best performing holdings for the Fund during the period?
A. The greatest contributors to returns included funds in three broad strategy
categories: 1) long-biased equity, 2) multi-asset hedged, and 3) hedged
high-yield and strategic income.
Among equity-oriented funds, JPMorgan US Large Cap Core Plus benefited from
the general market uptrend and Needham Growth focused on opportunities in
small-caps and technology.
Mainstay 130/30 High Yield benefited from the improvement in credit markets
and the narrowing of spreads as it took a selective approach within the
hedged high-yield and strategic income group. JPMorgan Strategic Income
Opportunities and Driehaus Active Income followed more broadly diversified
and actively hedged approaches.
Within the multi-asset hedged funds category, BlackRock Global Allocation
took advantage of the rise in U.S. as well as international equities, and
also capitalized on trends in sovereign yields and major currencies. FPA
Crescent was cautious and selective in its approach to domestic equities
and corporate debt.
Q. What were the weakest performing holdings?
A. Given the upward market trends, highly hedged and short-biased funds
lagged. However the allocation to these funds was not large, so the impact
on performance was limited. An allocation to a Hedged Commodities fund
proved to be ineffective and was eliminated, resulting in a small loss.
Q. How was the Fund positioned as of October 31, 2009?
A. Markets have enjoyed an extended run, the question is will momentum
continue to carry prices higher or is a correction likely? If there is a
correction, will it be a short-lived episode of profit taking or will fears
that the markets have "gone too far too fast" relative to fundamentals lead
to a significant step backwards?
Factors supporting the market include interest-rates near zero, improving
liquidity, and substantial investor cash reserves. On the other hand, the
economic recovery remains labored, except in Emerging Markets. Investors
are still waiting nervously for signs of top-line growth in corporate
revenues as cost-cutting alone does not appear capable of sustaining equity
valuations.
The tension between these plusses and minuses is likely to result in
heightened volatility in all markets, not just equities. Therefore, we
continue to position the Fund to dampen the risk of conventional asset
classes while maintaining the potential to generate relatively stable
returns via less conventional strategies. By the end of October we had
adjusted the portfolio by paring back allocations to Long/Short Equity
Strategies and increasing Hedged Fixed-Income and Arbitrage. As a result,
net equity exposure roughly ranged from 30% to 35%.
GROWTH OF A HYPOTHETICAL
$10,000 INVESTMENT--CLASS I
(PERFORMANCE GRAPH)
Lake Partners LASSO Alternatives Fund
Lake
Partners
LASSO Morningstar
Alternatives HFRX Equity Long/Short
Fund - Class I Hedge Index Category
-------------- ----------- -----------
4/2/2009 10,000 10,000 10,000
Apr-09 10,150 10,102 10,266
Jul-09 10,800 10,600 10,826
Oct-09 11,150 10,830 11,043
All dividends and capital gains are reinvested. Indexes are unmanaged and do not
take into account fees, expenses or other costs.
Returns shown in the chart and table do not reflect taxes that a shareholder
would pay on Fund distributions or on the sale of the Fund shares.
Fund-of-funds that invest in funds using alternative or hedging strategies may
be exposed to potentially dramatic changes in the value of certain of its
portfolio holdings. Investments in fund-of-funds are subject to higher costs
than investing directly in the underlying funds.
RETURNS FOR PERIOD ENDED 10/31/09
Total Returns - Class I
Cumulative since Inception 11.50%
Inception Date 04/01/09*
* The Fund commenced operations on April 1, 2009. Because the Fund invests
primarily in open-end investment companies which are priced as of the close
of the NYSE, performance is shown from April 2, 2009.
THE PERFORMANCE DATA QUOTED REPRESENTS PAST PERFORMANCE. PAST PERFORMANCE DOES
NOT GUARANTEE FUTURE RESULTS. INVESTMENT RETURN AND PRINCIPAL VALUE WILL
FLUCTUATE SO THAT AN INVESTOR'S SHARES, UPON REDEMPTION, MAY BE WORTH MORE OR
LESS THAN THEIR ORIGINAL COST. CURRENT PERFORMANCE MAY BE HIGHER OR LOWER THAN
THE PERFORMANCE DATA QUOTED. FOR PERFORMANCE DATA CURRENT TO THE MOST RECENT
MONTH-END, PLEASE VISIT OUR WEBSITE AT www.astonfunds.com.
THE PERFORMANCE QUOTED WOULD HAVE BEEN LOWER IF WAIVERS HAD NOT BEEN IN EFFECT.
50
Aston Funds
LAKE PARTNERS LASSO ALTERNATIVES FUND OCTOBER 31, 2009
SCHEDULE OF INVESTMENTS
(PIE CHART)
LONG/SHORT STRATEGIES 47%
HEDGED FIXED INCOME 30%
ARBITRAGE 17%
CASH & NET OTHER ASSETS AND LIABILITIES 3%
MARKET NEUTRAL 2%
OPTION HEDGING 1%
% OF TOTAL NET ASSETS
MARKET
SHARES VALUE
--------- --------------
INVESTMENT COMPANIES - 98.88%
ARBITRAGE - 17.04%
20,601 AQR Diversified Arbitrage Fund-N * ................ $ 221,869
6,022 Merger Fund ....................................... 92,613
--------------
314,482
--------------
HEDGED FIXED INCOME - 29.75%
13,639 Driehaus Active Income Fund ....................... 166,806
8,929 Eaton Vance Global Macro Absolute Return Fund-A ... 92,508
14,419 JPMorgan Strategic Income Opportunities Fund ...... 166,102
10,273 MainStay 130/30 High Yield Fund-A ................. 111,971
250 ProShares UltraShort 20+ Year Treasury ............ 11,415
--------------
548,802
--------------
LONG/SHORT STRATEGIES - 46.72%
7,945 BlackRock Global Allocation Fund .................. 138,395
1,728 Caldwell & Orkin Market Opportunity Fund .......... 34,750
11,544 FPA Crescent Fund-I ............................... 276,720
13,506 JPMorgan U.S. Large Cap Core Plus Fund-S .......... 228,655
4,505 Needham Growth Fund ............................... 121,557
4,437 Royce Global Select Fund-INV ...................... 61,805
--------------
861,882
--------------
MARKET NEUTRAL - 2.51%
2,948 JPMorgan Market Neutral Fund-IN ................... 46,247
--------------
OPTION HEDGING - 0.97%
1,387 Hussman Strategic Growth Fund ..................... 17,977
--------------
MARKET
SHARES VALUE
--------- --------------
CASH EQUIVALENTS - 1.89%
34,858 BlackRock Liquidity Funds TempCash Portfolio ...... $ 34,858
--------------
TOTAL INVESTMENT COMPANIES
(Cost $1,766,710) .............................. 1,824,248
--------------
TOTAL INVESTMENTS - 98.88%
(Cost $1,766,710)** ........................................ 1,824,248
--------------
NET OTHER ASSETS AND LIABILITIES - 1.12% ...................... 20,586
--------------
NET ASSETS - 100.00% .......................................... $ 1,844,834
==============
----------
* Non-income producing security.
** Aggregate cost for Federal income tax purposes is $1,768,522.
Gross unrealized appreciation ... $60,148
Gross unrealized depreciation ... (4,422)
-------
Net unrealized appreciation ..... $55,726
=======
SEE ACCOMPANYING NOTES TO FINANCIAL STATEMENTS.
51
Aston Funds
FORTIS REAL ESTATE FUND
PORTFOLIO MANAGERS COMMENTARY (UNAUDITED) OCTOBER 31, 2009
Joseph Pavnica & James Hardman
Q. What were the most significant market factors affecting Fund performance
and returns relative to the benchmark during the past 12 months?
A. The period between November 2008 and the beginning of March 2009 saw US
REITs fall more than 50% as the global collapse in confidence in the
financial sector hit the real estate market across the board. As credit
markets froze, the REIT sector experienced its most volatile period in
history. The economic recession also played out badly for real estate,
though the fortunes of the real estate market have recovered sharply since
March as the banking sector recovered somewhat and opened up to real estate
companies seeking to raise billions of dollars in equity to repair
over-leveraged balance sheets. The Fund underperformed its benchmark due to
a combination of allocation and stock selection. Performance benefited from
an underweight to diversified companies as well as investments in shopping
centers. An underweight to the Healthcare sector, which has benefited from
its perception as a defensive play amid challenging market circumstances
and our preferences within the health care group, also contributed
negatively to returns.
Q. What were the best performing holdings for the Fund during the period?
A. Kimco Realty, a shopping center REIT, was traded during the period to take
advantage of fluctuating sentiment towards the group and the stock, and was
a positive influence on relative performance. A large overweight stake in
National Retail Properties, due to its attractive valuation relative to
peers, was also a significant contributor to performance.
Q. What were the weakest performing holdings?
A. The Fund timed its move into Prologis, an international industrial
developer and landlord, incorrectly in January 2009 as the name
subsequently underperformed the index significantly. A large underweight
position in Healthcare REIT Ventas detracted from performance as that group
outperformed. Host Hotels turned in a disappointing return during the
period despite the lodgings sector having outperformed.
Q. How was the Fund positioned as of October 31, 2009?
A. In summary, the outlook for real estate remains cautious with portfolio
preferences being driven largely by bottom-up research focused on companies
well-positioned to not only withstand the current environment, but also
benefit disproportionately when opportunities arise in the future. At the
country level, the Fund remains essentially neutral weighted to both Canada
and the U.S., liking the relative stability that Canada provides at certain
points in the cycle, but recognizing that valuations appear stretched. Some
sector preferences emerged towards the end of the period, such as an
underweight to the Multifamily sector where the prospects look difficult
given the state of the jobs market and that government credits make home
ownership more affordable. As it has for some time now, the Healthcare
sector remains the largest underweight, as valuations appear relatively
unattractive across the sector. Trends in the Office sector seem
attractive, albeit in select markets, as they have held up better than
expected.
GROWTH OF A HYPOTHETICAL
$10,000 INVESTMENT--CLASS N
(PERFORMANCE GRAPH)
Fortis Real Estate Fund
Morningstar(R)
ABN AMRO Real Estate MSCI US REIT Specialty-Real Estate
Fund - Class N Shares Equity Index Category
--------------------- ------------ ---------------------
Dec-97 10,000 10,000 10,000
Dec-98 8,721 8,310 8,441
Dec-99 8,431 7,932 8,208
Dec-00 10,856 10,059 10,426
Oct-01 10,806 10,453 10,658
Oct-02 11,522 11,152 11,426
Oct-03 15,406 14,937 15,242
Oct-04 20,141 19,344 19,683
Oct-05 23,777 22,756 23,097
Oct-06 33,096 31,351 31,194
Oct-07 32,629 31,260 32,105
Oct-08 18,352 18,612 17,966
Oct-09 18,087 18,698 18,568
All dividends and capital gains are reinvested. Indexes are unmanaged and do not
take into account fees, expenses or other costs.
Returns shown in the chart and table do not reflect taxes that a shareholder
would pay on Fund distributions or on the sale of the Fund shares.
Real estate funds may be subject to a higher degree of market risk than
diversified funds because of the concentration in a specific industry or
geographical sector. Risks also include declines in the value of real estate,
general and economic conditions, changes in the value of underlying property and
defaults by borrowers.
RETURNS FOR PERIOD ENDED 10/31/09
Average Annual Total Returns - Class N
One Year -1.44%
Five Year -2.13%
Ten Year 8.24%
Since Inception 5.13%
Inception Date 12/30/97
Average Annual Total Returns - Class I
One Year -1.27%
Since Inception -6.78%
Inception Date 09/20/05
THE PERFORMANCE DATA QUOTED REPRESENTS PAST PERFORMANCE. PAST PERFORMANCE DOES
NOT GUARANTEE FUTURE RESULTS. INVESTMENT RETURN AND PRINCIPAL VALUE WILL
FLUCTUATE SO THAT AN INVESTOR'S SHARES, UPON REDEMPTION, MAY BE WORTH MORE OR
LESS THAN THEIR ORIGINAL COST. CURRENT PERFORMANCE MAY BE HIGHER OR LOWER THAN
THE PERFORMANCE DATA QUOTED. FOR PERFORMANCE DATA CURRENT TO THE MOST RECENT
MONTH-END, PLEASE VISIT OUR WEBSITE AT www.astonfunds.com.
THE TOTAL EXPENSE RATIO FOR THE N CLASS AND I CLASS IS 1.57% AND 1.32%
RESPECTIVELY, AS DISCLOSED IN THE PROSPECTUS DATED MARCH 1, 2009. THE
PERFORMANCE QUOTED WOULD HAVE BEEN LOWER IF WAIVERS HAD NOT BEEN IN EFFECT.
PLEASE REFER TO THE FINANCIAL HIGHLIGHTS SECTION IN THIS REPORT FOR MORE 2009
FISCAL YEAR END RELATED INFORMATION.
52
Aston Funds
FORTIS REAL ESTATE FUND OCTOBER 31, 2009
SCHEDULE OF INVESTMENTS
(PIE CHART)
RETAIL 30%
OFFICE PROPERTIES 15%
RESIDENTIAL 14%
HEALTH CARE 11%
DIVERSIFIED 9%
STORAGE 8%
INDUSTRIAL 7%
HOTELS 4%
CASH & NET OTHER ASSETS AND LIABILITIES 1%
FOREIGN COMMON STOCKS 1%
% OF TOTAL NET ASSETS
MARKET
SHARES VALUE
--------- --------------
COMMON STOCKS - 97.55%
DIVERSIFIED - 8.65%
17,834 Digital Realty Trust .............................. $ 804,848
13,560 Entertainment Properties Trust .................... 461,311
16,382 Vornado Realty Trust .............................. 975,712
--------------
2,241,871
--------------
HEALTH CARE - 11.02%
7,882 HCP ............................................... 233,228
13,145 Health Care, REIT ................................. 583,244
24,771 Nationwide Health Properties ...................... 798,865
30,896 Ventas ............................................ 1,239,857
--------------
2,855,194
--------------
HOTELS - 3.79%
68,659 Host Hotels & Resorts ............................. 694,143
9,943 Starwood Hotels & Resorts Worldwide ............... 288,944
--------------
983,087
--------------
INDUSTRIAL - 6.60%
14,224 AMB Property ...................................... 312,644
11,350 EastGroup Properties .............................. 417,794
86,585 ProLogis Trust .................................... 981,008
--------------
1,711,446
--------------
OFFICE PROPERTIES - 15.05%
22,982 Boston Properties ................................. 1,396,616
56,381 Brookfield Properties ............................. 572,831
84,409 Douglas Emmett .................................... 996,026
15,949 Kilroy Realty ..................................... 440,511
12,728 SL Green Realty ................................... 493,337
--------------
3,899,321
--------------
MARKET
SHARES VALUE
--------- --------------
RESIDENTIAL - 13.87%
15,043 AvalonBay Communities ............................. $ 1,034,657
31,824 Camden Property Trust ............................. 1,153,620
32,656 Equity Residential Properties Trust ............... 943,105
11,851 Home Properties ................................... 464,322
--------------
3,595,704
--------------
RETAIL - 30.14%
23,273 Federal Realty Investment Trust ................... 1,373,805
116,333 Kimco Realty ...................................... 1,470,449
26,601 National Retail Properties ........................ 515,527
51,833 Simon Property Group .............................. 3,518,942
13,638 Tanger Factory Outlet Centers ..................... 519,199
13,549 Taubman Centers ................................... 413,380
--------------
7,811,302
--------------
STORAGE - 8.43%
29,679 Public Storage .................................... 2,184,374
--------------
TOTAL COMMON STOCKS
(Cost $24,671,002) ............................. 25,282,299
--------------
FOREIGN COMMON STOCKS - 1.55%
CANADA - 1.55%
27,790 Brookfield Properties ............................. 288,931
4,714 Canadian Real Estate Investment Trust ............. 111,310
--------------
TOTAL FOREIGN COMMON STOCKS
(Cost $395,727) ................................ 400,241
--------------
INVESTMENT COMPANY - 0.23%
59,877 BlackRock Liquidity Funds TempCash Portfolio ...... 59,877
--------------
TOTAL INVESTMENT COMPANY
(Cost $59,877) ................................. 59,877
--------------
TOTAL INVESTMENTS - 99.33%
(Cost $25,126,606)** ....................................... 25,742,417
--------------
NET OTHER ASSETS AND LIABILITIES - 0.67% ...................... 173,825
--------------
NET ASSETS - 100.00% .......................................... $ 25,916,242
==============
----------
** Aggregate cost for Federal income tax purposes is $29,152,447.
Gross unrealized appreciation .......................... $ 845,865
Gross unrealized depreciation .......................... (4,255,895)
-----------
Net unrealized depreciation ............................ $(3,410,030)
===========
REIT Real Estate Investment Trust
SEE ACCOMPANYING NOTES TO FINANCIAL STATEMENTS.
53
Aston Funds
MONTAG & CALDWELL BALANCED FUND
PORTFOLIO MANAGER COMMENTARY (UNAUDITED) OCTOBER 31, 2009
Ronald E. Canakaris, CFA, CIC
Q. What were the most significant market factors affecting Fund performance
and returns relative to the benchmark during the past 12 months?
A. After selling off sharply, the stock market experienced a remarkable rally
beginning in March 2009 in anticipation of a recovery in economic activity.
In this environment, many of the stocks that helped the Fund significantly
outperform during the previous two years were a short-term drag on relative
performance given a resurgence in more beaten down stocks and an apparent
increase in investors' appetite for risk. In our work, valuations of many
of the more cyclical and lesser quality stocks appear extended based on
2010 earnings. The biggest detractors came from the Consumer Discretionary
and Financials sectors. We would note both of these areas were contributors
to the Fund's 2008 positive relative returns. The Fund benefited from
strong stock selection in the Technology, Energy, and Healthcare sectors.
The bond portion of the Fund performed better than the Barclay's Capital
U.S. Government/Credit Bond Index during the period, primarily due to an
overweight position in high-quality corporate bonds. Corporate bond spreads
had widened tremendously during the financial crises of 2008-2009, and we
took advantage of attractive yield levels by reducing the portfolio's
weighting in Treasury and agency bonds and by purchasing high-quality
corporate bonds.
Q. What were the best performing holdings for the Fund during the period?
A. Apple and Google aided performance within Technology. Apple's iPhone
continued to drive growth in earnings, and the company benefited from
better than expected sales of both its computers and iPods, while top-line
growth resumed at Google and its management demonstrated an ability to
restrain spending. Cameron International performed well on a recovery in
the price of oil and a secular trend towards deep-water oil exploration.
Within Healthcare, Schering-Plough was one of the portfolio's best
performers after it accepted an offer to be acquired by Merck. Also,
Allergan benefited from an expectation that its earnings would improve with
increased expenditures on discretionary healthcare items such as cosmetic
surgery.
Q. What were the weakest performing holdings?
A. Stryker's performance lagged in 2009 as the company had several unresolved
regulatory issues. Wells Fargo hurt the Fund's results during the year as
we sold it and built a position in JPMorgan Chase. Devon Energy was
negatively affected by ongoing weakness in the price of natural gas, which
did not recover. Gilead Sciences and Procter & Gamble were among our better
performers in 2008 but did not do well in 2009 due to an investor
preference for more cyclical issues.
Q. How was the Fund positioned as of October 31, 2009?
A. We continue to believe the stock market reached a bear market low on March
9, 2009, and that a cyclical bull market is under way. While the S&P 500 is
more fairly valued after a nearly 60% increase, we are still finding plenty
of attractively valued stocks. Furthermore, there is ample fiscal and
monetary liquidity to support financial markets and promote economic
growth. In our opinion, a synchronized global economic recovery is under
way amid low inflation that should contribute to higher share prices and
mitigate the stock market's risk. Still, because the market is more fairly
valued and technically overbought, we do see an increasing risk of a market
correction over the short-term, though we would view that development as
merely a correction within a bull market.
The Fund continues to be overweight high-quality corporate bonds as we
believe the demand for yield and the recovery in corporate profits will
continue to cause spreads to narrow. The portfolio is underweight the long
end of the yield curve as we remain concerned that yields on
longer-maturity bonds will rise as the economic recovery takes hold.
GROWTH OF A HYPOTHETICAL $10,000
INVESTMENT--CLASS N
(PERFORMANCE GRAPH)
Montag and Caldwell Balanced Fund
60% S&P 500
Index/40%
Barclays Capital Barclays Capital Morningstar(R)
Montage and Government Credit SP 500(R) U.S. Government Moderate Allocation
Caldwell Balaned Bond Index Index Credit Bond Index Category
---------------- ----------------- ------ ------------------ -----------
Nov-94 10,000 10,000 10,000 10,000 10,000
Oct-95 12,375 12,227 12,641 11,616 11,823
Oct-96 14,895 14,228 15,685 12,242 13,633
Oct-97 18,509 17,436 20,720 13,321 16,401
Oct-98 21,185 20,550 25,276 14,690 17,872
Oct-99 24,962 23,554 31,759 14,593 20,111
Oct-00 25,472 25,154 33,690 15,634 22,010
Oct-01 23,857 22,563 25,305 18,029 19,837
Oct-02 21,849 21,054 21,484 19,018 18,181
Oct-03 23,332 24,237 25,950 20,192 21,124
Oct-04 24,067 26,156 28,392 21,316 22,742
Oct-05 25,334 27,629 30,868 21,493 24,482
Oct-06 26,995 30,853 35,909 22,542 27,408
Oct-07 31,753 34,219 41,134 23,753 30,768
Oct-08 25,128 26,215 26,293 23,501 21,882
Oct-09 28,977 29,458 28,869 26,932 25,324
All dividends and capital gains are reinvested. Indexes are unmanaged and do not
take into account fees, expenses or other costs.
Returns shown in the chart and table do not reflect taxes that a shareholder
would pay on Fund distributions or on the sale of the Fund shares.
The Fund is subject to interest rate risk associated with the underlying bond
holdings in the portfolio. The value of the Fund can decline as interest rates
rise and an investor can lose principal.
RETURNS FOR PERIOD ENDED 10/31/09
Average Annual Total Returns - Class N
One Year 15.32%
Five Year 3.78%
Ten Year 1.50%
Since Inception 7.35%
Inception Date 11/02/94
Average Annual Total Returns - Class I
One Year 15.53%
Five Year 4.00%
Ten Year 1.74%
Since Inception 2.24%
Inception Date 12/31/98
THE PERFORMANCE DATA QUOTED REPRESENTS PAST PERFORMANCE. PAST PERFORMANCE DOES
NOT GUARANTEE FUTURE RESULTS. INVESTMENT RETURN AND PRINCIPAL VALUE WILL
FLUCTUATE SO THAT AN INVESTOR'S SHARES, UPON REDEMPTION, MAY BE WORTH MORE OR
LESS THAN THEIR ORIGINAL COST. CURRENT PERFORMANCE MAY BE HIGHER OR LOWER THAN
THE PERFORMANCE DATA QUOTED. FOR PERFORMANCE DATA CURRENT TO THE MOST RECENT
MONTH-END, PLEASE VISIT OUR WEBSITE AT www.astonfunds.com.
THE TOTAL EXPENSE RATIO FOR THE N CLASS AND I CLASS IS 1.75% AND 1.50%
RESPECTIVELY, AS DISCLOSED IN THE PROSPECTUS DATED MARCH 1, 2009. PLEASE REFER
TO THE FINANCIAL HIGHLIGHTS SECTION IN THIS REPORT FOR MORE 2009 FISCAL YEAR END
RELATED INFORMATION.
54
Aston Funds
MONTAG & CALDWELL BALANCED FUND OCTOBER 31, 2009
SCHEDULE OF INVESTMENTS
(PIE CHART)
COMMON STOCKS 64%
CORPORATE NOTES AND BONDS 23%
U.S. GOVERNMENT AND AGENCY OBLIGATIONS 11%
CASH & NET OTHER ASSETS AND LIABILITIES 2%
% OF TOTAL NET ASSETS
MARKET
SHARES VALUE
--------- --------------
COMMON STOCKS - 63.88%
CONSUMER DISCRETIONARY - 6.76%
7,100 McDonald's ........................................ $ 416,126
3,750 NIKE, Class B ..................................... 233,175
7,350 TJX ............................................... 274,523
6,000 Walt Disney ....................................... 164,220
--------------
1,088,044
--------------
CONSUMER STAPLES - 14.41%
8,800 Coca-Cola ......................................... 469,128
3,850 Colgate-Palmolive ................................. 302,726
5,650 Costco Wholesale .................................. 321,203
5,000 CVS Caremark ...................................... 176,500
6,920 PepsiCo ........................................... 419,006
3,950 Procter & Gamble .................................. 229,100
8,050 Wal-Mart Stores ................................... 399,924
--------------
2,317,587
--------------
ENERGY - 6.03%
8,100 Cameron International * ........................... 299,457
3,350 Occidental Petroleum .............................. 254,198
6,700 Schlumberger ...................................... 416,740
--------------
970,395
--------------
FINANCIALS - 3.72%
20,400 Charles Schwab .................................... 353,736
5,850 JPMorgan Chase .................................... 244,355
--------------
598,091
--------------
HEALTH CARE - 10.36%
8,600 Abbott Laboratories ............................... 434,902
5,250 Allergan .......................................... 295,313
7,350 Gilead Sciences * ................................. 312,743
16,250 Schering-Plough ................................... 458,250
3,600 Stryker ........................................... 165,600
--------------
1,666,808
--------------
MARKET
SHARES VALUE
--------- --------------
INDUSTRIALS - 4.25%
3,600 3M ................................................ $ 264,852
1,750 Burlington Northern Santa Fe ...................... 131,810
2,950 Emerson Electric .................................. 111,363
3,950 Fluor ............................................. 175,459
--------------
683,484
--------------
INFORMATION TECHNOLOGY - 17.81%
2,750 Apple * ........................................... 518,375
973 Google, Class A * ................................. 521,645
10,500 Hewlett-Packard ................................... 498,330
9,350 Juniper Networks * ................................ 238,519
10,300 QUALCOMM .......................................... 426,523
3,450 Research In Motion * .............................. 202,619
6,050 Visa, Class A ..................................... 458,348
--------------
2,864,359
--------------
MATERIALS - 0.54%
1,300 Monsanto 87,334
--------------
TOTAL COMMON STOCKS
(Cost $9,723,389) 10,276,102
--------------
PAR VALUE
---------
CORPORATE NOTES AND BONDS - 23.34%
CONSUMER STAPLES - 5.10%
$ 250,000 Coca-Cola (The)
5.350%, 11/15/17 ............................... 271,998
250,000 PepsiCo
5.000%, 06/01/18 ............................... 266,562
275,000 Wal-Mart Stores
4.125%, 07/01/10 ............................... 281,713
--------------
820,273
--------------
ENERGY - 1.34%
200,000 ConocoPhillips
4.750%, 02/01/14 ............................... 214,949
--------------
FINANCIALS - 5.55%
175,000 General Electric Capital,
MTN, Series A
5.875%, 02/15/12 ............................... 188,790
225,000 Goldman Sachs Group
5.150%, 01/15/14 ............................... 237,924
250,000 JPMorgan Chase
4.750%, 05/01/13 ............................... 265,105
200,000 Wells Fargo
4.200%, 01/15/10 ............................... 201,261
--------------
893,080
--------------
HEALTH CARE - 4.35%
250,000 Abbott Laboratories
4.350%, 03/15/14 ............................... 263,544
200,000 Johnson & Johnson
5.950%, 08/15/37 ............................... 224,926
200,000 Pfizer
4.450%, 03/15/12 ............................... 212,200
--------------
700,670
--------------
INFORMATION TECHNOLOGY - 4.05%
200,000 Cisco Systems
5.500%, 02/22/16 ............................... 220,109
200,000 Hewlett-Packard
4.500%, 03/01/13 ............................... 214,207
SEE ACCOMPANYING NOTES TO FINANCIAL STATEMENTS.
55
Aston Funds
MONTAG & CALDWELL BALANCED FUND OCTOBER 31, 2009
SCHEDULE OF INVESTMENTS - CONTINUED
MARKET
PAR VALUE VALUE
--------- --------------
INFORMATION TECHNOLOGY (CONTINUED)
$ 200,000 Oracle
4.950%, 04/15/13 ............................... $ 216,684
--------------
651,000
--------------
TELECOMMUNICATION SERVICES - 2.95%
200,000 BellSouth Capital Funding
7.750%, 02/15/10 ............................... 204,135
250,000 Verizon Communications
5.550%, 02/15/16 ............................... 270,985
--------------
475,120
--------------
TOTAL CORPORATE NOTES AND BONDS
(Cost $3,595,366) .............................. 3,755,092
--------------
U.S. GOVERNMENT AND AGENCY OBLIGATIONS - 11.10%
FANNIE MAE - 1.17%
100,000 6.000%, 05/15/11 .................................. 107,901
75,000 4.375%, 09/15/12 .................................. 80,711
--------------
188,612
--------------
FREDDIE MAC - 1.01%
150,000 4.500%, 01/15/13 .................................. 163,108
--------------
U.S. TREASURY BONDS - 3.62%
150,000 8.125%, 08/15/19 .................................. 208,313
100,000 8.000%, 11/15/21 .................................. 140,859
200,000 5.375%, 02/15/31 .................................. 232,344
--------------
581,516
--------------
U.S. TREASURY NOTES - 5.30%
175,000 4.000%, 02/15/15 .................................. 188,918
225,000 4.500%, 02/15/16 .................................. 247,922
225,000 2.625%, 04/30/16 .................................. 222,047
175,000 4.625%, 02/15/17 .................................. 193,416
--------------
852,303
--------------
TOTAL U.S. GOVERNMENT AND AGENCY OBLIGATIONS
(Cost $1,673,356) .............................. 1,785,539
--------------
TOTAL INVESTMENTS - 98.32%
(Cost $14,992,111)** ....................................... 15,816,733
--------------
NET OTHER ASSETS AND LIABILITIES - 1.68% ...................... 269,681
--------------
NET ASSETS - 100.00% .......................................... $ 16,086,414
==============
----------
* Non-income producing security.
** Aggregate cost for Federal income tax purposes is $15,345,575.
Gross unrealized appreciation ..... $ 795,318
Gross unrealized depreciation ..... (324,160)
---------
Net unrealized appreciation ....... $ 471,158
=========
MTN Medium Term Note
PORTFOLIO COMPOSITION
Common Stocks ......................................... 65%
U.S. Government Obligations ........................... 9%
U.S. Government Agency Obligations .................... 2%
Corporate Notes and Bonds (Moody's Ratings - unaudited)
Aaa ................................................ 2%
Aa ................................................. 8%
A .................................................. 14%
---
100%
===
SEE ACCOMPANYING NOTES TO FINANCIAL STATEMENTS.
56
Aston Funds
BALANCED FUND
PORTFOLIO MANAGERS COMMENTARY (UNAUDITED) OCTOBER 31, 2009
Robert E. Canakaris, CFA, CIC; Tere Alvarez Canida, CFA
William J. Canida, CFA & Alan M. Habecht
Q. What were the most significant market factors affecting Fund performance
and returns relative to the benchmark during the past 12 months?
A. After selling off sharply, the stock market experienced a remarkable rally
beginning in March 2009 in anticipation of a recovery in economic activity.
In this environment, many of the stocks that helped the Fund significantly
outperform during the previous two years were a short-term drag on relative
performance given a resurgence in more beaten down stocks and an apparent
increase in investors' appetite for risk. In our work, valuations of many
of the more cyclical and lesser quality stocks appear extended based on
2010 earnings. The biggest detractors came from the Consumer Discretionary
and Financials sectors. We would note both of these areas were contributors
to the Fund's 2008 positive relative returns. The Fund benefited from
strong stock selection in the Technology, Energy, and Healthcare sectors.
The bond portion of the portfolio outperformed due to an overweight
position in Corporate bonds and underweight stake in US Treasuries.
Above-average exposure to lower-quality investment-grade Corporates also
added to returns as systemic risk declined with the broader economy. A
barbell approach to credit that emphasized Corporates on the long end of
the curve and higher-quality floating-rate notes on the short end, enhanced
returns as well.
Q. What were the best performing holdings for the Fund during the period?
A. Apple and Google aided performance within Technology. Apple's iPhone
continued to drive growth in earnings, and the company benefited from
better than expected sales of both its computers and iPods, while top-line
growth resumed at Google and its management demonstrated an ability to
restrain spending. Cameron International performed well on a recovery in
the price of oil and a secular trend towards deep-water oil exploration.
Within Healthcare, Schering-Plough was one of the portfolio's best
performers after it accepted an offer to be acquired by Merck. Also,
Allergan benefited from an expectation that its earnings would improve with
increased expenditures on discretionary healthcare items such as cosmetic
surgery.
Q. What were the weakest performing holdings?
A. Stryker's performance lagged in 2009 as the company had several unresolved
regulatory issues. Wells Fargo hurt the Fund's results during the year as
we sold it and built a position in JPMorgan Chase. Devon Energy was
negatively affected by ongoing weakness in the price of natural gas, which
did not recover. Gilead Sciences and Procter & Gamble were among our better
performers in 2008 but did not do well in 2009 due to an investor
preference for more cyclical issues.
Q. How was the Fund positioned as of October 31, 2009?
A. We continue to believe the stock market reached a bear market low on March
9, 2009, and that a cyclical bull market is under way. While the S&P 500 is
more fairly valued after a nearly 60% increase, we are still finding plenty
of attractively valued stocks. Furthermore, there is ample fiscal and
monetary liquidity to support financial markets and promote economic
growth. In our opinion, a synchronized global economic recovery is under
way amid low inflation that should contribute to higher share prices and
mitigate the stock market's risk. We do see an increasing risk of a market
correction over the short-term, though we would view that development as
merely a correction within a bull market.
The Fund continues to maintain an above-market commitment to Corporate
bonds in anticipation of further spread compression over time. We have
reduced investments in Fannie Mae and Freddie Mac securities given that the
pending resolution of the final structure of government-sponsored
enterprises (GSE) remains a key risk for fixed-income investors. Without
greater clarity on a likely outcome, we do not believe investors are being
compensated appropriately for the uncertainty.
GROWTH OF A HYPOTHETICAL $10,000
INVESTMENT--CLASS N
(PERFORMANCE GRAPH)
Balanced Fund
60% S&P 500
Index/ 40% Barclays
Barclays Capital Capital
Aggregate Bond Morningstar(R) Moderate S&P Aggregate Bond
Balanced Fund Index Allocation Category 500 Index Index
------------- ---------------- ----------------------- ---------- --------------
Sep-95 10,000 10.000 10,000 10,000 10,000
Oct-96 11,847 11,692 10,722 12,364 11,372
Oct-97 14,229 14,334 11,675 16,333 13,113
Oct-98 16,862 16,835 12,766 19,928 15,775
Oct-99 19,772 19,390 12,833 25,041 17,190
Oct-00 22,701 20,715 13,770 26,564 19,344
Oct-01 19,658 18,529 15,775 19,952 21,170
Oct-02 18,805 17,308 16,704 16,939 19,081
Oct-03 20,917 19,819 17,523 20,461 22,170
Oct-04 21,696 21,383 18,492 22,386 23,868
Oct-05 22,390 22,608 18,701 24,338 25,694
Oct-06 23,583 25,274 19,671 28,313 28,764
Oct-07 26,051 28,031 20,730 32,432 32,291
Oct-08 19,600 21,595 20,792 20,731 22,965
Oct-09 22,834 24,193 23,659 22,762 26,578
All dividends and capital gains are reinvested. Indexes are unmanaged and do not
take into account fees, expenses or other costs.
Returns shown in the chart and table do not reflect taxes that a shareholder
would pay on Fund distributions or on the sale of the Fund shares.
The Fund is subject to interest rate risk associated with the underlying bond
holdings in the portfolio. The value of the Fund can decline as interest rates
rise and an investor can lose principal.
RETURNS FOR PERIOD ENDED 10/31/09
Average Annual Total Returns - Class N
One Year 16.50%
Five Year 1.03%
Ten Year 1.45%
Since Inception 6.03%
Inception Date 09/21/95
THE PERFORMANCE DATA QUOTED REPRESENTS PAST PERFORMANCE. PAST PERFORMANCE DOES
NOT GUARANTEE FUTURE RESULTS. INVESTMENT RETURN AND PRINCIPAL VALUE WILL
FLUCTUATE SO THAT AN INVESTOR'S SHARES, UPON REDEMPTION, MAY BE WORTH MORE OR
LESS THAN THEIR ORIGINAL COST. CURRENT PERFORMANCE MAY BE HIGHER OR LOWER THAN
THE PERFORMANCE DATA QUOTED. FOR PERFORMANCE DATA CURRENT TO THE MOST RECENT
MONTH-END, PLEASE VISIT OUR WEBSITE AT www.astonfunds.com.
THE TOTAL EXPENSE RATIO FOR THE N CLASS IS 1.50% AS DISCLOSED IN THE PROSPECTUS
DATED MARCH 1, 2009. PLEASE REFER TO THE FINANCIAL HIGHLIGHTS SECTION IN THIS
REPORT FOR MORE 2009 FISCAL YEAR END RELATED INFORMATION.
57
Aston Funds
BALANCED FUND OCTOBER 31, 2009
SCHEDULE OF INVESTMENTS
(PIE CHART)
COMMON STOCKS 59%
U.S. GOVERNMENT AND AGENCY OBLIGATIONS 18%
CORPORATE NOTES AND BONDS 18%
CASH & NET OTHER ASSETS AND LIABILITIES 5%
% OF TOTAL NET ASSETS
MARKET
SHARES VALUE
--------- --------------
COMMON STOCKS - 59.19%
CONSUMER DISCRETIONARY - 6.44%
7,100 McDonald's ........................................ $ 416,131
3,650 NIKE, Class B ..................................... 226,957
7,550 TJX ............................................... 281,993
5,750 Walt Disney ....................................... 157,378
--------------
1,082,459
--------------
CONSUMER STAPLES - 13.31%
8,450 Coca-Cola ......................................... 450,470
4,050 Colgate-Palmolive ................................. 318,451
5,450 Costco Wholesale .................................. 309,832
4,500 CVS Caremark ...................................... 158,850
6,600 PepsiCo ........................................... 399,630
3,700 Procter & Gamble .................................. 214,600
7,750 Wal-Mart Stores ................................... 385,020
--------------
2,236,853
--------------
ENERGY - 5.53%
7,600 Cameron International * ........................... 280,972
3,300 Occidental Petroleum .............................. 250,404
6,400 Schlumberger ...................................... 398,080
--------------
929,456
--------------
FINANCIALS - 3.42%
19,650 Charles Schwab .................................... 340,731
5,600 JPMorgan Chase .................................... 233,912
--------------
574,643
--------------
HEALTH CARE - 9.71%
8,300 Abbott Laboratories ............................... 419,731
5,500 Allergan .......................................... 309,375
7,100 Gilead Sciences * ................................. 302,105
15,650 Schering-Plough ................................... 441,330
3,450 Stryker ........................................... 158,700
--------------
1,631,241
--------------
MARKET
SHARES VALUE
--------- --------------
INDUSTRIALS - 3.89%
3,500 3M ................................................ $ 257,495
1,700 Burlington Northern Santa Fe ...................... 128,044
2,800 Emerson Electric .................................. 105,700
3,650 Fluor ............................................. 162,133
--------------
653,372
--------------
INFORMATION TECHNOLOGY - 16.41%
2,650 Apple * ........................................... 499,525
910 Google, Class A * ................................. 487,869
10,100 Hewlett-Packard ................................... 479,346
9,000 Juniper Networks * ................................ 229,590
9,850 QUALCOMM .......................................... 407,888
3,650 Research In Motion * .............................. 214,365
5,800 Visa, Class A ..................................... 439,408
--------------
2,757,991
--------------
MATERIALS - 0.48%
1,200 Monsanto .......................................... 80,616
--------------
TOTAL COMMON STOCKS
(Cost $8,816,902) .............................. 9,946,631
--------------
PAR VALUE
---------
U.S. GOVERNMENT AND AGENCY OBLIGATIONS - 17.55%
FANNIE MAE - 5.31%
$ 41,516 7.500%, 02/01/35,
Pool # 787557 .................................. 45,988
17,629 7.500%, 04/01/35,
Pool # 819231 .................................. 19,529
146,302 6.000%, 11/01/35,
Pool # 844078 .................................. 156,071
271,600 6.000%, 12/01/36,
Pool # 888029 .................................. 289,311
166,682 5.500%, 06/01/37,
Pool # 918778 .................................. 175,696
195,407 5.500%, 03/01/38,
Pool # 962344 .................................. 205,944
--------------
892,539
--------------
FREDDIE MAC - 4.32%
244,995 5.500%, 11/01/20,
Gold Pool # G18083 ............................. 261,491
43,472 5.500%, 12/01/20,
Gold Pool # G11820 ............................. 46,399
180,529 5.500%, 09/01/37,
Gold Pool # G03202 ............................. 190,433
218,420 5.000%, 04/01/38,
Gold Pool # G04334 ............................. 226,662
--------------
724,985
--------------
GOVERNMENT NATIONAL MORTGAGE ASSOCIATION - 1.97%
193,827 5.000%, 08/20/37,
Pool # 4015 .................................... 201,756
122,394 5.500%, 02/15/39,
Pool # 698060 .................................. 129,430
--------------
331,186
--------------
U.S. TREASURY BILLS - 5.95%
500,000 0.140%, 12/03/09 (a) .............................. 499,982
500,000 0.060%, 01/28/10 (a) .............................. 499,939
--------------
999,921
--------------
TOTAL U.S. GOVERNMENT AND AGENCY OBLIGATIONS
(Cost $2,827,184) .............................. 2,948,631
--------------
SEE ACCOMPANYING NOTES TO FINANCIAL STATEMENTS.
58
Aston Funds
BALANCED FUND OCTOBER 31, 2009
SCHEDULE OF INVESTMENTS - CONTINUED
MARKET
PAR VALUE VALUE
--------- --------------
CORPORATE NOTES AND BONDS - 17.52%
CONSUMER DISCRETIONARY - 2.96%
$ 70,000 Darden Restaurants
Senior Unsecured Notes
6.800%, 10/15/37 ............................... $ 72,456
50,000 Home Depot
Senior Unsecured Notes
5.875%, 12/16/36 ............................... 48,935
250,000 Macy's Retail Holdings
6.375%, 03/15/37 ............................... 205,000
50,000 Time Warner Cable
8.250%, 02/14/14 ............................... 58,682
50,000 Whirlpool, MTN
Senior Unsecured Notes
8.600%, 05/01/14 ............................... 57,118
60,000 Wyndham Worldwide
Senior Unsecured Notes
6.000%, 12/01/16 ............................... 54,695
--------------
496,886
--------------
CONSUMER STAPLES - 0.62%
50,000 Kroger
8.050%, 02/01/10 ............................... 50,837
50,000 Reynolds American
7.750%, 06/01/18 ............................... 54,073
--------------
104,910
--------------
ENERGY - 3.15%
Hess
50,000 Senior Unsecured Notes
8.125%, 02/15/19 ............................... 60,756
50,000 Senior Unsecured Notes
7.875%, 10/01/29 ............................... 59,082
50,000 Kinder Morgan Energy Partners
Senior Unsecured Notes
9.000%, 02/01/19 ............................... 61,017
50,000 Marathon Oil Canada
Senior Secured Notes
8.375%, 05/01/12 ............................... 56,526
50,000 Nabors Industries
9.250%, 01/15/19 ............................... 60,463
125,000 Nexen
Senior Unsecured Notes
7.500%, 07/30/39 ............................... 138,430
25,000 Trans-Canada Pipelines
Senior Unsecured Notes
7.625%, 01/15/39 ............................... 32,001
50,000 Weatherford International
9.625%, 03/01/19 ............................... 61,962
--------------
530,237
--------------
FINANCIALS - 4.18%
50,000 American Financial Group
Senior Unsecured Notes
9.875%, 06/15/19 ............................... 56,666
100,000 Blackstone Holdings Finance (b)
6.625%, 08/15/19 ............................... 100,919
150,000 Goldman Sachs Capital I
6.345%, 02/15/34 ............................... 142,519
100,000 Jefferies Group
Senior Unsecured Notes
8.500%, 07/15/19 ............................... 108,706
50,000 Marsh & McLennan
Senior Unsecured Notes
9.250%, 04/15/19 ............................... 62,305
MARKET
PAR VALUE VALUE
--------- --------------
FINANCIALS (CONTINUED)
$ 50,000 Rio Tinto Finance
8.950%, 05/01/14 ............................... $ 59,136
250,000 SLM, MTN
Senior Unsecured Notes
5.625%, 08/01/33 ............................... 171,549
--------------
701,800
--------------
HEALTH CARE - 2.26%
110,000 Boston Scientific
Senior Unsecured Notes
7.000%, 11/15/35 ............................... 107,800
50,000 McKesson
Senior Unsecured Notes
7.500%, 02/15/19 ............................... 58,880
50,000 Medtronic
Senior Unsecured Notes
6.500%, 03/15/39 ............................... 58,339
100,000 UnitedHealth Group
Senior Unsecured Notes
1.768%, 02/07/11 (c) ........................... 100,163
50,000 WellPoint
Senior Unsecured Notes
6.800%, 08/01/12 ............................... 55,003
--------------
380,185
--------------
INDUSTRIALS - 1.54%
100,000 Embraer Overseas
6.375%, 01/15/20 ............................... 95,250
50,000 FedEx
Senior Notes
8.000%, 01/15/19 ............................... 60,637
100,000 Tyco International Finance
4.125%, 10/15/14 ............................... 102,267
--------------
258,154
--------------
INFORMATION TECHNOLOGY - 0.25%
50,000 Motorola
Senior Unsecured Notes
6.625%, 11/15/37 ............................... 42,748
--------------
MATERIALS - 0.90%
100,000 ArcelorMittal
Senior Unsecured Notes
7.000%, 10/15/39 ............................... 94,812
50,000 Bemis
Senior Unsecured Notes
6.800%, 08/01/19 ............................... 56,107
--------------
150,919
--------------
TELECOMMUNICATION SERVICES - 0.63%
50,000 Rogers Wireless
Senior Subordinated Notes
8.000%, 12/15/12 ............................... 51,510
50,000 Telus
Senior Unsecured Notes
8.000%, 06/01/11 ............................... 54,527
--------------
106,037
--------------
UTILITIES - 1.03%
50,000 Allegheny Energy Supply (b)
Senior Unsecured Notes
6.750%, 10/15/39 ............................... 48,053
50,000 FPL Group Capital
7.875%, 12/15/15 ............................... 60,807
SEE ACCOMPANYING NOTES TO FINANCIAL STATEMENTS.
59
Aston Funds
BALANCED FUND OCTOBER 31, 2009
SCHEDULE OF INVESTMENTS - CONTINUED
MARKET
PAR VALUE VALUE
--------- --------------
UTILITIES (CONTINUED)
$ 50,000 Sempra Energy
Senior Unsecured Notes
9.800%, 02/15/19 ............................... $ 63,886
--------------
172,746
--------------
TOTAL CORPORATE NOTES AND BONDS
(Cost $2,796,334) .............................. 2,944,622
--------------
SHARES
---------
INVESTMENT COMPANY - 5.73%
962,607 BlackRock Liquidity Funds
TempCash Portfolio ............................. 962,607
--------------
TOTAL INVESTMENT COMPANY
(Cost $962,607) ................................ 962,607
--------------
TOTAL INVESTMENTS - 99.99%
(Cost $15,403,027)** ....................................... 16,802,491
--------------
NET OTHER ASSETS AND LIABILITIES - 0.01% ...................... 2,479
--------------
NET ASSETS - 100.00% .......................................... $ 16,804,970
==============
----------
* Non-income producing security.
** Aggregate cost for Federal income tax purposes is $15,649,935.
Gross unrealized appreciation... $1,577,111
Gross unrealized depreciation... (424,555)
----------
Net unrealized appreciation..... $1,152,556
==========
(a) Annualized yield at the time of purchase.
(b) Securities exempt from registration under Rule 144A of the Securities Act
of 1933, as amended. These securities are purchased in accordance with
guidelines approved by the Fund's Board of Trustees and may only be resold,
in transactions exempt from registration, to qualified institutional
buyers. At October 31, 2009, these securities amounted to $148,972 or 0.89%
of net assets. These securities have been determined by the Adviser to be
liquid securities.
(c) Floating rate note. The interest rate shown reflects the rate in effect at
October 31, 2009.
MTN Medium Term Note
PORTFOLIO COMPOSITION
Common Stocks ......................................... 59%
Investment Company .................................... 6%
U.S. Government Obligations ........................... 6%
U.S. Government Agency Obligations .................... 12%
Corporate Notes and Bonds (Moody's Ratings - unaudited)
A .................................................. 2%
Baa ................................................ 12%
Ba ................................................. 3%
---
100%
===
SEE ACCOMPANYING NOTES TO FINANCIAL STATEMENTS.
60
Aston Funds
TCH FIXED INCOME FUND
PORTFOLIO MANAGERS COMMENTARY (UNAUDITED) OCTOBER 31, 2009
Tere Alvarez Canida, CFA; Alan M. Habecht & William J. Canida, CFA
Q. What were the most significant market factors affecting Fund performance
and returns relative to the benchmark during the past 12 months?
A. An overweight position in Corporate bonds and underweight stake in US
Treasuries aided performance as Corporates delivered outsized returns
versus Treasuries during the period. The Fund's above-market exposure to
lower-quality investment-grade Corporates also added to returns on both an
absolute and a duration-adjusted basis as systemic risk declined with the
broader economy showing signs of stabilizing. Overall, the structure of the
portfolio enhanced returns as well, as we maintained a barbell approach to
credit, emphasizing lower-quality investment-grade Corporates on the long
end of the curve and higher-quality floating-rate notes on the short end.
Valuations in floating-rate notes improved along with a sharp narrowing in
credit spreads and a marked increase in liquidity.
Q. What were the best performing holdings for the Fund during the period?
A. The portfolio's best performing holdings included Corporate bonds issued by
financial institutions, as the Financials sector was the best performing
area of the credit market. Longer dated securities, lower-quality
investment-grade securities, and floating-rate notes boosted returns as
well.
Q. What were the weakest performing holdings?
A. Positions in US Treasury securities were among the weakest performers in
the Fund.
Q. How was the Fund positioned as of October 31, 2009?
A. We have maintained an above-market commitment to Corporate bonds in
anticipation of further spread compression over time. We think Corporates
remain attractive in a risk-reward context. The unprecedented narrowing in
credit spreads throughout 2009 reflects the diminution of systemic risk. We
believe Corporate bond valuations are attractive, particularly ahead of
heightened regulation and strengthened capital requirements. We anticipate
further spread compression in 2010.
In anticipation of rising Treasury yields, we have emphasized Treasury
Inflation Protected Securities (TIPS) within the Treasury allocation.
Notwithstanding the expectation for deflationary pressures over the
near-term, we believe the massive stimulus of credit easing and increased
government deficit spending will prove inflationary over time. Accordingly,
we believe TIPS will outperform nominal Treasuries with similar maturities
in 2010.
We have reduced investments in Fannie Mae and Freddie Mac given that the
pending resolution for the final structure of government-sponsored
enterprises (GSE) remains a key risk for fixed-income investors. We believe
the most likely outcome for the GSEs incorporates some combination of a
public utility model with covered bonds for funding purposes. Still,
without greater clarity on a likely outcome, we do not believe investors
are being compensated appropriately for the uncertainty.
GROWTH OF A HYPOTHETICAL
$10,000 INVESTMENT--CLASS N
(PERFORMANCE GRAPH)
TCH Fixed Income Fund
TCH Fixed Morningstar(R)
Income Fund - Intermediate-Term Barclays Capital
Class N Shares Bond Category Aggregate Bond Index
-------------- ----------------- --------------------
Dec-93 10,000 10,000 10,000
Oct-94 9,677 9,535 9,636
Oct-95 11,117 11,026 11,066
Oct-96 11,758 11,671 11,659
Oct-97 12,797 12,709 12,652
Oct-98 13,778 13,895 13,614
Oct-99 13,919 13,969 13,617
Oct-00 14,891 14,989 14,411
Oct-01 16,840 17,171 16,359
Oct-02 17,310 18,183 16,953
Oct-03 18,103 19,074 17,992
Oct-04 19,129 20,129 18,893
Oct-05 19,205 20,356 19,056
Oct-06 20,052 21,412 19,952
Oct-07 21,368 22,564 20,787
Oct-08 19,896 22,632 19,291
Oct-09 24,470 25,753 22,736
All dividends and capital gains are reinvested. Indexes are unmanaged and do not
take into account fees, expenses or other costs.
Returns shown in the chart and table do not reflect taxes that a shareholder
would pay on Fund distributions or on the sale of the Fund shares.
Bond funds have the same interest rate, high yield and credit risks associated
with the underlying bonds in the portfolio, all of which could reduce the Fund's
value. As interest rates rise, the value of the Fund can decline and an investor
can lose principal.
RETURNS FOR PERIOD ENDED 10/31/09
Average Annual Total Returns - Class N
One Year 22.99%
Five Year 5.05%
Ten Year 5.80%
Since Inception 5.80%
Inception Date 12/13/93
Average Annual Total Returns - Class I
One Year 23.14%
Five Year 5.29%
Since Inception 6.06%
Inception Date 07/31/00
THE PERFORMANCE DATA QUOTED REPRESENTS PAST PERFORMANCE. PAST PERFORMANCE DOES
NOT GUARANTEE FUTURE RESULTS. INVESTMENT RETURN AND PRINCIPAL VALUE WILL
FLUCTUATE SO THAT AN INVESTOR'S SHARES, UPON REDEMPTION, MAY BE WORTH MORE OR
LESS THAN THEIR ORIGINAL COST. CURRENT PERFORMANCE MAY BE HIGHER OR LOWER THAN
THE PERFORMANCE DATA QUOTED. FOR PERFORMANCE DATA CURRENT TO THE MOST RECENT
MONTH-END, PLEASE VISIT OUR WEBSITE AT www.astonfunds.com.
THE TOTAL EXPENSE RATIO FOR THE N CLASS AND I CLASS IS 1.08% AND 0.83%,
RESPECTIVELY, AS DISCLOSED IN THE PROSPECTUS DATED MARCH 1, 2009. THE
PERFORMANCE QUOTED WOULD HAVE BEEN LOWER IF WAIVERS HAD NOT BEEN IN EFFECT.
PLEASE REFER TO THE FINANCIAL HIGHLIGHTS SECTION IN THIS REPORT FOR MORE 2009
FISCAL YEAR END RELATED INFORMATION.
61
Aston Funds
TCH FIXED INCOME FUND OCTOBER 31, 2009
SCHEDULE OF INVESTMENTS
(PIE CHART)
CORPORATE NOTES AND BONDS 53%
U.S. GOVERNMENT AND AGENCY OBLIGATIONS 38%
CASH & NET OTHER ASSETS AND LIABILITIES 6%
COMMERCIAL MORTGAGE-BACKED SECURITIES 3%
% OF TOTAL NET ASSETS
MARKET
PAR VALUE VALUE
---------- --------------
CORPORATE NOTES AND BONDS - 52.50%
CONSUMER DISCRETIONARY - 6.83%
$ 250,000 CBS
8.875%, 05/15/19 .............................. $ 282,659
500,000 JC Penney
6.375%, 10/15/36 .............................. 423,750
1,000,000 Limited Brands
Senior Unsecured Notes
7.600%, 07/15/37 .............................. 862,500
Macy's Retail Holdings
100,000 8.875%, 07/15/15 (a) .......................... 106,250
500,000 6.375%, 03/15/37 .............................. 410,000
250,000 Staples
Senior Unsecured Notes
9.750%, 01/15/14 .............................. 303,232
450,000 Time Warner Cable
8.250%, 02/14/14 .............................. 528,142
250,000 TJX
Senior Unsecured Notes
6.950%, 04/15/19 .............................. 293,978
250,000 Tyco Electronics Group
7.125%, 10/01/37 .............................. 257,091
250,000 Viacom
Senior Unsecured Notes
6.125%, 10/05/17 .............................. 267,807
450,000 Whirlpool, MTN
Senior Unsecured Notes
8.600%, 05/01/14 .............................. 514,065
200,000 Wyndham Worldwide
Senior Unsecured Notes
6.000%, 12/01/16 .............................. 182,318
150,000 Yum! Brands
Senior Unsecured Notes
6.875%, 11/15/37 .............................. 164,121
--------------
4,595,913
--------------
MARKET
PAR VALUE VALUE
---------- --------------
CONSUMER STAPLES - 4.64%
Altria Group
$ 500,000 8.500%, 11/10/13 .............................. $ 580,608
200,000 10.200%, 02/06/39 ............................. 267,357
250,000 CVS Caremark
6.600%, 03/15/19 .............................. 279,105
1,000,000 Kraft Foods
Senior Unsecured Notes
7.000%, 08/11/37 .............................. 1,096,030
Kroger
200,000 8.050%, 02/01/10 .............................. 203,348
250,000 6.900%, 04/15/38 .............................. 291,391
150,000 Pepsico
Senior Unsecured Notes
7.900%, 11/01/18 .............................. 188,703
200,000 Reynolds American
7.750%, 06/01/18 .............................. 216,290
--------------
3,122,832
--------------
ENERGY - 8.28%
500,000 Ecopetrol SA
7.625%, 07/23/19 .............................. 547,500
250,000 Energy Transfer Partners
Senior Unsecured Notes
9.000%, 04/15/19 .............................. 302,368
250,000 Halliburton
Senior Unsecured Notes
7.450%, 09/15/39 .............................. 312,614
Hess
Senior Unsecured Notes
400,000 8.125%, 02/15/19 .............................. 486,047
100,000 7.875%, 10/01/29 .............................. 118,164
400,000 Kinder Morgan Energy Partners
Senior Unsecured Notes
9.000%, 02/01/19 .............................. 488,135
1,005,000 Marathon Oil Canada
Senior Secured Notes
8.375%, 05/01/12 .............................. 1,136,165
450,000 Nabors Industries
9.250%, 01/15/19 .............................. 544,163
500,000 Nexen
Senior Unsecured Notes
7.500%, 07/30/39 .............................. 553,720
225,000 Trans-Canada Pipelines
Senior Unsecured Notes
7.625%, 01/15/39 .............................. 288,007
250,000 Valero Energy
Senior Unsecured Notes
9.375%, 03/15/19 .............................. 296,169
400,000 Weatherford International
9.625%, 03/01/19 .............................. 495,698
--------------
5,568,750
--------------
FINANCIALS - 12.70%
250,000 AFLAC
Senior Notes
8.500%, 05/15/19 .............................. 293,858
450,000 American Financial Group
Senior Unsecured Notes
9.875%, 06/15/19 .............................. 509,990
250,000 Bank of America
Senior Unsecured Notes
0.799%, 09/11/12 (c) .......................... 244,643
1,500,000 Bear Stearns, MTN
Senior Unsecured Notes
0.809%, 11/21/16 (c) .......................... 1,393,371
SEE ACCOMPANYING NOTES TO FINANCIAL STATEMENTS.
62
Aston Funds
TCH FIXED INCOME FUND OCTOBER 31, 2009
SCHEDULE OF INVESTMENTS - CONTINUED
MARKET
PAR VALUE VALUE
---------- --------------
FINANCIALS (CONTINUED)
$ 150,000 Blackstone Holdings Finance
6.625%, 08/15/19 (b) .......................... $ 151,379
250,000 Bunge Ltd Finance
8.500%, 06/15/19 .............................. 291,667
2,000,000 Citigroup
Subordinated Notes
0.943%, 08/25/36 (c) .......................... 1,129,794
500,000 General Electric Capital, MTN,
Series A
0.852%, 05/05/26 (c) .......................... 393,989
800,000 Goldman Sachs Capital I
6.345%, 02/15/34 .............................. 760,103
500,000 Jefferies Group
Senior Unsecured Notes
8.500%, 07/15/19 .............................. 543,531
300,000 Marsh & McLennan
Senior Unsecured Notes
9.250%, 04/15/19 .............................. 373,833
750,000 Merrill Lynch, MTN
6.875%, 04/25/18 .............................. 808,307
1,000,000 NB Capital Trust II
7.830%, 12/15/26 .............................. 965,000
1,000,000 SLM, MTN
Senior Unsecured Notes
5.625%, 08/01/33 .............................. 686,195
--------------
8,545,660
--------------
HEALTH CARE - 6.55%
500,000 Biogen Idec
Senior Unsecured Notes
6.875%, 03/01/18 .............................. 546,251
300,000 Boston Scientific
Senior Unsecured Notes
6.250%, 11/15/35 .............................. 294,000
250,000 Express Scripts
Senior Unsecured Notes
6.250%, 06/15/14 .............................. 274,963
200,000 Hospira
Senior Unsecured Notes, GMTN
6.400%, 05/15/15 .............................. 222,516
250,000 Humana
Senior Unsecured Notes
8.150%, 06/15/38 .............................. 232,699
750,000 McKesson
Senior Unsecured Notes
7.500%, 02/15/19 .............................. 883,205
450,000 Medtronic
Senior Unsecured Notes
6.500%, 03/15/39 .............................. 525,049
250,000 Pfizer
Senior Unsecured Notes
7.200%, 03/15/39 .............................. 315,223
500,000 Roche Holdings
Senior Unsecured Notes
7.000%, 03/01/39 (b) .......................... 616,614
450,000 WellPoint
Senior Unsecured Notes
6.800%, 08/01/12 .............................. 495,027
--------------
4,405,547
--------------
INDUSTRIALS - 2.21%
250,000 Caterpillar
7.000%, 12/15/13 .............................. 286,595
MARKET
PAR VALUE VALUE
---------- --------------
INDUSTRIALS (CONTINUED)
$ 300,000 Embraer Overseas
6.375%, 01/15/20 .............................. $ 285,750
250,000 FedEx
Senior Notes
8.000%, 01/15/19 .............................. 303,183
200,000 Ingersoll-Rand Global Holding
6.875%, 08/15/18 .............................. 221,496
100,000 Tyco International Finance
4.125%, 10/15/14 .............................. 102,267
250,000 Waste Management
7.375%, 03/11/19 .............................. 291,765
--------------
1,491,056
--------------
INFORMATION TECHNOLOGY - 1.51%
250,000 KLA Instruments
Senior Unsecured Notes
6.900%, 05/01/18 .............................. 262,342
200,000 Motorola
Senior Unsecured Notes
6.625%, 11/15/37 .............................. 170,992
500,000 Telecom Italia Capital SA
7.721%, 06/04/38 .............................. 581,409
--------------
1,014,743
--------------
MATERIALS - 3.84%
300,000 ArcelorMittal
Senior Unsecured Notes
7.000%, 10/15/39 .............................. 284,436
700,000 Bemis
Senior Unsecured Notes
6.800%, 08/01/19 .............................. 785,495
250,000 Dow Chemical (The)
Senior Unsecured Notes
8.550%, 05/15/19 .............................. 285,692
500,000 International Paper
8.700%, 06/15/38 .............................. 577,785
550,000 Rio Tinto Finance
8.950%, 05/01/14 .............................. 650,497
--------------
2,583,905
--------------
TELECOMMUNICATION SERVICES - 1.42%
450,000 Rogers Wireless
Senior Subordinated Notes
8.000%, 12/15/12 .............................. 463,593
450,000 Telus
Senior Unsecured Notes
8.000%, 06/01/11 .............................. 490,748
--------------
954,341
--------------
UTILITIES - 4.52%
200,000 Allegheny Energy Supply
Senior Unsecured Notes
6.750%, 10/15/39 (b) .......................... 192,211
995,000 CenterPoint Energy
Senior Notes, Series B
7.250%, 09/01/10 .............................. 1,020,318
450,000 FPL Group Capital
7.875%, 12/15/15 .............................. 547,260
250,000 Oncor Electric Delivery
7.500%, 09/01/38 .............................. 304,518
150,000 Pacific Gas & Electric
8.250%, 10/15/18 .............................. 188,863
450,000 Sempra Energy
Senior Unsecured Notes
9.800%, 02/15/19 .............................. 574,978
SEE ACCOMPANYING NOTES TO FINANCIAL STATEMENTS.
63
Aston Funds
TCH FIXED INCOME FUND OCTOBER 31, 2009
SCHEDULE OF INVESTMENTS - CONTINUED
MARKET
PAR VALUE VALUE
---------- --------------
UTILITIES (CONTINUED)
$ 150,000 Virginia Electric and Power
Senior Unsecured Notes
8.875%, 11/15/38 .............................. $ 212,630
--------------
3,040,778
--------------
TOTAL CORPORATE NOTES AND BONDS
(Cost $33,270,786) ............................ 35,323,525
--------------
U.S. GOVERNMENT AND AGENCY OBLIGATIONS - 38.35%
FANNIE MAE - 16.92%
614,127 6.000%, 11/01/17,
Pool # 662854 ................................. 663,346
338,458 6.000%, 04/01/18,
Pool # 725175 ................................. 365,690
502,665 5.500%, 11/01/18,
Pool # 748886 ................................. 540,438
289,192 4.500%, 06/01/19,
Pool # 747860 ................................. 305,416
1,298,279 6.000%, 01/01/21,
Pool # 850787 ................................. 1,397,867
1,000,000 6.000%, 07/02/24 ................................. 1,001,001
729,065 6.000%, 09/01/32,
Pool # 847899 ................................. 783,443
229,514 6.000%, 02/01/34,
Pool # 771952 ................................. 245,915
264,808 7.500%, 02/01/35,
Pool # 787557 ................................. 293,336
112,418 7.500%, 04/01/35,
Pool # 819231 ................................. 124,528
822,323 6.000%, 11/01/35,
Pool # 844078 ................................. 877,232
695,629 5.000%, 05/01/36,
Pool # 745581 ................................. 722,895
543,201 6.000%, 12/01/36,
Pool # 888029 ................................. 578,623
666,729 5.500%, 06/01/37,
Pool # 918778 ................................. 702,785
671,216 6.500%, 10/01/37,
Pool # 888890 ................................. 721,672
1,954,070 5.500%, 03/01/38,
Pool # 962344 ................................. 2,059,438
--------------
11,383,625
--------------
FREDDIE MAC - 12.20%
1,377,190 5.500%, 11/01/20,
Gold Pool # G18083 ............................ 1,469,920
244,446 5.500%, 12/01/20,
Gold Pool # G11820 ............................ 260,906
247,449 6.000%, 10/01/35,
Gold Pool # A47772 ............................ 264,127
705,769 5.500%, 05/01/37,
Pool # A60048 ................................. 744,488
1,444,232 5.500%, 09/01/37,
Gold Pool # G03202 ............................ 1,523,463
1,622,160 5.000%, 02/01/38,
Gold Pool # A73409 ............................ 1,683,372
2,184,198 5.000%, 04/01/38,
Gold Pool # G04334 ............................ 2,266,618
--------------
8,212,894
--------------
MARKET
PAR VALUE VALUE
---------- --------------
GOVERNMENT NATIONAL MORTGAGE ASSOCIATION - 7.05%
$ 718,198 5.000%, 05/01/37,
Pool # 782156 ................................. $ 747,620
1,550,615 5.000%, 08/20/37,
Pool # 4015 ................................... 1,614,050
1,354,381 6.000%, 07/20/38,
Pool # 4195 ................................... 1,441,749
882,433 6.000%, 01/15/39,
Pool # 698036 ................................. 938,161
--------------
4,741,580
--------------
U.S. TREASURY BILLS (D) - 0.76%
500,000 3.875%, 05/15/10 ................................. 509,824
--------------
U.S. TREASURY INFLATION INDEX NOTE - 1.42%
924,086 2.375%, 04/15/11 ................................. 956,645
--------------
TOTAL U.S. GOVERNMENT AND AGENCY OBLIGATIONS
(Cost $24,379,750) ............................ 25,804,568
--------------
COMMERCIAL MORTGAGE-BACKED SECURITIES - 2.58%
275,000 Bear Stearns Commercial
Mortgage Securities
Series 2007-T28, Class A4
5.742%, 09/11/42 (e) .......................... 277,320
500,000 CS First Boston Mortgage
Securites
Series 2005-C5, Class A2
5.100%, 08/15/38 (e) .......................... 509,255
940,000 JP Morgan Chase Commercial
Mortgage Securities
Series 2005-CB13, Class A2
5.247%, 01/12/43 (e) .......................... 946,007
--------------
TOTAL COMMERCIAL MORTGAGE-BACKED SECURITIES
(Cost $1,547,434) ............................. 1,732,582
--------------
SHARES
---------
INVESTMENT COMPANY - 5.22%
3,515,024 BlackRock Liquidity Funds
TempCash Portfolio ............................ 3,515,024
--------------
TOTAL INVESTMENT COMPANY
(Cost $3,515,024) ............................. 3,515,024
--------------
TOTAL INVESTMENTS - 98.65%
(Cost $62,712,994)* ........................................ 66,375,699
--------------
NET OTHER ASSETS AND LIABILITIES - 1.35% ...................... 907,802
--------------
NET ASSETS - 100.00% .......................................... $ 67,283,501
==============
----------
* Aggregate cost for Federal income tax purposes is $62,700,552.
Gross unrealized appreciation..... $ 5,342,983
Gross unrealized depreciation..... (1,667,836)
-----------
Net unrealized appreciation....... $ 3,675,147
===========
(a) Step Coupon. A bond that pays an initial coupon rate for the first period
and then a higher coupon rate for the following periods until maturity. The
coupon rate was 8.375% until April 17, 2009 and is 8.875% thereafter.
SEE ACCOMPANYING NOTES TO FINANCIAL STATEMENTS.
64
Aston Funds
TCH FIXED INCOME FUND OCTOBER 31, 2009
SCHEDULE OF INVESTMENTS - CONTINUED
(b) Securities exempt from registration under Rule 144A of the Securities Act
of 1933, as amended. These securities are purchased in accordance with
guidelines approved by the Fund's Board of Trustees and may only be resold,
in transactions exempt from registration, to qualified institutional
buyers. At October 31, 2009, these securities amounted to $960,204 or 1.43%
of net assets. These securities have been determined by the Sub-Adviser to
be liquid securities.
(c) Variable rate bond. The interest rate shown reflects the rate in effect at
October 31, 2009.
(d) Annualized yield at the time of purchase.
(e) Standard & Poor's (S&P) credit ratings are used in the absence of a rating
by Moody's Investors, Inc.
GMTN Global Medium Term Note
MTN Medium Term Note
PORTFOLIO COMPOSITION
Investment Company ...................................... 5%
U.S. Government Obligations ............................. 2%
U.S. Government Agency Obligations ...................... 36%
Corporate Notes and Bonds (Moody's Ratings (e) unaudited)
Aaa .................................................. 3%
Aa ................................................... 3%
A .................................................... 9%
Baa .................................................. 36%
Ba ................................................... 6%
---
100%
===
SEE ACCOMPANYING NOTES TO FINANCIAL STATEMENTS.
65
Aston Funds
OCTOBER 31, 2009
STATEMENT OF ASSETS AND LIABILITIES
MONTAG & CALDWELL VEREDUS SELECT
GROWTH FUND GROWTH FUND
----------------- --------------
ASSETS:
Investments:
Investments at cost .............................................................. $2,218,157,211 $ 81,328,976
Net unrealized appreciation (depreciation) ....................................... 268,930,401 4,985,278
-------------- ------------
Total investments at value .................................................... 2,487,087,612 86,314,254
Receivables:
Dividends and interest ........................................................... 2,234,274 22,566
Dividend reclaims ................................................................ -- --
Fund shares sold ................................................................. 7,410,071 165,645
Investments sold ................................................................. 15,194,801 3,888,176
Due from Adviser, net (Note G) ................................................... -- --
Other assets ........................................................................... 15,871 948
-------------- ------------
Total assets .................................................................. 2,511,942,629 90,391,589
-------------- ------------
LIABILITIES:
Payables:
Dividend distribution ............................................................ -- --
Investments purchased ............................................................ 19,420,456 2,870,636
Fund shares redeemed ............................................................. 3,685,804 270,994
Due to Adviser, net (Note G) ..................................................... 1,425,526 74,040
Administration fees (Note G) ..................................................... 105,284 5,892
Distribution fees (Note G) ....................................................... 99,493 3,177
Audit and tax fees ............................................................... 24,917 15,024
Custodian fees ................................................................... 23,421 2,919
Transfer agent fees .............................................................. 149,235 5,833
Trustees fees and related expenses (Note G) ...................................... 3,389 --
Accrued expenses and other payables .............................................. 181,789 6,614
-------------- ------------
Total liabilities ............................................................. 25,119,314 3,255,129
-------------- ------------
NET ASSETS ............................................................................. $2,486,823,315 $ 87,136,460
============== ============
NET ASSETS CONSIST OF:
Paid in capital ..................................................................... $2,320,799,613 $121,419,447
Accumulated undistributed (distribution in excess of) net investment income (loss) .. 7,373,004 --
Accumulated net realized loss on investments, purchased options and payments by
affiliates ....................................................................... (110,279,703) (39,268,265)
Net unrealized appreciation (depreciation) on investments and purchased options ..... 268,930,401 4,985,278
-------------- ------------
TOTAL NET ASSETS ....................................................................... $2,486,823,315 $ 87,136,460
============== ============
CLASS N:
Net Assets .......................................................................... $1,277,345,869 $ 39,437,033
Shares of beneficial interest outstanding (unlimited authorization) ................. 61,198,083 4,346,721
NET ASSET VALUE Offering and redemption price per share
(Net Assets/Shares Outstanding) ............................................... $ 20.87 $ 9.07
============== ============
CLASS I:
Net Assets .......................................................................... $1,205,637,140 $ 47,699,427
Shares of beneficial interest outstanding (unlimited authorization) ................. 57,491,570 5,209,752
NET ASSET VALUE Offering and redemption price per share
(Net Assets/Shares Outstanding) ............................................... $ 20.97 $ 9.16
============== ============
CLASS R:
Net Assets .......................................................................... $ 3,840,306 $ --
Shares of beneficial interest outstanding (unlimited authorization) ................. 185,293 --
NET ASSET VALUE Offering and redemption price per share
(Net Assets/Shares Outstanding) ............................................... $ 20.73 $ --
============== ============
SEE ACCOMPANYING NOTES TO FINANCIAL STATEMENTS.
66
Aston Funds
OPTIMUM TAMRO RIVER ROAD OPTIMUM MONTAG & CALDWELL
LARGE CAP VALUE DIVERSIFIED DIVIDEND ALL MID CAP MID CAP
GROWTH FUND OPPORTUNITY FUND FUND EQUITY FUND CAP VALUE FUND FUND GROWTH FUND
------------ ---------------- ------------ ----------- -------------- -------------- -----------------
$195,391,684 $ 4,063,647 $237,470,737 $ 9,157,555 $144,360,692 $ 969,308,941 $2,886,806
7,046,648 137,519 (11,744,893) 1,362,314 14,193,425 19,381,485 99,487
------------ ----------- ------------ ----------- ------------ -------------- ----------
202,438,332 4,201,166 225,725,844 10,519,869 158,554,117 988,690,426 2,986,293
180,064 6,797 336,969 1,195 376,962 179,558 754
-- -- 820 -- 18,942 -- --
11,496 2 19,312 28,915 143,394 3,557,789 29
1,287,484 194,658 1,781,059 -- 1,093,392 8,113,867 --
-- -- -- -- -- -- 5,519
2,170 38 2,398 1,257 617 6,780 488
------------ ----------- ------------ ----------- ------------ -------------- ----------
203,919,546 4,402,661 227,866,402 10,551,236 160,187,424 1,000,548,420 2,993,083
------------ ----------- ------------ ----------- ------------ -------------- ----------
-- -- -- -- 47,750 -- --
1,815,790 -- 1,907,816 13,875 747,582 3,745,396 13,983
201,992 32,945 1,903 23,262 216,333 2,667,995 --
117,872 12,730 136,929 4,143 98,428 631,219 --
9,572 1,410 13,681 1,938 8,181 44,864 1,599
4,494 344 1,573 -- 6,366 67,060 232
19,158 14,570 17,714 14,836 14,930 19,010 15,006
6,837 1,727 6,303 1,491 5,938 11,786 1,011
15,595 2,920 5,928 4,948 10,644 87,699 1,642
1,036 204 697 123 997 4,045 76
29,786 2,147 20,317 648 2,977 83,689 160
------------ ----------- ------------ ----------- ------------ -------------- ----------
2,222,132 68,997 2,112,861 65,264 1,160,126 7,362,763 33,709
------------ ----------- ------------ ----------- ------------ -------------- ----------
$201,697,414 $ 4,333,664 $225,753,541 $10,485,972 $159,027,298 $ 993,185,657 $2,959,374
============ =========== ============ =========== ============ ============== ==========
$235,595,035 $10,555,948 $268,565,684 $10,583,495 $157,199,713 $ 974,476,191 $3,657,885
767,143 8,948 263,036 -- 27,627 130,625 --
(41,711,412) (6,368,751) (31,330,286) (1,459,837) (12,393,467) (802,644) (797,998)
7,046,648 137,519 (11,744,893) 1,362,314 14,193,425 19,381,485 99,487
------------ ----------- ------------ ----------- ------------ -------------- ----------
$201,697,414 $ 4,333,664 $225,753,541 $10,485,972 $159,027,298 $ 993,185,657 $2,959,374
============ =========== ============ =========== ============ ============== ==========
$ 56,304,527 $ 4,333,664 $ 20,173,483 $10,485,972 $ 81,842,162 $ 842,232,804 $2,959,374
4,447,220 548,361 2,426,944 1,079,033 9,540,484 37,051,190 433,457
$ 12.66 $ 7.90 $ 8.31 $ 9.72 $ 8.58 $ 22.73 $ 6.83
============ =========== ============ =========== ============ ============== ==========
$144,805,253 $ -- $205,580,058 $ -- $ 77,185,136 $ 150,952,853 $ --
11,228,146 -- 24,742,783 -- 9,002,008 6,563,216 --
$ 12.90 $ -- $ 8.31 $ -- $ 8.57 $ 23.00 $ --
============ =========== ============ =========== ============ ============== ==========
$ 587,634 $ -- $ -- $ -- $ -- $ -- $ --
47,183 -- -- -- -- -- --
$ 12.45 $ -- $ -- $ -- $ -- $ -- $ --
============ =========== ============ =========== ============ ============== ==========
SEE ACCOMPANYING NOTES TO FINANCIAL STATEMENTS.
67
Aston Funds
OCTOBER 31, 2009
STATEMENT OF ASSETS AND LIABILITIES - CONTINUED
CARDINAL RIVER ROAD
MID CAP SMALL-MID
VALUE FUND CAP FUND
---------- ------------
ASSETS:
Investments:
Investments at cost ................................................................... $ 879,913 $196,410,350
Net unrealized appreciation (depreciation) ............................................ 46,149 12,124,735
---------- ------------
Total investments at value ......................................................... 926,062 208,535,085
Receivables:
Dividends and interest ................................................................ 43 191,969
Dividend reclaims ..................................................................... -- --
Fund shares sold ...................................................................... 3,500 351,300
Investments and foreign currency sold ................................................. -- 778,584
Due from Adviser, net (Note G) ........................................................ 5,382 --
Other assets ................................................................................ 16 1,276
---------- ------------
Total assets ....................................................................... 935,003 209,858,214
---------- ------------
LIABILITIES:
Payables:
Due to custodian ...................................................................... -- --
Investments and foreign currency purchased ............................................ -- 299,876
Fund shares redeemed .................................................................. -- 169,541
Due to Adviser, net (Note G) .......................................................... -- 197,858
Administration fees (Note G) .......................................................... 1,430 11,453
Distribution fees (Note G) ............................................................ 71 3,248
Audit and tax fees .................................................................... 14,303 16,167
Custodian fees ........................................................................ 818 11,711
Transfer agent fees ................................................................... 1,552 5,287
Trustees fees and related expenses (Note G) ........................................... 98 574
Accrued expenses and other payables ................................................... 631 7,624
---------- ------------
Total liabilities .................................................................. 18,903 723,339
---------- ------------
NET ASSETS .................................................................................. $ 916,100 $209,134,875
========== ============
NET ASSETS CONSIST OF:
Paid in capital .......................................................................... $1,245,142 $214,371,346
Accumulated undistributed (distribution in excess of) net investment income (loss) ....... 904 174,467
Accumulated net realized gain (loss) on investments, foreign currency transactions and
payments by affiliates ................................................................ (376,095) (17,535,673)
Net unrealized appreciation (depreciation) on investments and translation of assets and
liabilities denominated in foreign currency ........................................... 46,149 12,124,735
---------- ------------
TOTAL NET ASSETS ............................................................................ $ 916,100 $209,134,875
========== ============
CLASS N:
Net Assets ............................................................................... $ 916,100 $ 41,800,657
Shares of beneficial interest outstanding (unlimited authorization) ...................... 127,774 5,421,561
NET ASSET VALUE Offering and redemption price per share
(Net Assets/Shares Outstanding) .................................................... $ 7.17 $ 7.71
========== ============
CLASS I:
Net Assets ............................................................................... $ -- $167,334,218
Shares of beneficial interest outstanding (unlimited authorization) ...................... -- 21,633,827
NET ASSET VALUE Offering and redemption price per share
(Net Assets/Shares Outstanding) .................................................... $ -- $ 7.73
========== ============
SEE ACCOMPANYING NOTES TO FINANCIAL STATEMENTS.
68
Aston Funds
VEREDUS TAMRO RIVER ROAD NEPTUNE BARINGS DYNAMIC
AGGRESSIVE SMALL CAP SMALL CAP INTERNATIONAL INTERNATIONAL ALLOCATION
GROWTH FUND FUND VALUE FUND FUND FUND FUND
------------ ------------ ------------ ------------- ------------- -----------
$ 41,726,584 $673,837,099 $478,291,670 $ 1,758,018 $23,847,243 $38,917,710
4,271,591 75,057,680 23,390,565 (283,757) 4,308,046 125,826
------------ ------------ ------------ ----------- ----------- -----------
45,998,175 748,894,779 501,682,235 1,474,261 28,155,289 39,043,536
45 83,320 353,686 34,229 34,657 51
-- -- -- 3,356 18,813 --
14,673 7,892,659 1,248,941 -- -- 191,456
649,921 8,263,371 1,604,178 1,134,863 922,583 --
-- -- -- 4,275 -- --
615 4,438 3,177 100 67 96
------------ ------------ ------------ ----------- ----------- -----------
46,663,429 765,138,567 504,892,217 2,651,084 29,131,409 39,235,139
------------ ------------ ------------ ----------- ----------- -----------
-- -- -- 1,132,309 -- --
1,034,194 6,019,595 4,929,428 -- 799,691 --
17,443 1,139,321 609,398 -- -- 6,578
50,741 625,127 395,019 -- 11,935 9,635
4,134 34,551 23,382 2,591 3,959 3,373
2,699 19,019 16,913 24 -- 3,011
17,784 18,120 17,946 16,030 15,319 14,599
4,283 19,830 15,333 5,533 20,116 697
10,949 107,488 78,240 2,736 1,405 5,663
250 2,828 2,129 66 102 48
24,766 37,222 41,304 4,945 2,190 918
------------ ------------ ------------ ----------- ----------- -----------
1,167,243 8,023,101 6,129,092 1,164,234 854,717 44,522
------------ ------------ ------------ ----------- ----------- -----------
$ 45,496,186 $757,115,466 $498,763,125 $ 1,486,850 $28,276,692 $39,190,617
============ ============ ============ =========== =========== ===========
$ 80,177,959 $780,477,887 $549,283,489 $ 5,099,029 $27,597,422 $36,204,154
-- 90,254 373,360 84,460 114,467 23,038
(38,953,364) (98,510,355) (74,284,289) (3,413,386) (3,738,470) 2,837,599
4,271,591 75,057,680 23,390,565 (283,253) 4,303,273 125,826
------------ ------------ ------------ ----------- ----------- -----------
$ 45,496,186 $757,115,466 $498,763,125 $ 1,486,850 $28,276,692 $39,190,617
============ ============ ============ =========== =========== ===========
$ 32,140,369 $241,523,881 $216,220,978 $ 293,294 $ -- $39,190,617
3,583,615 16,463,174 21,154,200 41,388 -- 4,275,951
$ 8.97 $ 14.67 $ 10.22 $ 7.09 $ -- $ 9.17
============ ============ ============ =========== =========== ===========
$ 13,355,817 $515,591,585 $282,542,147 $ 1,193,556 $28,276,692 $ --
1,444,218 34,682,721 27,604,824 168,302 4,389,485 --
$ 9.25 $ 14.87 $ 10.24 $ 7.09 $ 6.44 $ --
============ ============ ============ =========== =========== ===========
SEE ACCOMPANYING NOTES TO FINANCIAL STATEMENTS.
69
Aston Funds
OCTOBER 31, 2009
STATEMENT OF ASSETS AND LIABILITIES - CONTINUED
NEW CENTURY M.D. SASS
ABSOLUTE RETURN ENHANCED
ETF FUND EQUITY FUND
--------------- -----------
ASSETS:
Investments:
Investments at cost ........................................................................ $16,525,516 $25,654,156
Net unrealized appreciation (depreciation) ................................................. 1,180,678 (1,596,739)
----------- -----------
Total investments at value .............................................................. 17,706,194 24,057,417
Foreign currency (Cost $351) ..................................................................... -- --
Cash ............................................................................................. -- --
Receivables:
Dividends and interest ..................................................................... 1,418 33,013
Fund shares sold ........................................................................... 21,598 52,598
Investments and foreign currency sold ...................................................... -- 47,958
Due from Adviser, net (Note G) ............................................................. 6,250 1,115
Deferred offering costs (Note B-11) .............................................................. -- --
Other assets ..................................................................................... 168 173
----------- -----------
Total assets ............................................................................ 17,735,628 24,192,274
----------- -----------
LIABILITIES:
Payables:
Due to custodian ........................................................................... -- --
Dividend distribution ...................................................................... -- --
Investments and foreign currency purchased ................................................. -- 317,127
Fund shares redeemed ....................................................................... 5,218 4,097
Due to Adviser, net (Note G) ............................................................... -- --
Administration fees (Note G) ............................................................... 2,892 2,298
Distribution fees (Note G) ................................................................. 1,396 1,720
Audit and tax fees ......................................................................... 14,002 16,038
Custodian fees ............................................................................. 1,304 7,858
Transfer agent fees ........................................................................ 3,820 4,334
Trustees fees and related expenses (Note G) ................................................ 355 491
Accrued expenses and other payables ........................................................ 235 2,871
Outstanding options written, at value (premiums received $840,418) ............................... -- 1,283,625
----------- -----------
Total liabilities ....................................................................... 29,222 1,640,459
----------- -----------
NET ASSETS ....................................................................................... $17,706,406 $22,551,815
=========== ===========
NET ASSETS CONSIST OF:
Paid in capital ............................................................................... $19,014,536 $24,846,734
Accumulated undistributed (distribution in excess of) net investment income (loss) ............ 23,030 12,570
Accumulated net realized gain (loss) on investments, purchased and written options and
foreign currency transactions .............................................................. (2,511,838) (267,543)
Net unrealized appreciation (depreciation) on investments, purchased and written options and
translation of assets and liabilities denominated in foreign currency ...................... 1,180,678 (2,039,946)
----------- -----------
TOTAL NET ASSETS ................................................................................. $17,706,406 $22,551,815
=========== ===========
CLASS N:
Net Assets .................................................................................... $17,706,406 $22,551,815
Shares of beneficial interest outstanding (unlimited authorization) ........................... 1,991,112 2,630,861
NET ASSET VALUE Offering and redemption price per share
(Net Assets/Shares Outstanding) ......................................................... $ 8.89 $ 8.57
=========== ===========
CLASS I:
Net Assets .................................................................................... $ -- $ --
Shares of beneficial interest outstanding (unlimited authorization) ........................... -- --
NET ASSET VALUE Offering and redemption price per share
(Net Assets/Shares Outstanding) ......................................................... $ -- $ --
=========== ===========
SEE ACCOMPANYING NOTES TO FINANCIAL STATEMENTS.
70
Aston Funds
LAKE PARTNERS FORTIS TCH
LASSO ALTERNATIVES REAL ESTATE MONTAG & CALDWELL BALANCED FIXED INCOME
FUND FUND BALANCED FUND FUND FUND
------------------ ------------ ----------------- ----------- ------------
$1,766,710 $ 25,126,606 $14,992,111 $15,403,027 $62,712,994
57,538 615,811 824,622 1,399,464 3,662,705
---------- ------------ ----------- ----------- -----------
1,824,248 25,742,417 15,816,733 16,802,491 66,375,699
-- 346 -- -- --
-- -- -- -- 200,000
823 15,616 79,216 68,988 771,785
-- 1,740 5,686 2,821 39,272
-- 292,356 531,874 62,197 --
10,225 -- -- -- --
32,121 -- -- -- --
-- 300 221 208 882
---------- ------------ ----------- ----------- -----------
1,867,417 26,052,775 16,433,730 16,936,705 67,387,638
---------- ------------ ----------- ----------- -----------
-- -- 82,961 -- --
-- -- -- -- 17,036
-- 79,204 38,402 90,377 --
-- 7,291 190,420 -- 38,979
-- 15,134 4,612 10,088 10,949
1,931 6,361 2,723 3,184 3,265
-- 310 -- -- --
14,273 16,745 17,848 17,717 17,979
1,480 2,447 1,617 1,966 2,267
2,768 4,277 6,438 4,195 7,406
42 278 157 201 244
2,089 4,486 2,138 4,007 6,012
-- -- -- -- --
---------- ------------ ----------- ----------- -----------
22,583 136,533 347,316 131,735 104,137
---------- ------------ ----------- ----------- -----------
$1,844,834 $ 25,916,242 $16,086,414 $16,804,970 $67,283,501
========== ============ =========== =========== ===========
$1,752,946 $ 52,591,927 $23,304,810 $18,178,289 $72,944,973
1,231 341,014 (232,269) 295,561 30,935
33,119 (27,632,503) (7,810,749) (3,068,344) (9,355,112)
57,538 615,804 824,622 1,399,464 3,662,705
---------- ------------ ----------- ----------- -----------
$1,844,834 $ 25,916,242 $16,086,414 $16,804,970 $67,283,501
========== ============ =========== =========== ===========
$ -- $ 4,011,176 $14,937,504 $16,804,970 $47,007,817
-- 695,153 842,474 3,032,269 4,690,769
$ -- $ 5.77 $ 17.73 $ 5.54 $ 10.02
========== ============ =========== =========== ===========
$1,844,834 $ 21,905,066 $ 1,148,910 $ -- $20,275,684
165,447 3,818,773 64,972 -- 2,023,266
$ 11.15 $ 5.74 $ 17.68 $ -- $ 10.02
========== ============ =========== =========== ===========
SEE ACCOMPANYING NOTES TO FINANCIAL STATEMENTS.
71
Aston Funds
FOR THE YEAR ENDED OCTOBER 31, 2009
STATEMENT OF OPERATIONS
MONTAG & CALDWELL VEREDUS SELECT
GROWTH FUND GROWTH FUND
----------------- --------------
INVESTMENT INCOME:
Dividends ............................................. $ 27,797,774 $ 879,267
Less: foreign taxes withheld .......................... -- (17,928)
Interest .............................................. -- 807
------------ ------------
Total investment income ............................ 27,797,774 862,146
------------ ------------
EXPENSES:
Investment advisory fees (Note G) ..................... 12,553,027 609,135
Distribution expenses (Note G)(a) ..................... 2,272,323 84,183
Transfer agent fees (Note G) .......................... 1,281,883 94,966
Administration fees (Note G) .......................... 965,190 54,966
Registration expenses ................................. 154,140 28,128
Custodian fees ........................................ 75,453 7,404
Audit and tax fees .................................... 30,099 18,922
Legal fees ............................................ 121,502 4,692
Reports to shareholder expense ........................ 280,492 15,838
Trustees fees and related expenses (Note G) ........... 90,491 4,817
Interest expense (Note H) ............................. -- --
Other expenses ........................................ 204,836 11,820
------------ ------------
Total expenses before waivers/reimbursements ....... 18,029,436 934,871
------------ ------------
Less: Investment advisory fees waived (Note G) ..... -- (51,192)
Less: Expenses reimbursed (Note G) ................. -- --
------------ ------------
Net expenses ....................................... 18,029,436 883,679
------------ ------------
NET INVESTMENT INCOME (LOSS) ............................. 9,768,338 (21,533)
------------ ------------
NET REALIZED AND UNREALIZED GAIN (LOSS) ON INVESTMENTS:
Net realized loss on investments ...................... (96,925,383) (16,636,677)
Net realized loss on purchased options(b) ............. -- --
Payments by affiliates (Note G) ....................... -- --
Net change in unrealized appreciation of investments .. 456,976,612 19,891,920
------------ ------------
NET REALIZED AND UNREALIZED GAIN ON INVESTMENTS ....... 360,051,229 3,255,243
------------ ------------
NET INCREASE IN NET ASSETS FROM OPERATIONS ............ $369,819,567 $ 3,233,710
============ ============
----------
(a) Distribution expense is incurred at the Class N level for all funds except
Montag & Caldwell Growth Fund and Growth Fund. The distribution expense for
Class N and R of the Montag & Caldwell Growth Fund is $2,265,537 and $6,786
respectively. The distribution expense for Class N and R of the Growth Fund
is $137,049 and $2,771, respectively.
(b) Primary risk exposure is equity contracts.
SEE ACCOMPANYING NOTES TO FINANCIAL STATEMENTS.
72
Aston Funds
OPTIMUM TAMRO RIVER ROAD OPTIMUM MONTAG & CALDWELL
LARGE CAP VALUE DIVERSIFIED DIVIDEND ALL MID CAP MID CAP
GROWTH FUND OPPORTUNITY FUND FUND EQUITY FUND CAP VALUE FUND FUND GROWTH FUND
------------ ---------------- ------------ ----------- -------------- ------------ -----------------
$ 2,868,519 $ 49,741 $ 6,081,424 $ 103,022 $ 4,872,821 $ 11,619,425 $ 19,700
-- (240) (76,286) -- (56,100) (141,199) (94)
-- -- -- -- -- -- --
------------ ----------- ------------ ----------- ----------- ------------ ---------
2,868,519 49,501 6,005,138 103,022 4,816,721 11,478,226 19,606
------------ ----------- ------------ ----------- ----------- ------------ ---------
1,272,184 27,352 1,613,311 69,775 736,901 5,092,843 18,726
139,820 8,547 48,689 2,509 174,738 1,444,927 5,508
127,791 19,463 51,025 30,655 101,306 705,979 18,734
110,909 15,451 125,511 20,298 70,790 379,159 16,404
40,743 11,387 31,552 16,010 32,837 46,854 22,201
9,844 1,410 20,870 3,881 19,764 37,943 5,434
24,684 19,728 22,592 18,741 19,502 23,393 19,132
6,009 252 9,328 588 4,772 40,177 128
23,423 1,857 21,195 1,314 7,842 127,760 197
7,485 420 7,555 665 6,784 45,749 206
-- -- -- -- -- 2,901 --
44,204 3,025 27,549 5,267 13,737 88,247 3,821
------------ ----------- ------------ ----------- ----------- ------------ ---------
1,807,096 108,892 1,979,177 169,703 1,188,973 8,035,932 110,491
------------ ----------- ------------ ----------- ----------- ------------ ---------
(23,157) (27,352) (276,845) (65,041) -- -- (18,726)
-- (40,987) -- -- -- -- (60,922)
------------ ----------- ------------ ----------- ----------- ------------ ---------
1,783,939 40,553 1,702,332 104,662 1,188,973 8,035,932 30,843
------------ ----------- ------------ ----------- ----------- ------------ ---------
1,084,580 8,948 4,302,806 (1,640) 3,627,748 3,442,294 (11,237)
------------ ----------- ------------ ----------- ----------- ------------ ---------
(27,518,574) (1,308,390) (27,626,230) (1,034,659) (8,621,021) (545,644) (403,883)
-- -- -- (14,760) -- -- --
11 -- -- -- -- -- --
53,995,312 1,778,793 41,983,428 2,484,282 24,704,160 233,642,408 841,452
------------ ----------- ------------ ----------- ----------- ------------ ---------
26,476,749 470,403 14,357,198 1,434,863 16,083,139 233,096,764 437,569
------------ ----------- ------------ ----------- ----------- ------------ ---------
$ 27,561,329 $ 479,351 $ 18,660,004 $ 1,433,223 $19,710,887 $236,539,058 $ 426,332
============ =========== ============ =========== =========== ============ =========
SEE ACCOMPANYING NOTES TO FINANCIAL STATEMENTS.
73
Aston Funds
FOR THE YEAR ENDED OCTOBER 31, 2009
STATEMENT OF OPERATIONS - CONTINUED
CARDINAL RIVER ROAD
MID CAP SMALL-MID CAP
VALUE FUND FUND
---------- -------------
INVESTMENT INCOME:
Dividends ................................................................... $ 13,461 $ 2,420,881
Less: foreign taxes withheld ................................................ -- (5,896)
--------- ------------
Total investment income .................................................. 13,461 2,414,985
--------- ------------
EXPENSES:
Investment advisory fees (Note G) ........................................... 7,138 1,630,828
Distribution expenses (Note G) .............................................. 1,983 101,349
Transfer agent fees (Note G) ................................................ 17,257 53,553
Administration fees (Note G) ................................................ 15,279 102,619
Registration expenses ....................................................... 21,896 35,849
Custodian fees .............................................................. 2,431 32,046
Audit and tax fees .......................................................... 19,131 23,795
Legal fees .................................................................. 44 7,585
Amortization of offering costs (Note B-11) .................................. -- --
Reports to shareholder expense .............................................. 95 18,646
Trustees fees and related expenses (Note G) ................................. 47 10,256
Interest expense (Note H) ................................................... -- --
Other expenses .............................................................. 3,366 20,934
--------- ------------
Total expenses before waivers/reimbursements ............................. 88,667 2,037,460
--------- ------------
Less: Investment advisory fees waived (Note G) ........................... (7,138) --
Less: Expenses reimbursed (Note G) ....................................... (70,425) --
Plus: Net expenses recouped (Note G) ..................................... -- 102,394
--------- ------------
Net expenses ............................................................. 11,104 2,139,854
--------- ------------
NET INVESTMENT INCOME (LOSS) ................................................... 2,357 275,131
--------- ------------
NET REALIZED AND UNREALIZED GAIN (LOSS) ON INVESTMENTS:
Net realized gain (loss) on investments ..................................... (294,095) (12,229,527)
Net realized loss on foreign currency transactions .......................... -- --
Payments by affiliates (Note G) ............................................. -- --
Net change in unrealized appreciation of investments ........................ 421,964 32,098,705
Net change in unrealized appreciation (depreciation) on translation of assets
and liabilities denominated in foreign currency .......................... -- --
--------- ------------
NET REALIZED AND UNREALIZED GAIN ON INVESTMENTS ............................. 127,869 19,869,178
--------- ------------
NET INCREASE IN NET ASSETS FROM OPERATIONS .................................. $ 130,226 $ 20,144,309
========= ============
SEE ACCOMPANYING NOTES TO FINANCIAL STATEMENTS.
74
Aston Funds
VEREDUS TAMRO RIVER ROAD NEPTUNE BARINGS DYNAMIC
AGGRESSIVE SMALL CAP SMALL CAP INTERNATIONAL INTERNATIONAL ALLOCATION
GROWTH FUND FUND VALUE FUND FUND FUND FUND
------------ ------------ ------------ ------------- ------------- ----------
$ 157,131 $ 5,120,523 $ 5,302,861 $ 248,316 $ 499,282 $ 479,393
-- -- (16,535) (14,009) (40,680) --
------------ ------------ ------------ ----------- ----------- ----------
157,131 5,120,523 5,286,326 234,307 458,602 479,393
------------ ------------ ------------ ----------- ----------- ----------
456,014 4,785,733 3,273,962 86,401 163,062 184,297
81,912 407,526 419,799 563 -- 57,593
102,624 578,980 462,333 28,619 16,495 48,381
40,069 291,462 206,140 27,971 40,933 26,311
26,207 40,507 49,780 25,996 21,309 25,130
8,439 42,331 37,826 6,500 56,787 3,777
23,019 23,298 22,818 21,801 20,718 19,694
3,770 28,119 20,565 588 873 1,428
-- -- -- -- -- 15,434
22,876 74,659 68,233 821 546 3,187
3,195 34,182 22,092 615 864 1,079
627 -- -- -- -- --
30,749 57,094 34,629 6,817 5,689 2,998
------------ ------------ ------------ ----------- ----------- ----------
799,501 6,363,891 4,618,177 206,692 327,276 389,309
------------ ------------ ------------ ----------- ----------- ----------
(151,505) (63,074) -- (86,401) (139,755) (89,827)
-- -- -- (31,599) -- --
-- -- -- -- -- --
------------ ------------ ------------ ----------- ----------- ----------
647,996 6,300,817 4,618,177 88,692 187,521 299,482
------------ ------------ ------------ ----------- ----------- ----------
(490,865) (1,180,294) 668,149 145,615 271,081 179,911
------------ ------------ ------------ ----------- ----------- ----------
(14,966,950) (67,769,370) (37,285,006) (2,673,799) (1,329,857) 3,123,476
-- -- -- (61,124) (162,713) --
-- -- -- 13 10,678 67
17,053,720 132,865,248 90,342,485 5,428,068 6,645,313 732,438
-- -- -- 4,719 (2,253) --
------------ ------------ ------------ ----------- ----------- ----------
2,086,770 65,095,878 53,057,479 2,697,877 5,161,168 3,855,981
------------ ------------ ------------ ----------- ----------- ----------
$ 1,595,905 $ 63,915,584 $ 53,725,628 $ 2,843,492 $ 5,432,249 $4,035,892
============ ============ ============ =========== =========== ==========
SEE ACCOMPANYING NOTES TO FINANCIAL STATEMENTS.
75
Aston Funds
FOR THE YEAR ENDED OCTOBER 31, 2009
STATEMENT OF OPERATIONS - CONTINUED
NEW CENTURY M.D. SASS
ABSOLUTE RETURN ENHANCED EQUITY
ETF FUND FUND
--------------- ---------------
INVESTMENT INCOME:
Dividends ........................................................ $ 250,275 $ 441,781
Less: foreign taxes withheld ..................................... (28) --
Interest ......................................................... -- --
----------- -----------
Total investment income ....................................... 250,247 441,781
----------- -----------
EXPENSES:
Investment advisory fees (Note G) ................................ 40,481 116,321
Distribution expenses (Note G) ................................... 36,548 41,543
Transfer agent fees (Note G) ..................................... 35,238 38,009
Administration fees (Note G) ..................................... 22,956 26,217
Registration expenses ............................................ 19,814 19,897
Custodian fees ................................................... 4,081 27,370
Audit and tax fees ............................................... 20,345 25,157
Legal fees ....................................................... 1,477 27,836
Amortization of offering costs (Note B-11) ....................... 30,970 13,509
Reports to shareholder expense ................................... 3,721 3,657
Trustees fees and related expenses (Note G) ...................... 1,169 7,340
Other expenses ................................................... 3,443 3,319
----------- -----------
Total expenses before waivers/reimbursements .................. 220,243 350,175
----------- -----------
Less: Investment advisory fees waived (Note G) ................ (38,745) (116,321)
Less: Expenses reimbursed (Note G) ............................ (5,128) (26,892)
----------- -----------
Net expenses .................................................. 176,370 206,962
----------- -----------
NET INVESTMENT INCOME (LOSS) ........................................ 73,877 234,819
----------- -----------
NET REALIZED AND UNREALIZED GAIN (LOSS) ON INVESTMENTS:
Net realized gain (loss) on investments .......................... (2,068,146) (708,995)
Net realized loss on purchased options(b) ........................ -- (305,547)
Net realized gain on written option transactions(b) .............. 21,259 837,949
Net realized loss on foreign currency transactions ............... -- --
Net change in unrealized appreciation of investments ............. 2,779,288 2,973,896
Net change in unrealized depreciation on purchased options(b) .... -- (22,007)
Net change in unrealized depreciation on written options(b) ...... -- (332,264)
Net change in unrealized appreciation on translation of assets and
liabilities denominated in foreign currency ................... -- --
----------- -----------
NET REALIZED AND UNREALIZED GAIN (LOSS) ON INVESTMENTS ........... 732,401 2,443,032
----------- -----------
NET INCREASE (DECREASE) IN NET ASSETS FROM OPERATIONS ............ $ 806,278 $ 2,677,851
=========== ===========
----------
(a) Lake Partners LASSO Alternative Fund commenced investment operations on
April 1, 2009.
(b) Primary risk exposure is equity contracts.
SEE ACCOMPANYING NOTES TO FINANCIAL STATEMENTS.
76
Aston Funds
LAKE PARTNERS FORTIS TCH
LASSO ALTERNATIVES REAL ESTATE MONTAG & CALDWELL BALANCED FIXED INCOME
FUND (a) FUND BALANCED FUND FUND FUND
------------------ ------------ ----------------- ----------- ------------
$ 6,925 $ 985,635 $ 178,581 $ 176,256 $ 36,342
-- (1,898) -- -- --
-- -- 268,327 308,053 3,976,994
-------- ------------ ---------- ----------- -----------
6,925 983,737 446,908 484,309 4,013,336
-------- ------------ ---------- ----------- -----------
5,595 219,082 131,614 115,902 374,455
-- 9,713 26,926 5,447 53,720
11,317 45,023 50,943 28,095 49,124
9,714 32,127 27,338 39,568 58,975
6,218 26,475 25,122 16,047 26,572
2,420 7,877 4,146 5,411 6,639
18,662 22,141 23,404 23,209 23,471
2,024 1,759 1,299 1,229 5,530
43,171 -- -- -- --
441 3,792 2,431 2,438 8,494
67 1,699 1,281 900 4,618
1,995 10,577 8,710 8,782 12,753
-------- ------------ ---------- ----------- -----------
101,624 380,265 303,214 247,028 624,351
-------- ------------ ---------- ----------- -----------
(5,595) (125,181) (83,255) -- (237,026)
(88,476) -- -- -- --
-------- ------------ ---------- ----------- -----------
7,553 255,084 219,959 247,028 387,325
-------- ------------ ---------- ----------- -----------
(628) 728,653 226,949 237,281 3,626,011
-------- ------------ ---------- ----------- -----------
33,119 (13,453,895) (505,443) (1,968,862) (1,327,665)
-- -- -- -- --
-- -- -- -- --
-- (25,434) -- -- --
57,538 11,546,797 2,858,743 4,255,574 11,829,836
-- -- -- -- --
-- -- -- -- --
-- 601 -- -- --
-------- ------------ ---------- ----------- -----------
90,657 (1,931,931) 2,353,300 2,286,712 10,502,171
-------- ------------ ---------- ----------- -----------
$ 90,029 $ (1,203,278) $2,580,249 $ 2,523,993 $14,128,182
======== ============ ========== =========== ===========
SEE ACCOMPANYING NOTES TO FINANCIAL STATEMENTS.
77
Aston Funds
STATEMENTS OF CHANGES IN NET ASSETS
MONTAG & CALDWELL VEREDUS SELECT
GROWTH FUND GROWTH FUND
------------------------------- ---------------------------
YEARS ENDED OCTOBER 31, YEARS ENDED OCTOBER 31,
------------------------------- ---------------------------
2009 2008 2009 2008
-------------- -------------- ------------ ------------
NET ASSETS AT BEGINNING OF PERIOD ..................... $1,357,841,579 $2,018,011,931 $ 83,181,659 $ 53,999,458
-------------- -------------- ------------ ------------
INCREASE (DECREASE) IN NET ASSETS FROM OPERATIONS:
Net investment income (loss) ....................... 9,768,338 7,359,892 (21,533) (366,716)
Net realized gain (loss) on investments and payments
by affiliates ................................... (96,925,383) 32,523,865 (16,636,677) (22,610,581)
Net change in unrealized appreciation (depreciation)
on investments .................................. 456,976,612 (664,627,304) 19,891,920 (20,130,969)
-------------- -------------- ------------ ------------
Net increase (decrease) in net assets from
operations ................................... 369,819,567 (624,743,547) 3,233,710 (43,108,266)
-------------- -------------- ------------ ------------
DISTRIBUTIONS TO SHAREHOLDERS FROM:
Net investment income:
Class N ......................................... (1,824,308) (1,193,382) -- --
Class I ......................................... (4,451,761) (2,957,565) -- --
Class R ......................................... -- (3,674) -- --
Net realized gain on investments:
Class N ......................................... (19,144,013) (98,653,826) -- (7,627,866)
Class I ......................................... (23,968,862) (164,914,941) -- (486,367)
Class R ......................................... (9,145) (522,637) -- --
-------------- -------------- ------------ ------------
Total distributions .......................... (49,398,089) (268,246,025) -- (8,114,233)
-------------- -------------- ------------ ------------
CAPITAL SHARE TRANSACTIONS:
Proceeds from sales of shares:
Class N ......................................... 840,785,556 359,177,323 12,155,911 21,160,777
Class I ......................................... 507,027,301 320,234,151 11,156,007 66,159,989
Class R ......................................... 4,289,265 3,226,527 -- --
Proceeds from reinvestment of distributions:
Class N ......................................... 20,185,047 94,326,188 -- 7,520,953
Class I ......................................... 25,893,503 152,386,318 -- 486,367
Class R ......................................... 9,071 524,046 -- --
Cost of shares redeemed:
Class N ......................................... (366,430,503) (244,529,342) (11,304,011) (10,945,698)
Class I ......................................... (222,156,312) (446,205,259) (11,286,816) (3,977,688)
Class R ......................................... (1,042,670) (6,320,732) -- --
-------------- -------------- ------------ ------------
Net increase (decrease) from capital share
transactions .............................. 808,560,258 232,819,220 721,091 80,404,700
-------------- -------------- ------------ ------------
Total increase (decrease) in net assets ...... 1,128,981,736 (660,170,352) 3,954,801 29,182,201
-------------- -------------- ------------ ------------
NET ASSETS AT END OF PERIOD (INCLUDING LINE A) ........ $2,486,823,315 $1,357,841,579 $ 87,136,460 $ 83,181,659
============== ============== ============ ============
(A) Undistributed (distributions in excess of) net
investment income (loss) ........................ $ 7,373,004 $ 3,887,167 $ -- $ --
============== ============== ============ ============
SEE ACCOMPANYING NOTES TO FINANCIAL STATEMENTS.
78
Aston Funds
OPTIMUM LARGE CAP
GROWTH FUND OPPORTUNITY FUND VALUE FUND
---------------------------- -------------------------- ----------------------------
YEARS ENDED OCTOBER 31, YEARS ENDED OCTOBER 31, YEARS ENDED OCTOBER 31,
---------------------------- -------------------------- ----------------------------
2009 2008 2009 2008 2009 2008
------------ ------------- ----------- ------------ ------------ -------------
$188,961,200 $ 420,377,974 $ 3,690,736 $ 40,563,288 $208,391,708 $ 419,500,562
------------ ------------- ----------- ------------ ------------ -------------
1,084,580 734,558 8,948 (13,504) 4,302,806 5,014,180
(27,518,563) (8,478,353) (1,308,390) (4,158,617) (27,626,230) 24,041,461
53,995,312 (103,383,285) 1,778,793 (4,452,110) 41,983,428 (150,192,000)
------------ ------------- ----------- ------------ ------------ -------------
27,561,329 (111,127,080) 479,351 (8,624,231) 18,660,004 (121,136,359)
------------ ------------- ----------- ------------ ------------ -------------
(123,518) (19,419) -- (26,900) (3,870,466) (913,797)
(722,501) (478,591) -- -- (367,357) (4,054,890)
(469) -- -- -- -- --
-- (40,457,129) -- -- (24,382,406) (11,662,570)
-- (59,169,640) -- -- (2,607,605) (26,129,365)
-- (173,029) -- -- -- --
------------ ------------- ----------- ------------ ------------ -------------
(846,488) (100,297,808) -- (26,900) (31,227,834) (42,760,622)
------------ ------------- ----------- ------------ ------------ -------------
3,840,712 11,902,983 1,871,676 4,077,900 5,005,683 27,856,409
186,658 261,560 -- -- -- 10,002
31,305 363,288 -- -- -- --
118,511 35,329,298 -- 25,914 2,912,811 12,541,877
722,100 58,833,489 -- -- 28,252,872 30,184,255
216 103,773 -- -- -- --
(17,626,369) (75,324,977) (1,708,099) (32,325,235) (6,241,703) (117,804,416)
(1,162,484) (51,257,529) -- -- -- --
(89,276) (203,771) -- -- -- --
------------ ------------- ----------- ------------ ------------ -------------
(13,978,627) (19,991,886) 163,577 (28,221,421) 29,929,663 (47,211,873)
------------ ------------- ----------- ------------ ------------ -------------
12,736,214 (231,416,774) 642,928 (36,872,552) 17,361,833 (211,108,854)
------------ ------------- ----------- ------------ ------------ -------------
$201,697,414 $ 188,961,200 $ 4,333,664 $ 3,690,736 $225,753,541 $ 208,391,708
============ ============= =========== ============ ============ =============
$ 767,143 $ 529,040 $ 8,948 $ -- $ 263,036 $ 198,951
============ ============= =========== ============ ============ =============
SEE ACCOMPANYING NOTES TO FINANCIAL STATEMENTS.
79
Aston Funds
STATEMENTS OF CHANGES IN NET ASSETS - CONTINUED
TAMRO DIVERSIFIED RIVER ROAD DIVIDEND
EQUITY FUND ALL CAP VALUE FUND
------------------------- ---------------------------
YEARS ENDED OCTOBER 31, YEARS ENDED OCTOBER 31,
------------------------- ---------------------------
2009 2008 2009 2008
----------- ----------- ------------ ------------
NET ASSETS AT BEGINNING OF PERIOD ..................... $ 8,562,093 $15,358,608 $ 51,648,751 $ 32,510,238
----------- ----------- ------------ ------------
INCREASE (DECREASE) IN NET ASSETS FROM OPERATIONS:
Net investment income (loss) ....................... (1,640) 38,314 3,627,748 1,708,975
Net realized gain (loss) on investments ............ (1,049,419) (360,343) (8,621,021) (4,811,635)
Net change in unrealized appreciation (depreciation)
on investments .................................. 2,484,282 (4,928,345) 24,704,160 (11,651,941)
----------- ----------- ------------ ------------
Net increase (decrease) in net assets from
operations ................................... 1,433,223 (5,250,374) 19,710,887 (14,754,601)
----------- ----------- ------------ ------------
DISTRIBUTIONS TO SHAREHOLDERS FROM:
Net investment income:
Class N ......................................... (38,534) (8,963) (1,721,842) (1,335,727)
Class I ......................................... -- -- (954,273) (5,757)
Return of Capital:
Class N ......................................... -- -- -- (24,094)
Class I ......................................... -- -- -- (104)
Net realized gain on investments:
Class N ......................................... -- (1,219,876) -- (1,677,293)
Class I ......................................... -- -- -- (10,432)
----------- ----------- ------------ ------------
Total distributions .......................... (38,534) (1,228,839) (2,676,115) (3,053,407)
----------- ----------- ------------ ------------
CAPITAL SHARE TRANSACTIONS:
Proceeds from sales of shares:
Class N ......................................... 2,135,995 1,073,875 62,751,999 56,532,683
Class I ......................................... -- -- 66,394,520 1,511
Proceeds from reinvestment of distributions:
Class N ......................................... 38,207 1,188,304 1,657,312 2,762,921
Class I ......................................... -- -- 529,398 16,293
Cost of shares redeemed:
Class N ......................................... (1,645,012) (2,579,481) (39,807,148) (22,366,887)
Class I ......................................... -- -- (1,182,306) --
----------- ----------- ------------ ------------
Net increase (decrease) from capital share
transactions .............................. 529,190 (317,302) 90,343,775 36,946,521
----------- ----------- ------------ ------------
Total increase (decrease) in net assets ...... 1,923,879 (6,796,515) 107,378,547 19,138,513
----------- ----------- ------------ ------------
NET ASSETS AT END OF PERIOD (INCLUDING LINE A) ........ $10,485,972 $ 8,562,093 $159,027,298 $ 51,648,751
=========== =========== ============ ============
(A) Undistributed (distributions in excess of) net
investment income (loss) ........................ $ -- $ 30,808 $ 27,627 $ (3,961)
=========== =========== ============ ============
----------
(a) Montag & Caldwell Mid Cap Growth Fund commenced investment operations on
November 2, 2007.
(b) Cardinal Mid Cap Value Fund commenced investment operations on November 2,
2007.
SEE ACCOMPANYING NOTES TO FINANCIAL STATEMENTS.
80
Aston Funds
MONTAG & CALDWELL CARDINAL MID CAP
MID CAP GROWTH FUND VALUE FUND
OPTIMUM MID CAP FUND -------------------------- --------------------------
----------------------------- YEAR ENDED PERIOD ENDED YEARS ENDED PERIOD ENDED
YEARS ENDED OCTOBER 31, OCTOBER 31, OCTOBER 31, OCTOBER 31, OCTOBER 31,
----------------------------- ----------- ------------ ----------- ------------
2009 2008 2009 2008(a) 2009 2008(b)
------------- ------------- ----------- ------------ ----------- ------------
$ 602,061,413 $ 949,727,581 $1,814,569 $ -- $ 782,776 $ --
------------- ------------- ---------- ----------- --------- ----------
3,442,294 1,964,622 (11,237) (15,118) 2,357 1,726
(545,644) 10,654,411 (403,883) (394,115) (294,095) (82,000)
233,642,408 (454,980,690) 841,452 (741,965) 421,964 (375,815)
------------- ------------- ---------- ----------- --------- ----------
236,539,058 (442,361,657) 426,332 (1,151,198) 130,226 (456,089)
------------- ------------- ---------- ----------- --------- ----------
(4,132,092) -- -- -- (8,532) --
(1,143,451) -- -- -- -- --
-- -- -- -- -- --
-- -- -- -- -- --
(8,736,848) (56,429,414) -- -- -- --
(1,689,593) (8,542,028) -- -- -- --
------------- ------------- ---------- ----------- --------- ----------
(15,701,984) (64,971,442) -- -- (8,532) --
------------- ------------- ---------- ----------- --------- ----------
319,711,144 382,563,505 793,491 3,025,312 25,746 1,238,874
64,914,636 68,718,434 -- -- -- --
12,136,985 53,046,328 -- -- 1,742 --
2,654,628 7,190,803 -- -- -- --
(181,783,742) (317,844,577) (75,018) (59,545) (15,858) (9)
(47,346,481) (34,007,562) -- -- -- --
------------- ------------- ---------- ----------- --------- ----------
170,287,170 159,666,931 718,473 2,965,767 11,630 1,238,865
------------- ------------- ---------- ----------- --------- ----------
391,124,244 (347,666,168) 1,144,805 1,814,569 133,324 782,776
------------- ------------- ---------- ----------- --------- ----------
$ 993,185,657 $ 602,061,413 $2,959,374 $ 1,814,569 $ 916,100 $ 782,776
============= ============= ========== =========== ========= ==========
$ 130,625 $ 1,964,622 $ -- $ 18,374 $ 904 $ 38,007
============= ============= ========== =========== ========= ==========
SEE ACCOMPANYING NOTES TO FINANCIAL STATEMENTS.
81
Aston Funds
STATEMENTS OF CHANGES IN NET ASSETS - CONTINUED
RIVER ROAD VEREDUS AGGRESSIVE
SMALL-MID CAP FUND GROWTH FUND
--------------------------- ----------------------------
YEARS ENDED OCTOBER 31, YEARS ENDED OCTOBER 31,
--------------------------- ----------------------------
2009 2008 2009 2008
------------ ------------ ------------ -------------
NET ASSETS AT BEGINNING OF PERIOD ..................... $110,715,839 $ 17,774,666 $ 59,868,093 $ 230,745,446
------------ ------------ ------------ -------------
INCREASE (DECREASE) IN NET ASSETS FROM OPERATIONS:
Net investment income (loss) ....................... 275,131 156,056 (490,865) (1,408,310)
Net realized loss on investments, foreign currency
transactions and payments by affiliates ......... (12,229,527) (5,039,800) (14,966,950) (23,155,591)
Net change in unrealized appreciation (depreciation)
on investments and translation of assets and
liabilities denominated in foreign currency ..... 32,098,705 (20,074,564) 17,053,720 (58,256,376)
------------ ------------ ------------ -------------
Net increase (decrease) in net assets from
operations ................................... 20,144,309 (24,958,308) 1,595,905 (82,820,277)
------------ ------------ ------------ -------------
DISTRIBUTIONS TO SHAREHOLDERS FROM:
Net investment income:
Class N ......................................... (80,194) -- -- --
Class I ......................................... (188,448) (58,969) -- --
Net realized gain on investments:
Class N ......................................... -- -- (241,471) (27,985,957)
Class I ......................................... -- -- (88,235) (26,198,976)
------------ ------------ ------------ -------------
Total distributions .......................... (268,642) (58,969) (329,706) (54,184,933)
------------ ------------ ------------ -------------
CAPITAL SHARE TRANSACTIONS:
Proceeds from sales of shares:
Class N ......................................... 42,964,602 25,523,544 3,773,701 10,616,263
Class I ......................................... 96,650,247 118,090,164 453,913 23,833,681
Proceeds from reinvestment of distributions:
Class N ......................................... 79,361 -- 233,197 26,256,385
Class I ......................................... 141,129 54,508 87,459 24,448,984
Cost of shares redeemed:
Class N ......................................... (32,256,463) (7,792,472) (16,017,794) (32,951,858)
Class I ......................................... (29,035,507) (17,917,294) (4,168,582) (86,075,598)
------------ ------------ ------------ -------------
Net increase (decrease) from capital share
transactions .............................. 78,543,369 117,958,450 (15,638,106) (33,872,143)
------------ ------------ ------------ -------------
Total increase (decrease) in net assets ...... 98,419,036 92,941,173 (14,371,907) (170,877,353)
------------ ------------ ------------ -------------
NET ASSETS AT END OF PERIOD (INCLUDING LINE A) ........ $209,134,875 $110,715,839 $ 45,496,186 $ 59,868,093
============ ============ ============ =============
(A) Undistributed (distributions in excess of) net
investment income (loss) ....................... $ 174,467 $ 167,978 $ -- $ --
============ ============ ============ =============
SEE ACCOMPANYING NOTES TO FINANCIAL STATEMENTS.
82
Aston Funds
TAMRO RIVER ROAD NEPTUNE
SMALL CAP FUND SMALL CAP VALUE FUND INTERNATIONAL FUND
----------------------------- ---------------------------- -------------------------
YEARS ENDED OCTOBER 31, YEARS ENDED OCTOBER 31, YEARS ENDED OCTOBER 31,
----------------------------- ---------------------------- -------------------------
2009 2008 2009 2008 2009 2008
------------- ------------- ------------ ------------- ----------- -----------
$ 398,363,783 $ 372,301,855 $274,911,304 $ 302,220,867 $ 8,602,575 $ 2,369,665
------------- ------------- ------------ ------------- ----------- -----------
(1,180,294) 1,588,393 668,149 452,511 145,615 157,948
(67,769,370) (31,736,542) (37,285,006) (36,422,487) (2,734,910) (847,310)
132,865,248 (127,226,809) 90,342,485 (83,796,022) 5,432,787 (6,126,595)
------------- ------------- ------------ ------------- ----------- -----------
63,915,584 (157,374,958) 53,725,628 (119,765,998) 2,843,492 (6,815,957)
------------- ------------- ------------ ------------- ----------- -----------
-- -- (130,237) (37,949) (1,002) --
(343,822) -- (454,107) (44,332) (64,620) (28,222)
-- (10,737,284) -- (8,476,846) -- --
-- (6,479,414) -- (2,898,349) -- --
------------- ------------- ------------ ------------- ----------- -----------
(343,822) (17,216,698) (584,344) (11,457,476) (65,622) (28,222)
------------- ------------- ------------ ------------- ----------- -----------
135,349,839 109,183,845 109,581,610 102,025,124 79,336 432,275
337,277,664 245,253,420 177,743,809 106,971,828 29,066 13,051,300
-- 9,961,962 127,352 7,800,405 1,002 --
192,771 3,216,594 353,414 2,357,643 6,234 22,153
(63,379,709) (109,019,877) (70,119,952) (101,232,051) (56,971) (1,731)
(114,260,644) (57,942,360) (46,975,696) (14,009,038) (9,952,262) (426,908)
------------- ------------- ------------ ------------- ----------- -----------
295,179,921 200,653,584 170,710,537 103,913,911 (9,893,595) 13,077,089
------------- ------------- ------------ ------------- ----------- -----------
358,751,683 26,061,928 223,851,821 (27,309,563) (7,115,725) 6,232,910
------------- ------------- ------------ ------------- ----------- -----------
$ 757,115,466 $ 398,363,783 $498,763,125 $ 274,911,304 $ 1,486,850 $ 8,602,575
============= ============= ============ ============= =========== ===========
$ 90,254 $ 607,640 $ 373,360 $ 282,201 $ 84,460 $ 86,551
============= ============= ============ ============= =========== ===========
SEE ACCOMPANYING NOTES TO FINANCIAL STATEMENTS.
83
Aston Funds
STATEMENTS OF CHANGES IN NET ASSETS - CONTINUED
BARINGS DYNAMIC
INTERNATIONAL FUND ALLOCATION FUND
-------------------------- --------------------------
YEAR ENDED PERIOD ENDED YEAR ENDED PERIOD ENDED
OCTOBER 31, OCTOBER 31, OCTOBER 31, OCTOBER 31,
2009 2008(a) 2009 2008(b)
----------- ------------ ----------- ------------
NET ASSETS AT BEGINNING OF PERIOD .......................... $ 5,517,433 $ -- $ 6,070,423 $ --
----------- ----------- ----------- -----------
INCREASE (DECREASE) IN NET ASSETS FROM OPERATIONS:
Net investment income (loss) ............................ 271,081 104,279 179,911 36,586
Net realized gain (loss) on investments, foreign currency
transactions and payments by affiliates .............. (1,481,892) (2,571,858) 3,123,543 (285,877)
Net change in unrealized appreciation (depreciation)
on investments and translation of assets and
liabilities denominated in foreign currency .......... 6,643,060 (2,339,787) 732,438 (606,612)
----------- ----------- ----------- -----------
Net increase (decrease) in net assets from
operations ........................................ 5,432,249 (4,807,366) 4,035,892 (855,903)
----------- ----------- ----------- -----------
DISTRIBUTIONS TO SHAREHOLDERS FROM:
Net investment income:
Class N .............................................. -- -- (187,961) (37,610)
Class I .............................................. (4,815) -- -- --
Net realized gain on investments:
Class N .............................................. -- -- -- --
----------- ----------- ----------- -----------
Total distributions ............................... (4,815) -- (187,961) (37,610)
----------- ----------- ----------- -----------
CAPITAL SHARE TRANSACTIONS:
Proceeds from sales of shares:
Class N .............................................. -- -- 36,466,180 10,231,848
Class I .............................................. 20,249,535 13,102,841 -- --
Proceeds from reinvestment of distributions:
Class N .............................................. -- -- 187,829 37,578
Class I .............................................. 2,023 -- -- --
Cost of shares redeemed:
Class N .............................................. -- -- (7,381,746) (3,305,490)
Class I .............................................. (2,919,733) (2,778,042) -- --
----------- ----------- ----------- -----------
Net increase from capital share transactions ...... 17,331,825 10,324,799 29,272,263 6,963,936
----------- ----------- ----------- -----------
Total increase in net assets ...................... 22,759,259 5,517,433 33,120,194 6,070,423
----------- ----------- ----------- -----------
NET ASSETS AT END OF PERIOD (INCLUDING LINE A) ............. $28,276,692 $ 5,517,433 $39,190,617 $ 6,070,423
=========== =========== =========== ===========
(A) Undistributed (distributions in excess of) net
investment income (loss) ............................. $ 114,467 $ -- $ 23,038 $ 53,712
=========== =========== =========== ===========
----------
(a) Barings International Fund commenced investment operations on November 2,
2007.
(b) Dynamic Allocation Fund commenced investment operations on January 10,
2008.
(c) New Century Absolute Return Fund commenced investment operations on March
4, 2008.
(d) M.D. Sass Enhanced Equity Fund commenced investment operations on January
15, 2008.
(e) Lake Partners LASSO Alternative Fund commenced investment operations on
April 1, 2009.
SEE ACCOMPANYING NOTES TO FINANCIAL STATEMENTS.
84
Aston Funds
LAKE PARTNERS
NEW CENTURY M.D. SASS LASSO
ABSOLUTE RETURN ENHANCED EQUITY ALTERNATIVES
ETF FUND FUND FUND
-------------------------- -------------------------- -------------
YEAR ENDED PERIOD ENDED YEAR ENDED PERIOD ENDED PERIOD ENDED
OCTOBER 31, OCTOBER 31, OCTOBER 31, OCTOBER 31, OCTOBER 31,
2009 2008(c) 2009 2008(d) 2009(e)
----------- ------------ ----------- ------------ -------------
$13,747,979 $ -- $14,388,959 $ -- $ --
----------- ----------- ----------- ----------- ----------
73,877 10,826 234,819 213,651 (628)
(2,046,887) (464,951) (176,593) 938,753 33,119
2,779,288 (1,598,610) 2,619,625 (4,659,571) 57,538
----------- ----------- ----------- ----------- ----------
806,278 (2,052,735) 2,677,851 (3,507,167) 90,029
----------- ----------- ----------- ----------- ----------
(121,220) -- (267,832) (210,633) --
-- -- -- -- --
-- -- (1,029,769) -- --
----------- ----------- ----------- ----------- ----------
(121,220) -- (1,297,601) (210,633) --
----------- ----------- ----------- ----------- ----------
11,470,790 18,396,559 8,226,815 18,939,337 --
-- -- -- -- 2,017,587
91,694 -- 890,192 80,537 --
-- -- -- -- --
(8,289,115) (2,595,845) (2,334,401) (913,115) --
-- -- -- -- (262,782)
----------- ----------- ----------- ----------- ----------
3,273,369 15,800,714 6,782,606 18,106,759 1,754,805
----------- ----------- ----------- ----------- ----------
3,958,427 13,747,979 8,162,856 14,388,959 1,844,834
----------- ----------- ----------- ----------- ----------
$17,706,406 $13,747,979 $22,551,815 $14,388,959 $1,844,834
=========== =========== =========== =========== ==========
$ 23,030 $ 63,413 $ 12,570 $ 49,900 $ 1,231
=========== =========== =========== =========== ==========
SEE ACCOMPANYING NOTES TO FINANCIAL STATEMENTS.
85
Aston Funds
STATEMENTS OF CHANGES IN NET ASSETS - CONTINUED
FORTIS MONTAG & CALDWELL
REAL ESTATE FUND BALANCED FUND
--------------------------- -------------------------
YEARS ENDED OCTOBER 31, YEARS ENDED OCTOBER 31,
--------------------------- -------------------------
2009 2008 2009 2008
------------ ------------ ----------- -----------
NET ASSETS AT BEGINNING OF PERIOD ........................ $ 29,440,875 $ 90,668,373 $17,504,601 $17,860,943
------------ ------------ ----------- -----------
INCREASE (DECREASE) IN NET ASSETS FROM OPERATIONS:
Net investment income ................................. 728,653 470,371 226,949 210,680
Net realized gain (loss) on investments and foreign
currency transactions .............................. (13,479,329) (13,985,524) (505,443) 120,418
Net change in unrealized appreciation (depreciation)
on investments and translation of assets and
liabilities denominated in foreign currency ........ 11,547,398 (14,563,027) 2,858,743 (5,028,369)
------------ ------------ ----------- -----------
Net increase (decrease) in net assets from
operations ...................................... (1,203,278) (28,078,180) 2,580,249 (4,697,271)
------------ ------------ ----------- -----------
DISTRIBUTIONS TO SHAREHOLDERS FROM:
Net investment income:
Class N ............................................ (169,447) (262,056) (249,501) (226,864)
Class I ............................................ (807,903) (337,509) (16,924) (16,943)
Net realized gain on investments:
Class N ............................................ -- (12,004,865) -- --
Class I ............................................ -- (10,600,029) -- --
------------ ------------ ----------- -----------
Total distributions ............................. (977,350) (23,204,459) (266,425) (243,807)
------------ ------------ ----------- -----------
CAPITAL SHARE TRANSACTIONS:
Proceeds from sales of shares:
Class N ............................................ 485,760 4,653,383 2,450,539 10,014,274
Class I ............................................ -- -- 116,672 103,774
Proceeds from reinvestment of distributions:
Class N ............................................ 163,314 12,082,216 179,931 205,276
Class I ............................................ 807,903 10,937,524 16,883 16,798
Cost of shares redeemed:
Class N ............................................ (1,833,927) (37,617,982) (6,460,170) (5,661,808)
Class I ............................................ (967,055) -- (35,866) (93,578)
------------ ------------ ----------- -----------
Net increase (decrease) from capital share
transactions ................................. (1,344,005) (9,944,859) (3,732,011) 4,584,736
------------ ------------ ----------- -----------
Total decrease in net assets .................... (3,524,633) (61,227,498) (1,418,187) (356,342)
------------ ------------ ----------- -----------
NET ASSETS AT END OF PERIOD (INCLUDING LINE A) ........... $ 25,916,242 $ 29,440,875 $16,086,414 $17,504,601
============ ============ =========== ===========
(A) Undistributed (distributions in excess of) net
investment income (loss) .......................... $ 341,014 $ 615,145 $ (232,269) $ (333,969)
============ ============ =========== ===========
SEE ACCOMPANYING NOTES TO FINANCIAL STATEMENTS.
86
Aston Funds
BALANCED FUND TCH FIXED INCOME FUND
-------------------------- ---------------------------
YEARS ENDED OCTOBER 31, YEARS ENDED OCTOBER 31,
-------------------------- ---------------------------
2009 2008 2009 2008
----------- ------------ ------------ ------------
$17,673,382 $ 35,923,985 $ 68,655,177 $ 91,979,543
----------- ------------ ------------ ------------
237,281 349,764 3,626,011 4,280,277
(1,968,862) (559,417) (1,327,665) (1,680,037)
4,255,574 (6,647,417) 11,829,836 (7,551,902)
----------- ------------ ------------ ------------
2,523,993 (6,857,070) 14,128,182 (4,951,662)
----------- ------------ ------------ ------------
(255,186) (396,405) (2,378,032) (2,622,635)
-- -- (1,340,088) (1,780,523)
(142) (5,993,129) -- --
-- -- -- --
----------- ------------ ------------ ------------
(255,328) (6,389,534) (3,718,120) (4,403,158)
----------- ------------ ------------ ------------
910,432 1,669,881 9,530,426 12,409,629
-- -- 2,287,740 4,645,377
253,470 6,366,439 2,291,237 2,489,637
-- -- 1,215,866 1,264,040
(4,300,979) (13,040,319) (14,228,978) (19,017,029)
-- -- (12,878,029) (15,761,200)
----------- ------------ ------------ ------------
(3,137,077) (5,003,999) (11,781,738) (13,969,546)
----------- ------------ ------------ ------------
(868,412) (18,250,603) (1,371,676) (23,324,366)
----------- ------------ ------------ ------------
$16,804,970 $ 17,673,382 $ 67,283,501 $ 68,655,177
=========== ============ ============ ============
$ 295,561 $ 186,323 $ 30,935 $ 179,929
=========== ============ ============ ============
SEE ACCOMPANYING NOTES TO FINANCIAL STATEMENTS.
87
Aston Funds
MONTAG & CALDWELL GROWTH FUND - CLASS N
OCTOBER 31, 2009
FINANCIAL HIGHLIGHTS
YEAR YEAR YEAR YEAR YEAR
ENDED ENDED ENDED ENDED ENDED
10/31/09 10/31/08 10/31/07 10/31/06 10/31/05
---------- -------- -------- -------- --------
Net Asset Value, Beginning of period .......................... $ 18.84 $ 31.51 $ 25.15 $ 23.35 $ 21.53
---------- -------- -------- -------- --------
INCOME FROM INVESTMENT OPERATIONS:
Net investment income ................................... 0.08(a) 0.07(a) 0.06(a) 0.07(a) 0.05(a)
Net realized and unrealized gain (loss) on investments .. 2.61 (8.66) 6.54 1.80 1.83
---------- -------- -------- -------- --------
Total from investment operations ..................... 2.69 (8.59) 6.60 1.87 1.88
---------- -------- -------- -------- --------
LESS DISTRIBUTIONS:
Distributions from and in excess of net
investment income .................................... (0.06) (0.05) (0.06) (0.07) (0.06)
Distributions from net realized gain on investments ..... (0.60) (4.03) (0.18) -- --
---------- -------- -------- -------- --------
Total distributions .................................. (0.66) (4.08) (0.24) (0.07) (0.06)
---------- -------- -------- -------- --------
Net increase (decrease) in net asset value .................... 2.03 (12.67) 6.36 1.80 1.82
---------- -------- -------- -------- --------
Net Asset Value, End of period ................................ $ 20.87 $ 18.84 $ 31.51 $ 25.15 $ 23.35
========== ======== ======== ======== ========
TOTAL RETURN .................................................. 15.08% (31.13)% 26.41% 8.02% 8.72%
RATIOS/SUPPLEMENTAL DATA:
Net Assets, End of period (in 000's) ....................... $1,277,346 $602,905 $759,567 $846,100 $992,229
Ratios of expenses to average net assets:
Before reimbursement and/or waiver of
expenses by Adviser .................................. 1.11% 1.08%(b) 1.07%(b) 1.06%(b) 1.03%
After reimbursement and/or waiver of
expenses by Adviser .................................. 1.11% 1.08%(b) 1.07%(b) 1.06%(b) 1.03%
Ratios of net investment income
to average net assets:
Before reimbursement and/or waiver of
expenses by Adviser ............................... 0.41% 0.26% 0.23% 0.28% 0.20%
After reimbursement and/or waiver of
expenses by Adviser ............................... 0.41% 0.26% 0.23% 0.28% 0.20%
Portfolio Turnover ................................... 35.09%(c) 52.32% 69.02% 68.74% 52.16%
----------
(a) The selected per share data was calculated using the weighted average
shares outstanding method for the period.
(b) Ratios of expenses to average net assets include interest expense of less
than 0.005% for the years ended October 31, 2008, October 31, 2007 and
October 31, 2006. The interest expense is from utilizing the line of credit
as discussed in Note H to Financial Statements.
(c) Portfolio turnover rate excludes securities received from processing a
subscription-in-kind.
SEE ACCOMPANYING NOTES TO FINANCIAL STATEMENTS.
88
Aston Funds
MONTAG & CALDWELL GROWTH FUND - CLASS I
OCTOBER 31, 2009
FINANCIAL HIGHLIGHTS
YEAR YEAR YEAR YEAR YEAR
ENDED ENDED ENDED ENDED ENDED
10/31/09 10/31/08 10/31/07 10/31/06 10/31/05
---------- -------- ---------- ---------- ----------
Net Asset Value, Beginning of period ......... $ 18.94 $ 31.61 $ 25.24 $ 23.44 $ 21.61
---------- -------- ---------- ---------- ----------
INCOME FROM INVESTMENT OPERATIONS:
Net investment income .................. 0.12(a) 0.13(a) 0.14(a) 0.13(a) 0.11(a)
Net realized and unrealized gain (loss)
on investments ...................... 2.62 (8.70) 6.55 1.82 1.83
---------- -------- ---------- ---------- ----------
Total from investment operations .... 2.74 (8.57) 6.69 1.95 1.94
---------- -------- ---------- ---------- ----------
LESS DISTRIBUTIONS:
Distributions from and in excess of net
investment income ................... (0.11) (0.07) (0.14) (0.15) (0.11)
Distributions from net realized gain on
investments ...................... (0.60) (4.03) (0.18) -- --
---------- -------- ---------- ---------- ----------
Total distributions ................. (0.71) (4.10) (0.32) (0.15) (0.11)
---------- -------- ---------- ---------- ----------
Net increase (decrease) in net asset value ... 2.03 (12.67) 6.37 1.80 1.83
---------- -------- ---------- ---------- ----------
Net Asset Value, End of period ............... $ 20.97 $ 18.94 $ 31.61 $ 25.24 $ 23.44
========== ======== ========== ========== ==========
TOTAL RETURN ................................. 15.36% (30.96)% 26.72% 8.36% 8.99%
RATIOS/SUPPLEMENTAL DATA:
Net Assets, End of period (in 000's) ...... $1,205,637 $754,671 $1,254,382 $1,246,683 $1,727,848
Ratios of expenses to average net assets:
Before reimbursement and/or waiver of
expenses by Adviser ................. 0.86% 0.83%(b) 0.79%(b) 0.78%(b) 0.75%
After reimbursement and/or waiver of
expenses by Adviser ................. 0.86% 0.83%(b) 0.79%(b) 0.78%(b) 0.75%
Ratios of net investment income to
average net assets:
Before reimbursement and/or waiver of
expenses by Adviser .............. 0.66% 0.51% 0.51% 0.56% 0.48%
After reimbursement and/or waiver of
expenses by Adviser .............. 0.66% 0.51% 0.51% 0.56% 0.48%
Portfolio Turnover ..................... 35.09%(c) 52.32% 69.02% 68.74% 52.16%
----------
(a) The selected per share data was calculated using the weighted average
shares outstanding method for the period.
(b) Ratios of expenses to average net assets include interest expense of less
than 0.005% for the years ended October 31, 2008, October 31, 2007 and
October 31, 2006. The interest expense is from utilizing the line of credit
as discussed in Note H to Financial Statements.
(c) Portfolio turnover rate excludes securities received from processing a
subscription-in-kind.
SEE ACCOMPANYING NOTES TO FINANCIAL STATEMENTS.
89
Aston Funds
MONTAG & CALDWELL GROWTH FUND - CLASS R
OCTOBER 31, 2009
FINANCIAL HIGHLIGHTS
YEAR YEAR YEAR YEAR YEAR
ENDED ENDED ENDED ENDED ENDED
10/31/09 10/31/08 10/31/07 10/31/06 10/31/05
-------- -------- -------- -------- --------
Net Asset Value, Beginning of period .......................... $18.69 $ 31.33 $25.04 $23.23 $21.43
------ ------- ------ ------ ------
INCOME FROM INVESTMENT OPERATIONS:
Net investment income (loss) ............................ 0.03(a) --(a)(b) --(a)(b) 0.01(a) (0.01)(a)
Net realized and unrealized gain (loss) on investments .. 2.61 (8.58) 6.49 1.80 1.83
------ ------- ------ ------ ------
Total from investment operations ..................... 2.64 (8.58) 6.49 1.81 1.82
------ ------- ------ ------ ------
LESS DISTRIBUTIONS:
Distributions from and in excess of net
investment income .................................... -- (0.03) (0.02) -- (0.02)
Distributions from net realized gain on investments ..... (0.60) (4.03) (0.18) -- --
------ ------- ------ ------ ------
Total distributions .................................. (0.60) (4.06) (0.20) -- (0.02)
------ ------- ------ ------ ------
Net increase (decrease) in net asset value .................... 2.04 (12.64) 6.29 1.81 1.80
------ ------- ------ ------ ------
Net Asset Value, End of period ................................ $20.73 $ 18.69 $31.33 $25.04 $23.23
====== ======= ====== ====== ======
TOTAL RETURN .................................................. 14.87% (31.28)% 26.06% 7.79% 8.50%
RATIOS/SUPPLEMENTAL DATA:
Net Assets, End of period (in 000's) ....................... $3,840 $ 266 $4,062 $ 693 $ 703
Ratios of expenses to average net assets:
Before reimbursement and/or waiver of
expenses by Adviser .................................. 1.36% 1.33%(c) 1.29%(c) 1.28%(c) 1.25%
After reimbursement and/or waiver of
expenses by Adviser .................................. 1.36% 1.33%(c) 1.29%(c) 1.28%(c) 1.25%
Ratios of net investment income (loss)
to average net assets:
Before reimbursement and/or waiver of
expenses by Adviser .................................. 0.16% 0.01% 0.01% 0.06% (0.02)%
After reimbursement and/or waiver of
expenses by Adviser .................................. 0.16% 0.01% 0.01% 0.06% (0.02)%
Portfolio Turnover ......................................... 35.09%(d) 52.32% 69.02% 68.74% 52.16%
----------
(a) The selected per share data was calculated using the weighted average
shares outstanding method for the period.
(b) Represents less than $0.005 per share.
(c) Ratios of expenses to average net assets include interest expense of less
than 0.005% for the years ended October 31, 2008, October 31, 2007 and
October 31, 2006. The interest expense is from utilizing the line of credit
as discussed in Note H to Financial Statements.
(d) Portfolio turnover rate excludes securities received from processing a
subscription-in-kind.
SEE ACCOMPANYING NOTES TO FINANCIAL STATEMENTS.
90
Aston Funds
VEREDUS SELECT GROWTH FUND - CLASS N
OCTOBER 31, 2009
FINANCIAL HIGHLIGHTS
YEAR YEAR YEAR YEAR YEAR
ENDED ENDED ENDED ENDED ENDED
10/31/09 10/31/08 10/31/07 10/31/06 10/31/05
-------- -------- -------- -------- --------
Net Asset Value, Beginning of period .......................... $ 8.69 $ 16.77 $ 13.08 $ 11.88 $ 10.31
------- ------- ------- ------- -------
INCOME FROM INVESTMENT OPERATIONS:
Net investment loss ..................................... (0.01) (0.06) (0.08) (0.03)(a) (0.02)
Net realized and unrealized gain (loss) on investments .. 0.39 (5.60) 3.77 1.24 1.59
------- ------- ------- ------- -------
Total from investment operations ..................... 0.38 (5.66) 3.69 1.21 1.57
------- ------- ------- ------- -------
LESS DISTRIBUTIONS:
Distributions from net realized gain on investments ..... -- (2.42) -- (0.01) --
------- ------- ------- ------- -------
Total distributions .................................. -- (2.42) -- (0.01) --
------- ------- ------- ------- -------
Net increase (decrease) in net asset value .................... 0.38 (8.08) 3.69 1.20 1.57
------- ------- ------- ------- -------
Net Asset Value, End of period ................................ $ 9.07 $ 8.69 $ 16.77 $ 13.08 $ 11.88
======= ======= ======= ======= =======
TOTAL RETURN .................................................. 4.37% (39.09)% 28.14% 10.22% 15.23%
RATIOS/SUPPLEMENTAL DATA:
Net Assets, End of period (in 000's) ....................... $39,437 $37,142 $50,783 $34,687 $13,270
Ratios of expenses to average net assets:
Before reimbursement and/or waiver of
expenses by Adviser .................................. 1.37% 1.34% 1.52% 1.75% 2.57%
After reimbursement and/or waiver of
expenses by Adviser .................................. 1.30% 1.30% 1.30% 1.30% 1.30%
Ratios of net investment loss to average net assets:
Before reimbursement and/or waiver of
expenses by Adviser .................................. (0.24)% (0.55)% (0.81)% (0.72)% (1.76)%
After reimbursement and/or waiver of
expenses by Adviser .................................. (0.17)% (0.51)% (0.59)% (0.27)% (0.49)%
Portfolio Turnover ......................................... 331.55% 387.57% 283.38% 269.88% 202.37%
----------
(a) The selected per share data was calculated using the weighted average
shares outstanding method for the period.
SEE ACCOMPANYING NOTES TO FINANCIAL STATEMENTS.
91
Aston Funds
VEREDUS SELECT GROWTH FUND - CLASS I
OCTOBER 31, 2009
FINANCIAL HIGHLIGHTS
YEAR YEAR YEAR PERIOD
ENDED ENDED ENDED ENDED
10/31/09 10/31/08 10/31/07 10/31/06(a)
-------- -------- -------- -----------
Net Asset Value, Beginning of period .............................. $ 8.74 $ 16.83 $ 13.08 $ 11.97
------- ------- ------- -------
INCOME FROM INVESTMENT OPERATIONS:
Net investment income (loss) ................................ 0.01 (0.02) (0.02) --(b)(c)
Net realized and unrealized gain (loss) on investments ...... 0.41 (5.65) 3.77 1.11
------- ------- ------- -------
Total from investment operations ......................... 0.42 (5.67) 3.75 1.11
------- ------- ------- -------
LESS DISTRIBUTIONS:
Distributions from net realized gain on investments ......... -- (2.42) -- --
------- ------- ------- -------
Total distributions ...................................... -- (2.42) -- --
------- ------- ------- -------
Net increase (decrease) in net asset value ........................ 0.42 (8.09) 3.75 1.11
------- ------- ------- -------
Net Asset Value, End of period .................................... $ 9.16 $ 8.74 $ 16.83 $ 13.08
======= ======= ======= =======
TOTAL RETURN ...................................................... 4.81% (38.96)% 28.52% 9.27%(d)
RATIOS/SUPPLEMENTAL DATA:
Net Assets, End of period (in 000's) ........................... $47,699 $46,040 $ 3,216 $ 1,015
Ratios of expenses to average net assets:
Before reimbursement and/or waiver of expenses by Adviser ... 1.12% 1.09% 1.19% 1.43%(e)
After reimbursement and/or waiver of expenses by Adviser .... 1.05% 1.05% 0.97% 0.98%(e)
Ratios of net investment income (loss) to average net assets:
Before reimbursement and/or waiver of expenses by Adviser ... 0.01% (0.30)% (0.48)% (0.55)%(e)
After reimbursement and/or waiver of expenses by Adviser .... 0.08% (0.26)% (0.26)% (0.10)%(e)
Portfolio Turnover ............................................. 331.55% 387.57% 283.38% 269.88%
----------
(a) Veredus Select Growth Fund, Class I, commenced investment operations on
September 11, 2006.
(b) The selected per share data was calculated using the weighted average
shares outstanding method for the period.
(c) Represents less than $(0.005) per share.
(d) Not Annualized.
(e) Annualized.
SEE ACCOMPANYING NOTES TO FINANCIAL STATEMENTS.
92
Aston Funds
GROWTH FUND - CLASS N
OCTOBER 31, 2009
FINANCIAL HIGHLIGHTS
YEAR YEAR YEAR YEAR YEAR
ENDED ENDED ENDED ENDED ENDED
10/31/09 10/31/08 10/31/07 10/31/06 10/31/05
-------- -------- -------- -------- --------
Net Asset Value, Beginning of period .......................... $ 10.95 $ 22.49 $ 22.82 $ 22.66 $ 21.76
------- ------- -------- -------- --------
INCOME FROM INVESTMENT OPERATIONS:
Net investment income ................................... 0.05(a) 0.02 0.05(a) --(b) 0.05(a)
Net realized and unrealized gain (loss) on investments .. 1.68(c) (5.93) 2.39 1.25 0.90
------- ------- -------- -------- --------
Total from investment operations ..................... 1.73 (5.91) 2.44 1.25 0.95
------- ------- -------- -------- --------
LESS DISTRIBUTIONS:
Distributions from and in excess of net
investment income .................................... (0.02) -- (0.03) -- (0.05)
Distributions from net realized gain on investments ..... -- (5.63) (2.74) (1.09) --
------- ------- -------- -------- --------
Total distributions .................................. (0.02) (5.63) (2.77) (1.09) (0.05)
------- ------- -------- -------- --------
Net increase (decrease) in net asset value .................... 1.71 (11.54) (0.33) 0.16 0.90
------- ------- -------- -------- --------
Net Asset Value, End of period ................................ $ 12.66 $ 10.95 $ 22.49 $ 22.82 $ 22.66
======= ======= ======== ======== ========
TOTAL RETURN .................................................. 15.87% (33.76)% 11.85% 5.55% 4.38%
RATIOS/SUPPLEMENTAL DATA:
Net Assets, End of period (in 000's) ....................... $56,305 $62,674 $172,436 $446,884 $888,248
Ratios of expenses to average net assets:
Before reimbursement and/or waiver of
expenses by Adviser .................................. 1.16% 1.15%(e) 1.11%(e) 1.10%(e) 1.10%
After reimbursement and/or waiver of
expenses by Adviser .................................. 1.15%(d) 1.15%(e) 1.11%(e) 1.10%(e) 1.10%
Ratios of net investment income to average net assets:
Before reimbursement and/or waiver of
expenses by Adviser .................................. 0.41% 0.09% 0.23% 0.01% 0.21%
After reimbursement and/or waiver of
expenses by Adviser .................................. 0.42% 0.09% 0.23% 0.01% 0.21%
Portfolio Turnover ......................................... 37.59% 122.68% 47.46% 29.07% 31.30%(f)
----------
(a) The selected per share data was calculated using the weighted average
shares outstanding method for the period.
(b) Represents less than $0.005 per share.
(c) Includes payment by affiliates which is less than $0.005 per share.
(d) The Adviser voluntarily waived 0.01% of their fees through October 31,
2009.
(e) Ratios of expenses to average net assets include interest expense of 0.01%
for the year ended October 31, 2008 and less than 0.005% for the years
ended October 31, 2007 and October 31, 2006. The interest expense is from
utilizing the line of credit as discussed in Note H to Financial
Statements.
(f) Portfolio turnover rate excludes securities delivered from processing a
redemption-in-kind.
SEE ACCOMPANYING NOTES TO FINANCIAL STATEMENTS.
93
Aston Funds
GROWTH FUND - CLASS I
OCTOBER 31, 2009
FINANCIAL HIGHLIGHTS
YEAR YEAR YEAR YEAR YEAR
ENDED ENDED ENDED ENDED ENDED
10/31/09 10/31/08 10/31/07 10/31/06 10/31/05
-------- -------- -------- -------- --------
Net Asset Value, Beginning of period .......................... $ 11.17 $ 22.83 $ 23.14 $ 22.97 $ 22.02
-------- -------- -------- -------- --------
INCOME FROM INVESTMENT OPERATIONS:
Net investment income ................................... 0.08(a) 0.06 0.11(a) 0.07 0.11(a)
Net realized and unrealized gain (loss) on investments .. 1.71(b) (6.04) 2.43 1.27 0.92
-------- -------- -------- -------- --------
Total from investment operations ..................... 1.79 (5.98) 2.54 1.34 1.03
-------- -------- -------- -------- --------
LESS DISTRIBUTIONS:
Distributions from and in excess of net
investment income .................................... (0.06) (0.05) (0.11) (0.08) (0.08)
Distributions from net realized gain on investments ..... -- (5.63) (2.74) (1.09) --
-------- -------- -------- -------- --------
Total distributions .................................. (0.06) (5.68) (2.85) (1.17) (0.08)
-------- -------- -------- -------- --------
Net increase (decrease) in net asset value .................... 1.73 (11.66) (0.31) 0.17 0.95
-------- -------- -------- -------- --------
Net Asset Value, End of period ................................ $ 12.90 $ 11.17 $ 22.83 $ 23.14 $ 22.97
======== ======== ======== ======== ========
TOTAL RETURN .................................................. 16.21% (33.61)% 12.19% 5.87% 4.69%
RATIOS/SUPPLEMENTAL DATA:
Net Assets, End of period (in 000's) ....................... $144,805 $125,727 $247,258 $459,965 $449,492
Ratios of expenses to average net assets:
Before reimbursement and/or waiver of
expenses by Adviser .................................. 0.91% 0.90%(d) 0.83%(d) 0.81%(d) 0.82%
After reimbursement and/or waiver of
expenses by Adviser .................................. 0.90%(c) 0.90%(d) 0.83%(d) 0.81%(d) 0.82%
Ratios of net investment income to average net assets:
Before reimbursement and/or waiver of
expenses by Adviser .................................. 0.66% 0.34% 0.51% 0.30% 0.49%
After reimbursement and/or waiver of
expenses by Adviser .................................. 0.67% 0.34% 0.51% 0.30% 0.49%
Portfolio Turnover ......................................... 37.59% 122.68% 47.46% 29.07% 31.30%(e)
----------
(a) The selected per share data was calculated using the weighted average
shares outstanding method for the period.
(b) Includes payment by affiliates which is less than $0.005 per share.
(c) The Adviser voluntarily waived 0.01% of their fees through October 31,
2009.
(d) Ratios of expenses to average net assets include interest expense of 0.01%
for the year ended October 31, 2008 and less than 0.005% for the years
ended October 31, 2007 and October 31, 2006. The interest expense is from
utilizing the line of credit as discussed in Note H to Financial
Statements.
(e) Portfolio turnover rate excludes securities delivered from processing a
redemption-in-kind.
SEE ACCOMPANYING NOTES TO FINANCIAL STATEMENTS.
94
Aston Funds
GROWTH FUND - CLASS R
OCTOBER 31, 2009
FINANCIAL HIGHLIGHTS
YEAR YEAR YEAR YEAR YEAR
ENDED ENDED ENDED ENDED ENDED
10/31/09 10/31/08 10/31/07 10/31/06 10/31/05
-------- -------- -------- -------- --------
Net Asset Value, Beginning of period .......................... $10.78 $ 22.28 $22.64 $22.53 $21.66
------ ------- ------ ------ ------
INCOME FROM INVESTMENT OPERATIONS:
Net investment income (loss) ............................ 0.02(a) 0.04 --(a)(b) (0.04) --(a)(b)
Net realized and unrealized gain (loss) on investments .. 1.66(c) (5.91) 2.38 1.24 0.90
------ ------- ------ ------ ------
Total from investment operations ..................... 1.68 (5.87) 2.38 1.20 0.90
------ ------- ------ ------ ------
LESS DISTRIBUTIONS:
Distributions from and in excess of net
investment income .................................... (0.01) -- -- -- (0.03)
Distributions from net realized gain on investments ..... -- (5.63) (2.74) (1.09) --
------ ------- ------ ------ ------
Total distributions .................................. (0.01) (5.63) (2.74) (1.09) (0.03)
------ ------- ------ ------ ------
Net increase (decrease) in net asset value .................... 1.67 (11.50) (0.36) 0.11 0.87
------ ------- ------ ------ ------
Net Asset Value, End of period ................................ $12.45 $ 10.78 $22.28 $22.64 $22.53
====== ======= ====== ====== ======
TOTAL RETURN .................................................. 15.69% (33.93)% 11.61% 5.35% 4.16%
RATIOS/SUPPLEMENTAL DATA:
Net Assets, End of period (in 000's) ....................... $ 588 $ 560 $ 684 $1,679 $1,122
Ratios of expenses to average net assets:
Before reimbursement and/or waiver of
expenses by Adviser .................................. 1.41% 1.40%(e) 1.32%(e) 1.31%(e) 1.31%
After reimbursement and/or waiver of
expenses by Adviser .................................. 1.40%(d) 1.40%(e) 1.32%(e) 1.31%(e) 1.31%
Ratios of net investment income (loss)
to average net assets:
Before reimbursement and/or waiver of
expenses by Adviser .................................. 0.16% (0.16)% 0.01% (0.20)% 0.00%
After reimbursement and/or waiver of
expenses by Adviser .................................. 0.17% (0.16)% 0.01% (0.20)% 0.00%
Portfolio Turnover ......................................... 37.59% 122.68% 47.46% 29.07% 31.30%(f)
----------
(a) The selected per share data was calculated using the weighted average
shares outstanding method for the period.
(b) Represents less than $0.005 per share.
(c) Includes payment by affiliates which is less than $0.005 per share.
(d) The Adviser voluntarily waived 0.01% of their fees through October 31,
2009.
(e) Ratios of expenses to average net assets include interest expense of 0.01%
for the year ended October 31, 2008 and less than 0.005% for the years
ended October 31, 2007 and October 31, 2006. The interest expense is from
utilizing the line of credit as discussed in Note H to Financial
Statements.
(f) Portfolio turnover rate excludes securities delivered from processing a
redemption-in-kind.
SEE ACCOMPANYING NOTES TO FINANCIAL STATEMENTS.
95
Aston Funds
OPTIMUM LARGE CAP OPPORTUNITY FUND - CLASS N
OCTOBER 31, 2009
FINANCIAL HIGHLIGHTS
YEAR YEAR PERIOD
ENDED ENDED ENDED
10/31/09 10/31/08 10/31/07(a)
-------- -------- -----------
Net Asset Value, Beginning of period .............................. $ 6.79 $ 12.56 $ 10.00
------ ------- -------
INCOME FROM INVESTMENT OPERATIONS:
Net investment income (loss) ................................ 0.02 (0.02) (0.01)
Net realized and unrealized gain (loss) on investments ...... 1.09 (5.74) 2.57
------ ------- -------
Total from investment operations ......................... 1.11 (5.76) 2.56
------ ------- -------
LESS DISTRIBUTIONS:
Distributions from and in excess of
net investment income .................................... -- (0.01) --
------ ------- -------
Total distributions ...................................... -- (0.01) --
------ ------- -------
Net increase (decrease) in net asset value ........................ 1.11 (5.77) 2.56
------ ------- -------
Net Asset Value, End of period .................................... $ 7.90 $ 6.79 $ 12.56
====== ======= =======
TOTAL RETURN ...................................................... 16.35% (45.90)% 25.60%(b)
RATIOS/SUPPLEMENTAL DATA:
Net Assets, End of period (in 000's) ........................... $4,334 $ 3,691 $40,563
Ratios of expenses to average net assets:
Before reimbursement and/or waiver of expenses by Adviser ... 3.18 1.89%(d) 2.30%(d)(e)
After reimbursement and/or waiver of expenses by Adviser .... 1.19(c) 1.12%(d) 1.13%(d)(e)(f)
Ratios of net investment income (loss) to average net assets:
Before reimbursement and/or waiver of expenses by Adviser ... (1.73) (0.86)% (1.31)%(e)
After reimbursement and/or waiver of expenses by Adviser .... 0.26 (0.09)% (0.14)%(e)
Portfolio Turnover ............................................. 76.59% 48.87% 76.40%(b)
----------
(a) Optimum Large Cap Opportunity Fund, Class N, commenced investment
operations on December 28, 2006.
(b) Not Annualized.
(c) Effective March 1, 2009, the Adviser removed the voluntary expense
limitation of 1.10%, the contractual expense limitation is 1.22%.
(d) Ratios of expenses to average net assets include interest expense of 0.02%
for the year ended October 31, 2008 and the period ended October 31, 2007,
which is not included in the contractual or voluntary expense limitation.
The interest expense is from utilizing the line of credit as discussed in
Note H to Financial Statements.
(e) Annualized.
(f) The Adviser's expense reimbursement level, which affects the net expense
ratio, was implemented on May 1, 2007.
SEE ACCOMPANYING NOTES TO FINANCIAL STATEMENTS.
96
Aston Funds
VALUE FUND - CLASS N
OCTOBER 31, 2009
FINANCIAL HIGHLIGHTS
YEAR YEAR YEAR YEAR YEAR
ENDED ENDED ENDED ENDED ENDED
10/31/09 10/31/08 10/31/07 10/31/06 10/31/05
-------- -------- -------- -------- --------
Net Asset Value, Beginning of period ....................... $ 9.07 $ 15.57 $ 14.06 $ 12.15 $ 11.05
------- ------- -------- -------- -------
INCOME FROM INVESTMENT OPERATIONS:
Net investment income ................................ 0.15 0.15 0.19 0.21 0.17(a)
Net realized and unrealized gain (loss)
on investments .................................... 0.41 (5.08) 2.09 2.09 1.10
------- ------- -------- -------- -------
Total from investment operations .................. 0.56 (4.93) 2.28 2.30 1.27
------- ------- -------- -------- -------
LESS DISTRIBUTIONS:
Distributions from and in excess of net
investment income ................................. (0.15) (0.16) (0.20) (0.20) (0.17)
Distributions from net realized gain on investments .. (1.17) (1.41) (0.57) (0.19) --
------- ------- -------- -------- -------
Total distributions ............................... (1.32) (1.57) (0.77) (0.39) (0.17)
------- ------- -------- -------- -------
Net increase (decrease) in net asset value ................. (0.76) (6.50) 1.51 1.91 1.10
------- ------- -------- -------- -------
Net Asset Value, End of period ............................. $ 8.31 $ 9.07 $ 15.57 $ 14.06 $ 12.15
======= ======= ======== ======== =======
TOTAL RETURN ............................................... 8.60% (34.85)% 16.77% 19.35% 11.48%
RATIOS/SUPPLEMENTAL DATA:
Net Assets, End of period (in 000's) .................... $20,173 $19,704 $130,476 $103,819 $95,624
Ratios of expenses to average net assets:
Before reimbursement and/or waiver of
expenses by Adviser ............................... 1.21% 1.18%(c) 1.16% 1.16% 1.16%
After reimbursement and/or waiver of
expenses by Adviser ............................... 1.07%(b) 1.02%(c) 0.94% 0.94% 0.94%
Ratios of net investment income to average net assets:
Before reimbursement and/or waiver of
expenses by Adviser ............................... 1.77% 1.22% 1.06% 1.37% 1.19%
After reimbursement and/or waiver of
expenses by Adviser ............................... 1.91% 1.38% 1.28% 1.59% 1.41%
Portfolio Turnover ...................................... 39.00% 67.57% 28.05% 26.86% 21.84%
----------
(a) The selected per share data was calculated using the weighted average
shares outstanding method for the period.
(b) The Adviser removed the contractual expense limitation, not including
interest expense or acquired fund fees and expenses, and implemented a
voluntary expense limitation of 1.07% effective March 1, 2009.
(c) Ratios of expenses to average net assets include interest expense of less
than 0.005% for the year ended October 31, 2008, which is not included in
the contractual expense limitation. The interest expense is from utilizing
the line of credit as discussed in Note H to Financial Statements.
SEE ACCOMPANYING NOTES TO FINANCIAL STATEMENTS.
97
Aston Funds
VALUE FUND - CLASS I
OCTOBER 31, 2009
FINANCIAL HIGHLIGHTS
YEAR YEAR YEAR YEAR PERIOD
ENDED ENDED ENDED ENDED ENDED
10/31/09 10/31/08 10/31/07 10/31/06 10/31/05(a)
-------- -------- -------- -------- -----------
Net Asset Value, Beginning of period ........................... $ 9.06 $ 15.57 $ 14.07 $ 12.16 $ 12.36
-------- -------- -------- -------- --------
INCOME FROM INVESTMENT OPERATIONS:
Net investment income .................................... 0.17 0.20 0.23 0.24 0.01(b)
Net realized and unrealized gain (loss) on investments ... 0.42 (5.10) 2.07 2.09 (0.21)
-------- -------- -------- -------- --------
Total from investment operations ...................... 0.59 (4.90) 2.30 2.33 (0.20)
-------- -------- -------- -------- --------
LESS DISTRIBUTIONS:
Distributions from and in excess of net investment
income ................................................ (0.17) (0.20) (0.23) (0.23) --
Distributions from net realized gain on investments ...... (1.17) (1.41) (0.57) (0.19) --
-------- -------- -------- -------- --------
Total distributions ................................... (1.34) (1.61) (0.80) (0.42) --
-------- -------- -------- -------- --------
Net increase (decrease) in net asset value ..................... (0.75) (6.51) 1.50 1.91 (0.20)
-------- -------- -------- -------- --------
Net Asset Value, End of period ................................. $ 8.31 $ 9.06 $ 15.57 $ 14.07 $ 12.16
======== ======== ======== ======== ========
TOTAL RETURN ................................................... 9.01% (34.73)% 16.98% 19.64% (1.62)%(c)
RATIOS/SUPPLEMENTAL DATA:
Net Assets, End of period (in 000's) ........................ $205,580 $188,688 $289,024 $247,667 $192,662
Ratios of expenses to average net assets:
Before reimbursement and/or waiver of expenses by
Adviser ............................................... 0.96% 0.93%(e) 0.91% 0.91% 0.91%(f)
After reimbursement and/or waiver of expenses by
Adviser ............................................... 0.82%(d) 0.77%(e) 0.69% 0.69% 0.69%(f)
Ratios of net investment income to average net assets:
Before reimbursement and/or waiver of expenses by
Adviser ............................................... 2.02% 1.47% 1.31% 1.62% 0.40%(f)
After reimbursement and/or waiver of expenses by
Adviser ............................................... 2.16% 1.63% 1.53% 1.84% 0.62%(f)
Portfolio Turnover .......................................... 39.00% 67.57% 28.05% 26.86% 21.84%
----------
(a) Value Fund, Class I, commenced investment operations on September 20, 2005.
(b) The selected per share data was calculated using the weighted average
shares outstanding method for the period.
(c) Not Annualized.
(d) The Adviser removed the contractual expense limitation, not including
interest expense or acquired fund fees and expenses, and implemented a
voluntary expense limitation of 0.82% effective March 1, 2009.
(e) Ratios of expense to average net assets included interest expense of less
than 0.005% for the year ended October 31, 2008, which is not included in
the contractual expense limitation. The interest expenses is from utilizing
the line of credit as discussed in Note H to Financial Statements.
(f) Annualized.
SEE ACCOMPANYING NOTES TO FINANCIAL STATEMENTS.
98
Aston Funds
TAMRO DIVERSIFIED EQUITY FUND - CLASS N
OCTOBER 31, 2009
FINANCIAL HIGHLIGHTS
YEAR YEAR YEAR YEAR YEAR
ENDED ENDED ENDED ENDED ENDED
10/31/09 10/31/08 10/31/07 10/31/06 10/31/05
-------- -------- -------- -------- --------
Net Asset Value, Beginning of period ........................... $ 8.34 $ 14.41 $ 13.91 $ 12.40 $ 11.35
------- ------- ------- ------- -------
INCOME FROM INVESTMENT OPERATIONS:
Net investment income (loss) ............................. --(a) 0.04 0.03 0.09 0.08
Net realized and unrealized gain (loss) on investments ... 1.42 (4.94) 2.13 1.53 1.05
------- ------- ------- ------- -------
Total from investment operations ...................... 1.42 (4.90) 2.16 1.62 1.13
------- ------- ------- ------- -------
LESS DISTRIBUTIONS:
Distributions from and in excess of net investment
income ................................................ (0.04) (0.01) (0.03) (0.11) (0.08)
Distributions from net realized gain on investments ...... -- (1.16) (1.63) -- --
------- ------- ------- ------- -------
Total distributions ................................... (0.04) (1.17) (1.66) (0.11) (0.08)
------- ------- ------- ------- -------
Net increase (decrease) in net asset value ..................... 1.38 (6.07) 0.50 1.51 1.05
------- ------- ------- ------- -------
Net Asset Value, End of period ................................. $ 9.72 $ 8.34 $ 14.41 $ 13.91 $ 12.40
======= ======= ======= ======= =======
TOTAL RETURN ................................................... 17.13% (36.75)% 16.98% 13.10% 9.98%
RATIOS/SUPPLEMENTAL DATA:
Net Assets, End of period (in 000's) ........................ $10,486 $ 8,562 $15,359 $15,864 $21,590
Ratios of expenses to average net assets:
Before reimbursement and/or waiver of expenses by
Adviser ............................................... 1.95% 1.88% 1.74%(b) 1.54%(b) 1.54%
After reimbursement and/or waiver of expenses by
Adviser ............................................... 1.20% 1.20% 1.20%(b) 1.22%(b) 1.20%
Ratios of net investment income (loss) to average net assets:
Before reimbursement and/or waiver of expenses by
Adviser ............................................... (0.77)% (0.37)% (0.30)% 0.36% 0.35%
After reimbursement and/or waiver of expenses by
Adviser ............................................... (0.02)% 0.31% 0.24% 0.68% 0.69%
Portfolio Turnover .......................................... 85.49% 93.82% 37.87% 43.88% 36.84%
----------
(a) Represents less than $(0.005) per share.
(b) Ratios of expenses to average net assets include interest expense of less
than 0.005% for the year ended October 31, 2007 and 0.02% for the year
ended October 31, 2006, which is not included in the contractual expense
limitation. The interest expense is from utilizing the line of credit as
discussed in Note H to Financial Statements.
SEE ACCOMPANYING NOTES TO FINANCIAL STATEMENTS.
99
Aston Funds
RIVER ROAD DIVIDEND ALL CAP VALUE FUND - CLASS N
OCTOBER 31, 2009
FINANCIAL HIGHLIGHTS
YEAR YEAR YEAR YEAR PERIOD
ENDED ENDED ENDED ENDED ENDED
10/31/09 10/31/08 10/31/07 10/31/06 10/31/05(a)
-------- -------- -------- -------- -----------
Net Asset Value, Beginning of period ........................... $ 8.43 $ 12.58 $ 11.81 $ 9.91 $10.00
------- ------- ------- ------- ------
INCOME FROM INVESTMENT OPERATIONS:
Net investment income .................................... 0.26(b) 0.38 0.46(b) 0.42 0.13
Short-term capital gains distributions received .......... -- -- -- --(c) --
Net realized and unrealized gain (loss) on investments ... 0.08 (3.54) 0.81 1.89 (0.10)
------- ------- ------- ------- ------
Total from investment operations ...................... 0.34 (3.16) 1.27 2.31 0.03
------- ------- ------- ------- ------
LESS DISTRIBUTIONS:
Distributions from and in excess of net investment
income ................................................ (0.19) (0.32) (0.37) (0.41) (0.12)
Return of Capital ........................................ -- (0.01) -- -- --
Distributions from net realized gain on investments ...... -- (0.66) (0.13) -- --
------- ------- ------- ------- ------
Total distributions ................................... (0.19) (0.99) (0.50) (0.41) (0.12)
------- ------- ------- ------- ------
Net increase (decrease) in net asset value ..................... 0.15 (4.15) 0.77 1.90 (0.09)
------- ------- ------- ------- ------
Net Asset Value, End of period ................................. $ 8.58 $ 8.43 $ 12.58 $ 11.81 $ 9.91
======= ======= ======= ======= ======
TOTAL RETURN ................................................... 4.33% (26.82)% 10.89% 23.71% 0.30%(d)
RATIOS/SUPPLEMENTAL DATA:
Net Assets, End of period (in 000's) ........................ $81,842 $51,504 $32,313 $15,899 $5,326
Ratios of expenses to average net assets:
Before reimbursement and/or waiver of expenses by
Adviser ............................................... 1.21% 1.35%(e) 1.53% 2.48% 2.71%(f)
After reimbursement and/or waiver of expenses by
Adviser ............................................... 1.21% 1.30%(e) 1.30% 1.30% 1.30%(f)
Ratios of net investment income to average net assets:
Before reimbursement and/or waiver of expenses by
Adviser ............................................... 3.36% 3.81% 3.48% 2.77% 2.65%(f)
After reimbursement and/or waiver of expenses by
Adviser ............................................... 3.36% 3.86% 3.71% 3.95% 4.06%(f)
Portfolio Turnover .......................................... 47.34% 48.95% 114.56% 45.50% 14.37%(d)
----------
(a) River Road Dividend All Cap Value Fund, Class N, commenced investment
operations on June 28, 2005.
(b) The selected per share data was calculated using the weighted average
shares outstanding method for the period.
(c) Represents less than $0.005 per share.
(d) Not Annualized.
(e) Ratios of expenses to average net assets include interest expense of less
than 0.005% for the year ended October 31, 2008, which is not included in
the contractual expense limitation. The interest expense is from utilizing
the line of credit as discussed in Note H to Financial Statements.
(f) Annualized.
SEE ACCOMPANYING NOTES TO FINANCIAL STATEMENTS.
100
Aston Funds
RIVER ROAD DIVIDEND ALL CAP VALUE FUND - CLASS I
OCTOBER 31, 2009
FINANCIAL HIGHLIGHTS
YEAR YEAR PERIOD
ENDED ENDED ENDED
10/31/09 10/31/08 10/31/07(a)
-------- -------- -----------
Net Asset Value, Beginning of period ........................... $ 8.42 $ 12.57 $ 12.94
------- ------- -------
INCOME FROM INVESTMENT OPERATIONS:
Net investment income .................................... 0.29(b) 0.41 0.16(b)
Net realized and unrealized gain (loss) on investments ... 0.07 (3.55) (0.37)
------- ------- -------
Total from investment operations ...................... 0.36 (3.14) (0.21)
------- ------- -------
LESS DISTRIBUTIONS:
Distributions from and in excess of net investment
income ................................................ (0.21) (0.34) (0.16)
Return of Capital ........................................ -- (0.01) --
Distributions from net realized gain on investments ...... -- (0.66) --
------- ------- -------
Total distributions ................................... (0.21) (1.01) (0.16)
------- ------- -------
Net increase (decrease) in net asset value ..................... 0.15 (4.15) (0.37)
------- ------- -------
Net Asset Value, End of period ................................. $ 8.57 $ 8.42 $ 12.57
======= ======= =======
TOTAL RETURN ................................................... 4.59% (26.66)% (1.58)%(c)
RATIOS/SUPPLEMENTAL DATA:
Net Assets, End of period (in 000's) ........................ $77,185 $ 144 $ 197
Ratios of expenses to average net assets:
Before reimbursement and/or waiver of expenses by
Adviser ............................................... 0.96% 1.10%(d) 1.42%(e)
After reimbursement and/or waiver of expenses by
Adviser ............................................... 0.96% 1.05%(d) 0.96%(e)
Ratios of net investment income to average net assets:
Before reimbursement and/or waiver of expenses by
Adviser ............................................... 3.61% 4.06% 2.86%(e)
After reimbursement and/or waiver of expenses by
Adviser ............................................... 3.61% 4.11% 3.33%(e)
Portfolio Turnover .......................................... 47.34% 48.95% 114.56%
----------
(a) River Road Dividend All Cap Value Fund, Class I, commenced investment
operations on June 28, 2007.
(b) The selected per share data was calculated using the weighted average
shares outstanding method for the period.
(c) Not Annualized.
(d) Ratios of expenses to average net assets include interest expense of less
than 0.005% for the year ended October 31, 2008, which is not included in
the contractual expense limitation. The interest expense is from utilizing
the line of credit as discussed in Note H to Financial Statements.
(e) Annualized.
SEE ACCOMPANYING NOTES TO FINANCIAL STATEMENTS.
101
Aston Funds
OPTIMUM MID CAP FUND - CLASS N
OCTOBER 31, 2009
FINANCIAL HIGHLIGHTS
YEAR YEAR YEAR YEAR YEAR
ENDED ENDED ENDED ENDED ENDED
10/31/09 10/31/08 10/31/07 10/31/06 10/31/05
-------- -------- -------- -------- --------
Net Asset Value, Beginning of period ........................... $ 17.25 $ 32.32 $ 27.16 $ 23.21 $ 22.93
-------- -------- -------- -------- --------
INCOME FROM INVESTMENT OPERATIONS:
Net investment income (loss) ............................. 0.09 0.05 (0.02) (0.02) (0.02)
Net realized and unrealized gain (loss) on investments ... 5.82 (12.93) 7.01 4.88 1.04
-------- -------- -------- -------- --------
Total from investment operations ...................... 5.91 (12.88) 6.99 4.86 1.02
-------- -------- -------- -------- --------
LESS DISTRIBUTIONS:
Distributions from and in excess of net investment
income ................................................ (0.14) -- -- -- --
Distributions from net realized gain on investments ...... (0.29) (2.19) (1.83) (0.91) (0.74)
-------- -------- -------- -------- --------
Total distributions ................................... (0.43) (2.19) (1.83) (0.91) (0.74)
-------- -------- -------- -------- --------
Net increase (decrease) in net asset value ..................... 5.48 (15.07) 5.16 3.95 0.28
-------- -------- -------- -------- --------
Net Asset Value, End of period ................................. $ 22.73 $ 17.25 $ 32.32 $ 27.16 $ 23.21
======== ======== ======== ======== ========
TOTAL RETURN ................................................... 35.60% (42.50)% 27.08% 21.39% 4.43%
RATIOS/SUPPLEMENTAL DATA:
Net Assets, End of period (in 000's) ........................ $842,233 $508,886 $823,036 $577,891 $548,595
Ratios of expenses to average net assets:
Before reimbursement and/or waiver of expenses by
Adviser ............................................... 1.20%(a) 1.16%(a) 1.15%(a) 1.16% 1.23%
After reimbursement and/or waiver of expenses by
Adviser ............................................... 1.20%(a) 1.16%(a) 1.15%(a) 1.16% 1.23%
Ratios of net investment income (loss) to average net assets:
Before reimbursement and/or waiver of expenses by
Adviser ............................................... 0.46% 0.18% (0.09)% (0.09)% (0.08)%
After reimbursement and/or waiver of expenses by
Adviser ............................................... 0.46% 0.18% (0.09)% (0.09)% (0.08)%
Portfolio Turnover .......................................... 17.72% 22.58% 26.15% 30.65% 27.42%
----------
(a) Ratios of expenses to average net assets include interest expense of less
than 0.005% for the years ended October 31, 2009, October 31, 2008 and
October 31, 2007, which is not included in the contractual expense
limitation. The interest expense is from utilizing the line of credit as
discussed in Note H to Financial Statements.
SEE ACCOMPANYING NOTES TO FINANCIAL STATEMENTS.
102
Aston Funds
OPTIMUM MID CAP FUND - CLASS I
OCTOBER 31, 2009
FINANCIAL HIGHLIGHTS
YEAR YEAR YEAR YEAR YEAR
ENDED ENDED ENDED ENDED ENDED
10/31/09 10/31/08 10/31/07 10/31/06 10/31/05
-------- -------- -------- -------- --------
Net Asset Value, Beginning of period ........................... $ 17.47 $ 32.64 $ 27.34 $ 23.30 $ 22.96
-------- ------- -------- ------- -------
INCOME FROM INVESTMENT OPERATIONS:
Net investment income .................................... 0.13 0.11 0.05 0.05 0.04
Net realized and unrealized gain (loss) on investments ... 5.89 (13.09) 7.08 4.90 1.04
-------- ------- -------- ------- -------
Total from investment operations ...................... 6.02 (12.98) 7.13 4.95 1.08
-------- ------- -------- ------- -------
LESS DISTRIBUTIONS:
Distributions from and in excess of net investment
income ................................................ (0.20) -- -- -- --
Distributions from net realized gain on investment ....... (0.29) (2.19) (1.83) (0.91) (0.74)
-------- ------- -------- ------- -------
Total distributions ................................... (0.49) (2.19) (1.83) (0.91) (0.74)
-------- ------- -------- ------- -------
Net increase (decrease) in net asset value ..................... 5.53 (15.17) 5.30 4.04 0.34
-------- ------- -------- ------- -------
Net Asset Value, End of period ................................. $ 23.00 $ 17.47 $ 32.64 $ 27.34 $ 23.30
======== ======= ======== ======= =======
TOTAL RETURN ................................................... 35.97% (42.39)% 27.43% 21.76% 4.69%
RATIOS/SUPPLEMENTAL DATA:
Net Assets, End of period (in 000's) ........................ $150,953 $93,176 $126,691 $81,670 $73,293
Ratios of expenses to average net assets:
Before reimbursement and/or waiver of expenses by
Adviser ............................................... 0.95%(a) 0.91%(a) 0.87%(a) 0.89% 0.94%
After reimbursement and/or waiver of expenses by
Adviser ............................................... 0.95%(a) 0.91%(a) 0.87%(a) 0.89% 0.94%
Ratios of net investment income (loss) to average net assets:
Before reimbursement and/or waiver of expenses by
Adviser ............................................... 0.71% 0.43% 0.19% 0.18% 0.21%
After reimbursement and/or waiver of expenses by
Adviser ............................................... 0.71% 0.43% 0.19% 0.18% 0.21%
Portfolio Turnover .......................................... 17.72% 22.58% 26.15% 30.65% 27.42%
----------
(a) Ratios of expenses to average net assets include interest expense of less
than 0.005% for the years ended October 31, 2009, October 31, 2008 and
October 31, 2007, which is not included in the contractual expense
limitation. The interest expense is from utilizing the line of credit as
discussed in Note H to Financial Statements.
SEE ACCOMPANYING NOTES TO FINANCIAL STATEMENTS.
103
Aston Funds
MONTAG & CALDWELL MID CAP GROWTH FUND - CLASS N
OCTOBER 31, 2009
FINANCIAL HIGHLIGHTS
YEAR PERIOD
ENDED ENDED
10/31/09 10/31/08(a)
-------- -----------
Net Asset Value, Beginning of period ........................... $ 5.85 $ 10.00
------ -------
INCOME FROM INVESTMENT OPERATIONS:
Net investment loss ...................................... (0.04) (0.05)
Net realized and unrealized gain (loss) on investments ... 1.02 (4.10)
------ -------
Total from investment operations ...................... 0.98 (4.15)
------ -------
Net increase (decrease) in net asset value ..................... 0.98 (4.15)
------ -------
Net Asset Value, End of period ................................. $ 6.83 $ 5.85
====== =======
TOTAL RETURN ................................................... 16.75% (41.50)%(b)
RATIOS/SUPPLEMENTAL DATA:
Net Assets, End of period (in 000's) ........................ $2,959 $ 1,815
Ratios of expenses to average net assets:
Before reimbursement and/or waiver of expenses by
Adviser ............................................... 5.02% 5.80%(c)
After reimbursement and/or waiver of expenses by
Adviser ............................................... 1.40% 1.40%(c)
Ratios of net investment loss to average net assets:
Before reimbursement and/or waiver of expenses by
Adviser ............................................... (4.13)% (5.07)%(c)
After reimbursement and/or waiver of expenses by
Adviser ............................................... (0.51)% (0.67)%(c)
Portfolio Turnover .......................................... 54.37% 63.66%(b)
----------
(a) Montag & Caldwell Mid Cap Growth Fund, Class N, commenced investment
operations on November 2, 2007.
(b) Not Annualized.
(c) Annualized.
SEE ACCOMPANYING NOTES TO FINANCIAL STATEMENTS.
104
Aston Funds
CARDINAL MID CAP VALUE FUND - CLASS N
OCTOBER 31, 2009
FINANCIAL HIGHLIGHTS
YEAR PERIOD
ENDED ENDED
10/31/09 10/31/08(a)
-------- -----------
Net Asset Value, Beginning of period ........................... $ 6.23 $ 10.00
------- -------
INCOME FROM INVESTMENT OPERATIONS:
Net investment income .................................... 0.02 0.01
Net realized and unrealized gain (loss) on investments ... 0.99 (3.78)
------- -------
Total from investment operations ...................... 1.01 (3.77)
------- -------
LESS DISTRIBUTIONS:
Distributions from net investment income ................. (0.07) --
------- -------
Total distributions ................................... (0.07) --
------- -------
Net increase (decrease) in net asset value ..................... 0.94 (3.77)
------- -------
Net Asset Value, End of period ................................. $ 7.17 $ 6.23
======= =======
TOTAL RETURN ................................................... 16.45% (37.70)%(b)
RATIOS/SUPPLEMENTAL DATA:
Net Assets, End of period (in 000's) ........................ $ 916 $ 783
Ratios of expenses to average net assets:
Before reimbursement and/or waiver of expenses by Adviser 11.18% 11.20%(c)
After reimbursement and/or waiver of expenses by Adviser . 1.40% 1.40%(c)
Ratios of net investment income (loss) to average net assets:
Before reimbursement and/or waiver of expenses by Adviser (9.48)% (9.64)%(c)
After reimbursement and/or waiver of expenses by Adviser . 0.30% 0.16%(c)
Portfolio Turnover .......................................... 65.55% 50.79%(b)
----------
(a) Cardinal Mid Cap Value Fund, Class N, commenced investment operations on
November 2, 2007.
(b) Not Annualized.
(c) Annualized.
SEE ACCOMPANYING NOTES TO FINANCIAL STATEMENTS.
105
Aston Funds
RIVER ROAD SMALL-MID CAP FUND - CLASS N
OCTOBER 31, 2009
FINANCIAL HIGHLIGHTS
YEAR YEAR PERIOD
ENDED ENDED ENDED
10/31/09 10/31/08 10/31/07(a)
-------- -------- -----------
Net Asset Value, Beginning of period ............................ $ 7.13 $ 10.13 $ 10.00
------- ------- -------
INCOME FROM INVESTMENT OPERATIONS:
Net investment income (loss) .............................. --(b)(c) --(b)(c) 0.01
Net realized and unrealized gain (loss) on investments .... 0.59 (3.00) 0.12
------- ------- -------
Total from investment operations ....................... 0.59 (3.00) 0.13
------- ------- -------
LESS DISTRIBUTIONS:
Distributions from net investment income .................. (0.01) -- --
------- ------- -------
Total distribution ..................................... (0.01) -- --
------- ------- -------
Net increase (decrease) in net asset value ...................... 0.58 (3.00) 0.13
------- ------- -------
Net Asset Value, End of period .................................. $ 7.71 $ 7.13 $ 10.13
======= ======= =======
TOTAL RETURN .................................................... 8.33% (29.62)% 1.30%(d)
RATIOS/SUPPLEMENTAL DATA:
Net Assets, End of period (in 000's) ......................... $41,801 $26,714 $10,292
Ratios of expenses to average net assets:
Before recoupment and/or waiver of expenses by Adviser .... 1.44% 1.56% 3.18%(e)
After recoupment and/or waiver of expenses by Adviser ..... 1.50% 1.50% 1.50%(e)
Ratios of net investment income (loss) to average net
assets:
Before recoupment and/or waiver of expenses by Adviser .... 0.04% (0.08)% (1.43)%(e)
After recoupment and/or waiver of expenses by Adviser ..... (0.02)% (0.02)% 0.25%(e)
Portfolio Turnover ........................................... 44.09% 54.93% 41.51%(d)
----------
(a) River Road Small-Mid Cap Fund, Class N, commenced investment operations on
March 29, 2007.
(b) The selected per share data was calculated using the weighted average
shares outstanding method for the period.
(c) Represents less than $(0.005) per share.
(d) Not Annualized.
(e) Annualized.
SEE ACCOMPANYING NOTES TO FINANCIAL STATEMENTS.
106
Aston Funds
RIVER ROAD SMALL-MID CAP FUND - CLASS I
OCTOBER 31, 2009
FINANCIAL HIGHLIGHTS
YEAR YEAR PERIOD
ENDED ENDED ENDED
10/31/09 10/31/08 10/31/07(a)
-------- -------- -----------
Net Asset Value, Beginning of period ............................ $ 7.14 $ 10.13 $10.51
-------- ------- ------
INCOME FROM INVESTMENT OPERATIONS:
Net investment income ..................................... 0.02(b) 0.02(b) 0.01
Net realized and unrealized gain (loss) on investments .... 0.59 (3.00) (0.39)
-------- ------- ------
Total from investment operations ....................... 0.61 (2.98) (0.38)
-------- ------- ------
LESS DISTRIBUTIONS:
Distributions from net investment income .................. (0.02) (0.01) --
-------- ------- ------
Total distributions .................................... (0.02) (0.01) --
-------- ------- ------
Net increase (decrease) in net asset value ...................... 0.59 (2.99) (0.38)
-------- ------- ------
Net Asset Value, End of period .................................. $ 7.73 $ 7.14 $10.13
======== ======= ======
TOTAL RETURN .................................................... 8.52% (29.49)% (3.52)%(c)
RATIOS/SUPPLEMENTAL DATA:
Net Assets, End of period (in 000's) ......................... $167,334 $84,002 $7,482
Ratios of expenses to average net assets:
Before recoupment and/or waiver of expenses by Adviser .... 1.19% 1.31% 2.57%(d)
After recoupment and/or waiver of expenses by Adviser ..... 1.25% 1.25% 1.24%(d)
Ratios of net investment income (loss) to average net
assets:
Before recoupment and/or waiver of expenses by Adviser .... 0.29% 0.17% (0.91)%(d)
After recoupment and/or waiver of expenses by Adviser ..... 0.23% 0.23% 0.42%(d)
Portfolio Turnover ........................................... 44.09% 54.93% 41.51%(c)
----------
(a) River Road Small-Mid Cap Fund, Class I, commenced investment operations on
June 28, 2007.
(b) The selected per share data was calculated using the weighted average
shares outstanding method for the period.
(c) Not Annualized.
(d) Annualized.
SEE ACCOMPANYING NOTES TO FINANCIAL STATEMENTS.
107
Aston Funds
VEREDUS AGGRESSIVE GROWTH FUND - CLASS N
OCTOBER 31, 2009
FINANCIAL HIGHLIGHTS
YEAR YEAR YEAR YEAR YEAR
ENDED ENDED ENDED ENDED ENDED
10/31/09 10/31/08 10/31/07 10/31/06 10/31/05
-------- -------- -------- -------- --------
Net Asset Value, Beginning of period .............................. $ 8.38 $ 22.42 $ 18.44 $ 18.35 $ 16.26
------- ------- -------- -------- --------
INCOME FROM INVESTMENT OPERATIONS:
Net investment loss ......................................... (0.10) (0.17) (0.24)(a) (0.22)(a) (0.20)
Net realized and unrealized gain (loss) on investments ...... 0.74 (8.31) 5.45 0.31 2.29
------- ------- -------- -------- --------
Total from investment operations ......................... 0.64 (8.48) 5.21 0.09 2.09
------- ------- -------- -------- --------
LESS DISTRIBUTIONS:
Distributions from net realized gain on investments ......... (0.05) (5.56) (1.23) -- --
------- ------- -------- -------- --------
Total distributions ...................................... (0.05) (5.56) (1.23) -- --
------- ------- -------- -------- --------
Net increase (decrease) in net asset value ........................ 0.59 (14.04) 3.98 0.09 2.09
------- ------- -------- -------- --------
Net Asset Value, End of period .................................... $ 8.97 $ 8.38 $ 22.42 $ 18.44 $ 18.35
======= ======= ======== ======== ========
TOTAL RETURN ...................................................... 7.79% (47.87)% 30.01% 0.49% 12.85%
RATIOS/SUPPLEMENTAL DATA:
Net Assets, End of period (in 000's) ........................... $32,140 $43,149 $114,803 $367,113 $549,452
Ratios of expenses to average net assets:
Before reimbursement and/or waiver of expenses by Adviser ... 1.82%(b) 1.55%(b) 1.48%(b) 1.41%(b) 1.42%
After reimbursement and/or waiver of expenses by Adviser .... 1.49%(b) 1.49%(b) 1.48%(b) 1.41%(b) 1.42%
Ratios of net investment loss to average net assets:
Before reimbursement and/or waiver of expenses by Adviser ... (1.48)% (1.21)% (1.27)% (1.15)% (1.06)%
After reimbursement and/or waiver of expenses by Adviser .... (1.15)% (1.15)% (1.27)% (1.15)% (1.06)%
Portfolio Turnover ............................................. 264.98% 166.19% 126.54% 133.21% 140.04%
----------
(a) The selected per share data was calculated using the weighted average
shares outstanding method for the period.
(b) Ratios of expenses to average net assets include interest expense of less
than 0.005% for the years ended October 31, 2009 and October 31, 2008,
0.02% for the year ended October 31, 2007 and less than 0.005% for the year
ended October 31, 2006, which is not included in the contractual expense
limitation. The interest expense is from utilizing the line of credit as
discussed in Note H to Financial Statements.
SEE ACCOMPANYING NOTES TO FINANCIAL STATEMENTS.
108
Aston Funds
VEREDUS AGGRESSIVE GROWTH FUND - CLASS I
OCTOBER 31, 2009
FINANCIAL HIGHLIGHTS
YEAR YEAR YEAR YEAR YEAR
ENDED ENDED ENDED ENDED ENDED
10/31/09 10/31/08 10/31/07 10/31/06 10/31/05
-------- -------- -------- -------- --------
Net Asset Value, Beginning of period .............................. $ 8.61 $ 22.83 $ 18.71 $ 18.57 $ 16.40
------- ------- -------- -------- --------
INCOME FROM INVESTMENT OPERATIONS:
Net investment loss ......................................... (0.08) (0.21) (0.19)(a) (0.17)(a) (0.12)
Net realized and unrealized gain (loss) on investments ...... 0.77 (8.45) 5.54 0.31 2.29
------- ------- -------- -------- --------
Total from investment operations ......................... 0.69 (8.66) 5.35 0.14 2.17
------- ------- -------- -------- --------
LESS DISTRIBUTIONS:
Distributions from net realized gain on investments ......... (0.05) (5.56) (1.23) -- --
------- ------- -------- -------- --------
Total distributions ...................................... (0.05) (5.56) (1.23) -- --
------- ------- -------- -------- --------
Net increase (decrease) in net asset value ........................ 0.64 (14.22) 4.12 0.14 2.17
------- ------- -------- -------- --------
Net Asset Value, End of period .................................... $ 9.25 $ 8.61 $ 22.83 $ 18.71 $ 18.57
======= ======= ======== ======== ========
TOTAL RETURN ...................................................... 8.16% (47.77)% 30.34% 0.75% 13.23%
RATIOS/SUPPLEMENTAL DATA:
Net Assets, End of period (in 000's) ........................... $13,356 $16,719 $115,942 $150,697 $156,286
Ratios of expenses to average net assets:
Before reimbursement and/or waiver of expenses by Adviser ... 1.57%(b) 1.30%(b) 1.19%(b) 1.13%(b) 1.14%
After reimbursement and/or waiver of expenses by Adviser .... 1.24%(b) 1.24%(b) 1.19%(b) 1.13%(b) 1.14%
Ratios of net investment loss to average net assets:
Before reimbursement and/or waiver of expenses by Adviser ... (1.23)% (0.96)% (0.98)% (0.87)% (0.78)%
After reimbursement and/or waiver of expenses by Adviser .... (0.90)% (0.90)% (0.98)% (0.87)% (0.78)%
Portfolio Turnover ............................................. 264.98% 166.19% 126.54% 133.21% 140.04%
----------
(a) The selected per share data was calculated using the weighted average
shares outstanding method for the period.
(b) Ratios of expenses to average net assets include interest expense of less
than 0.005% for the years ended October 31, 2009 and October 31, 2008,
0.02% for the year ended October 31, 2007 and less than 0.005% for the year
ended October 31, 2006, which is not included in the contractual expense
limitation. The interest expense is from utilizing the line of credit as
discussed in Note H to Financial Statements.
SEE ACCOMPANYING NOTES TO FINANCIAL STATEMENTS.
109
Aston Funds
TAMRO SMALL CAP FUND - CLASS N
OCTOBER 31, 2009
FINANCIAL HIGHLIGHTS
YEAR YEAR YEAR YEAR YEAR
ENDED ENDED ENDED ENDED ENDED
10/31/09 10/31/08 10/31/07 10/31/06 10/31/05
-------- -------- -------- -------- --------
Net Asset Value, Beginning of period .............................. $ 13.64 $ 20.99 $ 19.73 $ 15.63 $ 15.25
-------- -------- -------- -------- --------
INCOME FROM INVESTMENT OPERATIONS:
Net investment income (loss) ................................ (0.05)(a) 0.05 (0.08)(a) (0.07)(a) (0.07)(a)
Net realized and unrealized gain (loss) on investments ...... 1.08 (6.43) 2.48 4.17 1.45
-------- -------- -------- -------- --------
Total from investment operations ......................... 1.03 (6.38) 2.40 4.10 1.38
-------- -------- -------- -------- --------
LESS DISTRIBUTIONS:
Distributions from net realized gain on investments ......... -- (0.97) (1.14) -- (1.00)
-------- -------- -------- -------- --------
Total distributions ...................................... -- (0.97) (1.14) -- (1.00)
-------- -------- -------- -------- --------
Net increase (decrease) in net asset value ........................ 1.03 (7.35) 1.26 4.10 0.38
-------- -------- -------- -------- --------
Net Asset Value, End of period .................................... $ 14.67 $ 13.64 $ 20.99 $ 19.73 $ 15.63
======== ======== ======== ======== ========
TOTAL RETURN ...................................................... 7.63% (31.58)% 12.56% 26.23% 9.16%
RATIOS/SUPPLEMENTAL DATA:
Net Assets, End of period (in 000's) ........................... $241,524 $159,965 $235,242 $182,462 $148,950
Ratios of expenses to average net assets:
Before reimbursement and/or waiver of expenses by Adviser ... 1.37% 1.32% 1.33%(c) 1.42% 1.41%
After reimbursement and/or waiver of expenses by Adviser .... 1.36%(b) 1.30% 1.30%(c) 1.30% 1.30%
Ratios of net investment income (loss) to average net assets:
Before reimbursement and/or waiver of expenses by Adviser ... (0.41)% 0.29% (0.42)% (0.51)% (0.58)%
After reimbursement and/or waiver of expenses by Adviser .... (0.40)% 0.31% (0.39)% (0.39)% (0.47)%
Portfolio Turnover ............................................. 89.92% 66.65% 58.88% 58.28% 56.28%
----------
(a) The selected per share data was calculated using the weighted average
shares outstanding method for the period.
(b) The Adviser removed the contractual expense limitation of 1.30%, not
including interest expense or acquired fund fees and expenses, effective
March 1, 2009.
(c) Ratios of expenses to average net assets include interest expenses of less
than 0.005% for the year ended October 31, 2007, which is not included in
the contractual expense limitation. The interest expense is from utilizing
the line of credit as discussed in Note H to Financial Statements.
SEE ACCOMPANYING NOTES TO FINANCIAL STATEMENTS.
110
Aston Funds
TAMRO SMALL CAP FUND - CLASS I
OCTOBER 31, 2009
FINANCIAL HIGHLIGHTS
YEAR YEAR YEAR YEAR PERIOD
ENDED ENDED ENDED ENDED ENDED
10/31/09 10/31/08 10/31/07 10/31/06 10/31/05(a)
-------- -------- -------- -------- -----------
Net Asset Value, Beginning of period .............................. $ 13.79 $ 21.16 $ 19.83 $ 15.67 $ 15.32
-------- -------- -------- ------- -------
INCOME FROM INVESTMENT OPERATIONS:
Net investment income (loss) ................................ (0.02)(b) 0.02 (0.02)(b) (0.02)(b) (0.04)(b)
Net realized and unrealized gain (loss) on investments ...... 1.12 (6.42) 2.49 4.18 0.39
-------- -------- -------- ------- -------
Total from investment operations ......................... 1.10 (6.40) 2.47 4.16 0.35
-------- -------- -------- ------- -------
LESS DISTRIBUTIONS:
Distributions from and in excess of net investment income ... (0.02) -- -- -- --
Distributions from net realized gain on investments ......... -- (0.97) (1.14) -- --
-------- -------- -------- ------- -------
Total distributions ...................................... (0.02) (0.97) (1.14) -- --
-------- -------- -------- ------- -------
Net increase (decrease) in net asset value ........................ 1.08 (7.37) 1.33 4.16 0.35
-------- -------- -------- ------- -------
Net Asset Value, End of period .................................... $ 14.87 $ 13.79 $ 21.16 $ 19.83 $ 15.67
======== ======== ======== ======= =======
TOTAL RETURN ...................................................... 7.94% (31.42)% 12.86% 26.55% 2.28%(c)
RATIOS/SUPPLEMENTAL DATA:
Net Assets, End of period (in 000's) ........................... $515,592 $238,399 $137,059 $63,982 $11,432
Ratios of expenses to average net assets:
Before reimbursement and/or waiver of expenses by Adviser ... 1.12% 1.07% 1.05%(e) 1.11% 1.16%(f)
After reimbursement and/or waiver of expenses by Adviser .... 1.11%(d) 1.05% 1.02%(e) 0.99% 1.05%(f)
Ratios of net investment income (loss) to average net assets:
Before reimbursement and/or waiver of expenses by Adviser ... (0.16)% 0.54% (0.14)% (0.20)% (0.39)%(f)
After reimbursement and/or waiver of expenses by Adviser .... (0.15)% 0.56% (0.11)% (0.08)% (0.28)%(f)
Portfolio Turnover ............................................. 89.92% 66.65% 58.88% 58.28% 56.28%
----------
(a) TAMRO Small Cap Fund, Class I, commenced investment operations on January
4, 2005.
(b) The selected per share data was calculated using the weighted average
shares outstanding method for the period.
(c) Not Annualized.
(d) The Adviser removed the contractual expense limitation of 1.05%, not
including interest expense or acquired fund fees and expenses, effective
March 1, 2009.
(e) Ratios of expenses to average net assets include interest expenses of less
than 0.005% for the year ended October 31, 2007, which is not included in
the contractual expense limitation. The interest expense is from utilizing
the line of credit as discussed in Note H to Financial Statements.
(f) Annualized.
SEE ACCOMPANYING NOTES TO FINANCIAL STATEMENTS.
111
Aston Funds
RIVER ROAD SMALL CAP VALUE FUND - CLASS N
OCTOBER 31, 2009
FINANCIAL HIGHLIGHTS
YEAR YEAR YEAR YEAR YEAR
ENDED ENDED ENDED ENDED ENDED
10/31/09 10/31/08 10/31/07 10/31/06 10/31/05(a)
-------- -------- -------- -------- -----------
Net Asset Value, Beginning of period .............................. $ 9.30 $ 14.37 $ 13.46 $ 10.28 $10.00
-------- -------- -------- -------- ------
INCOME FROM INVESTMENT OPERATIONS:
Net investment income ....................................... 0.01 0.01(b) 0.05(b) 0.02 --(c)
Net realized and unrealized gain (loss) on investments ...... 0.92 (4.54) 1.04 3.16 0.28
-------- -------- -------- -------- ------
Total from investment operations ......................... 0.93 (4.53) 1.09 3.18 0.28
-------- -------- -------- -------- ------
LESS DISTRIBUTIONS:
Distributions from and in excess of net investment income ... (0.01) -- (0.05) -- --
Distributions from net realized gain on investments ......... -- (0.54) (0.13) -- --
-------- -------- -------- -------- ------
Total distributions ...................................... (0.01) (0.54) (0.18) -- --
-------- -------- -------- -------- ------
Net increase (decrease) in net asset value ........................ 0.92 (5.07) 0.91 3.18 0.28
-------- -------- -------- -------- ------
Net Asset Value, End of period .................................... $ 10.22 $ 9.30 $ 14.37 $ 13.46 $10.28
======== ======== ======== ======== ======
TOTAL RETURN ...................................................... 9.99% (32.51)% 8.12% 30.93% 2.80%(d)
RATIOS/SUPPLEMENTAL DATA:
Net Assets, End of period (in 000's) ........................... $216,221 $160,245 $237,695 $167,438 $6,299
Ratios of expenses to average net assets:
Before reimbursement and/or waiver of expenses by Adviser ... 1.40% 1.45%(f) 1.44%(f) 1.78% 2.86%(g)
After reimbursement and/or waiver of expenses by Adviser .... 1.40%(e) 1.45%(f) 1.44%(f) 1.43% 1.50%(g)
Ratios of net investment income (loss) to average net assets:
Before reimbursement and/or waiver of expenses by Adviser ... 0.05% 0.08% 0.38% 0.25% (1.41)%(g)
After reimbursement and/or waiver of expenses by Adviser .... 0.05% 0.08% 0.38% 0.60% (0.05)%(g)
Portfolio Turnover ............................................. 35.83% 57.32% 74.18% 51.63% 20.82%(d)(h)
----------
(a) River Road Small Cap Value Fund, Class N, commenced investment operations
on June 28, 2005.
(b) The selected per share data was calculated using the weighted average
shares outstanding method for the period.
(c) Represents less than $(0.005) per share.
(d) Not Annualized.
(e) The Adviser removed the contractual expense limitation of 1.50%, not
including interest expense or acquired fund fees and expenses, effective
March 1, 2009.
(f) Ratios of expenses to average net assets include interest expenses of less
than 0.005% for the years ended October 31, 2008 and October 31, 2007,
which is not included in the contractual expense limitation. The interest
expense is from utilizing the line of credit as discussed in Note H to
Financial Statements.
(g) Annualized.
(h) Portfolio turnover rate excludes securities received from processing a
subscription-in-kind.
SEE ACCOMPANYING NOTES TO FINANCIAL STATEMENTS.
112
Aston Funds
RIVER ROAD SMALL CAP VALUE FUND - CLASS I
OCTOBER 31, 2009
FINANCIAL HIGHLIGHTS
YEAR YEAR YEAR
ENDED ENDED ENDED
10/31/09 10/31/08 10/31/07(a)
-------- -------- -----------
Net Asset Value, Beginning of period .............................. $ 9.32 $ 14.37 $ 14.04
-------- -------- -------
INCOME FROM INVESTMENT OPERATIONS:
Net investment income ....................................... 0.03 0.04(b) 0.09(b)
Net realized and unrealized gain (loss) on investments ...... 0.92 (4.54) 0.46
-------- -------- -------
Total from investment operations ......................... 0.95 (4.50) 0.55
-------- -------- -------
LESS DISTRIBUTIONS:
Distributions from and in excess of net investment income ... (0.03) (0.01) (0.09)
Distributions from net realized gain on investments ......... -- (0.54) (0.13)
-------- -------- -------
Total distributions ...................................... (0.03) (0.55) (0.22)
-------- -------- -------
Net increase (decrease) in net asset value ........................ 0.92 (5.05) 0.33
-------- -------- -------
Net Asset Value, End of period .................................... $ 10.24 $ 9.32 $ 14.37
======== ======== =======
TOTAL RETURN ...................................................... 10.31% (32.34)% 3.91%(c)
RATIOS/SUPPLEMENTAL DATA:
Net Assets, End of period (in 000's) ........................... $282,542 $114,666 $64,525
Ratios of expenses to average net assets:
Before reimbursement and/or waiver of expenses by Adviser ... 1.15% 1.20%(e) 1.16%(e)(f)
After reimbursement and/or waiver of expenses by Adviser .... 1.15%(d) 1.20%(e) 1.16%(e)(f)
Ratios of net investment income to average net assets:
Before reimbursement and/or waiver of expenses by Adviser ... 0.30% 0.33% 0.31%(f)
After reimbursement and/or waiver of expenses by Adviser .... 0.30% 0.33% 0.31%(f)
Portfolio Turnover ............................................. 35.83% 57.32% 74.18%
----------
(a) River Road Small Cap Value Fund, Class I, commenced investment operations
on December 13, 2006.
(b) The selected per share data was calculated using the weighted average
shares outstanding method for the period.
(c) Not Annualized.
(d) The Adviser removed the contractual expense limitation of 1.25%, not
including interest expense or acquired fund fees and expenses, effective
March 1, 2009.
(e) Ratios of expenses to average net assets include interest expenses of less
than 0.005% for the year ended October 31, 2008 and the period ended
October 31, 2007, which is not included in the contractual expense
limitation. The interest expense is from utilizing the line of credit as
discussed in Note H to Financial Statements.
(f) Annualized.
SEE ACCOMPANYING NOTES TO FINANCIAL STATEMENTS.
113
Aston Funds
NEPTUNE INTERNATIONAL FUND - CLASS N
OCTOBER 31, 2009
FINANCIAL HIGHLIGHTS
YEAR PERIOD
ENDED ENDED
10/31/09 10/31/08(a)
--------- -----------
Net Asset Value, Beginning of period .................................. $ 5.85 $ 11.14
------ -------
INCOME FROM INVESTMENT OPERATIONS:
Net investment income ........................................... 0.09(b) 0.02(b)
Net realized and unrealized gain (loss) on investments .......... 1.18(c) (5.31)
------ -------
Total from investment operations ............................. 1.27 (5.29)
------ -------
LESS DISTRIBUTIONS:
Distributions from and in excess of net investment income ....... (0.03) --
------ -------
Total distributions .......................................... (0.03) --
------ -------
Net increase (decrease) in net asset value ............................ 1.24 (5.29)
------ -------
Net Asset Value, End of period ........................................ $ 7.09 $ 5.85
====== =======
TOTAL RETURN .......................................................... 21.94% (47.49)%(d)
RATIOS/SUPPLEMENTAL DATA:
Net Assets, End of period (in 000's) ............................... $ 293 $ 225
Ratios of expenses to average net assets:
Before reimbursement and/or waiver of expenses by Adviser ....... 2.64% 3.15%(e)
After reimbursement and/or waiver of expenses by Adviser ........ 1.27% 1.27%(e)
Ratios of net investment income (loss) to average net assets:
Before reimbursement and/or waiver of expenses by Adviser ....... 0.07% (1.24)%(e)
After reimbursement and/or waiver of expenses by Adviser ........ 1.44% 0.64%(e)
Portfolio Turnover ................................................. 42.65% 7.39%
----------
(a) Neptune International Fund, Class N, commenced investment operations on
June 18, 2008.
(b) The selected per share data was calculated using the weighted average
shares outstanding method for the period.
(c) Includes payments by affiliates which is less than $0.005 per share.
(d) Not Annualized.
(e) Annualized.
SEE ACCOMPANYING NOTES TO FINANCIAL STATEMENTS.
114
Aston Funds
NEPTUNE INTERNATIONAL FUND - CLASS I
OCTOBER 31, 2009
FINANCIAL HIGHLIGHTS
YEAR YEAR PERIOD
ENDED ENDED ENDED
10/31/09 10/31/08 10/31/07(a)
--------- -------- -----------
Net Asset Value, Beginning of period .................................. $ 5.85 $ 12.24 $10.00
------ ------- ------
INCOME FROM INVESTMENT OPERATIONS:
Net investment income ........................................... 0.10(b) 0.17(b) 0.03
Net realized and unrealized gain (loss) on investments .......... 1.19(c) (6.42) 2.21
------ ------- ------
Total from investment operations ............................. 1.29 (6.25) 2.24
------ ------- ------
LESS DISTRIBUTIONS:
Distributions from and in excess of net investment income ....... (0.05) (0.14) --
------ ------- ------
Total distributions .......................................... (0.05) (0.14) --
------ ------- ------
Net increase (decrease) in net asset value ............................ 1.24 (6.39) 2.24
------ ------- ------
Net Asset Value, End of period ........................................ $ 7.09 $ 5.85 $12.24
====== ======= ======
TOTAL RETURN .......................................................... 22.23% (51.55)% 22.30%(d)
RATIOS/SUPPLEMENTAL DATA:
Net Assets, End of period (in 000's) ............................... $1,194 $ 8,378 $2,370
Ratios of expenses to average net assets:
Before reimbursement and/or waiver of expenses by Adviser ....... 2.39% 3.02% 11.72%(f)
After reimbursement and/or waiver of expenses by Adviser ........ 1.02% 1.04%(e) 1.25%(f)
Ratios of net investment income (loss) to average net assets:
Before reimbursement and/or waiver of expenses by Adviser ....... 0.32% (0.24)% (9.21)%(f)
After reimbursement and/or waiver of expenses by Adviser ........ 1.69% 1.74% 1.26%(f)
Portfolio Turnover ................................................. 42.65% 7.39% 5.14%(d)
----------
(a) Neptune International Fund, Class I, commenced investment operations on
August 6, 2007.
(b) The selected per share data was calculated using the weighted average
shares outstanding method for the period.
(c) Includes payments by affiliates which is less than $0.005 per share.
(d) Not Annualized.
(e) Effective February 11, 2008, the contractual expense limitation of 1.40%
was removed and Aston agreed to voluntarily waive management fees and/or
reimburse expenses for the Fund so that the net expense ratio is no more
than 1.02% for Class I Shares. This voluntary waiver became the contractual
expense limitation on February 29, 2008.
(f) Annualized.
SEE ACCOMPANYING NOTES TO FINANCIAL STATEMENTS.
115
Aston Funds
BARINGS INTERNATIONAL FUND - CLASS I
OCTOBER 31, 2009
FINANCIAL HIGHLIGHTS
YEAR PERIOD
ENDED ENDED
10/31/09 10/31/08(a)
--------- -----------
Net Asset Value, Beginning of period .................................. $ 5.08 $ 10.00
------- -------
INCOME FROM INVESTMENT OPERATIONS:
Net investment income ........................................... 0.10(b) 0.10
Net realized and unrealized gain (loss) on investments .......... 1.27(c) (5.02)
------- -------
Total from investment operations ............................. 1.37 (4.92)
------- -------
LESS DISTRIBUTIONS:
Distributions from and in excess of net investment income ....... (0.01) --
------- -------
Total distributions .......................................... (0.01) --
------- -------
Net increase (decrease) in net asset value ............................ 1.36 (4.92)
------- -------
Net Asset Value, End of period ........................................ $ 6.44 $ 5.08
======= =======
TOTAL RETURN .......................................................... 27.11% (49.20)%(d)
RATIOS/SUPPLEMENTAL DATA:
Net Assets, End of period (in 000's) ............................... $28,277 $ 5,517
Ratios of expenses to average net assets:
Before reimbursement and/or waiver of expenses by Adviser ....... 2.01% 3.95%(e)(f)
After reimbursement and/or waiver of expenses by Adviser ........ 1.15% 1.18%(e)(f)
Ratios of net investment income (loss) to average net assets:
Before reimbursement and/or waiver of expenses by Adviser ....... 0.80% (1.11)%(f)
After reimbursement and/or waiver of expenses by Adviser ........ 1.66% 1.66%(f)
Portfolio Turnover ................................................. 115.51% 121.99%(d)
----------
(a) Barings International Fund, Class I, commenced investment operations on
November 2, 2007
(b) The selected per share data was calculated using the weighted average
shares outstanding method for the period.
(c) Includes payments by affiliates which is less than $0.005 per share.
(d) Not Annualized.
(e) Ratios of expenses to average net assets include interest expense of less
than 0.01% for the period ended October 31, 2008, which is not included in
the contractual or voluntary expense limitation. The interest expense is
from utilizing the line of credit as discussed in Note H to Financial
Statements.
(f) Annualized.
SEE ACCOMPANYING NOTES TO FINANCIAL STATEMENTS.
116
Aston Funds
DYNAMIC ALLOCATION FUND - CLASS N
OCTOBER 31, 2009
FINANCIAL HIGHLIGHTS
YEAR PERIOD
ENDED ENDED
10/31/09 10/31/08(a)
-------- -----------
Net Asset Value, Beginning of period .................................. $ 8.24 $ 10.00
------- -------
INCOME FROM INVESTMENT OPERATIONS:
Net investment income ........................................... 0.06 0.07
Net realized and unrealized income (loss) on investments ........ 0.99(b) (1.76)
------- -------
Total from investment operations ............................. 1.05 (1.69)
------- -------
LESS DISTRIBUTIONS:
Distributions from and in excess of net investment income ....... (0.12) (0.07)
------- -------
Total distributions .......................................... (0.12) (0.07)
------- -------
Net increase (decrease) in net asset value ............................ 0.93 (1.76)
------- -------
Net Asset Value, End of period ........................................ $ 9.17 $ 8.24
======= =======
TOTAL RETURN .......................................................... 12.98% (16.98)%(c)
RATIOS/SUPPLEMENTAL DATA:
Net Assets, End of period (in 000's) ............................... $39,191 $ 6,070
Ratios of expenses to average net assets:
Before reimbursement and/or waiver of expenses by Adviser (d) ... 1.69% 5.11%(e)(f)
After reimbursement and/or waiver of expenses by Adviser (d) .... 1.30% 1.31%(e)(f)
Ratios of net investment income (loss) to average net assets:
Before reimbursement and/or waiver of expenses by Adviser ....... 0.39% (2.48)%(e)(f)
After reimbursement and/or waiver of expenses by Adviser ........ 0.78% 1.32%(e)(f)
Portfolio Turnover ................................................. 365.93% 498.68%(c)
----------
(a) Dynamic Allocation Fund, Class N, commenced investment operations on
January 10, 2008.
(b) Includes payments by affiliates which is less than $0.005 per share.
(c) Not Annualized.
(d) Does not include expenses of the underlying funds in which the Fund
invests.
(e) Ratios of expenses to average net assets include interest expense of 0.01%
for the period ended October 31, 2008, which is not included in the
contractual expense limitation. The interest expense is from utilizing the
line of credit as discussed in Note H to Financial Statements.
(f) Annualized.
SEE ACCOMPANYING NOTES TO FINANCIAL STATEMENTS.
117
Aston Funds
NEW CENTURY ABSOLUTE RETURN ETF FUND - CLASS N
OCTOBER 31, 2009
FINANCIAL HIGHLIGHTS
YEAR PERIOD
ENDED ENDED
10/31/09 10/31/08(a)
-------- -----------
Net Asset Value, Beginning of period ................................. $ 8.64 $ 10.00
------- -------
INCOME FROM INVESTMENT OPERATIONS:
Net investment income .......................................... 0.04 0.01
Net realized and unrealized gain (loss) on investments ......... 0.28 (1.37)
------- -------
Total from investment operations ............................ 0.32 (1.36)
------- -------
LESS DISTRIBUTIONS:
Distributions from and in excess of net investment income ...... (0.07) --
------- -------
Total distributions ......................................... (0.07) --
------- -------
Net increase (decrease) in net asset value ........................... 0.25 (1.36)
------- -------
Net Asset Value, End of period ....................................... $ 8.89 $ 8.64
======= =======
TOTAL Return ......................................................... 3.85% (13.60)%(b)
RATIOS/SUPPLEMENTAL DATA:
Net Assets, End of period (in 000's) .............................. $17,706 $13,748
Ratios of expenses to average net assets:
Before reimbursement and/or waiver of expenses by Adviser (c) .. 1.51% 3.77%(e)
After reimbursement and/or waiver of expenses by Adviser (c) ... 1.21%(d) 1.50%(e)
Ratios of net investment income (loss) to average net assets:
Before reimbursement and/or waiver of expenses by Adviser ...... 0.21% (2.02)%(e)
After reimbursement and/or waiver of expenses by Adviser ....... 0.51% 0.25%(e)
Portfolio Turnover ................................................ 325.31% 172.11%(b)
----------
(a) New Century Absolute Return ETF Fund, Class N, commenced investment
operations on March 4, 2008.
(b) Not Annualized.
(c) Does not include expenses of the underlying funds in which the Fund
invests.
(d) The Sub-Adviser has agreed that for any full calendar year of operations,
if any such period the Fund had a total return (before taxes) of less than
zero then the Sub-Adviser will waive its fee in its entirety for the next
succeeding calendar year. For any period when this waiver is in effect, the
Adviser has agreed to reduce its advisory fee to 0.15%. For the period
ended December 31, 2008, the Fund's total return was less than zero,
therefore the Adviser reduced its advisory fee to 0.15% for the 2009
calendar year. The Adviser voluntarily waived 0.12% of its advisory fees
through October 31, 2009.
(e) Annualized.
SEE ACCOMPANYING NOTES TO FINANCIAL STATEMENTS.
118
Aston Funds
M.D. SASS ENHANCED EQUITY FUND - CLASS N
OCTOBER 31, 2009
FINANCIAL HIGHLIGHTS
YEAR PERIOD
ENDED ENDED
10/31/09 10/31/08(a)
-------- -----------
Net Asset Value, Beginning of period ................................. $ 8.09 $ 10.00
------- --------
INCOME FROM INVESTMENT OPERATIONS:
Net investment income .......................................... 0.11 0.14
Net realized and unrealized gain (loss) on investments ......... 1.02 (1.91)
------- --------
Total from investment operations ............................ 1.13 (1.77)
------- --------
LESS DISTRIBUTIONS:
Distributions from and in excess of net investment income ...... (0.13) (0.14)
Distributions from net realized gain on investments ............ (0.52) --
------- --------
Total distributions ......................................... (0.65) (0.14)
------- --------
Net increase (decrease)in net asset value ............................ 0.48 (1.91)
------- --------
Net Asset Value, End of period ....................................... $ 8.57 $ 8.09
======= ========
TOTAL Return ......................................................... 15.86% (17.91)%(b)
RATIOS/SUPPLEMENTAL DATA:
Net Assets, End of period (in 000's) .............................. $22,552 $ 14,389
Ratios of expenses to average net assets:
Before reimbursement and/or waiver of expenses by Adviser ...... 2.11% 2.38%(d)
After reimbursement and/or waiver of expenses by Adviser ....... 1.25%(c) 1.10%(d)
Ratios of net investment income to average net assets:
Before reimbursement and/or waiver of expenses by Adviser ...... 0.55% 0.86%(d)
After reimbursement and/or waiver of expenses by Adviser ....... 1.41% 2.14%(d)
Portfolio Turnover ................................................ 51.56% 23.68%(b)
----------
(a) M.D. Sass Enhanced Equity Fund, Class N, commenced investment operations on
January 15, 2008.
(b) Not Annualized.
(c) Effective June 1, 2009, the contractual expense limitation was increased
from 1.10% to 1.40% due to the change in Sub-Adviser.
(d) Annualized.
SEE ACCOMPANYING NOTES TO FINANCIAL STATEMENTS.
119
Aston Funds
LAKE PARTNERS LASSO ALTERNATIVES FUND - CLASS I
OCTOBER 31, 2009
FINANCIAL HIGHLIGHTS
PERIOD
ENDED
10/31/09(a)
-----------
Net Asset Value, Beginning of period ................................. $ 10.00
--------
INCOME FROM INVESTMENT OPERATIONS:
Net investment loss ............................................ --(b)
Net realized and unrealized gain on investments ................ 1.15
--------
Total from investment operations ............................ 1.15
--------
LESS DISTRIBUTIONS:
Distributions from and in excess of net investment income ...... --
--------
Total distributions ......................................... --
--------
Net increase in net asset value ...................................... 1.15
--------
Net Asset Value, End of period ....................................... $ 11.15
========
TOTAL Return ......................................................... 11.50%(c)
RATIOS/SUPPLEMENTAL DATA:
Net Assets, End of period (in 000's) .............................. $ 1,845
Ratios of expenses to average net assets:
Before reimbursement and/or waiver of expenses by Adviser(d) ... 18.16%(e)
After reimbursement and/or waiver of expenses by Adviser(d) .... 1.35%(e)
Ratios of net investment loss to average net assets:
Before reimbursement and/or waiver of expenses by Adviser ...... (16.92)%(e)
After reimbursement and/or waiver of expenses by Adviser ....... (0.11)%(e)
Portfolio Turnover ................................................... 65.93%(c)
----------
(a) Lake Partners LASSO Alternatives Fund, Class I, commenced investment
operations on April 1, 2009.
(b) Represents less than $(0.005) per share.
(c) Not Annualized.
(d) Does not include expenses of the underlying funds in which the Fund
invests.
(e) Annualized.
SEE ACCOMPANYING NOTES TO FINANCIAL STATEMENTS.
120
Aston Funds
FORTIS REAL ESTATE FUND - CLASS N
OCTOBER 31, 2009
FINANCIAL HIGHLIGHTS
YEAR YEAR YEAR YEAR YEAR
ENDED ENDED ENDED ENDED ENDED
10/31/09 10/31/08 10/31/07 10/31/06 10/31/05
-------- -------- -------- -------- --------
Net Asset Value, Beginning of period .............................. $ 6.08 $ 15.59 $ 19.99 $ 16.23 $ 14.56
------- ------- ------- ------- -------
INCOME FROM INVESTMENT OPERATIONS:
Net investment income ....................................... 0.15(a) 0.07(a) 0.30(a) 0.32(a) 0.46(a)
Net realized and unrealized gain (loss) on investments ...... (0.28) (5.50) (0.40) 5.42 2.10
------- ------- ------- ------- -------
Total from investment operations ......................... (0.13) (5.43) (0.10) 5.74 2.56
------- ------- ------- ------- -------
LESS DISTRIBUTIONS:
Distributions from and in excess of net
investment income ........................................ (0.18) (0.09) (0.05) (0.13) (0.26)
Distributions from net realized gain on investments ......... -- (3.99) (4.25) (1.85) (0.63)
------- ------- ------- ------- -------
Total distributions ...................................... (0.18) (4.08) (4.30) (1.98) (0.89)
------- ------- ------- ------- -------
Net increase (decrease) in net asset value ........................ (0.31) (9.51) (4.40) 3.76 1.67
------- ------- ------- ------- -------
Net Asset Value, End of period .................................... $ 5.77 $ 6.08 $ 15.59 $ 19.99 $ 16.23
======= ======= ======= ======= =======
TOTAL RETURN ...................................................... (1.44)% (43.76)% (1.41)% 39.19% 18.06%
RATIOS/SUPPLEMENTAL DATA:
Net Assets, End of period (in 000's) ........................... $ 4,011 $ 6,030 $49,123 $72,506 $54,851
Ratios of expenses to average net assets:
Before reimbursement and/or waiver of
expenses by Adviser ...................................... 1.94% 1.57%(b) 1.46%(b) 1.46%(b) 1.45%
After reimbursement and/or waiver of
expenses by Adviser ...................................... 1.37% 1.37%(b) 1.37%(b) 1.37%(b) 1.37%
Ratios of net investment income to average net assets:
Before reimbursement and/or waiver of
expenses by Adviser ...................................... 2.55% 0.49% 1.73% 1.77% 2.91%
After reimbursement and/or waiver of
expenses by Adviser ...................................... 3.12% 0.69% 1.82% 1.86% 2.99%
Portfolio Turnover .......................................... 139.76% 85.08% 88.75% 83.15% 43.14%
----------
(a) The selected per share data was calculated using the weighted average
shares outstanding method for the period.
(b) Ratios of expenses to average net assets include interest expense of less
than 0.005% for the years ended October 31, 2008, October 31, 2007 and
October 31, 2006, which is not included in the contractual expense
limitation. The interest expense is from utilizing the line of credit as
discussed in Note H to Financial Statements.
SEE ACCOMPANYING NOTES TO FINANCIAL STATEMENTS.
121
Aston Funds
FORTIS REAL ESTATE FUND - CLASS I
OCTOBER 31, 2009
FINANCIAL HIGHLIGHTS
YEAR YEAR YEAR YEAR PERIOD
ENDED ENDED ENDED ENDED ENDED
10/31/09 10/31/08 10/31/07 10/31/06 10/31/05(a)
-------- -------- -------- -------- -----------
Net Asset Value, Beginning of period .............................. $ 6.08 $ 15.62 $ 20.00 $ 16.23 $ 16.64
------- ------- ------- ------- -------
INCOME FROM INVESTMENT OPERATIONS:
Net investment income ....................................... 0.16(b) 0.09(b) 0.34(b) 0.36(b) 0.10(b)
Net realized and unrealized gain (loss) on investments ...... (0.28) (5.51) (0.40) 5.42 (0.51)
------- ------- ------- ------- -------
Total from investment operations ......................... (0.12) (5.42) (0.06) 5.78 (0.41)
------- ------- ------- ------- -------
LESS DISTRIBUTIONS:
Distributions from and in excess of net
investment income ........................................ (0.22) (0.13) (0.07) (0.16) --
Distributions from net realized gain on investments ......... -- (3.99) (4.25) (1.85) --
------- ------- ------- ------- -------
Total distributions ...................................... (0.22) (4.12) (4.32) (2.01) --
------- ------- ------- ------- -------
Net increase (decrease) in net asset value ........................ (0.34) (9.54) (4.38) 3.77 (0.41)
------- ------- ------- ------- -------
Net Asset Value, End of period .................................... $ 5.74 6.08 $ 15.62 $ 20.00 $ 16.23
======= ======= ======= ======= =======
TOTAL RETURN ...................................................... (1.27)% (43.58)% (1.18)% 39.54% (2.46)%(c)
RATIOS/SUPPLEMENTAL DATA:
Net Assets, End of period (in 000's) ........................... $21,905 $23,411 $41,545 $46,025 $32,711
Ratios of expenses to average net assets:
Before reimbursement and/or waiver of
expenses by Adviser ...................................... 1.69% 1.32%(d) 1.20%(d) 1.21%(d) 1.32%(e)
After reimbursement and/or waiver of
expenses by Adviser ...................................... 1.12% 1.12%(d) 1.11%(d) 1.12%(d) 1.11%(e)
Ratios of net investment income to average net assets:
Before reimbursement and/or waiver of
expenses by Adviser ...................................... 2.80% 0.74% 1.99% 2.02% 5.11%(e)
After reimbursement and/or waiver of
expenses by Adviser ...................................... 3.37% 0.94% 2.08% 2.11% 5.32%(e)
Portfolio Turnover ............................................. 139.76% 85.08% 88.75% 83.15% 43.14%
----------
(a) Fortis Real Estate Fund, Class I, commenced investment operations on
September 20, 2005.
(b) The selected per share data was calculated using the weighted average
shares outstanding method for the period.
(c) Not Annualized.
(d) Ratios of expenses to average net assets include interest expense of less
than 0.005% for the years ended October 31, 2008, October 31, 2007 and
October 31, 2006, which is not included in the contractual expense
limitation. The interest expense is from utilizing the line of credit as
discussed in Note H to Financial Statements.
(e) Annualized.
SEE ACCOMPANYING NOTES TO FINANCIAL STATEMENTS.
122
Aston Funds
MONTAG & CALDWELL BALANCED FUND - CLASS N
OCTOBER 31, 2009
FINANCIAL HIGHLIGHTS
YEAR YEAR YEAR YEAR YEAR
ENDED ENDED ENDED ENDED ENDED
10/31/09 10/31/08 10/31/07 10/31/06 10/31/05
-------- -------- -------- -------- --------
Net Asset Value, Beginning of period .............................. $ 15.61 $ 19.98 $ 17.21 $ 16.41 $ 15.81
------- ------- ------- ------- -------
INCOME FROM INVESTMENT OPERATIONS:
Net investment income ....................................... 0.21(a) 0.29 0.19(a) 0.18(a) 0.17(a)
Net realized and unrealized gain (loss) on investments ...... 2.15 (4.42) 2.82 0.87 0.67
------- ------- ------- ------- -------
Total from investment operations ......................... 2.36 (4.13) 3.01 1.05 0.84
------- ------- ------- ------- -------
LESS DISTRIBUTIONS:
Distributions from and in excess of net
investment income ........................................ (0.24) (0.24) (0.24) (0.25) (0.24)
------- ------- ------- ------- -------
Total distributions ...................................... (0.24) (0.24) (0.24) (0.25) (0.24)
------- ------- ------- ------- -------
Net increase (decrease) in net asset value ........................ 2.12 (4.37) 2.77 0.80 0.60
------- ------- ------- ------- -------
Net Asset Value, End of period .................................... $ 17.73 $ 15.61 $ 19.98 $ 17.21 $ 16.41
======= ======= ======= ======= =======
TOTAL RETURN ...................................................... 15.32% (20.87)% 17.63% 6.56% 5.27%
RATIOS/SUPPLEMENTAL DATA:
Net Assets, End of period (in 000's) ........................... $14,938 $16,586 $16,703 $23,355 $48,759
Ratios of expenses to average net assets:
Before reimbursement and/or waiver of
expenses by Adviser ...................................... 1.73% 1.74% 1.72%(b) 1.33%(b) 1.16%
After reimbursement and/or waiver of
expenses by Adviser ...................................... 1.26% 1.35% 1.36%(b) 1.33%(b) 1.16%
Ratios of net investment income to average net assets:
Before reimbursement and/or waiver of
expenses by Adviser ...................................... 0.81% 0.74% 0.71% 1.07% 1.04%
After reimbursement and/or waiver of
expenses by Adviser ...................................... 1.28% 1.13% 1.07% 1.07% 1.04%
Portfolio Turnover ............................................. 38.72% 43.65% 36.25% 33.70% 33.43%
----------
(a) The selected per share data was calculated using the weighed average shares
outstanding method for the period.
(b) Ratios of expenses to average net assets include interest expense of less
than 0.01% for the year ended October 31, 2007 and less than 0.005% for the
year ended October 31, 2006, which is not included in the voluntary expense
limitation. The interest expense is from utilizing the line of credit as
discussed in Note H to Financial Statements.
SEE ACCOMPANYING NOTES TO FINANCIAL STATEMENTS.
123
Aston Funds
MONTAG & CALDWELL BALANCED FUND - CLASS I
OCTOBER 31, 2009
FINANCIAL HIGHLIGHTS
YEAR YEAR YEAR YEAR YEAR
ENDED ENDED ENDED ENDED ENDED
10/31/09 10/31/08 10/31/07 10/31/06 10/31/05
-------- -------- -------- -------- --------
Net Asset Value, Beginning of period .............................. $15.57 $ 19.94 $17.19 $16.39 $ 15.81
------ ------- ------ ------ -------
INCOME FROM INVESTMENT OPERATIONS:
Net investment income ....................................... 0.23(a) 0.27 0.24(a) 0.22(a) 0.21(a)
Net realized and unrealized gain (loss) on investments ...... 2.16 (4.35) 2.80 0.88 0.66
------ ------- ------ ------ -------
Total from investment operations ......................... 2.39 (4.08) 3.04 1.10 0.87
------ ------- ------ ------ -------
LESS DISTRIBUTIONS:
Distributions from and in excess of net
investment income ........................................ (0.28) (0.29) (0.29) (0.30) (0.29)
------ ------- ------ ------ -------
Total distributions ...................................... (0.28) (0.29) (0.29) (0.30) (0.29)
------ ------- ------ ------ -------
Net increase (decrease) in net asset value ........................ 2.11 (4.37) 2.75 0.80 0.58
------ ------- ------ ------ -------
Net Asset Value, End of period .................................... $17.68 $ 15.57 $19.94 $17.19 $ 16.39
====== ======= ====== ====== =======
TOTAL RETURN ...................................................... 15.53% (20.71)% 17.87% 6.80% 5.50%
RATIOS/SUPPLEMENTAL DATA:
Net Assets, End of period (in 000's) ........................... $1,149 $ 919 $1,158 $7,640 $19,609
Ratios of expenses to average net assets:
Before reimbursement and/or waiver of
expenses by Adviser ...................................... 1.57% 1.49% 1.44%(b) 1.07%(b) 0.91%
After reimbursement and/or waiver of
expenses by Adviser ...................................... 1.10% 1.10% 1.08%(b) 1.07%(b) 0.91%
Ratios of net investment income to average net assets:
Before reimbursement and/or waiver of
expenses by Adviser ...................................... 0.97% 0.99% 0.99% 1.33% 1.29%
After reimbursement and/or waiver of
expenses by Adviser ...................................... 1.44% 1.38% 1.35% 1.33% 1.29%
Portfolio Turnover ............................................. 38.72% 43.65% 36.25% 33.70% 33.43%
----------
(a) The selected per share data was calculated using the weighted average
shares outstanding method for the period.
(b) Ratios of expenses to average net assets include interest expense of less
than 0.01% for the year ended October 31, 2007 and less than 0.005% for the
year ended October 31, 2006, which is not included in the voluntary expense
limitation. The interest expense is from utilizing the line of credit as
discussed in Note H to Financial Statements.
SEE ACCOMPANYING NOTES TO FINANCIAL STATEMENTS.
124
Aston Funds
BALANCED FUND - CLASS N
OCTOBER 31, 2009
FINANCIAL HIGHLIGHTS
YEAR YEAR YEAR YEAR YEAR
ENDED ENDED ENDED ENDED ENDED
10/31/09 10/31/08 10/31/07 10/31/06 10/31/05
-------- -------- -------- -------- --------
Net Asset Value, Beginning of period .............................. $ 4.83 $ 7.97 $ 10.65 $ 10.84 $ 11.32
------- ------- ------- ------- --------
INCOME FROM INVESTMENT OPERATIONS:
Net investment income ....................................... 0.08 0.08 0.12 0.12 0.16
Net realized and unrealized gain (loss) on investments ...... 0.71 (1.73) 0.69 0.45 0.20
------- ------- ------- ------- --------
Total from investment operations ......................... 0.79 (1.65) 0.81 0.57 0.36
------- ------- ------- ------- --------
LESS DISTRIBUTIONS:
Distributions from and in excess of net
investment income ........................................ (0.08) (0.09) (0.14) (0.17) (0.19)
Distributions from net realized gain on investments ......... -- (1.40) (3.35) (0.59) (0.65)
------- ------- ------- ------- --------
Total distributions ...................................... (0.08) (1.49) (3.49) (0.76) (0.84)
------- ------- ------- ------- --------
Net increase (decrease) in net asset value ........................ 0.71 (3.14) (2.68) (0.19) (0.48)
------- ------- ------- ------- --------
Net Asset Value, End of period .................................... $ 5.54 $ 4.83 $ 7.97 $ 10.65 $ 10.84
======= ======= ======= ======= ========
TOTAL RETURN ...................................................... 16.50% (24.76)% 10.47% 5.33% 3.20%
RATIOS/SUPPLEMENTAL DATA:
Net Assets, End of period (in 000's) ........................... $16,805 $17,673 $35,924 $60,831 $173,051
Ratios of expenses to average net assets:
Before reimbursement and/or waiver of
expenses by Adviser ...................................... 1.49% 1.50%(a) 1.31%(a) 1.14%(a) 1.09%
After reimbursement and/or waiver of
expenses by Adviser ...................................... 1.49% 1.50%(a) 1.31%(a) 1.14%(a) 1.09%
Ratios of net investment income to average net assets:
Before reimbursement and/or waiver of
expenses by Adviser ...................................... 1.43% 1.33% 1.48% 1.38% 1.53%
After reimbursement and/or waiver of
expenses by Adviser ...................................... 1.43% 1.33% 1.48% 1.38% 1.53%
Portfolio Turnover ............................................. 43.33% 106.18% 60.93% 36.66% 28.76%
----------
(a) Ratios of expenses to average net assets include interest expense of 0.01%
for the year ended October 31, 2008 and less than 0.005% for the years
ended October 31, 2007 and October 31, 2006. The interest expense is from
utilizing the line of credit as discussed in Note H to Financial
Statements.
SEE ACCOMPANYING NOTES TO FINANCIAL STATEMENTS.
125
Aston Funds
TCH FIXED INCOME FUND - CLASS N
OCTOBER 31, 2009
FINANCIAL HIGHLIGHTS
YEAR YEAR YEAR YEAR YEAR
ENDED ENDED ENDED ENDED ENDED
10/31/09 10/31/08 10/31/07 10/31/06 10/31/05
-------- -------- -------- -------- --------
Net Asset Value, Beginning of period ....................... $ 8.60 $ 9.73 $ 9.62 $ 9.69 $ 10.13
------- ------- ------- ------- --------
INCOME FROM INVESTMENT OPERATIONS:
Net investment income ................................ 0.49(a) 0.47 0.48(a) 0.45(a) 0.42(a)
Net realized and unrealized gain (loss) on
investments ....................................... 1.44 (1.10) 0.14 (0.04) (0.38)
------- ------- ------- ------- --------
Total from investment operations .................. 1.93 (0.63) 0.62 0.41 0.04
------- ------- ------- ------- --------
LESS DISTRIBUTIONS:
Distributions from and in excess of net investment
income ............................................ (0.51) (0.50) (0.51) (0.48) (0.48)
------- ------- ------- ------- --------
Total distributions ............................... (0.51) (0.50) (0.51) (0.48) (0.48)
------- ------- ------- ------- --------
Net increase (decrease) in net asset value ................. 1.42 (1.13) 0.11 (0.07) (0.44)
------- ------- ------- ------- --------
Net Asset Value, End of period ............................. $ 10.02 $ 8.60 $ 9.73 $ 9.62 $ 9.69
======= ======= ======= ======= ========
TOTAL RETURN ............................................... 22.99% (6.89)% 6.56% 4.42% 0.40%
RATIOS/SUPPLEMENTAL DATA:
Net Assets, End of period (in 000's) .................... $47,008 $42,765 $52,662 $77,096 $138,807
Ratios of expenses to average net assets:
Before reimbursement and/or waiver of expenses by
Adviser ........................................... 0.96% 1.06% 1.04%(b) 0.96%(b) 0.95%
After reimbursement and/or waiver of expenses by
Adviser ........................................... 0.61% 0.65%(c) 0.73%(b)(c) 0.75%(b) 0.74%
Ratios of net investment income to average net assets:
Before reimbursement and/or waiver of expenses by
Adviser ........................................... 4.93% 4.59% 4.63% 4.45% 3.98%
After reimbursement and/or waiver of expenses by
Adviser ........................................... 5.28% 5.00% 4.94% 4.66% 4.19%
Portfolio Turnover ...................................... 40.81% 78.39% 71.61% 71.19% 41.33%
----------
(a) The selected per share data was calculated using the weighted average
shares outstanding method for the period.
(b) Ratios of expenses to average net assets include interest expense of less
than 0.005% for the years ended October 31, 2007 and October 31, 2006,
which is not included in the contractual or voluntary expense limitation.
The interest expense is from utilizing the line of credit as discussed in
Note H to Financial Statements.
(c) The Adviser's expense reimbursement level, which affects the net expense
ratio was changed from 0.74% to 0.64% on September 1, 2007. Subsequently,
on October 1, 2008, the Adviser's expense reimbursement level changed from
0.64% to 0.74%.
SEE ACCOMPANYING NOTES TO FINANCIAL STATEMENTS.
126
Aston Funds
TCH FIXED INCOME FUND - CLASS I
OCTOBER 31, 2009
FINANCIAL HIGHLIGHTS
YEAR YEAR YEAR YEAR YEAR
ENDED ENDED ENDED ENDED ENDED
10/31/09 10/31/08 10/31/07 10/31/06 10/31/05
-------- -------- -------- -------- --------
Net Asset Value, Beginning of period ....................... $ 8.60 $ 9.73 $ 9.62 $ 9.69 $ 10.13
------- ------- ------- ------- -------
INCOME FROM INVESTMENT OPERATIONS:
Net investment income ................................ 0.50(a) 0.48 0.51(a) 0.47(a) 0.44(a)
Net realized and unrealized gain (loss) on
investments ....................................... 1.44 (1.09) 0.13 (0.03) (0.37)
------- ------- ------- ------- -------
Total from investment operations .................. 1.94 (0.61) 0.64 0.44 0.07
------- ------- ------- ------- -------
LESS DISTRIBUTIONS:
Distributions from and in excess of net investment
income ............................................ (0.52) (0.52) (0.53) (0.51) (0.51)
------- ------- ------- ------- -------
Total distributions .................................. (0.52) (0.52) (0.53) (0.51) (0.51)
------- ------- ------- ------- -------
Net increase (decrease) in net asset value ................. 1.42 (1.13) 0.11 (0.07) (0.44)
------- ------- ------- ------- -------
Net Asset Value, End of period ............................. $ 10.02 $ 8.60 $ 9.73 $ 9.62 $ 9.69
======= ======= ======= ======= =======
TOTAL RETURN ............................................... 23.14% (6.65)% 6.84% 4.68% 0.65%
RATIOS/SUPPLEMENTAL DATA:
Net Assets, End of period (in 000's) .................... $20,276 $25,891 $39,318 $43,148 $72,876
Ratios of expenses to average net assets:
Before reimbursement and/or waiver of expenses by
Adviser ........................................... 0.84% 0.81% 0.78%(b) 0.71%(b) 0.70%
After reimbursement and/or waiver of expenses by
Adviser ........................................... 0.49% 0.40%(c) 0.47%(b)(c) 0.50%(b) 0.49%
Ratios of net investment income to average net assets:
Before reimbursement and/or waiver of expenses by
Adviser ........................................... 5.05% 4.84% 4.89% 4.70% 4.23%
After reimbursement and/or waiver of expenses by
Adviser ........................................... 5.40% 5.25% 5.20% 4.91% 4.44%
Portfolio Turnover ...................................... 40.81% 78.39% 71.61% 71.19% 41.33%
----------
(a) The selected per share data was calculated using the weighted average
shares outstanding method for the period.
(b) Ratios of expenses to average net assets include interest expense of less
than 0.005% for the years ended October 31, 2007 and October 31, 2006,
which is not included in the contractual or voluntary expense limitation.
The interest expense is from utilizing the line of credit as discussed in
Note H to Financial Statements.
(c) The Adviser's expense reimbursement level, which affects the net expense
ratio, was changed from 0.49% to 0.39% on September 1, 2007. Subsequently,
on October 1, 2008, the Adviser's expense reimbursement level changed from
0.39% to 0.49%.
SEE ACCOMPANYING NOTES TO FINANCIAL STATEMENTS.
127
Aston Funds
OCTOBER 31, 2009
NOTES TO FINANCIAL STATEMENTS
NOTE (A) FUND ORGANIZATION: The Aston Funds (the "Trust") was organized as a
Delaware statutory trust under a Declaration of Trust dated September 10, 1993.
The Trust is registered under the Investment Company Act of 1940, as amended,
(the "1940 Act") as an open-end management investment company with 24 separate
portfolios established by the Board of Trustees as of October 31, 2009.
Aston Asset Management LLC ("Aston"), the investment adviser to each Fund
included in these financial statements and the administrator to all of the
Funds, manages each Fund by retaining one or more Sub-Advisers to manage each
Fund. The following 24 portfolios of the Trust are included in these financial
statements:
Aston/Montag & Caldwell Growth Fund (the "M&C Growth Fund")
Aston/Veredus Select Growth Fund (the "Veredus Select Growth Fund")
Aston Growth Fund (the "Growth Fund")
Aston/Optimum Large Cap Opportunity Fund (the "Optimum Large Cap Opportunity
Fund")
Aston Value Fund (the "Value Fund")
Aston/TAMRO Diversified Equity Fund, formerly known as Aston/TAMRO All Cap Fund
(the "TAMRO Diversified Equity Fund")
Aston/River Road Dividend All Cap Value Fund, (the "River Road Dividend All Cap
Value Fund")
Aston/Optimum Mid Cap Fund (the "Optimum Mid Cap Fund")
Aston/Montag & Caldwell Mid Cap Growth Fund (the "M&C Mid Cap Growth Fund")
Aston/Cardinal Mid Cap Value Fund (the "Cardinal Mid Cap Value Fund")
Aston/River Road Small-Mid Cap Fund (the "River Road Small-Mid Cap Fund")
Aston/Veredus Aggressive Growth Fund (the "Veredus Aggressive Growth Fund")
Aston/TAMRO Small Cap Fund (the "TAMRO Small Cap Fund")
Aston/River Road Small Cap Value Fund (the "River Road Small Cap Value Fund")
Aston/Neptune International Fund (the "Neptune International Fund")
Aston/Barings International Fund (the "Barings International Fund")
Aston Dynamic Allocation Fund, formerly known as Aston/Smart Portfolios Fund
(the "Dynamic Allocation Fund")
Aston/New Century Absolute Return ETF Fund (the "New Century Absolute Return ETF
Fund")
Aston/M.D. Sass Enhanced Equity Fund, formerly known as Aston/MB Enhanced Equity
Income Fund (the "M.D. Sass Enhanced Equity Fund")
Aston/Lake Partners LASSO Alternatives Fund (the "Lake Partners LASSO
Alternatives Fund")
Aston/Fortis Real Estate Fund (the "Fortis Real Estate Fund")
Aston/Montag & Caldwell Balanced Fund (the "M&C Balanced Fund")
Aston Balanced Fund (the "Balanced Fund")
Aston/TCH Fixed Income Fund (the "TCH Fixed Income Fund")
M&C Growth Fund and Growth Fund are authorized to issue three classes of shares
(Class N Shares, Class I Shares and Class R Shares). Veredus Select Growth Fund,
Value Fund, River Road Dividend All Cap Value Fund, Optimum Mid Cap Fund, River
Road Small-Mid Cap Fund, Veredus Aggressive Growth Fund, TAMRO Small Cap Fund,
River Road Small Cap Value Fund, Neptune International Fund, Barings
International Fund, Fortis Real Estate Fund, M&C Balanced Fund, Balanced Fund
and TCH Fixed Income Fund are each authorized to issue two classes of shares
(Class N Shares and Class I Shares). Optimum Large Cap Opportunity Fund, TAMRO
Diversified Equity Fund, M&C Mid Cap Growth Fund, Cardinal Mid Cap Value Fund,
Dynamic Allocation Fund, New Century Absolute Return ETF Fund, M.D. Sass
Enhanced Equity Fund and Lake Partners LASSO Alternatives Fund are each
authorized to issue one class of shares (Class I Shares for Lake Partners LASSO
Alternatives Fund, Class N Shares for all others). Currently Barings
International Fund offers only Class I Shares and Balanced Fund offers only
Class N Shares. Each class of shares is substantially the same except that
certain classes of shares bear class specific expenses, which include
distribution fees. TAMRO Small Cap Fund and River Road Small Cap Value Fund are
closed to new investors until further notice.
The investment objectives of the Funds are as follows:
M&C GROWTH FUND Long-term capital appreciation and, secondarily, current
income, by investing primarily in common stocks and
convertible securities.
VEREDUS SELECT Capital appreciation.
GROWTH FUND
GROWTH FUND Long-term total return through a combination of capital
appreciation and current income by investing primarily in
a combination of stocks and bonds.
OPTIMUM LARGE CAP Long-term capital appreciation.
OPPORTUNITY FUND
VALUE FUND Total return through long-term capital appreciation and
current income.
TAMRO DIVERSIFIED Long-term capital appreciation.
EQUITY FUND
RIVER ROAD DIVIDEND High current income and, secondarily, long-term capital
ALL CAP VALUE FUND appreciation.
OPTIMUM MID CAP Long-term total return through capital appreciation by
FUND investing primarily in common and preferred stocks and
convertible securities.
M&C MID CAP Long-term capital appreciation and secondarily, current
GROWTH FUND income, by investing primarily in common stocks and
convertible securities.
CARDINAL MID CAP High level of total return.
VALUE FUND
RIVER ROAD SMALL-MID Long-term capital appreciation.
CAP FUND
VEREDUS AGGRESSIVE Capital appreciation.
GROWTH FUND
TAMRO SMALL CAP Long-term capital appreciation.
FUND
128
Aston Funds
OCTOBER 31, 2009
NOTES TO FINANCIAL STATEMENTS - CONTINUED
RIVER ROAD SMALL Long-term capital appreciation.
CAP VALUE FUND
NEPTUNE Long-term capital appreciation.
INTERNATIONAL FUND
BARINGS Total return.
INTERNATIONAL FUND
DYNAMIC ALLOCATION Long-term capital appreciation.
FUND
NEW CENTURY Positive total return.
ABSOLUTE RETURN
ETF FUND
M.D. SASS ENHANCED Total return through a combination of a high level
EQUITY FUND of current income and capital appreciation.
LAKE PARTNERS LASSO Long term total return with reduced correlation
ALTERNATIVES FUND to the conventional stock and bond markets.
FORTIS REAL ESTATE Total return through a combination of growth and
FUND income.
M&C BALANCED FUND Long-term total return.
BALANCED FUND Growth of capital with current income by investing
in a combination of equity and fixed income
securities.
TCH FIXED INCOME High current income consistent with prudent risk
FUND of capital.
NOTE (B) SIGNIFICANT ACCOUNTING POLICIES: The following is a summary of the
significant accounting policies consistently followed by each Fund in the
preparation of its financial statements. These policies are in conformity with
US generally accepted accounting principles.
(1) SECURITY VALUATION: Equity securities, closed-end funds and index options
traded on a national securities exchange and over-the-counter securities listed
on the NASDAQ National Market System are valued at the last sale price or the
NASDAQ Official Closing Price ("NOCP"), if applicable. If no last sale price or
NOCP, if applicable, is reported, the mean of the last bid and asked prices may
be used. Fixed income securities, except short-term investments, are valued on
the basis of mean prices provided by a pricing service when such prices are
believed by the Adviser to reflect the current market value of such securities
in accordance with guidelines adopted. If accurate market quotations are not
available, securities are valued at fair value as determined by the Adviser in
accordance with guidelines adopted by the Board of Trustees. Short-term
investments, that is, those with maturities of 60 days or less, are valued at
amortized cost, which approximates fair value. Repurchase agreements are valued
at cost. Investments in money market funds are valued at the underlying fund's
net asset value ("NAV") at the date of valuation. Foreign securities are valued
at the last sales price on the primary exchange where the security is traded.
Under the fair value procedures adopted by the Board of Trustees, the Funds may
utilize the services of an independent pricing service to determine fair value
prices for foreign securities if certain market events occur.
Certain Funds invest in exchange traded funds ("ETFs"), which are shares of
other investment companies ("underlying funds"). An ETF is an investment company
that seeks to track the performance of an index by holding in its portfolio
shares of all the companies, or a representative sample of the companies, that
are components of a particular index. ETFs are traded on a securities exchange
based on their market value. When a Fund invests in an underlying fund,
shareholders of the Fund bear their proportionate share of the other underlying
fund's fees and expenses, including operating, registration, trustee, licensing
and marketing, as well as their share of the Funds' fees and expenses.
Certain Funds invest in securities of other investment companies, including
ETFs, open-end funds and closed-end funds. Open-end funds are investment
companies that issue new shares continuously and redeem shares daily. Closed-end
funds are investment companies that typically issue a fixed number of shares
that trade on a securities exchange or over-the-counter. The risks of investment
in other investment companies typically reflect the risk of the types of
securities in which the Funds invest. Investments in ETFs and closed-end funds
are subject to the additional risk that shares of the fund may trade at a
premium or discount to their NAV per share. When the Fund invests in another
investment company, shareholders of the Fund bear their proportionate share of
the other investment company's fees and expenses, including operating,
registration, trustee, licensing and marketing, as well as their share of the
Fund's fees and expenses.
FAIR VALUE MEASUREMENTS - The inputs and valuations techniques used to measure
fair value of the Funds' net assets are summarized into three levels as
described in the hierarchy below:
- Level 1 - unadjusted quoted prices in active markets for identical
assets or liabilities
- Level 2 - other significant observable inputs (including quoted prices
for similar securities, interest rates, prepayment speeds,
credit risk, etc.)
- Level 3 - significant unobservable inputs (including the Fund's own
assumptions in determining the fair value of investments)
129
Aston Funds
OCTOBER 31, 2009
NOTES TO FINANCIAL STATEMENTS - CONTINUED
The inputs or methodology used for valuing securities are not necessarily an
indication of the risk associated with investing in those securities. A summary
of the inputs used to value the Fund's net assets as of October 31, 2009 is as
follows:
Level 2 Level 3
Total Level 1 Significant Significant
Value at Quoted Observable Unobservable
FUNDS 10/31/09 Price Input Input
----- -------------- -------------- ----------- ------------
M&C GROWTH FUND
Investments in Securities* ............... $2,487,087,612 $2,487,087,612 $ -- $ --
============== ============== =========== ======
VEREDUS SELECT GROWTH FUND
Investments in Securities* ............... $ 86,314,254 $ 86,314,254 $ -- $ --
============== ============== =========== ======
GROWTH FUND
Investments in Securities* ............... $ 202,438,332 $ 202,438,332 $ -- $ --
============== ============== =========== ======
OPTIMUM LARGE CAP OPPORTUNITY FUND
Investments in Securities* ............... $ 4,201,166 $ 4,201,166 $ -- $ --
============== ============== =========== ======
VALUE FUND
Investments in Securities* ............... $ 225,725,844 $ 225,725,844 $ -- $ --
============== ============== =========== ======
TAMRO DIVERSIFIED EQUITY FUND
Investments in Securities* ............... $ 10,519,869 $ 10,519,869 $ -- $ --
============== ============== =========== ======
RIVER ROAD DIVIDEND ALL CAP VALUE FUND
Investments in Securities* ............... $ 158,554,117 $ 158,554,117 $ -- $ --
============== ============== =========== ======
OPTIMUM MID CAP FUND
Investments in Securities* ............... $ 988,690,426 $ 988,690,426 $ -- $ --
============== ============== =========== ======
M&C MID CAP GROWTH FUND
Investments in Securities* ............... $ 2,986,293 $ 2,986,293 $ -- $ --
============== ============== =========== ======
CARDINAL MID CAP VALUE FUND
Investments in Securities* ............... $ 926,062 $ 926,062 $ -- $ --
============== ============== =========== ======
RIVER ROAD SMALL-MID CAP FUND
Investments in Securities* ............... $ 208,535,085 $ 208,535,085 $ -- $ --
============== ============== =========== ======
VEREDUS AGGRESSIVE GROWTH FUND
Investments in Securities* ............... $ 45,998,175 $ 45,998,175 $ -- $ --
============== ============== =========== ======
TAMRO SMALL CAP
Common Stocks
Consumer Discretionary ................... $ 164,983,026 $ 164,983,026 $ -- $ --
Consumer Staples ......................... 57,064,879 57,064,879 -- --
Energy ................................... 60,306,524 60,306,524 -- --
Financials ............................... 139,631,805 139,567,458 64,347 --
Health Care .............................. 61,844,132 61,844,132 -- --
Industrials .............................. 97,419,597 97,419,597 -- --
Information Technology ................... 145,641,651 145,641,651 -- --
Telecommunication Services ............... 14,275,889 14,275,889 -- --
-------------- -------------- ----------- ------
741,167,503 741,103,156 64,347 --
-------------- -------------- ----------- ------
Investment Company* ...................... 7,727,276 7,727,276 -- --
-------------- -------------- ----------- ------
Total .................................... $ 748,894,779 $ 748,830,432 $ 64,347 $ --
============== ============== =========== ======
RIVER ROAD SMALL CAP VALUE FUND
Common Stocks
Consumer Discretionary ................... $ 133,425,656 $ 132,894,134 $ 531,522 $ --
Consumer Staples ......................... 79,557,101 79,557,101 -- --
Energy ................................... 28,807,794 28,807,794 -- --
Financials ............................... 72,429,481 72,429,481 -- --
Health Care .............................. 33,831,345 33,831,345 -- --
Industrials .............................. 60,871,494 60,871,494 -- --
Information Technology ................... 29,252,138 27,506,823 1,745,315 --
Materials ................................ 25,454,598 25,454,598 -- --
Utilities ................................ 13,116,423 13,116,423 -- --
-------------- -------------- ----------- ------
476,746,030 474,469,193 2,276,837 --
-------------- -------------- ----------- ------
Investment Company* ...................... 24,936,205 24,936,205 -- --
-------------- -------------- ----------- ------
Total .................................... $ 501,682,235 $ 499,405,398 $ 2,276,837 $ --
============== ============== =========== ======
130
Aston Funds
OCTOBER 31, 2009
NOTES TO FINANCIAL STATEMENTS - CONTINUED
Level 2 Level 3
Total Level 1 Significant Significant
Value at Quoted Observable Unobservable
FUNDS 10/31/09 Price Input Input
----- -------------- -------------- ----------- ------------
NEPTUNE INTERNATIONAL FUND
Common Stocks
Australia ................................ $ 24,521 $ -- $ 24,521 $ --
Brazil ................................... 46,220 46,220 -- --
China .................................... 423,655 100,984 322,671 --
Italy .................................... 24,767 -- 24,767 --
Japan .................................... 47,979 -- 47,979 --
Luxembourg ............................... 12,115 -- 12,115 --
Netherlands .............................. 59,044 -- 59,044 --
Norway ................................... 33,057 -- 33,057 --
Russia ................................... 267,489 205,585 61,904 --
Switzerland .............................. 56,716 -- 56,716 --
Taiwan ................................... 19,080 19,080 -- --
United Kingdom ........................... 459,618 -- 459,126 492
-------------- -------------- ----------- ------
Total .................................... $ 1,474,261 $ 371,869 $ 1,101,900 $ 492
============== ============== =========== ======
BARINGS INTERNATIONAL FUND
Common Stocks
Australia ................................ $ 1,003,880 $ -- $ 1,003,880 $ --
Belgium .................................. 527,203 -- 527,203 --
Brazil ................................... 1,255,179 1,255,179 -- --
Canada ................................... 457,814 457,814 -- --
China .................................... 395,057 -- 395,057 --
France ................................... 1,623,425 -- 1,623,425 --
Germany .................................. 2,620,174 -- 2,620,174 --
Hong Kong ................................ 1,087,135 -- 1,087,135 --
Japan .................................... 4,163,562 -- 4,163,562 --
Netherlands .............................. 1,732,541 -- 1,732,541 --
Norway ................................... 438,304 -- 438,304 --
Papua New Guinea ......................... 436,395 -- 436,395 --
Russia ................................... 501,523 501,523 -- --
Singapore ................................ 439,563 -- 439,563 --
Spain .................................... 928,733 -- 928,733 --
Switzerland .............................. 2,357,334 425,313 1,932,021 --
United Kingdom ........................... 7,064,433 -- 7,058,623 5,810
-------------- -------------- ----------- ------
27,032,255 2,639,829 24,386,616 5,810
-------------- -------------- ----------- ------
Exchange Traded Fund ..................... 703,560 703,560 -- --
Investment Company* ...................... 419,474 419,474 -- --
-------------- -------------- ----------- ------
Total .................................... $ 28,155,289 $ 3,762,863 $24,386,616 $5,810
============== ============== =========== ======
DYNAMIC ALLOCATION FUND
Investments in Securities* ............... $ 39,043,536 $ 39,043,536 $ -- $ --
============== ============== =========== ======
NEW CENTURY ABSOLUTE RETURN ETF FUND
Investments in Securities* ............... $ 17,706,194 $ 17,706,194 $ -- $ --
============== ============== =========== ======
M.D. SASS ENHANCED EQUITY FUND
Common Stocks* ........................... $ 22,520,953 $ 22,520,953 $ -- $ --
Purchased Options ........................ 250,900 250,900 -- --
Investment Company* ...................... 1,285,564 1,285,564 -- --
Other Financial Instruments** ............ (1,283,625) (1,283,625) -- --
-------------- -------------- ----------- ------
Total .................................... $ 22,773,792 $ 22,773,792 $ -- $ --
============== ============== =========== ======
LAKE PARTNERS LASSO ALTERNATIVE FUND
Investments in Securities* ............... $ 1,824,248 $ 1,824,248 $ -- $ --
============== ============== =========== ======
FORTIS REAL ESTATE FUND
Investments in Securities* ............... $ 25,742,417 $ 25,742,417 $ -- $ --
============== ============== =========== ======
M&C BALANCED FUND
Common Stocks* ........................... $ 10,276,102 $ 10,276,102 $ -- $ --
Corporate Notes and Bonds ................ 3,755,092 -- 3,755,092 --
U.S. Government and Agency Obligations ... 1,785,539 -- 1,785,539 --
-------------- -------------- ----------- ------
Total ....................................... $ 15,816,733 $ 10,276,102 $ 5,540,631 $ --
============== ============== =========== ======
131
Aston Funds
OCTOBER 31, 2009
NOTES TO FINANCIAL STATEMENTS - CONTINUED
Level 2 Level 3
Total Level 1 Significant Significant
Value at Quoted Observable Unobservable
FUNDS 10/31/09 Price Input Input
----- -------------- -------------- ----------- ------------
BALANCED FUND
Common Stocks* ........................... $ 9,946,631 $ 9,946,631 $ -- $ --
U.S. Government and Agency Obligations ... 2,948,631 -- 2,948,631 --
Corporate Notes and Bonds ................ 2,944,622 -- 2,944,622 --
Investment Company* ...................... 962,607 962,607 -- --
-------------- -------------- ----------- ------
Total .................................... $ 16,802,491 $ 10,909,238 $ 5,893,253 $ --
============== ============== =========== ======
TCH FIXED INCOME FUND
Corporate Notes and Bonds ................ $ 35,323,525 $ -- $35,323,525 $ --
U.S. Government and Agency Obligations ... 25,804,568 -- 25,804,568 --
Commercial Mortgage-Backed Securities .... 1,732,582 -- 1,732,582 --
Investment Company* ...................... 3,515,024 3,515,024 -- --
-------------- -------------- ----------- ------
Total .................................... $ 66,375,699 $ 3,515,024 $62,860,675 $ --
============== ============== =========== ======
* Common Stocks and Investment Companies are Level 1. Please refer to the
Schedule of Investments for industry, sector or country breakout.
** Other financial instruments include written options for the M.D. Sass
Enhanced Equity Fund.
Level 3 holdings were valued using internal valuation techniques which took into
consideration factors including previous experience with similar securities of
the same issuer, conversion ratio and security terms.
The following is a reconciliation of Level 3 holdings for which significant
unobservable inputs were used in determining fair value as of October 31, 2009:
Investments in
Securities
--------------
NEPTUNE INTERNATIONAL FUND
Fair Value, beginning of period ......................... $ --
Net purchases (sales) ................................... (252)
Total net realized gains (losses) ....................... 743
Total change in unrealized appreciation (depreciation) .. 1
-------
Fair Value, end of period ............................... $ 492
=======
Change in net unrealized appreciation (depreciation)
on Level 3 holdings held at end of period ............ $ 1
=======
BARINGS INTERNATIONAL FUND
Fair Value, beginning of period ......................... $ --
Net purchases (sales) ................................... 5,116
Total net realized gains (losses) ....................... 680
Total change in unrealized appreciation (depreciation) .. 14
-------
Fair Value, end of period ............................... $ 5,810
=======
Change in net unrealized appreciation (depreciation)
on Level 3 holdings held at end of period ............ $ 14
=======
(2) REPURCHASE AGREEMENTS: Each Fund may enter into repurchase agreements with
financial institutions deemed to be creditworthy by the Fund's Adviser or
Sub-Adviser, subject to the seller's agreement to repurchase and the Fund's
agreement to resell such securities at a mutually agreed upon price. Securities
purchased subject to repurchase agreements are deposited with the Fund's
custodian and, pursuant to the terms of the repurchase agreement, must have an
aggregate market value greater than or equal to the repurchase price plus
accrued interest at all times. If the value of the underlying securities falls
below the value of the repurchase price plus accrued interest, the Fund will
require the seller to deposit additional collateral by the next business day. If
the request for additional collateral is not met, or the seller defaults on its
repurchase obligation, the Fund has the right to sell the underlying securities
at market value and may claim any resulting loss against the seller. At October
31, 2009, the Funds did not own any repurchase agreements.
(3) WHEN ISSUED/DELAYED DELIVERY SECURITIES: Each Fund may purchase and sell
securities on a "when issued" or "delayed delivery" basis, with settlement to
occur at a later date. The value of the security so purchased is subject to
market fluctuations during this period. The Funds segregate assets having an
aggregate value at least equal to the amount of when issued or delayed delivery
purchase commitments until payment is made. At October 31, 2009, the Funds did
not own any when issued or delayed delivery securities.
(4) MORTGAGE-BACKED SECURITIES: M&C Balanced Fund, Balanced Fund and TCH Fixed
Income Fund may invest in mortgage-backed securities ("MBS"), representing
interests in pools of mortgage loans. These securities provide shareholders with
payments consisting of both principal and interest as the mortgages in the
underlying mortgage pools are paid. The timely payment of principal and interest
on mortgage-backed securities issued or guaranteed by Ginnie Mae (formerly known
as Government National Mortgage Association) is backed by Ginnie Mae and the
full faith and credit of the U.S. government. MBS issued by U.S. government
agencies or instrumentalities other than Ginnie Mae are not "full faith and
credit" obligations. Certain obligations, such as those issued by the Federal
Home Loan Banks, Fannie Mae (formerly known as the Federal National Mortgage
Association) and Freddie Mac (formerly known as the Federal Home Loan Mortgage
Corporation) are supported only by the credit of the issuer.
132
Aston Funds
OCTOBER 31, 2009
NOTES TO FINANCIAL STATEMENTS - CONTINUED
MBS issued by private agencies are not government securities and are not
directly guaranteed by any government agency. They are secured by the underlying
collateral of the private issuer. Yields on privately issued MBS tend to be
higher than those of government backed issues. However, risk of loss due to
default and sensitivity to interest rate fluctuations are also higher. The Funds
previously listed may also invest in collateralized mortgage obligations ("CMO")
and real estate mortgage investment conduits ("REMIC"). A CMO is a bond that is
collateralized by a pool of MBS, and a REMIC is similar in form to a CMO. These
MBS pools are divided into classes with each class having its own
characteristics. The different classes are retired in sequence as the underlying
mortgages are repaid.
(5) OPTIONS CONTRACTS: In the normal course of pursuing its investment
objectives, certain Funds are subject to price volatility risk. Certain Funds
may write and/or purchase call and put options on securities for hedging
purposes only. Writing put options or purchasing call options tends to increase
a Fund's exposure to the underlying instrument. Writing call options or
purchasing put options tends to decrease a Fund's exposure to the underlying
instrument. When a Fund writes or purchases a call or put option, an amount
equal to the premium received or paid by the Fund is included in a Fund's
Statement of Assets and Liabilities as a liability or an investment and
subsequently adjusted to the current market value, based on the quoted daily
settlement price, of the option written or purchased. Premiums received or paid
from writing or purchasing options, which expire unexercised, are treated by a
Fund on the expiration date as realized gains or losses. The difference between
the premium and the amount paid or received on a closing purchase or sale
transaction, including brokerage commissions, is also treated as a realized gain
or loss. If an option is exercised, the premium paid or received is added to the
cost of the purchase or proceeds from the sale in determining whether the Fund
has realized a gain or loss on investment transactions. If the Fund writes a
covered call option, the Fund foregoes, in exchange for the premium, the
opportunity to profit during the option period from an increase in the market
value of the underlying security above the exercise price. If the Fund writes a
put option it accepts the risk of a decline in the market value of the
underlying security below the exercise price. There is the risk a Fund may not
be able to enter into a closing transaction because of an illiquid market. The
risk associated with purchasing put and call options is limited to the premium
paid. Options were traded during the year in the TAMRO Diversified Equity, M.D.
Sass Enhanced Equity and New Century Absolute Return ETF Funds. The fair value
of purchased options in the TAMRO Diversified Equity Fund is included in the
Investments at Cost line in the Statement of Assets and Liabilities. The
premiums received and the fair value of written equity options outstanding in
the M.D. Sass Enhanced Equity Fund are included in a separate line item in the
Statement of Assets and Liabilities. Net realized and unrealized gain/loss
amounts are included in separate line items in the Statements of Operations for
these respective funds. See the Schedules of Investments for open options
contracts held by TAMRO Diversified Equity and M.D. Sass Enhanced Equity Funds
at October 31, 2009. There were no outstanding options purchased or written for
the New Century Absolute Return ETF Fund at October 31, 2009. The contract
volumes indicated within are indicative of activity for the year ended October
31, 2009.
(6) FORWARD FOREIGN CURRENCY CONTRACTS: In the normal course of pursuing their
investment objectives, certain Funds are subject to foreign investment and
currency risk. Certain Funds may enter into forward foreign currency contracts
("forward contracts") for purposes of hedging, duration management, as a
substitute for securities, to increase returns, for currency hedging or risk
management, or to otherwise help achieve a Fund's investment goal. These
contracts are marked-to-market daily at the applicable translation rates. A Fund
records realized gains or losses at the time the forward contract is closed. A
forward contract is extinguished through a closing transaction or upon delivery
of the currency or entering an offsetting contract. Risks may arise upon
entering these contracts from the potential inability of a counterparty to meet
the terms of their contracts and from unanticipated movements in the value of a
foreign currency relative to the U.S. dollar or other currencies. As of October
31, 2009, there were no open forward foreign currency contracts.
(7) INVESTMENT INCOME AND SECURITIES TRANSACTIONS: Dividend income is recorded
on the ex-dividend date, except for certain dividends from foreign securities
where the ex-dividend date may have passed, which are recorded as soon as a Fund
is informed of the ex-dividend date. Interest income is accrued daily and is
captured in dividends and interest receivable. Premiums and discounts are
amortized or accreted on an effective yield method on fixed income securities.
The Funds may be subject to foreign taxes on income, gains on investments or
currency repatriation, a portion of which may be recoverable. The Funds will
accrue such taxes and reclaims as applicable, based upon their current
interpretation of tax rules and regulations that exist in the markets in which
the Funds invest. Securities are accounted for on a trade date basis. The cost
of securities sold is determined using the identified cost method for the
Optimum Mid Cap Fund and First In First Out ("FIFO") method for all other Funds.
(8) FOREIGN CURRENCY: Foreign currencies, investments and other assets and
liabilities are translated into U.S. dollars at the exchange rates at 4:00 p.m.
U.S. ET (Eastern Time). Fluctuations in the value of the foreign currencies and
other assets and liabilities resulting from changes in exchange rates are
recorded as unrealized foreign currency gains (losses). Realized gains (losses)
and unrealized appreciation (depreciation) on investment securities and income
and expenses are translated on the respective dates of such transactions. The
effects of changes in foreign currency exchange rates on investments in
securities are segregated in the Statement of Operations from the effects of
changes in market prices of those securities, and are included with the net
realized and unrealized gain or loss on investment securities.
(9) FEDERAL INCOME TAXES: The Funds have elected to be treated as "regulated
investment companies" under Subchapter M of the Internal Revenue Code of 1986,
as amended, and to distribute substantially all of their respective net taxable
income. Accordingly, no provisions for federal income taxes have been
133
Aston Funds
OCTOBER 31, 2009
NOTES TO FINANCIAL STATEMENTS - CONTINUED
made in the accompanying financial statements. The Funds intend to utilize
provisions of the federal income tax laws, which allow them to carry a realized
capital loss forward for eight years following the year of the loss and offset
such losses against any future realized capital gains. At October 31, 2009, the
following Funds had available realized capital losses to offset future net
capital gains through the fiscal year ended:
2010 2011 2012 2013 2014 2015 2016 2017 TOTAL
--------- --------- ------- ---- --------- -------- ----------- ----------- -----------
M&C Growth Fund ......... $ -- $ -- $ -- $-- $ -- $ -- $ -- $86,434,151 $86,434,151
Veredus Select
Growth Fund .......... -- -- -- -- -- -- 20,645,901 18,622,364 39,268,265
Growth Fund ............. -- -- -- -- -- -- 11,375,824 27,330,965 38,706,789
Optimum Large Cap
Opportunity Fund ..... -- -- -- -- -- 900,934 4,340,402 1,110,827 6,352,163
Value Fund .............. -- -- -- -- -- -- -- 29,923,488 29,923,488
TAMRO Diversified
Equity Fund .......... -- -- -- -- -- -- 323,950 1,119,889 1,443,839
River Road Dividend
All Cap Value Fund ... -- -- -- -- -- -- 3,845,894 6,959,803 10,805,697
Optimum Mid Cap Fund .... -- -- -- -- -- -- -- 409,568 409,568
M&C Mid Cap
Growth Fund .......... -- -- -- -- -- -- 343,633 413,601 757,234
Cardinal Mid Cap
Value Fund ........... -- -- -- -- -- -- 81,755 294,280 376,035
River Road Small-Mid
Cap Fund ............. -- -- -- -- -- 171,820 4,200,696 11,382,935 15,755,451
Veredus Aggressive
Growth Fund .......... -- -- -- -- -- -- 22,597,198 16,347,889 38,945,087
TAMRO Small Cap Fund .... -- -- -- -- -- -- 24,563,509 63,071,540 87,635,049
River Road Small Cap
Value Fund ........... -- -- -- -- -- -- 35,323,830 36,796,207 72,120,037
Neptune International
Fund ................. -- -- -- -- -- 7,221 732,365 2,673,800 3,413,386
Barings International
Fund ................. -- -- -- -- -- -- 1,923,797 966,034 2,889,831
New Century Absolute
Return ETF Fund ...... -- -- -- -- -- -- 454,248 2,031,844 2,486,092
M.D. Sass Enhanced
Equity Fund .......... -- -- -- -- -- -- -- 152,602 152,602
Fortis Real Estate
Fund .................. -- -- -- -- -- -- 12,378,561 11,228,100 23,606,661
M&C Balanced Fund ....... 4,092,594 2,978,228 -- -- -- -- -- 638,828 7,709,650
Balanced Fund ........... -- -- -- -- -- -- 455,967 2,088,044 2,544,011
TCH Fixed Income Fund ... 15,377 -- 139,950 -- 5,274,089 -- 2,654,917 1,270,779 9,355,112
For the year ended October 31, 2009, Growth Fund had $15,120,067 of capital
losses that expired.
For the year ended October 31, 2009, Dynamic Allocation Fund utilized $220,013
of capital losses expiring in 2016.
Management has analyzed the Fund's tax positions taken on federal income tax
returns for all open tax years (current and prior three tax years), and has
concluded that no provision for federal income tax is required in the Fund's
financial statements. The Fund's federal and state income and federal excise tax
returns for tax years for which the applicable statutes of limitations have not
expired are subject to examination by the Internal Revenue Service and state
departments of revenue.
(10) MULTI-CLASS OPERATIONS: With respect to M&C Growth Fund, Veredus Select
Growth Fund, Growth Fund, Value Fund, River Road Dividend All Cap Value Fund,
Optimum Mid Cap Fund, River Road Small-Mid Cap Fund, Veredus Aggressive Growth
Fund, TAMRO Small Cap Fund, River Road Small Cap Value Fund, Neptune
International Fund, Fortis Real Estate Fund, M&C Balanced Fund and TCH Fixed
Income Fund, each class offered by these Funds has equal rights as to net
assets.
Income, fund and trust level expenses and realized and unrealized capital gains
and losses, if any, are allocated to each class of shares based on the relative
net assets of each class. Class specific expenses are allocated to each class
and include distribution fees.
(11) OFFERING COSTS: Certain costs were incurred in connection with the offering
of the following Funds as disclosed in the table below. The costs associated
have been capitalized and are being amortized on a straight-line basis over
twelve months based on the commencement date of the Funds, stated below.
ORIGINAL
FUND COMMENCEMENT DATE OFFERING COSTS
--- ----------------- --------------
Dynamic Allocation Fund January 10, 2008 $70,170
New Century Absolute Return ETF Fund March 4, 2008 83,557
M.D. Sass Enhanced Equity Fund January 15, 2008 60,391
Lake Partners LASSO Alternatives Fund April 1, 2009 75,292
134
Aston Funds
OCTOBER 31, 2009
NOTES TO FINANCIAL STATEMENTS - CONTINUED
(12) USE OF ESTIMATES: The preparation of financial statements in conformity
with US generally accepted accounting principles requires management to make
estimates and assumptions that affect the reported amounts of assets and
liabilities and disclosure of contingent assets and liabilities at the date of
the financial statements and the reported amounts of revenues and expenses
during the reporting period. Actual results could differ from those estimates.
(13) COMMITMENTS AND CONTINGENCIES: In the normal course of business, the Trust
enters into contracts on behalf of the Funds that contain a variety of
provisions for general indemnifications. Each Fund's maximum exposure under
these arrangements is unknown, as this would involve future claims that may be
made against each Fund that are not known at this time. However, based on
experience, the Funds believe the risk of loss is remote.
(14) RECENT ACCOUNTING PRONOUNCEMENT: In June 2009, the Financial Accounting
Standards Board (FASB) established the FASB Accounting Standards
Codification(TM) (Codification) as the single source of authoritative accounting
principles recognized by the FASB in the preparation of financial statements in
conformity with U.S. generally accepted accounting principles (GAAP). The
Codification supersedes existing non-grandfathered, non SEC accounting and
reporting standards. The Codification did not change GAAP but rather organized
it into a hierarchy where all guidance within the Codification carries an equal
level of authority. The Codification became effective for financial statements
issued for interim and annual periods ending after Sept. 15, 2009. The
Codification did not have a material effect on the Fund's financial statements.
NOTE (C) DIVIDENDS FROM NET INVESTMENT INCOME AND DISTRIBUTIONS OF CAPITAL
GAINS: Dividends and distributions to shareholders are recorded on the
ex-dividend date. River Road Dividend All Cap Value Fund, M.D. Sass Enhanced
Equity Fund and TCH Fixed Income Fund distribute dividends from net investment
income to shareholders monthly and net realized gains from investment
transactions, if any, are generally distributed annually, usually in December.
Value Fund, Dynamic Allocation Fund, New Century Absolute Return ETF Fund, M&C
Balanced Fund and Balanced Fund distribute dividends from net investment income
to shareholders quarterly and net realized gains from investment transactions,
if any, are generally distributed annually, usually in December.
M&C Growth Fund, Veredus Select Growth Fund, Growth Fund, Optimum Large Cap
Opportunity Fund, TAMRO Diversified Equity Fund, Optimum Mid Cap Fund, M&C Mid
Cap Growth Fund, Cardinal Mid Cap Value Fund, River Road Small-Mid Cap Fund,
Veredus Aggressive Growth Fund, TAMRO Small Cap Fund, River Road Small Cap Value
Fund, Neptune International Fund, Barings International Fund, Fortis Real Estate
Fund and Lake Partners LASSO Alternatives Fund, distribute dividends from net
investment income to shareholders annually and net realized gains from
investment transactions, if any, are generally distributed annually, usually in
December.
Dividends and distributions are automatically reinvested in additional Fund
shares on ex-date at that day's ending NAV for the respective Fund for those
shareholders who have elected the reinvestment option.
Differences in dividends per share between classes of M&C Growth Fund, Veredus
Select Growth Fund, Growth Fund, Value Fund, River Road Dividend All Cap Value
Fund, Optimum Mid Cap Fund, River Road Small-Mid Cap Fund, Veredus Aggressive
Growth Fund, TAMRO Small Cap Fund, River Road Small Cap Value Fund, Neptune
International Fund, Fortis Real Estate Fund, M&C Balanced Fund and TCH Fixed
Income Fund are due to different class expenses. Net investment income and
realized gains and losses for federal income tax purposes may differ from those
reported on the financial statements because of temporary and permanent book and
tax basis differences. Permanent differences, such as net operating losses,
nondeductible expenses, premium amortization, mark to market on Passive Foreign
Investment Companies and adjustment for Real Estate Investment Trusts, are
reclassified among capital accounts in the financial statements to reflect their
character. Temporary differences, such as deferrals on losses relating to wash
sales transactions and capital loss carryovers, arise when income, expenses,
gains or losses are recognized in different periods for financial statement and
tax purposes; these differences will reverse at some time in the future.
Permanent differences between book and tax basis reporting for the 2009 fiscal
year have been identified and appropriately reclassified as follows. These
reclassifications have no impact on net assets.
ACCUMULATED
UNDISTRIBUTED NET ACCUMULATED NET
INVESTMENT INCOME REALIZED GAIN (LOSS) PAID IN CAPITAL
----------------- -------------------- ---------------
M&C Growth Fund ................................. $ (6,432) $ 6,432 $ --
Veredus Select Growth Fund ...................... 21,533 -- (21,533)
Growth Fund ..................................... 11 15,120,056 (15,120,067)
Value Fund ...................................... (898) 898 --
TAMRO Diversified Equity Fund ................... 9,366 -- (9,366)
River Road Dividend All Cap Value Fund .......... (920,045) 911,969 8,076
Optimum Mid Cap Fund ............................ (748) 748 --
M&C Mid Cap Growth Fund ......................... (7,137) -- 7,137
Cardinal Mid Cap Value Fund ..................... (30,928) -- 30,928
Veredus Aggressive Growth Fund .................. 490,865 329,706 (820,571)
TAMRO Small Cap Fund ............................ 1,006,730 174,639 (1,181,369)
River Road Small Cap Value Fund ................. 7,354 (7,354) --
Neptune International Fund ...................... (82,084) 61,111 20,973
Barings International Fund ...................... (151,799) 152,036 (237)
Dynamic Allocation Fund. ........................ (22,624) (67) 22,691
135
Aston Funds
OCTOBER 31, 2009
NOTES TO FINANCIAL STATEMENTS - CONTINUED
ACCUMULATED
UNDISTRIBUTED NET ACCUMULATED NET
INVESTMENT INCOME REALIZED GAIN (LOSS) PAID IN CAPITAL
----------------- -------------------- ---------------
New Century Absolute Return ETF Fund ........... 6,960 -- (6,960)
M.D. Sass Enhanced Equity Fund .................. (4,317) 66 4,251
Lake Partners LASSO Alternatives Fund ........... 1,859 -- (1,859)
Fortis Real Estate Fund ........................ (25,434) 25,434 --
M&C Balanced Fund ............................... 141,176 (141,176) --
Balanced Fund ................................... 127,143 (127,143) --
TCH Fixed Income Fund ........................... (56,885) 56,885 --
Distributions from net realized gains for book purposes may include short-term
capital gains, which are classified as ordinary income for tax purposes.
The tax character of distributions paid during the fiscal years ended 2009 and
2008 was as follows:
DISTRIBUTIONS PAID IN 2009 DISTRIBUTIONS PAID IN 2008
------------------------------- -------------------------------------------
LONG-TERM LONG-TERM RETURN OF
ORDINARY INCOME CAPITAL GAINS ORDINARY INCOME CAPITAL GAINS CAPITAL
--------------- ------------- --------------- ------------- ---------
M&C Growth Fund ............................... $6,282,502 $43,115,588 $40,646,846 $227,599,180 $ --
Veredus Select Growth Fund .................... -- -- 6,651,877 1,462,356 --
Growth Fund ................................... 846,488 -- 9,845,290 90,452,517 --
Optimum Large Cap Opportunity Fund ............ -- -- 26,900 -- --
Value Fund .................................... 4,238,721 26,989,113 7,735,979 35,024,643 --
TAMRO Diversified Equity Fund ................. 38,534 -- 252,035 976,804 --
River Road Dividend All Cap Value Fund ........ 2,632,122 -- 2,532,551 495,595 24,198
Optimum Mid Cap Fund .......................... 5,276,291 10,425,693 8,375,773 56,595,670 --
Cardinal Mid Cap Value Fund ................... 8,532 -- -- -- --
River Road Small-Mid Cap Fund ................. 268,642 -- 58,969 -- --
Veredus Aggressive Growth Fund ................ 329,706 -- 22,230,291 31,954,642 --
TAMRO Small Cap Fund .......................... 343,822 -- 2,106 17,214,592 --
River Road Small Cap Value Fund ............... 584,344 -- 10,151,344 1,306,132 --
Neptune International Fund .................... 65,622 -- 28,222 -- --
Barings International Fund .................... 4,815 -- -- -- --
Dynamic Allocation Fund ....................... 187,961 -- 37,610 -- --
New Century Absolute Return ETF Fund .......... 121,220 -- -- -- --
M.D. Sass Enhanced Equity Fund ................ 1,297,601 -- 210,633 -- --
Fortis Real Estate Fund ....................... 977,351 -- 3,500,548 19,703,911 --
M&C Balanced Fund ............................. 266,425 -- 243,807 -- --
Balanced Fund ................................. 255,328 -- 798,522 5,591,012 --
TCH Fixed Income Fund ......................... 3,716,858 -- 4,498,684 -- --
As of October 31, 2009, the most recent tax year end, the components of
distributable earnings on a tax basis were as follows:
UNREALIZED
CAPITAL LOSS UNDISTRIBUTED UNDISTRIBUTED APPRECIATION/
CARRYFORWARD ORDINARY INCOME LONG-TERM GAIN DEPRECIATION TOTAL
------------- --------------- -------------- ------------- -------------
M&C Growth Fund ........................... $(86,434,151) $7,373,003 $ -- $245,084,850 $166,023,702
Veredus Select Growth Fund ................ (39,268,265) -- -- 4,985,278 (34,282,987)
Growth Fund ............................... (38,706,789) 767,143 -- 4,042,025 (33,897,621)
Optimum Large Cap Opportunity Fund ........ (6,352,163) 8,948 -- 120,931 (6,222,284)
Value Fund ................................ (29,923,488) 263,036 -- (13,151,691) (42,812,143)
TAMRO Diversified Equity Fund ............. (1,443,839) -- -- 1,346,316 (97,523)
River Road Dividend All Cap Value Fund .... (10,805,697) 45,315 -- 12,605,656 1,845,274
Optimum Mid Cap Fund ...................... (409,568) 130,625 -- 18,988,409 18,709,466
M&C Mid Cap Growth Fund ................... (757,234) -- -- 58,723 (698,511)
Cardinal Mid Cap Value Fund ............... (376,035) 904 -- 46,089 (329,042)
River Road Small-Mid Cap Fund ............. (15,755,451) 174,467 -- 10,344,513 (5,236,471)
Veredus Aggressive Growth Fund ............ (38,945,087) -- -- 4,263,314 (34,681,773)
TAMRO Small Cap Fund ...................... (87,635,049) -- -- 64,097,990 (23,537,059)
River Road Small Cap Value Fund ........... (72,120,037) 373,360 -- 21,226,315 (50,520,362)
Neptune International Fund ................ (3,413,386) 84,460 -- (283,253) (3,612,179)
Barings International Fund ................ (2,889,831) 114,467 -- 3,454,634 679,270
Dynamic Allocation Fund. .................. -- 2,906,655 2,690 77,118 2,986,463
New Century Absolute Return ETF Fund ..... (2,486,092) 23,030 -- 1,154,932 (1,308,130)
M.D. Sass Enhanced Equity Fund ............ (152,602) 12,570 -- (2,154,887) (2,294,919)
Lake Partners LASSO Alternatives Fund ..... -- 36,162 -- 55,726 91,888
Fortis Real Estate Fund. .................. (23,606,661) 341,013 -- (3,410,037) (26,675,685)
M&C Balanced Fund ......................... (7,709,650) 20,096 -- 471,158 (7,218,396)
Balanced Fund ............................. (2,544,011) 18,136 -- 1,152,556 (1,373,319)
TCH Fixed Income Fund ..................... (9,355,112) 35,529 -- 3,675,147 (5,644,436)
136
Aston Funds
OCTOBER 31, 2009
NOTES TO FINANCIAL STATEMENTS - CONTINUED
NOTE (D) SHARES OF BENEFICIAL INTEREST: Each Fund is authorized to issue an
unlimited number of shares of beneficial interest with no par value. Share
transactions of the Funds were as follows:
YEAR ENDED OCTOBER 31, 2009
PROCEEDS FROM NET INCREASE
REINVESTMENT (DECREASE) IN
CLASS N SOLD OF DISTRIBUTIONS REDEEMED SHARES OUTSTANDING
------- ---------- ---------------- ----------- ------------------
M&C Growth Fund ......................... 48,040,340 1,199,349 (20,046,221) 29,193,468
Veredus Select Growth Fund .............. 1,512,578 -- (1,440,827) 71,751
Growth Fund ............................. 357,628 11,664 (1,646,645) (1,277,353)
Optimum Large Cap Opportunity Fund ...... 259,201 -- (254,514) 4,687
Value Fund .............................. 665,155 404,427 (815,629) 253,953
TAMRO Diversified Equity Fund ........... 249,737 5,047 (202,928) 51,856
River Road Dividend All Cap Value Fund .. 8,295,005 214,554 (5,079,305) 3,430,254
Optimum Mid Cap Fund .................... 17,386,101 815,658 (10,657,995) 7,543,764
M&C Mid Cap Growth Fund ................. 135,121 -- (12,022) 123,099
Cardinal Mid Cap Value Fund ............. 4,306 304 (2,494) 2,116
River Road Small-Mid Cap Fund ........... 6,490,418 12,419 (4,828,043) 1,674,794
Veredus Aggressive Growth Fund .......... 454,822 32,389 (2,054,933) (1,567,722)
TAMRO Small Cap Fund .................... 9,706,815 -- (4,973,779) 4,733,036
River Road Small Cap Value Fund ......... 11,903,620 15,233 (7,995,851) 3,923,002
Neptune International Fund .............. 13,561 188 (10,793) 2,956
Dynamic Allocation Fund ................. 4,399,038 22,707 (882,794) 3,538,951
New Century Absolute Return ETF Fund .... 1,448,508 11,710 (1,060,767) 399,451
M.D. Sass Enhanced Equity Fund .......... 1,054,061 128,775 (329,897) 852,939
Fortis Real Estate Fund ................. 97,559 34,728 (428,785) (296,498)
M&C Balanced Fund ....................... 155,060 11,210 (386,570) (220,300)
Balanced Fund ........................... 183,485 52,051 (859,883) (624,347)
TCH Fixed Income Fund ................... 1,014,253 245,161 (1,539,488) (280,074)
PROCEEDS FROM NET INCREASE
REINVESTMENT (DECREASE) IN
CLASS I SOLD OF DISTRIBUTIONS REDEEMED SHARES OUTSTANDING
------- ---------- ---------------- ----------- ------------------
M&C Growth Fund ......................... 28,477,512 1,533,976 (12,374,492) 17,636,996
Veredus Select Growth Fund .............. 1,380,104 -- (1,435,848) (55,744)
Growth Fund ............................. 17,758 69,971 (116,363) (28,634)
Value Fund .............................. -- 3,924,472 -- 3,924,472
River Road Dividend All Cap Value Fund .. 9,063,675 65,666 (144,477) 8,984,864
Optimum Mid Cap Fund .................... 3,738,606 176,622 (2,685,047) 1,230,181
River Road Small-Mid Cap Fund ........... 14,234,102 22,086 (4,387,141) 9,869,047
Veredus Aggressive Growth Fund .......... 56,619 11,803 (565,793) (497,371)
TAMRO Small Cap Fund .................... 25,690,278 16,172 (8,312,294) 17,394,156
River Road Small Cap Value Fund ......... 20,421,198 42,274 (5,163,576) 15,299,896
Neptune International Fund .............. 5,814 1,179 (1,269,615) (1,262,622)
Barings International Fund .............. 3,866,972 391 (563,522) 3,303,841
Lake Partners LASSO Alternatives Fund ... 189,107 -- (23,660) 165,447
Fortis Real Estate Fund ................. -- 172,999 (202,737) (29,738)
M&C Balanced Fund ....................... 7,445 1,055 (2,525) 5,975
TCH Fixed Income Fund ................... 241,798 130,810 (1,359,167) (986,559)
(a) Lake Partners LASSO Alternatives Fund commenced investment operations on
April 1, 2009.
PROCEEDS FROM NET INCREASE
REINVESTMENT (DECREASE) IN
CLASS R SOLD OF DISTRIBUTIONS REDEEMED SHARES OUTSTANDING
------- ---------- ---------------- ----------- ------------------
M&C Growth Fund ......................... 224,401 542 (53,875) 171,068
Growth Fund ............................. 2,955 21 (7,764) (4,788)
137
Aston Funds
OCTOBER 31, 2009
NOTES TO FINANCIAL STATEMENTS - CONTINUED
YEAR ENDED OCTOBER 31, 2008
PROCEEDS FROM NET INCREASE
REINVESTMENT (DECREASE) IN
CLASS N SOLD OF DISTRIBUTIONS REDEEMED SHARES OUTSTANDING
------- ---------- ---------------- ----------- ------------------
M&C Growth Fund ......................... 14,677,614 3,514,388 (10,293,943) 7,898,059
Veredus Select Growth Fund .............. 1,689,953 541,855 (984,250) 1,247,558
Growth Fund ............................. 771,373 2,263,248 (4,977,106) (1,942,485)
Optimum Large Cap Opportunity Fund ...... 361,985 2,154 (3,051,046) (2,686,907)
Value Fund .............................. 2,253,400 932,494 (9,395,263) (6,209,369)
TAMRO Diversified Equity Fund ........... 93,932 94,685 (227,227) (38,610)
River Road Dividend All Cap Value Fund .. 5,407,124 255,565 (2,121,746) 3,540,943
Optimum Mid Cap Fund .................... 14,676,572 1,873,766 (12,507,157) 4,043,181
M&C Mid Cap Growth Fund (a) ............. 318,097 -- (7,739) 310,358
Cardinal Mid Cap Value Fund (a) ......... 125,659 -- (1) 125,658
River Road Small-Mid Cap Fund ........... 3,629,344 -- (898,784) 2,730,560
Veredus Aggressive Growth Fund .......... 842,978 1,862,155 (2,674,801) 30,332
TAMRO Small Cap Fund .................... 6,485,985 544,667 (6,508,367) 522,285
River Road Small Cap Value Fund ......... 8,591,132 619,572 (8,516,839) 693,865
Neptune International Fund (b) .......... 38,708 -- (276) 38,432
Dynamic Allocation Fund (c) ............. 1,095,755 4,045 (362,800) 737,000
New Century Absolute Return ETF
Fund (d) ............................. 1,861,086 -- (269,425) 1,591,661
M.D. Sass Enhanced Equity Fund (e) ...... 1,861,954 8,004 (92,036) 1,777,922
Fortis Real Estate Fund ................. 509,510 1,311,859 (3,980,634) (2,159,265)
M&C Balanced Fund ....................... 529,844 10,773 (313,911) 226,706
Balanced Fund ........................... 276,024 1,022,624 (2,150,008) (851,360)
TCH Fixed Income Fund ................... 1,303,287 262,051 (2,004,073) (438,735)
(a) M&C Mid Cap Growth and Cardinal Mid Cap Value Funds commenced investment
operations on November 2, 2007.
(b) Neptune International Fund began issuing Class N Shares on June 17, 2008.
(c) Dynamic Allocation Fund commenced investment operations on January 10,
2008.
(d) New Century Absolute Return ETF Fund commenced investment operations on
March 4, 2008.
(e) M.D. Sass Enhanced Equity Fund commenced investment operations on January
15, 2008.
PROCEEDS FROM NET INCREASE
REINVESTMENT (DECREASE) IN
CLASS I SOLD OF DISTRIBUTIONS REDEEMED SHARES OUTSTANDING
------- ---------- ---------------- ----------- ------------------
M&C Growth Fund ......................... 12,682,376 5,660,710 (18,176,954) 166,132
Veredus Select Growth Fund .............. 5,395,864 34,915 (356,408) 5,074,371
Growth Fund ............................. 18,283 3,702,548 (3,296,057) 424,774
Value Fund .............................. 1,193 2,259,330 -- 2,260,523
River Road Dividend All Cap Value Fund .. -- 1,485 -- 1,485
Optimum Mid Cap Fund .................... 2,546,507 251,251 (1,346,538) 1,451,220
River Road Small-Mid Cap Fund ........... 13,088,539 5,867 (2,068,013) 11,026,393
Veredus Aggressive Growth Fund .......... 1,796,178 1,690,801 (6,624,489) (3,137,510)
TAMRO Small Cap Fund .................... 14,161,308 174,341 (3,523,490) 10,812,159
River Road Small Cap Value Fund ......... 8,821,014 187,412 (1,193,431) 7,814,995
Neptune International Fund .............. 1,273,516 1,973 (38,224) 1,237,265
Barings International Fund (a) .......... 1,515,800 -- (430,156) 1,085,644
Fortis Real Estate Fund ................. -- 1,188,863 -- 1,188,863
M&C Balanced Fund ....................... 5,554 884 (5,535) 903
TCH Fixed Income Fund ................... 482,402 133,683 (1,645,645) (1,029,560)
(a) Barings International Fund commenced investment operations on November 2,
2007.
PROCEEDS FROM NET INCREASE
REINVESTMENT (DECREASE) IN
CLASS R SOLD OF DISTRIBUTIONS REDEEMED SHARES OUTSTANDING
------- ---------- ---------------- ----------- ------------------
M&C Growth Fund ......................... 124,297 19,649 (259,374) (115,428)
Growth Fund ............................. 28,718 6,734 (14,167) 21,285
138
Aston Funds
OCTOBER 31, 2009
NOTES TO FINANCIAL STATEMENTS - CONTINUED
NOTE (E) INVESTMENT TRANSACTIONS: Aggregate purchases and proceeds from sales of
investment securities (other than short-term investments) for the year ended
October 31, 2009 were as follows:
AGGREGATE PURCHASES PROCEEDS FROM SALES
-------------------------------- ------------------------------
U.S. GOVERNMENT OTHER U.S. GOVERNMENT OTHER
--------------- -------------- --------------- ------------
M&C Growth Fund (1) ..................... $ -- $1,328,664,190 $ -- $625,267,546
Veredus Select Growth Fund .............. -- 244,222,375 -- 244,345,797
Growth Fund ............................. -- 67,884,897 -- 81,596,017
Optimum Large Cap Opportunity Fund ...... -- 2,574,399 -- 2,716,285
Value Fund .............................. -- 81,816,612 -- 78,099,348
TAMRO Diversified Equity Fund ........... -- 7,744,344 -- 7,339,836
River Road Dividend All Cap Value Fund .. -- 138,235,071 -- 47,821,100
Optimum Mid Cap Fund .................... -- 292,210,853 -- 121,450,821
M&C Mid Cap Growth Fund ................. -- 1,865,260 -- 1,173,767
Cardinal Mid Cap Value Fund ............. -- 523,539 -- 510,513
River Road Small-Mid Cap Fund ........... -- 144,879,425 -- 68,976,310
Veredus Aggressive Growth Fund .......... -- 119,217,708 -- 133,810,631
TAMRO Small Cap Fund .................... -- 757,530,649 -- 469,372,642
River Road Small Cap Value Fund ......... -- 287,177,967 -- 124,826,106
Neptune International Fund .............. -- 3,149,540 -- 11,628,941
Barings International Fund .............. -- 35,069,159 -- 17,967,929
Dynamic Allocation Fund ................. -- 110,315,067 -- 80,162,233
New Century Absolute Return ETF Fund .... -- 40,419,226 -- 37,530,929
M.D. Sass Enhanced Equity Fund .......... -- 14,508,573 -- 8,818,550
Lake Partners LASSO Alternatives Fund ... -- 2,374,891 -- 676,158
Fortis Real Estate Fund ................. -- 30,896,931 -- 31,297,970
M&C Balanced Fund ....................... 541,099 6,042,392 1,692,122 8,410,094
Balanced Fund ........................... 332,337 6,459,633 1,735,097 9,137,904
TCH Fixed Income Fund ................... 6,390,080 19,538,043 14,616,362 17,330,715
(1) The M&C Growth Fund had a subscription-in-kind on April 1, 2009 which
resulted in transactions into the fund of $1,154,244, which is comprised of
securities, cash and dividends accrued in the amounts of $1,148,094,
$5,186, and $964, respectively. These securities are excluded from the
aggregate purchase above.
NOTE (F) REDEMPTION FEES: In accordance with the prospectuses, certain Funds
assessed a 2% redemption fee on fund share redemptions and exchanges within
specified time periods, as indicated in the following table for the year ended
October 31, 2009 and included in the Cost of Shares redeemed on the Statements
of Changes in Net Assets:
FUND NAME TIME PERIOD AMOUNT
--------- ----------------- ------
Fortis Real Estate Fund 2% Within 90 Days $3,667
Neptune International Fund 2% Within 90 Days 56
NOTE (G) ADVISORY, ADMINISTRATION, DISTRIBUTION SERVICES AND TRUSTEE AGREEMENTS:
ADVISORY. Aston serves as Investment Adviser and Administrator to the Funds.
Under terms of each Fund's investment advisory agreement, fees are accrued daily
and paid monthly, based on specific annual rates of average daily net assets.
The factors considered by the Board of Trustees in approving the current
investment advisory agreement for each Fund are included in the Funds' annual or
semi-annual report to shareholders covering the period during which the approval
occurred.
Certain Funds have an expense limitation agreement with the Adviser, which caps
annual ordinary operating expenses for Class N and Class I shareholders at
certain specified annual rates of average daily net assets (the "Expense
Limitation Agreements"). There are no contractual expense limitations for Class
R shareholders.
139
Aston Funds
OCTOBER 31, 2009
NOTES TO FINANCIAL STATEMENTS - CONTINUED
The Expense Limitation Agreements are effective through February 28, 2010,
except as noted below. The advisory rates and contractual expense limitations
for the year ended October 31, 2009 were as follows:
CONTRACTUAL
EXPENSE LIMITATIONS
-----------------------
FUND NAME ADVISORY FEES CLASS N CLASS I
---------------------------------------------------- --------------------------- ---------- ----------
M&C Growth Fund..................................... 0.80% on first $800,000,000
0.60% over $800,000,000 N/A N/A
Veredus Select Growth Fund.......................... 0.80% 1.30% 1.05%
Growth Fund (a)..................................... 0.70% N/A N/A
Optimum Large Cap Opportunity Fund (b).............. 0.80% 1.22%(c) N/A
Value Fund (d)...................................... 0.80% N/A N/A
TAMRO Diversified Equity Fund....................... 0.80% 1.20% N/A
River Road Dividend All Cap Value Fund.............. 0.70% 1.30% 1.05%
Optimum Mid Cap Fund (e)............................ 0.80% on first $100,000,000
0.75% next $300,000,000
0.70% over $400,000,000 N/A N/A
M&C Mid Cap Growth Fund............................. 0.85% 1.40%(c) N/A
Cardinal Mid Cap Value Fund......................... 0.90% 1.40%(c) N/A
River Road Small-Mid Cap Fund....................... 1.00% 1.50%(c) 1.25%(c)
Veredus Aggressive Growth Fund...................... 1.00% 1.49% 1.24%
TAMRO Small Cap Fund (f)............................ 0.90% N/A N/A
River Road Small Cap Value Fund (g)................. 0.90% N/A N/A
Neptune International Fund (h)...................... 1.00% 1.27%(c) 1.02%(c)
Barings International Fund (i)...................... 1.00% N/A 1.25%(c)
Dynamic Allocation Fund............................. 0.80% 1.30%(c) N/A
New Century Absolute Return ETF Fund (j)............ 1.00% 1.50%(c) N/A
M.D. Sass Enhanced Equity Fund (k).................. 0.70% 1.40%(c) N/A
Lake Partners LASSO Alternatives Fund............... 1.00% N/A 1.35%(c)*
Fortis Real Estate Fund............................. 1.00% 1.37% 1.12%
M&C Balanced Fund (l)............................... 0.75% N/A N/A
Balanced Fund (m)................................... 0.70% N/A N/A
TCH Fixed Income Fund............................... 0.55% 0.74% 0.49%
(a) Aston voluntarily waived 0.01% of its advisory fees for the Growth Fund
through October 31, 2009.
(b) The contractual and voluntary expense limitations prior to March 1, 2009
were 1.40% and 1.10% respectively for the Optimum Large Cap Opportunity
Fund, however, effective March 1, 2009, Aston agreed to contractually waive
management fees and/or reimburse expenses so that the net expense ratio is
no more than 1.22% for Class N.
(c) Aston and the Fund have entered into a contractual expense reimbursement
agreement which states for a period of three years subsequent to the
commencement of operations of the Fund the Adviser is entitled to be
reimbursed by the Fund for previously waived fees and reimbursed expenses
to the extent that the Fund's expense ratio (not including acquired fund
fees and expenses) remains below the operating expense cap after such
reimbursement.
(d) Effective March 1, 2009, Aston has agreed to voluntarily waive management
fees and/or reimburse expenses for the Value Fund so that the net expense
ratio is no more than 1.07% for Class N and 0.82% for Class I. Prior to
March 1, 2009, the contractual expense limitation was 1.07% for Class N and
0.82% for Class I.
(e) Effective March 1, 2009, the contractual expense limitation for the Optimum
Mid Cap Fund of 1.40% for Class N and 1.15% for Class I was removed.
(f) Effective March 1, 2009, the contractual expense limitation for the TAMRO
Small Cap Fund of 1.30% for Class N and 1.05% for Class I was removed.
(g) Effective March 1, 2009, the contractual expense limitation for the River
Road Small Cap Value Fund of 1.50% for Class N and 1.25% for Class I was
removed.
(h) Effective February 11, 2008, the contractual expense limitation of 1.40%
was removed and Aston agreed to voluntarily waive management fees and/or
reimburse expenses for the Neptune International Fund so that the net
expense ratio is no more than 1.02% for Class I. This voluntary waiver
became the contractual expense limitation on February 29, 2008.
(i) Effective March 31, 2008, Aston agreed to voluntarily waive management fees
and/or reimburse expenses for the Barings International Fund so that the
net expense ratio is no more than 1.15% for Class I.
(j) The Sub-Adviser has agreed that for any full calendar year of operations,
if any such period the Fund had a total return (before taxes) of less than
zero then the Sub-Adviser will waive its fee in its entirety for the next
succeeding calendar year. For any period when this waiver is in effect,
Aston has agreed to reduce its advisory fee to 0.15%. For the period ended
December 31, 2008, the Fund's total return was less than zero, therefore
Aston reduced its advisory fee to 0.15% for the 2009 calendar year.
Additionally, Aston voluntarily waived 0.14% of its advisory fees for the
New Century Absolute Return ETF Fund for the 10 month period ended October
31, 2009.
(k) Effective June 1, 2009, the contractual expense limitation for the M.D.
Sass Enhanced Equity Fund was increased from 1.10% to 1.40% due to a change
in the Sub-Adviser.
(l) Effective November 1, 2006, Aston agreed to voluntarily waive management
fees and/or reimburse expenses for the M&C Balanced Fund so that the net
expense ratio is no more than 1.35% for Class N and 1.10% for Class I.
Aston may revise or discontinue the voluntary waiver at any time.
(m) Effective December 19, 2008, Aston agreed to voluntarily waive management
fees and/or reimburse expenses for the Balanced Fund so that the net
expense ratio is no more than 1.50% for Class N. Aston may revise or
discontinue the voluntary waiver at any time.
* The Expense Limitation Agreement for Lake Partners LASSO Alternatives Fund
is in effect through April 1, 2010.
140
Aston Funds
OCTOBER 31, 2009
NOTES TO FINANCIAL STATEMENTS - CONTINUED
Pursuant to a contractual expense reimbursement arrangement between Aston and
the following Funds, during any of the first three years subsequent to the
Fund's commencement of operations for a period of up to three years from the
date such amount was waived or reduced of each of the Optimum Large Cap
Opportunity Fund-Class N, M&C Mid Cap Growth Fund-Class N, Cardinal Mid Cap
Value Fund-Class N, River Road Small-Mid Cap Fund-Classes N and I, Neptune
International Fund-Classes N and I, Barings International Fund-Class I, Dynamic
Allocation Fund-Class N, New Century Absolute Return ETF Fund-Class N, M.D. Sass
Enhanced Equity Fund-Class N, and Lake Partners LASSO Alternatives Fund-Class I.
Aston is entitled to be reimbursed by each Fund for previously waived fees and
reimbursed expenses to the extent that each Fund's expense ratio (not including
interest expense and acquired fund fees and expenses) remains at or below the
operating expense cap after such reimbursement.
The cumulative reimbursement amounts as of October 31, 2009 that are entitled to
be reimbursed for each Fund are as follows:
EXPIRATION
------------------------------------------------
FUNDS 2010 2011 2012
----- ------------ -------------- ----------------
Optimum Large Cap Opportunity Fund $139,592 $ 119,883 $ 68,339
M&C Mid Cap Growth Fund N/A 98,808 79,648
Cardinal Mid Cap Value Fund N/A 103,064 77,563
River Road Small-Mid Cap Fund -- 41,111 --
Neptune International Fund 48,302 181,699 118,000
Barings International Fund N/A 174,288 139,755
Dynamic Allocation Fund N/A 105,329 89,827
New Century Absolute Return ETF Fund N/A 97,083 26,954
M.D. Sass Enhanced Equity Fund N/A 127,941 143,213
Lake Partners LASSO Alternatives Fund (1) N/A N/A 94,071
-------- ---------- --------
TOTALS $187,894 $1,049,206 $837,370
======== ========== ========
(1) The Fund commenced operations in the current fiscal year.
For the year ended October 31, 2009, the Adviser was reimbursed $102,394 by the
River Road Small-Mid Cap Fund. No other Fund in the above table reimbursed the
Adviser during the period.
During the year ended October 31, 2009, the respective Sub-adviser reimbursed
the following Funds for losses incurred on transactions not meeting the Funds'
investment guidelines:
PAYMENT BY
AFFILIATE
----------
Growth Fund $ 11
Neptune International Fund 13
Barings International Fund 10,678
Dynamic Allocation Fund 67
Aston manages each Fund by retaining one or more sub-advisers to manage each
Fund as follows:
FUND SUB-ADVISER
---- -------------------------------------------
M&C Growth Fund Montag & Caldwell, Inc.
Veredus Select Growth Fund Todd-Veredus Asset Management LLC(1)
Growth Fund Montag & Caldwell, Inc.(2)
Optimum Large Cap Opportunity
Fund Optimum Investment Advisers, LLC
Value Fund MFS Institutional Advisors Inc.
TAMRO Diversified Equity Fund TAMRO Capital Partners LLC
River Road Dividend All Cap
Value Fund River Road Asset Management, LLC
FUND SUB-ADVISER
---- -------------------------------------------
Optimum Mid Cap Fund Optimum Investment Advisors, LLC
M&C Mid Cap Growth
Fund Montag & Caldwell, Inc.
Cardinal Mid Cap Value Fund Cardinal Capital Management, L.L.C.
River Road Small-Mid Cap
Fund River Road Asset Management, LLC
Veredus Aggressive Growth
Fund Todd-Veredus Asset Management LLC(1)
TAMRO Small Cap Fund TAMRO Capital Partners LLC
River Road Small Cap Value
Fund River Road Asset Management, LLC
Neptune International Fund Neptune Investment Management Limited
Barings International Fund Baring International Investment Limited
Dynamic Allocation Fund Smart Portfolios, LLC
New Century Absolute
Return ETF Fund New Century Capital Management, LLC
M.D. Sass Enhanced Equity
Fund M.D. Sass Investors Services, Inc.(3)
Lake Partners LASSO
Alternatives Fund Lake Partners, Inc.
Fortis Real Estate Fund Fortis Investment Management USA, Inc.(4)
M&C Balanced
Fund Montag & Caldwell, Inc.
Balanced Fund Montag & Caldwell, Inc. (Equity Portion)
Taplin, Canida & Habacht LLC (Fixed
Income Portion)
TCH Fixed Income Fund Taplin, Canida & Habacht, LLC
(1) Effective April 30, 2009, Veredus Asset Management LLC merged with Todd
Investment Advisors, Inc. and became Todd-Veredus Asset Management, LLC.
(2) Effective January 1, 2008, Montag & Caldwell, Inc. became the subadviser to
the Fund. Prior to January 1, 2008, ABN AMRO Asset Management, Inc. was the
subadviser.
(3) Effective June 1, 2009, M.D. Sass Investor Services, Inc. became the
subadviser to the Fund. Prior to June 1, 2009, MB Investment Partners, Inc.
was the subadviser.
(4) Effective August 1, 2008, Fortis Asset Management USA, Inc. became the
subadviser to the Fund. Prior to August 1, 2008, ABN AMRO Asset Management,
Inc. was the subadviser.
Sub-advisory fees are paid monthly by Aston. The factors considered by the Board
of Trustees in approving the current sub-investment advisory agreements are
included in the Funds' annual or semi-annual report to shareholders covering the
period in which such approval occurred.
ADMINISTRATION. Under the terms of the administration agreement between the
Funds and Aston, the Funds' administrator, ("Administration Agreement"),
administration fees are accrued daily and paid monthly, based on a specified
percentage of average daily net assets of the Trust and base fees are fixed at
an annual rate of $12,000 per Fund. The fee is allocated to each Fund based on
the relative net assets of the Trust. Administration expenses also include
pricing agent fees and compliance related expenses. The administration fee
arrangement is as follows:
ADMINISTRATION FEES
AT TRUST LEVEL ANNUAL RATE
------------------- ------------
First $7.4 billion 0.0490%
Over $7.4 billion 0.0465%
PNC Global Investment Servicing (U.S.) Inc. ("PNC"), formerly named PFPC Inc.,
provides certain administrative services to the Funds pursuant to a
Sub-administration and Accounting Services Agreement between Aston and PNC (the
"Sub-Administration Agreement"). Under the terms of the Sub-Administration
Agreement, sub-administration fees, which are paid by Aston, are accrued daily
and paid monthly, at a rate of 0.022% of average daily net assets of the Trust
and a base fee at an annual rate of $12,000 per Fund.
141
Aston Funds
OCTOBER 31, 2009
NOTES TO FINANCIAL STATEMENTS - CONTINUED
DISTRIBUTION SERVICES. PFPC Distributors, Inc. (the "Distributor") serves as
principal underwriter and distributor of the Fund's shares. Pursuant to Rule
12b-1 distribution plans (the "Plans") adopted by the Funds, with respect to
Class N shares and Class R shares, the Funds pay certain expenses associated
with the distribution of their shares. Under the Plans, each Fund may pay actual
expenses not exceeding, on an annual basis, 0.25% of each participating Fund's
Class N average daily net assets and 0.50% of each participating Fund's Class R
average daily net assets. The Class I shares do not have distribution plans.
From December 18, 2008 to October 31, 2009, the Aston Balanced Fund and the
TAMRO Diversified Equity Fund did not charge 12b-1 fees under the Class N Shares
Plan. From May 1, 2009 to October 31, 2009 and from July 1, 2009 to October 31,
2009, TCH Fixed Income Fund and M&C Balanced Fund, respectfully, did not charge
12b-1 fees under the Class N Shares Plan.
TRUSTEES. The Trustees of the Trust who are not affiliated with the investment
adviser or sub-advisers receive an annual retainer and per meeting fees. The
Lead Independent Trustee and Committee Chairs receive an additional retainer.
The Trustees of the Trust who are not affiliated with the investment adviser or
sub-advisers receive fees and are reimbursed for out-of-pocket expenses for each
meeting of the Board of Trustees they attend. No officer or employee of the
investment adviser, sub-advisers or their affiliates receives any compensation
from the Funds for acting as a Trustee of the Trust. The officers of the Trust
receive no compensation directly from the Funds for performing the duties of
their offices, except that the Funds compensate the Administrator for providing
an officer to serve as the Funds' Chief Compliance Officer. The aggregate
remuneration paid to the Trustees during the year ended October 31, 2009 was
$365,500.
NOTE (H) CREDIT AGREEMENT: Effective April 28, 2009, the Trust entered into a
Credit Agreement with PNC Bank, National Association which provides the Trust
with a revolving credit facility up to $50 million. The facility is shared by
each series of the Trust except for the Lake Partners LASSO Alternatives Fund,
and is available for temporary, emergency purposes including liquidity needs in
meeting redemptions. The annual facility fee is 0.25% of the commitment amount
of the facility. The Veredus Aggressive Growth Fund utilized the line of credit
during the period April 28, 2009 to October 31, 2009. The average daily loan
balance outstanding on the days where borrowing existed was $2,105,100, the
weighted average interest rate was 2.68% and the interest expense, which is
included on the Statement of Operations was $627. No other Fund utilized the
line of credit during the same period.
Prior to April 28, 2009, the Credit Agreement with The Bank of Nova Scotia had
an annual facility fee of 0.125% of the commitment amount of the facility in
addition to an annual administration fee of $75,000. The Optimum Mid Cap Fund
utilized the line of credit during the period November 1, 2008 to April 28,
2009. The average daily loan balance outstanding on the days where borrowings
existed was $2,160,413, the weighted average interest rate was 3.25% and the
interest expense, which is included on the Statement of Operations was $2,901.
No other Fund utilized the line of credit during the period November 1, 2008 to
April 28, 2009. The Credit Agreement with The Bank of Nova Scotia was terminated
on April 29, 2009.
NOTE (I) REFLOW FUND LLC: The Veredus Aggressive Growth Fund may participate in
the ReFlow Fund LLC program ("ReFlow"), which is designed to provide an
alternative liquidity source for mutual funds experiencing redemptions of their
shares. In order to pay cash to shareholders who redeem their shares on a given
day, a mutual fund typically must hold cash in its portfolio, liquidate
portfolio securities, or borrow money, all of which impose certain costs on the
fund. ReFlow provides participating mutual funds with another source of cash by
standing ready to purchase shares from a fund equal to the amount of the fund's
net redemptions on a given day. ReFlow then generally redeems those shares when
the fund experiences net sales or when the shares have been outstanding for the
holding limit of 28 days, whichever comes first. In return for this service, the
Veredus Aggressive Growth Fund will pay a fee to ReFlow at a rate determined by
a daily auction with other participating mutual funds.
The costs to the Veredus Aggressive Growth Fund for participating in ReFlow are
expected to be influenced by and comparable to the cost of other sources of
liquidity, such as the Fund's short-term lending arrangements or the costs of
selling portfolio securities to meet redemptions. ReFlow will be prohibited from
acquiring more than 3% of the outstanding voting securities of the Fund.
As of October 31, 2009, the Veredus Aggressive Growth Fund had not utilized
ReFlow.
NOTE (J) LIQUIDATIONS: Aston/ClariVest Mid Cap Growth Fund and Aston/SGA
International Small-Mid Cap Fund were terminated and liquidated on January 29,
2009. Aston/Fortis Global Real Estate Fund was terminated and liquidated on July
30, 2009.
NOTE (K) SUBSEQUENT EVENTS: Management has evaluated the impact of all
subsequent events on the Funds through December 29, 2009, the date the financial
statements were issued, and has determined that there were subsequent events as
follows:
The Trust filed a Post Effective Amendment to its Registration Statement on
October 5, 2009, for the purpose of adding a new series to the Trust,
Aston/Fasciano Small Cap Fund. This new Fund is expected to commence operations
on or about December 21, 2009.
Aston Asset Management LLC ("Aston"), the investment adviser for each Fund, is a
wholly-owned subsidiary of Highbury Financial Inc. ("Highbury"). On December 14,
2009, Highbury entered into a definitive merger agreement with Affiliated
Managers Group, Inc. ("AMG") and its wholly-owned subsidiary, Manor LLC ("Merger
Sub"), pursuant to which the parties agreed to merge Highbury with and into
Merger Sub, resulting
142
Aston Funds
OCTOBER 31, 2009
NOTES TO FINANCIAL STATEMENTS - CONTINUED
in AMG's acquisition of Highbury (the "Transaction"). Upon completion of the
Transaction, Aston will be converted to a Delaware limited partnership and
change its name to "Aston Asset Management, LP." AMG will own a majority equity
interest in Aston, and certain members of senior management and key employees of
Aston will retain an equity interest in Aston. Upon the closing of the
Transaction, Aston expects to have substantially the same personnel with
substantially the same responsibilities as before, with no change in its
day-to-day operations, or the services provided to its clients.
As required by the Investment Company Act of 1940, as amended (the "1940 Act"),
the Investment Advisory Agreement for each Fund provides for its automatic
termination in the event of its assignment as defined in the 1940 Act. The
Transaction will result in an "assignment" and termination of the Investment
Advisory Agreement for each Fund, which will cause the termination of each
Sub-Investment Advisory Agreement then in effect with respect to each Fund. At
an in person meeting on December 6, 2009, the Board of Trustees considered a
number of proposals in connection with the Transaction. At that meeting, the
Board of Trustees, approved a new Investment Advisory Agreement with Aston Asset
Management, LP with respect to each Fund and new Sub-Investment Advisory
Agreement(s) between Aston Asset Management, LP and the applicable subadviser(s)
with respect to each Fund to take effect upon the termination of the current
agreements. The Board of Trustees also approved an amendment to the By Laws of
the Trust to increase the mandatory retirement age of trustees; and nominated
ten trustees to stand for election to the Board, contingent upon the completion
of the Transaction.
Shareholder approval of the new Sub-Investment Advisory Agreements is not
required pursuant to a "manager-of-managers" exemptive order obtained by the
Trust and Aston Asset Management LLC. Shareholder approval will be sought with
respect to the election of new trustees, the amendment to the By-Laws and the
new Investment Advisory Agreement. Shareholders of each Fund will receive a
proxy statement in the first quarter of 2009, which will describe these
proposals in more detail. If a new Investment Advisory Agreement is approved by
shareholders of substantially all of the Funds and certain other closing
conditions of the Transaction are satisfied or waived, the new Investment
Advisory Agreements and Sub-Investment Advisory Agreements will become effective
as of the closing date of the Transaction. If the Transaction does not close,
the current agreements will remain in full force and effect. It is anticipated
that the Transaction will close in the second quarter of 2010.
At an in-person meeting of the Board of Trustees on December 6, 2009, the Board
of Trustees voted in favor of recommending that shareholders approve two
separate reorganizations (each a "Reorganization") that would (a) reorganize the
Balanced Fund into the M&C Balanced Fund and (b) reorganize the Growth Fund into
the M&C Growth Fund. Shareholders of the Balanced Fund and the Growth Fund will
receive a proxy statement in the first quarter of 2009, which will describe
these proposals in more detail. If shareholder approval is obtained, the
Reorganizations are expected to occur in the second quarter of 2010.
The Trust anticipates offering Class I shares of the M.D. Sass Enhanced Equity
Fund to the public on or about March 1, 2010. The Trust also anticipates
offering Class N shares of the Barings International Fund and Lake Partners
LASSO Alternatives Fund to the public on or about March 1, 2010.
143
Aston Funds
REPORT OF INDEPENDENT REGISTERED PUBLIC ACCOUNTING FIRM
To the Shareholders and Board of Trustees of Aston Funds
We have audited the accompanying statements of assets and liabilities, including
the schedules of investments, of the Aston/Montag & Caldwell Growth Fund,
Aston/Veredus Select Growth Fund, Aston Growth Fund, Aston/Optimum Large Cap
Opportunity Fund, Aston Value Fund, Aston/TAMRO Diversified Equity Fund,
Aston/River Road Dividend All Cap Value Fund, Aston/Optimum Mid Cap Fund,
Aston/Montag & Caldwell Mid Cap Growth Fund, Aston/Cardinal Mid Cap Value Fund,
Aston/River Road Small-Mid Cap Fund, Aston/Veredus Aggressive Growth Fund,
Aston/TAMRO Small Cap Fund, Aston/River Road Small Cap Value Fund, Aston/Neptune
International Fund, Aston/Barings International Fund, Aston Dynamic Allocation
Fund, Aston/New Century Absolute Return ETF Fund, Aston/M.D. Sass Enhanced
Equity Fund, Aston/Lake Partners LASSO Alternatives Fund, Aston/Fortis Real
Estate Fund, Aston/Montag & Caldwell Balanced Fund, Aston Balanced Fund, and
Aston/TCH Fixed Income Fund (the "Funds") (twenty-four of the portfolios
constituting the Aston Funds (the "Trust")) as of October 31, 2009, and the
related statements of operations, statements of changes in net assets, and
financial highlights for the periods indicated therein. These financial
statements and financial highlights are the responsibility of the Trust's
management. Our responsibility is to express an opinion on these financial
statements and financial highlights based on our audits.
We conducted our audits in accordance with the standards of the Public Company
Accounting Oversight Board (United States). Those standards require that we plan
and perform the audits to obtain reasonable assurance about whether the
financial statements and financial highlights are free of material misstatement.
We were not engaged to perform an audit of the Trust's internal control over
financial reporting. Our audits included consideration of internal control over
financial reporting as a basis for designing audit procedures that are
appropriate in the circumstances, but not for the purpose of expressing an
opinion on the effectiveness of the Trust's internal control over financial
reporting. Accordingly, we express no such opinion. An audit also includes
examining, on a test basis, evidence supporting the amounts and disclosures in
the financial statements and financial highlights, assessing the accounting
principles used and significant estimates made by management, and evaluating the
overall financial statement presentation. Our procedures included confirmation
of securities owned as of October 31, 2009, by correspondence with the custodian
and brokers or by other appropriate auditing procedures where replies from
brokers were not received. We believe that our audits provide a reasonable basis
for our opinion.
In our opinion, the financial statements and financial highlights referred to
above present fairly, in all material respects, the financial position of each
of the above mentioned portfolios of the Funds at October 31, 2009, the results
of their operations, changes in their net assets, and financial highlights for
the periods indicated therein, in conformity with U.S. generally accepted
accounting principles.
(ERNST & YOUNG LLP)
Chicago, Illinois
December 29, 2009
144
Aston Funds
OCTOBER 31, 2009
ADDITIONAL INFORMATION (UNAUDITED)
FORM N-Q: The Trust files complete schedules of portfolio holdings for the Funds
with the Securities and Exchange Commission (the "SEC") for the Trust's first
and third quarters of each fiscal year on Form N-Q. The Trust's Form N-Q are
available on the SEC's Web site at www.sec.gov and are available for review and
copying at the SEC's Public Reference Room in Washington, DC. Information on the
operations of the Public Reference Room may be obtained by calling the SEC at
202 942-8090.
PROXY VOTING: Aston Funds' Proxy Voting Policies and Procedures, used to
determine how to vote proxies relating to portfolio securities, are included in
the Trust's Statement of Additional Information, which is available (i) upon
request, without charge, by calling 800 992-8151; (ii) on Aston Funds' Web site
at www.astonfunds.com; and (iii) on the SEC's Web site at www.sec.gov. Aston
Funds' Proxy Voting Record for the most recent twelve-month period ended June 30
is available without charge (i) on the Funds' Web site at www.astonfunds.com;
and (ii) on the SEC's Web site at www.sec.gov.
TAX INFORMATION: In accordance with Federal tax law, the following Funds hereby
make the designations indicated below regarding their fiscal year ended October
31, 2009:
The following are the estimated percentages of the income dividends qualifying
for the dividends received deduction available to corporations:
FUND PERCENTAGE
--- ----------
M&C Growth Fund 100.00%
Growth Fund 100.00%
Value Fund 100.00%
TAMRO Diversified Equity Fund 100.00%
River Road Dividend All Cap Value Fund 100.00%
Optimum Mid Cap Fund 100.00%
Cardinal Mid Cap Value Fund 100.00%
River Road Small-Mid Cap Fund 100.00%
TAMRO Small Cap Fund 100.00%
River Road Small Cap Value Fund 100.00%
Neptune International Fund 100.00%
Barings International Fund 100.00%
Dynamic Allocation Fund 100.00%
New Century Absolute Return ETF Fund 100.00%
M.D. Sass Enhanced Equity Fund 100.00%
Fortis Real Estate Fund 100.00%
M&C Balanced Fund 100.00%
Balanced Fund 100.00%
Each Fund designates 100%, or if subsequently different, of ordinary income
dividends ("QDI") to qualify for the lower tax rates applicable to individual
shareholders; and 100%, or if subsequently different, of ordinary income
dividends to qualify for the dividends received deduction ("DRD") for corporate
shareholders. The actual percentage of QDI and DRD for the calendar year will be
designated in year-end tax statements.
For the fiscal year ended October 31, 2009, certain dividends paid by the Funds
may be subject to a maximum tax rate of 15%, as provided by the Jobs and Growth
Tax Relief Reconciliation Act of 2003. Of the distributions made by the
following Funds, the corresponding percentages represent the amount of each
distribution which may qualify for the 15% dividend income tax rate.
FUND PERCENTAGE
--- ----------
M&C Growth Fund 100.00%
Growth Fund 100.00%
Optimum Large Cap Opportunity Fund 100.00%
Value Fund 100.00%
River Road Dividend All Cap Value Fund 100.00%
Optimum Mid Cap Fund 100.00%
Cardinal Mid Cap Value Fund 100.00%
River Road Small-Mid Cap Fund 100.00%
River Road Small Cap Value Fund 100.00%
Neptune International Fund 100.00%
Barings International Fund 100.00%
Dynamic Allocation Fund 100.00%
New Century Absolute Return ETF Fund 100.00%
M.D. Sass Enhanced Equity Fund 24.52%
Lake Partners LASSO Alternatives Fund 100.00%
Fortis Real Estate Fund 4.32%
M&C Balanced Fund 66.66%
Balanced Fund 69.86%
Shareholders should not use the above tax information to prepare their tax
returns. The information will be included with your Form 1099 DIV which will be
sent to you separately in January 2010.
FACTORS CONSIDERED BY THE BOARD OF TRUSTEES IN APPROVING THE INVESTMENT ADVISORY
AGREEMENT WITH ASTON ASSET MANAGEMENT WITH RESPECT TO ASTON/M.D. SASS ENHANCED
EQUITY FUND.
The Board of Trustees (the "Board") of the Aston Funds (the "Trust") approved a
Sub-Investment Advisory Agreement (the "Sub-Investment Advisory Agreement")
between Aston Asset Management LLC ("Adviser" or "Aston") and M.D. Sass
Investors Services, Inc. ("Subadviser" or "M.D. Sass") with respect to the
Aston/M.D. Sass Enhanced Equity Fund (f/k/a Aston/MB Enhanced Equity Income
Fund) at an in-person meeting on June 1, 2009. The Board considered information
provided, and discussions held, at the June 1st meeting by Aston and M.D. Sass.
The Independent Trustees met separately from the "interested" Trustee of the
Trust and any officers of Aston, the Subadviser or their affiliates to consider
approval of the Sub-Investment Advisory Agreement and were assisted by
independent legal counsel in their deliberations. Among the matters considered
by the Board, including the Independent Trustees, in connection with its
approval of the Sub-Investment Advisory Agreement were the following:
145
Aston Funds
OCTOBER 31, 2009
ADDITIONAL INFORMATION (UNAUDITED) - CONTINUED
NATURE, QUALITY AND EXTENT OF SERVICES. The Board considered the nature, extent
and quality of services expected to be provided under the Sub-Investment
Advisory Agreement. The Board considered the reputation, qualifications and
background of the proposed Subadviser. The Board also considered the investment
approach of the Subadviser, the experience and skills of investment personnel
responsible for the day-to-day investment management of the Fund and the
resources made available to such personnel. The Board considered that a
portfolio manager of the Fund had joined M.D. Sass, which would result in
continuity of the investment strategy. The Board also considered the
Subadviser's experience with institutional and separately managed accounts. On
the basis of this evaluation, the Board concluded that the nature, quality and
extent of services to be provided by the Subadviser are expected to be
satisfactory.
FEES, PROFITABILITY AND ECONOMIES OF SCALE. The Board considered the subadvisory
fee rates under the Sub-Investment Advisory Agreement as well as the overall
management fee structure of the Fund. The Board considered that the subadvisory
fee rates were negotiated at arm's length between Aston and the Subadviser, an
unaffiliated third party, and that Aston will compensate the Subadviser from its
fees. As part of its review of the investment advisory agreement with Aston, the
Board considered whether there will be economies of scale with respect to the
overall fee structure of the Fund and whether the Fund will benefit from any
economies of scale.
The Board concluded that the proposed subadvisory fee rates were reasonable in
light of the nature, quality and extent of services to be provided and that the
economies of scale were limited at this time.
OTHER BENEFITS TO THE SUBADVISER. The Board also considered the character and
amount of other incidental benefits received by the Subadviser. The Board
considered potential benefits to the Subadviser from the use of "soft dollars"
to pay for research services generated by parties other than the executing
broker dealer. The Board concluded that the subadvisory fees were reasonable
taking into account any other benefits to be received by the Subadviser from its
relationship with the Fund.
CONCLUSION. Based on all of the information considered and the conclusions
reached, the Board determined that the terms of the Sub-Investment Advisory
Agreement are fair and reasonable, and that the approval of the Sub-Investment
Advisory Agreement is in the best interests of the Fund. No single factor was
determinative in the Board's analysis.
DISCLOSURE OF FUND EXPENSES: We believe it is important for you to understand
the impact of fees regarding your investment. All mutual funds have operating
expenses. As a shareholder of a mutual fund, you incur ongoing costs, which
include costs for portfolio management, administrative services, and shareholder
reports (like this one), among others. Operating expenses, which are deducted
from a fund's gross income, directly reduce the investment return of the fund. A
fund's expenses are expressed as a percentage of its average daily net assets.
This figure is known as the expense ratio. The following examples are intended
to help you understand the ongoing fees (in dollars) of investing in your Fund
and to compare these costs with those of other mutual funds. The examples are
based on an investment of $1,000 made at the beginning of the period shown and
held for the entire period.
This table illustrates each Fund's costs in two ways:
ACTUAL FUND RETURN: This section helps you to estimate the actual expenses,
after any applicable fee waivers, that you paid over the period. The "Ending
Account Value" shown is derived from the Fund's actual return for the past six
month period, the "Expense Ratio" column shows the period's annualized expense
ratio, and the "Expenses Paid During Period" column shows the dollar amount that
would have been paid by an investor who started with $1,000 in the Fund at the
beginning of the period. You may use the information here, together with your
account value, to estimate the expenses that you paid over the period. To do so,
simply divide your account value by $1,000 (for example, an $8,600 account value
divided by $1,000 = 8.6), then multiply the result by the number given for your
Fund in the first line under the heading entitled "Expenses Paid During Period."
HYPOTHETICAL 5% RETURN: This section is intended to help you compare your Fund's
costs with those of other mutual funds. It assumes that the Fund had an annual
return of 5% before expenses, but that the expense ratio is unchanged. In this
case, because the return used is not the Fund's actual return, the results do
not apply to your investment. This example is useful in making comparisons to
other mutual funds because the SEC requires all mutual funds to calculate
expenses based on an assumed 5% annual return. You can assess your Fund's costs
by comparing this hypothetical example with the hypothetical examples that
appear in shareholder reports of other funds.
Please note that the expenses shown in the table are meant to highlight and help
you compare your ongoing costs only and do not reflect any transactional costs
such as sales charges (loads) and redemption fees, which are described in the
Prospectus. If these costs were applied to your account, your costs would be
higher.
146
Aston Funds
OCTOBER 31, 2009
ADDITIONAL INFORMATION (UNAUDITED) - CONTINUED
BEGINNING ENDING
ACCOUNT ACCOUNT EXPENSES
VALUE VALUE EXPENSE PAID DURING
05/01/09 10/31/09 RATIO(1) PERIOD(2)
--------- --------- -------- -----------
M&C GROWTH FUND
ACTUAL FUND RETURN
Class N ............................... $1,000 $1,162.70 1.09% $5.94
Class I ............................... 1,000 1,164.40 0.84% 4.58
Class R ............................... 1,000 1,162.00 1.34% 7.30
HYPOTHETICAL 5% RETURN
Class N ............................... $1,000 $1,019.71 1.09% $5.55
Class I ............................... 1,000 1,020.97 0.84% 4.28
Class R ............................... 1,000 1,018.45 1.34% 6.82
VEREDUS SELECT GROWTH FUND
ACTUAL FUND RETURN
Class N ............................... $1,000 $1,125.30 1.30% $6.96
Class I ............................... 1,000 1,128.10 1.05% 5.63
HYPOTHETICAL 5% RETURN
Class N ............................... $1,000 $1,018.65 1.30% $6.61
Class I ............................... 1,000 1,019.91 1.05% 5.35
GROWTH FUND
ACTUAL FUND RETURN
Class N ............................... $1,000 $1,169.00 1.08% $5.90
Class I ............................... 1,000 1,170.60 0.83% 4.54
Class R ............................... 1,000 1,167.80 1.33% 7.27
HYPOTHETICAL 5% RETURN
Class N ............................... $1,000 $1,019.76 1.08% $5.50
Class I ............................... 1,000 1,021.02 0.83% 4.23
Class R ............................... 1,000 1,018.50 1.33% 6.77
OPTIMUM LARGE CAP OPPORTUNITY FUND
ACTUAL FUND RETURN
Class N ............................... $1,000 $1,172.10 1.22% $6.68
HYPOTHETICAL 5% RETURN
Class N ............................... $1,000 $1,019.06 1.22% $6.21
VALUE FUND
ACTUAL FUND RETURN
Class N ............................... $1,000 $1,180.10 1.07% $5.88
Class I ............................... 1,000 1,181.50 0.82% 4.51
HYPOTHETICAL 5% RETURN
Class N ............................... $1,000 $1,019.81 1.07% $5.45
Class I ............................... 1,000 1,021.07 0.82% 4.18
TAMRO DIVERSIFIED EQUITY FUND
ACTUAL FUND RETURN
Class N ............................... $1,000 $1,161.30 1.20% $6.54
HYPOTHETICAL 5% RETURN
Class N ............................... $1,000 $1,019.16 1.20% $6.11
RIVER ROAD DIVIDEND ALL CAP VALUE FUND
ACTUAL FUND RETURN
Class N ............................... $1,000 $1,157.40 1.19% $6.47
Class I ............................... 1,000 1,157.60 0.95% 5.17
HYPOTHETICAL 5% RETURN
Class N ............................... $1,000 $1,019.21 1.19% $6.06
Class I ............................... 1,000 1,020.42 0.95% 4.84
OPTIMUM MID CAP FUND
ACTUAL FUND RETURN
Class N ............................... $1,000 $1,305.60 1.14% $6.62
Class I ............................... 1,000 1,306.80 0.89% 5.17
HYPOTHETICAL 5% RETURN
Class N ............................... $1,000 $1,019.46 1.14% $5.80
Class I ............................... 1,000 1,020.72 0.89% 4.53
BEGINNING ENDING
ACCOUNT ACCOUNT EXPENSES
VALUE VALUE EXPENSE PAID DURING
05/01/09 10/31/09 RATIO(1) PERIOD(2)
--------- --------- -------- -----------
M&C MID CAP GROWTH FUND
ACTUAL FUND RETURN
Class N ............................... $1,000 $1,163.60 1.40% $7.63
HYPOTHETICAL 5% RETURN
Class N ............................... $1,000 $1,018.15 1.40% $7.12
CARDINAL MID CAP VALUE FUND
ACTUAL FUND RETURN
Class N ............................... $1,000 $1,147.20 1.40% $7.58
HYPOTHETICAL 5% RETURN
Class N ............................... $1,000 $1,018.15 1.40% $7.12
RIVER ROAD SMALL-MID CAP FUND
ACTUAL FUND RETURN
Class N ............................... $1,000 $1,111.00 1.50% $7.98
Class I ............................... 1,000 1,112.20 1.25% 6.65
HYPOTHETICAL 5% RETURN
Class N ............................... $1,000 $1,017.64 1.50% $7.63
Class I ............................... 1,000 1,018.90 1.25% 6.36
VEREDUS AGGRESSIVE GROWTH FUND
ACTUAL FUND RETURN
Class N ............................... $1,000 $1,160.40 1.49% $8.11
Class I ............................... 1,000 1,162.10 1.24% 6.76
HYPOTHETICAL 5% RETURN
Class N ............................... $1,000 $1,017.69 1.49% $7.58
Class I ............................... 1,000 1,018.95 1.24% 6.31
TAMRO SMALL CAP FUND
ACTUAL FUND RETURN
Class N ............................... $1,000 $1,113.00 1.38% $7.35
Class I ............................... 1,000 1,114.00 1.13% 6.02
HYPOTHETICAL 5% RETURN
Class N ............................... $1,000 $1,018.25 1.38% $7.02
Class I ............................... 1,000 1,019.51 1.13% 5.75
RIVER ROAD SMALL CAP VALUE FUND
ACTUAL FUND RETURN
Class N ............................... $1,000 $1,135.60 1.39% $7.48
Class I ............................... 1,000 1,137.80 1.14% 6.14
HYPOTHETICAL 5% RETURN
Class N ............................... $1,000 $1,018.20 1.39% $7.07
Class I ............................... 1,000 1,019.46 1.14% 5.80
NEPTUNE INTERNATIONAL FUND
ACTUAL FUND RETURN
Class N ............................... $1,000 $1,254.90 1.27% $5.34
Class I ............................... $1,000 1,254.90 1.02% 5.80
HYPOTHETICAL 5% RETURN
Class N ............................... $1,000 $1,018.80 1.27% $4.78
Class I ............................... $1,000 1,020.06 1.02% 5.19
BARINGS INTERNATIONAL FUND
ACTUAL FUND RETURN
Class I ............................... $1,000 $1,250.00 1.15% $6.52
HYPOTHETICAL 5% RETURN
Class I ............................... $1,000 $1,019.41 1.15% $5.85
DYNAMIC ALLOCATION FUND
ACTUAL FUND RETURN
Class N ............................... $1,000 $1,125.20 1.30% $6.96
HYPOTHETICAL 5% RETURN
Class N ............................... $1,000 $1,018.65 1.30% $6.61
NEW CENTURY ABSOLUTE RETURN ETF FUND
ACTUAL FUND RETURN
Class N ............................... $1,000 $1,142.70 0.99% $5.35
HYPOTHETICAL 5% RETURN
Class N ............................... $1,000 $1,020.21 0.99% $5.04
147
Aston Funds
OCTOBER 31, 2009
ADDITIONAL INFORMATION (UNAUDITED) - CONTINUED
BEGINNING ENDING
ACCOUNT ACCOUNT EXPENSES
VALUE VALUE EXPENSE PAID DURING
05/01/09 10/31/09 RATIO(1) PERIOD(2)
--------- --------- -------- -----------
M.D. SASS ENHANCED EQUITY FUND
ACTUAL FUND RETURN
Class N ............................... $1,000 $1,166.30 1.36% $7.43
HYPOTHETICAL 5% RETURN
Class N ............................... $1,000 $1,018.35 1.36% $6.92
LAKE PARTNERS LASSO ALTERNATIVES FUND
ACTUAL FUND RETURN
Class I ............................... $1,000 $1,098.50 1.35% $7.14
HYPOTHETICAL 5% RETURN
Class I ............................... $1,000 $1,018.40 1.35% $6.87
FORTIS REAL ESTATE FUND
ACTUAL FUND RETURN
Class N ............................... $1,000 $1,251.60 1.37% $7.78
Class I ............................... 1,000 1,253.30 1.12% 6.36
HYPOTHETICAL 5% RETURN
Class N ............................... $1,000 $1,018.30 1.37% $6.97
Class I ............................... 1,000 1,019.56 1.12% 5.70
M&C BALANCED FUND
ACTUAL FUND RETURN
Class N ............................... $1,000 $1,116.90 1.18% $6.30
Class I ............................... 1,000 1,117.40 1.10% 5.87
HYPOTHETICAL 5% RETURN
Class N ............................... $1,000 $1,019.26 1.18% $6.01
Class I ............................... 1,000 1,019.66 1.10% 5.60
BALANCED FUND
ACTUAL FUND RETURN
Class N ............................... $1,000 $1,142.80 1.43% $7.72
HYPOTHETICAL 5% RETURN
Class N ............................... $1,000 $1,018.00 1.43% $7.27
TCH FIXED INCOME FUND
ACTUAL FUND RETURN
Class N ............................... $1,000 $1,137.80 0.49% $2.64
Class I ............................... 1,000 1,137.90 0.49% 2.64
HYPOTHETICAL 5% RETURN
Class N ............................... $1,000 $1,022.74 0.49% $2.50
Class I ............................... 1,000 1,022.74 0.49% 2.50
(1) Annualized, based on the Funds' most recent fiscal half-year expenses.
(2) Expenses are equal to the Fund's annualized expense ratio multiplied by the
average account value over the period, multiplied by the number of days in
the most recent fiscal half-year or partial year, if applicable, for the
actual return and multiplied by the most recent fiscal half-year for the
hypothetical 5% return, then divided by 365. Expense ratios do not include
interest expense, if applicable.
148
Aston Funds
OCTOBER 31, 2009
ADDITIONAL INFORMATION (UNAUDITED) - CONTINUED
TRUSTEES AND OFFICERS OF THE TRUST
Under Delaware law, the business and affairs of the Trust are managed under the
direction of the Board of Trustees. Information pertaining to the Trustees and
Executive Officers of the Trust is set forth below. The term "officer" means the
president, vice president, secretary, treasurer, controller or any other officer
who performs a policy making function.
NUMBER OF
PORTFOLIOS
TERM OF IN FUND
OFFICE (2) AND COMPLEX OTHER TRUSTEESHIPS/
NAME, ADDRESS, AGE(1) AND LENGTH OF PRINCIPAL OCCUPATION(S) OVERSEEN BY DIRECTORSHIPS
POSITION(S) WITH TRUST TIME SERVED (1) DURING PAST FIVE YEARS TRUSTEE HELD BY TRUSTEE
------------------------------- --------------- ----------------------------------------- ----------- ------------------------------
DISINTERESTED TRUSTEES
Leonard F. Amari 15 years Partner at the law offices of Amari & 24 President of the Board of
c/o Aston Funds Locallo, a practice with exclusive con- Trustees, John Marshall Law
120 N. LaSalle Street centration in real estate taxation and School
Chicago, IL 60602 related areas, since 1986; Special
Age: 67 Assistant Attorney General since 1986.
Trustee
Gregory T. Mutz 15 years CEO of AMLI Residential Properties Trust 24 Director of Alico, Inc.
c/o Aston Funds (a Multifamily REIT), a successor company (NASDAQ: ALCO) (agribusiness);
120 N. LaSalle Street to AMLI Realty Co. since 2004 and a Member of Board of Genesis
Chicago, IL 60602 wholly owned subsidiary of PRIME Property Financial Solutions (a
Age: 63 Fund, LLC, an institutional real estate privately-held company based
Lead Independent co-mingled fund managed by Morgan Stanley in Portland, Oregon provid-
Trustee Real Estate, Inc.; Vice Chairman of UICI ing debt recovery, consumer
(NYSE: UCI) (an insurance holding lending and credit card
company) from 2003-2004; President and services); a member of the
CEO of UICI from 1999-2003; Chairman of Board of WAN S.A., a
Academic Management Service Corp. (a residential real estate
student loans and finance company) from company headquartered in
2000-2003. Warsaw, Poland; a member of
the Board of Suknip
International Limited, a
residential real estate
company headquartered in St.
Petersburg, Russia.
Robert B. Scherer 10 years President of The Rockridge Group, Ltd 24 Director, Title Reinsurance
c/o Aston Funds (title insurance industry consulting ser- Company (insurance for title
120 N. LaSalle Street vices) since 1994. agents)
Chicago, IL 60602
Age: 68
Trustee
Denis Springer 10 years Retired. Senior Vice President and Chief 24 Director, Coleman Cable Inc.
c/o Aston Funds Financial Officer of Burlington Northern (wire and cable manufacturer)
120 N. LaSalle Street Santa Fe Corp. (railroad), 1995-1999. (NASDAQ: CCIX)
Chicago, IL 60602
Age: 63
Trustee
149
Aston Funds
OCTOBER 31, 2009
ADDITIONAL INFORMATION (UNAUDITED) - CONTINUED
NUMBER OF
PORTFOLIOS
TERM OF IN
OFFICE(2) FUND
AND COMPLEX OTHER TRUSTEESHIPS/
NAME, ADDRESS, AGE(1) AND LENGTH OF PRINCIPAL OCCUPATION(S) OVERSEEN BY DIRECTORSHIPS
POSITION(S) WITH TRUST TIME SERVED (1) DURING PAST FIVE YEARS TRUSTEE HELD BY TRUSTEE
------------------------------- --------------- ----------------------------------------- ----------- -----------------------
INTERESTED TRUSTEE (3)
Stuart D. Bilton, CFA 15 years Chief Executive Officer, Aston Asset 24 Director, Baldwin & Lyons,
c/o Aston Funds Management LLC, since 2006; Director, Inc. (property and casualty
120 N. LaSalle Street Highbury Financial Inc. since August insurance firm); Director,
Chicago, IL 60602 2009; Vice Chairman of ABN AMRO Asset Highbury Financial, Inc.
Age: 63 Management Holdings, Inc. 2003-2006;
Chairman, Board of Trustees President and Chief Executive Officer of
ABN AMRO Asset Management Holdings, Inc.
from 2001-2003; President of Alleghany
Asset Management, Inc. from 1996-2001
(purchased by ABN AMRO in February 2001).
OFFICER(S) WHO ARE NOT TRUSTEES
Kenneth C. Anderson 15 years President, Aston Asset Management LLC, N/A Director, Highbury Financial,
c/o Aston Funds since 2006; Director, Highbury Financial Inc.
120 N. LaSalle Street Inc. since August 2009; President and
Chicago, IL 60602 Chief Executive Officer of ABN AMRO
Age: 45 Investment Fund Services, Inc. (formerly
President (Chief Executive known as Alleghany Investment Services,
Officer) Inc.) 1995-2006; Executive Vice President
of ABN AMRO Asset Management (USA) LLC
2001-2005; Director, ABN AMRO Trust
Services Company 2001-2005; Director,
TAMRO Capital Partners LLC and Veredus
Asset Management LLC 2001-2006; Officer
of the Trust since 1993; CPA.
Gerald F. Dillenburg 12 years Chief Compliance Officer and Chief N/A N/A
c/o Aston Funds Financial Officer, Aston Asset Management
120 N. LaSalle Street LLC, since 2006; Senior Managing Director
Chicago, IL 60602 ("SMD") of ABN AMRO Investment Fund
Age: 42 Services, Inc. (formerly known as
Senior Vice President, Alleghany Investment Services, Inc.)
Secretary and Treasurer 1996-2006; SMD of ABN AMRO Asset
(Chief Financial Officer, Management Holdings, Inc. and ABN AMRO
Chief Operating Officer and Asset Management, Inc. (formerly known
Chief Compliance Officer) as Chicago Capital Management, Inc.)
2001-2006; Operations manager and
compliance officer of ABN AMRO mutual
funds 1996-2006; CPA.
----------
(1) As of October 31, 2009.
(2) Trustees serve for an indefinite term until the earliest of: (i) removal by
two-thirds of the Board of Trustees or shareholders, (ii) resignation,
death or incapacity, (iii) the election and qualification of his successor,
in accordance with the By-Laws of the Trust or (iv) the last day of the
fiscal year in which he attains the age of 72 years. Officers serve for an
indefinite term until the earliest of: (i) removal by the Board of
Trustees, (ii) resignation, death or incapacity, or (iii) the election and
qualification of their successor, in accordance with the By-Laws of the
Trust.
(3) "Interested person" of the Trust as defined in the 1940 Act. Mr. Bilton is
considered an "interested person" because of affiliations with Aston Asset
Management LLC and related entities, which act as the Funds' investment
adviser.
150
Aston Funds
ADVISER
Aston Asset Management LLC
120 N. LaSalle Street, 25th Floor
Chicago, IL 60602
SUBADVISERS
Fortis Investment Management USA, Inc.
75 State Street
Boston, MA 02109
Baring International Investment Limited
155 Bishopsgate
London, EC2M 3XY UK
Cardinal Capital Management, L.L.C.
One Greenwich Office Park
Greenwich, CT 06831
Lake Partners, Inc.
24 Field Point Road
Greenwich, CT 06830
M.D. Sass Investors Services, Inc.
1185 Avenue of the Americas, 18th Floor
New York, NY 10036
MFS Institutional Advisors Inc.
500 Boylston Street
Boston, MA 02116
Montag & Caldwell, Inc.
3455 Peachtree Road NE, Suite 1200
Atlanta, GA 30326
SUBADVISERS - CONTINUED
Neptune Investment Management Limited
1 Hammersmith Grove
London, W6 0NB
New Century Capital Management, LLC
36 South Washington Street
Hinsdale, IL 60521
Optimum Investment Advisors, LLC
100 South Wacker Drive, Suite 2100
Chicago, IL 60606
River Road Asset Management, LLC
Meidinger Tower, Suite 1600
462 South Fourth Street
Louisville, KY 40202
Smart Portfolios, LLC
17865 Ballinger Way NE
Seattle, WA 98155
TAMRO Capital Partners LLC
1660 Duke St.
Alexandria, VA 22314
Taplin, Canida & Habacht LLC
1001 Brickell Bay Drive, Suite 2100
Miami, FL 33131
Todd-Veredus Asset Management LLC
6060 Dutchmans Lane
One Paragon Centre, Suite 320
Louisville, KY 40205
SHAREHOLDER SERVICES
Aston Funds
P.O. Box 9765
Providence, RI 02940
DISTRIBUTOR
PFPC Distributors, Inc.
760 Moore Road
King of Prussia, PA 19406
OFFICERS
Kenneth C. Anderson, President and Chief Executive Officer
Gerald F. Dillenburg, Senior Vice President, Secretary and Treasurer, Chief
Operating Officer, Chief Financial Officer and Chief Compliance Officer
Juli A. Braun, Assistant Treasurer
Laura M. Curylo, Assistant Treasurer
James A. Dimmick, Assistant Secretary
Marc J. Peirce, Assistant Secretary
CUSTODIAN
PFPC Trust Company
8800 Tinicum Boulevard
Philadelphia, PA 19153
LEGAL COUNSEL
Vedder Price P.C.
222 N. LaSalle Street
Chicago, IL 60601
INDEPENDENT REGISTERED PUBLIC ACCOUNTING FIRM
Ernst & Young LLP
Willis Tower
233 S. Wacker Drive
Chicago, IL 60606
THE STATEMENT OF ADDITIONAL INFORMATION INCLUDES ADDITIONAL INFORMATION ABOUT
FUND TRUSTEES AND IS AVAILABLE UPON REQUEST WITHOUT CHARGE BY
CALLING 800 992-8151.
151
This page intentionally left blank.
This page intentionally left blank.
This page intentionally left blank.
Guide to Shareholder Benefits
We're delighted to offer all Aston Funds shareholders a variety of services and
convenient options. To receive more information about any of these benefits,
simply call an Investor Services Associate Monday through Friday, 9 a.m. - 7
p.m. ET.
THE EASY WAY TO ADD TO YOUR ACCOUNT: START AN AUTOMATIC INVESTMENT PLAN
For N class shareholders, systematic investing is an easy, effortless way to
help reach any investment goal. Just choose a fixed amount, and we'll
automatically deduct it from your checking or savings account on a regular
schedule and invest it in your Aston Funds account. Periodic investment plans
involve continuous investments in securities regardless of price. You should
consider your financial ability to continue to purchase shares through periods
of both high and low price levels. This plan does not assure a profit and does
not protect against loss in declining markets.
COMPOUND YOUR EARNINGS WITH AUTOMATIC DIVIDEND REINVESTMENT
By automatically reinvesting dividends into your Fund account, profits have the
opportunity to mount. Monthly and quarterly dividends and annual capital gain
distributions are reinvested at no charge.
ACCESS INFORMATION AND MAKE TRANSACTIONS ONLINE AT OUR WEB SITE
You can open a new account, access account balances, view statements, obtain
fund information, and make transactions online 24 hours a day, 7 days a week.
www.astonfunds.com
Our Shareholder Services Line Is at Your Service 24 Hours a Day
800 992-8151
Investor Services
Associates are available to assist you Monday - Friday 9 a.m. to 7 p.m., ET. Or,
call any time, day or night, for automated account information to make exchanges
or check fund performance.
(ASTON FUNDS LOGO)
Aston Funds
P.O. Box 9765
Providence, RI 02940
ATN NIRAN 09
PART C: OTHER INFORMATION
Section 10.2 of the Registrant’s Trust Instrument provides as follows:
10.2 Indemnification. The Trust shall indemnify each of its Trustees against all liabilities and expenses (including amounts paid in satisfaction of judgments, in compromise, as fines and penalties, and as counsel fees) reasonably incurred by him in connection with the defense or disposition of any action, suit or other proceeding, whether civil or criminal, in which he may be involved or with which he may be threatened, while as a Trustee or thereafter, by reason of his being or having been such a Trustee except with respect to any matter as to which he shall have been adjudicated to have acted in bad faith, willful misfeasance, gross negligence or reckless disregard of his duties, provided that as to any matter disposed of by a compromise payment by such person, pursuant to a consent decree or otherwise, no indemnification either for said payment or for any other expenses shall be provided unless the Trust shall have received a written opinion from independent legal counsel approved by the Trustees to the effect that if either the matter of willful misfeasance, gross negligence or reckless disregard of duty, or the matter of bad faith had been adjudicated, it would in the opinion of such counsel have been adjudicated in favor of such person. The rights accruing to any person under these provisions shall not exclude any other right to which he may be lawfully entitled, provided that no person may satisfy any right of indemnity or reimbursement hereunder except out of the property of the Trust. The Trustees may make advance payments in connection with the indemnification under this Section 10.2, provided that the indemnified person shall have given a written undertaking to reimburse the Trust in the event it is subsequently determined that he is not entitled to such indemnification.
The Trust shall indemnify officers, and shall have the power to indemnify representatives and employees of the Trust, to the same extent that Trustees are entitled to indemnification pursuant to this Section 10.2.
Insofar as indemnification for liability arising under the Securities Act of 1933 (the “1933 Act”) may be permitted to trustees, officers and controlling persons of Registrant pursuant to the foregoing provisions, or otherwise, Registrant has been advised that in the opinion of the Securities and Exchange Commission such indemnification is against public policy as expressed in that Act and is, therefore, unenforceable. In the event that a claim for indemnification against such liabilities (other than the payment by Registrant of expenses incurred or paid by a trustee, officer or controlling person of Registrant in the successful defense of any action, suit or proceeding) is asserted by such trustee, officer or controlling person in connection with the securities being registered, Registrant will, unless in the opinion of its counsel the matter has been settled by controlling precedent, submit to a court of appropriate jurisdiction the question whether such indemnification by it is against public policy as expressed in that Act and will be governed by the final adjudication of such issue.
Section 10.3 of the Registrant’s Trust Instrument also provides for the indemnification of shareholders of the Registrant. Section 10.3 states as follows:
10.3 Shareholders. In case any Shareholder or former Shareholder of any Series shall be held to be personally liable solely by reason of his being or having been a shareholder of such Series and not because of his acts or omissions or for some other reason, the Shareholder or former Shareholder (or his heirs, executors, administrators or other legal representatives or, in the case of a corporation or other entity, its corporate or other general successor) shall be entitled out of the assets belonging to the applicable Series to be held harmless from and indemnified against all loss and expense arising from such liability. The Trust, on behalf of the affected Series, shall,
upon request by the Shareholder, assume the defense of any claim made against the Shareholder for any act or obligation of the Trust and satisfy any judgment thereon from the assets of the Series.
In addition, the Registrant currently has a trustees’ and officers’ liability policy covering certain types of errors and omissions.
(1) (a) Trust Instrument dated September 10, 1993 is incorporated herein by reference to Post-Effective Amendment No. 8 to the Registration Statement as filed on April 16, 1996.
(b) State of Delaware Certificate of Amendment to Certificate of Trust dated February 25, 1998 is incorporated by reference to Exhibit (a)(2) to Post-Effective Amendment No. 33 to the Registration Statement as filed on September 21, 2001.
(c) State of Delaware Certificate of Amendment to Certificate of Trust dated September 10, 2001 is incorporated by reference to Exhibit (a)(3) to Post-Effective Amendment No. 33 to the Registration Statement as filed on September 21, 2001.
(d) State of Delaware Certificate of Amendment to Certificate of Trust dated November 29, 2006 is incorporated by reference to Exhibit (a)(4) to Post-Effective Amendment No. 74 to the Registration Statement as filed on November 30, 2006.
(2) (a) By-Laws are incorporated by reference to Exhibit No. 2 of Post-Effective Amendment No. 7 to the Registration Statement filed on February 22, 1996.
(b) Amendment to By-Laws dated March 18, 1999 is incorporated by reference to Exhibit (b)(2) to Post-Effective Amendment No. 51 to the Registration Statement as filed on February 27, 2004.
(c) Amendment to By-Laws dated December 18, 2003 is incorporated by reference to Exhibit (b)(3) to Post-Effective Amendment No. 51 to the Registration Statement as filed on February 27, 2004.
(3) Not applicable.
(4) Form of Agreement and Plan of Reorganization is filed herein as Appendix G to Part A of this Registration Statement.
(5) Not applicable.
(6) (a) Investment Advisory Agreement dated November 30, 2006 between the Trust and Aston Asset Management LLC is incorporated by reference to Exhibit (d)(1) to Post-Effective Amendment No. 74 to the Registration Statement as filed on November 30, 2006.
(b) Revised Schedules A and B to the Investment Advisory Agreement between the Trust and Aston Asset Management LLC is incorporated by reference to Exhibit (d)(2) to Post-Effective Amendment No. 106 to the Registration Statement as filed on December 30, 2009.
(c) Sub-Investment Advisory Agreement dated October 17, 2007 between Aston Asset Management LLC and ABN AMRO Asset Management, Inc. (currently known as Fortis
2
Investment Management USA, Inc.) is incorporated by reference to Exhibit (d)(5) to Post-Effective Amendment No. 102 to the Registration Statement as filed on February 27, 2009.
(d) Sub-Investment Advisory Agreement dated October 17, 2007 between Aston Asset Management LLC and Montag & Caldwell, Inc. is incorporated by reference to Exhibit (d)(7) to Post-Effective Amendment No. 96 to the Registration Statement as filed on February 28, 2008.
(e) Revised Schedule A to the Sub-Investment Advisory Agreement dated December 20, 2007 between Aston Asset Management LLC and Montag & Caldwell, Inc. is incorporated by reference to Exhibit (d)(4) to Post-Effective Amendment No. 96 to the Registration Statement as filed on February 28, 2008.
(f) Sub-Investment Advisory Agreement dated June 30, 2007 between Aston Asset Management LLC and Tasho Investment, LLC (to be renamed TAMRO Capital Partners, LLC) is incorporated by reference to Exhibit (d)(8) to Post-Effective Amendment No. 96 to the Registration Statement as filed on February 28, 2008.
(g) Amendment to Sub-Investment Advisory Agreement dated June 30, 2007 between Aston Asset Management LLC and TAMRO Capital Partners, LLC (formerly known as Tasho Investment, LLC) is incorporated by reference to Exhibit (d)(7) to Post-Effective Amendment No. 106 to the Registration Statement as filed on December 30, 2009.
(h) Sub-Investment Advisory Agreement dated October 17, 2007 between Aston Asset Management LLC and Veredus Asset Management LLC is incorporated by reference to Exhibit (d)(11) to Post-Effective Amendment No. 102 to the Registration Statement as filed on February 27, 2009.
(i) Sub-Investment Advisory Agreement dated October 17, 2007 between Aston Asset Management LLC and River Road Asset Management, LLC is incorporated by reference to Exhibit (d)(12) to Post-Effective Amendment No. 102 to the Registration Statement as filed on February 27, 2009.
(j) Sub-Investment Advisory Agreement dated October 17, 2007 between Aston Asset Management LLC and River Road Asset Management, LLC is incorporated by reference to Exhibit (d)(13) to Post-Effective Amendment No. 102 to the Registration Statement as filed on February 27, 2009.
(k) Sub-Investment Advisory Agreement dated November 30, 2006 between Aston Asset Management LLC and MFS Institutional Advisors Inc. is incorporated by reference to Exhibit (d)(7) to Post-Effective Amendment No. 74 to the Registration Statement as filed on November 30, 2006.
(l) Revised Schedule B dated March 1, 2007 to the Sub-Investment Advisory Agreement between Aston Asset Management LLC and MFS Institutional Advisors Inc. is incorporated by reference to Exhibit (d)(20) to Post-Effective Amendment no. 81 to the Registration Statement as filed May 9, 2007.
(m) Sub-Investment Advisory Agreement dated November 30, 2006 between Aston Asset Management LLC and Optimum Investment Advisors LP is incorporated by reference to Exhibit (d)(8) to Post-Effective Amendment No. 74 to the Registration Statement as filed November 30, 2006.
3
(n) Revised Schedule B to the Sub-Investment Advisory Agreement between Aston Asset Management LLC and Optimum Investment Advisors, LLC is incorporated by reference to Exhibit (d)(16) to Post-Effective Amendment No. 100 to the Registration Statement as filed on December 30, 2008.
(o) Sub-Investment Advisory Agreement dated December 3, 2008 between Aston Asset Management LLC and Taplin, Canida, and Habacht, LLC is incorporated by reference to Exhibit (d)(18) to Post-Effective Amendment No. 102 to the Registration Statement as filed on February 27, 2009.
(p) Sub-Investment Advisory Agreement dated July 20, 2007 between Aston Asset Management LLC and Neptune Investment Management Limited is incorporated by reference to Exhibit (d)(25) to Post-Effective Amendment No. 84 to the Registration Statement as filed on July 31, 2007.
(q) Sub-Investment Advisory Agreement dated September 7, 2007 between Aston Asset Management LLC and Cardinal Capital Management L.L.C. is incorporated by reference to Exhibit (d)(20) to Post-Effective Amendment No. 96 as filed on February 28, 2008.
(r) Sub-Investment Advisory Agreement dated November 1, 2007 between Aston Asset Management LLC and Baring International Investment Limited is incorporated by reference to Exhibit (d)(23) to Post-Effective Amendment No. 96 as filed on February 28, 2008.
(s) Sub-Investment Advisory Agreement between Aston Asset Management LLC and New Century Capital Management, LLC is incorporated by reference to Exhibit (d) (24) to Post-Effective Amendment No. 99 to the Registration Statement as filed on June 13, 2008.
(t) Sub-Investment Advisory Agreement dated January 7, 2008 between Aston Asset Management LLC and Smart Portfolios, LLC is incorporated by reference to Exhibit (d)(25) to Post-Effective Amendment No. 96 as filed on February 28, 2008.
(u) Sub-Investment Advisory Agreement dated June 1, 2009 between Aston Asset Management LLC and M.D. Sass Investors Services, Inc. is incorporated by reference to Exhibit (d)(21) to Post-Effective Amendment No. 106 to the Registration Statement as filed on December 30, 2009.
(v) Sub-Investment Advisory Agreement between Aston Asset Management and Lake Partners, Inc. is incorporated by reference to Exhibit (d)(22) to Post-Effective Amendment No. 106 to the Registration Statement as filed on December 30, 2009.
(w) Amendment to Sub-Investment Advisory Agreement dated March 30, 2009 between Aston Asset Management and Lake Partners, Inc. is incorporated by reference to Exhibit (d)(23) to Post-Effective Amendment No. 106 to the Registration Statement as filed on December 30, 2009.
(x) Sub-Investment Advisory Agreement dated December 21, 2009 between Aston Asset Management LLC and Fasciano Associates, LLC is incorporated by reference to Exhibit (d)(24) to Post-Effective Amendment No. 106 to the Registration Statement as filed on December 30, 2009.
(7) (a) Distribution Agreement between ABN AMRO Funds (currently known as Aston Funds) and ABN AMRO Distribution Services (USA), Inc. is incorporated herein by reference to Exhibit (e)(1) of Post-Effective Amendment No. 36 to the Registration Statement filed on December 28, 2001.
(b) Amended Schedule A to the Distribution Agreement between ABN AMRO Funds (currently known as Aston Funds) and ABN AMRO Distribution Services (USA), Inc. is incorporated herein by reference to Exhibit (e)(2) of Post-Effective Amendment No. 36 to the Registration Statement filed on December 28, 2001.
4
(c) Amendment No. 1 to Distribution Services Agreement is incorporated herein by reference to Exhibit (e)(3) of Post-Effective Amendment No. 47 to the Registration Statement filed on February 28, 2003.
(d) Amendment No. 2 to Distribution Services Agreement is incorporated herein by reference to Exhibit (e)(4) of Post-Effective Amendment No. 47 to the Registration Statement filed on February 28, 2003.
(e) Amendment No. 3 to Distribution Services Agreement is incorporated herein by reference to Exhibit (e)(5) of Post-Effective Amendment No. 47 to the Registration Statement filed on February 28, 2003.
(f) Form of Revised Schedule A to the Distribution Agreement is filed herewith as Exhibit (7)(f).
(g) ABN AMRO Assignment Agreement is incorporated by reference to Exhibit (e)(9) of Post-Effective Amendment No. 74 to the Registration Statement filed on November 30, 2006.
(h) Form of Selling/Services Agreement for Aston Funds is filed herewith as Exhibit (7)(h).
(i) Mutual Fund Service Agent Agreement for Wrap Processing is incorporated herein by reference to Exhibit (e)(13) to Post-Effective Amendment No. 84 to the Registration Statement as filed on July 31, 2007.
(8) Not applicable.
(9) (a) Custodian Services Agreement dated May 5, 2003 by and between PFPC Trust Company and ABN AMRO Funds (currently known as Aston Funds) is incorporated by reference to Exhibit (g)(9) of Post-Effective Amendment No. 49 as filed on June 30, 2003.
(b) Amendment to the Custodian Services Agreement is incorporated herein by reference to Exhibit (g)(2) of Post-Effective Amendment No. 58 to the Registration Statement as filed on June 23, 2005.
(c) Revised Exhibit A to the Custodian Services Agreement is incorporated by reference to Exhibit (g)(3) to Post-Effective Amendment No. 106 to the Registration Statement as filed on December 30, 2009.
(d) Russian Addendum to the Custodian Services Agreement for Aston/Barings International Fund is incorporated by reference to Exhibit (g)(4) to Post-Effective Amendment No. 102 to the Registration Statement as filed on February 27, 2009.
(e) Russian Addendum to the Custodian Services Agreement for Aston/Neptune International Fund is incorporated by reference to Exhibit (g)(5) to Post-Effective Amendment No. 102 to the Registration Statement as filed on February 27, 2009.
(f) Form of Amendment to the Custodian Services Agreement is filed herewith as Exhibit (9)(f).
(10) (a) Distribution and Services Plan pursuant to Rule 12b-1 is incorporated by reference to Exhibit (m)(1) to Post-Effective Amendment No. 33 to the Registration Statement as filed on September 21, 2001.
5
(b) Amended Schedule A to Distribution and Services Plan pursuant to Rule 12b-1 is incorporated herein by reference to Exhibit (m)(2) of Post-Effective Amendment No. 36 to the Registration Statement filed on December 28, 2001.
(c) Distribution and Services Plan dated June 21, 2001, and amended December 20, 2001 and March 21, 2002, pursuant to Rule 12b-1 is incorporated by reference to Exhibit (m)(3) of Post-Effective Amendment No. 43 to the Registration Statement filed on July 3, 2002.
(d) Revised Schedule A to Distribution and Services Plan pursuant to Rule 12b-1 is incorporated by reference to Exhibit (m)(4) of Post-Effective Amendment to the Registration Statement No. 105 filed on December 18, 2009.
(e) Distribution and Services Plan dated June 20, 2002, pursuant to Rule 12b-1 is incorporated by reference to Exhibit (m)(4) of Post-Effective Amendment No. 43 to the Registration Statement filed on July 3, 2002.
(f) Amended and Restated Distribution and Services Plan pursuant to Rule 12b-1 is incorporated by reference to Exhibit (m)(2) to Post-Effective Amendment No. 33 to the Registration Statement as filed on September 21, 2001.
(g) Amended and Restated Distribution and Plan pursuant to Rule 12b-1 is incorporated by reference to Exhibit (m)(10) of Post-Effective Amendment No. 45 to the Registration Statement filed on October 28, 2002.
(h) 18f-3 plan is incorporated by reference to Exhibit (n) to Post-Effective Amendment No. 33 to the Registration Statement as filed on September 21, 2001.
(i) Amended Schedule A to 18f-3 Plan is incorporated herein by reference to Exhibit (n)(2) of Post-Effective Amendment No. 36 to the Registration Statement filed on December 28, 2001.
(j) Amended Schedule A to 18f-3 Plan is incorporated by reference to Exhibit (n)(3) of Post-Effective Amendment No. 43 to the Registration Statement filed on July 3, 2002.
6
(k) Amended Multiple Class Plan Pursuant to Rule 18f-3 is incorporated by reference to Exhibit (n)(4) of Post-Effective Amendment No. 43 to the Registration Statement filed on July 3, 2002.
(l) Amended Multiple Class Plan pursuant to Rule 18f-3 is incorporated by reference to Exhibit (n)(5) of Post-Effective Amendment No. 45 to the Registration Statement filed on October 28, 2002.
(m) Amended Schedule A to the 18f-3 Plan is incorporated by reference to Exhibit (n)(6) to Post-Effective Amendment No. 105 to the Registration Statement as filed on December 18, 2009.
(11) Opinion of Vedder Price P.C. is filed herewith as Exhibit (11).
(12) Form of Tax Opinion of Vedder Price P.C. is filed herewith as Exhibit (12).
(13) (a) Transfer Agency Services Agreement between Alleghany Funds (currently known as Aston Funds) and PFPC, Inc. (currently known as PNC Global Investment Servicing (U.S.) Inc.), dated April 1, 2000, is incorporated herein by reference to Exhibit (h)(1) of Post-Effective Amendment No. 22 to the Registration Statement as filed on June 30, 2000.
(b) Amendment No. 1 to the Transfer Agency Services Agreement is incorporated herein by reference to Exhibit (h)(2) of Post-Effective Amendment No. 22 to the Registration Statement as filed on June 30, 2000.
(c) Amendment No. 2 to the Transfer Agency Services Agreement is incorporated herein by reference to Post-Effective Amendment No. 26 to the Registration Statement as filed on March 1, 2001.
(d) Amendment No. 3 to the Transfer Agency Services Agreement is incorporated by reference to Exhibit (h)(4) to Post-Effective Amendment No. 51 to the Registration Statement as filed on February 27, 2004.
(e) Amendment No. 4 to the Transfer Agency Services Agreement is incorporated by reference to Exhibit (h)(5) to Post-Effective Amendment No. 51 to the Registration Statement as filed on February 27, 2004.
(f) Amendment No. 5 to the Transfer Agency Services Agreement is incorporated by reference to Exhibit (h)(6) to Post-Effective Amendment No. 51 to the Registration Statement as filed on February 27, 2004.
(g) Amendment No. 6 to the Transfer Agency Services Agreement is incorporated by reference to Exhibit (h)(7) to Post-Effective Amendment No. 51 to the Registration Statement as filed on February 27, 2004.
(h) Compliance Support Services Amendment to Transfer Agency Services Agreement is incorporated herein by reference as Exhibit (h)(9) of Post-Effective Amendment No. 55 to the Registration Statement filed on December 29, 2004.
(i) Anti-Money Laundering and Privacy Amendment to the Transfer Agency Services Agreement is incorporated herein by reference to Exhibit (h)(9) to Post-Effective Amendment No. 56 to the Registration Statement as filed on February 25, 2005.
7
(j) Customer Identification Services Amendment to Transfer Agency Services Agreement is incorporated herein by reference to Exhibit (h)(10) to Post-Effective Amendment No. 56 to the Registration Statement as filed on February 25, 2005.
(k) Amendment to the Transfer Agency Services Agreement is incorporated herein by reference to Exhibit (h)(12) to Post-Effective Amendment No. 58 to the Registration Statement as filed on June 23, 2005.
(l) Section 312 Foreign Financial Institution Amendment to the Transfer Agency Services Agreement is incorporated by reference to Exhibit (h)(15) of Post-Effective Amendment No. 76 to the Registration Statement as filed on December 22, 2006.
(m) Form of Revised Exhibit A to the Transfer Agency Services Agreement is filed herewith as Exhibit (13)(m).
(n) Form of Amendment to the Transfer Agency Services Agreement is filed herewith as Exhibit (13)(n).
(o) Amendment to Transfer Agency Agreement Regarding Red Flag Services is incorporated herein by reference to Exhibit (h)(15) of Post-Effective Amendment No. 106 to the Registration Statement filed on December 30, 2009.
(p) Administration Agreement between Alleghany Funds (currently known as Aston Funds) and Alleghany Investment Services, Inc. dated June 7, 1999, is incorporated herein by reference to Exhibit (h) of Post-Effective Amendment No. 17 to the Registration Statement as filed on June 28, 1999.
(q) Amendment No. 1 to the Administration Agreement is incorporated herein by reference to Exhibit (h)(3) of Post-Effective Amendment No. 22 to the Registration Statement as filed on June 30, 2000.
(r) Amendment No. 2 to the Administration Agreement is incorporated herein by reference to Exhibit (h) of Post-Effective Amendment No. 24 to the Registration Statement as filed on December 29, 2000.
(s) Amendment No. 3 to the Administration Agreement is incorporated herein by reference to Exhibit (h)(9) of Post-Effective Amendment No. 36 to the Registration Statement filed on December 28, 2001.
(t) Amendment No. 4 to the Administration Agreement is incorporated herein by reference to Exhibit (h)(10) of Post-Effective Amendment No. 36 to the Registration Statement filed on December 28, 2001.
(u) Amendment No. 5 to the Administration Agreement is incorporated herein by reference to Exhibit (h)(13) of Post-Effective Amendment No. 47 to the Registration Statement filed on February 28, 2003.
(v) Amendment No. 6 to the Administration Agreement is incorporated herein by reference to Exhibit (h)(14) of Post-Effective Amendment No. 47 to the Registration Statement filed on February 28, 2003.
(w) Amendment No. 7 to the Administration Agreement is incorporated herein by reference to Exhibit (h)(15) of Post-Effective Amendment No. 47 to the Registration Statement filed on February 28, 2003.
(x) Amendment No. 8 to the Administration Agreement is incorporated herein by reference to Exhibit (h)(19) of Post-Effective Amendment No. 50 to the Registration Statement filed on December 30, 2003.
8
(y) Amendment No. 9 to the Administration Agreement is incorporated by reference to Exhibit (h)(20) to Post-Effective Amendment No. 51 to the Registration Statement as filed on February 27, 2004.
(z) Amendment No. 10 to the Administration Agreement is incorporated herein by reference to Exhibit (h)(24) of Post-Effective Amendment No. 58 to the Registration Statement filed on June 23, 2005.
(aa) Revised Schedule C to the Administration Agreement is incorporated herein by reference to Exhibit (h)(27) of Post-Effective Amendment No. 106 to the Registration Statement filed on December 30, 2009.
(bb) Sub-Administration and Accounting Services Agreement between Alleghany Investment Services Inc. and PFPC Inc. (currently known as PNC Global Investment Servicing (U.S.) Inc.), dated April 1, 2000, is incorporated herein by reference to Exhibit (h)(4) of Post-Effective Amendment No. 22 to the Registration Statement as filed on June 30, 2000.
(cc) Amendment No. 1 to the Sub-Administration and Accounting Services Agreement is incorporated herein by reference to Exhibit (h)(5) of Post-Effective Amendment No. 22 to the Registration Statement as filed on June 30, 2000.
(dd) Amendment No. 2 to the Sub-Administration and Accounting Services Agreement is incorporated herein by reference to Post-Effective Amendment No. 26 to the Registration Statement as filed on March 1, 2001.
(ee) Amendment No. 3 to the Sub-Administration and Accounting Services Agreement is incorporated by reference to Exhibit (h)(24) to Post-Effective Amendment No. 56 to the Registration Statement as filed on February 25, 2005.
(ff) Amendment No. 4 to the Sub-Administration and Accounting Services Agreement is incorporated by reference to Exhibit (h)(25) to Post-Effective Amendment No. 56 to the Registration Statement as filed on February 25, 2005.
(gg) Amendment No. 5 to the Sub-Administration and Accounting Services Agreement is incorporated by reference to Exhibit (h)(26) to Post-Effective Amendment No. 56 to the Registration Statement as filed on February 25, 2005.
(hh) Amendment No. 6 to the Sub-Administration and Accounting Services Agreement is incorporated by reference to Exhibit (h)(27) to Post-Effective Amendment No. 56 to the Registration Statement as filed on February 25, 2005.
(ii) Amendment to Sub-Administration and Accounting Services Agreement is incorporated by reference to Exhibit (h)(29) to Post-Effective Amendment No. 56 to the Registration Statement as filed on February 25, 2005.
(jj) Amendment to the Sub-Administration and Accounting Services Agreement is incorporated herein by reference to Exhibit (h)(35) of Post-Effective Amendment No. 58 to the Registration Statement filed on June 23, 2005.
(kk) Amendment to the Sub-Administration and Accounting Services Agreement is incorporated by reference to Exhibit (h)(35) to Post-Effective Amendment No. 102 to the Registration Statement as filed on February 27, 2009.
9
(ll) Amendment to the Sub-Administration and Accounting Services Agreement is incorporated by reference to Exhibit (h)(36) to Post-Effective Amendment No. 104 to the Registration Statement as filed on October 5, 2009.
(mm) Revised Schedule B to the Sub-Administration and Accounting Services Agreement is incorporated herein by reference to Exhibit (h)(36) of Post-Effective Amendment No. 97 to the Registration Statement filed on February 28, 2008.
(nn) Revised Exhibit A to the Sub-Administration and Accounting Services Agreement is incorporated herein by reference to Exhibit (h)(40) of Post-Effective Amendment No. 106 to the Registration Statement filed on December 30, 2009.
(oo) Form of Amendment to the Sub-Administration and Accounting Services Agreement is filed herewith as Exhibit (13)(oo).
(14) Consent of Certified Public Accountants is filed herewith as Exhibit (14).
(15) Not applicable.
(16) (a) Power of Attorney dated December 21, 2006 is incorporated herein by reference to Exhibit (o)(1) to Post-Effective Amendment No. 74 to the Registration Statement filed on December 22, 2006.
(b) Power of Attorney dated December 6, 2009 is incorporated herein by reference to Exhibit (16)(b) to an initial Registration Statement filed on Form N-14 on December 21, 2009.
(1) The undersigned registrant agrees that prior to any public reoffering of the securities registered through the use of a prospectus which is a part of this registration statement by any person or party who is deemed to be an underwriter within the meaning of Rule 145(c) of the Securities Act, the reoffering prospectus will contain the information called for by the applicable registration form for reofferings by persons who may be deemed underwriters, in addition to the information called for by the other items of the applicable form.
(2) The undersigned registrant agrees that every prospectus that is filed under paragraph (1) above will be filed as a part of an amendment to the registration statement and will not be used until the amendment is effective, and that, in determining any liability under the 1933 Act, each post-effective amendment shall be deemed to be a new registration statement for the securities offered therein, and the offering of the securities at that time shall be deemed to be the initial bona fide offering of them.
10
SIGNATURES
As required by the Securities Act of 1933, this Registration Statement has been signed on behalf of the registrant, in the city of Chicago, the State of Illinois on the 7th day of January, 2010.
| | |
ASTON FUNDS (formerly known as ABN AMRO Funds) |
| |
| By: | | /s/ KENNETH ANDERSON |
| | Kenneth C. Anderson, President & Chief Executive Officer |
As required by the Securities Act of 1933, this Registration Statement has been signed by the following persons in the capacities and on the dates indicated.
| | | | |
Signature | | Capacity | | Date |
| | |
STUART D. BILTON* Stuart D. Bilton | | Chairman, Board of Trustees | | January 7, 2010 |
| | |
GREGORY T. MUTZ* Gregory T. Mutz | | Trustee | | January 7, 2010 |
| | |
LEONARD F. AMARI* Leonard F. Amari | | Trustee | | January 7, 2010 |
| | |
ROBERT B. SCHERER* Robert B. Scherer | | Trustee | | January 7, 2010 |
| | |
DENIS SPRINGER* Denis Springer | | Trustee | | January 7, 2010 |
| | |
/s/ KENNETH ANDERSON Kenneth C. Anderson | | President (Chief Executive Officer) | | January 7, 2010 |
| | |
/s/ GERALD DILLENBURG Gerald F. Dillenburg | | Secretary, Treasurer and Senior Vice President (Chief Financial Officer, Chief Operating Officer and Chief Compliance Officer) | | January 7, 2010 |
| | |
/s/ GERALD DILLENBURG Gerald F. Dillenburg | | Attorney-in-Fact | | January 7, 2010 |
| * | Signed by Gerald F. Dillenburg pursuant to a Power of Attorney filed in the initial Registration Statement filed on Form N-14 on December 21, 2009. |
11
EXHIBIT INDEX
| | |
| (7)(f) | | Form of Revised Schedule A to the Distribution Agreement. |
| |
| (7)(h) | | Form of Selling/Services Agreement for Aston Funds. |
| |
| (9)(f) | | Form of Amendment to the Custodian Services Agreement. |
| |
| (11) | | Opinion of Vedder Price P.C. |
| |
| (12) | | Form of Tax Opinion of Vedder Price P.C. |
| |
| (13)(m) | | Form of Revised Exhibit A to the Transfer Agency Services Agreement. |
| |
| (13)(n) | | Form of Amendment to the Transfer Agency Services Agreement. |
| |
| (13)(oo) | | Form of Amendment to the Sub-Administration and Accounting Services Agreement. |
| |
| (14) | | Consent of Certified Public Accountants. |
12