As filed with the Securities and Exchange Commission on January 30, 2013
File No. 333-
SECURITIES AND EXCHANGE COMMISSION
Washington, D.C. 20549
FORM N-14
REGISTRATION STATEMENT
UNDER
THE SECURITIES ACT OF 1933
¨ Pre-Effective Amendment No.
¨ Post-Effective Amendment No.
ASTON FUNDS
(Exact Name of Registrant as Specified in Charter)
120 North LaSalle Street
Chicago, Illinois 60602
(Address of Principal Executive Offices, including Zip Code)
Registrant’s Telephone Number, including Area Code (312) 268-1400
Copy to:
| | |
(Name and Address of Agent for Service) Kenneth C. Anderson, President Aston Funds 120 North LaSalle Street Chicago, Illinois 60602 | | Copy to: Deborah Bielicke Eades Vedder Price P.C. 222 North LaSalle Street Chicago, Illinois 60601 |
Approximate date of proposed public offering: As soon as practicable after the effective date of this Registration Statement.
TITLE OF SECURITIES BEING REGISTERED: Shares of Beneficial Interest (no par value per share) of the Registrant.
No filing fee is required because of reliance on Section 24(f) and an indefinite number of shares have previously been registered pursuant to Rule 24f-2 under the Investment Company Act of 1940.
The Registrant hereby amends this Registration Statement on such date or dates as may be necessary to delay its effective date until the Registrant shall file a further amendment that specifically states that this Registration Statement shall thereafter become effective in accordance with Section 8(a) of the Securities Act of 1933 or until the Registration Statement shall become effective on such date as the Commission, acting pursuant to said Section 8(a), may determine.
, 2013
Dear Fellow Shareholder:
ASTON Small Cap Fund (formerly, ASTON/Veredus Small Cap Growth Fund) (the “Target Fund”), a series of Aston Funds (the “Trust”), a Delaware statutory trust, will hold a Meeting of Shareholders at [BNY Mellon Investment Servicing (US) Inc., 4400 Computer Drive, Westborough, MA 01581] on [April , 2013] at [10:00 a.m.] [Eastern Time] (the “Special Meeting”).
The purpose of the Special Meeting is to consider the approval of an Agreement and Plan of Reorganization (and the related transactions) which provides for (i) the transfer of all the assets of the Target Fund to ASTON/LMCG Small Cap Growth Fund (formerly, ASTON Small Cap Growth Fund) (the “Acquiring Fund”) in exchange solely for shares of beneficial interest of the Acquiring Fund and the assumption by the Acquiring Fund of all the liabilities of the Target Fund; and (ii) the distribution by the Target Fund of all the shares of each class of the Acquiring Fund received by the Target Fund to the holders of shares of the corresponding class of the Target Fund in complete liquidation and termination of the Target Fund.
We encourage you to read the Questions and Answers section and the full text of the enclosed Proxy Statement/Prospectus.
The Board of Trustees has approved this proposal and urges you to vote “FOR” the proposal.
YOUR VOTE IS IMPORTANT! Please review the attached Proxy Statement/Prospectus carefully. Enclosed is a proxy card that we ask you to complete, sign, date and return as soon as possible in the postage-paid envelope. You may also vote by telephone or over the Internet using the toll-free telephone number or web address printed on your proxy card.
Effective January 31, 2013, Lee Munder Capital Group, LLC (“LMCG”) was appointed as subadviser to the Target Fund. The enclosed document also provides information about LMCG and the new subadvisory agreement for the Fund between LMCG and Aston Asset Management, LP.
Thank you for your attention and your vote with regard to this important proposal. Please call proxy services at (866) 880-8631 if you need more information. Thank you for your response, and we look forward to serving your future investment needs.
|
| Sincerely, |
|
| Kenneth C. Anderson |
| President |
Important Information for
ASTON Small Cap Fund Shareholders
At a Special Meeting of shareholders of ASTON Small Cap Fund (formerly, ASTON/Veredus Small Cap Growth Fund) (the “Target Fund”), a series of Aston Funds (the “Trust”), you will be asked to vote on an important change affecting your fund. The purpose of the Special Meeting is to allow you to vote on the reorganization of your fund into ASTON/LMCG Small Cap Growth Fund (formerly, ASTON Small Cap Growth Fund) (the “Acquiring Fund”). If the reorganization is approved and completed, you will become a shareholder of the Acquiring Fund. The Target Fund and the Acquiring Fund are referred to herein collectively as the “Funds” and each individually as a “Fund.”
Although we recommend that you read the full text of the enclosed Proxy Statement/Prospectus, for your convenience, below is a brief overview of the proposal presented to shareholders for a vote.
| Q. | Why am I receiving this Proxy Statement/Prospectus? |
| A. | The shareholders of the Target Fund are being asked to approve a reorganization between the Target Fund and the Acquiring Fund pursuant to an Agreement and Plan of Reorganization entered into by the Trust, on behalf of the Target Fund and the Acquiring Fund (the “Agreement”), which is summarized below. |
| Q. | Why has the reorganization been proposed for the Target Fund? |
| A. | The proposed reorganization is intended to consolidate funds that have substantially similar investment objectives and investment policies, and, as of the date of this Proxy Statement/Prospectus, the same subadviser. The reorganization may result in lower operating expenses, taking into account the lower expense limitation in effect for the Acquiring Fund. In addition, the combination of two funds of relatively small sizes may result in economies of scale. |
| Q. | What are the similarities between the investment objectives and principal investment strategies of the Funds? |
| A. | The Target Fund and the Acquiring Fund have substantially similar objectives and principal investment strategies. The Acquiring Fund seeks to provide long-term capital appreciation, and the Target Fund seeks to provide capital appreciation. Under normal conditions, both Funds invest at least 80% of their assets in common stocks and other equity securities of small-cap companies. The Acquiring Fund defines small-cap companies as companies with a market capitalization of less than $3.0 billion at the time of acquisition. The Target Fund defines small-cap companies as those with a market capitalization of less than $2.5 billion at the time of acquisition. |
| Q. | What will happen if shareholders do not approve the reorganization? |
| A. | If the reorganization is not approved by shareholders, the Board of Trustees of the Trust (the “Board”) will take such actions as it deems to be in the best interests of the Target Fund, which may include additional solicitation, continuing to operate the Target Fund as a stand-alone fund or liquidating the Target Fund. |
| Q. | Will Target Fund shareholders receive new shares in exchange for their current shares? |
| A. | Yes. If shareholders approve the reorganization and it is completed, each Target Fund shareholder will receive shares of the Acquiring Fund in an amount equal in total value to the total value of the Target Fund shares surrendered by such shareholder. |
| Q. | Will this reorganization create a taxable event for me? |
| A. | No. The reorganization is intended to qualify as a tax-free reorganization for federal income tax purposes. It is expected that you will recognize no gain or loss for federal income tax purposes as a direct result of the reorganization. |
| Q. | How do total operating expenses compare between the two Funds? |
| A. | The management fee rate is the same for both Funds, and the Funds have the same fee structure with respect to distribution and service fees. As of October 31, 2012, the Target Fund’s total gross expense ratio was lower than the total gross expense ratio of the Acquiring Fund, due to its larger asset size; however, the Acquiring Fund’s net expense ratio was lower as a result of a lower contractual expense cap currently in effect for the Acquiring Fund. If the reorganization is completed, the net expense ratio of the combined fund is expected to be lower than the net expense ratio of the Target Fund for both share classes at least through the duration of the contractual fee waiver applicable to the Acquiring Fund, which remains in effect through February 28, 2014. |
| Q. | Who will bear the costs of the reorganization? |
| A. | Generally, each of the Target Fund and the Acquiring Fund will bear its own expenses related to the reorganization (whether or not the reorganization is consummated), including legal and accounting fees and expenses, provided that Aston Asset Management, LP (“Aston”) will reimburse the Funds for expenses in connection with the reorganization to the extent that such expenses cause total operating expenses of a Fund to exceed contractual operating expense caps currently in effect. It is expected that both Funds will be operating at expense levels exceeding their respective contractual expense limitations, thus resulting in Aston reimbursing the Funds for all direct expenses related to the reorganization. The Funds will bear all indirect costs such as brokerage and trading costs in connection with any portfolio repositioning. |
| Q. | When would the reorganization take place? |
| A. | If approved by Target Fund shareholders at the Special Meeting to be held on April , 2013, the reorganization would occur on or about , 2013, or as soon as reasonably practicable after shareholder approval is obtained. |
| Q. | Will a proxy firm be engaged for the proxy solicitation? Will Aston contact me? |
| A. | Yes. Computershare Fund Services will be engaged for the proxy solicitation. Shareholders of the Target Fund may be contacted by Aston personnel, in addition to the proxy solicitation firm. |
| Q. | Whom do I call for more information? |
| A. | Please call Computershare Fund Services’ Shareholder Services toll free at (866) 880-8631. |
| Q. | How do I vote my shares? |
| A. | You may vote by telephone or by Internet, as described below. |
| | |
| To vote by Telephone: | | To vote by Internet: |
(1) Read the Proxy Statement/Prospectus and have your proxy card at hand. | | (1) Read the Proxy Statement/Prospectus and have your proxy card at hand. |
| |
(2) Call the toll-free number that appears on your proxy card. | | (2) Go to the website that appears on your proxy card. |
| |
(3) Enter the control number set forth on the proxy card and follow the simple instructions. | | (3) Enter the control number set forth on the proxy card and follow the simple instructions. |
| Q. | How does the Board suggest that I vote? |
| A. | After careful consideration, the Board has determined that the reorganization is in the best interests of your Fund and recommends that you vote “FOR” the reorganization. |
| | Your vote is very important. We encourage you as a shareholder to participate in your Fund’s governance by returning your vote as soon as possible. If enough shareholders fail to cast their votes, your Fund may not be able to hold its meeting or the vote on the reorganization, and will be required to incur additional solicitation costs in order to obtain sufficient shareholder participation. |
, 2013
ASTON Small Cap Fund
NOTICE OF SPECIAL MEETING OF SHAREHOLDERS
TO BE HELD ON APRIL , 2013
To the Shareholders of ASTON Small Cap Fund:
Notice is hereby given that a special meeting of shareholders of ASTON Small Cap Fund (formerly, ASTON/Veredus Small Cap Growth Fund) (the “Target Fund”), a series of Aston Funds (the “Trust”), a Delaware statutory trust, will be held at [BNY Mellon Investment Servicing (US) Inc., 4400 Computer Drive, Westborough, MA 01581] on April [__], 2013 at [10:00 a.m.] [Eastern Time] (the “Special Meeting”), for the following purposes:
1. To approve an Agreement and Plan of Reorganization (and the related transactions) which provides for (i) the transfer of all the assets of the Target Fund to ASTON/LMCG Small Cap Growth Fund (formerly, ASTON Small Cap Growth Fund) (the “Acquiring Fund”) in exchange solely for shares of beneficial interest of the Acquiring Fund and the assumption by the Acquiring Fund of all the liabilities of the Target Fund; and (ii) the distribution by the Target Fund of all the shares of each class of the Acquiring Fund received by the Target Fund to the holders of shares of the corresponding class of the Target Fund in complete liquidation and termination of the Target Fund.
2. To transact such other business as may properly come before the Special Meeting including whether or not to adjourn the Special Meeting, and any adjournment or postponement of the Special Meeting.
The Board of Trustees of the Trust has fixed the close of business on , 2013 as the record date for the determination of shareholders entitled to notice of and to vote at the Special Meeting or any adjournment thereof. The persons named as proxies will vote in their discretion on any other business that may properly come before the Special Meeting or any adjournments or postponements thereof.
|
By Order of the Board of Trustees, Gerald F. Dillenburg Senior Vice President and Secretary |
Shareholders are requested to execute and return promptly the accompanying proxy card, which is being solicited by the Board of Trustees of the Trust. You may execute the proxy card using the methods described in the proxy card. Executing the proxy card is important to ensure a quorum at the Special Meeting. Shareholders also have the option to provide their vote by telephone or over the Internet by following the instructions accompanying the proxy card. Proxies may be revoked at any time before they are exercised by submitting a written notice of revocation or a subsequently executed proxy or by attending the Special Meeting and voting in person.
INSTRUCTIONS FOR VOTING
The following general rules apply to voting by mail and will help you properly sign your proxy card. Please read them carefully, because if you do not sign your proxy card properly your vote will be invalidated.
1. Individual Accounts: Sign your name exactly as it appears in the registration on the proxy card.
2. Joint Accounts: Both parties must sign, and the name of each party signing should conform exactly to the name shown in the registration on the proxy card.
3. All Other Accounts: The capacity of the individual signing the proxy card should be indicated unless it is reflected in the form of registration. For example:
| | | | |
| Registration | | Valid Signature |
|
| Corporate Accounts |
| (1) | | ABC Corp. | | ABC Corp. by John Doe, Treasurer |
| (2) | | ABC Corp. | | |
| | John Doe, Treasurer | | John Doe |
| (3) | | ABC Corp. Profit Sharing Plan | | John Doe |
|
| Trust Accounts |
| (1) | | ABC Trust | | Jane B. Doe, Trustee |
| (2) | | Jane B. Doe, Trustee | | |
| | u/t/d 12/28/78 | | Jane B. Doe |
|
| Custodial or Estate Accounts |
| (1) | | John B. Smith, Cust. | | |
| | f/b/o John B. Smith, Jr. UGMA | | John B. Smith |
| (2) | | Estate of John B. Smith | | John B. Smith, Jr., Executor |
Rather than mailing in your proxy, you may vote by telephone or over the Internet using the toll-free telephone number or web address printed on your proxy card. These options require you to input the control number located on your proxy card. After inputting the control number, you may enter your vote on the proposal. You will have an opportunity to review your vote and make any necessary changes before submitting your vote.
Proxy Statement/Prospectus and
Information Statement
Dated , 2013
Relating to the Acquisition of the Assets and Liabilities of
ASTON Small Cap Fund (formerly, ASTON/Veredus Small Cap Growth)
This Proxy Statement/Prospectus is furnished in connection with the solicitation of proxies by the Board of Trustees (the “Board”) of Aston Funds, a Delaware statutory trust (the “Trust”), on behalf of ASTON Small Cap Fund (the “Target Fund”), for use at a special meeting of shareholders of the Target Fund to be held at [BNY Mellon Investment Servicing (US) Inc., 4400 Computer Drive, Westborough, MA 01581] and at any and all adjournments or postponements thereof (the “Special Meeting”). This document also serves as an Information Statement with respect to the appointment of Lee Munder Capital Group, LLC (“LMCG”) as subadviser to the Target Fund, effective as of January 31, 2013.
The purpose of the Special Meeting is to consider the proposed reorganization (the “Reorganization”) of the Target Fund into ASTON/LMCG Small Cap Growth Fund (formerly, ASTON Small Cap Growth Fund) (the “Acquiring Fund”), another series of the Trust. The Target Fund and the Acquiring Fund are referred to herein collectively as the “Funds” and each individually as a “Fund.” Each Fund is a series of the Trust, an open-end, registered management investment company. If shareholders of the Target Fund approve the Reorganization and it is completed, each shareholder of the Target Fund will receive shares of the corresponding class of the Acquiring Fund with the same total value as the total value of the Target Fund shares surrendered by such shareholders. The Board has determined that the Reorganization is in the best interests of the Target Fund.
The address of the principal executive office and telephone number of the Funds and the Trust is 120 North LaSalle Street, Chicago, Illinois 60602, (312) 268-1400.
The enclosed proxy and this Proxy Statement/Prospectus and Information Statement are first being sent to shareholders of the Target Fund on or about March , 2013. Shareholders of record as of the close of business on , 2013 are entitled to vote at the Special Meeting and any adjournment or postponement thereof with respect to the Reorganization. In reliance on a manager-of-managers exemptive order governing the “manager-of-managers” structure under which the Funds operate, the Target Fund is not seeking your proxy or vote with respect to the appointment of LMCG as subadviser to the Target Fund.
The securities offered by this Proxy Statement/Prospectus have not been approved or disapproved by the Securities and Exchange Commission (“SEC”), nor has the SEC passed upon the accuracy or adequacy of this Proxy Statement/Prospectus. Any representation to the contrary is a criminal offense.
This Proxy Statement/Prospectus explains concisely what you should know before voting on the Reorganization (in effect, investing in Class N and Class I shares of the Acquiring Fund) and constitutes an offering of Class N and Class I shares of beneficial interest, no par value per share, of the Acquiring Fund. Please read it carefully and retain it for future reference.
The following documents have been filed with the SEC and are incorporated into this Proxy Statement/Prospectus by reference:
| | (i) | the Trust’s prospectus dated February 28, 2013 relating to the Acquiring Fund, which accompanies this Proxy Statement/Prospectus; |
| | (ii) | the Trust’s prospectus dated February 28, 2013 relating to the Target Fund; |
| | (iii) | the Statement of Additional Information relating to the proposed Reorganization, dated , 2013 (the “Reorganization SAI”); |
| | (iv) | the Trust’s statement of additional information dated February 28, 2013 relating to the Funds; |
| | (v) | the audited financial statements of the Acquiring Fund contained in the Trust’s Annual Report for the fiscal year ended October 31, 2012; and |
| | (vi) | the audited financial statements of the Target Fund contained in the Trust’s Annual Report for the fiscal year ended October 31, 2012. |
No other parts of the documents referenced above are incorporated by reference herein.
The financial highlights of the Acquiring Fund contained in the Trust’s Annual Report for the fiscal year ended October 31, 2012 are attached as Appendix B to this Proxy Statement/Prospectus.
Copies of the foregoing may be obtained without charge by calling or writing the Funds at the telephone number or address shown below. If you wish to request the Reorganization SAI, please ask for the “Reorganization SAI.” In addition, the Acquiring Fund will furnish, without charge, a copy of its most recent annual report and subsequent semi-annual report to a shareholder upon request. You may request any of the foregoing by calling (800) 992-8151 or by writing to Aston Funds at P.O. Box 9765, Providence, RI 02940.
The Trust is subject to the informational requirements of the Securities Exchange Act of 1934, as amended, and the Investment Company Act of 1940, as amended, and in accordance therewith files reports and other information with the SEC. Reports, proxy statements, registration statements and other information filed by the Trust (including the Registration Statement relating to the Acquiring Fund on Form N-14 of which this Proxy Statement/Prospectus is a part) may be inspected without charge and copied (for a duplication fee at prescribed rates) at the SEC’s Public Reference Room at 100 F Street, N.E., Washington, D.C. 20549 or at the SEC’s Northeast Regional Office (3 World Financial Center, New York, New York 10281) or Midwest Regional Office (175 W. Jackson Boulevard, Suite 900, Chicago, Illinois 60604). You may call the SEC at (202) 551-8090 for information about the operation of the Public Reference Room. You may obtain copies of this information, with payment of a duplication fee, by electronic request at the following e-mail address: publicinfo@sec.gov, or by writing the SEC’s Public Reference Branch, Office of Consumer Affairs and Information Services, Securities and Exchange Commission, Washington, D.C. 20549. You may also access reports and other information about the Funds on the EDGAR database on the SEC’s Internet site at http://www.sec.gov.
-ii-
TABLE OF CONTENTS
-iii-
TABLE OF CONTENTS
(continued)
-iv-
SYNOPSIS
The following is a summary of, and is qualified by reference to, the more complete information contained in this Proxy Statement/Prospectus and the information attached hereto or incorporated herein by reference, including the Agreement and Plan of Reorganization. If the Reorganization is approved and completed, shareholders of the Target Fund will become shareholders of the Acquiring Fund and will cease to be shareholders of the Target Fund.
Shareholders should read the entire Proxy Statement/Prospectus carefully, together with the Trust’s Prospectus relating to the Acquiring Fund that accompanies this Proxy Statement/Prospectus and is incorporated herein by reference. This Proxy Statement/Prospectus constitutes an offering of Class N and Class I shares of the Acquiring Fund.
Background
Prior to January 31, 2013, the Target Fund and the Acquiring Fund were managed by different subadvisers. Todd-Veredus Asset Management LLC (“Todd-Veredus”) served as the Target Fund’s subadviser and Lee Munder Capital Group, LLC (“LMCG”) served as the Acquiring Fund’s subadviser. During the fourth quarter of 2012, Todd-Veredus notified Aston Asset Management, LP (“Aston” or the “Adviser”) of its intention to close the investment strategy for the Target Fund as soon as practicable. As a result, Aston recommended, and the Board of Trustees approved, the appointment of LMCG as subadviser to the Target Fund, effective January 31, 2013 (the “Subadviser Change Date”), in order to provide continuity of portfolio management to the Target Fund utilizing a substantially similar investment style, after Todd-Veredus ceased to serve as subadviser. Simultaneously, Aston recommended the reorganization of the Target Fund into the Acquiring Fund because the reorganization would provide the Target Fund’s shareholders with an investment style that is similar to that of the Target Fund. The consolidation of two substantially similar funds of relatively small sizes may result in a lower total operating expense ratio, taking into account the effect of expense waivers, and may result in economies of scale, which may subsequently lead to additional shareholder purchases and additional economies of scale.
The Reorganization
This Proxy Statement/Prospectus is being furnished to shareholders of the Target Fund in connection with the proposed combination of the Target Fund with and into the Acquiring Fund pursuant to the terms and conditions of an Agreement and Plan of Reorganization dated , 2013 (the “Agreement”), among the Trust, on behalf of the Target Fund and on behalf of the Acquiring Fund, and Aston. The Agreement provides for (i) the transfer of all the assets of the Target Fund to the Acquiring Fund in exchange solely for Class N and Class I shares of beneficial interest, with no par value per share, of the Acquiring Fund and the assumption by the Acquiring Fund of all the liabilities of the Target Fund; and (ii) the distribution by the Target Fund of all the shares of each class of the Acquiring Fund received by the Target Fund to the shareholders of the corresponding class of the Target Fund in complete liquidation and termination of the Target Fund as soon as practicable following the Closing Date (as defined herein).
If shareholders approve the Reorganization and it is completed, Target Fund shareholders will become shareholders of the Acquiring Fund. The Board has determined that the Reorganization is in the best interests of the Target Fund and that the interests of existing shareholders of each Fund will not be diluted as a result of the Reorganization. The Board unanimously approved the Agreement and the transactions contemplated thereunder at an in-person meeting held on December 13, 2012.
The Board is asking shareholders of the Target Fund to approve the Reorganization at the Special Meeting to be held on April , 2013. Approval of the Reorganization requires the affirmative vote of the
1
holders of “a majority of the outstanding voting securities,” as defined by the 1940 Act. See “Voting Information and Requirements” below. The Board recommends that shareholders vote “FOR” the Reorganization.
If shareholders of the Target Fund approve the Reorganization, it is expected that the Reorganization will occur at [9:00 a.m. Central Time] on , 2013 (the “Closing Date”), or as soon as practicable thereafter. If the Reorganization is not approved, the Board will take such action as it deems to be in the best interests of the Target Fund. The Closing Date may be delayed and the Reorganization may be abandoned at any time by the mutual agreement of the parties. In addition, either Fund may at its option terminate the Agreement at or before the Closing Date due to (i) a breach by any other party of any representation, warranty or agreement contained in the Agreement to be performed at or before the Closing Date, if not cured within 30 days, (ii) a condition precedent to the obligations of the terminating party that has not been met and reasonably appears will not or cannot be met, or (iii) a determination by the Board that the consummation of the transactions contemplated by the Agreement is not in the best interests of a Fund.
Board of Trustees Recommendation
The Board believes that the proposed Reorganization would be in the best interests of each Fund. In approving the Reorganization and recommending that shareholders of the Target Fund approve the Reorganization, the Board considered a number of factors in reaching its determination, including the following:
| | • | | the appointment of the Acquiring Fund’s subadviser to serve as subadviser to the Target Fund; |
| | • | | the similarities and differences in the Funds’ investment objectives, principal investment strategies and principal risks; |
| | • | | the Funds’ relative sizes and potential for economies of scale; |
| | • | | the investment performance of the Funds; |
| | • | | the relative fees and expense ratios of the Funds, including the contractual expense caps in place for each Fund; |
| | • | | alternatives to the Reorganization; |
| | • | | the anticipated tax-free nature of the Reorganization; |
| | • | | the expected costs of the Reorganization and the extent to which the Funds would bear any such costs; |
| | • | | the effect of the Reorganization on shareholder services and shareholder rights; and |
| | • | | any potential benefits of the Reorganization to Aston and its affiliates as a result of the Reorganization. |
For a more detailed discussion of the Board’s considerations regarding the approval of the Reorganization, see “The Board’s Consideration of the Reorganization.”
2
Shareholder Information
The Funds have identical procedures for purchasing, exchanging and selling/redeeming shares, and for making distributions. Both Funds offer Class N and Class I shares. The classes of each Fund have the same investment eligibility criteria. See “Comparison of the Funds” below for a more detailed discussion.
Material Federal Income Tax Consequences of the Reorganization
The Reorganization is intended to qualify as a tax-free reorganization for federal income tax purposes. If the Reorganization so qualifies, neither the Target Fund nor its shareholders will recognize any gain or loss as a direct result of the transfers contemplated by the Reorganization. Prior to the Closing Date, the Target Fund will declare a distribution to its shareholders, which together with all previous distributions, will have the effect of distributing to shareholders all its net investment income and realized net capital gains (after reduction by any available capital loss carryforwards), if any, through the Closing Date. Such distribution will be taxable to the Target Fund’s shareholders for federal income tax purposes. As a result of the change in subadviser effective on the Subadviser Change Date, the Target Fund will experience greater than normal portfolio turnover while LMCG repositions the portfolio. A majority of the securities in the Target Fund may be sold between the Subadviser Change Date and the Closing Date as a result of LMCG implementing its investment strategy. Such portfolio turnover will occur whether or not the Reorganization is consummated. Any income or losses realized by the Target Fund as a result of such portfolio turnover may increase or decrease the net investment income and net capital gain to be distributed by the Target Fund. Portfolio turnover as a direct result of the Reorganization is expected to be less than 5% of the assets of the Target Fund. For a more detailed discussion of the federal income tax consequences of the Reorganization, please see “The Proposed Reorganization—Material Federal Income Tax Consequences” below.
COMPARISON OF THE FUNDS
Investment Objectives
The investment objectives of the Funds are substantially similar. The investment objective of the Target Fund is to provide capital appreciation, and the investment objective of the Acquiring Fund is to provide long-term capital appreciation. The investment objective of each Fund is fundamental and may not be changed without shareholder approval.
Investment Strategies
The Target Fund and the Acquiring Fund have substantially similar principal investment strategies. The similarities and differences of the principal investment strategies of the Funds are:
| | | | |
Target Fund | | | | Acquiring Fund |
• Under normal circumstances, the Fund invests at least 80% of its assets in common stock and other equity securities of small-cap companies. The Fund defines a small-cap company as one having a market capitalization of less than $2.5 billion at the time of acquisition. | | | | • Under normal circumstances, the Fund invests at least 80% of its assets in common stock and other equity securities of small-cap companies. The Fund defines a small-cap company as one having a market capitalization of less than $3.0 billion at the time of acquisition. |
3
| | | | |
Target Fund | | | | Acquiring Fund |
• The Fund seeks to invest in growth stocks of small-cap companies whose earnings are growing, or are expected to grow, at an accelerating rate. | | | | • The portfolio manager seeks to achieve above average risk-adjusted returns by identifying unrecognized growth potential. |
| | |
• The portfolio managers look for inefficiencies in the market caused by inaccurate expectations (e.g., positive earnings surprises, estimate revisions). The focus is on companies that have expanding unit volume growth; expanding profit margin potential; high or improving cash flow return on investment; and large markets with high barriers to entry. | | | | • The portfolio manager utilizes a fundamental bottom-up security selection process to identify characteristics such as: revenue growth, margin expansion, surprise potential and strong balance sheets. |
| | |
• The Fund may also invest in equity securities outside the small-cap range. The Fund may invest in exchange-traded funds (“ETFs”), publicly traded partnerships and foreign securities (directly and indirectly through depositary receipts). | | | | • The Fund may also invest in mid-cap stocks, including companies with a market capitalization up to $10 billion at the time of acquisition. |
| | |
• Sector exposure is a residual of the investment process and the Fund may, from time to time, have exposure to a single sector or group of related sectors that react similarly to market, economic or other events. | | | | |
Comparison of Principal Investment Strategies
The investment objectives and principal investment strategies of the Funds are substantially similar. However, there are some differences. Each Fund invests at least 80% of its assets in small-cap companies under normal circumstances. However, the Target Fund defines a small-cap company as one having a market capitalization of less than $2.5 billion at the time of acquisition and the Acquiring Fund defines a small-cap company as one having a market capitalization of less than $3.0 billion at the time of acquisition. Both Funds seek to invest in companies with growth potential. Prior to the Subadviser Change Date, the subadvisers to the Target Fund and the Acquiring Fund were different and each subadviser had different investment processes for selecting securities. However, as of the Subadviser Change Date, the Funds have the same subadviser, and as a result, there is a significant degree of overlap between the portfolio holdings of the Funds as of the date of this Proxy Statement/Prospectus.
While each Fund may invest in companies outside of the small-cap range, the Acquiring Fund may only invest in companies with market capitalization of up to $10 billion. Both Funds may invest in ETFs, publicly-traded partnerships and foreign securities, but the Target Fund may do so as a principal strategy.
The Reorganization may result in one-time brokerage costs for the Target Fund to the extent it is necessary for the Target Fund to sell securities prior to the Reorganization so that the Acquiring Fund’s portfolio immediately following the Reorganization remains in compliance with its investment policies and restrictions. As a result of the subadviser change described above, however, it is expected that the Target Fund will commence repositioning its portfolio as of the Subadviser Change Date and will have sold a material portion of its portfolio as of the date of this Proxy Statement/Prospectus. The repositioning of the portfolio by LMCG is expected to be completed prior to the Closing Date and such portfolio turnover will take place whether or not the Reorganization is consummated. Any portfolio sales that occur prior to the Reorganization, whether as a result of the subadviser change or the Reorganization,
4
may result in taxable distributions to Target Fund shareholders. See “The Proposed Reorganization—Material Federal Income Tax Consequences” below.
Risk Factors
In evaluating the Reorganization, you should consider carefully the risks of the Acquiring Fund. Investing in a mutual fund involves risk, including the risk that you could lose money by investing in a fund. For a complete description of the risks of an investment in the Acquiring Fund, see the section in the Acquiring Fund’s Prospectus entitled “Principal Risks.”
Because the Funds have substantially similar investment strategies, the principal risks of each Fund are substantially similar. The principal risks of investing in the Acquiring Fund are described below.
Growth Style Risk. Growth investing involves buying stocks that have relatively high price-to-earnings ratios. Growth stocks may be more volatile than other stocks because they are generally more sensitive to investor perceptions and market moves. During periods of growth stock underperformance, the Fund’s performance may suffer.
Liquidity Risk. When there is no willing buyer and investments cannot be readily sold at the desired time or price, the Fund may need to accept a lower price or may not be able to sell the security at all. An inability to sell securities can adversely affect the Fund’s value or prevent the Fund from being able to take advantage of other investment opportunities. Less liquid securities are more difficult to dispose of at their recorded values and are subject to increased spreads and volatility.
Manager Risk. The performance of the Fund is dependent upon the investment adviser’s skill in selecting managers and the portfolio manager’s skill in making appropriate investments. As a result, the Fund may underperform its benchmark or its peers.
Market Risk. The Fund’s share price can move down in response to stock market conditions, changes in the economy or changes in a particular company’s stock price. An individual stock may decline in value even when the value of stocks in general is rising.
Portfolio Turnover Risk. Frequent trading of the Fund’s portfolio holdings may result in a higher than average level of capital gains, including short-term gains, and will result in greater transaction costs to the Fund. To the extent distributions to shareholders are made from net short-term capital gains (i.e. net capital gain on securities held or treated as held by the Fund for one year or less minus any net capital losses on securities held or treated as held by the Fund for more than one year), the distributions will be taxed at ordinary income rates for federal income tax purposes, rather than at the lower long-term capital gains rates. Greater transaction costs and higher expenses as a result of portfolio turnover can negatively impact the Fund’s performance.
Small-Cap and Mid-Cap Company Risks. Investing in securities of small-cap and mid-cap companies may involve greater risks than investing in securities of larger, more established issuers. Small-cap and mid-cap companies generally have limited product lines, markets and financial resources. Their securities may trade less frequently and in more limited volume than the securities of larger, more established companies. Also, small-cap and mid-cap companies are typically subject to greater changes in earnings and business prospects than larger companies. As a result, their stock prices may experience greater volatility and may decline significantly in market downturns.
An investment in the Target Fund is also subject to each of the foregoing principal risks. In addition, principal risks of investing in the Target Fund include risks associated with investments in other
5
investment companies, foreign securities and publicly-traded partnerships, as well as sector concentration risk.
Fundamental Investment Restrictions
The Funds have substantially similar fundamental investment restrictions that cannot be changed without shareholder approval. In addition, each Fund is a diversified fund. As diversified funds, each Fund, with respect to 75% of its assets, may not invest more than 5% of its total assets in the securities of any one issuer (other than securities issued by other investment companies or by the U.S. government, its agencies, instrumentalities or authorities) and may not purchase more than 10% of the outstanding voting securities of any one issuer.
Fees and Expenses
The table below provides information about the fees and expenses attributable to each class of shares of the Funds, and the pro forma fees and expenses of the combined fund following the Reorganization. Total Annual Fund Operating Expenses reflect the fees and expenses for the Funds as of their fiscal year ended October 31, 2012, and the pro forma fees and expenses are based on the amounts shown in the table for each Fund, assuming that the Reorganization occurred on October 31, 2012.
Annual Fund Operating Expenses
(expenses that you pay each year as a percentage of the value of your investment)
| | | | | | |
| | | Target
Fund | | Acquiring
Fund | | Combined
Fund Pro
Forma1 |
Management Fees | | | | | | |
Class N | | 1.00% | | 1.00% | | 1.00% |
Class I | | 1.00% | | 1.00% | | 1.00% |
Distribution and Service (12b-1 ) Fees | | | | | | |
Class N | | 0.25% | | 0.25% | | 0.25% |
Class I | | — | | — | | — |
Other Expenses | | | | | | |
Class N | | 0.58% | | 1.61% | | 0.79% |
Class I | | 0.58% | | 1.61% | | 0.79% |
Acquired Fund Fees and Expenses | | | | | | |
Class N | | 0.01% | | 0.01% | | 0.01% |
Class I | | 0.01% | | 0.01% | | 0.01% |
Total Annual Fund Operating Expenses | | | | | | |
Class N | | 1.84% | | 2.87% | | 2.05% |
Class I | | 1.59% | | 2.62% | | 1.80% |
Less Fee Waiver and/or Expense Reimbursement2 | | | | | | |
Class N | | (0.34)% | | (1.51)%3 | | (0.69)% |
Class I | | (0.34)% | | (1.51)%3 | | (0.69)% |
Total Annual Fund Operating Expenses After Fee Waiver and/or Expense Reimbursement | | | | | | |
Class N | | 1.50% | | 1.36% | | 1.36% |
Class I | | 1.25% | | 1.11% | | 1.11% |
| 1 | Gross pro forma expenses include the expenses to be charged to the Funds in connection with the Reorganization. However, it is expected that both Funds will be operating at expense levels exceeding their respective contractual expenses caps, thus resulting in the Adviser reimbursing the Funds for all direct expenses related to the Reorganization. See “The Proposed Reorganization—Reorganization Expenses” for additional information about these expenses. |
| 2 | The Adviser is contractually obligated to waive management fees and/or reimburse ordinary operating expenses, not including investment-related costs (such as brokerage commissions), interest, taxes, extraordinary expenses and |
6
| | acquired fund fees and expenses, through February 28, 2014, to the extent that operating expenses exceed the rates set forth above, as a percentage of each Fund’s average daily net assets with respect to each Fund (the “Operating Expense Limit”). Prior to February 28, 2014, the arrangement may be amended or terminated for a class only by a vote of the Board of Trustees of Aston Funds. |
| 3 | For a period of up to three years from the fiscal year end during which an amount was waived or reimbursed, the Adviser is entitled to be reimbursed by the Fund for fees waived and expenses reimbursed from commencement of operations through the completion of the first three full fiscal years to the extent that the Fund’s Total Annual Operating Expenses for a class, not including investment-related costs (such as brokerage commissions), interest, taxes, extraordinary expenses and acquired fund fees and expenses, remains at or below the Operating Expense Limit after such reimbursement. |
Example
The example below is intended to help you compare the cost of investing in each Fund and the pro forma cost of investing in the combined fund. The example shows the operating expenses you would incur as a shareholder if you invested $10,000 in a Fund over the time periods shown and you redeem all your shares at the end of those periods. The example assumes that the average annual return was 5%, operating expenses remained the same, and expenses were capped for one year in each period. Although your actual costs may be higher or lower, based on these assumptions your costs would be:
| | | | | | |
| | | Target
Fund | | Acquiring
Fund | | Combined
Fund Pro
Forma |
1 Year | | | | | | |
Class N | | $ 153 | | $ 138 | | $ 138 |
Class I | | $ 127 | | $ 113 | | $ 113 |
3 Years | | | | | | |
Class N | | $ 546 | | $ 746 | | $ 576 |
Class I | | $ 469 | | $ 671 | | $ 499 |
5 Years | | | | | | |
Class N | | $ 964 | | $1,380 | | $1,040 |
Class I | | $ 834 | | $1,255 | | $ 910 |
10 Years | | | | | | |
Class N | | $2,131 | | $3,086 | | $2,324 |
Class I | | $1,861 | | $2,842 | | $2,059 |
Portfolio Turnover
Each Fund pays transaction costs, such as commissions, when it buys and sells securities (or “turns over” its portfolio). A higher portfolio turnover may indicate higher transaction costs and may result in higher taxes when shares are held in a taxable account. These costs, which are not reflected in annual fund operating expenses or in the example, affect a Fund’s performance. During the most recent fiscal year for which audited financial statements are available, the Funds had the following portfolio turnover rates:
| | | | |
Fund | | Fiscal Year End | | Rate |
Target Fund | | 10/31/12 | | 158.83% |
Acquiring Fund | | 10/31/12 | | 168.05% |
After the Reorganization is completed, the portfolio manager of the Acquiring Fund may, in his discretion, sell securities acquired from the Target Fund. To the extent that the portfolio manager chooses to sell a significant percentage of such securities, the Acquiring Fund’s portfolio turnover rate and brokerage costs may be higher than they otherwise would have been.
7
Performance Information
A comparison of the total returns of the Funds for the periods ended December 31, 2012, based on historical fees and expenses for each period, is set forth in the chart and tables below.
The bar chart shows how the performance of the Class N shares of each Fund has varied from year to year for the periods shown. Class N shares and Class I shares are invested in the same portfolio of securities, so the annual returns would differ only to the extent that the classes have different expenses. The annual returns of the Class I shares would be higher than the returns of the Class N shares due to 12b-1 fees paid with respect to Class N shares. This information may help illustrate the risks of investing in the Funds. The Funds make updated performance information available on the Funds’ website, www.astonfunds.com, or by calling 800-992-8151. As with all mutual funds, past performance (before and after taxes) does not guarantee future performance.
8
Target Fund*
Class N Annual Total Return
| * | During the periods shown in the above chart, Todd-Veredus Asset Management LLC or Veredus Asset Management LLC served as subadviser to the Fund. Accordingly, returns may have differed had the current subadviser been in place. |
During the periods shown in the bar chart, the Target Fund’s highest and lowest calendar quarter returns were 30.94% and -28.07%, respectively, for the quarters ended September 30. 2009 and September 30, 2011.
Acquiring Fund*
Class N Annual Total Return
| * | The Acquiring Fund commenced operations November 3, 2010. Prior to February 17, 2012, another firm served as subadviser to the Fund. However, the same portfolio manager has been in place since the Fund’s inception. |
During the periods shown in the bar chart, the Acquiring Fund’s highest and lowest calendar quarter returns were 16.15% and -27.36%, respectively, for the quarters ended March 31, 2012 and September 30, 2011.
9
The following tables indicate how each Fund’s average annual returns for different calendar periods compared to the returns of a broad-based securities market index.
| | | | | | | | |
| | | Average Annual Total Returns for the
Periods Ended December 31, 2012* |
Target Fund | | 1 Year | | 5 Years | | 10 Years | | Since
Inception |
Class N Shares (Inception 6/30/98) | | | | | | | | |
Return Before Taxes | | 10.75% | | (1.35)% | | 6.19% | | 6.71% |
Return After Taxes on Distributions | | 10.75% | | (1.38)% | | 5.36% | | 5.40% |
Return After Taxes on Distributions and Sale of Fund Shares | | 6.99% | | (1.16)% | | 5.21% | | 5.33% |
Class I (Inception 10/05/01) | | | | | | | | |
Return Before Taxes | | 11.11% | | (1.09)% | | 6.48% | | 1.12% |
Russell 2000 Growth Index (Reflects no deduction for taxes, expenses or fees. Index return for Class I shares, since inception, computed from September 30, 2001, is 7.44%.) | | 14.59% | | 3.49% | | 9.80% | | 3.80% |
| * | From the inception of the Fund through January 31, 2013, Todd-Veredus Asset Management LLC or Veredus Asset Management, LLC served as subadviser to the Fund. Accordingly, returns may have differed had the current subadviser been in place. |
| | | | |
| | | Average Annual Total Returns for the
Periods Ended December 31, 2012** |
Acquiring Fund | | 1 Year | | Since Inception |
Class N Shares (Inception 11/03/10) | | | | |
Return Before Taxes | | 24.18% | | 9.09% |
Return After Taxes on Distributions | | 21.31% | | 7.92% |
Return After Taxes on Distributions and Sale of Fund Shares | | 16.07% | | 7.16% |
Class I (Inception 6/01/11) | | | | |
Return Before Taxes | | 24.43% | | (1.43)% |
Russell 2000 Growth Index (Reflects no deduction for taxes, expenses or fees. Index return since inception for Class N shares is computed from October 31, 2010. Index return for Class I shares, since inception, computed from May 31, 2011, is 0.16%.) | | 14.59% | | 10.81% |
| ** | Prior to February 17, 2012, a different investment manager served as subadviser to the Fund. However, the portfolio manager of the Fund has been in place since the Fund’s inception. |
Investment Adviser and Subadviser
Aston Asset Management, LP serves as investment adviser to the Funds. Aston is a majority-owned and independently managed indirect subsidiary of Affiliated Managers Group (“AMG”). A wholly-owned subsidiary of AMG, Manor LLC, serves as the General Partner of Aston, and senior management and key employees of Aston have an equity interest in Aston. Aston commenced operations on December 1, 2006 and converted to a Delaware limited partnership on April 15, 2010 in connection with AMG’s acquisition of a controlling interest in Aston. As of December 31, 2012, Aston had approximately $11.5 billion in assets under management.
Lee Munder Capital Group, LLC (“LMCG”), 200 Clarendon Street, 28th Floor, Boston, Massachusetts 02116, has served as the subadviser to the Acquiring Fund since February 17, 2012 and to the Target Fund since January 31, 2013. LMCG was founded in August 2000. LMCG is majority-owned
10
by Convergent Capital Management, LLC. As of December 31, 2012, LMCG had approximately $5.0 billion in assets under management.
Mr. Andrew Morey, CFA, lead portfolio manager of LMCG’s small and small/mid-cap investment strategies has served as the Acquiring Fund’s portfolio manager since its inception and as the Target Fund’s portfolio manager since January 31, 2013. Mr. Morey joined LMCG in February 2012. Mr. Morey has 20 years of investment management experience, and prior to joining LMCG, he served as portfolio manager at Crosswind Investments, LLC for Crosswind’s small and small/mid-cap investment strategies. Previously, Mr. Morey was the founder and portfolio manager of Tartan Partners, LLC from 2005 to 2007. Prior to Tartan Partners, Mr. Morey worked at State Street Research & Management as a portfolio manager, and at Gabelli & Co. as a research analyst. Mr. Morey holds the Chartered Financial Analyst designation.
For a complete description of the advisory services provided to the Acquiring Fund, see the section of the Trust’s Prospectus entitled “Management of the Funds” and the sections of the Trust’s Statement of Additional Information entitled “Investment Adviser” and “Subadvisers.” Additional information about the portfolio manager compensation structure, other accounts managed by the portfolio managers and the portfolio managers’ ownership of securities in the Funds is provided in the Trust’s Statement of Additional Information.
Advisory and Other Fees
For the services provided and the expenses assumed pursuant to the Investment Advisory Agreement with Aston, Aston receives a management fee from each Fund based on the Fund’s average daily net assets, computed daily and payable monthly, at the following annual rates:
| | |
Fund | | Management Fee |
ASTON Small Cap Fund | | 1.00% |
ASTON/LMCG Small Cap Growth Fund | | 1.00% |
For the services provided pursuant to the Sub-Investment Advisory Agreement with LMCG with respect to the Acquiring Fund and the Target Fund, Aston pays LMCG a fee computed daily and payable monthly. The sub-advisory fee rate is 50% of the applicable advisory fee less any expense waivers or reimbursements and certain payments to third-party intermediaries.
Aston has entered into an Expense Reimbursement Agreement with the Trust, on behalf of the Acquiring Fund, through February 28, 2014, under which Aston will waive its fees or reimburse the Fund’s expenses to the extent that the Fund’s annual operating expense ratio, not including interest, taxes, investment-related costs (such as brokerage commissions), extraordinary expenses and acquired fund fees and expenses, exceed 1.10% for Class I shares and 1.35% for Class N shares. In connection with the Expense Reimbursement Agreement for each class of shares, the Acquiring Fund has agreed that for a period of up to three years from the end of the fiscal year end in which such amount was waived or reimbursed, the Adviser is entitled to be reimbursed by the Fund for fees waived and expenses reimbursed from the commencement of operations of the class of shares through the completion of the Fund’s first three full fiscal years of that class to the extent that the Fund’s expense ratio with respect to that class (not including interest, taxes, other investment-related costs (such as brokerage commissions), extraordinary expenses and acquired fund fees and expenses) remains at or below the applicable operating expense cap after such reimbursement.
In addition, Aston has entered into an Expense Limitation Agreement with the Trust, on behalf of the Target Fund, through February 28, 2014 under which Aston will waive its fees or reimburse the
11
Fund’s expenses to the extent that the Fund’s annual operating expense ratio, not including interest, taxes, investment-related costs (such as brokerage commissions), extraordinary expenses and acquired fund fees and expenses, exceeds 1.24% for Class I shares and 1.49% for Class N shares.
The Board has adopted plans of distribution (the “Plans”) pursuant to Rule 12b-1 under the 1940 Act, which permit the Class N shares of each Fund to pay certain expenses associated with the distribution of its shares and the provision of shareholder services. Class I shares are not subject to Rule 12b-1 fees.
Under the Plans, each Fund is authorized to pay an annual rate not exceeding 0.25% of the Fund’s average daily net assets for Class N shares. From this amount, the Trust’s distributor may make payments to financial institutions and intermediaries such as banks, savings and loan associations, insurance companies, investment counselors, broker-dealers, and the distributor’s affiliates and subsidiaries as compensation for services, reimbursement of expenses incurred in connection with distribution assistance or provision of shareholder services. The Plans for Class N shares are characterized as reimbursement plans and are directly tied to expenses incurred by the distributor; therefore, the payments the distributor receives during any year may not exceed its actual expenses.
Trustees and Officers
Both Funds are series of the Trust and, as a result, have the same Board and the same officers. The management of each Fund, including general oversight of the duties performed by Aston under the Investment Advisory Agreement for each Fund, is the responsibility of the Board. The Board currently is composed of nine trustees (each, a “Trustee”), seven of whom are not “interested persons” (as that term is defined in the 1940 Act). The names and business addresses of the Trustees and officers of the Funds and their principal occupations and other affiliations during the past five years are set forth under “Trustees and Officers of the Trust” in the Statement of Additional Information for the Funds incorporated herein by reference.
Purchase and Sale of Fund Shares
Each Fund offers Class N and Class I shares. You may purchase, exchange, or redeem shares of the Funds on any business day, which is any day the New York Stock Exchange is open for trading. You may purchase, exchange or redeem shares of each Fund through a financial representative or directly from the Fund. Each Fund’s initial and subsequent investment minimums generally are as follows, although each Fund may reduce or waive the minimums in some cases:
| | | | | | | | |
| | | Class N | | | Class I |
| | | |
ASTON/LMCG Small Cap Growth Fund | | Regular Accounts | | | $2,500 | | | Institutional Accounts $1 Million |
| | Individual Retirement Accounts | | | $500 | | | |
| | Education Savings Accounts | | | $500 | | | |
| | Custodial Accounts for Minors | | | $500 | | | |
| | | |
ASTON Small Cap Fund | | Regular Accounts | | | $2,500 | | | Institutional Accounts $1 Million |
| | Individual Retirement Accounts | | | $500 | | | |
| | Education Savings Accounts | | | $500 | | | |
| | Custodial Accounts for Minors | | | $500 | | | |
For a complete description of purchase, redemption and exchange options, see the section of the Trust’s Prospectus entitled “Shareholder Information” and the section of the Trust’s Statement of Additional Information entitled “Redemptions-In-Kind.”
12
Tax Information
The Funds’ distributions are generally taxable as ordinary income or capital gains for federal income purposes, unless you are investing through a tax-deferred account such as a 401(k) or individual retirement account. Distributions on investments made through tax-deferred vehicles, such as 401(k) plans or IRAs, may be taxed later upon withdrawal of assets from those plans or accounts.
Payments to Broker-Dealers and Other Financial Intermediaries
If you purchase shares of a Fund through a broker-dealer or another financial intermediary (such as a bank), the Fund and its related companies may pay the intermediary for the sale of shares and related services. These payments may create a conflict of interest by influencing the broker-dealer or other intermediary and your salesperson to recommend the Fund over another investment. Ask your salesperson or visit your financial intermediary’s website for more information.
THE PROPOSED REORGANIZATION
The proposed Reorganization will be governed by the Agreement, a form of which is attached as Appendix A. The following discussion of the Agreement is qualified in its entirety by the full text of the Agreement.
The Board has determined that the proposed Reorganization is in the best interests of each Fund and that the interests of shareholders of each Fund will not be diluted as a result of the transactions contemplated by the Agreement.
The Agreement provides that the closing of the Reorganization will take place at [9:00 a.m. Central Time] on the Closing Date. At the closing, the Target Fund will transfer all its assets to the Acquiring Fund, and in exchange, the Acquiring Fund will assume all the liabilities of the Target Fund and deliver to the Target Fund a number of full and fractional shares of the Acquiring Fund having an aggregate value equal to the value of the assets of the Target Fund less the liabilities of the Target Fund assumed by the Acquiring Fund. On or as soon after the Closing Date as is practicable, the Target Fund will distribute in complete liquidation of the Target Fund, pro rata to its Class N and Class I shareholders, all Class N and Class I shares of the Acquiring Fund received by the Target Fund. This distribution will be accomplished by the transfer of Acquiring Fund shares credited to the account of the Target Fund on the books of the Acquiring Fund to open accounts on the share records of the Acquiring Fund in the name of the Target Fund shareholders, and representing the respective pro rata number of Acquiring Fund shares due such shareholders. All issued and outstanding shares of the Target Fund will simultaneously be canceled on the books of the Target Fund. The Acquiring Fund shall not issue certificates representing Acquiring Fund shares in connection with such transfer.
The aggregate net asset value of Acquiring Fund shares received by the Target Fund in the Reorganization will equal, as of the close of regular trading on the New York Stock Exchange on the business day immediately prior to the Closing Date, the aggregate net asset value of Target Fund shares held by Target Fund shareholders.
The consummation of the Reorganization is subject to the terms and conditions of, and the representations and warranties being true as set forth in, the Agreement. The Agreement may be terminated by the mutual agreement of the parties to the Reorganization, and such termination may be effected by the Trust’s President without further action by the Board. In addition, either the Acquiring Fund or the Target Fund may at its option terminate the Agreement at or before the Closing Date due to (a) a breach by any other party to the Reorganization of any representation, warranty or agreement
13
contained therein to be performed at or before the Closing Date, if not cured within 30 days; (b) a condition precedent to the obligations of the terminating party has not been met and it reasonably appears that it will not or cannot be met; or (c) a determination by the Board that the consummation of the transactions contemplated therein with respect to the Reorganization is not in the best interests of the Acquiring Fund or the Target Fund.
The Target Fund will, within a reasonable period of time before the Closing Date, furnish the Acquiring Fund with a list of the Target Fund’s portfolio securities and other investments. The Acquiring Fund will, within a reasonable period of time before the Closing Date, furnish the Target Fund with a list of the securities, if any, on the Target Fund’s list referred to above that do not conform to the Acquiring Fund’s investment objective, policies and restrictions. The Target Fund, if requested by the Acquiring Fund, will dispose of securities on such Acquiring Fund’s list before the Closing Date. In addition, if it is determined that the portfolios of the Target Fund and the Acquiring Fund, when aggregated, would contain investments exceeding certain percentage limitations imposed upon the Acquiring Fund with respect to such investments, the Target Fund, if requested by the Acquiring Fund, will dispose of a sufficient amount of such investments as may be necessary to avoid violating such limitations as of the Closing Date. Notwithstanding the foregoing, nothing herein will require the Target Fund to dispose of any investments or securities if, in the reasonable judgment of the Board or the Adviser, such disposition would adversely affect the status of the Reorganization as a “reorganization” for federal income tax purposes or would otherwise not be in the best interests of the Target Fund.
Description of Securities to be Issued
The Acquiring Fund has established and designated Class N and Class I shares, no par value per share. The Acquiring Fund is authorized to issue an unlimited number of shares. The number of Acquiring Fund shares to be issued (including fractional shares, if any) in exchange for the Target Fund’s net assets shall be determined with respect to each class by dividing the Target Fund’s net assets with respect to each class of shares of the Target Fund by the net asset value per share of the respective class of Acquiring Fund shares. All shares issued are fully paid and non-assessable, and shareholders have no preemptive or other right to subscribe to any additional shares and no conversion rights. See also “Rights of Shareholders” below.
Service Providers
The Bank of New York Mellon serves as the custodian for the Funds and BNY Mellon Investment Servicing (US) Inc. serves as transfer agent and dividend paying agent for the Funds. Ernst & Young LLP is the Trust’s independent registered public accounting firm.
Material Federal Income Tax Consequences
As a condition to each Fund’s obligation to consummate the Reorganization, each Fund will receive a tax opinion from Vedder Price P.C. (which opinion will be based on certain factual representations and certain customary assumptions and exclusions) substantially to the effect that, on the basis of the existing provisions of the Internal Revenue Code of 1986, as amended (the “Code”), current administrative rules and court decisions, for federal income tax purposes:
| | 1. | The transfer of all the assets of the Target Fund to the Acquiring Fund in exchange solely for Acquiring Fund shares and the assumption by the Acquiring Fund of all the liabilities of the Target Fund, followed by the pro rata distribution to the Target Fund shareholders of all the Acquiring Fund shares received by the Target Fund in complete liquidation of the Target Fund, will constitute a “reorganization” within the meaning of Section 368(a) of the Code, and the Acquiring Fund and the Target Fund will each be a “party to a |
14
| | reorganization” within the meaning of Section 368(b) of the Code with respect to the Reorganization. |
| | 2. | No gain or loss will be recognized by the Acquiring Fund upon the receipt of all the assets of the Target Fund solely in exchange for Acquiring Fund shares and the assumption by the Acquiring Fund of all the liabilities of the Target Fund. |
| | 3. | No gain or loss will be recognized by the Target Fund upon the transfer of all the Target Fund’s assets to the Acquiring Fund solely in exchange for Acquiring Fund shares and the assumption by the Acquiring Fund of all the liabilities of the Target Fund or upon the distribution (whether actual or constructive) of all such Acquiring Fund shares to the Target Fund shareholders solely in exchange for such shareholders’ shares of the Target Fund in complete liquidation of the Target Fund. |
| | 4. | No gain or loss will be recognized by Target Fund shareholders upon the exchange of their Target Fund shares solely for Acquiring Fund shares pursuant to the Reorganization. |
| | 5. | The aggregate basis of the Acquiring Fund shares received by each Target Fund shareholder pursuant to the Reorganization will be the same as the aggregate basis of the Target Fund shares exchanged therefor by such shareholder. The holding period of the Acquiring Fund shares received by each Target Fund shareholder will include the period during which the Target Fund shares exchanged therefor were held by such shareholder, provided such Target Fund shares are held as capital assets at the effective time of the Reorganization. |
| | 6. | The basis of the Target Fund’s assets acquired by the Acquiring Fund will be the same as the basis of such assets to the Target Fund immediately before the Reorganization. The holding period of the assets of the Target Fund in the hands of the Acquiring Fund will include the period during which those assets were held by the Target Fund. |
No opinion will be expressed as to (1) the effect of the Reorganization on (A) the Target Fund, the Acquiring Fund or any Target Fund shareholder with respect to any asset as to which any unrealized gain or loss is required to be recognized under federal income tax principles (i) at the end of a taxable year (or on the termination thereof) or (ii) upon the transfer of such asset regardless of whether such transfer would otherwise be a non-taxable transaction under the Code, or (B) the Target Fund, the Acquiring Fund or any Target Fund shareholder with respect to any stock held in a passive foreign investment company as defined in Section 1297(a) of the Code or (2) any other federal tax issues (except those set forth above) and all state, local or foreign tax issues of any kind.
Prior to the closing of the Reorganization, the Target Fund will declare a distribution to its shareholders, which together with all previous distributions, will have the effect of distributing to shareholders all its net investment income and realized net capital gains (after reduction by any available capital loss carryforwards), if any, through the closing of the Reorganization. This distribution will be taxable to shareholders for federal income tax purposes and may include net capital gains resulting from the sale of portfolio assets discussed below. Additional distributions may be made if necessary. All dividends and distributions will be reinvested in additional shares of the Target Fund unless a shareholder has made an election to receive dividends and distributions in cash. Dividends and distributions are treated the same for federal income tax purposes whether received in cash or additional shares.
To the extent that a portion of the Target Fund’s portfolio assets are sold prior to the Reorganization, the federal income tax effect of such sales would depend on the holding periods of such assets and the difference between the price at which such portfolio assets were sold and the Target Fund’s
15
basis in such assets. Any net capital gains (net long-term capital gain in excess of any net short-term capital loss) recognized in these sales, after the application of any available capital loss carryforwards (capital losses from prior taxable years that may be used to offset future capital gains), would be distributed to the Target Fund’s shareholders as capital gain dividends. Any net short-term capital gains (net short-term capital gain in excess of any net long-term capital loss and after application of any available capital loss carryforwards) would be distributed as ordinary dividends. All such distributions would be made during or with respect to the Target Fund’s taxable year in which the sale occurs and would be taxable for federal income tax purposes to shareholders subject to federal income tax. Although the Target Fund is expected to have substantial portfolio turnover as a result of the appointment of LMCG as subadviser effective January 31, 2013, any gains resulting from such sales are expected to be offset by available capital loss carryforwards of the Target Fund.
At October 31, 2012, the Funds had unused capital loss carryforwards available for federal income tax purposes to be applied against future capital gains, if any. If not applied, the capital loss carryforwards would expire as follows:
| | | | |
| | | Acquiring
Fund | | Target Fund |
Expiration Date: | | | | |
October 31, 2016 | | $ — | | $ 2,506,635 |
October 31, 2017 | | — | | 16,347,889 |
Total | | $ — | | $18,854,524 |
For net capital losses arising in taxable years beginning after December 22, 2010 (“post-enactment losses”), a Fund will generally be able to carry forward such capital losses indefinitely. A Fund’s net capital losses from taxable years beginning on or prior to December 22, 2010, however, will remain subject to their current expiration dates and can be used only after the post-enactment losses.
After the Reorganization, the Acquiring Fund’s ability to use the Target Fund’s pre-Reorganization capital losses, if any, may be limited under certain federal income tax rules applicable to reorganizations of this type. Therefore, in certain circumstances, former shareholders of the Target Fund may pay federal income tax sooner, or may pay more federal income taxes, than they would have had the Reorganization not occurred. It is currently estimated that the Acquiring Fund may not be able to utilize approximately $16,600,000 of the capital loss carryforwards set forth above following the Reorganization due to certain federal income tax rules. The effect of these potential limitations will depend on a number of factors, including the amount of the losses, the amount of gains to be offset, the exact timing of the Reorganization and the amount of unrealized capital gains in the Funds at the time of the Reorganization.
In addition, shareholders of the Target Fund will receive a proportionate share of any taxable income and gains realized by the Acquiring Fund and not distributed to its shareholders prior to the Reorganization when such income and gains are eventually distributed by the Acquiring Fund. As a result, shareholders of the Target Fund may receive a greater amount of taxable distributions than they would have had the Reorganization not occurred.
The foregoing is intended to be only a summary of the principal federal income tax consequences of the Reorganization and should not be considered to be tax advice. There can be no assurance that the Internal Revenue Service will concur on all or any of the issues discussed above. The foregoing is made without regard to the particular facts and circumstances of any shareholder. Shareholders are urged to consult their own tax advisers regarding the federal, state and local tax consequences with respect to the foregoing matters and any other considerations which may be applicable to them.
16
Reorganization Expenses
Each Fund will bear the expenses of the Reorganization (whether or not the Reorganization is consummated), including legal and accounting fees and expenses, provided that the Adviser will reimburse the Funds for expenses incurred in connection with the Reorganization, including legal and accounting expenses, to the extent that such expenses cause the total operating expense ratio of a Fund to exceed operating expense caps currently in effect for a Fund. It is expected that both Funds will be operating at expense levels exceeding their respective expense caps, thus resulting in the Adviser reimbursing the Funds for all direct expenses related to the Reorganization.
Notwithstanding the foregoing, expenses will in any event be paid by the party directly incurring such expenses if and to the extent that the payment by the other party of such expenses would result in the disqualification of the Target Fund or the Acquiring Fund, as the case may be, as a regulated investment company for federal income tax purposes.
The Target Fund has engaged Computershare Fund Services to assist in the solicitation of proxies at an estimated cost of $11,000, which is included in the estimate of Reorganization costs.
Rights of Shareholders
Both Funds are organized as series of a Delaware statutory trust. The Target Fund and the Acquiring Fund are both series of the Trust. As such, there are no material differences in the rights of shareholders.
Each issued and outstanding full and fractional share of a Fund is entitled to one full and fractional vote. Shares of a Fund participate equally in regards to dividends, distributions and liquidations with respect to that Fund subject to preferences (such as Rule 12b-1 fees), rights or privileges of any share class. Shareholders have equal non-cumulative voting rights. Class N shares have exclusive voting rights with respect to the Plans for their class. On any matter submitted to a vote of shareholders, shares of each Fund will vote separately except when a vote of shareholders in the aggregate is required by law, or when the Trustees have determined that the matter affects the interests of more than one Fund, in which case the shareholders of all such Funds shall be entitled to vote thereon.
Shareholders have the power to vote only (i) for the election of Trustees, (ii) for the removal of Trustees, and (iii) with respect to such additional matters relating to the Trust as may be required by law, by the Trust Instrument, or as the Trustees may consider desirable.
Capitalization
The following table sets forth the capitalization of the Target Fund and the Acquiring Fund as of October 31, 2012, and the pro forma capitalization of the combined fund as if the Reorganization had occurred on that date. These numbers may differ at the Closing Date.
Capitalization Table as of October 31, 2012 (Unaudited)
| | | | | | | | | | |
| | | Target Fund | | Acquiring
Fund | | Adjustments | | Pro Forma
Combined
Fund | |
Net Assets | | | | | | | | | | |
Class N | | $21,762,975 | | $5,658,602 | | – | | | $27,421,577 | (a) |
Class I | | 2,400,330 | | 754,628 | | – | | | 3,154,958 | (a) |
Total | | $24,163,305 | | $6,413,230 | | – | | | $30,576,535 | (a) |
17
| | | | | | | | | | | | | | | | |
| | | Target Fund | | | Acquiring
Fund | | | Adjustments | | | Pro Forma
Combined
Fund | |
Shares Outstanding | | | | | | | | | | | | | | | | |
Class N | | | 1,670,425 | | | | 495,521 | | | | 235,265(b) | | | | 2,401,211(b) | |
Class I | | | 177,344 | | | | 65,824 | | | | 32,109(b) | | | | 275,277(b) | |
Total | | | 1,847,769 | | | | 561,345 | | | | 267,374(b) | | | | 2,676,488(b) | |
Net Asset Value Per Share | | | | | | | | | | | | | | | | |
Class N | | | $13.03 | | | | $11.42 | | | | – | | | | $11.42 | |
Class I | | | $13.53 | | | | $11.46 | | | | – | | | | $11.46 | |
Shares Authorized | | | | | | | | | | | | | | | | |
Class N | | | Unlimited | | | | Unlimited | | | | | | | | Unlimited | |
Class I | | | Unlimited | | | | Unlimited | | | | | | | | Unlimited | |
| | (a) | Figures reflect the costs associated with the proposed Reorganization, estimated to be approximately $99,400, of which approximately $74,200 will be charged to the Target Fund and approximately $25,200 will be charged to the Acquiring Fund whether or not the Reorganization is consummated. However, it is expected that both Funds will be operating at expense levels exceeding their respective contractual expense caps, thus resulting in the Adviser reimbursing the Funds for all direct expenses related to the Reorganization. |
| | (b) | Figures reflect the issuance by the Acquiring Fund of approximately 1,905,690 Class N shares and 209,453 Class I shares to shareholders of the Target Fund in connection with the proposed Reorganization. |
Legal Matters
Certain legal matters concerning the Funds and their participation in the Reorganization, the federal income tax consequences of the Reorganization and the issuance of Class N and Class I shares of the Acquiring Fund will be passed on by Vedder Price P.C., 222 North LaSalle Street, Chicago, Illinois 60601.
Information Filed with the Securities and Exchange Commission
This Proxy Statement/Prospectus and the related Statement of Additional Information do not contain all the information set forth in the registration statements and the exhibits relating thereto and the annual and semi-annual reports which the Funds have filed with the SEC pursuant to the requirements of the Securities Act of 1933, as amended, and the 1940 Act, to which reference is hereby made. The SEC file number for the registration statement containing the current Prospectus and Statement of Additional Information for the Target Fund and the Acquiring Fund is Registration No. 811-08004. The Prospectus and Statement of Additional Information are incorporated herein by reference.
THE BOARD’S CONSIDERATION OF THE REORGANIZATION
Aston proposed to the Board the Reorganization which would have the effect of merging the Target Fund and the Acquiring Fund, which Aston believes have substantially similar investment objectives. The Board, including those Trustees who are not “interested persons” of the Funds, the investment adviser or any subadviser of the Trust, as defined in the 1940 Act (the “Independent Trustees”), approved the terms of the Reorganization and recommended that the Reorganization be approved by the shareholders of the Target Fund.
In preparation for the meeting of the Board held on December 13, 2012 (the “Meeting”) at which the Reorganization was considered, Aston provided the Board with information regarding the proposed Reorganization, including the rationale therefor and alternatives considered to the Reorganization of the
18
Funds. In determining to recommend that the shareholders of the Target Fund approve the Reorganization, the Board considered the factors described below.
The Funds’ investment objectives, strategies, policies and relative risks. The Board noted that the Target Fund’s and the Acquiring Fund’s investment objectives and principal strategies, policies and risks are substantially similar.
The Funds’ relative sizes and potential for economies of scale. The Board noted that the Target Fund currently has a larger asset size than the Acquiring Fund, but that both Funds are relatively small and economies of scale may result from the Reorganization.
The investment performance of the Funds and the appointment of the Acquiring Fund’s subadviser to serve as subadviser to the Target Fund. In connection with its annual contract renewal process, the Board considered that the performance of the Target Fund lagged its benchmark index and peer group. The Board also noted that while the Acquiring Fund had more favorable performance, it had a relatively short track record. Accordingly, the Board took into account the long-term composite performance of LMCG’s small cap strategy. The Board considered that the same portfolio manager currently managing the Acquiring Fund is expected to continue to manage the combined fund upon consummation of the Reorganization.
The relative fees and expense ratios of the Funds. The Board noted that the Funds have the same management fee rate, and the Acquiring Fund has a lower total annual operating expense ratio after fee waiver/expense reimbursements than that of the Target Fund. The estimated total annual operating expense ratio for the combined fund is expected to be lower than the current total annual operating expense ratio of the Target Fund, taking into account the effect of contractual expense limitations, and a larger combined fund offers the opportunity for economies of scale.
The anticipated tax-free nature of the Reorganization. The Board took into account that, for federal income tax purposes, the Reorganization is generally not expected to result in a taxable event for the Target Fund or its shareholders.
Potential sales of portfolio securities of the Target Fund to accomplish the Reorganization. The Board considered that a material portion of securities in the Target Fund’s portfolio may be sold whether or not the Reorganization takes place as a result of the change of Subadviser. The Board considered that portfolio turnover is not expected to be significant in order to comply with the Acquiring Fund’s investment policies.
The expected costs of the Reorganization. The Board noted that each Fund will bear the expenses of the Reorganization (whether or not the Reorganization is consummated), including legal and accounting fees and expenses, provided that Aston will reimburse the Funds for expenses in connection with the Reorganization to the extent that such expenses cause total operating expenses of a Fund to exceed operating expense cap currently in effect for the Fund. It is expected that both Funds will be operating at expense levels exceeding their respective expense caps, thus resulting in Aston reimbursing the Funds for all direct expenses related to the Reorganization.
The effect of the Reorganization on shareholder services and shareholder rights. The Board took into account that the services available to Target Fund shareholders will be substantially the same on a class level basis.
Alternatives to the Reorganization. The Board considered continuing to operate the Target Fund as a stand-alone fund, and considered the possibility of liquidating the Target Fund. The Board determined that the proposed Reorganization is the best alternative because it is not expected to be a
19
taxable event to shareholders for federal income tax purposes, it provides shareholders with a similar investment opportunity and economies of scale may be realized as a result of the size of the combined fund.
Any potential benefits of the Reorganization to Aston and its affiliates as a result of the Reorganization. The Board noted that the Reorganization may result in some operational efficiencies for the Adviser and its affiliates, including a reduction in operational expenses incurred in connection with administrative and compliance services, as a result of the elimination of the Target Fund as a separate series of the Trust.
Conclusion. Based on all of the foregoing, the Board concluded that the Target Fund’s participation in the proposed Reorganization would be in the best interests of the Target Fund and would not dilute the interests of each Fund’s existing shareholders.
OTHER INFORMATION
Shareholders of the Funds
The following tables set forth the percentage of ownership of each person who, as of , 2013, the record date with respect to the Special Meeting, owns of record, or is known by the Funds to own of record or beneficially, 5% or more of any class of shares of either Fund. The tables also set forth the estimated percentage of shares of the combined fund that would have been owned by such parties if the Reorganization had occurred on , 2013. These amounts may differ on the Closing Date.
Target Fund
| | | | | | |
Class | | Name and Address of Owner | | Percentage of
Ownership | | Estimated Pro Forma
Percentage of
Ownership of the
Combined Fund After
the Reorganization |
Class N Shares | | | | . % | | . %
|
Class I Shares | | | | . % | | . % |
|
Acquiring Fund |
Class | | Name and Address of Owner | | Percentage of
Ownership | | Estimated Pro Forma
Percentage of
Ownership of the
Combined Fund After
the Reorganization |
Class N Shares | | | | . % | | . % |
Class I Shares | | | | . % | | . % |
At the close of business on , 2013, there were Class N shares and Class I shares of the Target Fund outstanding. As of , 2013, the [Trustees and officers of the Target Fund as a group owned less than 1% of the total outstanding shares of the Target Fund and as a group owned less than 1% of each class of shares of the Target Fund.]
20
At the close of business on , 2013, there were Class N shares and Class I shares of the Acquiring Fund outstanding. As of , 2013, the [Trustees and officers of the Acquiring Fund as a group owned less than 1% of the total outstanding shares of the Acquiring Fund and as a group owned less than 1% of each class of shares of the Acquiring Fund.]
Submission of Shareholder Proposals
Under Delaware law, the Trust is not required to hold annual shareholders’ meetings, but it will hold special meetings as required or deemed desirable, or upon the request of holders of at least 10% of the Trust’s shares entitled to vote. Because the Trust does not hold regular meetings of shareholders, the anticipated date of the next special shareholder meeting cannot be provided. Any shareholder who wishes to submit a proposal for consideration at a subsequent shareholders’ meeting should mail the proposal promptly to the Trust. Any proposal to be considered for submission to shareholders must comply with Rule 14a-8 under the Securities Exchange Act of 1934, as amended, and must be received by the Trust within a reasonable time before the solicitation of proxies for that meeting. The timely submission of a proposal does not guarantee its inclusion.
Shareholder Communications
Pursuant to guidelines approved by the Board, shareholders who wish to communicate with the Board as a whole and/or each of the Trustees individually should forward such correspondence by U.S. mail or other courier service to the Secretary of the Trust. Correspondence addressed to the Board will be forwarded to the Chairman of the Board and the Chairman of the Nominating and Governance Committee, and correspondence addressed to a particular Trustee will be forwarded to that Trustee.
Other Matters to Come Before the Special Meeting
The Board is not aware of any matters that will be presented for action at the Special Meeting other than the matters set forth herein. Should any other matters requiring a vote of shareholders arise, it is intended that the proxies that do not contain specific instructions to the contrary will be voted in accordance with the judgment of the persons named in the enclosed form of proxy.
Proxy Statement/Prospectus Delivery
Please note that only one Proxy Statement/Prospectus may be delivered to two or more shareholders of the Target Fund who share an address, unless the Fund has received instructions to the contrary. To request a separate copy of the Proxy Statement/Prospectus, or for instructions as to how to request a separate copy of such document or as to how to request a single copy if multiple copies of such document are received, shareholders should contact the Trust by calling (800) 992-8151.
VOTING INFORMATION AND REQUIREMENTS
Shareholders of the Target Fund are entitled to one vote for each full share held and fractional votes for fractional shares.
Approval of the Reorganization will require the affirmative vote of a majority of the outstanding voting securities of the Target Fund, with shareholders of each class voting together as a single class. The “vote of a majority of the outstanding voting securities” is defined in the 1940 Act as the lesser of the vote of (i) 67% or more of the voting securities present at a meeting, if the holders of more than 50% of the outstanding voting securities of such company are present or represented by proxy; or (ii) more than 50% of the outstanding voting securities of such company.
21
One-third of the number of shares entitled to vote, present in person or by proxy, constitutes a quorum for the transaction of business, except that where any provision of law or the Trust Instrument permits or requires that holders of any series shall vote as a series (or that holders of a class shall vote as a class), then one-third of the aggregate number of shares of that series (or that class) entitled to vote shall be necessary to constitute a quorum for the transaction of business by that series (or that class). Any lesser number is sufficient for adjournment. Any adjourned session or sessions may be held without the necessity of further notice.
Abstentions and broker “non-votes” (that is, proxies from brokers or nominees indicating that such persons have not received instructions from the beneficial owner or other persons entitled to vote shares on a particular matter with respect to which the brokers or nominees do not have discretionary voting power) will be treated as shares that are present for purposes of determining the presence of a quorum for transacting business at the Special Meeting and will have the same effect as a vote against the proposal. In the event that a quorum is not present at the Special Meeting, or in the event that a quorum is present but sufficient votes to approve the proposal are not received, the persons named as proxies on the enclosed proxy card may propose one or more adjournments of the Special Meeting to permit further solicitation of proxies. The persons named as proxies will vote upon such adjournment after consideration of all circumstances that may bear upon a decision to adjourn the Special Meeting. Any business that might have been transacted at the Special Meeting originally called may be transacted at any such adjourned session(s) at which a quorum is present.
Shareholders who execute proxies may revoke them at any time before they are voted by submitting a written notice of revocation or a subsequently executed proxy or by attending the Special Meeting and voting in person. The giving of a proxy will not affect your right to vote in person if you attend the Special Meeting and wish to do so.
The Board believes that the proposed Reorganization is in the best interests of the Target Fund. Accordingly, the Board unanimously recommends that shareholders vote FOR approval of the proposed Reorganization.
OTHER INFORMATION REGARDING CHANGE IN SUBADVISER OF THE TARGET FUND
As indicated above, LMCG was appointed to serve as the Target Fund’s subadviser effective on or about January 31, 2013. Generally, the 1940 Act requires an investment advisory agreement to be approved by the Board, including the Independent Trustees, and the Fund’s shareholders in order for it to become effective. However, a “manager-of-managers” exemptive order granted to Aston and the Trust by the SEC allows Aston to hire and terminate subadvisers and amend subadvisory agreements, subject to Board approval, without obtaining shareholder approval.
Under the exemptive order, if Aston hires a new subadviser for a Fund, shareholders of the Fund must be provided with an information statement containing certain information about the subadviser and the subadvisory agreement. The sub-investment advisory agreement for the Target Fund between Aston and LMCG (the “LMCG Sub-Investment Advisory Agreement”) is attached hereto as Appendix C. The following information is intended to provide shareholders of the Target Fund with information about LMCG and the LMCG Sub-Investment Advisory Agreement. It is intended that the following information, along with the information contained in the Proxy Statement/Prospectus, will satisfy the information statement requirements of the exemptive order.
22
Background
As discussed above under “Comparison of the Funds–Investment Adviser and Subadviser,” prior to the appointment of LMCG as the Target Fund’s subadviser, Todd-Veredus served as subadviser. At a meeting held on December 13, 2012, the Board, including the Independent Trustees, approved the LMCG Sub-Investment Advisory Agreement.
Board Considerations
The Board, including the Independent Trustees, approved the LMCG Sub-Investment Advisory Agreement at an in-person meeting held December 13, 2012. The Board considered information provided and discussions held at the December 13, 2012 meeting.
The Independent Trustees met separately from the “interested” Trustees of the Trust and any officers of Aston, LMCG or their affiliates to consider approval of the LMCG Sub-Investment Advisory Agreement and were assisted by independent legal counsel in their deliberations. Among the matters considered by the Board, including the Independent Trustees, in connection with the approval of the LMCG Sub-Investment Advisory Agreement were the following:
Nature, Quality and Extent of Services. The Board considered the nature, quality and extent of services expected to be provided under the LMCG Sub-Investment Advisory Agreement. The Board considered the reputation, qualifications and background of LMCG and its operational and compliance infrastructures. The Board also considered information provided regarding the experience and skills of senior management and investment personnel of LMCG, the resources made available to such personnel, the ability of LMCG to attract and retain high-quality personnel, and the organizational depth of LMCG. The Board considered that Mr. Morey would manage the Fund at LMCG, and that he is also the portfolio manager of the Acquiring Fund. The investment objective and principal strategies of the Fund would not change as a result of the approval of the LMCG Sub-Investment Advisory Agreement. On the basis of this evaluation, the Board concluded that the nature, quality and extent of services to be provided by LMCG are expected to be satisfactory.
Fees, Profitability and Economies of Scale. The Board considered the subadvisory fee rate under the LMCG Sub-Investment Advisory Agreement as well as the overall management fee structure of the Fund, noting that the subadvisory fee rate is fifty percent (50%) of management fees less certain third-party payments, fee waivers and expense reimbursement incurred by Aston. The Board considered that the subadvisory fee rate was negotiated at arm’s length between Aston and LMCG, an unaffiliated third party, and that Aston would compensate LMCG from the fees it receives from the Fund. As part of its review of the investment advisory agreement with Aston, the Board considered whether there will be economies of scale with respect to the overall fee structure of the Fund and whether the Fund will benefit from any economies of scale.
The Board also considered information provided by LMCG with respect to fees charged to other mutual funds and separate account clients, as applicable. The Board considered that the fee rates charged to the Fund and other clients vary because of the additional regulatory and compliance requirements, among other things, associated with registered investment companies such as the Fund and other differences in the products and services provided, including differences in fee structures. The Board determined that profitability information with respect to LMCG was not material to its considerations in light of the fee model used by Aston and the unaffiliated status of LMCG.
The Board concluded that the proposed subadvisory fee rate was reasonable in light of the nature, quality and extent of services to be provided and that economies of scale were limited at this time.
23
Other Benefits to the Subadviser. The Board also considered the character and amount of other incidental benefits expected to be received by LMCG as a result of its association with the Fund. The Board considered potential benefits to LMCG from the use of “soft dollars” to pay for research services generated by parties other than the executing broker-dealer. The Board concluded that the subadvisory fees were reasonable taking into account any other benefits expected to be received by LMCG from its relationship with the Fund.
Conclusion. Based on all of the information considered and the conclusions reached, the Board determined that the terms of the LMCG Sub-Investment Advisory Agreement are fair and reasonable, and that the approval of the LMCG Sub-Investment Advisory Agreement is in the best interests of the Fund. No single factor was determinative in the Board’s analysis.
Description of the Sub-Investment Advisory Agreement
The terms of the LMCG Sub-Investment Advisory Agreement, which is attached hereto as Appendix C, are described below.
Investment Management Services. The LMCG Sub-Investment Advisory Agreement provides that LMCG shall manage the investment and reinvestment of the Fund’s assets in accordance with the Fund’s investment objective, policies and limitations and administer the Fund’s affairs to the extent requested by, and subject to, the oversight of the Board.
Brokerage. The LMCG Sub-Investment Advisory Agreement authorizes LMCG to select brokers or dealers that will execute the purchases and sales of portfolio securities for the Fund, subject to its obligation to obtain best execution under the circumstances, which may take account of the overall quality of brokerage and research services provided to LMCG. The agreement permits LMCG to rely on Section 28(e) of the Securities Exchange Act of 1934, as amended, in placing brokerage transactions. Under that section, a commission paid to a broker may be higher than that which another qualified broker would have charged for effecting the same transaction, provided LMCG determines in good faith that the commission is reasonable in terms of either the transaction or the overall responsibility of LMCG to the Fund and its other clients and that the total commissions paid by the Fund will be reasonable in relation to the benefits to the Fund over the long term.
Expenses. The LMCG Sub-Investment Advisory Agreement provides that LMCG agrees to pay all expenses it incurs in connection with its activities under the agreement other than the cost of securities purchased for the Fund (including brokerage commissions and other related expenses).
Compensation. Under the LMCG Sub-Investment Advisory Agreement, Aston pays LMCG a management fee out of the investment advisory fee it receives from the Fund, in an amount equal to fifty percent (50%) of the positive difference, if any, of the investment advisory fee payable to Aston minus the sum of: (i) any investment advisory fees waived by Aston pursuant to an expense limitation or reimbursement agreement with the Fund, (ii) any expenses reimbursed by Aston pursuant to an expense limitation or reimbursement agreement with the Fund, and (iii) any payments by Aston to third parties who provide distribution, shareholder or similar services to the Fund. If the foregoing calculation results in a negative amount, such amount shall be payable by LMCG within 30 days of receipt of notice from Aston.
Aston receives a fee based on the Fund’s average daily net assets, computed daily and payable monthly at the annual rate of 1.00%. Aston has contractually agreed to waive management fees and/or reimburse ordinary operating expenses through February 28, 2014 to limit the Fund’s expense ratio, not including fees and expenses from investments in other investment companies (acquired fund fees and expenses), to 1.35% for Class N shares and 1.10% for Class I shares.
24
Limitation on Liability. Under the LMCG Sub-Investment Advisory Agreement, LMCG and its directors, officers, stockholders, employees and agents will not be liable for any error of judgment or mistake of law or for any loss suffered by Aston or the Trust in connection with any matters to which the agreement relates or for any other act or omission in the performance by LMCG of its duties under the agreement, except that nothing in the agreement shall be construed to protect LMCG against any liability by reason of its willful misfeasance, bad faith or gross negligence in the performance of its duties or for its reckless disregard of its obligations or duties under the agreement. The LMCG Sub-Investment Advisory Agreement also includes an indemnity provision which requires Aston and LMCG to indemnify each other for certain losses.
Term. The LMCG Sub-Investment Advisory Agreement for the Fund has an effective date of January 31, 2013 and has an initial term ending on December 31, 2013. The LMCG Sub-Investment Advisory Agreement will continue in effect from year to year thereafter if such continuance is approved on behalf of the Fund at least annually in the manner required by the 1940 Act and the rules and regulations thereunder.
Termination. The LMCG Sub-Investment Advisory Agreement may be terminated at any time without the payment of any penalty upon sixty (60) days’ written notice to or by LMCG. In addition, the LMCG Sub-Investment Advisory Agreement may be terminated upon less than sixty (60) days’ notice to LMCG upon a material breach of the agreement or if the Board determines that other circumstances have, or likely will have, a material adverse effect on LMCG’s abilities to perform its obligations under the agreement, including notification of the departure of a portfolio manager or other key personnel change. The LMCG Sub-Investment Advisory Agreement terminates automatically without the payment of any penalty upon its assignment or upon termination of the advisory agreement.
Other. The LMCG Sub-Investment Advisory Agreement includes a non-solicitation provision under which LMCG may not solicit Fund shareholders to request redemption of their shares of any series of the Trust.
Other Information
Officers and Directors. Information regarding the principal executive officers and directors of Aston and LMCG is shown in Appendix D. To the best knowledge of the Trust, as of , 2013, the ownership of shares of the Target Fund by the Trustees and executive officers of the Trust is shown in Appendix E.
Aggregate Advisory Fees. During the fiscal year ended October 31, 2012, Aston earned gross investment advisory fees of $279,493 for services provided to the Target Fund, and Aston paid $82,505 in subadvisory fees to Todd-Veredus with respect to the Fund during the last fiscal year.
Distributor and Administrator. Foreside Funds Distributors LLC, 400 Berwyn Park, 899 Cassatt Road, Berwyn, PA 19312, is the Trust’s distributor. The Trust’s administrator is Aston Asset Management, LP, 120 North LaSalle Street, 25th Floor, Chicago, IL 60602.
Brokerage Commissions. During the fiscal year ended October 31, 2012, no commissions were paid to any affiliated broker.
25
, 2013
Please sign and return your proxy promptly.
Your vote is important and your participation
in the affairs of your Fund does make a difference.
26
APPENDIX A
FORM OF
AGREEMENT AND PLAN OF REORGANIZATION
THIS AGREEMENT AND PLAN OF REORGANIZATION (the “Agreement”) is made as of this [ ] day of [ , 20 ] by Aston Funds, a Delaware statutory trust (the “Trust”), on behalf of and between ASTON/LMCG Small Cap Growth Fund (formerly known as ASTON Small Cap Growth Fund) (the “Acquiring Fund”) and ASTON Small Cap Fund (formerly known as ASTON/Veredus Small Cap Growth Fund) (the “Target Fund”) (the Acquiring Fund and the Target Fund are referred to herein each as a “Fund” and collectively as the “Funds”), and Aston Asset Management, LP (the “Adviser”), the investment adviser to the Funds (for purposes of Section 9.1 of the Agreement only). The principal place of business of the Trust is 120 North LaSalle Street, Chicago, Illinois 60602.
This Agreement is intended to be, and is adopted as, a plan of reorganization within the meaning of Section 368 of the Internal Revenue Code of 1986, as amended (the “Code”), and the Treasury Regulations promulgated thereunder. The reorganization will consist of: (i) the transfer of all the assets of the Target Fund to the Acquiring Fund, in exchange solely for Class N and Class I shares of beneficial interest, no par value per share, of the Acquiring Fund (“Acquiring Fund Shares”) and the assumption by the Acquiring Fund of all the liabilities of the Target Fund; and (ii) the distribution, after the Closing Date hereinafter referred to, of the Acquiring Fund Shares to the shareholders of each corresponding class of the Target Fund, in complete liquidation and termination of the Target Fund as provided herein, all upon the terms and conditions set forth in this Agreement (the “Reorganization”).
WHEREAS, each Fund is a separate series of the Trust, and the Trust is an open-end management investment company registered under the Investment Company Act of 1940, as amended (the “1940 Act”), and the Target Fund owns securities that generally are assets of the character in which the Acquiring Fund is permitted to invest;
WHEREAS, the Acquiring Fund is authorized to issue the Acquiring Fund Shares; and
WHEREAS, the Board of Trustees of the Trust (the “Board”) has determined that the Reorganization, with respect to each Fund, is in the best interests of such Fund and that the interests of the existing shareholders of each Fund will not be diluted as a result of the Reorganization.
NOW, THEREFORE, in consideration of the premises and of the covenants and agreements hereinafter set forth, the parties hereto covenant and agree as follows:
ARTICLE I
TRANSFER OF ASSETS OF THE TARGET FUND IN EXCHANGE FOR ACQUIRING FUND
SHARES AND THE ASSUMPTION OF THE TARGET FUND LIABILITIES AND
LIQUIDATION AND TERMINATION OF THE TARGET FUND
1.1 THE EXCHANGE. Subject to the terms and conditions contained herein and on the basis of the representations and warranties contained herein, the Target Fund agrees to transfer all its assets, as set forth in Section 1.2, to the Acquiring Fund. In consideration therefor, the Acquiring Fund
A-1
agrees: (i) to issue and deliver to the Target Fund the number of full and fractional Acquiring Fund Shares, computed in the manner set forth in Section 2.3; and (ii) to assume all the liabilities of the Target Fund, as set forth in Section 1.3. Such transactions shall take place at the closing provided for in Section 3.1 (the “Closing”).
1.2 ASSETS TO BE ACQUIRED. The assets of the Target Fund to be acquired by the Acquiring Fund shall consist of all property, including, without limitation, all cash, securities, commodities, options, interests in futures and dividends or interest receivables, owned by the Target Fund and any deferred or prepaid expenses shown as an asset on the books of the Target Fund as of the Closing.
The Target Fund will, within a reasonable period of time before the Closing Date, furnish the Acquiring Fund with a list of the Target Fund’s portfolio securities and other investments. The Acquiring Fund will, within a reasonable period of time before the Closing Date, furnish the Target Fund with a list of the securities, if any, on the Target Fund’s list referred to above that do not conform to the Acquiring Fund’s investment objective, policies and restrictions. The Target Fund, if requested by the Acquiring Fund, will dispose of securities on such Acquiring Fund’s list before the Closing Date. In addition, if it is determined that the portfolios of the Target Fund and the Acquiring Fund, when aggregated, would contain investments exceeding certain percentage limitations imposed upon the Acquiring Fund with respect to such investments, the Target Fund, if requested by the Acquiring Fund, will dispose of a sufficient amount of such investments as may be necessary to avoid violating such limitations as of the Closing Date. Notwithstanding the foregoing, nothing herein will require the Target Fund to dispose of any investments or securities if, in the reasonable judgment of the Board or the Adviser, such disposition would adversely affect the status of the Reorganization as a “reorganization” as such term is used in the Code or would otherwise not be in the best interest of the Target Fund.
1.3 LIABILITIES TO BE ASSUMED. The Target Fund will endeavor to discharge all of its known liabilities and obligations to the extent possible before the Closing Date. Notwithstanding the foregoing, any liabilities not so discharged shall be assumed by the Acquiring Fund, which assumed liabilities shall include all of the Target Fund’s liabilities, debts, obligations, and duties of whatever kind or nature, whether absolute, accrued, contingent, or otherwise, whether or not arising in the ordinary course of business, whether or not determinable at the Closing Date, and whether or not specifically referred to in this Agreement.
1.4 LIQUIDATION AND DISTRIBUTION. On or as soon after the Closing Date as is practicable (the “Liquidation Date”): (a) the Target Fund will distribute in complete liquidation of the Target Fund, pro rata to its Class N and Class I shareholders of record (the “Target Fund Shareholders”), as applicable, determined as of the Valuation Time (as defined in Section 2.1), all the Class N and Class I Acquiring Fund Shares, as applicable, received by the Target Fund pursuant to Section 1.1; and (b) the Target Fund will thereupon proceed to terminate as set forth in Section 1.7 below. Such distribution will be accomplished by the transfer of Acquiring Fund Shares credited to the account of the Target Fund on the books of the Acquiring Fund to open accounts on the share records of the Acquiring Fund in the name of the Target Fund Shareholders, and representing the respective pro rata number of Acquiring Fund Shares due such shareholders. All issued and outstanding shares of the Target Fund will simultaneously
A-2
be canceled on the books of the Target Fund. The Acquiring Fund shall not issue certificates representing Acquiring Fund Shares in connection with such transfer.
1.5 OWNERSHIP OF SHARES. Ownership of Acquiring Fund Shares will be shown on the books of the Acquiring Fund’s transfer agent. Class N and Class I shares of the Acquiring Fund, as applicable, will be issued simultaneously to the Target Fund, in an amount computed in the manner set forth in Section 2.3, to be distributed to the Class N and Class I Target Fund Shareholders, as applicable.
1.6 TRANSFER TAXES. Any transfer taxes payable upon the issuance of Acquiring Fund Shares in a name other than the registered holder of the Target Fund shares on the books of the Target Fund as of that time shall, as a condition of such issuance and transfer, be paid by the person to whom the Acquiring Fund Shares are to be issued and transferred.
1.7 TERMINATION. The Target Fund shall completely liquidate, terminate and have its affairs wound up in accordance with Delaware state law, promptly following the Closing Date and the making of all distributions pursuant to Section 1.4.
1.8 REPORTING. Any reporting responsibility of the Target Fund including, without limitation, the responsibility for filing of regulatory reports, tax returns or other documents with the Securities and Exchange Commission (the “Commission”), any state securities commission and any federal, state or local tax authorities or any other relevant regulatory authority, is and shall remain the responsibility of the Target Fund.
1.9 BOOKS AND RECORDS. All books and records of the Target Fund, including all books and records required to be maintained under the 1940 Act, and the rules and regulations thereunder, shall be available to the Acquiring Fund from and after the Closing Date and shall be turned over to the Acquiring Fund as soon as practicable following the Closing Date.
ARTICLE II
VALUATION
2.1 VALUATION OF ASSETS. The value of the Target Fund’s net assets shall be the value of all of the Target Fund’s assets as of the close of regular trading on the New York Stock Exchange (“NYSE”) on the business day immediately prior to the Closing Date (such time and date being hereinafter called the “Valuation Time”), less the amount of all of the Target Fund’s liabilities as of such time. The value of the Target Fund’s assets shall be determined by using the valuation procedures of the Trust adopted by the Board or such other valuation procedures as shall be mutually agreed upon by the parties.
2.2 VALUATION OF SHARES. The net asset value per share per class of Acquiring Fund Shares shall be the net asset value per share for such class computed as of the Valuation Time, using the valuation procedures of the Trust adopted by the Board or such other valuation procedures as shall be mutually agreed upon by the parties.
A-3
2.3 SHARES TO BE ISSUED. The number of Acquiring Fund Shares to be issued (including fractional shares, if any) in exchange for the Target Fund’s net assets shall be determined with respect to each class by dividing the Target Fund’s net assets with respect to such class of shares of the Target Fund determined in accordance with Section 2.1, by the net asset value per share of the corresponding class of Acquiring Fund Shares determined in accordance with Section 2.2.
2.4 EFFECT OF SUSPENSION IN TRADING. In the event that at the Valuation Time, either: (a) the NYSE or another primary exchange on which the portfolio securities of the Acquiring Fund or the Target Fund are purchased or sold, shall be closed to trading or trading on such exchange shall be restricted; or (b) trading or the reporting of trading on the NYSE or elsewhere shall be disrupted so that accurate appraisal of the value of the net assets of the Acquiring Fund or the Target Fund is impracticable, the Valuation Time shall be postponed until the first business day after the day when trading is fully resumed and reporting is restored, and the Closing Date shall be postponed accordingly.
ARTICLE III
CLOSING AND CLOSING DATE
3.1 CLOSING DATE. The Closing shall occur on , 20 or such other date as the parties may agree (the “Closing Date”). The Closing shall be held as of [9:00 a.m. Central time] at the offices of Vedder Price P.C. in Chicago, Illinois, or at such other time and/or place as the parties may agree. Unless otherwise provided, all acts taking place at the Closing shall be deemed to take place as of [9:00 a.m. Central time.]
3.2 CUSTODIAN’S CERTIFICATE. The Target Fund shall cause The Bank of New York Mellon, as custodian for the Target Fund, to deliver to the Acquiring Fund at the Closing a certificate of an authorized officer stating that: (a) the Target Fund’s portfolio securities, cash, and any other assets shall have been delivered in proper form to the Acquiring Fund on the Closing Date; and (b) all necessary taxes including all applicable federal and state stock transfer stamps, if any, shall have been paid, or provision for payment shall have been made, in conjunction with the delivery of portfolio securities by the Target Fund.
3.3 TRANSFER AGENT’S CERTIFICATE. The Target Fund shall cause BNY Mellon Investment Servicing (U.S.) Inc., as transfer agent for the Target Fund, to deliver to the Acquiring Fund at the Closing a certificate of an authorized officer stating that its records contain the names and addresses of the Target Fund Shareholders, and the number and percentage ownership of outstanding shares per class owned by each such shareholder immediately prior to the Closing. The Acquiring Fund shall issue and deliver or cause BNY Mellon Investment Servicing (U.S.) Inc., its transfer agent, to issue and deliver to the Target Fund a confirmation evidencing the Acquiring Fund Shares to be credited on the Closing Date or provide evidence satisfactory to the Target Fund that such Acquiring Fund Shares have been credited to the Target Fund’s account on the books of the Acquiring Fund.
3.4 DELIVERY OF ADDITIONAL ITEMS. At the Closing, each party shall deliver to the other such bills of sale, checks, assignments, share certificates, receipts and other documents, if any, as
A-4
such other party or its counsel may reasonably request to effect the transactions contemplated by this Agreement.
ARTICLE IV
REPRESENTATIONS AND WARRANTIES
4.1 REPRESENTATIONS OF THE TARGET FUND. The Trust, on behalf of the Target Fund, represents and warrants to the Acquiring Fund as follows:
(a) The Trust is a statutory trust duly organized, validly existing and in good standing under the laws of the State of Delaware.
(b) The Target Fund is a separate series of the Trust duly authorized in accordance with the applicable provisions of the Trust’s Trust Instrument.
(c) The Trust is registered as an open-end management investment company under the 1940 Act, and such registration is in full force and effect.
(d) The Target Fund is not in violation of, and the execution, delivery, and performance of this Agreement (subject to shareholder approval) will not result in a violation of, any provision of the Trust’s Trust Instrument or By-Laws or of any material agreement, indenture, instrument, contract, lease, or other undertaking to which the Target Fund is a party or by which it is bound.
(e) Except as otherwise disclosed in writing to and accepted by the Acquiring Fund, the Target Fund has no material contracts or other commitments that will be terminated with liability to it before the Closing Date.
(f) To the Target Fund’s knowledge, no litigation, administrative proceeding, or investigation of or before any court or governmental body is presently pending or threatened against the Target Fund or any of its properties or assets, which, if adversely determined, would materially and adversely affect its financial condition, the conduct of its business, or the ability of the Target Fund to carry out the transactions contemplated by this Agreement. The Target Fund knows of no facts that might form the basis for the institution of such proceedings and is not a party to or subject to the provisions of any order, decree, or judgment of any court or governmental body that materially and adversely affects its business or its ability to consummate the transactions herein contemplated.
(g) The audited financial statements of the Target Fund as of October 31, 2012, and for the year then ended, have been prepared in accordance with generally accepted accounting principles and have been audited by independent auditors, and such statements (copies of which have been furnished to the Acquiring Fund) fairly reflect the financial condition of the Target Fund as of October 31, 2012, and there are no known contingent liabilities of the Target Fund as of such date that are not disclosed in such statements.
A-5
(h) Since October 31, 2012, there have been no material adverse changes in the Target Fund’s financial condition, assets, liabilities or business (other than changes occurring in the ordinary course of business), and there are no known contingent liabilities of the Target Fund arising after such date. For the purposes of this subsection (h), a decline in the net asset value of the Target Fund shall not constitute a material adverse change.
(i) All federal, state, local and other tax returns and reports of the Target Fund required by law to be filed by it (taking into account permitted extensions for filing) have been timely filed and are complete and correct in all material respects. All federal, state, local and other taxes of the Target Fund required to be paid (whether or not shown on any such return or report) have been paid, or provision shall have been made for the payment thereof, and any such unpaid taxes are properly reflected on the financial statements referred to in subsection (g) above. To the best of the Target Fund’s knowledge, no tax authority is currently auditing or preparing to audit the Target Fund, and no assessment for taxes, interest, additions to tax or penalties has been asserted against the Target Fund.
(j) All issued and outstanding shares of the Target Fund are duly and validly issued and outstanding, fully paid and non-assessable by the Target Fund. All the issued and outstanding shares of the Target Fund will, at the time of the Closing, be held by the persons and in the amounts set forth in the records of the Target Fund’s transfer agent as provided in Section 3.3. The Target Fund has no outstanding options, warrants or other rights to subscribe for or purchase any shares of the Target Fund and has no outstanding securities convertible into shares of the Target Fund.
(k) At the Closing Date, the Target Fund will have good and marketable title to the Target Fund’s assets to be transferred to the Acquiring Fund pursuant to Section 1.2, and full right, power and authority to sell, assign, transfer and deliver such assets, and the Acquiring Fund will acquire good and marketable title thereto, subject to no restrictions on the full transfer thereof, including such restrictions as might arise under the Securities Act of 1933, as amended (the “1933 Act”), and the 1940 Act, except those restrictions as to which the Acquiring Fund has received notice and necessary documentation at or prior to the Closing.
(l) The execution, delivery and performance of this Agreement have been duly authorized by all necessary action on the part of the Target Fund. Subject to approval by the Target Fund Shareholders, this Agreement constitutes a valid and binding obligation of the Target Fund, enforceable in accordance with its terms, subject, as to enforcement, to bankruptcy, insolvency, reorganization, moratorium, and other laws relating to or affecting creditors’ rights and to general equity principles.
(m) The information to be furnished by the Target Fund for use in no-action letters, applications for orders, registration statements, proxy materials and other documents that may be necessary in connection with the transactions contemplated herein shall be accurate and complete in all material respects and shall comply in all material respects with federal securities and other laws and regulations.
(n) From the effective date of the Registration Statement (as defined in Section 5.7), through the time of the meeting of the Target Fund Shareholders and on the Closing Date, any written information furnished by the Trust with respect to the Target Fund for use in the Proxy Materials (as defined in
A-6
Section 5.7), or any other materials provided in connection with the Reorganization, does not and will not contain any untrue statement of a material fact or omit to state a material fact required to be stated or necessary to make the statements, in light of the circumstances under which such statements were made, not misleading.
(o) For each taxable year of its operations (including the taxable year ending on the Closing Date), the Target Fund (i) has elected to qualify, and has qualified or will qualify (in the case of the short taxable year ending with the Closing Date), as a “regulated investment company” under the Code (a “RIC”), (ii) has been eligible to compute and has computed its federal income tax under Section 852 of the Code, and on or prior to the Closing Date will have declared and paid a distribution with respect to all its investment company taxable income (determined without regard to the deduction for dividends paid), the excess of its interest income excludible from gross income under Section 103(a) of the Code over its deductions disallowed under Sections 265 and 171(a)(2) of the Code and its net capital gain (as such terms are defined in the Code) that has accrued or will accrue on or prior to the Closing Date, and (iii) has been, and will be (in the case of the short taxable year ending with the Closing Date), treated as a separate corporation for federal income tax purposes.
4.2 REPRESENTATIONS OF THE ACQUIRING FUND. The Trust, on behalf of the Acquiring Fund, represents and warrants to the Target Fund as follows:
(a) The Trust is a statutory trust, duly organized, validly existing and in good standing under the laws of the State of Delaware.
(b) The Acquiring Fund is a separate series of the Trust duly authorized in accordance with the applicable provisions of the Trust’s Trust Instrument.
(c) The Trust is registered as an open-end management investment company under the 1940 Act, and such registration is in full force and effect.
(d) The Acquiring Fund is not in violation of, and the execution, delivery and performance of this Agreement will not result in a violation of, the Trust’s Trust Instrument or By-Laws or of any material agreement, indenture, instrument, contract, lease, or other undertaking to which the Acquiring Fund is a party or by which it is bound.
(e) To the Acquiring Fund’s knowledge, no litigation, administrative proceeding or investigation of or before any court or governmental body is presently pending or threatened against the Acquiring Fund or any of its properties or assets, which, if adversely determined, would materially and adversely affect its financial condition, the conduct of its business or the ability of the Acquiring Fund to carry out the transactions contemplated by this Agreement. The Acquiring Fund knows of no facts that might form the basis for the institution of such proceedings, and it is not a party to or subject to the provisions of any order, decree, or judgment of any court or governmental body that materially and adversely affects its business or its ability to consummate the transaction herein contemplated.
(f) The audited financial statements of the Acquiring Fund as of October 31, 2012, and for the fiscal year then ended, have been prepared in accordance with generally accepted accounting
A-7
principles and have been audited by independent auditors, and such statements (copies of which have been furnished to the Target Fund) fairly reflect the financial condition of the Acquiring Fund as of October 31, 2012, and there are no known contingent liabilities of the Acquiring Fund as of such date that are not disclosed in such statements.
(g) Since October 31, 2012, there have been no material adverse changes in the Acquiring Fund’s financial condition, assets, liabilities or business (other than changes occurring in the ordinary course of business) and there are no known contingent liabilities of the Acquiring Fund arising after such date. For the purposes of this subsection (g), a decline in the net asset value of the Acquiring Fund shall not constitute a material adverse change.
(h) All federal, state, local and other tax returns and reports of the Acquiring Fund required by law to be filed by it (taking into account permitted extensions for filing) have been timely filed and are complete and correct in all material respects. All federal, state, local and other taxes of the Acquiring Fund required to be paid (whether or not shown on any such return or report) have been paid or provision shall have been made for their payment, and any such unpaid taxes are properly reflected on the financial statements referred to in subsection (f) above. To the best of the Acquiring Fund’s knowledge, no tax authority is currently auditing or preparing to audit the Acquiring Fund, and no assessment for taxes, interest, additions to tax or penalties has been asserted against the Acquiring Fund.
(i) All issued and outstanding Acquiring Fund Shares are duly and validly issued and outstanding, fully paid and non-assessable by the Acquiring Fund. The Acquiring Fund has no outstanding options, warrants, or other rights to subscribe for or purchase shares of the Acquiring Fund, and there are no outstanding securities convertible into shares of the Acquiring Fund.
(j) The execution, delivery and performance of this Agreement have been duly authorized by all necessary action on the part of the Acquiring Fund, and this Agreement constitutes a valid and binding obligation of the Acquiring Fund, enforceable in accordance with its terms, subject, as to enforcement, to bankruptcy, insolvency, reorganization, moratorium, and other laws relating to or affecting creditors’ rights and to general equity principles.
(k) The Acquiring Fund Shares to be issued and delivered to the Target Fund for the account of the Target Fund Shareholders pursuant to the terms of this Agreement will, at the Closing Date, have been duly authorized. When so issued and delivered, such shares will be duly and validly issued shares of the Acquiring Fund and will be fully paid and non-assessable.
(l) The information to be furnished by the Acquiring Fund for use in no-action letters, applications for orders, registration statements, proxy materials and other documents that may be necessary in connection with the transactions contemplated herein shall be accurate and complete in all material respects and shall comply in all material respects with federal securities and other laws and regulations.
(m) From the effective date of the Registration Statement (as defined in Section 5.7), through the time of the meeting of the Target Fund Shareholders and on the Closing Date, any written information furnished by the Trust with respect to the Acquiring Fund for use in the Proxy Materials (as defined in
A-8
Section 5.7), or any other materials provided in connection with the Reorganization, does not and will not contain any untrue statement of a material fact or omit to state a material fact required to be stated or necessary to make the statements, in light of the circumstances under which such statements were made, not misleading.
(n) For each taxable year of its operations, including the taxable year that includes the Closing Date, the Acquiring Fund (i) has elected to qualify, has qualified or will qualify (in the case of the year that includes the Closing Date) and intends to continue to qualify as a RIC under the Code, (ii) has been eligible to and has computed its federal income tax under Section 852 of the Code, and will do so for the taxable year that includes the Closing Date, and (iii) has been, and will be (in the case of the taxable year that includes the Closing Date), treated as a separate corporation for federal income tax purposes.
(o) The Acquiring Fund agrees to use all reasonable efforts to obtain the approvals and authorizations required by the 1933 Act, the 1940 Act and any state securities laws as it may deem appropriate in order to continue its operations after the Closing Date.
ARTICLE V
COVENANTS OF ACQUIRING FUND AND TARGET FUND
5.1 OPERATION IN ORDINARY COURSE. Subject to Sections 1.2 and 8.5, each of the Acquiring Fund and the Target Fund will operate its respective business in the ordinary course between the date of this Agreement and the Closing Date, it being understood that such ordinary course of business will include customary dividends and distributions, any other distributions necessary or desirable to avoid federal income or excise taxes, and shareholder purchases and redemptions.
5.2 APPROVAL OF SHAREHOLDERS. The Trust will call a special meeting of shareholders of the Target Fund to consider and act upon this Agreement (or transactions contemplated thereby) and to take all other appropriate action necessary to obtain approval of the transactions contemplated herein.
5.3 INVESTMENT REPRESENTATION. The Target Fund covenants that the Acquiring Fund Shares to be issued pursuant to this Agreement are not being acquired for the purpose of making any distribution, other than in connection with the Reorganization and in accordance with the terms of this Agreement.
5.4 ADDITIONAL INFORMATION. The Target Fund will assist the Acquiring Fund in obtaining such information as the Acquiring Fund reasonably requests concerning the beneficial ownership of the Target Fund’s shares.
5.5 FURTHER ACTION. Subject to the provisions of this Agreement, each Fund will take or cause to be taken all action and do or cause to be done, all things reasonably necessary, proper or advisable to consummate and make effective the transactions contemplated by this Agreement, including any actions required to be taken after the Closing Date.
A-9
5.6 STATEMENT OF EARNINGS AND PROFITS. As promptly as practicable, but in any case within 60 days after the Closing Date, the Target Fund shall furnish the Acquiring Fund, in such form as is reasonably satisfactory to the Acquiring Fund and which will be certified by the Trust’s Treasurer, a statement of the earnings and profits of the Target Fund for federal income tax purposes, as well as any net operating loss carryovers and capital loss carryovers, that will be carried over to the Acquiring Fund pursuant to Section 381 of the Code.
5.7 PREPARATION OF REGISTRATION STATEMENT AND PROXY MATERIALS. The Trust will prepare and file with the Commission a registration statement on Form N-14 relating to the Acquiring Fund Shares to be issued to the Target Fund Shareholders (the “Registration Statement”). The Registration Statement shall include a proxy statement and a prospectus of the Acquiring Fund relating to the transactions contemplated by this Agreement. The Registration Statement shall be in compliance with the 1933 Act, the Securities Exchange Act of 1934, as amended (the “1934 Act”), and the 1940 Act, as applicable. Each party will provide the other party with the materials and information necessary to prepare the proxy statement and related materials (the “Proxy Materials”), for inclusion therein, in connection with the meeting of Target Fund Shareholders to consider the approval of this Agreement and the transactions contemplated herein.
5.8 TAX STATUS OF REORGANIZATION. The intention of the parties is that the Reorganization will qualify as a reorganization within the meaning of Section 368(a) of the Code. None of the Target Fund, the Trust or the Acquiring Fund shall take any action, or cause any action to be taken (including, without limitation, the filing of any tax return), that is inconsistent with such treatment or results in the failure of the transaction to qualify as a reorganization within the meaning of Section 368(a) of the Code. At or prior to the Closing Date, the Target Fund, the Trust and the Acquiring Fund will take such action, or cause such action to be taken, as is reasonably necessary to enable counsel to render the tax opinion contemplated herein in section 8.8.
ARTICLE VI
CONDITION PRECEDENT TO OBLIGATIONS OF THE TARGET FUND
The obligations of the Target Fund to consummate the transactions provided for herein with respect to the Reorganization shall be subject to the following condition:
6.1 All representations, covenants and warranties of the Acquiring Fund contained in this Agreement shall be true and correct in all material respects as of the date hereof and as of the Closing Date, with the same force and effect as if made on and as of the Closing Date. The Acquiring Fund shall have delivered to the Target Fund a certificate executed in the Acquiring Fund’s name by the Trust’s President or Senior Vice President and its Chief Financial Officer, in form and substance reasonably satisfactory to the Target Fund and dated as of the Closing Date, to such effect and as to such other matters as the Target Fund shall reasonably request.
A-10
ARTICLE VII
CONDITIONS PRECEDENT TO OBLIGATIONS OF THE ACQUIRING FUND
The obligations of the Acquiring Fund to consummate the transactions provided for herein with respect to the Reorganization shall be subject to the following conditions:
7.1 All representations, covenants and warranties of the Target Fund contained in this Agreement shall be true and correct in all material respects as of the date hereof and as of the Closing Date, with the same force and effect as if made on and as of the Closing Date. The Target Fund shall have delivered to the Acquiring Fund on the Closing Date a certificate executed in the Target Fund’s name by the Trust’s President or Senior Vice President and its Chief Financial Officer, in form and substance reasonably satisfactory to the Acquiring Fund and dated as of the Closing Date, to such effect and as to such other matters as the Acquiring Fund shall reasonably request.
7.2 The Target Fund shall have delivered to the Acquiring Fund a statement of the Target Fund’s assets and liabilities, together with a list of the Target Fund’s portfolio securities showing the tax basis of such securities by lot and the holding periods of such securities, as of the Closing Date, certified by the Treasurer of the Trust.
ARTICLE VIII
FURTHER CONDITIONS PRECEDENT WITH RESPECT TO THE REORGANIZATION
The obligations of the Target Fund and the Acquiring Fund with respect to the Reorganization hereunder shall also be subject to the following:
8.1 This Agreement and the transactions contemplated herein, with respect to the Target Fund, shall have been approved by the requisite vote of the holders of the outstanding shares of the Target Fund in accordance with applicable law and the provisions of the Trust’s Trust Instrument and By-Laws. Notwithstanding anything herein to the contrary, neither the Acquiring Fund nor the Target Fund may waive the condition set forth in this Section 8.1.
8.2 On the Closing Date, the Commission shall not have issued an unfavorable report under Section 25(b) of the 1940 Act or instituted any proceeding seeking to enjoin the consummation of the transactions contemplated by this Agreement under Section 25(c) of the 1940 Act. Furthermore, no action, suit or other proceeding shall be threatened or pending before any court or governmental agency in which it is sought to restrain or prohibit, or obtain damages or other relief in connection with, this Agreement or the transactions contemplated herein.
8.3 All required consents of other parties and all other consents, orders and permits of federal, state and local regulatory authorities (including those of the Commission and of state securities authorities, including any necessary “no-action” positions and exemptive orders from such federal and state authorities) to permit consummation of the transactions contemplated herein shall have been obtained.
A-11
8.4 The Registration Statement shall have become effective under the 1933 Act, and no stop order suspending the effectiveness thereof shall have been issued. To the best knowledge of the parties to this Agreement, no investigation or proceeding for that purpose shall have been instituted or be pending, threatened or contemplated under the 1933 Act.
8.5 The Target Fund shall have declared and paid a dividend or dividends which, together with all previous such dividends, shall have the effect of distributing to its shareholders at least all of the Target Fund’s investment company taxable income for all taxable periods ending on or before the Closing Date (computed without regard to any deduction for dividends paid), if any, plus the excess of its interest income excludible from gross income under Section 103(a) of the Code, if any, over its deductions disallowed under Sections 265 and 171(a)(2) of the Code for all taxable periods ending on or before the Closing Date and all of its net capital gains realized in all taxable periods ending on or before the Closing Date (after reduction for any available capital loss carry forward).
8.6 The Target Fund shall have delivered to the Acquiring Fund, and the Acquiring Fund shall have delivered to the Target Fund, on the Closing Date a certificate executed in its name by the Trust’s President or Senior Vice President, in a form reasonably satisfactory to the Target Fund or Acquiring Fund, as applicable, and dated as of the Closing Date, to the effect that the representations and warranties of the Trust, on behalf of the Fund, made in this Agreement are true and correct on and as of the Closing Date and as to such other matters as the Fund shall reasonably request.
8.7 The Funds shall have received on the Closing Date an opinion from Vedder Price P.C., counsel to the Trust, dated as of the Closing Date, substantially to the effect that:
(a) The Trust is a statutory trust, validly existing under the laws of the State of Delaware, which, to such counsel’s knowledge, has the power to own all its properties and assets and to carry on its business as presently conducted.
(b) The Trust is registered as an investment company under the 1940 Act, and, to such counsel’s knowledge, such registration under the 1940 Act is in full force and effect.
(c) Assuming that the Acquiring Fund Shares are issued in accordance with the terms of this Agreement, the Acquiring Fund Shares to be issued and delivered to the Target Fund on behalf of the Target Fund Shareholders, as provided by this Agreement, are duly authorized and upon such delivery will be legally issued and outstanding and fully paid and non-assessable, and no shareholder of the Acquiring Fund has any preemptive rights with respect to the Acquiring Fund Shares.
(d) The Registration Statement is effective, and to such counsel’s knowledge, no stop order under the 1933 Act pertaining thereto has been issued, and to the knowledge of such counsel, no consent, approval, authorization or order of any court or governmental authority of the United States or the State of Delaware is required for consummation by the Funds of the transactions contemplated herein, except as have been obtained.
(e) The execution and delivery of this Agreement did not, and the consummation of the transactions contemplated herein will not, result in a violation of the Trust’s Trust Instrument
A-12
(assuming approval of Target Fund Shareholders has been obtained) or By-Laws or any provision of any material agreement, indenture, instrument, contract, lease or other undertaking (in each case known to such counsel) to which a Fund is a party or by which a Fund or any of its properties may be bound.
8.8 The Funds shall have received an opinion of Vedder Price P.C. addressed to the Acquiring Fund and the Target Fund substantially to the effect that for federal income tax purposes:
(a) The transfer of all the Target Fund’s assets to the Acquiring Fund in exchange solely for Acquiring Fund Shares and the assumption by the Acquiring Fund of all the liabilities of the Target Fund, followed by the pro rata distribution by the Target Fund of all the Acquiring Fund Shares received to the Target Fund Shareholders in complete liquidation of the Target Fund will constitute a “reorganization” within the meaning of Section 368(a) of the Code, and the Acquiring Fund and the Target Fund will each be a “party to a reorganization,” within the meaning of Section 368(b) of the Code, with respect to the Reorganization.
(b) No gain or loss will be recognized by the Acquiring Fund upon the receipt of all the assets of the Target Fund solely in exchange for Acquiring Fund Shares and the assumption by the Acquiring Fund of all the liabilities of the Target Fund.
(c) No gain or loss will be recognized by the Target Fund upon the transfer of all the Target Fund’s assets to the Acquiring Fund solely in exchange for Acquiring Fund Shares and the assumption by the Acquiring Fund of all the liabilities of the Target Fund or upon the distribution (whether actual or constructive) of Acquiring Fund Shares to the Target Fund Shareholders solely in exchange for such shareholders’ shares of the Target Fund in complete liquidation of the Target Fund.
(d) No gain or loss will be recognized by the Target Fund Shareholders upon the exchange of their Target Fund shares solely for Acquiring Fund Shares in the Reorganization.
(e) The aggregate basis of the Acquiring Fund Shares received by each Target Fund Shareholder pursuant to the Reorganization will be the same as the aggregate basis of the Target Fund shares exchanged therefor by such shareholder. The holding period of the Acquiring Fund Shares received by each Target Fund Shareholder will include the period during which the Target Fund shares exchanged therefor were held by such shareholder, provided such Target Fund shares are held as capital assets at the time of the Reorganization.
(f) The basis of the Target Fund’s assets acquired by the Acquiring Fund will be the same as the basis of such assets to the Target Fund immediately before the Reorganization. The holding period of the assets of the Target Fund in the hands of the Acquiring Fund will include the period during which those assets were held by the Target Fund.
No opinion will be expressed as to (1) the effect of the Reorganization on (A) the Target Fund, the Acquiring Fund or any Target Fund Shareholder with respect to any asset as to which any unrealized gain or loss is required to be recognized under federal income tax principles (i) at the end of a taxable year (or on the termination thereof) or (ii) upon the transfer of such asset regardless of whether such transfer would otherwise be a non-taxable transaction under the Code, or (B) the Target Fund, the
A-13
Acquiring Fund or any Target Fund Shareholder with respect to any stock held in a passive foreign investment company as defined in Section 1297(a) of the Code or (2) any other federal tax issues (except those set forth above) and all state, local or foreign tax issues of any kind.
Such opinion shall be based on customary assumptions and such representations as Vedder Price P.C. may reasonably request of the Funds, and the Target Fund and the Acquiring Fund will cooperate to make and certify the accuracy of such representations. Notwithstanding anything herein to the contrary, neither the Acquiring Fund nor the Target Fund may waive the conditions set forth in this Section 8.8.
ARTICLE IX
EXPENSES
9.1 Each Fund will bear its own expenses in connection with the Reorganization (whether or not the Reorganization is consummated), including legal and accounting fees and expenses, provided that the Adviser will reimburse the Funds for expenses in connection with the Reorganization, including legal and accounting expenses, to the extent that such expenses cause total operating expenses of a Fund to exceed operating expense caps in effect for a Fund through February 28, 2014.
9.2 Each party represents and warrants to the other that there is no person or entity entitled to receive any broker’s fees or similar fees or commission payments in connection with the transactions provided for herein.
9.3 Notwithstanding the foregoing, expenses will in any event be paid by the party directly incurring such expenses if and to the extent that the payment by the other party of such expenses would result in the disqualification of the Target Fund or the Acquiring Fund, as the case may be, as a RIC.
ARTICLE X
ENTIRE AGREEMENT; SURVIVAL OF WARRANTIES
10.1 The parties to the Reorganization agree that no party has made to the other parties any representation, warranty and/or covenant not set forth herein, and that this Agreement constitutes the entire agreement between and among the parties.
10.2 The representations, warranties, and covenants contained in this Agreement or in any document delivered pursuant to or in connection with this Agreement shall not survive the consummation of the transactions contemplated hereunder.
ARTICLE XI
TERMINATION
11.1 This Agreement may be terminated by the mutual agreement of the parties to the Reorganization, and such termination may be effected by the Trust’s President without further action by
A-14
the Board. In addition, either the Acquiring Fund or the Target Fund may at its option terminate this Agreement at or before the Closing Date due to:
(a) a breach by any other party to the Reorganization of any representation, warranty, or agreement contained herein to be performed at or before the Closing Date, if not cured within 30 days;
(b) a condition precedent to the obligations of the terminating party that has not been met and it reasonably appears that it will not or cannot be met; or
(c) a determination by the Board that the consummation of the transactions contemplated herein with respect to the Reorganization is not in the best interests of the Acquiring Fund or the Target Fund.
11.2 In the event of any such termination, in the absence of willful default, there shall be no liability for damages on the part of the Trust, the Trustees, the Acquiring Fund, the Target Fund, the Adviser, or the Trust’s or Adviser’s officers.
ARTICLE XII
AMENDMENTS
12.1 This Agreement may be amended, modified or supplemented in such manner as may be mutually agreed upon in writing by the officers of the Trust as specifically authorized by the Board of Trustees; provided, however, that following the meeting of the Target Fund Shareholders called by the Target Fund pursuant to Section 5.2 of this Agreement, no such amendment may have the effect of changing the provisions for determining the number of Acquiring Fund Shares to be issued to the Target Fund Shareholders under this Agreement to the detriment of such shareholders without their further approval.
ARTICLE XIII
HEADINGS; COUNTERPARTS; GOVERNING LAW; ASSIGNMENT;
LIMITATION OF LIABILITY
13.1 The article and section headings contained in this Agreement are for reference purposes only and shall not affect in any way the meaning or interpretation of this Agreement.
13.2 This Agreement may be executed in any number of counterparts, each of which shall be deemed an original.
13.3 This Agreement shall be governed by and construed in accordance with the laws of the State of Delaware.
13.4 This Agreement shall bind and inure to the benefit of the parties hereto and their respective successors and assigns, but, except as provided in this section, no assignment or transfer hereof
A-15
or of any rights or obligations hereunder shall be made by any party without the written consent of the other parties. Nothing herein expressed or implied is intended or shall be construed to confer upon or give any person, firm or corporation, other than the parties hereto and their respective successors and assigns, any rights or remedies under or by reason of this Agreement.
13.5 It is expressly agreed that the obligations of each Fund hereunder shall not be binding upon any of the Trustees, shareholders, nominees, officers, agents or employees of the Trust personally, but shall bind only the trust property of the respective Fund, as provided in the Trust’s Trust Instrument. The execution and delivery of this Agreement have been authorized by the Trustees of the Trust on behalf of each Fund and signed by authorized officers of the Trust acting as such. Neither the authorization by such Trustees nor the execution and delivery by such officers shall be deemed to have been made by any of them individually or to impose any liability on any of them personally, but shall bind only the trust property of the respective Fund as provided in the Trust’s Trust Instrument.
[SIGNATURE PAGE FOLLOWS]
A-16
IN WITNESS WHEREOF, the parties have duly executed this Agreement, all as of the date first written above.
|
ASTON FUNDS on behalf of ASTON/LMCG Small Cap Growth Fund (formerly known as ASTON Small Cap Growth Fund) |
|
By: |
Name: |
Title: |
|
ASTON FUNDS on behalf of ASTON Small Cap Fund (formerly known as ASTON/Veredus Small Cap Growth Fund) By: |
Name: |
Title: |
|
The undersigned is a party to this Agreement for the purposes of Section 9.1 only: ASTON ASSET MANAGEMENT, LP |
|
By: |
Name: |
Title: |
A-17
APPENDIX B
FINANCIAL HIGHLIGHTS
These financial highlights tables are intended to help you understand the Acquiring Fund’s financial performance. The following schedules present financial highlights for one outstanding share of the Fund throughout the periods indicated. The total returns in the tables represent the rate that an investor would have earned or lost on an investment in the Acquiring Fund (assuming reinvestment of all dividends and distributions). This information has been derived from the Fund’s financial statements as of October 31, 2012. The financial statements for the Acquiring Fund have been audited by [ ], whose report along with the Acquiring Funds’ financial statements, is included in the Trust’s Annual Report, which is available upon request.
[To Come]
B-1
APPENDIX C
LMCG SUB-INVESTMENT ADVISORY AGREEMENT
SUB-INVESTMENT ADVISORY AGREEMENT (the “Agreement”) made this 17th day of February, 2012 by and between ASTON ASSET MANAGEMENT, LP (hereinafter referred to as the “Investment Adviser”) and LEE MUNDER CAPITAL GROUP, LLC (hereinafter referred to as the “Subadviser”), which Agreement may be executed in any number of counterparts, each of which shall be deemed to be an original, but all of which together shall constitute but one instrument.
W I T N E S S E T H:
WHEREAS, the Investment Adviser has been retained by Aston Funds, a Delaware statutory trust (the “Trust”), a registered management investment company under the Investment Company Act of 1940, as amended (the “1940 Act”), to provide investment advisory services to the Trust with respect to certain series of the Trust set forth in Schedule A hereto as may be amended from time to time (hereinafter referred to as a “Fund” and, collectively, the “Funds” of the Trust);
WHEREAS, the Investment Adviser wishes to enter into a contract with the Subadviser to provide research, analysis, advice and recommendations with respect to the purchase and sale of securities, and make investment commitments with respect to such portion of the Funds’ assets as shall be allocated to the Subadviser by the Investment Adviser from time to time (the “Allocated Assets”), subject to oversight by the Trustees of the Trust and the supervision of the Investment Adviser.
NOW THEREFORE, in consideration of the mutual agreements herein contained, and intending to be bound, the parties agree as follows:
1. In accordance with the Investment Advisory Agreement between the Trust and the Investment Adviser (“Investment Advisory Agreement”) with respect to the Funds, the Investment Adviser hereby appoints the Subadviser to act as subadviser with respect to the Allocated Assets for the period and on the terms set forth in this Agreement. The Subadviser accepts such appointment and agrees to render the services set forth herein, for the compensation provided herein.
2. As compensation for the services enumerated herein, the Investment Adviser will pay the Subadviser a fee with respect to the Allocated Assets, which shall be calculated and payable monthly in arrears based on the average daily net assets of the Fund, in an amount equal to 50% of the positive difference, if any, of (x) the advisory fee payable to the Investment Adviser with respect to the Allocated Assets of the Fund (before reduction of the fee payable to Subadviser) minus (y) the sum of: (i) any investment advisory fees waived by the Investment Adviser pursuant to an expense limitation or reimbursement agreement with the Fund, (ii) any reimbursement of expenses by the Investment Adviser pursuant to an expense limitation or reimbursement agreement with the Fund, and (iii) any payments made by the Investment Adviser to third parties that provide distribution, shareholder services or similar services on behalf of the Fund. If the foregoing calculation results in a negative amount, such amount shall be payable by the Subadviser within 30 days of receipt of notice from the Investment Adviser, which notice shall include the basis for the calculation.
For the purposes of this Agreement, a Fund’s “net assets” shall be determined as provided in the Fund’s then-current Prospectus (as used herein, this term includes the related Statement of Additional Information).
C-1
If this Agreement shall become effective subsequent to the first day of a month, or shall terminate before the last day of a month, the Subadviser’s compensation for such fraction of the month shall be prorated based on the number of calendar days of such month during which the Agreement is effective.
3. This Agreement shall become effective with respect to a Fund as of the date set forth opposite the Fund’s name as set forth on Schedule A hereto (the “Effective Date”), provided that it has been approved by the Trustees of the Trust in accordance with the provisions of the 1940 Act and the rules thereunder and, if so required by the 1940 Act and the rules thereunder, by the shareholders of the Fund in accordance with the requirements of the 1940 Act and the rules thereunder.
4. This Agreement shall continue in effect for the initial term set forth in Schedule A. It shall be renewed automatically thereafter with respect to a Fund by the Investment Adviser and the Subadviser for successive periods not exceeding one year, if and only if such renewal and continuance is specifically approved at least annually by the Board of Trustees of the Trust or by a vote of the majority of the outstanding voting securities of the Fund as prescribed by the 1940 Act and provided further that such continuance is approved at least annually thereafter by a vote of a majority of the Trust’s Trustees, who are not parties to such Agreement or interested persons of such a party, cast in person at a meeting called for the purpose of voting on such approval. This Agreement will terminate with respect to a Fund without the payment of any penalty upon termination of the Investment Advisory Agreement relating to the Fund by either party thereto (accompanied by simultaneous notice to the Subadviser) or upon sixty days’ written notice to the Subadviser that the Trustees of the Trust, the Investment Adviser or the shareholders by vote of a majority of the outstanding voting securities of the Fund, as provided by the 1940 Act, have terminated this Agreement. Notwithstanding the foregoing, this Agreement may be terminated upon less than sixty days’ notice to the Subadviser upon a material breach of this Agreement or if the Trustees determine that other circumstances have, or likely will have, a material adverse effect on the Subadviser’s abilities to perform its obligations hereunder, including without limitation, notification of the departure of a portfolio manager of the Fund or other key personnel change. This Agreement may also be terminated by the Subadviser with respect to a Fund without penalty upon sixty days’ written notice to the Investment Adviser and the Trust.
This Agreement shall terminate automatically with respect to a Fund in the event of its assignment or, upon notice thereof to the Subadviser, the assignment of the Investment Advisory Agreement, unless its continuation thereafter is approved by the Board of Trustees of the Trust and the shareholders of the Fund if so required by the 1940 Act (in each case as the term “assignment” is defined in Section 2(a)(4) of the 1940 Act, subject to such exemptions as may be granted by the Securities and Exchange Commission (“SEC”) by any rule, regulation, order or interpretive guidance).
5. Subject to the oversight of the Board of Trustees of the Trust and the Investment Adviser, the Subadviser will provide an investment program for the Allocated Assets, including investment research and management with respect to securities and investments, including cash and cash equivalents, and will determine from time to time what securities and other investments will be purchased, retained or sold. The Subadviser will provide the services under this Agreement in accordance with each Fund’s investment objective, policies and restrictions as stated in the Prospectus, as provided to the Subadviser by the Investment Adviser. The Subadviser further agrees that, in all matters relating to the performance of this Agreement, it:
(a) shall act in conformity with the Trust’s Declaration of Trust, By-Laws and currently effective registration statements under the 1940 Act and the Securities Act of 1933 (the “1933 Act”) and any amendments or supplements thereto (the “Registration Statements”) and with the written policies, procedures and guidelines of each Fund, and written instructions and directions of the Trustees of the Trust and shall comply with the requirements of the 1940 Act and the Investment Advisers Act of
C-2
1940 (the “Advisers Act”) and the rules thereunder, and all other applicable federal and state laws and regulations. The Trust agrees to provide Subadviser with copies of the Trust’s Declaration of Trust, By-Laws, Registration Statements, written policies, procedures and guidelines, and written instructions and directions of the Trustees, and any amendments or supplements to any of them at, or, if practicable, before the time such materials, instructions or directives become effective;
(b) will maintain at all times during the term of this Agreement, in full force and effect, insurance, including without limitation errors and omissions insurance, with reputable insurance carriers, in such amounts, covering such risks and liabilities, and with such deductibles and self-insurance as are consistent with customary industry practice;
(c) will pay expenses incurred by it in connection with its activities under this Agreement other than the cost of securities and other investments (including brokerage commissions and other transaction charges, if any) purchased for each Fund, provided that the Subadviser will not pay for or provide a credit with respect to any research provided to it in accordance with Section 5(d);
(d) will place orders pursuant to its investment determinations for the Allocated Assets either directly with any broker or dealer, or with the issuer. In placing orders with brokers or dealers, the Subadviser will attempt to obtain the best overall price and the most favorable execution of its orders. Subject to policies established by the Trustees of the Trust and communicated to the Subadviser, it is understood that the Subadviser will not be deemed to have acted unlawfully, or to have breached a fiduciary duty to the Trust or in respect of a Fund, or be in breach of any obligation owing to the Investment Adviser or the Trust or in respect of a Fund under this Agreement, or otherwise, solely by reason of its having caused the Fund to pay a member of a securities exchange, a broker or a dealer a commission for effecting a securities transaction for the Fund in excess of the amount of commission another member of an exchange, broker or dealer would have charged if the Subadviser determines in good faith that the commission paid was reasonable in relation to the brokerage or research services (as those terms are defined in Section 28(e) of the Securities Exchange Act of 1934 and interpretive guidance issued by the SEC thereunder) provided by such member, broker or dealer, viewed in terms of that particular transaction or the Subadviser’s overall responsibilities with respect to the accounts, including the Fund, as to which it exercises investment discretion;
(e) will review the daily valuation of securities comprising the Allocated Assets of each Fund as obtained on a daily basis by the Fund’s administrator and furnished by it to Subadviser, and will promptly notify the Trust and the Investment Adviser if the Subadviser believes that any such valuations may not properly reflect the market value of any securities owned by the Fund, provided, however, that the Subadviser is not required by this subparagraph to obtain valuations of any such securities from brokers or dealers or otherwise, or to otherwise independently verify valuations of any such securities;
(f) unless otherwise instructed, will be responsible for voting all proxies of the Allocated Assets in accordance with the Proxy Voting Policies and Guidelines of Subadviser (the “Proxy Policy”), provided that such Proxy Policy and any amendments thereto are furnished to the Trust;
(g) will attend regular business and investment-related meetings with the Trust’s Board of Trustees and the Investment Adviser if requested to do so by the Trust and/or the Investment Adviser, and at its expense, shall supply the Board, the officers of the Trust, and the Investment Adviser with all information and reports reasonably required by them and reasonably available to the Subadviser relating to the services provided by the Subadviser hereunder;
C-3
(h) will maintain books and records with respect to the securities transactions for the Allocated Assets of each Fund and proxy voting record for the Allocated Assets of the Fund, furnish to the Investment Adviser and the Trust’s Board of Trustees such periodic and special reports as they may request with respect to the Fund, and provide in advance to the Investment Adviser all of the Subadviser’s reports to the Trust’s Board of Trustees for examination and review within a reasonable time prior to the Trust’s Board meetings; and
(i) will pay reasonable expenses incurred by the Trust for any matters related to any transaction or event that is deemed to result in a change of control of the Subadviser or otherwise result in the assignment of the Sub-Investment Advisory Agreement under the 1940 Act.
6. The Investment Adviser or its affiliates may, from time to time, engage other subadvisers to advise other series of the Trust (or portions thereof) or other registered investment companies (or series or portions thereof) that may be deemed to be under common control (each a “Sub-Advised Fund”). The Subadviser agrees that it will not consult with any other subadviser engaged by the Investment Adviser or its affiliates with respect to transactions in securities or other assets concerning a Fund or another Sub-Advised Fund, except to the extent permitted by the rules under the 1940 Act that permit certain transactions with a subadviser or its affiliates.
7. Subadviser agrees with respect to the services provided to each Fund that:
(a) it will promptly communicate to the Investment Adviser such information relating to Fund transactions as the officers and Trustees of the Trust may reasonably request and as communicated to the Subadviser;
(b) it will treat confidentially and as proprietary information of the Trust all records and other information relative to each Fund and its prior, present or potential shareholders (“Confidential Information”), will comply at all times with all applicable laws and regulations relating to the confidentiality of “nonpublic personal information” including the Gramm-Leach-Bliley Act or other federal or state privacy laws and the regulations promulgated thereunder, and will not use such Confidential Information for any purpose other than the performance of its responsibilities and duties hereunder (except after prior notification to and approval in writing by the Trust, which approval may not be withheld where Subadviser is advised by counsel that the Subadviser may be exposed to civil or criminal contempt or other proceedings for failure to comply, when requested to divulge such information by duly constituted authorities, or when so requested by the Trust); and
(c) during the term of this Agreement and for a period of eighteen (18) months following the termination of this Agreement, Subadviser (and its directors, officers, stockholders, employees, and agents) will not, directly or indirectly, solicit or induce any of the Fund’s shareholders to be withdrawn from investment in any series of the Trust.
8. Each party represents and warrants to the other party that the execution, delivery and performance of this Agreement is within its powers and have been duly authorized by all necessary actions of its directors or members, and no action by, or in respect of, or filing with, any governmental body, agency or official is required on the part of either party for execution, delivery and performance of this Agreement, and the execution, delivery and performance by either party of this Agreement do not contravene or constitute a violation of, or a material default under, (i) any provision of applicable law, rule or regulation, (ii) such party’s governing instruments, or (iii) any agreement, judgment, injunction, order, decree or other instrument binding upon such party.
C-4
9. In compliance with the requirements of Rule 31a-3 under the 1940 Act, Subadviser acknowledges that all records which it maintains for the Trust are the property of the Trust and agrees to surrender promptly to the Trust any of such records upon the Trust’s request, provided that Subadviser may retain copies thereof at its own expense. Subadviser further agrees to preserve for the periods prescribed by Rule 31a-2 under the 1940 Act the records required to be maintained by Rule 31a-1 under the 1940 Act relating to transactions placed by Subadviser for the Fund. Subadviser further agrees to maintain each Fund’s proxy voting record with respect to the Allocated Assets in a form mutually agreeable between the parties and which contains the information required by Form N-PX under the 1940 Act.
10. It is expressly understood and agreed that the services to be rendered by the Subadviser to the Investment Adviser under the provisions of this Agreement are not to be deemed to be exclusive, and the Subadviser shall be free to provide similar or different services to others so long as its ability to provide the services provided for in this Agreement shall not be materially impaired thereby. In addition, but without limiting any separate agreement between the Subadviser and the Investment Adviser to the contrary, nothing in this Agreement shall limit or restrict the right of any director, officer, or employee of the Subadviser who may also be a Trustee, officer, or employee of the Trust, to engage in any other business or to devote his or her time and attention in part to the management or other aspects of any other business, whether of a similar nature or a dissimilar nature.
11. The Investment Adviser agrees that it will furnish currently to the Subadviser all information with reference to each Fund and the Trust that is reasonably necessary to permit the Subadviser to carry out its responsibilities under this Agreement, and the parties agree that they will from time to time consult and make appropriate arrangements as to specific information that is required under this paragraph and the frequency and manner with which it shall be supplied. Without limiting the generality of the foregoing, Investment Adviser will furnish to Subadviser procedures consistent with the Trust’s contract with each Fund’s custodian from time to time (the “Custodian”), and reasonably satisfactory to Subadviser, for consummation of portfolio transactions for each Fund by payment to or delivery by the Custodian of all cash and/or securities or other investments due to or from the Fund, and Subadviser shall not have possession or custody thereof or any responsibility or liability with respect to such custody. Upon giving proper instructions to the Custodian, Subadviser shall have no responsibility or liability with respect to custodial arrangements or the acts, omissions or other conduct of the Custodian.
12. The Subadviser and its directors, officers, stockholders, employees and agents shall not be liable for any error of judgment or mistake of law or for any loss suffered by the Investment Adviser or the Trust in connection with any matters to which this Agreement relates or for any other act or omission in the performance by the Subadviser of its duties under this Agreement except that nothing herein contained shall be construed to protect the Subadviser against any liability by reason of the Subadviser’s willful misfeasance, bad faith, or gross negligence in the performance of its duties or by reckless disregard of its obligations or duties under this Agreement.
13. Each party shall indemnify and hold harmless the other party and its respective control persons (as described in Section 15 of the 1933 Act) and their respective directors, stockholders, members and employees (collectively, “Indemnitees”) against any and all losses, claims, damages, liabilities or expenses (including reasonable legal and other expenses of investigating or defending any alleged loss, claim, damages or liabilities) to which any of the Indemnitees may become subject under the 1933 Act, the 1940 Act, or the Advisers Act, or under any other statute, at common law or otherwise, arising out of or based on (i) any willful misfeasance, bad faith, or gross negligence of the other party in the performance of, or reckless disregard of, any of its duties or obligations hereunder, or (ii) any material breach of this Agreement by the other party.
C-5
14. If any provision of this Agreement shall be held or made invalid by a court decision, statute, rule or otherwise, the remainder of the Agreement shall not be affected thereby. Except to the extent governed by federal law including the 1940 Act, this Agreement shall be governed by, and construed in accordance with, the laws of the State of Delaware, without applying the principles of conflicts of law thereunder.
15. No provision of this Agreement may be changed, discharged or terminated orally, but only by an instrument in writing signed by the party against which enforcement of the change, discharge or termination is sought. No amendment of this Agreement shall be effective with respect to the Trust until approved as required by applicable law.
16. Any notice to be given hereunder may be given by personal notification or by facsimile transmission, to the party specified at the address stated below:
To the Investment Adviser at:
Aston Asset Management, LP
120 N. LaSalle Street
25th Floor
Chicago, IL 60602
Attn: President
Facsimile: (312) 268-1380
To the Subadviser at:
Lee Munder Capital Group, LLC
200 Clarendon Street
28th Floor
Boston, Massachusetts 02116
Attn: Client Service Director
Facsimile: (617) 380-5598
To a Fund or the Trust at:
Aston Funds
120 N. LaSalle Street
25th Floor
Chicago, IL 60602
Attn: President
Facsimile: (312) 268-1380
or addressed as such party may from time to time designate by notice to other parties in accordance herewith.
17. The Subadviser agrees that for any claim by it against a Fund in connection with this Agreement or the services rendered under this Agreement, it shall look only to assets of a Fund for satisfaction and that it shall have no claim against the assets of any other portfolios of the Trust.
[The Remainder of Page Intentionally Left Blank]
C-6
IN WITNESS WHEREOF, the parties hereto have caused this Agreement to be signed by their duly authorized officers as of the day and year first above written.
| | |
| ASTON ASSET MANAGEMENT, LP |
| |
| By: | | |
| | |
| Name: | | Gerald Dillenburg |
| |
| Title: | | CCO |
| | |
|
| LEE MUNDER CAPITAL GROUP, LLC |
| |
| By: | | |
| | |
| Name: | | Joseph F. Tower III |
| |
| Title: | | COO & CCO |
C-7
SCHEDULE A
| | | | |
Fund | | Effective Date | | Initial Term |
| | |
| ASTON Small Cap Growth Fund (to be renamed ASTON/LMCG Small Cap Growth Fund) | | February 17, 2012 | | December 31, 2013 |
| | |
| ASTON Small Cap Fund | | January 31, 2013 | | December 31, 2013 |
C-8
APPENDIX D
PRINCIPAL EXECUTIVE OFFICERS AND DIRECTORS OF ASTON AND LMCG
[To Come]
D-1
APPENDIX E
TRUSTEES AND EXECUTIVE OFFICERS OWNERSHIP OF TARGET FUND SHARES
[To Come]
E-1
EVERY SHAREHOLDER’S VOTE IS IMPORTANT
| | | | |
| | EASY VOTING OPTIONS: |
| | |
| |  | | VOTE ON THE INTERNET Log on to: www.proxy-direct.com or scan the QR code Follow the on-screen instructions available 24 hours |
| | |
| |  | | VOTE BY PHONE Call 1-800-337-3503 Follow the recorded instructions available 24 hours |
| | |
| |  | | VOTE BY MAIL Vote, sign and date this Proxy Card and return in the postage-paid envelope |
| | |
| |  | | VOTE IN PERSON Attend the Shareholder Meeting [4400 Computer Drive Westborough, MA 01581] on [April , 2013] |
Please detach at perforation before mailing.
| | | | |
PROXY | | ASTON SMALL CAP FUND (formerly, ASTON/Veredus Small Cap Growth) SPECIAL MEETING OF SHAREHOLDERS TO BE HELD ON [APRIL , 2013] | | PROXY |
THIS PROXY IS BEING SOLICITED BY THE BOARD OF TRUSTEES. The undersigned shareholder(s) of the ASTON Small Cap Fund (formerly, ASTON/Veredus Small Cap Growth Fund), a series of Aston Funds (the “Trust”), revoking previous proxies, hereby appoints [ ] or any one of them true and lawful attorneys with power of substitution of each, to vote all shares of ASTON Small Cap Fund which the undersigned is entitled to vote, at the Special Meeting of Shareholders to be held on [April , 2013], at [10:00 a.m.] Eastern time, [at the offices of BNY Mellon Investment Servicing (US) Inc., 4400 Computer Drive, Westborough, MA 01581,] and at any adjournment or postponement thereof as indicated on the reverse side. In their discretion, the proxy holders named above are authorized to vote upon such other matters as may properly come before the meeting.
Receipt of the Notice of the Special Meeting of Shareholders and the accompanying Proxy Statement/Prospectus is hereby acknowledged. The shares of ASTON Small Cap Fund represented hereby will be voted as indicated or FOR the proposal if no choice is indicated.
| | |
| | VOTE VIA THE INTERNET: www.proxy-direct.com |
| | VOTE VIA TELEPHONE: 1-800-337-3503 |
| | |
| | Please sign exactly as your name appears at left. Joint owners each should sign. When signing as attorney, executor, administrator, trustee or guardian, please give full title as such. If a corporation, please sign in full corporate name by president or authorized officer. If a partnership, please sign in partnership name by authorized person. Please sign, date and return. |
| | |
| | Signature and Title, if applicable |
| | |
| | Signature (if held jointly) |
| | |
| | Date AST_24317_012913A |
EVERY SHAREHOLDER’S VOTE IS IMPORTANT
Important Notice Regarding the Availability of Proxy Materials for the
ASTON Small Cap Fund
Shareholders Meeting to Be Held on [April , 2013]
The Proxy Statement/Prospectus and Proxy Card for this meeting are available at:
https://www.proxy-direct.com/ast-24317
IF YOU VOTE ON THE INTERNET OR BY TELEPHONE,
YOU NEED NOT RETURN THIS PROXY CARD
Please detach at perforation before mailing.
Properly executed proxies will be voted as specified. If no other specification is made, such shares will be voted “FOR” the proposal.
TO VOTE, MARK BLOCKS BELOW IN BLUE OR BLACK INK. Example: ¢
| | | | | | | | | | | | | | | | |
| | | | | | FOR | | | | AGAINST | | | | ABSTAIN | | |
1. | | To approve an Agreement and Plan of Reorganization (and the related transactions) which provides for (i) the transfer of all the assets of ASTON Small Cap Fund (formerly, ASTON/Veredus Small Cap Growth Fund) (the “Target Fund”) to ASTON/LMCG Small Cap Growth Fund (formerly, ASTON Small Cap Growth Fund) (the “Acquiring Fund”)in exchange solely for shares of beneficial interest of the Acquiring Fund and the assumption by the Acquiring Fund of all the liabilities of the Target Fund; and (ii) the distribution by the Target Fund of all the shares of each class of the Acquiring Fund received by the Target Fund to the holders of shares of the corresponding class of the Target Fund in complete liquidation and termination of the Target Fund. | | | | ¨ | | | | ¨ | | | | ¨ | | |
| | | | | | | | |
2. | | To transact such other business as may properly come before the meeting or any adjournment or postponement thereof. | | | | | | | | | | | | | | |
PLEASE SIGN AND DATE ON THE REVERSE SIDE
AST_24317_012913A
STATEMENT OF ADDITIONAL INFORMATION
Dated , 2013
Relating to the Acquisition of the Assets and Liabilities of
ASTON Small Cap Fund (formerly, ASTON/Veredus Small Cap Growth)
120 N. LaSalle St.
Chicago, Illinois 60602
Telephone: (312) 268-1400
This Statement of Additional Information (“SAI”) is not a prospectus but should be read in conjunction with the Proxy Statement/Prospectus dated , 2013 for use in connection with the Special Meeting of Shareholders (the “Special Meeting”) of ASTON Small Cap Fund (the “Target Fund”), a series of Aston Funds (the “Trust”), to be held on April [ ], 2013. At the Special Meeting, shareholders of the Target Fund will be asked to approve the reorganization (the “Reorganization”) of the Target Fund into ASTON/LMCG Small Cap Growth Fund (the “Acquiring Fund” and together with the Target Fund, the “Funds”) as described in the Proxy Statement/Prospectus. Copies of the Proxy Statement/Prospectus may be obtained at no charge by writing to the Trust at the address shown above or by calling (800) 992-8151.
Further information about the Funds is contained in the Trust’s Statement of Additional Information dated February 28, 2013 which is incorporated herein by reference only insofar as it relates to the Target Fund or Acquiring Fund. No other parts are incorporated by reference herein.
The unaudited pro forma financial information, attached hereto as Appendix A, is intended to present the financial condition and related results of operations of the Acquiring Fund as if the Reorganization had been consummated on October 31, 2012.
The Trust’s audited financial statements and related independent registered public accounting firm’s report contained in the Trust’s Annual Report for the fiscal year ended October 31, 2012 are incorporated herein by reference only insofar as they relate to the Acquiring Fund and the Target Fund. No other parts of the Annual Report are incorporated by reference herein.
The date of this Statement of Additional Information is , 2013.
1
APPENDIX A
PRO FORMA FINANCIAL INFORMATION
The unaudited pro forma financial information set forth below is for informational purposes only and does not purport to be indicative of the financial condition that actually would have resulted if the Reorganization had been consummated. These pro forma numbers have been estimated in good faith based on information regarding the Target Fund and Acquiring Fund as of October 31, 2012, using the fees and expenses information shown in the Proxy Statement/Prospectus. The unaudited pro forma financial information should be read in conjunction with the historical financial statements of the Target Fund and Acquiring Fund, which are available in the Trust’s Annual Report.
Narrative Description of the Pro Forma Effects of the Reorganization
Note 1—Reorganization
The unaudited pro forma information has been prepared to give effect to the proposed Reorganization of the Target Fund into the Acquiring Fund pursuant to an Agreement and Plan of Reorganization (the “Agreement”) as if the Reorganization had occurred on October 31, 2012, except as noted in Note 3 below.
| | |
Target Fund | | Acquiring Fund |
| |
ASTON Small Cap Fund | | ASTON/LMCG Small Cap Growth Fund |
Note 2—Basis of Pro Forma
The Reorganization will be accounted for as a reorganization for federal income tax purposes; therefore, no gain or loss will be recognized by the Target Fund or its shareholders as a direct result of the Reorganization. The Target Fund and the Acquiring Fund are both series of the Trust, a registered open-end management investment company. The Reorganization would be accomplished by the acquisition of all of the assets and the assumption of all of the liabilities of the Target Fund by the Acquiring Fund in exchange for shares of the Acquiring Fund and the distribution of such shares to Target Fund shareholders in complete liquidation of the Target Fund. The table below shows the class and shares that Target Fund shareholders would have received if the Reorganization had taken place on October 31, 2012.
| | | | |
Target Fund Share Class | | Acquiring Fund
Shares Issued | | Acquiring Fund
Share Class |
| | |
N | | 1,905,690 | | N |
I | | 209,453 | | I |
Under accounting principles generally accepted in the United States of America, the historical cost of investment securities will be carried forward to the surviving entity, the Acquiring Fund, and the results of operations of the Acquiring Fund for pre-reorganization periods will not be restated.
| | | | | | |
Fund | | Net Assets | | | As-of Date |
| | |
ASTON Small Cap Fund (Target Fund) | | | 24,163,305 | | | 10/31/12 |
ASTON/LMCG Small Cap Growth Fund
(Acquiring Fund) | | | 6,413,230 | | | 10/31/12 |
ASTON/LMCG Small Cap Growth Fund (Pro Forma Combined) | | | 30,576,535 | | | 10/31/12 |
1
Note 3—Pro Forma Adjustments
The table below reflects adjustments to annual expenses made to the pro forma combined fund financial information as if the Reorganization had taken place on October 31, 2012 using the fees and expenses information shown in the Proxy Statement/Prospectus. The pro forma information has been derived from the books and records used in calculating daily net asset values of the Target Fund and Acquiring Fund and has been prepared in accordance with accounting principles generally accepted in the United States of America, which require management to make estimates and assumptions that affect this information. Actual results could differ from those estimates.
| | |
Expense Category | | Increase
(Decrease) |
Management Fees(1) | | – |
Professional fees(2) (3) | | $62,505 |
Shareholders’ reports–printing and mailing expenses(4) | | $19,400 |
Custodian’s fees and expenses(2) | | – |
Federal and state registration fees(2) | | $(31,689) |
Investment Advisory fees waived | | $(32,260) |
Transfer agent fees(2) | | $(40,385) |
Administration fees(2) | | $(12,000) |
Other expenses(2) | | $(4,678) |
| (1) | The Funds have the same management fees. |
| (2) | Reflects the anticipated reduction of certain duplicative expenses eliminated as a result of the Reorganization and applicable Reorganization costs. |
| (3) | Includes estimated Reorganization costs of $15,000 for audit and $65,000 for legal. |
| (4) | Reorganization costs related to proxy solicitation. |
No significant accounting policies will change as a result of the Reorganization, specifically policies regarding security valuation or compliance with Subchapter M of the Internal Revenue Code of 1986, as amended.
Note 4—Reorganization Costs
The Target Fund is expected to be charged an estimated $74,200 in Reorganization costs. These costs represent the estimated nonrecurring expense of the Target Fund carrying out its obligations under the Agreement and consist of management’s estimate of professional services fees, printing costs and mailing charges related to the proposed Reorganization to be borne by the Target Fund. The Acquiring Fund is expected to be charged approximately $25,200 of expenses in connection with the Reorganization.
Note 5—Accounting Survivor
The Acquiring Fund will be the accounting survivor. The surviving fund will have the portfolio management team, portfolio composition, strategies, investment objective, expense structure and policies/restrictions of the Acquiring Fund.
Note 6—Capital Loss Carryforward
On October 31, 2012 the Target Fund had capital loss carryforwards of approximately $18,854,524 million. On October 31, 2012 the Acquiring Fund did not have any capital loss carryforwards. For additional information regarding capital loss limitations, please see the section
2
entitled “The Proposed Reorganization—Material Federal Income Tax Consequences” in the Proxy Statement/Prospectus.
3
Aston Funds
Dear Fellow Shareholder:
Of all the phrases that dominated the lexicon of investing during the past several years, perhaps none was more often evoked or more memorable than the prediction that the world had entered a “new normal.” Simply put, the “new normal” camp believed that the macroeconomic dislocations the world had endured since 2007 would take decades to work through and would depress equity and bond returns to levels well below their historical averages in the future.
Admittedly, the past 12 months were anything but normal. Unusually accommodative monetary policies from central banks across the world were designed to stimulate economic growth. Even so, global economic growth remained stubbornly subpar compared with other periods of economic recovery as consumers, businesses, and governments continued to deleverage by curtailing spending and reducing debt. Natural disasters and political upheavals seemed to happen with greater frequency than they had in any time during modern history.
Despite these relatively “abnormal” conditions, there is evidence that some things remained or reverted to the “old” normal during the past year. U.S. stock prices resumed their relationship to corporate earnings, moving higher as earnings results surprised on the upside during most of the past year. U.S. bonds overall were anchored by ultra-low and declining interest rates, though they registered gains during the year. The more credit-sensitive sectors, such as corporate bonds, fared best, helped as well by improved corporate profitability. For the year ending October 31, 2012, the Standard & Poor’s 500 Index, a broad gauge of the U.S. stock market, gained 15.19%, while U.S. investment-grade bonds, as measured by the Barclays U.S. Aggregate Bond Index, advanced 5.25%. Although foreign equity markets produced significantly divergent results for the year, most ended the period with gains.
As we look out on the coming year, we’re mindful that each and every day brings a mixture of both change and normalcy. To capitalize on the opportunities presented by the day-to-day dynamics of markets, our managers apply their vast analytic resources and experience. We give history and the lessons learned from it the deference they deserve by adhering to the proven and time-tested principles that have provided the underpinnings of our long-term investment success.
Given the many choices investors enjoy, we are grateful to you for your continued support of the Aston Funds family and are pleased to present you with the Aston Funds annual report.
Sincerely,

Kenneth C. Anderson
President
Aston Funds
|
| The views expressed in this report reflect those of the portfolio managers only, through the end of the period covered and do not necessarily represent the views of Aston Funds or Aston Asset Management, LP. Any such views are subject to change at any time based upon market or other conditions and Aston Funds and Aston Asset Management, LP disclaim any responsibility to update such views. These views may not be relied on as investment advice and, because investment decisions for an Aston Fund are based on numerous factors, may not be relied on as an indication of trading intent on behalf of any Aston Fund. |
Aston Funds
Large Cap Funds
ASTON/Montag & Caldwell Growth Fund
ASTON/Veredus Select Growth Fund
ASTON/TAMRO Diversified Equity Fund
ASTON/Herndon Large Cap Value Fund
ASTON/Cornerstone Large Cap Value Fund
Equity Income Funds
ASTON/River Road Dividend All Cap Value Fund
ASTON/River Road Dividend All Cap Value Fund II
Mid Cap Funds
ASTON/Fairpointe Mid Cap Fund
ASTON/Montag & Caldwell Mid Cap Growth Fund
Table of Contents
Small Cap Funds
ASTON/Veredus Small Cap Growth Fund
(formerly, the ASTON/Veredus Aggressive Growth Fund)
ASTON Small Cap Growth Fund
(formerly, the ASTON/Crosswind Small Cap Growth Fund)
ASTON/Silvercrest Small Cap Fund
ASTON/TAMRO Small Cap Fund
ASTON/River Road Select Value Fund
ASTON/River Road Small Cap Value Fund
ASTON/River Road Independent Value Fund
Fixed Income Funds
ASTON/DoubleLine Core Plus Fixed Income Fund ASTON/TCH Fixed Income Fund
Alternative Funds
ASTON/Lake Partners LASSO Alternatives Fund ASTON Dynamic Allocation Fund
ASTON/Anchor Capital Enhanced Equity Fund
(formerly, the ASTON/M.D. Sass Enhanced Equity Fund)
ASTON/River Road Long-Short Fund
International Fund
ASTON/Barings International Fund
Sector Fund
ASTON/Harrison Street Real Estate Fund
Balanced Fund
ASTON/Montag & Caldwell Balanced Fund
This report is submitted for general information to the shareholders of the funds. It is not authorized for distribution to prospective investors in the funds unless preceded or accompanied by an effective prospectus which includes details regarding the funds’ objectives, policies, expenses and other information.
Aston Funds are distributed by Foreside Funds Distributors LLC, 400 Berwyn Park, 899 Cassatt Road, Berwyn, PA 19312
Shareholder Services 800-992-8151 • www.astonfunds.com
NOT FDIC INSURED • NO BANK GUARANTEE • MAY LOSE VALUE
ASTON/Montag & Caldwell Growth Fund
| | |
| |
| Portfolio Manager Commentary (unaudited) | | October 31, 2012 |
| | Ronald E. Canakaris, CFA, CIC |
| Q. | What were the most significant market factors affecting Fund performance and returns relative to the benchmark during the past 12 months? |
| A. | Class N Shares of the Fund gained 11.40% during the past year, slightly trailing the Russell 1000 Growth Index gain of 13.02% and the S&P 500, which rose 15.19%. The Fund benefited from good stock selection in the Information Technology, Materials and Industrials sectors, as well as the underweight position to the Energy sector. This was offset by negative stock selection in the Energy and Consumer Discretionary sectors, the Fund’s cash reserve and an underweight position in Information Technology relative to the Fund’s Index. |
| Q. | What were the best performing holdings for the Fund during the period? |
| A. | Visa was the Fund’s top performing stock for the 12-month period, as the company continues to enjoy strong revenue and earnings growth despite the increased regulatory environment. While Apple was the Fund’s second best performing stock on an absolute basis, the Fund’s weighting in the stock is less than the Index and thus, the underweight position slightly detracted from relative performance. TJX had another year of strong gains as the company continues to benefit from consumers’ focus on value in the weak economic environment. The Fund established a position in Amazon as the company is hopeful of accelerating growth in existing markets, has opportunity for expansion in international markets and is well positioned to benefit from increased consumption of digital media. The stock performed well during the period and the Fund exited the position after the stock appreciated to a 20% premium to our estimated present value. eBay was purchased during the period and enjoyed strong gains, as the company continues to benefit from growth in online commerce and it has become a leader in online payments with its PayPal division. |
| Q. | What were the weakest performing holdings? |
| A. | We initiated a position in Juniper Networks during the period after the stock had been weak, but it declined further subsequent to our purchase. While earnings are sub-par in 2012, as carriers have deferred spending, Juniper is well positioned to benefit from the company’s five new product launches and an expected return to normal carrier spending patterns in 2013. Occidental Petroleum was weak, as the company has experienced rising costs, which tempered investors’ enthusiasm for the company’s above industry production growth. A position was established in Starbucks during the period, but the stock declined after the purchase, as revenues were less than expected over the summer due to the weak economic environment. We continue to favor the company as it has continued domestic and international growth opportunities and is benefiting from declining commodity costs. JP Morgan declined during the period and was eliminated, as financial stocks continued to suffer multiple compression due to the global debt crisis and increased regulatory requirements. |
| Q. | How was the Fund positioned as of October 31, 2012? |
| A. | While central bank actions are supportive of share prices and may limit the stock market’s downside risk, the market may have gotten ahead of its fundamentals, and it would not be surprising if the period ahead is more challenging. Global economic growth has weakened; corporate profit growth has slowed; corporate profit expectations seem too high with global growth slowing and profit margins near record levels; and it is uncertain if the “fiscal cliff” will be dealt with effectively after the election. We believe the outlook for the higher quality growth stocks held in the Fund is very promising. The shares of these companies are reasonably valued, and their earnings growth potential is more assured due to their financial strength and global diversification. In addition, many of the Fund’s holdings have above average dividend yields and dividend growth prospects. |
Growth of a Hypothetical
$10,000 Investment—Class N
All dividends and capital gains are reinvested. Indexes are unmanaged and do not take into account fees, expenses or other costs.
Returns shown in the chart and table do not reflect taxes that a shareholder would pay on Fund distributions or on the sale of the Fund shares.
RETURNSFOR PERIOD ENDED 10/31/12
Average Annual Total Returns - Class N
| | | | |
One Year | | | 11.40 | % |
Five Year | | | 1.10 | % |
Ten Year | | | 5.91 | % |
Since Inception | | | 8.46 | % |
Inception Date 11/02/94
Average Annual Total Returns - Class I
| | | | |
One Year | | | 11.67 | % |
Five Year | | | 1.35 | % |
Ten Year | | | 6.19 | % |
Since Inception | | | 6.70 | % |
Inception Date 06/28/96
Average Annual Total Returns - Class R
| | | | |
One Year | | | 11.10 | % |
Five Year | | | 0.86 | % |
Since Inception | | | 6.01 | % |
Inception Date 12/31/02
The performance data quoted represents past performance. Past performance does not guarantee future results. Investment return and principal value will fluctuate so that an investor’s shares, upon redemption, may be worth more or less than their original cost. Current performance may be lower or higher than the performance data quoted. For performance data current to the most recent month-end, please visit our website at www.astonfunds.com.
The total expense ratio for the Class N, Class I and Class R Shares is 1.07%, 0.82% and 1.32% respectively, as disclosed in the prospectus dated March 1, 2012. Please refer to the Financial Highlights section in this report for more 2012 fiscal year-end related information.
| | |
| |
| ASTON/Montag & Caldwell Growth Fund | | October 31, 2012 |
| |
| Schedule of Investments | | |
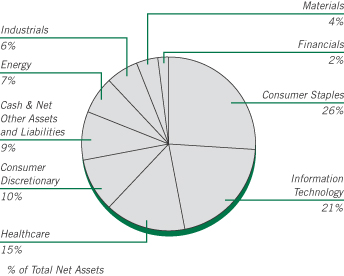
| | | | | | | | |
Shares | | | | | Market
Value | |
|
| | COMMON STOCKS – 91.03% | |
| | |
| | | | Consumer Discretionary – 9.71% | | | | |
| | 1,421,300 | | | Bed Bath & Beyond * | | $ | 81,980,584 | |
| | 828,400 | | | Las Vegas Sands | | | 38,470,896 | |
| | 752,400 | | | McDonald’s | | | 65,308,320 | |
| | 500,000 | | | NIKE, Class B | | | 45,690,000 | |
| | 888,500 | | | Omnicom Group | | | 42,568,035 | |
| | 1,951,500 | | | Starbucks | | | 89,573,850 | |
| | 1,355,900 | | | TJX | | | 56,446,117 | |
| | | | | | | | |
| | | | | | | 420,037,802 | |
| | | | | | | | |
| | |
| | | | Consumer Staples – 26.24% | | | | |
| | 5,339,000 | | | Coca-Cola | | | 198,504,020 | |
| | 1,274,418 | | | Colgate-Palmolive | | | 133,762,913 | |
| | 1,326,300 | | | Costco Wholesale | | | 130,547,709 | |
| | 1,705,900 | | | Kraft Foods Group * | | | 77,584,332 | |
| | 5,766,700 | | | Mondelez International, Class A | | | 153,048,218 | |
| | 1,512,500 | | | PepsiCo | | | 104,725,500 | |
| | 1,594,000 | | | Philip Morris International | | | 141,164,640 | |
| | 1,475,000 | | | Procter & Gamble | | | 102,129,000 | |
| | 2,533,700 | | | Unilever (Netherlands) | | | 92,961,453 | |
| | | | | | | | |
| | | | | | | 1,134,427,785 | |
| | | | | | | | |
| | |
| | | | Energy – 6.61% | | | | |
| | 2,127,300 | | | Cameron International * | | | 107,726,472 | |
| | 1,400,000 | | | Occidental Petroleum | | | 110,544,000 | |
| | 969,800 | | | Schlumberger | | | 67,430,194 | |
| | | | | | | | |
| | | | | | | 285,700,666 | |
| | | | | | | | |
| | |
| | | | Financials – 2.30% | | | | |
| | 2,950,100 | | | Wells Fargo | | | 99,388,869 | |
| | | | | | | | |
| | |
| | | | Healthcare – 14.93% | | | | |
| | 2,843,300 | | | Abbott Laboratories | | | 186,293,016 | |
| | 1,574,900 | | | Allergan | | | 141,615,008 | |
| | | | | | | | |
Shares | | | | | Market
Value | |
| | |
| | | | Healthcare (continued) | | | | |
| | 2,400,000 | | | AmerisourceBergen | | $ | 94,656,000 | |
| | 2,104,254 | | | Express Scripts * | | | 129,495,791 | |
| | 1,774,500 | | | Stryker | | | 93,338,700 | |
| | | | | | | | |
| | | | | | | 645,398,515 | |
| | | | | | | | |
| | |
| | | | Industrials – 6.27% | | | | |
| | 8,355,500 | | | General Electric | | | 175,966,830 | |
| | 1,300,000 | | | United Parcel Service, Class B | | | 95,225,000 | |
| | | | | | | | |
| | | | | | | 271,191,830 | |
| | | | | | | | |
| | |
| | | | Information Technology – 21.37% | | | | |
| | 1,007,800 | | | Accenture, Class A (Ireland) | | | 67,935,798 | |
| | 257,180 | | | Apple | | | 153,047,818 | |
| | 1,874,200 | | | eBay * | | | 90,505,118 | |
| | 1,548,100 | | | EMC * | | | 37,804,602 | |
| | 120,000 | | | Google, Class A * | | | 81,572,400 | |
| | 4,647,787 | | | Juniper Networks * | | | 77,013,831 | |
| | 4,100,100 | | | Oracle | | | 127,308,105 | |
| | 2,800,000 | | | Qualcomm | | | 164,010,000 | |
| | 900,000 | | | Visa, Class A | | | 124,884,000 | |
| | | | | | | | |
| | | | | | | 924,081,672 | |
| | | | | | | | |
| | |
| | | | Materials – 3.60% | | | | |
| | 1,807,400 | | | Monsanto | | | 155,562,918 | |
| | | | | | | | |
| | |
| | | | Total Common Stocks
(Cost $3,468,623,067) | | | 3,935,790,057 | |
| | | | | | | | |
|
| | INVESTMENT COMPANY – 8.96% | |
| | |
| | 387,376,867 | | | BlackRock Liquidity Funds
TempCash Portfolio | | | 387,376,867 | |
| | | | | | | | |
| | |
| | | | Total Investment Company
(Cost $387,376,867) | | | 387,376,867 | |
| | | | | | | | |
| Total Investments – 99.99%
(Cost $3,855,999,934)** | | | 4,323,166,924 | |
| | | | | | | | |
| Net Other Assets and Liabilities – 0.01% | | | 411,957 | |
| | | | | | | | |
| Net Assets – 100.00% | | $ | 4,323,578,881 | |
| | | | | | | | |
| * | | Non-income producing security. |
| ** | | Aggregate cost for Federal income tax purposes is $3,863,518,548. |
| | | | |
Gross unrealized appreciation | | $ | 503,529,353 | |
Gross unrealized depreciation | | | (43,880,977 | ) |
| | | | |
Net unrealized appreciation | | $ | 459,648,376 | |
| | | | |
See accompanying Notes to Financial Statements.
ASTON/Veredus Select Growth Fund
| | |
| |
| Portfolio Manager Commentary (unaudited) | | October 31, 2012 |
| B. Anthony Weber; Charles F. Mercer, Jr., CFA; Michael E. Johnson, CFA; |
| John R. Prys, CFA & Katherine A. Kuntz, CFA |
| Q. | What were the most significant market factors affecting Fund performance and returns relative to the benchmark during the past 12 months? |
| A. | The Fund’s underperformance during the period was primarily due to two extremely poor months at the end of 2011 on the back of a dismal earnings season for some of the holdings in the portfolio. Not owning Apple hurt returns during the first quarter of 2012, a deficit that we were unable make up during the two subsequent quarters. Apple had missed its third quarter 2011 earnings target and we did not want to risk owning the stock going into the 2011 holiday season. That was definitely the wrong call. We did reestablished a position in Apple during the second quarter and still held a position as of the end of October 2012, but nowhere near a benchmark weighting. The environment for our brand of growth investing was also made worse during the period by the market’s tilt toward defensive names and fat dividends. |
| Q. | What were the best performing holdings for the Fund during the period? |
| A. | eBay was the best performing stock in the portfolio, as its PayPal subsidiary and growth in mobile payments propelled the stock strongly higher. Visa continued its quarterly progression of solid results with increasing transaction volumes pushing the stock. Michael Kors, a leading upscale women’s clothing and accessories retailer and the portfolio’s largest holding, gained from its efforts at building one of the most sought after brand names around. |
| Q. | What were the weakest performing holdings? |
| A. | Digital media company Rovi announced third quarter results that missed |
| | estimates and gave weak guidance. This had been a huge stock for the portfolio in the past, but the company missed a tremendous opportunity in the world of digital movie downloads. We exited the stock as it rallied back from the near-term sell-off, though still at a significant loss for the period. Herbalife, the global marketing firm of nutritional supplements, succumbed to multiple rumors that an activist hedge fund manager was in the market shorting the stock. The Fund owned Nokia early in 2012 based on new product flow which was obviously over-hyped, leading to a drop in the stock. |
| Q. | How was the Fund positioned as of October 31, 2012? |
| A. | Consumer Discretionary comprised the largest weighting in the Fund, led by Michael Kors, various specialty retailers, and some homebuilders as lower gasoline prices and enhanced consumer confidence is providing a boost to these areas. Information Technology makes up 19% of the portfolio, but this is somewhat misleading in our view as we think of eBay and Visa as more consumer plays. Not counting those two holdings, the portfolio’s Technology exposure is way down from what it has been historically. Healthcare is the next largest sector, with Illumina and Watson Pharmaceuticals the two largest positions. Financials make up 14.5% led by Citigroup, Energy is 7.2% focused on natural gas names and Materials comprise 9.2% led by Vulcan Materials. The Fund is severely underweight Industrials given the slowing nature of heavy industry. With the “fiscal cliff” looming, 2013 could very well be a difficult year. We will be watching Washington closely and would not rule out getting defensive in the not too distant future. |
Growth of a Hypothetical
$10,000 Investment—Class N
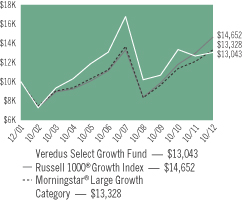
All dividends and capital gains are reinvested. Indexes are unmanaged and do not take into account fees, expenses or other costs.
Returns shown in the chart and table do not reflect taxes that a shareholder would pay on Fund distributions or on the sale of the Fund shares.
RETURNSFOR PERIOD ENDED 10/31/12
Average Annual Total Returns - Class N
| | | | |
One Year | | | 2.97 | % |
Five Year | | | -4.91 | % |
Ten Year | | | 5.99 | % |
Since Inception | | | 2.48 | % |
Inception Date 12/31/01
Average Annual Total Returns - Class I
| | | | |
One Year | | | 3.19 | % |
Five Year | | | -4.67 | % |
Since Inception | | | 1.65 | % |
Inception Date 09/11/06
The performance data quoted represents past performance. Past performance does not guarantee future results. Investment return and principal value will fluctuate so that an investor’s shares, upon redemption, may be worth more or less than their original cost. Current performance may be lower or higher than the performance data quoted. For performance data current to the most recent month-end, please visit our website at www.astonfunds.com.
The total expense ratio for the Class N and Class I Shares is 1.31% and 1.06% respectively, as disclosed in the prospectus dated March 1, 2012. Please refer to the Financial Highlights section in this report for more 2012 fiscal year-end related information.
| | |
| |
| ASTON/Veredus Select Growth Fund | | October 31, 2012 |
| |
| Schedule of Investments | | |
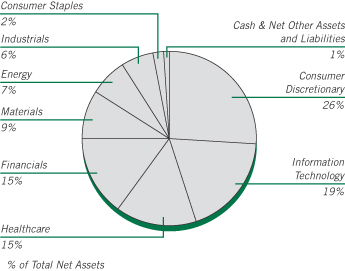
| | | | | | | | |
Shares | | | | | Market
Value | |
| |
| | COMMON STOCKS – 99.75% | | | | |
| | |
| | | | Consumer Discretionary – 26.41% | | | | |
| | 11,400 | | | D.R. Horton | | $ | 238,944 | |
| | 3,625 | | | Dick’s Sporting Goods | | | 181,250 | |
| | 6,600 | | | GNC Holdings, Class A | | | 255,222 | |
| | 6,800 | | | Lennar, Class A | | | 254,796 | |
| | 7,075 | | | Ltd. Brands | | | 338,822 | |
| | 7,275 | | | Mattel | | | 267,575 | |
| | 10,100 | | | Michael Kors Holdings * | | | 552,369 | |
| | 1,525 | | | Panera Bread, Class A * | | | 257,176 | |
| | 93,125 | | | Sirius XM Radio * | | | 260,750 | |
| | 2,525 | | | Tractor Supply | | | 243,006 | |
| | 3,725 | | | Ulta Salon Cosmetics & Fragrance | | | 343,520 | |
| | | | | | | | |
| | | | | | | 3,193,430 | |
| | | | | | | | |
| | |
| | | | Consumer Staples – 2.25% | | | | |
| | 3,925 | | | PepsiCo | | | 271,767 | |
| | | | | | | | |
| | |
| | | | Energy – 7.24% | | | | |
| | 8,875 | | | Cabot Oil & Gas | | | 416,947 | |
| | 2,375 | | | Continental Resources * | | | 170,667 | |
| | 8,300 | | | Southwestern Energy * | | | 288,010 | |
| | | | | | | | |
| | | | | | | 875,624 | |
| | | | | | | | |
| | |
| | | | Financials – 14.51% | | | | |
| | 4,325 | | | American Express | | | 242,070 | |
| | 11,075 | | | American International Group | | | 386,850 | |
| | 13,500 | | | CBRE Group, Class A | | | 243,270 | |
| | 11,400 | | | Citigroup | | | 426,246 | |
| | 13,225 | | | Fifth Third Bancorp | | | 192,159 | |
| | 15,200 | | | Morgan Stanley | | | 264,176 | |
| | | | | | | | |
| | | | | | | 1,754,771 | |
| | | | | | | | |
| | | | | | | | |
Shares | | | | | Market
Value | |
| | |
| | | | Healthcare – 14.74% | | | | |
| | 4,800 | | | Abbott Laboratories | | $ | 314,496 | |
| | 1,275 | | | Biogen Idec * | | | 176,230 | |
| | 8,025 | | | Illumina * | | | 381,268 | |
| | 7,225 | | | Merck & Co. | | | 329,677 | |
| | 4,950 | | | ResMed | | | 197,703 | |
| | 4,450 | | | Watson Pharmaceuticals * | | | 382,478 | |
| | | | | | | | |
| | | | | | | 1,781,852 | |
| | | | | | | | |
| | |
| | | | Industrials – 6.28% | | | | |
| | 3,000 | | | C.H. Robinson Worldwide | | | 180,990 | |
| | 16,700 | | | Masco | | | 252,003 | |
| | 12,600 | | | Quanta Services * | | | 326,718 | |
| | | | | | | | |
| | | | | | | 759,711 | |
| | | | | | | | |
| | |
| | | | Information Technology – 19.13% | | | | |
| | 3,300 | | | Accenture, Class A (Ireland) | | | 222,453 | |
| | 6,650 | | | Akamai Technologies * | | | 252,633 | |
| | 525 | | | Apple | | | 312,427 | |
| | 6,475 | | | eBay * | | | 312,678 | |
| | 8,725 | | | Microsoft | | | 248,968 | |
| | 5,075 | | | Teradata * | | | 346,673 | |
| | 4,450 | | | Visa, Class A | | | 617,482 | |
| | | | | | | | |
| | | | | | | 2,313,314 | |
| | | | | | | | |
| | |
| | | | Materials – 9.19% | | | | |
| | 8,000 | | | Newmont Mining | | | 436,400 | |
| | 2,550 | | | Rock-Tenn, Class A | | | 186,635 | |
| | 10,625 | | | Vulcan Materials | | | 488,431 | |
| | | | | | | | |
| | | | | | | 1,111,466 | |
| | | | | | | | |
| | |
| | | | Total Common Stocks
(Cost $11,228,523) | | | 12,061,935 | |
| | | | | | | | |
| |
| | INVESTMENT COMPANY – 2.08% | | | | |
| | |
| | 250,962 | | | BlackRock Liquidity Funds TempCash Portfolio | | | 250,962 | |
| | | | | | | | |
| | |
| | | | Total Investment Company
(Cost $250,962) | | | 250,962 | |
| | | | | | | | |
| Total Investments – 101.83%
(Cost $11,479,485)** | | | 12,312,897 | |
| | | | | | | | |
| Net Other Assets and Liabilities – (1.83)% | | | (221,358 | ) |
| | | | | | | | |
| Net Assets – 100.00% | | $ | 12,091,539 | |
| | | | | | | | |
| * | | Non-income producing security. |
| ** | | Aggregate cost for Federal income tax purposes is $11,481,872. |
| | | | |
Gross unrealized appreciation | | $ | 1,023,402 | |
Gross unrealized depreciation | | | (192,377 | ) |
| | | | |
Net unrealized appreciation | | $ | 831,025 | |
| | | | |
See accompanying Notes to Financial Statements.
ASTON/TAMRO Diversified Equity Fund
| | |
| |
| Portfolio Manager Commentary (unaudited) | | October 31, 2012 |
Philip D. Tasho, CFA & Timothy A. Holland, CFA
| Q. | What were the most significant market factors affecting Fund performance and returns relative to the benchmark during the past 12 months? |
| A. | While the U.S. and global economies saw a slowdown in growth, aggressively easy monetary policy provided ample liquidity that helped fuel double digit returns across all market capitalizations of the U.S. equity markets. The underperformance of the Fund relative to the benchmark, the Russell 1000 Index, was primarily due to weak stock selection in the Consumer Discretionary, Technology and Financials sectors that was not sufficiently offset by strength in the Consumer Staples, Energy and Healthcare sectors. |
| Q. | What were the best performing holdings for the Fund during the period? |
| A. | A rebound in the housing cycle benefitted the largest home improvement retailer, Home Depot. Demand for Apple’s premium mobility products sent its shares to new highs. Lastly, DaVita Healthcare Partners benefited from industry consolidation and rising demand for renal dialysis. |
| Q. | What were the weakest performing holdings? |
| A. | A softening in telecomm capital spending led to a slowdown for Acme Packet’s Session Border Control products that manage the quality of data as it crosses from one network to another. Rising competition in the specialty mattress segment impacted shares of Tempur-Pedic International, while a general slowdown in South America reduced earnings |
| | expectations for the number one McDonald’s franchisee there, Arcos Dorados Holdings. We maintain a position in Tempur-Pedic, but we eliminated the others due to the identification of other investments that we believe represent better relative opportunities. |
| Q. | How was the Fund positioned as of October 31, 2012? |
| A. | The Fund’s investment process focuses on individual, bottom-up stock selection to identify companies that we believe are best able to execute given their specific competitive advantage. Our approach to portfolio management is opportunistic and broadly diversified, with sector weights determined by where we see opportunities at the stock level. As of October 31, 2012, Financials, Consumer Discretionary and Healthcare were the largest sectors. Among our investment categories, higher quality Leaders and Innovators, which focus on low cost operations and efficiency, comprised 91% of the portfolio. Laggards, or companies undergoing restructuring, made up 9%. |
We believe the domestic economy will continue to grow at a slower than normal pace, led by an ongoing rebound in consumer spending and housing. The change in housing prices has turned positive in most regions of the country and consumer sentiment is the highest yet in the recovery. After the election is over, there should be more clarity concerning the direction of U.S. economic policy. Any interim volatility may provide opportunities to add to current positions or initiate new ones at attractive valuations.
Growth of a Hypothetical
$10,000 Investment—Class N
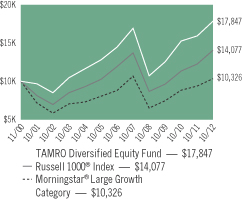
All dividends and capital gains are reinvested. Indexes are unmanaged and do not take into account fees, expenses or other costs.
Returns shown in the chart and table do not reflect taxes that a shareholder would pay on Fund distributions or on the sale of the Fund shares.
RETURNSFOR PERIOD ENDED 10/31/12
Average Annual Total Returns - Class N
| | | | |
One Year | | | 11.94 | % |
Five Year | | | 1.08 | % |
Ten Year | | | 7.67 | % |
Since Inception | | | 4.98 | % |
Inception Date 11/30/00
Total Return - Class I
| | | | |
Cumulative Since Inception | | | 2.04 | % |
Inception date 03/02/12
The performance data quoted represents past performance. Past performance does not guarantee future results. Investment return and principal value will fluctuate so that an investor’s shares, upon redemption, may be worth more or less than their original cost. Current performance may be lower or higher than the performance data quoted. For performance data current to the most recent month-end, please visit our website at www.astonfunds.com.
The performance quoted would have been lower if fee waivers and/or expense reimbursements had not been in effect.
The total expense ratio for the Class N and Class I Shares is 1.63% and 1.38% respectively, as disclosed in the prospectus dated March 1, 2012. Please refer to the Financial Highlights section in this report for more 2012 fiscal year-end related information.
| | |
| |
| ASTON/TAMRO Diversified Equity Fund | | October 31, 2012 |
| |
| Schedule of Investments | | |
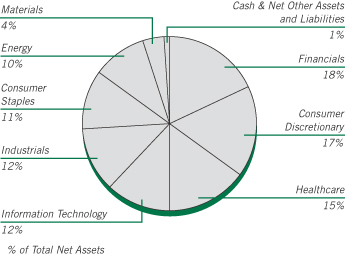
| | | | | | | | |
Shares | | | | | Market
Value | |
|
| | COMMON STOCKS – 99.12% | |
| | |
| | | | Consumer Discretionary – 16.80% | | | | |
| | 3,070 | | | Amazon.com * | | $ | 714,757 | |
| | 6,480 | | | Bed Bath & Beyond * | | | 373,766 | |
| | 14,488 | | | CarMax * | | | 488,970 | |
| | 11,676 | | | GNC Holdings, Class A | | | 451,511 | |
| | 8,902 | | | Home Depot | | | 546,405 | |
| | 13,457 | | | Macy’s | | | 512,308 | |
| | 8,121 | | | Tempur-Pedic International * | | | 214,719 | |
| | 14,743 | | | Toll Brothers * | | | 486,666 | |
| | | | | | | | |
| | | | | | | 3,789,102 | |
| | | | | | | | |
| | |
| | | | Consumer Staples – 10.53% | | | | |
| | 6,598 | | | Kraft Foods Group * | | | 300,077 | |
| | 7,425 | | | McCormick & Co (Non-Voting Shares) | | | 457,528 | |
| | 12,780 | | | Mondelez International, Class A | | | 339,181 | |
| | 5,135 | | | Philip Morris International | | | 454,756 | |
| | 8,055 | | | United Natural Foods * | | | 428,848 | |
| | 11,147 | | | Walgreen | | | 392,709 | |
| | | | | | | | |
| | | | | | | 2,373,099 | |
| | | | | | | | |
| | |
| | | | Energy – 10.35% | | | | |
| | 2,718 | | | EOG Resources | | | 316,620 | |
| | 6,472 | | | Exxon Mobil | | | 590,052 | |
| | 10,205 | | | Phillips 66 | | | 481,268 | |
| | 6,827 | | | Range Resources | | | 446,213 | |
| | 14,366 | | | Southwestern Energy * | | | 498,500 | |
| | | | | | | | |
| | | | | | | 2,332,653 | |
| | | | | | | | |
| | |
| | | | Financials – 18.59% | | | | |
| | 10,233 | | | American Express | | | 572,741 | |
| | 3,850 | | | American Tower, REIT | | | 289,867 | |
| | 5,353 | | | Berkshire Hathaway, Class B * | | | 462,232 | |
| | 3,161 | | | Franklin Resources | | | 403,976 | |
| | 7,159 | | | Iberiabank | | | 356,447 | |
| | 11,123 | | | JPMorgan Chase | | | 463,607 | |
| | | | | | | | |
Shares | | | | | Market
Value | |
| | |
| | | | Financials (continued) | | | | |
| | 10,737 | | | MetLife | | $ | 381,056 | |
| | 3,339 | | | Portfolio Recovery Associates * | | | 349,426 | |
| | 13,436 | | | Raymond James Financial | | | 512,449 | |
| | 6,168 | | | T. Rowe Price Group | | | 400,550 | |
| | | | | | | | |
| | | | | | | 4,192,351 | |
| | | | | | | | |
| | |
| | | | Healthcare – 14.64% | | | | |
| | 9,737 | | | Advisory Board * | | | 462,507 | |
| | 4,275 | | | Allergan | | | 384,408 | |
| | 5,216 | | | Athenahealth * | | | 335,337 | |
| | 4,717 | | | DaVita * | | | 530,757 | |
| | 6,424 | | | Express Scripts * | | | 395,333 | |
| | 12,836 | | | HMS Holdings * | | | 296,383 | |
| | 6,863 | | | Johnson & Johnson | | | 486,038 | |
| | 10,169 | | | Teva Pharmaceutical, SP ADR (Israel) | | | 411,031 | |
| | | | | | | | |
| | | | | | | 3,301,794 | |
| | | | | | | | |
| | |
| | | | Industrials – 11.79% | | | | |
| | 5,912 | | | Boeing | | | 416,441 | |
| | 5,030 | | | C.H. Robinson Worldwide | | | 303,460 | |
| | 8,800 | | | Chicago Bridge & Iron (Netherlands) | | | 330,440 | |
| | 11,105 | | | Cintas | | | 464,300 | |
| | 12,688 | | | Colfax * | | | 436,340 | |
| | 8,503 | | | Danaher | | | 439,860 | |
| | 4,781 | | | Fluor | | | 267,019 | |
| | | | | | | | |
| | | | | | | 2,657,860 | |
| | | | | | | | |
| | |
| | | | Information Technology – 12.31% | | | | |
| | 2,028 | | | Apple | | | 1,206,863 | |
| | 3,869 | | | Factset Research Systems | | | 350,338 | |
| | 369 | | | Google, Class A * | | | 250,835 | |
| | 8,226 | | | Microchip Technology | | | 257,885 | |
| | 7,296 | | | QUALCOMM | | | 427,363 | |
| | 4,091 | | | Seagate Technology (Ireland) | | | 111,766 | |
| | 10,141 | | | Yahoo! * | | | 170,470 | |
| | | | | | | | |
| | | | | | | 2,775,520 | |
| | | | | | | | |
| | |
| | | | Materials – 4.11% | | | | |
| | 5,313 | | | Monsanto | | | 457,290 | |
| | 5,334 | | | Royal Gold | | | 469,819 | |
| | | | | | | | |
| | | | | | | 927,109 | |
| | | | | | | | |
| | |
| | | | Total Common Stocks
(Cost $17,981,931) | | | 22,349,488 | |
| | | | | | | | |
|
| | INVESTMENT COMPANY – 0.54% | |
| | |
| | 122,258 | | | BlackRock Liquidity Funds
TempCash Portfolio | | | 122,258 | |
| | | | | | | | |
| | |
| | | | Total Investment Company
(Cost $122,258) | | | 122,258 | |
| | | | | | | | |
| Total Investments – 99.66%
(Cost $18,104,189)** | | | 22,471,746 | |
| | | | | | | | |
| Net Other Assets and Liabilities – 0.34% | | | 77,231 | |
| | | | | | | | |
| Net Assets – 100.00% | | $ | 22,548,977 | |
| | | | | | | | |
See accompanying Notes to Financial Statements.
| | |
| |
| ASTON/TAMRO Diversified Equity Fund | | October 31, 2012 |
| |
| Schedule of Investments – continued | | |
| * | | Non-income producing security. |
| ** | | Aggregate cost for Federal income tax purposes is $18,231,067. |
| | | | |
Gross unrealized appreciation | | $ | 4,746,965 | |
Gross unrealized depreciation | | | (506,286 | ) |
| | | | |
Net unrealized appreciation | | $ | 4,240,679 | |
| | | | |
| ADR | | American Depositary Receipt |
| REIT | | Real Estate Investment Trust |
| SP ADR | | Sponsored American Depositary Receipt |
See accompanying Notes to Financial Statements.
ASTON/Herndon Large Cap Value Fund
| | |
| |
| Portfolio Manager Commentary (unaudited) | | October 31, 2012 |
| | Randell A. Cain, Jr., CFA |
| Q. | What were the most significant market factors affecting Fund performance and returns relative to the benchmark during the past 12 months? |
| A. | Over the past 12-month period, positive absolute returns to the Fund were produced by nine of the ten major sectors, with five of those sectors posting double digit gains. The portfolio’s positive absolute performance was the result of a strengthening U.S. economy, solid increase in corporate earnings and improving consumer sentiment. |
The Fund did, however, underperform the Russell 1000 Value Index by more than 600 basis points. Stock performance and relative weights in the Information Technology, Utilities and Industrials sectors contributed positively to the portfolio’s overall relative performance. The major detractors were stocks in the Materials, Consumer Staples and Consumer Discretionary sectors. The portfolio’s relative returns were most negatively impacted by the performance of Materials stocks as a weak global mining and commodities market led to these stocks underperforming.
| Q. | What were the best performing holdings for the Fund during the period? |
| A. | The highest individual stock contributors to the portfolio’s performance were Gilead Sciences (+61% return), Apple Inc. (+48%) and TJX Companies (+43%). These securities represent holdings in the Healthcare, Information Technology and Consumer Discretionary sectors, respectively. |
| Q. | What were the weakest performing holdings? |
| A. | The highest individual stock detractors to the portfolio’s performance were Cliff’s Natural Resources (-45% return), Chimera Investment Corp. (-19%) and Herbalife Ltd. (-16%) . These stocks are in the Materials, Financial Services and Consumer Staples sectors, respectively. |
| Q. | How was the Fund positioned as of October 31, 2012? |
| A. | As of October 31, 2012, the Fund was overweight the Energy, Information Technology, Consumer Staples, Consumer Discretionary, Materials and Industrials sectors. The underweight sectors were Financial Services, Utilities, Telecommunications and Healthcare. |
Growth of a Hypothetical
$10,000 Investment—Class N
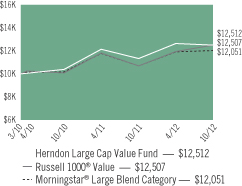
All dividends and capital gains are reinvested. Indexes are unmanaged and do not take into account fees, expenses or other costs.
Returns shown in the chart and table do not reflect taxes that a shareholder would pay on Fund distributions or on the sale of the Fund shares.
Value investing involves the risk that a Fund’s investing in companies believed to be undervalued will not appreciate as anticipated.
RETURNSFOR PERIOD ENDED 10/31/12
Average Annual Total Returns - Class N
| | | | |
1 Year | | | 10.39 | % |
Since Inception | | | 9.04 | % |
Inception Date 03/31/10
Average Annual Total Returns - Class I
| | | | |
1 Year | | | 10.69 | % |
Since Inception | | | 5.44 | % |
Inception Date 03/02/11
The performance data quoted represents past performance. Past performance does not guarantee future results. Investment return and principal value will fluctuate so that an investor’s shares, upon redemption, may be worth more or less than their original cost. Current performance may be lower or higher than the performance data quoted. For performance data current to the most recent month-end, please visit our website at www.astonfunds.com.
The performance quoted would have been lower if fee waivers and/or expense reimbursements had not been in effect.
| | |
| |
| ASTON/Herndon Large Cap Value Fund | | October 31, 2012 |
| |
| Schedule of Investments | | |
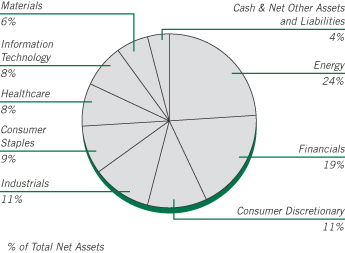
| | | | | | | | |
Shares | | | | | Market
Value | |
|
| | COMMON STOCKS – 95.14% | |
| | |
| | | | Consumer Discretionary – 10.84% | | | | |
| | 48,108 | | | Apollo Group, Class A * | | $ | 966,009 | |
| | 23,361 | | | Coach | | | 1,309,384 | |
| | 15,203 | | | Ross Stores | | | 926,623 | |
| | 36,312 | | | TJX | | | 1,511,669 | |
| | 18,471 | | | Yum! Brands | | | 1,295,002 | |
| | | | | | | | |
| | | | | | | 6,008,687 | |
| | | | | | | | |
| | |
| | | | Consumer Staples – 9.44% | | | | |
| | 43,623 | | | Altria Group | | | 1,387,211 | |
| | 8,042 | | | Colgate-Palmolive | | | 844,088 | |
| | 25,370 | | | Herbalife (Cayman) | | | 1,302,750 | |
| | 5,869 | | | Nu Skin Enterprises, Class A | | | 277,780 | |
| | 16,002 | | | Philip Morris International | | | 1,417,137 | |
| | | | | | | | |
| | | | | | | 5,228,966 | |
| | | | | | | | |
| | |
| | | | Energy – 23.62% | | | | |
| | 16,268 | | | Apache | | | 1,346,177 | |
| | 9,974 | | | Chevron | | | 1,099,235 | |
| | 19,512 | | | ConocoPhillips | | | 1,128,769 | |
| | 15,711 | | | Exxon Mobil | | | 1,432,372 | |
| | 42,074 | | | Halliburton | | | 1,358,569 | |
| | 32,149 | | | HollyFrontier | | | 1,241,916 | |
| | 23,603 | | | Marathon Petroleum | | | 1,296,513 | |
| | 38,927 | | | Newfield Exploration * | | | 1,055,700 | |
| | 65,943 | | | Patterson-UTI Energy | | | 1,066,958 | |
| | 95,889 | | | RPC | | | 1,098,888 | |
| | 20,912 | | | Superior Energy Services * | | | 425,141 | |
| | 23,445 | | | Ultra Petroleum * | | | 534,780 | |
| | | | | | | | |
| | | | | | | 13,085,018 | |
| | | | | | | | |
| | |
| | | | Financials – 18.64% | | | | |
| | 32,173 | | | Aflac | | | 1,601,572 | |
| | 41,808 | | | American Capital Agency, REIT | | | 1,380,500 | |
| | | | | | | | |
Shares | | | | | Market
Value | |
| | |
| | | | Financials (continued) | | | | |
| | 39,196 | | | Apartment Investment & Management, Class A, REIT | | $ | 1,046,141 | |
| | 39,242 | | | CBOE Holdings | | | 1,157,247 | |
| | 32,657 | | | Discover Financial Services | | | 1,338,937 | |
| | 35,538 | | | Eaton Vance | | | 1,000,039 | |
| | 74,416 | | | Federated Investors, Class B | | | 1,729,428 | |
| | 32,149 | | | Waddell & Reed Financial, Class A | | | 1,071,526 | |
| | | | | | | | |
| | | | | | | 10,325,390 | |
| | | | | | | | |
| | |
| | | | Healthcare – 8.23% | | | | |
| | 24,063 | | | Eli Lilly | | | 1,170,184 | |
| | 34,279 | | | Endo Health Solutions * | | | 982,436 | |
| | 20,166 | | | Gilead Sciences * | | | 1,354,349 | |
| | 144,475 | | | Health Management Associates, Class A * | | | 1,054,667 | |
| | | | | | | | |
| | | | | | | 4,561,636 | |
| | | | | | | | |
| | |
| | | | Industrials – 10.70% | | | | |
| | 10,264 | | | Caterpillar | | | 870,490 | |
| | 18,180 | | | Copa Holdings SA, Class A (Panama) | | | 1,687,468 | |
| | 10,264 | | | Cummins | | | 960,505 | |
| | 18,907 | | | Joy Global | | | 1,180,742 | |
| | 13,121 | | | Lockheed Martin | | | 1,229,044 | |
| | | | | | | | |
| | | | | | | 5,928,249 | |
| | | | | | | | |
| | |
| | | | Information Technology – 7.98% | | | | |
| | 2,203 | | | Apple | | | 1,311,005 | |
| | 6,173 | | | International Business Machines | | | 1,200,834 | |
| | 29,970 | | | Microsoft | | | 855,194 | |
| | 30,841 | | | Western Digital | | | 1,055,687 | |
| | | | | | | | |
| | | | | | | 4,422,720 | |
| | | | | | | | |
| | |
| | | | Materials – 5.69% | | | | |
| | 5,786 | | | CF Industries Holdings | | | 1,187,229 | |
| | 25,516 | | | Cliffs Natural Resources | | | 925,465 | |
| | 30,593 | | | Kronos Worldwide | | | 408,417 | |
| | 2,324 | | | Newmarket | | | 630,524 | |
| | | | | | | | |
| | | | | | | 3,151,635 | |
| | | | | | | | |
| | |
| | | | Total Common Stocks
(Cost $51,852,542) | | | 52,712,301 | |
| | | | | | | | |
|
| | INVESTMENT COMPANY – 5.42% | |
| | |
| | 3,005,231 | | | BlackRock Liquidity Funds
TempCash Portfolio | | | 3,005,231 | |
| | | | | | | | |
| | |
| | | | Total Investment Company
(Cost $3,005,231) | | | 3,005,231 | |
| | | | | | | | |
| Total Investments – 100.56%
(Cost $54,857,773)** | | | 55,717,532 | |
| | | | | | | | |
| Net Other Assets and Liabilities – (0.56)% | | | (310,580 | ) |
| | | | | | | | |
| Net Assets – 100.00% | | $ | 55,406,952 | |
| | | | | | | | |
See accompanying Notes to Financial Statements.
| | |
| |
| ASTON/Herndon Large Cap Value Fund | | October 31, 2012 |
| |
| Schedule of Investments – continued | | |
| * | | Non-income producing security. |
| ** | | Aggregate cost for Federal income tax purposes is $55,304,811. |
| | | | |
Gross unrealized appreciation | | $ | 3,460,988 | |
Gross unrealized depreciation | | | (3,048,267 | ) |
| | | | |
Net unrealized appreciation | | $ | 412,721 | |
| | | | |
| REIT | | Real Estate Investment Trust |
See accompanying Notes to Financial Statements.
ASTON/Cornerstone Large Cap Value Fund
| | |
| |
| Portfolio Manager Commentary (unaudited) | | October 31, 2012 |
John Campbell, CFA; Rick van Nostrand, CFA; Cameron Clement, CFA; & Dean Morris, CFA
| Q. | What were the most significant market factors affecting Fund performance and returns relative to the benchmark during the past 12 months? |
| A. | Despite continued overhangs from European sovereign debt, slowing emerging economies and political uncertainty in the U.S., the markets posted double digit gains over the past 12 months; as the Russell 1000 Value Index was up 16.89%. Attractive valuations coupled with improved economic reports from the U.S. drove investors back into equities. Additionally, the European Central Bank’s long-term refinancing operations attempted to allay investor fears of sovereign default by providing nearly $1.2 trillion in cheap loans to European banks. In the U.S., data surrounding housing, employment and manufacturing have begun to paint a more stable and improving picture. |
| Q. | What were the best performing holdings for the Fund during the period? |
| A. | Apple (+47.7%) was the best performing stock during the period. The company continued to post impressive growth driven largely by iPhone and tablet sales, while the successful launch of the third generation iPad added to investor enthusiasm. |
Western Digital (+29.3%) sold off in the 2nd quarter over fears of peak pricing and demand given the concerns over global PC demand. As a result, we added to our position and were rewarded as the company provided increased earnings guidance for FY13 driving the stock price considerably higher.
Wal-Mart (+35.6%) was a top performer for the period, as the market rewarded the company for regaining sales momentum in the U.S. Their international business is also seeing improved margins and should be a bigger contributor to earnings going forward.
| Q. | What were the weakest performing holdings? |
| A. | Hewlett-Packard (-49.4%) was the top overall detractor to performance over the past 12 months. The street reacted negatively to the earnings report in August, in which management provided a muted outlook for the remainder of 2012. Investors remain concerned about the ongoing turnaround at Hewlett-Packard and how quickly management can implement needed changes. |
Vale (-22.4%) was weaker for the 12-month period given macro concerns pertaining to China and overall global demand for steel. The Brazilian government’s influence over the company has also led some investors to question whose best interest company management is trying to appease—that of shareholders or the Brazilian government.
Hess Corp. (-15.8%) saw significant weakness during the period after posting disappointing forward guidance during its Q1 2012 quarterly earnings call. The stock was weak given its lackluster production results in the Bakken region—its primary growth area. Additionally, investors are focused on near-term capital expenditure costs and a portfolio that is viewed by some as being too diverse.
| Q. | How was the Fund positioned as of October 31, 2012? |
| A. | Despite the strong performance over the past 12 months, valuations remain compelling, both on traditional measures and our proprietary valuation work, which now indicates that 73% of the stocks in the 800 stock universe are undervalued relative to our assessment of their value. We continue to find a lot of value in the market, and are enthusiastic about the Fund’s positioning and our ability to improve the quality of the holdings while aiming to hold market leading, cash flow rich, and attractively priced companies in the process. |
Growth of a Hypothetical
$10,000 Investment—Class N
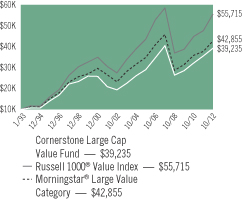
All dividends and capital gains are reinvested. Indexes are unmanaged and do not take into account fees, expenses or other costs.
Returns shown in the chart and table do not reflect taxes that a shareholder would pay on Fund distributions or on the sale of the Fund shares.
Value investing involves the risk that a Fund’s investing in companies believed to be undervalued will not appreciate as anticipated.
RETURNSFOR PERIOD ENDED 10/31/12
Average Annual Total Returns - Class N
| | | | |
One Year | | | 10.43 | % |
Five Year | | | -0.61 | % |
Ten Year | | | 7.34 | % |
Since Inception | | | 7.14 | % |
Inception Date 01/04/93
Average Annual Total Returns - Class I
| | | | |
One Year | | | 10.66 | % |
Five Year | | | -0.34 | % |
Since Inception | | | 4.35 | % |
Inception Date 09/20/05
The performance data quoted represents past performance. Past performance does not guarantee future results. Investment return and principal value will fluctuate so that an investor’s shares, upon redemption, may be worth more or less than their original cost. Current performance may be lower or higher than the performance data quoted. For performance data current to the most recent month-end, please visit our website at www.astonfunds.com.
The performance quoted would have been lower if fee waivers and/or expense reimbursements had not been in effect.
The total expense ratio for the Class N and Class I Shares is 1.61% and 1.36%, respectively, as disclosed in the prospectus dated March 1, 2012. Please refer to the Financial Highlights section in this report for more 2012 fiscal year-end related information.
| | |
| |
| ASTON/Cornerstone Large Cap Value Fund | | October 31, 2012 |
| |
| Schedule of Investments | | |
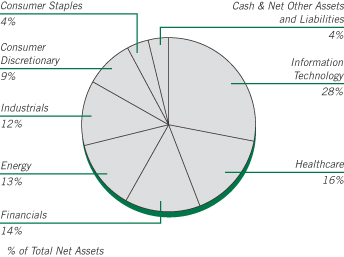
| | | | | | | | |
Shares | | | | | Market
Value | |
| |
| | COMMON STOCKS – 96.22% | | | | |
| | |
| | | | Consumer Discretionary – 8.57% | | | | |
| | 17,600 | | | Hasbro | | $ | 633,424 | |
| | 27,900 | | | Mattel | | | 1,026,162 | |
| | 53,100 | | | Staples | | | 611,447 | |
| | | | | | | | |
| | | | | | | 2,271,033 | |
| | | | | | | | |
| | |
| | | | Consumer Staples – 3.88% | | | | |
| | 13,700 | | | Wal-Mart Stores | | | 1,027,774 | |
| | | | | | | | |
| | |
| | | | Energy – 12.95% | | | | |
| | 7,750 | | | Apache | | | 641,312 | |
| | 9,275 | | | Chevron | | | 1,022,198 | |
| | 18,012 | | | Hess | | | 941,307 | |
| | 12,100 | | | Royal Dutch Shell PLC, ADR
(United Kingdom) | | | 828,608 | |
| | | | | | | | |
| | | | | | | 3,433,425 | |
| | | | | | | | |
| | |
| | | | Financials – 14.39% | | | | |
| | 10,925 | | | ACE (Switzerland) | | | 859,251 | |
| | 13,525 | | | Capital One Financial | | | 813,799 | |
| | 34,275 | | | Citigroup | | | 1,281,542 | |
| | 49,375 | | | Morgan Stanley | | | 858,138 | |
| | | | | | | | |
| | | | | | | 3,812,730 | |
| | | | | | | | |
| | |
| | | | Healthcare – 16.12% | | | | |
| | 11,175 | | | Eli Lilly | | | 543,440 | |
| | 19,025 | | | Merck | | | 868,111 | |
| | 22,550 | | | Sanofi, ADR (France) | | | 988,817 | |
| | 16,700 | | | Stryker | | | 878,420 | |
| | 24,575 | | | Teva Pharmaceutical, SP ADR (Israel) | | | 993,322 | |
| | | | | | | | |
| | | | | | | 4,272,110 | |
| | | | | | | | |
| | |
| | | | Industrials – 12.29% | | | | |
| | 7,100 | | | 3M | | | 621,960 | |
| | 19,300 | | | Eaton | | | 911,346 | |
| | | | | | | | |
Shares | | | | | Market
Value | |
| | |
| | | | Industrials (continued) | | | | |
| | 12,425 | | | General Dynamics | | $ | 845,894 | |
| | 11,175 | | | Parker Hannifin | | | 879,026 | |
| | | | | | | | |
| | | | | | | 3,258,226 | |
| | | | | | | | |
| | |
| | | | Information Technology – 28.02% | | | | |
| | 1,805 | | | Apple | | | 1,074,155 | |
| | 14,500 | | | eBay * | | | 700,205 | |
| | 1,545 | | | Google, Class A * | | | 1,050,245 | |
| | 33,700 | | | Hewlett-Packard | | | 466,745 | |
| | 23,200 | | | Intel | | | 501,700 | |
| | 3,455 | | | International Business Machines | | | 672,101 | |
| | 35,025 | | | Microsoft | | | 999,438 | |
| | 30,550 | | | Oracle | | | 948,577 | |
| | 29,625 | | | Western Digital * | | | 1,014,064 | |
| | | | | | | | |
| | | | | | | 7,427,230 | |
| | | | | | | | |
| | |
| | | | Total Common Stocks
(Cost $23,872,624) | | | 25,502,528 | |
| | | | | | | | |
| |
| | INVESTMENT COMPANY – 2.44% | | | | |
| | |
| | 645,820 | | | BlackRock Liquidity Funds TempCash Portfolio | | | 645,820 | |
| | | | | | | | |
| | |
| | | | Total Investment Company
(Cost $645,820) | | | 645,820 | |
| | | | | | | | |
| Total Investments – 98.66%
(Cost $24,518,444)** | | | 26,148,348 | |
| | | | | | | | |
| Net Other Assets and Liabilities – 1.34% | | | 354,520 | |
| | | | | | | | |
| Net Assets – 100.00% | | $ | 26,502,868 | |
| | | | | | | | |
| * | | Non-income producing security. |
| ** | | Aggregate cost for Federal income tax purposes is $24,749,261. |
| | | | |
Gross unrealized appreciation | | $ | 2,471,184 | |
Gross unrealized depreciation | | | (1,072,097 | ) |
| | | | |
Net unrealized appreciation | | $ | 1,399,087 | |
| | | | |
| ADR | | American Depositary Receipt |
| SP ADR | | Sponsored American Depositary Receipt |
See accompanying Notes to Financial Statements.
ASTON/River Road Dividend All Cap Value Fund
| | |
| |
| Portfolio Manager Commentary (unaudited) | | October 31, 2012 |
Henry W. Sanders, III, CFA; Thomas Forsha, CFA & James C. Shircliff, CFA
| Q. | What were the most significant market factors affecting Fund performance and returns relative to the benchmark during the past 12 months? |
| A. | Over the last 12 months, the most significant market factor affecting absolute performance was the ongoing extraordinary monetary policy (quantitative easing). According to Ned Davis Research,* among S&P 500 companies, performance declined as dividend yield increased, creating a significant relative headwind for a dividend-oriented strategy. The Energy sector had the highest impact on relative results, primarily due to strong stock selection and the underweight allocation in that sector. The Industrials sector had the most negative impact on relative results, primarily due to weak stock selection. |
| Q. | What were the best performing holdings for the Fund during the period? |
| A. | The two holdings with the largest positive contribution to the Fund’s total return were Sabra Healthcare REIT Inc., owner of a portfolio of skilled nursing and senior housing facilities, and Kimberly-Clark Corp., a global health and hygiene paper product manufacturer. During Q3 2012, Sabra reported quarterly results ahead of expectations and acquired two high-quality senior housing facilities, as well as a deal to acquire up to 10 newly constructed senior housing facilities. With its earnings release in August, Sabra reported aggressive refinancing activity, generating significant interest savings, and raised an additional $100 million of debt at an attractive interest rate. |
Kimberly-Clark reported Q1 results that topped analysts’ estimates, including +6% organic revenue growth. Sales at K-C International jumped +13%, bringing attention to its emerging markets business, which has grown +8% organically. Price increases, lower pulp costs, and benefits from cost reduction efforts contributed to a +29% increase in earnings before interest and tax year-over-year. Additionally, management announced the company will repurchase between $900 million and $1.1 billion worth of stock
from operating cash flow and raised its dividend +6% during the quarter.
| Q. | What were the weakest performing holdings? |
| A. | The two holdings with the lowest contribution to the Fund’s total return during the period were Telefonica Brasil SA ADR, the largest telecom company in Brazil, and Norfolk Southern Corp., a railroad operator in 22 eastern states. Despite solid fundamentals, Telefonica shares declined in Q2 2012 due to concerns about parent company Telefonica S.A. and weakness in the Brazilian Real. Investors are increasingly concerned about TEF’s debt burden and have begun to speculate whether they will be forced to sell all or part of their healthy, growing Latin American operations, including their 74% stake in VIV. While the parent company’s woes continue to make headlines, we remain confident in VIV’s strong cash production and modest financial leverage. |
In July, Norfolk Southern reported second quarter results in-line with our expectations, as strong efficiency gains and growth in merchandise traffic more than offset continued softness in the domestic coal business. As Q3 progressed, Chinese demand for U.S. coal exports faltered, reducing prices and the number of carloads traveling to eastern ports. Facing uncertain demand and lower fuel surcharge revenues, in late September, NSC forecasted that third quarter revenues would be down -4% versus last year and issued guidance below our expectations.
| Q. | How was the Fund positioned as of October 31, 2012? |
| A. | We continue to focus on stocks with high and growing dividends, healthy balance sheets, and attractive valuations that we believe can thrive in a low growth environment. |
*Ned Davis Research, Inc., Sarasota, FL, examined S&P 500 Stock Constituents ranked by quartiles (Dividend Yield) for the last twelve months as of October 31, 2012.
Growth of a Hypothetical
$10,000 Investment—Class N
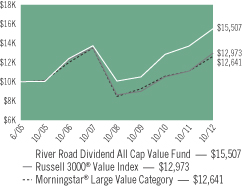
All dividends and capital gains are reinvested. Indexes are unmanaged and do not take into account fees, expenses or other costs.
Returns shown in the chart and table do not reflect taxes that a shareholder would pay on Fund distributions or on the sale of the Fund shares.
Value investing involves the risk that a Fund’s investing in companies believed to be undervalued will not appreciate as anticipated.
Small-cap and mid-cap stocks may be subject to a higher degree of market risk than the securities of more established companies because they tend to be more volatile and less liquid.
RETURNSFOR PERIOD ENDED 10/31/12
Average Annual Total Returns - Class N
| | | | |
One Year | | | 12.96 | % |
Five Year | | | 2.42 | % |
Since Inception | | | 6.15 | % |
Inception Date 06/28/05
Average Annual Total Returns - Class I
| | | | |
One Year | | | 13.25 | % |
Five Year | | | 2.67 | % |
Since Inception | | | 2.20 | % |
Inception Date 06/28/07
The performance data quoted represents past performance. Past performance does not guarantee future results. Investment return and principal value will fluctuate so that an investor’s shares, upon redemption, may be worth more or less than their original cost. Current performance may be lower or higher than the performance data quoted. For performance data current to the most recent month-end, please visit our website at www.astonfunds.com.
| | |
| |
| ASTON/River Road Dividend All Cap Value Fund | | October 31, 2012 |
| |
| Schedule of Investments | | |
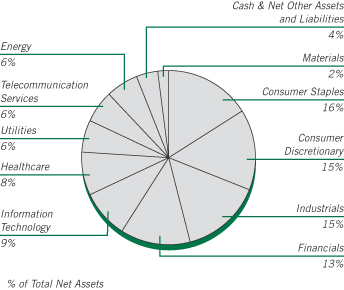
| | | | | | | | |
Shares | | | | | Market
Value | |
|
| | COMMON STOCKS – 96.32% | |
| | |
| | | | Consumer Discretionary – 14.91% | | | | |
| | 485,725 | | | American Greetings, Class A | | $ | 8,339,898 | |
| | 351,120 | | | Bob Evans Farms | | | 13,367,138 | |
| | 240,910 | | | Darden Restaurants | | | 12,676,684 | |
| | 135,110 | | | Genuine Parts | | | 8,455,184 | |
| | 400,675 | | | Hasbro | | | 14,420,293 | |
| | 575,430 | | | Hillenbrand | | | 11,779,052 | |
| | 295,665 | | | Kohl’s | | | 15,753,031 | |
| | 641,820 | | | National CineMedia | | | 9,922,537 | |
| | 680,400 | | | Regal Entertainment Group, Class A | | | 10,450,944 | |
| | 269,270 | | | Target | | | 17,165,963 | |
| | 546,160 | | | Thomson Reuters | | | 15,434,482 | |
| | | | | | | | |
| | | | | | | 137,765,206 | |
| | | | | | | | |
| | |
| | | | Consumer Staples – 15.51% | | | | |
| | 280,355 | | | Dr Pepper Snapple Group | | | 12,013,212 | |
| | 542,090 | | | General Mills | | | 21,726,967 | |
| | 254,030 | | | Kimberly-Clark | | | 21,198,804 | |
| | 278,675 | | | Molson Coors Brewing, Class B | | | 12,022,040 | |
| | 247,260 | | | PepsiCo | | | 17,120,282 | |
| | 180,650 | | | Procter & Gamble | | | 12,508,206 | |
| | 584,025 | | | Sysco | | | 18,145,657 | |
| | 176,365 | | | Wal-Mart Stores | | | 13,230,902 | |
| | 435,755 | | | Walgreen | | | 15,351,649 | |
| | | | | | | | |
| | | | | | | 143,317,719 | |
| | | | | | | | |
| | |
| | | | Energy – 5.67% | | | | |
| | 902,200 | | | BreitBurn Energy Partners LP | | | 18,188,352 | |
| | 160,995 | | | Chevron | | | 17,743,259 | |
| | 196,750 | | | ConocoPhillips | | | 11,381,988 | |
| | 142,055 | | | Transmontaigne Partners LP | | | 5,051,476 | |
| | | | | | | | |
| | | | | | | 52,365,075 | |
| | | | | | | | |
| | | | | | | | |
Shares | | | | | Market
Value | |
| | |
| | | | Financials – 13.42% | | | | |
| | 92,725 | | | BlackRock | | $ | 17,588,078 | |
| | 183,560 | | | Chubb | | | 14,130,449 | |
| | 210,895 | | | CME Group | | | 11,795,357 | |
| | 208,329 | | | Commerce Bancshares | | | 7,933,168 | |
| | 390,105 | | | Compass Diversified Holdings | | | 5,617,512 | |
| | 340,855 | | | OneBeacon Insurance Group, Class A (Bermuda) | | | 4,601,542 | |
| | 186,040 | | | PartnerRe (Bermuda) | | | 15,069,240 | |
| | 191,300 | | | PNC Financial Services Group | | | 11,131,747 | |
| | 720,870 | | | Sabra Health Care, REIT | | | 16,017,731 | |
| | 197,655 | | | Safety Insurance Group | | | 9,161,309 | |
| | 260,135 | | | Tower Group | | | 4,687,633 | |
| | 190,355 | | | U.S. Bancorp | | | 6,321,690 | |
| | | | | | | | |
| | | | | | | 124,055,456 | |
| | | | | | | | |
| | |
| | | | Healthcare – 8.59% | | | | |
| | 253,295 | | | AstraZeneca PLC, SP ADR (United Kingdom) | | | 11,752,888 | |
| | 143,350 | | | Becton, Dickinson | | | 10,848,728 | |
| | 201,440 | | | Johnson & Johnson | | | 14,265,981 | |
| | 40,123 | | | Landauer | | | 2,325,128 | |
| | 346,845 | | | Medtronic | | | 14,421,815 | |
| | 371,262 | | | Owens & Minor | | | 10,569,829 | |
| | 613,030 | | | Pfizer | | | 15,246,056 | |
| | | | | | | | |
| | | | | | | 79,430,425 | |
| | | | | | | | |
| | |
| | | | Industrials – 14.69% | | | | |
| | 88,840 | | | 3M | | | 7,782,384 | |
| | 413,935 | | | ABM Industries | | | 7,864,765 | |
| | 103,925 | | | Emerson Electric | | | 5,033,088 | |
| | 179,715 | | | General Dynamics | | | 12,234,997 | |
| | 339,075 | | | Iron Mountain | | | 11,731,995 | |
| | 166,445 | | | Lockheed Martin | | | 15,590,903 | |
| | 275,815 | | | Norfolk Southern | | | 16,921,250 | |
| | 214,915 | | | Raytheon | | | 12,155,592 | |
| | 408,935 | | | Republic Services | | | 11,593,307 | |
| | 244,070 | | | United Parcel Service, Class B | | | 17,878,128 | |
| | 65,280 | | | United Technologies | | | 5,102,285 | |
| | 362,815 | | | Waste Management | | | 11,878,563 | |
| | | | | | | | |
| | | | | | | 135,767,257 | |
| | | | | | | | |
| | |
| | | | Information Technology – 9.34% | | | | |
| | 386,805 | | | Automatic Data Processing | | | 22,353,461 | |
| | 433,150 | | | CA | | | 9,754,538 | |
| | 560,525 | | | Corning | | | 6,586,169 | |
| | 913,380 | | | Intel | | | 19,751,843 | |
| | 253,180 | | | j2 Global | | | 7,605,527 | |
| | 388,950 | | | Microsoft | | | 11,098,688 | |
| | 283,250 | | | Paychex | | | 9,185,798 | |
| | | | | | | | |
| | | | | | | 86,336,024 | |
| | | | | | | | |
| | |
| | | | Materials – 2.46% | | | | |
| | 326,265 | | | Bemis | | | 10,783,058 | |
| | 298,545 | | | Nucor | | | 11,980,611 | |
| | | | | | | | |
| | | | | | | 22,763,669 | |
| | | | | | | | |
See accompanying Notes to Financial Statements.
| | |
| |
| ASTON/River Road Dividend All Cap Value Fund | | October 31, 2012 |
| |
| Schedule of Investments – continued | | |
| | | | | | | | |
Shares | | | | | Market
Value | |
| | |
| | | | Telecommunication Services – 5.58% | | | | |
| | 127,675 | | | Atlantic Tele-Network | | $ | 5,290,852 | |
| | 483,162 | | | Telefonica Brasil SA, ADR (Brazil) | | | 10,639,227 | |
| | 375,875 | | | Verizon Communications | | | 16,779,060 | |
| | 692,225 | | | Vodafone Group, SP ADR (United Kingdom) | | | 18,842,365 | |
| | | | | | | | |
| | | | | | | 51,551,504 | |
| | | | | | | | |
| | |
| | | | Utilities – 6.15% | | | | |
| | 222,315 | | | AmeriGas Partners LP | | | 9,959,712 | |
| | 424,900 | | | Avista | | | 10,800,958 | |
| | 119,940 | | | Entergy | | | 8,705,245 | |
| | 176,220 | | | National Fuel Gas | | | 9,286,794 | |
| | 424,875 | | | UNS Energy | | | 18,116,670 | |
| | | | | | | | |
| | | | | | | 56,869,379 | |
| | | | | | | | |
| | |
| | | | Total Common Stocks
(Cost $797,171,955) | | | 890,221,714 | |
| | | | | | | | |
|
| | INVESTMENT COMPANY – 3.50% | |
| | |
| | 32,335,683 | | | BlackRock Liquidity Funds
TempCash Portfolio | | | 32,335,683 | |
| | | | | | | | |
| | |
| | | | Total Investment Company
(Cost $32,335,683) | | | 32,335,683 | |
| | | | | | | | |
| Total Investments – 99.82%
(Cost $829,507,638)* | | | 922,557,397 | |
| | | | | | | | |
| Net Other Assets and Liabilities – 0.18% | | | 1,651,971 | |
| | | | | | | | |
| Net Assets – 100.00% | | $ | 924,209,368 | |
| | | | | | | | |
| * | | Aggregate cost for Federal income tax purposes is $830,214,282. |
| | | | |
Gross unrealized appreciation | | $ | 101,045,034 | |
Gross unrealized depreciation | | | (8,701,919 | ) |
| | | | |
Net unrealized appreciation | | $ | 92,343,115 | |
| | | | |
| ADR | | American Depositary Receipt |
| REIT | | Real Estate Investment Trust |
| SP ADR | | Sponsored American Depositary Receipt |
See accompanying Notes to Financial Statements.
ASTON/River Road Dividend All Cap Value Fund II
| | |
| |
| Portfolio Manager Commentary (unaudited) | | October 31, 2012 |
Henry W. Sanders, III, CFA; Thomas Forsha, CFA & James C. Shircliff, CFA
| Q. | What were the most significant market factors affecting Fund performance and returns relative to the benchmark during the past 12 months? |
| A. | Since inception, the most significant market factor affecting absolute performance was the ongoing extraordinary monetary policy (quantitative easing). According to Ned Davis Research,* among S&P 500 companies, performance declined as dividend yield increased, a significant relative headwind for a dividend-oriented strategy. The Utilities sector was the only sector with a positive impact on relative results, primarily due to strong stock selection and the underweight allocation. The Financials sector had the most negative impact on relative results, primarily due to weak stock selection and the underweight allocation. |
| Q. | What were the best performing holdings for the Fund during the period? |
| A. | The two holdings with the largest positive contribution to the Fund’s total return were BreitBurn Energy Partners L.P., an independent oil and gas master limited partnership, and Iron Mountain Inc., which provides record management services. BreitBurn units ended Q2 trading near the 52-week low after making a $93 million acquisition in Wyoming’s Big Horn Basin and two acquisitions in the Permian Basin in Texas for $220 million. While the acquisitions raised concerns about the partnership’s leverage, rising oil prices in September enabled management to place 10 million new partnership units at prices well off the June/July lows. Investors continue to find BreitBurn’s strong yield (over 9%) attractive and were encouraged by the ninth consecutive quarterly dividend increase, announced in August. |
Iron Mountain posted solid Q2 2012 results. Earnings before interest, taxes, depreciation and amortization margins increased 130 bps to 31.3% year-over-year (yoy) on better fixed cost control, storage organic revenue increased 4% yoy, offset by lower commodity prices for recycled paper (down 33% yoy), and the international market had 8% organic growth. In June, Iron Mountain raised the dividend 8% to $1.08/share, and
the Board of Directors has committed to $1 billion in return-of-capital through 2013 via increased dividends and a one-time dividend.
| Q. | What were the weakest performing holdings? |
| A. | The two holdings with the lowest contribution to the Fund’s total return during the period were Intel Corp., the world’s largest semiconductor manufacturer, and Norfolk Southern Corp., a railroad operator in 22 eastern states. Intel shares were weak following a disappointing Q2 earnings release, which was below both our and Wall Street expectations, and a cut to guidance that was larger than anticipated. While the company’s Data Center and Software & Services groups continued to post strong growth, the core PC business was softer than expected despite the launch of new Ivy Bridge chips. Shares continued to slide after both Dell and HP, Intel’s largest customers, offered disappointing results and guidance in August. |
In July, Norfolk Southern reported second quarter results in-line with our expectations, as strong efficiency gains and growth in merchandise traffic more than offset continued softness in the domestic coal business. As Q3 progressed, Chinese demand for U.S. coal exports faltered, reducing prices and the number of carloads traveling to eastern ports. Facing uncertain demand and lower fuel surcharge revenues, in late September, Norfolk Southern forecasted that third quarter revenues would be down -4% versus last year and issued guidance below our expectations.
| Q. | How was the Fund positioned as of October 31, 2012? |
| A. | We continue to focus on stocks with high and growing dividends, healthy balance sheets, and attractive valuations that we believe can thrive in a low growth environment. |
*Ned Davis Research, Inc., Sarasota, FL, examined S&P 500 Stock Constituents ranked by quartiles (Dividend Yield) for the last twelve months as of October 31, 2012.
Growth of a Hypothetical
$10,000 Investment—Class N
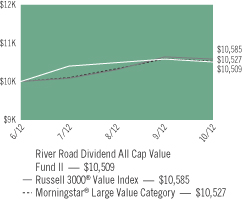
All dividends and capital gains are reinvested. Indexes are unmanaged and do not take into account fees, expenses or other costs.
Returns shown in the chart and table do not reflect taxes that a shareholder would pay on Fund distributions or on the sale of the Fund shares.
Value investing involves the risk that a Fund’s investing in companies believed to be undervalued will not appreciate as anticipated.
Small-cap and mid-cap stocks may be subject to a higher degree of market risk than the securities of more established companies because they tend to be more volatile and less liquid.
RETURNSFOR PERIOD ENDED 10/31/12
Total Return - Class N
| | | | |
Cumulative Since Inception | | | 5.09 | % |
Inception Date 06/27/12
Total Return - Class I
| | | | |
Cumulative Since Inception | | | 5.17 | % |
Inception Date 06/27/12
The performance data quoted represents past performance. Past performance does not guarantee future results. Investment return and principal value will fluctuate so that an investor’s shares, upon redemption, may be worth more or less than their original cost. Current performance may be lower or higher than the performance data quoted. For performance data current to the most recent month-end, please visit our website at www.astonfunds.com.
The performance quoted would have been lower if fee waivers and/or expense reimbursements had not been in effect.
| | |
| |
| ASTON/River Road Dividend All Cap Value Fund II | | October 31, 2012 |
| |
| Schedule of Investments | | |
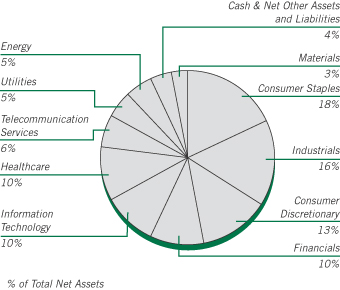
| | | | | | | | |
Shares | | | | | Market
Value | |
|
| | COMMON STOCKS – 95.25% | |
| | |
| | | | Consumer Discretionary – 12.91% | | | | |
| | 1,255 | | | Bob Evans Farms | | $ | 47,778 | |
| | 3,160 | | | Darden Restaurants | | | 166,279 | |
| | 1,735 | | | Genuine Parts | | | 108,576 | |
| | 5,265 | | | Hasbro | | | 189,487 | |
| | 2,915 | | | Hillenbrand | | | 59,670 | |
| | 3,720 | | | Kohl’s | | | 198,202 | |
| | 8,970 | | | Regal Entertainment Group, Class A | | | 137,779 | |
| | 3,670 | | | Target | | | 233,963 | |
| | 7,185 | | | Thomson Reuters | | | 203,048 | |
| | | | | | | | |
| | | | | | | 1,344,782 | |
| | | | | | | | |
| | |
| | | | Consumer Staples – 17.97% | | | | |
| | 3,345 | | | Dr Pepper Snapple Group | | | 143,333 | |
| | 7,400 | | | General Mills | | | 296,592 | |
| | 3,260 | | | Kimberly-Clark | | | 272,047 | |
| | 3,670 | | | Molson Coors Brewing, Class B | | | 158,324 | |
| | 3,245 | | | PepsiCo | | | 224,684 | |
| | 2,400 | | | Procter & Gamble | | | 166,176 | |
| | 7,350 | | | Sysco | | | 228,365 | |
| | 2,335 | | | Wal-Mart Stores | | | 175,172 | |
| | 5,905 | | | Walgreen | | | 208,033 | |
| | | | | | | | |
| | | | | | | 1,872,726 | |
| | | | | | | | |
| | |
| | | | Energy – 4.80% | | | | |
| | 5,650 | | | BreitBurn Energy Partners LP | | | 113,904 | |
| | 2,145 | | | Chevron | | | 236,400 | |
| | 2,590 | | | ConocoPhillips | | | 149,832 | |
| | | | | | | | |
| | | | | | | 500,136 | |
| | | | | | | | |
| | |
| | | | Financials – 10.20% | | | | |
| | 1,225 | | | BlackRock | | | 232,358 | |
| | 1,920 | | | Chubb | | | 147,802 | |
| | | | | | | | |
Shares | | | | | Market
Value | |
| | |
| | | | Financials (continued) | | | | |
| | 2,790 | | | CME Group | | $ | 156,045 | |
| | 2,672 | | | Commerce Bancshares | | | 101,750 | |
| | 2,400 | | | PartnerRe (Bermuda) | | | 194,400 | |
| | 2,590 | | | PNC Financial Services Group | | | 150,712 | |
| | 2,400 | | | U.S. Bancorp | | | 79,704 | |
| | | | | | | | |
| | | | | | | 1,062,771 | |
| | | | | | | | |
| | |
| | | | Healthcare – 9.85% | | | | |
| | 3,605 | | | AstraZeneca PLC, SP ADR (United Kingdom) | | | 167,272 | |
| | 1,935 | | | Becton, Dickinson | | | 146,441 | |
| | 2,655 | | | Johnson & Johnson | | | 188,027 | |
| | 4,535 | | | Medtronic | | | 188,565 | |
| | 4,560 | | | Owens & Minor | | | 129,823 | |
| | 8,300 | | | Pfizer | | | 206,421 | |
| | | | | | | | |
| | | | | | | 1,026,549 | |
| | | | | | | | |
| | |
| | | | Industrials – 15.96% | | | | |
| | 1,285 | | | 3M | | | 112,566 | |
| | 4,095 | | | ABM Industries | | | 77,805 | |
| | 1,305 | | | Emerson Electric | | | 63,201 | |
| | 2,470 | | | General Dynamics | | | 168,158 | |
| | 4,615 | | | Iron Mountain | | | 159,679 | |
| | 2,235 | | | Lockheed Martin | | | 209,352 | |
| | 3,670 | | | Norfolk Southern | | | 225,155 | |
| | 2,765 | | | Raytheon | | | 156,388 | |
| | 5,135 | | | Republic Services | | | 145,577 | |
| | 3,115 | | | United Parcel Service, Class B | | | 228,174 | |
| | 775 | | | United Technologies | | | 60,574 | |
| | 1,710 | | | Waste Management | | | 55,985 | |
| | | | | | | | |
| | | | | | | 1,662,614 | |
| | | | | | | | |
| | |
| | | | Information Technology – 9.86% | | | | |
| | 3,475 | | | Automatic Data Processing | | | 200,820 | |
| | 5,475 | | | CA | | | 123,297 | |
| | 7,175 | | | Corning | | | 84,306 | |
| | 11,955 | | | Intel | | | 258,527 | |
| | 3,245 | | | j2 Global | | | 97,480 | |
| | 4,975 | | | Microsoft | | | 141,962 | |
| | 3,750 | | | Paychex | | | 121,613 | |
| | | | | | | | |
| | | | | | | 1,028,005 | |
| | | | | | | | |
| | |
| | | | Materials – 2.81% | | | | |
| | 4,120 | | | Bemis | | | 136,166 | |
| | 3,900 | | | Nucor | | | 156,507 | |
| | | | | | | | |
| | | | | | | 292,673 | |
| | | | | | | | |
| | |
| | | | Telecommunication Services – 5.94% | | | | |
| | 6,951 | | | Telefonica Brasil SA ADR (Brazil) | | | 153,061 | |
| | 4,960 | | | Verizon Communications | | | 221,414 | |
| | 8,970 | | | Vodafone Group, SP ADR (United Kingdom) | | | 244,163 | |
| | | | | | | | |
| | | | | | | 618,638 | |
| | | | | | | | |
See accompanying Notes to Financial Statements.
| | |
| |
| ASTON/River Road Dividend All Cap Value Fund II | | October 31, 2012 |
| |
| Schedule of Investments – continued | | |
| | | | | | | | |
Shares | | | | | Market
Value | |
| | |
| | | | Utilities – 4.95% | | | | |
| | 1,760 | | | AmeriGas Partners LP | | $ | 78,848 | |
| | 2,720 | | | Avista | | | 69,142 | |
| | 1,695 | | | Entergy | | | 123,023 | |
| | 2,235 | | | National Fuel Gas | | | 117,785 | |
| | 2,970 | | | UNS Energy | | | 126,641 | |
| | | | | | | | |
| | | | | | | 515,439 | |
| | | | | | | | |
| | |
| | | | Total Common Stocks
(Cost $9,971,686) | | | 9,924,333 | |
| | | | | | | | |
|
| | INVESTMENT COMPANY – 3.55% | |
| | |
| | 369,982 | | | BlackRock Liquidity Funds
TempCash Portfolio | | | 369,982 | |
| | | | | | | | |
| | |
| | | | Total Investment Company
(Cost $369,982) | | | 369,982 | |
| | | | | | | | |
| Total Investments – 98.80%
(Cost $10,341,668)* | | | 10,294,315 | |
| | | | | | | | |
| Net Other Assets and Liabilities – 1.20% | | | 124,925 | |
| | | | | | | | |
| Net Assets – 100.00% | | $ | 10,419,240 | |
| | | | | | | | |
| * | | Aggregate cost for Federal income tax purposes is $10,342,918. |
| | | | |
Gross unrealized appreciation | | $ | 151,570 | |
Gross unrealized depreciation | | | (200,173 | ) |
| | | | |
Net unrealized depreciation | | $ | (48,603 | ) |
| | | | |
| ADR | | American Depositary Receipt |
| SP ADR | | Sponsored American Depositary Receipt |
See accompanying Notes to Financial Statements.
ASTON/Fairpointe Mid Cap Fund
| | |
| |
| Portfolio Manager Commentary (unaudited) | | October 31, 2012 |
Thyra E. Zerhusen, Marie L. Lorden & Mary L. Pierson
| Q. | What were the most significant market factors affecting Fund performance and returns relative to the benchmark during the past 12 months? |
| A. | Despite a multitude of macro concerns in Europe and the U.S. and significant volatility, equity markets fared quite well. The S&P 500 Index was up 15.21%, the S&P Midcap 400 Index increased 12.11% and the Russell Midcap Index was up 12.15%. The Fund was up 11.15% (11.46%, I–shares), slightly outperforming its Morningstar Mid-Blend category which increased 10.26%. |
| Q. | What were the best performing holdings for the Fund during the period? |
| A. | The best performing stocks were Akamai Technologies, a leader in accelerating delivery of internet content, up 44%; Gannett Company, a provider of media and marketing services, up 52%; and Lincare Holdings, a home health care provider, up 76%. We eliminated the position from the portfolio after it became a takeover target by Linde AG. Linde paid $41.50 per Lincare share. |
| Q. | What were the weakest performing holdings? |
| A. | Two stocks were down more than 20% during the period: Lexmark International and Unisys Corporation. Lexmark reported second quarter results below expectations. The company subsequently announced a significant share repurchase program and a major restructuring plan (including the exit of the low margin inkjet printer business). The stock is currently trading at book value, a yield of 5.2%, and P/E multiple of 5.6x. Unisys reported disappointing third quarter |
| | results. North American revenues in particular were weaker than expected. The stock appears attractively valued with a current P/E of 5x. We remain encouraged by the growing pipeline of opportunities in cloud computing and data security. |
| Q. | How was the Fund positioned as of October 31, 2012? |
| A. | The Fund is attractively valued with a P/E of 11.3x and a P/E to growth rate of 1.1. This valuation is more attractive than the S&P 400 benchmark which has a P/E of 14.2x and the Russell Midcap’s P/E of 12.2. At the same time, our mid-cap holdings have a better balance sheet profile and have the potential to be more profitable compared to the above mentioned benchmarks. Our mid-cap holdings are well diversified geographically, have the ability to grow market share, and in many cases represent “must have” products or services that make their clients more efficient. |
Concerns about the current economic problems in the U.S. and abroad have provided us with the opportunity to initiate or add to positions in companies with strong secular growth but which are currently under pressure due to the still weak economic environment. We look for companies that have the ability to weather the current storms and report strong results when conditions improve.
Note: The price/earnings (P/E) of a fund is the weighted average of the P/E ratios of all the companies in the fund’s portfolio. The P/E ratio of a company is a comparison of the price of the company’s stock divided by its estimated earnings per share.
Growth of a Hypothetical
$10,000 Investment—Class N
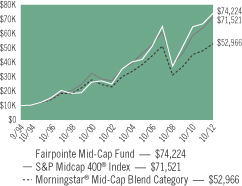
All dividends and capital gains are reinvested. Indexes are unmanaged and do not take into account fees, expenses or other costs.
Returns shown in the chart and table do not reflect taxes that a shareholder would pay on Fund distributions or on the sale of the Fund shares.
Small-cap and mid-cap stocks may be subject to a higher degree of market risk than the securities of more established companies because they tend to be more volatile and less liquid.
RETURNSFOR PERIOD ENDED 10/31/12
Average Annual Total Returns - Class N
| | | | |
One Year | | | 11.15 | % |
Five Year | | | 2.70 | % |
Ten Year | | | 11.51 | % |
Since Inception | | | 11.70 | % |
Inception Date 09/19/94
Average Annual Total Returns - Class I
| | | | |
One Year | | | 11.46 | % |
Five Year | | | 2.95 | % |
Since Inception | | | 7.49 | % |
Inception Date 07/06/04
The performance data quoted represents past performance. Past performance does not guarantee future results. Investment return and principal value will fluctuate so that an investor’s shares, upon redemption, may be worth more or less than their original cost. Current performance may be lower or higher than the performance data quoted. For performance data current to the most recent month-end, please visit our website at www.astonfunds.com.
The total expense ratio for the Class N and Class I Shares is 1.14% and 0.89% respectively, as disclosed in the prospectus dated March 1, 2012. Please refer to the Financial Highlights section in this report for more 2012 fiscal year-end related information.
| | |
| |
| ASTON/Fairpointe Mid Cap Fund | | October 31, 2012 |
| |
| Schedule of Investments | | |
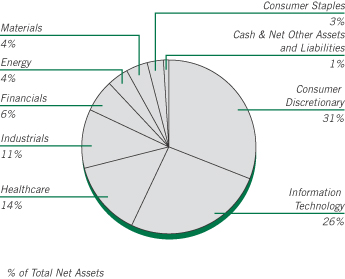
| | | | | | | | |
Shares | | | | | Market
Value | |
| |
| | COMMON STOCKS – 99.09% | | | | |
| | |
| | | | Consumer Discretionary – 30.69% | | | | |
| | 6,938,478 | | | Belo, Class A | | $ | 51,899,815 | |
| | 701,200 | | | BorgWarner * | | | 46,152,984 | |
| | 4,334,100 | | | DeVry | | | 113,813,466 | |
| | 6,501,400 | | | Gannett | | | 109,873,660 | |
| | 6,565,800 | | | H&R Block | | | 116,214,660 | |
| | 8,062,468 | | | Interpublic Group | | | 81,430,927 | |
| | 1,275,400 | | | Lear | | | 54,332,040 | |
| | 1,357,200 | | | Mattel | | | 49,917,816 | |
| | 1,482,555 | | | McGraw-Hill | | | 81,955,640 | |
| | 11,650,554 | | | New York Times, Class A * | | | 95,301,532 | |
| | 1,514,897 | | | Scholastic | | | 49,976,452 | |
| | 6,741,900 | | | Staples | | | 77,632,979 | |
| | | | | | | | |
| | | | | | | 928,501,971 | |
| | | | | | | | |
| | |
| | | | Consumer Staples – 3.28% | | | | |
| | 356,720 | | | Bunge | | | 25,337,822 | |
| | 1,709,486 | | | Molson Coors Brewing, Class B | | | 73,747,226 | |
| | | | | | | | |
| | | | | | | 99,085,048 | |
| | | | | | | | |
| | |
| | | | Energy – 4.45% | | | | |
| | 1,249,692 | | | Compagnie Generale de Geophysique-Veritas, SP ADR (France) | | | 40,589,996 | |
| | 1,711,329 | | | Denbury Resources * | | | 26,234,674 | |
| | 1,660,792 | | | FMC Technologies * | | | 67,926,393 | |
| | | | | | | | |
| | | | | | | 134,751,063 | |
| | | | | | | | |
| | |
| | | | Financials – 5.93% | | | | |
| | 1,429,800 | | | Cincinnati Financial | | | 56,963,232 | |
| | 1,862,285 | | | Eaton Vance | | | 52,404,700 | |
| | 1,467,888 | | | Northern Trust | | | 70,135,689 | |
| | | | | | | | |
| | | | | | | 179,503,621 | |
| | | | | | | | |
| | | | | | | | |
Shares | | | | | Market
Value | |
| | |
| | | | Healthcare – 14.20% | | | | |
| | 21,005,636 | | | Boston Scientific * | | $ | 107,968,969 | |
| | 1,821,719 | | | Charles River Laboratories * | | | 67,986,553 | |
| | 2,359,768 | | | Forest Laboratories * | | | 79,547,779 | |
| | 2,883,231 | | | Hospira * | | | 88,486,359 | |
| | 1,283,700 | | | Varian Medical Systems * | | | 85,699,812 | |
| | | | | | | | |
| | | | | | | 429,689,472 | |
| | | | | | | | |
| | |
| | | | Industrials – 10.99% | | | | |
| | 1,196,000 | | | Chicago Bridge & Iron (Netherlands) | | | 44,909,800 | |
| | 2,346,100 | | | Con-way | | | 68,294,971 | |
| | 1,553,944 | | | ManpowerGroup | | | 58,956,635 | |
| | 9,136,600 | | | Southwest Airlines | | | 80,584,812 | |
| | 3,445,400 | | | Werner Enterprises | | | 79,795,464 | |
| | | | | | | | |
| | | | | | | 332,541,682 | |
| | | | | | | | |
| | |
| | | | Information Technology – 25.69% | | | | |
| | 2,348,239 | | | Akamai Technologies * | | | 89,209,600 | |
| | 2,096,100 | | | Cree * | | | 63,574,713 | |
| | 1,219,900 | | | Harris | | | 55,847,022 | |
| | 2,279,798 | | | Itron * | | | 93,608,506 | |
| | 2,702,900 | | | Jabil Circuit | | | 46,868,286 | |
| | 3,608,400 | | | Lexmark International, Class A | | | 76,714,584 | |
| | 566,104 | | | Mentor Graphics * | | | 8,785,934 | |
| | 1,883,786 | | | Molex | | | 48,921,922 | |
| | 1,829,264 | | | Molex, Class A | | | 39,219,420 | |
| | 3,021,300 | | | Nuance Communications * | | | 67,254,138 | |
| | 4,677,300 | | | NVIDIA * | | | 55,987,281 | |
| | 3,856,628 | | | Unisys * | | | 65,755,507 | |
| | 1,824,659 | | | Zebra Technologies, Class A * | | | 65,559,998 | |
| | | | | | | | |
| | | | | | | 777,306,911 | |
| | | | | | | | |
| | |
| | | | Materials – 3.86% | | | | |
| | 928,600 | | | FMC | | | 49,698,672 | |
| | 957,900 | | | Sigma-Aldrich | | | 67,187,106 | |
| | | | | | | | |
| | | | | | | 116,885,778 | |
| | | | | | | | |
| | |
| | | | Total Common Stocks
(Cost $2,511,414,136) | | | 2,998,265,546 | |
| | | | | | | | |
| |
| | INVESTMENT COMPANY – 0.75% | | | | |
| | |
| | 22,475,495 | | | BlackRock Liquidity Funds TempCash Portfolio | | | 22,475,495 | |
| | | | | | | | |
| | |
| | | | Total Investment Company
(Cost $22,475,495) | | | 22,475,495 | |
| | | | | | | | |
| Total Investments – 99.84%
(Cost $2,533,889,631)** | | | 3,020,741,041 | |
| | | | | | | | |
| Net Other Assets and Liabilities – 0.16% | | | 4,990,591 | |
| | | | | | | | |
| Net Assets – 100.00% | | $ | 3,025,731,632 | |
| | | | | | | | |
See accompanying Notes to Financial Statements.
| | |
| |
| ASTON/Fairpointe Mid Cap Fund | | October 31, 2012 |
| |
| Schedule of Investments – continued | | |
| * | | Non-income producing security. |
| ** | | Aggregate cost for Federal income tax purposes is $2,535,470,394. |
| | | | |
Gross unrealized appreciation | | $ | 589,711,130 | |
Gross unrealized depreciation | | | (104,440,483 | ) |
| | | | |
Net unrealized appreciation | | $ | 485,270,647 | |
| | | | |
| SP ADR | | Sponsored American Depositary Receipt |
See accompanying Notes to Financial Statements.
ASTON/Montag & Caldwell Mid Cap Growth Fund
| | |
| |
| Portfolio Manager Commentary (unaudited) | | October 31, 2012 |
| | M. Scott Thompson, CFA & Andrew W. Jung, CFA |
| Q. | What were the most significant market factors affecting Fund performance and returns relative to the benchmark during the past 12 months? |
| A. | For the past 12 months, the Fund just slightly underperformed its primary benchmark as positive stock selection was offset by sector allocation. Stock selection in the Consumer Discretionary sector was again particularly good as was stock selection in the Energy and Materials sectors. Stock selection in Financials and Healthcare, by comparison, were detractors from performance, though allocation to these two sectors was neutral to modestly positive. In both cases, a single stock in both sectors accounted for the majority of the underperformance. |
| Q. | What were the best performing holdings for the Fund during the period? |
| A. | Over the past twelve months, LKQ Corporation, Inc. shares have benefited from above-average earnings growth during a period of both increased economic uncertainty as well as slowing corporate profit growth. The company was able to achieve better growth through ongoing improvements in the company’s core business, alternative collision replacement parts, as well as the attractive acquisition of Euro Car Parts in October 2011. |
Verisk Analytics, Inc., which provides information and data analytics about risk to companies in the insurance, healthcare, and mortgage industries, among others, benefited from consistent double-digit revenue growth and rising margins driving 15-20% quarterly earnings growth.
Ecolab Inc. shares performed well as solid organic growth for its core institutional cleaning and sanitizing business, combined with the accretive benefits of the Nalco acquisition, which closed in late 2011, offered investors visibility to accelerating earnings per share growth despite a slowing in global economic growth.
| Q. | What were the weakest performing holdings? |
| A. | Unusually weak telecom carrier spending in the second half of 2011 carried |
| | forward into the first half of 2012, which made for a difficult demand environment for Juniper Networks, causing its shares to underperform. |
MSCI experienced a sharp correction in its share price in recent months following Vanguard’s decision to eliminate the use of MSCI indices as benchmarks for their index mutual funds. In addition to the negative financial impact to MSCI, investors grew concerned that other providers of ETFs and index funds might follow suit, potentially causing a reduction in the company’s medium-term earnings power and growth trajectory.
For F5 Networks, rising political and macro uncertainty this past summer and early fall caused customers to postpone spending decisions, which led to an earnings shortfall in the September quarter and downward estimate revisions.
| Q. | How was the Fund positioned as of October 31, 2012? |
| A. | We continue to maintain what we believe is a balanced portfolio of both cyclical and non-cyclical growth stocks to reflect the challenge of dueling market forces—weakening economic and corporate profit growth offset by additional central bank accommodation. Political uncertainty remains high, which has implications for how the “fiscal cliff” is addressed. Based on experience with the showdown over the debt ceiling in 2011, our confidence that it gets resolved gracefully is low. Most investors seem to be adopting a more hopeful view that a last minute deal will be struck to prevent us from going over the cliff. Regardless of the outcome, we remain convinced that the longer-term growth outlook remains subdued as household and government sector deleveraging will likely remain dominant themes for the foreseeable future. In that environment, we continue to believe that high-quality growth stocks offer the greatest appeal. Their valuations are attractive on our work, and their earnings growth is possibly due to their financial strength and geographic diversification. |
Growth of a Hypothetical $10,000 Investment—Class N
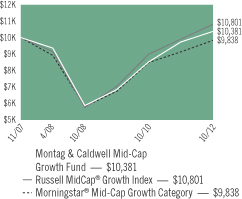
All dividends and capital gains are reinvested. Indexes are unmanaged and do not take into account fees, expenses or other costs.
Returns shown in the chart and table do not reflect taxes that a shareholder would pay on Fund distributions or on the sale of the Fund shares.
Mid-cap stocks may be subject to a higher degree of market risk than the securities of more established companies because they tend to be more volatile and less liquid.
RETURNSFOR PERIOD ENDED 10/31/12
Average Annual Total Returns - Class N
| | | | |
One Year | | | 6.70 | % |
Since Inception | | | 0.75 | % |
Inception Date 11/02/07
The performance data quoted represents past performance. Past performance does not guarantee future results. Investment return and principal value will fluctuate so that an investor’s shares, upon redemption, may be worth more or less than their original cost. Current performance may be lower or higher than the performance data quoted. For performance data current to the most recent month-end, please visit our website at www.astonfunds.com.
The performance quoted would have been lower if fee waivers and/or expense reimbursements had not been in effect.
| | |
| |
| ASTON/Montag & Caldwell Mid Cap Growth Fund | | October 31, 2012 |
| |
| Schedule of Investments | | |
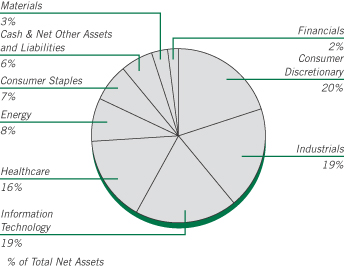
| | | | | | | | |
Shares | | | | | Market
Value | |
| |
| | COMMON STOCKS – 94.32% | | | | |
| | |
| | | | Consumer Discretionary – 20.45% | | | | |
| | 1,590 | | | Bed Bath & Beyond * | | $ | 91,711 | |
| | 1,890 | | | BorgWarner * | | | 124,400 | |
| | 1,970 | | | Dick’s Sporting Goods | | | 98,500 | |
| | 8,210 | | | LKQ * | | | 171,507 | |
| | 1,780 | | | O’Reilly Automotive * | | | 152,510 | |
| | 1,460 | | | Omnicom Group | | | 69,949 | |
| | 850 | | | Panera Bread, Class A * | | | 143,344 | |
| | 1,500 | | | PVH | | | 164,985 | |
| | 840 | | | Ralph Lauren | | | 129,100 | |
| | 1,170 | | | Ross Stores | | | 71,312 | |
| | 1,040 | | | Starwood Hotels & Resorts Worldwide | | | 53,924 | |
| | 960 | | | Tractor Supply | | | 92,390 | |
| | 2,030 | | | Warnaco Group (The) * | | | 143,277 | |
| | | | | | | | |
| | | | | | | 1,506,909 | |
| | | | | | | | |
| | |
| | | | Consumer Staples – 7.01% | | | | |
| | 2,710 | | | Church & Dwight | | | 137,560 | |
| | 1,730 | | | Fresh Market * | | | 98,108 | |
| | 2,240 | | | McCormick & Co (Non Voting Shares) | | | 138,029 | |
| | 2,320 | | | Mead Johnson Nutrition | | | 143,051 | |
| | | | | | | | |
| | | | | | | 516,748 | |
| | | | | | | | |
| | |
| | | | Energy – 8.03% | | | | |
| | 3,360 | | | Cameron International * | | | 170,150 | |
| | 950 | | | Core Laboratories (Netherlands) | | | 98,477 | |
| | 3,600 | | | Oceaneering International | | | 188,388 | |
| | 2,500 | | | SM Energy | | | 134,800 | |
| | | | | | | | |
| | | | | | | 591,815 | |
| | | | | | | | |
| | |
| | | | Financials – 2.38% | | | | |
| | 1,340 | | | IntercontinentalExchange * | | | 175,540 | |
| | | | | | | | |
| | | | | | | | |
Shares | | | | | Market
Value | |
| | |
| | | | Healthcare – 15.62% | | | | |
| | 4,320 | | | Dentsply International | | $ | 159,149 | |
| | 1,240 | | | Edwards Lifesciences * | | | 107,669 | |
| | 1,670 | | | Henry Schein * | | | 123,213 | |
| | 1,260 | | | IDEXX Laboratories * | | | 121,212 | |
| | 1,200 | | | Perrigo | | | 138,012 | |
| | 5,210 | | | ResMed | | | 208,087 | |
| | 2,310 | | | Varian Medical Systems * | | | 154,216 | |
| | 1,700 | | | Waters * | | | 139,077 | |
| | | | | | | | |
| | | | | | | 1,150,635 | |
| | | | | | | | |
| | |
| | | | Industrials – 19.14% | | | | |
| | 4,755 | | | AMETEK | | | 169,040 | |
| | 3,010 | | | Donaldson | | | 97,133 | |
| | 2,540 | | | Expeditors International Washington | | | 92,989 | |
| | 1,860 | | | Fastenal | | | 83,142 | |
| | 1,610 | | | J.B. Hunt Transport Services | | | 94,507 | |
| | 2,280 | | | Jacobs Engineering Group * | | | 87,985 | |
| | 2,050 | | | Joy Global | | | 128,023 | |
| | 6,540 | | | Robert Half International | | | 175,861 | |
| | 960 | | | Roper Industries | | | 104,803 | |
| | 2,040 | | | Stericycle * | | | 193,310 | |
| | 3,600 | | | Verisk Analytics, Class A * | | | 183,600 | |
| | | | | | | | |
| | | | | | | 1,410,393 | |
| | | | | | | | |
| | |
| | | | Information Technology – 18.85% | | | | |
| | 5,310 | | | Altera | | | 161,849 | |
| | 2,800 | | | Amphenol, Class A | | | 168,364 | |
| | 2,640 | | | ANSYS * | | | 187,123 | |
| | 1,900 | | | F5 Networks * | | | 156,712 | |
| | 1,300 | | | FactSet Research Systems | | | 117,715 | |
| | 2,520 | | | Fiserv * | | | 188,849 | |
| | 10,490 | | | Juniper Networks * | | | 173,819 | |
| | 8,760 | | | NVIDIA * | | | 104,857 | |
| | 1,900 | | | Teradata * | | | 129,789 | |
| | | | | | | | |
| | | | | | | 1,389,077 | |
| | | | | | | | |
| | |
| | | | Materials – 2.84% | | | | |
| | 3,010 | | | Ecolab | | | 209,496 | |
| | | | | | | | |
| | |
| | | | Total Common Stocks
(Cost $6,077,628) | | | 6,950,613 | |
| | | | | | | | |
| |
| | INVESTMENT COMPANY – 5.97% | | | | |
| | |
| | 439,467 | | | BlackRock Liquidity Funds TempCash Portfolio | | | 439,467 | |
| | | | | | | | |
| | |
| | | | Total Investment Company
(Cost $439,467) | | | 439,467 | |
| | | | | | | | |
| Total Investments – 100.29%
(Cost $6,517,095)** | | | 7,390,080 | |
| | | | | | | | |
| Net Other Assets and Liabilities – (0.29)% | | | (21,130 | ) |
| | | | | | | | |
| Net Assets – 100.00% | | $ | 7,368,950 | |
| | | | | | | | |
See accompanying Notes to Financial Statements.
| | |
| |
| ASTON/Montag & Caldwell Mid Cap Growth Fund | | October 31, 2012 |
| |
| Schedule of Investments – continued | | |
| * | | Non-income producing security. |
| ** | | Aggregate cost for Federal income tax purposes is $6,541,125. |
| | | | |
Gross unrealized appreciation | | $ | 1,079,040 | |
Gross unrealized depreciation | | | (230,085 | ) |
| | | | |
Net unrealized appreciation | | $ | 848,955 | |
| | | | |
See accompanying Notes to Financial Statements.
ASTON/Veredus Small Cap Growth Fund
| | |
| |
| Portfolio Manager Commentary (unaudited) | | October 31, 2012 |
(formerly, the ASTON/Veredus
Aggressive Growth Fund) | | B. Anthony Weber; Charles F. Mercer, Jr., CFA; Michael E. Johnson, CFA; John R. Prys, CFA |
| | & Katherine A. Kuntz, CFA |
| Q. | What were the most significant market factors affecting Fund performance and returns relative to the benchmark during the past 12 months? |
| A. | The great majority of the Fund’s underperformance occurred during the final two months of 2011, as the results have just barely lagged the benchmark in calendar 2012 through the end of October. October 2011 was a big up month for the market overall as it rallied strongly in reaction to the Federal Reserve’s announcement of its second round of quantitative easing (QE2) and the market digested those gains by gravitating toward defensive themes and richer dividends during the final two months of that year. We had a couple of holdings with earnings problems that quarter as well. |
| Q. | What were the best performing holdings for the Fund during the period? |
| A. | The portfolio’s position in Consumer Staples, led by Schiff Nutrition and Hain Celestial, posted strong gains. Schiff agreed to be acquired by Bayer at a significant premium in October, while increased earnings estimates boosted Hain. The best performer for the year, however, was the newly public Mexican restaurant concept Chuy’s, which we think is an outstanding concept with great economics and a lot of runway for growth going forward. |
| Q. | What were the weakest performing holdings? |
| A. | The majority of the weakness in the portfolio came from the Information Technology sector, as themes were very hard to come by unless a company was part of the supply chain for surging Apple |
| | products. Service Source International, a business services software company that provides cloud based solutions to better manage revenue flow, came under fire as revenue recognition was questioned. From our experience, once that starts to happen with a software company it’s time to exit. Digital media company Rovi announced third quarter results that missed estimates and gave weak guidance. This had been a huge stock for the portfolio in the past, but the company missed a tremendous opportunity in the world of digital movie downloads. We exited the stock as it rallied back from the near-termsell-off, though still at a significant loss for the period. Tangoe, another software firm, suffered as short sellers questioned the firm’s organic growth after a recent acquisition. |
| Q. | How was the Fund positioned as of October 31, 2012? |
| A. | The Fund’s biggest exposure is in consumer-related areas as we think gasoline prices will continue to decline, freeing up income for consumption elsewhere. The housing market also appears to be recovering, boosting consumer confidence. Our emphasis is on specialty retailers and homebuilders, with the portfolio’s Materials position also leveraged to the homebuilding sector. A stake in Healthcare is highly specialized until we see what the effects of the Affordable Care Act are truly going to be. Technology, as one might expect given the lack of any real themes, is at the lowest levels for the Fund in a long time. With the “fiscal cliff” looming, 2013 could be a difficult year. We will be watching Washington closely and would not rule out getting defensive in the not too distant future. |
Growth of a Hypothetical $10,000 Investment—Class N
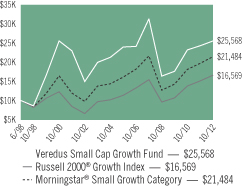
All dividends and capital gains are reinvested. Indexes are unmanaged and do not take into account fees, expenses or other costs.
Returns shown in the chart and table do not reflect taxes that a shareholder would pay on Fund distributions or on the sale of the Fund shares.
Small company stocks may be subject to a higher degree of market risk than the securities of more established companies because they tend to be more volatile and less liquid.
RETURNSFOR PERIOD ENDED 10/31/12
Average Annual Total Returns - Class N
| | | | |
One Year | | | 5.42 | % |
Five Year | | | -3.98 | % |
Ten Year | | | 5.51 | % |
Since Inception | | | 6.77 | % |
Inception Date 06/30/98
Average Annual Total Returns - Class I
| | | | |
One Year | | | 5.62 | % |
Five Year | | | -3.74 | % |
Ten Year | | | 5.79 | % |
Since Inception | | | 1.09 | % |
Inception Date 10/05/01
The performance data quoted represents past performance. Past performance does not guarantee future results. Investment return and principal value will fluctuate so that an investor’s shares, upon redemption, may be worth more or less than their original cost. Current performance may be lower or higher than the performance data quoted. For performance data current to the most recent month-end, please visit our website at www.astonfunds.com.
The performance quoted would have been lower if fee waivers and/or expense reimbursements had not been in effect.
The total expense ratio for the Class N and Class I Shares is 1.66% and 1.41% respectively, as disclosed in the prospectus dated March 1, 2012. Please refer to the Financial Highlights section in this report for more 2012 fiscal year-end related information.
| | |
| |
| ASTON/Veredus Small Cap Growth Fund | | October 31, 2012 |
| |
| Schedule of Investments | | |
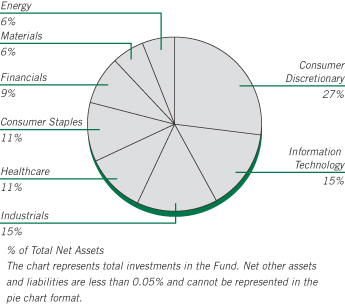
| | | | | | | | |
Shares | | | | | Market
Value | |
|
| | COMMON STOCKS – 100.15% | |
| | |
| | | | Consumer Discretionary – 27.10% | | | | |
| | 6,700 | | | Blue Nile * | | $ | 253,058 | |
| | 26,200 | | | Chico’s FAS | | | 487,320 | |
| | 19,220 | | | Chuy’s Holdings * | | | 469,544 | |
| | 8,625 | | | Five Below * | | | 285,832 | |
| | 26,394 | | | Francesca’s Holdings * | | | 779,414 | |
| | 7,858 | | | Gentherm * | | | 94,452 | |
| | 13,900 | | | Jack in the Box * | | | 361,539 | |
| | 18,500 | | | MDC Holdings | | | 707,440 | |
| | 16,150 | | | Pier 1 Imports | | | 329,460 | |
| | 10,175 | | | Ryland Group | | | 344,627 | |
| | 8,990 | | | Select Comfort * | | | 250,192 | |
| | 10,425 | | | Shutterfly * | | | 315,461 | |
| | 34,275 | | | Sinclair Broadcast Group, Class A | | | 431,865 | |
| | 8,750 | | | Stage Stores | | | 214,375 | |
| | 9,500 | | | Sturm Ruger | | | 448,685 | |
| | 11,350 | | | Tilly’s, Class A * | | | 183,189 | |
| | 4,340 | | | Ulta Salon Cosmetics & Fragrance | | | 400,235 | |
| | 3,350 | | | Vitamin Shoppe * | | | 191,754 | |
| | | | | | | | |
| | | | | | | 6,548,442 | |
| | | | | | | | |
| | |
| | | | Consumer Staples – 10.64% | | | | |
| | 25,400 | | | B&G Foods | | | 768,858 | |
| | 13,510 | | | Elizabeth Arden * | | | 637,402 | |
| | 4,907 | | | Hain Celestial Group * | | | 283,625 | |
| | 20,825 | | | Natural Grocers by Vitamin Cottage * | | | 422,331 | |
| | 13,550 | | | Schiff Nutrition International * | | | 458,532 | |
| | | | | | | | |
| | | | | | | 2,570,748 | |
| | | | | | | | |
| | |
| | | | Energy – 5.90% | | | | |
| | 3,900 | | | Approach Resources * | | | 96,057 | |
| | 9,475 | | | Carrizo Oil & Gas * | | | 254,120 | |
| | | | | | | | |
Shares | | | | | Market
Value | |
| | |
| | | | Energy (continued) | | | | |
| | 12,900 | | | Comstock Resources * | | $ | 220,848 | |
| | 4,125 | | | Oasis Petroleum * | | | 121,151 | |
| | 35,250 | | | PetroQuest Energy * | | | 215,025 | |
| | 25,200 | | | Rex Energy * | | | 333,648 | |
| | 7,400 | | | Western Refining | | | 184,038 | |
| | | | | | | | |
| | | | | | | 1,424,887 | |
| | | | | | | | |
| | |
| | | | Financials – 8.89% | | | | |
| | 34,300 | | | Apollo Global Management LLC, Class A | | | 521,017 | |
| | 11,575 | | | Banner | | | 335,559 | |
| | 8,950 | | | Community Bank System | | | 246,931 | |
| | 3,300 | | | Jones Lang Lasalle | | | 256,542 | |
| | 1,775 | | | Navigators Group * | | | 94,217 | |
| | 21,200 | | | Old National Bancorp | | | 260,124 | |
| | 7,500 | | | Piper Jaffray * | | | 201,375 | |
| | 6,325 | | | Wintrust Financial | | | 233,709 | |
| | | | | | | | |
| | | | | | | 2,149,474 | |
| | | | | | | | |
| | |
| | | | Healthcare – 10.85% | | | | |
| | 14,335 | | | Acadia Healthcare * | | | 294,871 | |
| | 19,600 | | | Alkermes * | | | 363,188 | |
| | 13,150 | | | Cynosure, Class A * | | | 346,371 | |
| | 22,521 | | | Exact Sciences * | | | 213,049 | |
| | 32,200 | | | Health Management Associates, Class A * | | | 235,060 | |
| | 12,967 | | | Healthstream * | | | 331,177 | |
| | 10,225 | | | PerkinElmer | | | 316,259 | |
| | 4,750 | | | Sirona Dental Systems * | | | 271,985 | |
| | 17,200 | | | Spectranetics * | | | 250,432 | |
| | | | | | | | |
| | | | | | | 2,622,392 | |
| | | | | | | | |
| | |
| | | | Industrials – 14.71% | | | | |
| | 12,875 | | | AAON | | | 270,118 | |
| | 11,750 | | | AZZ | | | 463,420 | |
| | 96,825 | | | Builders FirstSource * | | | 533,506 | |
| | 5,300 | | | Celadon Group | | | 90,630 | |
| | 5,300 | | | Marten Transport | | | 98,103 | |
| | 20,665 | | | MasTec * | | | 466,202 | |
| | 11,978 | | | Mistras Group * | | | 264,594 | |
| | 1,567 | | | Portfolio Recovery Associates * | | | 163,987 | |
| | 13,170 | | | Powell Industries * | | | 523,903 | |
| | 6,175 | | | Team * | | | 202,417 | |
| | 13,650 | | | Trex * | | | 476,931 | |
| | | | | | | | |
| | | | | | | 3,553,811 | |
| | | | | | | | |
| | |
| | | | Information Technology – 15.52% | | | | |
| | 8,085 | | | ACI Worldwide * | | | 316,124 | |
| | 11,800 | | | Allot Communications (Israel) * | | | 275,648 | |
| | 14,900 | | | Anaren * | | | 268,647 | |
| | 27,650 | | | CalAmp * | | | 245,532 | |
| | 73,600 | | | Callidus Software * | | | 341,504 | |
| | 8,600 | | | Cardtronics * | | | 244,326 | |
| | 10,250 | | | Cirrus Logic * | | | 417,790 | |
| | 4,850 | | | Ellie Mae * | | | 121,250 | |
| | 8,987 | | | Heartland Payment Systems | | | 234,381 | |
| | 15,827 | | | LivePerson * | | | 248,326 | |
| | 38,225 | | | Move * | | | 316,885 | |
See accompanying Notes to Financial Statements.
| | |
| |
| ASTON/Veredus Small Cap Growth Fund | | October 31, 2012 |
| |
| Schedule of Investments – continued | | |
| | | | | | | | |
Shares | | | | | Market
Value | |
| | |
| | | | Information Technology (continued) | | | | |
| | 77,772 | | | Silicon Image * | | $ | 342,197 | |
| | 21,050 | | | Tangoe * | | | 271,966 | |
| | 14,985 | | | TeleNav * | | | 105,494 | |
| | | | | | | | |
| | | | | | | 3,750,070 | |
| | | | | | | | |
| | |
| | | | Materials – 6.54% | | | | |
| | 5,150 | | | American Vanguard | | | 184,010 | |
| | 7,525 | | | Eagle Materials | | | 398,599 | |
| | 39,000 | | | Louisiana-Pacific * | | | 615,810 | |
| | 8,875 | | | Texas Industries * | | | 382,779 | |
| | | | | | | | |
| | | | | | | 1,581,198 | |
| | | | | | | | |
| | |
| | | | Total Common Stocks
(Cost $22,235,255) | | | 24,201,022 | |
| | | | | | | | |
|
| | WARRANTS – 0.00% | |
| | |
| | | | Energy – 0.00% | | | | |
| | 4,906 | | | Magnum Hunter Resources, Expiration 10/14/13 | | | 147 | |
| | | | | | | | |
| | |
| | | | Total Warrants
(Cost $—) | | | 147 | |
| | | | | | | | |
|
| | INVESTMENT COMPANY – 1.87% | |
| | |
| | 451,077 | | | BlackRock Liquidity Funds
TempCash Portfolio | | | 451,077 | |
| | | | | | | | |
| | |
| | | | Total Investment Company
(Cost $451,077) | | | 451,077 | |
| | | | | | | | |
| Total Investments – 102.02%
(Cost $22,691,645)** | | | 24,652,246 | |
| | | | | | | | |
| Net Other Assets and Liabilities – (2.02)% | | | (488,941 | ) |
| | | | | | | | |
| Net Assets – 100.00% | | $ | 24,163,305 | |
| | | | | | | | |
| * | | Non-income producing security. |
| ** | | Aggregate cost for Federal income tax purposes is $22,736,235. |
| | | | |
Gross unrealized appreciation | | $ | 2,983,366 | |
Gross unrealized depreciation | | | (1,067,355 | ) |
| | | | |
Net unrealized appreciation | | $ | 1,916,011 | |
| | | | |
See accompanying Notes to Financial Statements.
ASTON Small Cap Growth Fund
| | |
| |
| Portfolio Manager Commentary (unaudited) | | October 31, 2012 |
(formerly, the ASTON/Crosswind
Small Cap Growth Fund) | | Andrew Morey, CFA |
| Q. | What were the most significant market factors affecting Fund performance and returns relative to the index during the past 12 months? |
| A. | The most significant factors affecting the Fund’s performance relative to the index over the past year were the reemergence of growth-oriented stocks, and the breadth the market has exhibited in willingness to pay for revenue growth, margin expansion, and positive earnings. Coming off a challenging period in the prior fiscal year, we were confident in our overall positioning last fall—that the volatility of the prior period would create a pool of companies demonstrating the unrecognized growth characteristics we seek. That condition has occurred as several of our stocks surprised and revised earnings upward during the past year. Consequently, the Fund’s relative performance has turned sharply positive over the past year. |
| Q. | What were the best performing holdings for the Fund during the period? |
| A. | At the sector level, Information Technology was a strong area for the Fund, especially among our software holdings, where merger and acquisition activity helped boost returns. Kenexa was a top-performing stock and the most significant positive contributor to the Fund’s return comparison for the year. Kenexa is a leading developer of human resources software with a deep client base, and the key driver for the stock was its acquisition—at a significant premium—by IBM in August of this year. Ariba, acquired in the spring, was another key contributor to the Fund’s return for the year. In Healthcare, shares of acute care and rehabilitation hospital companies, where we have been well represented, helped Fund performance for the year, and Tenet HealthCare and HealthSouth have been two of our larger positions in this group. Lastly in Industrials, we have held a meaningful position in GEO Group, a private prison operator whose shares have risen steadily on key state contract extensions and positive earnings releases. |
| Q. | What were the weakest performing holdings? |
| A. | Among individual holdings, VeriFone Systems and DFC Global Corp. were among our weakest names for the period and key detractors from relative performance. VeriFone designs and sells electronic payment systems and devices, and the stock was weak through late spring on concerns about the company’s Eurozone exposure; the company also had a patent infringement case against it around the same time. DFC Global is a consumer finance company serving under-banked individuals and small businesses, and the stock was weak late in the period due partly to stricter collection requirements in the UK. Financials, where we have limited exposure overall, was the Fund’s weakest sector for the year. |
| Q. | How was the Fund positioned as of October 31, 2012? |
| A. | With a backdrop of ongoing macro uncertainties, both in the U.S. and globally, the investment team continues to identify companies that are growing revenues and expanding margins, and exhibiting sustainability in these growth characteristics based upon their competitive positions. On a stock by stock basis, the Fund is well positioned beginning the new fiscal year, and we remain optimistic for the medium term and longer. |
In recent months, we have built up our positions in Healthcare and Information Technology, increasing our overweights to these sectors even as we have reduced positions in several of the stocks highlighted above. The Fund’s largest holdings in Healthcare now include Volcano Corporation and Health Management Associates, with both names among the five largest holdings in the Fund at the end of October. We are also overweight in the Energy and Industrials sectors. The Fund’s largest underweights are in the Materials and Consumer sectors, including an almost-zero weight in Consumer Staples at the end of the period.
Growth of a Hypothetical $10,000 Investment—Class N

All dividends and capital gains are reinvested. Indexes are unmanaged and do not take into account fees, expenses or other costs.
Returns shown in the chart and table do not reflect taxes that a shareholder would pay on Fund distributions or on the sale of the Fund shares.
Small-cap stocks may be subject to a higher degree of market risk than the securities of more established companies because they tend to be more volatile and less liquid.
RETURNSFOR PERIOD ENDED 10/31/12
Average Annual Total Returns - Class N
| | | | |
One Year | | | 14.77 | % |
Since Inception | | | 6.88 | % |
Inception Date 11/03/10
Average Annual Total Returns - Class I
| | | | |
One Year | | | 14.95 | % |
Since Inception | | | -5.40 | % |
Inception Date 06/01/11
The performance data quoted represents past performance. Past performance does not guarantee future results. Investment return and principal value will fluctuate so that an investor’s shares, upon redemption, may be worth more or less than their original cost. Current performance may be lower or higher than the performance data quoted. For performance data current to the most recent month-end, please visit our website at www.astonfunds.com.
The performance quoted would have been lower if fee waivers and/or expense reimbursements had not been in effect.
| | |
| |
| ASTON Small Cap Growth Fund | | October 31, 2012 |
| |
| Schedule of Investments | | |
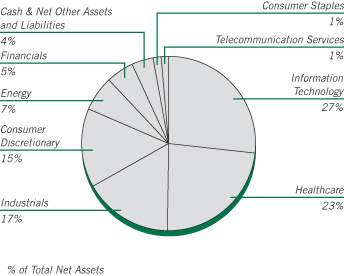
| | | | | | | | |
Shares | | | | | Market
Value | |
|
| | COMMON STOCKS – 95.97% | |
| | |
| | | | Consumer Discretionary – 14.63% | | | | |
| | 2,060 | | | Arctic Cat * | | $ | 74,716 | |
| | 6,733 | | | Black Diamond * | | | 63,964 | |
| | 2,949 | | | Brunswick | | | 69,567 | |
| | 938 | | | Cabela’s * | | | 42,032 | |
| | 4,029 | | | Cablevision Systems, Class A | | | 70,185 | |
| | 1,999 | | | Domino’s Pizza | | | 81,199 | |
| | 563 | | | Genesco * | | | 32,260 | |
| | 1,319 | | | GNC Holdings, Class A | | | 51,006 | |
| | 42,440 | | | Office Depot * | | | 105,251 | |
| | 10,885 | | | OfficeMax | | | 80,005 | |
| | 629 | | | Papa John’s International * | | | 33,538 | |
| | 1,232 | | | Select Comfort * | | | 34,287 | |
| | 6,614 | | | Shutterfly * | | | 200,140 | |
| | | | | | | | |
| | | | | | | 938,150 | |
| | | | | | | | |
| | |
| | | | Consumer Staples – 1.47% | | | | |
| | 1,630 | | | Hain Celestial Group * | | | 94,214 | |
| | | | | | | | |
| | |
| | | | Energy – 6.54% | | | | |
| | 811 | | | Berry Petroleum, Class A | | | 31,232 | |
| | 1,565 | | | Carrizo Oil & Gas * | | | 41,973 | |
| | 4,431 | | | Gulfport Energy * | | | 147,021 | |
| | 25,303 | | | Magnum Hunter Resources * | | | 96,658 | |
| | 2,350 | | | Oasis Petroleum * | | | 69,020 | |
| | 726 | | | Rosetta Resources * | | | 33,425 | |
| | | | | | | | |
| | | | | | | 419,329 | |
| | | | | | | | |
| | |
| | | | Financials – 5.14% | | | | |
| | 556 | | | Credit Acceptance * | | | 45,397 | |
| | 4,054 | | | DFC Global * | | | 68,310 | |
| | 4,727 | | | DuPont Fabros Technology, REIT | | | 101,441 | |
| | 1,716 | | | Highwoods Properties, REIT | | | 55,341 | |
| | | | | | | | |
Shares | | | | | Market
Value | |
| | |
| | | | Financials (continued) | | | | |
| | 1,874 | | | Stifel Financial * | | $ | 59,406 | |
| | | | | | | | |
| | | | | | | 329,895 | |
| | | | | | | | |
| | |
| | | | Healthcare – 23.43% | | | | |
| | 2,326 | | | Allscripts Healthcare Solutions * | | | 30,052 | |
| | 1,311 | | | Cubist Pharmaceuticals * | | | 56,242 | |
| | 38,664 | | | Health Management Associates, Class A * | | | 282,247 | |
| | 1,390 | | | HeartWare International * | | | 116,732 | |
| | 1,024 | | | HMS Holdings * | | | 23,644 | |
| | 5,092 | | | Incyte * | | | 81,268 | |
| | 863 | | | Jazz Pharmaceuticals PLC (Ireland) * | | | 46,369 | |
| | 1,716 | | | Masimo * | | | 37,701 | |
| | 14,062 | | | Merge Healthcare * | | | 47,951 | |
| | 2,195 | | | Puma Biotechnology * | | | 45,217 | |
| | 6,389 | | | Tenet Healthcare * | | | 150,780 | |
| | 6,548 | | | Threshold Pharmaceuticals * | | | 26,912 | |
| | 5,210 | | | Tornier NV (Netherlands) * | | | 89,091 | |
| | 15,759 | | | Vanguard Health Systems * | | | 152,547 | |
| | 6,536 | | | Volcano * | | | 187,060 | |
| | 2,706 | | | WellCare Health Plans * | | | 128,806 | |
| | | | | | | | |
| | | | | | | 1,502,619 | |
| | | | | | | | |
| | |
| | | | Industrials – 16.62% | | | | |
| | 4,686 | | | Encore Capital Group * | | | 135,894 | |
| | 2,257 | | | Genesee & Wyoming, Class A * | | | 163,565 | |
| | 9,463 | | | Geo Group | | | 262,314 | |
| | 2,802 | | | Hexcel * | | | 71,619 | |
| | 7,959 | | | Kelly Services, Class A | | | 105,775 | |
| | 4,437 | | | Triumph Group | | | 290,269 | |
| | 1,082 | | | Woodward | | | 36,247 | |
| | | | | | | | |
| | | | | | | 1,065,683 | |
| | | | | | | | |
| | |
| | | | Information Technology – 26.77% | | | | |
| | 947 | | | Aruba Networks * | | | 17,207 | |
| | 10,816 | | | AVG Technologies (Netherlands) * | | | 113,460 | |
| | 3,741 | | | Brightcove * | | | 47,211 | |
| | 5,243 | | | DealerTrack Holdings * | | | 143,291 | |
| | 1,836 | | | EPAM Systems * | | | 33,011 | |
| | 26,726 | | | Internap Network Services * | | | 183,073 | |
| | 5,645 | | | Kenexa * | | | 259,444 | |
| | 3,565 | | | Liquidity Services * | | | 146,985 | |
| | 8,317 | | | Microsemi * | | | 159,686 | |
| | 3,136 | | | Parametric Technology * | | | 63,285 | |
| | 2,338 | | | QLIK Technologies * | | | 43,043 | |
| | 4,039 | | | Semtech * | | | 100,854 | |
| | 4,280 | | | Skyworks Solutions * | | | 100,152 | |
| | 1,258 | | | Sourcefire * | | | 53,830 | |
| | 2,943 | | | Synchronoss Technologies * | | | 60,302 | |
| | 1,235 | | | TIBCO Software * | | | 31,134 | |
| | 5,427 | | | VeriFone Systems * | | | 160,856 | |
| | | | | | | | |
| | | | | | | 1,716,824 | |
| | | | | | | | |
| | |
| | | | Telecommunication Services – 1.37% | | | | |
| | 3,464 | | | tw telecom * | | | 88,228 | |
| | | | | | | | |
| | |
| | | | Total Common Stocks
(Cost $5,792,521) | | | 6,154,942 | |
| | | | | | | | |
See accompanying Notes to Financial Statements.
| | |
| |
| ASTON Small Cap Growth Fund | | October 31, 2012 |
| |
| Schedule of Investments – continued | | |
| | | | | | | | |
Shares | | | | | Market
Value | |
|
| | WARRANTS – 0.00% | |
| | |
| | | | Energy – 0.00% | | | | |
| | 1,091 | | | Magnum Hunter Resources,
Expiration 10/14/13 | | $ | 33 | |
| | | | | | | | |
| | |
| | | | Total Warrants
(Cost $—) | | | 33 | |
| | | | | | | | |
|
| | INVESTMENT COMPANY – 7.24% | |
| | |
| | 464,198 | | | BlackRock Liquidity Funds
TempCash Portfolio | | | 464,198 | |
| | | | | | | | |
| | |
| | | | Total Investment Company
(Cost $464,198) | | | 464,198 | |
| | | | | | | | |
| Total Investments – 103.21%
(Cost $6,256,719)** | | | 6,619,173 | |
| | | | | | | | |
| Net Other Assets and Liabilities – (3.21)% | | | (205,943 | ) |
| | | | | | | | |
| Net Assets – 100.00% | | $ | 6,413,230 | |
| | | | | | | | |
| * | | Non-income producing security. |
| ** | | Aggregate cost for Federal income tax purposes is $6,285,060. |
| | | | |
Gross unrealized appreciation | | $ | 590,449 | |
Gross unrealized depreciation | | | (256,336 | ) |
| | | | |
Net unrealized appreciation | | $ | 334,113 | |
| | | | |
| REIT | | Real Estate Investment Trust |
See accompanying Notes to Financial Statements.
ASTON/Silvercrest Small Cap Fund
| | |
| |
| Portfolio Manager Commentary (unaudited) | | October 31, 2012 |
| | Roger W. Vogel, CFA |
| Q. | What were the most significant market factors affecting Fund performance and returns relative to the benchmark during the past 12 months? |
| A. | By far, the most significant issue impacting Fund performance since inception in December 2011 relative to the Russell 2000 Value benchmark was our underweight and underperformance in the Financials sector. Our average weighting of 21% was far below the benchmark’s 37%, and given that the sector was the second best performing sector in the benchmark with a 19% advance for the period, this underexposure cost us roughly 100 bps of relative performance. Additionally, our stock holdings selection within the sector, gained just 9% vs. a 19% gain within the index sector. We struggled in two sub-sectors, Banks and REITs. Our banks gained just 2% versus 14% for the benchmark’s banks, and while our REITs came closer to the benchmark’s REITs, gaining 16% vs. 21%, our sharp underweighting at 5% vs. 13% hurt us. We have made some changes to our exposures in the Financials sector recently, and hope that we can improve our relative performance there. |
| Q. | What were the best performing holdings for the Fund during the period? |
| A. | Our biggest contributors to return since inception were AFC Enterprises, which posted our largest percentage gain at 69%, Horace Mann (+42%), ACI Worldwide (+33%), West Pharmaceutical Services (+45%), and Analogic Corp. |
| | (+33%). All tended to report earnings above expectations. |
| Q. | What were the weakest performing holdings? |
| A. | Our worst contributors to return included Swift Energy, our biggest decliner at (-46%), Schnitzer Steel Industries (-34%), Tennant Co. (-14%), Astec Industries (-16%), and MKS Instruments (-19%). All had disappointing fundamental results. We have eliminated our holding of Schnitzer Steel. |
| Q. | How was the Fund positioned as of October 31, 2012? |
| A. | We believe the Fund is very well positioned entering the new fiscal year. As we leave the September quarter earnings cycle, uncertainties abound. Company pre-announcements have been decidedly skewed negatively, as it appears business has slowed globally in late summer. Companies and investors alike appear somewhat skittish in front of an uncertain and likely partisan discourse surrounding the U.S. “fiscal cliff” and its impact on taxes. We continue to believe there is tremendous intrinsic value in our companies, and remain hopeful that in a more positive merger and acquisition environment we will catch our share. Our companies continue to appear undervalued, with generally strong cash flows and solid balance sheets that should permit them to take advantage of any opportunities in a modest global GDP growth environment. |
Growth of a Hypothetical
$10,000 Investment—Class N
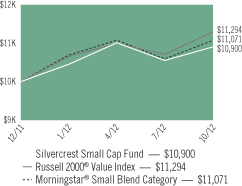
All dividends and capital gains are reinvested. Indexes are unmanaged and do not take into account fees, expenses or other costs.
Returns shown in the chart and table do not reflect taxes that a shareholder would pay on Fund distributions or on the sale of the Fund shares.
Small-cap stocks may be subject to a higher degree of market risk than the securities of more established companies because they tend to be more volatile and less liquid.
RETURNSFOR PERIOD ENDED 10/31/12
Total Return - Class N
| | | | |
Cumulative Since Inception | | | 9.00 | % |
Inception Date 12/27/11
Total Return - Class I
| | | | |
Cumulative Since Inception | | | 9.30 | % |
Inception Date 12/27/11
The performance data quoted represents past performance. Past performance does not guarantee future results. Investment return and principal value will fluctuate so that an investor’s shares, upon redemption, may be worth more or less than their original cost. Current performance may be lower or higher than the performance data quoted. For performance data current to the most recent month-end, please visit our website at www.astonfunds.com.
The performance quoted would have been lower if fee waivers and/or expense reimbursements had not been in effect.
| | |
| |
| ASTON/Silvercrest Small Cap Fund | | October 31, 2012 |
| |
| Schedule of Investments | | |
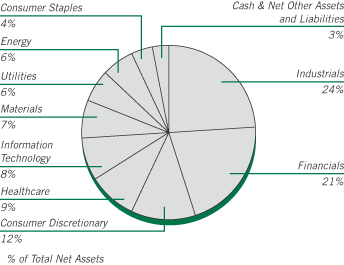
| | | | | | | | |
Shares | | | | | Market
Value | |
|
| | COMMON STOCKS – 97.53% | |
| | |
| | | | Consumer Discretionary – 11.70% | | | | |
| | 5,432 | | | AFC Enterprises * | | $ | 137,538 | |
| | 3,310 | | | Bob Evans Farms | | | 126,012 | |
| | 2,577 | | | Core-Mark Holding | | | 123,361 | |
| | 3,935 | | | Drew Industries * | | | 124,622 | |
| | 5,240 | | | La-Z-Boy * | | | 84,993 | |
| | 2,090 | | | Lithia Motors, Class A | | | 71,478 | |
| | | | | | | | |
| | | | | | | 668,004 | |
| | | | | | | | |
| | |
| | | | Consumer Staples – 4.35% | | | | |
| | 2,114 | | | J & J Snack Foods | | | 121,069 | |
| | 1,754 | | | Lancaster Colony | | | 127,656 | |
| | | | | | | | |
| | | | | | | 248,725 | |
| | | | | | | | |
| | |
| | | | Energy – 5.96% | | | | |
| | 4,810 | | | Forum Energy Technologies * | | | 107,311 | |
| | 3,299 | | | Rosetta Resources * | | | 151,886 | |
| | 4,865 | | | Swift Energy * | | | 81,294 | |
| | | | | | | | |
| | | | | | | 340,491 | |
| | | | | | | | |
| | |
| | | | Financials – 20.87% | | | | |
| | 7,240 | | | Duff & Phelps, Class A | | | 89,993 | |
| | 2,948 | | | EastGroup Properties, REIT | | | 153,473 | |
| | 8,518 | | | FirstMerit | | | 118,060 | |
| | 7,364 | | | Horace Mann Educators | | | 141,462 | |
| | 2,509 | | | Iberiabank | | | 124,923 | |
| | 5,123 | | | Independent Bank/Rockland MA | | | 151,180 | |
| | 2,254 | | | Mid-America Apartment Communities, REIT | | | 145,856 | |
| | 2,762 | | | Prosperity Bancshares | | | 115,617 | |
| | 5,548 | | | Protective Life | | | 151,460 | |
| | | | | | | | |
| | | | | | | 1,192,024 | |
| | | | | | | | |
| | |
| | | | Healthcare – 8.56% | | | | |
| | 1,487 | | | Analogic | | | 109,532 | |
| | 1,914 | | | ICU Medical * | | | 113,558 | |
| | | | | | | | |
Shares | | | | | Market
Value | |
| | |
| | | | Healthcare (continued) | | | | |
| | 2,120 | | | Integra LifeSciences Holdings * | | $ | 81,090 | |
| | 3,293 | | | Invacare | | | 44,950 | |
| | 2,593 | | | West Pharmaceutical Services | | | 139,685 | |
| | | | | | | | |
| | | | | | | 488,815 | |
| | | | | | | | |
| | |
| | | | Industrials – 24.55% | | | | |
| | 5,355 | | | Altra Holdings | | | 96,497 | |
| | 3,383 | | | Applied Industrial Technologies | | | 137,316 | |
| | 3,008 | | | Astec Industries * | | | 86,630 | |
| | 3,100 | | | Beacon Roofing Supply * | | | 100,254 | |
| | 2,113 | | | Cubic | | | 103,114 | |
| | 4,326 | | | EMCOR Group | | | 139,124 | |
| | 4,077 | | | Hexcel * | | | 104,208 | |
| | 2,559 | | | Mine Safety Appliances | | | 98,777 | |
| | 2,460 | | | TAL International Group | | | 83,984 | |
| | 1,740 | | | Teledyne Technologies * | | | 111,412 | |
| | 2,556 | | | Tennant | | | 95,646 | |
| | 6,529 | | | US Ecology | | | 154,933 | |
| | 2,240 | | | Watts Water Technologies, Class A | | | 90,115 | |
| | | | | | | | |
| | | | | | | 1,402,010 | |
| | | | | | | | |
| | |
| | | | Information Technology – 7.84% | | | | |
| | 2,229 | | | ACI Worldwide * | | | 87,154 | |
| | 2,297 | | | FEI | | | 126,450 | |
| | 2,005 | | | Littelfuse | | | 107,468 | |
| | 3,125 | | | MKS Instruments | | | 73,844 | |
| | 1,817 | | | Scansource * | | | 53,147 | |
| | | | | | | | |
| | | | | | | 448,063 | |
| | | | | | | | |
| | |
| | | | Materials – 7.21% | | | | |
| | 2,762 | | | HB Fuller | | | 83,965 | |
| | 2,307 | | | Innophos Holdings | | | 109,929 | |
| | 7,923 | | | PH Glatfelter | | | 141,109 | |
| | 2,109 | | | Sensient Technologies | | | 76,725 | |
| | | | | | | | |
| | | | | | | 411,728 | |
| | | | | | | | |
| | |
| | | | Utilities – 6.49% | | | | |
| | 2,492 | | | MGE Energy | | | 131,179 | |
| | 4,679 | | | Portland General Electric | | | 128,205 | |
| | 3,073 | | | UIL Holdings | | | 111,150 | |
| | | | | | | | |
| | | | | | | 370,534 | |
| | | | | | | | |
| | |
| | | | Total Common Stocks
(Cost $5,459,213) | | | 5,570,394 | |
| | | | | | | | |
|
| | INVESTMENT COMPANY – 2.75% | |
| | |
| | 156,940 | | | BlackRock Liquidity Funds
TempCash Portfolio | | | 156,940 | |
| | | | | | | | |
| | |
| | | | Total Investment Company
(Cost $156,940) | | | 156,940 | |
| | | | | | | | |
| Total Investments – 100.28%
(Cost $5,616,153)** | | | 5,727,334 | |
| | | | | | | | |
| Net Other Assets and Liabilities – (0.28)% | | | (15,767 | ) |
| | | | | | | | |
| Net Assets – 100.00% | | $ | 5,711,567 | |
| | | | | | | | |
See accompanying Notes to Financial Statements.
| | |
| |
| ASTON/Silvercrest Small Cap Fund | | October 31, 2012 |
| |
| Schedule of Investments – continued | | |
| * | | Non-income producing security. |
| ** | | Aggregate cost for Federal income tax purposes is $5,624,018. |
| | | | |
Gross unrealized appreciation | | $ | 312,380 | |
Gross unrealized depreciation | | | (209,064 | ) |
| | | | |
Net unrealized appreciation | | $ | 103,316 | |
| | | | |
| REIT | | Real Estate Investment Trust |
See accompanying Notes to Financial Statements.
ASTON/TAMRO Small Cap Fund
| | |
| |
| Portfolio Manager Commentary (unaudited) | | October 31, 2012 |
Philip D. Tasho, CFA & Timothy A. Holland, CFA
| Q. | What were the most significant market factors affecting Fund performance and returns relative to the benchmark during the past 12 months? |
| A. | While the U.S. and global economies saw a slowdown in growth, aggressively easy monetary policy provided ample liquidity that helped fuel double digit returns across all market capitalizations of the U.S. equity markets. October proved to be a challenging month for the Fund in terms of relative performance, causing the Fund to trail the benchmark, the Russell 2000 Index, for the fiscal year ending October 31, 2012. Overall, stock selection benefited the Fund with strength in the Healthcare and Materials sectors offset somewhat by weakness in the Industrials, Energy and Financials sectors. Sector allocation detracted from performance largely due to an overweight in Energy and under weights in the Financials and Materials sectors. |
| Q. | What were the best performing holdings for the Fund during the period? |
| A. | The three holdings that contributed the most to performance were Westlake Chemical, AMERIGROUP and Advisory Board. Westlake Chemical benefited from lower natural gas, feedstock prices and accelerating revenues and earnings. AMERIGROUP agreed to be acquired by Wellpoint at a +40% premium to its market price. Advisory Board saw strong demand from hospitals for its best-practices consulting services and software solutions. |
| Q. | What were the weakest performing holdings? |
| A. | Revenue and earnings growth deceleration impacted the three holdings that detracted the most from Fund performance. A softening in telecomm capital spending led to a slowdown for Acme Packet’s Session Border Control products |
| | that manage the quality of data as it crosses from one network to another. Commodity pricing pressured Precision Drilling, a provider of oil and natural gas drilling and related services via its fleet of rigs stationed throughout North America. Aero Vironmentis a technology solutions provider focused on small unmanned aerial systems and electric transportation solutions. Long term, we remain confident in the business strategies and maintain the positions. |
| Q. | How was the Fund positioned as of October 31, 2012? |
| A. | The Fund’s investment process focuses on individual, bottom-up stock selection to identify companies that we believe are best able to execute given their specific competitive advantage. Our approach to portfolio management is opportunistic and broadly diversified, with sector weights determined by where we see opportunities at the stock level. As of October 31, 2012, Financials, Consumer Discretionary and Industrials were the largest sectors in the Fund. Among our investment categories, Leaders and Innovators, which tend to be higher quality companies with leading market share and tenured management teams, comprised 72% of the portfolio. Laggards, or companies undergoing restructuring, made up 28%. |
We believe the domestic economy will continue to grow at a slower-than-normal pace, led by an ongoing rebound in consumer spending and housing. The change in housing prices has turned positive in most regions of the country and consumer sentiment is the highest yet in the recovery. Once the election is over, there should be more clarity concerning the direction of U.S. economic policy. Any interim volatility may provide opportunities to add to current positions or initiate new ones at attractive valuations.
Growth of a Hypothetical
$10,000 Investment—Class N
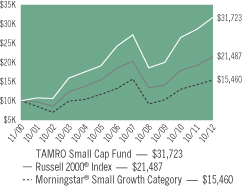
All dividends and capital gains are reinvested. Indexes are unmanaged and do not take into account fees, expenses or other costs.
Returns shown in the chart and table do not reflect taxes that a shareholder would pay on Fund distributions or on the sale of the Fund shares.
Small-cap stocks may be subject to a higher degree of market risk than the securities of more established companies because they tend to be more volatile and less liquid.
RETURNSFOR PERIOD ENDED 10/31/12
Average Annual Total Returns - Class N
| | | | |
One Year | | | 10.70 | % |
Five Year | | | 3.12 | % |
Ten Year | | | 11.58 | % |
Since Inception | | | 10.17 | % |
Inception Date 11/30/00
Average Annual Total Returns - Class I
| | | | |
One Year | | | 10.98 | % |
Five Year | | | 3.38 | % |
Since Inception | | | 7.22 | % |
Inception Date 01/04/05
The performance data quoted represents past performance. Past performance does not guarantee future results. Investment return and principal value will fluctuate so that an investor’s shares, upon redemption, may be worth more or less than their original cost. Current performance may be lower or higher than the performance data quoted. For performance data current to the most recent month-end, please visit our website at www.astonfunds.com.
The total expense ratio for the Class N and Class I Shares is 1.30% and 1.05% respectively, as disclosed in the prospectus dated March 1, 2012. Please refer to the Financial Highlights section in this report for more 2012 fiscal year-end related information.
| | |
| |
| ASTON/TAMRO Small Cap Fund | | October 31, 2012 |
| |
| Schedule of Investments | | |
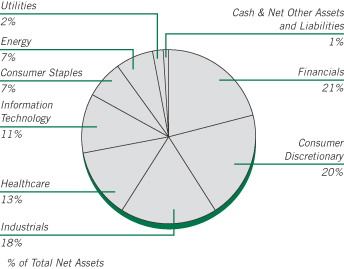
| | | | | | | | |
Shares | | | | | Market
Value | |
| |
| | COMMON STOCKS – 99.27% | | | | |
| | |
| | | | Consumer Discretionary – 20.26% | | | | |
| | 389,296 | | | BJ’s Restaurants * | | $ | 12,866,232 | |
| | 1,389,716 | | | Chico’s FAS | | | 25,848,717 | |
| | 334,858 | | | Coinstar * | | | 15,718,235 | |
| | 1,798,726 | | | EW Scripps (The), Class A * (a) | | | 19,084,483 | |
| | 1,165,373 | | | Grand Canyon Education * | | | 25,358,516 | |
| | 517,166 | | | Harman International Industries | | | 21,684,770 | |
| | 664,694 | | | MDC Holdings | | | 25,417,899 | |
| | 452,609 | | | Monro Muffler Brake | | | 15,352,497 | |
| | 412,403 | | | Red Robin Gourmet Burgers * | | | 13,774,260 | |
| | 452,031 | | | Tempur-Pedic International * | | | 11,951,700 | |
| | 1,261,228 | | | Texas Roadhouse | | | 20,532,792 | |
| | | | | | | | |
| | | | | | | 207,590,101 | |
| | | | | | | | |
| | |
| | | | Consumer Staples – 7.32% | | | | |
| | 999,776 | | | Cott (Canada) * | | | 7,648,286 | |
| | 392,315 | | | Fresh Market * | | | 22,248,184 | |
| | 405,803 | | | Tootsie Roll Industries | | | 10,814,650 | |
| | 219,983 | | | TreeHouse Foods * | | | 11,780,090 | |
| | 422,883 | | | United Natural Foods * | | | 22,514,291 | |
| | | | | | | | |
| | | | | | | 75,005,501 | |
| | | | | | | | |
| | |
| | | | Energy – 6.77% | | | | |
| | 961,865 | | | Cloud Peak Energy * | | | 20,295,352 | |
| | 1,415,772 | | | Comstock Resources * | | | 24,238,017 | |
| | 325,009 | | | Contango Oil & Gas * | | | 15,977,442 | |
| | 1,236,120 | | | Precision Drilling (Canada) * | | | 8,900,064 | |
| | | | | | | | |
| | | | | | | 69,410,875 | |
| | | | | | | | |
| | |
| | | | Financials – 21.15% | | | | |
| | 761,443 | | | Bank of the Ozarks | | | 24,929,643 | |
| | 1,540,647 | | | Glacier Bancorp | | | 22,339,382 | |
| | | | | | | | |
Shares | | | | | Market
Value | |
| | |
| | | | Financials (continued) | | | | |
| | 370,033 | | | Greenhill | | $ | 17,657,975 | |
| | 471,510 | | | Iberiabank | | | 23,476,483 | |
| | 891,047 | | | LaSalle Hotel Properties, REIT | | | 21,331,665 | |
| | 215,290 | | | Portfolio Recovery Associates * | | | 22,530,099 | |
| | 1,121,596 | | | Redwood Trust, REIT | | | 17,485,682 | |
| | 706,014 | | | Stifel Financial * | | | 22,380,644 | |
| | 404,571 | | | UMB Financial | | | 18,015,547 | |
| | 799,544 | | | Waddell & Reed Financial, Class A | | | 26,648,802 | |
| | | | | | | | |
| | | | | | | 216,795,922 | |
| | | | | | | | |
| | |
| | | | Healthcare – 12.47% | | | | |
| | 229,456 | | | Affymax * | | | 5,229,302 | |
| | 349,561 | | | Analogic | | | 25,748,663 | |
| | 278,832 | | | Athenahealth * | | | 17,926,109 | |
| | 1,311,931 | | | DexCom * | | | 17,186,296 | |
| | 2,608,702 | | | Health Management Associates, Class A * | | | 19,043,525 | |
| | 876,282 | | | HMS Holdings * | | | 20,233,351 | |
| | 330,489 | | | Teleflex | | | 22,456,728 | |
| | | | | | | | |
| | | | | | | 127,823,974 | |
| | | | | | | | |
| | |
| | | | Industrials – 17.93% | | | | |
| | 572,058 | | | Advisory Board * | | | 27,172,755 | |
| | 752,988 | | | Aerovironment * | | | 16,558,206 | |
| | 266,833 | | | Chicago Bridge & Iron
(Netherlands) | | | 10,019,579 | |
| | 710,358 | | | Colfax * | | | 24,429,212 | |
| | 501,185 | | | Corporate Executive Board | | | 22,533,278 | |
| | 299,655 | | | Franklin Electric | | | 17,362,010 | |
| | 318,924 | | | Morningstar | | | 20,085,834 | |
| | 741,244 | | | Titan International | | | 15,551,299 | |
| | 116,167 | | | Wabtec | | | 9,514,077 | |
| | 549,026 | | | Zillow, Class A * | | | 20,511,611 | |
| | | | | | | | |
| | | | | | | 183,737,861 | |
| | | | | | | | |
| | |
| | | | Information Technology – 11.38% | | | | |
| | 1,194,682 | | | Acme Packet * | | | 19,760,040 | |
| | 997,350 | | | Aruba Networks * | | | 18,121,849 | |
| | 324,687 | | | CommVault Systems * | | | 20,283,197 | |
| | 1,396,547 | | | Ixia * | | | 19,565,623 | |
| | 578,907 | | | Netgear * | | | 20,556,988 | |
| | 312,447 | | | Power Integrations | | | 9,242,182 | |
| | 686,607 | | | Websense * | | | 9,076,945 | |
| | | | | | | | |
| | | | | | | 116,606,824 | |
| | | | | | | | |
| | |
| | | | Utilities – 1.99% | | | | |
| | 437,365 | | | Northwest Natural Gas | | | 20,350,593 | |
| | | | | | | | |
| | |
| | | | Total Common Stocks
(Cost $827,375,266) | | | 1,017,321,651 | |
| | | | | | | | |
See accompanying Notes to Financial Statements.
| | |
| |
| ASTON/TAMRO Small Cap Fund | | October 31, 2012 |
| |
| Schedule of Investments – continued | | |
| | | | | | | | |
Shares | | | | | Market
Value | |
| |
| | INVESTMENT COMPANY – 1.72% | | | | |
| | |
| | 17,606,619 | | | BlackRock Liquidity Funds TempCash Portfolio | | $ | 17,606,619 | |
| | | | | | | | |
| | |
| | | | Total Investment Company
(Cost $17,606,619) | | | 17,606,619 | |
| | | | | | | | |
| Total Investments – 100.99%
(Cost $844,981,885)** | | | 1,034,928,270 | |
| | | | | | | | |
| Net Other Assets and Liabilities – (0.99)% | | | (10,140,187 | ) |
| | | | | | | | |
| Net Assets – 100.00% | | $ | 1,024,788,083 | |
| | | | | | | | |
| * | | Non-income producing security. |
| ** | | Aggregate cost for Federal income tax purposes is $846,326,847. |
| | | | |
Gross unrealized appreciation | | $ | 233,339,898 | |
Gross unrealized depreciation | | | (44,738,475 | ) |
| | | | |
Net unrealized appreciation | | $ | 188,601,423 | |
| | | | |
| (a) | | This security has been determined by the Subadviser to be an illiquid security. At October 31, 2012, this security amounted to $19,084,483 or 1.86% of net assets. |
| REIT | | Real Estate Investment Trust |
See accompanying Notes to Financial Statements.
ASTON/River Road Select Value Fund
| | |
| |
| Portfolio Manager Commentary (unaudited) | | October 31, 2012 |
James C. Shircliff, CFA; R. Andrew Beck & J. Justin Akin
| Q. | What were the most significant market factors affecting Fund performance and returns relative to the benchmark during the past 12 months? |
| A. | The Fund’s return lagged the benchmark Russell 2500 Value. The Fund’s performance was negatively impacted by the leadership of high beta, lower quality securities in the small/mid-cap market. As that trend reversed, however, the Fund’s relative performance significantly improved. Six of 10 sectors contributed positively to relative Fund performance. The largest contribution was from the Industrials sector, which benefited from strong stock selection. The largest detractor was the Financials sector, which lagged most significantly as the result of an underweight allocation. |
| Q. | What were the best performing holdings for the Fund during the period? |
| A. | The two holdings with the largest positive contribution to relative return were Madison Square Garden Co. and GEO Group Inc. Madison Square Garden owns the New York Knicks, the New York Rangers, the MSG regional sports cable network, plus the real estate of the “World’s Most Famous Arena.” The company has begun to realize operating benefits from its $1B renovation of the Garden. Also, the management team favorably resolved a pricing dispute with Time Warner Cable, which represents approximately 30% of the MSG subscriber base. GEO Group is the second largest private prison operator in the United States. In early 2012, the company initiated a dividend and subsequently increased it twice, which |
| | resulted in an attractive yield for investors. Secondly, the company is pursuing the possibility of converting into a Real Estate Investment Trust (REIT). We believe that the IRS will grant approval, which will improve GEO’s tax efficiency and could lead to multiple expansion. |
| Q. | What were the weakest performing holdings? |
| A. | The two holdings with the largest negative contribution to the Fund’s total return were Big Lots Inc. and Harris Teeter Supermarkets Inc. Big Lots is the largest broad line close-out retailer in the United States. The company reported disappointing Q2 results that were below expectations and also lowered its earnings guidance for 2012. Same-store sales declined due to weakness in its seasonal, home, and furniture categories. The Chief Merchandising Officer resigned as a result. Harris Teeter operates an upscale grocery chain in the mid-Atlantic region of the United States. In-store traffic trends have remained positive throughout the year. However, food inflation and higher levels of discounting have put a lid on margins which has limited profit growth. |
| Q. | How was the Fund positioned as of October 31, 2012? |
| A. | We continue to position the Fund in the shares of high quality companies that we believe will perform well in a period of weak economic growth. |
Note: Beta is a measure of risk which shows a fund’s volatility relative to its benchmark index.
Growth of a Hypothetical
$10,000 Investment—Class N
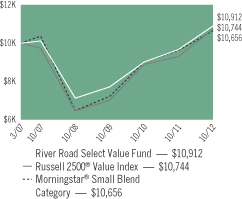
All dividends and capital gains are reinvested. Indexes are unmanaged and do not take into account fees, expenses or other costs.
Returns shown in the chart and table do not reflect taxes that a shareholder would pay on Fund distributions or on the sale of the Fund shares.
Small-cap and mid-cap stocks may be subject to a higher degree of market risk than the securities of more established companies because they tend to be more volatile and less liquid.
RETURNSFOR PERIOD ENDED 10/31/12
Average Annual Total Returns - Class N
| | | | |
One Year | | | 12.87 | % |
Five Year | | | 1.50 | % |
Since Inception | | | 1.57 | % |
Inception Date 03/29/07
Average Annual Total Returns - Class I
| | | | |
One Year | | | 13.18 | % |
Five Year | | | 1.77 | % |
Since Inception | | | 0.97 | % |
Inception Date 06/28/07
The performance data quoted represents past performance. Past performance does not guarantee future results. Investment return and principal value will fluctuate so that an investor’s shares, upon redemption, may be worth more or less than their original cost. Current performance may be lower or higher than the performance data quoted. For performance data current to the most recent month-end, please visit our website at www.astonfunds.com.
| | |
| |
| ASTON/River Road Select Value Fund | | October 31, 2012 |
| |
| Schedule of Investments | | |
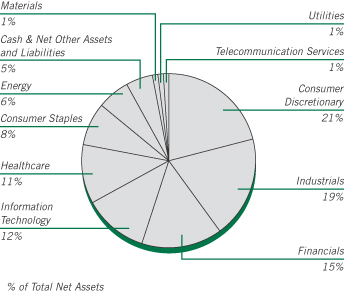
| | | | | | | | |
Shares | | | | | Market
Value | |
|
| | COMMON STOCKS – 94.98% | |
| | |
| | | | Consumer Discretionary – 20.82% | | | | |
| | 39,060 | | | Abercrombie & Fitch, Class A | | $ | 1,194,455 | |
| | 188,630 | | | Ascena Retail Group * | | | 3,734,874 | |
| | 25,980 | | | Ascent Capital Group, Class A * | | | 1,544,511 | |
| | 172,510 | | | Big Lots * | | | 5,025,216 | |
| | 86,250 | | | Bob Evans Farms | | | 3,283,537 | |
| | 75,000 | | | DreamWorks Animation SKG, Class A * | | | 1,527,750 | |
| | 101,620 | | | Fred’s, Class A | | | 1,376,951 | |
| | 97,720 | | | Iconix Brand Group * | | | 1,808,797 | |
| | 162,090 | | | Madison Square Garden, Class A * | | | 6,671,624 | |
| | 124,940 | | | Pep Boys - Manny, Moe, & Jack | | | 1,248,151 | |
| | 123,900 | | | Rent-A-Center | | | 4,129,587 | |
| | 49,200 | | | Service Corp International | | | 690,768 | |
| | 64,540 | | | True Religion Apparel | | | 1,655,451 | |
| | | | | | | | |
| | | | | | | 33,891,672 | |
| | | | | | | | |
| | |
| | | | Consumer Staples – 7.58% | | | | |
| | 36,810 | | | Constellation Brands, Class A * | | | 1,300,865 | |
| | 158,480 | | | Harris Teeter Supermarkets | | | 5,935,076 | |
| | 43,350 | | | Industrias Bachoco, SP ADR (Mexico) | | | 1,094,588 | |
| | 32,066 | | | J & J Snack Foods | | | 1,836,420 | |
| | 59,190 | | | Village Super Market, Class A | | | 2,170,497 | |
| | | | | | | | |
| | | | | | | 12,337,446 | |
| | | | | | | | |
| | |
| | | | Energy – 5.71% | | | | |
| | 38,090 | | | Cloud Peak Energy * | | | 803,699 | |
| | 75,370 | | | Endeavour International * | | | 547,186 | |
| | 38,810 | | | Energen | | | 1,810,486 | |
| | 214,509 | | | Miller Energy Resources * | | | 969,581 | |
| | 38,020 | | | Nordic American Tankers (Bermuda) | | | 319,368 | |
| | 67,230 | | | Patterson-UTI Energy | | | 1,087,781 | |
| | 112,580 | | | Resolute Energy * | | | 999,710 | |
| | 62,120 | | | Rex Energy * | | | 822,469 | |
| | | | | | | | |
Shares | | | | | Market
Value | |
| | |
| | | | Energy (continued) | | | | |
| | 147,760 | | | Tetra Technologies * | | $ | 790,516 | |
| | 139,500 | | | Vaalco Energy * | | | 1,139,715 | |
| | | | | | | | |
| | | | | | | 9,290,511 | |
| | | | | | | | |
| | |
| | | | Financials – 15.42% | | | | |
| | 8,205 | | | Alleghany * | | | 2,852,058 | |
| | 137,985 | | | Alterra Capital Holdings (Bermuda) | | | 3,370,974 | |
| | 127,760 | | | BGC Partners, Class A | | | 597,917 | |
| | 16,125 | | | Capital Southwest | | | 1,737,469 | |
| | 20,629 | | | Commerce Bancshares | | | 785,552 | |
| | 35,440 | | | FirstService (Canada) * | | | 1,022,090 | |
| | 86,810 | | | Hilltop Holdings * | | | 1,179,748 | |
| | 23,360 | | | Navigators Group * | | | 1,239,949 | |
| | 24,090 | | | Oppenheimer Holdings, Class A | | | 392,185 | |
| | 29,250 | | | PartnerRe (Bermuda) | | | 2,369,250 | |
| | 39,420 | | | SEI Investments | | | 862,510 | |
| | 43,700 | | | Tower Group | | | 787,474 | |
| | 69,110 | | | W. R. Berkley | | | 2,687,688 | |
| | 10,165 | | | White Mountains Insurance Group | | | 5,211,595 | |
| | | | | | | | |
| | | | | | | 25,096,459 | |
| | | | | | | | |
| | |
| | | | Healthcare – 10.88% | | | | |
| | 22,520 | | | Chemed | | | 1,514,470 | |
| | 79,410 | | | Ensign Group | | | 2,315,596 | |
| | 55,520 | | | Hill-Rom Holdings | | | 1,559,557 | |
| | 60,210 | | | ICU Medical * | | | 3,572,259 | |
| | 243,660 | | | Nordion (Canada) | | | 1,578,917 | |
| | 74,840 | | | Owens & Minor | | | 2,130,695 | |
| | 66,810 | | | Quality Systems | | | 1,165,835 | |
| | 108,780 | | | STERIS | | | 3,873,656 | |
| | | | | | | | |
| | | | | | | 17,710,985 | |
| | | | | | | | |
| | |
| | | | Industrials – 18.82% | | | | |
| | 72,400 | | | ABM Industries | | | 1,375,600 | |
| | 124,160 | | | Aircastle (Bermuda) | | | 1,381,901 | |
| | 71,340 | | | Brink’s | | | 1,876,955 | |
| | 25,520 | | | Cubic | | | 1,245,376 | |
| | 119,810 | | | Dolan * | | | 554,720 | |
| | 66,120 | | | Equifax | | | 3,308,645 | |
| | 59,230 | | | G & K Services, Class A | | | 1,910,168 | |
| | 257,750 | | | Geo Group | | | 7,144,830 | |
| | 62,310 | | | Heartland Express | | | 869,225 | |
| | 80,250 | | | Insperity | | | 2,095,328 | |
| | 83,150 | | | John Bean Technologies | | | 1,282,173 | |
| | 85,170 | | | Korn/Ferry International * | | | 1,140,426 | |
| | 36,930 | | | Layne Christensen * | | | 823,170 | |
| | 52,049 | | | Standard Parking * | | | 1,189,320 | |
| | 63,690 | | | Unifirst | | | 4,430,913 | |
| | | | | | | | |
| | | | | | | 30,628,750 | |
| | | | | | | | |
| | |
| | | | Information Technology – 11.82% | | | | |
| | 132,800 | | | Convergys | | | 2,232,368 | |
| | 53,650 | | | CSG Systems International * | | | 1,105,726 | |
| | 94,410 | | | Daktronics | | | 827,976 | |
| | 103,560 | | | DST Systems | | | 5,907,062 | |
| | 79,090 | | | Ingram Micro, Class A * | | | 1,202,168 | |
See accompanying Notes to Financial Statements.
| | |
| |
| ASTON/River Road Select Value Fund | | October 31, 2012 |
| |
| Schedule of Investments – continued | | |
| | | | | | | | |
Shares | | | | | Market
Value | |
| | |
| | | | Information Technology (continued) | | | | |
| | 43,140 | | | Ituran Location and Control (Israel) | | $ | 533,210 | |
| | 26,710 | | | j2 Global | | | 802,368 | |
| | 24,330 | | | Lexmark International, Class A | | | 517,256 | |
| | 142,840 | | | NeuStar, Class A * | | | 5,226,516 | |
| | 39,660 | | | Total System Services | | | 891,953 | |
| | | | | | | | |
| | | | | | | 19,246,603 | |
| | | | | | | | |
| | |
| | | | Materials – 1.55% | | | | |
| | 16,720 | | | Aptargroup | | | 857,402 | |
| | 60,210 | | | Kraton Performance Polymers * | | | 1,313,782 | |
| | 20,660 | | | Tredegar | | | 350,600 | |
| | | | | | | | |
| | | | | | | 2,521,784 | |
| | | | | | | | |
| | |
| | | | Telecommunication Services – 0.91% | | | | |
| | 35,610 | | | Atlantic Tele-Network | | | 1,475,678 | |
| | | | | | | | |
| | |
| | | | Utilities – 1.47% | | | | |
| | 55,420 | | | Avista | | | 1,408,776 | |
| | 30,720 | | | UGI | | | 991,949 | |
| | | | | | | | |
| | | | | | | 2,400,725 | |
| | | | | | | | |
| | |
| | | | Total Common Stocks
(Cost $133,054,206) | | | 154,600,613 | |
| | | | | | | | |
|
| | INVESTMENT COMPANY – 5.46% | |
| | |
| | 8,893,679 | | | BlackRock Liquidity Funds
TempCash Portfolio | | | 8,893,679 | |
| | | | | | | | |
| | |
| | | | Total Investment Company
(Cost $8,893,679) | | | 8,893,679 | |
| | | | | | | | |
| Total Investments – 100.44%
(Cost $141,947,885)** | | | 163,494,292 | |
| | | | | | | | |
| Net Other Assets and Liabilities – (0.44)% | | | (714,428 | ) |
| | | | | | | | |
| Net Assets – 100.00% | | $ | 162,779,864 | |
| | | | | | | | |
| * | | Non-income producing security. |
| ** | | Aggregate cost for Federal income tax purposes is $142,663,248. |
| | | | |
Gross unrealized appreciation | | $ | 27,411,399 | |
Gross unrealized depreciation | | | (6,580,355 | ) |
| | | | |
Net unrealized appreciation | | $ | 20,831,044 | |
| | | | |
| SP ADR | | Sponsored American Depositary Receipt |
See accompanying Notes to Financial Statements.
ASTON/River Road Small Cap Value Fund
| | |
| |
| Portfolio Manager Commentary (unaudited) | | October 31, 2012 |
| James C. Shircliff, CFA; R. Andrew Beck & J. Justin Akin |
| Q. | What were the most significant market factors affecting Fund performance and returns relative to the benchmark during the past 12 months? |
| A. | The Fund’s return lagged the benchmark Russell 2000 Value. The Fund’s performance was negatively impacted by the leadership of high beta, lower quality securities in the small cap market. As that trend reversed, however, the Fund’s relative performance significantly improved. Five of 10 sectors contributed positively to relative Fund performance. The largest contribution was from the Information Technology sector, which benefited from strong stock selection. The largest negative contributor was the Financials sector, which lagged most significantly as the result of an underweight allocation. |
| Q. | What were the best performing holdings for the Fund during the period? |
| A. | The two holdings with the largest positive contribution to relative return were GEO Group Inc. and Madison Square Garden Co. GEO Group is the second largest private prison operator in the United States. In early 2012, the company initiated a dividend and subsequently increased it twice, which resulted in an attractive yield for investors. Secondly, the company is pursuing the possibility of converting into a Real Estate Investment Trust (REIT). We believe that the IRS will grant approval, which will improve GEO’s tax efficiency and could lead to multiple expansion. Madison Square Garden owns the New York Knicks, the New York Rangers, the MSG regional sports cable network, plus the real estate of the |
| | “World’s Most Famous Arena.” The company has begun to realize operating benefits from its $1 billion renovation of the Garden. Also, the management team favorably resolved a pricing dispute with Time Warner Cable, which represents approximately 30% of the MSG subscriber base. |
| Q. | What were the weakest performing holdings? |
| A. | The two holdings with the largest negative contribution to the Fund’s total return were Big Lots Inc. and Harris Teeter Supermarkets Inc. Big Lots is the largest broad line close-out retailer in the United States. The company reported disappointing Q2 results that were below expectations and also lowered its earnings guidance for 2012. Same-store sales declined due to weakness in its seasonal, home, and furniture categories. The Chief Merchandising Officer resigned as a result. Harris Teeter operates an upscale grocery chain in the mid-Atlantic region of the United States. In-store traffic trends have remained positive throughout the year. However, food inflation and higher levels of discounting have put a lid on margins which has limited profit growth. |
| Q. | How was the Fund positioned as of October 31, 2012? |
| A. | We continue to position the Fund in the shares of high quality companies that we believe will perform well in a period of weak economic growth. |
Note: Beta is a measure of risk which shows a fund’s volatility relative to its benchmark index.
Growth of a Hypothetical
$10,000 Investment—Class N

All dividends and capital gains are reinvested. Indexes are unmanaged and do not take into account fees, expenses or other costs.
Returns shown in the chart and table do not reflect taxes that a shareholder would pay on Fund distributions or on the sale of the Fund shares.
Small-cap stocks may be subject to a higher degree of market risk than the securities of more established companies because they tend to be more volatile and less liquid.
Value investing involves the risk that a Fund’s investing in companies believed to be undervalued will not appreciate as anticipated.
RETURNSFOR PERIOD ENDED 10/31/12
Average Annual Total Returns - Class N
| | | | |
One Year | | | 11.15 | % |
Five Year | | | -0.23 | % |
Since Inception | | | 5.07 | % |
Inception Date 06/28/05
Average Annual Total Returns - Class I
| | | | |
One Year | | | 11.46 | % |
Five Year | | | 0.01 | % |
Since Inception | | | 0.67 | % |
Inception Date 12/13/06
The performance data quoted represents past performance. Past performance does not guarantee future results. Investment return and principal value will fluctuate so that an investor’s shares, upon redemption, may be worth more or less than their original cost. Current performance may be lower or higher than the performance data quoted. For performance data current to the most recent month-end, please visit our website at www.astonfunds.com.
| | |
| |
| ASTON/River Road Small Cap Value Fund | | October 31, 2012 |
| |
| Schedule of Investments | | |
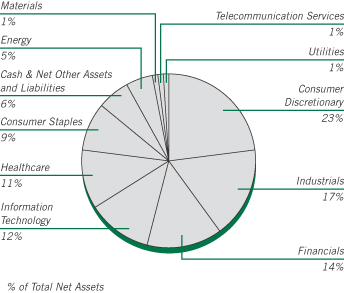
| | | | | | | | |
Shares | | | | | Market
Value | |
|
| | COMMON STOCKS – 94.22% | |
| | |
| | | | Consumer Discretionary – 23.21% | | | | |
| | 63,480 | | | Abercrombie & Fitch, Class A | | $ | 1,941,218 | |
| | 333,428 | | | Ascena Retail Group * | | | 6,601,874 | |
| | 45,811 | | | Ascent Capital Group, Class A * | | | 2,723,464 | |
| | 305,570 | | | Big Lots * | | | 8,901,254 | |
| | 153,680 | | | Bob Evans Farms | | | 5,850,598 | |
| | 132,380 | | | DreamWorks Animation SKG, Class A * | | | 2,696,581 | |
| | 176,798 | | | Fred’s, Class A | | | 2,395,613 | |
| | 173,160 | | | Iconix Brand Group * | | | 3,205,192 | |
| | 422,521 | | | Mac-Gray (a) | | | 5,492,773 | |
| | 285,920 | | | Madison Square Garden, Class A * | | | 11,768,467 | |
| | 161,359 | | | Monarch Casino & Resort * (a) | | | 1,471,594 | |
| | 179,740 | | | Motorcar Parts of America * | | | 844,778 | |
| | 220,420 | | | Pep Boys - Manny, Moe, & Jack | | | 2,201,996 | |
| | 221,927 | | | Rent-A-Center | | | 7,396,827 | |
| | 52,722 | | | Service Corp International | | | 740,217 | |
| | 113,480 | | | True Religion Apparel | | | 2,910,762 | |
| | | | | | | | |
| | | | | | | 67,143,208 | |
| | | | | | | | |
| | |
| | | | Consumer Staples – 9.02% | | | | |
| | 283,989 | | | Harris Teeter Supermarkets | | | 10,635,388 | |
| | 133,480 | | | Industrias Bachoco, SP ADR (Mexico) | | | 3,370,370 | |
| | 91,320 | | | Ingles Markets, Class A | | | 1,479,384 | |
| | 54,804 | | | J & J Snack Foods | | | 3,138,625 | |
| | 196,617 | | | Omega Protein * | | | 1,279,977 | |
| | 168,796 | | | Village Super Market, Class A | | | 6,189,749 | |
| | | | | | | | |
| | | | | | | 26,093,493 | |
| | | | | | | | |
| | |
| | | | Energy – 5.21% | | | | |
| | 68,000 | | | Cloud Peak Energy * | | | 1,434,800 | |
| | 112,843 | | | Endeavour International * | | | 819,240 | |
| | 558,393 | | | Evolution Petroleum * | | | 4,578,823 | |
| | | | | | | | |
Shares | | | | | Market
Value | |
| | |
| | | | Energy (continued) | | | | |
| | 532,508 | | | Miller Energy Resources * | | $ | 2,406,936 | |
| | 198,200 | | | Resolute Energy * | | | 1,760,016 | |
| | 85,570 | | | Rex Energy * | | | 1,132,947 | |
| | 171,507 | | | Tetra Technologies * | | | 917,562 | |
| | 245,985 | | | Vaalco Energy * | | | 2,009,697 | |
| | | | | | | | |
| | | | | | | 15,060,021 | |
| | | | | | | | |
| | |
| | | | Financials – 13.50% | | | | |
| | 244,111 | | | Alterra Capital Holdings (Bermuda) | | | 5,963,632 | |
| | 228,340 | | | BGC Partners, Class A | | | 1,068,631 | |
| | 28,667 | | | Capital Southwest | | | 3,088,869 | |
| | 229,952 | | | Dime Community Bancshares | | | 3,334,304 | |
| | 22,465 | | | First Citizens BancShares, Class A | | | 3,790,969 | |
| | 61,580 | | | FirstService (Canada) * | | | 1,775,967 | |
| | 158,170 | | | Hilltop Holdings * | | | 2,149,530 | |
| | 148,639 | | | Medallion Financial | | | 1,859,474 | |
| | 44,927 | | | Navigators Group * | | | 2,384,725 | |
| | 33,539 | | | Oppenheimer Holdings, Class A | | | 546,015 | |
| | 286,440 | | | SWS Group * | | | 1,629,844 | |
| | 35,728 | | | Tompkins Financial | | | 1,446,269 | |
| | 60,915 | | | Tower Group | | | 1,097,688 | |
| | 17,368 | | | White Mountains Insurance Group | | | 8,904,574 | |
| | | | | | | | |
| | | | | | | 39,040,491 | |
| | | | | | | | |
| | |
| | | | Healthcare – 10.84% | | | | |
| | 39,435 | | | Chemed | | | 2,652,004 | |
| | 144,863 | | | Ensign Group | | | 4,224,205 | |
| | 87,920 | | | Hill-Rom Holdings | | | 2,469,673 | |
| | 107,073 | | | ICU Medical * | | | 6,352,641 | |
| | 432,018 | | | Nordion (Canada) | | | 2,799,477 | |
| | 132,530 | | | Owens & Minor | | | 3,773,129 | |
| | 114,250 | | | Quality Systems | | | 1,993,662 | |
| | 198,960 | | | STERIS | | | 7,084,966 | |
| | | | | | | | |
| | | | | | | 31,349,757 | |
| | | | | | | | |
| | |
| | | | Industrials – 17.11% | | | | |
| | 124,170 | | | ABM Industries | | | 2,359,230 | |
| | 216,920 | | | Aircastle (Bermuda) | | | 2,414,320 | |
| | 125,950 | | | Brink’s | | | 3,313,744 | |
| | 44,026 | | | Cubic | | | 2,148,469 | |
| | 219,234 | | | Dolan * | | | 1,015,053 | |
| | 109,432 | | | G & K Services, Class A | | | 3,529,182 | |
| | 450,760 | | | Geo Group | | | 12,495,067 | |
| | 109,580 | | | Heartland Express | | | 1,528,641 | |
| | 140,989 | | | Insperity | | | 3,681,223 | |
| | 150,540 | | | John Bean Technologies | | | 2,321,327 | |
| | 154,650 | | | Korn/Ferry International * | | | 2,070,763 | |
| | 65,533 | | | Layne Christensen * | | | 1,460,730 | |
| | 152,459 | | | Standard Parking * | | | 3,483,688 | |
| | 110,073 | | | Unifirst | | | 7,657,779 | |
| | | | | | | | |
| | | | | | | 49,479,216 | |
| | | | | | | | |
| | |
| | | | Information Technology – 12.29% | | | | |
| | 32,461 | | | Computer Services | | | 886,185 | |
| | 239,860 | | | Convergys | | | 4,032,047 | |
| | 95,590 | | | CSG Systems International * | | | 1,970,110 | |
See accompanying Notes to Financial Statements.
| | |
| |
| ASTON/River Road Small Cap Value Fund | | October 31, 2012 |
| |
| Schedule of Investments – continued | | |
| | | | | | | | |
Shares | | | | | Market
Value | |
| | |
| | | | Information Technology (continued) | | | | |
| | 171,010 | | | Daktronics | | $ | 1,499,758 | |
| | 183,466 | | | DST Systems | | | 10,464,901 | |
| | 178,973 | | | Electro Rent | | | 2,813,455 | |
| | 93,973 | | | Ingram Micro, Class A * | | | 1,428,390 | |
| | 89,570 | | | Ituran Location and Control (Israel) | | | 1,107,085 | |
| | 39,860 | | | j2 Global | | | 1,197,394 | |
| | 42,660 | | | Lexmark International, Class A | | | 906,952 | |
| | 252,930 | | | NeuStar, Class A * | | | 9,254,709 | |
| | | | | | | | |
| | | | | | | 35,560,986 | |
| | | | | | | | |
| | |
| | | | Materials – 1.35% | | | | |
| | 18,773 | | | Aptargroup | | | 962,679 | |
| | 106,030 | | | Kraton Performance Polymers * | | | 2,313,575 | |
| | 36,521 | | | Tredegar | | | 619,761 | |
| | | | | | | | |
| | | | | | | 3,896,015 | |
| | | | | | | | |
| | |
| | | | Telecommunication Services – 0.91% | | | | |
| | 63,360 | | | Atlantic Tele-Network | | | 2,625,638 | |
| | | | | | | | |
| | |
| | | | Utilities – 0.78% | | | | |
| | 89,030 | | | Avista | | | 2,263,143 | |
| | | | | | | | |
| | |
| | | | Total Common Stocks
(Cost $204,872,610) | | | 272,511,968 | |
| | | | | | | | |
|
| | INVESTMENT COMPANY – 5.82% | |
| | |
| | 16,823,092 | | | BlackRock Liquidity Funds
TempFund Portfolio | | | 16,823,092 | |
| | | | | | | | |
| | |
| | | | Total Investment Company
(Cost $16,823,092) | | | 16,823,092 | |
| | | | | | | | |
| Total Investments – 100.04%
(Cost $221,695,702)** | | | 289,335,060 | |
| | | | | | | | |
| Net Other Assets and Liabilities – (0.04)% | | | (105,872 | ) |
| | | | | | | | |
| Net Assets – 100.00% | | $ | 289,229,188 | |
| | | | | | | | |
| * | | Non-income producing security. |
| ** | | Aggregate cost for Federal income tax purposes is $223,616,957. |
| | | | |
Gross unrealized appreciation | | $ | 73,808,558 | |
Gross unrealized depreciation | | | (8,090,455 | ) |
| | | | |
Net unrealized appreciation | | $ | 65,718,103 | |
| | | | |
| (a) | | These securities have been determined by the Subadviser to be illiquid securities. At October 31, 2012, these securities amounted to $6,964,367 or 2.41 % of net assets. |
| SP ADR | | Sponsored American Depositary Receipt |
See accompanying Notes to Financial Statements.
ASTON/River Road Independent Value Fund
| | |
| |
| Portfolio Manager Commentary (unaudited) | | October 31, 2012 |
| | Eric Cinnamond, CFA |
| Q. | What were the most significant market factors affecting Fund performance and returns relative to the benchmark during the past 12 months? |
| A. | Class N Shares of the Fund returned 7.41% during the past twelve months versus 14.47% for the Russell 2000 Value benchmark Index. The Fund’s high cash levels, which averaged 51%, were the driver of the underperformance during the period. Cash remained at above average levels throughout the last twelve months as the majority of the stocks on our possible buy list traded over our calculated valuations. On average, we did not believe we were being appropriately compensated relative to risk assumed during the year and opted to remain flexible until prices become more advantageous. |
| Q. | What were the best performing holdings for the Fund during the period? |
| A. | Core-Mark Holding Inc. and CSG Systems International Inc. were the largest positive contributors during the period. Core-Mark is the number two market leading convenience store distributor in North America with distribution to 28,000 convenience stores. The company’s results improved over the last several quarters due to increased end market demand and market share gains as it expanded its distribution customer base. CSG Systems is a market-leading provider of billing and customer relationship software for the satellite and cable industry. The firm’s operating results, cash flow generation, and balance sheet all strengthened throughout the period due to stabilizing demand trends and improved performance from a recent acquisition. |
| Q. | What were the weakest performing holdings? |
| A. | Bill Barrett Corp. and ManTech International Corp. were the largest negative contributors in the period. Bill Barrett is an oil and gas exploration and production company focused in the Rockies region that has suffered as natural gas prices declined throughout the first half of the year. ManTech is a leading provider of information technology services to the U.S. military and federal government agencies. The firm experienced weak bookings in 2012 caused by uncertainty around federal government spending. |
| Q. | How was the Fund positioned as of October 31, 2012? |
| A. | The Fund remained defensively positioned throughout the year as the rising small cap market provided few opportunities to purchase stocks on our buy list that we believe would provide us with adequate future rates of return. Cash levels remain above average and we continue to actively limit the operating or financial risk we take in the Fund. Early in the period, we added several Energy names that fell below our valuation as the sector sold off sharply due to falling oil and gas prices. This increased the operating risk of the Fund somewhat, but as of October 31, 2012 these positions have been significantly reduced as many approached valuation. We continue to be steadfast in our commitment to only taking risk when we are adequately compensated, and thus, believe our current defensive positioning is appropriate. We also remain prepared to take advantage of increased opportunities should volatility return to the small cap market. |
Growth of a Hypothetical $10,000 Investment—Class N
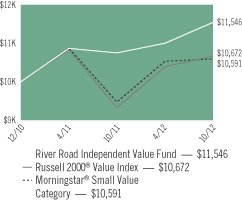
All dividends and capital gains are reinvested. Indexes are unmanaged and do not take into account fees, expenses or other costs.
Returns shown in the chart and table do not reflect taxes that a shareholder would pay on Fund distributions or on the sale of the Fund shares.
Value investing involves the risk that a Fund’s investing in companies believed to be undervalued will not appreciate as anticipated.
RETURNSFOR PERIOD ENDED 10/31/12
Average Annual Total Returns - Class N
| | | | |
One Year | | | 7.41 | % |
Since Inception | | | 8.15 | % |
Inception Date 12/31/10
Average Annual Total Returns - Class I
| | | | |
One Year | | | 7.68 | % |
Since Inception | | | 4.26 | % |
The performance data quoted represents past performance. Past performance does not guarantee future results. Investment return and principal value will fluctuate so that an investor’s shares, upon redemption, may be worth more or less than their original cost. Current performance may be lower or higher than the performance data quoted. For performance data current to the most recent month-end, please visit our website at www.astonfunds.com.
The performance quoted would have been lower if fee waivers and/or expense reimbursements had not been in effect.
| | |
| |
| ASTON/River Road Independent Value Fund | | October 31, 2012 |
| |
| Schedule of Investments | | |
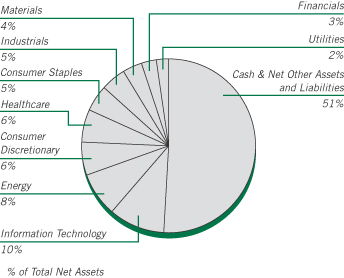
| | | | | | | | |
Shares | | | | | Market
Value | |
| |
| | COMMON STOCKS – 49.10% | | | | |
| | |
| | | | Consumer Discretionary – 6.14% | | | | |
| | 477,212 | | | Aaron’s * | | $ | 14,712,445 | |
| | 556,603 | | | American Greetings, Class A | | | 9,556,873 | |
| | 302,498 | | | Big Lots * | | | 8,811,767 | |
| | 43,625 | | | Core-Mark Holding | | | 2,088,329 | |
| | 302,449 | | | Valassis Communications * | | | 7,869,723 | |
| | | | | | | | |
| | | | | | | 43,039,137 | |
| | | | | | | | |
| | |
| | | | Consumer Staples – 4.89% | | | | |
| | 1,121,884 | | | Cott (Canada) * | | | 8,582,413 | |
| | 559,219 | | | Harris Teeter Supermarkets | | | 20,942,752 | |
| | 162,433 | | | Oil-Dri Corporation of America | | | 3,638,499 | |
| | 25,948 | | | Weis Markets | | | 1,068,020 | |
| | | | | | | | |
| | | | | | | 34,231,684 | |
| | | | | | | | |
| | |
| | | | Energy – 8.23% | | | | |
| | 263,359 | | | Bill Barrett * | | | 6,033,555 | |
| | 183,499 | | | Contango Oil & Gas * | | | 9,020,811 | |
| | 490,043 | | | Patterson-UTI Energy | | | 7,928,896 | |
| | 271,362 | | | QEP Resources | | | 7,869,498 | |
| | 301,190 | | | Tidewater | | | 14,309,537 | |
| | 310,013 | | | Unit * | | | 12,509,025 | |
| | | | | | | | |
| | | | | | | 57,671,322 | |
| | | | | | | | |
| | |
| | | | Financials – 2.80% | | | | |
| | 173,592 | | | Baldwin & Lyons, Class B | | | 4,226,965 | |
| | 211,175 | | | Brown & Brown | | | 5,395,521 | |
| | 259,937 | | | Potlatch, REIT | | | 10,002,376 | |
| | | | | | | | |
| | | | | | | 19,624,862 | |
| | | | | | | | |
| | |
| | | | Healthcare – 6.11% | | | | |
| | 30,163 | | | Bio-Rad Laboratories, Class A * | | | 3,057,020 | |
| | 303,804 | | | Covance * | | | 14,798,293 | |
| | | | | | | | |
Shares | | | | | Market
Value | |
| | |
| | | | Healthcare – (continued) | | | | |
| | 875,545 | | | Owens & Minor | | $ | 24,926,766 | |
| | | | | | | | |
| | | | | | | 42,782,079 | |
| | | | | | | | |
| | |
| | | | Industrials – 4.65% | | | | |
| | 122,838 | | | Alamo Group | | | 4,115,073 | |
| | 381,549 | | | Orbital Sciences * | | | 5,112,757 | |
| | 1,348,318 | | | Sykes Enterprises * | | | 18,364,091 | |
| | 71,613 | | | Unifirst | | | 4,982,116 | |
| | | | | | | | |
| | | | | | | 32,574,037 | |
| | | | | | | | |
| | |
| | | | Information Technology – 10.41% | | | | |
| | 425,031 | | | Benchmark Electronics * | | | 6,298,959 | |
| | 736,995 | | | CSG Systems International * | | | 15,189,467 | |
| | 1,180,634 | | | EPIQ Systems | | | 14,415,541 | |
| | 950,446 | | | FLIR Systems | | | 18,467,166 | |
| | 290,715 | | | Mantech International, Class A | | | 6,677,724 | |
| | 313,956 | | | Supertex * (a) | | | 5,999,699 | |
| | 263,079 | | | Total System Services | | | 5,916,647 | |
| | | | | | | | |
| | | | | | | 72,965,203 | |
| | | | | | | | |
| | |
| | | | Materials – 3.61% | | | | |
| | 1,150,828 | | | Pan American Silver (Canada) | | | 25,318,216 | |
| | | | | | | | |
| | |
| | | | Utilities – 2.26% | | | | |
| | 251,628 | | | Artesian Resources, Class A (a) | | | 5,789,960 | |
| | 138,998 | | | Avista | | | 3,533,329 | |
| | 352,084 | | | California Water Service Group | | | 6,485,387 | |
| | | | | | | | |
| | | | | | | 15,808,676 | |
| | | | | | | | |
| | |
| | | | Total Common Stocks
(Cost $333,734,578) | | | 344,015,216 | |
| | | | | | | | |
| Total Investments – 49.10%
(Cost $333,734,578)** | | | 344,015,216 | |
| | | | | | | | |
| Net Other Assets and Liabilities – 50.90% | | | 356,634,247 | |
| | | | | | | | |
| Net Assets – 100.00% | | $ | 700,649,463 | |
| | | | | | | | |
| * | | Non-income producing security. |
| ** | | Aggregate cost for Federal income tax purposes is $341,568,242. |
| | | | |
Gross unrealized appreciation | | $ | 23,160,321 | |
Gross unrealized depreciation | | | (20,713,347 | ) |
| | | | |
Net unrealized appreciation | | $ | 2,446,974 | |
| | | | |
| (a) | | These securities have been determined by the Subadviser to be illiquid securities. At October 31, 2012, these securities amounted to $11,789,659 or 1.68% of net assets. |
| REIT | | Real Estate Investment Trust |
See accompanying Notes to Financial Statements.
ASTON/DoubleLine Core Plus Fixed Income Fund
| | |
| |
| Portfolio Manager Commentary (unaudited) | | October 31, 2012 |
Jeffrey E. Gundlach; Philip A. Barach; Bonnie Baha, CFA & Luz M. Padilla
| Q. | What were the most significant market factors affecting Fund performance and returns relative to the benchmark during the past 12 months? |
| A. | The Fund outperformed significantly over the past twelve months ending October 31, 2012. This outperformance was driven by both the sector allocation among the varying sectors of the fixed income market as well as security selection within each of the respective sectors. For the year, both the Agency mortgage-backed securities (“MBS”) and U.S. Government sectors were the worst performing sectors of the Barclays Aggregate Index. The Fund was underweight the U.S. Government sector throughout the twelve month period which helped relative performance. Also, the Fund had a slight underweight to Agency MBS versus the benchmark, but when considering the Fund’s allocation of Agency pass through securities the underweight becomes much more significant. The Fund’s allocation to the overall MBS market, including non-Agency residentials, was more than the benchmark and considering these securities outperformed, performance benefitted. The Fund held a market-weighting in U.S. Corporate securities which performed in line with the benchmark over the period. The Fund also held overweights in Commercial MBS along with an allocation to U.S. dollar denominated Emerging Markets outside the benchmark. These two sectors outperformed the broad U.S. fixed income market and thus further enhanced returns. |
| Q. | What were the best performing holdings for the Fund during the period? |
| A. | Over the period, the non-benchmark holdings were the best performers. This includes the U.S. dollar denominated Emerging Markets holdings as well as non-Agency residential MBS. Emerging Market bonds continue to offer diversification benefits to the overall portfolio while also adding to outperformance. The non-Agency MBS sector also performed well over the previous twelve months. Securities backed by both prime and Alt-A collateral were the best performers over this period. |
| Q. | What were the weakest performing holdings? |
| A. | The Fund’s weakest holdings were in the U.S. Government debt (including Agency-backed securities) as well as U.S. Agency MBS. These sectors of the Fund were the worst performing sectors, however, these sectors performed in line with their respective portions of the benchmark. |
| Q. | How was the Fund positioned as of October 31, 2012? |
| A. | The Fund’s strategy has remained relatively constant throughout the twelve months ending October 31, 2012. The Fund continues to hold an allocation to non-benchmark sectors such as U.S. dollar-denominated Emerging Markets and non-Agency MBS. The non-Agency MBS allocations continue to be focused on prime and Alt-A backed collateral with very little subprime exposure. Additionally, the Fund continues to be underweight U.S. Government and Agency debt while maintaining a market weight in U.S. Corporates and no exposure to U.S. High Yield securities. |
Growth of a Hypothetical $10,000 Investment—Class N
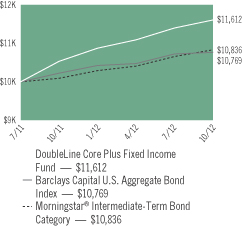
All dividends and capital gains are reinvested. Indexes are unmanaged and do not take into account fees, expenses or other costs.
Returns shown in the chart and table do not reflect taxes that a shareholder would pay on Fund distributions or on the sale of the Fund shares.
Bond funds have the same interest rate, high yield and credit risks associated with the underlying bonds in the portfolio, all of which could reduce the Fund’s value. As interest rates rise, the value of the Fund can decline and an investor can lose principal.
RETURNSFOR PERIOD ENDED 10/31/12
Average Annual Total Returns - Class N
| | | | |
One Year | | | 10.25 | % |
Since Inception | | | 12.28 | % |
Inception Date 07/18/11
Average Annual Total Returns - Class I
| | | | |
One Year | | | 10.52 | % |
Since Inception | | | 12.54 | % |
Inception Date 07/18/11
The performance data quoted represents past performance. Past performance does not guarantee future results. Investment return and principal value will fluctuate so that an investor’s shares, upon redemption, may be worth more or less than their original cost. Current performance may be lower or higher than the performance data quoted. For performance data current to the most recent month-end, please visit our website at www.astonfunds.com.
The performance quoted would have been lower if fee waivers and/or expense reimbursements had not been in effect.
| | |
| |
| ASTON/DoubleLine Core Plus Fixed Income Fund | | October 31, 2012 |
| |
| Schedule of Investments | | |
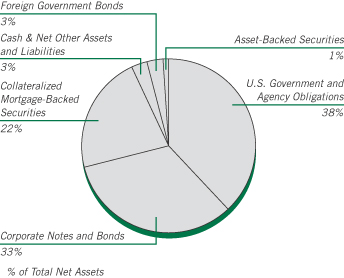
| | | | | | | | |
Par Value | | | | | Market
Value | |
|
| | AGENCY COLLATERALIZED MORTGAGE OBLIGATIONS – 12.44% | |
| | |
| | | | Fannie Mae – 3.64% | | | | |
| | $ 947,959 | | | 5.000%, 09/25/33
Series 2003-92, Class PZ, REMIC | | $ | 1,083,780 | |
| | 1,025,577 | | | 5.589%, 09/25/36 (a) (b)
Series 2009-86, Class CI, REMIC | | | 128,368 | |
| | 697,534 | | | 6.409%, 10/25/36 (a) (b)
Series 2007-57, Class SX, REMIC | | | 103,835 | |
| | 193,778 | | | 5.500%, 03/25/38
Series 2008-14, Class ZA, REMIC | | | 219,997 | |
| | 283,966 | | | 4.000%, 01/25/41
Series 2010-156, Class ZC, REMIC | | | 309,954 | |
| | 427,528 | | | 4.000%, 03/25/41
Series 2011-18, Class UZ, REMIC | | | 466,701 | |
| | 79,318 | | | 4.000%, 08/25/41
Series 2011-77, Class CZ, REMIC | | | 79,952 | |
| | 196,639 | | | 8.871%, 09/25/41 (a)
Series 2011-88, Class SB, REMIC | | | 199,942 | |
| | 158,428 | | | 13.307%, 09/25/41 (a)
Series 2011-87, Class US, REMIC | | | 160,968 | |
| | 1,023,573 | | | 3.500%, 03/25/42
Series 2012-20, Class ZT, REMIC | | | 1,049,268 | |
| | 1,535,352 | | | 4.000%, 04/25/42
Series 2012-31, Class Z, REMIC | | | 1,657,566 | |
| | 1,002,917 | | | 3.500%, 10/25/42
Series 2012-105, Class Z, REMIC | | | 977,831 | |
| | | | | | | | |
| | | | | | | 6,438,162 | |
| | | | | | | | |
| | |
| | | | Freddie Mac – 6.88% | | | | |
| | 2,984,665 | | | 3.000%, 08/15/42
Series 269, Class 30, STRIP | | | 3,115,698 | |
| | 739,121 | | | 5.000%, 12/15/34
Series 2909, Class Z, REMIC | | | 825,783 | |
| | 1,634,703 | | | 5.000%, 03/15/35
Series 2945, Class CZ, REMIC | | | 1,805,409 | |
| | | | | | | | |
Par Value | | | | | Market
Value | |
| | |
| | | | Freddie Mac (continued) | | | | |
| | $ 581,443 | | | 5.500%, 08/15/36
Series 3626, Class AZ, REMIC | | $ | 666,090 | |
| | 495,442 | | | 5.886%, 04/15/37 (a) (b)
Series 3301, Class MS, REMIC | | | 61,099 | |
| | 444,250 | | | 5.786%, 11/15/37 (a) (b)
Series 3382, Class SB, REMIC | | | 42,888 | |
| | 380,070 | | | 6.176%, 11/15/37 (a) (b)
Series 3384, Class S, REMIC | | | 51,142 | |
| | 1,500,000 | | | 4.000%, 12/15/38
Series 3738, Class BP, REMIC | | | 1,634,508 | |
| | 1,218,342 | | | 5.306%, 01/15/39 (a) (b)
Series 3500, Class SA, REMIC | | | 129,225 | |
| | 1,246,321 | | | 4.500%, 01/15/40
Series 3818, Class JA, REMIC | | | 1,293,506 | |
| | 23,373 | | | 14.358%, 10/15/40 (a)
Series 3747, Class KS, REMIC | | | 23,626 | |
| | 107,238 | | | 4.000%, 01/15/41
Series 3795, Class VZ, REMIC | | | 117,072 | |
| | 97,339 | | | 9.472%, 01/15/41 (a)
Series 3796, Class SK, REMIC | | | 98,015 | |
| | 299,140 | | | 4.000%, 06/15/41
Series 3872, Class BA, REMIC | | | 320,505 | |
| | 210,237 | | | 4.000%, 07/15/41
Series 3888, Class ZG, REMIC | | | 227,960 | |
| | 370,163 | | | 4.500%, 07/15/41
Series 3894, Class ZA, REMIC | | | 414,998 | |
| | 317,500 | | | 9.131%, 09/15/41 (a)
Series 3924, Class US, REMIC | | | 321,880 | |
| | 516,278 | | | 3.500%, 11/15/41
Series 3957, Class DZ, REMIC | | | 533,772 | |
| | 466,778 | | | 4.000%, 11/15/41
Series 3957, Class HZ, REMIC | | | 490,449 | |
| | | | | | | | |
| | | | | | | 12,173,625 | |
| | | | | | | | |
| |
| | | | Government National Mortgage Association – 1.92% | |
| | 53,019 | | | 31.130%, 03/20/34 (a)
Series 2004-35, Class SA | | | 98,984 | |
| | 1,210,849 | | | 7.419%, 08/20/38 (a) (b)
Series 2008-69, Class SB | | | 194,584 | |
| | 1,310,838 | | | 5.951%, 03/20/39 (b)
Series 2010-98, Class IA | | | 111,138 | |
| | 1,165,864 | | | 4.500%, 05/16/39
Series 2009-32, Class ZE | | | 1,303,195 | |
| | 582,932 | | | 4.500%, 05/20/39
Series 2009-35, Class DZ | | | 663,496 | |
| | 574,269 | | | 4.500%, 09/20/39
Series 2009-75, Class GZ | | | 652,129 | |
| | 2,824,714 | | | 5.239%, 06/20/41 (a) (b)
Series 2011-89, Class SA | | | 376,421 | |
| | | | | | | | |
| | | | | | | 3,399,947 | |
| | | | | | | | |
| | |
| | | | Total Agency Collateralized Mortgage Obligations
(Cost $20,983,252) | | | 22,011,734 | |
| | | | | | | | |
See accompanying Notes to Financial Statements.
| | |
| |
| ASTON/DoubleLine Core Plus Fixed Income Fund | | October 31, 2012 |
| |
| Schedule of Investments – continued | | |
| | | | | | | | |
Par Value | | | | | Market
Value | |
| |
| | U.S. GOVERNMENT OBLIGATIONS – 18.18% | | | | |
| | |
| | | | U.S. Treasury Bill – 3.42% | | | | |
| | $2,800,000 | | | 0.114%, 12/06/12 | | $ | 2,799,742 | |
| | 3,250,000 | | | 0.075%, 01/10/13 | | | 3,249,480 | |
| | | | | | | | |
| | | | | | | 6,049,222 | |
| | | | | | | | |
| | |
| | | | U.S. Treasury Bond – 3.24% | | | | |
| | 4,830,000 | | | 3.750%, 08/15/41 | | | 5,734,872 | |
| | | | | | | | |
| | |
| | | | U.S. Treasury Notes – 11.52% | | | | |
| | 2,420,000 | | | 1.875%, 09/30/17 | | | 2,555,747 | |
| | 3,160,000 | | | 2.375%, 05/31/18 | | | 3,422,182 | |
| | 4,950,000 | | | 1.250%, 04/30/19 | | | 5,015,355 | |
| | 810,000 | | | 1.000%, 08/31/19 | | | 804,051 | |
| | 2,590,000 | | | 2.625%, 11/15/20 | | | 2,842,525 | |
| | 5,680,000 | | | 1.750%, 05/15/22 | | | 5,731,035 | |
| | | | | | | | |
| | | | | | | 20,370,895 | |
| | | | | | | | |
| | |
| | | | Total U.S. Government Obligations
(Cost $32,380,435) | | | 32,154,989 | |
| | | | | | | | |
|
| | U.S. GOVERNMENT MORTGAGE-BACKED SECURITIES – 7.49% | |
| | |
| | | | Fannie Mae – 7.03% | | | | |
| | 576,830 | | | 4.000%, 09/01/31
Pool # MA3894 | | | 622,462 | |
| | 1,287,948 | | | 3.500%, 12/01/31
Pool # MA0919 | | | 1,377,453 | |
| | 1,129,041 | | | 3.500%, 01/01/32
Pool # MA0949 | | | 1,207,503 | |
| | 861,529 | | | 4.000%, 02/01/42
Pool # AK4039 | | | 904,915 | |
| | 730,451 | | | 4.500%, 03/01/42
Pool # MA1050 | | | 772,411 | |
| | 1,810,528 | | | 3.500%, 05/01/42
Pool # MA1068 | | | 1,885,994 | |
| | 2,070,153 | | | 4.000%, 06/01/42
Pool # AB5459 | | | 2,174,403 | |
| | 3,351,015 | | | 3.500%, 07/01/42
Pool # MA1117 | | | 3,490,693 | |
| | | | | | | | |
| | | | | | | 12,435,834 | |
| | | | | | | | |
| | |
| | | | Freddie Mac – 0.46% | | | | |
| | 113,914 | | | 5.000%, 07/01/35
Gold Pool # G01840 | | | 123,865 | |
| | 49,539 | | | 5.500%, 12/01/38
Gold Pool # G06172 | | | 53,910 | |
| | 610,820 | | | 4.000%, 10/01/41
Gold Pool # T60392 | | | 640,626 | |
| | | | | | | | |
| | | | | | | 818,401 | |
| | | | | | | | |
| | |
| | | | Total U.S. Government Mortgage-Backed
Securities
(Cost $13,156,776) | | | 13,254,235 | |
| | | | | | | | |
| | | | | | | | |
Par Value | | | | | Market
Value | |
|
| | CORPORATE NOTES AND BONDS – 32.67% | |
| | |
| | | | Consumer Discretionary – 2.58% | | | | |
| | $ 425,000 | | | ADT
3.500%, 07/15/22 (c) | | $ | 432,942 | |
| | 340,000 | | | Daimler Finance North America
1.950%, 03/28/14 (c) | | | 344,042 | |
| | 325,000 | | | DIRECTV Holdings
5.000%, 03/01/21 | | | 369,900 | |
| | 550,000 | | | Ford Motor
Senior Unsecured Notes
7.450%, 07/16/31 | | | 698,500 | |
| | 425,000 | | | Mattel
Senior Unsecured Notes
2.500%, 11/01/16 | | | 443,092 | |
| | 225,000 | | | News America
6.650%, 11/15/37 | | | 297,324 | |
| | 350,000 | | | Omnicom Group
Senior Unsecured Notes
4.450%, 08/15/20 | | | 398,675 | |
| | 100,000 | | | Prime Holdings Labuan (Malaysia)
5.375%, 09/22/14 | | | 105,687 | |
| | | | Target
Senior Unsecured Notes | | | | |
| | 275,000 | | | 3.875%, 07/15/20 | | | 315,335 | |
| | 150,000 | | | 2.900%, 01/15/22 | | | 161,114 | |
| | | | Time Warner Cable | | | | |
| | 275,000 | | | 5.000%, 02/01/20 | | | 323,982 | |
| | 325,000 | | | 4.500%, 09/15/42 | | | 334,338 | |
| | 300,000 | | | Wynn Las Vegas
7.750%, 08/15/20 | | | 338,250 | |
| | | | | | | | |
| | | | | | | 4,563,181 | |
| | | | | | | | |
| | |
| | | | Consumer Staples – 3.10% | | | | |
| | 725,000 | | | Altria Group
2.850%, 08/09/22 | | | 727,875 | |
| | 200,000 | | | Anadolu Efes Biracilik Ve Malt Sanayii AS (Turkey)
Senior Unsecured Notes
3.375%, 11/01/22 (c) | | | 195,000 | |
| | 300,000 | | | CCL Finance (Cayman Islands)
9.500%, 08/15/14 | | | 339,000 | |
| | 225,000 | | | Coca-Cola
Senior Unsecured Notes
1.800%, 09/01/16 | | | 233,461 | |
| | 100,000 | | | Corp Lindley (Peru)
Senior Unsecured Notes
6.750%, 11/23/21 (c) | | | 115,850 | |
| | 100,000 | | | Corp Pesquera Inca (Peru)
9.000%, 02/10/17 | | | 108,500 | |
| | 350,000 | | | Diageo Capital (United Kingdom)
1.500%, 05/11/17 | | | 357,101 | |
| | 360,000 | | | General Mills
Senior Unsecured Notes
3.150%, 12/15/21 | | | 384,018 | |
| | 120,000 | | | Gruma (Mexico)
Senior Unsecured Notes
7.750%, 12/29/49 | | | 121,200 | |
See accompanying Notes to Financial Statements.
| | |
| |
| ASTON/DoubleLine Core Plus Fixed Income Fund | | October 31, 2012 |
| |
| Schedule of Investments – continued | | |
| | | | | | | | |
Par Value | | | | | Market
Value | |
| | |
| | | | Consumer Staples (continued) | | | | |
| | $ 400,000 | | | IOI Investment L Bhd (Malaysia)
4.375%, 06/27/22 | | $ | 413,984 | |
| | 70,000 | | | JBS USA
Senior Unsecured Notes
7.250%, 06/01/21 (d) | | | 68,600 | |
| | 268,000 | | | Kellogg
Senior Unsecured Notes
7.450%, 04/01/31 | | | 378,996 | |
| | 290,000 | | | Kraft Foods
Senior Unsecured Notes
5.375%, 02/10/20 | | | 356,231 | |
| | 625,000 | | | Kroger
Senior Unsecured Notes
3.400%, 04/15/22 | | | 667,616 | |
| | 380,000 | | | Tyson Foods
4.500%, 06/15/22 | | | 404,700 | |
| | 550,000 | | | Wal-Mart Stores
Senior Unsecured Notes
3.250%, 10/25/20 | | | 613,176 | |
| | | | | | | | |
| | | | | | | 5,485,308 | |
| | | | | | | | |
| | |
| | | | Energy – 4.72% | | | | |
| | 500,000 | | | AKTransneft OJSC Via TransCapitalInvest (Ireland)
Senior Unsecured Notes
5.670%, 03/05/14 | | | 529,165 | |
| | 300,000 | | | BP Capital Markets (United Kingdom)
4.750%, 03/10/19 | | | 352,990 | |
| | 400,000 | | | CNPC General Capital (British Virgin Islands)
Senior Unsecured Notes
2.750%, 04/19/17 | | | 413,781 | |
| | 275,000 | | | ConocoPhillips
6.500%, 02/01/39 | | | 404,949 | |
| | | | Devon Energy
Senior Unsecured Notes | | | | |
| | 200,000 | | | 6.300%, 01/15/19 | | | 251,949 | |
| | 350,000 | | | 4.000%, 07/15/21 | | | 392,772 | |
| | 600,000 | | | Gazprom OAO Via Gaz Capital SA (Luxembourg)
Senior Unsecured Notes
8.125%, 07/31/14 | | | 659,364 | |
| | 225,000 | | | Halliburton
Senior Unsecured Notes
6.150%, 09/15/19 | | | 286,683 | |
| | 275,000 | | | Kinder Morgan Energy Partners
Senior Unsecured Notes
6.950%, 01/15/38 | | | 369,430 | |
| | 325,000 | | | Marathon Petroleum
Senior Secured Notes
5.125%, 03/01/21 | | | 383,565 | |
| | 301,000 | | | ONEOK Partners
6.125%, 02/01/41 | | | 384,051 | |
| | | | Pacific Rubiales Energy (Canada) | | | | |
| | 100,000 | | | 7.250%, 12/12/21 | | | 119,000 | |
| | 215,000 | | | 7.250%, 12/12/21 (c) | | | 255,850 | |
| | 550,000 | | | Pemex Project Funding Master Trust
6.625%, 06/15/35 | | | 688,875 | |
| | | | | | | | |
Par Value | | | | | Market
Value | |
| | |
| | | | Energy (continued) | | | | |
| | $ 520,000 | | | Petrobras International Finance
(Cayman Islands)
3.875%, 01/27/16 | | $ | 554,863 | |
| | 200,000 | | | Petroleos Mexicanos (Mexico)
6.625%, 09/28/99 | | | 214,000 | |
| | 250,000 | | | Phillips 66
5.875%, 05/01/42 (c) | | | 312,664 | |
| | 250,000 | | | Reliance Holdings USA
5.400%, 02/14/22 (c) | | | 278,256 | |
| | 400,000 | | | Transocean (Cayman Islands)
6.000%, 03/15/18 | | | 471,602 | |
| | 200,000 | | | Transportadora de Gas Internacional SA ESP (Colombia)
Senior Unsecured Notes
5.700%, 03/20/22 | | | 224,000 | |
| | 500,000 | | | Tupras Turkiye Petrol Rafinerileri AS (Turkey)
Senior Unsecured Notes
4.125%, 05/02/18 (c) (d) (e) | | | 494,375 | |
| | 250,000 | | | Valero Energy
6.125%, 02/01/20 | | | 309,042 | |
| | | | | | | | |
| | | | | | | 8,351,226 | |
| | | | | | | | |
| | |
| | | | Financials – 8.44% | | | | |
| | 725,000 | | | American Express Credit
Senior Unsecured Notes
2.750%, 09/15/15 | | | 764,738 | |
| | 600,000 | | | Australia & New Zealand Banking Group (Australia)
Senior Unsecured Notes
4.875%, 01/12/21 (c) | | | 693,895 | |
| | 200,000 | | | Banco Bradesco SA/Cayman Islands (Brazil)
Subordinated Notes
5.750%, 03/01/22 (c) | | | 216,500 | |
| | 100,000 | | | Banco de Chile (Chile)
6.250%, 06/15/16 | | | 112,180 | |
| | 220,000 | | | Banco de Credito del Peru/Panama (Peru)
Senior Unsecured Notes
4.750%, 03/16/16 | | | 235,950 | |
| | 600,000 | | | Banco de Credito e Inversiones (Chile)
Senior Unsecured Notes
3.000%, 09/13/17 (c) | | | 610,339 | |
| | | | Banco do Brasil SA/Cayman Islands (Brazil) | | | | |
| | 200,000 | | | 3.875%, 10/10/22 | | | 199,900 | |
| | 400,000 | | | 8.500%, 10/20/99 (a) (d) | | | 490,000 | |
| | 300,000 | | | Banco Mercantil del Norte (Mexico)
Subordinated Notes
6.862%, 10/13/21 (a) | | | 328,500 | |
| | 100,000 | | | Banco Mercantil del Norte SA (Mexico)
Senior Unsecured Notes
4.375%, 07/19/15 | | | 106,250 | |
| | 100,000 | | | Bancolombia SA (Colombia)
Senior Unsecured Notes
4.250%, 01/12/16 | | | 105,750 | |
See accompanying Notes to Financial Statements.
| | |
| |
| ASTON/DoubleLine Core Plus Fixed Income Fund | | October 31, 2012 |
| |
| Schedule of Investments – continued | | |
| | | | | | | | |
Par Value | | | | | Market
Value | |
| | |
| | | | Financials (continued) | | | | |
| | $ 700,000 | | | Bank of Montreal
(Canada)
Senior Unsecured Notes
1.400%, 09/11/17 | | $ | 706,607 | |
| | 515,000 | | | BB&T
Senior Unsecured Notes
1.600%, 08/15/17 | | | 524,629 | |
| | 275,000 | | | Boston Properties
Senior Unsecured Notes, REIT
4.125%, 05/15/21 | | | 302,514 | |
| | 100,000 | | | Boston Properties LP
Senior Unsecured Notes
3.850%, 02/01/23 | | | 107,979 | |
| | 400,000 | | | DBS Bank (Singapore)
5.000%, 11/15/19 (a) | | | 424,441 | |
| | 625,000 | | | General Electric Capital
Senior Unsecured Notes
2.900%, 01/09/17 | | | 662,149 | |
| | | | Grupo Aval (Cayman Islands) | | | | |
| | 400,000 | | | 5.250%, 02/01/17 | | | 428,520 | |
| | 200,000 | | | 4.750%, 09/26/22 (c) | | | 200,500 | |
| | 102,522 | | | Iirsa Norte Finance (Cayman Islands)
Senior Secured Notes
8.750%, 05/30/24 | | | 126,614 | |
| | 100,000 | | | Industrial Senior Trust (Cayman Islands)
5.500%, 11/01/22 (c) (d) (e) | | | 100,600 | |
| | 100,000 | | | Industry & Construction Bank
St Petersburg
5.010%, 09/29/15 (a) | | | 100,125 | |
| | | | JPMorgan Chase
Senior Unsecured Notes | | | | |
| | 250,000 | | | 4.950%, 03/25/20 | | | 287,390 | |
| | 400,000 | | | 4.500%, 01/24/22 | | | 452,368 | |
| | 675,000 | | | Korea Development Bank (South Korea)
4.375%, 08/10/15 | | | 732,175 | |
| | 455,000 | | | Liberty Mutual
6.500%, 05/01/42 (c) | | | 519,049 | |
| | | | MetLife
Senior Unsecured Notes | | | | |
| | 197,000 | | | 6.375%, 06/15/34 | | | 258,227 | |
| | 125,000 | | | 5.700%, 06/15/35 | | | 154,989 | |
| | 590,000 | | | National Rural Utilities Cooperative Finance Collateral Trust
10.375%, 11/01/18 | | | 878,178 | |
| | 600,000 | | | Oversea-Chinese Banking (Singapore)
4.250%, 11/18/19 (a) | | | 623,877 | |
| | | | PNC Funding | | | | |
| | 200,000 | | | 6.700%, 06/10/19 | | | 258,208 | |
| | 250,000 | | | 4.375%, 08/11/20 | | | 289,140 | |
| | 350,000 | | | Pttep Australia International Finance Property (Australia)
4.152%, 07/19/15 | | | 370,778 | |
| | 500,000 | | | Qtel International Finance (Bermuda)
3.375%, 10/14/16 | | | 530,000 | |
| | 200,000 | | | Russian Agricultural Bank (Luxembourg) Senior Unsecured Notes
7.125%, 01/14/14 | | | 212,260 | |
| | | | | | | | |
Par Value | | | | | Market
Value | |
| | |
| | | | Financials (continued) | | | | |
| | | | Simon Property Group
Senior Unsecured Notes
| | | | |
| | $ 100,000 | | | 5.650%, 02/01/20 | | $ | 120,420 | |
| | 160,000 | | | 4.375%, 03/01/21 | | | 180,831 | |
| | 500,000 | | | United Overseas Bank
5.375%, 09/03/19 (a) | | | 531,050 | |
| | 300,000 | | | VTB Bank OJSC Via VTB Capital (Luxembourg)
Senior Unsecured Notes
6.875%, 05/29/18 | | | 324,408 | |
| | 575,000 | | | Wells Fargo
Senior Unsecured Notes
4.600%, 04/01/21 | | | 662,582 | |
| | | | | | | | |
| | | | | | | 14,934,610 | |
| | | | | | | | |
| | |
| | | | Healthcare – 1.43% | | | | |
| | | | Becton Dickinson
Senior Unsecured Notes | | | | |
| | 125,000 | | | 3.250%, 11/12/20 | | | 135,337 | |
| | 405,000 | | | 3.125%, 11/08/21 | | | 436,734 | |
| | 350,000 | | | Biogen Idec
Senior Unsecured Notes
6.875%, 03/01/18 | | | 437,753 | |
| | 425,000 | | | Celgene
Senior Unsecured Notes
3.250%, 08/15/22 | | | 438,560 | |
| | 375,000 | | | Express Scripts Holding
2.100%, 02/12/15 (c) | | | 383,737 | |
| | | | WellPoint
Senior Unsecured Notes | | | | |
| | 350,000 | | | 5.250%, 01/15/16 | | | 392,074 | |
| | 250,000 | | | 5.875%, 06/15/17 | | | 296,231 | |
| | | | | | | | |
| | | | | | | 2,520,426 | |
| | | | | | | | |
| | |
| | | | Industrials – 4.20% | | | | |
| | 300,000 | | | Boeing
Senior Unsecured Notes
6.875%, 03/15/39 | | | 470,049 | |
| | 250,000 | | | Cemex Finance (Mexico)
Senior Secured Notes
9.500%, 12/14/16 | | | 266,650 | |
| | 100,000 | | | Cemex Sab de CV (Mexico)
Senior Secured Notes
9.000%, 01/11/18 | | | 104,250 | |
| | 200,000 | | | Corp GEO Sab de CV
8.875%, 03/27/22 | | | 212,000 | |
| | 200,000 | | | Corp Nacional del Cobre de Chile (Chile)
Senior Unsecured Notes
3.000%, 07/17/22 (c) | | | 202,209 | |
| | | | Covidien International Finance (Luxembourg) | | | | |
| | 185,000 | | | 2.800%, 06/15/15 | | | 194,748 | |
| | 302,000 | | | 6.000%, 10/15/17 | | | 370,099 | |
| | 125,000 | | | Daimler Finance North America
6.500%, 11/15/13 | | | 132,456 | |
See accompanying Notes to Financial Statements.
| | |
| |
| ASTON/DoubleLine Core Plus Fixed Income Fund | | October 31, 2012 |
| |
| Schedule of Investments – continued | | |
| | | | | | | | |
Par Value | | | | | Market
Value | |
| | |
| | | | Industrials (continued) | | | | |
| | $ 325,000 | | | Eastman Chemical
Senior Unsecured Notes
2.400%, 06/01/17 | | $ | 337,453 | |
| | | | Embraer Overseas (Cayman Islands) | | | | |
| | 350,000 | | | 6.375%, 01/24/17 | | | 400,750 | |
| | 150,000 | | | 6.375%, 01/15/20 | | | 175,125 | |
| | | | Empresas ICA (Mexico) | | | | |
| | 150,000 | | | 8.375%, 07/24/17 | | | 160,500 | |
| | 200,000 | | | 8.900%, 02/04/21 | | | 218,000 | |
| | 400,000 | | | Freeport-McMoRan Copper & Gold
Senior Unsecured Notes
2.150%, 03/01/17 | | | 406,478 | |
| | 500,000 | | | Grupo KUO SAB de CV (Mexico)
9.750%, 10/17/17 | | | 535,000 | |
| | | | Illinois Tool Works
Senior Unsecured Notes | | | | |
| | 125,000 | | | 6.250%, 04/01/19 | | | 156,592 | |
| | 150,000 | | | 3.375%, 09/15/21 | | | 161,945 | |
| | 400,000 | | | NET Servicos de Comunicacao (Brazil)
7.500%, 01/27/20 | | | 464,000 | |
| | 350,000 | | | Novartis Capital
4.400%, 04/24/20 | | | 412,735 | |
| | 400,000 | | | Penerbangan Malaysia (Malaysia)
5.625%, 03/15/16 | | | 451,860 | |
| | | | Southwest Airlines
Senior Unsecured Notes | | | | |
| | 337,000 | | | 5.750%, 12/15/16 | | | 383,073 | |
| | 225,000 | | | 5.125%, 03/01/17 | | | 250,522 | |
| | 200,000 | | | United Technologies
Senior Unsecured Notes
3.100%, 06/01/22 | | | 215,584 | |
| | 450,000 | | | Waste Management
6.125%, 11/30/39 | | | 576,178 | |
| | 200,000 | | | WPE International Cooperatief (Netherlands)
10.375%, 09/30/20 | | | 174,000 | |
| | | | | | | | |
| | | | | | | 7,432,256 | |
| | | | | | | | |
| | |
| | | | Information Technology – 1.39% | | | | |
| | 200,000 | | | Arrow Electronics
Senior Unsecured Notes
3.375%, 11/01/15 | | | 209,674 | |
| | 300,000 | | | IBM
Senior Unsecured Notes
1.950%, 07/22/16 | | | 313,734 | |
| | 375,000 | | | Intel
Senior Unsecured Notes
3.300%, 10/01/21 | | | 411,916 | |
| | 450,000 | | | Motorola Solutions
Senior Unsecured Notes
6.000%, 11/15/17 | | | 534,764 | |
| | 425,000 | | | Oracle
Senior Unsecured Notes
1.200%, 10/15/17 | | | 427,470 | |
| | 525,000 | | | Xerox
Senior Unsecured Notes
4.250%, 02/15/15 | | | 557,956 | |
| | | | | | | | |
| | | | | | | 2,455,514 | |
| | | | | | | | |
| | | | | | | | |
Par Value | | | | | Market
Value | |
| | |
| | | | Materials – 2.25% | | | | |
| | $ 600,000 | | | Alfa MTN Invest
Senior Unsecured Notes
9.250%, 06/24/13 | | $ | 626,328 | |
| | | | Celulosa Arauco y Constitucion SA (Chile)
Senior Unsecured Notes | | | | |
| | 300,000 | | | 5.000%, 01/21/21 | | | 324,523 | |
| | 200,000 | | | 4.750%, 01/11/22 | | | 213,752 | |
| | 200,000 | | | Corp Nacional del Cobre de Chile (Chile)
Senior Unsecured Notes
3.875%, 11/03/21 | | | 218,887 | |
| | | | Ecolab
Senior Unsecured Notes | | | | |
| | 225,000 | | | 2.375%, 12/08/14 | | | 233,289 | |
| | 200,000 | | | 1.000%, 08/09/15 | | | 201,046 | |
| | 200,000 | | | Inversiones CMPC (Chile)
Senior Unsecured Notes
4.500%, 04/25/22 | | | 210,465 | |
| | | | Inversiones CMPC | | | | |
| | 100,000 | | | 4.875%, 06/18/13 | | | 101,987 | |
| | 150,000 | | | 4.500%, 04/25/22 (c) | | | 157,849 | |
| | 250,000 | | | Senior Unsecured Notes
4.750%, 01/19/18 | | | 270,119 | |
| | 600,000 | | | Mexichem SAB de CV (Mexico)
Senior Unsecured Notes
4.875%, 09/19/22 (c) | | | 636,000 | |
| | | | POSCO (South Korea)
Senior Unsecured Notes | | | | |
| | 100,000 | | | 4.250%, 10/28/20 (c) | | | 107,610 | |
| | 250,000 | | | 5.250%, 04/14/21 (c) | | | 290,273 | |
| | 375,000 | | | Teck Resources (Canada)
5.400%, 02/01/43 | | | 379,062 | |
| | | | | | | | |
| | | | | | | 3,971,190 | |
| | | | | | | | |
| | |
| | | | Telecommunications – 1.53% | | | | |
| | 300,000 | | | AT&T
Senior Unsecured Notes
5.350%, 09/01/40 | | | 368,345 | |
| | 150,000 | | | Axiata SPV1 Labuan (Malaysia)
5.375%, 04/28/20 | | | 170,149 | |
| | 596,000 | | | British Telecom (united Kingdom)
Senior Unsecured Notes
5.950%, 01/15/18 | | | 716,140 | |
| | 125,000 | | | Deutsche Telekom International Finance BV (Netherlands)
8.750%, 06/15/30 | | | 193,055 | |
| | 300,000 | | | France Telecom (France)
Senior Unsecured Notes
2.750%, 09/14/16 | | | 316,908 | |
| | | | Globo Comunicacao e Participacoes
(Brazil) | | | | |
| | 300,000 | | | 6.250%, 07/20/15 (f) | | | 327,000 | |
| | 200,000 | | | 5.307%, 05/11/22 (c) (f) | | | 222,500 | |
| | 100,000 | | | Koninklijke KPN NV (Netherlands)
Senior Unsecured Notes
8.375%, 10/01/30 | | | 135,739 | |
See accompanying Notes to Financial Statements.
| | |
| |
| ASTON/DoubleLine Core Plus Fixed Income Fund | | October 31, 2012 |
| |
| Schedule of Investments – continued | | |
| | | | | | | | |
Par Value | | | | | Market
Value | |
| | |
| | | | Telecommunications (continued) | | | | |
| | $ 250,000 | | | Vimpel Communications Via VIP Finance (Ireland)
Senior Unsecured Notes
8.375%, 04/30/13 | | $ | 258,170 | |
| | | | | | | | |
| | | | | | | 2,708,006 | |
| | | | | | | | |
| | |
| | | | Transportation Non Rail – 0.89% | | | | |
| | 700,000 | | | Gazprombank OJSC Via GPB Eurobond Finance (Ireland)
Senior Unsecured Notes
7.933%, 06/28/13 | | | 729,767 | |
| | 400,000 | | | Itau Unibanco Holding SA (Brazil)
Subordinated Notes
5.650%, 03/19/22 | | | 427,100 | |
| | | | Transnet SOC (South Africa)
Senior Unsecured Notes | | | | |
| | 200,000 | | | 4.500%, 02/10/16 | | | 212,761 | |
| | 200,000 | | | 4.000%, 07/26/22 (c) | | | 200,500 | |
| | | | | | | | |
| | | | | | | 1,570,128 | |
| | | | | | | | |
| | |
| | | | Utilities – 2.14% | | | | |
| | | | Abu Dhabi National Energy
(United Arab Emirates) Senior Unsecured Notes | | | | |
| | 100,000 | | | 4.750%, 09/15/14 | | | 106,025 | |
| | 400,000 | | | 5.875%, 12/13/21 | | | 478,000 | |
| | 500,000 | | | AES Andres Dominicana (Cayman Islands)
Senior Secured Notes
9.500%, 11/12/20 | | | 553,750 | |
| | 150,000 | | | AES Gener (Chile)
Senior Unsecured Notes
7.500%, 03/25/14 | | | 161,379 | |
| | 400,000 | | | Duke Energy
Senior Unsecured Notes
3.550%, 09/15/21 | | | 429,139 | |
| | 350,000 | | | EGE Haina Finance (Cayman Islands)
Senior Secured Notes
9.500%, 04/26/17 | | | 367,500 | |
| | 200,000 | | | Hongkong Electric Finance
(British Virgin Islands)
4.250%, 12/14/20 | | | 221,220 | |
| | 200,000 | | | Instituto Costarricense de Electricidad (Cost Rica)
Senior Unsecured Notes
6.950%, 11/10/21 (c) | | �� | 223,500 | |
| | | | Midamerican Energy Holdings
Senior Unsecured Notes | | | | |
| | 50,000 | | | 5.950%, 05/15/37 | | | 64,434 | |
| | 375,000 | | | 6.500%, 09/15/37 | | | 518,327 | |
| | 95,969 | | | Nakilat (Qatar)
6.267%, 12/31/33 | | | 118,264 | |
| | 500,000 | | | Southern Power
Senior Unsecured Notes
4.875%, 07/15/15 | | | 550,558 | |
| | | | | | | | |
| | | | | | | 3,792,096 | |
| | | | | | | | |
| | |
| | | | Total Corporate Notes and Bonds
(Cost $55,854,107) | | | 57,783,941 | |
| | | | | | | | |
| | | | | | | | |
Par Value | | | | | Market
Value | |
|
| | COLLATERALIZED MORTGAGE-BACKED SECURITIES – 22.22% | |
| | |
| | $ 1,072,000 | | | American General Mortgage Loan Trust
Series 2010-1A, Class A3
5.650%, 03/25/58 (a) (c) | | $ | 1,118,668 | |
| | 250,000 | | | Banc of America Commercial Mortgage Trust
Series 2007-5, Class AM
5.772%, 02/10/51 (a) | | | 280,840 | |
| | 810,806 | | | Banc of America Funding
Series 2010-R9, Class 3A3
5.500%, 12/26/35 (c) | | | 364,588 | |
| | 1,068,877 | | | Banc of America Funding
Series 2006-B, Class 7A1
5.614%, 03/20/36 (a) | | | 918,890 | |
| | 1,292,917 | | | Banc of America Funding
Series 2012-R4, Class A
0.474%, 03/04/39 (a) (c) (d) | | | 1,234,736 | |
| | 250,000 | | | Banc of America Large Loan Trust
Series 2007-BMB1, Class A2
0.964%, 08/15/29 (a) (c) | | | 246,610 | |
| | 75,000 | | | Banc of America Merrill Lynch Commercial Mortgage
Series 2006-4, Class AM
5.675%, 07/10/46 | | | 84,745 | |
| | 50,000 | | | Banc of America Merrill Lynch Commercial Mortgage
Series 2007-1, Class A4
5.451%, 01/15/49 | | | 58,155 | |
| | 100,000 | | | Banc of America Re-REMIC Trust
Series 2012-CLRN, Class B
1.814%, 08/15/29 (a) (c) | | | 100,743 | |
| | 100,000 | | | Banc of America Re-REMIC Trust
Series 2012-CLRN, Class D
2.914%, 08/15/29 (a) (c) | | | 100,872 | |
| | 638,299 | | | Bear Stearns Asset Backed Securities Trust
Series 2004-AC2, Class 2A
5.000%, 05/25/34 | | | 643,879 | |
| | 125,000 | | | Bear Stearns Commercial Mortgage Securities
Series 2006-PW14, Class AM
5.243%, 12/11/38 | | | 139,529 | |
| | 275,000 | | | Bear Stearns Commercial Mortgage Securities
Series 2007-PW16, Class AM
5.716%, 06/11/40 (a) | | | 309,678 | |
| | 100,000 | | | Bear Stearns Commercial Mortgage Securities
Series 2005-PWR8, Class A4
4.674%, 06/11/41 | | | 109,264 | |
| | 25,000 | | | Bear Stearns Commercial Mortgage Securities
Series 2006-PW13, Class AM
5.582%, 09/11/41 (a) | | | 28,170 | |
| | 100,000 | | | Bear Stearns Commercial Mortgage Securities
Series 2006-T24, Class AM
5.568%, 10/12/41 (a) | | | 113,689 | |
See accompanying Notes to Financial Statements.
| | |
| |
| ASTON/DoubleLine Core Plus Fixed Income Fund | | October 31, 2012 |
| |
| Schedule of Investments – continued | | |
| | | | | | | | |
Par Value | | | | | Market
Value | |
| | $ 100,000 | | | Bear Stearns Commercial Mortgage Securities
Series 2005-T18, Class AJ
5.005%, 02/13/42 (a) | | $ | 106,362 | |
| | 200,000 | | | Bear Stearns Commercial Mortgage Securities
Series 2007-PW17, Class AM
5.894%, 06/11/50 (a) | | | 224,300 | |
| | 431,338 | | | Citicorp Mortgage Securities
Series 2007-2, Class 3A1
5.500%, 02/25/37 | | | 436,863 | |
| | 50,000 | | | Citigroup Commercial Mortgage Trust
Series 2005-C3, Class AM
4.830%, 05/15/43 (a) | | | 53,666 | |
| | 1,000,000 | | | Citigroup Commercial Mortgage Trust
Series 2012-GC8, Class XA
2.268%, 09/10/45 (a) (b) (c) | | | 137,030 | |
| | 130,000 | | | Citigroup Commercial Mortgage Trust Series 2006-C5, Class AM
5.462%, 10/15/49 | | | 146,770 | |
| | 175,000 | | | Citigroup Commercial Mortgage Trust
Series 2007-C6, Class AM
5.699%, 12/10/49 (a) | | | 194,137 | |
| | 250,000 | | | Citigroup Commercial Mortgage Trust
Series 2008-C7, Class AM
6.061%, 12/10/49 (a) | | | 278,360 | |
| | 100,000 | | | Citigroup Commercial Mortgage Trust
Series 2008-C7, Class A4,
6.061%, 12/10/49 (a) | | | 121,381 | |
| | 7,240,376 | | | Citigroup/Deutsche Bank Commercial Mortgage Trust
Series 2007-CD5, Class XP
0.170%, 11/15/44 (a) (b) (c) | | | 28,209 | |
| | 60,000 | | | Citigroup/Deutsche Bank Commercial Mortgage Trust
Series 2007-CD4, Class A4
5.322%, 12/11/49 | | | 69,270 | |
| | 340,000 | | | Citigroup/Deutsche Bank Commercial Mortgage Trust
Series 2007-CD4, Class AMFX
5.366%, 12/11/49 (a) | | | 354,786 | |
| | 1,200,313 | | | Citimortgage Alternative Loan Trust
Series 2007-A4, Class 1A13
5.750%, 04/25/37 | | | 929,476 | |
| | 200,000 | | | Commercial Mortgage Pass Through Certificates
Series 2007-TFLA, Class B
0.364%, 02/15/22 (a) (c) | | | 193,591 | |
| | 150,000 | | | Commercial Mortgage Pass Through Certificates
Series 2012-FL2, Class GPI
3.714%, 09/17/29 (a) (c) (d) (e) | | | 149,588 | |
| | 300,000 | | | Commercial Mortgage Pass Through Certificates
Series 2006-C3, Class AM
5.805%, 06/15/38 (a) | | | 330,655 | |
| | 275,000 | | | Commercial Mortgage Pass Through Certificates
Series 2006-C4, Class AM
5.509%, 09/15/39 | | | 290,847 | |
| | | | | | | | |
Par Value | | | | | Market
Value | |
| | $ 175,000 | | | Commercial Mortgage Pass Through Certificates
Series 2006-C5, Class AM
5.343%, 12/15/39 | | $ | 187,933 | |
| | 2,000,000 | | | Commercial Mortgage Pass Through Certificates
Series 2012-CR3, Class XA
2.382%, 11/15/45 (a) (b) | | | 291,899 | |
| | 50,000 | | | Commercial Mortgage Pass Through Certificates
Series 2006-C7, Class AM
5.773%, 06/10/46 (a) | | | 54,397 | |
| | 182,678 | | | Commercial Mortgage Pass Through Certificates
Series 2010-C1, Class XPA
2.379%, 07/10/46 (a) (b) (c) | | | 11,042 | |
| | 1,754,531 | | | Countrywide Alternative Loan Trust
Series 2005-J8, Class 1A5
5.500%, 07/25/35 | | | 1,655,478 | |
| | 2,318,030 | | | Countrywide Alternative Loan Trust
Series 2005-86CB, Class A5
5.500%, 02/25/36 | | | 1,825,972 | |
| | 623,019 | | | Countrywide Alternative Loan Trust
Series 2006-J1, Class 2A1
7.000%, 02/25/36 | | | 307,534 | |
| | 140,906 | | | Countrywide Alternative Loan Trust
Series 2007-18CB, Class 2A17
6.000%, 08/25/37 | | | 115,724 | |
| | 535,902 | | | Countrywide Alternative Loan Trust
Series 2007-23CB, Class A3
0.711%, 09/25/37 (a) | | | 305,331 | |
| | 511,697 | | | Countrywide Alternative Loan Trust
Series 2007-23CB, Class A4
6.284%, 09/25/37 (a) (b) | | | 125,759 | |
| | 51,460 | | | Countrywide Home Loan Mortgage Pass Through Trust
Series 2005-16, Class A8
1.117%, 09/25/35 (a) | | | 51,340 | |
| | 1,247,177 | | | Countrywide Home Loan Mortgage Pass Through Trust
Series 2005-HYB8, Class 4A1
4.779%, 12/20/35 (a) | | | 928,316 | |
| | 1,198,975 | | | Countrywide Home Loan Mortgage Pass Through Trust
Series 2007-2, Class A13
6.000%, 03/25/37 | | | 1,054,390 | |
| | 278,984 | | | Countrywide Home Loan Mortgage Pass Through Trust
Series 2007-7, Class A4
5.750%, 06/25/37 | | | 258,296 | |
| | 100,000 | | | Credit Suisse First Boston Mortgage Securities
Series 1998 -C2 Class F
6.750%, 11/15/30 (a) (c) | | | 107,335 | |
| | 4,271,819 | | | Credit Suisse First Boston Mortgage Securities
Series 1997-C2, Class AX
0.159%, 01/17/35 (a) (b) | | | 6,335 | |
See accompanying Notes to Financial Statements.
| | |
| |
| ASTON/DoubleLine Core Plus Fixed Income Fund | | October 31, 2012 |
| |
| Schedule of Investments – continued | | |
| | | | | | | | |
Par Value | | | | | Market
Value | |
| | $ 174,533 | | | Credit Suisse First Boston Mortgage Securities
Series 2005-8, Class 9A4
5.500%, 09/25/35 | | $ | 165,787 | |
| | 158,362 | | | Credit Suisse Mortgage Capital Certificates
Series 2006-TF2A, Class A2
0.384%, 10/15/21 (a) (c) | | | 154,713 | |
| | 704,145 | | | Credit Suisse Mortgage Capital Certificates
Series 2006-7, Class 1A3
5.000%, 08/25/36 | | | 583,045 | |
| | 503,133 | | | Credit Suisse Mortgage Capital Certificates
Series 2009-13R, Class 2A1
6.000%, 01/26/37 (c) | | | 522,996 | |
| | 1,823,117 | | | Credit Suisse Mortgage Capital Certificates
Series 2007-1, Class 5A4
6.000%, 02/25/37 | | | 1,570,269 | |
| | 150,000 | | | Credit Suisse Mortgage Capital Certificates
Series 2010-RR2, Class 3B
5.342%, 12/15/43 (a) (c) | | | 160,857 | |
| | 250,000 | | | Credit Suisse Mortgage Capital Certificates
Series 2009-RR2, Class IQB
5.695%, 04/16/49 (a) (c) | | | 277,302 | |
| | 150,000 | | | CW Capital Cobalt Commercial Mortgage Trust
Series 2007-C2, Class AMFX
5.526%, 04/15/47 (a) | | | 162,994 | |
| | 200,000 | | | DBRR Trust
Series 2012-EZ1, Class A
0.946%, 09/25/45 (c) (d) | | | 200,213 | |
| | 250,000 | | | DBRR Trust
Series 2011-C32, Class A3B
5.750%, 06/17/49 (a) (c) | | | 279,426 | |
| | 96,396 | | | Extended Stay America Trust
Series 2010-ESHA, Class A
2.951%, 11/05/27 (c) | | | 96,848 | |
| | 275,000 | | | Fontainebleau Miami Beach Trust
Series 2001-FBLU, Class C
4.270%, 05/05/27 (c) | | | 288,729 | |
| | 100,000 | | | Fontainebleau Miami Beach Trust
Series 2012-FBLU, Class E
5.253%, 05/05/27 (c) | | | 105,695 | |
| | 100,000 | | | GE Capital Commercial Mortgage
Series 2005-C2, Class B
5.113%, 05/10/43 (a) | | | 103,930 | |
| | 50,000 | | | GMAC Commercial Mortgage Securities
Series 2006-C1, Class AM
5.290%, 11/10/45 (a) | | | 54,040 | |
| | 100,000 | | | GMAC Commercial Mortgage Securities
Series 2006-C1 Class AJ
5.349%, 11/10/45 (a) | | | 83,391 | |
| | 50,000 | | | Greenwich Capital Commercial Funding
Series 2007-GG9, Class A4
5.444%, 03/10/39 | | | 57,896 | |
| | | | | | | | |
Par Value | | | | | Market
Value | |
| | $ 250,000 | | | Greenwich Capital Commercial Funding
Series 2007-GG9, Class AMFX
5.475%, 03/10/39 | | $ | 269,398 | |
| | 250,000 | | | Greenwich Capital Commercial Funding
Series 2007-GG11, Class AM
5.867%, 12/10/49 (a) | | | 274,832 | |
| | 200,000 | | | GS Mortgage Securities Corp II
Series 2007-EOP, Class A2
1.260%, 03/06/20 (a) (c) | | | 199,967 | |
| | 100,000 | | | GS Mortgage Securities Corp II
Series 2006-GG6, Class AM
5.622%, 04/10/38 (a) | | | 110,173 | |
| | 100,000 | | | GS Mortgage Securities Corp II
Series 2004-GG2, Class A6
5.396%, 08/10/38 (a) | | | 106,900 | |
| | 75,000 | | | GS Mortgage Securities Corp II
Series 2006-GG8, Class A4
5.560%, 11/10/39 | | | 87,110 | |
| | 1,077,105 | | | GSR Mortgage Loan Trust
Series 2006-AR1, Class 3A1
4.786%, 01/25/36 (a) | | | 978,086 | |
| | 182,959 | | | HSBC Asset Loan Obligation
Series 2007-2, Class 1A1
5.500%, 09/25/37 | | | 183,471 | |
| | 40,000 | | | JPMorgan Chase Commercial Mortgage
Securities
Series 2006-CB16, Class A4
5.552%, 05/12/45 | | | 46,274 | |
| | 2,579,337 | | | JPMorgan Chase Commercial Mortgage
Securities
Series 2006-LDP8, Class X
0.542%, 05/15/45 (a) (b) | | | 42,560 | |
| | 995,143 | | | JPMorgan Chase Commercial Mortgage
Securities
Series 2012-CBX, Class XA
2.058%, 06/15/45 (a) (b) | | | 117,698 | |
| | 2,500,000 | | | JPMorgan Chase Commercial Mortgage Securities
Series 2012-C8, Class XA
2.380%, 10/15/45 (a) (b) | | | 340,874 | |
| | 1,276,481 | | | JPMorgan Chase Commercial Mortgage Securities
Series 2011-C4, Class XA
1.598%, 07/15/46 (a) (b) (c) | | | 90,655 | |
| | 350,000 | | | JPMorgan Chase Commercial Mortgage Securities
Series 2007-CB17 Class AM
5.728%, 02/12/49 (a) | | | 370,319 | |
| | 175,000 | | | JPMorgan Chase Commercial Mortgage Securities
Series 2009-RR2, Class GEB
5.543%, 12/17/49 (c) (d) | | | 189,333 | |
| | 50,000 | | | JPMorgan Chase Commercial Mortgage Securities
Series 2007-CB20, Class A4
5.794%, 02/12/51 (a) | | | 59,947 | |
See accompanying Notes to Financial Statements.
| | |
| |
| ASTON/DoubleLine Core Plus Fixed Income Fund | | October 31, 2012 |
| |
| Schedule of Investments – continued | | |
| | | | | | | | |
Par Value | | | | | Market
Value | |
| | $ 250,000 | | | JPMorgan Chase Commercial Mortgage Securities
Series 2007-CB20, Class AM
5.882%, 02/12/51 (a) | | $ | 287,708 | |
| | 50,000 | | | JPMorgan Chase Commercial Mortgage Securities
Series 2007-C1, Class A4
5.716%, 02/15/51 | | | 59,668 | |
| | 98,157 | | | JPMorgan Chase Commercial Mortgage Securities
Series 2007-C1, Class ASB
5.857%, 02/15/51 | | | 106,780 | |
| | 250,000 | | | JPMorgan Chase Commercial Mortgage Securities
Series 2007-LD12, Class AM
6.043%, 02/15/51 (a) | | | 272,269 | |
| | 250,000 | | | LB Commercial Mortgage Trust
Series 2007-C3, Class AMFL
5.889%, 07/15/44 (a) (c) | | | 277,328 | |
| | 70,202 | | | LB-UBS Commercial Mortgage Trust
Series 2004-C1, Class A3
4.361%, 01/15/29 | | | 71,228 | |
| | 100,000 | | | LB-UBS Commercial Mortgage Trust
Series 2003-C7, Class D
5.038%, 07/15/37 (a) | | | 103,355 | |
| | 100,000 | | | LB-UBS Commercial Mortgage Trust
Series 2006-C7 Class AJ
5.407%, 11/15/38 | | | 69,547 | |
| | 350,000 | | | LB-UBS Commercial Mortgage Trust
Series 2006-C6, Class AM
5.413%, 09/15/39 | | | 398,913 | |
| | 50,000 | | | LB-UBS Commercial Mortgage Trust
Series 2005-C3, Class AM
4.794%, 07/15/40 | | | 54,090 | |
| | 7,236,910 | | | LB-UBS Commercial Mortgage Trust
Series 2007-C7, Class XCL
0.082%, 09/15/45 (a) (b) (c) | | | 67,636 | |
| | 250,000 | | | Merrill Lynch Mortgage Trust
Series 2005-CIP1, Class AM
5.107%, 07/12/38 (a) | | | 274,760 | |
| | 50,000 | | | Merrill Lynch Mortgage Trust
Series 2006-C1, Class AM
5.685%, 05/12/39 (a) | | | 56,037 | |
| | 997,111 | | | Morgan Stanley Bank of America Merrill Lynch Trust
Series 2012-C5, Class XA
1.941%, 08/15/45 (a) (b) (c) | | | 114,318 | |
| | 250,000 | | | Morgan Stanley Capital I
Series 2007-IQ13, Class AM
5.406%, 03/15/44 | | | 266,269 | |
| | 31,464 | | | Morgan Stanley Capital I
Series 2006-HQ9, Class AAB
5.685%, 07/12/44 | | | 32,191 | |
| | 50,000 | | | Morgan Stanley Capital I
Series 2006-HQ9, Class AM
5.773%, 07/12/44 (a) | | | 56,314 | |
| | 1,467,549 | | | Morgan Stanley Capital I
Series 2011-C1, Class XA
0.969%, 09/15/47 (a) (b) (c) | | | 50,554 | |
| | | | | | | | |
Par Value | | | | | Market
Value | |
| | $7,244,413 | | | Morgan Stanley Capital I
Series 2007-1Q16, Class X2
0.224%, 12/12/49 (a) (b) (c) | | $ | 48,820 | |
| | 250,000 | | | Morgan Stanley Capital I
Series 2007-IQ16, Class AM
6.102%, 12/12/49 (a) | | | 289,444 | |
| | 1,390,842 | | | Morgan Stanley Mortgage Loan Trust
Series 2005-3AR, Class 2A2
2.745%, 07/25/35 (a) | | | 1,151,099 | |
| | 200,000 | | | Morgan Stanley Re-REMIC Trust
Series 2010-HQ4, Class AJ
4.970%, 04/15/40 (c) | | | 210,201 | |
| | 100,000 | | | Morgan Stanley Re-REMIC Trust
Series 2010-GG10, Class A4A
5.789%, 08/15/45 (a) (c) | | | 118,408 | |
| | 300,000 | | | Nomura Asset Acceptance
Series 2005-AP3, Class A3
5.318%, 08/25/35 (a) | | | 212,656 | |
| | 792,487 | | | Prime Mortgage Trust
Series 2006-DR1, Class 2A1
5.500%, 05/25/35 (c) | | | 775,259 | |
| | 298,461 | | | Residential Asset Securitization Trust
Series 2006-A6, Class 1A1
6.500%, 07/25/36 | | | 198,292 | |
| | 783,535 | | | Residential Asset Securitization Trust
Series 2007-A1, Class A8
6.000%, 03/25/37 | | | 594,708 | |
| | 7,286 | | | Rialto Real Estate Fund LP
Series 2012-LT1A, Class A
4.750%, 02/15/25 (c) | | | 7,290 | |
| | 554,535 | | | Structured Adjustable Rate Mortgage Loan Trust
Series 2006-1, Class 2A2
4.515%, 02/25/36 (a) | | | 445,395 | |
| | 233,790 | | | Structured Asset Securities
Series 2005-10, Class 1A1
5.750%, 06/25/35 | | | 234,954 | |
| | 100,000 | | | TIAA Seasoned Commercial Mortgage Trust
Series 2007-C4 Class AJ
5.585%, 08/15/39 (a) | | | 109,268 | |
| | 2,000,000 | | | UBS-Barclays Commercial Mortgage Trust
Series 2012-C3, Class XA
2.210%, 08/10/49 (a) (b) (c) | | | 286,634 | |
| | 25,000 | | | Wachovia Bank Commercial Mortgage Trust
Series 2005-C22, Class AM 5.344%, 12/15/44 (a) | | | 27,365 | |
| | 200,000 | | | Wachovia Bank Commercial Mortgage Trust
Series 2006-C23, Class AM 5.466%, 01/15/45 (a) | | | 223,020 | |
| | 250,000 | | | Wachovia Bank Commercial Mortgage Trust
Series 2007-C33, Class AM 5.923%, 02/15/51 (a) | | | 277,797 | |
See accompanying Notes to Financial Statements.
| | |
| |
| ASTON/DoubleLine Core Plus Fixed Income Fund | | October 31, 2012 |
| |
| Schedule of Investments – continued | | |
| | | | | | | | |
Par Value | | | | | Market
Value | |
| | $1,021,059 | | | Wachovia Mortgage Loan Trust
Series 2005-A, Class 2A1
2.628%, 08/20/35 (a) | | $ | 920,713 | |
| | 554,739 | | | Wells Fargo Alternative Loan Trust
Series 2007-PA2, Class 1A1
6.000%, 06/25/37 | | | 497,788 | |
| | 1,246,749 | | | Wells Fargo Mortgage Backed Securities Trust
Series 2006-AR2, Class 2A5
2.629%, 03/25/36 (a) | | | 1,167,886 | |
| | 918,275 | | | Wells Fargo Mortgage Backed Securities Trust
Series 2007-8, Class 1A16
6.000%, 07/25/37 | | | 902,483 | |
| | 875,790 | | | Wells Fargo Mortgage Backed Securities Trust
Series 2007-8, Class 2A2
6.000%, 07/25/37 | | | 867,656 | |
| | 827,782 | | | Wells Fargo Mortgage Backed Securities Trust
Series 2007-13, Class A6
6.000%, 09/25/37 | | | 825,736 | |
| | 407,262 | | | Wells Fargo Mortgage Loan Trust
Series 2012-RR1 Class A1
2.847%, 08/27/37 (a) (c) | | | 411,358 | |
| | 998,970 | | | WF-RBS Commercial Mortgage Trust Series 2012-C8, Class XA
2.259%, 08/15/45 (a) (b) (c) | | | 138,225 | |
| | 1,500,000 | | | WF-RBS Commercial Mortgage Trust Series 2012-C9, Class XA
2.451%, 11/15/45 (a) (b) (c) (d) | | | 218,907 | |
| | | | | | | | |
| | |
| | | | Total Collateralized Mortgage-Backed Securities
(Cost $37,224,507) | | | 39,301,483 | |
| | | | | | | | |
| |
| | ASSET-BACKED SECURITIES – 0.96% | | | | |
| | |
| | 100,000 | | | Credit-Based Asset Servicing and Securitization
Series 2007-MX1, Class A4
6.231%, 12/25/36 (c) (f) | | | 68,791 | |
| | 61,261 | | | Crest
Series 2003-2A, Class A1
0.842%, 12/28/18 (a) (c) (d) | | | 58,198 | |
| | 757,000 | | | GSAA Trust
Series 2006-15, Class AF3B
5.933%, 09/25/36 (a) | | | 153,511 | |
| | 472,916 | | | Residential Asset Mortgage Products
Series 2006-RS5, Class A3
0.381%, 09/25/36 (a) | | | 378,663 | |
| | 500,000 | | | Residential Asset Securities
Series 2004-KS6, Class A15
5.850%, 07/25/34 (a) | | | 430,021 | |
| | 640,584 | | | Series 2005-KS4, Class M1
0.621%, 05/25/35 (a) | | | 616,356 | |
| | | | | | | | |
| | |
| | | | Total Asset-Backed Securities
(Cost $1,658,302) | | | 1,705,540 | |
| | | | | | | | |
| | | | | | | | |
Par Value | | | | | Market
Value | |
|
| | FOREIGN GOVERNMENT BONDS – 2.69% | |
| | |
| | $ 300,000 | | | Banco Latinoamericano de Comercio Exterior Senior Unsecured Notes
3.750%, 04/04/17 (c) | | $ | 311,250 | |
| | 600,000 | | | Corp Andina de Fomento
Senior Unsecured Notes
3.750%, 01/15/16 | | | 632,963 | |
| | 600,000 | | | Costa Rica Government International Bond Senior Unsecured Notes
6.548%, 03/20/14 | | | 633,000 | |
| | 526,000 | | | Mexico Government International Bond
Senior Unsecured Notes
5.625%, 01/15/17 | | | 617,524 | |
| | 200,000 | | | Panama Government International Bond Senior Unsecured Notes
7.250%, 03/15/15 | | | 228,500 | |
| | 400,000 | | | Qatar Government International Bond
4.500%, 01/20/22 | | | 460,000 | |
| | 300,000 | | | Qatar Government International Bond Senior Unsecured Notes
4.000%, 01/20/15 | | | 319,050 | |
| | 199,375 | | | Ras Laffan Liquefied Natural Gas II
Senior Secured Notes
5.298%, 09/30/20 | | | 225,792 | |
| | 250,000 | | | Ras Laffan Liquefied Natural Gas III
5.838%, 09/30/27 | | | 305,000 | |
| | 161,600 | | | Ras Laffan Liquefied Natural Gas III
Senior Secured Notes
5.832%, 09/30/16 | | | 178,730 | |
| | 250,000 | | | Wakala Global Sukuk
2.991%, 07/06/16 | | | 261,590 | |
| | 500,000 | | | Wakala Global Sukuk
4.646%, 07/06/21 | | | 575,603 | |
| | | | | | | | |
| | |
| | | | Total Foreign Government Bonds
(Cost $4,576,003) | | | 4,749,002 | |
| | | | | | | | |
Shares | | | | | | |
|
| | INVESTMENT COMPANY – 2.25% | |
| | |
| | 3,970,786 | | | BlackRock Liquidity Funds TempCash Portfolio (g) | | | 3,970,786 | |
| | | | | | | | |
| | |
| | | | Total Investment Company
(Cost $3,970,786) | | | 3,970,786 | |
| | | | | | | | |
| Total Investments – 98.90%
(Cost $169,804,168)* | | | 174,931,710 | |
| | | | | | | | |
| Net Other Assets and Liabilities – 1.10% | | | 1,949,868 | |
| | | | | | | | |
| Net Assets – 100.00% | | $ | 176,881,578 | |
| | | | | | | | |
See accompanying Notes to Financial Statements.
| | |
| |
| ASTON/DoubleLine Core Plus Fixed Income Fund | | October 31, 2012 |
| |
| Schedule of Investments – continued | | |
| * | | Aggregate cost for Federal income tax purposes is $170,217,622. |
| | | | |
Gross unrealized appreciation | | $ | 5,963,093 | |
Gross unrealized depreciation | | | (1,249,005 | ) |
| | | | |
Net unrealized appreciation | | $ | 4,714,088 | |
| | | | |
| (a) | | Variable rate bond. The interest rate shown reflects the rate in effect at October 31, 2012. |
| (b) | | Interest only security. This type of security represents the right to receive the monthly interest payments on an underlying pool of mortgages. Payments of principal on the pool reduce the value of the “interest only” holding. |
| (c) | | Securities exempt from registration under Rule 144A of the Securities Act of 1933, as amended. These securities are purchased in accordance with guidelines approved by the Fund’s Board of Trustees and may only be resold, in transactions exempt from registration, to qualified institutional buyers. At October 31, 2012, these securities amounted to $16,716,963 or 9.45% of net assets. These securities have been determined by the Subadviser to be liquid securities. |
| (d) | | Securities with a total aggregate market value of $3,204,550 or 1.81% of net assets, were valued under the fair value procedures established by the Funds’ Board of Trustees. |
| (e) | | Delayed delivery security. See Note (B-3) in the Notes to Financial Statements. |
| (f) | | Step Coupon. Security becomes interest bearing at a future date. |
| (g) | | Security with a market value of $1,036,719 has been pledged as collateral for delayed delivery securities. |
| REIT | | Real Estate Investment Trust |
| REMIC | | Real Estate Mortgage Investment Conduit |
| STRIP | | Separate Trading of Registered Interest and Principal |
| | | | |
Portfolio Composition | | | | |
U.S. Government Obligations | | | 18% | |
U.S. Government Agency Obligations | | | 20% | |
Corporate Notes and Bonds | | | | |
(S&P Ratings unaudited) | | | | |
AAA | | | 5% | |
AA | | | 6% | |
A | | | 13% | |
BBB | | | 20% | |
BB | | | 1% | |
B | | | 3% | |
Lower than B | | | 11% | |
Not Rated | | | 3% | |
| | | | |
| | | 100% | |
| | | | |
See accompanying Notes to Financial Statements.
ASTON/TCH Fixed Income Fund
| | |
| |
| Portfolio Manager Commentary (unaudited) | | October 31, 2012 |
| Tere Alvarez Canida, CFA; Alan M. Habacht & William J. Canida, CFA |
| Q. | What were the most significant market factors affecting Fund performance and returns relative to the benchmark during the past 12 months? |
| A. | During the fiscal year ended October 31, 2012, sector, quality and yield curve selection benefitted the portfolio. The Fund is overweight credit securities, which outperformed duration matched Treasuries by 525 basis points. In addition, the portfolio is underweight Treasury securities, which by contrast were the worst performing sector during the year. Moreover, the majority of the Fund’s Treasury exposure is in the form of Treasury Inflation-Protected Securities (TIPS), which outperformed nominals during the year, returning 8.03% compared to 3.66% for nominal Treasuries. |
Our decision to overweight lower quality investment grade securities also benefitted the Fund, as lower quality investment grade securities outperformed during the year. BBB rated securities generated 669 basis points of excess return, outperforming AAA, AA and A rated securities by 578, 383 and 109 basis points, respectively, on a duration-adjusted basis.
Portfolio structure also had a positive effect on the Fund’s return. The portfolio is structured in a barbelled fashion emphasizing high quality floating rate notes on the short end of the yield curve and lower quality investment grade securities on the long end. During the year, longer duration credit securities outperformed as credit curves flattened. In the trailing twelve months, long credit outperformed intermediate credit by 708 basis points. Looking closer at structure, long BBB rated securities outperformed intermediate AAA securities by 1333 basis points.
| Q. | What were the best performing holdings for the Fund during the period? |
| A. | The best performing holdings within the Fund were longer-dated, lower quality, investment grade credit securities. In addition, our exposure to TIPS benefitted the Fund as TIPS outperformed nominal Treasuries by 437 basis points during the year. |
| Q. | What were the weakest performing holdings? |
| A. | Our exposure to floating rate notes underperformed in the declining interest rate environment. Despite their underperformance, floating rate notes provide a hedge against rising inflation risk overtime. |
| Q. | How was the Fund positioned as of October 31, 2012? |
| A. | We still favor a barbell portfolio structure in order to capture the steepness of the U.S. Treasury curve. At the same time, supply and demand factors for investment grade credit appear favorable, in our view, particularly given the amount of additional spread earned over U.S. Treasury securities remains generous by historical standards. TIPS also remain an attractive asset class which aligns investors with Federal Reserve purchase programs and provide a hedge against rising inflation expectations. |
Note: Bond funds have the same interest rate, high yield and credit risks associated with the underlying bonds in the portfolio, all of which could reduce the Fund’s value. As interest rates rise, the value of the Fund can decline and an investor can lose principal.
Growth of a Hypothetical
$10,000 Investment—Class N
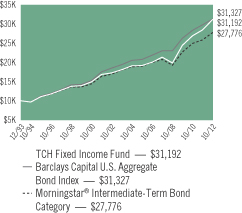
All dividends and capital gains are reinvested. Indexes are unmanaged and do not take into account fees, expenses or other costs.
Returns shown in the chart and table do not reflect taxes that a shareholder would pay on Fund distributions or on the sale of the Fund shares.
RETURNSFOR PERIOD ENDED 10/31/12
Average Annual Total Returns - Class N
| | | | |
One Year | | | 9.74 | % |
Five Year | | | 7.86 | % |
Ten Year | | | 6.07 | % |
Since Inception | | | 6.21 | % |
Inception Date 12/13/93
Average Annual Total Returns - Class I
| | | | |
One Year | | | 9.93 | % |
Five Year | | | 8.06 | % |
Ten Year | | | 6.30 | % |
Since Inception | | | 6.68 | % |
Inception Date 07/31/00
The performance data quoted represents past performance. Past performance does not guarantee future results. Investment return and principal value will fluctuate so that an investor’s shares, upon redemption, may be worth more or less than their original cost. Current performance may be lower or higher than the performance data quoted. For performance data current to the most recent month-end, please visit our website at www.astonfunds.com.
The total expense ratio for the Class N and Class I Shares is 1.15% and 0.90%, respectively, as disclosed in the prospectus dated March 1, 2012. Please refer to the Financial Highlights section in this report for more 2012 fiscal year-end related information.
The performance quoted would have been lower if fee waivers and/or expense reimbursements had not been in effect.
| | |
| |
| ASTON/TCH Fixed Income Fund | | October 31, 2012 |
| |
| Schedule of Investments | | |
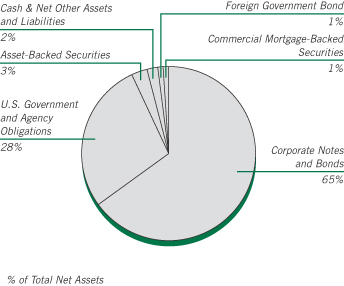
| | | | | | | | |
Par Value | | | | | Market
Value | |
|
| | CORPORATE NOTES AND BONDS – 64.64% | |
| | |
| | | | Consumer Discretionary – 3.92% | | | | |
| | $1,000,000 | | | Limited Brands
Senior Unsecured Notes
7.600%, 07/15/37 | | $ | 1,036,249 | |
| | 100,000 | | | Macy’s Retail Holdings
7.875%, 07/15/15 (a) | | | 117,678 | |
| | 500,000 | | | QVC
5.125%, 07/02/22 (b) | | | 523,313 | |
| | 250,000 | | | Staples
9.750%, 01/15/14 | | | 274,695 | |
| | 450,000 | | | Whirlpool, MTN
Unsecured Notes
8.600%, 05/01/14 | | | 498,922 | |
| | 250,000 | | | Wyndham Worldwide
Senior Unsecured Notes
7.375%, 03/01/20 | | | 300,039 | |
| | | | | | | | |
| | | | | | | 2,750,896 | |
| | | | | | | | |
| | |
| | | | Consumer Staples – 4.14% | | | | |
| | | | Altria Group | | | | |
| | 500,000 | | | 8.500%, 11/10/13 | | | 539,011 | |
| | 200,000 | | | 10.200%, 02/06/39 | | | 351,665 | |
| | 250,000 | | | Corn Products International
Senior Unsecured Notes
6.625%, 04/15/37 | | | 314,092 | |
| | 200,000 | | | Kellogg
Senior Unsecured Notes
5.125%, 12/03/12 | | | 200,740 | |
| | 150,000 | | | PepsiCo
Senior Unsecured Notes
7.900%, 11/01/18 | | | 204,697 | |
| | 500,000 | | | Ralcorp Holdings
6.625%, 08/15/39 | | | 539,433 | |
| | 200,000 | | | Reynolds American
7.750%, 06/01/18 | | | 252,286 | |
| | | | | | | | |
Par Value | | | | | Market
Value | |
| | |
| | | | Consumer Staples (continued) | | | | |
| | $ 500,000 | | | Walgreen
Senior Unsecured Notes
0.899%, 03/13/14 (c) | | $ | 501,564 | |
| | | | | | | | |
| | | | | | | 2,903,488 | |
| | | | | | | | |
| | |
| | | | Energy – 9.97% | | | | |
| | | | Chesapeake Energy
| | | | |
| | 500,000 | | | 6.775%, 03/15/19 | | | 501,874 | |
| | 250,000 | | | 6.625%, 08/15/20 | | | 263,750 | |
| | 250,000 | | | 6.125%, 02/15/21 | | | 254,375 | |
| | 500,000 | | | Dolphin Energy (United Arab Emirates)
5.500%, 12/15/21 (b) | | | 580,500 | |
| | 500,000 | | | Ecopetrol SA (Colombia)
Senior Unsecured Notes
7.625%, 07/23/19 | | | 650,000 | |
| | 250,000 | | | El Paso Pipeline Partners Operating
7.500%, 11/15/40 | | | 347,226 | |
| | 250,000 | | | Energy Transfer Partners
Senior Unsecured Notes
9.000%, 04/15/19 | | | 328,656 | |
| | 400,000 | | | Hess
Senior Unsecured Notes
8.125%, 02/15/19 | | | 533,439 | |
| | 400,000 | | | Kinder Morgan Energy Partners
Senior Unsecured Notes
9.000%, 02/01/19 | | | 541,770 | |
| | 250,000 | | | Markwest Energy Partners LP/Markwest Energy Finance
5.500%, 02/15/23 | | | 263,750 | |
| | 450,000 | | | Nabors Industries
9.250%, 01/15/19 | | | 604,159 | |
| | 250,000 | | | Pride International
Senior Unsecured Notes
6.875%, 08/15/20 | | | 321,694 | |
| | 750,000 | | | Rockies Express Pipeline
Senior Unsecured Notes
6.875%, 04/15/40 (b) | | | 656,250 | |
| | 250,000 | | | Rowan
Senior Unsecured Notes
5.000%, 09/01/17 | | | 274,296 | |
| | 250,000 | | | Valero Energy
9.375%, 03/15/19 | | | 343,872 | |
| | 400,000 | | | Weatherford International (Bermuda)
9.625%, 03/01/19 | | | 530,270 | |
| | | | | | | | |
| | | | | | | 6,995,881 | |
| | | | | | | | |
| | |
| | | | Financials – 22.04% | | | | |
| | 250,000 | | | AFLAC
Senior Unsecured Notes
8.500%, 05/15/19 | | | 339,950 | |
| | 450,000 | | | American Financial Group
Senior Unsecured Notes
9.875%, 06/15/19 | | | 589,573 | |
| | 250,000 | | | Banco Bradesco SA/Cayman Islands (Brazil)
Subordinated Notes
5.750%, 03/01/22 (b) | | | 270,625 | |
See accompanying Notes to Financial Statements.
| | |
| |
| ASTON/TCH Fixed Income Fund | | October 31, 2012 |
| |
| Schedule of Investments – continued | | |
| | | | | | | | |
Par Value | | | | | Market
Value | |
| | |
| | | | Financials (continued) | | | | |
| | | | Bancolombia SA (Colombia)
Senior Unsecured Notes | | | | |
| | $ 250,000 | | | 5.950%, 06/03/21 | | $ | 290,000 | |
| | | | Subordinated Notes | | | | |
| | 250,000 | | | 5.125%, 09/11/22 | | | 262,500 | |
| | 250,000 | | | Berkshire Hathaway Finance
Senior Unsecured Notes
0.868%, 02/11/13 (c) | | | 250,412 | |
| | 150,000 | | | Blackstone Holdings Finance
6.625%, 08/15/19 (b) (d) | | | 175,364 | |
| | 500,000 | | | 6.250%, 08/15/42 (b) | | | 548,558 | |
| | 250,000 | | | Bunge Ltd Finance
8.500%, 06/15/19 | | | 322,798 | |
| | 500,000 | | | Daimler Finance
1.130%, 04/10/14 (b) (c) | | | 501,944 | |
| | 250,000 | | | Discover Bank
Subordinated Notes
7.000%, 04/15/20 | | | 306,663 | |
| | 500,000 | | | Entertainment Properties Trust
5.750%, 08/15/22 | | | 524,531 | |
| | 1,000,000 | | | General Electric Capital, MTN
Senior Unsecured Notes
1.016%, 04/24/14 (c) | | | 1,008,189 | |
| | 800,000 | | | Goldman Sachs Capital I
6.345%, 02/15/34 | | | 825,317 | |
| | 250,000 | | | Goldman Sachs Group
Subordinated Notes
6.750%, 10/01/37 | | | 275,548 | |
| | 500,000 | | | ING US
5.500%, 07/15/22 (b) | | | 544,103 | |
| | | | IPIC, GMTN (Cayman Islands) | | | | |
| | 500,000 | | | 5.000%, 11/15/20 (b) | | | 558,750 | |
| | 500,000 | | | 6.875%, 11/01/41 (b) | | | 686,875 | |
| | 250,000 | | | Itau Unibanco Holding SA (Brazil)
5.500%, 08/06/22 (b) | | | 263,750 | |
| | 200,000 | | | Jefferies Group
Senior Unsecured Notes
8.500%, 07/15/19 | | | 235,000 | |
| | | | Lincoln National
Senior Unsecured Notes | | | | |
| | 250,000 | | | 6.300%, 10/09/37 | | | 294,932 | |
| | 750,000 | | | 7.000%, 06/15/40 | | | 969,569 | |
| | 300,000 | | | Marsh & McLennan
Senior Unsecured Notes
9.250%, 04/15/19 | | | 410,324 | |
| | 750,000 | | | Merrill Lynch, MTN
6.875%, 04/25/18 | | | 906,215 | |
| | 500,000 | | | Morgan Stanley
Senior Unsecured Notes
5.500%, 07/28/21 | | | 556,219 | |
| | 250,000 | | | NASDAQ OMX Group
Senior Unsecured Notes
5.550%, 01/15/20 | | | 272,811 | |
| | 1,000,000 | | | NB Capital Trust II
7.830%, 12/15/26 | | | 1,023,330 | |
| | 250,000 | | | Royal Bank of Canada (Canada)
Senior Unsecured Notes
1.013%, 10/30/14 (c) | | | 252,593 | |
| | | | | | | | |
Par Value | | | | | Market
Value | |
| | |
| | | | Financials (continued) | | | | |
| | $1,000,000 | | | SLM, MTN
Senior Unsecured Notes
5.625%, 08/01/33 | | $ | 940,000 | |
| | 500,000 | | | Unum Group
Senior Unsecured Notes
5.750%, 08/15/42 | | | 551,350 | |
| | 500,000 | | | Wells Fargo
1.287%, 06/26/15 (c) | | | 505,925 | |
| | | | | | | | |
| | | | | | | 15,463,718 | |
| | | | | | | | |
| | |
| | | | Healthcare – 3.23% | | | | |
| | | | Davita | | | | |
| | 125,000 | | | 6.375%, 11/01/18 | | | 133,750 | |
| | 375,000 | | | 6.625%, 11/01/20 | | | 402,187 | |
| | 200,000 | | | Hospira, GMTN
Senior Unsecured Notes
6.400%, 05/15/15 | | | 223,911 | |
| | 250,000 | | | Humana
Senior Unsecured Notes
8.150%, 06/15/38 | | | 345,779 | |
| | 500,000 | | | Lorillard Tobacco
8.125%, 05/01/40 | | | 687,898 | |
| | 200,000 | | | Quest Diagnostics
1.223%, 03/24/14 (c) | | | 201,447 | |
| | 250,000 | | | Watson Pharmaceuticals
Senior Unsecured Notes
4.625%, 10/01/42 | | | 268,854 | |
| | | | | | | | |
| | | | | | | 2,263,826 | |
| | | | | | | | |
| | |
| | | | Industrials – 4.18% | | | | |
| | 370,000 | | | Burlington Northern Santa Fe
Senior Unsecured Notes
7.000%, 02/01/14 | | | 399,083 | |
| | 250,000 | | | FedEx
Senior Notes
8.000%, 01/15/19 | | | 332,280 | |
| | 250,000 | | | Kazakhstan Temir Zholy Finance (Netherlands)
6.950%, 07/10/42 (b) | | | 305,760 | |
| | 500,000 | | | Mexichem SAB de CV (Mexico)
Senior Unsecured Notes
6.750%, 09/19/42 (b) | | | 541,250 | |
| | 175,000 | | | Mondelez International
Senior Unsecured Notes
6.000%, 02/11/13 | | | 177,488 | |
| | 250,000 | | | Transocean (Cayman Islands)
7.350%, 12/15/41 | | | 334,955 | |
| | 250,000 | | | Vale SA (Brazil)
Senior Unsecured Notes
5.625%, 09/11/42 | | | 268,359 | |
| | 250,000 | | | Waste Management
7.375%, 03/11/19 | | | 319,062 | |
| | 250,000 | | | Xstrata Finance Canada (Canada)
4.000%, 10/25/22 (b) | | | 251,368 | |
| | | | | | | | |
| | | | | | | 2,929,605 | |
| | | | | | | | |
See accompanying Notes to Financial Statements.
| | |
| |
| ASTON/TCH Fixed Income Fund | | October 31, 2012 |
| |
| Schedule of Investments – continued | | |
| | | | | | | | |
Par Value | | | | | Market
Value | |
| | |
| | | | Information Technology – 2.65% | | $ | | |
| | $ 500,000 | | | International Business Machines
Senior Unsecured Notes
6.500%, 10/15/13 | | | 529,519 | |
| | 250,000 | | | KLA Instruments
Senior Unsecured Notes
6.900%, 05/01/18 | | | 301,546 | |
| | 200,000 | | | Motorola
Senior Unsecured Notes
6.625%, 11/15/37 | | | 235,655 | |
| | 500,000 | | | Telecom Italia Capital SA (Luxembourg)
7.721%, 06/04/38 | | | 540,585 | |
| | 250,000 | | | Xerox
Senior Unsecured Notes
1.799%, 09/13/13 (c) | | | 252,014 | |
| | | | | | | | |
| | | | | | | 1,859,319 | |
| | | | | | | | |
| | |
| | | | Materials – 4.55% | | | | |
| | | | ArcelorMittal (Luxembourg)
Senior Unsecured Notes | | | | |
| | 750,000 | | | 5.750%, 03/01/21 | | | 724,774 | |
| | 650,000 | | | 7.250%, 10/15/39 | | | 603,988 | |
| | 200,000 | | | Bemis
Senior Unsecured Notes
6.800%, 08/01/19 | | | 244,367 | |
| | 250,000 | | | Braskem America Finance
7.125%, 07/22/41 (b) | | | 282,500 | |
| | 250,000 | | | Dow Chemical (The)
Senior Unsecured Notes
8.550%, 05/15/19 | | | 339,260 | |
| | 250,000 | | | International Paper
Senior Unsecured Notes
8.700%, 06/15/38 | | | 383,891 | |
| | 550,000 | | | Rio Tinto Finance (Australia)
8.950%, 05/01/14 | | | 616,562 | |
| | | | | | | | |
| | | | | | | 3,195,342 | |
| | | | | | | | |
| | |
| | | | Telecommunication Services – 6.47% | | | | |
| | 500,000 | | | British Telecommunications
(United Kingdom)
Senior Unsecured Notes
1.504%, 12/20/13 (c) | | | 503,461 | |
| | 250,000 | | | CBS
8.875%, 05/15/19 | | | 344,295 | |
| | | | CenturyLink | | | | |
| | | | Senior Unsecured Notes | | | | |
| | 500,000 | | | 7.600%, 09/15/39 | | | 512,887 | |
| | 500,000 | | | 7.650%, 03/15/42 | | | 511,967 | |
| | 400,000 | | | Expedia
5.950%, 08/15/20 | | | 442,013 | |
| | 350,000 | | | Frontier Communications
Senior Unsecured Notes
9.000%, 08/15/31 | | | 375,375 | |
| | 250,000 | | | Telefonica Emisiones SAU (Spain)
5.877%, 07/15/19 | | | 263,125 | |
| | 500,000 | | | Telefonica Europe BV (Netherlands)
8.250%, 09/15/30 | | | 563,750 | |
| | 450,000 | | | Time Warner Cable
8.250%, 02/14/14 | | | 492,373 | |
| | | | | | | | |
Par Value | | | | | Market
Value | |
| | |
| | | | Telecommunication Services (continued) | | | | |
| | $ 500,000 | | | Windstream
7.500%, 06/01/22 | | $ | 532,500 | |
| | | | | | | | |
| | | | | | | 4,541,746 | |
| | | | | | | | |
| | |
| | | | Utilities – 3.49% | | | | |
| | 200,000 | | | Allegheny Energy Supply
Senior Unsecured Notes
6.750%, 10/15/39 (b) | | | 222,005 | |
| | 500,000 | | | Dubai Electricity & Water Authority
(United Arab Emirates)
Senior Unsecured Notes
8.500%, 04/22/15 (b) | | | 569,375 | |
| | 450,000 | | | FPL Group Capital
7.875%, 12/15/15 | | | 542,094 | |
| | 150,000 | | | Pacific Gas & Electric
Senior Unsecured Notes
8.250%, 10/15/18 | | | 205,335 | |
| | 250,000 | | | Puget Energy
5.625%, 07/15/22 (b) | | | 272,721 | |
| | 450,000 | | | Sempra Energy
Senior Unsecured Notes
9.800%, 02/15/19 | | | 639,633 | |
| | | | | | | | |
| | | | | | | 2,451,163 | |
| | | | | | | | |
| | |
| | | | Total Corporate Notes and Bonds
(Cost $39,927,976) | | | 45,354,984 | |
| | | | | | | | |
|
| | U.S. GOVERNMENT AND AGENCY OBLIGATIONS – 27.98% | |
| | |
| | | | Fannie Mae – 6.72% | | | | |
| | 299,868 | | | 6.000%, 11/01/17,
Pool # 662854 | | | 322,981 | |
| | 118,306 | | | 6.000%, 04/01/18,
Pool # 725175 | | | 125,959 | |
| | 261,053 | | | 5.500%, 11/01/18,
Pool # 748886 | | | 284,195 | |
| | 112,955 | | | 4.500%, 06/01/19,
Pool # 747860 | | | 123,504 | |
| | 528,275 | | | 6.000%, 01/01/21,
Pool # 850787 | | | 577,755 | |
| | 213,895 | | | 6.000%, 09/01/32,
Pool # 847899 | | | 242,467 | |
| | 124,856 | | | 6.000%, 02/01/34,
Pool # 771952 | | | 141,846 | |
| | 107,734 | | | 7.500%, 02/01/35,
Pool # 787557 | | | 132,684 | |
| | 32,620 | | | 7.500%, 04/01/35,
Pool # 819231 | | | 38,473 | |
| | 196,554 | | | 6.000%, 11/01/35,
Pool # 844078 | | | 219,769 | |
| | 246,533 | | | 5.000%, 05/01/36,
Pool # 745581 | | | 269,600 | |
| | 164,198 | | | 6.000%, 12/01/36,
Pool # 888029 | | | 182,437 | |
| | 219,178 | | | 5.500%, 06/01/37,
Pool # 918778 | | | 240,365 | |
| | 207,645 | | | 6.500%, 10/01/37,
Pool # 888890 | | | 235,799 | |
See accompanying Notes to Financial Statements.
| | |
| |
| ASTON/TCH Fixed Income Fund | | October 31, 2012 |
| |
| Schedule of Investments – continued | | |
| | | | | | | | |
Par Value | | | | | Market
Value | |
| | |
| | | | Fannie Mae (continued) | | | | |
| | $ 699,402 | | | 5.500%, 03/01/38,
Pool # 962344 | | $ | 767,009 | |
| | 383,176 | | | 4.000%, 02/01/41,
Pool # AE0949 | | | 410,974 | |
| | 374,845 | | | 4.000%, 02/01/41,
Pool # AH5695 | | | 402,039 | |
| | | | | | | | |
| | | | | | | 4,717,856 | |
| | | | | | | | |
| | |
| | | | Freddie Mac – 6.70% | | | | |
| | 528,003 | | | 5.500%, 11/01/20,
Gold Pool # G18083 | | | 575,717 | |
| | 102,864 | | | 5.500%, 12/01/20,
Gold Pool # G11820 | | | 112,160 | |
| | 77,641 | | | 6.000%, 10/01/35,
Gold Pool # A47772 | | | 86,184 | |
| | 262,766 | | | 5.500%, 05/01/37,
Gold Pool # A60048 | | | 285,949 | |
| | 466,835 | | | 5.500%, 09/01/37,
Gold Pool # G03202 | | | 508,022 | |
| | 530,603 | | | 5.000%, 02/01/38,
Gold Pool # A73409 | | | 574,305 | |
| | 820,119 | | | 5.000%, 04/01/38,
Gold Pool # G04334 | | | 904,043 | |
| | 399,289 | | | 4.000%, 12/01/39,
Gold Pool # G06935 | | | 426,260 | |
| | 190,006 | | | 4.000%, 05/01/41,
Gold Pool # Q00870 | | | 203,078 | |
| | 959,449 | | | 4.000%, 11/01/41,
Gold Pool # Q04550 | | | 1,025,455 | |
| | | | | | | | |
| | | | | | | 4,701,173 | |
| | | | | | | | |
| |
| | | | Government National Mortgage Association – 3.10% | |
| | 269,479 | | | 5.000%, 05/20/37,
Pool # 782156 | | | 298,162 | |
| | 609,587 | | | 5.000%, 08/20/37,
Pool # 4015 | | | 674,472 | |
| | 479,746 | | | 6.000%, 07/20/38,
Pool # 4195 | | | 543,606 | |
| | 420,494 | | | 5.500%, 08/20/38,
Pool # 4215 | | | 447,988 | |
| | 184,068 | | | 6.000%, 01/15/39,
Pool # 698036 | | | 208,288 | |
| | | | | | | | |
| | | | | | | 2,172,516 | |
| | | | | | | | |
| | |
| | | | U.S. Treasury Bill – 2.85% | | | | |
| | 2,000,000 | | | 0.000%, 12/06/12 | | | 1,999,815 | |
| | | | | | | | |
| | |
| | | | U.S. Treasury Bond – 0.73% | | | | |
| | 500,000 | | | 3.000%, 05/15/42 | | | 514,766 | |
| | | | | | | | |
| |
| | | | U.S. Treasury Inflation Index Bonds – 6.38% | |
| | 1,602,240 | | | 1.375%, 07/15/18 | | | 1,870,740 | |
| | 1,021,980 | | | 0.625%, 07/15/21 | | | 1,168,890 | |
| | 1,099,480 | | | 1.750%, 01/15/28 | | | 1,439,976 | |
| | | | | | | | |
| | | | | | | 4,479,606 | |
| | | | | | | | |
| | | | | | | | |
Par Value | | | | | Market
Value | |
| | |
| | | | U.S. Treasury Note – 1.50% | | | | |
| | $1,000,000 | | | 4.000%, 02/15/14 | | $ | 1,048,438 | |
| | | | | | | | |
| | |
| | | | Total U.S. Government and Agency Obligations
(Cost $18,213,595) | | | 19,634,170 | |
| | | | | | | | |
|
| | COMMERCIAL MORTGAGE-BACKED SECURITIES – 0.85% | |
| | |
| | 275,000 | | | Bear Stearns Commercial Mortgage
Securities
Series 2007-T28, Class A4
5.742%, 09/11/42 (c) | | | 330,043 | |
| | 269,468 | | | JP Morgan Chase Commercial Mortgage Securities
Series 2005-CB13, Class A2
5.247%, 01/12/43 | | | 270,606 | |
| | | | | | | | |
| | |
| | | | Total Commercial Mortgage-Backed Securities
(Cost $442,723) | | | 600,649 | |
| | | | | | | | |
|
| | ASSET-BACKED SECURITIES – 2.68% | |
| | |
| | 3,773 | | | Capital Auto Receivables Asset Trust
Series 2008-2, Class A4
5.420%, 12/15/14 | | | 3,780 | |
| | 107,613 | | | CarMax Auto Owner Trust
Series 2009-1, Class A4
5.810%, 12/16/13 | | | 108,177 | |
| | | | Ford Credit Auto Owner Trust
Series 2009-A, Class A4 | | | | |
| | 535,907 | | | 6.070%, 05/15/14 | | | 542,325 | |
| | | | Series 2009-B, Class A4 | | | | |
| | 197,136 | | | 4.500%, 07/15/14 | | | 199,682 | |
| | | | Series 2009-C, Class A4 | | | | |
| | 699,744 | | | 4.430%, 11/15/14 | | | 712,700 | |
| | 309,947 | | | Nissan Auto Receivables Owner Trust
Series 2009-A, Class A4
4.740%, 08/17/15 | | | 311,524 | |
| | | | | | | | |
| | |
| | | | Total Asset-Backed Securities
(Cost $1,886,148) | | | 1,878,188 | |
| | | | | | | | |
|
| | FOREIGN GOVERNMENT BONDS – 1.13% | |
| | |
| | 500,000 | | | Republic of Poland
5.000%, 03/23/22 | | | 583,845 | |
| | 150,000 | | | State of Qatar
Senior Notes
6.400%, 01/20/40 (b) | | | 209,775 | |
| | | | | | | | |
| | |
| | | | Total Foreign Government Bonds
(Cost $643,276) | | | 793,620 | |
| | | | | | | | |
See accompanying Notes to Financial Statements.
| | |
| |
| ASTON/TCH Fixed Income Fund | | October 31, 2012 |
| |
| Schedule of Investments – continued | | |
| | | | | | | | |
Shares | | | | | Market
Value | |
|
| | INVESTMENT COMPANY – 1.60% | |
| | |
| | 1,121,862 | | | BlackRock Liquidity Funds
TempCash Portfolio | | $ | 1,121,862 | |
| | | | | | | | |
| | |
| | | | Total Investment Company
(Cost $1,121,862) | | | 1,121,862 | |
| | | | | | | | |
| Total Investments – 98.88%
(Cost $62,235,580) * | | | 69,383,473 | |
| | | | | | | | |
| Net Other Assets and Liabilities – 1.12% | | | 784,287 | |
| | | | | | | | |
| Net Assets – 100.00% | | $ | 70,167,760 | |
| | | | | | | | |
| * | | Aggregate cost for Federal income tax purposes is $62,008,880. |
| | | | |
Gross unrealized appreciation | | $ | 7,555,888 | |
Gross unrealized depreciation | | | (181,295 | ) |
| | | | |
Net unrealized appreciation | | $ | 7,374,593 | |
| | | | |
| (a) | | Step Coupon. A bond that pays an initial coupon rate for the first period and then a higher coupon rate for the following periods until maturity. The coupon rate will be 7.875% until maturity. |
| (b) | | Securities exempt from registration under Rule 144A of the Securities Act of 1933, as amended. These securities are purchased in accordance with guidelines approved by the Fund’s Board of Trustees and may only be resold, in transactions exempt from registration, to qualified institutional buyers. At October 31, 2012, these securities amounted to $7,964,786 or 11.35% of net assets. These securities have been determined by the Sub-Adviser to be liquid securities. |
| (c) | | Variable rate bond. The interest rate shown reflects the rate in effect at October 31, 2012. |
| (d) | | Standard & Poor’s (S&P) credit ratings are used in the absence of a rating by Moody’s Investors, Inc. |
| GMTN | | Global Medium Term Note |
| NASDAQ | | National Association of Securities Dealers Automated Quotations |
| | | | |
Portfolio Composition | | | | |
Investment Company | | | 2% | |
U.S. Government Obligations | | | 11% | |
U.S. Government Agency Obligations | | | 17% | |
Corporate Notes and Bonds | | | | |
(Moody’s Ratings (d) unaudited) | | | | |
Aaa | | | 3% | |
Aa | | | 5% | |
A | | | 7% | |
Baa | | | 42% | |
Ba | | | 12% | |
B | | | 1% | |
| | | | |
| | | 100% | |
| | | | |
See accompanying Notes to Financial Statements.
ASTON/Lake Partners LASSO Alternatives Fund
| | |
| |
| Portfolio Manager Commentary (unaudited) | | October 31, 2012 |
| Frederick C. Lake & Ronald A. Lake |
| Q. | What were the most significant market factors affecting Fund performance and returns relative to the benchmark during the past 12 months? |
| A. | Class N Shares of the Fund returned 5.34% versus 1.58% for the HFRX Equity Hedge Index. The Fund’s strategic diversification and moderate equity exposure enabled it to participate in the market’s upside while dampening the market’s downside volatility. In contrast, the benchmark reflected the relatively more hedged approaches of its constituent managers. |
Although equities finished the fiscal year higher, the trend was interrupted by several sharp corrections, as sentiment vacillated in reaction to policy developments. This is illustrated by dissecting the fiscal year into five sub-periods:
| | • | | The S&P 500 started the year with a tailspin, falling 7.3% by Thanksgiving on concerns about the global economy and the ongoing credit crisis in Europe. The Fund was off only 2.9%. |
| | • | | At the end of November there was an explosive rally after central banks launched a coordinated effort to support the European banks. The S&P rose over 23% through April 2, carried by liquidity, better U.S. economic data, the European Central Bank’s (ECB) LTRO program, and Greek debt restructuring. The Fund participated with a gain of 8.4%. |
| | • | | However, the S&P slid steadily over the next two months, losing 9.6% as U.S. data turned softer, China’s slowdown intensified, and Spain deteriorated seriously. The Fund was off only 3.8%. |
| | • | | Then, from June 1 through September 14, the index rallied 15.4%. Sparked by the ECB’s plan to recapitalize Spanish banks, momentum built on improving economic data in the U.S. and China, Draghi’s vow to “do whatever it takes” for the euro, the ECB’s Outright Monetary Transactions program, and expectations of the Fed easing. The Fund participated with a gain of 5.0%. |
| | • | | Ironically, the actual announcement of the third quantitative easing initiative |
| | | marked the peak. The S&P lost 3.5% from September 14 through October 31, as earnings disappointed. The Fund was off only 0.6%. |
| Q. | What were the best performing holdings for the Fund during the period? |
| A. | Returns were driven by solid gains from the core hedged equity allocations. Long-biased equity and hedged credit allocations also contributed meaningfully. |
| Q. | What were the weakest performing holdings? |
| A. | Long/short commodities and managed futures funds detracted from performance, but fortunately these were modest allocations. |
| Q. | How was the Fund positioned as of October 31, 2012? |
| A. | Throughout the year we positioned the portfolio to dampen the risk of conventional asset classes while aiming for relatively stable returns via a broad mix of alternatives. |
At fiscal year-end, equity-oriented funds (a diverse mix of long-biased, hedged, multi-asset and global strategies) accounted for 50% of the portfolio. Other allocations included 16% to Hedged Credit, 12% to Strategic Fixed Income, 10% to Arbitrage, and 8% to Global Macro.
We believe that volatility is likely to remain a feature of the investment landscape, as unresolved policy and political issues create uncertainty for investors. We therefore intend to maintain a diversified mix of strategies in an effort to mitigate volatility, while maintaining the potential to generate attractive risk-adjusted returns.
Note: A fund-of-funds that invest in funds using alternative or hedging strategies may be exposed to potentially dramatic changes in the value of certain of its portfolio holdings. Investments in a fund-of-funds are subject to higher costs than investing directly in the underlying funds.
Growth of a Hypothetical
$10,000 Investment—Class I
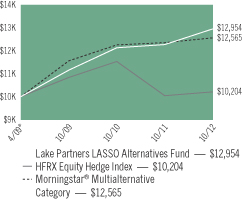
All dividends and capital gains are reinvested. Indexes are unmanaged and do not take into account fees, expenses or other costs.
Returns shown in the chart and table do not reflect taxes that a shareholder would pay on Fund distributions or on the sale of the Fund shares.
RETURNS FOR PERIOD ENDED 10/31/12
Average Annual Total Returns - Class N
| | | | |
One Year | | | 5.34 | % |
Since Inception | | | 3.94 | % |
Inception Date 03/03/10
Average Annual Total Returns - Class I
| | | | |
One Year | | | 5.56 | % |
Since Inception | | | 7.49 | % |
Inception Date 04/01/09*
* The Fund commenced operations on April 1, 2009. Because the Fund invests primarily in open-end investment companies which are priced as of the close of the NYSE, performance is shown from April 2, 2009.
The performance data quoted represents past performance. Past performance does not guarantee future results. Investment return and principal value will fluctuate so that an investor’s shares, upon redemption, may be worth more or less than their original cost. Current performance may be lower or higher than the performance data quoted. For performance data current to the most recent month-end, please visit our website at www.astonfunds.com.
The performance quoted would have been lower if fee waivers and/or expense reimbursements had not been in effect.
The total expense ratio for the Class N and Class I Shares is 3.07% and 2.82%, respectively, as disclosed in the prospectus dated March 1, 2012. Please refer to the Financial Highlights section in this report for more 2012 fiscal year-end related information.
| | |
| |
| ASTON/Lake Partners LASSO Alternatives Fund | | October 31, 2012 |
| |
| Schedule of Investments | | |
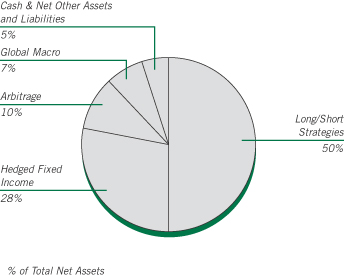
| | | | | | | | |
Shares | | | | | Market
Value | |
|
| | INVESTMENT COMPANIES – 95.40% | |
| | |
| | | | Merger Arbitrage – 9.95% | | | | |
| | 384,282 | | | Dunham Monthly Distribution Fund-N | | $ | 14,302,954 | |
| | 1,346,841 | | | Touchstone Merger Arbitrage Fund | | | 14,276,511 | |
| | | | | | | | |
| | | | | | | 28,579,465 | |
| | | | | | | | |
| |
| | | | Hedged Credit and Strategic Fixed Income – 27.65% | |
| | 956,219 | | | BlackRock Global Long/Short Credit Fund-INS | | | 10,088,108 | |
| | 677,708 | | | Driehaus Active Income Fund | | | 7,176,932 | |
| | 724,260 | | | Driehaus Select Credit Fund | | | 7,184,658 | |
| | 1,301,028 | | | John Hancock Funds II - Strategic Income Opportunities Fund | | | 14,415,394 | |
| | 2,088,579 | | | Metropolitan West High Yield Bond
Fund-I | | | 21,721,226 | |
| | 1,530,609 | | | PIMCO Income Fund | | | 18,780,578 | |
| | | | | | | | |
| | | | | | | 79,366,896 | |
| | | | | | | | |
| | |
| | | | Global Macro – 7.51% | | | | |
| | 2,016,060 | | | John Hancock Funds II - Global Absolute Return Strategies Fund * | | | 21,551,679 | |
| | | | | | | | |
| | | | | | | | |
Shares | | | | | Market
Value | |
| | |
| | | | Long/Short Strategies – 50.29% | | | | |
| | 948,271 | | | BlackRock Emerging Markets Long/Short Equity Fund-IS | | $ | 9,985,288 | |
| | 1,261,259 | | | FPA Crescent Fund-I | | | 35,920,658 | |
| | 2,683,645 | | | Robeco Boston Partners Long/Short Equity Fund-IS | | | 56,168,698 | |
| | 377,343 | | | Royce Global Select Fund-INV | | | 6,414,837 | |
| | 2,800,567 | | | The Weitz Funds - Partners III Opportunity Fund | | | 35,875,263 | |
| | | | | | | | |
| | | | | | | 144,364,744 | |
| | | | | | | | |
| | |
| | | | Total Investment Companies
(Cost $265,319,404) | | | 273,862,784 | |
| | | | | | | | |
| Total Investments – 95.40%
(Cost $265,319,404)** | | | 273,862,784 | |
| | | | | | | | |
| Net Other Assets and Liabilities – 4.60% | | | 13,198,817 | |
| | | | | | | | |
| Net Assets – 100.00% | | $ | 287,061,601 | |
| | | | | | | | |
| * | | Non-income producing security. |
| ** | | Aggregate cost for Federal income tax purposes is $266,062,572. |
| | | | |
Gross unrealized appreciation | | $ | 9,557,078 | |
Gross unrealized depreciation | | | (1,756,866 | ) |
| | | | |
Net unrealized appreciation | | $ | 7,800,212 | |
| | | | |
See accompanying Notes to Financial Statements.
ASTON Dynamic Allocation Fund
| | |
| |
| Portfolio Manager Commentary (unaudited) | | October 31, 2012 |
| | Bryce James |
| Q. | What were the most significant market factors affecting Fund performance and returns relative to the benchmark during the past 12 months? |
| A. | It has been an exceptionally challenging last 12 months for the Fund and our Dynamic Portfolio Optimization strategy. The adjective “more” comes to mind. We have witnessed more confusion, more contradictory economic statements from politicians, more market turmoil, more government interventions (in capital markets) than we can recall in nearly thirty years. Although we do not make economic forecasts nor engage in earnings estimates or similar exercises, ongoing macroeconomic confusion does manifest itself in the price action of the markets. This data is integrated into our model. |
| Q. | What were the best and weakest performing holdings for the Fund during the period? |
| A. | The past year witnessed some interesting disparities when the best, and worst exchange-traded fund (“ETF”) returns are examined in the portfolio. The best result, XLV-Healthcare, returned 22.36%. The worst performing, SKF Financial Inverse ETF, lost 26.22%. Ironically, the commonality, is that both sectors were subject to increasing government announcements and interventions. |
| Q. | How was the Fund positioned as of October 31, 2012? |
| A. | With all of the contradictory signals of short duration that we have seen the last 12 months, we continue to keep the portfolio in a relatively cautious and risk-averse posture. Our risk-centric focus does not allow for a high-risk/high-return proposition at this time. Our models recognize the historic tilt to current risks, even though it appears that many investors have already forgotten how quickly years of investment returns can be lost in a matter of months as seen in 2008. |
| | We are acutely cognizant of our prerogative to remain objective in the assessment of capital market risk, particularly in light of current macroeconomic issues. It appears to us that most investors have not fully considered the consequences of the U.S. Federal Reserve’s zero interest rate policy. The Fed policy creates and exacerbates the funding deficits for most defined-benefit pension plans and the structured life settlements provided by insurance companies. We think this area increasingly looks like a “bubble” or a setup for a future financial disaster. |
Growth of a Hypothetical
$10,000 Investment—Class N
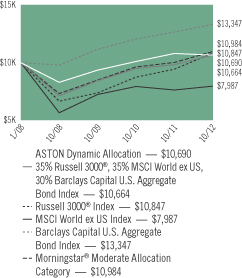
All dividends and capital gains are reinvested. Indexes are unmanaged and do not take into account fees, expenses or other costs.
Returns shown in the chart and table do not reflect taxes that a shareholder would pay on Fund distributions or on the sale of the Fund shares.
Investments in ETFs are subject to higher costs than investing directly in the underlying security. There are also certain investment limitations with a fund-of-funds.
RETURNSFOR PERIOD ENDED 10/31/12
Average Annual Total Returns - Class N
| | | | |
One Year | | | -1.17 | % |
Since Inception | | | 1.40 | % |
Inception Date 01/10/08
Average Annual Total Returns - Class I
| | | | |
One Year | | | -1.01 | % |
Since Inception | | | 2.87 | % |
Inception Date 11/02/10
The performance data quoted represents past performance. Past performance does not guarantee future results. Investment return and principal value will fluctuate so that an investor’s shares, upon redemption, may be worth more or less than their original cost. Current performance may be lower or higher than the performance data quoted. For performance data current to the most recent month-end, please visit our website at www.astonfunds.com.
The performance quoted would have been lower if fee waivers and/or expense reimbursements had not been in effect.
| | |
| |
| ASTON Dynamic Allocation Fund | | October 31, 2012 |
| |
| Schedule of Investments | | |
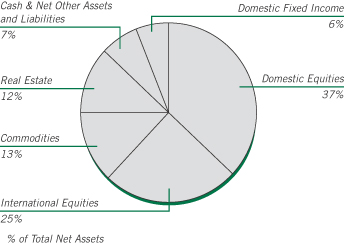
| | | | | | | | |
Shares | | | | | Market
Value | |
|
| | EXCHANGE TRADED FUNDS – 93.27% | |
| | |
| | | | Commodities – 12.80% | | | | |
| | 12,430 | | | SPDR Gold Shares * | | $ | 2,074,070 | |
| | 53,612 | | | United States Oil Fund LP * | | | 1,703,789 | |
| | | | | | | | |
| | | | | | | 3,777,859 | |
| | | | | | | | |
| | |
| | | | Domestic Equities – 37.37% | | | | |
| | 44,075 | | | Health Care Select Sector SPDR Fund | | | 1,763,000 | |
| | 20,896 | | | iShares Dow Jones U.S. Utilities Sector Index Fund | | | 1,890,879 | |
| | 9,965 | | | iShares Russell 2000 Growth Index Fund | | | 922,062 | |
| | 13,567 | | | iShares Russell 2000 Value Index
Fund | | | 987,949 | |
| | 29,444 | | | iShares Russell Midcap Growth Index Fund | | | 1,788,723 | |
| | 13,664 | | | PowerShares QQQ Trust Series 1 | | | 887,477 | |
| | 5,017 | | | SPDR S&P MidCap 400 ETF Trust | | | 894,280 | |
| | 51,366 | | | Utilities Select Sector SPDR Fund | | | 1,893,865 | |
| | | | | | | | |
| | | | | | | 11,028,235 | |
| | | | | | | | |
| | |
| | | | Domestic Fixed Income – 6.19% | | | | |
| | 21,638 | | | iShares Barclays 1-3 Year Treasury Bond Fund | | | 1,826,680 | |
| | | | | | | | |
| | |
| | | | International Equities – 24.59% | | | | |
| | 38,250 | | | iShares MSCI Australia Index Fund | | | 940,185 | |
| | 65,568 | | | iShares MSCI Canada Index Fund | | | 1,867,377 | |
| | 34,362 | | | iShares MSCI EAFE Index Fund | | | 1,840,772 | |
| | 69,411 | | | iShares MSCI Singapore Index Fund | | | 923,166 | |
| | 19,154 | | | iShares S&P Latin America 40 Index Fund | | | 809,448 | |
| | 49,166 | | | PowerShares India Portfolio | | | 877,613 | |
| | | | | | | | |
| | | | | | | 7,258,561 | |
| | | | | | | | |
| | | | | | | | |
Shares | | | | | Market
Value | |
| | |
| | | | Real Estate – 12.32% | | | | |
| | 23,401 | | | iShares Cohen & Steers Realty Majors Index Fund | | $ | 1,797,899 | |
| | 28,543 | | | Vanguard REIT | | | 1,837,598 | |
| | | | | | | | |
| | | | | | | 3,635,497 | |
| | | | | | | | |
| | |
| | | | Total Exchange Traded Funds
(Cost $27,237,623) | | | 27,526,832 | |
| | | | | | | | |
|
| | INVESTMENT COMPANY – 7.58% | |
| | |
| | 2,238,013 | | | BlackRock Liquidity Funds TempCash Portfolio | | | 2,238,013 | |
| | | | | | | | |
| | |
| | | | Total Investment Company
(Cost $2,238,013) | | | 2,238,013 | |
| | | | | | | | |
| Total Investments – 100.85%
(Cost $29,475,636)** | | | 29,764,845 | |
| | | | | | | | |
| Net Other Assets and Liabilities – (0.85)% | | | (251,868 | ) |
| | | | | | | | |
| Net Assets – 100.00% | | $ | 29,512,977 | |
| | | | | | | | |
| * | | Non-income producing security. |
| ** | | Aggregate cost for Federal income tax purposes is $29,596,378. |
| | | | |
Gross unrealized appreciation | | $ | 562,608 | |
Gross unrealized depreciation | | | (394,141 | ) |
| | | | |
Net unrealized appreciation | | $ | 168,467 | |
| | | | |
| EAFE | | Europe, Australasia, and Far East |
| EAFE | | Europe, Australasia, and Far East |
| MSCI | | Morgan Stanley Capital International |
| REIT | | Real Estate Investment Trust |
| SPDR | | Standard & Poor’s Depositary Receipt |
See accompanying Notes to Financial Statements.
ASTON/Anchor Capital Enhanced Equity Fund
| | |
| |
| Portfolio Manager Commentary (unaudited) | | October 31, 2012 |
| (formerly, the ASTON/M.D. Sass Enhanced Equity Fund) | | Ronald L. Altman |
| Q. | What were the most significant market factors affecting Fund performance and returns relative to the benchmark during the past 12 months? |
| A. | Class N Shares of the Fund returned 3.12% during the period, significantly less than the increase of 11.3% in the underlying stock holdings in the portfolio. The cost of using put options in order to provide downside protection in the event of a market break significantly reduced the portfolio’s total return, mainly because implied volatility (as represented by the Chicago Board Options Exchange Volatility Index-VIX) remained persistently low. Our strategy is to own put options when the VIX is less than 20, and to sell those options when the VIX is greater than 40. Continuing to maintain this hedge on the portfolio proved costly during the past 12 months, as the Index remained low, reducing overall returns. Although the cost of maintaining this hedge on the portfolio was substantially more than expected, we continue to think it prudent to hedge against the potential for future downside volatility given the current economic and market environment. |
| Q. | What were the best performing holdings for the Fund during the period? |
| A. | Looking at the equity-only portion of the portfolio, every sector contributed positively to the total return for this past year. The best performing sectors were Financials, Healthcare and Telecom. |
| Q. | What were the weakest performing holdings? |
| A. | Lagging sectors included Information Technology and Utilities. In addition, not owning traditional Energy and Materials companies had only a minimal impact on our overall performance versus the overall market. |
| Q. | How was the Fund positioned as of October 31, 2012? |
| A. | The Fund’s overriding commitment is to seek out attractive stocks using a value |
approach with an emphasis on companies with strong cash flows and above average dividend yields. We focus on dividend yield and free cash flow as we think that over time these are much better measures of valuation than net income. We also look for companies that have consistently increased their dividends over time, believing that dividend growth is often a strong signal of a company’s belief in its own growth potential. Whereas the broader investment community typically focuses on near-term cyclical issues, we think that the longer term secular growth potential of the business is more important in achieving investment success.
This investment process has, over the past two years, led the portfolio to be overweight large-cap Healthcare companies, both from a valuation perspective and due to our perception of a disparity between cyclical concerns and secular growth opportunities. Elsewhere on a sector level, the Fund continues to maintain significant overweight positions in Utilities and Industrials, with the most notable change from a year ago a reduction in its stake in Financials. Overall, the cash flow and weighted average dividend yield of the underlying holdings in the portfolio is greater than the Fund’s benchmark, while its average price/earnings ratio (a common measure of valuation) is lower.
In addition, we continually write covered call options on most positions in the portfolio. This forces us to keep the portfolio fresh. As stocks go up in value, and exceed the strike price of the call options written, they are frequently “called away” resulting in an opportunity to reexamine the most attractive candidates available. As previously noted, considering the potential economic risks (e.g. impending tax changes, lower government spending, Europe’s fiscal problems, and slowing economic growth in China), we remain convinced that owning put options to help protect against potential downside volatility is a prudent strategy.
Growth of a Hypothetical
$10,000 Investment—Class N
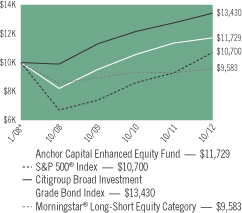
All dividends and capital gains are reinvested. Indexes are unmanaged and do not take into account fees, expenses or other costs.
Returns shown in the chart and table do not reflect taxes that a shareholder would pay on Fund distributions or on the sale of the Fund shares.
Investing in covered call options involves the risk of a lack of liquidity and can be negatively impacted by market price fluctuations.
RETURNSFOR PERIOD ENDED 10/31/12
Average Annual Total Returns - Class N
| | | | |
One Year | | | 3.12 | % |
Since Inception | | | 3.38 | % |
Inception Date 01/15/08
Average Annual Total Returns - Class I
| | | | |
One Year | | | 3.46 | % |
Since Inception | | | 6.20 | % |
Inception Date 03/03/10
The performance data quoted represents past performance. Past performance does not guarantee future results. Investment return and principal value will fluctuate so that an investor’s shares, upon redemption, may be worth more or less than their original cost. Current performance may be lower or higher than the performance data quoted. For performance data current to the most recent month-end, please visit our website at www.astonfunds.com.
| | |
| |
| ASTON/Anchor Capital Enhanced Equity Fund | | October 31, 2012 |
| |
| Schedule of Investments | | |
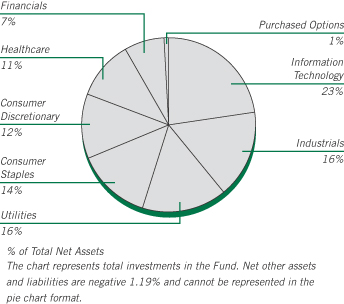
| | | | | | | | |
Shares | | | | | Market
Value | |
| |
| | COMMON STOCKS – 100.35% | | | | |
| | |
| | | | Consumer Discretionary – 12.54% | | | | |
| | 165,000 | | | Carnival (a) | | $ | 6,250,200 | |
| | 105,000 | | | Kohl’s (a) | | | 5,594,400 | |
| | 145,000 | | | Lowe’s (a) | | | 4,695,100 | |
| | 500,000 | | | Staples (a) | | | 5,757,500 | |
| | | | | | | | |
| | | | | | | 22,297,200 | |
| | | | | | | | |
| | |
| | | | Consumer Staples – 13.90% | | | | |
| | 230,000 | | | ConAgra Foods (a) | | | 6,403,200 | |
| | 90,000 | | | General Mills (a) | | | 3,607,200 | |
| | 87,100 | | | Procter & Gamble (a) | | | 6,030,804 | |
| | 90,000 | | | Sysco (a) | | | 2,796,300 | |
| | 167,000 | | | Walgreen (a) | | | 5,883,410 | |
| | | | | | | | |
| | | | | | | 24,720,914 | |
| | | | | | | | |
| | |
| | | | Financials – 7.43% | | | | |
| | 240,000 | | | Bank of America (a) | | | 2,236,800 | |
| | 176,000 | | | MetLife (a) | | | 6,246,240 | |
| | 50,000 | | | SunTrust Banks (a) | | | 1,360,000 | |
| | 100,000 | | | Wells Fargo (a) | | | 3,369,000 | |
| | | | | | | | |
| | | | | | | 13,212,040 | |
| | | | | | | | |
| | |
| | | | Healthcare – 11.56% | | | | |
| | 73,400 | | | Becton Dickinson (a) | | | 5,554,912 | |
| | 80,000 | | | Johnson & Johnson (a) | | | 5,665,600 | |
| | 140,000 | | | Medtronic (a) | | | 5,821,200 | |
| | 30,000 | | | Stryker (a) | | | 1,578,000 | |
| | 30,000 | | | Zimmer Holdings (a) | | | 1,926,300 | |
| | | | | | | | |
| | | | | | | 20,546,012 | |
| | | | | | | | |
| | | | | | | | |
Shares | | | | | Market
Value | |
| | |
| | | | Industrials – 16.38% | | | | |
| | 136,000 | | | Eaton (a) | | $ | 6,421,920 | |
| | 113,000 | | | Emerson Electric (a) | | | 5,472,590 | |
| | 160,000 | | | General Electric (a) | | | 3,369,600 | |
| | 25,000 | | | Lockheed Martin (a) | | | 2,341,750 | |
| | 99,900 | | | Raytheon (a) | | | 5,650,344 | |
| | 75,000 | | | United Technologies (a) | | | 5,862,000 | |
| | | | | | | | |
| | | | | | | 29,118,204 | |
| | | | | | | | |
| | |
| | | | Information Technology – 22.70% | | | | |
| | 500,000 | | | Applied Materials (a) | | | 5,300,000 | |
| | 340,000 | | | Cisco Systems (a) | | | 5,827,600 | |
| | 490,000 | | | Corning (a) | | | 5,757,500 | |
| | 130,000 | | | Harris (a) | | | 5,951,400 | |
| | 260,000 | | | Intel (a) | | | 5,622,500 | |
| | 195,000 | | | Microsoft (a) | | | 5,564,325 | |
| | 725,000 | | | Nokia OYJ, SP ADR (Finland) (a) | | | 1,935,750 | |
| | 685,000 | | | Xerox (a) | | | 4,411,400 | |
| | | | | | | | |
| | | | | | | 40,370,475 | |
| | | | | | | | |
| | |
| | | | Utilities – 15.84% | | | | |
| | 80,000 | | | Entergy (a) | | | 5,806,400 | |
| | 174,000 | | | Exelon (a) | | | 6,225,720 | |
| | 130,000 | | | FirstEnergy (a) | | | 5,943,600 | |
| | 155,000 | | | PPL (a) | | | 4,584,900 | |
| | 175,000 | | | Public Service Enterprise Group (a) | | | 5,607,000 | |
| | | | | | | | |
| | | | | | | 28,167,620 | |
| | | | | | | | |
| | |
| | | | Total Common Stocks (Cost $184,135,432) | | | 178,432,465 | |
| | | | | | | | |
Number of
Contracts | | | | | | |
| |
| | PURCHASED OPTIONS – 0.84% | | | | |
| | |
| | | | SPDR S&P 500 ETF Trust | | | | |
| | 1,300 | | | Strike @ $121 Exp 11/17/12 | | | 5,200 | |
| | 2,100 | | | Strike @ $122 Exp 11/17/12 | | | 8,400 | |
| | 2,100 | | | Strike @ $123 Exp 11/17/12 | | | 10,500 | |
| | 1,600 | | | Strike @ $124 Exp 11/17/12 | | | 9,600 | |
| | 2,000 | | | Strike @ $125 Exp 11/17/12 | | | 16,000 | |
| | 1,500 | | | Strike @ $126 Exp 11/17/12 | | | 15,000 | |
| | 1,500 | | | Strike @ $127 Exp 11/17/12 | | | 16,500 | |
| | 1,000 | | | Strike @ $130 Exp 11/17/12 | | | 16,000 | |
| | 1,000 | | | Strike @ $132 Exp 11/17/12 | | | 28,000 | |
| | 1,000 | | | Strike @ $131 Exp 11/17/12 | | | 22,000 | |
| | 1,000 | | | Strike @ $121 Exp 12/22/12 | | | 34,000 | |
| | 1,500 | | | Strike @ $122 Exp 12/22/12 | | | 57,000 | |
| | 2,000 | | | Strike @ $123 Exp 12/22/12 | | | 82,000 | |
| | 2,000 | | | Strike @ $124 Exp 12/22/12 | | | 94,000 | |
| | 2,000 | | | Strike @ $125 Exp 12/22/12 | | | 104,000 | |
| | 1,500 | | | Strike @ $128 Exp 12/22/12 | | | 118,500 | |
| | 1,500 | | | Strike @ $129 Exp 12/22/12 | | | 120,000 | |
| | 2,000 | | | Strike @ $129 Exp 12/31/12 | | | 200,000 | |
| | 2,000 | | | Strike @ $130 Exp 12/31/12 | | | 212,000 | |
| | 2,000 | | | Strike @ $131 Exp 12/31/12 | | | 254,000 | |
See accompanying Notes to Financial Statements.
| | |
| |
| ASTON/Anchor Capital Enhanced Equity Fund | | October 31, 2012 |
| |
| Schedule of Investments – continued | | |
| | | | | | | | |
Number of
Contracts | | | | | Market
Value | |
| | 500 | | | Strike @ $128 Exp 01/19/13 | | $ | 62,000 | |
| | | | | | | | |
| | |
| | | | Total Purchased Options
(Cost $2,273,051) | | | 1,484,700 | |
| | | | | | | | |
| Total Investments – 101.19%
(Cost $186,408,483)** | | | 179,917,165 | |
| | | | | | | | |
| Net Other Assets and Liabilities – (1.19)% | | | (2,107,845 | ) |
| | | | | | | | |
| Net Assets – 100.00% | | $ | 177,809,320 | |
| | | | | | | | |
| * | | Non-income producing security. |
| ** | | Aggregate cost for Federal income tax purposes is $186,675,910. |
| | | | |
Gross unrealized appreciation | | $ | 7,841,971 | |
Gross unrealized depreciation | | | (14,600,716 | ) |
| | | | |
Net unrealized depreciation | | $ | (6,758,745 | ) |
| | | | |
| (a) | | These securities are pledged as collateral for call options written. |
| SP ADR | | Sponsored American Depositary Receipt |
| SPDR | | Standard & Poor’s Depositary Receipt |
Transactions in written call options for the year ended October 31, 2012 were as follows:
| | | | | | | | |
| Contracts | | Number of
Contracts | | | Premium | |
Outstanding, October 31, 2011 | | | 37,160 | | | $ | 3,231,770 | |
Call Options Written | | | 151,796 | | | | 10,765,338 | |
Call Options Closed or Expired | | | (118,310 | ) | | | (8,797,416 | ) |
Call Options Exercised | | | (14,320 | ) | | | (1,259,996 | ) |
| | | | | | | | |
Outstanding, October 31, 2012 | | | 56,326 | | | $ | 3,939,696 | |
| | | | | | | | |
Premiums received and value of written call equity options outstanding as of October 31, 2012.
| | | | | | | | | | | | |
Number of
Contracts | | | Description | | Premium
Received | | | Market
Value | |
| | | | Applied Materials | | | | | | | | |
| | 2,566 | | | Strike @ $13 Exp 04/13 | | | $ 122,156 | | | | $ 17,962 | |
| | | |
| | | | Bank of America | | | | | | | | |
| | 1,800 | | | Strike @ $9 Exp 02/13 | | | 61,152 | | | | 156,600 | |
| | 600 | | | Strike @ $10 Exp 05/13 | | | 23,382 | | | | 42,000 | |
| | | |
| | | | Becton Dickinson | | | | | | | | |
| | 734 | | | Strike @ $80 Exp 03/13 | | | 114,124 | | | | 69,730 | |
| | | |
| | | | Carnival | | | | | | | | |
| | 210 | | | Strike @ $35 Exp 01/13 | | | 25,408 | | | | 73,500 | |
| | 150 | | | Strike @ $37 Exp 01/13 | | | 14,296 | | | | 32,250 | |
| | 262 | | | Strike @ $37 Exp 04/13 | | | 38,767 | | | | 77,290 | |
| | 1,028 | | | Strike @ $38 Exp 04/13 | | | 126,538 | | | | 254,430 | |
| | | |
| | | | Cisco Systems | | | | | | | | |
| | 800 | | | Strike @ $18 Exp 11/12 | | | 25,576 | | | | 24,000 | |
| | 2,600 | | | Strike @ $20 Exp 04/13 | | | 103,522 | | | | 88,400 | |
| | | | | | | | | | | | |
Number of
Contracts | | | Description | | Premium
Received | | | Market
Value | |
| | | | ConAgra Foods | | | | | | | | |
| | 300 | | | Strike @ $27 Exp 12/12 | | | $ 14,692 | | | | $ 42,000 | |
| | 340 | | | Strike @ $27 Exp 01/13 | | | 10,771 | | | | 49,300 | |
| | 500 | | | Strike @ $26 Exp 03/13 | | | 36,985 | | | | 125,000 | |
| | 1,160 | | | Strike @ $27 Exp 03/13 | | | 42,565 | | | | 179,800 | |
| | | |
| | | | Corning | | | | | | | | |
| | 3,000 | | | Strike @ $14 Exp 02/13 | | | 87,010 | | | | 45,000 | |
| | | |
| | | | Eaton | | | | | | | | |
| | 686 | | | Strike @ $46 Exp 01/13 | | | 74,069 | | | | 178,360 | |
| | 374 | | | Strike @ $48 Exp 04/13 | | | 78,733 | | | | 97,240 | |
| | 300 | | | Strike @ $50 Exp 04/13 | | | 51,534 | | | | 60,000 | |
| | | |
| | | | Emerson Electric | | | | | | | | |
| | 230 | | | Strike @ $48 Exp 01/13 | | | 30,583 | | | | 41,630 | |
| | 900 | | | Strike @ $50 Exp 01/13 | | | 73,206 | | | | 94,500 | |
| | | |
| | | | Entergy | | | | | | | | |
| | 690 | | | Strike @ $70 Exp 01/13 | | | 67,958 | | | | 208,725 | |
| | 110 | | | Strike @ $72.5 Exp 03/13 | | | 11,939 | | | | 20,900 | |
| | | |
| | | | Exelon | | | | | | | | |
| | 240 | | | Strike @ $40 Exp 04/13 | | | 8,160 | | | | 3,600 | |
| | | |
| | | | FirstEnergy | | | | | | | | |
| | 200 | | | Strike @ $46 Exp 01/13 | | | 11,800 | | | | 15,000 | |
| | 200 | | | Strike @ $47 Exp 01/13 | | | 8,800 | | | | 8,200 | |
| | 600 | | | Strike @ $47 Exp 04/13 | | | 45,899 | | | | 51,000 | |
| | 300 | | | Strike @ $48 Exp 04/13 | | | 16,200 | | | | 18,000 | |
| | | |
| | | | General Electric | | | | | | | | |
| | 450 | | | Strike @ $22 Exp 12/12 | | | 15,739 | | | | 12,600 | |
| | 1,150 | | | Strike @ $22 Exp 03/13 | | | 75,991 | | | | 66,700 | |
| | | |
| | | | General Mills | | | | | | | | |
| | 400 | | | Strike @ $41 Exp 04/13 | | | 32,378 | | | | 30,000 | |
| | 400 | | | Strike @ $42 Exp 04/13 | | | 19,766 | | | | 15,200 | |
| | | |
| | | | Harris | | | | | | | | |
| | 347 | | | Strike @ $45 Exp 11/12 | | | 42,451 | | | | 55,520 | |
| | 953 | | | Strike @ $45 Exp 02/13 | | | 230,255 | | | | 324,020 | |
| | | |
| | | | Intel | | | | | | | | |
| | 400 | | | Strike @ $27 Exp 04/13 | | | 11,988 | | | | 3,800 | |
| | | |
| | | | Johnson & Johnson | | | | | | | | |
| | 400 | | | Strike @ $67.5 Exp 01/13 | | | 46,029 | | | | 148,000 | |
| | 160 | | | Strike @ $70 Exp 01/13 | | | 18,875 | | | | 27,360 | |
| | 240 | | | Strike @ $70 Exp 04/13 | | | 29,152 | | | | 54,000 | |
| | | |
| | | | Kohls | | | | | | | | |
| | 880 | | | Strike @ $52.5 Exp 01/13 | | | 137,215 | | | | 250,800 | |
| | 170 | | | Strike @ $55 Exp 04/13 | | | 47,303 | | | | 42,500 | |
| | | |
| | | | Lockheed Martin | | | | | | | | |
| | 250 | | | Strike @ $90 Exp 12/12 | | | 45,243 | | | | 112,500 | |
| | | |
| | | | Lowes | | | | | | | | |
| | 200 | | | Strike @ $29 Exp 01/13 | | | 10,400 | | | | 78,000 | |
| | 500 | | | Strike @ $30 Exp 01/13 | | | 19,200 | | | | 157,500 | |
| | 300 | | | Strike @ $28 Exp 04/13 | | | 38,900 | | | | 156,000 | |
| | 300 | | | Strike @ $29 Exp 04/13 | | | 37,136 | | | | 132,000 | |
| | 150 | | | Strike @ $30 Exp 04/13 | | | 16,500 | | | | 51,000 | |
See accompanying Notes to Financial Statements.
| | |
| |
| ASTON/Anchor Capital Enhanced Equity Fund | | October 31, 2012 |
| |
| Schedule of Investments – continued | | |
| | | | | | | | | | | | |
Number of
Contracts | | | Description | | Premium
Received | | | Market
Value | |
| | | | Medtronic | | | | | | | | |
| | 200 | | | Strike @ $41 Exp 11/12 | | | $ 24,045 | | | | $ 22,400 | |
| | 50 | | | Strike @ $40 Exp 01/13 | | | 5,648 | | | | 12,650 | |
| | 250 | | | Strike @ $41 Exp 01/13 | | | 27,193 | | | | 47,250 | |
| | 850 | | | Strike @ $42 Exp 01/13 | | | 104,977 | | | | 123,250 | |
| | 50 | | | Strike @ $40 Exp 02/13 | | | 6,899 | | | | 14,025 | |
| | | |
| | | | MetLife | | | | | | | | |
| | 50 | | | Strike @ $35 Exp 12/12 | | | 6,299 | | | | 7,400 | |
| | 410 | | | Strike @ $35 Exp 01/13 | | | 44,378 | | | | 73,390 | |
| | 100 | | | Strike @ $35 Exp 03/13 | | | 10,297 | | | | 24,000 | |
| | 1,100 | | | Strike @ $38 Exp 03/13 | | | 148,317 | | | | 137,500 | |
| | 50 | | | Strike @ $40 Exp 03/13 | | | 5,051 | | | | 3,850 | |
| | 50 | | | Strike @ $39 Exp 06/13 | | | 7,248 | | | | 7,900 | |
| | | |
| | | | Microsoft | | | | | | | | |
| | 999 | | | Strike @ $33 Exp 04/13 | | | 73,316 | | | | 33,966 | |
| | 300 | | | Strike @ $31 Exp 07/13 | | | 27,599 | | | | 32,400 | |
| | 651 | | | Strike @ $32 Exp 07/13 | | | 46,069 | | | | 56,637 | |
| | | |
| | | | Nokia OYJ, SP ADR (Finland) | | | | | | | | |
| | 750 | | | Strike @ $10 Exp 01/13 | | | 7,481 | | | | 375 | |
| | 3,040 | | | Strike @ $7.5 Exp 01/13 | | | 43,490 | | | | 1,520 | |
| | 2,250 | | | Strike @ $5 Exp 04/13 | | | 47,881 | | | | 15,750 | |
| | | |
| | | | PPL | | | | | | | | |
| | 896 | | | Strike @ $29 Exp 01/13 | | | 48,664 | | | | 80,640 | |
| | 654 | | | Strike @ $30 Exp 01/13 | | | 25,216 | | | | 22,890 | |
| | | |
| | | | Procter & Gamble | | | | | | | | |
| | 671 | | | Strike @ $65 Exp 01/13 | | | 106,496 | | | | 322,080 | |
| | 200 | | | Strike @ $67.5 Exp 01/13 | | | 27,294 | | | | 56,800 | |
| | | |
| | | | Public Service Enterprise | | | | | | | | |
| | 400 | | | Strike @ $35 Exp 12/12 | | | 12,488 | | | | 1,000 | |
| | 450 | | | Strike @ $35 Exp 03/13 | | | 28,037 | | | | 6,750 | |
| | | |
| | | | Raytheon | | | | | | | | |
| | 50 | | | Strike @ $55 Exp 11/12 | | | 5,149 | | | | 9,450 | |
| | 700 | | | Strike @ $60 Exp 02/13 | | | 60,347 | | | | 51,100 | |
| | 249 | | | Strike @ $57.5 Exp 05/13 | | | 41,077 | | | | 57,146 | |
| | | |
| | | | Staples | | | | | | | | |
| | 160 | | | Strike @ $13 Exp 12/12 | | | 3,040 | | | | 3,200 | |
| | 100 | | | Strike @ $13 Exp 03/13 | | | 4,897 | | | | 4,500 | |
| | 2,000 | | | Strike @ $14 Exp 03/13 | | | 37,999 | | | | 50,000 | |
| | 1,450 | | | Strike @ $15 Exp 03/13 | | | 49,299 | | | | 18,125 | |
| | 325 | | | Strike @ $16 Exp 03/13 | | | 11,050 | | | | 1,625 | |
| | | |
| | | | Stryker | | | | | | | | |
| | 150 | | | Strike @ $55 Exp 03/13 | | | 28,199 | | | | 22,500 | |
| | 150 | | | Strike @ $57.5 Exp 03/13 | | | 14,700 | | | | 12,000 | |
| | | |
| | | | Suntrust | | | | | | | | |
| | 500 | | | Strike @ $27 Exp 01/13 | | | 51,487 | | | | 79,500 | |
| | | |
| | | | Sysco | | | | | | | | |
| | 500 | | | Strike @ $31 Exp 01/13 | | | 34,485 | | | | 42,500 | |
| | 300 | | | Strike @ $30 Exp 02/13 | | | 17,841 | | | | 49,500 | |
| | 100 | | | Strike @ $32 Exp 02/13 | | | 4,897 | | | | 5,500 | |
| | | |
| | | | United Technologies | | | | | | | | |
| | 680 | | | Strike @ $82.5 Exp 02/13 | | | 91,246 | | | | 105,400 | |
| | 70 | | | Strike @ $82.5 Exp 05/13 | | | 15,678 | | | | 18,900 | |
| | | | | | | | | | | | |
Number of
Contracts | | | Description | | Premium
Received | | | Market
Value | |
| | | | Walgreen | | | | | | | | |
| | 320 | | | Strike @ $33 Exp 01/13 | | | $ 30,071 | | | | $ 85,440 | |
| | 50 | | | Strike @ $35 Exp 01/13 | | | 4,999 | | | | 6,650 | |
| | 1,150 | | | Strike @ $36 Exp 01/13 | | | 48,212 | | | | 96,600 | |
| | 150 | | | Strike @ $36 Exp 04/13 | | | 28,471 | | | | 21,900 | |
| | | |
| | | | Wells Fargo | | | | | | | | |
| | 1,000 | | | Strike @ $36 Exp 04/13 | | | 151,967 | | | | 115,000 | |
| | | |
| | | | Xerox | | | | | | | | |
| | 945 | | | Strike @ $9 Exp 01/13 | | | 26,331 | | | | 2,835 | |
| | 1,976 | | | Strike @ $9 Exp 04/13 | | | 41,134 | | | | 7,904 | |
| | | |
| | | | Zimmer Holdings | | | | | | | | |
| | 100 | | | Strike @ $65 Exp 12/12 | | | 17,797 | | | | 16,500 | |
| | 100 | | | Strike @ $65 Exp 03/13 | | | 24,797 | | | | 30,000 | |
| | 100 | | | Strike @ $70 Exp 03/13 | | | 9,797 | | | | 11,200 | |
| | | | | | | | | | | | |
| | | |
| | | | Total Written Call Options | | | $3,939,696 | | | | $5,821,315 | |
| | | | | | | | | | | | |
See accompanying Notes to Financial Statements.
ASTON/River Road Long-Short Fund
| | |
| |
| Portfolio Manager Commentary (unaudited) | | October 31, 2012 |
| | |
| | Daniel Johnson, CFA & Matthew Moran, CFA |
| Q. | What were the most significant market factors affecting Fund performance and returns relative to the benchmark during the past 12 months? |
| A. | In the last 12 months, the Russell 3000 Index has returned 14.75%. The Fund returned 8.17%, capturing 69% of the market’s return with only 53% net exposure to the market over the same time period. The results were achieved due to strong stock selection. The long book returned 21.95% (outperforming the benchmark by 720 bps) and the individual short book returned 7.14% (outperforming the benchmark by 760 bps). |
| Q. | What were the best performing holdings for the Fund during the period? |
| A. | The holdings with the largest positive contribution to total return during the period were Madison Square Garden Co. and SEI Investments Co. Madison Square Garden is an entertainment company that owns the Garden, the New York Knicks, the New York Rangers, and a percentage of the air rights above the Garden. The company benefits from a long-term contract with Cablevision to broadcast everything that comes out of the Garden. The completion of the Garden’s transformation has removed an overhang and prompted rising ticket prices. SEI Investments provides middle and back office functions to financial institutions. The company benefits from long-term contracts and switching costs. Margins have been under pressure due to a rollout of their Global Wealth Platform, which will improve with |
time. The company maintains a rock solid balance sheet with net cash, a sizeable stake in quantitative value manager LSV Asset Management, and has reduced the share count aggressively over the past decade.
| Q. | What were the weakest performing holdings? |
| A. | The two holdings with the largest negative contribution to the Fund’s total return were a short position in AOL Inc. and a long position in Cloud Peak Energy Inc. AOL is a dial-up internet service provider that suffers from a dramatically declining customer base. Some questionable capital allocation decisions were overwhelmed by the sale of patents to Microsoft. We underestimated the value of the patents, but closed the position at our pre-established Stop-Loss. Cloud Peak Energy is the third largest coal producer in the Powder River Basin. The company was spun-out of Rio Tinto and is the only pure-play Powder River Basin producer. The PRB is the largest energy source in the world. The stock was eliminated due to our unrealized loss discipline. |
| Q. | How was the Fund positioned as of October 31, 2012? |
The Fund was closer to the lower end of its normal net market exposure range (50-70%) at 53% at the end of October. The market rally had made it challenging to find compelling longs. We remain prepared to take advantage of attractive purchase opportunities should volatility return to the market.
Growth of a Hypothetical
$10,000 Investment—Class N
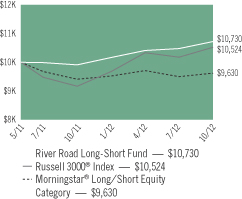
All dividends and capital gains are reinvested. Indexes are unmanaged and do not take into account fees, expenses or other costs.
Returns shown in the chart and table do not reflect taxes that a shareholder would pay on Fund distributions or on the sale of the Fund shares.
Short sales may involve the risk that the Fund will incur a loss by subsequently buying a security at a higher price than which it was previously sold short. A loss incurred on a short sale results from increases in the value of the security, thus losses on a short sale are theoretically unlimited. Value investing often involves buying the stocks of companies that are currently out-of-favor that may decline further. Investing in exchange-traded and closed-end funds subjects the Fund to the additional risk that shares of the underlying fund may trade at a premium or discount to their net asset value.
RETURNFOR PERIOD ENDED 10/31/12
Average Annual Total Returns - Class N
| | | | |
One Year | | | 8.17 | % |
Since Inception | | | 4.82 | % |
Inception Date 05/04/11
The performance data quoted represents past performance. Past performance does not guarantee future results. Investment return and principal value will fluctuate so that an investor’s shares, upon redemption, may be worth more or less than their original cost. Current performance may be lower or higher than the performance data quoted. For performance data current to the most recent month-end, please visit our website at www.astonfunds.com.
The performance quoted would have been lower if fee waivers and/or expense reimbursements had not been in effect.
| | |
| |
| ASTON/River Road Long-Short Fund | | October 31, 2012 |
| |
| Schedule of Investments | | |
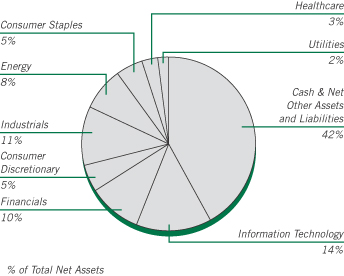
The chart represents total investments in the Fund. Exchange-Traded Funds and Telecommunication Services are negative 2.52% and 1.07%, respectively, and cannot be represented in the pie chart format.
| | | | | | | | |
Shares | | | | | Market
Value | |
|
| | COMMON STOCKS – 72.99% | |
| | |
| | | | Consumer Discretionary – 13.30% | | | | |
| | 6,288 | | | Big Lots * | | $ | 183,169 | |
| | 3,284 | | | General Motors * (a) | | | 83,742 | |
| | 5,283 | | | Guess? (a) | | | 130,913 | |
| | 2,428 | | | Kohl’s (a) | | | 129,364 | |
| | 3,245 | | | Madison Square Garden, Class A * (a) | | | 133,564 | |
| | 11,946 | | | Thomson Reuters (a) | | | 337,594 | |
| | | | | | | | |
| | | | | | | 998,346 | |
| | | | | | | | |
| | |
| | | | Consumer Staples – 6.24% | | | | |
| | 6,461 | | | Harris Teeter Supermarkets | | | 241,964 | |
| | 5,248 | | | Molson Coors Brewing, Class B (a) | | | 226,399 | |
| | | | | | | | |
| | | | | | | 468,363 | |
| | | | | | | | |
| | |
| | | | Energy – 7.76% | | | | |
| | 3,156 | | | Devon Energy (a) | | | 183,711 | |
| | 2,410 | | | Occidental Petroleum (a) | | | 190,294 | |
| | 3,930 | | | Williams Partners LP | | | 208,211 | |
| | | | | | | | |
| | | | | | | 582,216 | |
| | | | | | | | |
| | |
| | | | Financials – 11.46% | | | | |
| | 1,268 | | | Berkshire Hathaway, Class B * (a) | | | 109,492 | |
| | 1,058 | | | BlackRock | | | 200,681 | |
| | 2,878 | | | CME Group (a) | | | 160,966 | |
| | 4,894 | | | Loews (a) | | | 206,918 | |
| | 6,775 | | | MSCI * (a) | | | 182,518 | |
| | | | | | | | |
| | | | | | | 860,575 | |
| | | | | | | | |
| | |
| | | | Healthcare – 3.17% | | | | |
| | 3,142 | | | Becton, Dickinson (a) | | | 237,787 | |
| | | | | | | | |
| | | | | | | | |
Shares | | | | | Market
Value | |
| | |
| | | | Industrials – 14.29% | | | | |
| | 10,202 | | | ABM Industries | | $ | 193,838 | |
| | 6,238 | | | ADT * | | | 258,939 | |
| | 5,506 | | | Expeditors International of Washington (a) | | | 201,575 | |
| | 2,812 | | | General Dynamics | | | 191,441 | |
| | 9,516 | | | Heartland Express | | | 132,748 | |
| | 1,536 | | | Norfolk Southern | | | 94,234 | |
| | | | | | | | |
| | | | | | | 1,072,775 | |
| | | | | | | | |
| | |
| | | | Information Technology – 14.42% | | | | |
| | 2,422 | | | DST Systems (a) | | | 138,151 | |
| | 4,824 | | | Global Payments (a) | | | 206,226 | |
| | 8,986 | | | Microsoft (a) | | | 256,416 | |
| | 4,591 | | | Oracle (a) | | | 142,550 | |
| | 17,661 | | | Western Union (a) | | | 224,295 | |
| | 6,847 | | | Yahoo! * | | | 115,098 | |
| | | | | | | | |
| | | | | | | 1,082,736 | |
| | | | | | | | |
| | |
| | | | Utilities – 2.35% | | | | |
| | 3,343 | | | National Fuel Gas (a) | | | 176,176 | |
| | | | | | | | |
| | |
| | | | Total Common Stocks
(Cost $5,404,356) | | | 5,478,974 | |
| | | | | | | | |
|
| | INVESTMENT COMPANY – 28.40% | |
| | |
| | 2,132,110 | | | BlackRock Liquidity Funds
TempCash Portfolio | | | 2,132,110 | |
| | | | | | | | |
| | |
| | | | Total Investment Company
(Cost $2,132,110) | | | 2,132,110 | |
| | | | | | | | |
| Total Investments – 101.39%
(Cost $7,536,466)*** | | | 7,611,084 | |
| | | | | | | | |
| $1,127,727 in cash and $2,817,979 in securities was segregated or on
deposit with a prime broker to cover short sales as of October 31, 2012
and are included in “Net Other Assets and Liabilities”. |
|
|
| | SHORT SALES – (19.43)% | |
| | |
| | | | Consumer Discretionary – (8.58)% | | | | |
| | (1,903) | | | American Axle & Manufacturing Holdings ** | | | (20,686 | ) |
| | (489) | | | Bed Bath & Beyond ** | | | (28,206 | ) |
| | (320) | | | Charter Communications, Class A ** | | | (24,771 | ) |
| | (632) | | | Children’s Place Retail Stores ** | | | (36,928 | ) |
| | (717) | | | DineEquity ** | | | (44,956 | ) |
| | (845) | | | Finish Line , Class A | | | (17,580 | ) |
| | (1,595) | | | GameStop, Class A | | | (36,414 | ) |
| | (830) | | | Garmin (Switzerland) | | | (31,532 | ) |
| | (4,770) | | | Goodyear Tire & Rubber ** | | | (54,426 | ) |
| | (805) | | | Hanesbrands ** | | | (26,943 | ) |
| | (3,129) | | | Leggett & Platt | | | (83,012 | ) |
| | (662) | | | Life Time Fitness ** | | | (29,717 | ) |
| | (1,390) | | | Mattress Firm Holding ** | | | (44,494 | ) |
| | (1,716) | | | Monro Muffler Brake | | | (58,207 | ) |
| | (4,786) | | | Saks ** | | | (49,200 | ) |
| | (1,956) | | | Sonic ** | | | (19,501 | ) |
| | (989) | | | Thor Industries | | | (37,612 | ) |
| | | | | | | | |
| | | | | | | (644,185 | ) |
| | | | | | | | |
See accompanying Notes to Financial Statements.
| | |
| |
| ASTON/River Road Long-Short Fund | | October 31, 2012 |
| |
| Schedule of Investments – continued | | |
| | | | | | | | |
Shares | | | | | Market
Value | |
| | |
| | | | Consumer Staples – (1.26)% | | | | |
| | (1,626) | | | ConAgra Foods | | $ | (45,268 | ) |
| | (2,396) | | | Smithfield Foods ** | | | (49,046 | ) |
| | | | | | | | |
| | | | | | | (94,314 | ) |
| | | | | | | | |
| | |
| | | | Exchange-Traded Funds – (2.52)% | | | | |
| | (5,582) | | | United States Natural Gas Fund LP ** | | | (121,409 | ) |
| | (2,127) | | | United States Oil Fund LP ** | | | (67,596 | ) |
| | | | | | | | |
| | | | | | | (189,005 | ) |
| | | | | | | | |
| | |
| | | | Financials – (1.43)% | | | | |
| | (1,752) | | | Cincinnati Financial | | | (69,800 | ) |
| | (920) | | | Mercury General | | | (37,288 | ) |
| | | | | | | | |
| | | | | | | (107,088 | ) |
| | | | | | | | |
| | |
| | | | Healthcare – (0.58)% | | | | |
| | (1,107) | | | Emeritus ** | | | (24,852 | ) |
| | (888) | | | Insulet ** | | | (18,834 | ) |
| | | | | | | | |
| | | | | | | (43,686 | ) |
| | | | | | | | |
| | |
| | | | Industrials – (3.05)% | | | | |
| | (3,818) | | | Albany International, Class A | | | (83,881 | ) |
| | (883) | | | Deluxe | | | (27,823 | ) |
| | (983) | | | Granite Construction | | | (29,696 | ) |
| | (1,245) | | | Mobile Mini ** | | | (21,688 | ) |
| | (1,872) | | | RR Donnelley & Sons | | | (18,757 | ) |
| | (1,539) | | | Simpson Manufacturing | | | (46,878 | ) |
| | | | | | | | |
| | | | | | | (228,723 | ) |
| | | | | | | | |
| | |
| | | | Information Technology – (0.52)% | | | | |
| | (1,782) | | | RealPage ** | | | (38,901 | ) |
| | | | | | | | |
| | |
| | | | Telecommunication Services – (1.07)% | | | | |
| | (2,105) | | | CenturyLink | | | (80,790 | ) |
| | | | | | | | |
| | |
| | | | Utilities – (0.42)% | | | | |
| | (514) | | | DTE Energy | | | (31,919 | ) |
| | | | | | | | |
| Total Short Sales – (19.43)%
(Proceeds $1,426,545) | | | (1,458,611 | ) |
| | | | | | | | |
�� | Net Other Assets and Liabilities – 18.04% | | | 1,353,914 | |
| | | | | | | | |
| Net Assets – 100.00% | | $ | 7,506,387 | |
| | | | | | | | |
| * | | Non-income producing security. |
| ** | | No dividend payable on security sold short. |
| *** | | Aggregate cost for Federal income tax purposes is $7,579,024. |
| | | | |
Gross unrealized appreciation | | $ | 210,892 | |
Gross unrealized depreciation | | | (178,832 | ) |
| | | | |
Net unrealized appreciation | | $ | 32,060 | |
| | | | |
| (a) | | Security position is either entirely or partially held in a segregated account as collateral for securities sold short. |
| MSCI | | Morgan Stanley Capital International |
See accompanying Notes to Financial Statements.
ASTON/Barings International Fund
| | |
| |
| Portfolio Manager Commentary (unaudited) | | October 31, 2012 |
David Bertocchi, CFA
| Q. | What were the most significant market factors affecting Fund performance and returns relative to the benchmark during the past 12 months? |
| A. | For the year ended October 31, 2012, Class N Shares of the Fund returned 4.28% in US dollar terms versus the MSCI EAFE index, which returned 4.61%. The main sources of underperformance were our regional and sector allocation strategies. From a regional perspective, our overweight position in Emerging Markets was a drag on relative portfolio performance, although our underweight position in continental Europe partially alleviated this. From a sector perspective, our overweight positions in Information Technology and Energy, and our underweight position in Consumer Staples, were a drag on relative performance, although our overweight position in Healthcare and our underweight position in Utilities alleviated some of the negative impact. Overall, our stock selection produced positive results, particularly in continental Europe and Japan. |
| Q. | What were the best performing holdings for the Fund during the period? |
| A. | The largest positive impact on relative portfolio performance from an individual holding came from Sysmex, a Japanese-listed healthcare equipment manufacturer and service provider. The shares were trading at a discount to our determination of intrinsic value when we purchased the shares for the Fund. Since then, the shares have performed well due to strong operational delivery from the company. In addition, our holding in Japanese company Jupiter Telecom had a strong positive impact on portfolio performance. The company was recently the subject of a bid at a substantial premium to the undisturbed share price prior to the bid. Finally, our holding in Prudential Plc had a strongly positive impact on relative portfolio performance. The company is a UK-listed life insurer with a strongly growing Asian franchise. Continued growth of its business in Asia positively impacted its share price. |
| Q. | What were the weakest performing holdings? |
| A. | The largest negative impact on relative portfolio performance from an individual holding came from Niko Resources, a Canadian-listed emerging markets oil and gas exploration and production company. As well as drilling a number of dry wells as part of its exploration program, the company also wrote down reserves on its offshore D6 development after the company and its partner, Reliance, could not agree on adequate commercial terms with the Indian government. We see significant upside potential if the company is able to find commercial reserves as part of its drilling program, particularly in offshore Indonesia. Our holding in CentaminPlc, a UK-listed gold miner with most of its production coming from the Sukari mine in Egypt had a negative impact on portfolio performance, particularly towards the very end of the year. At this time, the company announced that an individual had filed a lawsuit against the Egyptian authorities, challenging the process by which Centamin had obtained its Sukari concession. |
| Q. | How was the Fund positioned as of October 31, 2012? |
| A. | The ongoing woes of the European economy lead us to an underweight position in continental Europe. This is manifested mostly through a significant underweight in European banks; we hold no euro-zone banks. In addition, we are heavily underweight Australia. We have concerns that the economic slowdown in China will have a substantially negative impact on the Australian economy. In addition, we have concerns that housing prices may see a substantial fall. These two underweight positions fund an overweight position in Emerging Markets, where we find an attractive risk-return trade-off in a number of names, particularly given the asset class’ superior growth prospects. At a sector level, we remain underweight Consumer Staples, where although we like the companies in the sector, we find the valuation levels too expensive to warrant profitable investment. We remain overweight the Information Technology sector, where we have a number of interesting individual stock ideas. |
Growth of a Hypothetical
$10,000 Investment—Class I
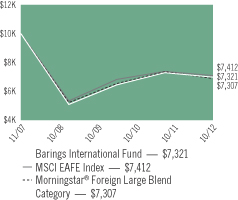
All dividends and capital gains are reinvested. Indexes are unmanaged and do not take into account fees, expenses or other costs.
Returns shown in the chart and table do not reflect taxes that a shareholder would pay on Fund distributions or on the sale of the Fund shares.
Investments made in securities of foreign companies may be less liquid and may fluctuate more widely than those traded in U.S. markets.
Emerging market securities may be subject to additional risks such as price volatility, currency fluctuation, financial reporting requirements as well as political and economic instability.
RETURNSFOR PERIOD ENDED 10/31/12
Average Annual Total Returns - Class N
| | | | |
One Year | | | 4.28 | % |
Since Inception | | | 4.20 | % |
Inception Date 03/03/10
Average Annual Total Returns - Class I
| | | | |
One Year | | | 4.72 | % |
Since Inception | | | -6.05 | % |
Inception Date 11/02/07
The performance data quoted represents past performance. Past performance does not guarantee future results. Investment return and principal value will fluctuate so that an investor’s shares, upon redemption, may be worth more or less than their original cost. Current performance may be lower or higher than the performance data quoted. For performance data current to the most recent month-end, please visit our website at www.astonfunds.com.
The performance quoted would have been lower if fee waivers and/or expense reimbursements had not been in effect.
| | |
| |
| ASTON/Barings International Fund | | October 31, 2012 |
| |
| Schedule of Investments | | |
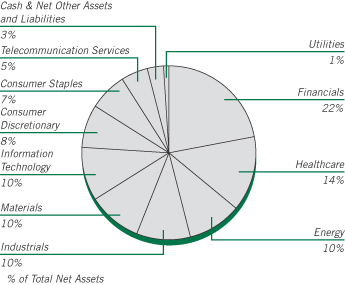
| | | | | | | | |
Shares | | | | | Market
Value | |
| |
| | COMMON STOCKS – 97.17% | | | | |
| | |
| | | | Australia – 1.46% | | | | |
| | 33,104 | | | Newcrest Mining | | $ | 908,234 | |
| | | | | | | | |
| | |
| | | | Belgium – 1.81% | | | | |
| | 13,434 | | | Anheuser-Busch InBev | | | 1,123,273 | |
| | | | | | | | |
| | |
| | | | China – 1.27% | | | | |
| | 7,400 | | | Baidu, SP ADR * | | | 788,988 | |
| | | | | | | | |
| | |
| | | | Denmark – 1.33% | | | | |
| | 5,123 | | | Novo Nordisk, Class B | | | 825,594 | |
| | | | | | | | |
| | |
| | | | France – 6.28% | | | | |
| | 12,509 | | | Sanofi | | | 1,099,596 | |
| | 12,161 | | | Scor Se | | | 324,548 | |
| | 35,512 | | | SES | | | 982,711 | |
| | 64,173 | | | Suez Environnement | | | 681,472 | |
| | 16,159 | | | Total | | | 813,060 | |
| | | | | | | | |
| | | | | | | 3,901,387 | |
| | | | | | | | |
| | |
| | | | Germany – 8.24% | | | | |
| | 10,788 | | | Bayer | | | 939,503 | |
| | 18,365 | | | Deutsche Boerse | | | 994,041 | |
| | 9,386 | | | Fresenius | | | 1,070,572 | |
| | 7,163 | | | Muenchener Rueckversicherungs-Gesellschaft | | | 1,151,249 | |
| | 13,140 | | | SAP | | | 957,160 | |
| | | | | | | | |
| | | | | | | 5,112,525 | |
| | | | | | | | |
| | |
| | | | Hong Kong – 1.01% | | | | |
| | 45,000 | | | Sun Hung Kai Properties | | | 626,512 | |
| | | | | | | | |
| | |
| | | | India – 0.39% | | | | |
| | 19,209 | | | Niko Resources | | | 244,644 | |
| | | | | | | | |
| | | | | | | | |
Shares | | | | | Market
Value | |
| | |
| | | | Israel – 2.84% | | | | |
| | 83,586 | | | Israel Chemicals | | $ | 1,045,995 | |
| | 17,781 | | | Teva Pharmaceutical Industries, SP ADR | | | 718,708 | |
| | | | | | | | |
| | | | | | | 1,764,703 | |
| | | | | | | | |
| | |
| | | | Japan – 20.39% | | | | |
| | 10,300 | | | Daito Trust Construction | | | 1,039,935 | |
| | 14,600 | | | East Japan Railway | | | 1,002,230 | |
| | 4,400 | | | FANUC | | | 700,539 | |
| | 72,000 | | | Hitachi Metals | | | 673,732 | |
| | 26,900 | | | Honda Motor | | | 805,349 | |
| | 61,000 | | | Isuzu Motors | | | 322,460 | |
| | 738 | | | Jupiter Telecommunications | | | 1,003,044 | |
| | 2,990 | | | KEYENCE | | | 793,288 | |
| | 14,500 | | | Komatsu | | | 303,695 | |
| | 10,500 | | | Kyocera | | | 922,022 | |
| | 46,300 | | | Mitsubishi | | | 826,475 | |
| | 72,000 | | | Mitsubishi Electric | | | 537,542 | |
| | 10,500 | | | Nidec | | | 747,088 | |
| | 83,700 | | | Rakuten | | | 752,807 | |
| | 10,500 | | | Sysmex | | | 493,893 | |
| | 37,800 | | | Tokio Marine Holdings | | | 1,000,519 | |
| | 16,400 | | | Tokyo Electron | | | 736,490 | |
| | | | | | | | |
| | | | | | | 12,661,108 | |
| | | | | | | | |
| | |
| | | | Mexico – 3.50% | | | | |
| | 40,591 | | | America Movil, Class L, ADR | | | 1,026,546 | |
| | 36,925 | | | Fresnillo | | | 1,143,497 | |
| | | | | | | | |
| | | | | | | 2,170,043 | |
| | | | | | | | |
| | |
| | | | Netherlands – 3.40% | | | | |
| | 9,116 | | | ASML Holding | | | 501,574 | |
| | 12,619 | | | Fugro | | | 853,130 | |
| | 22,009 | | | Royal Dutch Shell | | | 754,677 | |
| | | | | | | | |
| | | | | | | 2,109,381 | |
| | | | | | | | |
| | |
| | | | Norway – 1.01% | | | | |
| | 28,583 | | | Subsea 7 | | | 627,179 | |
| | | | | | | | |
| | |
| | | | Papua New Guinea – 1.29% | | | | |
| | 103,595 | | | Oil Search | | | 800,078 | |
| | | | | | | | |
| | |
| | | | Russia – 1.09% | | | | |
| | 73,963 | | | Gazprom, SP ADR | | | 676,022 | |
| | | | | | | | |
| | |
| | | | Singapore – 3.07% | | | | |
| | 86,000 | | | DBS Group Holdings | | | 979,997 | |
| | 105,700 | | | Keppel | | | 923,727 | |
| | | | | | | | |
| | | | | | | 1,903,724 | |
| | | | | | | | |
| | |
| | | | South Korea – 3.47% | | | | |
| | 60,673 | | | KT, SP ADR | | | 1,028,407 | |
| | 936 | | | Samsung Electronics | | | 1,124,299 | |
| | | | | | | | |
| | | | | | | 2,152,706 | |
| | | | | | | | |
See accompanying Notes to Financial Statements.
| | |
| |
| ASTON/Barings International Fund | | October 31, 2012 |
| |
| Schedule of Investments – continued | | |
| | | | | | | | |
Shares | | | | | Market
Value | |
| | |
| | | | Sweden – 2.90% | | | | |
| | 62,828 | | | Elekta AB, B Shares | | $ | 895,121 | |
| | 137,120 | | | TeliaSonera | | | 902,777 | |
| | | | | | | | |
| | | | | | | 1,797,898 | |
| | | | | | | | |
| | |
| | | | Switzerland – 8.16% | | | | |
| | 29,721 | | | Julius Baer Group | | | 1,030,805 | |
| | 4,321 | | | Roche Holding | | | 830,979 | |
| | 2,549 | | | Syngenta | | | 995,733 | |
| | 78,583 | | | UBS | | | 1,177,943 | |
| | 4,190 | | | Zurich Financial Services | | | 1,032,540 | |
| | | | | | | | |
| | | | | | | 5,068,000 | |
| | | | | | | | |
| | |
| | | | United Kingdom – 24.26% | | | | |
| | 50,639 | | | Admiral Group | | | 905,450 | |
| | 37,899 | | | BG Group | | | 701,811 | |
| | 18,592 | | | British American Tobacco | | | 920,944 | |
| | 66,323 | | | Cairn Energy PLC | | | 300,004 | |
| | 445,208 | | | Centamin * | | | 416,707 | |
| | 28,520 | | | Experian | | | 492,462 | |
| | 41,050 | | | GlaxoSmithKline | | | 918,486 | |
| | 154,154 | | | ICAP | | | 808,744 | |
| | 26,795 | | | Imperial Tobacco Group | | | 1,011,834 | |
| | 86,002 | | | Prudential | | | 1,177,606 | |
| | 9,208 | | | Randgold Resources | | | 1,099,604 | |
| | 216,390 | | | Resolution | | | 762,308 | |
| | 57,474 | | | Rolls-Royce Holdings | | | 792,543 | |
| | 4,368,024 | | | Rolls-Royce Holdings, C Shares * (a) (b) | | | 7,049 | |
| | 26,758 | | | SABMiller | | | 1,146,241 | |
| | 29,188 | | | Shire | | | 820,996 | |
| | 35,287 | | | Standard Chartered | | | 833,387 | |
| | 31,265 | | | Tullow Oil | | | 708,378 | |
| | 95,917 | | | WPP | | | 1,237,524 | |
| | | | | | | | |
| | | | | | | 15,062,078 | |
| | | | | | | | |
| | |
| | | | Total Common Stocks
(Cost $59,216,083) | | | 60,324,077 | |
| | | | | | | | |
|
| | INVESTMENT COMPANY – 2.66% | |
| | |
| | 1,653,984 | | | BlackRock Liquidity Funds
TempCash Portfolio | | | 1,653,984 | |
| | | | | | | | |
| | |
| | | | Total Investment Company
(Cost $1,653,984) | | | 1,653,984 | |
| | | | | | | | |
| Total Investments – 99.83%
(Cost $60,870,067)** | | | 61,978,061 | |
| | | | | | | | |
| Net Other Assets and Liabilities – 0.17% | | | 105,595 | |
| | | | | | | | |
| Net Assets – 100.00% | | $ | 62,083,656 | |
| | | | | | | | |
| * | | Non-income producing security. |
| ** | | Aggregate cost for Federal income tax purposes is $61,184,602. |
| | | | |
Gross unrealized appreciation | | $ | 5,930,199 | |
Gross unrealized depreciation | | | (5,136,740 | ) |
| | | | |
Net unrealized appreciation | | $ | 793,459 | |
| | | | |
| (a) | | Security with a total aggregate market value of $7,049 or 0.01% of the net assets, was valued under the fair value procedures established by the Funds’ Board of Trustees. |
| (b) | | This security has been determined by the Subadviser to be an illiquid security. At October 31, 2012, this security amounted to $7,049 or 0.01% of net assets. |
| ADR | | American Depositary Receipt |
| SP ADR | | Sponsored American Depositary Receipt |
See accompanying Notes to Financial Statements.
ASTON/Harrison Street Real Estate Fund
| | |
| |
| Portfolio Manager Commentary (unaudited) | | October 31, 2012 |
| | | | |
| | | James Kammert, CFA & Reagan Pratt | |
| Q. | What were the most significant market factors affecting Fund performance and returns relative to the benchmark during the past 12 months? |
| A. | Stock selection and an underweight position in mostly underperforming large-cap real estate investment trusts (REITs) aided relative performance during the period, while strong stock selection across the mid- and small-cap portions of the real estate sector also generated positive performance. A “risk-on” market environment for much of the past 12 months favored more growth-oriented mid- and small-cap REITs. Broad investor demand for higher yields also favored the securities at the smaller end of the sector relative to the perceived “safety” of large-caps. |
| Q. | What were the best performing holdings for the Fund during the period? |
| A. | Positions in small-cap Sabra Health Care, an owner of assisted living facilities and nursing homes, and STAG Industrial, a middle market focused industrial/warehouse landlord each delivered total returns that were multiples of the Fund’s benchmark index. Both were highly acquisitive in their respective sectors and offered investors appealing discounted valuations relative to their peers, complemented by higher dividend yields. At the other end of the spectrum, a consistent overweight position in national mall owner Simon Properties Group, the largest REIT in the industry, outdistanced the benchmark given its sequential dividend growth and strong operating results. A timely position in large-cap, international industrial owner Prologis also boosted results as it was held in the portfolio during a span when it bounced from a discount cash flow multiple to fair value, leading us to sell the position. Mid-cap mall owner CBL & Associates continued to close the relative valuation gap |
| | with its larger cap peers and contributed positively to portfolio performance. |
| Q. | What were the weakest performing holdings? |
| A. | After an extended, multi-year span of outperformance, shares of the data center landlords DuPont Fabros Technology and Digital Realty Trust rolled over during the late summer and early fall of 2012, crimping performance. Although operating results continued to come in as expected for both, investor concerns relating to prospective rental rates/pricing power and data center space demand in the face of continued sluggish corporate capital spending/decision-making pressured the shares heavily. Despite sound, sustained operating metrics national apartment owner/developer UDR lagged its apartment peers and the benchmark. |
| Q. | How was the Fund positioned as of October 31, 2012? |
| A. | Despite the underperformance of large-cap REITs, we continue to think that relative valuation among mid- and small-cap companies remains more attractive as a whole. The valuation discrepancies among market-capitalizations tend to be more enduring and take longer to play out over time. Thus, at present, the portfolio remains tilted toward mid- and small-cap allocations (70% of assets) and underweight (30%) large-cap names. Meanwhile, we think our disciplined, bottom-up valuation screens allow us to identify relative value across the capitalization spectrum and tilt the portfolio toward stocks exhibiting visible external growth opportunities (acquisitions and largely pre-lease development) and stabilizing internal metrics (occupancy and rental rates) which should collectively translate to higher overall cash flow and dividend growth. |
Growth of a Hypothetical
$10,000 Investment—Class N
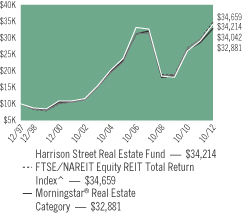
All dividends and capital gains are reinvested. Indexes are unmanaged and do not take into account fees, expenses or other costs.
Returns shown in the chart and table do not reflect taxes that a shareholder would pay on Fund distributions or on the sale of the Fund shares.
Real estate funds may be subject to a higher degree of market risk than diversified funds because of the concentration in a specific industry or geographical sector. Risks also include declines in the value of real estate, general and economic conditions, changes in the value of underlying property and defaults by borrowers.
RETURNSFOR PERIOD ENDED 10/31/12
Average Annual Total Returns - Class N
| | | | |
One Year | | | 17.85 | % |
Five Year | | | 0.95 | % |
Ten Year | | | 11.50 | % |
Since Inception | | | 8.65 | % |
Inception Date 12/30/97
Average Annual Total Returns - Class I
| | | | |
One Year | | | 18.16 | % |
Five Year | | | 1.19 | % |
Since Inception | | | 5.12 | % |
Inception Date 09/20/05
The performance data quoted represents past performance. Past performance does not guarantee future results. Investment return and principal value will fluctuate so that an investor’s shares, upon redemption, may be worth more or less than their original cost. Current performance may be lower or higher than the performance data quoted. For performance data current to the most recent month-end, please visit our website at www.astonfunds.com.
The performance quoted would have been lower if fee waivers and/or expense reimbursements had not been in effect.
The total expense ratio for the Class N and Class I Shares is 1.69% and 1.44% respectively, as disclosed in the prospectus dated March 1, 2012. The performance quoted would have been lower if waivers had not been in effect. Please refer to the Financial Highlights section in this report for more 2012 fiscal year-end related information.
| | |
| |
| ASTON/Harrison Street Real Estate Fund | | October 31, 2012 |
| |
| Schedule of Investments | | |
| | | | | | | | |
Shares | | | | | Market
Value | |
|
| | COMMON STOCKS – 99.15% | |
| | |
| | | | Diversified – 21.91% | | | | |
| | 12,200 | | | American Tower | | $ | 918,539 | |
| | 5,700 | | | Digital Realty Trust | | | 350,151 | |
| | 5,700 | | | Dundee Real Estate Investment Trust (Canada) | | | 209,166 | |
| | 13,300 | | | Dupont Fabros Technology | | | 285,418 | |
| | 4,500 | | | Entertainment Properties Trust | | | 200,025 | |
| | 7,100 | | | Rayonier | | | 347,971 | |
| | | | | | | | |
| | | | | | | 2,311,270 | |
| | | | | | | | |
| | |
| | | | Healthcare – 14.37% | | | | |
| | 14,500 | | | Health Care, REIT | | | 861,735 | |
| | 27,500 | | | Medical Properties Trust | | | 315,700 | |
| | 15,220 | | | Sabra Health Care | | | 338,188 | |
| | | | | | | | |
| | | | | | | 1,515,623 | |
| | | | | | | | |
| | |
| | | | Hotels – 5.74% | | | | |
| | 11,100 | | | LaSalle Hotel Properties | | | 265,734 | |
| | 13,600 | | | Orient-Express Hotels, Class A (Bermuda)* | | | 159,528 | |
| | 10,100 | | | RLJ Lodging Trust | | | 179,982 | |
| | | | | | | | |
| | | | | | | 605,244 | |
| | | | | | | | |
| | |
| | | | Industrial – 4.02% | | | | |
| | 19,500 | | | CubeSmart | | | 255,840 | |
| | 9,700 | | | STAG Industrial | | | 168,004 | |
| | | | | | | | |
| | | | | | | 423,844 | |
| | | | | | | | |
| | |
| | | | Office Properties – 14.51% | | | | |
| | 4,500 | | | Alexandria Real Estate Equities | | | 316,935 | |
| | 20,300 | | | BioMed Realty Trust | | | 388,136 | |
| | 10,200 | | | Corporate Office Properties Trust | | | 254,490 | |
| | 7,575 | | | SL Green Realty | | | 570,398 | |
| | | | | | | | |
| | | | | | | 1,529,959 | |
| | | | | | | | |
| | | | | | | | |
Shares | | | | | Market
Value | |
| | |
| | | | Residential – 14.80% | | | | |
| | 13,400 | | | Apartment Investment & Management, Class A | | $ | 357,646 | |
| | 5,100 | | | Camden Property Trust | | | 334,713 | |
| | 2,200 | | | Essex Property Trust | | | 330,000 | |
| | 3,900 | | | Mid-America Apartment Communities | | | 252,369 | |
| | 11,800 | | | UDR | | | 286,386 | |
| | | | | | | | |
| | | | | | | 1,561,114 | |
| | | | | | | | |
| | |
| | | | Retail – 23.80% | | | | |
| | 10,200 | | | CBL & Associates Properties | | | 228,174 | |
| | 2,700 | | | Federal Realty Investment Trust | | | 291,141 | |
| | 17,000 | | | General Growth Properties | | | 334,220 | |
| | 19,700 | | | Inland Real Estate | | | 160,949 | |
| | 19,700 | | | Kimco Realty | | | 384,544 | |
| | 7,300 | | | Simon Property Group | | | 1,111,133 | |
| | | | | | | | |
| | | | | | | 2,510,161 | |
| | | | | | | | |
| | |
| | | | Total Common Stocks
(Cost $9,877,857) | | | 10,457,215 | |
| | | | | | | | |
|
| | INVESTMENT COMPANY – 1.74% | |
| | |
| | 183,700 | | | BlackRock Liquidity Funds TempCash Portfolio | | | 183,700 | |
| | | | | | | | |
| | |
| | | | Total Investment Company
(Cost $183,700) | | | 183,700 | |
| | | | | | | | |
| Total Investments – 100.89%
(Cost $10,061,557)** | | | 10,640,915 | |
| | | | | | | | |
| Net Other Assets and Liabilities – (0.89)% | | | (94,311 | ) |
| | | | | | | | |
| Net Assets – 100.00% | | $ | 10,546,604 | |
| | | | | | | | |
| * | | Non-income producing security. |
| ** | | Aggregate cost for Federal income tax purposes is $10,193,571. |
| | | | |
Gross unrealized appreciation | | $ | 735,832 | |
Gross unrealized depreciation | | | (288,488 | ) |
| | | | |
Net unrealized appreciation | | $ | 447,344 | |
| | | | |
| REIT | | Real Estate Investment Trust |
See accompanying Notes to Financial Statements.
ASTON/Montag & Caldwell Balanced Fund
| | |
| |
| Portfolio Manager Commentary (unaudited) | | October 31, 2012 |
Ronald E. Canakaris, CFA, CIC
| Q. | What were the most significant market factors affecting Fund performance and returns relative to the benchmark during the past 12 months? |
| A. | The Fund’s Class N Shares generated a solid gain of 8.03% during the past year. The equity returns modestly trailed the Russell 1000 Growth Index and the S&P 500. The Fund benefited from good stock selection in the Information Technology, Materials and Industrials sectors, as well as the underweight position to the Energy sector. This was offset by negative stock selection in the Energy and Consumer Discretionary sectors, the Fund’s cash reserve and an underweight position in Information Technology relative to the Russell 1000 Growth Index. The fixed income returns lagged the Barclays U.S. Government Credit Index, as interest rates defied expectations and fell during the period. The Fund has continued to maintain a duration that is shorter than the benchmark, as low yield levels do not offer a compelling risk/reward tradeoff. The Fund owns corporate bonds rated A or higher, while the Index has a weighting of approximately 13% in BBB bonds, which significantly outperformed during the period. |
| Q. | What were the best performing holdings for the Fund during the period? |
| A. | Visa was the Fund’s top performing stock for the 12-month period as the company continues to enjoy strong revenue and earnings growth despite the increased regulatory environment. While Apple was the Fund’s second best performing stock on an absolute basis, the Fund’s weighting in the stock is less than the Russell 1000 Growth Index and thus the underweight position detracted from relative performance. TJX had another year of strong gains as the company continues to benefit from consumers’ focus on value in the weak economic environment. The Fund established a position in Amazon and the stock performed very well during the period, triggering a sale as the stock appreciated to a 20% premium to our estimated present value. eBay was purchased during the period and rose as the |
| | company continues to benefit from growth in online commerce and it has become a leader in online payments with its PayPal division. |
| Q. | What were the weakest performing holdings? |
| A. | We initiated a position in Juniper Networks during the period after the stock had been weak, but it declined further subsequent to our purchase. Juniper is well positioned to benefit from the company’s five new product launches and a return to normal carrier spending patterns in 2013. Occidental Petroleum was weak, as the company has experienced rising costs, which tempered investors’ enthusiasm for the company’s above industry production growth. A position was established in Starbuck’s during the period, but the stock declined after the purchase, as revenues were less than expected over the summer due to the weak economic environment. The company has domestic and international growth opportunities and is benefiting from declining commodity costs. JP Morgan declined during the period and was eliminated as financial stocks continued to suffer multiple compression. |
| Q. | How was the Fund positioned as of October 31, 2012? |
| A. | While central bank actions are supportive of share prices, the market may have gotten ahead of its fundamentals, and it would not be surprising if the period ahead is more challenging. Corporate profit expectations seem too high with global growth slowing and profit margins near record levels and it is uncertain if the fiscal cliff will be dealt with effectively after the election. We believe the outlook for the higher quality growth stocks held in the Fund is very promising. The shares of these companies are reasonably valued, and their earnings growth is more assured due to their financial strength and global diversification. The bond portion of the Fund continues to have a duration that is shorter than the benchmark and is overweight high quality intermediate corporate bonds. |
Growth of a Hypothetical
$10,000 Investment—Class N
All dividends and capital gains are reinvested. Indexes are unmanaged and do not take into account fees, expenses or other costs.
Returns shown in the chart and table do not reflect taxes that a shareholder would pay on Fund distributions or on the sale of the Fund shares.
The Fund is subject to interest rate risk associated with the underlying bond holdings in the portfolio. The value of the Fund can decline as interest rates rise and an investor can lose principal.
RETURNSFOR PERIOD ENDED 10/31/12
Average Annual Total Returns - Class N
| | | | |
One Year | | | 8.03 | % |
Five Year | | | 2.78 | % |
Ten Year | | | 5.24 | % |
Since Inception | | | 7.45 | % |
Inception Date 11/02/94
Average Annual Total Returns - Class I
| | | | |
One Year | | | 8.14 | % |
Five Year | | | 2.94 | % |
Ten Year | | | 5.45 | % |
Since Inception | | | 3.47 | % |
Inception Date 12/31/98
The performance data quoted represents past performance. Past performance does not guarantee future results. Investment return and principal value will fluctuate so that an investor’s shares, upon redemption, may be worth more or less than their original cost. Current performance may be lower or higher than the performance data quoted. For performance data current to the most recent month-end, please visit our website at www.astonfunds.com.
The performance quoted would have been lower if fee waivers and/or expense reimbursements had not been in effect.
The total expense ratio for the N class and I class is 1.61% and 1.36% respectively, as disclosed in the prospectus dated March 1, 2012. Please refer to the Financial Highlights section in this report for more 2012 fiscal year-end related information.
| | |
| |
| ASTON/Montag & Caldwell Balanced Fund | | October 31, 2012 |
| |
| Schedule of Investments | | |
| | | | | | | | |
Shares | | | | | Market
Value | |
|
| | COMMON STOCKS – 54.69% | |
| | |
| | | | Consumer Discretionary – 5.92% | | | | |
| | 6,600 | | | Bed Bath & Beyond * | | $ | 380,688 | |
| | 3,900 | | | Las Vegas Sands | | | 181,116 | |
| | 3,500 | | | McDonald’s | | | 303,800 | |
| | 2,650 | | | NIKE, Class B | | | 242,157 | |
| | 4,050 | | | Omnicom Group | | | 194,036 | |
| | 9,100 | | | Starbucks | | | 417,690 | |
| | 6,250 | | | TJX | | | 260,188 | |
| | | | | | | | |
| | | | | | | 1,979,675 | |
| | | | | | | | |
| | |
| | | | Consumer Staples – 15.36% | | | | |
| | 24,000 | | | Coca-Cola | | | 892,320 | |
| | 5,916 | | | Colgate-Palmolive | | | 620,943 | |
| | 6,100 | | | Costco Wholesale | | | 600,423 | |
| | 7,816 | | | Kraft Foods Group * | | | 355,472 | |
| | 26,550 | | | Mondelez International, Class A | | | 704,637 | |
| | 6,720 | | | PepsiCo | | | 465,293 | |
| | 7,400 | | | Philip Morris International | | | 655,344 | |
| | 6,250 | | | Procter & Gamble | | | 432,750 | |
| | 11,300 | | | Unilever (Netherlands) | | | 414,597 | |
| | | | | | | | |
| | | | | | | 5,141,779 | |
| | | | | | | | |
| | |
| | | | Energy – 4.14% | | | | |
| | 9,900 | | | Cameron International * | | | 501,336 | |
| | 7,200 | | | Occidental Petroleum | | | 568,512 | |
| | 4,550 | | | Schlumberger | | | 316,362 | |
| | | | | | | | |
| | | | | | | 1,386,210 | |
| | | | | | | | |
| | |
| | | | Financials – 1.36% | | | | |
| | 13,500 | | | Wells Fargo | | | 454,815 | |
| | | | | | | | |
| | |
| | | | Healthcare – 8.94% | | | | |
| | 13,450 | | | Abbott Laboratories | | | 881,244 | |
| | 7,250 | | | Allergan | | | 651,920 | |
| | 10,750 | | | AmerisourceBergen | | | 423,980 | |
| | | | | | | | |
Shares | | | | | Market
Value | |
| | |
| | | | Healthcare (continued) | | | | |
| | 9,865 | | | Express Scripts * | | $ | 607,092 | |
| | 8,150 | | | Stryker | | | 428,690 | |
| | | | | | | | |
| | | | | | | 2,992,926 | |
| | | | | | | | |
| | |
| | | | Industrials – 3.88% | | | | |
| | 39,100 | | | General Electric | | | 823,446 | |
| | 6,500 | | | United Parcel Service, Class B | | | 476,125 | |
| | | | | | | | |
| | | | | | | 1,299,571 | |
| | | | | | | | |
| | |
| | | | Information Technology – 12.94% | | | | |
| | 4,750 | | | Accenture, Class A (Ireland) | | | 320,198 | |
| | 1,187 | | | Apple | | | 706,384 | |
| | 8,600 | | | eBay * | | | 415,294 | |
| | 7,200 | | | EMC * | | | 175,824 | |
| | 592 | | | Google, Class A * | | | 402,424 | |
| | 21,660 | | | Juniper Networks * | | | 358,906 | |
| | 18,800 | | | Oracle | | | 583,740 | |
| | 12,900 | | | Qualcomm | | | 755,617 | |
| | 4,400 | | | Visa, Class A | | | 610,544 | |
| | | | | | | | |
| | | | | | | 4,328,931 | |
| | | | | | | | |
| | |
| | | | Materials – 2.15% | | | | |
| | 8,350 | | | Monsanto | | | 718,685 | |
| | | | | | | | |
| | |
| | | | Total Common Stocks
(Cost $16,015,205) | | | 18,302,592 | |
| | | | | | | | |
Par Value | | | | | | |
|
| | CORPORATE NOTES AND BONDS – 23.19% | |
| | |
| | | | Consumer Staples – 4.08% | | | | |
| | $350,000 | | | Coca-Cola
Senior Unsecured Notes
5.350%, 11/15/17 | | | 421,630 | |
| | 400,000 | | | PepsiCo
Senior Unsecured Notes
5.000%, 06/01/18 | | | 475,769 | |
| | 450,000 | | | Wal-Mart Stores
Senior Unsecured Notes
3.200%, 05/15/14 | | | 469,242 | |
| | | | | | | | |
| | | | | | | 1,366,641 | |
| | | | | | | | |
| | |
| | | | Energy – 0.30% | | | | |
| | 95,000 | | | ConocoPhillips
4.750%, 02/01/14 | | | 100,028 | |
| | | | | | | | |
| | |
| | | | Financials – 5.62% | | | | |
| | 425,000 | | | General Electric Capital
Senior Unsecured Notes, MTN 4.375%, 09/16/20 | | | 475,985 | |
| | 450,000 | | | JPMorgan Chase
Senior Unsecured Notes
4.350%, 08/15/21 | | | 503,449 | |
| | 400,000 | | | U.S. Bancorp
Senior Unsecured Notes
4.200%, 05/15/14 | | | 422,749 | |
See accompanying Notes to Financial Statements.
| | |
| |
| ASTON/Montag & Caldwell Balanced Fund | | October 31, 2012 |
| |
| Schedule of Investments – continued | | |
| | | | | | | | |
Par Value | | | | | Market
Value | |
| | |
| | | | Financials (continued) | | | | |
| | $450,000 | | | Wells Fargo
Senior Unsecured Notes, MTN, Series 1 3.750%, 10/01/14 | | $ | 477,789 | |
| | | | | | | | |
| | | | | | | 1,879,972 | |
| | | | | | | | |
| | |
| | | | Healthcare – 3.96% | | | | |
| | 400,000 | | | Abbott Laboratories
Senior Unsecured Notes
4.350%, 03/15/14 | | | 421,706 | |
| | 300,000 | | | Johnson & Johnson
Senior Unsecured Notes
5.950%, 08/15/37 | | | 428,863 | |
| | 450,000 | | | Medtronic
Senior Unsecured Notes
3.000%, 03/15/15 | | | 474,431 | |
| | | | | | | | |
| | | | | | | 1,325,000 | |
| | | | | | | | |
| | |
| | | | Industrials – 3.07% | | | | |
| | 450,000 | | | United Parcel Service
Senior Unsecured Notes
3.125%, 01/15/21 | | | 489,038 | |
| | 500,000 | | | United Technologies
Senior Unsecured Notes
3.100%, 06/01/22 | | | 538,960 | |
| | | | | | | | |
| | | | | | | 1,027,998 | |
| | | | | | | | |
| | |
| | | | Information Technology – 4.78% | | | | |
| | 400,000 | | | Cisco Systems
Senior Unsecured Notes
5.500%, 02/22/16 | | | 463,194 | |
| | 400,000 | | | Google
Senior Unsecured Notes
3.625%, 05/19/21 | | | 450,018 | |
| | 300,000 | | | Hewlett-Packard
Senior Unsecured Notes
4.500%, 03/01/13 | | | 303,286 | |
| | 375,000 | | | Oracle
Senior Unsecured Notes
4.950%, 04/15/13 | | | 382,619 | |
| | | | | | | | |
| | | | | | | 1,599,117 | |
| | | | | | | | |
| | |
| | | | Telecommunication Services – 1.38% | | | | |
| | 400,000 | | | Verizon Communications
Senior Unsecured Notes
5.550%, 02/15/16 | | | 460,653 | |
| | | | | | | | |
| | |
| | | | Total Corporate Notes and Bonds
(Cost $7,324,758) | | | 7,759,409 | |
| | | | | | | | |
|
| | U.S. GOVERNMENT AND AGENCY OBLIGATIONS – 15.32% | |
| | |
| | | | Fannie Mae – 0.95% | | | | |
| | 250,000 | | | 0.500%, 07/02/15 | | | 250,763 | |
| | 16,890 | | | 7.500%, 02/01/35,
Pool # 787557 | | | 20,802 | |
| | 5,115 | | | 7.500%, 04/01/35,
Pool # 819231 | | | 6,033 | |
| | | | | | | | |
Par Value | | | | | Market
Value | |
| | |
| | | | Fannie Mae (continued) | | | | |
| | $34,969 | | | 6.000%, 11/01/35,
Pool # 844078 | | $ | 39,100 | |
| | | | | | | | |
| | | | | | | 316,698 | |
| | | | | | | | |
| | |
| | | | Freddie Mac – 2.02% | | | | |
| | 200,000 | | | 4.500%, 01/15/13 | | | 201,793 | |
| | 450,000 | | | 1.000%, 09/29/17 | | | 453,750 | |
| | 18,293 | | | 5.500%, 12/01/20,
Gold Pool # G11820 | | | 19,946 | |
| | | | | | | | |
| | | | | | | 675,489 | |
| | | | | | | | |
| |
| | | | Government National Mortgage Association – 0.09% | |
| | 26,883 | | | 5.500%, 02/15/39,
Pool # 698060 | | | 29,712 | |
| | | | | | | | |
| | |
| | | | U.S. Treasury Bonds – 2.40% | | | | |
| | 375,000 | | | 5.375%, 02/15/31 | | | 539,355 | |
| | 250,000 | | | 3.125%, 11/15/41 | | | 264,414 | |
| | | | | | | | |
| | | | | | | 803,769 | |
| | | | | | | | |
| | |
| | | | U.S. Treasury Notes – 9.86% | | | | |
| | 350,000 | | | 0.250%, 02/15/15 | | | 349,453 | |
| | 400,000 | | | 4.000%, 02/15/15 | | | 433,438 | |
| | 300,000 | | | 4.500%, 02/15/16 | | | 339,750 | |
| | 475,000 | | | 2.625%, 04/30/16 | | | 510,514 | |
| | 425,000 | | | 4.625%, 02/15/17 | | | 497,316 | |
| | 500,000 | | | 3.125%, 05/15/19 | | | 566,407 | |
| | 575,000 | | | 2.125%, 08/15/21 | | | 604,558 | |
| | | | | | | | |
| | | | | | | 3,301,436 | |
| | | | | | | | |
| | |
| | | | Total U.S. Government and Agency Obligations
(Cost $4,868,465) | | | 5,127,104 | |
| | | | | | | | |
Shares | | | | | | |
| |
| | INVESTMENT COMPANY – 6.39% | | | | |
| | |
| | 2,139,288 | | | BlackRock Liquidity Funds TempCash Portfolio | | | 2,139,288 | |
| | | | | | | | |
| | |
| | | | Total Investment Company
(Cost $2,139,288) | | | 2,139,288 | |
| | | | | | | | |
| Total Investments – 99.59%
(Cost $30,347,716)** | | | 33,328,393 | |
| | | | | | | | |
| Net Other Assets and Liabilities – 0.41% | | | 137,862 | |
| | | | | | | | |
| Net Assets – 100.00% | | $ | 33,466,255 | |
| | | | | | | | |
| * | | Non-income producing security. |
| ** | | Aggregate cost for Federal income tax purposes is $30,726,840. |
| | | | |
Gross unrealized appreciation | | $ | 3,146,060 | |
Gross unrealized depreciation | | | (544,507 | ) |
| | | | |
Net unrealized appreciation | | $ | 2,601,553 | |
| | | | |
See accompanying Notes to Financial Statements.
This page intentionally left blank.
| | |
| |
| | October 31, 2012 |
| |
| Statements of Assets and Liabilities | | |
| | | | | | | | |
| | |
| | |
Montag & Caldwell
Growth Fund | | | Veredus Select
Growth Fund | |
| | | | | | | | |
| | |
ASSETS: | | | | | | | | |
Investments: | | | | | | | | |
Investments at cost | | $ | 3,855,999,934 | | | $ | 11,479,485 | |
Net unrealized appreciation (depreciation) | | | 467,166,990 | | | | 833,412 | |
| | | | | | | | |
Total investments at value | | | 4,323,166,924 | | | | 12,312,897 | |
Receivables: | | | | | | | | |
Dividends and interest | | | 4,136,310 | | | | 8,029 | |
Dividend reclaims | | | — | | | | — | |
Fund shares sold | | | 11,604,489 | | | | 4,856 | |
Investments sold | | | 28,794,991 | | | | — | |
Due from Adviser, net (Note G) | | | — | | | | — | |
Deferred offering costs (Note B-13) | | | — | | | | — | |
Other assets | | | 18,702 | | | | 314 | |
| | | | | | | | |
Total assets | | | 4,367,721,416 | | | | 12,326,096 | |
| | | | | | | | |
| | |
LIABILITIES: | | | | | | | | |
Payables: | | | | | | | | |
Dividend distribution | | | — | | | | — | |
Investments purchased | | | 10,522,744 | | | | 182,220 | |
Fund shares redeemed | | | 30,244,552 | | | | 5,120 | |
Due to Adviser, net (Note G) | | | 2,400,698 | | | | 6,804 | |
Administration fees (Note G) | | | 165,308 | | | | 1,943 | |
Distribution fees (Note G) | | | 79,205 | | | | 434 | |
Audit and tax fees | | | 22,457 | | | | 13,110 | |
Transfer agent fees | | | 482,094 | | | | 9,749 | |
Registration fees | | | 11,277 | | | | 13,114 | |
Trustees fees and related expenses (Note G) | | | 2,303 | | | | 7 | |
Offering costs | | | — | | | | — | |
Accrued expenses and other payables | | | 211,897 | | | | 2,056 | |
| | | | | | | | |
Total liabilities | | | 44,142,535 | | | | 234,557 | |
| | | | | | | | |
NET ASSETS | | $ | 4,323,578,881 | | | $ | 12,091,539 | |
| | | | | | | | |
| | |
NET ASSETS CONSIST OF: | | | | | | | | |
Paid in capital | | $ | 3,566,987,279 | | | $ | 28,941,960 | |
Accumulated undistributed (distribution in excess of) net investment income | | | 23,270,805 | | | | 174,730 | |
Accumulated net realized gain (loss) on investments and purchased options | | | 266,153,807 | | | | (17,858,563 | ) |
Net unrealized appreciation (depreciation) on investments and purchased options | | | 467,166,990 | | | | 833,412 | |
| | | | | | | | |
TOTAL NET ASSETS | | $ | 4,323,578,881 | | | $ | 12,091,539 | |
| | | | | | | | |
Class N: | | | | | | | | |
Net Assets | | $ | 1,908,662,599 | | | $ | 10,613,664 | |
Shares of beneficial interest outstanding (unlimited authorization) | | | 75,413,333 | | | | 957,448 | |
NET ASSET VALUE Offering and redemption price per share
(Net Assets/Shares Outstanding) | | $ | 25.31 | | | $ | 11.09 | |
| | | | | | | | |
Class I: | | | | | | | | |
Net Assets | | $ | 2,406,145,380 | | | $ | 1,477,875 | |
Shares of beneficial interest outstanding (unlimited authorization) | | | 94,494,505 | | | | 131,319 | |
NET ASSET VALUE Offering and redemption price per share
(Net Assets/Shares Outstanding) | | $ | 25.46 | | | $ | 11.25 | |
| | | | | | | | |
Class R: | | | | | | | | |
Net Assets | | $ | 8,770,902 | | | $ | — | |
Shares of beneficial interest outstanding (unlimited authorization) | | | 350,558 | | | | — | |
NET ASSET VALUE Offering and redemption price per share
(Net Assets/Shares Outstanding) | | $ | 25.02 | | | $ | — | |
| | | | | | | | |
See accompanying Notes to Financial Statements.
| | | | | | | | | | | | | | | | | | | | | | | | | | |
| | | | | | |
TAMRO
Diversified
Equity Fund | | | Herndon
Large Cap
Value Fund | | | Cornerstone
Large Cap
Value Fund | | | River Road
Dividend All
Cap Value Fund | | | River Road
Dividend All
Cap Value Fund II | | | Fairpointe
Mid Cap
Fund | | | Montag & Caldwell
Mid Cap
Growth Fund | |
| | | | | | | | | | | | | | | | | | | | | | | | | | |
| | | | | | |
| | | | | | | | | | | | | | | | | | | | | | | | | | |
| | | | | | | | | | | | | | | | | | | | | | | | | | |
| $ | 18,104,189 | | | $ | 54,857,773 | | | $ | 24,518,444 | | | $ | 829,507,638 | | | $ | 10,341,668 | | | $ | 2,533,889,631 | | | $ | 6,517,095 | |
| | 4,367,557 | | | | 859,759 | | | | 1,629,904 | | | | 93,049,759 | | | | (47,353 | ) | | | 486,851,410 | | | | 872,985 | |
| | | | | | | | | | | | | | | | | | | | | | | | | | |
| | 22,471,746 | | | | 55,717,532 | | | | 26,148,348 | | | | 922,557,397 | | | | 10,294,315 | | | | 3,020,741,041 | | | | 7,390,080 | |
| | | | | | | | | | | | | | | | | | | | | | | | | | |
| | 4,623 | | | | 50,677 | | | | 29,404 | | | | 3,229,852 | | | | 36,723 | | | | 2,543,010 | | | | 778 | |
| | — | | | | — | | | | 361 | | | | 1,182 | | | | — | | | | — | | | | — | |
| | 16,101 | | | | 10,850 | | | | 390,211 | | | | 1,442,381 | | | | 149,950 | | | | 6,222,320 | | | | 1,668 | |
| | 263,548 | | | | 15,167 | | | | — | | | | — | | | | — | | | | 8,282,494 | | | | — | |
| | 211 | | | | — | | | | — | | | | — | | | | — | | | | — | | | | — | |
| | — | | | | — | | | | — | | | | — | | | | 42,384 | | | | — | | | | — | |
| | 120 | | | | 119 | | | | 139 | | | | 3,744 | | | | — | | | | 14,692 | | | | 24 | |
| | | | | | | | | | | | | | | | | | | | | | | | | | |
| | 22,756,349 | | | | 55,794,345 | | | | 26,568,463 | | | | 927,234,556 | | | | 10,523,372 | | | | 3,037,803,557 | | | | 7,392,550 | |
| | | | | | | | | | | | | | | | | | | | | | | | | | |
| | | | | | |
| | | | | | | | | | | | | | | | | | | | | | | | | | |
| | | | | | | | | | | | | | | | | | | | | | | | | | |
| | — | | | | — | | | | — | | | | 420,712 | | | | 1,164 | | | | — | | | | — | |
| | 141,714 | | | | 302,343 | | | | — | | | | — | | | | — | | | | — | | | | — | |
| | 31,937 | | | | 6,182 | | | | 12,677 | | | | 1,862,468 | | | | 4,672 | | | | 9,486,783 | | | | — | |
| | — | | | | 45,301 | | | | 17,295 | | | | 550,018 | | | | 1,914 | | | | 1,846,214 | | | | 403 | |
| | 2,389 | | | | 3,577 | | | | 2,348 | | | | 36,828 | | | | 1,557 | | | | 118,066 | | | | 1,765 | |
| | 902 | | | | 848 | | | | 864 | | | | 13,838 | | | | 43 | | | | 63,770 | | | | 298 | |
| | 13,110 | | | | 13,360 | | | | 15,437 | | | | 16,187 | | | | 17,406 | | | | 22,457 | | | | 13,110 | |
| | 10,270 | | | | 7,335 | | | | 9,377 | | | | 81,211 | | | | 6,193 | | | | 330,300 | | | | 3,604 | |
| | 5,243 | | | | 4,943 | | | | 5,243 | | | | 4,943 | | | | 4,943 | | | | 8,618 | | | | 2,809 | |
| | 12 | | | | 30 | | | | 14 | | | | 474 | | | | 3 | | | | 1,588 | | | | 4 | |
| | — | | | | — | | | | — | | | | — | | | | 65,000 | | | | — | | | | — | |
| | 1,795 | | | | 3,474 | | | | 2,340 | | | | 38,509 | | | | 1,237 | | | | 194,129 | | | | 1,607 | |
| | | | | | | | | | | | | | | | | | | | | | | | | | |
| | 207,372 | | | | 387,393 | | | | 65,595 | | | | 3,025,188 | | | | 104,132 | | | | 12,071,925 | | | | 23,600 | |
| | | | | | | | | | | | | | | | | | | | | | | | | | |
| $ | 22,548,977 | | | $ | 55,406,952 | | | $ | 26,502,868 | | | $ | 924,209,368 | | | $ | 10,419,240 | | | $ | 3,025,731,632 | | | $ | 7,368,950 | |
| | | | | | | | | | | | | | | | | | | | | | | | | | |
| | | | | | |
| | | | | | | | | | | | | | | | | | | | | | | | | | |
| $ | 18,281,712 | | | $ | 53,311,586 | | | $ | 53,058,826 | | | $ | 797,381,742 | | | $ | 10,453,136 | | | $ | 2,460,864,049 | | | $ | 6,465,297 | |
| | 830 | | | | 601,291 | | | | 130,056 | | | | 132,637 | | | | 7,776 | | | | 11,980,487 | | | | (37,681 | ) |
| | (101,122 | ) | | | 634,316 | | | | (28,315,918 | ) | | | 33,645,230 | | | | 5,681 | | | | 66,035,686 | | | | 68,349 | |
| | 4,367,557 | | | | 859,759 | | | | 1,629,904 | | | | 93,049,759 | | | | (47,353 | ) | | | 486,851,410 | | | | 872,985 | |
| | | | | | | | | | | | | | | | | | | | | | | | | | |
| $ | 22,548,977 | | | $ | 55,406,952 | | | $ | 26,502,868 | | | $ | 924,209,368 | | | $ | 10,419,240 | | | $ | 3,025,731,632 | | | $ | 7,368,950 | |
| | | | | | | | | | | | | | | | | | | | | | | | | | |
| | | | | | | | | | | | | | | | | | | | | | | | | | |
| $ | 21,979,742 | | | $ | 20,832,465 | | | $ | 21,105,371 | | | $ | 338,166,102 | | | $ | 1,049,398 | | | $ | 1,561,509,927 | | | $ | 7,368,950 | |
| | 1,625,432 | | | | 1,775,810 | | | | 1,911,595 | | | | 28,974,101 | | | | 100,471 | | | | 47,617,723 | | | | 711,383 | |
| | | | | | | | | | | | | | | | | | | | | | | | | | |
| $ | 13.52 | | | $ | 11.73 | | | $ | 11.04 | | | $ | 11.67 | | | $ | 10.44 | | | $ | 32.79 | | | $ | 10.36 | |
| | | | | | | | | | | | | | | | | | | | | | | | | | |
| | | | | | | | | | | | | | | | | | | | | | | | | | |
| $ | 569,235 | | | $ | 34,574,487 | | | $ | 5,397,497 | | | $ | 586,043,266 | | | $ | 9,369,842 | | | $ | 1,464,221,705 | | | $ | — | |
| | 42,019 | | | | 2,943,589 | | | | 487,593 | | | | 50,240,372 | | | | 896,805 | | | | 43,992,278 | | | | — | |
| | | | | | | | | | | | | | | | | | | | | | | | | | |
| $ | 13.55 | | | $ | 11.75 | | | $ | 11.07 | | | $ | 11.66 | | | $ | 10.45 | | | $ | 33.28 | | | $ | — | |
| | | | | | | | | | | | | | | | | | | | | | | | | | |
| | | | | | | | | | | | | | | | | | | | | | | | | | |
| $ | — | | | $ | — | | | $ | — | | | $ | — | | | $ | — | | | $ | — | | | $ | — | |
| | — | | | | — | | | | — | | | | — | | | | — | | | | — | | | | — | |
| | | | | | | | | | | | | | | | | | | | | | | | | | |
| $ | — | | | $ | — | | | $ | — | | | $ | — | | | $ | — | | | $ | — | | | $ | — | |
| | | | | | | | | | | | | | | | | | | | | | | | | | |
See accompanying Notes to Financial Statements.
| | |
| |
| | October 31, 2012 |
| |
| Statements of Assets and Liabilities – continued | | |
| | | | | | | | |
| | |
| | | Veredus
Small Cap
Growth Fund | | | Small Cap
Growth Fund | |
| | | | | | | | |
| | |
ASSETS: | | | | | | | | |
Investments: | | | | | | | | |
Investments at cost | | $ | 22,691,645 | | | $ | 6,256,719 | |
Net unrealized appreciation | | | 1,960,601 | | | | 362,454 | |
| | | | | | | | |
Total investments at value | | | 24,652,246 | | | | 6,619,173 | |
Cash | | | — | | | | — | |
Receivables: | | | | | | | | |
Dividends and interest | | | 2,123 | | | | 64 | |
Fund shares sold | | | 4,955 | | | | 6,368 | |
Investments sold | | | — | | | | 44,144 | |
Due from Adviser, net (Note G) | | | — | | | | 1,421 | |
Deferred offering costs (Note B-13) | | | — | | | | — | |
Other assets | | | 155 | | | | 39 | |
| | | | | | | | |
Total assets | | | 24,659,479 | | | | 6,671,209 | |
| | | | | | | | |
| | |
LIABILITIES: | | | | | | | | |
Payables: | | | | | | | | |
Dividend distribution | | | — | | | | — | |
Investments purchased | | | 393,660 | | | | 229,095 | |
Fund shares redeemed | | | 44,644 | | | | — | |
Due to Adviser, net (Note G) | | | 19,322 | | | | — | |
Administration fees (Note G) | | | 2,553 | | | | 1,839 | |
Distribution fees (Note G) | | | 881 | | | | 232 | |
Audit and tax fees | | | 13,360 | | | | 13,110 | |
Transfer agent fees | | | 13,586 | | | | 6,560 | |
Registration fees | | | 5,243 | | | | 5,143 | |
Trustees fees and related expenses (Note G) | | | 13 | | | | 4 | |
Accrued expenses and other payables | | | 2,912 | | | | 1,996 | |
| | | | | | | | |
Total liabilities | | | 496,174 | | | | 257,979 | |
| | | | | | | | |
NET ASSETS | | $ | 24,163,305 | | | $ | 6,413,230 | |
| | | | | | | | |
| | |
NET ASSETS CONSIST OF: | | | | | | | | |
Paid in capital | | $ | 41,269,458 | | | $ | 5,647,265 | |
Accumulated undistributed (distribution in excess of) net investment income | | | (167,640 | ) | | | (5,175 | ) |
Accumulated net realized gain (loss) on investments | | | (18,899,114 | ) | | | 408,686 | |
Net unrealized appreciation on investments | | | 1,960,601 | | | | 362,454 | |
| | | | | | | | |
TOTAL NET ASSETS | | $ | 24,163,305 | | | $ | 6,413,230 | |
| | | | | | | | |
Class N: | | | | | | | | |
Net Assets | | $ | 21,762,975 | | | $ | 5,658,602 | |
Shares of beneficial interest outstanding (unlimited authorization) | | | 1,670,425 | | | | 495,521 | |
NET ASSET VALUE Offering and redemption price per share
(Net Assets/Shares Outstanding) | | $ | 13.03 | | | $ | 11.42 | |
| | | | | | | | |
Class I: | | | | | | | | |
Net Assets | | $ | 2,400,330 | | | $ | 754,628 | |
Shares of beneficial interest outstanding (unlimited authorization) | | | 177,344 | | | | 65,824 | |
NET ASSET VALUE Offering and redemption price per share
(Net Assets/Shares Outstanding) | | $ | 13.53 | | | $ | 11.46 | |
| | | | | | | | |
See accompanying Notes to Financial Statements.
| | | | | | | | | | | | | | | | | | | | | | | | | | |
| | | | | | |
Silvercrest
Small Cap
Fund | | | TAMRO
Small Cap
Fund | | | River Road
Select Value
Fund | | | River Road
Small Cap
Value Fund | | | River Road
Independent
Value Fund | | | DoubleLine Core
Plus Fixed Income
Fund | | | TCH
Fixed Income
Fund | |
| | | | | | | | | | | | | | | | | | | | | | | | | | |
| | | | | | |
| | | | | | | | | | | | | | | | | | | | | | | | | | |
| | | | | | | | | | | | | | | | | | | | | | | | | | |
| $ | 5,616,153 | | | $ | 844,981,885 | | | $ | 141,947,885 | | | $ | 221,695,702 | | | $ | 333,734,578 | | | $ | 169,804,168 | | | $ | 62,235,580 | |
| | 111,181 | | | | 189,946,385 | | | | 21,546,407 | | | | 67,639,358 | | | | 10,280,638 | | | | 5,127,542 | | | | 7,147,893 | |
| | | | | | | | | | | | | | | | | | | | | | | | | | |
| | 5,727,334 | | | | 1,034,928,270 | | | | 163,494,292 | | | | 289,335,060 | | | | 344,015,216 | | | | 174,931,710 | | | | 69,383,473 | |
| | — | | | | 3,090,359 | | | | — | | | | — | | | | 357,151,989 | | | | 1,725,610 | | | | 200,000 | |
| | | | | | | | | | | | | | | | | | | | | | | | | | |
| | 1,204 | | | | 401,701 | | | | 52,355 | | | | 92,456 | | | | 21,924 | | | | 1,201,203 | | | | 772,486 | |
| | — | | | | 2,254,719 | | | | 273,933 | | | | 281,657 | | | | 1,463,685 | | | | 396,202 | | | | 43,427 | |
| | — | | | | 354,745 | | | | 149,702 | | | | 146,615 | | | | — | | | | 237,368 | | | | — | |
| | 8,253 | | | | — | | | | — | | | | — | | | | — | | | | — | | | | — | |
| | 7,179 | | | | — | | | | — | | | | — | | | | — | | | | — | | | | — | |
| | 5 | | | | 5,346 | | | | 762 | | | | 1,768 | | | | 2,838 | | | | 265 | | | | 389 | |
| | | | | | | | | | | | | | | | | | | | | | | | | | |
| | 5,743,975 | | | | 1,041,035,140 | | | | 163,971,044 | | | | 289,857,556 | | | | 702,655,652 | | | | 178,492,358 | | | | 70,399,775 | |
| | | | | | | | | | | | | | | | | | | | | | | | | | |
| | | | | | |
| | | | | | | | | | | | | | | | | | | | | | | | | | |
| | | | | | | | | | | | | | | | | | | | | | | | | | |
| | — | | | | — | | | | — | | | | — | | | | — | | | | 33,522 | | | | 16,828 | |
| | — | | | | 9,263,874 | | | | 943,955 | | | | 26,107 | | | | 718,648 | | | | 1,187,619 | | | | — | |
| | — | | | | 5,961,220 | | | | 52,888 | | | | 257,889 | | | | 500,256 | | | | 264,917 | | | | 140,430 | |
| | — | | | | 818,589 | | | | 137,940 | | | | 219,187 | | | | 604,443 | | | | 45,750 | | | | 24,457 | |
| | 1,693 | | | | 42,208 | | | | 7,893 | | | | 12,643 | | | | 27,265 | | | | 14,975 | | | | 7,073 | |
| | 30 | | | | 15,889 | | | | 244 | | | | 2,012 | | | | 14,843 | | | | 2,917 | | | | 1,468 | |
| | 13,110 | | | | 15,687 | | | | 15,437 | | | | 15,437 | | | | 13,110 | | | | 17,040 | | | | 17,040 | |
| | 6,302 | | | | 69,633 | | | | 15,618 | | | | 70,661 | | | | 62,886 | | | | 25,631 | | | | 14,693 | |
| | 6,839 | | | | 5,243 | | | | 5,493 | | | | 9,268 | | | | 18,064 | | | | 5,143 | | | | 6,243 | |
| | 3 | | | | 561 | | | | 83 | | | | 144 | | | | 331 | | | | 85 | | | | 36 | |
| | 4,431 | | | | 54,153 | | | | 11,629 | | | | 15,020 | | | | 46,343 | | | | 13,181 | | | | 3,747 | |
| | | | | | | | | | | | | | | | | | | | | | | | | | |
| | 32,408 | | | | 16,247,057 | | | | 1,191,180 | | | | 628,368 | | | | 2,006,189 | | | | 1,610,780 | | | | 232,015 | |
| | | | | | | | | | | | | | | | | | | | | | | | | | |
| $ | 5,711,567 | | | $ | 1,024,788,083 | | | $ | 162,779,864 | | | $ | 289,229,188 | | | $ | 700,649,463 | | | $ | 176,881,578 | | | $ | 70,167,760 | |
| | | | | | | | | | | | | | | | | | | | | | | | | | |
| | | | | | |
| | | | | | | | | | | | | | | | | | | | | | | | | | |
| $ | 5,550,019 | | | $ | 742,562,257 | | | $ | 132,211,858 | | | $ | 213,116,337 | | | $ | 659,752,208 | | | $ | 171,056,571 | | | $ | 69,020,031 | |
| | 35,727 | | | | — | | | | 460,063 | | | | 1,294,664 | | | | (43,461 | ) | | | (380,739 | ) | | | 257,283 | |
| | 14,640 | | | | 92,279,441 | | | | 8,561,536 | | | | 7,178,829 | | | | 30,660,078 | | | | 1,078,204 | | | | (6,257,447 | ) |
| | 111,181 | | | | 189,946,385 | | | | 21,546,407 | | | | 67,639,358 | | | | 10,280,638 | | | | 5,127,542 | | | | 7,147,893 | |
| | | | | | | | | | | | | | | | | | | | | | | | | | |
| $ | 5,711,567 | | | $ | 1,024,788,083 | | | $ | 162,779,864 | | | $ | 289,229,188 | | | $ | 700,649,463 | | | $ | 176,881,578 | | | $ | 70,167,760 | |
| | | | | | | | | | | | | | | | | | | | | | | | | | |
| | | | | | | | | | | | | | | | | | | | | | | | | | |
| $ | 749,662 | | | $ | 389,124,895 | | | $ | 6,269,566 | | | $ | 49,154,009 | | | $ | 362,415,604 | | | $ | 71,546,413 | | | $ | 59,771,657 | |
| | 68,761 | | | | 18,962,398 | | | | 737,560 | | | | 3,625,337 | | | | 31,738,321 | | | | 6,445,656 | | | | 5,378,164 | |
$ |
10.90 |
| | $ | 20.52 | | | $ | 8.50 | | | $ | 13.56 | | | $ | 11.42 | | | $ | 11.10 | | | $ | 11.11 | |
| | | | | | | | | | | | | | | | | | | | | | | | | | |
| | | | | | | | | | | | | | | | | | | | | | | | | | |
| $ | 4,961,905 | | | $ | 635,663,188 | | | $ | 156,510,298 | | | $ | 240,075,179 | | | $ | 338,233,859 | | | $ | 105,335,165 | | | $ | 10,396,103 | |
| | 454,089 | | | | 30,331,379 | | | | 18,249,612 | | | | 17,628,506 | | | | 29,525,934 | | | | 9,489,617 | | | | 935,367 | |
$ |
10.93 |
�� | | $ | 20.96 | | | $ | 8.58 | | | $ | 13.62 | | | $ | 11.46 | | | $ | 11.10 | | | $ | 11.11 | |
| | | | | | | | | | | | | | | | | | | | | | | | | | |
See accompanying Notes to Financial Statements.
| | |
| |
| | October 31, 2012 |
| |
| Statements of Assets and Liabilities – continued | | |
| | | | | | | | |
| | |
| | | Lake Partners
LASSO Alternatives
Fund | | | Dynamic
Allocation
Fund | |
| | | | | | | | |
| | |
ASSETS: | | | | | | | | |
Investments: | | | | | | | | |
Investments at cost | | $ | 265,319,404 | | | $ | 29,475,636 | |
Net unrealized appreciation (depreciation) | | | 8,543,380 | | | | 289,209 | |
| | | | | | | | |
Total investments at value | | | 273,862,784 | | | | 29,764,845 | |
Foreign currency (Cost $7,769 and $3,570) | | | — | | | | — | |
Cash | | | 13,877,037 | | | | — | |
Segregated Cash (Note B) | | | — | | | | — | |
Receivables: | | | | | | | | |
Dividends and interest | | | 322,057 | | | | 343 | |
Dividend reclaims | | | — | | | | — | |
Fund shares sold | | | 267,744 | | | | 13,356 | |
Investments sold | | | — | | | | — | |
Other assets | | | 1,188 | | | | 253 | |
| | | | | | | | |
Total assets | | | 288,330,810 | | | | 29,778,797 | |
| | | | | | | | |
| | |
LIABILITIES: | | | | | | | | |
Payables: | | | | | | | | |
Interest and dividends on securities sold short | | | — | | | | — | |
Investments purchased | | | 325,436 | | | | — | |
Fund shares redeemed | | | 562,463 | | | | 205,206 | |
Due to Adviser, net (Note G) | | | 316,582 | | | | 13,085 | |
Administration fees (Note G) | | | 12,021 | | | | 2,404 | |
Distribution fees (Note G) | | | 1,387 | | | | 981 | |
Audit and tax fees | | | 14,674 | | | | 14,674 | |
Transfer agent fees | | | 19,864 | | | | 13,196 | |
Registration fees | | | 4,943 | | | | 13,514 | |
Trustees fees and related expenses (Note G) | | | 145 | | | | 16 | |
Accrued expenses and other payables | | | 11,694 | | | | 2,744 | |
Securities sold short, at value (proceeds $1,426,545) | | | — | | | | — | |
Call options written, at value (premiums received $3,939,696) | | | — | | | | — | |
| | | | | | | | |
Total liabilities | | | 1,269,209 | | | | 265,820 | |
| | | | | | | | |
NET ASSETS | | $ | 287,061,601 | | | $ | 29,512,977 | |
| | | | | | | | |
| | |
NET ASSETS CONSIST OF: | | | | | | | | |
Paid in capital | | $ | 283,350,503 | | | $ | 29,972,593 | |
Accumulated undistributed (distribution in excess of) net investment income | | | 781,026 | | | | 121,022 | |
Accumulated net realized gain (loss) on investments, purchased options, written options, securities sold short, foreign currency transactions and capital gain distributions received | | | (5,613,308 | ) | | | (869,847 | ) |
Net unrealized appreciation (depreciation) on investments, purchased options, written options, securities sold short and translation of assets and liabilities in foreign currency | | | 8,543,380 | | | | 289,209 | |
| | | | | | | | |
TOTAL NET ASSETS | | $ | 287,061,601 | | | $ | 29,512,977 | |
| | | | | | | | |
Class N: | | | | | | | | |
Net Assets | | $ | 33,718,695 | | | $ | 23,736,334 | |
Shares of beneficial interest outstanding (unlimited authorization) | | | 2,722,222 | | | | 2,789,715 | |
NET ASSET VALUE Offering and redemption price per share
(Net Assets/Shares Outstanding) | | $ | 12.39 | | | $ | 8.51 | |
| | | | | | | | |
Class I: | | | | | | | | |
Net Assets | | $ | 253,342,906 | | | $ | 5,776,643 | |
Shares of beneficial interest outstanding (unlimited authorization) | | | 20,396,742 | | | | 677,035 | |
NET ASSET VALUE Offering and redemption price per share
(Net Assets/Shares Outstanding) | | $ | 12.42 | | | $ | 8.53 | |
| | | | | | | | |
See accompanying Notes to Financial Statements.
| | | | | | | | | | | | | | | | | | |
| | | | |
Anchor Capital
Enhanced Equity
Fund | | | River Road
Long-Short
Fund | | | Barings
International
Fund | | | Harrison Street
Real Estate
Fund | | | Montag & Caldwell
Balanced Fund | |
| | | | | | | | | | | | | | | | | | |
| | | | |
| | | | | | | | | | | | | | | | | | |
| | | | | | | | | | | | | | | | | | |
| $ | 186,408,483 | | | $ | 7,536,466 | | | $ | 60,870,067 | | | $ | 10,061,557 | | | $ | 30,347,716 | |
| | (6,491,318 | ) | | | 74,618 | | | | 1,107,994 | | | | 579,358 | | | | 2,980,677 | |
| | | | | | | | | | | | | | | | | | |
| | 179,917,165 | | | | 7,611,084 | | | | 61,978,061 | | | | 10,640,915 | | | | 33,328,393 | |
| | — | | | | — | | | | 7,804 | | | | 3,532 | | | | — | |
| | 3,482,957 | | | | 303,919 | | | | — | | | | — | | | | — | |
| | — | | | | 1,127,727 | | | | — | | | | — | | | | — | |
| | | | | | | | | | | | | | | | | | |
| | 187,850 | | | | 7,989 | | | | 116,359 | | | | 1,846 | | | | 129,078 | |
| | — | | | | — | | | | 74,738 | | | | — | | | | — | |
| | 418,408 | | | | 1,000 | | | | 10,664 | | | | 5,158 | | | | 15,741 | |
| | — | | | | 23,453 | | | | — | | | | — | | | | 111,627 | |
| | 1,273 | | | | 26 | | | | 298 | | | | 55 | | | | 140 | |
| | | | | | | | | | | | | | | | | | |
| | 184,007,653 | | | | 9,075,198 | | | | 62,187,924 | | | | 10,651,506 | | | | 33,584,979 | |
| | | | | | | | | | | | | | | | | | |
| | | | |
| | | | | | | | | | | | | | | | | | |
| | | | | | | | | | | | | | | | | | |
| | — | | | | 2,207 | | | | — | | | | — | | | | — | |
| | — | | | | 66,741 | | | | — | | | | — | | | | 46,816 | |
| | 191,130 | | | | — | | | | 3,489 | | | | 66,689 | | | | 13,582 | |
| | 105,097 | | | | 3,313 | | | | 54,951 | | | | 3,562 | | | | 11,289 | |
| | 8,757 | | | | 1,915 | | | | 7,209 | | | | 1,706 | | | | 3,348 | |
| | 4,339 | | | | 310 | | | | 17 | | | | 424 | | | | 517 | |
| | 14,674 | | | | 15,924 | | | | 15,437 | | | | 13,860 | | | | 17,040 | |
| | 25,076 | | | | 3,358 | | | | 7,157 | | | | 8,356 | | | | 11,543 | |
| | 15,514 | | | | 13,730 | | | | 4,943 | | | | 8,443 | | | | 10,993 | |
| | 91 | | | | 4 | | | | 32 | | | | 5 | | | | 18 | |
| | 12,340 | | | | 2,698 | | | | 11,033 | | | | 1,857 | | | | 3,578 | |
| | — | | | | 1,458,611 | | | | — | | | | — | | | | — | |
| | 5,821,315 | | | | — | | | | — | | | | — | | | | — | |
| | | | | | | | | | | | | | | | | | |
| | 6,198,333 | | | | 1,568,811 | | | | 104,268 | | | | 104,902 | | | | 118,724 | |
| | | | | | | | | | | | | | | | | | |
| $ | 177,809,320 | | | $ | 7,506,387 | | | $ | 62,083,656 | | | $ | 10,546,604 | | | $ | 33,466,255 | |
| | | | | | | | | | | | | | | | | | |
| | | | |
| | | | | | | | | | | | | | | | | | |
| $ | 183,405,615 | | | $ | 7,108,203 | | | $ | 59,541,533 | | | $ | 23,151,276 | | | $ | 32,558,059 | |
| | 127,535 | | | | (29,732 | ) | | | 992,441 | | | | 125,494 | | | | (230,949 | ) |
|
2,649,107 |
| | | 385,364 | | | | 444,313 | | | | (13,309,485 | ) | | | (1,841,532 | ) |
|
(8,372,937 |
) | | | 42,552 | | | | 1,105,369 | | | | 579,319 | | | | 2,980,677 | |
| | | | | | | | | | | | | | | | | | |
| $ | 177,809,320 | | | $ | 7,506,387 | | | $ | 62,083,656 | | | $ | 10,546,604 | | | $ | 33,466,255 | |
| | | | | | | | | | | | | | | | | | |
| | | | | | | | | | | | | | | | | | |
| $ | 106,191,154 | | | $ | 7,506,387 | | | $ | 421,330 | | | $ | 10,380,840 | | | $ | 31,535,974 | |
| | 12,231,307 | | | | 699,705 | | | | 61,296 | | | | 989,224 | | | | 1,469,625 | |
$ |
8.68 |
| | $ | 10.73 | | | $ | 6.87 | | | $ | 10.49 | | | $ | 21.46 | |
| | | | | | | | | | | | | | | | | | |
| | | | | | | | | | | | | | | | | | |
| $ | 71,618,166 | | | $ | — | | | $ | 61,662,326 | | | $ | 165,764 | | | $ | 1,930,281 | |
| | 8,240,286 | | | | — | | | | 8,955,279 | | | | 15,873 | | | | 90,164 | |
$ |
8.69 |
| | $ | — | | | $ | 6.89 | | | $ | 10.44 | | | $ | 21.41 | |
| | | | | | | | | | | | | | | | | | |
See accompanying Notes to Financial Statements.
| | |
| |
| For the Year Ended October 31, 2012 | | |
| |
| Statements of Operations | | |
| | | | | | | | |
| | |
| | |
Montag & Caldwell
Growth Fund | | | Veredus Select
Growth Fund | |
| | | | | | | | |
INVESTMENT INCOME: | | | | | | | | |
Dividends | | $ | 63,023,934 | | | $ | 671,370 | |
Less: foreign taxes withheld | | | (306,956 | ) | | | — | |
| | | | | | | | |
Total investment income | | | 62,716,978 | | | | 671,370 | |
| | | | | | | | |
EXPENSES: | | | | | | | | |
Investment advisory fees (Note G) | | | 24,380,211 | | | | 352,118 | |
Distribution expenses (Note G)(b) | | | 4,520,587 | | | | 34,252 | |
Transfer agent fees | | | 3,107,943 | | | | 60,191 | |
Administration fees (Note G) | | | 1,841,475 | | | | 36,194 | |
Registration expenses | | | 172,508 | | | | 35,382 | |
Custodian fees | | | 133,881 | | | | 3,657 | |
Audit and tax fees | | | 30,332 | | | | 18,757 | |
Legal fees | | | 101,589 | | | | 939 | |
Amortization of offering costs (Note B-13) | | | — | | | | — | |
Reports to shareholder expense | | | 260,126 | | | | 3,048 | |
Trustees fees and related expenses (Note G) | | | 285,412 | | | | 4,012 | |
Interest expense (Note H) | | | — | | | | 71 | |
Other expenses | | | 151,570 | | | | 7,223 | |
| | | | | | | | |
Total expenses before waivers/reimbursements | | | 34,985,634 | | | | 555,844 | |
| | | | | | | | |
Less: Investment advisory fees waived (Note G) | | | — | | | | (59,367 | ) |
Less: Expenses reimbursed (Note G) | | | — | | | | — | |
| | | | | | | | |
Net expenses | | | 34,985,634 | | | | 496,477 | |
| | | | | | | | |
NET INVESTMENT INCOME (LOSS) | | | 27,731,344 | | | | 174,893 | |
| | | | | | | | |
NET REALIZED AND UNREALIZED GAIN (LOSS) ON INVESTMENTS: | | | | | | | | |
Net realized gain on investments | | | 287,451,677 | | | | 2,056,758 | |
Net realized loss on purchased options | | | — | | | | — | |
Net change in unrealized appreciation (depreciation) on investments | | | 78,274,829 | | | | (2,651,492 | ) |
Net change in unrealized appreciation on purchased options | | | — | | | | — | |
| | | | | | | | |
NET REALIZED AND UNREALIZED GAIN (LOSS) ON INVESTMENTS | | | 365,726,506 | | | | (594,734 | ) |
| | | | | | | | |
| | |
NET INCREASE (DECREASE) IN NET ASSETS FROM OPERATIONS | | $ | 393,457,850 | | | $ | (419,841 | ) |
| | | | | | | | |
| (a) | River Road Dividend All Cap Value Fund II began issuing shares on June 27, 2012. |
| (b) | Distribution expense is incurred at the Class N level for all funds except Montag & Caldwell Growth Fund. The distribution expense for Class N and R of the Montag & Caldwell Growth Fund is $4,475,917 and $44,670, respectively. |
| (c) | On January 13, 2012, Fairpointe Mid Cap Fund had a redemption-in-kind transfer of securities in the amount of $38,179,960. The net realized gain on the transaction of $2,483,994 will not be realized by the Fund for tax purposes. |
See accompanying Notes to Financial Statements.
| | | | | | | | | | | | | | | | | | | | | | | | | | |
| | | | | | |
TAMRO
Diversified
Equity Fund | | | Herndon
Large Cap
Value Fund | | | Cornerstone
Large Cap
Value Fund | | | River Road
Dividend All
Cap Value Fund | | | River Road
Dividend All
Cap Value Fund II(a) | | | Fairpointe
Mid Cap
Fund | | | Montag & Caldwell
Mid Cap
Growth Fund | |
| | | | | | | | | | | | | | | | | | | | | | | | | | |
| | | | | | | | | | | | | | | | | | | | | | | | | | |
| $ | 270,023 | | | $ | 1,153,800 | | | $ | 586,030 | | | $ | 31,448,065 | | | $ | 60,915 | | | $ | 47,068,708 | | | $ | 38,253 | |
| | (2,450 | ) | | | (559 | ) | | | (26,294 | ) | | | (74,001 | ) | | | (68 | ) | | | (46,653 | ) | | | (151 | ) |
| | | | | | | | | | | | | | | | | | | | | | | | | | |
| | 267,573 | | | | 1,153,241 | | | | 559,736 | | | | 31,374,064 | | | | 60,847 | | | | 47,022,055 | | | | 38,102 | |
| | | | | | | | | | | | | | | | | | | | | | | | | | |
| | | | | | | | | | | | | | | | | | | | | | | | | | |
| | 178,350 | | | | 323,690 | | | | 205,311 | | | | 5,697,260 | | | | 11,353 | | | | 20,664,084 | | | | 52,435 | |
| | 54,866 | | | | 30,138 | | | | 58,269 | | | | 826,838 | | | | 497 | | | | 3,860,391 | | | | 15,422 | |
| | 46,364 | | | | 39,567 | | | | 45,671 | | | | 643,468 | | | | 9,045 | | | | 2,062,997 | | | | 19,284 | |
| | 25,962 | | | | 34,196 | | | | 25,962 | | | | 409,284 | | | | 5,445 | | | | 1,426,657 | | | | 18,081 | |
| | 37,829 | | | | 34,701 | | | | 30,269 | | | | 100,347 | | | | 5,457 | | | | 81,272 | | | | 16,878 | |
| | 3,457 | | | | 6,091 | | | | 6,288 | | | | 37,365 | | | | 2,276 | | | | 114,951 | | | | 8,344 | |
| | 17,509 | | | | 18,011 | | | | 20,626 | | | | 22,678 | | | | 19,300 | | | | 27,536 | | | | 18,753 | |
| | 574 | | | | 1,039 | | | | 1,339 | | | | 24,271 | | | | 49 | | | | 76,362 | | | | 164 | |
| | — | | | | — | | | | — | | | | — | | | | 22,616 | | | | — | | | | — | |
| | 2,005 | | | | 2,187 | | | | — | | | | 42,974 | | | | 463 | | | | 270,254 | | | | 498 | |
| | 1,733 | | | | 2,589 | | | | 1,747 | | | | 60,348 | | | | 38 | | | | 223,376 | | | | 456 | |
| | 86 | | | | — | | | | — | | | | — | | | | — | | | | 12,242 | | | | — | |
| | 5,793 | | | | 5,563 | | | | 2,677 | | | | 39,330 | | | | 847 | | | | 137,441 | | | | 3,984 | |
| | | | | | | | | | | | | | | | | | | | | | | | | | |
| | 374,528 | | | | 497,772 | | | | 398,159 | | | | 7,904,163 | | | | 77,386 | | | | 28,957,563 | | | | 154,299 | |
| | | | | | | | | | | | | | | | | | | | | | | | | | |
| | (107,785 | ) | | | (42,793 | ) | | | (79,418 | ) | | | — | | | | (11,353 | ) | | | — | | | | (52,435 | ) |
| | — | | | | — | | | | — | | | | — | | | | (48,507 | ) | | | — | | | | (24,754 | ) |
| | | | | | | | | | | | | | | | | | | | | | | | | | |
| | 266,743 | | | | 454,979 | | | | 318,741 | | | | 7,904,163 | | | | 17,526 | | | | 28,957,563 | | | | 77,110 | |
| | | | | | | | | | | | | | | | | | | | | | | | | | |
| | 830 | | | | 698,262 | | | | 240,995 | | | | 23,469,901 | | | | 43,321 | | | | 18,064,492 | | | | (39,008 | ) |
| | | | | | | | | | | | | | | | | | | | | | | | | | |
| | | | | | | | | | | | | | | | | | | | | | | | | | |
| | 170,003 | | | | 930,577 | | | | 1,056,316 | | | | 35,184,296 | | | | 5,681 | | | | 70,142,404 | (c) | | | 426,097 | |
| | (204,029 | ) | | | — | | | | — | | | | — | | | | — | | | | — | | | | — | |
| | 2,400,339 | | | | 984,335 | | | | 1,197,003 | | | | 38,094,587 | | | | (47,353 | ) | | | 207,549,967 | | | | (74,900 | ) |
| | 149,516 | | | | — | | | | — | | | | — | | | | — | | | | — | | | | — | |
| | | | | | | | | | | | | | | | | | | | | | | | | | |
| | 2,515,829 | | | | 1,914,912 | | | | 2,253,319 | | | | 73,278,883 | | | | (41,672 | ) | | | 277,692,371 | | | | 351,197 | |
| | | | | | | | | | | | | | | | | | | | | | | | | | |
| | | | | | |
| $ | 2,516,659 | | | $ | 2,613,174 | | | $ | 2,494,314 | | | $ | 96,748,784 | | | $ | 1,649 | | | $ | 295,756,863 | | | $ | 312,189 | |
| | | | | | | | | | | | | | | | | | | | | | | | | | |
See accompanying Notes to Financial Statements.
| | |
| |
| For the Year Ended October 31, 2012 | | |
| |
| Statements of Operations – continued | | |
| | | | | | | | |
| | |
| | | Veredus
Small Cap
Growth Fund | | | Small Cap
Growth Fund | |
| | | | | | | | |
INVESTMENT INCOME: | | | | | | | | |
Dividends | | $ | 141,204 | | | $ | 14,894 | |
Less: foreign taxes withheld | | | — | | | | — | |
Interest | | | — | | | | — | |
| | | | | | | | |
Total investment income | | | 141,204 | | | | 14,894 | |
| | | | | | | | |
EXPENSES: | | | | | | | | |
Investment advisory fees (Note G) | | | 279,493 | | | | 81,515 | |
Distribution expenses (Note G) | | | 60,281 | | | | 14,116 | |
Transfer agent fees | | | 63,725 | | | | 36,803 | |
Administration fees (Note G) | | | 29,472 | | | | 19,643 | |
Registration expenses | | | 31,689 | | | | 36,809 | |
Custodian fees | | | 4,777 | | | | 5,248 | |
Audit and tax fees | | | 18,945 | | | | 17,495 | |
Legal fees | | | 674 | | | | 9,635 | |
Amortization of offering costs (Note B-13) | | | — | | | | — | |
Reports to shareholder expense | | | 3,497 | | | | 472 | |
Trustees fees and related expenses (Note G) | | | 2,309 | | | | 642 | |
Interest expense (Note H) | | | — | | | | — | |
Other expenses | | | 6,154 | | | | 4,651 | |
| | | | | | | | |
Total expenses before waivers/reimbursements | | | 501,016 | | | | 227,029 | |
| | | | | | | | |
Less: Investment advisory fees waived (Note G) | | | (94,164 | ) | | | (81,515 | ) |
Less: Expenses reimbursed (Note G) | | | — | | | | (41,754 | ) |
Less: Earnings credit | | | — | | | | — | |
| | | | | | | | |
Net expenses | | | 406,852 | | | | 103,760 | |
| | | | | | | | |
NET INVESTMENT INCOME (LOSS) | | | (265,648 | ) | | | (88,866 | ) |
| | | | | | | | |
NET REALIZED AND UNREALIZED GAIN (LOSS) ON INVESTMENTS: | | | | | | | | |
Net realized gain on investments | | | 3,149,755 | (b) | | | 793,830 | (c) |
Net change in unrealized appreciation (depreciation) on investments | | | (1,897,684 | ) | | | 504,009 | |
| | | | | | | | |
NET REALIZED AND UNREALIZED GAIN ON INVESTMENTS | | | 1,252,071 | | | | 1,297,839 | |
| | | | | | | | |
| | |
NET INCREASE IN NET ASSETS FROM OPERATIONS | | $ | 986,423 | | | $ | 1,208,973 | |
| | | | | | | | |
| (a) | Silvercrest Small Cap Fund began issuing shares on December 23, 2011. |
| (b) | On December 2, 2011, Veredus Small Cap Growth Fund had a redemption-in-kind transfer of securities in the amount of $13,225,479. The net realized gain on the transaction of $1,299,563 will not be realized by the Fund for tax purposes. |
| (c) | On September 25, 2012, Small Cap Growth Fund had a redemption-in-kind transfer of securities in the amount of $2,419,213. The net realized gain on the transaction of $114,052 will not be realized by the Fund for tax purposes. |
| (d) | On April 26, 2012, Silvercrest Small Cap Fund had a redemption-in-kind transfer of securities in the amount of $2,597,146. The net realized gain on the transaction of $211,366 will not be realized by the Fund for tax purposes. |
| (e) | On May 1, 2012 and June 27, 2012, TAMRO Small Cap Fund had redemption-in-kind transfers of securities in the amounts of $39,335,171 and $6,762,586, respectively. The net realized gains on the transactions of $2,612,293 and $289,177, respectively, will not be realized by the Fund for tax purposes. |
See accompanying Notes to Financial Statements.
| | | | | | | | | | | | | | | | | | | | | | | | | | |
| | | | | | |
Silvercrest
Small Cap
Fund(a) | | | TAMRO
Small Cap
Fund | | | River Road
Select Value
Fund | | | River Road
Small Cap
Value Fund | | | River Road
Independent
Value Fund | | | DoubleLine Core
Plus Fixed Income
Fund | | | TCH
Fixed Income
Fund | |
| | | | | | | | | | | | | | | | | | | | | | | | | | |
| | | | | | | | | | | | | | | | | | | | | | | | | | |
| $ | 63,091 | | | $ | 7,090,567 | | | $ | 2,246,039 | | | $ | 4,837,701 | | | $ | 3,788,146 | | | $ | 5,393 | | | $ | 3,188 | |
| | — | | | | (12,870 | ) | | | (16,266 | ) | | | (40,910 | ) | | | (17,635 | ) | | | — | | | | — | |
| | — | | | | — | | | | — | | | | — | | | | — | | | | 3,731,295 | | | | 3,603,811 | |
| | | | | | | | | | | | | | | | | | | | | | | | | | |
| | 63,091 | | | | 7,077,697 | | | | 2,229,773 | | | | 4,796,791 | | | | 3,770,511 | | | | 3,736,688 | | | | 3,606,999 | |
| | | | | | | | | | | | | | | | | | | | | | | | | | |
| | | | | | | | | | | | | | | | | | | | | | | | | | |
| | 39,768 | | | | 9,255,718 | | | | 1,486,962 | | | | 2,722,734 | | | | 5,928,678 | | | | 520,833 | | | | 393,159 | |
| | 1,238 | | | | 961,639 | | | | 19,672 | | | | 149,111 | | | | 864,895 | | | | 96,023 | | | | 102,097 | |
| | 29,795 | | | | 499,365 | | | | 74,926 | | | | 360,222 | | | | 560,140 | | | | 110,302 | | | | 68,414 | |
| | 14,537 | | | | 513,480 | | | | 88,039 | | | | 163,427 | | | | 300,968 | | | | 96,213 | | | | 66,978 | |
| | 23,236 | | | | 51,572 | | | | 31,927 | | | | 36,906 | | | | 47,837 | | | | 51,142 | | | | 32,023 | |
| | 5,787 | | | | 41,218 | | | | 14,990 | | | | 19,648 | | | | 30,930 | | | | 27,103 | | | | 6,276 | |
| | 17,413 | | | | 20,880 | | | | 20,642 | | | | 20,625 | | | | 18,794 | | | | 22,384 | | | | 22,795 | |
| | 3,519 | | | | 27,109 | | | | 3,793 | | | | 7,782 | | | | 16,509 | | | | 4,193 | | | | 1,859 | |
| | 56,642 | | | | — | | | | — | | | | — | | | | 9,185 | | | | 189,991 | | | | — | |
| | 211 | | | | 73,958 | | | | 12,906 | | | | 15,272 | | | | 92,513 | | | | 8,849 | | | | 3,404 | |
| | 250 | | | | 79,247 | | | | 10,889 | | | | 22,679 | | | | 44,470 | | | | 5,919 | | | | 5,437 | |
| | — | | | | 2,905 | | | | 2 | | | | — | | | | — | | | | — | | | | — | |
| | 1,741 | | | | 59,632 | | | | 10,941 | | | | 19,701 | | | | 29,246 | | | | 5,675 | | | | 6,402 | |
| | | | | | | | | | | | | | | | | | | | | | | | | | |
| | 194,137 | | | | 11,586,723 | | | | 1,775,689 | | | | 3,538,107 | | | | 7,944,165 | | | | 1,138,627 | | | | 708,844 | |
| | | | | | | | | | | | | | | | | | | | | | | | | | |
| | (39,768 | ) | | | — | | | | — | | | | — | | | | (143,528 | ) | | | (389,195 | ) | | | (113,511 | ) |
| | (107,398 | ) | | | — | | | | — | | | | — | | | | — | | | | — | | | | — | |
| | — | | | | — | | | | — | | | | — | | | | (23,757 | ) | | | — | | | | — | |
| | | | | | | | | | | | | | | | | | | | | | | | | | |
| | 46,971 | | | | 11,586,723 | | | | 1,775,689 | | | | 3,538,107 | | | | 7,776,880 | | | | 749,432 | | | | 595,333 | |
| | | | | | | | | | | | | | | | | | | | | | | | | | |
| | 16,120 | | | | (4,509,026 | ) | | | 454,084 | | | | 1,258,684 | | | | (4,006,369 | ) | | | 2,987,256 | | | | 3,011,666 | |
| | | | | | | | | | | | | | | | | | | | | | | | | | |
| | | | | | | | | | | | | | | | | | | | | | | | | | |
| | 226,287 | (d) | | | 104,050,686 | (e) | | | 10,079,561 | | | | 21,254,625 | | | | 36,018,328 | | | | 1,032,232 | | | | 1,541,463 | |
| | 111,181 | | | | 6,000,858 | | | | 7,191,158 | | | | 11,176,504 | | | | 10,854,961 | | | | 4,872,717 | | | | 2,125,017 | |
| | | | | | | | | | | | | | | | | | | | | | | | | | |
| | 337,468 | | | | 110,051,544 | | | | 17,270,719 | | | | 32,431,129 | | | | 46,873,289 | | | | 5,904,949 | | | | 3,666,480 | |
| | | | | | | | | | | | | | | | | | | | | | | | | | |
| | | | | | |
| $ | 353,588 | | | $ | 105,542,518 | | | $ | 17,724,803 | | | $ | 33,689,813 | | | $ | 42,866,920 | | | $ | 8,892,205 | | | $ | 6,678,146 | |
| | | | | | | | | | | | | | | | | | | | | | | | | | |
See accompanying Notes to Financial Statements.
| | |
| |
| For the Year Ended October 31, 2012 | | |
| |
| Statements of Operations – continued | | |
| | | | | | | | |
| | |
| | | Lake Partners
LASSO Alternatives
Fund | | | Dynamic
Allocation
Fund | |
| | | | | | | | |
INVESTMENT INCOME: | | | | | | | | |
Dividends | | $ | 4,444,523 | | | $ | 717,960 | |
Less: foreign taxes withheld | | | — | | | | — | |
Interest | | | — | | | | — | |
| | | | | | | | |
Total investment income | | | 4,444,523 | | | | 717,960 | |
| | | | | | | | |
EXPENSES: | | | | | | | | |
Investment advisory fees (Note G) | | | 2,517,804 | | | | 313,736 | |
Distribution expenses (Note G) | | | 60,107 | | | | 85,599 | |
Transfer agent fees | | | 157,884 | | | | 80,653 | |
Administration fees (Note G) | | | 135,076 | | | | 33,206 | |
Registration expenses | | | 37,152 | | | | 44,436 | |
Custodian fees | | | 8,279 | | | | 2,932 | |
Audit and tax fees | | | 19,030 | | | | 19,908 | |
Legal fees | | | 6,660 | | | | 1,046 | |
Interest and dividend expense on securities sold-short | | | — | | | | — | |
Amortization of offering costs (Note B-13) | | | — | | | | — | |
Reports to shareholder expense | | | 18,169 | | | | 4,278 | |
Trustees fees and related expenses (Note G) | | | 18,812 | | | | 3,252 | |
Interest expense (Note H) | | | — | | | | — | |
Other expenses | | | 13,739 | | | | 5,974 | |
| | | | | | | | |
Total expenses before waivers/reimbursements | | | 2,992,712 | | | | 595,020 | |
| | | | | | | | |
Less: Investment advisory fees waived (Note G) | | | — | | | | (98,710 | ) |
Less: Earnings credit | | | (2,453 | ) | | | — | |
Plus: Net expenses recouped (Note G) | | | 88,544 | | | | — | |
| | | | | | | | |
Net expenses | | | 3,078,803 | | | | 496,310 | |
| | | | | | | | |
NET INVESTMENT INCOME (LOSS) | | | 1,365,720 | | | | 221,650 | |
| | | | | | | | |
NET REALIZED AND UNREALIZED GAIN (LOSS) ON INVESTMENTS: | | | | | | | | |
Net realized gain (loss) on investments | | | (3,732,495 | ) | | | (853,449 | ) |
Net realized loss on purchased options | | | — | | | | — | |
Net realized gain on short sales | | | — | | | | — | |
Net realized gain on written option transactions | | | — | | | | — | |
Net realized loss on foreign currency transactions | | | — | | | | — | |
Capital gain distributions received | | | 5,290,364 | | | | — | |
Net change in unrealized appreciation (depreciation) on investments | | | 10,167,273 | | | | (60,432 | ) |
Net change in unrealized appreciation on purchased options | | | — | | | | — | |
Net change in unrealized depreciation on written options | | | — | | | | — | |
Net change in unrealized appreciation on securities sold short | | | — | | | | — | |
Net change in unrealized depreciation on translation of assets and liabilities denominated
in foreign currency | | | — | | | | — | |
| | | | | | | | |
NET REALIZED AND UNREALIZED GAIN (LOSS) ON INVESTMENTS | | | 11,725,142 | | | | (913,881 | ) |
| | | | | | | | |
| | |
NET INCREASE (DECREASE) IN NET ASSETS FROM OPERATIONS | | $ | 13,090,862 | | | $ | (692,231 | ) |
| | | | | | | | |
| (a) | On December 2, 2011, Harrison Street Real Estate Fund had a redemption-in-kind transfer of securities in the amount of $30,913,574. The net realized gain on the transaction of $664,979 will not be realized by the Fund for tax purposes. |
See accompanying Notes to Financial Statements.
| | | | | | | | | | | | | | | | | | |
| | | | |
Anchor Capital
Enhanced Equity
Fund | | | River Road
Long-Short
Fund | | | Barings
International
Fund | | | Harrison Street
Real Estate
Fund | | | Montag &
Caldwell
Balanced Fund | |
| | | | | | | | | | | | | | | | | | |
| | | | | | | | | | | | | | | | | | |
| $ | 4,470,235 | | | $ | 82,043 | | | $ | 1,871,158 | | | $ | 317,069 | | | $ | 295,064 | |
| | (54,940 | ) | | | (1,213 | ) | | | (139,970 | ) | | | (2,011 | ) | | | (1,449 | ) |
| | — | | | | — | | | | — | | | | — | | | | 289,629 | |
| | | | | | | | | | | | | | | | | | |
| | 4,415,295 | | | | 80,830 | | | | 1,731,188 | | | | 315,058 | | | | 583,244 | |
| | | | | | | | | | | | | | | | | | |
| | | | | | | | | | | | | | | | | | |
| | 1,015,845 | | | | 69,185 | | | | 596,736 | | | | 109,157 | | | | 220,017 | |
| | 182,804 | | | | 14,413 | | | | 988 | | | | 19,658 | | | | 33,452 | |
| | 154,572 | | | | 17,698 | | | | 35,113 | | | | 41,515 | | | | 56,770 | |
| | 87,495 | | | | 18,294 | | | | 64,465 | | | | 19,466 | | | | 32,227 | |
| | 51,679 | | | | 19,959 | | | | 30,009 | | | | 31,709 | | | | 35,764 | |
| | 33,144 | | | | 9,468 | | | | 42,079 | | | | 4,464 | | | | 3,460 | |
| | 19,594 | | | | 21,062 | | | | 20,650 | | | | 20,716 | | | | 22,794 | |
| | 10,765 | | | | 152 | | | | 1,573 | | | | 549 | | | | 763 | |
| | — | | | | 81,355 | | | | — | | | | — | | | | — | |
| | — | | | | 33,590 | | | | — | | | | — | | | | — | |
| | 20,209 | | | | 502 | | | | 2,078 | | | | — | | | | 2,418 | |
| | 10,818 | | | | 416 | | | | 4,609 | | | | 1,073 | | | | 2,093 | |
| | 690 | | | | — | | | | — | | | | — | | | | — | |
| | 8,582 | | | | 4,023 | | | | 6,888 | | | | 1,676 | | | | 5,085 | |
| | | | | | | | | | | | | | | | | | |
| | 1,596,197 | | | | 290,117 | | | | 805,188 | | | | 249,983 | | | | 414,843 | |
| | | | | | | | | | | | | | | | | | |
| | — | | | | (69,185 | ) | | | (117,951 | ) | | | (108,068 | ) | | | (58,700 | ) |
| | (1,467 | ) | | | (41,565 | ) | | | — | | | | — | | | | — | |
| | 61,190 | | | | — | | | | — | | | | — | | | | — | |
| | | | | | | | | | | | | | | | | | |
| | 1,655,920 | | | | 179,367 | | | | 687,237 | | | | 141,915 | | | | 356,143 | |
| | | | | | | | | | | | | | | | | | |
| | 2,759,375 | | | | (98,537 | ) | | | 1,043,951 | | | | 173,143 | | | | 227,101 | |
| | | | | | | | | | | | | | | | | | |
| | | | | | | | | | | | | | | | | | |
| | 6,296,016 | | | | 882,801 | | | | 913,139 | | | | 1,929,231 | (a) | | | 1,435,094 | |
| | (8,023,322 | ) | | | — | | | | — | | | | — | | | | — | |
| | — | | | | (269,534 | ) | | | — | | | | — | | | | — | |
| | 4,581,584 | | | | — | | | | — | | | | — | | | | — | |
| | — | | | | — | | | | (30,003 | ) | | | (74 | ) | | | — | |
| | — | | | | — | | | | — | | | | — | | | | — | |
| | 747,814 | | | | (101,505 | ) | | | 794,810 | | | | (2,376,578 | ) | | | 422,708 | |
| | 874,662 | | | | — | | | | — | | | | — | | | | — | |
| | (2,627,097 | ) | | | — | | | | — | | | | — | | | | — | |
| | — | | | | 27,982 | | | | — | | | | — | | | | — | |
| | | | | | | | | | | | | | | | | | |
| | — | | | | — | | | | (34,615 | ) | | | (30 | ) | | | — | |
| | | | | | | | | | | | | | | | | | |
| | 1,849,657 | | | | 539,744 | | | | 1,643,331 | | | | (447,451 | ) | | | 1,857,802 | |
| | | | | | | | | | | | | | | | | | |
| | | | |
| $ | 4,609,032 | | | $ | 441,207 | | | $ | 2,687,282 | | | $ | (274,308 | ) | | $ | 2,084,903 | |
| | | | | | | | | | | | | | | | | | |
See accompanying Notes to Financial Statements.
| | |
| |
| | |
| |
| Statements of Changes in Net Assets | | |
| | | | | | | | | | | | | | | | |
| | |
| | | Montag & Caldwell
Growth Fund | | | Veredus Select
Growth Fund | |
| | | Years Ended October 31, | | | Years Ended October 31, | |
| | | 2012 | | | 2011 | | | 2012 | | | 2011 | |
| | | | | | | | | | | | | | | | |
NET ASSETS at Beginning of Period | | $ | 3,441,019,426 | | | $ | 3,042,348,287 | | | $ | 80,277,274 | | | $ | 104,506,310 | |
| | | | | | | | | | | | | | | | |
Increase (decrease) in net assets from operations: | | | | | | | | | | | | | | | | |
Net investment income (loss) | | | 27,731,344 | | | | 23,212,618 | | | | 174,893 | | | | 12,937 | |
Net realized gain (loss) on investments and purchased options | | | 287,451,677 | | | | 276,464,229 | | | | 2,056,758 | | | | 2,087,190 | |
Net change in unrealized appreciation (depreciation) on investments and purchased options | | | 78,274,829 | | | | (24,507,953 | ) | | | (2,651,492 | ) | | | (6,313,915 | ) |
| | | | | | | | | | | | | | | | |
Net increase (decrease) in net assets from operations | | | 393,457,850 | | | | 275,168,894 | | | | (419,841 | ) | | | (4,213,788 | ) |
| | | | | | | | | | | | | | | | |
Distributions to shareholders from: | | | | | | | | | | | | | | | | |
Net investment income: | | | | | | | | | | | | | | | | |
Class N | | | (8,653,266 | ) | | | (8,322,107 | ) | | | — | | | | — | |
Class I | | | (13,404,436 | ) | | | (12,483,308 | ) | | | (27,060 | ) | | | — | |
Class R | | | (23,730 | ) | | | (29,409 | ) | | | — | | | | — | |
Net realized gain on investments: | | | | | | | | | | | | | | | | |
Class N | | | (125,020,421 | ) | | | (2,646,170 | ) | | | — | | | | — | |
Class I | | | (132,016,151 | ) | | | (2,724,240 | ) | | | — | | | | — | |
Class R | | | (653,567 | ) | | | (13,510 | ) | | | — | | | | — | |
| | | | | | | | | | | | | | | | |
Total distributions | | | (279,771,571 | ) | | | (26,218,744 | ) | | | (27,060 | ) | | | — | |
| | | | | | | | | | | | | | | | |
Capital share transactions: | | | | | | | | | | | | | | | | |
Proceeds from sales of shares: | | | | | | | | | | | | | | | | |
Class N | | | 441,340,857 | | | | 660,309,446 | | | | 534,868 | | | | 7,667,702 | |
Class I | | | 1,079,995,284 | | | | 621,098,679 | | | | 2,466,101 | | | | 11,926,061 | |
Class R | | | 2,438,971 | | | | 5,580,418 | | | | — | | | | — | |
Proceeds from reinvestment of distributions: | | | | | | | | | | | | | | | | |
Class N | | | 130,056,898 | | | | 10,562,918 | | | | — | | | | — | |
Class I | | | 100,607,628 | | | | 11,978,807 | | | | 26,846 | | | | — | |
Class R | | | 530,624 | | | | 21,213 | | | | — | | | | — | |
Cost of shares redeemed: | | | | | | | | | | | | | | | | |
Class N | | | (404,459,339 | ) | | | (618,544,121 | ) | | | (10,844,619 | ) | | | (28,127,415 | ) |
Class I | | | (578,526,415 | ) | | | (536,452,510 | ) | | | (59,922,030 | ) | | | (11,481,596 | ) |
Class R | | | (3,111,332 | ) | | | (4,833,861 | ) | | | — | | | | — | |
| | | | | | | | | | | | | | | | |
Net increase (decrease) from capital share transactions | | | 768,873,176 | | | | 149,720,989 | | | | (67,738,834 | ) | | | (20,015,248 | ) |
| | | | | | | | | | | | | | | | |
Total increase (decrease) in net assets | | | 882,559,455 | | | | 398,671,139 | | | | (68,185,735 | ) | | | (24,229,036 | ) |
| | | | | | | | | | | | | | | | |
NET ASSETS at End of Period | | $ | 4,323,578,881 | | | $ | 3,441,019,426 | | | $ | 12,091,539 | | | $ | 80,277,274 | |
| | | | | | | | | | | | | | | | |
Undistributed net investment income | | $ | 23,270,805 | | | $ | 17,620,893 | | | $ | 174,730 | | | $ | 26,897 | |
| | | | | | | | | | | | | | | | |
| (a) | Cornerstone Large Cap Value Fund had a redemption-in-kind on March 18, 2011, which resulted in a redemption out of the Fund of $222,180,158. The redemption was comprised of securities and cash in the amounts of $218,362,480 and $3,817,758, respectively. |
See accompanying Notes to Financial Statements.
| | | | | | | | | | | | | | | | | | | | | | |
| | |
TAMRO Diversified
Equity Fund | | | Herndon Large Cap
Value Fund | | | Cornerstone Large Cap
Value Fund | |
| Years Ended October 31, | | | Years Ended October 31, | | | Years Ended October 31, | |
| 2012 | | | 2011 | | | 2012 | | | 2011 | | | 2012 | | | 2011 | |
| | | | | | | | | | | | | | | | | | | | | | |
| $ | 24,353,652 | | | $ | 15,669,792 | | | $ | 17,969,968 | | | $ | 1,472,096 | | | $ | 24,756,738 | | �� | $ | 224,034,670 | |
| | | | | | | | | | | | | | | | | | | | | | |
| | | | | | | | | | | | | | | | | | | | | | |
| | 830 | | | | (44,914 | ) | | | 698,262 | | | | 136,661 | | | | 240,995 | | | | 1,616,818 | |
|
(34,026 |
) | | | 656,066 | | | | 930,577 | | | | 677,342 | | | | 1,056,316 | | | | 34,986,939 | |
|
2,549,855 |
| | | (699,407 | ) | | | 984,335 | | | | (196,751 | ) | | | 1,197,003 | | | | (15,657,682 | ) |
| | | | | | | | | | | | | | | | | | | | | | |
|
2,516,659 |
| | | (88,255 | ) | | | 2,613,174 | | | | 617,252 | | | | 2,494,314 | | | | 20,946,075 | |
| | | | | | | | | | | | | | | | | | | | | | |
| | | | | | | | | | | | | | | | | | | | | | |
| | | | | | | | | | | | | | | | | | | | | | |
| | — | | | | — | | | | (69,391 | ) | | | (13,657 | ) | | | (110,362 | ) | | | (265,642 | ) |
| | — | | | | — | | | | (154,780 | ) | | | — | | | | (577 | ) | | | (1,541,502 | ) |
| | — | | | | — | | | | — | | | | — | | | | — | | | | — | |
| | | | | | | | | | | | | | | | | | | | | | |
| | (473,355 | ) | | | — | | | | (340,506 | ) | | | — | | | | — | | | | — | |
| | — | | | | — | | | | (604,334 | ) | | | — | | | | — | | | | — | |
| | — | | | | — | | | | — | | | | — | | | | — | | | | — | |
| | | | | | | | | | | | | | | | | | | | | | |
| | (473,355 | ) | | | — | | | | (1,169,011 | ) | | | (13,657 | ) | | | (110,939 | ) | | | (1,807,144 | ) |
| | | | | | | | | | | | | | | | | | | | | | |
| | | | | | | | | | | | | | | | | | | | | | |
| | | | | | | | | | | | | | | | | | | | | | |
| | 2,735,793 | | | | 13,791,809 | | | | 19,089,187 | | | | 14,353,866 | | | | 5,930,111 | | | | 9,241,468 | |
| | 584,348 | | | | — | | | | 26,894,024 | | | | 12,434,600 | | | | 5,334,807 | | | | 413 | |
| | — | | | | — | | | | — | | | | — | | | | — | | | | — | |
| | | | | | | | | | | | | | | | | | | | | | |
| | 461,380 | | | | — | | | | 409,897 | | | | 13,657 | | | | 106,566 | | | | 254,223 | |
| | — | | | | — | | | | 759,114 | | | | — | | | | 577 | | | | 964,424 | |
| | — | | | | — | | | | — | | | | — | | | | — | | | | — | |
| | | | | | | | | | | | | | | | | | | | | | |
| | (7,598,556 | ) | | | (5,019,694 | ) | | | (5,463,083 | ) | | | (10,907,846 | ) | | | (11,895,211 | ) | | | (6,696,820 | ) |
| | (30,944 | ) | | | — | | | | (5,696,318 | ) | | | — | | | | (114,095 | ) | | | (222,180,571 | )(a) |
| | — | | | | — | | | | — | | | | — | | | | — | | | | — | |
| | | | | | | | | | | | | | | | | | | | | | |
|
(3,847,979 |
) | | | 8,772,115 | | | | 35,992,821 | | | | 15,894,277 | | | | (637,245 | ) | | | (218,416,863 | ) |
| | | | | | | | | | | | | | | | | | | | | | |
| | (1,804,675 | ) | | | 8,683,860 | | | | 37,436,984 | | | | 16,497,872 | | | | 1,746,130 | | | | (199,277,932 | ) |
| | | | | | | | | | | | | | | | | | | | | | |
| $ | 22,548,977 | | | $ | 24,353,652 | | | $ | 55,406,952 | | | $ | 17,969,968 | | | $ | 26,502,868 | | | $ | 24,756,738 | |
| | | | | | | | | | | | | | | | | | | | | | |
| $ | 830 | | | $ | — | | | $ | 601,291 | | | $ | 127,238 | | | $ | 130,056 | | | $ | — | |
| | | | | | | | | | | | | | | | | | | | | | |
See accompanying Notes to Financial Statements.
| | |
| |
| | |
| |
| Statements of Changes in Net Assets – continued | | |
| | | | | | | | | | | | |
| | |
| | | River Road Dividend
All Cap Value Fund | | | River Road
Dividend All Cap
Value Fund II | |
| | | Years Ended October 31, | | | Period Ended
October 31,
2012(a) | |
| | | 2012 | | | 2011 | | |
| | | | | | | | | | | | |
NET ASSETS at Beginning of Period | | $ | 620,152,985 | | | $ | 273,172,565 | | | $ | — | |
| | | | | | | | | | | | |
Increase (decrease) in net assets from operations: | | | | | | | | | | | | |
Net investment income (loss) | | | 23,469,901 | | | | 11,709,666 | | | | 43,321 | |
Net realized gain on investments | | | 35,184,296 | | | | 4,466,315 | | | | 5,681 | |
Net change in unrealized appreciation (depreciation) on investments | | | 38,094,587 | | | | 13,856,396 | | | | (47,353 | ) |
| | | | | | | | | | | | |
Net increase (decrease) in net assets from operations | | | 96,748,784 | | | | 30,032,377 | | | | 1,649 | |
| | | | | | | | | | | | |
Distributions to shareholders from: | | | | | | | | | | | | |
Net investment income: | | | | | | | | | | | | |
Class N | | | (8,876,757 | ) | | | (4,480,688 | ) | | | (4,217 | ) |
Class I | | | (14,324,347 | ) | | | (6,151,388 | ) | | | (38,951 | ) |
Net realized gain on investments: | | | | | | | | | | | | |
Class N | | | (2,301,513 | ) | | | — | | | | — | |
Class I | | | (2,349,496 | ) | | | — | | | | — | |
| | | | | | | | | | | | |
Total distributions | | | (27,852,113 | ) | | | (10,632,076 | ) | | | (43,168 | ) |
| | | | | | | | | | | | |
Capital share transactions: | | | | | | | | | | | | |
Proceeds from sales of shares: | | | | | | | | | | | | |
Class N | | | 113,881,567 | | | | 200,005,589 | | | | 1,042,531 | |
Class I | | | 274,730,584 | | | | 193,412,218 | | | | 9,388,289 | |
Proceeds from reinvestment of distributions: | | | | | | | | | | | | |
Class N | | | 11,027,472 | | | | 4,324,529 | | | | 3,909 | |
Class I | | | 11,799,898 | | | | 3,993,640 | | | | 36,423 | |
Cost of shares redeemed: | | | | | | | | | | | | |
Class N | | | (117,659,249 | ) | | | (52,119,639 | ) | | | (414 | ) |
Class I | | | (58,620,560 | ) | | | (22,036,218 | ) | | | (9,979 | ) |
| | | | | | | | | | | | |
Net increase (decrease) from capital share transactions | | | 235,159,712 | | | | 327,580,119 | | | | 10,460,759 | |
| | | | | | | | | | | | |
Total increase (decrease) in net assets | | | 304,056,383 | | | | 346,980,420 | | | | 10,419,240 | |
| | | | | | | | | | | | |
NET ASSETS at End of Period | | $ | 924,209,368 | | | $ | 620,152,985 | | | $ | 10,419,240 | |
| | | | | | | | | | | | |
Undistributed (distributions in excess of) net investment income (loss) | | $ | 132,637 | | | $ | (110,262 | ) | | $ | 7,776 | |
| | | | | | | | | | | | |
| (a) | River Road Dividend All Cap Value Fund II began issuing shares on June 27, 2012. |
| (b) | Fairpointe Mid Cap Fund had a redemption-in-kind on January 13, 2012, which resulted in a redemption out of the Fund of $38,722,763. The redemption was comprised of securities and cash in the amounts of $38,179,960 and $542,803, respectively. |
| (c) | Veredus Small Cap Growth Fund had a redemption-in-kind on December 2, 2011, which resulted in a redemption out of the Fund of $13,436,583. The redemption was comprised of securities and cash in the amounts of $13,225,479 and $211,104, respectively. |
See accompanying Notes to Financial Statements.
| | | | | | | | | | | | | | | | | | | | | | |
| | |
| Fairpointe Mid Cap Fund | | |
Montag & Caldwell
Mid Cap Growth Fund | | | Veredus Small Cap
Growth Fund | |
| Years Ended October 31, | | | Years Ended October 31, | | |
Years Ended October 31, | |
| 2012 | | | 2011 | | | 2012 | | | 2011 | | | 2012 | | | 2011 | |
| | | | | | | | | | | | | | | | | | | | | | |
| $ | 2,841,488,832 | | | $ | 1,969,004,161 | | | $ | 4,507,024 | | | $ | 3,399,072 | | | $ | 43,191,062 | | | $ | 49,784,390 | |
| | | | | | | | | | | | | | | | | | | | | | |
| | | | | | | | | | | | | | | | | | | | | | |
| | 18,064,492 | | | | 8,114,614 | | | | (39,008 | ) | | | (30,444 | ) | | | (265,648 | ) | | | (476,381 | ) |
| | 70,142,404 | | | | 18,380,917 | | | | 426,097 | | | | 299,123 | | | | 3,149,755 | | | | 6,542,782 | |
| | 207,549,967 | | | | (48,573,966 | ) | | | (74,900 | ) | | | 240,447 | | | | (1,897,684 | ) | | | (2,611,145 | ) |
| | | | | | | | | | | | | | | | | | | | | | |
| | 295,756,863 | | | | (22,078,435 | ) | | | 312,189 | | | | 509,126 | | | | 986,423 | | | | 3,455,256 | |
| | | | | | | | | | | | | | | | | | | | | | |
| | | | | | | | | | | | | | | | | | | | | | |
| | | | | | | | | | | | | | | | | | | | | | |
| | (2,661,253 | ) | | | (4,195,319 | ) | | | — | | | | — | | | | — | | | | — | |
| | (5,501,975 | ) | | | (1,840,072 | ) | | | — | | | | — | | | | — | | | | — | |
| | | | | | | | | | | | | | | | | | | | | | |
| | (10,321,076 | ) | | | (3,944,537 | ) | | | — | | | | — | | | | — | | | | — | |
| | (8,446,694 | ) | | | (1,492,202 | ) | | | — | | | | — | | | | — | | | | — | |
| | | | | | | | | | | | | | | | | | | | | | |
| | (26,930,998 | ) | | | (11,472,130 | ) | | | — | | | | — | | | | — | | | | — | |
| | | | | | | | | | | | | | | | | | | | | | |
| | | | | | | | | | | | | | | | | | | | | | |
| | | | | | | | | | | | | | | | | | | | | | |
| | 442,895,376 | | | | 723,036,262 | | | | 3,071,452 | | | | 738,840 | | | | 879,294 | | | | 3,538,598 | |
| | 655,170,800 | | | | 1,264,789,286 | | | | — | | | | — | | | | 354,546 | | | | 327,191 | |
| | | | | | | | | | | | | | | | | | | | | | |
| | 12,395,039 | | | | 7,690,209 | | | | — | | | | — | | | | — | | | | — | |
| | 9,858,507 | | | | 2,953,475 | | | | — | | | | — | | | | — | | | | — | |
| | | | | | | | | | | | | | | | | | | | | | |
| | (540,581,863 | ) | | | (731,287,676 | ) | | | (521,715 | ) | | | (140,014 | ) | | | (6,714,931 | ) | | | (13,481,571 | ) |
| | (664,320,924 | )(b) | | | (361,146,320 | ) | | | — | | | | — | | | | (14,533,089 | )(c) | | | (432,802 | ) |
| | | | | | | | | | | | | | | | | | | | | | |
| | (84,583,065 | ) | | | 906,035,236 | | | | 2,549,737 | | | | 598,826 | | | | (20,014,180 | ) | | | (10,048,584 | ) |
| | | | | | | | | | | | | | | | | | | | | | |
| | 184,242,800 | | | | 872,484,671 | | | | 2,861,926 | | | | 1,107,952 | | | | (19,027,757 | ) | | | (6,593,328 | ) |
| | | | | | | | | | | | | | | | | | | | | | |
| $ | 3,025,731,632 | | | $ | 2,841,488,832 | | | $ | 7,368,950 | | | $ | 4,507,024 | | | $ | 24,163,305 | | | $ | 43,191,062 | |
| | | | | | | | | | | | | | | | | | | | | | |
| $ | 11,980,487 | | | $ | 2,079,223 | | | $ | (37,681 | ) | | $ | — | | | $ | (167,640 | ) | | $ | — | |
| | | | | | | | | | | | | | | | | | | | | | |
See accompanying Notes to Financial Statements.
| | |
| |
| | |
| |
| Statements of Changes in Net Assets – continued | | |
| | | | | | | | | | | | |
| | |
| | | Small Cap
Growth Fund | | | Silvercrest
Small Cap Fund | |
| | | Year Ended
October 31,
2012 | | | Period Ended
October 31,
2011(a) | | | Period Ended
October 31, | |
| | | | | 2012(b) | |
| | | | | | | | | | | | |
NET ASSETS at Beginning of Period | | $ | 7,961,781 | | | $ | — | | | $ | — | |
| | | | | | | | | | | | |
Increase (decrease) in net assets from operations: | | | | | | | | | | | | |
Net investment income (loss) | | | (88,866 | ) | | | (34,103 | ) | | | 16,120 | |
Net realized gain (loss) on investments | | | 793,830 | | | | (183,520 | ) | | | 226,287 | |
Net change in unrealized appreciation (depreciation) on investments | | | 504,009 | | | | (141,555 | ) | | | 111,181 | |
| | | | | | | | | | | | |
Net increase (decrease) in net assets from
operations | | | 1,208,973 | | | | (359,178 | ) | | | 353,588 | |
| | | | | | | | | | | | |
Distributions to shareholders from: | | | | | | | | | | | | |
Net investment income: | | | | | | | | | | | | |
Class N | | | — | | | | — | | | | — | |
Class I | | | — | | | | — | | | | — | |
Net realized gain on investments: | | | | | | | | | | | | |
Class N | | | — | | | | — | | | | — | |
Class I | | | — | | | | — | | | | — | |
| | | | | | | | | | | | |
Total distributions | | | — | | | | — | | | | — | |
| | | | | | | | | | | | |
Capital share transactions: | | | | | | | | | | | | |
Proceeds from sales of shares: | | | | | | | | | | | | |
Class N | | | 1,039,380 | | | | 6,238,604 | | | | 706,680 | |
Class I | | | 297,740 | | | | 2,963,841 | | | | 7,290,194 | |
Proceeds from reinvestment of distributions: | | | | | | | | | | | | |
Class N | | | — | | | | — | | | | — | |
Class I | | | — | | | | — | | | | — | |
Cost of shares redeemed: | | | | | | | | | | | | |
Class N | | | (1,540,249 | ) | | | (881,486 | ) | | | (3,366 | ) |
Class I | | | (2,554,395 | )(c) | | | — | | | | (2,635,529 | )(d) |
| | | | | | | | | | | | |
Net increase (decrease) from capital share
transactions | | | (2,757,524 | ) | | | 8,320,959 | | | | 5,357,979 | |
| | | | | | | | | | | | |
Total increase (decrease) in net assets | | | (1,548,551 | ) | | | 7,961,781 | | | | 5,711,567 | |
| | | | | | | | | | | | |
NET ASSETS at End of Period | | $ | 6,413,230 | | | $ | 7,961,781 | | | $ | 5,711,567 | |
| | | | | | | | | | | | |
Undistributed (distributions in excess of)
net investment income (loss) | | $ | (5,175 | ) | | $ | (5,573 | ) | | $ | 35,727 | |
| | | | | | | | | | | | |
| (a) | Small Cap Growth Fund began issuing shares on November 2, 2010. |
| (b) | Silvercrest Small Cap Fund began issuing shares on December 23, 2011. |
| (c) | Small Cap Growth Fund had a redemption-in-kind on September 25, 2012, which resulted in a redemption out of the Fund of $2,554,395. The redemption was comprised of securities and cash in the amount of $2,419,213 and $135,182, respectively. |
| (d) | Silvercrest Small Cap Fund had a redemption-in-kind on April 26, 2012, which resulted in a redemption out of the Fund of $2,608,977. The redemption was comprised of securities and cash in the amount of $2,579,146 and $29,831, respectively. |
| (e) | TAMRO Small Cap Fund had redemptions-in-kind on May 1, 2012 and June 27, 2012, 2012, which resulted in redemptions out of the Fund of $40,667,980 and $7,010,475, respectively. The redemptions were comprised of securities and cash in the amounts of $39,335,174 and $6,762,586, respectively and $1,332,806 and $247,889, respectively. |
See accompanying Notes to Financial Statements.
| | | | | | | | | | | | | | | | | | | | | | |
| | |
TAMRO
Small Cap Fund | | | River Road
Select Value Fund | | | River Road
Small Cap Value Fund | |
Years Ended October 31, | | | Years Ended October 31, | | | Years Ended October 31, | |
| 2012 | | | 2011 | | | 2012 | | | 2011 | | | 2012 | | | 2011 | |
| | | | | | | | | | | | | | | | | | | | | | |
| $ | 1,001,284,211 | | | $ | 885,435,944 | | | $ | 143,687,434 | | | $ | 215,753,587 | | | $ | 337,488,064 | | | $ | 468,670,448 | |
| | | | | | | | | | | | | | | | | | | | | | |
| | | | | | | | | | | | | | | | | | | | | | |
| | (4,509,026 | ) | | | (5,328,724 | ) | | | 454,084 | | | | 42,145 | | | | 1,258,684 | | | | 83,034 | |
| | 104,050,686 | | | | 99,904,044 | | | | 10,079,561 | | | | 29,375,751 | | | | 21,254,625 | | | | 44,847,576 | |
| | 6,000,858 | | | | (22,100,977 | ) | | | 7,191,158 | | | | (13,992,847 | ) | | | 11,176,504 | | | | (11,965,485 | ) |
| | | | | | | | | | | | | | | | | | | | | | |
|
105,542,518 |
| | | 72,474,343 | | | | 17,724,803 | | | | 15,425,049 | | | | 33,689,813 | | | | 32,965,125 | |
| | | | | | | | | | | | | | | | | | | | | | |
| | | | | | | | | | | | | | | | | | | | | | |
| | | | | | | | | | | | | | | | | | | | | | |
| | — | | | | — | | | | — | | | | (176,001 | ) | | | — | | | | (643,153 | ) |
| | — | | | | — | | | | — | | | | (958,025 | ) | | | — | | | | (1,405,337 | ) |
| | | | | | | | | | | | | | | | | | | | | | |
| | (37,105,939 | ) | | | (7,598,056 | ) | | | (2,638,084 | ) | | | (475,433 | ) | | | — | | | | — | |
| | (60,086,992 | ) | | | (12,204,102 | ) | | | (26,691,130 | ) | | | (1,484,315 | ) | | | — | | | | — | |
| | | | | | | | | | | | | | | | | | | | | | |
| | (97,192,931 | ) | | | (19,802,158 | ) | | | (29,329,214 | ) | | | (3,093,774 | ) | | | — | | | | (2,048,490 | ) |
| | | | | | | | | | | | | | | | | | | | | | |
| | | | | | | | | | | | | | | | | | | | | | |
| | | | | | | | | | | | | | | | | | | | | | |
| | 100,985,943 | | | | 134,405,206 | | | | 2,113,833 | | | | 9,181,896 | | | | 11,250,505 | | | | 38,752,450 | |
| | 155,633,470 | | | | 203,159,987 | | | | 50,275,199 | | | | 40,104,315 | | | | 47,334,504 | | | | 51,580,650 | |
| | | | | | | | | | | | | | | | | | | | | | |
| | 36,431,124 | | | | 7,455,712 | | | | 2,564,966 | | | | 633,791 | | | | — | | | | 639,592 | |
| | 41,999,122 | | | | 8,709,830 | | | | 23,172,373 | | | | 2,107,208 | | | | — | | | | 1,383,335 | |
| | | | | | | | | | | | | | | | | | | | | | |
| | (126,301,603 | ) | | | (121,337,026 | ) | | | (10,015,665 | ) | | | (53,148,045 | ) | | | (61,115,685 | ) | | | (178,262,562 | ) |
| | (193,593,771 | )(e) | | | (169,217,627 | ) | | | (37,413,865 | ) | | | (83,276,593 | ) | | | (79,418,013 | ) | | | (76,192,484 | ) |
| | | | | | | | | | | | | | | | | | | | | | |
|
15,154,285 |
| | | 63,176,082 | | | | 30,696,841 | | | | (84,397,428 | ) | | | (81,948,689 | ) | | | (162,099,019 | ) |
| | | | | | | | | | | | | | | | | | | | | | |
| | 23,503,872 | | | | 115,848,267 | | | | 19,092,430 | | | | (72,066,153 | ) | | | (48,258,876 | ) | | | (131,182,384 | ) |
| | | | | | | | | | | | | | | | | | | | | | |
| $ | 1,024,788,083 | | | $ | 1,001,284,211 | | | $ | 162,779,864 | | | $ | 143,687,434 | | | $ | 289,229,188 | | | $ | 337,488,064 | |
| | | | | | | | | | | | | | | | | | | | | | |
$ |
— |
| | $ | — | | | $ | 460,063 | | | $ | — | | | $ | 1,294,664 | | | $ | — | |
| | | | | | | | | | | | | | | | | | | | | | |
See accompanying Notes to Financial Statements.
| | |
| |
| | |
| |
| Statements of Changes in Net Assets – continued | | |
| | | | | | | | | | | | | | | | |
| | |
| | | River Road
Independent Value Fund | | | DoubleLine
Core Plus
Fixed Income Fund | |
| | | Year Ended
October 31,
2012 | | | Period Ended
October 31,
2011(a) | | | Year Ended
October 31,
2012 | | | Period Ended
October 31,
2011(b) | |
| | | | | |
| | | | | | | | | | | | | | | | |
NET ASSETS at Beginning of Period | | $ | 391,700,125 | | | $ | — | | | $ | 27,143,189 | | | $ | — | |
| | | | | | | | | | | | | | | | |
Increase (decrease) in net assets from operations: | | | | | | | | | | | | | | | | |
Net investment income (loss) | | | (4,006,369 | ) | | | (1,085,446 | ) | | | 2,987,256 | | | | 186,165 | |
Net realized gain (loss) on investments and capital gain distributions | | | 36,018,328 | | | | 5,386,949 | | | | 1,032,232 | | | | 43,586 | |
Net change in unrealized appreciation (depreciation) on investments | | | 10,854,961 | | | | (574,323 | ) | | | 4,872,717 | | | | 254,825 | |
| | | | | | | | | | | | | | | | |
Net increase (decrease) in net assets from operations | | | 42,866,920 | | | | 3,727,180 | | | | 8,892,205 | | | | 484,576 | |
| | | | | | | | | | | | | | | | |
Distributions to shareholders from: | | | | | | | | | | | | | | | | |
Net investment income: | | | | | | | | | | | | | | | | |
Class N | | | — | | | | — | | | | (1,317,861 | ) | | | (148,691 | ) |
Class I | | | — | | | | — | | | | (2,043,553 | ) | | | (42,117 | ) |
Net realized gain on investments: | | | | | | | | | | | | | | | | |
Class N | | | (3,623,431 | ) | | | — | | | | (34,851 | ) | | | — | |
Class I | | | (2,074,734 | ) | | | — | | | | (24,248 | ) | | | — | |
| | | | | | | | | | | | | | | | |
Total distributions | | | (5,698,165 | ) | | | — | | | | (3,420,513 | ) | | | (190,808 | ) |
| | | | | | | | | | | | | | | | |
Capital share transactions: | | | | | | | | | | | | | | | | |
Proceeds from sales of shares: | | | | | | | | | | | | | | | | |
Class N | | | 202,967,411 | | | | 369,370,471 | | | | 71,060,094 | | | | 23,893,578 | |
Class I | | | 276,507,471 | | | | 87,929,924 | | | | 103,044,113 | | | | 5,325,160 | |
Proceeds from reinvestment of distributions: | | | | | | | | | | | | | | | | |
Class N | | | 3,615,800 | | | | — | | | | 1,344,828 | | | | 142,202 | |
Class I | | | 2,024,439 | | | | — | | | | 1,929,366 | | | | 42,117 | |
Cost of shares redeemed: | | | | | | | | | | | | | | | | |
Class N | | | (170,062,099 | ) | | | (65,670,819 | ) | | | (25,676,534 | ) | | | (1,531,005 | ) |
Class I | | | (43,272,439 | ) | | | (3,656,631 | ) | | | (7,435,170 | ) | | | (1,022,631 | ) |
| | | | | | | | | | | | | | | | |
Net increase (decrease) from capital share transactions | | | 271,780,583 | | | | 387,972,945 | | | | 144,266,697 | | | | 26,849,421 | |
| | | | | | | | | | | | | | | | |
Total increase (decrease) in net assets | | | 308,949,338 | | | | 391,700,125 | | | | 149,738,389 | | | | 27,143,189 | |
| | | | | | | | | | | | | | | | |
NET ASSETS at End of Period | | $ | 700,649,463 | | | $ | 391,700,125 | | | $ | 176,881,578 | | | $ | 27,143,189 | |
| | | | | | | | | | | | | | | | |
Undistributed (distributions in excess of)
net investment income (loss) | | $ | (43,461 | ) | | $ | (37,538 | ) | | $ | (380,739 | ) | | $ | (9,503 | ) |
| | | | | | | | | | | | | | | | |
| (a) | River Road Independent Value Fund began issuing shares on December 30, 2010. |
| (b) | DoubleLine Core Plus Fixed Income Fund began issuing shares on July 15, 2011. |
See accompanying Notes to Financial Statements.
| | | | | | | | | | | | | | | | | | | | | | |
| | |
TCH Fixed
Income Fund | | | Lake Partners
LASSO Alternatives Fund | | | Dynamic
Allocation Fund | |
Years Ended October 31, | | | Years Ended October 31, | | | Years Ended October 31, | |
| 2012 | | | 2011 | | | 2012 | | | 2011 | | | 2012 | | | 2011 | |
| | | | | | | | | | | | | | | | | | | | | | |
| $ | 72,769,324 | | | $ | 61,154,711 | | | $ | 207,625,322 | | | $ | 28,019,637 | | | $ | 49,240,524 | | | $ | 54,234,248 | |
| | | | | | | | | | | | | | | | | | | | | | |
| | | | | | | | | | | | | | | | | | | | | | |
| | 3,011,666 | | | | 2,777,397 | | | | 1,365,720 | | | | 141,372 | | | | 221,650 | | | | (167,249 | ) |
|
1,541,463 |
| | | 350,010 | | | | 1,557,869 | | | | (4,044,043 | ) | | | (853,449 | ) | | | 5,957,161 | |
|
2,125,017 |
| | | 153,269 | | | | 10,167,273 | | | | (2,659,656 | ) | | | (60,432 | ) | | | (2,211,531 | ) |
| | | | | | | | | | | | | | | | | | | | | | |
| | 6,678,146 | | | | 3,280,676 | | | | 13,090,862 | | | | (6,562,327 | ) | | | (692,231 | ) | | | 3,578,381 | |
| | | | | | | | | | | | | | | | | | | | | | |
| | | | | | | | | | | | | | | | | | | | | | |
| | | | | | | | | | | | | | | | | | | | | | |
| | (2,752,487 | ) | | | (2,179,922 | ) | | | (255,933 | ) | | | (60,987 | ) | | | (84,100 | ) | | | (145,930 | ) |
| | (479,605 | ) | | | (630,662 | ) | | | (3,425,003 | ) | | | (200,883 | ) | | | (10,445 | ) | | | (916 | ) |
| | | | | | | | | | | | | | | | | | | | | | |
| | — | | | | — | | | | — | | | | (51,647 | ) | | | (4,208,286 | ) | | | (1,740,103 | ) |
| | — | | | | — | | | | — | | | | (141,825 | ) | | | (428,748 | ) | | | (5,816 | ) |
| | | | | | | | | | | | | | | | | | | | | | |
| | (3,232,092 | ) | | | (2,810,584 | ) | | | (3,680,936 | ) | | | (455,342 | ) | | | (4,731,579 | ) | | | (1,892,765 | ) |
| | | | | | | | | | | | | | | | | | | | | | |
| | | | | | | | | | | | | | | | | | | | | | |
| | | | | | | | | | | | | | | | | | | | | | |
| | 11,970,554 | | | | 26,608,188 | | | | 20,838,852 | | | | 13,063,407 | | | | 7,144,660 | | | | 19,238,553 | |
| | 3,311,240 | | | | 3,668,580 | | | | 104,018,117 | | | | 200,746,741 | | | | 2,173,574 | | | | 6,991,108 | |
| | | | | | | | | | | | | | | | | | | | | | |
| | 2,642,277 | | | | 2,084,931 | | | | 254,528 | | | | 112,282 | | | | 4,285,707 | | | | 1,882,196 | |
| | 384,209 | | | | 473,715 | | | | 1,747,717 | | | | 314,308 | | | | 439,193 | | | | 6,732 | |
| | | | | | | | | | | | | | | | | | | | | | |
| | (20,139,538 | ) | | | (12,995,724 | ) | | | (5,931,093 | ) | | | (3,488,899 | ) | | | (27,591,473 | ) | | | (32,146,225 | ) |
| | (4,216,360 | ) | | | (8,695,169 | ) | | | (50,901,768 | ) | | | (24,124,485 | ) | | | (755,398 | ) | | | (2,651,704 | ) |
| | | | | | | | | | | | | | | | | | | | | | |
| | (6,047,618 | ) | | | 11,144,521 | | | | 70,026,353 | | | | 186,623,354 | | | | (14,303,737 | ) | | | (6,679,340 | ) |
| | | | | | | | | | | | | | | | | | | | | | |
| | (2,601,564 | ) | | | 11,614,613 | | | | 79,436,279 | | | | 179,605,685 | | | | (19,727,547 | ) | | | (4,993,724 | ) |
| | | | | | | | | | | | | | | | | | | | | | |
| $ | 70,167,760 | | | $ | 72,769,324 | | | $ | 287,061,601 | | | $ | 207,625,322 | | | $ | 29,512,977 | | | $ | 49,240,524 | |
| | | | | | | | | | | | | | | | | | | | | | |
$ |
257,283 |
| | $ | 276,876 | | | $ | 781,026 | | | $ | 67,864 | | | $ | 121,022 | | | $ | — | |
| | | | | | | | | | | | | | | | | | | | | | |
See accompanying Notes to Financial Statements.
| | |
| |
| | |
| |
| Statements of Changes in Net Assets – continued | | |
| | | | | | | | | | | | | | | | |
| | |
| | | Anchor Capital
Enhanced Equity Fund | | | River Road
Long-Short Fund | |
| | | Years Ended October 31, | | | Year Ended
October 31,
2012 | | | Period Ended
October 31,
2011(a) | |
| | | 2012 | | | 2011 | | | |
| | | | | | | | | | | | | | | | |
NET ASSETS at Beginning of Period | | $ | 113,205,174 | | | $ | 92,563,052 | | | $ | 4,593,930 | | | $ | — | |
| | | | | | | | | | | | | | | | |
Increase (decrease) in net assets from operations: | | | | | | | | | | | | | | | | |
Net investment income (loss) | | | 2,759,375 | | | | 1,731,594 | | | | (98,537 | ) | | | (30,424 | ) |
Net realized gain (loss) on investments, purchased options, written options, securities sold short and foreign currency transactions | | | 2,854,278 | | | | 11,844,073 | | | | 613,267 | | | | (150,888 | ) |
Net change in unrealized appreciation (depreciation) on investments, purchased options, written options, securities sold short and translation of assets and liabilities denominated in foreign currency | | | (1,004,621 | ) | | | (5,531,012 | ) | | | (73,523 | ) | | | 116,075 | |
| | | | | | | | | | | | | | | | |
Net increase (decrease) in net assets from operations | | | 4,609,032 | | | | 8,044,655 | | | | 441,207 | | | | (65,237 | ) |
| | | | | | | | | | | | | | | | |
Distributions to shareholders from: | | | | | | | | | | | | | | | | |
Net investment income: | | | | | | | | | | | | | | | | |
Class N | | | (1,259,013 | ) | | | (652,123 | ) | | | — | | | | — | |
Class I | | | (1,453,347 | ) | | | (1,009,975 | ) | | | — | | | | — | |
Net realized gain on investments: | | | | | | | | | | | | | | | | |
Class N | | | (5,377,824 | ) | | | (1,928,441 | ) | | | — | | | | — | |
Class I | | | (6,563,185 | ) | | | (2,282,232 | ) | | | — | | | | — | |
| | | | | | | | | | | | | | | | |
Total distributions | | | (14,653,369 | ) | | | (5,872,771 | ) | | | — | | | | — | |
| | | | | | | | | | | | | | | | |
Capital share transactions: | | | | | | | | | | | | | | | | |
Proceeds from sales of shares: | | | | | | | | | | | | | | | | |
Class N | | | 89,657,148 | | | | 26,609,227 | | | | 3,037,084 | | | | 4,660,217 | |
Class I | | | 42,752,026 | | | | 25,630,704 | | | | — | | | | — | |
Proceeds from reinvestment of distributions: | | | | | | | | | | | | | | | | |
Class N | | | 6,562,788 | | | | 2,544,539 | | | | — | | | | — | |
Class I | | | 5,836,625 | | | | 2,663,560 | | | | — | | | | — | |
Cost of shares redeemed: | | | | | | | | | | | | | | | | |
Class N | | | (34,343,989 | ) | | | (28,044,291 | ) | | | (565,834 | ) | | | (1,050 | ) |
Class I | | | (35,816,115 | ) | | | (10,933,501 | ) | | | — | | | | — | |
| | | | | | | | | | | | | | | | |
Net increase (decrease) from capital share
transactions | | | 74,648,483 | | | | 18,470,238 | | | | 2,471,250 | | | | 4,659,167 | |
| | | | | | | | | | | | | | | | |
Total increase (decrease) in net assets | | | 64,604,146 | | | | 20,642,122 | | | | 2,912,457 | | | | 4,593,930 | |
| | | | | | | | | | | | | | | | |
NET ASSETS at End of Period | | $ | 177,809,320 | | | $ | 113,205,174 | | | $ | 7,506,387 | | | $ | 4,593,930 | |
| | | | | | | | | | | | | | | | |
Undistributed (distributions in excess of)
net investment income (loss) | | $ | 127,535 | | | $ | 80,520 | | | $ | (29,732 | ) | | $ | (8,210 | ) |
| | | | | | | | | | | | | | | | |
| (a) | River Road Long-Short Fund began issuing shares on May 3, 2011. |
| (b) | Harrison Street Real Estate Fund had a redemption-in-kind on December 2, 2011, which resulted in a redemption out of the Fund of $31,399,368. The redemption was comprised of securities and cash in the amounts of $30,913,574 and $485,794, respectively. |
See accompanying Notes to Financial Statements.
| | | | | | | | | | | | | | | | | | | | | | |
| | |
Barings
International Fund | | | Harrison Street
Real Estate Fund | | | Montag & Caldwell
Balanced Fund | |
Years Ended October 31, | | | Years Ended October 31, | | | Years Ended October 31, | |
| 2012 | | | 2011 | | | 2012 | | | 2011 | | | 2012 | | | 2011 | |
| | | | | | | | | | | | | | | | | | | | | | |
| $ | 52,782,652 | | | $ | 48,168,829 | | | $ | 39,212,065 | | | $ | 35,582,298 | | | $ | 24,729,716 | | | $ | 30,555,528 | |
| | | | | | | | | | | | | | | | | | | | | | |
| | | | | | | | | | | | | | | | | | | | | | |
| | 1,043,951 | | | | 683,032 | | | | 173,143 | | | | 321,324 | | | | 227,101 | | | | 216,304 | |
|
883,136 |
| | | 3,681,538 | | | | 1,929,157 | | | | 8,172,513 | | | | 1,435,094 | | | | 2,651,240 | |
|
760,195 |
| | | (6,777,543 | ) | | | (2,376,608 | ) | | | (4,472,206 | ) | | | 422,708 | | | | (947,217 | ) |
| | | | | | | | | | | | | | | | | | | | | | |
| | 2,687,282 | | | | (2,412,973 | ) | | | (274,308 | ) | | | 4,021,631 | | | | 2,084,903 | | | | 1,920,327 | |
| | | | | | | | | | | | | | | | | | | | | | |
| | | | | | | | | | | | | | | | | | | | | | |
| | | | | | | | | | | | | | | | | | | | | | |
| | (2,517 | ) | | | (3,391 | ) | | | (46,752 | ) | | | (95,034 | ) | | | (309,427 | ) | | | (266,744 | ) |
| | (507,253 | ) | | | (1,016,220 | ) | | | (823 | ) | | | (532,220 | ) | | | (22,048 | ) | | | (45,549 | ) |
| | | | | | | | | | | | | | | | | | | | | | |
| | (9,564 | ) | | | — | | | | — | | | | — | | | | — | | | | — | |
| | (1,371,156 | ) | | | — | | | | — | | | | — | | | | — | | | | — | |
| | | | | | | | | | | | | | | | | | | | | | |
| | (1,890,490 | ) | | | (1,019,611 | ) | | | (47,575 | ) | | | (627,254 | ) | | | (331,475 | ) | | | (312,293 | ) |
| | | | | | | | | | | | | | | | | | | | | | |
| | | | | | | | | | | | | | | | | | | | | | |
| | | | | | | | | | | | | | | | | | | | | | |
| | 11,495 | | | | 299,750 | | | | 6,295,128 | | | | 3,015,671 | | | | 12,344,202 | | | | 1,639,927 | |
| | 17,971,181 | | | | 15,930,055 | | | | 208,772 | | | | 37,683 | | | | 641,711 | | | | 4,647,220 | |
| | | | | | | | | | | | | | | | | | | | | | |
| | 12,081 | | | | 3,391 | | | | 44,264 | | | | 93,419 | | | | 301,482 | | | | 258,918 | |
| | 1,167,329 | | | | 816,360 | | | | 539 | | | | 532,220 | | | | 9,037 | | | | 33,009 | |
| | | | | | | | | | | | | | | | | | | | | | |
| | (271 | ) | | | (68,520 | ) | | | (3,336,601 | ) | | | (3,431,764 | ) | | | (6,067,796 | ) | | | (9,141,134 | ) |
| | (10,657,603 | ) | | | (8,934,629 | ) | | | (31,555,680 | )(b) | | | (11,839 | ) | | | (245,525 | ) | | | (4,871,786 | ) |
| | | | | | | | | | | | | | | | | | | | | | |
|
8,504,212 |
| | | 8,046,407 | | | | (28,343,578 | ) | | | 235,390 | | | | 6,983,111 | | | | (7,433,846 | ) |
| | | | | | | | | | | | | | | | | | | | | | |
| | 9,301,004 | | | | 4,613,823 | | | | (28,665,461 | ) | | | 3,629,767 | | | | 8,736,539 | | | | (5,825,812 | ) |
| | | | | | | | | | | | | | | | | | | | | | |
| $ | 62,083,656 | | | $ | 52,782,652 | | | $ | 10,546,604 | | | $ | 39,212,065 | | | $ | 33,466,255 | | | $ | 24,729,716 | |
| | | | | | | | | | | | | | | | | | | | | | |
$ |
992,441 |
| | $ | 488,263 | | | $ | 125,494 | | | $ | 149,433 | | | $ | (230,949 | ) | | $ | (190,512 | ) |
| | | | | | | | | | | | | | | | | | | | | | |
See accompanying Notes to Financial Statements.
| | |
| |
| ASTON/Montag & Caldwell Growth Fund – Class N | | October 31, 2012 |
| |
| Financial Highlights | | |
| | | | | | | | | | | | | | | | | | | | |
| | | Year
Ended
10/31/12 | | | Year
Ended
10/31/11 | | | Year
Ended
10/31/10 | | | Year
Ended
10/31/09 | | | Year
Ended
10/31/08 | |
Net Asset Value, Beginning of Period | | $ | 24.72 | | | $ | 22.92 | | | $ | 20.87 | | | $ | 18.84 | | | $ | 31.51 | |
| | | | | | | | | | | | | | | | | | | | |
Income from Investment Operations: | | | | | | | | | | | | | | | | | | | | |
Net investment income | | | 0.15 | (a) | | | 0.14 | (a) | | | 0.12 | (a) | | | 0.08 | (a) | | | 0.07 | (a) |
Net realized and unrealized gain (loss)
on investments | | | 2.45 | | | | 1.83 | | | | 2.01 | (b) | | | 2.61 | | | | (8.66 | ) |
| | | | | | | | | | | | | | | | | | | | |
Total from investment operations | | | 2.60 | | | | 1.97 | | | | 2.13 | | | | 2.69 | | | | (8.59 | ) |
| | | | | | | | | | | | | | | | | | | | |
Less Distributions: | | | | | | | | | | | | | | | | | | | | |
Distributions from and in excess of net
investment income | | | (0.13 | ) | | | (0.13 | ) | | | (0.08 | ) | | | (0.06 | ) | | | (0.05 | ) |
Distributions from net realized gain
on investments | | | (1.88 | ) | | | (0.04 | ) | | | — | | | | (0.60 | ) | | | (4.03 | ) |
| | | | | | | | | | | | | | | | | | | | |
Total distributions | | | (2.01 | ) | | | (0.17 | ) | | | (0.08 | ) | | | (0.66 | ) | | | (4.08 | ) |
| | | | | | | | | | | | | | | | | | | | |
Net increase (decrease) in net asset value . | | | 0.59 | | | | 1.80 | | | | 2.05 | | | | 2.03 | | | | (12.67 | ) |
| | | | | | | | | | | | | | | | | | | | |
Net Asset Value, End of Period | | $ | 25.31 | | | $ | 24.72 | | | $ | 22.92 | | | $ | 20.87 | | | $ | 18.84 | |
| | | | | | | | | | | | | | | | | | | | |
Total Return (c) | | | 11.40 | % | | | 8.56 | % | | | 10.20 | % | | | 15.08 | % | | | (31.13 | )% |
| | | | | |
Ratios/Supplemental Data: | | | | | | | | | | | | | | | | | | | | |
Net Assets, End of Period (in 000’s) | | $ | 1,908,663 | | | $ | 1,683,183 | | | $ | 1,506,075 | | | $ | 1,277,346 | | | $ | 602,905 | |
Ratios of expenses to average net assets: | | | | | | | | | | | | | | | | | | | | |
Before reimbursement and/or waiver of
expenses by Adviser | | | 1.05 | % | | | 1.06 | % | | | 1.08 | %(d) | | | 1.11 | % | | | 1.08 | %(d) |
After reimbursement and/or waiver of
expenses by Adviser | | | 1.05 | % | | | 1.06 | % | | | 1.08 | %(d) | | | 1.11 | % | | | 1.08 | %(d) |
Ratios of net investment income to average net assets: | | | | | | | | | | | | | | | | | | | | |
Before reimbursement and/or waiver of
expenses by Adviser | | | 0.60 | % | | | 0.59 | % | | | 0.56 | % | | | 0.41 | % | | | 0.26 | % |
After reimbursement and/or waiver of
expenses by Adviser | | | 0.60 | % | | | 0.59 | % | | | 0.56 | % | | | 0.41 | % | | | 0.26 | % |
Portfolio Turnover | | | 46.42 | % | | | 63.48 | % | | | 57.39 | %(e) | | | 35.09 | %(f) | | | 52.32 | % |
| | (a) | The selected per share data was calculated using the weighted average shares outstanding method for the period. |
| | (b) | Includes payments by affiliates of less than $0.005 per share. |
| | (c) | The total return is calculated using the Net Asset Values used for trading at the close of business at period end. |
| | (d) | Ratios of expenses to average net assets include interest expenses of less than 0.005% for each of the years ended October 31, 2010 and October 31, 2008. The interest expenses are from utilizing the line of credit as discussed in Note H to Financial Statements. |
| | (e) | Portfolio turnover rate excludes securities received from a reorganization. |
| | (f) | Portfolio turnover rate excludes securities received from processing a subscription-in-kind. |
See accompanying Notes to Financial Statements.
| | |
| |
| ASTON/Montag & Caldwell Growth Fund – Class I | | October 31, 2012 |
| |
| Financial Highlights | | |
| | | | | | | | | | | | | | | | | | | | |
| | | Year
Ended
10/31/12 | | | Year
Ended
10/31/11 | | | Year
Ended
10/31/10 | | | Year
Ended
10/31/09 | | | Year
Ended
10/31/08 | |
Net Asset Value, Beginning of Period | | $ | 24.85 | | | $ | 23.05 | | | $ | 20.97 | | | $ | 18.94 | | | $ | 31.61 | |
| | | | | | | | | | | | | | | | | | | | |
Income from Investment Operations: | | | | | | | | | | | | | | | | | | | | |
Net investment income | | | 0.21 | (a) | | | 0.21 | (a) | | | 0.18 | (a) | | | 0.12 | (a) | | | 0.13 | (a) |
Net realized and unrealized gain (loss)
on investments | | | 2.47 | | | | 1.82 | | | | 2.02 | (b) | | | 2.62 | | | | (8.70 | ) |
| | | | | | | | | | | | | | | | | | | | |
Total from investment operations | | | 2.68 | | | | 2.03 | | | | 2.20 | | | | 2.74 | | | | (8.57 | ) |
| | | | | | | | | | | | | | | | | | | | |
Less Distributions: | | | | | | | | | | | | | | | | | | | | |
Distributions from and in excess of net
investment income | | | (0.19 | ) | | | (0.19 | ) | | | (0.12 | ) | | | (0.11 | ) | | | (0.07 | ) |
Distributions from net realized gain
on investments | | | (1.88 | ) | | | (0.04 | ) | | | — | | | | (0.60 | ) | | | (4.03 | ) |
| | | | | | | | | | | | | | | | | | | | |
Total distributions | | | (2.07 | ) | | | (0.23 | ) | | | (0.12 | ) | | | (0.71 | ) | | | (4.10 | ) |
| | | | | | | | | | | | | | | | | | | | |
Net increase (decrease) in net asset value | | | 0.61 | | | | 1.80 | | | | 2.08 | | | | 2.03 | | | | (12.67 | ) |
| | | | | | | | | | | | | | | | | | | | |
Net Asset Value, End of Period | | $ | 25.46 | | | $ | 24.85 | | | $ | 23.05 | | | $ | 20.97 | | | $ | 18.94 | |
| | | | | | | | | | | | | | | | | | | | |
Total Return (c) | | | 11.67 | % | | | 8.82 | % | | | 10.49 | % | | | 15.36 | % | | | (30.96 | )% |
| | | | | |
Ratios/Supplemental Data: | | | | | | | | | | | | | | | | | | | | |
Net Assets, End of Period (in 000’s) | | $ | 2,406,145 | | | $ | 1,749,183 | | | $ | 1,528,981 | | | $ | 1,205,637 | | | $ | 754,671 | |
Ratios of expenses to average net assets: | | | | | | | | | | | | | | | | | | | | |
Before reimbursement and/or waiver of
expenses by Adviser | | | 0.80 | % | | | 0.81 | % | | | 0.83 | %(d) | | | 0.86 | % | | | 0.83 | %(d) |
After reimbursement and/or waiver of
expenses by Adviser | | | 0.80 | % | | | 0.81 | % | | | 0.83 | %(d) | | | 0.86 | % | | | 0.83 | %(d) |
Ratios of net investment income to average net assets: | | | | | | | | | | | | | | | | | | | | |
Before reimbursement and/or waiver of
expenses by Adviser | | | 0.85 | % | | | 0.84 | % | | | 0.81 | % | | | 0.66 | % | | | 0.51 | % |
After reimbursement and/or waiver of
expenses by Adviser | | | 0.85 | % | | | 0.84 | % | | | 0.81 | % | | | 0.66 | % | | | 0.51 | % |
Portfolio Turnover | | | 46.42 | % | | | 63.48 | % | | | 57.39 | %(e) | | | 35.09 | %(f) | | | 52.32 | % |
| | (a) | The selected per share data was calculated using the weighted average shares outstanding method for the period. |
| | (b) | Includes payments by affiliates of less than $0.005 per share. |
| | (c) | The total return is calculated using the Net Asset Values used for trading at the close of business at period end. |
| | (d) | Ratios of expenses to average net assets include interest expenses of less than 0.005% for each of the years ended October 31, 2010 and October 31, 2008. The interest expenses are from utilizing the line of credit as discussed in Note H to Financial Statements. |
| | (e) | Portfolio turnover rate excludes securities received from a reorganization. |
| | (f) | Portfolio turnover rate excludes securities received from processing a subscription-in-kind. |
See accompanying Notes to Financial Statements.
| | |
| |
| ASTON/Montag & Caldwell Growth Fund – Class R | | October 31, 2012 |
| |
| Financial Highlights | | |
| | | | | | | | | | | | | | | | | | | | |
| | | Year
Ended
10/31/12 | | | Year
Ended
10/31/11 | | | Year
Ended
10/31/10 | | | Year
Ended
10/31/09 | | | Year
Ended
10/31/08 | |
Net Asset Value, Beginning of Period | | $ | 24.45 | | | $ | 22.70 | | | $ | 20.73 | | | $ | 18.69 | | | $ | 31.33 | |
| | | | | | | | | | | | | | | | | | | | |
Income from Investment Operations: | | | | | | | | | | | | | | | | | | | | |
Net investment income | | | 0.09 | (a) | | | 0.08 | (a) | | | 0.07 | (a) | | | 0.03 | (a) | | | — | (a)(b) |
Net realized and unrealized gain (loss)
on investments | | | 2.43 | | | | 1.80 | | | | 1.98 | (c) | | | 2.61 | | | | (8.58 | ) |
| | | | | | | | | | | | | | | | | | | | |
Total from investment operations | | | 2.52 | | | | 1.88 | | | | 2.05 | | | | 2.64 | | | | (8.58 | ) |
| | | | | | | | | | | | | | | | | | | | |
Less Distributions: | | | | | | | | | | | | | | | | | | | | |
Distributions from and in excess of net
investment income | | | (0.07 | ) | | | (0.09 | ) | | | (0.08 | ) | | | — | | | | (0.03 | ) |
Distributions from net realized gain
on investments | | | (1.88 | ) | | | (0.04 | ) | | | — | | | | (0.60 | ) | | | (4.03 | ) |
| | | | | | | | | | | | | | | | | | | | |
Total distributions | | | (1.95 | ) | | | (0.13 | ) | | | (0.08 | ) | | | (0.60 | ) | | | (4.06 | ) |
| | | | | | | | | | | | | | | | | | | | |
Net increase (decrease) in net asset value . | | | 0.57 | | | | 1.75 | | | | 1.97 | | | | 2.04 | | | | (12.64 | ) |
| | | | | | | | | | | | | | | | | | | | |
Net Asset Value, End of Period | | $ | 25.02 | | | $ | 24.45 | | | $ | 22.70 | | | $ | 20.73 | | | $ | 18.69 | |
| | | | | | | | | | | | | | | | | | | | |
Total Return (d) | | | 11.10 | % | | | 8.29 | % | | | 9.90 | % | | | 14.87 | % | | | (31.28 | )% |
| | | | | |
Ratios/Supplemental Data: | | | | | | | | | | | | | | | | | | | | |
Net Assets, End of Period (in 000’s) | | $ | 8,771 | | | $ | 8,654 | | | $ | 7,292 | | | $ | 3,840 | | | $ | 266 | |
Ratios of expenses to average net assets: | | | | | | | | | | | | | | | | | | | | |
Before reimbursement and/or waiver of
expenses by Adviser | | | 1.30 | % | | | 1.31 | % | | | 1.33 | %(e) | | | 1.36 | % | | | 1.33 | %(e) |
After reimbursement and/or waiver of
expenses by Adviser | | | 1.30 | % | | | 1.31 | % | | | 1.33 | %(e) | | | 1.36 | % | | | 1.33 | %(e) |
Ratios of net investment income to average net assets: | | | | | | | | | | | | | | | | | | | | |
Before reimbursement and/or waiver of
expenses by Adviser | | | 0.35 | % | | | 0.34 | % | | | 0.31 | % | | | 0.16 | % | | | 0.01 | % |
After reimbursement and/or waiver of
expenses by Adviser | | | 0.35 | % | | | 0.34 | % | | | 0.31 | % | | | 0.16 | % | | | 0.01 | % |
Portfolio Turnover | | | 46.42 | % | | | 63.48 | % | | | 57.39 | %(f) | | | 35.09 | %(g) | | | 52.32 | % |
| | (a) | The selected per share data was calculated using the weighted average shares outstanding method for the period. |
| | (b) | Represents less than $0.005 per share. |
| | (c) | Includes payments by affiliates of less than $0.005 per share. |
| | (d) | The total return is calculated using the Net Asset Values used for trading at the close of business at period end. |
| | (e) | Ratios of expenses to average net assets include interest expenses of less than 0.005% for each of the years ended October 31, 2010 and October 31, 2008. The interest expenses are from utilizing the line of credit as discussed in Note H to Financial Statements. |
| | (f) | Portfolio turnover rate excludes securities received from a reorganization. |
| | (g) | Portfolio turnover rate excludes securities received from processing a subscription-in-kind. |
See accompanying Notes to Financial Statements.
| | |
| |
| ASTON/Veredus Select Growth Fund – Class N | | October 31, 2012 |
| |
| Financial Highlights | | |
| | | | | | | | | | | | | | | | | | | | |
| | | Year
Ended
10/31/12 | | | Year
Ended
10/31/11 | | | Year
Ended
10/31/10 | | | Year
Ended
10/31/09 | | | Year
Ended
10/31/08 | |
Net Asset Value, Beginning of Period | | $ | 10.77 | | | $ | 11.35 | | | $ | 9.07 | | | $ | 8.69 | | | $ | 16.77 | |
| | | | | | | | | | | | | | | | | | | | |
Income from Investment Operations: | | | | | | | | | | | | | | | | | | | | |
Net investment income (loss) | | | 0.02 | (a) | | | (0.02 | )(a) | | | (0.04 | ) | | | (0.01 | ) | | | (0.06 | ) |
Net realized and unrealized gain income (loss)
on investments | | | 0.30 | | | | (0.56 | ) | | | 2.32 | | | | 0.39 | | | | (5.60 | ) |
| | | | | | | | | | | | | | | | | | | | |
Total from investment operations | | | 0.32 | | | | (0.58 | ) | | | 2.28 | | | | 0.38 | | | | (5.66 | ) |
| | | | | | | | | | | | | | | | | | | | |
Less Distributions: | | | | | | | | | | | | | | | | | | | | |
Distributions from and in excess of net
investment income | | | — | | | | — | | | | — | (b) | | | — | | | | — | |
Distributions from net realized gain
on investments | | | — | | | | — | | | | — | | | | — | | | | (2.42 | ) |
| | | | | | | | | | | | | | | | | | | | |
Total distributions | | | — | | | | — | | | | — | | | | — | | | | (2.42 | ) |
| | | | | | | | | | | | | | | | | | | | |
Net increase (decrease) in net asset value . | | | 0.32 | | | | (0.58 | ) | | | 2.28 | | | | 0.38 | | | | (8.08 | ) |
| | | | | | | | | | | | | | | | | | | | |
Net Asset Value, End of Period | | $ | 11.09 | | | $ | 10.77 | | | $ | 11.35 | | | $ | 9.07 | | | $ | 8.69 | |
| | | | | | | | | | | | | | | | | | | | |
Total Return (c) | | | 2.97 | % | | | (5.11 | )% | | | 25.15 | % | | | 4.37 | % | | | (39.09 | )% |
| | | | | |
Ratios/Supplemental Data: | | | | | | | | | | | | | | | | | | | | |
Net Assets, End of Period (in 000’s) | | $ | 10,614 | | | $ | 20,733 | | | $ | 42,567 | | | $ | 39,437 | | | $ | 37,142 | |
Ratios of expenses to average net assets: | | | | | | | | | | | | | | | | | | | | |
Before reimbursement and/or waiver of
expenses by Adviser | | | 1.44 | %(d) | | | 1.30 | % | | | 1.33 | % | | | 1.37 | % | | | 1.34 | % |
After reimbursement and/or waiver of
expenses by Adviser | | | 1.30 | %(d) | | | 1.30 | % | | | 1.30 | % | | | 1.30 | % | | | 1.30 | % |
Ratios of net investment income (loss)
to average net assets: | | | | | | | | | | | | | | | | | | | | |
Before reimbursement and/or waiver of
expenses by Adviser | | | 0.09 | % | | | (0.15 | )% | | | (0.38 | )% | | | (0.24 | )% | | | (0.55 | )% |
After reimbursement and/or waiver of
expenses by Adviser | | | 0.23 | % | | | (0.15 | )% | | | (0.35 | )% | | | (0.17 | )% | | | (0.51 | )% |
Portfolio Turnover | | | 202.81 | % | | | 312.62 | % | | | 325.01 | % | | | 331.55 | % | | | 387.57 | % |
| | (a) | The selected per share data was calculated using the weighted average shares outstanding method for the period. |
| | (b) | Represents less than $(0.005) per share. |
| | (c) | The total return is calculated using the Net Asset Values used for trading at the close of business at period end. |
| | (d) | Ratios of expenses to average net assets include interest expense of less than 0.005% for the year ended October 31, 2012, which is not included in the contractual expense limitation. The interest expense is from utilizing the line of credit as discussed in Note H to Financial Statements. |
See accompanying Notes to Financial Statements.
| | |
| |
| ASTON/Veredus Select Growth Fund – Class I | | October 31, 2012 |
| |
| Financial Highlights | | |
| | | | | | | | | | | | | | | | | | | | |
| | | Year
Ended
10/31/12 | | | Year
Ended
10/31/11 | | | Year
Ended
10/31/10 | | | Year
Ended
10/31/09 | | | Year
Ended
10/31/08 | |
Net Asset Value, Beginning of Period | | $ | 10.92 | | | $ | 11.48 | | | $ | 9.16 | | | $ | 8.74 | | | $ | 16.83 | |
| | | | | | | | | | | | | | | | | | | | |
Income from Investment Operations: | | | | | | | | | | | | | | | | | | | | |
Net investment income (loss) | | | 0.05 | (a) | | | 0.01 | (a) | | | (0.01 | ) | | | 0.01 | | | | (0.02 | ) |
Net realized and unrealized gain (loss)
on investments | | | 0.29 | | | | (0.57 | ) | | | 2.34 | | | | 0.41 | | | | (5.65 | ) |
| | | | | | | | | | | | | | | | | | | | |
Total from investment operations | | | 0.34 | | | | (0.56 | ) | | | 2.33 | | | | 0.42 | | | | (5.67 | ) |
| | | | | | | | | | | | | | | | | | | | |
Less Distributions: | | | | | | | | | | | | | | | | | | | | |
Distributions from and in excess of net
investment income | | | (0.01 | ) | | | — | | | | (0.01 | ) | | | — | | | | — | |
Distributions from net realized gain
on investments | | | — | | | | — | | | | — | | | | — | | | | (2.42 | ) |
| | | | | | | | | | | | | | | | | | | | |
Total distributions | | | (0.01 | ) | | | — | | | | (0.01 | ) | | | — | | | | (2.42 | ) |
| | | | | | | | | | | | | | | | | | | | |
Net increase (decrease) in net asset value . | | | 0.33 | | | | (0.56 | ) | | | 2.32 | | | | 0.42 | | | | (8.09 | ) |
| | | | | | | | | | | | | | | | | | | | |
Net Asset Value, End of Period | | $ | 11.25 | | | $ | 10.92 | | | $ | 11.48 | | | $ | 9.16 | | | $ | 8.74 | |
| | | | | | | | | | | | | | | | | | | | |
Total Return (b) | | | 3.19 | % | | | (4.88 | )% | | | 25.39 | % | | | 4.81 | % | | | (38.96 | )% |
| | | | | |
Ratios/Supplemental Data: | | | | | | | | | | | | | | | | | | | | |
Net Assets, End of Period (in 000’s) | | $ | 1,478 | | | $ | 59,544 | | | $ | 61,939 | | | $ | 47,699 | | | $ | 46,040 | |
Ratios of expenses to average net assets: | | | | | | | | | | | | | | | | | | | | |
Before reimbursement and/or waiver of
expenses by Adviser | | | 1.19 | %(c) | | | 1.05 | % | | | 1.08 | % | | | 1.12 | % | | | 1.09 | % |
After reimbursement and/or waiver of
expenses by Adviser | | | 1.05 | %(c) | | | 1.05 | % | | | 1.05 | % | | | 1.05 | % | | | 1.05 | % |
Ratios of net investment income (loss)
to average net assets: | | | | | | | | | | | | | | | | | | | | |
Before reimbursement and/or waiver of
expenses by Adviser | | | 0.34 | % | | | 0.10 | % | | | (0.13 | )% | | | 0.01 | % | | | (0.30 | )% |
After reimbursement and/or waiver of
expenses by Adviser | | | 0.48 | % | | | 0.10 | % | | | (0.10 | )% | | | 0.08 | % | | | (0.26 | )% |
Portfolio Turnover | | | 202.81 | % | | | 312.62 | % | | | 325.01 | % | | | 331.55 | % | | | 387.57 | % |
| | (a) | The selected per share data was calculated using the weighted average shares outstanding method for the period. |
| | (b) | The total return is calculated using the Net Asset Values used for trading at the close of business at period end. |
| | (c) | Ratios of expenses to average net assets include interest expense of less than 0.005% for the year ended October 31, 2012, which is not included in the contractual expense limitation. The interest expense is from utilizing the line of credit as discussed in Note H to Financial Statements. |
See accompanying Notes to Financial Statements.
| | |
| |
| ASTON/TAMRO Diversified Equity Fund – Class N | | October 31, 2012 |
| |
| Financial Highlights | | |
| | | | | | | | | | | | | | | | | | | | |
| | | Year
Ended
10/31/12 | | | Year
Ended
10/31/11 | | | Year
Ended
10/31/10 | | | Year
Ended
10/31/09 | | | Year
Ended
10/31/08 | |
Net Asset Value, Beginning of Period | | $ | 12.34 | | | $ | 11.83 | | | $ | 9.72 | | | $ | 8.34 | | | $ | 14.41 | |
| | | | | | | | | | | | | | | | | | | | |
Income from Investment Operations: | | | | | | | | | | | | | | | | | | | | |
Net investment income (loss) | | | — | (a) | | | (0.02 | ) | | | — | (a) | | | — | (a) | | | 0.04 | |
Net realized and unrealized gain (loss)
on investments | | | 1.44 | | | | 0.53 | | | | 2.13 | | | | 1.42 | | | | (4.94 | ) |
| | | | | | | | | | | | | | | | | | | | |
Total from investment operations | | | 1.44 | | | | 0.51 | | | | 2.13 | | | | 1.42 | | | | (4.90 | ) |
| | | | | | | | | | | | | | | | | | | | |
Less Distributions: | | | | | | | | | | | | | | | | | | | | |
Distributions from and in excess of net
investment income | | | — | | | | — | | | | (0.02 | ) | | | (0.04 | ) | | | (0.01 | ) |
Distributions from net realized gain
on investments | | | (0.26 | ) | | | — | | | | — | | | | — | | | | (1.16 | ) |
| | | | | | | | | | | | | | | | | | | | |
Total distributions | | | (0.26 | ) | | | — | | | | (0.02 | ) | | | (0.04 | ) | | | (1.17 | ) |
| | | | | | | | | | | | | | | | | | | | |
Net increase (decrease) in net asset value . | | | 1.18 | | | | 0.51 | | | | 2.11 | | | | 1.38 | | | | (6.07 | ) |
| | | | | | | | | | | | | | | | | | | | |
Net Asset Value, End of Period | | $ | 13.52 | | | $ | 12.34 | | | $ | 11.83 | | | $ | 9.72 | | | $ | 8.34 | |
| | | | | | | | | | | | | | | | | | | | |
Total Return (b) | | | 11.94 | % | | | 4.31 | % | | | 21.95 | % | | | 17.13 | % | | | (36.75 | )% |
| | | | | |
Ratios/Supplemental Data: | | | | | | | | | | | | | | | | | | | | |
Net Assets, End of Period (in 000’s) | | $ | 21,980 | | | $ | 24,354 | | | $ | 15,670 | | | $ | 10,486 | | | $ | 8,562 | |
Ratios of expenses to average net assets: | | | | | | | | | | | | | | | | | | | | |
Before reimbursement and/or waiver of
expenses by Adviser | | | 1.68 | %(c) | | | 1.62 | %(c) | | | 1.63 | % | | | 1.95 | % | | | 1.88 | % |
After reimbursement and/or waiver of
expenses by Adviser | | | 1.20 | %(c) | | | 1.20 | %(c) | | | 1.20 | % | | | 1.20 | % | | | 1.20 | % |
Ratios of net investment income (loss)
to average net assets: | | | | | | | | | | | | | | | | | | | | |
Before reimbursement and/or waiver of
expenses by Adviser | | | (0.47 | )% | | | (0.63 | )% | | | (0.45 | )% | | | (0.77 | )% | | | (0.37 | )% |
After reimbursement and/or waiver of
expenses by Adviser | | | — | %(a) | | | (0.21 | )% | | | (0.02 | )% | | | (0.02 | )% | | | 0.31 | % |
Portfolio Turnover | | | 52.56 | % | | | 65.96 | % | | | 81.75 | % | | | 85.49 | % | | | 93.82 | % |
| | (a) | Represents less than $(0.005) per share or less than (0.005)%. |
| | (b) | The total return is calculated using the Net Asset Values used for trading at the close of business at period end. |
| | (c) | Ratios of expenses to average net assets include interest expenses of less than 0.005% for each of the years ended October 31, 2012 and October 31, 2011, which are not included in the contractual expense limitation. The interest expenses are from utilizing the line of credit as discussed in Note H to Financial Statements. |
See accompanying Notes to Financial Statements.
| | |
| |
| ASTON/TAMRO Diversified Equity Fund – Class I | | October 31, 2012 |
| |
| Financial Highlights | | |
| | | | |
| | | Period
Ended
10/31/12(a) | |
Net Asset Value, Beginning of Period | | $ | 13.27 | |
| | | | |
Income from Investment Operations: | | | | |
Net investment loss | | | (0.05 | ) |
Net realized and unrealized gain on investments | | | 0.33 | |
| | | | |
Total from investment operations | | | 0.28 | |
| | | | |
Net increase in net asset value | | | 0.28 | |
| | | | |
Net Asset Value, End of Period | | $ | 13.55 | |
| | | | |
Total Return (b) | | | 2.04 | %(c) |
| |
Ratios/Supplemental Data: | | | | |
Net Assets, End of Period (in 000’s) | | $ | 569 | |
Ratios of expenses to average net assets: | | | | |
Before reimbursement and/or waiver of expenses by Adviser | | | 1.45 | %(d) |
After reimbursement and/or waiver of expenses by Adviser | | | 0.95 | %(d) |
Ratios of net investment loss to average net assets: | | | | |
Before reimbursement and/or waiver of expenses by Adviser | | | (1.11 | )%(d) |
After reimbursement and/or waiver of expenses by Adviser | | | (0.61 | )%(d) |
Portfolio Turnover | | | 52.56 | % |
| | (a) | TAMRO Diversified Equity Fund began issuing Class I shares on March 1, 2012. |
| | (b) | The total return is calculated using the Net Asset Values used for trading at the close of business at period end. |
See accompanying Notes to Financial Statements.
| | |
| |
| ASTON/Herndon Large Cap Value Fund – Class N | | October 31, 2012 |
| |
| Financial Highlights | | |
| | | | | | | | | | | | |
| | | Year
Ended
10/31/12 | | | Year
Ended
10/31/11 | | | Period
Ended
10/31/10(a) | |
Net Asset Value, Beginning of Period | | $ | 11.31 | | | $ | 10.39 | | | $ | 10.00 | |
| | | | | | | | | | | | |
Income from Investment Operations: | | | | | | | | | | | | |
Net investment income | | | 0.18 | (b) | | | 0.12 | (b) | | | 0.03 | |
Net realized and unrealized gain on investments | | | 0.91 | | | | 0.81 | | | | 0.36 | |
| | | | | | | | | | | | |
Total from investment operations | | | 1.09 | | | | 0.93 | | | | 0.39 | |
| | | | | | | | | | | | |
Less Distributions: | | | | | | | | | | | | |
Distributions from and in excess of net investment income | | | (0.11 | ) | | | (0.01 | ) | | | — | |
Distributions from net realized gain on investments | | | (0.56 | ) | | | — | | | | — | |
| | | | | | | | | | | | |
Total distributions | | | (0.67 | ) | | | (0.01 | ) | | | — | |
| | | | | | | | | | | | |
Net increase in net asset value | | | 0.42 | | | | 0.92 | | | | 0.39 | |
| | | | | | | | | | | | |
Net Asset Value, End of Period | | $ | 11.73 | | | $ | 11.31 | | | $ | 10.39 | |
| | | | | | | | | | | | |
Total Return (c) | | | 10.39 | % | | | 9.09 | % | | | 3.90 | %(d) |
| | | |
Ratios/Supplemental Data: | | | | | | | | | | | | |
Net Assets, End of Period (in 000’s) | | $ | 20,832 | | | $ | 6,089 | | | $ | 1,472 | |
Ratios of expenses to average net assets: | | | | | | | | | | | | |
Before reimbursement and/or waiver of expenses by Adviser | | | 1.41 | % | | | 2.38 | % | | | 13.84 | %(e) |
After reimbursement and/or waiver of expenses by Adviser | | | 1.30 | % | | | 1.30 | % | | | 1.30 | %(e) |
Ratios of net investment income (loss) to average net assets: | | | | | | | | | | | | |
Before reimbursement and/or waiver of expenses by Adviser | | | 1.44 | % | | | (0.05 | )% | | | (11.94 | )%(e) |
After reimbursement and/or waiver of expenses by Adviser | | | 1.55 | % | | | 1.03 | % | | | 0.60 | %(e) |
Portfolio Turnover | | | 80.56 | % | | | 189.70 | % | | | 38.64 | %(d) |
| | (a) | Herndon Large Cap Value Fund began issuing Class N shares on March 30, 2010. |
| | (b) | The selected per share data was calculated using the weighted average shares outstanding method for the period. |
| | (c) | The total return is calculated using the Net Asset Values used for trading at the close of business at period end. |
See accompanying Notes to Financial Statements.
| | |
| |
| ASTON/Herndon Large Cap Value Fund – Class I | | October 31, 2012 |
| |
| Financial Highlights | | |
| | | | | | | | |
| | | Year
Ended
10/31/12 | | | Period
Ended
10/31/11(a) | |
Net Asset Value, Beginning of Period | | $ | 11.33 | | | $ | 11.48 | |
| | | | | | | | |
Income from Investment Operations: | | | | | | | | |
Net investment income | | | 0.21 | (b) | | | 0.10 | (b) |
Net realized and unrealized gain (loss) on investments | | | 0.91 | | | | (0.25 | ) |
| | | | | | | | |
Total from investment operations | | | 1.12 | | | | (0.15 | ) |
| | | | | | | | |
Less Distributions: | | | | | | | | |
Distributions from and in excess of net investment income | | | (0.14 | ) | | | — | |
Distributions from net realized gain on investments | | | (0.56 | ) | | | — | |
| | | | | | | | |
Total distributions | | | (0.70 | ) | | | — | |
| | | | | | | | |
Net increase (decrease) in net asset value | | | 0.42 | | | | (0.15 | ) |
| | | | | | | | |
Net Asset Value, End of Period | | $ | 11.75 | | | $ | 11.33 | |
| | | | | | | | |
Total Return (c) | | | 10.69 | % | | | (1.31 | )%(d) |
| | |
Ratios/Supplemental Data: | | | | | | | | |
Net Assets, End of Period (in 000’s) | | $ | 34,575 | | | $ | 11,881 | |
Ratios of expenses to average net assets: | | | | | | | | |
Before reimbursement and/or waiver of expenses by Adviser | | | 1.16 | % | | | 2.13 | %(e) |
After reimbursement and/or waiver of expenses by Adviser | | | 1.05 | % | | | 1.05 | %(e) |
Ratios of net investment income to average net assets: | | | | | | | | |
Before reimbursement and/or waiver of expenses by Adviser | | | 1.69 | % | | | 0.20 | %(e) |
After reimbursement and/or waiver of expenses by Adviser | | | 1.80 | % | | | 1.28 | %(e) |
Portfolio Turnover | | | 80.56 | % | | | 189.70 | % |
| | (a) | Herndon Large Cap Value Fund began issuing Class I shares on March 1, 2011. |
| | (b) | The selected per share data was calculated using the weighted average shares outstanding method for the period. |
| | (c) | The total return is calculated using the Net Asset Values used for trading at the close of business at period end. |
See accompanying Notes to Financial Statements.
| | |
| |
| ASTON/Cornerstone Large Cap Value Fund – Class N | | October 31, 2012 |
| |
| Financial Highlights | | |
| | | | | | | | | | | | | | | | | | | | |
| | | Year
Ended
10/31/12 | | | Year
Ended
10/31/11 | | | Year
Ended
10/31/10 | | | Year
Ended
10/31/09 | | | Year
Ended
10/31/08 | |
Net Asset Value, Beginning of Period | | $ | 10.04 | | | $ | 9.20 | | | $ | 8.31 | | | $ | 9.07 | | | $ | 15.57 | |
| | | | | | | | | | | | | | | | | | | | |
Income from Investment Operations: | | | | | | | | | | | | | | | | | | | | |
Net investment income | | | 0.10 | (a) | | | 0.12 | (a) | | | 0.13 | | | | 0.15 | | | | 0.15 | |
Net realized and unrealized gain (loss)
on investments | | | 0.94 | | | | 0.83 | | | | 0.89 | | | | 0.41 | | | | (5.08 | ) |
| | | | | | | | | | | | | | | | | | | | |
Total from investment operations | | | 1.04 | | | | 0.95 | | | | 1.02 | | | | 0.56 | | | | (4.93 | ) |
| | | | | | | | | | | | | | | | | | | | |
Less Distributions: | | | | | | | | | | | | | | | | | | | | |
Distributions from and in excess of net
investment income | | | (0.04 | ) | | | (0.11 | ) | | | (0.13 | ) | | | (0.15 | ) | | | (0.16 | ) |
Distributions from net realized gain
on investments | | | — | | | | — | | | | — | | | | (1.17 | ) | | | (1.41 | ) |
| | | | | | | | | | | | | | | | | | | | |
Total distributions | | | (0.04 | ) | | | (0.11 | ) | | | (0.13 | ) | | | (1.32 | ) | | | (1.57 | ) |
| | | | | | | | | | | | | | | | | | | | |
Net increase (decrease) in net asset value . | | | 1.00 | | | | 0.84 | | | | 0.89 | | | | (0.76 | ) | | | (6.50 | ) |
| | | | | | | | | | | | | | | | | | | | |
Net Asset Value, End of Period | | $ | 11.04 | | | $ | 10.04 | | | $ | 9.20 | | | $ | 8.31 | | | $ | 9.07 | |
| | | | | | | | | | | | | | | | | | | | |
Total Return (b) | | | 10.43 | % | | | 10.44 | % | | | 12.37 | % | | | 8.60 | % | | | (34.85 | )% |
| | | | | |
Ratios/Supplemental Data: | | | | | | | | | | | | | | | | | | | | |
Net Assets, End of Period (in 000’s) | | $ | 21,105 | | | $ | 24,631 | | | $ | 19,984 | | | $ | 20,173 | | | $ | 19,704 | |
Ratios of expenses to average net assets: | | | | | | | | | | | | | | | | | | | | |
Before reimbursement and/or waiver of
expenses by Adviser | | | 1.58 | % | | | 1.61 | % | | | 1.19 | %(c) | | | 1.21 | % | | | 1.18 | %(c) |
After reimbursement and/or waiver of
expenses by Adviser | | | 1.26 | %(d) | | | 1.14 | %(d) | | | 1.07 | %(c) | | | 1.07 | %(e) | | | 1.02 | %(c) |
Ratios of net investment income to average net assets: | | | | | | | | | | | | | | | | | | | | |
Before reimbursement and/or waiver of
expenses by Adviser | | | 0.60 | | | | 0.80 | % | | | 1.32 | % | | | 1.77 | % | | | 1.22 | % |
After reimbursement and/or waiver of
expenses by Adviser | | | 0.92 | % | | | 1.27 | % | | | 1.44 | % | | | 1.91 | % | | | 1.38 | % |
Portfolio Turnover | | | 58.21 | % | | | 59.07 | %(f) | | | 37.44 | % | | | 39.00 | % | | | 67.57 | % |
| | (a) | The selected per share data was calculated using the weighted average shares outstanding method for the period. |
| | (b) | The total return is calculated using the Net Asset Values used for trading at the close of business at period end. |
| | (c) | Ratios of expenses to average net assets include interest expenses of less than 0.005% for each of the years ended October 31, 2010 and October 31, 2008, which are not included in the contractual expense limitation. The interest expenses are from utilizing the line of credit as discussed in Note H to Financial Statements. |
| | (d) | Effective March 22, 2011, the Adviser changed the voluntary expense limitation from 1.07% to 1.19%. Subsequently on February 29, 2012, the Adviser removed the voluntary expense limitation and replaced it with a contractual expense limitation of 1.30%. |
| | (e) | The contractual expense limitation of 1.07%, which excludes interest, taxes, other investment-related costs (such as brokerage commissions), extraordinary expenses and acquired fund fees and expenses, was removed by the Adviser and replaced with a voluntary expense limitation of 1.07% effective March 1, 2009. Voluntary expense waivers can end at any time. |
| | (f) | Portfolio turnover rate excludes securities delivered from processing a redemption-in-kind. |
See accompanying Notes to Financial Statements.
| | |
| |
| ASTON/Cornerstone Large Cap Value Fund – Class I | | October 31, 2012 |
| |
| Financial Highlights | | |
| | | | | | | | | | | | | | | | | | | | |
| | | Year
Ended
10/31/12 | | | Year
Ended
10/31/11 | | | Year
Ended
10/31/10 | | | Year
Ended
10/31/09 | | | Year
Ended
10/31/08 | |
Net Asset Value, Beginning of Period | | $ | 10.05 | | | $ | 9.19 | | | $ | 8.31 | | | $ | 9.06 | | | $ | 15.57 | |
| | | | | | | | | | | | | | | | | | | | |
Income from Investment Operations: | | | | | | | | | | | | | | | | | | | | |
Net investment income | | | 0.11 | (a) | | | 0.16 | (a) | | | 0.15 | | | | 0.17 | | | | 0.20 | |
Net realized and unrealized gain (loss)
on investments | | | 0.96 | | | | 0.84 | | | | 0.88 | | | | 0.42 | | | | (5.10 | ) |
| | | | | | | | | | | | | | | | | | | | |
Total from investment operations | | | 1.07 | | | | 1.00 | | | | 1.03 | | | | 0.59 | | | | (4.90 | ) |
| | | | | | | | | | | | | | | | | | | | |
Less Distributions: | | | | | | | | | | | | | | | | | | | | |
Distributions from and in excess of net
investment income | | | (0.05 | ) | | | (0.14 | ) | | | (0.15 | ) | | | (0.17 | ) | | | (0.20 | ) |
Distributions from net realized gain
on investments | | | — | | | | — | | | | — | | | | (1.17 | ) | | | (1.41 | ) |
| | | | | | | | | | | | | | | | | | | | |
Total distributions | | | (0.05 | ) | | | (0.14 | ) | | | (0.15 | ) | | | (1.34 | ) | | | (1.61 | ) |
| | | | | | | | | | | | | | | | | | | | |
Net increase (decrease) in net asset value . | | | 1.02 | | | | 0.86 | | | | 0.88 | | | | (0.75 | ) | | | (6.51 | ) |
| | | | | | | | | | | | | | | | | | | | |
Net Asset Value, End of Period | | $ | 11.07 | | | $ | 10.05 | | | $ | 9.19 | | | $ | 8.31 | | | $ | 9.06 | |
| | | | | | | | | | | | | | | | | | | | |
Total Return (b) | | | 10.66 | % | | | 10.95 | % | | | 12.53 | % | | | 9.01 | % | | | (34.73 | )% |
| | | | | |
Ratios/Supplemental Data: | | | | | | | | | | | | | | | | | | | | |
Net Assets, End of Period (in 000’s) | | $ | 5,397 | | | $ | 126 | | | $ | 204,051 | | | $ | 205,580 | | | $ | 188,688 | |
Ratios of expenses to average net assets: | | | | | | | | | | | | | | | | | | | | |
Before reimbursement and/or waiver of
expenses by Adviser | | | 1.33 | % | | | 1.36 | % | | | 0.94 | %(c) | | | 0.96 | % | | | 0.93 | %(c) |
After reimbursement and/or waiver of
expenses by Adviser | | | 1.01 | %(d) | | | 0.89 | %(d) | | | 0.82 | %(c) | | | 0.82 | %(e) | | | 0.77 | %(c) |
Ratios of net investment income to average net assets: | | | | | | | | | | | | | | | | | | | | |
Before reimbursement and/or waiver of
expenses by Adviser | | | 0.85 | % | | | 1.05 | % | | | 1.57 | % | | | 2.02 | % | | | 1.47 | % |
After reimbursement and/or waiver of
expenses by Adviser | | | 1.17 | % | | | 1.52 | % | | | 1.69 | % | | | 2.16 | % | | | 1.63 | % |
Portfolio Turnover | | | 58.21 | % | | | 59.07 | %(f) | | | 37.44 | % | | | 39.00 | % | | | 67.57 | % |
| | (a) | The selected per share data was calculated using the weighted average shares outstanding method for the period. |
| | (b) | The total return is calculated using the Net Asset Values used for trading at the close of business at period end. |
| | (c) | Ratios of expense to average net assets included interest expenses of less than 0.005% for each of the years ended October 31, 2010 and October 31, 2008, which are not included in the contractual expense limitation. The interest expenses are from utilizing the line of credit as discussed in Note H to Financial Statements. |
| | (d) | Effective March 22, 2011, the Adviser changed the voluntary expense limitation from 0.82% to 0.94%. Subsequently on February 29, 2012, the Adviser removed the voluntary expense limitation and replaced it with a contractual expense limitation of 1.05%. |
| | (e) | The contractual expense limitation of 0.82%, which excludes interest, taxes, other investment-related costs (such as brokerage commissions), extraordinary expenses and acquired fund fees and expenses, was removed by the Adviser and replaced with a voluntary expense limitation of 0.82% effective March 1, 2009. Voluntary expense waivers can end at any time. |
| | (f) | Portfolio turnover rate excludes securities delivered from processing a redemption-in-kind. |
See accompanying Notes to Financial Statements.
| | |
| |
| ASTON/River Road Dividend All Cap Value Fund – Class N | | October 31, 2012 |
| |
| Financial Highlights | | |
| | | | | | | | | | | | | | | | | | | | |
| | | Year
Ended
10/31/12 | | | Year
Ended
10/31/11 | | | Year
Ended
10/31/10 | | | Year
Ended
10/31/09 | | | Year
Ended
10/31/08 | |
Net Asset Value, Beginning of Period | | $ | 10.68 | | | $ | 10.23 | | | $ | 8.58 | | | $ | 8.43 | | | $ | 12.58 | |
| | | | | | | | | | | | | | | | | | | | |
Income from Investment Operations: | | | | | | | | | | | | | | | | | | | | |
Net investment income | | | 0.31 | (a) | | | 0.29 | (a) | | | 0.26 | (a) | | | 0.26 | (a) | | | 0.38 | |
Net realized and unrealized gain (loss)
on investments | | | 1.05 | | | | 0.42 | | | | 1.62 | | | | 0.08 | | | | (3.54 | ) |
| | | | | | | | | | | | | | | | | | | | |
Total from investment operations | | | 1.36 | | | | 0.71 | | | | 1.88 | | | | 0.34 | | | | (3.16 | ) |
| | | | | | | | | | | | | | | | | | | | |
Less Distributions: | | | | | | | | | | | | | | | | | | | | |
Distributions from and in excess of net
investment income | | | (0.30 | ) | | | (0.26 | ) | | | (0.23 | ) | | | (0.19 | ) | | | (0.32 | ) |
Return of capital | | | — | | | | — | | | | — | | | | — | | | | (0.01 | ) |
Distributions from net realized gain
on investments | | | (0.07 | ) | | | — | | | | — | | | | — | | | | (0.66 | ) |
| | | | | | | | | | | | | | | | | | | | |
Total distributions | | | (0.37 | ) | | | (0.26 | ) | | | (0.23 | ) | | | (0.19 | ) | | | (0.99 | ) |
| | | | | | | | | | | | | | | | | | | | |
Net increase (decrease) in net asset value . | | | 0.99 | | | | 0.45 | | | | 1.65 | | | | 0.15 | | | | (4.15 | ) |
| | | | | | | | | | | | | | | | | | | | |
Net Asset Value, End of Period | | $ | 11.67 | | | $ | 10.68 | | | $ | 10.23 | | | $ | 8.58 | | | $ | 8.43 | |
| | | | | | | | | | | | | | | | | | | | |
Total Return (b) | | | 12.96 | % | | | 6.94 | % | | | 22.20 | % | | | 4.33 | % | | | (26.82 | )% |
| | | | | |
Ratios/Supplemental Data: | | | | | | | | | | | | | | | | | | | | |
Net Assets, End of Period (in 000’s) | | $ | 338,166 | | | $ | 301,290 | | | $ | 135,544 | | | $ | 81,842 | | | $ | 51,504 | |
Ratios of expenses to average net assets: | | | | | | | | | | | | | | | | | | | | |
Before reimbursement and/or waiver of
expenses by Adviser | | | 1.12 | % | | | 1.12 | % | | | 1.14 | % | | | 1.21 | % | | | 1.35 | %(c) |
After reimbursement and/or waiver of
expenses by Adviser | | | 1.12 | % | | | 1.12 | % | | | 1.14 | % | | | 1.21 | % | | | 1.30 | %(c) |
Ratios of net investment income to average net assets: | | | | | | | | | | | | | | | | | | | | |
Before reimbursement and/or waiver of
expenses by Adviser | | | 2.74 | % | | | 2.70 | % | | | 2.69 | % | | | 3.36 | % | | | 3.81 | % |
After reimbursement and/or waiver of
expenses by Adviser | | | 2.74 | % | | | 2.70 | % | | | 2.69 | % | | | 3.36 | % | | | 3.86 | % |
Portfolio Turnover | | | 28.17 | % | | | 24.65 | % | | | 29.92 | % | | | 47.34 | % | | | 48.95 | % |
| | (a) | The selected per share data was calculated using the weighted average shares outstanding method for the period. |
| | (b) | The total return is calculated using the Net Asset Values used for trading at the close of business at period end. |
| | (c) | Ratios of expenses to average net assets include interest expense of less than 0.005% for the year ended October 31, 2008, which is not included in the contractual expense limitation. The interest expense is from utilizing the line of credit as discussed in Note H to Financial Statements. |
See accompanying Notes to Financial Statements.
| | |
| |
| ASTON/River Road Dividend All Cap Value Fund – Class I | | October 31, 2012 |
| |
| Financial Highlights | | |
| | | | | | | | | | | | | | | | | | | | |
| | | Year
Ended
10/31/12 | | | Year
Ended
10/31/11 | | | Year
Ended
10/31/10 | | | Year
Ended
10/31/09 | | | Year
Ended
10/31/08 | |
Net Asset Value, Beginning of Period | | $ | 10.67 | | | $ | 10.22 | | | $ | 8.57 | | | $ | 8.42 | | | $ | 12.57 | |
| | | | | | | | | | | | | | | | | | | | |
Income from Investment Operations: | | | | | | | | | | | | | | | | | | | | |
Net investment income | | | 0.34 | (a) | | | 0.32 | (a) | | | 0.28 | (a) | | | 0.29 | (a) | | | 0.41 | |
Net realized and unrealized gain (loss)
on investments | | | 1.05 | | | | 0.42 | | | | 1.63 | | | | 0.07 | | | | (3.55 | ) |
| | | | | | | | | | | | | | | | | | | | |
Total from investment operations | | | 1.39 | | | | 0.74 | | | | 1.91 | | | | 0.36 | | | | (3.14 | ) |
| | | | | | | | | | | | | | | | | | | | |
Less Distributions: | | | | | | | | | | | | | | | | | | | | |
Distributions from and in excess of net
investment income | | | (0.33 | ) | | | (0.29 | ) | | | (0.26 | ) | | | (0.21 | ) | | | (0.34 | ) |
Return of capital | | | — | | | | — | | | | — | | | | — | | | | (0.01 | ) |
Distributions from net realized gain
on investments | | | (0.07 | ) | | | — | | | | — | | | | — | | | | (0.66 | ) |
| | | | | | | | | | | | | | | | | | | | |
Total distributions | | | (0.40 | ) | | | (0.29 | ) | | | (0.26 | ) | | | (0.21 | ) | | | (1.01 | ) |
| | | | | | | | | | | | | | | | | | | | |
Net increase (decrease) in net asset value . | | | 0.99 | | | | 0.45 | | | | 1.65 | | | | 0.15 | | | | (4.15 | ) |
| | | | | | | | | | | | | | | | | | | | |
Net Asset Value, End of Period | | $ | 11.66 | | | $ | 10.67 | | | $ | 10.22 | | | $ | 8.57 | | | $ | 8.42 | |
| | | | | | | | | | | | | | | | | | | | |
Total Return (b) | | | 13.25 | % | | | 7.21 | % | | | 22.53 | % | | | 4.59 | % | | | (26.66 | )% |
| | | | | |
Ratios/Supplemental Data: | | | | | | | | | | | | | | | | | | | | |
Net Assets, End of Period (in 000’s) | | $ | 586,043 | | | $ | 318,863 | | | $ | 137,629 | | | $ | 77,185 | | | $ | 144 | |
Ratios of expenses to average net assets: | | | | | | | | | | | | | | | | | | | | |
Before reimbursement and/or waiver of
expenses by Adviser | | | 0.87 | % | | | 0.87 | % | | | 0.89 | % | | | 0.96 | % | | | 1.10 | %(c) |
After reimbursement and/or waiver of
expenses by Adviser | | | 0.87 | % | | | 0.87 | % | | | 0.89 | % | | | 0.96 | % | | | 1.05 | %(c) |
Ratios of net investment income to average net assets: | | | | | | | | | | | | | | | | | | | | |
Before reimbursement and/or waiver of
expenses by Adviser | | | 2.99 | % | | | 2.95 | % | | | 2.94 | % | | | 3.61 | % | | | 4.06 | % |
After reimbursement and/or waiver of
expenses by Adviser | | | 2.99 | % | | | 2.95 | % | | | 2.94 | % | | | 3.61 | % | | | 4.11 | % |
Portfolio Turnover | | | 28.17 | % | | | 24.65 | % | | | 29.92 | % | | | 47.34 | % | | | 48.95 | % |
| | (a) | The selected per share data was calculated using the weighted average shares outstanding method for the period. |
| | (b) | The total return is calculated using the Net Asset Values used for trading at the close of business at period end. |
| | (c) | Ratios of expenses to average net assets include interest expense of less than 0.005% for the year ended October 31, 2008, which is not included in the contractual expense limitation. The interest expense is from utilizing the line of credit as discussed in Note H to Financial Statements. |
See accompanying Notes to Financial Statements.
| | |
| |
| ASTON/River Road Dividend All Cap Value Fund II – Class N | | October 31, 2012 |
| |
| Financial Highlights | | |
| | | | |
| | | Period
Ended
10/31/12(a) | |
Net Asset Value, Beginning of Period | | $ | 10.00 | |
| | | | |
Income from Investment Operations: | | | | |
Net investment income | | | 0.09 | (b) |
Net realized and unrealized gain on investments | | | 0.41 | |
| | | | |
Total from investment operations | | | 0.50 | |
| | | | |
Less Distributions: | | | | |
Distributions from and in excess of net investment income | | | (0.06 | ) |
| | | | |
Total distributions | | | (0.06 | ) |
| | | | |
Net increase in net asset value | | | 0.44 | |
| | | | |
Net Asset Value, End of Period | | $ | 10.44 | |
| | | | |
Total Return (c) | | | 5.09 | %(d) |
| |
Ratios/Supplemental Data: | | | | |
Net Assets, End of Period (in 000’s) | | $ | 1,049 | |
Ratios of expenses to average net assets: | | | | |
Before reimbursement and/or waiver of expenses by Adviser | | | 4.99 | %(e) |
After reimbursement and/or waiver of expenses by Adviser | | | 1.30 | %(e) |
Ratios of net investment income (loss) to average net assets: | | | | |
Before reimbursement and/or waiver of expenses by Adviser | | | (1.24 | )%(e) |
After reimbursement and/or waiver of expenses by Adviser | | | 2.45 | %(e) |
Portfolio Turnover | | | 5.58 | %(d)(f) |
| | (a) | River Road Dividend All Cap Value Fund II began issuing Class N shares on June 27, 2012. |
| | (b) | The selected per share data was calculated using the weighted average shares outstanding method for the period. |
| | (c) | The total return is calculated using the Net Asset Values used for trading at the close of business at period end. |
| | (f) | Portfolio turnover excludes securities received from processing a subscription-in-kind. |
See accompanying Notes to Financial Statements.
| | |
| |
| ASTON/River Road Dividend All Cap Value Fund II – Class I | | October 31, 2012 |
| |
| Financial Highlights | | |
| | | | |
| | | Period
Ended
10/31/12(a) | |
Net Asset Value, Beginning of Period | | $ | 10.00 | |
| | | | |
Income from Investment Operations: | | | | |
Net investment income | | | 0.10 | (b) |
Net realized and unrealized gain on investments | | | 0.42 | |
| | | | |
Total from investment operations | | | 0.52 | |
| | | | |
Less Distributions: | | | | |
Distributions from and in excess of net investment income | | | (0.07 | ) |
| | | | |
Total distributions | | | (0.07 | ) |
| | | | |
Net increase in net asset value | | | 0.45 | |
| | | | |
Net Asset Value, End of Period | | $ | 10.45 | |
| | | | |
Total Return (c) | | | 5.17 | %(d) |
| |
Ratios/Supplemental Data: | | | | |
Net Assets, End of Period (in 000’s) | | $ | 9,370 | |
Ratios of expenses to average net assets: | | | | |
Before reimbursement and/or waiver of expenses by Adviser | | | 4.74 | %(e) |
After reimbursement and/or waiver of expenses by Adviser | | | 1.05 | %(e) |
Ratios of net investment income (loss) to average net assets: | | | | |
Before reimbursement and/or waiver of expenses by Adviser | | | (0.99 | )%(e) |
After reimbursement and/or waiver of expenses by Adviser | | | 2.70 | %(e) |
Portfolio Turnover | | | 5.58 | %(d)(f) |
| | (a) | River Road Dividend All Cap Value Fund II began issuing Class I shares on June 27, 2012. |
| | (b) | The selected per share data was calculated using the weighted average shares outstanding method for the period. |
| | (c) | The total return is calculated using the Net Asset Values used for trading at the close of business at period end. |
| | (f) | Portfolio turnover excludes securities received from processing a subscription-in-kind. |
See accompanying Notes to Financial Statements.
| | |
| |
| ASTON/Fairpointe Mid Cap Fund – Class N | | October 31, 2012 |
| |
| Financial Highlights | | |
| | | | | | | | | | | | | | | | | | | | |
| | | Year Ended
10/31/12 | | | Year
Ended
10/31/11 | | | Year
Ended
10/31/10 | | | Year
Ended
10/31/09 | | | Year
Ended
10/31/08 | |
Net Asset Value, Beginning of Period | | $ | 29.76 | | | $ | 29.04 | | | $ | 22.73 | | | $ | 17.25 | | | $ | 32.32 | |
| | | | | | | | | | | | | | | | | | | | |
Income from Investment Operations: | | | | | | | | | | | | | | | | | | | | |
Net investment income (loss) | | | 0.16 | | | | 0.06 | (a) | | | 0.01 | | | | 0.09 | | | | 0.05 | |
Net realized and unrealized gain (loss)
on investments | | | 3.13 | | | | 0.82 | | | | 6.35 | | | | 5.82 | | | | (12.93 | ) |
| | | | | | | | | | | | | | | | | | | | |
Total from investment operations | | | 3.29 | | | | 0.88 | | | | 6.36 | | | | 5.91 | | | | (12.88 | ) |
| | | | | | | | | | | | | | | | | | | | |
Less Distributions: | | | | | | | | | | | | | | | | | | | | |
Distributions from and in excess of net
investment income | | | (0.05 | ) | | | (0.08 | ) | | | (0.05 | ) | | | (0.14 | ) | | | — | |
Distributions from net realized gain
on investments | | | (0.21 | ) | | | (0.08 | ) | | | — | | | | (0.29 | ) | | | (2.19 | ) |
| | | | | | | | | | | | | | | | | | | | |
Total distributions | | | (0.26 | ) | | | (0.16 | ) | | | (0.05 | ) | | | (0.43 | ) | | | (2.19 | ) |
| | | | | | | | | | | | | | | | | | | | |
Net increase (decrease) in net asset value . | | | 3.03 | | | | 0.72 | | | | 6.31 | | | | 5.48 | | | | (15.07 | ) |
| | | | | | | | | | | | | | | | | | | | |
Net Asset Value, End of Period | | $ | 32.79 | | | $ | 29.76 | | | $ | 29.04 | | | $ | 22.73 | | | $ | 17.25 | |
| | | | | | | | | | | | | | | | | | | | |
Total Return (b) | | | 11.15 | % | | | 2.98 | % | | | 28.01 | % | | | 35.60 | % | | | (42.50 | )% |
| | | | | |
Ratios/Supplemental Data: | | | | | | | | | | | | | | | | | | | | |
Net Assets, End of Period (in 000’s) | | $ | 1,561,510 | | | $ | 1,502,266 | | | $ | 1,469,354 | | | $ | 842,233 | | | $ | 508,886 | |
Ratios of expenses to average net assets: | | | | | | | | | | | | | | | | | | | | |
Before reimbursement and/or waiver of
expenses by Adviser | | | 1.11 | %(c) | | | 1.14 | %(c) | | | 1.14 | %(c) | | | 1.20 | %(c) | | | 1.16 | %(c) |
After reimbursement and/or waiver of
expenses by Adviser | | | 1.11 | %(c) | | | 1.14 | %(c) | | | 1.14 | %(c) | | | 1.20 | %(c) | | | 1.16 | %(c) |
Ratios of net investment income (loss)
to average net assets: | | | | | | | | | | | | | | | | | | | | |
Before reimbursement and/or waiver of
expenses by Adviser | | | 0.50 | % | | | 0.21 | % | | | — | %(d) | | | 0.46 | % | | | 0.18 | % |
After reimbursement and/or waiver of
expenses by Adviser | | | 0.50 | % | | | 0.21 | % | | | — | %(d) | | | 0.46 | % | | | 0.18 | % |
Portfolio Turnover | | | 28.06 | %(e) | | | 11.20 | % | | | 13.82 | % | | | 17.72 | % | | | 22.58 | % |
| | (a) | The selected per share data was calculated using the weighted average shares outstanding method for the period. |
| | (b) | The total return is calculated using the Net Asset Values used for trading at the close of business at period end. |
| | (c) | Ratios of expenses to average net assets include interest expenses of less than 0.005% for each of the years ended October 31, 2012, October 31, 2011, October 31, 2010, October 31, 2009 and October 31, 2008, which are not included in the contractual expense limitation. The interest expenses are from utilizing the line of credit as discussed in Note H to Financial Statements. |
| | (d) | Represents less than 0.005%. |
| | (e) | Portfolio turnover rate excludes securities delivered from processing a redemption-in-kind. |
See accompanying Notes to Financial Statements.
| | |
| |
| ASTON/Fairpointe Mid Cap Fund – Class I | | October 31, 2012 |
| |
| Financial Highlights | | |
| | | | | | | | | | | | | | | | | | | | |
| | | Year Ended
10/31/12 | | | Year
Ended
10/31/11 | | | Year
Ended
10/31/10 | | | Year
Ended
10/31/09 | | | Year
Ended
10/31/08 | |
Net Asset Value, Beginning of Period | | $ | 30.20 | | | $ | 29.41 | | | $ | 23.00 | | | $ | 17.47 | | | $ | 32.64 | |
| | | | | | | | | | | | | | | | | | | | |
Income from Investment Operations: | | | | | | | | | | | | | | | | | | | | |
Net investment income | | | 0.24 | | | | 0.14 | (a) | | | 0.07 | | | | 0.13 | | | | 0.11 | |
Net realized and unrealized gain (loss)
on investments | | | 3.18 | | | | 0.82 | | | | 6.43 | | | | 5.89 | | | | (13.09 | ) |
| | | | | | | | | | | | | | | | | | | | |
Total from investment operations | | | 3.42 | | | | 0.96 | | | | 6.50 | | | | 6.02 | | | | (12.98 | ) |
| | | | | | | | | | | | | | | | | | | | |
Less Distributions: | | | | | | | | | | | | | | | | | | | | |
Distributions from and in excess of net
investment income | | | (0.13 | ) | | | (0.09 | ) | | | (0.09 | ) | | | (0.20 | ) | | | — | |
Distributions from net realized gain
on investment | | | (0.21 | ) | | | (0.08 | ) | | | — | | | | (0.29 | ) | | | (2.19 | ) |
| | | | | | | | | | | | | | | | | | | | |
Total distributions | | | (0.34 | ) | | | (0.17 | ) | | | (0.09 | ) | | | (0.49 | ) | | | (2.19 | ) |
| | | | | | | | | | | | | | | | | | | | |
Net increase (decrease) in net asset value | | �� | 3.08 | | | | 0.79 | | | | 6.41 | | | | 5.53 | | | | (15.17 | ) |
| | | | | | | | | | | | | | | | | | | | |
Net Asset Value, End of Period | | $ | 33.28 | | | $ | 30.20 | | | $ | 29.41 | | | $ | 23.00 | | | $ | 17.47 | |
| | | | | | | | | | | | | | | | | | | | |
Total Return (b) | | | 11.46 | % | | | 3.22 | % | | | 28.31 | % | | | 35.97 | % | | | (42.39 | )% |
| | | | | |
Ratios/Supplemental Data: | | | | | | | | | | | | | | | | | | | | |
Net Assets, End of Period (in 000’s) | | $ | 1,464,222 | | | $ | 1,339,223 | | | $ | 499,651 | | | $ | 150,953 | | | $ | 93,176 | |
Ratios of expenses to average net assets: | | | | | | | | | | | | | | | | | | | | |
Before reimbursement and/or waiver of
expenses by Adviser | | | 0.86 | %(c) | | | 0.89 | %(c) | | | 0.89 | %(c) | | | 0.95 | %(c) | | | 0.91 | %(c) |
After reimbursement and/or waiver of
expenses by Adviser | | | 0.86 | %(c) | | | 0.89 | %(c) | | | 0.89 | %(c) | | | 0.95 | %(c) | | | 0.91 | %(c) |
Ratios of net investment income to average
net assets: | | | | | | | | | | | | | | | | | | | | |
Before reimbursement and/or waiver of
expenses by Adviser | | | 0.75 | % | | | 0.46 | % | | | 0.25 | % | | | 0.71 | % | | | 0.43 | % |
After reimbursement and/or waiver of
expenses by Adviser | | | 0.75 | % | | | 0.46 | % | | | 0.25 | % | | | 0.71 | % | | | 0.43 | % |
Portfolio Turnover | | | 28.06 | %(d) | | | 11.20 | % | | | 13.82 | % | | | 17.72 | % | | | 22.58 | % |
| | (a) | The selected per share data was calculated using the weighted average shares outstanding method for the period. |
| | (b) | The total return is calculated using the Net Asset Values used for trading at the close of business at period end. |
| | (c) | Ratios of expenses to average net assets include interest expenses of less than 0.005% for each of the years ended October 31, 2012, October 31, 2011, October 31, 2010, October 31, 2009 and October 31, 2008, which are not included in the contractual expense limitation. The interest expenses are from utilizing the line of credit as discussed in Note H to Financial Statements. |
| | (d) | Portfolio turnover rate excludes securities delivered from processing a redemption-in-kind. |
See accompanying Notes to Financial Statements.
| | |
| |
| ASTON/Montag & Caldwell Mid Cap Growth Fund – Class N | | October 31, 2012 |
| |
| Financial Highlights | | |
| | | | | | | | | | | | | | | | | | | | |
| | | Year
Ended
10/31/12 | | | Year
Ended
10/31/11 | | | Year
Ended
10/31/10 | | | Year
Ended
10/31/09 | | | Period
Ended
10/31/08(a) | |
Net Asset Value, Beginning of Period | | $ | 9.71 | | | $ | 8.51 | | | $ | 6.83 | | | $ | 5.85 | | | $ | 10.00 | |
| | | | | | | | | | | | | | | | | | | | |
Income from Investment Operations: | | | | | | | | | | | | | | | | | | | | |
Net investment loss | | | (0.07 | )(b) | | | (0.07 | ) | | | (0.04 | ) | | | (0.04 | ) | | | (0.05 | ) |
Net realized and unrealized gain (loss)
on investments | | | 0.72 | | | | 1.27 | | | | 1.74 | | | | 1.02 | | | | (4.10 | ) |
| | | | | | | | | | | | | | | | | | | | |
Total from investment operations | | | 0.65 | | | | 1.20 | | | | 1.70 | | | | 0.98 | | | | (4.15 | ) |
| | | | | | | | | | | | | | | | | | | | |
Less Distributions: | | | | | | | | | | | | | | | | | | | | |
Distributions from and in excess of net
investment income | | | — | | | | — | | | | (0.02 | ) | | | — | | | | — | |
| | | | | | | | | | | | | | | | | | | | |
Total distributions | | | — | | | | — | | | | (0.02 | ) | | | — | | | | — | |
| | | | | | | | | | | | | | | | | | | | |
Net increase (decrease) in net asset value | | | 0.65 | | | | 1.20 | | | | 1.68 | | | | 0.98 | | | | (4.15 | ) |
| | | | | | | | | | | | | | | | | | | | |
Net Asset Value, End of Period | | $ | 10.36 | | | $ | 9.71 | | | $ | 8.51 | | | $ | 6.83 | | | $ | 5.85 | |
| | | | | | | | | | | | | | | | | | | | |
Total Return (c) | | | 6.70 | % | | | 14.10 | % | | | 24.85 | % | | | 16.75 | % | | | (41.50 | )%(d) |
| | | | | |
Ratios/Supplemental Data: | | | | | | | | | | | | | | | | | | | | |
Net Assets, End of Period (in 000’s) | | $ | 7,369 | | | $ | 4,507 | | | $ | 3,399 | | | $ | 2,959 | | | $ | 1,815 | |
Ratios of expenses to average net assets: | | | | | | | | | | | | | | | | | | | | |
Before reimbursement and/or waiver of
expenses by Adviser | | | 2.50 | % | | | 3.07 | % | | | 3.55 | % | | | 5.02 | % | | | 5.80 | %(e) |
After reimbursement and/or waiver of
expenses by Adviser | | | 1.25 | %(f) | | | 1.39 | %(f) | | | 1.40 | % | | | 1.40 | % | | | 1.40 | %(e) |
Ratios of net investment loss to average net assets: | | | | | | | | | | | | | | | | | | | | |
Before reimbursement and/or waiver of
expenses by Adviser | | | (1.88 | )% | | | (2.39 | )% | | | (2.75 | )% | | | (4.13 | )% | | | (5.07 | )%(e) |
After reimbursement and/or waiver of
expenses by Adviser | | | (0.63 | )% | | | (0.71 | )% | | | (0.60 | )% | | | (0.51 | )% | | | (0.67 | )%(e) |
Portfolio Turnover | | | 36.60 | % | | | 29.31 | % | | | 31.49 | % | | | 54.37 | % | | | 63.66 | %(d) |
| | (a) | Montag & Caldwell Mid Cap Growth Fund began issuing Class N shares on November 1, 2007. |
| | (b) | The selected per share data was calculated using the weighted average shares outstanding method for the period. |
| | (c) | The total return is calculated using the Net Asset Values used for trading at the close of business at period end. |
| | (f) | For the period November 1, 2010 through September 29, 2011 the Adviser contractually waived management fees and/or reimbursed expenses so that the net expense ratio is no more than 1.40%, excluding interest, taxes, other investment-related costs (such as brokerage commissions), extraordinary expenses and acquired fund fees and expenses. Effective September 30, 2011, the Adviser implemented a voluntary expense limitation of 1.25%. Subsequently on February 29, 2012, the Adviser removed the voluntary expense limitation and replaced it with a contractual expense limitation of 1.25%. |
See accompanying Notes to Financial Statements.
| | |
| |
| ASTON/Veredus Small Cap Growth Fund – Class N (formerly the ASTON/Veredus Aggressive Growth Fund) | | October 31, 2012 |
| |
| Financial Highlights | | |
| | | | | | | | | | | | | | | | | | | | |
| | | Year
Ended
10/31/12 | | | Year
Ended
10/31/11 | | | Year
Ended
10/31/10 | | | Year
Ended
10/31/09 | | | Year
Ended
10/31/08 | |
Net Asset Value, Beginning of Period | | $ | 12.36 | | | $ | 11.80 | | | $ | 8.97 | | | $ | 8.38 | | | $ | 22.42 | |
| | | | | | | | | | | | | | | | | | | | |
Income from Investment Operations: | | | | | | | | | | | | | | | | | | | | |
Net investment loss | | | (0.12 | )(a) | | | (0.14 | )(a) | | | (0.14 | )(a) | | | (0.10 | ) | | | (0.17 | ) |
Net realized and unrealized gain (loss)
on investments | | | 0.79 | | | | 0.70 | | | | 2.97 | | | | 0.74 | | | | (8.31 | ) |
| | | | | | | | | | | | | | | | | | | | |
Total from investment operations | | | 0.67 | | | | 0.56 | | | | 2.83 | | | | 0.64 | | | | (8.48 | ) |
| | | | | | | | | | | | | | | | | | | | |
Less Distributions: | | | | | | | | | | | | | | | | | | | | |
Distributions from net realized gain
on investments | | | — | | | | — | | | | — | | | | (0.05 | ) | | | (5.56 | ) |
| | | | | | | | | | | | | | | | | | | | |
Total distributions | | | — | | | | — | | | | — | | | | (0.05 | ) | | | (5.56 | ) |
| | | | | | | | | | | | | | | | | | | | |
Net increase (decrease) in net asset value . | | | 0.67 | | | | 0.56 | | | | 2.83 | | | | 0.59 | | | | (14.04 | ) |
| | | | | | | | | | | | | | | | | | | | |
Net Asset Value, End of Period | | $ | 13.03 | | | $ | 12.36 | | | $ | 11.80 | | | $ | 8.97 | | | $ | 8.38 | |
| | | | | | | | | | | | | | | | | | | | |
Total Return (b) | | | 5.42 | % | | | 4.75 | % | | | 31.55 | % | | | 7.79 | % | | | (47.87 | )% |
| | | | | |
Ratios/Supplemental Data: | | | | | | | | | | | | | | | | | | | | |
Net Assets, End of Period (in 000’s) | | $ | 21,763 | | | $ | 26,300 | | | $ | 33,594 | | | $ | 32,140 | | | $ | 43,149 | |
Ratios of expenses to average net assets: | | | | | | | | | | | | | | | | | | | | |
Before reimbursement and/or waiver of
expenses by Adviser | | | 1.83 | % | | | 1.65 | %(c) | | | 1.63 | % | | | 1.82 | %(c) | | | 1.55 | %(c) |
After reimbursement and/or waiver of
expenses by Adviser | | | 1.49 | % | | | 1.49 | %(c) | | | 1.49 | % | | | 1.49 | %(c) | | | 1.49 | %(c) |
Ratios of net investment loss to average net assets: | | | | | | | | | | | | | | | | | | | | |
Before reimbursement and/or waiver of
expenses by Adviser | | | (1.32 | )% | | | (1.19 | )% | | | (1.40 | )% | | | (1.48 | )% | | | (1.21 | )% |
After reimbursement and/or waiver of
expenses by Adviser | | | (0.98 | )% | | | (1.03 | )% | | | (1.27 | )% | | | (1.15 | )% | | | (1.15 | )% |
Portfolio Turnover | | | 158.83 | %(d) | | | 197.43 | % | | | 187.83 | % | | | 264.98 | % | | | 166.19 | % |
| | (a) | The selected per share data was calculated using the weighted average shares outstanding method for the period. |
| | (b) | The total return is calculated using the Net Asset Values used for trading at the close of business at period end. |
| | (c) | Ratios of expenses to average net assets include interest expenses of less than 0.005% for each of the years ended October 31, 2011, October 31, 2009 and October 31, 2008, which are not included in the contractual expense limitation. The interest expenses are from utilizing the line of credit as discussed in Note H to Financial Statements. |
| | (d) | Portfolio turnover rate excludes securities delivered from processing a redemption-in-kind. |
See accompanying Notes to Financial Statements.
| | |
| |
| ASTON/Veredus Small Cap Growth Fund – Class I (formerly the ASTON/Veredus Aggressive Growth Fund) | | October 31, 2012 |
| |
| Financial Highlights | | |
| | | | | | | | | | | | | | | | | | | | |
| | | Year
Ended
10/31/12 | | | Year
Ended
10/31/11 | | | Year
Ended
10/31/10 | | | Year
Ended
10/31/09 | | | Year
Ended
10/31/08 | |
| | | | | |
| | | | | |
| | | | | |
Net Asset Value, Beginning of Period | | $ | 12.80 | | | $ | 12.19 | | | $ | 9.25 | | | $ | 8.61 | | | $ | 22.83 | |
| | | | | | | | | | | | | | | | | | | | |
Income from Investment Operations: | | | | | | | | | | | | | | | | | | | | |
Net investment loss | | | (0.09 | )(a) | | | (0.11 | )(a) | | | (0.11 | )(a) | | | (0.08 | ) | | | (0.21 | ) |
Net realized and unrealized gain (loss)
on investments | | | 0.82 | | | | 0.72 | | | | 3.05 | | | | 0.77 | | | | (8.45 | ) |
| | | | | | | | | | | | | | | | | | | | |
Total from investment operations | | | 0.73 | | | | 0.61 | | | | 2.94 | | | | 0.69 | | | | (8.66 | ) |
| | | | | | | | | | | | | | | | | | | | |
Less Distributions: | | | | | | | | | | | | | | | | | | | | |
Distributions from net realized gain
on investments | | | — | | | | — | | | | — | | | | (0.05 | ) | | | (5.56 | ) |
| | | | | | | | | | | | | | | | | | | | |
Total distributions | | | — | | | | — | | | | — | | | | (0.05 | ) | | | (5.56 | ) |
| | | | | | | | | | | | | | | | | | | | |
Net increase (decrease) in net asset value . | | | 0.73 | | | | 0.61 | | | | 2.94 | | | | 0.64 | | | | (14.22 | ) |
| | | | | | | | | | | | | | | | | | | | |
Net Asset Value, End of Period | | $ | 13.53 | | | $ | 12.80 | | | $ | 12.19 | | | $ | 9.25 | | | $ | 8.61 | |
| | | | | | | | | | | | | | | | | | | | |
Total Return (b) | | | 5.62 | % | | | 5.09 | % | | | 31.78 | % | | | 8.16 | % | | | (47.77 | )% |
| | | | | |
Ratios/Supplemental Data: | | | | | | | | | | | | | | | | | | | | |
Net Assets, End of Period (in 000’s) | | $ | 2,400 | | | $ | 16,891 | | | $ | 16,190 | | | $ | 13,356 | | | $ | 16,719 | |
Ratios of expenses to average net assets: | | | | | | | | | | | | | | | | | | | | |
Before reimbursement and/or waiver of
expenses by Adviser | | | 1.58 | % | | | 1.40 | %(c) | | | 1.38 | % | | | 1.57 | %(c) | | | 1.30 | %(c) |
After reimbursement and/or waiver of
expenses by Adviser | | | 1.24 | % | | | 1.24 | %(c) | | | 1.24 | % | | | 1.24 | %(c) | | | 1.24 | %(c) |
Ratios of net investment loss to average net assets: | | | | | | | | | | | | | | | | | | | | |
Before reimbursement and/or waiver of
expenses by Adviser | | | (1.07 | )% | | | (0.94 | )% | | | (1.15 | )% | | | (1.23 | )% | | | (0.96 | )% |
After reimbursement and/or waiver of
expenses by Adviser | | | (0.73 | )% | | | (0.78 | )% | | | (1.02 | )% | | | (0.90 | )% | | | (0.90 | )% |
Portfolio Turnover | | | 158.83 | %(d) | | | 197.43 | % | | | 187.83 | % | | | 264.98 | % | | | 166.19 | % |
| | (a) | The selected per share data was calculated using the weighted average shares outstanding method for the period. |
| | (b) | The total return is calculated using the Net Asset Values used for trading at the close of business at period end. |
| | (c) | Ratios of expenses to average net assets include interest expenses of less than 0.005% for each of the years ended October 31, 2011, October 31, 2009 and October 31, 2008, which are not included in the contractual expense limitation. The interest expenses are from utilizing the line of credit as discussed in Note H to Financial Statements. |
| | (d) | Portfolio turnover rate excludes securities delivered from processing a redemption-in-kind. |
See accompanying Notes to Financial Statements.
| | |
| |
| ASTON Small Cap Growth Fund – Class N (formerly the ASTON/Crosswind Small Cap Growth Fund) | | October 31, 2012 |
| |
| Financial Highlights | | |
| | | | | | | | |
| | | Year
Ended
10/31/12 | | | Period
Ended
10/31/11(a) | |
| | |
| | |
| | |
Net Asset Value, Beginning of Period | | $ | 9.95 | | | $ | 10.00 | |
| | | | | | | | |
Income from Investment Operations: | | | | | | | | |
Net investment loss | | | (0.12 | )(b) | | | (0.04 | ) |
Net realized and unrealized gain (loss) on investments | | | 1.59 | | | | (0.01 | ) |
| | | | | | | | |
Total from investment operations | | | 1.47 | | | | (0.05 | ) |
| | | | | | | | |
Net increase (decrease) in net asset value | | | 1.47 | | | | (0.05 | ) |
| | | | | | | | |
Net Asset Value, End of Period | | $ | 11.42 | | | $ | 9.95 | |
| | | | | | | | |
Total Return (c) | | | 14.77 | % | | | (0.50 | )%(d) |
| | |
Ratios/Supplemental Data: | | | | | | | | |
Net Assets, End of Period (in 000’s) | | $ | 5,659 | | | $ | 5,411 | |
Ratios of expenses to average net assets: | | | | | | | | |
Before reimbursement and/or waiver of expenses by Adviser | | | 2.86 | % | | | 8.27 | %(e) |
After reimbursement and/or waiver of expenses by Adviser | | | 1.35 | % | | | 1.35 | %(e) |
Ratios of net investment loss to average net assets: | | | | | | | | |
Before reimbursement and/or waiver of expenses by Adviser | | | (2.68 | )% | | | (8.14 | )%(e) |
After reimbursement and/or waiver of expenses by Adviser | | | (1.17 | )% | | | (1.21 | )%(e) |
Portfolio Turnover | | | 168.05 | %(f) | | | 205.85 | %(d) |
| | (a) | Small Cap Growth Fund began issuing Class N shares on November 2, 2010. |
| | (b) | The selected per share data was calculated using the weighted average shares outstanding method for the period. |
| | (c) | The total return is calculated using the Net Asset Values used for trading at the close of business at period end. |
| | (f) | Portfolio turnover rate excludes securities delivered from processing a redemption-in-kind. |
See accompanying Notes to Financial Statements.
| | |
| |
| ASTON Small Cap Growth Fund – Class I (formerly the ASTON/Crosswind Small Cap Growth Fund) | | October 31, 2012 |
| |
| Financial Highlights | | |
| | | | | | | | |
| | | Year
Ended
10/31/12 | | | Period
Ended
10/31/11(a) | |
| | |
| | |
| | |
Net Asset Value, Beginning of Period | | $ | 9.97 | | | $ | 12.40 | |
| | | | | | | | |
Income from Investment Operations: | | | | | | | | |
Net investment loss | | | (0.10 | )(b) | | | (0.04 | ) |
Net realized and unrealized gain (loss) on investments | | | 1.59 | | | | (2.39 | ) |
| | | | | | | | |
Total from investment operations | | | 1.49 | | | | (2.43 | ) |
| | | | | | | | |
Net increase (decrease) in net asset value | | | 1.49 | | | | (2.43 | ) |
| | | | | | | | |
Net Asset Value, End of Period | | $ | 11.46 | | | $ | 9.97 | |
| | | | | | | | |
Total Return (c) | | | 14.95 | % | | | (19.60 | )%(d) |
| | |
Ratios/Supplemental Data: | | | | | | | | |
Net Assets, End of Period (in 000’s) | | $ | 755 | | | $ | 2,551 | |
Ratios of expenses to average net assets: | | | | | | | | |
Before reimbursement and/or waiver of expenses by Adviser | | | 2.61 | % | | | 6.25 | %(e) |
After reimbursement and/or waiver of expenses by Adviser | | | 1.10 | % | | | 1.10 | %(e) |
Ratios of net investment loss to average net assets: | | | | | | | | |
Before reimbursement and/or waiver of expenses by Adviser | | | (2.43 | )% | | | (6.11 | )%(e) |
After reimbursement and/or waiver of expenses by Adviser | | | (0.92 | )% | | | (0.96 | )%(e) |
Portfolio Turnover | | | 168.05 | %(f) | | | 205.85 | %(d) |
| | (a) | Small Cap Growth Fund began issuing Class I shares on May 31, 2011. |
| | (b) | The selected per share data was calculated using the weighted average shares outstanding method for the period. |
| | (c) | The total return is calculated using the Net Asset Values used for trading at the close of business at period end. |
| | (f) | Portfolio turnover rate excludes securities delivered from processing a redemption-in-kind. |
See accompanying Notes to Financial Statements.
| | |
| |
| ASTON/Silvercrest Small Cap Fund – Class N | | October 31, 2012 |
| |
| Financial Highlights | | |
| | | | |
| | | Period
Ended
10/31/12(a) | |
| |
| |
| |
Net Asset Value, Beginning of Period | | $ | 10.00 | |
| | | | |
Income from Investment Operations: | | | | |
Net investment income | | | 0.01 | |
Net realized and unrealized gain on investments | | | 0.89 | |
| | | | |
Total from investment operations | | | 0.90 | |
| | | | |
Net increase in net asset value | | | 0.90 | |
| | | | |
Net Asset Value, End of Period | | $ | 10.90 | |
| | | | |
Total Return (b) | | | 9.00 | %(c) |
| |
Ratios/Supplemental Data: | | | | |
Net Assets, End of Period (in 000’s) | | $ | 750 | |
Ratios of expenses to average net assets: | | | | |
Before reimbursement and/or waiver of expenses by Adviser | | | 5.10 | %(c) |
After reimbursement and/or waiver of expenses by Adviser | | | 1.40 | %(d) |
Ratios of net investment income (loss) to average net assets: | | | | |
Before reimbursement and/or waiver of expenses by Adviser | | | (3.51 | )%(d) |
After reimbursement and/or waiver of expenses by Adviser | | | 0.19 | %(d) |
Portfolio Turnover | | | 26.22 | %(c)(e) |
| | (a) | Silvercrest Small Cap Fund began issuing Class N shares on December 23, 2011. |
| | (b) | The total return is calculated using the Net Asset Values used for trading at the close of business at period end. |
| | (e) | Portfolio turnover rate excludes securities delivered from processing a redemption-in-kind. |
See accompanying Notes to Financial Statements.
| | |
| |
| ASTON/Silvercrest Small Cap Fund – Class I | | October 31, 2012 |
| |
| Financial Highlights | | |
| | | | |
| | | Period
Ended
10/31/12(a) | |
| |
| |
| |
Net Asset Value, Beginning of Period | | $ | 10.00 | |
| | | | |
Income from Investment Operations: | | | | |
Net investment income | | | 0.03 | |
Net realized and unrealized gain on investments | | | 0.90 | |
| | | | |
Total from investment operations | | | 0.93 | |
| | | | |
Net increase in net asset value | | | 0.93 | |
| | | | |
Net Asset Value, End of Period | | $ | 10.93 | |
| | | | |
Total Return (b) | | | 9.30 | %(c) |
| |
Ratios/Supplemental Data: | | | | |
Net Assets, End of Period (in 000’s) | | $ | 4,962 | |
Ratios of expenses to average net assets: | | | | |
Before reimbursement and/or waiver of expenses by Adviser | | | 4.85 | %(d) |
After reimbursement and/or waiver of expenses by Adviser | | | 1.15 | %(d) |
Ratios of net investment income (loss) to average net assets: | | | | |
Before reimbursement and/or waiver of expenses by Adviser | | | (3.26 | )%(d) |
After reimbursement and/or waiver of expenses by Adviser | | | 0.44 | %(d) |
Portfolio Turnover | | | 26.22 | %(c)(e) |
| | (a) | Silvercrest Small Cap Fund began issuing Class I shares on December 23, 2011. |
| | (b) | The total return is calculated using the Net Asset Values used for trading at the close of business at period end. |
| | (e) | Portfolio turnover rate excludes securities delivered from processing a redemption-in-kind. |
See accompanying Notes to Financial Statements.
| | |
| |
| ASTON/TAMRO Small Cap Fund – Class N | | October 31, 2012 |
| |
| Financial Highlights | | |
| | | | | | | | | | | | | | | | | | | | |
| | | Year
Ended
10/31/12 | | | Year
Ended
10/31/11 | | | Year
Ended
10/31/10 | | | Year
Ended
10/31/09 | | | Year
Ended
10/31/08 | |
Net Asset Value, Beginning of Period | | $ | 20.57 | | | $ | 19.42 | | | $ | 14.67 | | | $ | 13.64 | | | $ | 20.99 | |
| | | | | | | | | | | | | | | | | | | | |
Income from Investment Operations: | | | | | | | | | | | | | | | | | | | | |
Net investment income (loss) | | | (0.12 | )(a) | | | (0.15 | )(a) | | | (0.08 | )(a) | | | (0.05 | )(a) | | | 0.05 | |
Net realized and unrealized gain (loss)
on investments | | | 2.09 | | | | 1.75 | | | | 4.83 | | | | 1.08 | | | | (6.43 | ) |
| | | | | | | | | | | | | | | | | | | | |
Total from investment operations | | | 1.97 | | | | 1.60 | | | | 4.75 | | | | 1.03 | | | | (6.38 | ) |
| | | | | | | | | | | | | | | | | | | | |
Less Distributions: | | | | | | | | | | | | | | | | | | | | |
Distributions from net realized gain
on investments | | | (2.02 | ) | | | (0.45 | ) | | | — | | | | — | | | | (0.97 | ) |
| | | | | | | | | | | | | | | | | | | | |
Total distributions | | | (2.02 | ) | | | (0.45 | ) | | | — | | | | — | | | | (0.97 | ) |
| | | | | | | | | | | | | | | | | | | | |
Net increase (decrease) in net asset value . | | | (0.05 | ) | | | 1.15 | | | �� | 4.75 | | | | 1.03 | | | | (7.35 | ) |
| | | | | | | | | | | | | | | | | | | | |
Net Asset Value, End of Period | | $ | 20.52 | | | $ | 20.57 | | | $ | 19.42 | | | $ | 14.67 | | | $ | 13.64 | |
| | | | | | | | | | | | | | | | | | | | |
Total Return (b) | | | 10.70 | % | | | 8.16 | % | | | 32.29 | % | | | 7.63 | % | | | (31.58 | )% |
| | | | | |
Ratios/Supplemental Data: | | | | | | | | | | | | | | | | | | | | |
Net Assets, End of Period (in 000’s) | | $ | 389,125 | | | $ | 375,969 | | | $ | 335,809 | | | $ | 241,524 | | | $ | 159,965 | |
Ratios of expenses to average net assets: | | | | | | | | | | | | | | | | | | | | |
Before reimbursement and/or waiver of
expenses by Adviser | | | 1.28 | %(c) | | | 1.29 | % | | | 1.34 | % | | | 1.37 | % | | | 1.32 | % |
After reimbursement and/or waiver of
expenses by Adviser | | | 1.28 | %(c) | | | 1.29 | % | | | 1.34 | % | | | 1.36 | %(d) | | | 1.30 | % |
Ratios of net investment income (loss)
to average net assets: | | | | | | | | | | | | | | | | | | | | |
Before reimbursement and/or waiver of
expenses by Adviser | | | (0.59 | )% | | | (0.69 | )% | | | (0.49 | )% | | | (0.41 | )% | | | 0.29 | % |
After reimbursement and/or waiver of
expenses by Adviser | | | (0.59 | )% | | | (0.69 | )% | | | (0.49 | )% | | | (0.40 | )% | | | 0.31 | % |
Portfolio Turnover | | | 48.22 | %(e) | | | 47.25 | % | | | 62.13 | % | | | 89.92 | % | | | 66.65 | % |
| | (a) | The selected per share data was calculated using the weighted average shares outstanding method for the period. |
| | (b) | The total return is calculated using the Net Asset Values used for trading at the close of business at period end. |
| | (c) | Ratios of expenses to average net assets include interest expenses of less than 0.005% for the year ended October 31, 2012, which is not included in the contractual expense limitation. The interest expenses are from utilizing the line of credit as discussed in Note H to Financial Statements. |
| | (d) | The Adviser removed the contractual expense limitation of 1.30%, excluding interest, taxes, other investment-related costs (such as brokerage commissions), extraordinary expenses and acquired fund fees and expenses, effective March 1, 2009. |
| | (e) | Portfolio turnover rate excludes securities delivered from processing redemptions-in-kind. |
See accompanying Notes to Financial Statements.
| | |
| |
| ASTON/TAMRO Small Cap Fund – Class I | | October 31, 2012 |
| |
| Financial Highlights | | |
| | | | | | | | | | | | | | | | | | | | |
| | | Year
Ended
10/31/12 | | | Year
Ended
10/31/11 | | | Year
Ended
10/31/10 | | | Year
Ended
10/31/09 | | | Year
Ended
10/31/08 | |
| | | | | | | | | | | | | | | | | | | | |
Net Asset Value, Beginning of Period | | $ | 20.91 | | | $ | 19.69 | | | $ | 14.87 | | | $ | 13.79 | | | $ | 21.16 | |
| | | | | | | | | | | | | | | | | | | | |
Income from Investment Operations: | | | | | | | | | | | | | | | | | | | | |
Net investment income (loss) | | | (0.07 | )(a) | | | (0.09 | )(a) | | | (0.04 | )(a) | | | (0.02 | )(a) | | | 0.02 | |
Net realized and unrealized gain (loss)
on investments | | | 2.14 | | | | 1.76 | | | | 4.87 | | | | 1.12 | | | | (6.42 | ) |
| | | | | | | | | | | | | | | | | | | | |
Total from investment operations | | | 2.07 | | | | 1.67 | | | | 4.83 | | | | 1.10 | | | | (6.40 | ) |
| | | | | | | | | | | | | | | | | | | | |
Less Distributions: | | | | | | | | | | | | | | | | | | | | |
Distributions from and in excess of net
investment income | | | — | | | | — | | | | (0.01 | ) | | | (0.02 | ) | | | — | |
Distributions from net realized gain
on investments | | | (2.02 | ) | | | (0.45 | ) | | | — | | | | — | | | | (0.97 | ) |
| | | | | | | | | | | | | | | | | | | | |
Total distributions | | | (2.02 | ) | | | (0.45 | ) | | | (0.01 | ) | | | (0.02 | ) | | | (0.97 | ) |
| | | | | | | | | | | | | | | | | | | | |
Net increase (decrease) in net asset value . | | | 0.05 | | | | 1.22 | | | | 4.82 | | | | 1.08 | | | | (7.37 | ) |
| | | | | | | | | | | | | | | | | | | | |
Net Asset Value, End of Period | | $ | 20.96 | | | $ | 20.91 | | | $ | 19.69 | | | $ | 14.87 | | | $ | 13.79 | |
| | | | | | | | | | | | | | | | | | | | |
Total Return (b) | | | 10.98 | % | | | 8.40 | % | | | 32.62 | % | | | 7.94 | % | | | (31.42 | )% |
| | | | | |
Ratios/Supplemental Data: | | | | | | | | | | | | | | | | | | | | |
Net Assets, End of Period (in 000’s) | | $ | 635,663 | | | $ | 625,315 | | | $ | 549,627 | | | $ | 515,592 | | | $ | 238,399 | |
Ratios of expenses to average net assets: | | | | | | | | | | | | | | | | | | | | |
Before reimbursement and/or waiver of
expenses by Adviser | | | 1.03 | %(c) | | | 1.04 | % | | | 1.09 | % | | | 1.12 | % | | | 1.07 | % |
After reimbursement and/or waiver of
expenses by Adviser | | | 1.03 | %(c) | | | 1.04 | % | | | 1.09 | % | | | 1.11 | %(d) | | | 1.05 | % |
Ratios of net investment income (loss)
to average net assets: | | | | | | | | | | | | | | | | | | | | |
Before reimbursement and/or waiver of
expenses by Adviser | | | (0.34 | )% | | | (0.44 | )% | | | (0.24 | )% | | | (0.16 | )% | | | 0.54 | % |
After reimbursement and/or waiver of
expenses by Adviser | | | (0.34 | )% | | | (0.44 | )% | | | (0.24 | )% | | | (0.15 | )% | | | 0.56 | % |
Portfolio Turnover | | | 48.22 | %(e) | | | 47.25 | % | | | 62.13 | % | | | 89.92 | % | | | 66.65 | % |
| | (a) | The selected per share data was calculated using the weighted average shares outstanding method for the period. |
| | (b) | The total return is calculated using the Net Asset Values used for trading at the close of business at period end. |
| | (c) | Ratios of expenses to average net assets include interest expenses of less than 0.005% for the year ended October 31, 2012, which is not included in the contractual expense limitation. The interest expenses are from utilizing the line of credit as discussed in Note H to Financial Statements. |
| | (d) | The Adviser removed the contractual expense limitation of 1.05%, excluding interest, taxes, other investment-related costs (such as brokerage commissions), extraordinary expenses and acquired fund fees and expenses, effective March 1, 2009. |
| | (e) | Portfolio turnover rate excludes securities delivered from processing redemptions-in-kind. |
See accompanying Notes to Financial Statements.
| | |
| |
| ASTON/River Road Select Value Fund – Class N | | October 31, 2012 |
| |
| Financial Highlights | | |
| | | | | | | | | | | | | | | | | | | | |
| | | Year
Ended
10/31/12 | | | Year
Ended
10/31/11 | | | Year
Ended
10/31/10 | | | Year
Ended
10/31/09 | | | Year
Ended
10/31/08 | |
| | | | | | | | | | | | | | | | | | | | |
Net Asset Value, Beginning of Period | | $ | 9.54 | | | $ | 9.01 | | | $ | 7.71 | | | $ | 7.13 | | | $ | 10.13 | |
| | | | | | | | | | | | | | | | | | | | |
Income from Investment Operations: | | | | | | | | | | | | | | | | | | | | |
Net investment income (loss) | | | 0.01 | (a) | | | (0.02 | )(a) | | | 0.02 | (a) | | | — | (a)(b) | | | — | (a)(b) |
Net realized and unrealized gain (loss)
on investments | | | 1.01 | | | | 0.66 | | | | 1.28 | | | | 0.59 | | | | (3.00 | ) |
| | | | | | | | | | | | | | | | | | | | |
Total from investment operations | | | 1.02 | | | | 0.64 | | | | 1.30 | | | | 0.59 | | | | (3.00 | ) |
| | | | | | | | | | | | | | | | | | | | |
Less Distributions: | | | | | | | | | | | | | | | | | | | | |
Distributions from net investment income | | | — | | | | (0.03 | ) | | | — | | | | (0.01 | ) | | | — | |
Distributions from net realized gains
on investments | | | (2.06 | ) | | | (0.08 | ) | | | — | | | | — | | | | — | |
| | | | | | | | | | | | | | | | | | | | |
Total distributions | | | (2.06 | ) | | | (0.11 | ) | | | — | | | | (0.01 | ) | | | — | |
| | | | | | | | | | | | | | | | | | | | |
Net increase (decrease) in net asset value | | | (1.04 | ) | | | 0.53 | | | | 1.30 | | | | 0.58 | | | | (3.00 | ) |
| | | | | | | | | | | | | | | | | | | | |
Net Asset Value, End of Period | | $ | 8.50 | | | $ | 9.54 | | | $ | 9.01 | | | $ | 7.71 | | | $ | 7.13 | |
| | | | | | | | | | | | | | | | | | | | |
Total Return (c) | | | 12.87 | % | | | 7.12 | % | | | 16.86 | % | | | 8.33 | % | | | (29.62 | )% |
| | | | | |
Ratios/Supplemental Data: | | | | | | | | | | | | | | | | | | | | |
Net Assets, End of Period (in 000’s) | | $ | 6,270 | | | $ | 13,160 | | | $ | 52,522 | | | $ | 41,801 | | | $ | 26,714 | |
Ratios of expenses to average net assets: | | | | | | | | | | | | | | | | | | | | |
Before recoupment and/or waiver of
expenses by Adviser | | | 1.43 | %(d) | | | 1.42 | %(d) | | | 1.41 | %(d) | | | 1.44 | % | | | 1.56 | % |
After recoupment and/or waiver of
expenses by Adviser | | | 1.43 | %(d) | | | 1.42 | %(d) | | | 1.43 | %(d) | | | 1.50 | % | | | 1.50 | % |
Ratios of net investment income (loss)
to average net assets: | | | | | | | | | | | | | | | | | | | | |
Before recoupment and/or waiver of
expenses by Adviser | | | 0.07 | % | | | (0.18 | )% | | | 0.31 | % | | | 0.04 | % | | | (0.08 | )% |
After recoupment and/or waiver of
expenses by Adviser | | | 0.07 | % | | | (0.18 | )% | | | 0.29 | % | | | (0.02 | )% | | | (0.02 | )% |
Portfolio Turnover | | | 38.84 | % | | | 48.22 | % | | | 53.73 | % | | | 44.09 | % | | | 54.93 | % |
| | (a) | The selected per share data was calculated using the weighted average shares outstanding method for the period. |
| | (b) | Represents less than $(0.005) per share. |
| | (c) | The total return is calculated using the Net Asset Values used for trading at the close of business at period end. |
| | (d) | Ratios of expenses to average net assets include interest expenses of less than 0.005% for each of the years ended October 31, 2012, October 31, 2011 and October 31, 2010, which are not included in the contractual expense limitation. The interest expenses are from utilizing the line of credit as discussed in Note H to Financial Statements. |
See accompanying Notes to Financial Statements.
| | |
| |
| ASTON/River Road Select Value Fund – Class I | | October 31, 2012 |
| |
| Financial Highlights | | |
| | | | | | | | | | | | | | | | | | | | |
| | | Year
Ended
10/31/12 | | | Year
Ended
10/31/11 | | | Year
Ended
10/31/10 | | | Year
Ended
10/31/09 | | | Year
Ended
10/31/08 | |
| | | | | | | | | | | | | | | | | | | | |
Net Asset Value, Beginning of Period | | $ | 9.59 | | | $ | 9.04 | | | $ | 7.73 | | | $ | 7.14 | | | $ | 10.13 | |
| | | | | | | | | | | | | | | | | | | | |
Income from Investment Operations: | | | | | | | | | | | | | | | | | | | | |
Net investment income | | | 0.03 | (a) | | | 0.01 | (a) | | | 0.05 | (a) | | | 0.02 | (a) | | | 0.02 | (a) |
Net realized and unrealized gain (loss)
on investments | | | 1.02 | | | | 0.67 | | | | 1.28 | | | | 0.59 | | | | (3.00 | ) |
| | | | | | | | | | | | | | | | | | | | |
Total from investment operations | | | 1.05 | | | | 0.68 | | | | 1.33 | | | | 0.61 | | | | (2.98 | ) |
| | | | | | | | | | | | | | | | | | | | |
Less Distributions: | | | | | | | | | | | | | | | | | | | | |
Distributions from net investment income | | | — | | | | (0.05 | ) | | | (0.02 | ) | | | (0.02 | ) | | | (0.01 | ) |
Distributions from net realized gains
on investments | | | (2.06 | ) | | | (0.08 | ) | | | — | | | | — | | | | — | |
| | | | | | | | | | | | | | | | | | | | |
Total distributions | | | (2.06 | ) | | | (0.13 | ) | | | (0.02 | ) | | | (0.02 | ) | | | (0.01 | ) |
| | | | | | | | | | | | | | | | | | | | |
Net increase (decrease) in net asset value | | | (1.01 | ) | | | 0.55 | | | | 1.31 | | | | 0.59 | | | | (2.99 | ) |
| | | | | | | | | | | | | | | | | | | | |
Net Asset Value, End of Period | | $ | 8.58 | | | $ | 9.59 | | | $ | 9.04 | | | $ | 7.73 | | | $ | 7.14 | |
| | | | | | | | | | | | | | | | | | | | |
Total Return (b) | | | 13.18 | % | | | 7.56 | % | | | 17.19 | % | | | 8.52 | % | | | (29.49 | )% |
| | | | | |
Ratios/Supplemental Data: | | | | | | | | | | | | | | | | | | | | |
Net Assets, End of Period (in 000’s) | | $ | 156,510 | | | $ | 130,527 | | | $ | 163,232 | | | $ | 167,334 | | | $ | 84,002 | |
Ratios of expenses to average net assets: | | | | | | | | | | | | | | | | | | | | |
Before recoupment and/or waiver of
expenses by Adviser | | | 1.18 | %(c) | | | 1.17 | %(c) | | | 1.16 | %(c) | | | 1.19 | % | | | 1.31 | % |
After recoupment and/or waiver of
expenses by Adviser | | | 1.18 | %(c) | | | 1.17 | %(c) | | | 1.18 | %(c) | | | 1.25 | % | | | 1.25 | % |
Ratios of net investment income (loss)
to average net assets: | | | | | | | | | | | | | | | | | | | | |
Before recoupment and/or waiver of
expenses by Adviser | | | 0.32 | % | | | 0.07 | % | | | 0.56 | % | | | 0.29 | % | | | 0.17 | % |
After recoupment and/or waiver of
expenses by Adviser | | | 0.32 | % | | | 0.07 | % | | | 0.54 | % | | | 0.23 | % | | | 0.23 | % |
Portfolio Turnover | | | 38.84 | % | | | 48.22 | % | | | 53.73 | % | | | 44.09 | % | | | 54.93 | % |
| | (a) | The selected per share data was calculated using the weighted average shares outstanding method for the period. |
| | (b) | The total return is calculated using the Net Asset Values used for trading at the close of business at period end. |
| | (c) | Ratios of expenses to average net assets include interest expenses of less than 0.005% for each of the years ended October 31, 2012, October 31, 2011 and October 31, 2010, which are not included in the contractual expense limitation. The interest expenses are from utilizing the line of credit as discussed in Note H to Financial Statements. |
See accompanying Notes to Financial Statements.
| | |
| |
| ASTON/River Road Small Cap Value Fund – Class N | | October 31, 2012 |
| |
| Financial Highlights | | |
| | | | | | | | | | | | | | | | | | | | |
| | | Year
Ended
10/31/12 | | | Year
Ended
10/31/11 | | | Year
Ended
10/31/10 | | | Year
Ended
10/31/09 | | | Year
Ended
10/31/08 | |
| | | | | | | | | | | | | | | | | | | | |
Net Asset Value, Beginning of Period | | $ | 12.20 | | | $ | 11.60 | | | $ | 10.22 | | | $ | 9.30 | | | $ | 14.37 | |
| | | | | | | | | | | | | | | | | | | | |
Income from Investment Operations: | | | | | | | | | | | | | | | | | | | | |
Net investment income (loss) | | | 0.03 | (a) | | | (0.03 | ) | | | 0.03 | | | | 0.01 | | | | 0.01 | (a) |
Net realized and unrealized gain (loss)
on investments | | | 1.33 | | | | 0.67 | | | | 1.36 | | | | 0.92 | | | | (4.54 | ) |
| | | | | | | | | | | | | | | | | | | | |
Total from investment operations | | | 1.36 | | | | 0.64 | | | | 1.39 | | | | 0.93 | | | | (4.53 | ) |
| | | | | | | | | | | | | | | | | | | | |
Less Distributions: | | | | | | | | | | | | | | | | | | | | |
Distributions from and in excess of net
investment income | | | — | | | | (0.04 | ) | | | (0.01 | ) | | | (0.01 | ) | | | — | |
Distributions from net realized gain
on investments | | | — | | | | — | | | | — | | | | — | | | | (0.54 | ) |
| | | | | | | | | | | | | | | | | | | | |
Total distributions | | | — | | | | (0.04 | ) | | | (0.01 | ) | | | (0.01 | ) | | | (0.54 | ) |
| | | | | | | | | | | | | | | | | | | | |
Net increase (decrease) in net asset value | | | 1.36 | | | | 0.60 | | | | 1.38 | | | | 0.92 | | | | (5.07 | ) |
| | | | | | | | | | | | | | | | | | | | |
Net Asset Value, End of Period | | $ | 13.56 | | | $ | 12.20 | | | $ | 11.60 | | | $ | 10.22 | | | $ | 9.30 | |
| | | | | | | | | | | | | | | | | | | | |
Total Return (b) | | | 11.15 | % | | | 5.46 | % | | | 13.60 | % | | | 9.99 | % | | | (32.51 | )% |
| | | | | |
Ratios/Supplemental Data: | | | | | | | | | | | | | | | | | | | | |
Net Assets, End of Period (in 000’s) | | $ | 49,154 | | | $ | 91,347 | | | $ | 213,326 | | | $ | 216,221 | | | $ | 160,245 | |
Ratios of expenses to average net assets: | | | | | | | | | | | | | | | | | | | | |
Before reimbursement and/or waiver of
expenses by Adviser | | | 1.37 | % | | | 1.37 | %(c) | | | 1.39 | %(c) | | | 1.40 | % | | | 1.45 | %(c) |
After reimbursement and/or waiver of
expenses by Adviser | | | 1.37 | % | | | 1.37 | %(c) | | | 1.39 | %(c) | | | 1.40 | %(d) | | | 1.45 | %(c) |
Ratios of net investment income (loss)
to average net assets: | | | | | | | | | | | | | | | | | | | | |
Before reimbursement and/or waiver of
expenses by Adviser | | | 0.22 | % | | | (0.13 | )% | | | 0.27 | % | | | 0.05 | % | | | 0.08 | % |
After reimbursement and/or waiver of
expenses by Adviser | | | 0.22 | % | | | (0.13 | )% | | | 0.27 | % | | | 0.05 | % | | | 0.08 | % |
Portfolio Turnover | | | 26.95 | % | | | 42.29 | % | | | 51.05 | % | | | 35.83 | % | | | 57.32 | % |
| | (a) | The selected per share data was calculated using the weighted average shares outstanding method for the period. |
| | (b) | The total return is calculated using the Net Asset Values used for trading at the close of business at period end. |
| | (c) | Ratios of expenses to average net assets include interest expenses of less than 0.005% for each of the years ended October 31, 2011, October 31, 2010 and October 31, 2008, which are not included in the contractual expense limitation. The interest expenses are from utilizing the line of credit as discussed in Note H to Financial Statements. |
| | (d) | The Adviser removed the contractual expense limitation of 1.50%, excluding interest, taxes, other investment-related costs (such as brokerage commissions), extraordinary expenses and acquired fund fees and expenses, effective March 1, 2009. |
See accompanying Notes to Financial Statements.
| | |
| |
| ASTON/River Road Small Cap Value Fund – Class I | | October 31, 2012 |
| |
| Financial Highlights | | |
| | | | | | | | | | | | | | | | | | | | |
| | | Year
Ended
10/31/12 | | | Year
Ended
10/31/11 | | | Year
Ended
10/31/10 | | | Year
Ended
10/31/09 | | | Year
Ended
10/31/08 | |
| | | | | | | | | | | | | | | | | | | | |
Net Asset Value, Beginning of Period | | $ | 12.22 | | | $ | 11.62 | | | $ | 10.24 | | | $ | 9.32 | | | $ | 14.37 | |
| | | | | | | | | | | | | | | | | | | | |
Income from Investment Operations: | | | | | | | | | | | | | | | | | | | | |
Net investment income | | | 0.06 | (a) | | | 0.01 | | | | 0.06 | | | | 0.03 | | | | 0.04 | (a) |
Net realized and unrealized gain (loss)
on investments | | | 1.34 | | | | 0.65 | | | | 1.35 | | | | 0.92 | | | | (4.54 | ) |
| | | | | | | | | | | | | | | | | | | | |
Total from investment operations | | | 1.40 | | | | 0.66 | | | | 1.41 | | | | 0.95 | | | | (4.50 | ) |
| | | | | | | | | | | | | | | | | | | | |
Less Distributions: | | | | | | | | | | | | | | | | | | | | |
Distributions from and in excess of net
investment income | | | — | | | | (0.06 | ) | | | (0.03 | ) | | | (0.03 | ) | | | (0.01 | ) |
Distributions from net realized gain
on investments | | | — | | | | — | | | | — | | | | — | | | | (0.54 | ) |
| | | | | | | | | | | | | | | | | | | | |
Total distributions | | | — | | | | (0.06 | ) | | | (0.03 | ) | | | (0.03 | ) | | | (0.55 | ) |
| | | | | | | | | | | | | | | | | | | | |
Net increase (decrease) in net asset value | | | 1.40 | | | | 0.60 | | | | 1.38 | | | | 0.92 | | | | (5.05 | ) |
| | | | | | | | | | | | | | | | | | | | |
Net Asset Value, End of Period | | $ | 13.62 | | | $ | 12.22 | | | $ | 11.62 | | | $ | 10.24 | | | $ | 9.32 | |
| | | | | | | | | | | | | | | | | | | | |
Total Return (b) | | | 11.46 | % | | | 5.70 | % | | | 13.80 | % | | | 10.31 | % | | | (32.34 | )% |
| | | | | |
Ratios/Supplemental Data: | | | | | | | | | | | | | | | | | | | | |
Net Assets, End of Period (in 000’s) | | $ | 240,075 | | | $ | 246,141 | | | $ | 255,344 | | | $ | 282,542 | | | $ | 114,666 | |
Ratios of expenses to average net assets: | | | | | | | | | | | | | | | | | | | | |
Before reimbursement and/or waiver of
expenses by Adviser | | | 1.12 | % | | | 1.12 | %(c) | | | 1.14 | %(c) | | | 1.15 | % | | | 1.20 | %(c) |
After reimbursement and/or waiver of
expenses by Adviser | | | 1.12 | % | | | 1.12 | %(c) | | | 1.14 | %(c) | | | 1.15 | %(d) | | | 1.20 | %(c) |
Ratios of net investment income to average
net assets: | | | | | | | | | | | | | | | | | | | | |
Before reimbursement and/or waiver of
expenses by Adviser | | | 0.47 | % | | | 0.12 | % | | | 0.52 | % | | | 0.30 | % | | | 0.33 | % |
After reimbursement and/or waiver of
expenses by Adviser | | | 0.47 | % | | | 0.12 | % | | | 0.52 | % | | | 0.30 | % | | | 0.33 | % |
Portfolio Turnover | | | 26.95 | % | | | 42.29 | % | | | 51.05 | % | | | 35.83 | % | | | 57.32 | % |
| | (a) | The selected per share data was calculated using the weighted average shares outstanding method for the period. |
| | (b) | The total return is calculated using the Net Asset Values used for trading at the close of business at period end. |
| | (c) | Ratios of expenses to average net assets include interest expenses of less than 0.005% for each of the years ended October 31, 2011, October 31, 2010 and October 31, 2008, which are not included in the contractual expense limitation. The interest expenses are from utilizing the line of credit as discussed in Note H to Financial Statements. |
| | (d) | The Adviser removed the contractual expense limitation of 1.25%, excluding interest, taxes, other investment-related costs (such as brokerage commissions), extraordinary expenses and acquired fund fees and expenses, effective March 1, 2009. |
See accompanying Notes to Financial Statements.
| | |
| |
| ASTON/River Road Independent Value Fund – Class N | | October 31, 2012 |
| |
| Financial Highlights | | |
| | | | | | | | |
| | | Year
Ended
10/31/12 | | | Period
Ended
10/31/11(a) | |
Net Asset Value, Beginning of Period | | $ | 10.75 | | | $ | 10.00 | |
| | | | | | | | |
Income from Investment Operations: | | | | | | | | |
Net investment loss | | | (0.09 | )(b) | | | (0.07 | )(b) |
Net realized and unrealized gain on investments | | | 0.88 | | | | 0.82 | |
| | | | | | | | |
Total from investment operations | | | 0.79 | | | | 0.75 | |
| | | | | | | | |
Less Distributions: | | | | | | | | |
Distributions from net realized gain on investments | | | (0.12 | ) | | | — | |
| | | | | | | | |
Total distributions | | | (0.12 | ) | | | — | |
| | | | | | | | |
Net increase in net asset value | | | 0.67 | | | | 0.75 | |
| | | | | | | | |
Net Asset Value, End of Period | | $ | 11.42 | | | $ | 10.75 | |
| | | | | | | | |
Total Return (c) | | | 7.41 | % | | | 7.50 | %(d) |
| | |
Ratios/Supplemental Data: | | | | | | | | |
Net Assets, End of Period (in 000’s) | | $ | 362,416 | | | $ | 306,223 | |
Ratios of expenses to average net assets: | | | | | | | | |
Before reimbursement, waiver, and/or earnings credit of expenses by Adviser | | | 1.44 | %(f) | | | 1.59 | %(e) |
After reimbursement, waiver, and/or earnings credit of expenses by Adviser | | | 1.42 | %(f) | | | 1.42 | %(e) |
Ratios of net investment loss to average net assets: | | | | | | | | |
Before reimbursement, waiver, and/or earnings credit of expenses by Adviser | | | (0.81 | )% | | | (0.98 | )%(e) |
After reimbursement, waiver, and/or earnings credit of expenses by Adviser | | | (0.79 | )% | | | (0.80 | )%(e) |
Portfolio Turnover | | | 141.17 | % | | | 105.69 | %(d) |
| | (a) | River Road Independent Value Fund began issuing Class N shares on December 30, 2010. |
| | (b) | The selected per share data was calculated using the weighted average shares outstanding method for the period. |
| | (c) | The total return is calculated using the Net Asset Values used for trading at the close of business at period end. |
| | (f) | Ratios of expenses to average net assets include Earnings Credits of less than 0.005% for the year ended October 31, 2012, which is not included in the contractual expense limitation. See Note I in the Notes to Financial Statements. |
See accompanying Notes to Financial Statements.
| | |
| |
| ASTON/River Road Independent Value Fund – Class I | | October 31, 2012 |
| |
| Financial Highlights | | |
| | | | | | | | |
| | | Year
Ended
10/31/12 | | | Period
Ended
10/31/11(a) | |
Net Asset Value, Beginning of Period | | $ | 10.75 | | | $ | 10.92 | |
| | | | | | | | |
Income from Investment Operations: | | | | | | | | |
Net investment loss | | | (0.06 | )(b) | | | (0.02 | )(b) |
Net realized and unrealized gain (loss) on investments | | | 0.89 | | | | (0.15 | ) |
| | | | | | | | |
Total from investment operations | | | 0.83 | | | | (0.17 | ) |
| | | | | | | | |
Less Distributions: | | | | | | | | |
Distributions from net realized gain on investments | | | (0.12 | ) | | | — | |
| | | | | | | | |
Total distributions | | | (0.12 | ) | | | — | |
| | | | | | | | |
Net increase (decrease) in net asset value | | | 0.71 | | | | (0.17 | ) |
| | | | | | | | |
Net Asset Value, End of Period | | $ | 11.46 | | | $ | 10.75 | |
| | | | | | | | |
Total Return (c) | | | 7.68 | % | | | (1.47 | )%(d) |
| | |
Ratios/Supplemental Data: | | | | | | | | |
Net Assets, End of Period (in 000’s) | | $ | 338,234 | | | $ | 85,478 | |
Ratios of expenses to average net assets: | | | | | | | | |
Before reimbursement, waiver, and/or earnings credit of expenses by Adviser | | | 1.19 | %(f) | | | 1.34 | %(e) |
After reimbursement, waiver, and/or earnings credit of expenses by Adviser | | | 1.17 | %(f) | | | 1.17 | %(e) |
Ratios of net investment loss to average net assets: | | | | | | | | |
Before reimbursement, waiver, and/or earnings credit of expenses by Adviser | | | (0.56 | )% | | | (0.73 | )%(e) |
After reimbursement, waiver, and/or earnings credit of expenses by Adviser | | | (0.54 | )% | | | (0.55 | )%(e) |
Portfolio Turnover | | | 141.17 | % | | | 105.69 | %(d) |
| | (a) | River Road Independent Value Fund began issuing Class I shares on May 31, 2011. |
| | (b) | The selected per share data was calculated using the weighted average shares outstanding method for the period. |
| | (c) | The total return is calculated using the Net Asset Values used for trading at the close of business at period end. |
| | (f) | Ratios of expenses to average net assets include Earnings Credits of less than 0.005% for the year ended October 31, 2012, which is not included in the contractual expense limitation. See Note I in the Notes to Financial Statements. |
See accompanying Notes to Financial Statements.
| | |
| |
| ASTON/DoubleLine Core Plus Fixed Income Fund – Class N | | October 31, 2012 |
| |
| Financial Highlights | | |
| | | | | | | | |
| | | Year
Ended
10/31/12 | | | Period
Ended
10/31/11(a) | |
Net Asset Value, Beginning of Period | | $ | 10.44 | | | $ | 10.00 | |
| | | | | | | | |
Income from Investment Operations: | | | | | | | | |
Net investment income | | | 0.33 | (b) | | | 0.12 | (b) |
Net realized and unrealized gain on investments | | | 0.72 | | | | 0.41 | |
| | | | | | | | |
Total from investment operations | | | 1.05 | | | | 0.53 | |
| | | | | | | | |
Less Distributions: | | | | | | | | |
Distributions from and in excess of net investment income | | | (0.37 | ) | | | (0.09 | ) |
Distributions from net realized gain on investments | | | (0.02 | ) | | | — | |
| | | | | | | | |
Total distributions | | | (0.39 | ) | | | (0.09 | ) |
| | | | | | | | |
Net increase in net asset value | | | 0.66 | | | | 0.44 | |
| | | | | | | | |
Net Asset Value, End of Period | | $ | 11.10 | | | $ | 10.44 | |
| | | | | | | | |
Total Return (c) | | | 10.25 | % | | | 5.33 | %(d) |
| | |
Ratios/Supplemental Data: | | | | | | | | |
Net Assets, End of Period (in 000’s) | | $ | 71,546 | | | $ | 22,657 | |
Ratios of expenses to average net assets: | | | | | | | | |
Before reimbursement and/or waiver of expenses by Adviser | | | 1.35 | % | | | 3.16 | %(e) |
After reimbursement and/or waiver of expenses by Adviser | | | 0.94 | % | | | 0.94 | %(e) |
Ratios of net investment income to average net assets: | | | | | | | | |
Before reimbursement and/or waiver of expenses by Adviser | | | 2.59 | % | | | 1.63 | %(e) |
After reimbursement and/or waiver of expenses by Adviser | | | 3.01 | % | | | 3.85 | %(e) |
Portfolio Turnover | | | 118.67 | % | | | 38.49 | %(d) |
| | (a) | DoubleLine Core Plus Fixed Income Fund began issuing Class N shares on July 15, 2011. |
| | (b) | The selected per share data was calculated using the weighted average shares outstanding method for the period. |
| | (c) | The total return is calculated using the Net Asset Values used for trading at the close of business at period end. |
See accompanying Notes to Financial Statements.
| | |
| |
| ASTON/DoubleLine Core Plus Fixed Income Fund – Class I | | October 31, 2012 |
| |
| Financial Highlights | | |
| | | | | | | | |
| | | Year
Ended
10/31/12 | | | Period
Ended
10/31/11(a) | |
Net Asset Value, Beginning of Period | | $ | 10.44 | | | $ | 10.00 | |
| | | | | | | | |
Income from Investment Operations: | | | | | | | | |
Net investment income | | | 0.35 | (b) | | | 0.13 | (b) |
Net realized and unrealized gain on investments | | | 0.73 | | | | 0.41 | |
| | | | | | | | |
Total from investment operations | | | 1.08 | | | | 0.54 | |
| | | | | | | | |
Less Distributions: | | | | | | | | |
Distributions from and in excess of net investment income | | | (0.40 | ) | | | (0.10 | ) |
Distributions from net realized gain on investments | | | (0.02 | ) | | | — | |
| | | | | | | | |
Total distributions | | | (0.42 | ) | | | (0.10 | ) |
| | | | | | | | |
Net increase in net asset value | | | 0.66 | | | | 0.44 | |
| | | | | | | | |
Net Asset Value, End of Period | | $11.10 | | | | $ | 10.44 | |
| | | | | | | | |
Total Return (c) | | | 10.52 | % | | | 5.38 | %(d) |
| | |
Ratios/Supplemental Data: | | | | | | | | |
Net Assets, End of Period (in 000’s) | | $ | 105,335 | | | $ | 4,486 | |
Ratios of expenses to average net assets: | | | | | | | | |
Before reimbursement and/or waiver of expenses by Adviser | | | 1.10 | % | | | 2.91 | %(e) |
After reimbursement and/or waiver of expenses by Adviser | | | 0.69 | % | | | 0.69 | %(e) |
Ratios of net investment income to average net assets: | | | | | | | | |
Before reimbursement and/or waiver of expenses by Adviser | | | 2.84 | % | | | 1.88 | %(e) |
After reimbursement and/or waiver of expenses by Adviser | | | 3.26 | % | | | 4.10 | %(e) |
Portfolio Turnover | | | 118.67 | % | | | 38.49 | %(d) |
| | (a) | DoubleLine Core Plus Fixed Income Fund began issuing Class I shares on July 15, 2011. |
| | (b) | The selected per share data was calculated using the weighted average shares outstanding method for the period. |
| | (c) | The total return is calculated using the Net Asset Values used for trading at the close of business at period end. |
See accompanying Notes to Financial Statements.
| | |
| |
| ASTON/TCH Fixed Income Fund – Class N | | October 31, 2012 |
| |
| Financial Highlights | | |
| | | | | | | | | | | | | | | | | | | | |
| | | Year
Ended
10/31/12 | | | Year
Ended
10/31/11 | | | Year
Ended
10/31/10 | | | Year
Ended
10/31/09 | | | Year
Ended
10/31/08 | |
Net Asset Value, Beginning of Period | | $ | 10.59 | | | $ | 10.49 | | | $ | 10.02 | | | $ | 8.60 | | | $ | 9.73 | |
| | | | | | | | | | | | | | | | | | | | |
Income from Investment Operations: | | | | | | | | | | | | | | | | | | | | |
Net investment income | | | 0.45 | (a) | | | 0.47 | (a) | | | 0.50 | (a) | | | 0.49 | (a) | | | 0.47 | |
Net realized and unrealized gain (loss)
on investments | | | 0.56 | | | | 0.10 | | | | 0.47 | | | | 1.44 | | | | (1.10 | ) |
| | | | | | | | | | | | | | | | | | | | |
Total from investment operations | | | 1.01 | | | | 0.57 | | | | 0.97 | | | | 1.93 | | | | (0.63 | ) |
| | | | | | | | | | | | | | | | | | | | |
Less Distributions: | | | | | | | | | | | | | | | | | | | | |
Distributions from and in excess of net
investment income | | | (0.49 | ) | | | (0.47 | ) | | | (0.50 | ) | | | (0.51 | ) | | | (0.50 | ) |
| | | | | | | | | | | | | | | | | | | | |
Total distributions | | | (0.49 | ) | | | (0.47 | ) | | | (0.50 | ) | | | (0.51 | ) | | | (0.50 | ) |
| | | | | | | | | | | | | | | | | | | | |
Net increase (decrease) in net asset value . | | | 0.52 | | | | 0.10 | | | | 0.47 | | | | 1.42 | | | | (1.13 | ) |
| | | | | | | | | | | | | | | | | | | | |
Net Asset Value, End of Period | | $ | 11.11 | | | $ | 10.59 | | | $ | 10.49 | | | $ | 10.02 | | | $ | 8.60 | |
| | | | | | | | | | | | | | | | | | | | |
Total Return (b) | | | 9.74 | % | | | 5.62 | % | | | 9.98 | % | | | 22.99 | % | | | (6.89 | )% |
| | | | | |
Ratios/Supplemental Data: | | | | | | | | | | | | | | | | | | | | |
Net Assets, End of Period (in 000’s) | | $ | 59,772 | | | $ | 62,346 | | | $ | 46,274 | | | $ | 47,008 | | | $ | 42,765 | |
Ratios of expenses to average net assets: | | | | | | | | | | | | | | | | | | | | |
Before reimbursement and/or waiver of
expenses by Adviser | | | 1.02 | % | | | 1.14 | % | | | 0.98 | % | | | 0.96 | % | | | 1.06 | % |
After reimbursement and/or waiver of
expenses by Adviser | | | 0.86 | % | | | 0.88 | %(c) | | | 0.62 | % | | | 0.61 | % | | | 0.65 | %(c) |
Ratios of net investment income to average net assets: | | | | | | | | | | | | | | | | | | | | |
Before reimbursement and/or waiver of
expenses by Adviser | | | 4.03 | % | | | 4.20 | % | | | 4.51 | % | | | 4.93 | % | | | 4.59 | % |
After reimbursement and/or waiver of
expenses by Adviser | | | 4.19 | % | | | 4.46 | % | | | 4.87 | % | | | 5.28 | % | | | 5.00 | % |
Portfolio Turnover | | | 57.43 | % | | | 37.51 | % | | | 23.92 | % | | | 40.81 | % | | | 78.39 | % |
| | (a) | The selected per share data was calculated using the weighted average shares outstanding method for the period. |
| | (b) | The total return is calculated using the Net Asset Values used for trading at the close of business at period end. |
| | (c) | The Adviser’s contractual expense limitation, which affects the net expense ratio, was changed from 0.74% to 0.64% on September 1, 2007. Subsequently, on October 1, 2008, the Adviser’s expense reimbursement level changed from 0.64% to 0.74%. Subsequently, on March 1, 2011, the Adviser’s expense reimbursement level changed from 0.74% to 0.94%. The contractual expense limitation excludes interest, taxes, other investment-related costs (such as brokerage commissions), extraordinary expenses and acquired fund fees and expenses. |
See accompanying Notes to Financial Statements.
| | |
| |
| ASTON/TCH Fixed Income Fund – Class I | | October 31, 2012 |
| |
| Financial Highlights | | |
| | | | | | | | | | | | | | | | | | | | |
| | | Year
Ended
10/31/12 | | | Year
Ended
10/31/11 | | | Year
Ended
10/31/10 | | | Year
Ended
10/31/09 | | | Year
Ended
10/31/08 | |
Net Asset Value, Beginning of Period | | $ | 10.59 | | | $ | 10.49 | | | $ | 10.02 | | | $ | 8.60 | | | $ | 9.73 | |
| | | | | | | | | | | | | | | | | | | | |
Income from Investment Operations: | | | | | | | | | | | | | | | | | | | | |
Net investment income | | | 0.47 | (a) | | | 0.49 | (a) | | | 0.51 | (a) | | | 0.50 | (a) | | | 0.48 | |
Net realized and unrealized gain (loss)
on investments | | | 0.55 | | | | 0.11 | | | | 0.48 | | | | 1.44 | | | | (1.09 | ) |
| | | | | | | | | | | | | | | | | | | | |
Total from investment operations | | | 1.02 | | | | 0.60 | | | | 0.99 | | | | 1.94 | | | | (0.61 | ) |
| | | | | | | | | | | | | | | | | | | | |
Less Distributions: | | | | | | | | | | | | | | | | | | | | |
Distributions from and in excess of net
investment income | | | (0.50 | ) | | | (0.50 | ) | | | (0.52 | ) | | | (0.52 | ) | | | (0.52 | ) |
| | | | | | | | | | | | | | | | | | | | |
Total distributions | | | (0.50 | ) | | | (0.50 | ) | | | (0.52 | ) | | | (0.52 | ) | | | (0.52 | ) |
| | | | | | | | | | | | | | | | | | | | |
Net increase (decrease) in net asset value . | | | 0.52 | | | | 0.10 | | | | 0.47 | | | | 1.42 | | | | (1.13 | ) |
| | | | | | | | | | | | | | | | | | | | |
Net Asset Value, End of Period | | $ | 11.11 | | | $ | 10.59 | | | $ | 10.49 | | | $ | 10.02 | | | $ | 8.60 | |
| | | | | | | | | | | | | | | | | | | | |
Total Return (b) | | | 9.93 | % | | | 5.89 | % | | | 10.11 | % | | | 23.14 | % | | | (6.65 | )% |
| | | | | |
Ratios/Supplemental Data: | | | | | | | | | | | | | | | | | | | | |
Net Assets, End of Period (in 000’s) | | $ | 10,396 | | | $ | 10,423 | | | $ | 14,881 | | | $ | 20,276 | | | $ | 25,891 | |
Ratios of expenses to average net assets: | | | | | | | | | | | | | | | | | | | | |
Before reimbursement and/or waiver of
expenses by Adviser | | | 0.85 | % | | | 0.89 | % | | | 0.85 | % | | | 0.84 | % | | | 0.81 | % |
After reimbursement and/or waiver of
expenses by Adviser | | | 0.69 | % | | | 0.63 | %(c) | | | 0.49 | % | | | 0.49 | % | | | 0.40 | %(c) |
Ratios of net investment income to average net assets: | | | | | | | | | | | | | | | | | | | | |
Before reimbursement and/or waiver of
expenses by Adviser | | | 4.20 | % | | | 4.45 | % | | | 4.64 | % | | | 5.05 | % | | | 4.84 | % |
After reimbursement and/or waiver of
expenses by Adviser | | | 4.36 | % | | | 4.71 | % | | | 5.00 | % | | | 5.40 | % | | | 5.25 | % |
Portfolio Turnover | | | 57.43 | % | | | 37.51 | % | | | 23.92 | % | | | 40.81 | % | | | 78.39 | % |
| | (a) | The selected per share data was calculated using the weighted average shares outstanding method for the period. |
| | (b) | The total return is calculated using the Net Asset Values used for trading at the close of business at period end. |
| | (c) | The Adviser’s contractual expense limitation, which affects the net expense ratio, was changed from 0.49% to 0.39% on September 1, 2007. Subsequently, on October 1, 2008, the Adviser’s expense reimbursement level changed from 0.39% to 0.49%. Subsequently, on March 1, 2011, the Adviser’s expense reimbursement level changed from 0.49% to 0.69%. The contractual expense limitation excludes interest, taxes, other investment-related costs (such as brokerage commissions), extraordinary expenses and acquired fund fees and expenses. |
See accompanying Notes to Financial Statements.
| | |
| |
| ASTON/Lake Partners LASSO Alternatives Fund – Class N | | October 31, 2012 |
| |
| Financial Highlights | | |
| | | | | | | | | | | | |
| | | Year
Ended
10/31/12 | | | Year
Ended
10/31/11 | | | Period
Ended
10/31/10(a) | |
Net Asset Value, Beginning of Period | | $ | 11.94 | | | $ | 11.97 | | | $ | 11.48 | |
| | | | | | | | | | | | |
Income from Investment Operations: | | | | | | | | | | | | |
Net investment income (loss) | | | 0.04 | (b) | | | (0.01 | )(b) | | | 0.04 | (b) |
Net realized and unrealized gain on investments | | | 0.59 | | | | 0.13 | | | | 0.45 | |
| | | | | | | | | | | | |
Total from investment operations | | | 0.63 | | | | 0.12 | | | | 0.49 | |
| | | | | | | | | | | | |
Less Distributions: | | | | | | | | | | | | |
Distributions from and in excess of net investment income | | | (0.18 | ) | | | (0.08 | ) | | | — | |
Distributions from capital gains | | | — | | | | (0.07 | ) | | | — | |
| | | | | | | | | | | | |
Total distributions | | | (0.18 | ) | | | (0.15 | ) | | | — | |
| | | | | | | | | | | | |
Net increase (decrease) in net asset value | | | 0.45 | | | | (0.03 | ) | | | 0.49 | |
| | | | | | | | | | | | |
Net Asset Value, End of Period | | $ | 12.39 | | | $ | 11.94 | | | $ | 11.97 | |
| | | | | | | | | | | | |
Total Return (c) | | | 5.34 | % | | | 0.92 | % | | | 4.27 | %(d) |
| | | |
Ratios/Supplemental Data: | | | | | | | | | | | | |
Net Assets, End of Period (in 000’s) | | $ | 33,719 | | | $ | 17,626 | | | $ | 8,296 | |
Ratios of expenses to average net assets: | | | | | | | | | | | | |
Before reimbursement, waiver, earnings credit and/or recoupment of expenses by Adviser (e) | | | 1.41 | %(g)(i) | | | 1.53 | % | | | 2.19 | %(f) |
After reimbursement, waiver, earnings credit and/or recoupment of expenses by Adviser (e) | | | 1.45 | %(g)(i) | | | 1.45 | % | | | 1.45 | %(f)(h) |
Ratios of net investment income (loss) to average net assets: | | | | | | | | | | | | |
Before reimbursement, waiver, earnings credit and/or recoupment of expenses by Adviser | | | 0.36 | %(g) | | | (0.17 | )% | | | (0.25 | )%(f) |
After reimbursement, waiver, earnings credit and/or recoupment of expenses by Adviser | | | 0.32 | %(g) | | | (0.10 | )% | | | 0.49 | %(f) |
Portfolio Turnover | | | 45.60 | % | | | 79.77 | % | | | 116.68 | % |
| | (a) | Lake Partners LASSO Alternatives Fund began issuing Class N shares on March 2, 2010. |
| | (b) | The selected per share data was calculated using the weighted average shares outstanding method for the period. |
| | (c) | The total return is calculated using the Net Asset Values used for trading at the close of business at period end. |
| | (e) | Does not include expenses of the underlying funds in which the Fund invests. |
| | (g) | Ratios of expenses and net investment income to average net assets include advisory fee waiver of less than 0.005% for the year ended October 31, 2012. |
| | (h) | Effective March 30, 2010, the contractual expense limitation was decreased from 1.60% to 1.45% excluding interest, taxes, other investment-related costs (such as brokerage commissions), extraordinary expenses and acquired fund fees and expenses. |
| | (i) | Ratios of expenses to average net assets includes Earnings Credits of less than 0.005% for the year ended October 31, 2012, which is not included in the contractual expense limitation. See Note I in the Notes to Financial Statements. |
See accompanying Notes to Financial Statements.
| | |
| |
| ASTON/Lake Partners LASSO Alternatives Fund – Class I | | October 31, 2012 |
| |
| Financial Highlights | | |
| | | | | | | | | | | | | | | | |
| | | Year
Ended
10/31/12 | | | Year
Ended
10/31/11 | | | Year
Ended
10/31/10 | | | Period
Ended
10/31/09(a) | |
| | | | | | | | | | | | | | | | |
Net Asset Value, Beginning of Period | | $ | 11.97 | | | $ | 11.98 | | | $ | 11.15 | | | $ | 10.00 | |
| | | | | | | | | | | | | | | | |
Income from Investment Operations: | | | | | | | | | | | | | | | | |
Net investment income (loss) | | | 0.07 | (b) | | | 0.02 | (b) | | | 0.08 | (b) | | | (— | )(c) |
Net realized and unrealized gain on investments | | | 0.59 | | | | 0.13 | | | | 0.89 | | | | 1.15 | |
| | | | | | | | | | | | | | | | |
Total from investment operations | | | 0.66 | | | | 0.15 | | | | 0.97 | | | | 1.15 | |
| | | | | | | | | | | | | | | | |
Less Distributions: | | | | | | | | | | | | | | | | |
Distributions from and in excess of net investment income | | | (0.21 | ) | | | (0.09 | ) | | | (0.07 | ) | | | — | |
Distributions from net realized gain on investments | | | — | | | | (0.07 | ) | | | (0.07 | ) | | | — | |
| | | | | | | | | | | | | | | | |
Total distributions | | | (0.21 | ) | | | (0.16 | ) | | | (0.14 | ) | | | — | |
| | | | | | | | | | | | | | | | |
Net increase (decrease) in net asset value | | | 0.45 | | | | (0.01 | ) | | | 0.83 | | | | 1.15 | |
| | | | | | | | | | | | | | | | |
Net Asset Value, End of Period | | $ | 12.42 | | | $ | 11.97 | | | $ | 11.98 | | | $ | 11.15 | |
| | | | | | | | | | | | | | | | |
Total Return (d) | | | 5.56 | % | | | 1.22 | % | | | 8.74 | % | | | 11.50 | %(e) |
| | | | |
Ratios/Supplemental Data: | | | | | | | | | | | | | | | | |
Net Assets, End of Period (in 000’s) | | $ | 253,343 | | | $ | 189,999 | | | $ | 19,723 | | | $ | 1,845 | |
Ratios of expenses to average net assets: | | | | | | | | | | | | | | | | |
Before reimbursement, waiver and/or recoupment of expenses by Adviser (f) | | | 1.16 | %(h)(i) | | | 1.28 | % | | | 2.32 | % | | | 18.16 | %(g) |
After reimbursement, waiver and/or recoupment of expenses by Adviser (f) | | | 1.20 | %(h)(i) | | | 1.20 | % | | | 1.24 | %(j) | | | 1.35 | %(g) |
Ratios of net investment income (loss) to average net assets: | | | | | | | | | | | | | | | | |
Before reimbursement, waiver and/or recoupment of expenses by Adviser | | | 0.61 | %(h) | | | 0.08 | % | | | (0.41 | )% | | | (16.92 | )%(g) |
After reimbursement, waiver and/or recoupment of expenses by Adviser | | | 0.57 | %(h) | | | 0.15 | % | | | 0.67 | % | | | (0.11 | )%(g) |
Portfolio Turnover | | | 45.60 | % | | | 79.77 | % | | | 116.68 | % | | | 65.93 | %(e) |
| | (a) | Lake Partners LASSO Alternatives Fund began issuing Class I shares on March 31, 2009. |
| | (b) | The selected per share data was calculated using the weighted average shares outstanding method for the period. |
| | (c) | Represents less than $(0.005) per share. |
| | (d) | The total return is calculated using the Net Asset Values used for trading at the close of business at period end. |
| | (f) | Does not include expenses of the underlying funds in which the Fund invests. |
| | (h) | Ratios of expenses and net investment income to average net assets include advisory fee waiver of less than 0.005% for the year ended October 31, 2012. |
| | (i) | Ratios of expenses to average net assets include Earnings Credits of less than 0.005% for the year ended October 31, 2012, which is not included in the contractual expense limitation. See Note I in the Notes to Financial Statements. |
| | (j) | Effective March 30, 2010, the contractual expense limitation was decreased from 1.35% to 1.20% excluding interest, taxes, other investment-related costs (such as brokerage commissions), extraordinary expenses and acquired fund fees and expenses. |
See accompanying Notes to Financial Statements.
| | |
| |
| ASTON Dynamic Allocation Fund – Class N | | October 31, 2012 |
| |
| Financial Highlights | | |
| | | | | | | | | | | | | | | | | | | | |
| | | Year
Ended
10/31/12 | | | Year
Ended
10/31/11 | | | Year
Ended
10/31/10 | | | Year
Ended
10/31/09 | | | Period
Ended
10/31/08(a) | |
| | | | | | | | | | | | | | | | | | | | |
Net Asset Value, Beginning of Period | | $ | 9.54 | | | $ | 9.25 | | | $ | 9.17 | | | $ | 8.24 | | | $ | 10.00 | |
| | | | | | | | | | | | | | | | | | | | |
Income from Investment Operations: | | | | | | | | | | | | | | | | | | | | |
Net investment income (loss) | | | 0.05 | (b) | | | (0.03 | )(b) | | | 0.05 | | | | 0.06 | | | | 0.07 | |
Net realized and unrealized income (loss)
on investments | | | (0.17 | ) | | | 0.66 | | | | 0.66 | | | | 0.99 | (c) | | | (1.76 | ) |
| | | | | | | | | | | | | | | | | | | | |
Total from investment operations | | | (0.12 | ) | | | 0.63 | | | | 0.71 | | | | 1.05 | | | | (1.69 | ) |
| | | | | | | | | | | | | | | | | | | | |
Less Distributions: | | | | | | | | | | | | | | | | | | | | |
Distributions from and in excess of net
investment income | | | (0.02 | ) | | | (0.03 | ) | | | (0.05 | ) | | | (0.12 | ) | | | (0.07 | ) |
Distributions from net realized gains
on investments | | | (0.89 | ) | | | (0.31 | ) | | | (0.58 | ) | | | — | | | | — | |
| | | | | | | | | | | | | | | | | | | | |
Total distributions | | | (0.91 | ) | | | (0.34 | ) | | | (0.63 | ) | | | (0.12 | ) | | | (0.07 | ) |
| | | | | | | | | | | | | | | | | | | | |
Net increase (decrease) in net asset value | | | (1.03 | ) | | | 0.29 | | | | 0.08 | | | | 0.93 | | | | (1.76 | ) |
| | | | | | | | | | | | | | | | | | | | |
Net Asset Value, End of Period | | $ | 8.51 | | | $ | 9.54 | | | $ | 9.25 | | | $ | 9.17 | | | $ | 8.24 | |
| | | | | | | | | | | | | | | | | | | | |
Total Return (d) | | | (1.17 | )% | | | 6.86 | % | | | 7.92 | % | | | 12.98 | % | | | (16.98 | )%(e) |
| | | | | |
Ratios/Supplemental Data: | | | | | | | | | | | | | | | | | | | | |
Net Assets, End of Period (in 000’s) | | $ | 23,736 | | | $ | 44,847 | | | $ | 54,234 | | | $ | 39,191 | | | $ | 6,070 | |
Ratios of expenses to average net assets: | | | | | | | | | | | | | | | | | | | | |
Before reimbursement and/or waiver of
expenses by Adviser (f) | | | 1.55 | % | | | 1.58 | % | | | 1.45 | %(h) | | | 1.69 | % | | | 5.11 | %(g)(h) |
After reimbursement and/or waiver of
expenses by Adviser (f) | | | 1.30 | % | | | 1.30 | % | | | 1.30 | %(h) | | | 1.30 | % | | | 1.31 | %(g)(h) |
Ratios of net investment income (loss)
to average net assets: | | | | | | | | | | | | | | | | | | | | |
Before reimbursement and/or waiver of
expenses by Adviser | | | 0.28 | % | | | (0.63 | )% | | | 0.38 | % | | | 0.39 | % | | | (2.48 | )%(g) |
After reimbursement and/or waiver of
expenses by Adviser | | | 0.53 | % | | | (0.35 | )% | | | 0.53 | % | | | 0.78 | % | | | 1.32 | %(g) |
Portfolio Turnover | | | 445.24 | % | | | 387.35 | % | | | 519.43 | % | | | 365.93 | % | | | 498.68 | %(e) |
| | (a) | Dynamic Allocation Fund began issuing Class N shares on January 9, 2008. |
| | (b) | The selected per share data was calculated using the weighted average shares outstanding method for the period. |
| | (c) | Includes payments by affiliates of less than $0.005 per share. |
| | (d) | The total return is calculated using the Net Asset Values used for trading at the close of business at period end. |
| | (f) | Does not include expenses of the underlying funds in which the Fund invests. |
| | (h) | Ratios of expenses to average net assets include interest expenses of less than 0.005% for the year ended October 31, 2010 and 0.01% for the period ended October 31, 2008, which are not included in the contractual expense limitation. The interest expenses are from utilizing the line of credit as discussed in Note H to Financial Statements. |
See accompanying Notes to Financial Statements.
| | |
| |
| ASTON Dynamic Allocation Fund – Class I | | October 31, 2012 |
| |
| Financial Highlights | | |
| | | | | | | | |
| | | Year
Ended
10/31/12 | | | Period
Ended
10/31/11(a) | |
Net Asset Value, Beginning of Period | | $ | 9.55 | | | $ | 9.28 | |
| | | | | | | | |
Income from Investment Operations: | | | | | | | | |
Net investment income (loss) | | | 0.07 | (b) | | | (0.01 | )(b) |
Net realized and unrealized gain (loss) on investments | | | (0.18 | ) | | | 0.64 | |
| | | | | | | | |
Total from investment operations | | | (0.11 | ) | | | 0.63 | |
| | | | | | | | |
Less Distributions: | | | | | | | | |
Distributions from and in excess of net investment income | | | (0.02 | ) | | | (0.05 | ) |
Distributions from net realized gains on investments | | | (0.89 | ) | | | (0.31 | ) |
| | | | | | | | |
Total distributions | | | (0.91 | ) | | | (0.36 | ) |
| | | | | | | | |
Net increase (decrease) in net asset value | | | (1.02 | ) | | | 0.27 | |
| | | | | | | | |
Net Asset Value, End of Period | | $ | 8.53 | | | $ | 9.55 | |
| | | | | | | | |
Total Return (c) | | | (1.01 | )% | | | 6.89 | (d) |
| | |
Ratios/Supplemental Data: | | | | | | | | |
Net Assets, End of Period (in 000’s) | | $ | 5,777 | | | $ | 4,393 | |
Ratios of expenses to average net assets: | | | | | | | | |
Before reimbursement and/or waiver of expenses by Adviser (e) | | | 1.30 | % | | | 1.33 | %(f) |
After reimbursement and/or waiver of expenses by Adviser (e) | | | 1.05 | % | | | 1.05 | %(f) |
Ratios of net investment income (loss) to average net assets: | | | | | | | | |
Before reimbursement and/or waiver of expenses by Adviser | | | 0.53 | % | | | (0.38 | )%(f) |
After reimbursement and/or waiver of expenses by Adviser | | | 0.78 | % | | | (0.10 | )%(f) |
Portfolio Turnover | | | 445.24 | % | | | 387.35 | % |
| | (a) | Dynamic Allocation Fund began issuing Class I shares on November 1, 2010. |
| | (b) | The selected per share data was calculated using the weighted average shares outstanding method for the period. |
| | (c) | The total return is calculated using the Net Asset Values used for trading at the close of business at period end. |
| | (e) | Does not include expenses of the underlying funds in which the Fund invests. |
See accompanying Notes to Financial Statements.
| | |
| |
| ASTON/Anchor Capital Enhanced Equity Fund – Class N (formerly the ASTON/M.D. Sass Enhanced Equity Fund) | | October 31, 2012 |
| |
| Financial Highlights | | |
| | | | | | | | | | | | | | | | | | | | |
| | | Year
Ended
10/31/12 | | | Year
Ended
10/31/11 | | | Year
Ended
10/31/10 | | | Year
Ended
10/31/09 | | | Period
Ended
10/31/08(a) | |
| | | | | | | | | | | | | | | | | | | | |
Net Asset Value, Beginning of Period | | $ | 9.61 | | | $ | 9.41 | | | $ | 8.57 | | | $ | 8.09 | | | $ | 10.00 | |
| | | | | | | | | | | | | | | | | | | | |
Income from Investment Operations: | | | | | | | | | | | | | | | | | | | | |
Net investment income | | | 0.16 | | | | 0.14 | | | | 0.10 | | | | 0.11 | | | | 0.14 | |
Net realized and unrealized gain (loss)
on investments | | | 0.11 | | | | 0.56 | | | | 0.84 | | | | 1.02 | | | | (1.91 | ) |
| | | | | | | | | | | | | | | | | | | | |
Total from investment operations | | | 0.27 | | | | 0.70 | | | | 0.94 | | | | 1.13 | | | | (1.77 | ) |
| | | | | | | | | | | | | | | | | | | | |
Less Distributions: | | | | | | | | | | | | | | | | | | | | |
Distributions from and in excess of net
investment income | | | (0.16 | ) | | | (0.13 | ) | | | (0.10 | ) | | | (0.13 | ) | | | (0.14 | ) |
Distributions from net realized gain
on investments | | | (1.04 | ) | | | (0.37 | ) | | | — | | | | (0.52 | ) | | | — | |
| | | | | | | | | | | | | | | | | | | | |
Total distributions | | | (1.20 | ) | | | (0.50 | ) | | | (0.10 | ) | | | (0.65 | ) | | | (0.14 | ) |
| | | | | | | | | | | | | | | | | | | | |
Net increase (decrease) in net asset value | | | (0.93 | ) | | | 0.20 | | | | 0.84 | | | | 0.48 | | | | (1.91 | ) |
| | | | | | | | | | | | | | | | | | | | |
Net Asset Value, End of Period | | $ | 8.68 | | | $ | 9.61 | | | $ | 9.41 | | | $ | 8.57 | | | $ | 8.09 | |
| | | | | | | | | | | | | | | | | | | | |
Total Return (b) | | | 3.12 | % | | | 7.69 | % | | | 11.05 | % | | | 15.86 | % | | | (17.91 | )%(c) |
| | | | | |
Ratios/Supplemental Data: | | | | | | | | | | | | | | | | | | | | |
Net Assets, End of Period (in 000’s) | | $ | 106,191 | | | $ | 48,365 | | | $ | 46,423 | | | $ | 22,552 | | | $ | 14,389 | |
Ratios of expenses to average net assets: | | | | | | | | | | | | | | | | | | | | |
Before reimbursement, waiver, earnings credit and/or recoupment of expenses by Adviser | | | 1.22 | %(e)(f) | | | 1.24 | %(e) | | | 1.37 | % | | | 2.11 | % | | | 2.38 | %(d) |
After reimbursement, waiver, earnings credit and/or
recoupment of expenses by Adviser | | | 1.27 | %(e)(f) | | | 1.33 | %(e) | | | 1.40 | % | | | 1.25 | %(g) | | | 1.10 | %(d) |
Ratios of net investment income to average net assets: | | | | | | | | | | | | | | | | | | | | |
Before reimbursement, waiver, earnings credit and/or recoupment of expenses by Adviser | | | 1.82 | % | | | 1.51 | % | | | 1.20 | % | | | 0.55 | % | | | 0.86 | %(d) |
After reimbursement, waiver, earnings credit and/or
recoupment of expenses by Adviser | | | 1.78 | % | | | 1.41 | % | | | 1.17 | % | | | 1.41 | % | | | 2.14 | %(d) |
Portfolio Turnover | | | 56.33 | % | | | 87.37 | % | | | 41.33 | % | | | 51.56 | % | | | 23.68 | %(c) |
| | (a) | Anchor Capital Enhanced Equity Fund began issuing Class N shares on January 14, 2008. |
| | (b) | The total return is calculated using the Net Asset Values used for trading at the close of business at period end. |
| | (e) | Ratios of expenses to average net assets include interest expenses of less than 0.005% for each of the years ended October 31, 2012 and October 31, 2011, which are not included in the contractual expense limitation. The interest expenses are from utilizing the line of credit as discussed in Note H to Financial Statements. |
| | (f) | Ratios of expenses to average net assets include Earnings Credits of less than 0.005% for the year ended October 31, 2012, which is not included in the contractual expense limitation. See Note I in the Notes to Financial Statements. |
| | (g) | Effective June 1, 2009, due to the change in Subadviser, the contractual expense limitation was increased from 1.10% to 1.40% excluding interest, taxes, other investment-related costs (such as brokerage commissions), extraordinary expenses and acquired fund fee’s and expenses. |
See accompanying Notes to Financial Statements.
| | |
| |
| ASTON/Anchor Capital Enhanced Equity Fund – Class I (formerly the ASTON/M.D. Sass Enhanced Equity Fund) | | October 31, 2012 |
| |
| Financial Highlights | | |
| | | | | | | | | | | | |
| | | Year
Ended
10/31/12 | | | Year
Ended
10/31/11 | | | Period
Ended
10/31/10(a) | |
Net Asset Value, Beginning of Period | | $ | 9.62 | | | $ | 9.41 | | | $ | 9.04 | |
| | | | | | | | | | | | |
Income from Investment Operations: | | | | | | | | | | | | |
Net investment income | | | 0.18 | | | | 0.16 | | | | 0.09 | |
Net realized and unrealized gain on investments | | | 0.11 | | | | 0.57 | | | | 0.37 | |
| | | | | | | | | | | | |
Total from investment operations | | | 0.29 | | | | 0.73 | | | | 0.46 | |
| | | | | | | | | | | | |
Less Distributions: | | | | | | | | | | | | |
Distributions from and in excess of net investment income | | | (0.18 | ) | | | (0.15 | ) | | | (0.09 | ) |
Distributions from net realized gain on investments | | | (1.04 | ) | | | (0.37 | ) | | | — | |
| | | | | | | | | | | | |
Total distributions | | | (1.22 | ) | | | (0.52 | ) | | | (0.09 | ) |
| | | | | | | | | | | | |
Net increase (decrease) in net asset value | | | (0.93 | ) | | | 0.21 | | | | 0.37 | |
| | | | | | | | | | | | |
Net Asset Value, End of Period | | $ | 8.69 | | | $ | 9.62 | | | $ | 9.41 | |
| | | | | | | | | | | | |
Total Return (b) | | | 3.46 | % | | | 7.97 | % | | | 5.10 | %(c) |
| | | |
Ratios/Supplemental Data: | | | | | | | | | | | | |
Net Assets, End of Period (in 000’s) | | $ | 71,618 | | | $ | 64,840 | | | $ | 46,140 | |
Ratios of expenses to average net assets: | | | | | | | | | | | | |
Before reimbursement, waiver, earnings credit and/or recoupment of expenses by Adviser | | | 0.97 | %(e)(f) | | | 0.99 | %(e) | | | 1.10 | %(d) |
After reimbursement, waiver, earnings credit and/or recoupment of expenses by Adviser | | | 1.02 | %(e)(f) | | | 1.08 | %(e) | | | 1.15 | %(d) |
Ratios of net investment income to average net assets: | | | | | | | | | | | | |
Before reimbursement, waiver, earnings credit and/or recoupment of expenses by Adviser | | | 2.07 | % | | | 1.76 | % | | | 1.37 | %(d) |
After reimbursement, waiver, earnings credit and/or recoupment of expenses by Adviser | | | 2.03 | % | | | 1.66 | % | | | 1.32 | %(d) |
Portfolio Turnover | | | 56.33 | % | | | 87.37 | % | | | 41.33 | % |
| | (a) | Anchor Capital Enhanced Equity Fund began issuing Class I shares on March 2, 2010. |
| | (b) | The total return is calculated using the Net Asset Values used for trading at the close of business at period end. |
| | (e) | Ratios of expenses to average net assets include interest expenses of less than 0.005% for each of the years ended October 31, 2012 and October 31, 2011, which are not included in the contractual expense limitation. The interest expenses are from utilizing the line of credit as discussed in Note H to Financial Statements. |
| | (f) | Ratios of expenses to average net assets include Earnings Credits of less than 0.005% for the year ended October 31, 2012, which is not included in the contractual expense limitation. See Note I in the Notes to Financial Statements. |
See accompanying Notes to Financial Statements.
| | |
| |
| ASTON/River Road Long-Short Fund – Class N | | October 31, 2012 |
| |
| Financial Highlights | | |
| | | | | | | | |
| | | Year
Ended
10/31/12 | | | Period
Ended
10/31/11(a) | |
Net Asset Value, Beginning of Period | | $ | 9.91 | | | $ | 10.00 | |
| | | | | | | | |
Income from Investment Operations: | | | | | | | | |
Net investment loss | | | (0.18 | ) | | | (0.04 | )(b) |
Net realized and unrealized gain (loss) on investments | | | 1.00 | | | | (0.05 | ) |
| | | | | | | | |
Total from investment operations | | | 0.82 | | | | (0.09 | ) |
| | | | | | | | |
Net increase (decrease) in net asset value | | | 0.82 | | | | (0.09 | ) |
| | | | | | | | |
Net Asset Value, End of Period | | $ | 10.73 | | | $ | 9.91 | |
| | | | | | | | |
Total Return (c) | | | 8.17 | % | | | (0.80 | )%(d) |
| | |
Ratios/Supplemental Data: | | | | | | | | |
Net Assets, End of Period (in 000’s) | | $ | 7,506 | | | $ | 4,594 | |
Ratios of expenses to average net assets: | | | | | | | | |
Before reimbursement and/or waiver of expenses by Adviser including interest and
dividend expense for securities sold short | | | 5.03 | % | | | 8.68 | %(e) |
After reimbursement and/or waiver of expenses by Adviser including interest and
dividend expense for securities sold short | | | 3.11 | % | | | 2.72 | %(e) |
After reimbursement and/or waiver of expenses by Adviser excluding interest and
dividend expense for securities sold short | | | 1.70 | % | | | 1.70 | %(e) |
Ratios of net investment loss to average net assets: | | | | | | | | |
Before reimbursement and/or waiver of expenses by Adviser | | | (3.63 | )% | | | (6.80 | )%(e) |
After reimbursement and/or waiver of expenses by Adviser | | | (1.71 | )% | | | (0.84 | )%(e) |
Portfolio Turnover | | | 277.72 | % | | | 127.32 | %(d) |
| | (a) | River Road Long-Short Fund began issuing Class N shares on May 3, 2011. |
| | (b) | The selected per share data was calculated using the weighted average shares outstanding method for the period. |
| | (c) | The total return is calculated using the Net Asset Values used for trading at the close of business at period end. |
See accompanying Notes to Financial Statements.
| | |
| |
| ASTON/Barings International Fund – Class N | | October 31, 2012 |
| |
| Financial Highlights | | |
| | | | | | | | | | | | |
| | | Year
Ended
10/31/12 | | | Year
Ended
10/31/11 | | | Period
Ended
10/31/10(a) | |
Net Asset Value, Beginning of Period | | $ | 6.81 | | | $ | 7.24 | | | $ | 6.48 | |
| | | | | | | | | | | | |
Income from Investment Operations: | | | | | | | | | | | | |
Net investment income | | | 0.10 | (b) | | | 0.07 | (b) | | | 0.06 | (b) |
Net realized and unrealized gain (loss) on investments | | | 0.17 | | | | (0.37 | ) | | | 0.70 | |
| | | | | | | | | | | | |
Total from investment operations | | | 0.27 | | | | (0.30 | ) | | | 0.76 | |
| | | | | | | | | | | | |
Less Distributions: | | | | | | | | | | | | |
Distributions from and in excess of net investment income | | | (0.04 | ) | | | (0.13 | ) | | | — | |
Distributions from net realized gain on investments | | | (0.17 | ) | | | — | | | | — | |
| | | | | | | | | | | | |
Total distributions | | | (0.21 | ) | | | (0.13 | ) | | | — | |
| | | | | | | | | | | | |
Net increase (decrease) in net asset value | | | 0.06 | | | | (0.43 | ) | | | 0.76 | |
| | | | | | | | | | | | |
Net Asset Value, End of Period | | $ | 6.87 | | | $ | 6.81 | | | $ | 7.24 | |
| | | | | | | | | | | | |
Total Return (c) | | | 4.28 | % | | | (4.22 | )% | | | 11.73 | %(d) |
| | | |
Ratios/Supplemental Data: | | | | | | | | | | | | |
Net Assets, End of Period (in 000’s) | | $ | 421 | | | $ | 393 | | | $ | 184 | |
Ratios of expenses to average net assets: | | | | | | | | | | | | |
Before reimbursement and/or waiver of expenses by Adviser | | | 1.60 | % | | | 1.68 | %(f) | | | 1.72 | %(e) |
After reimbursement and/or waiver of expenses by Adviser | | | 1.40 | % | | | 1.40 | %(f) | | | 1.40 | %(e) |
Ratios of net investment income to average net assets: | | | | | | | | | | | | |
Before reimbursement and/or waiver of expenses by Adviser | | | 1.30 | % | | | 0.76 | %(f) | | | 1.07 | %(e) |
After reimbursement and/or waiver of expenses by Adviser | | | 1.50 | % | | | 1.04 | %(f) | | | 1.39 | %(e) |
Portfolio Turnover | | | 33.48 | % | | | 58.96 | % | | | 65.32 | % |
| | (a) | Barings International Fund began issuing Class N shares on March 2, 2010. |
| | (b) | The selected per share data was calculated using the weighted average shares outstanding method for the period. |
| | (c) | The total return is calculated using the Net Asset Values used for trading at the close of business at period end. |
| | (f) | For the period November 1, 2010 through February 28, 2011, the Adviser voluntarily waived management fees and/or reimbursed expenses at 1.40%. Effective March 1, 2011, the contractual expense limitation was decreased from 1.50% to 1.40% excluding interest, taxes, other investment-related costs (such as brokerage commissions), extraordinary expenses and acquired fund fees and expenses. |
See accompanying Notes to Financial Statements.
| | |
| |
| ASTON/Barings International Fund – Class I | | October 31, 2012 |
| |
| Financial Highlights | | |
| | | | | | | | | | | | | | | | | | | | |
| | | Year
Ended
10/31/12 | | | Year
Ended
10/31/11 | | | Year
Ended
10/31/10 | | | Year
Ended
10/31/09 | | | Period
Ended
10/31/08(a) | |
| | | | | | | | | | | | | | | | | | | | |
Net Asset Value, Beginning of Period | | $ | 6.82 | | | $ | 7.26 | | | $ | 6.44 | | | $ | 5.08 | | | $ | 10.00 | |
| | | | | | | | | | | | | | | | | | | | |
Income from Investment Operations: | | | | | | | | | | | | | | | | | | | | |
Net investment income | | | 0.12 | (b) | | | 0.09 | (b) | | | 0.06 | (b) | | | 0.10 | (b) | | | 0.10 | |
Net realized and unrealized gain (loss)
on investments | | | 0.18 | | | | (0.38 | ) | | | 0.78 | | | | 1.27 | (c) | | | (5.02 | ) |
| | | | | | | | | | | | | | | | | | | | |
Total from investment operations | | | 0.30 | | | | (0.29 | ) | | | 0.84 | | | | 1.37 | | | | (4.92 | ) |
| | | | | | | | | | | | | | | | | | | | |
Less Distributions: | | | | | | | | | | | | | | | | | | | | |
Distributions from and in excess of net
investment income | | | (0.06 | ) | | | (0.15 | ) | | | (0.02 | ) | | | (0.01 | ) | | | — | |
Distributions from net realized gain
on investments | | | (0.17 | ) | | | — | | | | — | | | | — | | | | — | |
| | | | | | | | | | | | | | | | | | | | |
Total distributions | | | (0.23 | ) | | | (0.15 | ) | | | (0.02 | ) | | | (0.01 | ) | | | — | |
| | | | | | | | | | | | | | | | | | | | |
Net increase (decrease) in net asset value | | | 0.07 | | | | (0.44 | ) | | | 0.82 | | | | 1.36 | | | | (4.92 | ) |
| | | | | | | | | | | | | | | | | | | | |
Net Asset Value, End of Period | | $ | 6.89 | | | $ | 6.82 | | | $ | 7.26 | | | $ | 6.44 | | | $ | 5.08 | |
| | | | | | | | | | | | | | | | | | | | |
Total Return (d) | | | 4.72 | % | | | (4.09 | )% | | | 12.89 | % | | | 27.11 | % | | | (49.20 | )%(e) |
| | | | | |
Ratios/Supplemental Data: | | | | | | | | | | | | | | | | | | | | |
Net Assets, End of Period (in 000’s) | | $ | 61,662 | | | $ | 52,390 | | | $ | 47,985 | | | $ | 28,277 | | | $ | 5,517 | |
Ratios of expenses to average net assets: | | | | | | | | | | | | | | | | | | | | |
Before reimbursement and/or waiver of
expenses by Adviser | | | 1.35 | % | | | 1.43 | %(g) | | | 1.47 | % | | | 2.01 | % | | | 3.95 | %(f)(h) |
After reimbursement and/or waiver of
expenses by Adviser | | | 1.15 | % | | | 1.15 | %(g) | | | 1.15 | % | | | 1.15 | % | | | 1.18 | %(f)(h) |
Ratios of net investment income (loss)
to average net assets: | | | | | | | | | | | | | | | | | | | | |
Before reimbursement and/or waiver of
expenses by Adviser | | | 1.55 | % | | | 1.01 | % | | | 0.63 | % | | | 0.80 | % | | | (1.11 | )%(f) |
After reimbursement and/or waiver of
expenses by Adviser | | | 1.75 | % | | | 1.29 | % | | | 0.95 | % | | | 1.66 | % | | | 1.66 | %(f) |
Portfolio Turnover | | | 33.48 | % | | | 58.96 | % | | | 65.32 | % | | | 115.51 | % | | | 121.99 | %(e) |
| | (a) | Barings International Fund began issuing Class I shares on November 1, 2007. |
| | (b) | The selected per share data was calculated using the weighted average shares outstanding method for the period. |
| | (c) | Includes payments by affiliates of less than $0.005 per share. |
| | (d) | The total return is calculated using the Net Asset Values used for trading at the close of business at period end. |
| | (g) | For the period November 1, 2010 through February 28, 2011, the Adviser voluntarily waived management fees and/or reimbursed expenses at 1.15%. Effective March 1, 2011, the contractual expense limitation was decreased from 1.25% to 1.15% excluding interest, taxes, other investment-related costs (such as brokerage commissions), extraordinary expenses and acquired fund fees and expenses. |
| | (h) | Ratios of expenses to average net assets include interest expense of less than 0.01% for the period ended October 31, 2008, which is not included in the contractual or voluntary expense limitations. The interest expense is from utilizing the line of credit as discussed in Note H to Financial Statements. |
See accompanying Notes to Financial Statements.
| | |
| |
| ASTON/Harrison Street Real Estate Fund – Class N | | October 31, 2012 |
| |
| Financial Highlights | | |
| | | | | | | | | | | | | | | | | | | | |
| | | Year
Ended
10/31/12 | | | Year
Ended
10/31/11 | | | Year
Ended
10/31/10 | | | Year
Ended
10/31/09 | | | Year
Ended
10/31/08 | |
| | | | | | | | | | | | | | | | | | | | |
Net Asset Value, Beginning of Period | | $ | 8.97 | | | $ | 8.16 | | | $ | 5.77 | | | $ | 6.08 | | | $ | 15.59 | |
| | | | | | | | | | | | | | | | | | | | |
Income from Investment Operations: | | | | | | | | | | | | | | | | | | | | |
Net investment income | | | 0.15 | (a) | | | 0.15 | (a) | | | 0.14 | (a) | | | 0.15 | (a) | | | 0.07 | (a) |
Net realized and unrealized gain (loss)
on investments | | | 1.44 | | | | 0.79 | | | | 2.36 | | | | (0.28 | ) | | | (5.50 | ) |
| | | | | | | | | | | | | | | | | | | | |
Total from investment operations | | | 1.59 | | | | 0.94 | | | | 2.50 | | | | (0.13 | ) | | | (5.43 | ) |
| | | | | | | | | | | | | | | | | | | | |
Less Distributions: | | | | | | | | | | | | | | | | | | | | |
Distributions from and in excess of net
investment income | | | (0.07 | ) | | | (0.13 | ) | | | (0.11 | ) | | | (0.18 | ) | | | (0.09 | ) |
Distributions from net realized gain
on investments | | | — | | | | — | | | | — | | | | — | | | | (3.99 | ) |
| | | | | | | | | | | | | | | | | | | | |
Total distributions | | | (0.07 | ) | | | (0.13 | ) | | | (0.11 | ) | | | (0.18 | ) | | | (4.08 | ) |
| | | | | | | | | | | | | | | | | | | | |
Net increase (decrease) in net asset value . | | | 1.52 | | | | 0.81 | | | | 2.39 | | | | (0.31 | ) | | | (9.51 | ) |
| | | | | | | | | | | | | | | | | | | | |
Net Asset Value, End of Period | | $ | 10.49 | | | $ | 8.97 | | | $ | 8.16 | | | $ | 5.77 | | | $ | 6.08 | |
| | | | | | | | | | | | | | | | | | | | |
Total Return (b) | | | 17.85 | % | | | 11.66 | % | | | 43.77 | % | | | (1.44 | )% | | | (43.76 | )% |
| | | | | |
Ratios/Supplemental Data: | | | | | | | | | | | | | | | | | | | | |
Net Assets, End of Period (in 000’s) | | $ | 10,381 | | | $ | 6,287 | | | $ | 6,158 | | | $ | 4,011 | | | $ | 6,030 | |
Ratios of expenses to average net assets: | | | | | | | | | | | | | | | | | | | | |
Before reimbursement and/or waiver of
expenses by Adviser | | | 2.36 | % | | | 1.61 | %(c) | | | 1.68 | %(c) | | | 1.94 | % | | | 1.57 | %(c) |
After reimbursement and/or waiver of
expenses by Adviser | | | 1.37 | % | | | 1.29 | %(c) | | | 1.37 | %(c) | | | 1.37 | % | | | 1.37 | %(c) |
Ratios of net investment income to average
net assets: | | | | | | | | | | | | | | | | | | | | |
Before reimbursement and/or waiver of
expenses by Adviser | | | 0.53 | % | | | 1.36 | % | | | 1.65 | % | | | 2.55 | % | | | 0.49 | % |
After reimbursement and/or waiver of
expenses by Adviser | | | 1.52 | % | | | 1.68 | % | | | 1.96 | % | | | 3.12 | % | | | 0.69 | % |
Portfolio Turnover | | | 86.62 | %(d) | | | 143.86 | % | | | 75.30 | % | | | 139.76 | % | | | 85.08 | % |
| | (a) | The selected per share data was calculated using the weighted average shares outstanding method for the period. |
| | (b) | The total return is calculated using the Net Asset Values used for trading at the close of business at period end. |
| | (c) | Ratios of expenses to average net assets include interest expenses of less than 0.005% for each of the years ended October 31, 2011, October 31, 2010 and October 31, 2008, which are not included in the contractual expense limitation. The interest expenses are from utilizing the line of credit as discussed in Note H to Financial Statements. |
| | (d) | Portfolio turnover rate excludes securities delivered from processing a redemption-in-kind. |
See accompanying Notes to Financial Statements.
| | |
| |
| ASTON/Harrison Street Real Estate Fund – Class I | | October 31, 2012 |
| |
| Financial Highlights | | |
| | | | | | | | | | | | | | | | | | | | |
| | | Year
Ended
10/31/12 | | | Year
Ended
10/31/11 | | | Year
Ended
10/31/10 | | | Year
Ended
10/31/09 | | | Year
Ended
10/31/08 | |
| | | | | | | | | | | | | | | | | | | | |
Net Asset Value, Beginning of Period | | $ | 8.92 | | | $ | 8.12 | | | $ | 5.74 | | | $ | 6.08 | | | $ | 15.62 | |
| | | | | | | | | | | | | | | | | | | | |
Income from Investment Operations: | | | | | | | | | | | | | | | | | | | | |
Net investment income | | | 0.15 | (a) | | | 0.16 | (a) | | | 0.16 | (a) | | | 0.16 | (a) | | | 0.09 | (a) |
Net realized and unrealized gain (loss)
on investments | | | 1.46 | | | | 0.79 | | | | 2.34 | | | | (0.28 | ) | | | (5.51 | ) |
| | | | | | | | | | | | | | | | | | | | |
Total from investment operations | | | 1.61 | | | | 0.95 | | | | 2.50 | | | | (0.12 | ) | | | (5.42 | ) |
| | | | | | | | | | | | | | | | | | | | |
Less Distributions: | | | | | | | | | | | | | | | | | | | | |
Distributions from and in excess of net
investment income | | | (0.09 | ) | | | (0.15 | ) | | | (0.12 | ) | | | (0.22 | ) | | | (0.13 | ) |
Distributions from net realized gain
on investments | | | — | | | | — | | | | — | | | | — | | | | (3.99 | ) |
| | | | | | | | | | | | | | | | | | | | |
Total distributions | | | (0.09 | ) | | | (0.15 | ) | | | (0.12 | ) | | | (0.22 | ) | | | (4.12 | ) |
| | | | | | | | | | | | | | | | | | | | |
Net increase (decrease) in net asset value . | | | 1.52 | | | | 0.80 | | | | 2.38 | | | | (0.34 | ) | | | (9.54 | ) |
| | | | | | | | | | | | | | | | | | | | |
Net Asset Value, End of Period | | $ | 10.44 | | | $ | 8.92 | | | $ | 8.12 | | | $ | 5.74 | | | $ | 6.08 | |
| | | | | | | | | | | | | | | | | | | | |
Total Return (b) | | | 18.16 | % | | | 11.82 | % | | | 44.14 | % | | | (1.27 | )% | | | (43.58 | )% |
| | | | | |
Ratios/Supplemental Data: | | | | | | | | | | | | | | | | | | | | |
Net Assets, End of Period (in 000’s) | | $ | 166 | | | $ | 32,925 | | | $ | 29,425 | | | $ | 21,905 | | | $ | 23,411 | |
Ratios of expenses to average net assets: | | | | | | | | | | | | | | | | | | | | |
Before reimbursement and/or waiver of
expenses by Adviser | | | 2.11 | % | | | 1.44 | %(c) | | | 1.43 | %(c) | | | 1.69 | % | | | 1.32 | %(c) |
After reimbursement and/or waiver of
expenses by Adviser | | | 1.12 | % | | | 1.12 | %(c) | | | 1.12 | %(c) | | | 1.12 | % | | | 1.12 | %(c) |
Ratios of net investment income to average net assets: | | | | | | | | | | | | | | | | | | | | |
Before reimbursement and/or waiver of
expenses by Adviser | | | 0.78 | % | | | 1.53 | % | | | 1.90 | % | | | 2.80 | % | | | 0.74 | % |
After reimbursement and/or waiver of
expenses by Adviser | | | 1.77 | % | | | 1.85 | % | | | 2.21 | % | | | 3.37 | % | | | 0.94 | % |
Portfolio Turnover | | | 86.62 | %(d) | | | 143.86 | % | | | 75.30 | % | | | 139.76 | % | | | 85.08 | % |
| | (a) | The selected per share data was calculated using the weighted average shares outstanding method for the period. |
| | (b) | The total return is calculated using the Net Asset Values used for trading at the close of business at period end. |
| | (c) | Ratios of expenses to average net assets include interest expenses of less than 0.005% for each of the years ended October 31, 2011, October 31, 2010 and October 31, 2008, which are not included in the contractual expense limitation. The interest expenses are from utilizing the line of credit as discussed in Note H to Financial Statements. |
| | (d) | Portfolio turnover rate excludes securities delivered from processing a redemption-in-kind. |
See accompanying Notes to Financial Statements.
| | |
| |
| ASTON/Montag & Caldwell Balanced Fund – Class N | | October 31, 2012 |
| |
| Financial Highlights | | |
| | | | | | | | | | | | | | | | | | | | |
| | | Year
Ended
10/31/12 | | | Year
Ended
10/31/11 | | | Year
Ended
10/31/10 | | | Year
Ended
10/31/09 | | | Year
Ended
10/31/08 | |
| | | | | | | | | | | | | | | | | | | | |
Net Asset Value, Beginning of Period | | $ | 20.09 | | | $ | 19.13 | | | $ | 17.73 | | | $ | 15.61 | | | $ | 19.98 | |
| | | | | | | | | | | | | | | | | | | | |
Income from Investment Operations: | | | | | | | | | | | | | | | | | | | | |
Net investment income | | | 0.16 | (a) | | | 0.15 | (a) | | | 0.21 | (a) | | | 0.21 | (a) | | | 0.29 | |
Net realized and unrealized gain (loss)
on investments | | | 1.45 | | | | 1.03 | | | | 1.47 | | | | 2.15 | | | | (4.42 | ) |
| | | | | | | | | | | | | | | | | | | | |
Total from investment operations | | | 1.61 | | | | 1.18 | | | | 1.68 | | | | 2.36 | | | | (4.13 | ) |
| | | | | | | | | | | | | | | | | | | | |
Less Distributions: | | | | | | | | | | | | | | | | | | | | |
Distributions from and in excess of net
investment income | | | (0.24 | ) | | | (0.22 | ) | | | (0.28 | ) | | | (0.24 | ) | | | (0.24 | ) |
| | | | | | | | | | | | | | | | | | | | |
Total distributions | | | (0.24 | ) | | | (0.22 | ) | | | (0.28 | ) | | | (0.24 | ) | | | (0.24 | ) |
| | | | | | | | | | | | | | | | | | | | |
Net increase (decrease) in net asset value. | | | 1.37 | | | | 0.96 | | | | 1.40 | | | | 2.12 | | | | (4.37 | ) |
| | | | | | | | | | | | | | | | | | | | |
Net Asset Value, End of Period | | $ | 21.46 | | | $ | 20.09 | | | $ | 19.13 | | | $ | 17.73 | | | $ | 15.61 | |
| | | | | | | | | | | | | | | | | | | | |
Total Return (b) | | | 8.03 | % | | | 6.20 | % | | | 9.54 | % | | | 15.32 | % | | | (20.87 | )% |
| | | | | |
Ratios/Supplemental Data: | | | | | | | | | | | | | | | | | | | | |
Net Assets, End of Period (in 000’s) | | $ | 31,536 | | | $ | 23,315 | | | $ | 29,194 | | | $ | 14,938 | | | $ | 16,586 | |
Ratios of expenses to average net assets: | | | | | | | | | | | | | | | | | | | | |
Before reimbursement and/or waiver of
expenses by Adviser | | | 1.42 | % | | | 1.57 | %(c) | | | 1.38 | % | | | 1.73 | % | | | 1.74 | % |
After reimbursement and/or waiver of
expenses by Adviser | | | 1.22 | % | | | 1.35 | %(c) | | | 1.13 | % | | | 1.26 | % | | | 1.35 | % |
Ratios of net investment income to average net assets: | | | | | | | | | | | | | | | | | | | | |
Before reimbursement and/or waiver of
expenses by Adviser | | | 0.57 | % | | | 0.53 | % | | | 0.89 | % | | | 0.81 | % | | | 0.74 | % |
After reimbursement and/or waiver of
expenses by Adviser | | | 0.77 | % | | | 0.76 | % | | | 1.15 | % | | | 1.28 | % | | | 1.13 | % |
Portfolio Turnover | | | 35.48 | % | | | 40.31 | % | | | 51.68 | %(d) | | | 38.72 | % | | | 43.65 | % |
| (a) | The selected per share data was calculated using the weighed average shares outstanding method for the period. |
| (b) | The total return is calculated using the Net Asset Values used for trading at the close of business at period end. |
| (c) | Ratios of expenses to average net assets include interest expenses of less than 0.005% for the year ended October 31, 2011, which is not included in the voluntary expense limitation. The interest expenses are from utilizing the line of credit as discussed in Note H to Financial Statements. |
| (d) | Portfolio turnover rate excludes securities received from a reorganization. |
See accompanying Notes to Financial Statements.
| | |
| |
| ASTON/Montag & Caldwell Balanced Fund – Class I | | October 31, 2012 |
| |
| Financial Highlights | | |
| | | | | | | | | | | | | | | | | | | | |
| | | Year
Ended
10/31/12 | | | Year
Ended
10/31/11 | | | Year
Ended
10/31/10 | | | Year
Ended
10/31/09 | | | Year
Ended
10/31/08 | |
| | | | | | | | | | | | | | | | | | | | |
Net Asset Value, Beginning of Period | | $ | 20.05 | | | $ | 19.08 | | | $ | 17.68 | | | $ | 15.57 | | | $ | 19.94 | |
| | | | | | | | | | | | | | | | | | | | |
Income from Investment Operations: | | | | | | | | | | | | | | | | | | | | |
Net investment income | | | 0.19 | (a) | | | 0.20 | (a) | | | 0.22 | (a) | | | 0.23 | (a) | | | 0.27 | |
Net realized and unrealized gain (loss)
on investments | | | 1.44 | | | | 1.04 | | | | 1.46 | | | | 2.16 | | | | (4.35 | ) |
| | | | | | | | | | | | | | | | | | | | |
Total from investment operations | | | 1.63 | | | | 1.24 | | | | 1.68 | | | | 2.39 | | | | (4.08 | ) |
| | | | | | | | | | | | | | | | | | | | |
Less Distributions: | | | | | | | | | | | | | | | | | | | | |
Distributions from and in excess of net
investment income | | | (0.27 | ) | | | (0.27 | ) | | | (0.28 | ) | | | (0.28 | ) | | | (0.29 | ) |
| | | | | | | | | | | | | | | | | | | | |
Total distributions | | | (0.27 | ) | | | (0.27 | ) | | | (0.28 | ) | | | (0.28 | ) | | | (0.29 | ) |
| | | | | | | | | | | | | | | | | | | | |
Net increase (decrease) in net asset value . | | | 1.36 | | | | 0.97 | | | | 1.40 | | | | 2.11 | | | | (4.37 | ) |
| | | | | | | | | | | | | | | | | | | | |
Net Asset Value, End of Period | | $ | 21.41 | | | $ | 20.05 | | | $ | 19.08 | | | $ | 17.68 | | | $ | 15.57 | |
| | | | | | | | | | | | | | | | | | | | |
Total Return (b) | | | 8.14 | % | | | 6.52 | % | | | 9.57 | % | | | 15.53 | % | | | (20.71 | )% |
| | | | | |
Ratios/Supplemental Data: | | | | | | | | | | | | | | | | | | | | |
Net Assets, End of Period (in 000’s) | | $ | 1,930 | | | $ | 1,415 | | | $ | 1,362 | | | $ | 1,149 | | | $ | 919 | |
Ratios of expenses to average net assets: | | | | | | | | | | | | | | | | | | | | |
Before reimbursement and/or waiver of
expenses by Adviser | | | 1.30 | % | | | 1.32 | %(c) | | | 1.35 | % | | | 1.57 | % | | | 1.49 | % |
After reimbursement and/or waiver of
expenses by Adviser | | | 1.10 | % | | | 1.10 | %(c) | | | 1.10 | % | | | 1.10 | % | | | 1.10 | % |
Ratios of net investment income to average net assets: | | | | | | | | | | | | | | | | | | | | |
Before reimbursement and/or waiver of
expenses by Adviser | | | 0.69 | % | | | 0.79 | % | | | 0.92 | % | | | 0.97 | % | | | 0.99 | % |
After reimbursement and/or waiver of
expenses by Adviser | | | 0.89 | % | | | 1.02 | % | | | 1.17 | % | | | 1.44 | % | | | 1.38 | % |
Portfolio Turnover | | | 35.48 | % | | | 40.31 | % | | | 51.68 | %(d) | | | 38.72 | % | | | 43.65 | % |
| (a) | The selected per share data was calculated using the weighted average shares outstanding method for the period. |
| (b) | The total return is calculated using the Net Asset Values used for trading at the close of business at period end. |
| (c) | Ratios of expenses to average net assets include interest expenses of less than 0.01% for the year ended October 31, 2011, which is not included in the voluntary expense limitation. The interest expenses are from utilizing the line of credit as discussed in Note H to Financial Statements. |
| (d) | Portfolio turnover rate includes securities received from a reorganization. |
See accompanying Notes to Financial Statements.
| | |
| |
| | October 31, 2012 |
| |
| Notes to Financial Statements | | |
Note (A) Fund Organization: Aston Funds (the “Trust”) was organized as a Delaware statutory trust under a Declaration of Trust dated September 10, 1993. The Trust is registered under the Investment Company Act of 1940, as amended (the “1940 Act”) as an open-end management investment company with 25 separate portfolios (each a “Fund” and collectively the “Funds”) as of October 31, 2012.
Aston Asset Management, LP (“Aston” or the “Adviser”), the investment adviser and the administrator, manages each Fund by retaining one or more subadvisers (each, a “Subadviser”) to manage each Fund. The following 25 portfolios of the Trust are included in these financial statements:
|
| ASTON/Montag & Caldwell Growth Fund (the “M&C Growth Fund”) |
| ASTON/Veredus Select Growth Fund (the “Veredus Select Growth Fund”) |
ASTON/TAMRO Diversified Equity Fund (the “TAMRO Diversified Equity Fund”) |
ASTON/Herndon Large Cap Value Fund
(the “Herndon Large Cap Value Fund”) |
ASTON/Cornerstone Large Cap Value Fund
(the “Cornerstone Large Cap Value Fund”) |
ASTON/River Road Dividend All Cap Value Fund
(the “River Road Dividend All Cap Value Fund”) |
ASTON/River Road Dividend All Cap Value Fund II
(the “River Road Dividend All Cap Value Fund II”) |
| ASTON/Fairpointe Mid Cap Fund (the “Fairpointe Mid Cap Fund”) |
ASTON/Montag & Caldwell Mid Cap Growth Fund
(the “M&C Mid Cap Growth Fund”) |
| ASTON/Veredus Small Cap Growth Fund, formerly the ASTON/Veredus Aggressive Growth Fund (the “Veredus Small Cap Growth Fund”) |
| ASTON Small Cap Growth Fund, formerly the ASTON/Crosswind Small Cap Growth Fund (the “Small Cap Growth Fund”) |
| ASTON/Silvercrest Small Cap Fund (the “Silvercrest Small Cap Fund”) |
| ASTON/TAMRO Small Cap Fund (the “TAMRO Small Cap Fund”) |
ASTON/River Road Select Value Fund
(the “River Road Select Value Fund”) |
ASTON/River Road Small Cap Value Fund
(the “River Road Small Cap Value Fund”) |
ASTON/River Road Independent Value Fund
(the “River Road Independent Value Fund”) |
ASTON/DoubleLine Core Plus Fixed Income Fund
(the “DoubleLine Core Plus Fixed Income Fund”) |
| ASTON/TCH Fixed Income Fund (the “TCH Fixed Income Fund”) |
ASTON/Lake Partners LASSO Alternatives Fund
(the “Lake Partners LASSO Alternatives Fund”) |
| ASTON Dynamic Allocation Fund (the “Dynamic Allocation Fund”) |
| ASTON/Anchor Capital Enhanced Equity Fund, formerly the ASTON/M.D. Sass Enhanced Equity Fund (the “Anchor Capital Enhanced Equity Fund”) |
| ASTON/River Road Long-Short Fund (the “River Road Long-Short Fund”) |
| ASTON/Barings International Fund (the “Barings International Fund”) |
|
ASTON/Harrison Street Real Estate Fund (the “Harrison Street Real Estate Fund”) |
| ASTON/Montag & Caldwell Balanced Fund (the “M&C Balanced Fund”) |
M&C Growth Fund is authorized to issue three classes of shares (Class N Shares, Class I Shares and Class R Shares). The following funds are each authorized to issue two classes of shares (Class N Shares and Class I Shares): Veredus Select Growth Fund, TAMRO Diversified Equity Fund, Herndon Large Cap Value Fund, Cornerstone Large Cap Value Fund, River Road Dividend All Cap Value Fund, River Road Dividend All Cap Value Fund II, Fairpointe Mid Cap Fund, Veredus Small Cap Growth Fund, Small Cap Growth Fund, Silvercrest Small Cap Fund, TAMRO Small Cap Fund, River Road Select Value Fund, River Road Small Cap Value Fund, River Road Independent Value Fund, DoubleLine Core Plus Fixed Income Fund, TCH Fixed Income Fund, Lake Partners LASSO Alternatives Fund, Dynamic Allocation Fund, Anchor Capital Enhanced Equity Fund, Barings International Fund, Harrison Street Real Estate Fund and M&C Balanced Fund. The following Funds are each authorized to issue one class of shares (Class N Shares): M&C Mid Cap Growth Fund and River Road Long-Short Fund. Each class of shares is substantially the same except that certain classes of shares bear class specific expenses, which include distribution fees. TAMRO Small Cap Fund and River Road Dividend All Cap Value Fund are closed to new investors until further notice.
The investment objectives of the Funds are as follows:
| | |
M&C Growth Fund | | Long-term capital appreciation and, secondarily, current income, by investing primarily in common stocks and convertible securities. |
Veredus Select
Growth Fund | | Capital appreciation. |
TAMRO Diversified Equity Fund | | Long-term capital appreciation. |
Herndon Large
Cap Value Fund | | Long-term capital appreciation. |
Cornerstone Large
Cap Value Fund | | Total return through long-term capital appreciation and current income. |
River Road Dividend All Cap Value Fund | | High current income and, secondarily, long-term capital appreciation. |
River Road Dividend All Cap Value Fund II | | Long-term capital appreciation and high current income. |
Fairpointe Mid
Cap Fund | | Long-term total return through capital apprecia- tion by investing primarily in common and pre- ferred stocks and convertible securities. |
M&C Mid Cap
Growth Fund | | Long-term capital appreciation and secondarily, current income, by investing primarily in common stocks and convertible securities. |
Veredus Small Cap Growth Fund | | Capital appreciation. |
Small Cap Growth
Fund | | Long-term capital appreciation. |
| | |
| |
| | October 31, 2012 |
| |
| Notes to Financial Statements – continued | | |
| | |
Silvercrest Small Cap Fund | | Long-term capital appreciation. |
TAMRO Small Cap Fund | | Long-term capital appreciation. |
River Road Select Value Fund | | Long-term capital appreciation. |
River Road Small Cap Value Fund | | Long-term capital appreciation. |
River Road Independent Value Fund | | Long-term total return. |
DoubleLine Core Plus Fixed Income Fund | | Maximize total return. |
TCH Fixed Income Fund | | High current income consistent with prudent risk of capital. |
Lake Partners LASSO Alternatives Fund | | Long term total return with reduced correlation to the conventional stock and bond markets. |
Dynamic Allocation Fund | | Long-term capital appreciation. |
Anchor Capital Enhanced Equity Fund | | Total return through a combination of a high level of current income and capital appreciation. |
River Road Long- Short Fund | | Absolute return while minimizing volatility over a fund market cycle |
Barings International Fund | | Total return. |
Harrison Street Real Estate Fund | | Total return through a combination of growth and income. |
M&C Balanced Fund | | Long-term total return. |
Note (B) Significant Accounting Policies: The following is a summary of the significant accounting policies consistently followed by each Fund in the preparation of its financial statements. These policies are in conformity with U.S. generally accepted accounting principles (“U.S. GAAP”).
(1) Security Valuation: Equity securities, closed-end funds, exchange traded funds, index options traded on a national securities exchange, and over-the-counter securities listed on the NASDAQ National Market System are valued at the last sale price or the NASDAQ Official Closing Price (“NOCP”), if applicable. If no last sale price or NOCP, if applicable, is reported, the mean of the last bid and asked prices may be used. Fixed income securities, except short-term investments, are valued on the basis of mean prices provided by a pricing service when such prices are believed by the Adviser to reflect the current market value of such securities in accordance with guidelines adopted by the Board of Trustees. The pricing service provider may employ methodologies that utilize actual market transac- tions, broker-dealer supplied valuations, or other electronic data processing techniques. Such techniques generally consider such factors as security prices, yields, maturities, call features, ratings and developments relating to specific securities in arriving at valuations. If accurate market quotations are not available, securities are valued at fair value as determined by the Adviser
in accordance with guidelines adopted by the Board of Trustees. Short-term investments, that is, those with maturities of 60 days or less, are valued at amortized cost, which approximates fair value. Repurchase agreements are valued at cost. Investments in money market funds and other mutual funds are valued at the underlying fund’s net asset value (“NAV”) at the date of valuation. Foreign securities are valued at the last sales price on the primary exchange where the security is traded. Under the Fair Valuation Procedures adopted by the Board of Trustees, the Funds may utilize the services of an independent pricing service to determine fair value prices for foreign securities if certain market events occur.
Certain Funds invest in securities of other investment companies, including exchange traded funds (“ETFs”), open-end funds and closed-end funds. Open-end funds are investment companies that issue new shares continuously and redeem shares daily. Closed-end funds are investment companies that typically issue a fixed number of shares that trade on a securities exchange or over-the-counter. An ETF is an investment company that seeks to track the performance of an index by holding in its portfolio shares of all the companies, or a representative sample of the companies, that are components of a particular index. ETFs are traded on a securities exchange based on their market value. The risks of investment in other investment companies typically reflect the risks of the types of securities in which investment companies invest. Investments in ETFs and closed-end funds are subject to the additional risk that shares of the fund may trade at a premium or discount to their NAV per share. When a Fund invests in another investment company, shareholders of the Fund bear their proportionate share of the other investment company’s fees and expenses, including operating, registration, trustee, licensing and marketing, as well as their share of the Fund’s fees and expenses.
Fair Value Measurements - The inputs and valuation techniques used to measure fair value of the Funds’ net assets are summarized into three levels as described in the hierarchy below:
| | |
•Level 1 – | | unadjusted quoted prices in active markets for identical assets or liabilities |
•Level 2 – | | other significant observable inputs (including quoted prices for similar securities, interest rates, prepayment speeds, credit risk, etc.) |
•Level 3 – | | significant unobservable inputs (including the Funds’ own assumptions in determining the fair value of investments) |
| | |
| |
| | October 31, 2012 |
| |
| Notes to Financial Statements – continued | | |
The inputs or methodology used for valuing securities are not necessarily an indication of the risk associated with investing in those securities. Transfers in and out of the levels are recognized at the market value at the end of the period. The summary of each Fund’s investments that are measured at fair value by Level within the fair value hierarchy as of October 31, 2012 is as follows:
| | | | | | | | | | | | | | | | |
Funds | | Total
Value at
10/31/12 | | | Level 1
Quoted
Prices | | | Level 2
Significant
Observable
Inputs | | | Level 3
Significant
Unobservable
Inputs | |
| | | | | | | | | | | | | | | | |
| M&C Growth Fund | | | | | | | | | | | | | | | | |
| Assets | | | | | | | | | | | | | | | | |
Investments in Securities* | | $ | 4,323,166,924 | | | $ | 4,323,166,924 | | | $ | — | | | $ | — | |
| | | | | | | | | | | | | | | | |
| Veredus Select Growth Fund | | | | | | | | | | | | | | | | |
| Assets | | | | | | | | | | | | | | | | |
Investments in Securities* | | $ | 12,312,897 | | | $ | 12,312,897 | | | $ | — | | | $ | — | |
| | | | | | | | | | | | | | | | |
| TAMRO Diversified Equity Fund | | | | | | | | | | | | | | | | |
| Assets | | | | | | | | | | | | | | | | |
Investments in Securities* | | $ | 22,471,746 | | | $ | 22,471,746 | | | $ | — | | | $ | — | |
| | | | | | | | | | | | | | | | |
| Herndon Large Cap Value Fund | | | | | | | | | | | | | | | | |
| Assets | | | | | | | | | | | | | | | | |
Investments in Securities* | | $ | 55,717,532 | | | $ | 55,717,532 | | | $ | — | | | $ | — | |
| | | | | | | | | | | | | | | | |
| Cornerstone Large Cap Value Fund | | | | | | | | | | | | | | | | |
| Assets | | | | | | | | | | | | | | | | |
Investments in Securities* | | $ | 26,148,348 | | | $ | 26,148,348 | | | $ | — | | | $ | — | |
| | | | | | | | | | | | | | | | |
| River Road Dividend All Cap Value Fund | | | | | | | | | | | | | | | | |
| Assets | | | | | | | | | | | | | | | | |
Investments in Securities* | | $ | 922,557,397 | | | $ | 922,557,397 | | | $ | — | | | $ | — | |
| | | | | | | | | | | | | | | | |
| River Road Dividend All Cap Value Fund II | | | | | | | | | | | | | | | | |
| Assets | | | | | | | | | | | | | | | | |
Investments in Securities* | | $ | 10,294,315 | | | $ | 10,294,315 | | | $ | — | | | $ | — | |
| | | | | | | | | | | | | | | | |
| Fairpointe Mid Cap Fund | | | | | | | | | | | | | | | | |
| Assets | | | | | | | | | | | | | | | | |
Investments in Securities* | | $ | 3,020,741,041 | | | $ | 3,020,741,041 | | | $ | — | | | $ | — | |
| | | | | | | | | | | | | | | | |
| M&C Mid Cap Growth Fund | | | | | | | | | | | | | �� | | | |
| Assets | | | | | | | | | | | | | | | | |
Investments in Securities* | | $ | 7,390,080 | | | $ | 7,390,080 | | | $ | — | | | $ | — | |
| | | | | | | | | | | | | | | | |
| Veredus Small Cap Growth Fund | | | | | | | | | | | | | | | | |
| Assets | | | | | | | | | | | | | | | | |
Investment in Securities* | | $ | 24,652,246 | | | $ | 24,652,246 | | | $ | — | | | $ | — | |
| | | | | | | | | | | | | | | | |
| Small Cap Growth Fund | | | | | | | | | | | | | | | | |
| Assets | | | | | | | | | | | | | | | | |
Investment in Securities* | | $ | 6,619,173 | | | $ | 6,619,173 | | | $ | — | | | $ | — | |
| | | | | | | | | | | | | | | | |
| Silvercrest Small Cap Fund | | | | | | | | | | | | | | | | |
| Assets | | | | | | | | | | | | | | | | |
Investments in Securities* | | $ | 5,727,334 | | | $ | 5,727,334 | | | $ | — | | | $ | — | |
| | | | | | | | | | | | | | | | |
| TAMRO Small Cap Fund | | | | | | | | | | | | | | | | |
| Assets | | | | | | | | | | | | | | | | |
Common Stocks | | | | | | | | | | | | | | | | |
Consumer Discretionary | | $ | 207,590,101 | | | $ | 188,505,618 | | | $ | 19,084,483 | | | $ | — | |
Consumer Staples | | | 75,005,501 | | | | 75,005,501 | | | | — | | | | — | |
Energy | | | 69,410,875 | | | | 69,410,875 | | | | — | | | | — | |
Financials | | | 216,795,922 | | | | 216,795,922 | | | | — | | | | — | |
Healthcare | | | 127,823,974 | | | | 127,823,974 | | | | — | | | | — | |
Industrials | | | 183,737,861 | | | | 183,737,861 | | | | — | | | | — | |
Information Technology | | | 116,606,824 | | | | 116,606,824 | | | | — | | | | — | |
Utilities | | | 20,350,593 | | | | 20,350,593 | | | | — | | | | — | |
| | | | | | | | | | | | | | | | |
Total Common Stocks | | | 1,017,321,651 | | | | 998,237,168 | | | | 19,084,483 | | | | — | |
| | | | | | | | | | | | | | | | |
Investment Company* | | | 17,606,619 | | | | 17,606,619 | | | | — | | | | — | |
| | | | | | | | | | | | | | | | |
Total | | $ | 1,034,928,270 | | | $ | 1,015,843,787 | | | $ | 19,084,483 | | | $ | — | |
| | | | | | | | | | | | | | | | |
| River Road Select Value Fund | | | | | | | | | | | | | | | | |
| Assets | | | | | | | | | | | | | | | | |
Investments in Securities* | | $ | 163,494,292 | | | $ | 163,494,292 | | | $ | — | | | $ | — | |
| | | | | | | | | | | | | | | | |
| | |
| |
| | October 31, 2012 |
| |
| Notes to Financial Statements – continued | | |
| | | | | | | | | | | | | | | | |
Funds | | Total
Value at
10/31/12 | | | Level 1
Quoted
Prices | | | Level 2
Significant
Observable
Inputs | | | Level 3
Significant
Unobservable
Inputs | |
| | | | | | | | | | | | | | | | |
| River Road Small Cap Value Fund | | | | | | | | | | | | | | | | |
| Assets | | | | | | | | | | | | | | | | |
Common Stocks | | | | | | | | | | | | | | | | |
Consumer Discretionary | | $ | 67,143,208 | | | $ | 60,178,841 | | | $ | 6,964,367 | | | $ | — | |
Consumer Staples | | | 26,093,493 | | | | 26,093,493 | | | | — | | | | — | |
Energy | | | 15,060,021 | | | | 15,060,021 | | | | — | | | | — | |
Financials | | | 39,040,491 | | | | 39,040,491 | | | | — | | | | — | |
Healthcare | | | 31,349,757 | | | | 31,349,757 | | | | — | | | | — | |
Industrials | | | 49,479,216 | | | | 49,479,216 | | | | — | | | | — | |
Information Technology | | | 35,560,986 | | | | 35,560,986 | | | | — | | | | — | |
Materials | | | 3,896,015 | | | | 3,896,015 | | | | — | | | | — | |
Telecommunication Services | | | 2,625,638 | | | | 2,625,638 | | | | — | | | | — | |
Utilities | | | 2,263,143 | | | | 2,263,143 | | | | — | | | | — | |
| | | | | | | | | | | | | | | | |
Total Common Stocks | | | 272,511,968 | | | | 265,547,601 | | | | 6,964,367 | | | | — | |
| | | | | | | | | | | | | | | | |
Investment Company* | | | 16,823,092 | | | | 16,823,092 | | | | — | | | | — | |
| | | | | | | | | | | | | | | | |
Total | | $ | 289,335,060 | | | $ | 282,370,693 | | | $ | 6,964,367 | | | $ | — | |
| | | | | | | | | | | | | | | | |
| River Road Independent Value Fund | | | | | | | | | | | | | | | | |
| Assets | | | | | | | | | | | | | | | | |
Common Stocks | | | | | | | | | | | | | | | | |
Consumer Discretionary | | $ | 43,039,137 | | | $ | 43,039,137 | | | $ | — | | | $ | — | |
Consumer Staples | | | 34,231,684 | | | | 34,231,684 | | | | — | | | | — | |
Energy | | | 57,671,322 | | | | 57,671,322 | | | | — | | | | — | |
Financials | | | 19,624,862 | | | | 19,624,862 | | | | — | | | | — | |
Healthcare | | | 42,782,079 | | | | 42,782,079 | | | | — | | | | — | |
Industrials | | | 32,574,037 | | | | 32,574,037 | | | | — | | | | — | |
Information Technology | | | 72,965,203 | | | | 66,965,504 | | | | 5,999,699 | | | | — | |
Materials | | | 25,318,216 | | | | 25,318,216 | | | | — | | | | — | |
Utilities | | | 15,808,676 | | | | 10,018,716 | | | | 5,789,960 | | | | — | |
| | | | | | | | | | | | | | | | |
Total | | $ | 344,015,216 | | | $ | 332,225,557 | | | $ | 11,789,659 | | | $ | — | |
| | | | | | | | | | | | | | | | |
| DoubleLine Core Plus Fixed Income Fund | | | | | | | | | | | | | | | | |
| Assets | | | | | | | | | | | | | | | | |
U.S. Agency Collateralized Mortgage Obligations | | $ | 22,011,734 | | | $ | — | | | $ | 22,011,734 | | | $ | — | |
U.S. Government Obligations | | | 32,154,989 | | | | — | | | | 32,154,989 | | | | — | |
U.S. Government Mortgage-Backed Securities | | | 13,254,235 | | | | — | | | | 13,254,235 | | | | — | |
Corporate Notes and Bonds | | | 57,783,941 | | | | — | | | | 57,783,941 | | | | — | |
Collateralized Mortgage-Backed Securities | | | 39,301,483 | | | | — | | | | 39,301,483 | | | | — | |
Asset-Backed Securities | | | 1,705,540 | | | | — | | | | 1,705,540 | | | | — | |
Foreign Government Bond | | | 4,749,002 | | | | — | | | | 4,749,002 | | | | — | |
Investment Company* | | | 3,970,786 | | | | 3,970,786 | | | | — | | | | — | |
| | | | | | | | | | | | | | | | |
Total | | $ | 174,931,710 | | | $ | 3,970,786 | | | $ | 170,960,924 | | | $ | — | |
| | | | | | | | | | | | | | | | |
| TCH Fixed Income Fund | | | | | | | | | | | | | | | | |
| Assets | | | | | | | | | | | | | | | | |
Corporate Notes and Bonds | | $ | 45,354,984 | | | $ | — | | | $ | 45,354,984 | | | $ | — | |
U.S. Government and Agency Obligations | | | 19,634,170 | | | | — | | | | 19,634,170 | | | | — | |
Commercial Mortgage-Backed Securities | | | 600,649 | | | | — | | | | 600,649 | | | | — | |
Asset-Backed Securities | | | 1,878,188 | | | | — | | | | 1,878,188 | | | | — | |
Foreign Government Bond | | | 793,620 | | | | — | | | | 793,620 | | | | — | |
Investment Company* | | | 1,121,862 | | | | 1,121,862 | | | | — | | | | — | |
| | | | | | | | | | | | | | | | |
Total | | $ | 69,383,473 | | | $ | 1,121,862 | | | $ | 68,261,611 | | | $ | — | |
| | | | | | | | | | | | | | | | |
| Lake Partners LASSO Alternatives Fund | | | | | | | | | | | | | | | | |
| Assets | | | | | | | | | | | | | | | | |
Investments in Securities* | | $ | 273,862,784 | | | $ | 273,862,784 | | | $ | — | | | $ | — | |
| | | | | | | | | | | | | | | | |
| Dynamic Allocation Fund | | | | | | | | | | | | | | | | |
| Assets | | | | | | | | | | | | | | | | |
Investments in Securities* | | $ | 29,764,845 | | | $ | 29,764,845 | | | $ | — | | | $ | — | |
| | | | | | | | | | | | | | | | |
| | |
| |
| | October 31, 2012 |
| |
| Notes to Financial Statements – continued | | |
| | | | | | | | | | | | | | | | |
Funds | | Total
Value at
10/31/12 | | | Level 1
Quoted
Prices | | | Level 2
Significant
Observable
Inputs | | | Level 3
Significant
Unobservable
Inputs | |
| Anchor Capital Enhanced Equity Fund | | | | | | | | | | | | | | | | |
| Assets | | | | | | | | | | | | | | | | |
Common Stocks* | | $ | 178,432,465 | | | $ | 178,432,465 | | | $ | — | | | $ | — | |
Derivatives | | | | | | | | | | | | | | | | |
Equity Contracts | | | 1,484,700 | | | | 1,484,700 | | | | — | | | | — | |
| | | | | | | | | | | | | | | | |
Total Assets | | | 179,917,165 | | | | 179,917,165 | | | | — | | | | — | |
| | | | | | | | | | | | | | | | |
| Liabilities | | | | | | | | | | | | | | | | |
Derivatives | | | | | | | | | | | | | | | | |
Equity Contracts | | | (5,821,315 | ) | | | (5,821,315 | ) | | | — | | | | — | |
| | | | | | | | | | | | | | | | |
Total Liabilities | | | (5,821,315 | ) | | | (5,821,315 | ) | | | — | | | | — | |
| | | | | | | | | | | | | | | | |
Total | | $ | 174,095,850 | | | $ | 174,095,850 | | | $ | — | | | $ | — | |
| | | | | | | | | | | | | | | | |
| | | | | | | | | | | | | | | | |
| River Road Long-Short Fund | | | | | | | | | | | | | | | | |
| Assets | | | | | | | | | | | | | | | | |
Investments in Securities* | | $ | 7,611,084 | | | $ | 7,611,084 | | | $ | — | | | $ | — | |
| | | | | | | | | | | | | | | | |
Total Assets | | | 7,611,084 | | | | 7,611,084 | | | | — | | | | — | |
| | | | | | | | | | | | | | | | |
| Liabilities | | | | | | | | | | | | | | | | |
Short Sales* | | | (1,458,611 | ) | | | (1,458,611 | ) | | | — | | | | — | |
| | | | | | | | | | | | | | | | |
Total Liabilities | | | (1,458,611 | ) | | | (1,458,611 | ) | | | — | | | | — | |
| | | | | | | | | | | | | | | | |
Total | | $ | 6,152,473 | | | $ | 6,152,473 | | | $ | — | | | $ | — | |
| | | | | | | | | | | | | | | | |
| Barings International Fund | | | | | | | | | | | | | | | | |
| Assets | | | | | | | | | | | | | | | | |
Common Stocks | | | | | | | | | | | | | | | | |
Australia | | $ | 908,234 | | | $ | 908,234 | | | $ | — | | | $ | — | |
Belgium | | | 1,123,273 | | | | 1,123,273 | | | | — | | | | — | |
China | | | 788,988 | | | | 788,988 | | | | — | | | | — | |
Denmark | | | 825,594 | | | | 825,594 | | | | — | | | | — | |
France | | | 3,901,387 | | | | 3,901,387 | | | | — | | | | — | |
Germany | | | 5,112,525 | | | | 5,112,525 | | | | — | | | | — | |
Hong Kong | | | 626,512 | | | | 626,512 | | | | — | | | | — | |
India | | | 244,644 | | | | 244,644 | | | | — | | | | — | |
Israel | | | 1,764,703 | | | | 1,764,703 | | | | — | | | | — | |
Japan | | | 12,661,108 | | | | 12,661,108 | | | | — | | | | — | |
Mexico | | | 2,170,043 | | | | 2,170,043 | | | | — | | | | — | |
Netherlands | | | 2,109,381 | | | | 2,109,381 | | | | — | | | | — | |
Norway | | | 627,179 | | | | 627,179 | | | | — | | | | — | |
Papua New Guinea | | | 800,078 | | | | 800,078 | | | | — | | | | — | |
Russia | | | 676,022 | | | | 676,022 | | | | — | | | | — | |
Singapore | | | 1,903,724 | | | | 1,903,724 | | | | — | | | | — | |
South Korea | | | 2,152,706 | | | | 2,152,706 | | | | — | | | | — | |
Sweden | | | 1,797,898 | | | | 1,797,898 | | | | — | | | | — | |
Switzerland | | | 5,068,000 | | | | 5,068,000 | | | | — | | | | — | |
United Kingdom | | | 15,062,078 | | | | 15,055,029 | | | | — | | | | 7,049 | |
| | | | | | | | | | | | | | | | |
Total Common Stocks | | | 60,324,077 | | | | 60,317,028 | | | | — | | | | 7,049 | |
| | | | | | | | | | | | | | | | |
Investment Company* | | | 1,653,984 | | | | 1,653,984 | | | | — | | | | — | |
| | | | | | | | | | | | | | | | |
Total | | $ | 61,978,061 | | | $ | 61,971,012 | | | $ | — | | | $ | 7,049 | |
| | | | | | | | | | | | | | | | |
| Harrison Street Real Estate Fund | | | | | | | | | | | | | | | | |
| Assets | | | | | | | | | | | | | | | | |
Investments in Securities* | | $ | 10,640,915 | | | $ | 10,640,915 | | | $ | — | | | $ | — | |
| | | | | | | | | | | | | | | | |
| M&C Balanced Fund | | | | | | | | | | | | | | | | |
| Assets | | | | | | | | | | | | | | | | |
Common Stocks* | | $ | 18,302,592 | | | $ | 18,302,592 | | | $ | — | | | $ | — | |
Corporate Notes and Bonds | | | 7,759,409 | | | | — | | | | 7,759,409 | | | | — | |
U.S. Government and Agency Obligations | | | 5,127,104 | | | | — | | | | 5,127,104 | | | | — | |
Investment Company* | | | 2,139,288 | | | | 2,139,288 | | | | — | | | | — | |
| | | | | | | | | | | | | | | | |
Total | | $ | 33,328,393 | | | $ | 20,441,880 | | | $ | 12,886,513 | | | $ | — | |
| | | | | | | | | | | | | | | | |
| * | | All Common Stocks and Investment Companies are Level 1. Please refer to the Schedule of Investments for industry, sector or country breakout. |
| | |
| |
| | October 31, 2012 |
| |
| Notes to Financial Statements – continued | | |
At the end of each calendar quarter, management evaluates the Level 2 and 3 assets and liabilities for changes in liquidity, including but not limited to: whether a broker is willing to execute at the quoted price, the depth and consistency of prices from third party services, and the existence of contemporaneous, observable trades in the market. Additionally, management evaluates the Level 1 and 2 assets and liabilities on a quarterly basis for changes in listings or delistings on national exchanges. Due to the inherent uncertainty of determining the fair value of investments that do not have a readily available market value, the fair value of the Funds’ investments may fluctuate from period to period. Additionally, the fair value of investments may differ significantly from the values that would have been used had a ready market existed for such investments and may differ materially from the values the Funds may ultimately realize. Further, such investments may be subject to legal and other restrictions on resale or otherwise less liquid than publicly-traded securities.
Barings International Fund may utilize an external pricing service to fair value certain foreign securities if certain market events occur. Such fair valuations are categorized as Level 2 in the hierarchy. Certain market events were not deemed to have occurred at October 31, 2012, and therefore, the Barings International Fund did not utilize the external pricing service model adjustments. As a result, certain securities that were held in this Fund at October 31, 2012 and since the beginning of the year, were transferred from Level 2 to Level 1.
Certain securities that were held at October 31, 2012 and since the beginning of the year in the TAMRO Small Cap Fund, the River Road Small Cap Value Fund and the River Road Independent Value Fund had changes in liquidity assessments which resulted in a transfer between levels.
| | | | | | | | |
Funds | | Transfer from
Level 1 to Level 2 | | | Transfer from
Level 2 to Level 1 | |
| TAMRO Small Cap Fund | | $ | 19,084,483 | | | $ | — | |
| River Road Small Cap Value Fund | | | 1,471,594 | | | | 9,560,119 | |
| River Road Independent Value Fund | | | — | | | | 3,638,499 | |
| Barings International Fund | | | — | | | | 41,365,365 | |
Level 3 holdings were valued using internal valuation techniques which took into consideration factors including previous experience with similar securities of the same issuer, conversion ratio and security terms.
The following is a reconciliation of Level 3 holdings for which significant unobservable inputs were used in determining fair value as of October 31, 2012:
| | | | |
| Barings International Fund | | | Common Stocks | |
| | | | |
Fair Value, beginning of period | | $ | 9,447 | |
Purchases | | | 7,002 | |
Sales | | | (9,094 | ) |
Net realized gains | | | 3,219 | |
Change in unrealized appreciation (depreciation) | | | (3,525 | ) |
| | | | |
Fair Value, end of period | | $ | 7,049 | |
| | | | |
Change in net unrealized appreciation (depreciation)
on Level 3 holdings held at end of period | | $ | 47 | |
| | | | |
(2) Repurchase Agreements: Each Fund may enter into repurchase agreements with financial institutions deemed to be creditworthy by the Fund’s Adviser or Subadviser, subject to the seller’s agreement to repurchase and the Fund’s agreement to resell such securities at a mutually agreed upon price. Securities purchased subject to repurchase agreements are deposited with the Fund’s custodian and, pursuant to the terms of the repurchase agreement, must have an aggregate market value greater than or equal to the repurchase price plus accrued interest at all times. If the value of the underlying securities falls below the value of the repurchase price plus accrued interest, the Fund will require the seller to deposit additional collateral by the next business day. If the request for additional collateral is not met, or the seller defaults on its repurchase obligation, the Fund has the right to sell the underlying securities at market value and may claim any resulting loss against the seller. As of and during the year ended October 31, 2012, the Funds did not own any repurchase agreements.
(3) When Issued/Delayed Delivery Securities: Each Fund may purchase and sell securities on a “when issued” or “delayed delivery” basis, with settlement to occur at a later date. The value of the security so purchased is subject to market fluctuations during this period. The Funds segregate assets having an aggregate value at least equal to the amount of when issued or delayed delivery purchase commitments until payment is made. During the year ended October 31, 2012, the DoubleLine Core Plus Fixed Income Fund and the TCH Fixed Income Fund owned delayed delivery securities. At October 31, 2012, only the DoubleLine Core Plus Fixed Income Fund owned delayed delivery securities.
(4) Mortgage-Backed Securities: M&C Balanced Fund, DoubleLine Core Plus Fixed Income Fund and TCH Fixed Income Fund may invest in mortgage-backed securities (“MBS”), representing interests in pools of mortgage loans. These securities provide shareholders with payments consisting of both principal and interest as the mortgages in the underlying mortgage pools are paid. The timely payment of principal and interest on MBS issued or guaranteed by Ginnie Mae (formerly known as the Government National Mortgage Association) is backed by Ginnie Mae and the full faith and credit of the U.S. government. MBS issued by U.S. government agencies or instrumentalities other than Ginnie Mae are not “full faith and credit” obligations. Certain obligations, such as those issued by the Federal Home Loan Banks, Fannie Mae (formerly known as the Federal National Mortgage Association) and Freddie Mac (formerly known as the Federal Home Loan Mortgage Corporation) are supported only by the credit of the issuer. MBS issued by private issuers are not
| | |
| |
| | October 31, 2012 |
| |
| Notes to Financial Statements – continued | | |
government securities and are not directly guaranteed by any government agency. They are secured by the underlying collateral of the private issuer. Yields on privately issued MBS tend to be higher than those of government-backed issues. However, risk of loss due to default and sensitivity to interest rate fluctuations are also higher. M&C Balanced Fund, DoubleLine Core Plus Fixed Income Fund and TCH Fixed Income Fund may also invest in collateralized mortgage obligations (“CMOs”) and real estate mortgage investment conduits (“REMICs”). A CMO is a bond that is collateralized by a pool of MBS, and a REMIC is similar in form to a CMO. These MBS pools are divided into classes with each class having its own characteristics. The different classes are retired in sequence as the underlying mortgages are repaid.
(5) Securities Sold Short: The River Road Long-Short Fund utilizes short sales as part of its overall portfolio management strategy. A short sale involves the sale of a security that is borrowed from a broker or other institution. A gain, limited to the price at which the Fund sold the security short, or a loss, unlimited in size, will be recognized upon closing a short sale. Short sales expose the Fund to the risk that it will be required to acquire, convert or exchange securities to replace the borrowed securities at a time when the securities sold short have appreciated in value, thus resulting in a loss to the Fund. The Fund making a short sale must segregate liquid assets, or otherwise cover its position in a permissible manner. The liquidity of the assets is determined by the Subadviser, in accordance with procedures established by the Board of Trustees. Cash segregated for short sales is shown in the Statement of Assets and Liabilities as cash held as collateral. Security positions segregated for short sales are included in the total investments line item on the Statement of Assets and Liabilities.
(6) Options Contracts: In the normal course of pursuing its investment objectives, certain Funds are subject to price volatility risk. Certain Funds may write and/or purchase call and put options on securities for hedging purposes, to seek capital appreciation, to mitigate risk and/or to increase exposure. Writing put options or purchasing call options tends to increase a Fund’s exposure to the underlying instrument. Writing call options or purchasing put options tends to decrease a Fund’s exposure to the underlying instrument. When a Fund writes or purchases a call or put option, an amount equal to the premium received or paid by the Fund is included in a Fund’s Statement of Assets and Liabilities as a liability or an investment and subsequently adjusted to the current market value based on the quoted daily settlement price of the option written or purchased. Premiums received or paid from writing or purchasing options, which expire unexercised, are treated by a Fund on the expiration date as realized gains or losses. The difference between the premium and the amount paid or received on a closing purchase or sale transaction, including brokerage commissions, is also treated as a realized gain or loss. If an option is exercised, the premium paid or received is added to the cost of the purchase or proceeds from the sale in determining whether the Fund has realized a gain or loss on investment transactions. If the Fund writes a covered call option, the Fund forgoes, in exchange for the premium, the opportunity to profit during the option period
from an increase in the market value of the underlying security above the exercise price. If the Fund writes a put option, it accepts the risk of a decline in the market value of the underlying security below the exercise price. There is the risk a Fund may not be able to enter into a closing transaction because of an illiquid market. The risk associated with purchasing put and call options is limited to the premium paid. Options were traded during the period in the TAMRO Diversified Equity Fund and Anchor Capital Enhanced Equity Fund. At October 31, 2012, TAMRO Diversified Equity did not hold any open options contracts. See the Schedule of Investments for open options contracts held by Anchor Capital Enhanced Equity Fund at October 31, 2012. For the year ended October 31, 2012, the average* volume of derivative activities are as follows:
| | | | | | | | |
Funds | | Purchased
Options
(Cost) | | | Written
Options
(Premiums Received) | |
| TAMRO Diversified Equity Fund | | $ | 120,858 | | | $ | — | |
| Anchor Capital Enhanced Equity Fund | | | 1,722,579 | | | | 3,283,110 | |
| * | estimate based on quarter-end holdings |
(7) Forward Foreign Currency Contracts: In the normal course of pursuing their investment objectives, certain Funds are subject to foreign investment and currency risk. Certain Funds may enter into forward foreign currency contracts (“forward contracts”) for purposes of hedging, duration management, as a substitute for securities, to increase returns, for currency hedging or risk management, or to otherwise help achieve a Fund’s investment goal. These contracts are marked-to-market daily at the applicable translation rates. A Fund records realized gains or losses at the time the forward contract is closed. A forward contract is extinguished through a closing transaction or upon delivery of the currency or entering an offsetting contract. Risks may arise upon entering these contracts from the potential inability of a counterparty to meet the terms of their contracts and from unanticipated movements in the value of a foreign currency relative to the U.S. dollar or other currencies. During the year ended October 31, 2012, the Funds did not enter into any forward foreign currency contracts.
(8) Disclosures about Derivative Instruments: The following is a table summarizing the fair value of derivatives held at October 31, 2012, by primary risk exposure:
| | | | | | | | |
| | | Asset Derivative
Investments Value | | | Liability Derivative
Investments Value | |
Fund | | Equity
Contracts (a) | | | Equity
Contracts(a) | |
| | | | | | | | |
| Anchor Capital Enhanced Equity Fund | | $ | 1,484,700 | | | $ | (5,821,315 | ) |
| (a) | Statement of Assets and Liabilities location: Total investments at value for purchased options and call options written, at value for written options. |
| | |
| |
| | October 31, 2012 |
| |
| Notes to Financial Statements – continued | | |
The effect of derivative instruments on the Statement of Operations for the year ended October 31, 2012:
| | | | | | | | |
| | | Amount of
Realized Gain (Loss)
on Derivatives | | | Change in Unrealized
Appreciation
(Depreciation)
on Derivatives | |
Fund | | Equity
Contracts(a) | | | Equity
Contracts(b) | |
| TAMRO Diversified Equity Fund | | $ | (204,029 | ) | | $ | 149,516 | |
| Anchor Capital Enhanced Equity Fund | | | (3,441,738 | ) | | | (1,752,435 | ) |
| (a) | Statement of Operations location: Net realized gain (loss) on purchased options and net realized gain (loss) on written option transactions. |
| (b) | Statement of Operations location: Net change in unrealized appreciation (depreciation) on pur- chased options and net change in unrealized appreciation (depreciation) on written options transactions. |
(9) Investment Income and Securities Transactions: Dividend income is recorded on the ex-dividend date, except for certain dividends from foreign securities where the ex-dividend date may have passed, which are recorded as soon as a Fund is informed of the ex-dividend date. Interest income is accrued daily. Dividend income and interest income are recorded on the Statement of Operations as investment income. Premiums and discounts are amortized or accreted on an effective yield method on fixed income securities. The Funds may be subject to foreign taxes on income, gains on investments or currency repatriation, a portion of which may be recoverable. The Funds will accrue such taxes and reclaims as applicable, based upon their current interpretation of tax rules and regulations that exist in the markets in which the Funds invest. Securities are accounted for on a
trade date basis. The cost of securities sold is determined using the identified cost method for the Fairpointe Mid Cap Fund and first in first out (“FIFO”) method for all other Funds.
(10) Foreign Currency: Foreign currencies, investments and other assets and liabilities are translated into U.S. dollars at the exchange rates at the close of the regular trading session on the New York Stock Exchange. Fluctuations in the value of the foreign currencies and other assets and liabilities resulting from changes in exchange rates are recorded as unrealized foreign currency gains (losses). Realized gains (losses) and unrealized appreciation (depreciation) on investment securities and income and expenses are translated on the respective dates of such transactions. The effects of changes in foreign currency exchange rates on investments in securities are segregated on the Statement of Operations from the effects of changes on market prices of those securities, and are included with the net realized and change in unrealized gain or loss on investment securities.
(11) Federal Income Taxes: The Funds have elected to be treated as “regulated investment companies” under Subchapter M of the Internal Revenue Code of 1986, as amended, and to distribute substantially all of their respective net taxable income. Accordingly, no provisions for federal income taxes have been made in the accompanying financial statements. The Funds intend to utilize provisions of the federal income tax laws, which allow them to carry a realized capital loss forward for eight years following the year of the loss and offset such losses against any future realized capital gains.
At October 31, 2012, the following Funds had available realized capital loss carryforwards to offset future net capital gains through the fiscal year ended:
| | | | | | | | | | | | | | | | | | | | | | | | | | | | | | | | |
| | | Capital Loss Carryforwards: | |
Fund | | 2014 | | | 2016 | | | 2017 | | | 2018 | | | 2019 | | | No Expiration
Short Term* | | | No Expiration
Long Term* | | | Total | |
| | | | | | | | | | | | | | | | | | | | | | | | | | | | | | | | |
| M&C Growth Fund | | $ | — | | | $ | — | | | $ | 12,098,064 | ** | | $ | — | | | $ | — | | | $ | — | | | $ | — | | | $ | 12,098,064 | |
| Veredus Select Growth Fund | | | — | | | | — | | | | 17,856,176 | | | | — | | | | — | | | | — | | | | — | | | | 17,856,176 | |
| Cornerstone Large Cap Value Fund | | | — | | | | — | | | | 21,265,288 | | | | 6,819,813 | | | | — | | | | — | | | | — | | | | 28,085,101 | |
| Veredus Small Cap Growth Fund | | | — | | | | 2,506,635 | | | | 16,347,889 | | | | — | | | | — | | | | — | | | | — | | | | 18,854,524 | |
| TCH Fixed Income Fund | | | 2,331,750 | | | | 2,654,917 | | | | 1,270,780 | | | | — | | | | — | | | | — | | | | — | | | | 6,257,447 | |
| Lake Partners LASSO Alternatives Fund | | | — | | | | — | | | | — | | | | — | | | | 4,140,503 | | | | 729,638 | | | | — | | | | 4,870,141 | |
| Dynamic Allocation Fund | | | — | | | | — | | | | — | | | | — | | | | — | | | | 749,106 | | | | — | | | | 749,106 | |
| Harrison Street Real Estate Fund | | | — | | | | 1,949,371 | | | | 11,228,100 | | | | — | | | | — | | | | — | | | | — | | | | 13,177,471 | |
| M&C Balanced Fund | | | — | | | | — | | | | 1,726,376 | ** | | | — | | | | — | | | | — | | | | — | | | | 1,726,376 | |
| * | On December 22, 2010, the Regulated Investment Company Modernization Act of 2010 (the “Modernization Act”) was signed into law. Under the Modernization Act the Funds will be permitted to carry forward capital losses incurred for an unlimited period. However, any losses incurred during those future taxable years will be required to be utilized prior to the losses incurred in pre-enactment taxable years. As a result of this ordering rule, pre-enactment capital loss carryforwards may be more likely to expire unused. Additionally, post enactment capital losses that are carried forward will retain their character as either short-term or long-term capital losses rather than being considered all short term as under previous law. |
| ** | These capital loss carryforward amounts were acquired in the reorganizations of the Growth Fund into the M&C Growth Fund and the Balanced Fund into the M&C Balanced Fund on March 29, 2010. The Funds’ ability to utilize the capital loss carryforwards is limited under Internal Revenue Service regulations. |
| | |
| |
| | October 31, 2012 |
| |
| Notes to Financial Statements – continued | | |
For the year ended October 31, 2012, the following Funds utilized capital losses as follows:
| | | | | | | | | | | | | | | | | | | | |
| | | Utilized Capital Losses (with Expiration Year) | |
Fund | | 2014 | | | 2016 | | | 2017 | | | 2018 | | | 2019 | |
| | | | | | | | | | | | | | | | | | | | |
| M&C Growth Fund | | $ | — | | | $ | — | | | $ | 3,189,231 | | | $ | — | | | $ | — | |
| Veredus Select Growth Fund | | | — | | | | 1,093,781 | | | | 766,189 | | | | — | | | | — | |
| Cornerstone Large Cap Value Fund | | | — | | | | — | | | | 1,198,312 | | | | — | | | | — | |
| M&C Mid Cap Growth Fund | | | — | | | | — | | | | 327,840 | | | | — | | | | — | |
| Veredus Small Cap Growth Fund | | | — | | | | 1,721,390 | | | | — | | | | — | | | | — | |
| Small Cap Growth Fund | | | — | | | | — | | | | — | | | | — | | | | 59,470 | |
| River Road Small Cap Value Fund | | | — | | | | — | | | | 11,636,083 | | | | — | | | | — | |
| TCH Fixed Income Fund | | | 1,367,065 | | | | — | | | | — | | | | — | | | | — | |
| River Road Long-Short Fund | | | — | | | | — | | | | — | | | | — | | | | 100,223 | |
| Harrison Street Real Estate Fund | | | — | | | | 1,146,586 | | | | — | | | | — | | | | — | |
| M&C Balanced Fund | | | — | | | | 318,991 | | | | 1,000,496 | | | | — | | | | — | |
Under current laws, certain capital losses realized after October 31 may be deferred (and certain ordinary losses after January 1st may be deferred) and treated as occurring on the first day of the following fiscal year. For the fiscal year ended October 31, 2012, the Funds elected to defer the following losses incurred from January 1, 2012 through October 31, 2012:
| | | | | | | | | | | | |
| | | Long-Term
Realized
Capital Losses | | | Short-Term
Realized
Capital Losses | | | Ordinary
Losses | |
| | | | | | | | | | | | |
| M&C Mid Cap Growth Fund | | $ | — | | | $ | — | | | $ | 37,681 | |
| Veredus Small Cap Growth Fund | | | — | | | | — | | | | 167,640 | |
Management has analyzed the Funds’ tax positions for all open tax years (current and prior three tax years), as well as potential exposure to foreign capital gains withholding taxes, and has concluded that no provision for federal, state, or international income tax is required in the Funds’ financial statements. The Funds’ federal income and excise tax returns for tax years for which the applicable statutes of limitations have not expired are subject to examination by the Internal Revenue Service.
(12) Multi-Class Operations: Each class offered by a Fund that is authorized to offer multiple classes of shares has equal rights as to the Fund’s net assets.
Income, fund and trust level expenses and realized and unrealized capital gains and losses, if any, are allocated to each class of shares based on the relative net assets of each class. Class specific expenses (distribution expenses) are allocated to each class.
(13) Offering Costs: Certain costs were incurred in connection with the offering of the following Funds as disclosed in the table below. The costs associated have been capitalized and are being amortized on a straight-line basis over twelve months based on the commencement date of the Funds, stated below.
| | | | | | | | |
Fund | | Commencement Date | | | Original
Offering Costs | |
| River Road Independent Value Fund | | | December 30, 2010 | | | $ | 53,931 | |
| River Road Long-Short Fund | | | May 4, 2011 | | | | 70,782 | |
| DoubleLine Core Plus Fixed Income Fund | | | July 18, 2011 | | | | 246,370 | |
| Silvercrest Small Cap Fund | | | December 27, 2011 | | | | 63,821 | |
| River Road Dividend All Cap Value Fund II | | | June 27, 2012 | | | | 57,711 | |
(14) Use of Estimates: The preparation of financial statements in conformity with U.S. GAAP requires management to make estimates and assumptions that affect the reported amounts of assets and liabilities and disclosure of contingent assets and liabilities at the date of the financial statements and the reported amounts of revenues and expenses during the reporting period. Actual results could differ from those estimates.
(15) Commitments and Contingencies: In the normal course of business, the Trust enters into contracts on behalf of the Funds that contain a variety of provisions for general indemnifications. Each Fund’s maximum exposure under these arrangements is unknown, as this would involve future claims that may be made against each Fund that are not known at this time. However, based on experience, the Funds believe the risk of loss is remote.
(16) Recent Accounting Pronouncement: In December 2011, FASB issued ASU No. 2011-11, Disclosures about Offsetting Assets and Liabilities. ASU 2011-11 requires disclosures to make financial statements that are prepared under U.S. GAAP more comparable to those prepared under IFRS. The new disclosure requirements mandate that entities disclose both gross and net information about instruments and transactions eligible for offset in the Statement of Assets and Liabilities as well as instruments and transactions subject to an agreement similar to a master netting arrangement. In addition, ASU 2011-11 requires disclosure of collateral received and posted in connection with master netting agreements or similar arrangements. New disclosures are required for annual reporting periods beginning on or after January 1, 2013, and interim periods within those annual periods. Management is evaluating the impact of ASU 2011-11 on the financial statements and disclosures.
Note (C) Dividends from Net Investment Income and Distributions of Capital Gains: Dividends and distributions to shareholders are recorded on the ex-dividend date. River Road Dividend All Cap Value Fund, River Road Dividend All Cap Value Fund II, DoubleLine Core Plus Fixed Income Fund and TCH Fixed Income Fund distribute dividends from net investment income to shareholders monthly and net realized gains from investment transactions, if any, are generally distributed annually, usually in December.
| | |
| |
| | October 31, 2012 |
| |
| Notes to Financial Statements – continued | | |
Anchor Capital Enhanced Equity Fund and M&C Balanced Fund distribute dividends from net investment income to shareholders quarterly and net realized gains from investment transactions, if any, are generally distributed annually, usually in December.
The following Funds distribute dividends from net investment income to shareholders annually and net realized gains from investment transactions, if any, are generally distributed annually, usually in December: M&C Growth Fund, Veredus Select Growth Fund, TAMRO Diversified Equity Fund, Herndon Large Cap Value Fund, Cornerstone Large Cap Value Fund, Fairpointe Mid Cap Fund, M&C Mid Cap Growth Fund, Veredus Small Cap Growth Fund, Small Cap Growth Fund, Silvercrest Small Cap Fund, TAMRO Small Cap Fund, River Road Select Value Fund, River Road Small Cap Value Fund, River Road Independent Value Fund, Lake Partners LASSO Alternatives Fund, Dynamic Allocation Fund, River Road Long-Short Fund, Barings International Fund and Harrison Street Real Estate Fund.
Dividends and distributions are automatically reinvested in additional Fund shares on ex-date at that day’s ending NAV for the respective Fund for those shareholders who have elected the reinvestment option.
Differences in dividends per share between classes of the following Funds are due to different class expenses: M&C Growth Fund, Veredus Select Growth Fund, TAMRO Diversified Equity Fund, Herndon Large Cap Value Fund, Cornerstone Large Cap Value Fund, River Road Dividend All Cap Value Fund, River
Road Dividend All Cap Value Fund II, Fairpointe Mid Cap Fund, Veredus Small Cap Growth Fund, Small Cap Growth Fund, Silvercrest Small Cap Fund, TAMRO Small Cap Fund, River Road Select Value Fund, River Road Small Cap Value Fund, River Road Independent Value Fund, DoubleLine Core Plus Fixed Income Fund, TCH Fixed Income Fund, Lake Partners LASSO Alternatives Fund, Dynamic Allocation Fund, Anchor Capital Enhanced Equity Fund, Barings International Fund, Harrison Street Real Estate Fund and M&C Balanced Fund.
Net investment income and realized gains and losses for federal income tax purposes may differ from those reported on the financial statements because of temporary and permanent book and tax basis differences. Permanent differences, such as net operating losses, disallowed expenses, premium reversals, reclass of short-term gain to ordinary income, capitalized dividends on short sales, in-kind distribution for redemptions, paydown reclass, reversal of prior year writeoff of capital loss carryovers, redesignation of dividends paid, partnership reclasses and adjustment for Real Estate Investment Trusts, are reclassified among capital accounts in the financial statements to reflect their character. Temporary differences, such as deferrals on losses relating to wash sales transactions, amortization of offering costs, premium amortization, current year dividends payable, passive foreign investment company adjustments and capital loss carryovers, arise when income, expenses, gains or losses are recognized in different periods for financial statement and tax purposes; these differences will reverse at some time in the future.
Permanent differences between book and tax basis reporting for the 2012 fiscal year have been identified and appropriately reclassified as indicated below. These reclassifications have no impact on net assets.
| | | | | | | | | | | | |
| | | Accumulated
Undistributed Net
Investment Income | | | Accumulated Net
Realized Gain (Loss) | | | Paid in Capital | |
| | | | | | | | | | | | |
| | | | | | | | | | | | |
| Herndon Large Cap Value Fund | | $ | (38 | ) | | $ | 38 | | | $ | — | |
| Cornerstone Large Cap Value Fund | | | — | | | | (49,006 | ) | | | 49,006 | |
| River Road Dividend All Cap Value Fund | | | (25,898 | ) | | | 25,898 | | | | — | |
| River Road Dividend All Cap Value Fund II | | | 7,623 | | | | — | | | | (7,623 | ) |
| Fairpointe Mid Cap Fund | | | — | | | | (2,483,994 | ) | | | 2,483,994 | |
| M&C Mid Cap Growth Fund | | | 1,327 | | | | 70 | | | | (1,397 | ) |
| Veredus Small Cap Growth Fund | | | 98,008 | | | | (1,344,110 | ) | | | 1,246,102 | |
| Small Cap Growth Fund | | | 89,264 | | | | (201,624 | ) | | | 112,360 | |
| Silvercrest Small Cap Fund | | | 19,607 | | | | (211,647 | ) | | | 192,040 | |
| TAMRO Small Cap Fund | | | 4,509,026 | | | | (7,354,201 | ) | | | 2,845,175 | |
| River Road Select Value Fund | | | 5,979 | | | | (5,979 | ) | | | — | |
| River Road Small Cap Value Fund | | | 35,980 | | | | (607,449 | ) | | | 571,469 | |
| River Road Independent Value Fund | | | 4,000,446 | | | | (3,999,126 | ) | | | (1,320 | ) |
| DoubleLine Core Plus Fixed Income Fund | | | 2,922 | | | | 48,919 | | | | (51,841 | ) |
| TCH Fixed Income Fund | | | 200,833 | | | | (174,399 | ) | | | (26,434 | ) |
| Lake Partners LASSO Alternatives Fund | | | 3,028,378 | | | | (3,028,378 | ) | | | — | |
| Dynamic Allocation Fund | | | (6,083 | ) | | | 6,083 | | | | — | |
| River Road Long-Short Fund | | | 77,015 | | | | (77,015 | ) | | | — | |
| Barings International Fund | | | (30,003 | ) | | | 30,003 | | | | — | |
| Harrison Street Real Estate Fund | | | (149,507 | ) | | | 560,884 | | | | (411,377 | ) |
| M&C Balanced Fund | | | 63,937 | | | | (63,937 | ) | | | — | |
| | |
| |
| | October 31, 2012 |
| |
| Notes to Financial Statements – continued | | |
Distributions from net realized gains for book purposes may include short-term capital gains, which are classified as ordinary income for tax purposes.
The tax character of distributions paid during the fiscal years ended 2012 and 2011 was as follows:
| | | | | | | | | | | | | | | | |
| | | Distributions Paid in 2012 | | | Distributions Paid in 2011 | |
| | | Ordinary Income | | | Long-Term
Capital Gains | | | Ordinary Income | | | Long-Term
Capital Gains | |
| | | | | | | | | | | | | | | | |
| | | | | | | | | | | | | | | | |
| M&C Growth Fund | | $ | 22,081,432 | | | $ | 257,690,139 | | | $ | 20,834,824 | | | $ | 5,383,920 | |
| Veredus Select Growth Fund | | | 27,060 | | | | — | | | | — | | | | — | |
| TAMRO Diversified Equity Fund | | | — | | | | 473,355 | | | | — | | | | — | |
| Herndon Large Cap Value Fund | | | 1,044,862 | | | | 124,149 | | | | 13,657 | | | | — | |
| Cornerstone Large Cap Value Fund | | | 110,939 | | | | — | | | | 1,807,144 | | | | — | |
| River Road Dividend All Cap Value Fund | | | 22,890,654 | | | | 4,651,009 | | | | 10,476,590 | | | | 118,593 | |
| River Road Dividend All Cap Value Fund II | | | 42,004 | | | | — | | | | — | | | | — | |
| Fairpointe Mid Cap Fund | | | 8,163,228 | | | | 18,767,770 | | | | 6,035,391 | | | | 5,436,739 | |
| TAMRO Small Cap Fund | | | — | | | | 97,192,931 | | | | — | | | | 19,802,159 | |
| River Road Select Value Fund | | | 1,196,413 | | | | 28,132,801 | | | | 1,134,027 | | | | 1,959,747 | |
| River Road Small Cap Value Fund | | | — | | | | — | | | | 2,048,490 | | | | — | |
| River Road Independent Value Fund | | | 5,597,522 | | | | 100,643 | | | | — | | | | — | |
| DoubleLine Core Plus Fixed Income Fund | | | 3,389,167 | | | | — | | | | 190,808 | | | | — | |
| TCH Fixed Income Fund | | | 3,234,814 | | | | — | | | | 2,810,584 | | | | — | |
| Lake Partners LASSO Alternatives Fund | | | 3,680,936 | | | | — | | | | 454,894 | | | | 448 | |
| Dynamic Allocation Fund | | | 3,933,878 | | | | 797,701 | | | | 1,619,896 | | | | 272,869 | |
| Anchor Capital Enhanced Equity Fund | | | 12,244,228 | | | | 2,409,141 | | | | 5,872,771 | | | | — | |
| Barings International Fund | | | 509,770 | | | | 1,380,720 | | | | 1,019,611 | | | | — | |
| Harrison Street Real Estate Fund | | | 47,575 | | | | — | | | | 627,254 | | | | — | |
| M&C Balanced Fund | | | 331,475 | | | | — | | | | 312,292 | | | | — | |
As of October 31, 2012, the most recent tax year end, the components of distributable earnings on a tax basis were as follows:
| | | | | | | | | | | | | | | | | | | | |
| | | Accumulated
Capital and
Other Losses | | | Undistributed
Ordinary Income | | | Undistributed
Long-Term Gain | | | Unrealized
Appreciation
(Depreciation) | | | Total | |
| | | | | | | | | | | | | | | | | | | | |
| M&C Growth Fund | | $ | (12,098,064 | ) | | $ | 33,942,232 | | | $ | 275,099,058 | | | $ | 459,648,376 | | | $ | 756,591,602 | |
| Veredus Select Growth Fund | | | (17,856,176 | ) | | | 174,730 | | | | — | | | | 831,025 | | | | (16,850,421 | ) |
| TAMRO Diversified Equity Fund | | | — | | | | 830 | | | | 25,756 | | | | 4,240,679 | | | | 4,267,265 | |
| Herndon Large Cap Value Fund | | | — | | | | 1,678,137 | | | | 4,508 | | | | 412,721 | | | | 2,095,366 | |
| Cornerstone Large Cap Value Fund | | | (28,085,101 | ) | | | 130,056 | | | | — | | | | 1,399,087 | | | | (26,555,958 | ) |
| River Road Dividend All Cap Value Fund | | | — | | | | 8,345,565 | | | | 26,559,658 | | | | 92,343,115 | | | | 127,248,338 | |
| River Road Dividend All Cap Value Fund II | | | — | | | | 18,055 | | | | — | | | | (48,603 | ) | | | (30,548 | ) |
| Fairpointe Mid Cap Fund | | | — | | | | 13,547,048 | | | | 66,049,888 | | | | 485,270,647 | | | | 564,867,583 | |
| M&C Mid Cap Growth Fund | | | (37,681 | ) | | | — | | | | 92,379 | | | | 848,955 | | | | 903,653 | |
| Veredus Small Cap Growth Fund | | | (19,022,164 | ) | | | — | | | | — | | | | 1,916,011 | | | | (17,106,153 | ) |
| Small Cap Growth Fund | | | — | | | | 389,762 | | | | 47,265 | | | | 334,113 | | | | 771,140 | |
| Silvercrest Small Cap Fund | | | — | | | | 68,147 | | | | 649 | | | | 103,316 | | | | 172,112 | |
| TAMRO Small Cap Fund | | | — | | | | 18,818,417 | | | | 74,805,986 | | | | 188,601,423 | | | | 282,225,826 | |
| River Road Select Value Fund | | | — | | | | 1,038,194 | | | | 8,698,768 | | | | 20,831,044 | | | | 30,568,006 | |
| River Road Small Cap Value Fund | | | — | | | | 1,328,652 | | | | 9,066,096 | | | | 65,718,103 | | | | 76,112,851 | |
| River Road Independent Value Fund | | | — | | | | 38,493,742 | | | | — | | | | 2,446,974 | | | | 40,940,716 | |
| DoubleLine Core Plus Fixed Income Fund | | | — | | | | 1,274,175 | | | | 22,764 | | | | 4,714,088 | | | | 6,011,027 | |
| TCH Fixed Income Fund | | | (6,257,447 | ) | | | 47,411 | | | | — | | | | 7,374,593 | | | | 1,164,557 | |
| Lake Partners LASSO Alternatives Fund | | | (4,870,141 | ) | | | 781,026 | | | | — | | | | 7,800,212 | | | | 3,711,097 | |
| Dynamic Allocation Fund | | | (749,106 | ) | | | 121,022 | | | | — | | | | 168,467 | | | | (459,617 | ) |
| Anchor Capital Enhanced Equity Fund | | | — | | | | 2,487,451 | | | | 556,618 | | | | (8,640,364 | ) | | | (5,596,295 | ) |
| River Road Long-Short Fund | | | — | | | | 406,152 | | | | 21,693 | | | | (6 | ) | | | 427,839 | |
| Barings International Fund | | | — | | | | 1,201,598 | | | | 549,691 | | | | 790,834 | | | | 2,542,123 | |
| Harrison Street Real Estate Fund | | | (13,177,471 | ) | | | 125,494 | | | | — | | | | 447,305 | | | | (12,604,672 | ) |
| M&C Balanced Fund | | | (1,726,376 | ) | | | 33,019 | | | | — | | | | 2,601,553 | | | | 908,196 | |
| | |
| |
| | October 31, 2012 |
| |
| Notes to Financial Statements – continued | | |
Note (D) Shares of Beneficial Interest: Each Fund is authorized to issue an unlimited number of shares of beneficial interest with no par value. Share transactions of the Funds were as follows:
Year Ended October 31, 2012
| | | | | | | | | | | | | | | | |
Class N | | Sold | | | Proceeds From
Reinvestment
of Distributions | | | Redeemed | | | Net Increase
(Decrease) in
Shares Outstanding | |
| M&C Growth Fund | | | 18,041,363 | | | | 5,664,499 | | | | (16,394,064 | ) | | | 7,311,798 | |
| Veredus Select Growth Fund | | | 49,925 | | | | — | | | | (1,016,765 | ) | | | (966,840 | ) |
| TAMRO Diversified Equity Fund | | | 210,627 | | | | 38,289 | | | | (597,734 | ) | | | (348,818 | ) |
| Herndon Large Cap Value Fund | | | 1,664,603 | | | | 39,719 | | | | (466,689 | ) | | | 1,237,633 | |
| Cornerstone Large Cap Value Fund | | | 574,279 | | | | 10,721 | | | | (1,126,860 | ) | | | (541,860 | ) |
| River Road Dividend All Cap Value Fund | | | 10,262,549 | | | | 985,104 | | | | (10,485,646 | ) | | | 762,007 | |
| River Road Dividend All Cap Value Fund II (a) | | | 100,138 | | | | 373 | | | | (40 | ) | | | 100,471 | |
| Fairpointe Mid Cap Fund | | | 13,920,692 | | | | 417,341 | | | | (17,204,213 | ) | | | (2,866,180 | ) |
| M&C Mid Cap Growth Fund | | | 296,901 | | | | — | | | | (49,540 | ) | | | 247,361 | |
| Veredus Small Cap Growth Fund | | | 69,893 | | | | — | | | | (527,804 | ) | | | (457,911 | ) |
| Small Cap Growth Fund | | | 94,914 | | | | — | | | | (143,050 | ) | | | (48,136 | ) |
| Silvercrest Small Cap Fund (b) | | | 69,067 | | | | — | | | | (306 | ) | | | 68,761 | |
| TAMRO Small Cap Fund | | | 4,990,377 | | | | 1,982,107 | | | | (6,291,677 | ) | | | 680,807 | |
| River Road Select Value Fund | | | 248,746 | | | | 332,250 | | | | (1,222,289 | ) | | | (641,293 | ) |
| River Road Small Cap Value Fund | | | 862,257 | | | | — | | | | (4,725,116 | ) | | | (3,862,859 | ) |
| River Road Independent Value Fund | | | 18,469,468 | | | | 339,193 | | | | (15,564,710 | ) | | | 3,243,951 | |
| DoubleLine Core Plus Fixed Income Fund | | | 6,542,470 | | | | 124,012 | | | | (2,391,890 | ) | | | 4,274,592 | |
| TCH Fixed Income Fund | | | 1,111,218 | | | | 245,495 | | | | (1,865,034 | ) | | | (508,321 | ) |
| Lake Partners LASSO Alternatives Fund | | | 1,713,847 | | | | 21,588 | | | | (489,123 | ) | | | 1,246,312 | |
| Dynamic Allocation Fund | | | 817,323 | | | | 508,991 | | | | (3,236,169 | ) | | | (1,909,855 | ) |
| Anchor Capital Enhanced Equity Fund | | | 10,363,817 | | | | 763,094 | | | | (3,930,442 | ) | | | 7,196,469 | |
| River Road Long-Short Fund | | | 290,834 | | | | — | | | | (54,850 | ) | | | 235,984 | |
| Barings International Fund | | | 1,673 | | | | 1,945 | | | | (43 | ) | | | 3,575 | |
| Harrison Street Real Estate Fund | | | 621,290 | | | | 4,957 | | | | (337,947 | ) | | | 288,300 | |
| M&C Balanced Fund | | | 584,267 | | | | 14,308 | | | | (289,262 | ) | | | 309,313 | |
| (a) | River Road Dividend All Cap Value Fund II began issuing Class N Shares on June 27, 2012. |
| (b) | Silvercrest Small Cap Fund began issuing Class N Shares on December 23, 2011. |
| | | | | | | | | | | | | | | | |
Class I | | Sold | | | Proceeds From
Reinvestment
of Distributions | | | Redeemed | | | Net Increase
(Decrease) in
Shares Outstanding | |
| M&C Growth Fund | | | 43,042,995 | | | | 4,364,756 | | | | (23,294,443 | ) | | | 24,113,308 | |
| Veredus Select Growth Fund | | | 223,629 | | | | 2,609 | | | | (5,547,826 | ) | | | (5,321,588 | ) |
| TAMRO Diversified Equity Fund (a) | | | 44,338 | | | | — | | | | (2,319 | ) | | | 42,019 | |
| Herndon Large Cap Value Fund | | | 2,306,966 | | | | 73,629 | | | | (485,691 | ) | | | 1,894,904 | |
| Cornerstone Large Cap Value Fund | | | 485,538 | | | | 58 | | | | (10,500 | ) | | | 475,096 | |
| River Road Dividend All Cap Value Fund | | | 24,480,603 | | | | 1,049,359 | | | | (5,161,671 | ) | | | 20,368,291 | |
| River Road Dividend All Cap Value Fund II (b) | | | 894,279 | | | | 3,478 | | | | (952 | ) | | | 896,805 | |
| Fairpointe Mid Cap Fund (c) | | | 20,254,334 | | | | 327,743 | | | | (20,929,526 | ) | | | (347,449 | ) |
| Veredus Small Cap Growth Fund (d) | | | 27,307 | | | | — | | | | (1,169,094 | ) | | | (1,141,787 | ) |
| Small Cap Growth Fund (e) | | | 25,824 | | | | — | | | | (215,934 | ) | | | (190,110 | ) |
| Silvercrest Small Cap Fund (f) (g) | | | 694,135 | | | | — | | | | (240,046 | ) | | | 454,089 | |
| TAMRO Small Cap Fund (h) | | | 7,501,659 | | | | 2,242,345 | | | | (9,314,452 | ) | | | 429,552 | |
| River Road Select Value Fund | | | 6,030,361 | | | | 2,982,288 | | | | (4,372,992 | ) | | | 4,639,657 | |
| River Road Small Cap Value Fund | | | 3,570,354 | | | | — | | | | (6,081,336 | ) | | | (2,510,982 | ) |
| River Road Independent Value Fund | | | 25,305,662 | | | | 189,732 | | | | (3,918,323 | ) | | | 21,577,071 | |
| DoubleLine Core Plus Fixed Income Fund | | | 9,567,318 | | | | 177,202 | | | | (684,564 | ) | | | 9,059,956 | |
| TCH Fixed Income Fund | | | 308,748 | | | | 35,661 | | | | (393,122 | ) | | | (48,713 | ) |
| Lake Partners LASSO Alternatives Fund | | | 8,580,923 | | | | 148,112 | | | | (4,201,794 | ) | | | 4,527,241 | |
| Dynamic Allocation Fund | | | 252,489 | | | | 52,099 | | | | (87,664 | ) | | | 216,924 | |
| Anchor Capital Enhanced Equity Fund | | | 4,796,811 | | | | 678,182 | | | | (3,978,006 | ) | | | 1,496,987 | |
| Barings International Fund | | | 2,684,137 | | | | 187,976 | | | | (1,593,922 | ) | | | 1,278,191 | |
| Harrison Street Real Estate Fund (i) | | | 20,224 | | | | 61 | | | | (3,696,962 | ) | | | (3,676,677 | ) |
| M&C Balanced Fund | | | 30,540 | | | | 428 | | | | (11,383 | ) | | | 19,585 | |
| (a) | TAMRO Diversified Equity Fund began issuing Class I Shares on March 1, 2012. |
| (b) | River Road Dividend All Cap Value Fund II began issuing Class I Shares on June 27, 2012. |
| | |
| |
| | October 31, 2012 |
| |
| Notes to Financial Statements – continued | | |
| (c) | Fairpointe Mid Cap Fund had a redemption-in-kind on January 13, 2012, which resulted in a redemption out of the Fund of $38,722,763. The redemption was comprised of securities and cash in the amounts of $38,179,960 and $542,803, respectively. |
| (d) | Veredus Small Cap Growth Fund had a redemption-in-kind on December 2, 2011, which resulted in a redemption out of the Fund of $13,436,583. The redemption was comprised of securities and cash in the amounts of $13,225,479 and $211,104, respectively. |
| (e) | Small Cap Growth Fund had a redemption-in-kind on September 25, 2012, which resulted in a redemption out of the Fund of $2,554,395. The redemption was comprised of securities and cash in the amounts of $2,419,213 and $135,182, respectively. |
| (f) | Silvercrest Small Cap Fund began issuing Class I Shares on December 23, 2011. |
| (g) | Silvercrest Small Cap Fund had a redemption-in-kind on April 26, 2012, which resulted in a redemption out of the Fund of $2,608,977. The redemption was comprised of securities and cash in the amounts of $2,579,146 and $29,831, respectively. |
| (h) | TAMRO Small Cap Fund had redemptions-in-kind on May 1, 2012 and June 27, 2012, which resulted in redemptions out of the Fund of $40,667,980 and $7,010,475, respectively. The redemption was comprised of securities and cash in the amounts of $39,335,174 and $6,762,586, respectively and $1,332,806 and $247,889, respectively. |
| (i) | Harrison Street Real Estate Fund had a redemption-in-kind on December 2, 2011, which resulted in a redemption out of the Fund of $31,399,368. The redemption was comprised of securities and cash in the amounts of $30,913,574 and $485,794, respectively. |
| | | | | | | | | | | | | | | | |
Class R | | Sold | | | Proceeds From
Reinvestment of
Distributions | | | Redeemed | | | Net
Decrease in
Shares Outstanding | |
| M&C Growth Fund | | | 100,372 | | | | 23,324 | | | | (127,056 | ) | | | (3,360 | ) |
Year Ended October 31, 2011
| | | | | | | | | | | | | | | | |
Class N | | Sold | | | Shares Issued From
Reinvestment of
Distributions | | | Redeemed | | | Net Increase
(Decrease) in
Shares Outstanding | |
| M&C Growth Fund | | | 27,529,579 | | | | 436,304 | | | | (25,563,135 | ) | | | 2,402,748 | |
| Veredus Select Growth Fund | | | 600,195 | | | | — | | | | (2,424,886 | ) | | | (1,824,691 | ) |
| TAMRO Diversified Equity Fund | | | 1,047,491 | | | | — | | | | (398,182 | ) | | | 649,309 | |
| Herndon Large Cap Value Fund | | | 1,302,936 | | | | 1,239 | | | | (907,748 | ) | | | 396,427 | |
| Cornerstone Large Cap Value Fund | | | 938,206 | | | | 26,444 | | | | (683,845 | ) | | | 280,805 | |
| River Road Dividend All Cap Value Fund | | | 19,428,483 | | | | 401,663 | | | | (4,872,469 | ) | | | 14,957,677 | |
| Fairpointe Mid Cap Fund | | | 23,004,145 | | | | 239,794 | | | | (23,365,775 | ) | | | (121,836 | ) |
| M&C Mid Cap Growth Fund | | | 79,385 | | | | — | | | | (14,651 | ) | | | 64,734 | |
| Veredus Small Cap Growth Fund | | | 261,170 | | | | — | | | | (980,739 | ) | | | (719,569 | ) |
| Small Cap Growth Fund (a) | | | 622,572 | | | | — | | | | (78,915 | ) | | | 543,657 | |
| TAMRO Small Cap Fund | | | 6,465,730 | | | | 349,541 | | | | (5,826,262 | ) | | | 989,009 | |
| River Road Select Value Fund | | | 940,625 | | | | 64,739 | | | | (5,458,457 | ) | | | (4,453,093 | ) |
| River Road Small Cap Value Fund | | | 3,083,624 | | | | 49,890 | | | | (14,038,695 | ) | | | (10,905,181 | ) |
| River Road Independent Value Fund (b) | | | 34,714,694 | | | | — | | | | (6,220,324 | ) | | | 28,494,370 | |
| DoubleLine Core Plus Fixed Income Fund (c) | | | 2,304,445 | | | | 13,647 | | | | (147,028 | ) | | | 2,171,064 | |
| TCH Fixed Income Fund | | | 2,519,080 | | | | 199,342 | | | | (1,241,865 | ) | | | 1,476,557 | |
| Lake Partners LASSO Alternatives Fund | | | 1,059,998 | | | | 9,203 | | | | (286,539 | ) | | | 782,662 | |
| Dynamic Allocation Fund | | | 2,015,362 | | | | 199,385 | | | | (3,376,730 | ) | | | (1,161,983 | ) |
| Anchor Capital Enhanced Equity Fund | | | 2,823,656 | | | | 274,141 | | | | (2,998,639 | ) | | | 99,158 | |
| River Road Long-Short Fund (d) | | | 463,827 | | | | — | | | | (106 | ) | | | 463,721 | |
| Barings International Fund | | | 41,175 | | | | 470 | | | | (9,259 | ) | | | 32,386 | |
| Harrison Street Real Estate Fund | | | 334,601 | | | | 11,310 | | | | (399,317 | ) | | | (53,406 | ) |
| M&C Balanced Fund | | | 83,389 | | | | 13,236 | | | | (462,762 | ) | | | (366,137 | ) |
| (a) | Small Cap Growth Fund began issuing Class N Shares on November 2, 2010. |
| (b) | River Road Independent Value Fund began issuing Class N Shares on December 30, 2010. |
| (c) | DoubleLine Core Plus Fixed Income Fund began issuing Class N Shares on July 15, 2011. |
| (d) | River Road Long-Short Fund began issuing Class N Shares on May 3, 2011. |
| | | | | | | | | | | | | | | | |
Class I | | Sold | | | Shares Issued From
Reinvestment of
Distributions | | | Redeemed | | | Net Increase
(Decrease) in
Shares Outstanding | |
| M&C Growth Fund | | | 25,367,654 | | | | 492,955 | | | | (21,812,016 | ) | | | 4,048,593 | |
| Veredus Select Growth Fund | | | 1,022,514 | | | | — | | | | (965,498 | ) | | | 57,016 | |
| Herndon Large Cap Value Fund (a) | | | 1,048,685 | | | | — | | | | — | | | | 1,048,685 | |
| Cornerstone Large Cap Value Fund (b) | | | 41 | | | | 99,223 | | | | (22,281,046 | ) | | | (22,181,782 | ) |
| River Road Dividend All Cap Value Fund | | | 18,128,321 | | | | 370,706 | | | | (2,092,580 | ) | | | 16,406,447 | |
| Fairpointe Mid Cap Fund | | | 39,262,459 | | | | 90,932 | | | | (12,005,364 | ) | | | 27,348,027 | |
| Veredus Small Cap Growth Fund | | | 23,685 | | | | — | | | | (32,239 | ) | | | (8,554 | ) |
| Small Cap Growth Fund | | | 255,934 | | | | — | | | | — | | | | 255,934 | |
| TAMRO Small Cap Fund | | | 9,479,673 | | | | 402,302 | | | | (7,890,124 | ) | | | 1,991,851 | |
| River Road Select Value Fund | | | 4,193,249 | | | | 214,802 | | | | (8,853,662 | ) | | | (4,445,611 | ) |
| River Road Small Cap Value Fund | | | 4,141,086 | | | | 107,904 | | | | (6,084,595 | ) | | | (1,835,605 | ) |
| River Road Independent Value Fund (c) | | | 8,308,048 | | | | — | | | | (359,185 | ) | | | 7,948,863 | |
| DoubleLine Core Plus Fixed Income Fund (d) | | | 523,751 | | | | 4,051 | | | | (98,141 | ) | | | 429,661 | |
| | |
| |
| | October 31, 2012 |
| |
| Notes to Financial Statements – continued | | |
| | | | | | | | | | | | | | | | |
Class I | | Sold | | | Shares Issued From
Reinvestment of
Distributions | | | Redeemed | | | Net Increase
(Decrease) in
Shares Outstanding | |
| TCH Fixed Income Fund | | | 347,836 | | | | 45,383 | | | | (827,447 | ) | | | (434,228 | ) |
| Lake Partners LASSO Alternatives Fund | | | 16,212,425 | | | | 25,742 | | | | (2,014,816 | ) | | | 14,223,351 | |
| Dynamic Allocation Fund (e) | | | 734,609 | | | | 715 | | | | (275,213 | ) | | | 460,111 | |
| Anchor Capital Enhanced Equity Fund | | | 2,722,359 | | | | 287,142 | | | | (1,167,597 | ) | | | 1,841,904 | |
| Harrison Street Real Estate Fund | | | 3,825 | | | | 64,984 | | | | (1,747 | ) | | | 67,062 | |
| Barings International Fund | | | 2,212,819 | | | | 113,069 | | | | (1,257,377 | ) | | | 1,068,511 | |
| M&C Balanced Fund | | | 236,989 | | | | 1,686 | | | | (239,470 | ) | | | (795 | ) |
| (a) | Herndon Large Cap Value Fund began issuing Class I Shares on March 1, 2011. |
| (b) | Cornerstone Large Cap Value Fund had a redemption-in-kind on March 18, 2011, which resulted in a redemption out of the Fund of $222,180,158. The redemption was comprised of securities and cash in the amounts of $218,362,400 and $3,817,758, respectively. |
| (c) | River Road Independent Value Fund began issuing Class I Shares on May 31, 2011. |
| (d) | DoubleLine Core Plus Fixed Income Fund began issuing Class I Shares on July 15, 2011. |
| (e) | Dynamic Allocation Fund began issuing Class I Shares on November 1, 2010. |
| | | | | | | | | | | | | | | | |
Class R | | Sold | | | Shares Issued From
Reinvestment
of Distributions | | | Redeemed | | | Net Increase in
Shares Outstanding | |
| M&C Growth Fund | | | 231,098 | | | | 883 | | | | (199,315 | ) | | | 32,666 | |
Note (E) Investment Transactions: Aggregate purchases and proceeds from sales and maturities of investment securities (other than short-term investments) for the year ended October 31, 2012 were as follows:
| | | | | | | | | | | | | | | | |
| | | Aggregate Purchases | | | Proceeds from Sales | |
| | | U.S. Government | | | Other | | | U.S. Government | | | Other | |
| | | | | | | | | | | | | | | | |
| M&C Growth Fund | | $ | — | | | $ | 1,972,776,769 | | | $ | — | | | $ | 1,651,965,719 | |
| Veredus Select Growth Fund | | | — | | | | 86,063,915 | | | | — | | | | 152,482,104 | |
| TAMRO Diversified Equity Fund | | | — | | | | 11,512,336 | | | | — | | | | 15,154,644 | |
| Herndon Large Cap Value Fund | | | — | | | | 64,334,427 | | | | — | | | | 30,376,108 | |
| Cornerstone Large Cap Value Fund | | | — | | | | 14,410,279 | | | | — | | | | 14,663,999 | |
| River Road Dividend All Cap Value Fund | | | — | | | | 435,843,737 | | | | — | | | | 220,734,933 | |
| River Road Dividend All cap Value Fund II (a) | | | — | | | | 9,292,035 | | | | — | | | | 258,302 | |
| Fairpointe Mid Cap Fund (b) | | | — | | | | 808,523,795 | | | | — | | | | 858,643,069 | |
| M&C Mid Cap Growth Fund | | | — | | | | 4,395,164 | | | | — | | | | 2,153,729 | |
| Veredus Small Cap Growth Fund (c) | | | — | | | | 44,891,321 | | | | — | | | | 50,745,538 | |
| Small Cap Growth Fund (d) | | | — | | | | 12,988,573 | | | | — | | | | 13,341,662 | |
| Silvercrest Small Cap Fund (e) | | | — | | | | 8,983,916 | | | | — | | | | 1,169,680 | |
| TAMRO Small Cap Fund (f) | | | — | | | | 487,439,513 | | | | — | | | | 525,841,529 | |
| River Road Select Value Fund | | | — | | | | 55,429,185 | | | | — | | | | 56,846,863 | |
| River Road Small Cap Value Fund | | | — | | | | 78,856,625 | | | | — | | | | 165,223,867 | |
| River Road Independent Value Fund | | | — | | | | 507,859,647 | | | | — | | | | 411,506,172 | |
| DoubleLine Core Plus Fixed Income Fund | | | 127,026,252 | | | | 111,468,591 | | | | 74,878,485 | | | | 29,863,881 | |
| TCH Fixed Income Fund | | | 4,722,161 | | | | 34,513,695 | | | | 7,968,677 | | | | 39,189,498 | |
| Lake Partners LASSO Alternatives Fund | | | — | | | | 181,324,973 | | | | — | | | | 108,604,194 | |
| Dynamic Allocation Fund. | | | — | | | | 155,318,453 | | | | — | | | | 169,160,674 | |
| Anchor Capital Enhanced Equity Fund | | | — | | | | 142,591,937 | | | | — | | | | 81,577,001 | |
| River Road Long-Short Fund | | | — | | | | 13,832,153 | | | | — | | | | 12,409,676 | |
| Barings International Fund | | | — | | | | 26,502,151 | | | | — | | | | 19,396,806 | |
| Harrison Street Real Estate Fund (g) | | | — | | | | 14,526,721 | | | | — | | | | 11,107,020 | |
| M&C Balanced Fund | | | 2,629,899 | | | | 13,230,936 | | | | 753,780 | | | | 8,915,745 | |
| (a) | River Road Dividend All Cap Value Fund II had a subscription-in-kind on June 26, 2012, which resulted in transactions into the Fund of $982,592 and is excluded from the aggregate purchases above. The subscription was comprised of securities, cash and dividends accrued in the amounts of $932,272, $47,924 and $2,396, respectively. |
| (b) | Fairpointe Mid Cap Fund had a redemption-in-kind on January 13, 2012, which resulted in a redemption out of the Fund of $38,722,763 and is excluded from the proceeds from sales above. The redemp- tion was comprised of securities and cash in the amount of $38,179,960 and $542,803, respectively. |
| (c) | Veredus Small Cap Growth Fund had a redemption-in-kind on December 2, 2011, which resulted in a redemption out of the Fund of $13,436,583 and is excluded from proceeds from sales above. The redemption was comprised of securities and cash in the amounts of $13,225,479 and $211,104, respectively. |
| (d) | Small Cap Growth Fund had a redemption-in-kind on September 25, 2012, which resulted in a redemption out of the Fund of $2,554,395 and is excluded from the proceeds from sales above. The redemption was comprised of securities and cash in the amounts of $2,419,213 and $135,182, respectively. |
| (e) | Silvercrest Small Cap Fund had a redemption-in-kind on April 26, 2012, which resulted in a redemption out of the Fund of $2,608,977 and is excluded from the proceeds from sales above. The redemption was comprised of securities and cash in the amount of $2,579,146 and $29,831, respectively. |
| (f) | TAMRO Small Cap Fund had redemptions-in-kind on May 1, 2012 and June 27, 2012, which resulted in redemptions out of the Fund of $40,667,980 and $7,010,475, respectively and is excluded from the proceeds from sales above. The redemption was comprised of securities and cash in the amounts of $39,335,174 and $6,762,586, respectively and 1,332,806 and $247,889, respectively. |
| | |
| |
| | October 31, 2012 |
| |
| Notes to Financial Statements – continued | | |
| (g) | Harrison Street Real Estate Fund had a redemption-in-kind on December 2, 2011, which resulted in a redemption out of the Fund of $31,399,368 and is excluded from proceeds from sales above. The redemption was comprised of securities and cash in the amounts of $30,913,574 and $485,794, respectively. |
Note (F) Redemption Fees: In accordance with the prospectus, certain Funds assessed a 2% redemption fee on Fund share redemptions and exchanges within specified time periods, as indicated in the following table for the year ended October 31, 2012 and included in the Cost of Shares redeemed on the Statements of Changes in Net Assets:
| | | | | | |
Fund Name | | Time Period | | Amount | |
| Barings International Fund | | 2% Within 90 Days | | $ | 5,830 | |
| Harrison Street Real Estate Fund | | 2% Within 90 Days | | | 7,183 | |
Note (G) Advisory, Administration, Distribution Services and Trustee Agreements:
Advisory. Aston serves as investment adviser and administrator to the Funds. Under the terms of the investment advisory agreement for the Funds (the “Investment Advisory Agreement”), fees are accrued daily and paid monthly, based on specific annual rates of average daily net assets. The factors considered by the Board of Trustees in approving the current Investment Advisory Agreement are included in the Funds’ annual or semi-annual report to shareholders covering the period during which the approval occurred.
Certain Funds have an expense limitation agreement with the Adviser, which caps annual ordinary operating expenses for Class N and Class I shareholders at certain specified annual rates of average daily net assets (the “Expense Limitation Agreements”). There are no contractual expense limitations for Class R shareholders.
The Expense Limitation Agreements are effective through February 28, 2013, except as noted below. The advisory rates and contractual expense limitations for the year ended October 31, 2012 were as follows:
| | | | | | |
| | | | | Contractual Expense Limitations |
Fund Name | | Advisory Fees | | Class N | | Class I |
| M&C Growth Fund | | 0.80% on first $800,000,000 | | | | |
| | 0.60% over $800,000,000 | | N/A | | N/A |
| Veredus Select Growth Fund | | 0.80% | | 1.30% | | 1.05% |
| TAMRO Diversified Equity Fund (a) | | 0.80% | | 1.20% | | 0.95% |
| Herndon Large Cap Value Fund | | 0.80% | | 1.30%(b) | | 1.05%(b) |
| Cornerstone Large Cap Value Fund (c) | | 0.80% | | 1.30% | | 1.05% |
| River Road Dividend All Cap Value Fund | | 0.70% | | 1.30% | | 1.05% |
| River Road Dividend All Cap Value Fund II (d) | | 0.70% | | 1.30%(b) | | 1.05%(b) |
| Fairpointe Mid Cap Fund | | 0.80% on first $100,000,000 | | | | |
| | 0.75% next $300,000,000 | | | | |
| | 0.70% over $400,000,000 | | N/A | | N/A |
| M&C Mid Cap Growth Fund (e) | | 0.85% | | 1.25%(b) | | N/A |
| Veredus Small Cap Growth Fund | | 1.00% | | 1.49% | | 1.24% |
| Small Cap Growth Fund | | 1.00% | | 1.35%(b) | | 1.10%(b) |
| Silvercrest Small Cap Growth (f) | | 1.00% | | 1.40%(b) | | 1.15%(b) |
| TAMRO Small Cap Fund | | 0.90% | | N/A | | N/A |
| River Road Select Value Fund | | 1.00% | | 1.50%(b) | | 1.25%(b) |
| River Road Small Cap Value Fund | | 0.90% | | N/A | | N/A |
| River Road Independent Value Fund | | 1.00% | | 1.42%(b) | | 1.17%(b) |
| DoubleLine Core Plus Fixed Income Fund | | 0.55% | | 0.94%(b) | | 0.69%(b) |
| TCH Fixed Income Fund | | 0.55% | | 0.94% | | 0.69% |
| Lake Partners LASSO Alternatives Fund | | 1.00% | | 1.45%(b) | | 1.20%(b) |
| Dynamic Allocation Fund | | 0.80% | | 1.30%(b) | | 1.05%(b) |
| Anchor Capital Enhanced Equity Fund | | 0.70% | | 1.40%(b) | | 1.15%(b) |
| River Road Long-Short Fund | | 1.20% | | 1.70%(b) | | N/A |
| Barings International Fund | | 1.00% | | 1.40%(b) | | 1.15%(b) |
| Harrison Street Real Estate Fund | | 1.00% | | 1.37% | | 1.12% |
| M&C Balanced Fund | | 0.75% | | 1.35% | | 1.10% |
| (a) | TAMRO Diversified Equity Fund began issuing Class I Shares on March 1, 2012. |
| (b) | Pursuant to a contractual expense reimbursement agreement between the Adviser and the Fund, from commencement of operations through the completion of the first three full fiscal years for a period up to three years from the fiscal year end during which such amount was waived or reduced, the Adviser is entitled to be reimbursed by the Fund for previously waived fees and reimbursed expenses to the extent that the Fund’s expense ratio (not including interest, taxes, brokerage commissions, other investment related costs, extraordinary expenses and acquired fund fees and expenses,) remains below the operating expense cap after such reimbursement. |
| (c) | Effective February 29, 2012, the voluntary expense limitation for the Cornerstone Large Cap Value Fund was replaced with a contractual expense limitation of 1.30% for Class N and 1.05% for Class I. |
| (d) | River Road Dividend All Cap Value Fund II began issuing Class N and Class I Shares on June 27, 2012. |
| (e) | Effective February 29, 2012, the voluntary expense limitation for the M&C Mid Cap Growth Fund was removed and replaced with a contractual expense limitation of 1.25%. |
| (f) | Silvercrest Small Cap Growth Fund began issuing Class N and Class I Shares on December 23, 2011. |
| | |
| |
| | October 31, 2012 |
| |
| Notes to Financial Statements – continued | | |
Pursuant to a contractual expense reimbursement agreement between the Adviser and the following Funds, from commencement of operations through the completion of the first three full fiscal years for a period of up to three years from the fiscal year end during which such amount was waived or reduced of each of the Herndon Large Cap Value Fund-Classes N and I, River Road Dividend All Cap Value Fund II-Classes N and I, M&C Mid Cap Growth Fund-Class N, Small Cap Growth Fund-Classes N and I, Silvercrest Small Cap Fund-Classes N and I, River Road Select Value Fund-Classes N and I, River Road Independent Value Fund-Classes N and I, DoubleLine Core Plus Fixed Income Fund-Classes N and I, Lake Partners LASSO Alternatives Fund-Classes N and I, Dynamic Allocation Fund-Classes N and I, Anchor Capital Enhanced Equity Fund-Classes N and I, River Road Long-Short Fund Class N and Barings International Fund-Classes N and I, the Adviser is entitled to be reimbursed by each Fund for previously waived fees and reimbursed expenses to the extent that each Fund’s expense ratio (not including interest, taxes, brokerage commissions, other investment related costs, extraordinary expenses and acquired fund fees and expenses) remains below the operating expense cap after such reimbursement.
The cumulative reimbursement amounts as of October 31, 2012 that are entitled to be reimbursed for each Fund are as follows:
| | | | | | | | | | | | |
| | | | | | Expiration | | | | |
| | | 2013 | | | 2014 | | | 2015 | |
| Herndon Large Cap Value Fund | | | 74,284 | | | | 129,816 | | | | 42,793 | |
| River Road Dividend All Cap Value Fund II (1) | | | N/A | | | | N/A | | | | 59,860 | |
| Montag & Caldwell Mid Cap Growth Fund | | | 67,970 | | | | 72,010 | | | | N/A | |
| Small Cap Growth Fund | | | N/A | | | | 190,704 | | | | 123,269 | |
| Silvercrest Small Cap Fund (1) | | | N/A | | | | N/A | | | | 147,166 | |
| River Road Select Value Fund | | | — | | | | N/A | | | | N/A | |
| River Road Independent Value Fund | | | N/A | | | | 244,471 | | | | 143,528 | |
| DoubleLine Core Plus Fixed Income Fund | | | N/A | | | | 105,633 | | | | 389,195 | |
| Lake Partners LASSO Alternatives Fund | | | 135,895 | | | | 87,814 | | | | N/A | |
| Dynamic Allocation Fund | | | 74,415 | | | | 138,681 | | | | N/A | |
| Anchor Capital Enhanced Equity Fund | | | — | | | | — | | | | N/A | |
| River Road Long-Short Fund | | | N/A | | | | 97,108 | | | | 110,750 | |
| Barings International Fund | | | 134,828 | | | | 147,896 | | | | N/A | |
| | | | | | | | | | | | |
| Total | | $ | 487,392 | | | $ | 1,214,133 | | | $ | 1,016,561 | |
| | | | | | | | | | | | |
| (1) | The Fund commenced operations in the current fiscal year. |
For the year ended October 31, 2012, the Adviser was reimbursed $88,544 by the Lake Partners LASSO Alternatives Fund and $61,190 by the Anchor Capital Enhanced Equity Fund for recoupment of prior year fee waivers. No other Fund in the above table reimbursed the Adviser for the period.
The Adviser manages each Fund by retaining one or more Sub-advisers to manage each Fund as follows:
| | |
Fund | | Subadviser |
M&C Growth Fund | | Montag & Caldwell, LLC |
Veredus Select Growth Fund | | Todd-Veredus Asset Management LLC |
TAMRO Diversified Equity Fund | | TAMRO Capital Partners LLC |
Herndon Large Cap Value Fund | | Herndon Capital Management, LLC |
Cornerstone Large Cap Value Fund | | Cornerstone Investment Partners, LLC |
River Road Dividend All Cap Value Fund | | River Road Asset Management, LLC |
River Road Dividend All Cap Value Fund II | | River Road Asset Management, LLC |
| | |
Fund | | Subadviser |
Fairpointe Mid Cap Fund | | Fairpointe Capital LLC |
M&C Mid Cap Growth Fund | | Montag & Caldwell, LLC |
Veredus Small Cap Growth Fund | | Todd-Veredus Asset Management LLC |
Small Cap Growth Fund | | Lee Munder Capital Group, LLC(1) |
Silvercrest Small Cap Fund | | Silvercrest Asset Management Group, LLC |
TAMRO Small Cap Fund | | TAMRO Capital Partners LLC |
River Road Select Value Fund | | River Road Asset Management, LLC |
River Road Small Cap Value Fund | | River Road Asset Management, LLC |
River Road Independent Value Fund | | River Road Asset Management, LLC |
DoubleLine Core Plus Fixed Income Fund | | DoubleLine Capital LP |
TCH Fixed Income Fund | | Taplin, Canida & Habacht, LLC |
Lake Partners LASSO Alternatives Fund | | Lake Partners, Inc. |
Dynamic Allocation Fund | | Smart Portfolios, LLC |
Anchor Capital Enhanced Equity Fund | | Anchor Capital Advisors LLC(2) |
River Road Long-Short Fund | | River Road Asset Management, LLC |
Barings International Fund | | Baring International Investment Limited |
Harrison Street Real Estate Fund | | Harrison Street Securities, LLC |
M&C Balanced Fund | | Montag & Caldwell, LLC |
| (1) | Effective as of February 17, 2012, Lee Munder Capital Group, LLC became the Subadviser to the Fund. Prior to February 17, 2012, Crosswind Investments, LLC was the Subadviser. |
| (2) | Effective June 29, 2012, Anchor Capital Advisors LLC became the Subadviser to the Fund. Prior to June 29, 2012, M.D. Sass Investors Services, Inc. was the Subadviser. |
Subadvisory fees are paid monthly by Aston. The factors considered by the Board of Trustees in approving the current sub-investment advisory agreements for the Funds (each a “Sub-Investment Advisory Agreement”) are included in the additional information section of the Funds’ annual or semi-annual report to shareholders covering the period in which such approval occurred.
Administration. Under the terms of the administration agreement between the Funds and Aston, the Funds’ administrator (the “Administration Agreement”), administration fees are accrued daily and paid monthly, based on a specified percentage of average daily net assets of the Trust, and base fees are fixed at an annual rate of $12,000 per Fund. The fee is allocated to each Fund based on the relative net assets of the Trust. Administration expenses also include pricing agent fees and compliance related expenses. Effective July 1, 2012, the administration fee arrangement is as follows:
| | |
Administration Fees at Trust Level | | Annual Rate |
| |
| First $7.4 billion | | 0.0437% |
| Over $7.4 billion | | 0.0412% |
Prior to July 1, 2012, the administration fee arrangement was as follows:
| | |
Administration Fees
at Trust Level | | Annual Rate |
| First $7.4 billion | | 0.0490% |
| Over $7.4 billion | | 0.0465% |
BNY Mellon Investment Servicing (US) Inc. (“BNY Mellon”) provides certain administrative services to the Funds pursuant to
| | |
| |
| | October 31, 2012 |
| |
| Notes to Financial Statements – continued | | |
a Sub-administration and Accounting Services Agreement between Aston and BNY Mellon (the “Sub-Administration Agreement”). Effective July 1, 2012, under the terms of the Sub-Administration Agreement, sub-administration fees and tax services fees, which are paid by Aston, are accrued daily and paid monthly, at a rate of 0.0142% and 0.0025%, respectively of average daily net assets of the Trust and a base fee at an annual rate of $12,000 per Fund.
Prior to July 1, 2012, the sub-administration fees were 0.022% of average daily net assets. BNY Mellon did not provide tax services prior to July 1, 2012.
Distribution Services. On March 31, 2012, BNY Mellon Distributors LLC Inc. was sold to Foreside Funds Distributors LLC. Upon the closing of the transaction, BNY Mellon Distributors LLC became an indirect, wholly owned subsidiary of Foreside Financial Group, LLC and was renamed Foreside Funds Distributors LLC (the “Distributor”) effective April 1, 2012. The Distributor serves as principal underwriter and distributor of the Fund’s shares. Pursuant to Rule 12b-1 distribution and service plans (the “Plans”) adopted by the Funds, with respect to Class N shares and Class R shares, the Funds pay certain expenses associated with the distribution of their shares. Under the Plans, each Fund may pay actual expenses not exceeding, on an annual basis, 0.25% of each participating Fund’s Class N average daily net assets and 0.50% of each participating Fund’s Class R average daily net assets. The Class I shares do not have Rule 12b-1 plans. Effective January 1, 2012 the TCH Fixed Income Fund and M&C Balanced Fund reduced their 12b-1 fees to 0.10% and 0.15%, respectively.
Trustees. The Trustees of the Trust who are not affiliated with the Adviser or Subadviser receive an annual retainer and per meeting fees and are reimbursed for out-of-pocket expenses for each meeting of the Board of Trustees they attend. The Chairman of the Board and Committee Chairs receive an additional retainer. No officer or employee of the Adviser, Subadvisers or their affiliates receives any compensation from the Funds for acting as a Trustee of the Trust. The officers of the Trust receive no compensation directly from the Funds for performing the duties of their offices, except that the Funds compensate the Administrator for providing an officer to serve as the Funds’ Chief Compliance Officer. The aggregate remuneration paid to the Trustees during the year ended October 31, 2012 was $704,750.
Note (H) Credit Agreement: Effective July 6, 2010 and as amended August 31, 2012, the Trust entered into a Credit Agreement with The Bank of New York Mellon which provides the Trust with a revolving line of credit facility up to $50 million. The facility is shared by each series of the Trust and is available for temporary, emergency purposes including liquidity needs in meeting redemptions. The interest rate on outstanding Alternate Base Rate Loans is equivalent to the greater of the Prime Rate plus 1.25% or 0.50% plus the Federal Funds Effective Rate plus 1.25%, as applicable. The interest rate on outstanding Overnight Loans is equivalent to the greater of the Federal Funds Effective Rate plus 1.25% or the One
Month LIBOR Rate plus 1.25%, as applicable. The Trust pays a commitment fee on the unutilized commitment amount of 0.12% per annum. For the Funds that utilized the line of credit during the year ended October 31, 2012, the average daily loan balance outstanding on the days where borrowings existed, the weighted average interest rate and the interest expense, which is included on the Statement of Operations, allocated to each Fund for the use of the line of credit were as follows:
| | | | | | | | | | | | |
| | | Weighted Average Interest Rate on Days When Borrowings Existed | | | Average Daily Loan Balance on Days When Borrowings Existed | | | Interest Expense | |
| | | |
| | | |
| | | |
| | | |
| Veredus Select Growth Fund | | | 1.65 | % | | $ | 1,539,700 | | | $ | 71 | |
| TAMRO Diversified Equity Fund | | | 1.64 | % | | | 270,343 | | | | 86 | |
| Fairpointe Mid Cap Fund | | | 1.64 | % | | | 24,387,327 | | | | 12,242 | |
| TAMRO Small Cap Fund | | | 1.65 | % | | | 10,549,933 | | | | 2,905 | |
| River Road Select Value Fund | | | 1.65 | % | | | 37,000 | | | | 2 | |
| Anchor Capital Enhanced Equity Fund | | | 1.65 | % | | | 2,504,567 | | | | 690 | |
Note (I) Fully FDIC-insured Uninvested Deposit Balance Program: Effective July 3, 2012, the Trust entered into a program under which cash that is currently held in custody and trust accounts by The Bank of New York Mellon (the “Bank”), as custodian for the Trust, is held in non-interest bearing transaction accounts at the Bank that are fully covered by the FDIC. River Road Independent Value Fund, Lake Partners LASSO Alternatives Fund and Anchor Capital Enhanced Equity Fund will accrue an Earnings Credit to offset the Fund’s custody and transfer agency fees (including overdraft charges) based on the Earnings Credit Rate. The Earnings Credit Rate is 8 basis points, on positive balances. The term of this agreement is June 1, 2012 through December 31, 2012. The Earnings Credit Rate may be changed by the Bank from time to time. For the year ended October 31, 2012, the Funds’ accrued Earnings Credits are as follows:
| | | | |
Fund | | 2012 Earnings
Credit to Custody
and Transfer
Agency Fees | |
| River Road Independent Value Fund | | $ | 23,757 | |
| Lake Partners LASSO Alternatives Fund | | | 2,453 | |
| Anchor Capital Enhanced Equity Fund | | | 1,467 | |
Note (J) ReFlow Fund LLC: The Veredus Small Cap Growth Fund may participate in the ReFlow Fund LLC program (“ReFlow”), which is designed to provide an alternative liquidity source for mutual funds experiencing redemptions of their shares. In order to pay cash to shareholders who redeem their shares on a given day, a mutual fund typically must hold cash in its portfolio, liquidate portfolio securities, or borrow money, all of which impose certain costs on the fund. ReFlow provides participating mutual funds with another source of cash by standing ready to purchase shares from a fund equal to the amount of the fund’s net redemptions on a given day. ReFlow then generally redeems those shares when the fund experiences net sales or when the shares have been outstanding for the holding limit of 28 days, whichever comes first. In return for this service, the Veredus Small Cap Growth Fund will pay a fee to ReFlow at a rate determined by a daily auction with other participating mutual funds.
| | |
| |
| | October 31, 2012 |
| |
| Notes to Financial Statements – continued | | |
The costs to the Veredus Small Cap Growth Fund for participating in ReFlow are expected to be influenced by and comparable to the cost of other sources of liquidity, such as the Fund’s short-term lending arrangements or the costs of selling portfolio securities to meet redemptions. ReFlow will be prohibited from acquiring more than 3% of the outstanding voting securities of the Fund.
As of October 31, 2012, the Veredus Small Cap Growth Fund had not utilized ReFlow.
Note (K) Liquidations: ASTON/Cardinal Mid Cap Value Fund and ASTON/Neptune International Fund were terminated and liquidated on October 26, 2012.
Note (L) Significant Concentrations: Certain Funds may invest a significant percentage of their assets in securities of foreign issuers. These investments may involve certain considerations and risks not typically associated with investments in the United States as a result of, among other factors, the possibility of future political and economic developments and the level of governmental supervision and regulation of securities markets in the respective countries. Some countries in which the Funds invest may require government approval for repatriation of investment income, capital or the proceeds for sales of securities by foreign investors. In addition, if there is deterioration in a country’s balance of payments or for other reasons, a country may impose temporary restrictions on foreign capital remittances abroad. In addition, changes in currency exchange rates will affect the value of investments denominated in a foreign currency, as well as investment income derived from those securities.
Note (M) Subsequent Events: Management has evaluated the impact of all subsequent events on the Funds through the date the financial statements were issued, and has determined that there were no subsequent events requiring recognition or disclosure in the financial statements, except as follows.
At meetings held on December 13, 2012 and December 20, 2012, the Board of Trustees of the Trust determined to terminate and liquidate the ASTON/Veredus Select Growth Fund and ASTON Dynamic Allocation Fund, respectively. The estimated liquidation date for both Funds is on or about January 30, 2013.
At a meeting held on December 13, 2012, the Board of Trustees of the Trust approved the appointment of Lee Munder Capital Group, LLC as subadviser to ASTON/Veredus Small Cap Growth Fund and a name change for ASTON/Veredus Small Cap Growth Fund to ASTON Small Cap Fund, effective January 31, 2013. At the same meeting, the Board of Trustees of the Trust approved the merger of ASTON/Veredus Small Cap Growth Fund with and into ASTON Small Cap Growth Fund, each a series of the Trust, subject to the approval of shareholders of the ASTON/Veredus Small Cap Growth Fund (the “Merger”). If approved by the shareholders of the ASTON/Veredus Small Cap Growth Fund, the Merger will occur as soon as practicable after shareholder approval is obtained, likely on or about March 31, 2013.
| | |
| |
| | |
| |
| Report of Independent Registered Public Accounting Firm | | |
To the Shareholders and Board of Trustees of
Aston Funds
We have audited the accompanying statements of assets and liabilities, including the schedules of investments, of Aston Funds (the “Trust”) (comprising, respectively, ASTON/Montag & Caldwell Growth Fund, ASTON/Veredus Select Growth Fund, ASTON/TAMRO Diversified Equity Fund, ASTON/Herndon Large Cap Value Fund, ASTON/Cornerstone Large Cap Value Fund, ASTON/River Road Dividend All Cap Value Fund, ASTON/River Road Dividend All Cap Value Fund II, ASTON/Fairpointe Mid Cap Fund, ASTON/Montag & Caldwell Mid Cap Growth Fund, ASTON/Veredus Small Cap Growth Fund (formerly, ASTON/Veredus Aggressive Growth Fund), ASTON Small Cap Growth Fund (formerly, ASTON/Crosswind Small Cap Growth Fund), ASTON/Silvercrest Small Cap Fund, ASTON/TAMRO Small Cap Fund, ASTON/River Road Select Value Fund, ASTON/River Road Small Cap Value Fund, ASTON/River Road Independent Value Fund, ASTON/DoubleLine Core Plus Fixed Income Fund, ASTON/TCH Fixed Income Fund, ASTON/Lake Partners LASSO Alternatives Fund, ASTON Dynamic Allocation Fund, ASTON/Anchor Capital Enhanced Equity Fund (formerly, ASTON/M.D. Sass Enhanced Equity Fund), ASTON/River Road Long-Short Fund, ASTON/Barings International Fund, ASTON/Harrison Street Real Estate Fund, and ASTON/Montag & Caldwell Balanced Fund, (the “Funds”)) as of October 31, 2012, and the related statements of operations, statements of changes in net assets, and financial highlights for the periods indicated therein. These financial statements and financial highlights are the responsibility of the Trust’s management. Our responsibility is to express an opinion on these financial statements and financial highlights based on our audits.
We conducted our audits in accordance with the standards of the Public Company Accounting Oversight Board (United States). Those standards require that we plan and perform the audits to obtain reasonable assurance about whether the financial statements and financial highlights are free of material misstatement. We were not engaged to perform an audit of the Trust’s internal control over financial reporting. Our audits included consideration of internal control over financial reporting as a basis for designing audit procedures that are appropriate in the circumstances, but not for the purpose of expressing an opinion on the effectiveness of the Trust’s internal control over financial reporting. Accordingly, we express no such opinion. An audit also includes examining, on a test basis, evidence supporting the amounts and disclosures in the financial statements and financial highlights, assessing the accounting principles used and significant estimates made by management, and evaluating the overall financial statement presentation. Our procedures included confirmation of securities owned as of October 31, 2012, by correspondence with the custodian and brokers or by other appropriate auditing procedures where replies from brokers were not received. We believe that our audits provide a reasonable basis for our opinion.
In our opinion, the financial statements and financial highlights referred to above present fairly, in all material respects, the financial position of each of the respective portfolios constituting the Aston Funds at October 31, 2012, and the results of their operations, the changes in their net assets, and the financial highlights for the periods indicated therein, in conformity with U.S. generally accepted accounting principles.

Chicago, Illinois
December 20, 2012
| | |
| |
| | October 31, 2012 |
| |
| Additional Information (unaudited) | | |
Form N-Q: The Trust files complete schedules of portfolio holdings for the Funds with the Securities and Exchange Commission (the “SEC”) for the Trust’s first and third quarters of each fiscal year on Form N-Q. The Trust’s Form N-Q are available on the SEC’s website at www.sec.gov and are available for review and copying at the SEC’s Public Reference Room in Washington, DC. Information on the operations of the Public Reference Room may be obtained by calling the SEC at 202-942-8090.
Proxy Voting: Aston Funds’ Proxy Voting Policies and Procedures, used to determine how to vote proxies relating to portfolio securities, are included in the Trust’s Statement of Additional Information, which is available (i) upon request, without charge, by calling 800-992-8151; (ii) on Aston Funds’ website at www. astonfunds.com; and (iii) on the SEC’s website at www. sec.gov. Aston Funds’ Proxy Voting Record for the most recent twelve-month period ended June 30 is available without charge (i) on the Funds’ website at www.astonfunds.com; and (ii) on the SEC’s website at www.sec.gov.
Tax Information: In accordance with Federal tax law, the following Funds hereby make the designations indicated below regarding their fiscal year ended October 31, 2012:
The following are the estimated percentages of the income dividends qualifying for the dividends received deduction available to corporations:
| | | | |
Fund | | Percentage | |
| M&C Growth Fund | | | 100.00 | % |
| Veredus Select Growth Fund | | | 100.00 | % |
| Herndon Large Cap Value Fund | | | 24.32 | % |
| Cornerstone Large Cap Value Fund | | | 100.00 | % |
| River Road Dividend All Cap Value Fund | | | 78.94 | % |
| River Road Dividend All Cap Value Fund II | | | 75.31 | % |
| Fairpointe Mid Cap Fund | | | 100.00 | % |
| River Road Select Value Fund | | | 100.00 | % |
| River Road Independent Value Fund | | | 15.43 | % |
| Lake Partners LASSO Alternatives Fund | | | 24.66 | % |
| Dynamic Allocation Fund | | | 14.20 | % |
| Anchor Capital Enhanced Equity Fund | | | 17.65 | % |
| Barings International Fund | | | 4.76 | % |
| Harrison Street Real Estate Fund | | | 29.07 | % |
| M&C Balanced Fund | | | 82.34 | % |
Each Fund designates 100%, or if subsequently different, of ordinary income dividends (“QDI”) to qualify for the lower tax rates applicable to individual shareholders; and 100%, or if subsequently different, of ordinary income dividends to qualify for the dividends received deduction (“DRD”) for corporate shareholders. The actual percentage of QDI and DRD for the calendar year will be designated in year-end tax statements.
For the fiscal year ended October 31, 2012, certain dividends may be subject to a maximum tax rate of 15%, as qualified dividend income (“QDI”) under the Jobs and Growth Tax Relief Reconciliation Act of 2003. For individual shareholders, a percentage of their ordinary income dividends (dividend income plus short-term gains, if any) may qualify for a maximum tax rate of
15%. Complete information is computed and reported in conjunction with your Form 1099-DIV.
| | | | |
Fund | | Percentage | |
| M&C Growth Fund | | | 100.00 | % |
| Veredus Select Growth Fund | | | 100.00 | % |
| Herndon Large Cap Value Fund | | | 21.89 | % |
| Cornerstone Large Cap Value Fund | | | 100.00 | % |
| River Road Dividend All Cap Value Fund | | | 85.79 | % |
| River Road Dividend All Cap Value Fund II | | | 62.58 | % |
| Fairpointe Mid Cap Fund | | | 100.00 | % |
| River Road Select Value Fund | | | 100.00 | % |
| River Road Independent Value Fund | | | 14.56 | % |
| Lake Partners LASSO Alternatives Fund | | | 32.38 | % |
| Dynamic Allocation Fund | | | 100.00 | % |
| Anchor Capital Enhanced Equity Fund | | | 2.63 | % |
| Barings International Fund | | | 100.00 | % |
| Harrison Street Real Estate Fund | | | 29.07 | % |
| M&C Balanced Fund | | | 88.27 | % |
Shareholders should not use the above tax information to prepare their tax returns. The information will be included with your Form 1099-DIV which will be sent to you separately in January 2013.
FACTORS CONSIDERED BY THE BOARD OF TRUSTEES IN APPROVING THE INVESTMENT ADVISORY AGREEMENT FOR ASTON/RIVER ROAD DIVIDEND ALL CAP VALUE FUND II
At an in-person meeting on June 21, 2012, the Board of Trustees (the “Board”) of Aston Funds (the “Trust”), including the trustees who are not “interested persons” as defined in Section 2(a)(9) of the Investment Company Act of 1940, as amended (the “Independent Trustees”), determined that the terms of the Investment Advisory Agreement with Aston Asset Management, LP (“Aston”) with respect to the ASTON/River Road Dividend All Cap Value Fund II (the “New Fund”) are fair and reasonable and approved the Investment Advisory Agreement for the New Fund as being in the best interests of the New Fund. In making such determinations, the Board, including the Independent Trustees, considered materials received and discussions held with respect to the approval of the Investment Advisory Agreement at the June meeting and prior meetings. The Independent Trustees met separately from the “interested” Trustees of the Trust and any officers of Aston or its affiliates to consider approval of the Investment Advisory Agreement with respect to the New Fund and were assisted by independent legal counsel in their deliberations.
In evaluating the Investment Advisory Agreement on behalf of the New Fund, the Board reviewed information regarding: (1) the nature, quality and extent of the services to be provided to the New Fund; (2) the advisory fees to be charged and estimated total expense ratio of the New Fund compared to a peer group of funds; (3) fee waivers or expenses to be reimbursed by the investment adviser and/or subadviser; and (4) potential benefits to be received by Aston or its affiliates from Aston’s relationship with the New Fund. In considering the Investment Advisory Agreement on behalf of the New Fund, the Board,
| | |
| |
| | October 31, 2012 |
| |
| Additional Information (unaudited) – continued | | |
including the Independent Trustees, did not identify any single factor or group of factors as all-important or controlling, but considered all factors together. The following summary does not detail all the matters considered.
Nature, Quality and Extent of Services. The Board considered the nature, quality and extent of services provided by Aston, including advisory services and administrative services. The Board considered that Aston is a manager-of-managers, and that in its role as adviser to the New Fund it intends to delegate the day-to-day investment responsibility for managing the New Fund to a subadviser. Accordingly, the Board considered Aston’s capabilities and processes with respect to the selection and monitoring of subadvisers on an ongoing basis, as well as information regarding the composition, experience and role of its Investment Committee. In this regard, the Board noted the responsibilities and experience of Aston personnel, the resources made available to such personnel, the ability of Aston to attract and retain high quality personnel and the organizational depth and stability of Aston.
In addition to advisory services, the Board considered the quality of other services provided by Aston including oversight of service providers, regulatory administration and Board support, fund administration and operational support, compliance services, shareholder servicing and platform management, and distribution and marketing related services. The Board also considered the nature and quantity of services provided by Aston with respect to other series of the Trust. On the basis of this evaluation, the Board concluded that the nature, quality and extent of services to be provided by Aston are expected to be satisfactory.
Fees and Expenses. The Board considered the New Fund’s proposed management fee rate and total net expense ratio after contractual expense reimbursements and fee waivers. As a part of this analysis, the Board compared the proposed advisory fees and total net expenses to those of a relevant peer group for the New Fund. The Board concluded that the proposed advisory fees were reasonable and appropriate in light of the nature, quality and extent of services to be provided by Aston.
Costs and Profitability. With respect to the costs of services to be provided and profits expected to be realized by Aston, the Board considered the resources involved in managing the New Fund in light of Aston’s business model as well as fee waivers or expenses to be reimbursed under an Expense Reimbursement Agreement with Aston. The Board noted that, with respect to the New Fund, Aston and the subadviser each generally will bear 50% of any fee waivers or expense reimbursements. Because the New Fund has not yet commenced operations, profitability information was not available. However, based upon projected asset size and the impact of fee waivers or expenses to be reimbursed by the investment adviser, the Board concluded that profitability was not expected to be unreasonable.
Economies of Scale. The Board considered the extent to which economies of scale would be realized as the New Fund grows. The Board considered the potential asset size of the New Fund,
as well as the terms of the Expense Reimbursement Agreement, and concluded that at this time the potential for economies of scale are limited.
Other Benefits to the Investment Adviser. The Board considered the nature and amount of fees to be paid by the New Fund for services to be provided by Aston for administration services. The Board noted that Aston currently does not intend to manage any of the Aston Funds directly, and therefore, will not benefit from the use of “soft” commission dollars to pay for research and brokerage services. The Board concluded that any other benefits to be received by the Adviser from its relationship with the New Fund was not expected to be unreasonable.
Conclusion. Based upon its evaluation of all material factors and assisted by the advice of independent legal counsel, the Board, including all of the Independent Trustees, concluded that the terms of the Investment Advisory Agreement for the New Fund, including the proposed advisory fee, were fair and reasonable, and that the Investment Advisory Agreement on behalf of the New Fund should be approved.
FACTORS CONSIDERED BY THE BOARD OF TRUSTEES IN APPROVING THE SUB-INVESTMENT ADVISORY AGREEMENT FOR ASTON/RIVER ROAD DIVIDEND ALL CAP VALUE FUND II
The Board of Trustees (the “Board”) of Aston Funds (the “Trust”), including the trustees who are not “interested persons” as defined in Section 2(a)(9) of the Investment Company Act of 1940, as amended (the “Independent Trustees”), considered the approval of a Sub-Investment Advisory Agreement (the “Sub-Investment Advisory Agreement”) between Aston Asset Management, LP (“Aston”) and River Road Asset Management, LLC (“River Road”) with respect to the ASTON/River Road Dividend All Cap Value Fund II (the “New Fund”), at an in-person meeting on June 21, 2012. The Board considered information provided and discussions held at the June meeting and at prior meetings.
The Independent Trustees met separately from the “interested” Trustees of the Trust and any officers of Aston, River Road or their affiliates to consider approval of the Sub-Investment Advisory Agreement and were assisted by independent legal counsel in their deliberations. Among the matters considered by the Board, including the Independent Trustees, in connection with its approval of the Sub-Investment Advisory Agreement were the following:
Nature, Quality and Extent of Services. The Board considered the nature, quality and extent of services expected to be provided under the Sub-Investment Advisory Agreement. The Board considered the reputation, qualifications and background of River Road and its operational and compliance infrastructure. The Board also considered information provided regarding River Road’s investment approach, the experience and skills of senior management and investment personnel of River Road, the resources made available to such personnel, the ability of River Road to attract and retain high-quality personnel, and the
| | |
| |
| | October 31, 2012 |
| |
| Additional Information (unaudited) – continued | | |
organizational depth of River Road. The Board also considered the nature and quality of services provided by River Road with respect to other series of the Trust. On the basis of this evaluation, the Board concluded that the nature, quality and extent of services to be provided by River Road are expected to be satisfactory.
Fees, Profitability and Economies of Scale. The Board considered the subadvisory fee rate under the Sub-Investment Advisory Agreement as well as the overall management fee structure of the New Fund, noting that the subadvisory fee rate is fifty percent (50%) of management fees, fee waivers and expense reimbursements incurred by Aston and, depending on the asset size of the Fund, less certain third party payments. The Board considered that the subadvisory fee rate was negotiated at arm’s length between Aston and River Road, an unaffiliated third party, and that Aston would compensate River Road from the fees it receives from the Fund. As part of its review of the investment advisory agreement with Aston, the Board considered whether there will be economies of scale with respect to the overall fee structure of the New Fund and whether the New Fund will benefit from any economies of scale. The Board determined that profitability information with respect to River Road was not material to its considerations in light of the fee model used by Aston and the unaffiliated status of River Road. The Board concluded that the proposed subadvisory fee rate was reasonable in light of the nature, quality and extent of services to be provided and that economies of scale were limited at this time.
Other Benefits to the Subadviser. The Board also considered the character and amount of other incidental benefits expected to be received by River Road and its affiliates. The Board considered potential benefits to River Road from the use of “soft dollars” to pay for research services generated by parties other than the executing broker-dealer. The Board concluded that the subadvisory fees were reasonable taking into account any other benefits expected to be received by River Road from its relationship with the New Fund.
Conclusion. Based on all of the information considered and the conclusions reached, the Board determined that the terms of the Sub-Investment Advisory Agreement are fair and reasonable, and that the approval of the Sub-Investment Advisory Agreement is in the best interests of the New Fund. No single factor was determinative in the Board’s analysis.
FACTORS CONSIDERED BY THE BOARD OF TRUSTEES IN APPROVING THE SUB-INVESTMENT ADVISORY AGREEMENT FOR ASTON/ANCHOR CAPITAL ENHANCED EQUITY FUND
The Board of Trustees (the “Board”) of Aston Funds (the “Trust”), including the trustees who are not “interested persons” as defined in Section 2(a)(9) of the Investment Company Act of 1940, as amended (the “Independent Trustees”), considered the approval of a Sub-Investment Advisory Agreement (the “Sub-Investment Advisory Agreement”) between Aston Asset Management, LP (“Aston”) and Anchor Capital Advisors LLC (“Anchor Capital”) with respect to the ASTON/Anchor Capital Enhanced Equity Fund
(formerly, ASTON/M.D. Sass Enhanced Equity Fund) (the “Fund”), at an in-person meeting on June 21, 2012. The Board considered information provided and discussions held at the June 21, 2012 meeting.
The Independent Trustees met separately from the “interested” Trustees of the Trust and any officers of Aston, Anchor Capital or their affiliates to consider approval of the Sub-Investment Advisory Agreement and were assisted by independent legal counsel in their deliberations. Among the matters considered by the Board, including the Independent Trustees, in connection with its approval of the Sub-Investment Advisory Agreement were the following:
Nature, Quality and Extent of Services. The Board considered the nature, quality and extent of services expected to be provided under the Sub-Investment Advisory Agreement. The Board considered the reputation, qualifications and background of Anchor Capital and its operational and compliance infrastructure. The Board also considered information provided regarding the experience and skills of senior management and investment personnel of Anchor Capital, the resources made available to such personnel, the ability of Anchor Capital to attract and retain high-quality personnel, and the organizational depth of Anchor Capital. The Board considered that Mr. Ronald Altman, the portfolio manager of the Fund since its inception, would continue to manage the Fund at Anchor Capital, and that the investment objective and principal strategies of the Fund would not change. On the basis of this evaluation, the Board concluded that the nature, quality and extent of services to be provided by Anchor Capital are expected to be satisfactory.
Fees, Profitability and Economies of Scale. The Board considered the subadvisory fee rate under the Sub-Investment Advisory Agreement as well as the overall management fee structure of the Fund, noting that the subadvisory fee rate is fifty percent (50%) of management fees less certain third party payments, fee waivers and expense reimbursements incurred by Aston. The Board considered that the subadvisory fee rate was negotiated at arm’s length between Aston and Anchor Capital, an unaffiliated third party, and that Aston would compensate Anchor Capital from the fees it receives from the Fund. As part of its review of the investment advisory agreement with Aston during the annual contract renewal process, the Board had considered whether there would be economies of scale with respect to the overall fee structure of the Fund and whether the Fund would benefit from any economies of scale.
The Board also considered information provided by Anchor Capital with respect to fees charged to other clients. The Board considered that the fee rates charged to the Fund and other clients vary because of the additional regulatory and compliance requirements, among other things, associated with registered investment companies such as the Fund and other differences in the products and services provided, including differences in fee structures. The Board determined that profitability information with respect to the Anchor Capital was not material to its considerations in light of the fee model used by Aston and
| | |
| |
| | October 31, 2012 |
| |
| Additional Information (unaudited) – continued | | |
the unaffiliated status of Anchor Capital. The Board concluded that the proposed subadvisory fee rate was reasonable in light of the nature, quality and extent of services to be provided and that economies of scale were limited at this time.
Other Benefits to the Subadviser. The Board also considered the character and amount of other incidental benefits expected to be received by Anchor Capital as a result of its association with the Fund. The Board considered potential benefits to Anchor Capital from the use of “soft dollars” to pay for research services generated by parties other than the executing broker-dealer. The Board concluded that the subadvisory fees were reasonable taking into account any other benefits expected to be received by Anchor Capital from its relationship with the Fund.
Conclusion. Based on all of the information considered and the conclusions reached, the Board determined that the terms of the Sub-Investment Advisory Agreement are fair and reasonable, and that the approval of the Sub-Investment Advisory Agreement is in the best interests of the Fund. No single factor was determinative in the Board’s analysis.
FACTORS CONSIDERED BY THE BOARD OF TRUSTEES IN APPROVING THE CONTINUATION OF THE EXISTING SUB-INVESTMENT ADVISORY AGREEMENT FOR ASTON/CORNERSTONE LARGE CAP VALUE FUND
The Board of Trustees (the “Board”) of Aston Funds (the “Trust”), including the trustees who are not “interested persons” as defined in Section 2(a)(9) of the Investment Company Act of 1940, as amended (the “Independent Trustees”), considered the approval of the continuation of the Sub-Investment Advisory Agreement (the “Sub-Investment Advisory Agreement”) between Aston Asset Management, LP (“Aston”) and Cornerstone Investment Partners, LLC (“Cornerstone”) with respect to the ASTON/Cornerstone Large Cap Value Fund (the “Fund”), at an in-person meeting on September 20, 2012.
The Board considered information provided and discussions held at the September 20, 2012 meeting regarding certain anticipated ownership changes of Cornerstone, resulting from the retirement of the original founders (the “Transaction”). The Board considered that the Transaction may be deemed to result in an assignment of the Sub-Investment Advisory Agreement which would result in its automatic termination.
The Independent Trustees met separately from the “interested” Trustees of the Trust and any officers of Aston, Cornerstone or their affiliates to consider the approval of the continuation of the Sub-Investment Advisory Agreement and were assisted by independent legal counsel in their deliberations.
In determining whether to approve the continuation of the Sub-Investment Advisory Agreement, the Board noted that at its June 23, 2011 meeting, it had determined to approve the Sub-Investment Advisory Agreement. The Board also noted that, at its
September 15, 2011 meeting, it had determined to approve the continuation of the Sub-Investment Advisory Agreement (as a result of similar ownership changes in anticipation of the retirement of the founders) on the same terms, including the fees payable to Cornerstone. The Board noted that, with respect to the Sub-Investment Advisory Agreement, it had considered: (i) the nature, extent and quality of services to be provided; (ii) the sub-advisory fee rate and overall fee structure of the Fund; and (iii) other potential benefits to be received by Cornerstone. The Board considered that at its June 23, 2011 meeting, it had determined that the terms of the Sub-Investment Advisory Agreement were fair and reasonable and that the approval of the Sub-Investment Advisory Agreement was in the best interests of the Fund.
The Board also considered whether the Transaction would result in any change in personnel of Cornerstone and whether it would impact the nature, extent or quality of services provided to the Fund. Based on the information provided by Cornerstone, it was noted that the Transaction would not impact the nature, extent or quality of services provided by Cornerstone and that the Fund’s current portfolio management team would not change as a result.
Conclusion. Based on all of the information considered and the conclusions reached, the Board determined that the terms of the Sub-Investment Advisory Agreement were fair and reasonable, and that the approval of the continuation of the Sub-Investment Advisory Agreement was in the best interests of the Fund. No single factor was determinative in the Board’s analysis.
Disclosure of Fund Expenses: We believe it is important for you to understand the impact of fees regarding your investment. All mutual funds have operating expenses. As a shareholder of a mutual fund, you incur ongoing costs, which include costs for portfolio management, administrative services, and shareholder reports (like this one), among others. Operating expenses, which are deducted from a fund’s gross income, directly reduce the investment return of the fund. A fund’s expenses are expressed as a percentage of its average daily net assets. This figure is known as the expense ratio. The following examples are intended to help you understand the ongoing fees (in dollars) of investing in your Fund and to compare these costs with those of other mutual funds. The examples are based on an investment of $1,000 made at the beginning of the period shown and held for the entire period.
This table illustrates each Fund’s costs in two ways:
Actual Fund Return: This section helps you to estimate the actual expenses, after any applicable fee waivers, that you paid over the period. The “Ending Account Value” shown is derived from the Fund’s actual return for the past six-month period, the “Expense Ratio” column shows the period’s annualized expense
| | |
| |
| | October 31, 2012 |
| |
| Additional Information (unaudited) – continued | | |
ratio, and the “Expenses Paid During Period” column shows the dollar amount that would have been paid by an investor who started with $1,000 in the Fund at the beginning of the period. You may use the information here, together with your account value, to estimate the expenses that you paid over the period. To do so, simply divide your account value by $1,000 (for example, an $8,600 account value divided by $1,000 = 8.6), then multiply the result by the number given for your Fund in the first line under the heading entitled “Expenses Paid During Period.”
Hypothetical 5% Return: This section is intended to help you compare your Fund’s costs with those of other mutual funds. It assumes that the Fund had an annual return of 5% before expenses, but that the expense ratio is unchanged. In this case, because the return used is not the Fund’s actual return, the results do not apply to your investment. This example is useful in making comparisons to other mutual funds because the SEC requires all mutual funds to calculate expenses based on an assumed 5% annual return. You can assess your Fund’s costs by comparing this hypothetical example with the hypothetical examples that appear in shareholder reports of other funds.
Please note that the expenses shown in the table are meant to highlight and help you compare your ongoing costs only and do not reflect any transactional costs such as sales charges (loads) and redemption fees, which are described in the prospectus. If these costs were applied to your account, your costs would be higher.
| | | | | | | | | | | | | | | | |
| | | Beginning
Account
Value
5/1/12 | | | Ending
Account
Value
10/31/12 | | | Expense
Ratio(1) | | | Expenses
Paid During
Period(2) | |
| M&C Growth Fund | | | | | | | | | | | | | | | | |
Actual Fund Return | | | | | | | | | | | | | | | | |
Class N | | | $1,000 | | | | $1,001.20 | | | | 1.05% | | | | $5.28 | |
Class I | | | 1,000 | | | | 1,002.00 | | | | 0.80% | | | | 4.03 | |
Class R | | | 1,000 | | | | 999.60 | | | | 1.30% | | | | 6.53 | |
Hypothetical 5% Return | | | | | | | | | | | | | | | | |
Class N | | | $1,000 | | | | $1,019.86 | | | | 1.05% | | | | $5.33 | |
Class I | | | 1,000 | | | | 1,021.11 | | | | 0.80% | | | | 4.06 | |
Class R | | | 1,000 | | | | 1,018.60 | | | | 1.30% | | | | 6.60 | |
| Veredus Select Growth Fund | | | | | | | | | | | | | | | | |
Actual Fund Return | | | | | | | | | | | | | | | | |
Class N | | | $1,000 | | | | $981.40 | | | | 1.30% | | | | $6.47 | |
Class I | | | 1,000 | | | | 983.40 | | | | 1.05% | | | | 5.23 | |
Hypothetical 5% Return | | | | | | | | | | | | | | | | |
Class N | | | $1,000 | | | | $1,018.60 | | | | 1.30% | | | | $6.60 | |
Class I | | | 1,000 | | | | 1,019.86 | | | | 1.05% | | | | 5.33 | |
| TAMRO Diversified Equity Fund | | | | | | | | | | | | | |
Actual Fund Return | | | | | | | | | | | | | | | | |
Class N | | | $1,000 | | | | $1,006.00 | | | | 1.20% | | | | $6.05 | |
Class I | | | 1,000 | | | | 1,007.40 | | | | 0.95% | | | | 4.79 | |
Hypothetical 5% Return | | | | | | | | | | | | | | | | |
Class N | | | $1,000 | | | | $1,019.10 | | | | 1.20% | | | | $6.09 | |
Class I | | | 1,000 | | | | 1,020.36 | | | | 0.95% | | | | 4.82 | |
| Herndon Large Cap Value Fund | | | | | | | | | | | | | |
Actual Fund Return | | | | | | | | | | | | | | | | |
Class N | | | $1,000 | | | | $988.20 | | | | 1.30% | | | | $6.50 | |
Class I | | | 1,000 | | | | 989.00 | | | | 1.05% | | | | 5.25 | |
Hypothetical 5% Return | | | | | | | | | | | | | | | | |
Class N | | | $1,000 | | | | $1,018.60 | | | | 1.30% | | | | $6.60 | |
Class I | | | 1,000 | | | | 1,019.86 | | | | 1.05% | | | | 5.33 | |
| | | | | | | | | | | | | | | | |
| | | Beginning
Account
Value
5/1/12 | | | Ending
Account
Value
10/31/12 | | | Expense
Ratio(1) | | | Expenses
Paid During
Period(2) | |
| Cornerstone Large Cap Value Fund | | | | | | | | | | | | | |
Actual Fund Return | | | | | | | | | | | | | | | | |
Class N | | | $1,000 | | | | $1,011.90 | | | | 1.30% | | | | $6.57 | |
Class I | | | 1,000 | | | | 1,013.70 | | | | 1.05% | | | | 5.31 | |
Hypothetical 5% Return | | | | | | | | | | | | | | | | |
Class N | | | $1,000 | | | | $1,018.60 | | | | 1.30% | | | | $6.60 | |
Class I | | | 1,000 | | | | 1,019.86 | | | | 1.05% | | | | 5.33 | |
| River Road Dividend All Cap Value Fund | | | | | | | | | | | | | |
Actual Fund Return | | | | | | | | | | | | | | | | |
Class N | | | $1,000 | | | | $1,037.50 | | | | 1.13% | | | | $5.79 | |
Class I | | | 1,000 | | | | 1,038.90 | | | | 0.88% | | | | 4.51 | |
Hypothetical 5% Return | | | | | | | | | | | | | | | | |
Class N | | | $1,000 | | | | $1,019.46 | | | | 1.13% | | | | $5.74 | |
Class I | | | 1,000 | | | | 1,020.71 | | | | 0.88% | | | | 4.47 | |
| River Road Dividend All Cap Value Fund II(3) | | | | | | | | | |
Actual Fund Return | | | | | | | | | | | | | | | | |
Class N | | | $1,000 | | | | $1,050.90 | | | | 1.30% | | | | $4.63 | |
Class I | | | 1,000 | | | | 1,051.70 | | | | 1.05% | | | | 3.74 | |
Hypothetical 5% Return | | | | | | | | | | | | | | | | |
Class N | | | $1,000 | | | | $1,018.60 | | | | 1.30% | | | | $6.60 | |
Class I | | | 1,000 | | | | 1,019.86 | | | | 1.05% | | | | 5.33 | |
| Fairpointe Mid Cap Fund | | | | | | | | | | | | | |
Actual Fund Return | | | | | | | | | | | | | | | | |
Class N | | | $1,000 | | | | $1,020.60 | | | | 1.10% | | | | $5.59 | |
Class I | | | 1,000 | | | | 1,021.80 | | | | 0.85% | | | | 4.32 | |
Hypothetical 5% Return | | | | | | | | | | | | | | | | |
Class N | | | $1,000 | | | | $1,019.61 | | | | 1.10% | | | | $5.58 | |
Class I | | | 1,000 | | | | 1,020.86 | | | | 0.85% | | | | 4.32 | |
| M&C Mid Cap Growth Fund | | | | | | | | | | | | | |
Actual Fund Return | | | | | | | | | | | | | | | | |
Class N | | | $1,000 | | | | $959.30 | | | | 1.25% | | | | $6.16 | |
Hypothetical 5% Return | | | | | | | | | | | | | | | | |
Class N | | | $1,000 | | | | $1,018.85 | | | | 1.25% | | | | $6.34 | |
| Veredus Small Cap Growth Fund | | | | | | | | | | | | | |
Actual Fund Return | | | | | | | | | | | | | | | | |
Class N | | | $1,000 | | | | $984.10 | | | | 1.49% | | | | $7.43 | |
Class I | | | 1,000 | | | | 985.40 | | | | 1.24% | | | | 6.19 | |
Hypothetical 5% Return | | | | | | | | | | | | | | | | |
Class N | | | $1,000 | | | | $1,017.65 | | | | 1.49% | | | | $7.56 | |
Class I | | | 1,000 | | | | 1,018.90 | | | | 1.24% | | | | 6.29 | |
| Small Cap Growth Fund | | | | | | | | | | | | | |
Actual Fund Return | | | | | | | | | | | | | | | | |
Class N | | | $1,000 | | | | $1,027.00 | | | | 1.35% | | | | $6.88 | |
Class I | | | 1,000 | | | | 1,027.80 | | | | 1.10% | | | | 5.61 | |
Hypothetical 5% Return | | | | | | | | | | | | | | | | |
Class N | | | $1,000 | | | | $1,018.35 | | | | 1.35% | | | | $6.85 | |
Class I | | | 1,000 | | | | 1,019.61 | | | | 1.10% | | | | 5.58 | |
| Silvercrest Small Cap Fund | | | | | | | | | | | | | |
Actual Fund Return | | | | | | | | | | | | | | | | |
Class N | | | $1,000 | | | | $990.00 | | | | 1.40% | | | | $7.00 | |
Class I | | | 1,000 | | | | 991.80 | | | | 1.15% | | | | 5.76 | |
Hypothetical 5% Return | | | | | | | | | | | | | | | | |
Class N | | | $1,000 | | | | $1,018.10 | | | | 1.40% | | | | $7.10 | |
Class I | | | 1,000 | | | | 1,019.36 | | | | 1.15% | | | | 5.84 | |
| TAMRO Small Cap Fund | | | | | | | | | | | | | |
Actual Fund Return | | | | | | | | | | | | | | | | |
Class N | | | $1,000 | | | | $1,000.00 | | | | 1.28% | | | | $6.43 | |
Class I | | | 1,000 | | | | 1,001.00 | | | | 1.03% | | | | 5.18 | |
Hypothetical 5% Return | | | | | | | | | | | | | | | | |
Class N | | | $1,000 | | | | $1,018.70 | | | | 1.28% | | | | $6.50 | |
Class I | | | 1,000 | | | | 1,019.96 | | | | 1.03% | | | | 5.23 | |
| | |
| |
| | October 31, 2012 |
| |
| Additional Information (unaudited) – continued | | |
| | | | | | | | | | | | | | | | |
| | | Beginning
Account
Value
5/1/12 | | | Ending
Account
Value
10/31/12 | | | Expense
Ratio(1) | | | Expenses
Paid During
Period(2) | |
| River Road Select Value Fund | | | | | | | | | | | | | |
Actual Fund Return | | | | | | | | | | | | | | | | |
Class N | | | $1,000 | | | | $1,026.60 | | | | 1.41% | | | | $7.18 | |
Class I | | | 1,000 | | | | 1,027.50 | | | | 1.16% | | | | 5.91 | |
Hypothetical 5% Return | | | | | | | | | | | | | | | | |
Class N | | | $1,000 | | | | $1,018.05 | | | | 1.41% | | | | $7.15 | |
Class I | | | 1,000 | | | | 1,019.30 | | | | 1.16% | | | | 5.89 | |
| River Road Small Cap Value Fund | | | | | | | | | | | | | |
Actual Fund Return | | | | | | | | | | | | | | | | |
Class N | | | $1,000 | | | | $1,019.60 | | | | 1.35% | | | | $6.85 | |
Class I | | | 1,000 | | | | 1,021.00 | | | | 1.10% | | | | 5.59 | |
Hypothetical 5% Return | | | | | | | | | | | | | | | | |
Class N | | | $1,000 | | | | $1,018.35 | | | | 1.35% | | | | $6.85 | |
Class I | | | 1,000 | | | | 1,019.61 | | | | 1.10% | | | | 5.58 | |
| River Road Independent Value Fund(4) | | | | | | | | | | | | | |
Actual Fund Return | | | | | | | | | | | | | | | | |
Class N | | | $1,000 | | | | $1,049.60 | | | | 1.42% | | | | $7.32 | |
Class I | | | 1,000 | | | | 1,050.40 | | | | 1.17% | | | | 6.03 | |
Hypothetical 5% Return | | | | | | | | | | | | | | | | |
Class N | | | $1,000 | | | | $1,018.00 | | | | 1.42% | | | | $7.20 | |
Class I | | | 1,000 | | | | 1,019.25 | | | | 1.17% | | | | 5.94 | |
| DoubleLine Core Plus Fixed Income Fund | | | | | | | | | | | | | |
Actual Fund Return | | | | | | | | | | | | | | | | |
Class N | | | $1,000 | | | | $1,046.60 | | | | 0.94% | | | | $4.84 | |
Class I | | | 1,000 | | | | 1,047.80 | | | | 0.69% | | | | 3.55 | |
Hypothetical 5% Return | | | | | | | | | | | | | | | | |
Class N | | | $1,000 | | | | $1,020.41 | | | | 0.94% | | | | $4.77 | |
Class I | | | 1,000 | | | | 1,021.67 | | | | 0.69% | | | | 3.51 | |
| TCH Fixed Income Fund | | | | | | | | | | | | | |
Actual Fund Return | | | | | | | | | | | | | | | | |
Class N | | | $1,000 | | | | $1,057.90 | | | | 0.84% | | | | $4.35 | |
Class I | | | 1,000 | | | | 1,057.60 | | | | 0.69% | | | | 3.57 | |
Hypothetical 5% Return | | | | | | | | | | | | | | | | |
Class N | | | $1,000 | | | | $1,020.91 | | | | 0.84% | | | | $4.27 | |
Class I | | | 1,000 | | | | 1,021.67 | | | | 0.69% | | | | 3.51 | |
| Lake Partners LASSO Alternatives Fund(4) | | | | | | | | | | | | | |
Actual Fund Return | | | | | | | | | | | | | | | | |
Class N | | | $1,000 | | | | $1,005.70 | | | | 1.45% | | | | $7.31 | |
Class I | | | 1,000 | | | | 1,006.50 | | | | 1.20% | | | | 6.05 | |
Hypothetical 5% Return | | | | | | | | | | | | | | | | |
Class N | | | $1,000 | | | | $1,017.85 | | | | 1.45% | | | | $7.35 | |
Class I | | | 1,000 | | | | 1,019.10 | | | | 1.20% | | | | 6.09 | |
| Dynamic Allocation Fund | | | | | | | | | | | | | |
Actual Fund Return | | | | | | | | | | | | | | | | |
Class N | | | $1,000 | | | | $1,011.90 | | | | 1.30% | | | | $6.57 | |
Class I | | | 1,000 | | | | 1,013.10 | | | | 1.05% | | | | 5.31 | |
Hypothetical 5% Return | | | | | | | | | | | | | | | | |
Class N | | | $1,000 | | | | $1,018.60 | | | | 1.30% | | | | $6.60 | |
Class I | | | 1,000 | | | | 1,019.86 | | | | 1.05% | | | | 5.33 | |
| Anchor Capital Enhanced Equity Fund(4) | | | | | | | | | | | | | |
Actual Fund Return | | | | | | | | | | | | | | | | |
Class N | | | $1,000 | | | | $985.70 | | | | 1.24% | | | | $6.19 | |
Class I | | | 1,000 | | | | 986.90 | | | | 0.99% | | | | 4.94 | |
Hypothetical 5% Return | | | | | | | | | | | | | | | | |
Class N | | | $1,000 | | | | $1,018.90 | | | | 1.24% | | | | $6.29 | |
Class I | | | 1,000 | | | | 1,020.16 | | | | 0.99% | | | | 5.03 | |
| River Road Long-Short Fund(5) | | | | | | | | | | | | | |
Actual Fund Return | | | | | | | | | | | | | | | | |
Class N | | | $1,000 | | | | $1,029.80 | | | | 1.70% | | | | $8.67 | |
Hypothetical 5% Return | | | | | | | | | | | | | | | | |
Class N | | | $1,000 | | | | $1,016.59 | | | | 1.70% | | | | $8.62 | |
| | | | | | | | | | | | | | | | |
| | | Beginning
Account
Value
5/1/12 | | | Ending
Account
Value
10/31/12 | | | Expense
Ratio(1) | | | Expenses
Paid During
Period(2) | |
| Barings International Fund | | | | | | | | | | | | | |
Actual Fund Return | | | | | | | | | | | | | | | | |
Class N | | | $1,000 | | | | $991.30 | | | | 1.40% | | | | $7.01 | |
Class I | | | 1,000 | | | | 994.20 | | | | 1.15% | | | | 5.76 | |
Hypothetical 5% Return | | | | | | | | | | | | | | | | |
Class N | | | $1,000 | | | | $1,018.10 | | | | 1.40% | | | | $7.10 | |
Class I | | | 1,000 | | | | 1,019.36 | | | | 1.15% | | | | 5.84 | |
| Harrison Street Real Estate Fund | | | | | | | | | | | | | |
Actual Fund Return | | | | | | | | | | | | | | | | |
Class N | | | $1,000 | | | | $1,021.40 | | | | 1.37% | | | | $6.96 | |
Class I | | | 1,000 | | | | 1,022.50 | | | | 1.12% | | | | 5.69 | |
Hypothetical 5% Return | | | | | | | | | | | | | | | | |
Class N | | | $1,000 | | | | $1,018.25 | | | | 1.37% | | | | $6.95 | |
Class I | | | 1,000 | | | | 1,019.51 | | | | 1.12% | | | | 5.69 | |
| M&C Balanced Fund | | | | | | | | | | | | | |
Actual Fund Return | | | | | | | | | | | | | | | | |
Class N | | | $1,000 | | | | $1,007.30 | | | | 1.20% | | | | $6.05 | |
Class I | | | 1,000 | | | | 1,007.80 | | | | 1.10% | | | | 5.55 | |
Hypothetical 5% Return | | | | | | | | | | | | | | | | |
Class N | | | $1,000 | | | | $1,019.10 | | | | 1.20% | | | | $6.09 | |
Class I | | | 1,000 | | | | 1,019.61 | | | | 1.10% | | | | 5.58 | |
| (1) | Annualized, based on the Fund’s most recent fiscal half-year expenses. |
| (2) | Expenses are equal to the Fund’s annualized expense ratio multiplied by the average account value over the period, multiplied by the number of days in the most recent fiscal half-year (184) or partial year, if applicable, for the actual return and multiplied by the most recent fiscal half-year for the hypothetical 5% return, then divided by 366. Expense ratios do not include interest expense, if applicable. |
| (3) | River Road Dividend All Cap Value Fund II began issuing shares on June 27, 2012. |
| (4) | Earnings Credit did not affect the six months expense ratio for the six months ended October 31, 2012. |
| (5) | Excludes interest expense and dividends on short positions. If included, your annualized expenses ratio is 2.64% and your actual and hypothetical expenses paid during the period are $13.47 and $13.35, respectively. |
| | |
| |
| | October 31, 2012 |
| |
| Additional Information (unaudited) – continued | | |
TRUSTEES AND OFFICERS OF THE TRUST
Under Delaware law, the business and affairs of the Trust are managed under the direction of the Board of Trustees. Information pertaining to the Trustees and Executive Officers of the Trust is set forth below. The term “officer” means the president, vice president, secretary, treasurer, controller or any other officer who performs a policy making function.
| | | | | | | | | | | | |
Name, Address, Age and Position(s) with Trust | | Term of Office 1 and Length of Time Served | | Principal Occupation(s) During Past Five Years | | Number of Portfolios in Fund Complex 2
Overseen by Trustee | | | Other Trusteeships/ Directorships Held by Trustee During Past Five Years | | Experience, Qualifications, Attributes, Skills for Board Membership |
| | | | |
| INDEPENDENT TRUSTEES | | | | | | | | | | |
William E. Chapman, II c/o Aston Funds 120 N. LaSalle Street Chicago, IL 60602 Age: 71 Trustee; Independent Chairman | | Since 2010 | | President and Owner, Longboat Retirement Planning Solutions (1998-present); Trustee of Bowdoin College (2002-present); Hewitt Associates, LLC (part time) (provider of Retirement and Investment Education Seminars) (resigned Nov. 2009) | | | 25 | | | Director of Harding, Loevner Funds, Inc. (6 portfolios); Trustee of Third Avenue Trust (5 portfolios); Trustee of Third Avenue Variable Trust (1 portfolio); Trustee of The Managers Funds, Managers AMG Funds, Managers Trust I and Managers Trust II (39 portfolios) | | Significant board experience; significant executive experience with several financial services firms; service as Independent Chairman of the Board. |
| | | | | |
Edward J. Kaier c/o Aston Funds 120 N. LaSalle Street Chicago, IL 60602 Age: 67 Trustee | | Since 2010 | | Attorney at Law and Partner, Teeters Harvey Gilboy & Kaier LLP (2007-present); Attorney at Law and Partner, Hepburn Willcox Hamilton & Putnam, LLP (1977-2007) | | | 25 | | | Trustee of Third Avenue Trust (5 portfolios); Trustee of Third Avenue Variable Trust (1 portfolio); Trustee of The Managers Funds, Managers AMG Funds, Managers Trust I and Managers Trust II (39 portfolios) | | Significant board experience; practicing attorney. |
| | | | | |
Gregory T. Mutz c/o Aston Funds 120 N. LaSalle Street Chicago, IL 60602 Age: 67 Trustee | | Since 1993 | | Chairman and CEO of AMLI Residential Properties Trust (a Multifamily REIT), a successor company to AMLI Realty Co. (2004-present); Vice Chairman of UICI (NYSE: UCI) (an insurance holding company) (2003-2004) | | | 25 | | | Member of Board of Genesis Financial Solutions (a privately-held company based in Portland, Oregon providing debt recovery, consumer lending and credit card services) (2005-present); a member of the Board of WAN S.A., a residential real estate company headquartered in Warsaw, Poland (2008-present); a member of the Board of Suknip International Limited, a residential real estate company headquartered in St. Petersburg, Russia (2008- present); Formerly, Director of Alico, Inc. (NASDAQ: ALCO) (agribusiness) (2005-2009) | | Significant board experience; previous service as lead independent trustee; significant executive experience with several financial services firms. |
| | |
| |
| | October 31, 2012 |
| |
| Additional Information (unaudited) – continued | | |
| | | | | | | | | | | | |
Name, Address, Age and Position(s) with Trust | | Term of Office 1 and Length of Time Served | | Principal Occupation(s) During Past Five Years | | Number of Portfolios in Fund Complex 2
Overseen by Trustee | | | Other Trusteeships/ Directorships Held by Trustee During Past Five Years | | Experience, Qualifications, Attributes, Skills for Board Membership |
| | | | |
| INDEPENDENT TRUSTEES Continued) | | | | | | | | | | |
Steven J. Paggioli c/o Aston Funds 120 N. LaSalle Street Chicago, IL 60602 Age: 62 Trustee | | Since 2010 | | Independent Consultant (2002-present); formerly Executive Vice President and Director, The Wadsworth Group (1986-2001); Executive Vice President, Secretary and Director, Investment Company Administration, LLC (1990- 2001); Vice President, Secretary and Director, First Fund Distributors, Inc. (1991- 2001) | | | 25 | | | Trustee, Professionally Managed Portfolios (43 portfolios); Advisory Board Member, Sustainable Growth Advisors, LP; Independent Director, Chase Investment Counsel; Trustee of The Managers Funds, Managers AMG Funds, Managers Trust I and Managers Trust II (39 portfolios) | | Significant board experience; significant executive experience with several financial services firms; former service with financial service regulator. |
| | | | | |
Eric Rakowski c/o Aston Funds 120 N. LaSalle Street Chicago, IL 60602 Age: 54 Trustee | | Since 2010 | | Professor, University of California at Berkeley School of Law (1990-present) | | | 25 | | | Director of Harding, Loevner Funds, Inc. (6 portfolios); Trustee of Third Avenue Trust (5 portfolios); Trustee of Third Avenue Variable Trust (1 portfolio); Trustee of The Managers Funds, Managers AMG Funds, Managers Trust I and Managers Trust II (39 portfolios) | | Significant board experience; former practicing attorney; currently, professor of law. |
| | | | | |
Robert B. Scherer c/o Aston Funds 120 N. LaSalle Street Chicago, IL 60602 Age: 71 Trustee | | Since 1999 | | President of The Rockridge Group, Ltd. (title insurance industry consulting services) (1994-present) | | | 25 | | | Director, Title Reinsurance Company (insurance for title agents) (1998- present) | | Significant board experience; continuing service as Chair of the Audit Committee; significant executive experience as chief financial officer of insurance and financial services firm. |
| | |
| |
| | October 31, 2012 |
| |
| Additional Information (unaudited) – continued | | |
| | | | | | | | | | | | |
Name, Address, Age and Position(s) with Trust | | Term of Office 1 and Length of Time Served | | Principal Occupation(s) During Past Five Years | | Number of Portfolios in Fund Complex 2
Overseen by Trustee | | | Other Trusteeships/ Directorships Held by Trustee During Past Five Years | | Experience, Qualifications, Attributes, Skills for Board Membership |
| | | | |
| INDEPENDENT TRUSTEES (continued) | | | | | | | | | | |
Thomas R. Schneeweis c/o Aston Funds 120 N. LaSalle Street Chicago, IL 60602 Age: 71 Trustee | | Since 2010 | | Professor of Finance, University of Massachusetts (1977-present); Director, CISDM at the University of Massachusetts, (1996-present); President, TRS Associates (1982-present); President, Alternative Investment Analytics, LLC (formerly Schneeweis Partners, LLC) (2001-present); Partner, White Bear Partners, LLC (2007-2010); Partner, S Capital Management, LLC (2007-present); Partner, Northampton Capital Management, LLC (2004-2010) | | | 25 | | | Trustee of The Managers Funds, Managers AMG Funds, Managers Trust I and Managers Trust II (39 portfolios) | | Significant board experience; currently professor of finance; significant executive experience with several investment partnerships. |
| | | | |
| INTERESTED TRUSTEES | | | | | | | | | | |
Stuart D. Bilton, CFA3 c/o Aston Funds 120 N. LaSalle Street Chicago, IL 60602 Age: 66 Trustee; Chief Executive Officer | | Trustee since 1993; Chief Executive Officer since 2010 | | Chief Executive Officer, Aston Asset Management, LP (2006-present); Chairman, Aston Funds (1993-2010); Vice Chairman of ABN AMRO Asset Management Holdings, Inc. (2003-2006); President and Chief Executive Officer of ABN AMRO Asset Management Holdings, Inc. (2001-2003); President of Alleghany Asset Management, Inc. (1996-2001) (purchased by ABN AMRO in February 2001) | | | 25 | | | Director, Baldwin & Lyons, Inc. (property and casualty insurance firm) (1987-present); Director, Highbury Financial Inc. (2009- 2010) | | Significant board experience; significant executive experience with several financial services firms; former Chairman of the Board. |
| | | | | |
Jeffrey S. Murphy3 c/o Aston Funds 120 N. LaSalle Street Chicago, IL 60602 Age: 46 Trustee | | Since 2010 | | Senior Vice President, Affiliated Managers Group, Inc. (2007-present); Vice President, Affiliated Managers Group, Inc. (1995-2007) | | | 25 | | | N/A | | Significant financial industry experience; significant executive experience with several financial services firms. |
| | |
| |
| | October 31, 2012 |
| |
| Additional Information (unaudited) – continued | | |
| | | | | | | | | | | | |
Name, Address, Age and Position(s) with Trust | | Term of Office 1 and Length of Time Served | | Principal Occupation(s) During Past Five Years | | Number of Portfolios in Fund Complex 2 Overseen by Trustee | | | Other Trusteeships/ Directorships Held by Trustee During Past Five Years | | Experience, Qualifications, Attributes, Skills for Board Membership |
| | | | |
| OFFICER(S) WHO ARE NOT TRUSTEES | | | | | | | | | | |
Kenneth C. Anderson c/o Aston Funds 120 N. LaSalle Street Chicago, IL 60602 Age: 48 President | | Since 1993 | | President, Aston Asset Management, LP (2006-present); Director, Highbury Financial Inc. (2009-2010); President and Chief Executive Officer of ABN AMRO Investment Fund Services, Inc. (formerly known as Alleghany Investment Services, Inc.) (1995-2006); Executive Vice President of ABN AMRO Asset Management (USA) LLC (2001-2005); Director, ABN AMRO Trust Services Company (2001-2005); Director, TAMRO Capital Partners LLC and Veredus Asset Management LLC (2001-2006); CPA | | | N/A | | | N/A | | N/A |
| | | | | |
Gerald F. Dillenburg c/o Aston Funds 120 N. LaSalle Street Chicago, IL 60602 Age: 46 Senior Vice President and Secretary, Chief Operating Officer and Chief Compliance Officer | | Since 1996 | | Chief Compliance Officer and Chief Operating Officer, Aston Asset Management, LP (2006-present); Chief Financial Officer, Aston Asset Management, LP (2006- 2010); Senior Managing Director (“SMD”) of ABN AMRO Investment Fund Services, Inc. (formerly known as Alleghany Investment Services, Inc.) (1996-2006); SMD of ABN AMRO Asset Management Holdings, Inc. and ABN AMRO Asset Management, Inc. (formerly known as Chicago Capital Management, Inc.) (2001- 2006); CPA | | | N/A | | | N/A | | N/A |
| | | | | |
Laura M. Curylo c/o Aston Funds 120 N. LaSalle Street Chicago, IL 60602 Age: 44 Treasurer and Chief Financial Officer | | Since 2010 | | Chief Financial Officer, Aston Asset Management, LP (2010-present); Vice President and Controller, Aston Asset Management, LP (2006-present); Vice President, ABN AMRO Investment Fund Services, Inc. (formerly known as Alleghany Investment Services, Inc.) (1997-2006); CPA | | | N/A | | | N/A | | N/A |
| | |
| |
| | October 31, 2012 |
| |
| Additional Information (unaudited) – continued | | |
| | | | | | | | | | | | |
Name, Address, Age and Position(s) with Trust | | Term of Office 1 and Length of Time Served | | Principal Occupation(s) During Past Five Years | | Number of Portfolios in Fund Complex 2 Overseen by Trustee | | | Other Trusteeships/ Directorships Held by Trustee During Past Five Years | | Experience, Qualifications, Attributes, Skills for Board Membership |
| | | | |
| OFFICER(S) WHO ARE NOT TRUSTEES (continued) | | | | | | | | | | |
Christine C. Carsman c/o Aston Funds 120 N. LaSalle Street Chicago, IL 60602 Age: 59 Chief Legal Officer | | Since 2010 | | Senior Vice President (2007- present), Deputy General Counsel (2011-present), and Chief Regulatory Counsel (2004-present), Vice President (2004-2007), Affiliated Managers Group, Inc.; Trustee, Managers AMG Funds, The Managers Funds, Managers Trust I and Managers Trust II (2011-present); Senior Counsel, Vice President and Director of Operational Risk Management and Compliance, Wellington Management Company, LLP (1995-2004). | | | N/A | | | N/A | | N/A |
| 1 | | A Trustee serves for an indefinite term until the earliest of: (i) removal by two-thirds of the Board or shareholders, (ii) resignation, death or incapacity, (iii) the election and qualification of his successor, in accordance with the By-Laws of the Trust or (iv) the last day of the fiscal year in which he attains the age of 75 years. Officers serve for an indefinite term until the earliest of: (i) removal by the Board, (ii) resignation, death or incapacity, or (iii) the election and qualification of their successors, in accordance with the By-Laws of the Trust. |
| 2 | | The term Fund Complex includes all series of Aston Funds. |
| 3 | | “Interested person” of the Trust as defined in the 1940 Act. Mr. Bilton is considered an “interested person” because of his affiliation with Aston Asset Management, LP which acts as the Funds’ investment adviser. Mr. Murphy is considered an “interested person” because of his affiliations with Affiliated Managers Group, Inc., the ultimate parent of the investment adviser, and related entities. |
Aston Funds
ADVISER
Aston Asset Management, LP
120 N. LaSalle Street, 25th Floor
Chicago, IL 60602
SUB-ADVISERS
Anchor Capital Advisors LLC
One Post Office Square, Suite 3850
Boston, MA 02109
Baring International Investment Limited
155 Bishopsgate
London, EC2M 3XY UK
Cornerstone Investment Partners, LLC
Phipps Tower
3438 Peachtree Road NE, Suite 900
Atlanta, GA 30326
DoubleLine Capital LP
333 South Grand Avenue, Suite 1800
Los Angeles, CA 90071
Fairpointe Capital LLC
One North Franklin, Suite 3300
Chicago, IL 60606
Harrison Street Securities LLC
71 South Wacker Drive, Suite 3575
Chicago, IL 60606
Herndon Capital Management, LLC
191 Peachtree Street, NE, Suite 2500
Atlanta, GA 30303
Lake Partners, Inc.
4 High Ridge Park, Suite 300
Stamford, CT 06905
Lee Munder Capital Group, LLC
200 Clarendon Street, 28th Floor
Boston, MA 02116
SUBADVISERS - continued
Montag & Caldwell, LLC
3455 Peachtree Road NE, Suite 1200
Atlanta, GA 30326
River Road Asset Management, LLC
Meidinger Tower, Suite 1600
462 South Fourth Street
Louisville, KY 40202
Silvercrest Asset Management Group LLC
1330 Avenue of the Americas, 38th Floor
New York, NY 10019
Smart Portfolios, LLC
17865 Ballinger Way NE
Seattle, WA 98155
TAMRO Capital Partners LLC
1701 Duke St., Suite 250
Alexandria, VA 22314
Taplin, Canida & Habacht LLC
1001 Brickell Bay Drive, Suite 2100
Miami, FL 33131
Todd-Veredus Asset Management LLC
National City Tower
101 South Fifth Street, Suite 3100
Louisville, KY 40202
SHAREHOLDER SERVICES
Aston Funds
P.O. Box 9765
Providence, RI 02940
DISTRIBUTOR
Foreside Funds Distributors LLC
400 Berwyn Park
899 Cassatt Road
Berwyn, PA 19312
OFFICERS
Stuart D. Bilton, Chief Executive Officer
Kenneth C. Anderson, President
Gerald F. Dillenburg, Senior Vice President and Secretary, Chief Operating Officer and Chief Compliance Officer
Christine C. Carsman, Chief Legal Officer
Laura M. Curylo, Treasurer and Chief Financial Officer
Juli A. Braun, Assistant Treasurer
James A. Dimmick, Assistant Secretary
Marc J. Peirce, Assistant Secretary
Diana R. Podgorny, Assistant Secretary
CUSTODIAN
The Bank of New York Mellon
One Wall Street
New York, New York 10286
LEGAL COUNSEL
Vedder Price P.C.
222 N. LaSalle Street
Chicago, IL 60601
INDEPENDENT REGISTERED PUBLIC ACCOUNTING FIRM
Ernst & Young LLP
155 N. Wacker Drive
Chicago, IL 60606
THE STATEMENT OF ADDITIONAL INFORMATION INCLUDES ADDITIONAL INFORMATION ABOUT FUND TRUSTEES AND IS AVAILABLE UPON REQUEST WITHOUT CHARGE BY CALLING 800-992-8151.
Guide to Shareholder Benefits
We’re delighted to offer all Aston Funds shareholders a variety of services and convenient options. To receive more information about any of these benefits, simply call an Investor Services Associate Monday through Friday, 9 a.m. – 7 p.m. Eastern Time.
THE EASY WAY TO ADD TO YOUR ACCOUNT: START AN AUTOMATIC INVESTMENT PLAN
For Class N shareholders, systematic investing is an easy, effortless way to help reach any investment goal. Just choose a fixed amount, and we’ll automatically deduct it from your checking or savings account on a regular schedule and invest it in your Aston Funds account. Periodic investment plans involve continuous investments in securities regardless of price. You should consider your financial ability to continue to purchase shares through periods of both high and low price levels. This plan does not assure a profit and does not protect against loss in declining markets.
COMPOUND YOUR EARNINGS WITH AUTOMATIC DIVIDEND REINVESTMENT
By automatically reinvesting dividends into your Fund account, profits have the opportunity to mount. Monthly and quarterly dividends and annual capital gain distributions are reinvested at no charge.
ACCESS INFORMATION AND MAKE TRANSACTIONS ONLINE AT OUR WEBSITE
You can open a new account, access account balances, view statements, obtain fund information, and make transactions online 24 hours a day, 7 days a week.
| | |
| | www.astonfunds.com |
| |
| | Our Automated Shareholder Services Line Is at Your Service 24 Hours a Day |
| | 800-992-8151 |
Investor Services
Associates are available to assist you Monday – Friday 9 a.m. to 7 p.m., Eastern Time. Or, call any time, day or night, for automated account information to make exchanges or check fund performance.

Aston Funds
P.O. Box 9765
Providence, RI 02940
PART C
OTHER INFORMATION
Item 15. Indemnification
Section 10.2 of the Registrant’s Trust Instrument provides as follows:
10.2 Indemnification. The Trust shall indemnify each of its Trustees against all liabilities and expenses (including amounts paid in satisfaction of judgments, in compromise, as fines and penalties, and as counsel fees) reasonably incurred by him in connection with the defense or disposition of any action, suit or other proceeding, whether civil or criminal, in which he may be involved or with which he may be threatened, while as a Trustee or thereafter, by reason of his being or having been such a Trustee except with respect to any matter as to which he shall have been adjudicated to have acted in bad faith, willful misfeasance, gross negligence or reckless disregard of his duties, provided that as to any matter disposed of by a compromise payment by such person, pursuant to a consent decree or otherwise, no indemnification either for said payment or for any other expenses shall be provided unless the Trust shall have received a written opinion from independent legal counsel approved by the Trustees to the effect that if either the matter of willful misfeasance, gross negligence or reckless disregard of duty, or the matter of bad faith had been adjudicated, it would in the opinion of such counsel have been adjudicated in favor of such person. The rights accruing to any person under these provisions shall not exclude any other right to which he may be lawfully entitled, provided that no person may satisfy any right of indemnity or reimbursement hereunder except out of the property of the Trust. The Trustees may make advance payments in connection with the indemnification under this Section 10.2, provided that the indemnified person shall have given a written undertaking to reimburse the Trust in the event it is subsequently determined that he is not entitled to such indemnification.
The Trust shall indemnify officers, and shall have the power to indemnify representatives and employees of the Trust, to the same extent that Trustees are entitled to indemnification pursuant to this Section 10.2.
Insofar as indemnification for liability arising under the 1933 Act may be permitted to trustees, officers and controlling persons of Registrant pursuant to the foregoing provisions, or otherwise, Registrant has been advised that in the opinion of the SEC such indemnification is against public policy as expressed in that Act and is, therefore, unenforceable. In the event that a claim for indemnification against such liabilities (other than the payment by Registrant of expenses incurred or paid by a trustee, officer or controlling person of Registrant in the successful defense of any action, suit or proceeding) is asserted by such trustee, officer or controlling person in connection with the securities being registered, Registrant will, unless in the opinion of its counsel the matter has been settled by controlling precedent, submit to a court of appropriate jurisdiction the question whether such indemnification by it is against public policy as expressed in that Act and will be governed by the final adjudication of such issue.
C-1
Section 10.3 of the Registrant’s Trust Instrument, also provides for the indemnification of shareholders of the Registrant. Section 10.3 states as follows:
10.3 Shareholders. In case any Shareholder or former Shareholder of any Series shall be held to be personally liable solely by reason of his being or having been a shareholder of such Series and not because of his acts or omissions or for some other reason, the Shareholder or former Shareholder (or his heirs, executors, administrators or other legal representatives or, in the case of a corporation or other entity, its corporate or other general successor) shall be entitled out of the assets belonging to the applicable Series to be held harmless from and indemnified against all loss and expense arising from such liability. The Trust, on behalf of the affected Series, shall, upon request by the Shareholder, assume the defense of any claim made against the Shareholder for any act or obligation of the Series and satisfy any judgment thereon from the assets of the Series.
In addition, the Registrant currently has a trustees’ and officers’ liability policy covering certain types of errors and omissions.
Item 16. Exhibits
| | | | |
| (1) | | a) Trust Instrument dated September 10, 1993 is incorporated herein by reference to Post-Effective Amendment No. 8 filed on Form N-1A as filed on April 16, 1996. | | |
| | b) State of Delaware Certificate of Amendment to Certificate of Trust dated February 25, 1998 is incorporated herein by reference to Exhibit (a)(2) to Post-Effective Amendment No. 33 filed on Form N-1A as filed on September 21, 2001. | | |
| | c) State of Delaware Certificate of Amendment to Certificate of Trust dated September 10, 2001 is incorporated herein by reference to Exhibit (a)(3) to Post-Effective Amendment No. 33 filed on Form N-1A as filed on September 21, 2001. | | |
| | d) State of Delaware Certificate of Amendment to Certificate of Trust dated November 29, 2006 is incorporated herein by reference to Exhibit (a)(4) to Post-Effective Amendment No. 74 filed on Form N-1A as filed on November 30, 2006. | | |
| (2) | | Amended and Restated By-Laws dated July 8, 2010 are incorporated herein by reference to Exhibit (b)(4) to Post-Effective Amendment No. 116 filed on Form N-1A as filed on October 20, 2010. | | |
| | |
| (3) | | Not applicable. | | |
| | |
| (4) | | Form of Agreement and Plan of Reorganization is filed herein as Appendix A to Part A of this Registration Statement. | | |
| | |
| (5) | | Not applicable | | |
C-2
| | | | |
| (6) | | a) Investment Advisory Agreement dated April 15, 2010 between the Trust and Aston Asset Management, LP is incorporated herein by reference to Exhibit (d)(1) to Post-Effective Amendment No. 112 filed on Form N-1A as filed on August 30, 2010. | | |
| | |
| | b) Revised Schedules A and B to the Investment Advisory Agreement between the Trust and Aston Asset Management, LP is incorporated herein by reference to Exhibit (d)(2) to Post-Effective Amendment No. 142 filed on Form N-1A as filed on June 22, 2012. | | |
| | |
| | c) Sub-Investment Advisory Agreement dated February 17, 2012 between Aston Asset Management, LP and Lee Munder Capital Group, LLC is incorporated herein by reference to Exhibit (d)(22) to Post-Effective Amendment No. 139 filed on Form N-1A as filed on February 29, 2012. | | |
| | |
| (7) | | a) Distribution Agreement between ABN AMRO Funds (currently known as Aston Funds) and ABN AMRO Distribution Services (USA), Inc. is incorporated herein by reference to Exhibit (e)(1) to Post-Effective Amendment No. 36 filed on Form N-1A filed on December 28, 2001. | | |
| | |
| | b) Amended Schedule A to the Distribution Agreement between ABN AMRO Funds (currently known as Aston Funds) and ABN AMRO Distribution Services (USA), Inc. is incorporated herein by reference to Exhibit (e)(2) to Post-Effective Amendment No. 36 filed on Form N-1A filed on December 28, 2001. | | |
| | |
| | c) Amendment No. 1 to Distribution Services Agreement is incorporated herein by reference to Exhibit (e)(3) to Post-Effective Amendment No. 47 filed on Form N-1A filed on February 28, 2003. | | |
| | |
| | d) Amendment No. 2 to Distribution Services Agreement is incorporated herein by reference to Exhibit (e)(4) to Post-Effective Amendment No. 47 filed on Form N-1A filed on February 28, 2003. | | |
| | |
| | e) Amendment No. 3 to Distribution Services Agreement is incorporated herein by reference to Exhibit (e)(5) to Post-Effective Amendment No. 47 filed on Form N-1A filed on February 28, 2003. | | |
| | |
| | f) Distribution Agreement between Aston Funds and BNY Mellon Distributors, Inc. (currently known as Foreside Funds Distributors, LLC) is incorporated herein by reference to Exhibit (e)(7) to Post-Effective Amendment No. 111 filed on Form N-1A as filed on August 6, 2010. | | |
C-3
| | | | |
| | g) Distribution Agreement between Aston Funds and Foreside Funds Distributors, LLC is incorporated herein by reference to Exhibit (e)(7) to Post-Effective Amendment No. 144 filed on Form N-1A as filed on December 28, 2012. | | |
| | |
| | h) Revised Schedule A to the Distribution Agreement is incorporated herein by reference to Exhibit (e)(7) to Post-Effective Amendment No. 144 filed on Form N-1A as filed on December 28, 2012. | | |
| | |
| | i) Form of Selling/Services Agreement for Aston Funds is incorporated herein by reference to Exhibit (e)(8) to Post-Effective Amendment No. 108 filed on Form N-1A as filed on February 26, 2010. | | |
| | |
| | j) ABN AMRO Assignment Agreement is incorporated herein by reference to Exhibit (e)(9) to Post-Effective Amendment No. 74 Filed on Form N-1A as filed on November 30, 2006. | | |
| | |
| | k) Mutual Fund Service Agent Agreement for Wrap Processing is incorporated herein by reference to Exhibit (e)(13) to Post-Effective Amendment No. 84 filed on Form N-1A as filed on July 31, 2007. | | |
| | |
| (8) | | Not applicable. | | |
| | |
| (9) | | a) Custodian Services Agreement dated May 5, 2003 by and between PFPC Trust Company and ABN AMRO Funds (currently known as Aston Funds) is incorporated herein by reference to Exhibit (g)(9) to Post-Effective Amendment No. 49 filed on Form N-1A as filed on June 30, 2003. | | |
| | |
| | b) Amendment to the Custodian Services Agreement is incorporated herein by reference to Exhibit (g)(2) to Post-Effective Amendment No. 58 filed on Form N-1A as filed on June 23, 2005. | | |
| | |
| | c) Revised Exhibit A to the Custodian Services Agreement is incorporated herein by reference to Exhibit (g)(3) to Post-Effective Amendment No. 144 filed on Form N-1A as filed on December 28, 2012. | | |
| | |
| | d) Russian Addendum to the Custodian Services Agreement for Aston/Barings International Fund is incorporated herein by reference to Exhibit (g)(4) to Post-Effective Amendment No. 102 filed on Form N-1A as filed on February 27, 2009. | | |
| | |
| | e) Amendment to the Custodian Services Agreement dated December 18, 2009 is incorporated herein by reference to Exhibit (g)(6) to Post-Effective Amendment No. 108 filed on Form N-1A as filed on February 26, 2010. | | |
C-4
| | | | |
| | f) Letter Agreement between Aston Funds and The Bank of New York Mellon appointing The Bank of New York Mellon as Foreign Custody Manager is incorporated herein by reference to Exhibit (g)(7) to Post-Effective Amendment No. 139 filed on Form N-1A as filed on February 29, 2012. | | |
| | |
| | g) Amendment to Custodian Services Agreement dated July 1, 2012 is incorporated herein by reference to Exhibit (g)(7) to Post-Effective Amendment No. 144 filed on Form N-1A as filed on December 28, 2012. | | |
| | |
| (10) | | a) Distribution and Services Plan pursuant to Rule 12b-1 is incorporated herein by reference to Exhibit (m)(1) to Post-Effective Amendment No. 33 filed on Form N-1A as filed on September 21, 2001. | | |
| | |
| | b) Amended Schedule A to Distribution and Services Plan pursuant to Rule 12b-1 is incorporated herein by reference to Exhibit (m)(2) to Post-Effective Amendment No. 36 filed on Form N-1A as filed on December 28, 2001. | | |
| | |
| | c) Distribution and Services Plan dated June 21, 2001, and amended December 20, 2001 and March 21, 2002, pursuant to Rule 12b-1 is incorporated herein by reference to Exhibit (m)(3) to Post-Effective Amendment No. 43 filed on Form N-1A as filed on July 3, 2002. | | |
| | |
| | d) Revised Schedule A to Distribution and Services Plan pursuant to Rule 12b-1 is incorporated by reference to Exhibit (m)(4) to Post-Effective Amendment No. 142 as filed on June 22, 2012. | | |
| | |
| | e) Distribution and Services Plan dated June 20, 2002, pursuant to Rule 12b-1 is incorporated herein by reference to Exhibit (m)(4) to Post-Effective Amendment No. 43 filed on Form N-1A as filed on July 3, 2002. | | |
| | |
| | f) Amended and Restated Distribution and Services Plan pursuant to Rule 12b-1 is incorporated herein by reference to Exhibit (m)(2) to Post-Effective Amendment No. 33 filed on Form N-1A as filed on September 21, 2001. | | |
| | |
| | g) Amended and Restated Distribution and Services Plan pursuant to Rule 12b-1 is incorporated herein by reference to Exhibit (m)(10) to Post-Effective Amendment No. 45 filed on Form N-1A as filed on October 28, 2002. | | |
C-5
| | | | |
| | h) Revised Schedule A to Amended and Restated Distribution and Services Plan pursuant to Rule 12b-1 is incorporated herein by reference to Exhibit (m)(8) to Post-Effective Amendment No. 144 filed on Form N-1A as filed on December 28, 2012. | | |
| | |
| | i) Revised Schedule A to Amended and Restated Distribution and Services Plan pursuant to Rule 12b-1 is incorporated herein by reference to Exhibit (m)(9) to Post-Effective Amendment No. 144 filed on Form N-1A as filed on December 28, 2012. | | |
| | |
| | j) Amended and Restated Multiple Class Plan pursuant to Rule 18f-3 is incorporated herein by reference to Exhibit (n)(7) to Post-Effective Amendment No. 133 filed on Form N-1A as filed on July 13, 2011. | | |
| | |
| (11) | | Opinion of Vedder Price P.C. to be filed by amendment. | | |
| | |
| (12) | | Form of Tax Opinion of Vedder Price P.C. to be filed by amendment. | | |
| | |
| (13) | | a) Transfer Agency Services Agreement between Alleghany Funds (currently known as Aston Funds) and PFPC Inc. (currently known as BNY Mellon Investment Servicing (US) Inc.), dated April 1, 2000, is incorporated herein by reference to Exhibit (h)(1) to Post-Effective Amendment No. 22 filed on Form N-1A as filed on June 30, 2000. | | |
| | b) Amendment No. 1 to the Transfer Agency Services Agreement is incorporated herein by reference to Exhibit (h)(2) to Post-Effective Amendment No. 22 filed on Form N-1A as filed on June 30, 2000. | | |
| | c) Amendment No. 2 to the Transfer Agency Services Agreement is incorporated herein by reference to Post-Effective Amendment No. 26 filed on Form N-1A as filed on March 1, 2001. | | |
| | d) Amendment No. 3 to the Transfer Agency Services Agreement is incorporated herein by reference to Exhibit (h)(4) to Post-Effective Amendment No. 51 filed on Form N-1A as filed on February 27, 2004. | | |
| | e) Amendment No. 4 to the Transfer Agency Services Agreement is incorporated herein by reference to Exhibit (h)(5) to Post-Effective Amendment No. 51 filed on Form N-1A as filed on February 27, 2004. | | |
| | f) Amendment No. 5 to the Transfer Agency Services Agreement is incorporated herein by reference to Exhibit (h)(6) to Post-Effective Amendment No. 51 filed on Form N-1A as filed on February 27, 2004. | | |
| | g) Amendment No. 6 to the Transfer Agency Services Agreement is incorporated herein by reference to Exhibit (h)(7) to Post-Effective Amendment No. 51 filed on Form N-1A as filed on February 27, 2004. | | |
| | h) Compliance Support Services Amendment to Transfer Agency Services Agreement is incorporated herein by reference as Exhibit (h)(9) to Post-Effective Amendment No. 55 filed on Form N-1A as filed on December 29, 2004. | | |
C-6
| | | | |
| | i) Anti-Money Laundering and Privacy Amendment to the Transfer Agency Services Agreement is incorporated herein by reference to Exhibit (h)(9) to Post-Effective Amendment No. 56 filed on Form N-1A as filed on February 25, 2005. | | |
| | j) Customer Identification Services Amendment to Transfer Agency Services Agreement is incorporated herein by reference to Exhibit (h)(10) to Post-Effective Amendment No. 56 filed on Form N-1A as filed on February 25, 2005. k) Amendment to the Transfer Agency Services Agreement is incorporated herein by reference to Exhibit (h)(12) to Post-Effective Amendment No. 58 filed on Form N-1A as filed on June 23, 2005. l) Section 312 Foreign Financial Institution Amendment to the Transfer Agency Services Agreement is incorporated herein by reference to Exhibit (h)(15) to Post-Effective Amendment No. 76 filed on Form N-1A as filed on December 22, 2006. m) Revised Exhibit A to the Transfer Agency Services Agreement is incorporated herein by reference to Exhibit (h)(13) to Post-Effective Amendment No. 144 filed on Form N-1A as filed on December 28, 2012. n) Amendment to the Transfer Agency Services Agreement dated December 18, 2009 is incorporated herein by reference to Exhibit (h)(14) to Post-Effective Amendment No. 108 filed on Form N-1A as filed on February 26, 2010. o) Amendment to Transfer Agency Services Agreement Regarding Red Flag Services is incorporated herein by reference to Exhibit (h)(15) to Post-Effective Amendment No. 106 filed on Form N-1A as filed on December 30, 2009. p) Amendment to Transfer Agency Services Agreement dated July 1, 2012 is incorporated herein by reference to Exhibit (h)(16) to Post-Effective Amendment No. 144 filed on Form N-1A as filed on December 28, 2012. q) Administration Agreement between Alleghany Funds (currently known as Aston Funds) and Alleghany Investment Services, Inc. dated June 7, 1999, is incorporated herein by reference to Exhibit (h) to Post-Effective Amendment No. 17 filed on Form N-1A as filed on June 28, 1999. r) Amendment No. 1 to the Administration Agreement is incorporated herein by reference to Exhibit (h)(3) to Post-Effective Amendment No. 22 filed on Form N-1A as filed on June 30, 2000. s) Amendment No. 2 to the Administration Agreement is incorporated herein by reference to Exhibit (h) to Post-Effective Amendment No. 24 filed on Form N-1A as filed on December 29, 2000. t) Amendment No. 3 to the Administration Agreement is incorporated herein by reference to Exhibit (h)(9) to Post-Effective Amendment No. 36 filed on Form N-1A as filed on December 28, 2001. | | |
C-7
| | | | |
| | u) Amendment No. 4 to the Administration Agreement is incorporated herein by reference to Exhibit (h)(10) to Post-Effective Amendment No. 36 filed on Form N-1A as filed on December 28, 2001. | | |
| | v) Amendment No. 5 to the Administration Agreement is incorporated herein by reference to Exhibit (h)(13) to Post-Effective Amendment No. 47 filed on Form N-1A as filed on February 28, 2003. w) Amendment No. 6 to the Administration Agreement is incorporated herein by reference to Exhibit (h)(14) to Post-Effective Amendment No. 47 filed on Form N-1A as filed on February 28, 2003. x) Amendment No. 7 to the Administration Agreement is incorporated herein by reference to Exhibit (h)(15) to Post-Effective Amendment No. 47 filed on Form N-1A as filed on February 28, 2003. y) Amendment No. 8 to the Administration Agreement is incorporated herein by reference to Exhibit (h)(19) to Post-Effective Amendment No. 50 filed on Form N-1A as filed on December 30, 2003. z) Amendment No. 9 to the Administration Agreement is incorporated herein by reference to Exhibit (h)(20) to Post-Effective Amendment No. 51 filed on Form N-1A as filed on February 27, 2004. aa) Amendment No. 10 to the Administration Agreement is incorporated herein by reference to Exhibit (h)(24) to Post-Effective Amendment No. 58 filed on Form N-1A as filed on June 23, 2005. bb) Amendment No. 11 to the Administration Agreement is incorporated herein by reference to Exhibit (h)(28) to Post-Effective Amendment No. 144 filed on Form N-1A as filed on December 28, 2012. cc) Revised Schedule C to the Administration Agreement is incorporated herein by reference to Exhibit (h)(27) to Post-Effective Amendment No. 142 filed on Form N-1A as filed on June 22, 2012. dd) Sub-Administration and Accounting Services Agreement between Alleghany Investment Services Inc. and PFPC Inc. (currently known as BNY Mellon Investment Servicing (US) Inc.), dated April 1, 2000, is incorporated herein by reference to Exhibit (h)(4) to Post-Effective Amendment No. 22 filed on Form N-1A as filed on June 30, 2000. ee) Amendment No. 1 to the Sub-Administration and Accounting Services Agreement is incorporated herein by reference to Exhibit (h)(5) to Post-Effective Amendment No. 22 filed on Form N-1A as filed on June 30, 2000. ff) Amendment No. 2 to the Sub-Administration and Accounting Services Agreement is incorporated herein by reference to Post-Effective Amendment No. 26 filed on Form N-1A as filed on March 1, 2001. gg) Amendment No. 3 to the Sub-Administration and Accounting Services Agreement is incorporated herein by reference to Exhibit (h)(24) to Post-Effective Amendment No. 56 filed on Form N-1A as filed on February 25, 2005. | | |
C-8
| | | | |
| | hh) Amendment No. 4 to the Sub-Administration and Accounting Services Agreement is incorporated herein by reference to Exhibit (h)(25) to Post-Effective Amendment No. 56 filed on Form N-1A as filed on February 25, 2005. | | |
| | ii) Amendment No. 5 to the Sub-Administration and Accounting Services Agreement is incorporated herein by reference to Exhibit (h)(26) to Post-Effective Amendment No. 56 filed on Form N-1A as filed on February 25, 2005. | | |
| | jj) Amendment No. 6 to the Sub-Administration and Accounting Services Agreement is incorporated herein by reference to Exhibit (h)(27) to Post-Effective Amendment No. 56 filed on Form N-1A as filed on February 25, 2005. | | |
| | kk) Amendment to Sub-Administration and Accounting Services Agreement is incorporated herein by reference to Exhibit (h)(29) to Post-Effective Amendment No. 56 filed on Form N-1A as filed on February 25, 2005. | | |
| | ll) Amendment to the Sub-Administration and Accounting Services Agreement is incorporated herein by reference to Exhibit (h)(35) to Post-Effective Amendment No. 58 filed on Form N-1A as filed on June 23, 2005. | | |
| | mm) Amendment to the Sub-Administration and Accounting Services Agreement is incorporated herein by reference to Exhibit (h)(35) to Post-Effective Amendment No. 102 filed on Form N-1A as filed on February 27, 2009. | | |
| | nn) Amendment to the Sub-Administration and Accounting Services Agreement is incorporated herein by reference to Exhibit (h)(36) to Post-Effective Amendment No. 104 filed on Form N-1A as filed on October 5, 2009. | | |
| | oo) Revised Schedule B to the Sub-Administration and Accounting Services Agreement is incorporated herein by reference to Exhibit (h)(36) to Post-Effective Amendment No. 97 filed on Form N-1A as filed on February 28, 2008. | | |
| | pp) Revised Exhibit A to the Sub-Administration and Accounting Services Agreement is incorporated herein by reference to Exhibit (h)(13) to Post-Effective Amendment No. 144 filed on Form N-1A as filed on December 28, 2012. | | |
| | qq) Amendment to the Sub-Administration and Accounting Services Agreement is incorporated herein by reference to Exhibit (h)(41) to Post-Effective Amendment No. 108 filed on Form N-1A as filed on February 26, 2010. | | |
| | rr) Amendment to the Sub-Administration and Accounting Services Agreement dated July 1, 2012 is incorporated herein by reference to Exhibit (d)(21) to Post-Effective Amendment No. 144 filed on Form N-1A as filed on December 28, 2012. | | |
| (l4) | | Consent of Independent Auditor is filed herewith. | | |
| | |
| (15) | | Not applicable. | | |
C-9
| | | | |
| (16) | | Power of Attorney dated January 22, 2013 is filed herewith. | | |
| | |
| (17) | | Form of Proxy is filed herein and appears following the Proxy Statement/Prospectus included in this Registration Statement. | | |
Item 17. Undertakings
(1) The undersigned Registrant agrees that prior to any public reoffering of the securities registered through the use of a prospectus which is a part of this registration statement by any person or party who is deemed to be an underwriter within the meaning of Rule 145(c) of the Securities Act of 1933, the reoffering prospectus will contain the information called for by the applicable registration form for reofferings by persons who may be deemed underwriters, in addition to the information called for by the other items of the applicable form.
(2) The undersigned Registrant agrees that every prospectus that is filed under paragraph (1) above will be filed as a part of an amendment filed on Form N-1A and will not be used until the amendment is effective, and that, in determining any liability under the Securities Act of 1933 Act, each post-effective amendment shall be deemed to be a new registration statement for the securities offered therein, and the offering of the securities at that time shall be deemed to be the initial bona fide offering of them.
C-10
SIGNATURES
As required by the Securities Act of 1933, this registration statement has been signed on behalf of the registrant, in the City of Chicago, the State of Illinois, on the 30th day of January, 2013.
| | |
| ASTON FUNDS |
| |
| By: | | /s/ Stuart D. Bilton |
| | Stuart D. Bilton |
| | Chief Executive Officer |
As required by the Securities Act of 1933, this registration statement has been signed by the following persons in the capacities and on the dates indicated:
| | | | | | |
Signature | | | | Capacity | | Date |
| | | |
/s/ Stuart D. Bilton* Stuart D. Bilton | | | | Trustee | | |
| | | |
/s/ William E. Chapman, II* William E. Chapman, II | | | | Independent Chairman, Trustee | | |
| | | |
/s/ Edward J. Kaier* Edward J. Kaier | | | | Trustee | | |
| | | |
/s/ Jeffrey S. Murphy* Jeffrey S. Murphy | | | | Trustee | | |
| | | |
/s/ Gregory T. Mutz* Gregory T. Mutz | | | | Trustee | | |
| | | |
/s/ Steven J. Paggioli* Steven J. Paggioli | | | | Trustee | | |
| | | |
/s/ Eric P. Rakowski* Eric P. Rakowski | | | | Trustee | | |
| | | |
/s/ Robert B. Scherer* Robert B. Scherer | | | | Trustee | | |
| | | |
/s/ Thomas R. Schneeweis* Thomas R. Schneeweis | | | | Trustee | | |
| | | | | | |
Signature | | | | Capacity | | Date |
| | | |
/s/ Stuart D. Bilton Stuart D. Bilton | | | | Chief Executive Officer | | January 30, 2013 |
| | | |
/s/ Laura M. Curylo Laura M. Curylo | | | | Chief Financial Officer and Treasurer | | January 30, 2013 |
| | | |
/s/ Laura M. Curylo Laura M. Curylo | | | | Attorney-in-fact | | January 30, 2013 |
* Signed by Laura M. Curylo pursuant to a Power of Attorney filed herewith as Exhibit 16.
EXHIBIT INDEX
| | |
Exhibit No. | | Name of Exhibit |
| |
| 14 | | Consent of Independent Auditor |
| |
| 16 | | Powers of Attorney |