As filed with the Securities and Exchange Commission on March 4, 2013
File No. 333-186289
SECURITIES AND EXCHANGE COMMISSION
Washington, D.C. 20549
FORM N-14
REGISTRATION STATEMENT
UNDER
THE SECURITIES ACT OF 1933
x Pre-Effective Amendment No. 1
¨ Post-Effective Amendment No.
ASTON FUNDS
(Exact Name of Registrant as Specified in Charter)
120 North LaSalle Street
Chicago, Illinois 60602
(Address of Principal Executive Offices, including Zip Code)
Registrant’s Telephone Number, including Area Code (312) 268-1400
Copy to:
| | |
(Name and Address of Agent for Service) Kenneth C. Anderson, President Aston Funds 120 North LaSalle Street Chicago, Illinois 60602 | | Copy to: Deborah Bielicke Eades Vedder Price P.C. 222 North LaSalle Street Chicago, Illinois 60601 |
Approximate date of proposed public offering: As soon as practicable after the effective date of this Registration Statement.
TITLE OF SECURITIES BEING REGISTERED: Shares of Beneficial Interest (no par value per share) of the Registrant.
No filing fee is required because of reliance on Section 24(f) and an indefinite number of shares have previously been registered pursuant to Rule 24f-2 under the Investment Company Act of 1940.
The Registrant hereby amends this Registration Statement on such date or dates as may be necessary to delay its effective date until the Registrant shall file a further amendment that specifically states that this Registration Statement shall thereafter become effective in accordance with Section 8(a) of the Securities Act of 1933 or until the Registration Statement shall become effective on such date as the Commission, acting pursuant to said Section 8(a), may determine.
, 2013
Dear Fellow Shareholder:
ASTON Small Cap Fund (formerly, ASTON/Veredus Small Cap Growth Fund) (the “Target Fund”), a series of Aston Funds (the “Trust”), a Delaware statutory trust, will hold a Meeting of Shareholders at the offices of the Trust, 120 North LaSalle Street, 25th Floor, Chicago, Illinois 60602 on April 16, 2013 at 9:00 a.m. Central Time (the “Special Meeting”).
The purpose of the Special Meeting is to consider the approval of an Agreement and Plan of Reorganization (and the related transactions) which provides for (i) the transfer of all the assets of the Target Fund to ASTON/LMCG Small Cap Growth Fund (formerly, ASTON Small Cap Growth Fund) (the “Acquiring Fund”) in exchange solely for shares of beneficial interest of the Acquiring Fund and the assumption by the Acquiring Fund of all the liabilities of the Target Fund; and (ii) the distribution by the Target Fund of all the shares of each class of the Acquiring Fund received by the Target Fund to the holders of shares of the corresponding class of the Target Fund in complete liquidation and termination of the Target Fund.
We encourage you to read the Questions and Answers section and the full text of the enclosed Proxy Statement/Prospectus.
The Board of Trustees has approved this proposal and urges you to vote “FOR” the proposal.
YOUR VOTE IS IMPORTANT! Please review the attached Proxy Statement/Prospectus carefully. Enclosed is a proxy card that we ask you to complete, sign, date and return as soon as possible in the postage-paid envelope. You may also vote by telephone or over the Internet using the toll-free telephone number or web address printed on your proxy card.
Effective January 31, 2013, Lee Munder Capital Group, LLC (“LMCG”) was appointed as subadviser to the Target Fund. The enclosed document also provides information about LMCG and the new subadvisory agreement for the Fund between LMCG and Aston Asset Management, LP.
Thank you for your attention and your vote with regard to this important proposal. Please call proxy services at (866) 880-8631 if you need more information. Thank you for your response, and we look forward to serving your future investment needs.
|
| Sincerely, |
|
| Kenneth C. Anderson |
| President |
Important Information for
ASTON Small Cap Fund Shareholders
At a special meeting of shareholders (the “Special Meeting”) of ASTON Small Cap Fund (formerly, ASTON/Veredus Small Cap Growth Fund) (the “Target Fund”), a series of Aston Funds (the “Trust”), you will be asked to vote on an important change affecting your fund. The purpose of the Special Meeting is to allow you to vote on the reorganization of your fund into ASTON/LMCG Small Cap Growth Fund (formerly, ASTON Small Cap Growth Fund) (the “Acquiring Fund”). If the reorganization is approved and completed, you will become a shareholder of the Acquiring Fund. The Target Fund and the Acquiring Fund are referred to herein collectively as the “Funds” and each individually as a “Fund.”
Although we recommend that you read the full text of the enclosed Proxy Statement/Prospectus, for your convenience, below is a brief overview of the proposal presented to shareholders for a vote.
| Q. | Why am I receiving this Proxy Statement/Prospectus? |
| A. | The shareholders of the Target Fund are being asked to approve a reorganization between the Target Fund and the Acquiring Fund pursuant to an Agreement and Plan of Reorganization entered into by the Trust, on behalf of the Target Fund and the Acquiring Fund (the “Agreement”), which is summarized below. |
| Q. | Why has the reorganization been proposed for the Target Fund? |
| A. | The proposed reorganization is intended to consolidate funds that have substantially similar investment objectives and investment policies, and, as of the date of this Proxy Statement/Prospectus, the same subadviser. Although the Acquiring Fund has higher gross operating expenses, the reorganization may result in lower operating expenses after taking into account the lower expense limitation in effect for the Acquiring Fund through February 28, 2014. In addition, the combination of two funds of relatively small sizes may result in economies of scale. |
| Q. | What are the similarities between the investment objectives and principal investment strategies of the Funds? |
| A. | The Target Fund and the Acquiring Fund have substantially similar objectives and principal investment strategies. The Acquiring Fund seeks to provide long-term capital appreciation, and the Target Fund seeks to provide capital appreciation. Under normal conditions, both Funds invest at least 80% of their assets in common stocks and other equity securities of small-cap companies. The Acquiring Fund defines small-cap companies as companies with a market capitalization of less than $3.0 billion at the time of acquisition. The Target Fund defines small-cap companies as those with a market capitalization of less than $2.5 billion at the time of acquisition. |
| Q. | What will happen if shareholders do not approve the reorganization? |
| A. | If the reorganization is not approved by shareholders, the Board of Trustees of the Trust (the “Board”) will take such actions as it deems to be in the best interests of the Target Fund, which may include additional solicitation, continuing to operate the Target Fund as a stand-alone fund or liquidating the Target Fund. |
| Q. | Will Target Fund shareholders receive new shares in exchange for their current shares? |
| A. | Yes. If shareholders approve the reorganization and it is completed, each Target Fund shareholder will receive shares of the Acquiring Fund in an amount equal in total value to the total value of the Target Fund shares surrendered by such shareholder. |
| Q. | Will this reorganization create a taxable event for me? |
| A. | No. The reorganization is intended to qualify as a tax-free reorganization for federal income tax purposes. It is expected that you will recognize no gain or loss for federal income tax purposes as a direct result of the reorganization. |
| Q. | How do total operating expenses compare between the two Funds? |
| A. | The management fee rate is the same for both Funds, and the Funds have the same fee structure with respect to distribution and service fees. As of October 31, 2012, the Target Fund’s total gross expense ratio was lower than the total gross expense ratio of the Acquiring Fund; however, the Acquiring Fund’s net expense ratio was lower as a result of a lower contractual expense cap currently in effect for the Acquiring Fund through February 28, 2014. If the reorganization is completed, the net expense ratio of the combined fund is expected to be lower than the net expense ratio of the Target Fund for both share classes at least through the duration of the contractual fee waiver applicable to the Acquiring Fund, which remains in effect through February 28, 2014. |
| Q. | Who will bear the costs of the reorganization? |
| A. | Generally, each of the Target Fund and the Acquiring Fund will bear its own expenses related to the reorganization (whether or not the reorganization is consummated), including legal and accounting fees and expenses, provided that Aston Asset Management, LP (“Aston”) will reimburse the Funds for expenses in connection with the reorganization to the extent that such expenses cause total operating expenses of a Fund to exceed contractual operating expense caps currently in effect. It is expected that both Funds will be operating at expense levels exceeding their respective contractual expense limitations, thus resulting in Aston reimbursing the Funds for all direct expenses related to the reorganization. The Funds will bear all indirect costs such as brokerage and trading costs in connection with any portfolio repositioning. |
| Q. | When would the reorganization take place? |
| A. | If approved by Target Fund shareholders at the Special Meeting to be held on April 16, 2013, the reorganization would occur on or about April 22, 2013, or as soon as reasonably practicable after shareholder approval is obtained. |
| Q. | Will a proxy firm be engaged for the proxy solicitation? Will Aston contact me? |
| A. | Yes. Georgeson, Inc. d/b/a Computershare Fund Services will be engaged for the proxy solicitation. Shareholders of the Target Fund may be contacted by Aston personnel, in addition to the proxy solicitation firm. |
| Q. | Whom do I call for more information? |
| A. | Please call Computershare Fund Services’ Shareholder Services toll free at (866) 880-8631. |
| Q. | How do I vote my shares? |
| A. | You may vote your shares by Internet, by telephone or by mail, as described below. |
| | By Internet. Log on to the website noted on your proxy card(s), enter the control number printed on the proxy card(s), and follow the simple online instructions. |
By Touch-Tone Phone. Call the toll-free number found on your proxy card(s) and follow the simple instructions.
By Mail. Simply return your signed and dated proxy card(s) in the envelope provided.
| Q. | How does the Board suggest that I vote? |
| A. | After careful consideration, the Board has determined that the reorganization is in the best interests of your Fund and recommends that you vote “FOR” the reorganization. |
| | Your vote is very important. We encourage you as a shareholder to participate in your Fund’s governance by returning your vote as soon as possible. If enough shareholders fail to cast their votes, your Fund may not be able to hold its meeting or the vote on the reorganization, and will be required to incur additional solicitation costs in order to obtain sufficient shareholder participation. |
, 2013
ASTON Small Cap Fund
NOTICE OF SPECIAL MEETING OF SHAREHOLDERS
TO BE HELD ON APRIL 16, 2013
To the Shareholders of ASTON Small Cap Fund:
Notice is hereby given that a special meeting of shareholders of ASTON Small Cap Fund (formerly, ASTON/Veredus Small Cap Growth Fund) (the “Target Fund”), a series of Aston Funds (the “Trust”), a Delaware statutory trust, will be held at the offices of the Trust, 120 North LaSalle Street, 25th Floor, Chicago, Illinois 60602, on April 16, 2013 at 9:00 a.m. Central Time (the “Special Meeting”), for the following purposes:
1. To approve an Agreement and Plan of Reorganization (and the related transactions) which provides for (i) the transfer of all the assets of the Target Fund to ASTON/LMCG Small Cap Growth Fund (formerly, ASTON Small Cap Growth Fund) (the “Acquiring Fund”) in exchange solely for shares of beneficial interest of the Acquiring Fund and the assumption by the Acquiring Fund of all the liabilities of the Target Fund; and (ii) the distribution by the Target Fund of all the shares of each class of the Acquiring Fund received by the Target Fund to the holders of shares of the corresponding class of the Target Fund in complete liquidation and termination of the Target Fund.
2. To transact such other business as may properly come before the Special Meeting including whether or not to adjourn the Special Meeting, and any adjournment or postponement of the Special Meeting.
The Board of Trustees of the Trust has fixed the close of business on January 31, 2013 as the record date for the determination of shareholders entitled to notice of and to vote at the Special Meeting or any adjournment thereof. The persons named as proxies will vote in their discretion on any other business that may properly come before the Special Meeting or any adjournments or postponements thereof.
|
By Order of the Board of Trustees, Gerald F. Dillenburg Senior Vice President and Secretary |
Shareholders are requested to execute and return promptly the accompanying proxy card, which is being solicited by the Board of Trustees of the Trust. You may execute the proxy card using the methods described in the proxy card. Executing the proxy card is important to ensure a quorum at the Special Meeting. Shareholders also have the option to provide their vote by telephone or over the Internet by following the instructions accompanying the proxy card. Proxies may be revoked at any time before they are exercised by submitting a written notice of revocation or a subsequently executed proxy or by attending the Special Meeting and voting in person.
INSTRUCTIONS FOR VOTING
The following general rules apply to voting by mail and will help you properly sign your proxy card. Please read them carefully, because if you do not sign your proxy card properly your vote will be invalidated.
1. Individual Accounts: Sign your name exactly as it appears in the registration on the proxy card.
2. Joint Accounts: Both parties must sign, and the name of each party signing should conform exactly to the name shown in the registration on the proxy card.
3. All Other Accounts: The capacity of the individual signing the proxy card should be indicated unless it is reflected in the form of registration. For example:
| | | | |
| Registration | | Valid Signature |
|
| Corporate Accounts |
| (1) | | ABC Corp. | | ABC Corp. by John Doe, Treasurer |
| (2) | | ABC Corp. | | |
| | John Doe, Treasurer | | John Doe |
| (3) | | ABC Corp. Profit Sharing Plan | | John Doe |
|
| Trust Accounts |
| (1) | | ABC Trust | | Jane B. Doe, Trustee |
| (2) | | Jane B. Doe, Trustee | | |
| | u/t/d 12/28/78 | | Jane B. Doe |
|
| Custodial or Estate Accounts |
| (1) | | John B. Smith, Cust. | | |
| | f/b/o John B. Smith, Jr. UGMA | | John B. Smith |
| (2) | | Estate of John B. Smith | | John B. Smith, Jr., Executor |
Rather than mailing in your proxy, you may vote by telephone or over the Internet using the toll-free telephone number or web address printed on your proxy card. These options require you to input the control number located on your proxy card. After inputting the control number, you may enter your vote on the proposal. You will have an opportunity to review your vote and make any necessary changes before submitting your vote.
Proxy Statement/Prospectus and
Information Statement
Dated , 2013
Relating to the Acquisition of the Assets and Liabilities of
ASTON Small Cap Fund (formerly, ASTON/Veredus Small Cap Growth Fund)
This Proxy Statement/Prospectus is furnished in connection with the solicitation of proxies by the Board of Trustees (the “Board”) of Aston Funds (the “Trust”), a Delaware statutory trust, on behalf of ASTON Small Cap Fund (the “Target Fund”), for use at a special meeting of shareholders of the Target Fund to be held at the offices of the Trust, 120 North LaSalle Street, 25th Floor, Chicago, Illinois 60602 and at any and all adjournments or postponements thereof (the “Special Meeting”). This document also serves as an Information Statement with respect to the appointment of Lee Munder Capital Group, LLC (“LMCG”) as subadviser to the Target Fund, effective as of January 31, 2013.
The purpose of the Special Meeting is to consider the proposed reorganization (the “Reorganization”) of the Target Fund into ASTON/LMCG Small Cap Growth Fund (formerly, ASTON Small Cap Growth Fund) (the “Acquiring Fund”), another series of the Trust. The Target Fund and the Acquiring Fund are referred to herein collectively as the “Funds” and each individually as a “Fund.” Each Fund is a series of the Trust, an open-end, registered management investment company. If shareholders of the Target Fund approve the Reorganization and it is completed, each shareholder of the Target Fund will receive shares of the corresponding class of the Acquiring Fund with the same total value as the total value of the Target Fund shares surrendered by such shareholder. The Board has determined that the Reorganization is in the best interests of the Target Fund.
The address of the principal executive office and telephone number of the Funds and the Trust is 120 North LaSalle Street, 25th Floor, Chicago, Illinois 60602, (312) 268-1400.
The enclosed proxy and this Proxy Statement/Prospectus and Information Statement are first being sent to shareholders of the Target Fund on or about March , 2013. Shareholders of record as of the close of business on January 31, 2013 are entitled to vote at the Special Meeting and any adjournment or postponement thereof with respect to the Reorganization. In reliance on a manager-of-managers exemptive order governing the “manager-of-managers” structure under which the Funds operate, the Target Fund is not seeking your proxy or vote with respect to the appointment of LMCG as subadviser to the Target Fund.
The securities offered by this Proxy Statement/Prospectus have not been approved or disapproved by the Securities and Exchange Commission (“SEC”), nor has the SEC passed upon the accuracy or adequacy of this Proxy Statement/Prospectus. Any representation to the contrary is a criminal offense.
This Proxy Statement/Prospectus explains concisely what you should know before voting on the Reorganization (in effect, investing in Class N and Class I shares of the Acquiring Fund) and constitutes an offering of Class N and Class I shares of beneficial interest, no par value per share, of the Acquiring Fund. Please read it carefully and retain it for future reference.
The following documents have been filed with the SEC and are incorporated into this Proxy Statement/Prospectus by reference:
| | (i) | the Trust’s prospectus dated February 28, 2013 relating to the Acquiring Fund, which accompanies this Proxy Statement/Prospectus; |
| | (ii) | the Trust’s prospectus dated February 28, 2013 relating to the Target Fund; |
| | (iii) | the Statement of Additional Information relating to the proposed Reorganization, dated , 2013 (the “Reorganization SAI”); |
| | (iv) | the Trust’s statement of additional information dated February 28, 2013, as supplemented through the date of this Proxy Statement/Prospectus, relating to the Funds; |
| | (v) | the audited financial statements of the Acquiring Fund contained in the Trust’s Annual Report for the fiscal year ended October 31, 2012; and |
| | (vi) | the audited financial statements of the Target Fund contained in the Trust’s Annual Report for the fiscal year ended October 31, 2012. |
No other parts of the documents referenced above are incorporated by reference herein.
The financial highlights of the Acquiring Fund contained in the Trust’s Annual Report for the fiscal year ended October 31, 2012 are attached as Appendix B to this Proxy Statement/Prospectus.
Copies of the foregoing may be obtained without charge by calling or writing the Funds at the telephone number or address shown below. If you wish to request the Reorganization SAI, please ask for the “Reorganization SAI.” In addition, the Acquiring Fund will furnish, without charge, a copy of its most recent annual report and subsequent semi-annual report to a shareholder upon request. You may request any of the foregoing by calling (800) 992-8151 or by writing to Aston Funds at P.O. Box 9765, Providence, RI 02940.
The Trust is subject to the informational requirements of the Securities Exchange Act of 1934, as amended, and the Investment Company Act of 1940, as amended, and in accordance therewith files reports and other information with the SEC. Reports, proxy statements, registration statements and other information filed by the Trust (including the Registration Statement relating to the Acquiring Fund on Form N-14 of which this Proxy Statement/Prospectus is a part) may be inspected without charge and copied (for a duplication fee at prescribed rates) at the SEC’s Public Reference Room at 100 F Street, N.E., Washington, D.C. 20549 or at the SEC’s Northeast Regional Office (3 World Financial Center, New York, New York 10281) or Midwest Regional Office (175 W. Jackson Boulevard, Suite 900, Chicago, Illinois 60604). You may call the SEC at (202) 551-8090 for information about the operation of the Public Reference Room. You may obtain copies of this information, with payment of a duplication fee, by electronic request at the following e-mail address: publicinfo@sec.gov, or by writing the SEC’s Public Reference Branch, Office of Consumer Affairs and Information Services, Securities and Exchange Commission, Washington, D.C. 20549. You may also access reports and other information about the Funds on the EDGAR database on the SEC’s Internet site at http://www.sec.gov.
-ii-
TABLE OF CONTENTS
-iii-
TABLE OF CONTENTS
(continued)
-iv-
SYNOPSIS
The following is a summary of, and is qualified by reference to, the more complete information contained in this Proxy Statement/Prospectus and the information attached hereto or incorporated herein by reference, including the Agreement and Plan of Reorganization. If the Reorganization is approved and completed, shareholders of the Target Fund will become shareholders of the Acquiring Fund and will cease to be shareholders of the Target Fund.
Shareholders should read the entire Proxy Statement/Prospectus carefully, together with the Trust’s Prospectus relating to the Acquiring Fund that accompanies this Proxy Statement/Prospectus and is incorporated herein by reference. This Proxy Statement/Prospectus constitutes an offering of Class N and Class I shares of the Acquiring Fund.
Background
Prior to January 31, 2013, the Target Fund and the Acquiring Fund were managed by different subadvisers. Todd-Veredus Asset Management LLC (“Todd-Veredus”) served as the Target Fund’s subadviser and Lee Munder Capital Group, LLC (“LMCG”) served as the Acquiring Fund’s subadviser. During the fourth quarter of 2012, Todd-Veredus notified Aston Asset Management, LP (“Aston” or the “Adviser”) of its decision to terminate the sub-investment advisory agreement with respect to the Fund in connection with its decision to close the investment strategy for the Target Fund as soon as practicable. As a result, Aston recommended, and the Board of Trustees approved, the appointment of LMCG as subadviser to the Target Fund, effective January 31, 2013 (the “Subadviser Change Date”), in order to provide continuity of portfolio management to the Target Fund utilizing a substantially similar investment style, after Todd-Veredus ceased to serve as subadviser. Simultaneously, Aston recommended the reorganization of the Target Fund into the Acquiring Fund because the reorganization would provide the Target Fund’s shareholders with an investment style that is similar to that of the Target Fund. Although the Acquiring Fund has higher gross operating expenses, the consolidation of two substantially similar funds of relatively small sizes may result in a lower total operating expense ratio after taking into account the lower expense limitation in effect for the Acquiring Fund at least through February 28, 2014, and may result in economies of scale, which may subsequently lead to additional shareholder purchases and additional economies of scale.
The Reorganization
This Proxy Statement/Prospectus is being furnished to shareholders of the Target Fund in connection with the proposed combination of the Target Fund with and into the Acquiring Fund pursuant to the terms and conditions of an Agreement and Plan of Reorganization (the “Agreement”), among the Trust, on behalf of the Target Fund and on behalf of the Acquiring Fund, and Aston. The Agreement provides for (i) the transfer of all the assets of the Target Fund to the Acquiring Fund in exchange solely for Class N and Class I shares of beneficial interest, with no par value per share, of the Acquiring Fund and the assumption by the Acquiring Fund of all the liabilities of the Target Fund; and (ii) the distribution by the Target Fund of all the shares of each class of the Acquiring Fund received by the Target Fund to the shareholders of the corresponding class of the Target Fund in complete liquidation and the termination of the Target Fund as soon as practicable following the Closing Date (as defined herein).
If shareholders approve the Reorganization and it is completed, Target Fund shareholders will become shareholders of the Acquiring Fund. The Board has determined that the Reorganization is in the best interests of the Target Fund and that the interests of existing shareholders of each Fund will not be diluted as a result of the Reorganization. The Board unanimously approved the Agreement and the transactions contemplated thereunder at an in-person meeting held on December 13, 2012.
The Board is asking shareholders of the Target Fund to approve the Reorganization at the Special Meeting to be held on April 16, 2013. Approval of the Reorganization requires the affirmative vote of the
1
holders of “a majority of the outstanding voting securities,” as defined by the 1940 Act. See “Voting Information and Requirements” below. The Board recommends that shareholders vote “FOR” the Reorganization.
If shareholders of the Target Fund approve the Reorganization, it is expected that the Reorganization will occur at 8:00 a.m. Central Time on April 22, 2013 (the “Closing Date”), or as soon as practicable thereafter. If the Reorganization is not approved, the Board will take such action as it deems to be in the best interests of the Target Fund. The Closing Date may be delayed and the Reorganization may be abandoned at any time by the mutual agreement of the parties. In addition, either Fund may at its option terminate the Agreement at or before the Closing Date due to (i) a breach by any other party of any representation, warranty or agreement contained in the Agreement to be performed at or before the Closing Date, if not cured within 30 days, (ii) a condition precedent to the obligations of the terminating party that has not been met and reasonably appears will not or cannot be met, or (iii) a determination by the Board that the consummation of the transactions contemplated by the Agreement is not in the best interests of a Fund.
Board of Trustees Recommendation
The Board believes that the proposed Reorganization would be in the best interests of each Fund. In approving the Reorganization and recommending that shareholders of the Target Fund approve the Reorganization, the Board considered a number of factors in reaching its determination, including the following:
| | • | | the appointment of the Acquiring Fund’s subadviser to serve as subadviser to the Target Fund; |
| | • | | the similarities and differences in the Funds’ investment objectives, principal investment strategies and principal risks; |
| | • | | the Funds’ relative sizes and potential for economies of scale; |
| | • | | the investment performance of the Funds; |
| | • | | the relative fees and expense ratios of the Funds, including the contractual expense caps in place for each Fund; |
| | • | | alternatives to the Reorganization; |
| | • | | the anticipated tax-free nature of the Reorganization; |
| | • | | the expected costs of the Reorganization and the extent to which the Funds would bear any such costs; |
| | • | | the effect of the Reorganization on shareholder services and shareholder rights; and |
| | • | | any potential benefits of the Reorganization to Aston and its affiliates as a result of the Reorganization. |
For a more detailed discussion of the Board’s considerations regarding the approval of the Reorganization, see “The Board’s Consideration of the Reorganization.”
2
Shareholder Information
The Funds have identical procedures for purchasing, exchanging and selling/redeeming shares, and for making distributions. Both Funds offer Class N and Class I shares. The classes of each Fund have the same investment eligibility criteria. See “Comparison of the Funds” below for a more detailed discussion.
Material Federal Income Tax Consequences of the Reorganization
The Reorganization is intended to qualify as a tax-free reorganization for federal income tax purposes. If the Reorganization so qualifies, neither the Target Fund nor its shareholders will recognize any gain or loss as a direct result of the transfers contemplated by the Reorganization. Prior to the Closing Date, the Target Fund will declare a distribution to its shareholders, which together with all previous distributions, will have the effect of distributing to shareholders all its net investment income and realized net capital gains (after reduction by any available capital loss carryforwards), if any, through the Closing Date. Such distribution will be taxable to the Target Fund’s shareholders for federal income tax purposes. As a result of the change in subadviser effective on the Subadviser Change Date, the Target Fund will experience greater than normal portfolio turnover while LMCG repositions the portfolio. A majority of the securities in the Target Fund may be sold between the Subadviser Change Date and the Closing Date as a result of LMCG implementing its investment strategy. Such portfolio turnover will occur whether or not the Reorganization is consummated. Any income or losses realized by the Target Fund as a result of such portfolio turnover may increase or decrease the net investment income and net capital gain to be distributed by the Target Fund. Portfolio turnover as a direct result of the Reorganization is expected to be less than 5% of the assets of the Target Fund. For a more detailed discussion of the federal income tax consequences of the Reorganization, please see “The Proposed Reorganization—Material Federal Income Tax Consequences” below.
COMPARISON OF THE FUNDS
Investment Objectives
The investment objectives of the Funds are substantially similar. The investment objective of the Target Fund is to provide capital appreciation, and the investment objective of the Acquiring Fund is to provide long-term capital appreciation. The investment objective of each Fund is fundamental and may not be changed without shareholder approval.
Investment Strategies
The Target Fund and the Acquiring Fund have substantially similar principal investment strategies. The similarities and differences of the principal investment strategies of the Funds are:
| | | | | | | | |
Target Fund | | | | Acquiring Fund |
| • | | Under normal circumstances, the Fund invests at least 80% of its assets in common stock and other equity securities of small-cap companies. The Fund defines a small-cap company as one having a market capitalization of less than $2.5 billion at the time of acquisition. | | | | • | | Under normal circumstances, the Fund invests at least 80% of its assets in common stock and other equity securities of small-cap companies. The Fund defines a small-cap company as one having a market capitalization of less than $3.0 billion at the time of acquisition. |
3
| | | | | | | | |
Target Fund | | | | Acquiring Fund |
| • | | The Fund seeks to invest in growth stocks of small-cap companies whose earnings are growing, or are expected to grow, at an accelerating rate. | | | | • | | The portfolio manager seeks to achieve above average risk-adjusted returns by identifying unrecognized growth potential. |
| | | | |
| • | | The portfolio managers look for inefficiencies in the market caused by inaccurate expectations (e.g., positive earnings surprises, estimate revisions). The focus is on companies that have expanding unit volume growth; expanding profit margin potential; high or improving cash flow return on investment; and large markets with high barriers to entry. | | | | • | | The portfolio manager utilizes a fundamental bottom-up security selection process to identify characteristics such as: revenue growth, margin expansion, surprise potential and strong balance sheets. |
| | | | |
| • | | The Fund may also invest in equity securities outside the small-cap range. The Fund may invest in exchange-traded funds (“ETFs”), publicly traded partnerships and foreign securities (directly and indirectly through depositary receipts). | | | | • | | The Fund may also invest in mid-cap stocks, including companies with a market capitalization up to $10 billion at the time of acquisition. |
| | | | |
| • | | Sector exposure is a residual of the investment process and the Fund may, from time to time, have exposure to a single sector or group of related sectors that react similarly to market, economic or other events. | | | | | | |
Comparison of Principal Investment Strategies
The investment objectives and principal investment strategies of the Funds are substantially similar. However, there are some differences. Each Fund invests at least 80% of its assets in small-cap companies under normal circumstances. However, the Target Fund defines a small-cap company as one having a market capitalization of less than $2.5 billion at the time of acquisition and the Acquiring Fund defines a small-cap company as one having a market capitalization of less than $3.0 billion at the time of acquisition. Both Funds seek to invest in companies with growth potential. Prior to the Subadviser Change Date, the subadvisers to the Target Fund and the Acquiring Fund were different and each subadviser had different investment processes for selecting securities. However, as of the Subadviser Change Date, the Funds have the same subadviser, and as a result, there is a significant degree of overlap between the portfolio holdings of the Funds as of the date of this Proxy Statement/Prospectus.
While each Fund may invest in companies outside of the small-cap range, the Acquiring Fund may only invest in companies with market capitalization of up to $10 billion. Both Funds may invest in ETFs, publicly-traded partnerships and foreign securities, but the Target Fund may do so as a principal strategy.
The Reorganization may result in one-time brokerage costs for the Target Fund to the extent it is necessary for the Target Fund to sell securities prior to the Reorganization so that the Acquiring Fund’s portfolio immediately following the Reorganization remains in compliance with its investment policies and restrictions. As a result of the subadviser change described above, however, it is expected that the Target Fund will have commenced repositioning its portfolio as of the Subadviser Change Date and will have sold a material portion of its portfolio as of the date of this Proxy Statement/Prospectus. The repositioning of the portfolio by LMCG is expected to be completed prior to the Closing Date and such portfolio turnover will take place whether or not the Reorganization is consummated. Any portfolio sales that occur prior to the Reorganization, whether as a result of the subadviser change or the Reorganization,
4
may result in taxable distributions to Target Fund shareholders. See “The Proposed Reorganization—Material Federal Income Tax Consequences” below.
Risk Factors
In evaluating the Reorganization, you should consider carefully the risks of the Acquiring Fund. Investing in a mutual fund involves risk, including the risk that you could lose money by investing in a fund. For a complete description of the risks of an investment in the Acquiring Fund, see the section in the Acquiring Fund’s Prospectus entitled “Principal Risks.”
Because the Funds have substantially similar investment strategies, the principal risks of each Fund are substantially similar. The principal risks of investing in the Acquiring Fund are described below.
Growth Style Risk. Growth investing involves buying stocks that have relatively high price-to-earnings ratios. Growth stocks may be more volatile than other stocks because they are generally more sensitive to investor perceptions and market moves. During periods of growth stock underperformance, the Fund’s performance may suffer.
Liquidity Risk. When there is no willing buyer and investments cannot be readily sold at the desired time or price, the Fund may need to accept a lower price or may not be able to sell the security at all. An inability to sell securities can adversely affect the Fund’s value or prevent the Fund from being able to take advantage of other investment opportunities. Less liquid securities are more difficult to dispose of at their recorded values and are subject to increased spreads and volatility.
Manager Risk. The performance of the Fund is dependent upon the investment adviser’s skill in selecting managers and the portfolio manager’s skill in making appropriate investments. As a result, the Fund may underperform its benchmark or its peers.
Market Risk. The Fund’s share price can move down in response to stock market conditions, changes in the economy or changes in a particular company’s stock price. An individual stock may decline in value even when the value of stocks in general is rising.
Portfolio Turnover Risk. Frequent trading of the Fund’s portfolio holdings may result in a higher than average level of capital gains, including short-term gains, and will result in greater transaction costs to the Fund. To the extent distributions to shareholders are made from net short-term capital gains (i.e. net capital gain on securities held or treated as held by the Fund for one year or less minus any net capital losses on securities held or treated as held by the Fund for more than one year), the distributions will be taxed at ordinary income rates for federal income tax purposes, rather than at the lower long-term capital gains rates. Greater transaction costs and higher expenses as a result of portfolio turnover can negatively impact the Fund’s performance.
Small-Cap and Mid-Cap Company Risks. Investing in securities of small-cap and mid-cap companies may involve greater risks than investing in securities of larger, more established issuers. Small-cap and mid-cap companies generally have limited product lines, markets and financial resources. Their securities may trade less frequently and in more limited volume than the securities of larger, more established companies. Also, small-cap and mid-cap companies are typically subject to greater changes in earnings and business prospects than larger companies. As a result, their stock prices may experience greater volatility and may decline significantly in market downturns.
An investment in the Target Fund is also subject to each of the foregoing principal risks. In addition, principal risks of investing in the Target Fund include risks associated with investments in other
5
investment companies, foreign securities and publicly-traded partnerships, as well as sector concentration risk.
Fundamental Investment Restrictions
The Funds have substantially similar fundamental investment restrictions that cannot be changed without shareholder approval. In addition, each Fund is a diversified fund. As diversified funds, each Fund, with respect to 75% of its assets, may not invest more than 5% of its total assets in the securities of any one issuer (other than securities issued by other investment companies or by the U.S. government, its agencies, instrumentalities or authorities) and may not purchase more than 10% of the outstanding voting securities of any one issuer.
Fees and Expenses
The table below provides information about the fees and expenses attributable to each class of shares of the Funds, and the pro forma fees and expenses of the combined fund following the Reorganization. Total Annual Fund Operating Expenses reflect the fees and expenses for the Funds as of their fiscal year ended October 31, 2012, and the pro forma fees and expenses are based on the amounts shown in the table for each Fund, assuming that the Reorganization occurred at the beginning of the most recently completed fiscal year (i.e., on November 1, 2011).
Annual Fund Operating Expenses
(expenses that you pay each year as a percentage of the value of your investment)
| | | | | | |
| | | Target
Fund | | Acquiring
Fund | | Combined
Fund Pro
Forma1 |
Management Fees | | | | | | |
Class N | | 1.00% | | 1.00% | | 1.00% |
Class I | | 1.00% | | 1.00% | | 1.00% |
Distribution and Service (12b-1) Fees | | | | | | |
Class N | | 0.25% | | 0.25% | | 0.25% |
Class I | | — | | — | | — |
Other Expenses | | | | | | |
Class N | | 0.58% | | 1.61% | | 0.79% |
Class I | | 0.58% | | 1.61% | | 0.79% |
Acquired Fund Fees and Expenses | | | | | | |
Class N | | 0.00% | | 0.01% | | 0.01% |
Class I | | 0.00% | | 0.01% | | 0.01% |
Total Annual Fund Operating Expenses | | | | | | |
Class N | | 1.83% | | 2.87% | | 2.05% |
Class I | | 1.58% | | 2.62% | | 1.80% |
Less Fee Waiver and/or Expense Reimbursement2 | | | | | | |
Class N | | (0.34)% | | (1.51)%3 | | (0.69)% |
Class I | | (0.34)% | | (1.51)%3 | | (0.69)% |
Total Annual Fund Operating Expenses After Fee Waiver and/or Expense Reimbursement | | | | | | |
Class N | | 1.49% | | 1.36% | | 1.36% |
Class I | | 1.24% | | 1.11% | | 1.11% |
| 1 | Gross pro forma expenses include the expenses to be charged to the Funds in connection with the Reorganization. However, it is expected that both Funds will be operating at expense levels exceeding their respective contractual expenses caps, thus resulting in the Adviser reimbursing the Funds for all direct expenses related to the Reorganization. See “The Proposed Reorganization—Reorganization Expenses” for additional information about these expenses. |
| 2 | The Adviser is contractually obligated to waive management fees and/or reimburse ordinary operating expenses, not including investment-related costs (such as brokerage commissions), interest, taxes, extraordinary expenses and |
6
| | acquired fund fees and expenses, through February 28, 2014, to the extent that operating expenses exceed the rates set forth above, as a percentage of each Fund’s average daily net assets with respect to each Fund (the “Operating Expense Limit”). Prior to February 28, 2014, the arrangement may be amended or terminated for a class only by a vote of the Board of Trustees of the Trust. |
| 3 | For a period of up to three years from the fiscal year end during which an amount was waived or reimbursed, the Adviser is entitled to be reimbursed by the Acquiring Fund for fees waived and expenses reimbursed from commencement of operations through the completion of the first three full fiscal years to the extent that the Fund’s Total Annual Operating Expenses for a class, not including investment-related costs (such as brokerage commissions), interest, taxes, extraordinary expenses and acquired fund fees and expenses, remains at or below the Operating Expense Limit after such reimbursement. |
Example
The example below is intended to help you compare the cost of investing in each Fund and the pro forma cost of investing in the combined fund. The example shows the operating expenses you would incur as a shareholder if you invested $10,000 in a Fund over the time periods shown and you redeem all your shares at the end of those periods. The example assumes that the average annual return was 5%, operating expenses remained the same, and expenses were capped for one year in each period. Although your actual costs may be higher or lower, based on these assumptions your costs would be:
| | | | | | |
| | | Target
Fund | | Acquiring
Fund | | Combined
Fund Pro
Forma |
1 Year | | | | | | |
Class N | | $ 152 | | $ 138 | | $ 138 |
Class I | | $ 126 | | $ 113 | | $ 113 |
3 Years | | | | | | |
Class N | | $ 543 | | $ 746 | | $ 576 |
Class I | | $ 466 | | $ 671 | | $ 499 |
5 Years | | | | | | |
Class N | | $ 959 | | $1,380 | | $1,040 |
Class I | | $ 828 | | $1,255 | | $ 910 |
10 Years | | | | | | |
Class N | | $2,120 | | $3,086 | | $2,324 |
Class I | | $1,850 | | $2,842 | | $2,059 |
Portfolio Turnover
Each Fund pays transaction costs, such as commissions, when it buys and sells securities (or “turns over” its portfolio). A higher portfolio turnover may indicate higher transaction costs and may result in higher taxes when shares are held in a taxable account. These costs, which are not reflected in annual fund operating expenses or in the example, affect a Fund’s performance. During the most recent fiscal year for which audited financial statements are available, the Funds had the following portfolio turnover rates:
| | | | |
Fund | | Fiscal Year End | | Rate |
Target Fund | | 10/31/12 | | 158.83% |
Acquiring Fund | | 10/31/12 | | 168.05% |
After the Reorganization is completed, the portfolio manager of the Acquiring Fund may, in his discretion, sell securities acquired from the Target Fund. To the extent that the portfolio manager chooses to sell a significant percentage of such securities, the Acquiring Fund’s portfolio turnover rate and brokerage costs may be higher than they otherwise would have been.
7
Performance Information
A comparison of the total returns of the Funds for the periods ended December 31, 2012, based on historical fees and expenses for each period, is set forth in the charts and tables below.
The bar charts show how the performance of the Class N shares of each Fund has varied from year to year for the periods shown. Class N shares and Class I shares are invested in the same portfolio of securities, so the annual returns would differ only to the extent that the classes have different expenses. The annual returns of the Class I shares would be higher than the returns of the Class N shares due to 12b-1 fees paid with respect to Class N shares. This information may help illustrate the risks of investing in the Funds. The Funds make updated performance information available on the Funds’ website, www.astonfunds.com, or by calling 800-992-8151. As with all mutual funds, past performance (before and after taxes) does not guarantee future performance.
8
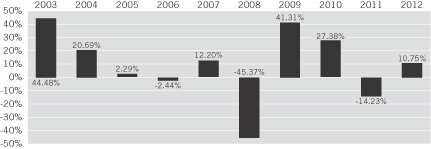
Target Fund*
Class N Annual Total Return
| * | During the periods shown in the chart, Todd-Veredus Asset Management LLC or Veredus Asset Management LLC served as subadviser to the Fund. Accordingly, returns may have differed had the current subadviser been in place. |
During the periods shown in the bar chart, the Target Fund’s highest and lowest calendar quarter returns were 30.94% and -28.07%, respectively, for the quarters ended September 30, 2009 and September 30, 2011.
Acquiring Fund*
Class N Annual Total Return
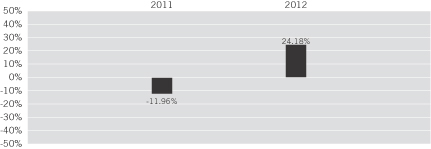
| * | The Acquiring Fund commenced operations November 3, 2010. Prior to February 17, 2012, another firm served as subadviser to the Fund. However, the same portfolio manager has been in place since the Fund’s inception. |
During the periods shown in the bar chart, the Acquiring Fund’s highest and lowest calendar quarter returns were 16.15% and -27.36%, respectively, for the quarters ended March 31, 2012 and September 30, 2011.
9
The following tables indicate how each Fund’s average annual returns for different calendar periods compared to the returns of a broad-based securities market index.
| | | | | | | | |
| | | Average Annual Total Returns for the
Periods Ended December 31, 2012* |
Target Fund | | 1 Year | | 5 Years | | 10 Years | | Since
Inception |
Class N Shares (Inception 6/30/98) | | | | | | | | |
Return Before Taxes | | 10.75% | | (1.35)% | | 6.19% | | 6.71% |
Return After Taxes on Distributions | | 10.75% | | (1.38)% | | 5.36% | | 5.40% |
Return After Taxes on Distributions and Sale of Fund Shares | | 6.99% | | (1.16)% | | 5.21% | | 5.33% |
Class I (Inception 10/05/01) | | | | | | | | |
Return Before Taxes | | 11.11% | | (1.09)% | | 6.48% | | 1.12% |
Russell 2000 Growth Index (Reflects no deduction for taxes, expenses or fees. Index return for Class I shares, since inception, computed from September 30, 2001, is 7.44%.) | | 14.59% | | 3.49% | | 9.80% | | 3.80% |
| * | From the inception of the Fund through January 31, 2013, Todd-Veredus Asset Management LLC or Veredus Asset Management LLC served as subadviser to the Fund. Accordingly, returns may have differed had the current subadviser been in place. |
| | | | |
| | | Average Annual Total Returns for the
Periods Ended December 31, 2012** |
Acquiring Fund | | 1 Year | | Since Inception |
Class N Shares (Inception 11/03/10) | | | | |
Return Before Taxes | | 24.18% | | 9.09% |
Return After Taxes on Distributions | | 21.31% | | 7.92% |
Return After Taxes on Distributions and Sale of Fund Shares | | 16.07% | | 7.16% |
Class I (Inception 6/01/11) | | | | |
Return Before Taxes | | 24.43% | | (1.43)% |
Russell 2000 Growth Index (Reflects no deduction for taxes, expenses or fees. Index return since inception for Class N shares is computed from October 31, 2010. Index return for Class I shares, since inception, computed from May 31, 2011, is 0.16%.) | | 14.59% | | 10.81% |
| ** | Prior to February 17, 2012, a different investment manager served as subadviser to the Fund. However, the portfolio manager of the Fund has been in place since the Fund’s inception. |
Investment Adviser and Subadviser
Aston Asset Management, LP serves as investment adviser to the Funds. Aston is a majority-owned and independently managed indirect subsidiary of Affiliated Managers Group, Inc. (“AMG”). A wholly-owned subsidiary of AMG, Manor LLC, serves as the General Partner of Aston, and senior management and key employees of Aston have an equity interest in Aston. Aston commenced operations on December 1, 2006 and converted to a Delaware limited partnership on April 15, 2010 in connection with AMG’s acquisition of a controlling interest in Aston. As of December 31, 2012, Aston had approximately $11.5 billion in assets under management.
Lee Munder Capital Group, LLC (“LMCG”), 200 Clarendon Street, 28th Floor, Boston, Massachusetts 02116, has served as the subadviser to the Acquiring Fund since February 17, 2012 and to the Target Fund since January 31, 2013. LMCG was founded in August 2000. LMCG is majority-owned
10
by Convergent Capital Management, LLC. As of December 31, 2012, LMCG had approximately $5.0 billion in assets under management.
Mr. Andrew Morey, CFA, lead portfolio manager of LMCG’s small- and small/mid-cap investment strategies has served as the Acquiring Fund’s portfolio manager since its inception and as the Target Fund’s portfolio manager since January 31, 2013. Mr. Morey joined LMCG in February 2012. Mr. Morey has 20 years of investment management experience, and prior to joining LMCG, he served as portfolio manager at Crosswind Investments, LLC for Crosswind’s small- and small/mid-cap investment strategies. Previously, Mr. Morey was the founder and portfolio manager of Tartan Partners, LLC from 2005 to 2007. Prior to Tartan Partners, Mr. Morey worked at State Street Research & Management as a portfolio manager, and at Gabelli & Co. as a research analyst. Mr. Morey holds the Chartered Financial Analyst designation.
For a complete description of the advisory services provided to the Acquiring Fund, see the section of the Trust’s Prospectus entitled “Management of the Funds” and the sections of the Trust’s Statement of Additional Information entitled “Investment Adviser” and “Subadvisers.” Additional information about the portfolio manager compensation structure, other accounts managed by the portfolio manager and the portfolio manager’s ownership of securities in the Funds is provided in the Trust’s Statement of Additional Information.
Advisory and Other Fees
For the services provided and the expenses assumed pursuant to the Investment Advisory Agreement with Aston, Aston receives a management fee from each Fund based on the Fund’s average daily net assets, computed daily and payable monthly, at the following annual rates:
| | |
Fund | | Management Fee |
ASTON Small Cap Fund | | 1.00% |
ASTON/LMCG Small Cap Growth Fund | | 1.00% |
For the services provided pursuant to the Sub-Investment Advisory Agreement with LMCG with respect to the Acquiring Fund and the Target Fund, Aston pays LMCG a fee computed daily and payable monthly. The sub-advisory fee rate is 50% of the applicable advisory fee less any fee waivers and expense reimbursements and certain payments to third-party intermediaries.
Aston has entered into an Expense Reimbursement Agreement with the Trust, on behalf of the Acquiring Fund, through February 28, 2014, under which Aston will waive its fees or reimburse the Fund’s expenses to the extent that the Fund’s annual operating expense ratio, not including interest, taxes, investment-related costs (such as brokerage commissions), extraordinary expenses and acquired fund fees and expenses, exceeds 1.10% for Class I shares and 1.35% for Class N shares. In connection with the Expense Reimbursement Agreement for each class of shares, the Acquiring Fund has agreed that for a period of up to three years from the end of the fiscal year end in which such amount was waived or reimbursed, the Adviser is entitled to be reimbursed by the Fund for fees waived and expenses reimbursed from the commencement of operations of the class of shares through the completion of the Fund’s first three full fiscal years of that class to the extent that the Fund’s expense ratio with respect to that class (not including interest, taxes, other investment-related costs (such as brokerage commissions), extraordinary expenses and acquired fund fees and expenses) remains at or below the applicable operating expense cap after such reimbursement.
In addition, Aston has entered into an Expense Limitation Agreement with the Trust, on behalf of the Target Fund, through February 28, 2014 under which Aston will waive its fees or reimburse the
11
Fund’s expenses to the extent that the Fund’s annual operating expense ratio, not including interest, taxes, investment-related costs (such as brokerage commissions), extraordinary expenses and acquired fund fees and expenses, exceeds 1.24% for Class I shares and 1.49% for Class N shares.
The Board has adopted plans of distribution (the “Plans”) pursuant to Rule 12b-1 under the 1940 Act, which permit the Class N shares of each Fund to pay certain expenses associated with the distribution of its shares and the provision of shareholder services. Class I shares are not subject to Rule 12b-1 fees.
Under the Plans, each Fund is authorized to pay an annual rate not exceeding 0.25% of the Fund’s average daily net assets for Class N shares. From this amount, the Trust’s distributor may make payments to financial institutions and intermediaries such as banks, savings and loan associations, insurance companies, investment counselors, broker-dealers, and the distributor’s affiliates and subsidiaries as compensation for services, reimbursement of expenses incurred in connection with distribution assistance or the provision of shareholder services. The Plans for Class N shares are characterized as reimbursement plans and are directly tied to expenses incurred by the distributor; therefore, the payments the distributor receives during any year may not exceed its actual expenses.
Trustees and Officers
Both Funds are series of the Trust and, as a result, have the same Board and the same officers. The management of each Fund, including general oversight of the duties performed by Aston under the Investment Advisory Agreement for each Fund, is the responsibility of the Board. The Board currently is composed of nine trustees (each, a “Trustee”), seven of whom are not “interested persons” (as that term is defined in the 1940 Act). The names and business addresses of the Trustees and officers of the Funds and their principal occupations and other affiliations during the past five years are set forth under “Trustees and Officers of the Trust” in the Statement of Additional Information for the Trust incorporated herein by reference.
Purchase and Sale of Fund Shares
Each Fund offers Class N and Class I shares. You may purchase, exchange, or redeem shares of the Funds on any business day, which is any day the New York Stock Exchange is open for trading. You may purchase, exchange or redeem shares of each Fund through a financial representative or directly from the Fund. Each Fund’s initial and subsequent investment minimums generally are as follows, although each Fund may reduce or waive the minimums in some cases:
| | | | | | | | |
| | | Class N | | | Class I |
| | | |
ASTON/LMCG Small Cap Growth Fund | | Regular Accounts | | | $2,500 | | | Institutional Accounts $1 Million |
| | Individual Retirement Accounts | | | $500 | | | |
| | Education Savings Accounts | | | $500 | | | |
| | Custodial Accounts for Minors | | | $500 | | | |
| | | |
ASTON Small Cap Fund | | Regular Accounts | | | $2,500 | | | Institutional Accounts $1 Million |
| | Individual Retirement Accounts | | | $500 | | | |
| | Education Savings Accounts | | | $500 | | | |
| | Custodial Accounts for Minors | | | $500 | | | |
For a complete description of purchase, redemption and exchange options, see the section of the Trust’s Prospectus entitled “Shareholder Information” and the section of the Trust’s Statement of Additional Information entitled “Redemptions-In-Kind.”
12
Tax Information
The Funds’ distributions are generally taxable as ordinary income or capital gains for federal income purposes, unless you are investing through a tax-deferred account such as a 401(k) or individual retirement account. Distributions on investments made through tax-deferred vehicles, such as 401(k) plans or IRAs, may be taxed later upon withdrawal of assets from those plans or accounts.
Payments to Broker-Dealers and Other Financial Intermediaries
If you purchase shares of a Fund through a broker-dealer or another financial intermediary (such as a bank), the Fund and its related companies may pay the intermediary for the sale of shares and related services. These payments may create a conflict of interest by influencing the broker-dealer or other intermediary and your salesperson to recommend the Fund over another investment. Ask your salesperson or visit your financial intermediary’s website for more information.
THE PROPOSED REORGANIZATION
The proposed Reorganization will be governed by the Agreement, a form of which is attached as Appendix A. The following discussion of the Agreement is qualified in its entirety by the full text of the Agreement.
The Board has determined that the proposed Reorganization is in the best interests of each Fund and that the interests of shareholders of each Fund will not be diluted as a result of the transactions contemplated by the Agreement.
The Agreement provides that the closing of the Reorganization will take place at 8:00 a.m. Central Time on the Closing Date. At the closing, the Target Fund will transfer all its assets to the Acquiring Fund, and in exchange, the Acquiring Fund will assume all the liabilities of the Target Fund and deliver to the Target Fund a number of full and fractional shares of the Acquiring Fund having an aggregate value equal to the value of the assets of the Target Fund less the liabilities of the Target Fund assumed by the Acquiring Fund. On or as soon after the Closing Date as is practicable, the Target Fund will distribute in complete liquidation of the Target Fund, pro rata to its Class N and Class I shareholders, all Class N and Class I shares of the Acquiring Fund received by the Target Fund. This distribution will be accomplished by the transfer of Acquiring Fund shares credited to the account of the Target Fund on the books of the Acquiring Fund to open accounts on the share records of the Acquiring Fund in the name of the Target Fund shareholders, and representing the respective pro rata number of Acquiring Fund shares due such shareholders. All issued and outstanding shares of the Target Fund will simultaneously be canceled on the books of the Target Fund. The Acquiring Fund shall not issue certificates representing Acquiring Fund shares in connection with such transfer.
The aggregate net asset value of Acquiring Fund shares received by the Target Fund in the Reorganization will equal, as of the close of regular trading on the New York Stock Exchange on the business day immediately prior to the Closing Date, the aggregate net asset value of Target Fund shares held by Target Fund shareholders.
The consummation of the Reorganization is subject to the terms and conditions of, and the representations and warranties being true as set forth in, the Agreement. The Agreement may be terminated by the mutual agreement of the parties to the Reorganization, and such termination may be effected by the Trust’s President without further action by the Board. In addition, either the Acquiring Fund or the Target Fund may at its option terminate the Agreement at or before the Closing Date due to (a) a breach by any other party to the Reorganization of any representation, warranty or agreement
13
contained therein to be performed at or before the Closing Date, if not cured within 30 days; (b) a condition precedent to the obligations of the terminating party has not been met and it reasonably appears that it will not or cannot be met; or (c) a determination by the Board that the consummation of the transactions contemplated therein with respect to the Reorganization is not in the best interests of the Acquiring Fund or the Target Fund.
The Target Fund will, within a reasonable period of time before the Closing Date, furnish the Acquiring Fund with a list of the Target Fund’s portfolio securities and other investments. The Acquiring Fund will, within a reasonable period of time before the Closing Date, furnish the Target Fund with a list of the securities, if any, on the Target Fund’s list referred to above that do not conform to the Acquiring Fund’s investment objective, policies and restrictions. The Target Fund, if requested by the Acquiring Fund, will dispose of securities on such Acquiring Fund’s list before the Closing Date. In addition, if it is determined that the portfolios of the Target Fund and the Acquiring Fund, when aggregated, would contain investments exceeding certain percentage limitations imposed upon the Acquiring Fund with respect to such investments, the Target Fund, if requested by the Acquiring Fund, will dispose of a sufficient amount of such investments as may be necessary to avoid violating such limitations as of the Closing Date. Notwithstanding the foregoing, nothing herein will require the Target Fund to dispose of any investments or securities if, in the reasonable judgment of the Board or the Adviser, such disposition would adversely affect the status of the Reorganization as a “reorganization” for federal income tax purposes or would otherwise not be in the best interests of the Target Fund.
Description of Securities to be Issued
The Acquiring Fund has established and designated Class N and Class I shares, no par value per share. The Acquiring Fund is authorized to issue an unlimited number of shares. The number of Acquiring Fund shares to be issued (including fractional shares, if any) in exchange for the Target Fund’s net assets shall be determined with respect to each class by dividing the Target Fund’s net assets with respect to each class of shares of the Target Fund by the net asset value per share of the respective class of Acquiring Fund shares. All shares issued are fully paid and non-assessable, and shareholders have no preemptive or other right to subscribe to any additional shares and no conversion rights. See also “Rights of Shareholders” below.
Service Providers
The Bank of New York Mellon serves as the custodian for the Funds and BNY Mellon Investment Servicing (US) Inc. serves as transfer agent and dividend paying agent for the Funds. Ernst & Young LLP is the Trust’s independent registered public accounting firm.
Material Federal Income Tax Consequences
As a condition to each Fund’s obligation to consummate the Reorganization, each Fund will receive a tax opinion from Vedder Price P.C. (which opinion will be based on certain factual representations and certain customary assumptions and exclusions) substantially to the effect that, on the basis of the existing provisions of the Internal Revenue Code of 1986, as amended (the “Code”), current administrative rules and court decisions, for federal income tax purposes:
| | 1. | The transfer of all the assets of the Target Fund to the Acquiring Fund in exchange solely for Acquiring Fund shares and the assumption by the Acquiring Fund of all the liabilities of the Target Fund, followed by the pro rata distribution to the Target Fund shareholders of all the Acquiring Fund shares received by the Target Fund in complete liquidation of the Target Fund, will constitute a “reorganization” within the meaning of Section 368(a) of the Code, and the Acquiring Fund and the Target Fund will each be a “party to a |
14
| | reorganization” within the meaning of Section 368(b) of the Code with respect to the Reorganization. |
| | 2. | No gain or loss will be recognized by the Acquiring Fund upon the receipt of all the assets of the Target Fund solely in exchange for Acquiring Fund shares and the assumption by the Acquiring Fund of all the liabilities of the Target Fund. |
| | 3. | No gain or loss will be recognized by the Target Fund upon the transfer of all the Target Fund’s assets to the Acquiring Fund solely in exchange for Acquiring Fund shares and the assumption by the Acquiring Fund of all the liabilities of the Target Fund or upon the distribution (whether actual or constructive) of all such Acquiring Fund shares to the Target Fund shareholders solely in exchange for such shareholders’ shares of the Target Fund in complete liquidation of the Target Fund. |
| | 4. | No gain or loss will be recognized by Target Fund shareholders upon the exchange of their Target Fund shares solely for Acquiring Fund shares pursuant to the Reorganization. |
| | 5. | The aggregate basis of the Acquiring Fund shares received by each Target Fund shareholder pursuant to the Reorganization will be the same as the aggregate basis of the Target Fund shares exchanged therefor by such shareholder. The holding period of the Acquiring Fund shares received by each Target Fund shareholder will include the period during which the Target Fund shares exchanged therefor were held by such shareholder, provided such Target Fund shares are held as capital assets at the effective time of the Reorganization. |
| | 6. | The basis of the Target Fund’s assets acquired by the Acquiring Fund will be the same as the basis of such assets to the Target Fund immediately before the Reorganization. The holding period of the assets of the Target Fund in the hands of the Acquiring Fund will include the period during which those assets were held by the Target Fund. |
No opinion will be expressed as to (1) the effect of the Reorganization on (A) the Target Fund, the Acquiring Fund or any Target Fund shareholder with respect to any asset as to which any unrealized gain or loss is required to be recognized under federal income tax principles (i) at the end of a taxable year (or on the termination thereof) or (ii) upon the transfer of such asset regardless of whether such transfer would otherwise be a non-taxable transaction under the Code, or (B) the Target Fund, the Acquiring Fund or any Target Fund shareholder with respect to any stock held in a passive foreign investment company as defined in Section 1297(a) of the Code or (2) any other federal tax issues (except those set forth above) and all state, local or foreign tax issues of any kind.
Prior to the closing of the Reorganization, the Target Fund will declare a distribution to its shareholders, which together with all previous distributions, will have the effect of distributing to shareholders all its net investment income and realized net capital gains (after reduction by any available capital loss carryforwards), if any, through the closing of the Reorganization. This distribution will be taxable to shareholders for federal income tax purposes and may include net capital gains resulting from the sale of portfolio assets discussed below. Additional distributions may be made if necessary. All dividends and distributions will be reinvested in additional shares of the Target Fund unless a shareholder has made an election to receive dividends and distributions in cash. Dividends and distributions are treated the same for federal income tax purposes whether received in cash or additional shares.
To the extent that a portion of the Target Fund’s portfolio assets are sold prior to the Reorganization, the federal income tax effect of such sales would depend on the holding periods of such assets and the difference between the price at which such portfolio assets were sold and the Target Fund’s
15
basis in such assets. Any net capital gains (net long-term capital gain in excess of any net short-term capital loss) recognized in these sales, after the application of any available capital loss carryforwards (capital losses from prior taxable years that may be used to offset future capital gains), would be distributed to the Target Fund’s shareholders as capital gain dividends. Any net short-term capital gains (net short-term capital gain in excess of any net long-term capital loss), after application of any available capital loss carryforwards would be distributed as ordinary dividends. All such distributions would be made during or with respect to the Target Fund’s taxable year in which the sale occurs and would be taxable for federal income tax purposes to shareholders subject to federal income tax. Although the Target Fund is expected to have substantial portfolio turnover as a result of the appointment of LMCG as subadviser effective January 31, 2013, any gains resulting from such sales are expected to be offset by available capital loss carryforwards of the Target Fund.
At October 31, 2012, the Funds had unused capital loss carryforwards available for federal income tax purposes to be applied against future capital gains, if any. If not applied, the capital loss carryforwards would expire as follows:
| | | | |
| | | Acquiring
Fund | | Target Fund |
Expiration Date: | | | | |
October 31, 2016 | | $ — | | $ 2,506,635 |
October 31, 2017 | | — | | 16,347,889 |
Total | | $ — | | $18,854,524 |
For net capital losses arising in taxable years beginning after December 22, 2010 (“post-enactment losses”), a Fund will generally be able to carry forward such capital losses indefinitely. A Fund’s net capital losses from taxable years beginning on or prior to December 22, 2010, however, will remain subject to their current expiration dates and can be used only after the post-enactment losses.
After the Reorganization, the Acquiring Fund’s ability to use the Target Fund’s pre-Reorganization capital losses, if any, may be limited under certain federal income tax rules applicable to reorganizations of this type. Therefore, in certain circumstances, former shareholders of the Target Fund may pay federal income tax sooner, or may pay more federal income taxes, than they would have had the Reorganization not occurred. It is currently estimated that the Acquiring Fund may not be able to utilize approximately $16,600,000 of the capital loss carryforwards set forth above following the Reorganization due to certain federal income tax rules. The effect of these potential limitations will depend on a number of factors, including the amount of the losses, the amount of gains to be offset, the exact timing of the Reorganization and the amount of unrealized capital gains in the Funds at the time of the Reorganization.
In addition, shareholders of the Target Fund will receive a proportionate share of any taxable income and gains realized by the Acquiring Fund and not distributed to its shareholders prior to the Reorganization when such income and gains are eventually distributed by the Acquiring Fund. As a result, shareholders of the Target Fund may receive a greater amount of taxable distributions than they would have had the Reorganization not occurred.
The foregoing is intended to be only a summary of the principal federal income tax consequences of the Reorganization and should not be considered to be tax advice. There can be no assurance that the Internal Revenue Service will concur on all or any of the issues discussed above. The foregoing is made without regard to the particular facts and circumstances of any shareholder. Shareholders are urged to consult their own tax advisers regarding the federal, state and local tax consequences with respect to the foregoing matters and any other considerations which may be applicable to them.
16
Reorganization Expenses
Each Fund will bear the expenses of the Reorganization (whether or not the Reorganization is consummated), including legal and accounting fees and expenses, provided that the Adviser will reimburse the Funds for expenses incurred in connection with the Reorganization, including legal and accounting expenses, to the extent that such expenses cause the total operating expense ratio of a Fund to exceed operating expense caps currently in effect for a Fund. It is expected that both Funds will be operating at expense levels exceeding their respective expense caps, thus resulting in the Adviser reimbursing the Funds for all direct expenses related to the Reorganization.
Notwithstanding the foregoing, expenses will in any event be paid by the party directly incurring such expenses if and to the extent that the payment by the other party of such expenses would result in the disqualification of the Target Fund or the Acquiring Fund, as the case may be, as a regulated investment company for federal income tax purposes.
The Target Fund has engaged Georgeson, Inc. d/b/a Computershare Fund Services to assist in the solicitation of proxies at an estimated cost of $11,000, which is included in the estimate of Reorganization costs.
Rights of Shareholders
Both Funds are organized as series of a Delaware statutory trust. The Target Fund and the Acquiring Fund are both series of the Trust. As such, there are no material differences in the rights of shareholders.
Each issued and outstanding full and fractional share of a Fund is entitled to one full and fractional vote. Shares of a Fund participate equally in regards to dividends, distributions and liquidations with respect to that Fund subject to preferences (such as Rule 12b-1 fees), rights or privileges of any share class. Shareholders have equal non-cumulative voting rights. Class N shares have exclusive voting rights with respect to the Plans for their class. On any matter submitted to a vote of shareholders, shares of each Fund will vote separately except when a vote of shareholders in the aggregate is required by law, or when the Trustees have determined that the matter affects the interests of more than one Fund, in which case the shareholders of all such Funds shall be entitled to vote thereon.
Shareholders have the power to vote only (i) for the election of Trustees, (ii) for the removal of Trustees, and (iii) with respect to such additional matters relating to the Trust as may be required by law, by the Trust Instrument, or as the Trustees may consider desirable.
Capitalization
The following table sets forth the capitalization of the Target Fund and the Acquiring Fund as of October 31, 2012, and the pro forma capitalization of the combined fund as if the Reorganization had occurred on that date. These numbers may differ at the Closing Date.
Capitalization Table as of October 31, 2012 (Unaudited)
| | | | | | | | | | |
| | | Target Fund | | Acquiring
Fund | | Adjustments | | Pro Forma
Combined
Fund | |
Net Assets | | | | | | | | | | |
Class N | | $21,762,975 | | $5,658,602 | | – | | | $27,421,577 | (a) |
Class I | | 2,400,330 | | 754,628 | | – | | | 3,154,958 | (a) |
Total | | $24,163,305 | | $6,413,230 | | – | | | $30,576,535 | (a) |
17
| | | | | | | | | | | | | | | | |
| | | Target Fund | | | Acquiring
Fund | | | Adjustments | | | Pro Forma
Combined
Fund | |
Shares Outstanding | | | | | | | | | | | | | | | | |
Class N | | | 1,670,425 | | | | 495,521 | | | | 235,265(b) | | | | 2,401,211(b) | |
Class I | | | 177,344 | | | | 65,824 | | | | 32,109(b) | | | | 275,277(b) | |
Total | | | 1,847,769 | | | | 561,345 | | | | 267,374(b) | | | | 2,676,488(b) | |
Net Asset Value Per Share | | | | | | | | | | | | | | | | |
Class N | | | $13.03 | | | | $11.42 | | | | – | | | | $11.42 | |
Class I | | | $13.53 | | | | $11.46 | | | | – | | | | $11.46 | |
Shares Authorized | | | | | | | | | | | | | | | | |
Class N | | | Unlimited | | | | Unlimited | | | | | | | | Unlimited | |
Class I | | | Unlimited | | | | Unlimited | | | | | | | | Unlimited | |
| | (a) | Figures reflect the costs associated with the proposed Reorganization, estimated to be approximately $99,400, of which approximately $74,200 will be charged to the Target Fund and approximately $25,200 will be charged to the Acquiring Fund whether or not the Reorganization is consummated. However, it is expected that both Funds will be operating at expense levels exceeding their respective contractual expense caps, thus resulting in the Adviser reimbursing the Funds for all direct expenses related to the Reorganization. |
| | (b) | Figures reflect the issuance by the Acquiring Fund of approximately 1,905,690 Class N shares and 209,453 Class I shares to shareholders of the Target Fund in connection with the proposed Reorganization. |
Legal Matters
Certain legal matters concerning the Funds and their participation in the Reorganization, the federal income tax consequences of the Reorganization and the issuance of Class N and Class I shares of the Acquiring Fund will be passed on by Vedder Price P.C., 222 North LaSalle Street, Chicago, Illinois 60601.
Information Filed with the Securities and Exchange Commission
This Proxy Statement/Prospectus and the Reorganization SAI do not contain all the information set forth in the registration statements and the exhibits relating thereto and the annual and semi-annual reports which the Funds have filed with the SEC pursuant to the requirements of the Securities Act of 1933, as amended, and the 1940 Act, to which reference is hereby made. The SEC file number for the registration statement containing the current Prospectus and Statement of Additional Information for the Target Fund and the Acquiring Fund is Registration No. 811-08004. The Prospectus and Statement of Additional Information are incorporated herein by reference.
THE BOARD’S CONSIDERATION OF THE REORGANIZATION
Aston proposed to the Board the Reorganization which would have the effect of merging the Target Fund and the Acquiring Fund, which Aston believes have substantially similar investment objectives. The Board, including those Trustees who are not “interested persons” of the Funds, the investment adviser or any subadviser of the Trust, as defined in the 1940 Act (the “Independent Trustees”), approved the terms of the Reorganization and recommended that the Reorganization be approved by the shareholders of the Target Fund.
In preparation for the meeting of the Board held on December 13, 2012 (the “Meeting”) at which the Reorganization was considered, Aston provided the Board with information regarding the proposed Reorganization, including the rationale therefor and alternatives considered to the Reorganization of the
18
Funds. In determining to recommend that the shareholders of the Target Fund approve the Reorganization, the Board considered the factors described below.
The Funds’ investment objectives, strategies, policies and relative risks. The Board noted that the Target Fund’s and the Acquiring Fund’s investment objectives and principal strategies, policies and risks are substantially similar.
The Funds’ relative sizes and potential for economies of scale. The Board noted that the Target Fund currently has a larger asset size than the Acquiring Fund, but that both Funds are relatively small and economies of scale may result from the Reorganization.
The investment performance of the Funds and the appointment of the Acquiring Fund’s subadviser to serve as subadviser to the Target Fund. In connection with its annual contract renewal process, the Board considered that the performance of the Target Fund lagged its benchmark index and peer group. The Board also noted that while the Acquiring Fund had more favorable performance, it had a relatively short track record. Accordingly, the Board took into account the long-term composite performance of LMCG’s small-cap strategy. The Board considered that the same portfolio manager currently managing the Acquiring Fund is expected to continue to manage the combined fund upon consummation of the Reorganization.
The relative fees and expense ratios of the Funds. The Board noted that the Funds have the same management fee rate, and the Acquiring Fund has a lower total annual operating expense ratio after fee waiver/expense reimbursements than that of the Target Fund. The estimated total annual operating expense ratio for the combined fund is expected to be lower than the current total annual operating expense ratio of the Target Fund, taking into account the effect of contractual expense limitations, and a larger combined fund offers the opportunity for economies of scale.
The anticipated tax-free nature of the Reorganization. The Board took into account that, for federal income tax purposes, the Reorganization is generally not expected to result in a taxable event for the Target Fund or its shareholders.
Potential sales of portfolio securities of the Target Fund to accomplish the Reorganization. The Board considered that a material portion of securities in the Target Fund’s portfolio may be sold whether or not the Reorganization takes place as a result of the change of subadviser. The Board considered that portfolio turnover is not expected to be significant in order to comply with the Acquiring Fund’s investment policies.
The expected costs of the Reorganization. The Board noted that each Fund will bear the expenses of the Reorganization (whether or not the Reorganization is consummated), including legal and accounting fees and expenses, provided that Aston will reimburse the Funds for expenses in connection with the Reorganization to the extent that such expenses cause total operating expenses of a Fund to exceed operating expense cap currently in effect for the Fund. It is expected that both Funds will be operating at expense levels exceeding their respective expense caps, thus resulting in Aston reimbursing the Funds for all direct expenses related to the Reorganization.
The effect of the Reorganization on shareholder services and shareholder rights. The Board took into account that the services available to Target Fund shareholders will be substantially the same on a class level basis.
Alternatives to the Reorganization. The Board considered continuing to operate the Target Fund as a stand-alone fund, and considered the possibility of liquidating the Target Fund. The Board determined that the proposed Reorganization is the best alternative because it is not expected to be a
19
taxable event to shareholders for federal income tax purposes, it provides shareholders with a similar investment opportunity and economies of scale may be realized as a result of the size of the combined fund.
Any potential benefits of the Reorganization to Aston and its affiliates as a result of the Reorganization. The Board noted that the Reorganization may result in some operational efficiencies for the Adviser and its affiliates, including a reduction in operational expenses incurred in connection with administrative and compliance services, as a result of the elimination of the Target Fund as a separate series of the Trust.
Conclusion. Based on all of the foregoing, the Board concluded that the Target Fund’s participation in the proposed Reorganization would be in the best interests of the Target Fund and would not dilute the interests of each Fund’s existing shareholders.
OTHER INFORMATION
Shareholders of the Funds
The following tables set forth the percentage of ownership of each person who, as of January 31, 2013, the record date with respect to the Special Meeting, owns of record, or is known by the Funds to own of record or beneficially, 5% or more of any class of shares of either Fund. The tables also set forth the estimated percentage of shares of the combined fund that would have been owned by such parties if the Reorganization had occurred on January 31, 2013. These amounts may differ on the Closing Date.
Target Fund
| | | | | | |
Class | | Name and Address of Owner | | Percentage of
Ownership | | Estimated Pro Forma
Percentage of
Ownership of the
Combined Fund After
the Reorganization |
Class N Shares | | Charles Schwab & Co Inc Special Custody Acct for Exclusive of Customers ATTN Mutual Funds 101 Montgomery St San Francisco, CA 94104 | | 16.9859% | | 24.0763% |
| | | |
Class N Shares | | National Financial Services Corp (FBO) Our Customers ATTN Mutual Funds Department 5th Floor 499 Washington Blvd Jersey City, NJ 07310 | | 10.5948% | | 15.0174% |
| | | |
Class N Shares | | BNYM I S Trust Co Cust IRA FBO its Customer Louisville, KY 40223 | | 5.8736% | | 8.3254% |
| | | |
Class N Shares | | Morgan Stanley Smith Barney Harborside Financial Center Plaza 2 3rd Floor Jersey City, NJ 07311 | | 5.5436% | | 7.8577%
|
| | | |
Class I Shares | | DCGT as TTEE and/or CUST FBO Principal Financial Group Qualified PRIN ADVTG OMNIBUS ATTN NPIO Trade Desk 711 High Street Des Moines, IA 50303 | | 56.0738% | | 38.9777%
|
| | | |
Class I Shares | | Morgan Stanley Smith Barney Harborside Financial Center Plaza 2 3rd Floor Jersey City, NJ 07311 | | 14.0379% | | 9.7579%
|
| | | |
Class I Shares | | First Clearing LLC Special Custody Acct for the Exclusive Benefit of the Customer 2801 Market St St. Louis, MO 63103 | | 10.1518% | | 7.0567%
|
20
| | | | | | |
| Acquiring Fund |
Class | | Name and Address of Owner | | Percentage of
Ownership | | Estimated Pro Forma
Percentage of
Ownership of the
Combined Fund After
the Reorganization |
Class N Shares | | National Financial Services Corp (FBO) Our Customers ATTN Mutual Funds Department 5th Floor 499 Washington Blvd Jersey City, NJ 07310 | | 62.9820% | | 28.0489%
|
| | | |
Class N Shares | | ICMA Retirement Corporation 777 North Capitol Street, NE Washington, DC 2002 | | 18.6611% | | 8.3107%
|
| | | |
Class N Shares | | Pershing LLC PO Box 2052 Jersey City, NJ 07399 | | 5.3475% | | 2.3815%
|
| | | |
Class I Shares | | Kenneth Anderson 120 N. LaSalle Street Chicago, IL 60602 | | 59.2770% | | 26.2050%
|
| | | |
Class I Shares | | Gerald Dillenburg & Cheryl Dillenburg, JTWROS 120 N. LaSalle Street Chicago, IL 60602 | | 37.6579% | | 16.6477%
|
At the close of business on January 31, 2013, there were 1,508,238.216 Class N shares and 114,716.300 Class I shares of the Target Fund outstanding. As of January 31, 2013, the Trustees and officers of the Target Fund as a group owned less than 1% of the total outstanding shares of the Target Fund and as a group owned less than 1% of each class of shares of the Target Fund.
21
At the close of business on January 31, 2013, there were 562,847.698 Class N shares and 72,956.826 Class I shares of the Acquiring Fund outstanding. As of January 31, 2013, the ownership of shares of the Acquiring Fund by the Trustees and officers of the Acquiring Fund is shown in Appendix E.
Submission of Shareholder Proposals
Under Delaware law, the Trust is not required to hold annual shareholders’ meetings, but it will hold special meetings as required or deemed desirable, or upon the request of holders of at least 10% of the Trust’s shares entitled to vote. Because the Trust does not hold regular meetings of shareholders, the anticipated date of the next special shareholder meeting cannot be provided. Any shareholder who wishes to submit a proposal for consideration at a subsequent shareholders’ meeting should mail the proposal promptly to the Trust. Any proposal to be considered for submission to shareholders must comply with Rule 14a-8 under the Securities Exchange Act of 1934, as amended, and must be received by the Trust within a reasonable time before the solicitation of proxies for that meeting. The timely submission of a proposal does not guarantee its inclusion.
Shareholder Communications
Pursuant to guidelines approved by the Board, shareholders who wish to communicate with the Board as a whole and/or each of the Trustees individually should forward such correspondence by U.S. mail or other courier service to the Secretary of the Trust. Correspondence addressed to the Board will be forwarded to the Chairman of the Board and the Chairman of the Nominating and Governance Committee, and correspondence addressed to a particular Trustee will be forwarded to that Trustee.
Other Matters to Come Before the Special Meeting
The Board is not aware of any matters that will be presented for action at the Special Meeting other than the matters set forth herein. Should any other matters requiring a vote of shareholders arise, it is intended that the proxies that do not contain specific instructions to the contrary will be voted in accordance with the judgment of the persons named in the enclosed form of proxy.
Proxy Statement/Prospectus Delivery
Please note that only one Proxy Statement/Prospectus may be delivered to two or more shareholders of the Target Fund who share an address, unless the Fund has received instructions to the contrary. To request a separate copy of the Proxy Statement/Prospectus, or for instructions as to how to request a separate copy of such document or as to how to request a single copy if multiple copies of such document are received, shareholders should contact the Trust by calling (800) 992-8151.
VOTING INFORMATION AND REQUIREMENTS
Shareholders of the Target Fund are entitled to one vote for each full share held and fractional votes for fractional shares.
Approval of the Reorganization will require the affirmative vote of a majority of the outstanding voting securities of the Target Fund, with shareholders of each class voting together as a single class. The “vote of a majority of the outstanding voting securities” is defined in the 1940 Act as the lesser of the vote of (i) 67% or more of the voting securities present at a meeting, if the holders of more than 50% of the outstanding voting securities of such company are present or represented by proxy; or (ii) more than 50% of the outstanding voting securities of such company.
22
One-third of the number of shares entitled to vote, present in person or by proxy, constitutes a quorum for the transaction of business, except that where any provision of law or the Trust Instrument permits or requires that holders of any series shall vote as a series (or that holders of a class shall vote as a class), then one-third of the aggregate number of shares of that series (or that class) entitled to vote shall be necessary to constitute a quorum for the transaction of business by that series (or that class). Any lesser number is sufficient for adjournment. Any adjourned session or sessions may be held without the necessity of further notice.
Abstentions and broker “non-votes” (that is, proxies from brokers or nominees indicating that such persons have not received instructions from the beneficial owner or other persons entitled to vote shares on a particular matter with respect to which the brokers or nominees do not have discretionary voting power) will be treated as shares that are present for purposes of determining the presence of a quorum for transacting business at the Special Meeting and will have the same effect as a vote against the proposal. In the event that a quorum is not present at the Special Meeting, or in the event that a quorum is present but sufficient votes to approve the proposal are not received, the persons named as proxies on the enclosed proxy card may propose one or more adjournments of the Special Meeting to permit further solicitation of proxies. The persons named as proxies will vote upon such adjournment after consideration of all circumstances that may bear upon a decision to adjourn the Special Meeting. Any business that might have been transacted at the Special Meeting originally called may be transacted at any such adjourned session(s) at which a quorum is present.
Shareholders who execute proxies may revoke them at any time before they are voted by submitting a written notice of revocation or a subsequently executed proxy or by attending the Special Meeting and voting in person. The giving of a proxy will not affect your right to vote in person if you attend the Special Meeting and wish to do so.
The Board believes that the proposed Reorganization is in the best interests of the Target Fund. Accordingly, the Board unanimously recommends that shareholders vote FOR approval of the proposed Reorganization.
OTHER INFORMATION REGARDING THE CHANGE IN SUBADVISER OF THE TARGET FUND
As indicated above, LMCG was appointed to serve as the Target Fund’s subadviser effective on or about January 31, 2013. Generally, the 1940 Act requires an investment advisory agreement to be approved by the Board, including the Independent Trustees, and the Fund’s shareholders in order for it to become effective. However, a “manager-of-managers” exemptive order granted to Aston and the Trust by the SEC allows Aston to hire and terminate subadvisers and amend subadvisory agreements, subject to Board approval, without obtaining shareholder approval.
Under the exemptive order, if Aston hires a new subadviser for a Fund, shareholders of the Fund must be provided with an information statement containing certain information about the subadviser and the subadvisory agreement. The sub-investment advisory agreement for the Target Fund between Aston and LMCG (the “LMCG Sub-Investment Advisory Agreement”) is attached hereto as Appendix C. The following information is intended to provide shareholders of the Target Fund with information about LMCG and the LMCG Sub-Investment Advisory Agreement. It is intended that the following information, along with the information contained in the Proxy Statement/Prospectus, will satisfy the information statement requirements of the exemptive order.
23
Background
As discussed above under “Comparison of the Funds–Investment Adviser and Subadviser,” prior to the appointment of LMCG as the Target Fund’s subadviser, Todd-Veredus served as subadviser. At a meeting held on December 13, 2012, the Board, including the Independent Trustees, approved the LMCG Sub-Investment Advisory Agreement.
Board Considerations
The Board, including the Independent Trustees, considered the approval of the LMCG Sub-Investment Advisory Agreement at an in-person meeting on December 13, 2012.
The Independent Trustees met separately from the “interested” Trustees of the Trust and any officers of Aston, LMCG or their affiliates to consider the approval of the LMCG Sub-Investment Advisory Agreement and were assisted by independent legal counsel in their deliberations. The Board considered information provided at the December 13, 2012 Board meeting and at previous Board meetings in connection with the annual contract renewal with respect to other funds managed by LMCG. Among the matters considered by the Board, including the Independent Trustees, in connection with the approval of the LMCG Sub-Investment Advisory Agreement were the following:
Nature, Quality and Extent of Services. The Board considered the nature, quality and extent of services expected to be provided under the LMCG Sub-Investment Advisory Agreement. The Board considered the reputation, qualifications and background of LMCG and its operational and compliance infrastructures. The Board also considered information provided regarding the experience and skills of senior management and investment personnel of LMCG, the resources made available to such personnel, the ability of LMCG to attract and retain high-quality personnel, and the organizational depth of LMCG. The Board considered that LMCG currently serves as subadviser to the Acquiring Fund, a fund with a similar investment objective and similar investment policies managed by the same portfolio manager that will manage the Target Fund. On the basis of this evaluation, the Board concluded that the nature, quality and extent of services to be provided by LMCG are expected to be satisfactory.
Fees, Profitability and Economies of Scale. The Board considered the subadvisory fee rate under the LMCG Sub-Investment Advisory Agreement as well as the overall management fee structure of the Fund, noting that the subadvisory fee rate is fifty percent (50%) of the management fee less certain third-party payments, fee waivers and expense reimbursement incurred by Aston. The Board considered that the subadvisory fee rate was negotiated at arm’s length between Aston and LMCG, an unaffiliated third party, and that Aston would compensate LMCG from the management fee it receives from the Fund. As part of its review of the investment advisory agreement with Aston, the Board considered whether there will be economies of scale with respect to the overall fee structure of the Fund and whether the Fund will benefit from any economies of scale.
The Board also considered information provided by LMCG in connection with the annual contract renewal with respect to fees charged to other mutual funds and separate account clients, as applicable. The Board considered that the fee rates charged to the Fund and other clients vary because of the additional regulatory and compliance requirements, among other things, associated with registered investment companies such as the Fund and other differences in the products and services provided, including differences in fee structures. The Board determined that profitability information with respect to LMCG was not material to its considerations in light of the fee model used by Aston and the unaffiliated status of LMCG.
The Board concluded that the proposed subadvisory fee rate was reasonable in light of the nature, quality and extent of services to be provided and that economies of scale were limited at this time.
24
Other Benefits to the Subadviser. The Board also considered the character and amount of other incidental benefits expected to be received by LMCG as a result of its association with the Fund. The Board considered potential benefits to LMCG from the use of “soft dollars” to pay for research services generated by parties other than the executing broker-dealer. The Board concluded that the subadvisory fees were reasonable taking into account any other benefits expected to be received by LMCG from its relationship with the Fund.
Conclusion. Based on all of the information considered and the conclusions reached, the Board determined that the terms of the LMCG Sub-Investment Advisory Agreement are fair and reasonable, and that the approval of the LMCG Sub-Investment Advisory Agreement is in the best interests of the Fund. No single factor was determinative in the Board’s analysis.
Description of the Sub-Investment Advisory Agreement
The terms of the LMCG Sub-Investment Advisory Agreement, which is attached hereto as Appendix C, are described below.
Investment Management Services. The LMCG Sub-Investment Advisory Agreement provides that LMCG shall manage the investment and reinvestment of the Fund’s assets in accordance with the Fund’s investment objective, policies and limitations and administer the Fund’s affairs to the extent requested by, and subject to, the oversight of the Board.
Brokerage. The LMCG Sub-Investment Advisory Agreement authorizes LMCG to select brokers or dealers that will execute the purchases and sales of portfolio securities for the Fund, subject to its obligation to obtain best execution under the circumstances, which may take account of the overall quality of brokerage and research services provided to LMCG. The agreement permits LMCG to rely on Section 28(e) of the Securities Exchange Act of 1934, as amended, in placing brokerage transactions. Under that section, a commission paid to a broker may be higher than that which another qualified broker would have charged for effecting the same transaction, provided LMCG determines in good faith that the commission is reasonable in terms of either the transaction or the overall responsibility of LMCG to the Fund and its other clients and that the total commissions paid by the Fund will be reasonable in relation to the benefits to the Fund over the long term.
Expenses. The LMCG Sub-Investment Advisory Agreement provides that LMCG agrees to pay all expenses it incurs in connection with its activities under the agreement other than the cost of securities purchased for the Fund (including brokerage commissions and other related expenses).
Compensation. Under the LMCG Sub-Investment Advisory Agreement, Aston pays LMCG a management fee out of the investment advisory fee it receives from the Fund, in an amount equal to fifty percent (50%) of the positive difference, if any, of the investment advisory fee payable to Aston minus the sum of: (i) any investment advisory fees waived by Aston pursuant to an expense limitation or reimbursement agreement with the Fund, (ii) any expenses reimbursed by Aston pursuant to an expense limitation or reimbursement agreement with the Fund, and (iii) any payments by Aston to third parties who provide distribution, shareholder or similar services to the Fund. If the foregoing calculation results in a negative amount, such amount shall be payable by LMCG within 30 days of receipt of notice from Aston.
Aston receives a fee based on the Fund’s average daily net assets, computed daily and payable monthly at the annual rate of 1.00%. Aston has contractually agreed to waive management fees and/or reimburse ordinary operating expenses through February 28, 2014 to limit the Fund’s expense ratio, not including fees and expenses from investments in other investment companies (acquired fund fees and expenses), to 1.49% for Class N shares and 1.24% for Class I shares.
25
Limitation on Liability. Under the LMCG Sub-Investment Advisory Agreement, LMCG and its directors, officers, stockholders, employees and agents will not be liable for any error of judgment or mistake of law or for any loss suffered by Aston or the Trust in connection with any matters to which the agreement relates or for any other act or omission in the performance by LMCG of its duties under the agreement, except that nothing in the agreement shall be construed to protect LMCG against any liability by reason of its willful misfeasance, bad faith or gross negligence in the performance of its duties or for its reckless disregard of its obligations or duties under the agreement. The LMCG Sub-Investment Advisory Agreement also includes an indemnity provision which requires Aston and LMCG to indemnify each other for certain losses.
Term. The LMCG Sub-Investment Advisory Agreement for the Fund has an effective date of January 31, 2013 and has an initial term ending on December 31, 2013. The LMCG Sub-Investment Advisory Agreement will continue in effect from year to year thereafter if such continuance is approved on behalf of the Fund at least annually in the manner required by the 1940 Act and the rules and regulations thereunder.
Termination. The LMCG Sub-Investment Advisory Agreement may be terminated at any time without the payment of any penalty upon sixty (60) days’ written notice to or by LMCG. In addition, the LMCG Sub-Investment Advisory Agreement may be terminated upon less than sixty (60) days’ notice to LMCG upon a material breach of the agreement or if the Board determines that other circumstances have, or likely will have, a material adverse effect on LMCG’s abilities to perform its obligations under the agreement, including notification of the departure of a portfolio manager or other key personnel change. The LMCG Sub-Investment Advisory Agreement terminates automatically without the payment of any penalty upon its assignment or upon termination of the advisory agreement.
Other. The LMCG Sub-Investment Advisory Agreement includes a non-solicitation provision under which LMCG may not solicit Fund shareholders to request redemption of their shares of any series of the Trust.
Other Information
Officers and Directors. Information regarding the principal executive officers and directors of Aston and LMCG is shown in Appendix D. To the best knowledge of the Trust, as of January 31, 2013, the Trustees and executive officers of the Trust as a group owned less than 1% of the shares of the Target Fund.
Aggregate Advisory Fees. During the fiscal year ended October 31, 2012, Aston earned gross investment advisory fees of $279,493 for services provided to the Target Fund, and Aston paid $82,505 in subadvisory fees to Todd-Veredus with respect to the Fund during the last fiscal year.
Distributor and Administrator. Foreside Funds Distributors LLC, 400 Berwyn Park, 899 Cassatt Road, Berwyn, PA 19312, is the Trust’s distributor. The Trust’s administrator is Aston Asset Management, LP, 120 North LaSalle Street, 25th Floor, Chicago, IL 60602.
Brokerage Commissions. During the fiscal year ended October 31, 2012, no commissions were paid to any affiliated broker.
26
, 2013
Please sign and return your proxy promptly.
Your vote is important and your participation
in the affairs of your Fund does make a difference.
27
APPENDIX A
FORM OF
AGREEMENT AND PLAN OF REORGANIZATION
THIS AGREEMENT AND PLAN OF REORGANIZATION (the “Agreement”) is made as of this [ ] day of [ , 20 ] by Aston Funds, a Delaware statutory trust (the “Trust”), on behalf of and between ASTON/LMCG Small Cap Growth Fund (formerly known as ASTON Small Cap Growth Fund) (the “Acquiring Fund”) and ASTON Small Cap Fund (formerly known as ASTON/Veredus Small Cap Growth Fund) (the “Target Fund”) (the Acquiring Fund and the Target Fund are referred to herein each as a “Fund” and collectively as the “Funds”), and Aston Asset Management, LP (the “Adviser”), the investment adviser to the Funds (for purposes of Section 9.1 of the Agreement only). The principal place of business of the Trust is 120 North LaSalle Street, Chicago, Illinois 60602.
This Agreement is intended to be, and is adopted as, a plan of reorganization within the meaning of Section 368 of the Internal Revenue Code of 1986, as amended (the “Code”), and the Treasury Regulations promulgated thereunder. The reorganization will consist of: (i) the transfer of all the assets of the Target Fund to the Acquiring Fund, in exchange solely for Class N and Class I shares of beneficial interest, no par value per share, of the Acquiring Fund (“Acquiring Fund Shares”) and the assumption by the Acquiring Fund of all the liabilities of the Target Fund; and (ii) the distribution, after the Closing Date hereinafter referred to, of the Acquiring Fund Shares to the shareholders of each corresponding class of the Target Fund, in complete liquidation and termination of the Target Fund as provided herein, all upon the terms and conditions set forth in this Agreement (the “Reorganization”).
WHEREAS, each Fund is a separate series of the Trust, and the Trust is an open-end management investment company registered under the Investment Company Act of 1940, as amended (the “1940 Act”), and the Target Fund owns securities that generally are assets of the character in which the Acquiring Fund is permitted to invest;
WHEREAS, the Acquiring Fund is authorized to issue the Acquiring Fund Shares; and
WHEREAS, the Board of Trustees of the Trust (the “Board”) has determined that the Reorganization, with respect to each Fund, is in the best interests of such Fund and that the interests of the existing shareholders of each Fund will not be diluted as a result of the Reorganization.
NOW, THEREFORE, in consideration of the premises and of the covenants and agreements hereinafter set forth, the parties hereto covenant and agree as follows:
ARTICLE I
TRANSFER OF ASSETS OF THE TARGET FUND IN EXCHANGE FOR ACQUIRING FUND
SHARES AND THE ASSUMPTION OF THE TARGET FUND LIABILITIES AND
LIQUIDATION AND TERMINATION OF THE TARGET FUND
1.1 THE EXCHANGE. Subject to the terms and conditions contained herein and on the basis of the representations and warranties contained herein, the Target Fund agrees to transfer all its assets, as set forth in Section 1.2, to the Acquiring Fund. In consideration therefor, the Acquiring Fund
A-1
agrees: (i) to issue and deliver to the Target Fund the number of full and fractional Acquiring Fund Shares, computed in the manner set forth in Section 2.3; and (ii) to assume all the liabilities of the Target Fund, as set forth in Section 1.3. Such transactions shall take place at the closing provided for in Section 3.1 (the “Closing”).
1.2 ASSETS TO BE ACQUIRED. The assets of the Target Fund to be acquired by the Acquiring Fund shall consist of all property, including, without limitation, all cash, securities, commodities, options, interests in futures and dividends or interest receivables, owned by the Target Fund and any deferred or prepaid expenses shown as an asset on the books of the Target Fund as of the Closing.
The Target Fund will, within a reasonable period of time before the Closing Date, furnish the Acquiring Fund with a list of the Target Fund’s portfolio securities and other investments. The Acquiring Fund will, within a reasonable period of time before the Closing Date, furnish the Target Fund with a list of the securities, if any, on the Target Fund’s list referred to above that do not conform to the Acquiring Fund’s investment objective, policies and restrictions. The Target Fund, if requested by the Acquiring Fund, will dispose of securities on such Acquiring Fund’s list before the Closing Date. In addition, if it is determined that the portfolios of the Target Fund and the Acquiring Fund, when aggregated, would contain investments exceeding certain percentage limitations imposed upon the Acquiring Fund with respect to such investments, the Target Fund, if requested by the Acquiring Fund, will dispose of a sufficient amount of such investments as may be necessary to avoid violating such limitations as of the Closing Date. Notwithstanding the foregoing, nothing herein will require the Target Fund to dispose of any investments or securities if, in the reasonable judgment of the Board or the Adviser, such disposition would adversely affect the status of the Reorganization as a “reorganization” as such term is used in the Code or would otherwise not be in the best interest of the Target Fund.
1.3 LIABILITIES TO BE ASSUMED. The Target Fund will endeavor to discharge all of its known liabilities and obligations to the extent possible before the Closing Date. Notwithstanding the foregoing, any liabilities not so discharged shall be assumed by the Acquiring Fund, which assumed liabilities shall include all of the Target Fund’s liabilities, debts, obligations, and duties of whatever kind or nature, whether absolute, accrued, contingent, or otherwise, whether or not arising in the ordinary course of business, whether or not determinable at the Closing Date, and whether or not specifically referred to in this Agreement.
1.4 LIQUIDATION AND DISTRIBUTION. On or as soon after the Closing Date as is practicable (the “Liquidation Date”): (a) the Target Fund will distribute in complete liquidation of the Target Fund, pro rata to its Class N and Class I shareholders of record (the “Target Fund Shareholders”), as applicable, determined as of the Valuation Time (as defined in Section 2.1), all the Class N and Class I Acquiring Fund Shares, as applicable, received by the Target Fund pursuant to Section 1.1; and (b) the Target Fund will thereupon proceed to terminate as set forth in Section 1.7 below. Such distribution will be accomplished by the transfer of Acquiring Fund Shares credited to the account of the Target Fund on the books of the Acquiring Fund to open accounts on the share records of the Acquiring Fund in the name of the Target Fund Shareholders, and representing the respective pro rata number of Acquiring Fund Shares due such shareholders. All issued and outstanding shares of the Target Fund will simultaneously
A-2
be canceled on the books of the Target Fund. The Acquiring Fund shall not issue certificates representing Acquiring Fund Shares in connection with such transfer.
1.5 OWNERSHIP OF SHARES. Ownership of Acquiring Fund Shares will be shown on the books of the Acquiring Fund’s transfer agent. Class N and Class I shares of the Acquiring Fund, as applicable, will be issued simultaneously to the Target Fund, in an amount computed in the manner set forth in Section 2.3, to be distributed to the Class N and Class I Target Fund Shareholders, as applicable.
1.6 TRANSFER TAXES. Any transfer taxes payable upon the issuance of Acquiring Fund Shares in a name other than the registered holder of the Target Fund shares on the books of the Target Fund as of that time shall, as a condition of such issuance and transfer, be paid by the person to whom the Acquiring Fund Shares are to be issued and transferred.
1.7 TERMINATION. The Target Fund shall completely liquidate, terminate and have its affairs wound up in accordance with Delaware state law, promptly following the Closing Date and the making of all distributions pursuant to Section 1.4.
1.8 REPORTING. Any reporting responsibility of the Target Fund including, without limitation, the responsibility for filing of regulatory reports, tax returns or other documents with the Securities and Exchange Commission (the “Commission”), any state securities commission and any federal, state or local tax authorities or any other relevant regulatory authority, is and shall remain the responsibility of the Target Fund.
1.9 BOOKS AND RECORDS. All books and records of the Target Fund, including all books and records required to be maintained under the 1940 Act, and the rules and regulations thereunder, shall be available to the Acquiring Fund from and after the Closing Date and shall be turned over to the Acquiring Fund as soon as practicable following the Closing Date.
ARTICLE II
VALUATION
2.1 VALUATION OF ASSETS. The value of the Target Fund’s net assets shall be the value of all of the Target Fund’s assets as of the close of regular trading on the New York Stock Exchange (“NYSE”) on the business day immediately prior to the Closing Date (such time and date being hereinafter called the “Valuation Time”), less the amount of all of the Target Fund’s liabilities as of such time. The value of the Target Fund’s assets shall be determined by using the valuation procedures of the Trust adopted by the Board or such other valuation procedures as shall be mutually agreed upon by the parties.
2.2 VALUATION OF SHARES. The net asset value per share per class of Acquiring Fund Shares shall be the net asset value per share for such class computed as of the Valuation Time, using the valuation procedures of the Trust adopted by the Board or such other valuation procedures as shall be mutually agreed upon by the parties.
A-3
2.3 SHARES TO BE ISSUED. The number of Acquiring Fund Shares to be issued (including fractional shares, if any) in exchange for the Target Fund’s net assets shall be determined with respect to each class by dividing the Target Fund’s net assets with respect to such class of shares of the Target Fund determined in accordance with Section 2.1, by the net asset value per share of the corresponding class of Acquiring Fund Shares determined in accordance with Section 2.2.
2.4 EFFECT OF SUSPENSION IN TRADING. In the event that at the Valuation Time, either: (a) the NYSE or another primary exchange on which the portfolio securities of the Acquiring Fund or the Target Fund are purchased or sold, shall be closed to trading or trading on such exchange shall be restricted; or (b) trading or the reporting of trading on the NYSE or elsewhere shall be disrupted so that accurate appraisal of the value of the net assets of the Acquiring Fund or the Target Fund is impracticable, the Valuation Time shall be postponed until the first business day after the day when trading is fully resumed and reporting is restored, and the Closing Date shall be postponed accordingly.
ARTICLE III
CLOSING AND CLOSING DATE
3.1 CLOSING DATE. The Closing shall occur on April 22, 2013 or such other date as the parties may agree (the “Closing Date”). The Closing shall be held as of 8:00 a.m. Central Time at the offices of Vedder Price P.C. in Chicago, Illinois, or at such other time and/or place as the parties may agree. Unless otherwise provided, all acts taking place at the Closing shall be deemed to take place as of 8:00 a.m. Central Time.
3.2 CUSTODIAN’S CERTIFICATE. The Target Fund shall cause The Bank of New York Mellon, as custodian for the Target Fund, to deliver to the Acquiring Fund at the Closing a certificate of an authorized officer stating that: (a) the Target Fund’s portfolio securities, cash, and any other assets shall have been delivered in proper form to the Acquiring Fund on the Closing Date; and (b) all necessary taxes including all applicable federal and state stock transfer stamps, if any, shall have been paid, or provision for payment shall have been made, in conjunction with the delivery of portfolio securities by the Target Fund.
3.3 TRANSFER AGENT’S CERTIFICATE. The Target Fund shall cause BNY Mellon Investment Servicing (U.S.) Inc., as transfer agent for the Target Fund, to deliver to the Acquiring Fund at the Closing a certificate of an authorized officer stating that its records contain the names and addresses of the Target Fund Shareholders, and the number and percentage ownership of outstanding shares per class owned by each such shareholder immediately prior to the Closing. The Acquiring Fund shall issue and deliver or cause BNY Mellon Investment Servicing (U.S.) Inc., its transfer agent, to issue and deliver to the Target Fund a confirmation evidencing the Acquiring Fund Shares to be credited on the Closing Date or provide evidence satisfactory to the Target Fund that such Acquiring Fund Shares have been credited to the Target Fund’s account on the books of the Acquiring Fund.
3.4 DELIVERY OF ADDITIONAL ITEMS. At the Closing, each party shall deliver to the other such bills of sale, checks, assignments, share certificates, receipts and other documents, if any, as
A-4
such other party or its counsel may reasonably request to effect the transactions contemplated by this Agreement.
ARTICLE IV
REPRESENTATIONS AND WARRANTIES
4.1 REPRESENTATIONS OF THE TARGET FUND. The Trust, on behalf of the Target Fund, represents and warrants to the Acquiring Fund as follows:
(a) The Trust is a statutory trust duly organized, validly existing and in good standing under the laws of the State of Delaware.
(b) The Target Fund is a separate series of the Trust duly authorized in accordance with the applicable provisions of the Trust’s Trust Instrument.
(c) The Trust is registered as an open-end management investment company under the 1940 Act, and such registration is in full force and effect.
(d) The Target Fund is not in violation of, and the execution, delivery, and performance of this Agreement (subject to shareholder approval) will not result in a violation of, any provision of the Trust’s Trust Instrument or By-Laws or of any material agreement, indenture, instrument, contract, lease, or other undertaking to which the Target Fund is a party or by which it is bound.
(e) Except as otherwise disclosed in writing to and accepted by the Acquiring Fund, the Target Fund has no material contracts or other commitments that will be terminated with liability to it before the Closing Date.
(f) To the Target Fund’s knowledge, no litigation, administrative proceeding, or investigation of or before any court or governmental body is presently pending or threatened against the Target Fund or any of its properties or assets, which, if adversely determined, would materially and adversely affect its financial condition, the conduct of its business, or the ability of the Target Fund to carry out the transactions contemplated by this Agreement. The Target Fund knows of no facts that might form the basis for the institution of such proceedings and is not a party to or subject to the provisions of any order, decree, or judgment of any court or governmental body that materially and adversely affects its business or its ability to consummate the transactions herein contemplated.
(g) The audited financial statements of the Target Fund as of October 31, 2012, and for the year then ended, have been prepared in accordance with generally accepted accounting principles and have been audited by independent auditors, and such statements (copies of which have been furnished to the Acquiring Fund) fairly reflect the financial condition of the Target Fund as of October 31, 2012, and there are no known contingent liabilities of the Target Fund as of such date that are not disclosed in such statements.
A-5
(h) Since October 31, 2012, there have been no material adverse changes in the Target Fund’s financial condition, assets, liabilities or business (other than changes occurring in the ordinary course of business), and there are no known contingent liabilities of the Target Fund arising after such date. For the purposes of this subsection (h), a decline in the net asset value of the Target Fund shall not constitute a material adverse change.
(i) All federal, state, local and other tax returns and reports of the Target Fund required by law to be filed by it (taking into account permitted extensions for filing) have been timely filed and are complete and correct in all material respects. All federal, state, local and other taxes of the Target Fund required to be paid (whether or not shown on any such return or report) have been paid, or provision shall have been made for the payment thereof, and any such unpaid taxes are properly reflected on the financial statements referred to in subsection (g) above. To the best of the Target Fund’s knowledge, no tax authority is currently auditing or preparing to audit the Target Fund, and no assessment for taxes, interest, additions to tax or penalties has been asserted against the Target Fund.
(j) All issued and outstanding shares of the Target Fund are duly and validly issued and outstanding, fully paid and non-assessable by the Target Fund. All the issued and outstanding shares of the Target Fund will, at the time of the Closing, be held by the persons and in the amounts set forth in the records of the Target Fund’s transfer agent as provided in Section 3.3. The Target Fund has no outstanding options, warrants or other rights to subscribe for or purchase any shares of the Target Fund and has no outstanding securities convertible into shares of the Target Fund.
(k) At the Closing Date, the Target Fund will have good and marketable title to the Target Fund’s assets to be transferred to the Acquiring Fund pursuant to Section 1.2, and full right, power and authority to sell, assign, transfer and deliver such assets, and the Acquiring Fund will acquire good and marketable title thereto, subject to no restrictions on the full transfer thereof, including such restrictions as might arise under the Securities Act of 1933, as amended (the “1933 Act”), and the 1940 Act, except those restrictions as to which the Acquiring Fund has received notice and necessary documentation at or prior to the Closing.
(l) The execution, delivery and performance of this Agreement have been duly authorized by all necessary action on the part of the Target Fund. Subject to approval by the Target Fund Shareholders, this Agreement constitutes a valid and binding obligation of the Target Fund, enforceable in accordance with its terms, subject, as to enforcement, to bankruptcy, insolvency, reorganization, moratorium, and other laws relating to or affecting creditors’ rights and to general equity principles.
(m) The information to be furnished by the Target Fund for use in no-action letters, applications for orders, registration statements, proxy materials and other documents that may be necessary in connection with the transactions contemplated herein shall be accurate and complete in all material respects and shall comply in all material respects with federal securities and other laws and regulations.
(n) From the effective date of the Registration Statement (as defined in Section 5.7), through the time of the meeting of the Target Fund Shareholders and on the Closing Date, any written information furnished by the Trust with respect to the Target Fund for use in the Proxy Materials (as defined in
A-6
Section 5.7), or any other materials provided in connection with the Reorganization, does not and will not contain any untrue statement of a material fact or omit to state a material fact required to be stated or necessary to make the statements, in light of the circumstances under which such statements were made, not misleading.
(o) For each taxable year of its operations (including the taxable year ending on the Closing Date), the Target Fund (i) has elected to qualify, and has qualified or will qualify (in the case of the short taxable year ending with the Closing Date), as a “regulated investment company” under the Code (a “RIC”), (ii) has been eligible to compute and has computed its federal income tax under Section 852 of the Code, and on or prior to the Closing Date will have declared and paid a distribution with respect to all its investment company taxable income (determined without regard to the deduction for dividends paid), the excess of its interest income excludible from gross income under Section 103(a) of the Code over its deductions disallowed under Sections 265 and 171(a)(2) of the Code and its net capital gain (as such terms are defined in the Code) that has accrued or will accrue on or prior to the Closing Date, and (iii) has been, and will be (in the case of the short taxable year ending with the Closing Date), treated as a separate corporation for federal income tax purposes.
4.2 REPRESENTATIONS OF THE ACQUIRING FUND. The Trust, on behalf of the Acquiring Fund, represents and warrants to the Target Fund as follows:
(a) The Trust is a statutory trust, duly organized, validly existing and in good standing under the laws of the State of Delaware.
(b) The Acquiring Fund is a separate series of the Trust duly authorized in accordance with the applicable provisions of the Trust’s Trust Instrument.
(c) The Trust is registered as an open-end management investment company under the 1940 Act, and such registration is in full force and effect.
(d) The Acquiring Fund is not in violation of, and the execution, delivery and performance of this Agreement will not result in a violation of, the Trust’s Trust Instrument or By-Laws or of any material agreement, indenture, instrument, contract, lease, or other undertaking to which the Acquiring Fund is a party or by which it is bound.
(e) To the Acquiring Fund’s knowledge, no litigation, administrative proceeding or investigation of or before any court or governmental body is presently pending or threatened against the Acquiring Fund or any of its properties or assets, which, if adversely determined, would materially and adversely affect its financial condition, the conduct of its business or the ability of the Acquiring Fund to carry out the transactions contemplated by this Agreement. The Acquiring Fund knows of no facts that might form the basis for the institution of such proceedings, and it is not a party to or subject to the provisions of any order, decree, or judgment of any court or governmental body that materially and adversely affects its business or its ability to consummate the transaction herein contemplated.
(f) The audited financial statements of the Acquiring Fund as of October 31, 2012, and for the fiscal year then ended, have been prepared in accordance with generally accepted accounting
A-7
principles and have been audited by independent auditors, and such statements (copies of which have been furnished to the Target Fund) fairly reflect the financial condition of the Acquiring Fund as of October 31, 2012, and there are no known contingent liabilities of the Acquiring Fund as of such date that are not disclosed in such statements.
(g) Since October 31, 2012, there have been no material adverse changes in the Acquiring Fund’s financial condition, assets, liabilities or business (other than changes occurring in the ordinary course of business) and there are no known contingent liabilities of the Acquiring Fund arising after such date. For the purposes of this subsection (g), a decline in the net asset value of the Acquiring Fund shall not constitute a material adverse change.
(h) All federal, state, local and other tax returns and reports of the Acquiring Fund required by law to be filed by it (taking into account permitted extensions for filing) have been timely filed and are complete and correct in all material respects. All federal, state, local and other taxes of the Acquiring Fund required to be paid (whether or not shown on any such return or report) have been paid or provision shall have been made for their payment, and any such unpaid taxes are properly reflected on the financial statements referred to in subsection (f) above. To the best of the Acquiring Fund’s knowledge, no tax authority is currently auditing or preparing to audit the Acquiring Fund, and no assessment for taxes, interest, additions to tax or penalties has been asserted against the Acquiring Fund.
(i) All issued and outstanding Acquiring Fund Shares are duly and validly issued and outstanding, fully paid and non-assessable by the Acquiring Fund. The Acquiring Fund has no outstanding options, warrants, or other rights to subscribe for or purchase shares of the Acquiring Fund, and there are no outstanding securities convertible into shares of the Acquiring Fund.
(j) The execution, delivery and performance of this Agreement have been duly authorized by all necessary action on the part of the Acquiring Fund, and this Agreement constitutes a valid and binding obligation of the Acquiring Fund, enforceable in accordance with its terms, subject, as to enforcement, to bankruptcy, insolvency, reorganization, moratorium, and other laws relating to or affecting creditors’ rights and to general equity principles.
(k) The Acquiring Fund Shares to be issued and delivered to the Target Fund for the account of the Target Fund Shareholders pursuant to the terms of this Agreement will, at the Closing Date, have been duly authorized. When so issued and delivered, such shares will be duly and validly issued shares of the Acquiring Fund and will be fully paid and non-assessable.
(l) The information to be furnished by the Acquiring Fund for use in no-action letters, applications for orders, registration statements, proxy materials and other documents that may be necessary in connection with the transactions contemplated herein shall be accurate and complete in all material respects and shall comply in all material respects with federal securities and other laws and regulations.
(m) From the effective date of the Registration Statement (as defined in Section 5.7), through the time of the meeting of the Target Fund Shareholders and on the Closing Date, any written information furnished by the Trust with respect to the Acquiring Fund for use in the Proxy Materials (as defined in
A-8
Section 5.7), or any other materials provided in connection with the Reorganization, does not and will not contain any untrue statement of a material fact or omit to state a material fact required to be stated or necessary to make the statements, in light of the circumstances under which such statements were made, not misleading.
(n) For each taxable year of its operations, including the taxable year that includes the Closing Date, the Acquiring Fund (i) has elected to qualify, has qualified or will qualify (in the case of the year that includes the Closing Date) and intends to continue to qualify as a RIC under the Code, (ii) has been eligible to and has computed its federal income tax under Section 852 of the Code, and will do so for the taxable year that includes the Closing Date, and (iii) has been, and will be (in the case of the taxable year that includes the Closing Date), treated as a separate corporation for federal income tax purposes.
(o) The Acquiring Fund agrees to use all reasonable efforts to obtain the approvals and authorizations required by the 1933 Act, the 1940 Act and any state securities laws as it may deem appropriate in order to continue its operations after the Closing Date.
ARTICLE V
COVENANTS OF ACQUIRING FUND AND TARGET FUND
5.1 OPERATION IN ORDINARY COURSE. Subject to Sections 1.2 and 8.5, each of the Acquiring Fund and the Target Fund will operate its respective business in the ordinary course between the date of this Agreement and the Closing Date, it being understood that such ordinary course of business will include customary dividends and distributions, any other distributions necessary or desirable to avoid federal income or excise taxes, and shareholder purchases and redemptions.
5.2 APPROVAL OF SHAREHOLDERS. The Trust will call a special meeting of shareholders of the Target Fund to consider and act upon this Agreement (or transactions contemplated thereby) and to take all other appropriate action necessary to obtain approval of the transactions contemplated herein.
5.3 INVESTMENT REPRESENTATION. The Target Fund covenants that the Acquiring Fund Shares to be issued pursuant to this Agreement are not being acquired for the purpose of making any distribution, other than in connection with the Reorganization and in accordance with the terms of this Agreement.
5.4 ADDITIONAL INFORMATION. The Target Fund will assist the Acquiring Fund in obtaining such information as the Acquiring Fund reasonably requests concerning the beneficial ownership of the Target Fund’s shares.
5.5 FURTHER ACTION. Subject to the provisions of this Agreement, each Fund will take or cause to be taken all action and do or cause to be done, all things reasonably necessary, proper or advisable to consummate and make effective the transactions contemplated by this Agreement, including any actions required to be taken after the Closing Date.
A-9
5.6 STATEMENT OF EARNINGS AND PROFITS. As promptly as practicable, but in any case within 60 days after the Closing Date, the Target Fund shall furnish the Acquiring Fund, in such form as is reasonably satisfactory to the Acquiring Fund and which will be certified by the Trust’s Treasurer, a statement of the earnings and profits of the Target Fund for federal income tax purposes, as well as any net operating loss carryovers and capital loss carryovers, that will be carried over to the Acquiring Fund pursuant to Section 381 of the Code.
5.7 PREPARATION OF REGISTRATION STATEMENT AND PROXY MATERIALS. The Trust will prepare and file with the Commission a registration statement on Form N-14 relating to the Acquiring Fund Shares to be issued to the Target Fund Shareholders (the “Registration Statement”). The Registration Statement shall include a proxy statement and a prospectus of the Acquiring Fund relating to the transactions contemplated by this Agreement. The Registration Statement shall be in compliance with the 1933 Act, the Securities Exchange Act of 1934, as amended (the “1934 Act”), and the 1940 Act, as applicable. Each party will provide the other party with the materials and information necessary to prepare the proxy statement and related materials (the “Proxy Materials”), for inclusion therein, in connection with the meeting of Target Fund Shareholders to consider the approval of this Agreement and the transactions contemplated herein.
5.8 TAX STATUS OF REORGANIZATION. The intention of the parties is that the Reorganization will qualify as a reorganization within the meaning of Section 368(a) of the Code. None of the Target Fund, the Trust or the Acquiring Fund shall take any action, or cause any action to be taken (including, without limitation, the filing of any tax return), that is inconsistent with such treatment or results in the failure of the transaction to qualify as a reorganization within the meaning of Section 368(a) of the Code. At or prior to the Closing Date, the Target Fund, the Trust and the Acquiring Fund will take such action, or cause such action to be taken, as is reasonably necessary to enable counsel to render the tax opinion contemplated herein in section 8.8.
ARTICLE VI
CONDITION PRECEDENT TO OBLIGATIONS OF THE TARGET FUND
The obligations of the Target Fund to consummate the transactions provided for herein with respect to the Reorganization shall be subject to the following condition:
6.1 All representations, covenants and warranties of the Acquiring Fund contained in this Agreement shall be true and correct in all material respects as of the date hereof and as of the Closing Date, with the same force and effect as if made on and as of the Closing Date. The Acquiring Fund shall have delivered to the Target Fund a certificate executed in the Acquiring Fund’s name by the Trust’s President or Senior Vice President and its Chief Financial Officer, in form and substance reasonably satisfactory to the Target Fund and dated as of the Closing Date, to such effect and as to such other matters as the Target Fund shall reasonably request.
A-10
ARTICLE VII
CONDITIONS PRECEDENT TO OBLIGATIONS OF THE ACQUIRING FUND
The obligations of the Acquiring Fund to consummate the transactions provided for herein with respect to the Reorganization shall be subject to the following conditions:
7.1 All representations, covenants and warranties of the Target Fund contained in this Agreement shall be true and correct in all material respects as of the date hereof and as of the Closing Date, with the same force and effect as if made on and as of the Closing Date. The Target Fund shall have delivered to the Acquiring Fund on the Closing Date a certificate executed in the Target Fund’s name by the Trust’s President or Senior Vice President and its Chief Financial Officer, in form and substance reasonably satisfactory to the Acquiring Fund and dated as of the Closing Date, to such effect and as to such other matters as the Acquiring Fund shall reasonably request.
7.2 The Target Fund shall have delivered to the Acquiring Fund a statement of the Target Fund’s assets and liabilities, together with a list of the Target Fund’s portfolio securities showing the tax basis of such securities by lot and the holding periods of such securities, as of the Closing Date, certified by the Treasurer of the Trust.
ARTICLE VIII
FURTHER CONDITIONS PRECEDENT WITH RESPECT TO THE REORGANIZATION
The obligations of the Target Fund and the Acquiring Fund with respect to the Reorganization hereunder shall also be subject to the following:
8.1 This Agreement and the transactions contemplated herein, with respect to the Target Fund, shall have been approved by the requisite vote of the holders of the outstanding shares of the Target Fund in accordance with applicable law and the provisions of the Trust’s Trust Instrument and By-Laws. Notwithstanding anything herein to the contrary, neither the Acquiring Fund nor the Target Fund may waive the condition set forth in this Section 8.1.
8.2 On the Closing Date, the Commission shall not have issued an unfavorable report under Section 25(b) of the 1940 Act or instituted any proceeding seeking to enjoin the consummation of the transactions contemplated by this Agreement under Section 25(c) of the 1940 Act. Furthermore, no action, suit or other proceeding shall be threatened or pending before any court or governmental agency in which it is sought to restrain or prohibit, or obtain damages or other relief in connection with, this Agreement or the transactions contemplated herein.
8.3 All required consents of other parties and all other consents, orders and permits of federal, state and local regulatory authorities (including those of the Commission and of state securities authorities, including any necessary “no-action” positions and exemptive orders from such federal and state authorities) to permit consummation of the transactions contemplated herein shall have been obtained.
A-11
8.4 The Registration Statement shall have become effective under the 1933 Act, and no stop order suspending the effectiveness thereof shall have been issued. To the best knowledge of the parties to this Agreement, no investigation or proceeding for that purpose shall have been instituted or be pending, threatened or contemplated under the 1933 Act.
8.5 The Target Fund shall have declared and paid a dividend or dividends which, together with all previous such dividends, shall have the effect of distributing to its shareholders at least all of the Target Fund’s investment company taxable income for all taxable periods ending on or before the Closing Date (computed without regard to any deduction for dividends paid), if any, plus the excess of its interest income excludible from gross income under Section 103(a) of the Code, if any, over its deductions disallowed under Sections 265 and 171(a)(2) of the Code for all taxable periods ending on or before the Closing Date and all of its net capital gains realized in all taxable periods ending on or before the Closing Date (after reduction for any available capital loss carry forward).
8.6 The Target Fund shall have delivered to the Acquiring Fund, and the Acquiring Fund shall have delivered to the Target Fund, on the Closing Date a certificate executed in its name by the Trust’s President or Senior Vice President, in a form reasonably satisfactory to the Target Fund or Acquiring Fund, as applicable, and dated as of the Closing Date, to the effect that the representations and warranties of the Trust, on behalf of the Fund, made in this Agreement are true and correct on and as of the Closing Date and as to such other matters as the Fund shall reasonably request.
8.7 The Funds shall have received on the Closing Date an opinion from Vedder Price P.C., counsel to the Trust, dated as of the Closing Date, substantially to the effect that:
(a) The Trust is a statutory trust, validly existing under the laws of the State of Delaware, which, to such counsel’s knowledge, has the power to own all its properties and assets and to carry on its business as presently conducted.
(b) The Trust is registered as an investment company under the 1940 Act, and, to such counsel’s knowledge, such registration under the 1940 Act is in full force and effect.
(c) Assuming that the Acquiring Fund Shares are issued in accordance with the terms of this Agreement, the Acquiring Fund Shares to be issued and delivered to the Target Fund on behalf of the Target Fund Shareholders, as provided by this Agreement, are duly authorized and upon such delivery will be legally issued and outstanding and fully paid and non-assessable, and no shareholder of the Acquiring Fund has any preemptive rights with respect to the Acquiring Fund Shares.
(d) The Registration Statement is effective, and to such counsel’s knowledge, no stop order under the 1933 Act pertaining thereto has been issued, and to the knowledge of such counsel, no consent, approval, authorization or order of any court or governmental authority of the United States or the State of Delaware is required for consummation by the Funds of the transactions contemplated herein, except as have been obtained.
(e) The execution and delivery of this Agreement did not, and the consummation of the transactions contemplated herein will not, result in a violation of the Trust’s Trust Instrument
A-12
(assuming approval of Target Fund Shareholders has been obtained) or By-Laws or any provision of any material agreement, indenture, instrument, contract, lease or other undertaking (in each case known to such counsel) to which a Fund is a party or by which a Fund or any of its properties may be bound.
8.8 The Funds shall have received an opinion of Vedder Price P.C. addressed to the Acquiring Fund and the Target Fund substantially to the effect that for federal income tax purposes:
(a) The transfer of all the Target Fund’s assets to the Acquiring Fund in exchange solely for Acquiring Fund Shares and the assumption by the Acquiring Fund of all the liabilities of the Target Fund, followed by the pro rata distribution by the Target Fund of all the Acquiring Fund Shares received to the Target Fund Shareholders in complete liquidation of the Target Fund will constitute a “reorganization” within the meaning of Section 368(a) of the Code, and the Acquiring Fund and the Target Fund will each be a “party to a reorganization,” within the meaning of Section 368(b) of the Code, with respect to the Reorganization.
(b) No gain or loss will be recognized by the Acquiring Fund upon the receipt of all the assets of the Target Fund solely in exchange for Acquiring Fund Shares and the assumption by the Acquiring Fund of all the liabilities of the Target Fund.
(c) No gain or loss will be recognized by the Target Fund upon the transfer of all the Target Fund’s assets to the Acquiring Fund solely in exchange for Acquiring Fund Shares and the assumption by the Acquiring Fund of all the liabilities of the Target Fund or upon the distribution (whether actual or constructive) of Acquiring Fund Shares to the Target Fund Shareholders solely in exchange for such shareholders’ shares of the Target Fund in complete liquidation of the Target Fund.
(d) No gain or loss will be recognized by the Target Fund Shareholders upon the exchange of their Target Fund shares solely for Acquiring Fund Shares in the Reorganization.
(e) The aggregate basis of the Acquiring Fund Shares received by each Target Fund Shareholder pursuant to the Reorganization will be the same as the aggregate basis of the Target Fund shares exchanged therefor by such shareholder. The holding period of the Acquiring Fund Shares received by each Target Fund Shareholder will include the period during which the Target Fund shares exchanged therefor were held by such shareholder, provided such Target Fund shares are held as capital assets at the time of the Reorganization.
(f) The basis of the Target Fund’s assets acquired by the Acquiring Fund will be the same as the basis of such assets to the Target Fund immediately before the Reorganization. The holding period of the assets of the Target Fund in the hands of the Acquiring Fund will include the period during which those assets were held by the Target Fund.
No opinion will be expressed as to (1) the effect of the Reorganization on (A) the Target Fund, the Acquiring Fund or any Target Fund Shareholder with respect to any asset as to which any unrealized gain or loss is required to be recognized under federal income tax principles (i) at the end of a taxable year (or on the termination thereof) or (ii) upon the transfer of such asset regardless of whether such transfer would otherwise be a non-taxable transaction under the Code, or (B) the Target Fund, the
A-13
Acquiring Fund or any Target Fund Shareholder with respect to any stock held in a passive foreign investment company as defined in Section 1297(a) of the Code or (2) any other federal tax issues (except those set forth above) and all state, local or foreign tax issues of any kind.
Such opinion shall be based on customary assumptions and such representations as Vedder Price P.C. may reasonably request of the Funds, and the Target Fund and the Acquiring Fund will cooperate to make and certify the accuracy of such representations. Notwithstanding anything herein to the contrary, neither the Acquiring Fund nor the Target Fund may waive the conditions set forth in this Section 8.8.
ARTICLE IX
EXPENSES
9.1 Each Fund will bear its own expenses in connection with the Reorganization (whether or not the Reorganization is consummated), including legal and accounting fees and expenses, provided that the Adviser will reimburse the Funds for expenses in connection with the Reorganization, including legal and accounting expenses, to the extent that such expenses cause total operating expenses of a Fund to exceed operating expense caps in effect for a Fund through February 28, 2014.
9.2 Each party represents and warrants to the other that there is no person or entity entitled to receive any broker’s fees or similar fees or commission payments in connection with the transactions provided for herein.
9.3 Notwithstanding the foregoing, expenses will in any event be paid by the party directly incurring such expenses if and to the extent that the payment by the other party of such expenses would result in the disqualification of the Target Fund or the Acquiring Fund, as the case may be, as a RIC.
ARTICLE X
ENTIRE AGREEMENT; SURVIVAL OF WARRANTIES
10.1 The parties to the Reorganization agree that no party has made to the other parties any representation, warranty and/or covenant not set forth herein, and that this Agreement constitutes the entire agreement between and among the parties.
10.2 The representations, warranties, and covenants contained in this Agreement or in any document delivered pursuant to or in connection with this Agreement shall not survive the consummation of the transactions contemplated hereunder.
ARTICLE XI
TERMINATION
11.1 This Agreement may be terminated by the mutual agreement of the parties to the Reorganization, and such termination may be effected by the Trust’s President without further action by
A-14
the Board. In addition, either the Acquiring Fund or the Target Fund may at its option terminate this Agreement at or before the Closing Date due to:
(a) a breach by any other party to the Reorganization of any representation, warranty, or agreement contained herein to be performed at or before the Closing Date, if not cured within 30 days;
(b) a condition precedent to the obligations of the terminating party that has not been met and it reasonably appears that it will not or cannot be met; or
(c) a determination by the Board that the consummation of the transactions contemplated herein with respect to the Reorganization is not in the best interests of the Acquiring Fund or the Target Fund.
11.2 In the event of any such termination, in the absence of willful default, there shall be no liability for damages on the part of the Trust, the Trustees, the Acquiring Fund, the Target Fund, the Adviser, or the Trust’s or Adviser’s officers.
ARTICLE XII
AMENDMENTS
12.1 This Agreement may be amended, modified or supplemented in such manner as may be mutually agreed upon in writing by the officers of the Trust as specifically authorized by the Board of Trustees; provided, however, that following the meeting of the Target Fund Shareholders called by the Target Fund pursuant to Section 5.2 of this Agreement, no such amendment may have the effect of changing the provisions for determining the number of Acquiring Fund Shares to be issued to the Target Fund Shareholders under this Agreement to the detriment of such shareholders without their further approval.
ARTICLE XIII
HEADINGS; COUNTERPARTS; GOVERNING LAW; ASSIGNMENT;
LIMITATION OF LIABILITY
13.1 The article and section headings contained in this Agreement are for reference purposes only and shall not affect in any way the meaning or interpretation of this Agreement.
13.2 This Agreement may be executed in any number of counterparts, each of which shall be deemed an original.
13.3 This Agreement shall be governed by and construed in accordance with the laws of the State of Delaware.
13.4 This Agreement shall bind and inure to the benefit of the parties hereto and their respective successors and assigns, but, except as provided in this section, no assignment or transfer hereof
A-15
or of any rights or obligations hereunder shall be made by any party without the written consent of the other parties. Nothing herein expressed or implied is intended or shall be construed to confer upon or give any person, firm or corporation, other than the parties hereto and their respective successors and assigns, any rights or remedies under or by reason of this Agreement.
13.5 It is expressly agreed that the obligations of each Fund hereunder shall not be binding upon any of the Trustees, shareholders, nominees, officers, agents or employees of the Trust personally, but shall bind only the trust property of the respective Fund, as provided in the Trust’s Trust Instrument. The execution and delivery of this Agreement have been authorized by the Trustees of the Trust on behalf of each Fund and signed by authorized officers of the Trust acting as such. Neither the authorization by such Trustees nor the execution and delivery by such officers shall be deemed to have been made by any of them individually or to impose any liability on any of them personally, but shall bind only the trust property of the respective Fund as provided in the Trust’s Trust Instrument.
[SIGNATURE PAGE FOLLOWS]
A-16
IN WITNESS WHEREOF, the parties have duly executed this Agreement, all as of the date first written above.
|
ASTON FUNDS on behalf of ASTON/LMCG Small Cap Growth Fund (formerly known as ASTON Small Cap Growth Fund) |
|
By: |
Name: �� |
Title: |
|
ASTON FUNDS on behalf of ASTON Small Cap Fund (formerly known as ASTON/Veredus Small Cap Growth Fund) By: |
Name: |
Title: |
|
The undersigned is a party to this Agreement for the purposes of Section 9.1 only: ASTON ASSET MANAGEMENT, LP |
|
By: |
Name: |
Title: |
A-17
APPENDIX B
FINANCIAL HIGHLIGHTS
These financial highlights tables are intended to help you understand the Acquiring Fund’s financial performance. The following schedules present financial highlights for one outstanding share of the Fund throughout the periods indicated. The total returns in the tables represent the rate that an investor would have earned or lost on an investment in the Acquiring Fund (assuming reinvestment of all dividends and distributions). This information has been derived from the Fund’s financial statements as of October 31, 2012. The financial statements for the Acquiring Fund have been audited by Ernst & Young LLP, whose report along with the Acquiring Funds’ financial statements, is included in the Trust’s Annual Report, which is available upon request.
| | | | | | | | |
ASTON/LMCG Small Cap Growth Fund – Class N Year Ended October 31, (formerly, ASTON Small Cap Growth Fund) | | 2012 | | | 2011(a) | |
Per Share Operating Data: | | | | | | | | |
Net Asset Value, Beginning of Period | | | $9.95 | | | | $10.00 | |
Income from Investment Operations: | | | | | | | | |
Net investment loss | | | (0.12 | )(b) | | | (0.04 | ) |
Net realized and unrealized gain on investments | | | 1.59 | | | | (0.01 | ) |
| | | | | | | | |
Total from investment operations | | | 1.47 | | | | (0.05 | ) |
Less Distributions: | | | | | | | | |
Distributions from and in excess of net investment income | | | — | | | | — | |
| | | | | | | | |
Total distributions | | | — | | | | — | |
Net decrease in net asset value | | | 1.47 | | | | (0.05 | ) |
Net Asset Value, End of Period | | | $11.42 | | | | $9.95 | |
Total Return(c) | | | 14.77 | % | | | (0.50 | )%(d) |
| | | | | | | | |
Ratios/Supplemental Data: | | | | | | | | |
Net Assets, End of Period (in 000’s) | | | $5,659 | | | | $5,411 | |
Ratios of expenses to average net assets: | | | | | | | | |
Before reimbursement and/or waiver of expenses by Adviser | | | 2.86 | % | | | 8.27 | %(e) |
After reimbursement and/or waiver of expenses by Adviser | | | 1.35 | % | | | 1.35 | %(e) |
Ratios of net investment loss to average net assets: | | | | | | | | |
Before reimbursement and/or waiver of expenses by Adviser | | | (2.68 | )% | | | (8.14 | )%(e) |
After reimbursement and/or waiver of expenses by Adviser | | | (1.17 | )% | | | (1.21 | )%(e) |
Portfolio Turnover | | | 168.05 | %(f) | | | 205.85 | %(d) |
| | | | | | | | |
ASTON/LMCG Small Cap Growth Fund – Class I Year Ended October 31, (formerly, ASTON Small Cap Growth Fund) | | 2012 | | | 2011(g) | |
Per Share Operating Data: | | | | | | | | |
Net Asset Value, Beginning of Period | | | $9.97 | | | | $12.40 | |
Income from Investment Operations: | | | | | | | | |
Net investment loss | | | (0.10 | )(b) | | | (0.04 | ) |
Net realized and unrealized gain on investments | | | 1.59 | | | | (2.39 | ) |
| | | | | | | | |
Total from investment operations | | | 1.49 | | | | (2.43 | ) |
Less Distributions: | | | | | | | | |
Distributions from and in excess of net investment income | | | — | | | | — | |
| | | | | | | | |
Total distributions | | | — | | | | — | |
Net decrease in net asset value | | | 1.49 | | | | (2.43 | ) |
Net Asset Value, End of Period | | | $11.46 | | | | $9.97 | |
Total Return(c) | | | 14.95 | % | | | (19.60 | )%(d) |
| | | | | | | | |
Ratios/Supplemental Data: | | | | | | | | |
Net Assets, End of Period (in 000’s) | | | $755 | | | | $2,551 | |
Ratios of expenses to average net assets: | | | | | | | | |
Before reimbursement and/or waiver of expenses by Adviser | | | 2.61 | % | | | 6.25 | %(e) |
After reimbursement and/or waiver of expenses by Adviser | | | 1.10 | % | | | 1.10 | %(e) |
Ratios of net investment loss to average net assets: | | | | | | | | |
Before reimbursement and/or waiver of expenses by Adviser | | | (2.43 | )% | | | (6.11 | )%(e) |
After reimbursement and/or waiver of expenses by Adviser | | | (0.92 | )% | | | (0.96 | )%(e) |
Portfolio Turnover | | | 168.05 | %(f) | | | 205.85 | %(d) |
| | (a) | ASTON Small Cap Growth Fund began issuing Class N shares on November 2, 2010. |
| | (b) | The selected per share data was calculated using the weighted average shares outstanding method for the period. |
| | (c) | The total return is calculated using the Net Asset Values used for trading at the close of business at period end. |
| | (f) | Portfolio turnover rate excludes securities delivered from processing a redemption-in-kind. |
| | (g) | ASTON Small Cap Growth Fund began issuing Class I shares on May 31, 2011. |
| | | | | | | | | | | | | | | | | | | | |
ASTON Small Cap Fund – Class N Year Ended October 31, (formerly, ASTON/Veredus Small Cap Growth Fund) | | 2012 | | | 2011 | | | 2010 | | | 2009 | | | 2008 | |
Per Share Operating Data: | | | | | | | | | | | | | | | | | | | | |
Net Asset Value, Beginning of Period | | | $12.36 | | | | $11.80 | | | | $8.97 | | | | $8.38 | | | | $22.42 | |
Income from Investment Operations: | | | | | | | | | | | | | | | | | | | | |
Net investment loss | | | (0.12 | )(a) | | | (0.14 | )(a) | | | (0.14 | )(a) | | | (0.10 | ) | | | (0.17 | ) |
Net realized and unrealized gain (loss) on investments | | | 0.79 | | | | 0.70 | | | | 2.97 | | | | 0.74 | | | | (8.31 | ) |
| | | | | | | | |
Total from investment operations | | | 0.67 | | | | 0.56 | | | | 2.83 | | | | 0.64 | | | | (8.48 | ) |
Less Distributions: | | | | | | | | | | | | | | | | | | | | |
Distributions from net realized gain on investments | | | — | | | | — | | | | — | | | | (0.05 | ) | | | (5.56 | ) |
| | | | | | | | |
Total distributions | | | — | | | | — | | | | — | | | | (0.05 | ) | | | (5.56 | ) |
Net increase (decrease) in net asset value | | | 0.67 | | | | 0.56 | | | | 2.83 | | | | 0.59 | | | | (14.04 | ) |
Net Asset Value, End of Period | | | $13.03 | | | | $12.36 | | | | $11.80 | | | | $8.97 | | | | $8.38 | |
Total Return(b) | | | 5.42 | % | | | 4.75 | % | | | 31.55 | % | | | 7.79 | % | | | (47.87 | )% |
| | | | | | | | | | | | | | | | | | | | |
Ratios/Supplemental Data: | | | | | | | | | | | | | | | | | | | | |
Net Assets, End of Period (in 000’s) | | | $21,763 | | | | $26,300 | | | | $33,594 | | | | $32,140 | | | | $43,149 | |
Ratios of expenses to average net assets: | | | | | | | | | | | | | | | | | | | | |
Before reimbursement and/or waiver of expenses by Adviser | | | 1.83 | % | | | 1.65 | %(c) | | | 1.63 | % | | | 1.82 | %(c) | | | 1.55 | %(c) |
After reimbursement and/or waiver of expenses by Adviser | | | 1.49 | % | | | 1.49 | %(c) | | | 1.49 | % | | | 1.49 | %(c) | | | 1.49 | %(c) |
Ratios of net investment loss to average net assets: | | | | | | | | | | | | | | | | | | | | |
Before reimbursement and/or waiver of expenses by Adviser | | | (1.32 | )% | | | (1.19 | )% | | | (1.40 | )% | | | (1.48 | )% | | | (1.21 | )% |
After reimbursement and/or waiver of expenses by Adviser | | | (0.98 | )% | | | (1.03 | )% | | | (1.27 | )% | | | (1.15 | )% | | | (1.15 | )% |
Portfolio Turnover | | | 158.83 | %(d) | | | 197.43 | % | | | 187.83 | % | | | 264.98 | % | | | 166.19 | % |
| | | | | |
ASTON Small Cap Fund – Class I Year Ended October 31, (formerly, ASTON/Veredus Small Cap Growth Fund) | | 2012 | | | 2011 | | | 2010 | | | 2009 | | | 2008 | |
Per Share Operating Data: | | | | | | | | | | | | | | | | | | | | |
Net Asset Value, Beginning of Period | | | $12.80 | | | | $12.19 | | | | $9.25 | | | | $8.61 | | | | $22.83 | |
Income from Investment Operations: | | | | | | | | | | | | | | | | | | | | |
Net investment loss | | | (0.09 | )(a) | | | (0.11 | )(a) | | | (0.11 | )(a) | | | (0.08 | ) | | | (0.21 | ) |
Net realized and unrealized gain (loss) on investments | | | 0.82 | | | | 0.72 | | | | 3.05 | | | | 0.77 | | | | (8.45 | ) |
| | | | | | | | |
Total from investment operations | | | 0.73 | | | | 0.61 | | | | 2.94 | | | | 0.69 | | | | (8.66 | ) |
Less Distributions: | | | | | | | | | | | | | | | | | | | | |
Distributions from net realized gain on investments | | | — | | | | — | | | | — | | | | (0.05 | ) | | | (5.56 | ) |
| | | | | | | | |
Total distributions | | | — | | | | — | | | | — | | | | (0.05 | ) | | | (5.56 | ) |
Net increase (decrease) in net asset value | | | 0.73 | | | | 0.61 | | | | 2.94 | | | | 0.64 | | | | (14.22 | ) |
Net Asset Value, End of Period | | | $13.53 | | | | $12.80 | | | | $12.19 | | | | $9.25 | | | | $8.61 | |
Total Return(b) | | | 5.62 | % | | | 5.09 | % | | | 31.78 | % | | | 8.16 | % | | | (47.77 | )% |
| | | | | | | | | | | | | | | | | | | | |
Ratios/Supplemental Data: | | | | | | | | | | | | | | | | | | | | |
Net Assets, End of Period (in 000’s) | | | $2,400 | | | | $16,891 | | | | $16,190 | | | | $13,356 | | | | $16,719 | |
Ratios of expenses to average net assets: | | | | | | | | | | | | | | | | | | | | |
Before reimbursement and/or waiver of expenses by Adviser | | | 1.58 | % | | | 1.40 | %(c) | | | 1.38 | % | | | 1.57 | %(c) | | | 1.30 | %(c) |
After reimbursement and/or waiver of expenses by Adviser | | | 1.24 | % | | | 1.24 | %(c) | | | 1.24 | % | | | 1.24 | %(c) | | | 1.24 | %(c) |
Ratios of net investment loss to average net assets: | | | | | | | | | | | | | | | | | | | | |
Before reimbursement and/or waiver of expenses by Adviser | | | (1.07 | )% | | | (0.94 | )% | | | (1.15 | )% | | | (1.23 | )% | | | (0.96 | )% |
After reimbursement and/or waiver of expenses by Adviser | | | (0.73 | )% | | | (0.78 | )% | | | (1.02 | )% | | | (0.90 | )% | | | (0.90 | )% |
Portfolio Turnover | | | 158.83 | %(d) | | | 197.43 | % | | | 187.83 | % | | | 264.98 | % | | | 166.19 | % |
| | (a) | The selected per share data was calculated using the weighted average shares outstanding method for the period. |
| | (b) | The total return is calculated using the Net Asset Values used for trading at the close of business at period end. |
| | (c) | Ratios of expenses to average net assets include interest expense of less than 0.005% for the years ended October 31, 2011, October 31, 2009 and October 31, 2008, which is not included in the contractual expense limitation. The interest expense is from utilizing the line of credit. |
| | (d) | Portfolio turnover rate excludes securities delivered from processing a redemption-in-kind. |
B-2
APPENDIX C
LMCG SUB-INVESTMENT ADVISORY AGREEMENT
SUB-INVESTMENT ADVISORY AGREEMENT (the “Agreement”) made this 17th day of February, 2012 by and between ASTON ASSET MANAGEMENT, LP (hereinafter referred to as the “Investment Adviser”) and LEE MUNDER CAPITAL GROUP, LLC (hereinafter referred to as the “Subadviser”), which Agreement may be executed in any number of counterparts, each of which shall be deemed to be an original, but all of which together shall constitute but one instrument.
W I T N E S S E T H:
WHEREAS, the Investment Adviser has been retained by Aston Funds, a Delaware statutory trust (the “Trust”), a registered management investment company under the Investment Company Act of 1940, as amended (the “1940 Act”), to provide investment advisory services to the Trust with respect to certain series of the Trust set forth in Schedule A hereto as may be amended from time to time (hereinafter referred to as a “Fund” and, collectively, the “Funds” of the Trust);
WHEREAS, the Investment Adviser wishes to enter into a contract with the Subadviser to provide research, analysis, advice and recommendations with respect to the purchase and sale of securities, and make investment commitments with respect to such portion of the Funds’ assets as shall be allocated to the Subadviser by the Investment Adviser from time to time (the “Allocated Assets”), subject to oversight by the Trustees of the Trust and the supervision of the Investment Adviser.
NOW THEREFORE, in consideration of the mutual agreements herein contained, and intending to be bound, the parties agree as follows:
1. In accordance with the Investment Advisory Agreement between the Trust and the Investment Adviser (“Investment Advisory Agreement”) with respect to the Funds, the Investment Adviser hereby appoints the Subadviser to act as subadviser with respect to the Allocated Assets for the period and on the terms set forth in this Agreement. The Subadviser accepts such appointment and agrees to render the services set forth herein, for the compensation provided herein.
2. As compensation for the services enumerated herein, the Investment Adviser will pay the Subadviser a fee with respect to the Allocated Assets, which shall be calculated and payable monthly in arrears based on the average daily net assets of the Fund, in an amount equal to 50% of the positive difference, if any, of (x) the advisory fee payable to the Investment Adviser with respect to the Allocated Assets of the Fund (before reduction of the fee payable to Subadviser) minus (y) the sum of: (i) any investment advisory fees waived by the Investment Adviser pursuant to an expense limitation or reimbursement agreement with the Fund, (ii) any reimbursement of expenses by the Investment Adviser pursuant to an expense limitation or reimbursement agreement with the Fund, and (iii) any payments made by the Investment Adviser to third parties that provide distribution, shareholder services or similar services on behalf of the Fund. If the foregoing calculation results in a negative amount, such amount shall be payable by the Subadviser within 30 days of receipt of notice from the Investment Adviser, which notice shall include the basis for the calculation.
For the purposes of this Agreement, a Fund’s “net assets” shall be determined as provided in the Fund’s then-current Prospectus (as used herein, this term includes the related Statement of Additional Information).
C-1
If this Agreement shall become effective subsequent to the first day of a month, or shall terminate before the last day of a month, the Subadviser’s compensation for such fraction of the month shall be prorated based on the number of calendar days of such month during which the Agreement is effective.
3. This Agreement shall become effective with respect to a Fund as of the date set forth opposite the Fund’s name as set forth on Schedule A hereto (the “Effective Date”), provided that it has been approved by the Trustees of the Trust in accordance with the provisions of the 1940 Act and the rules thereunder and, if so required by the 1940 Act and the rules thereunder, by the shareholders of the Fund in accordance with the requirements of the 1940 Act and the rules thereunder.
4. This Agreement shall continue in effect for the initial term set forth in Schedule A. It shall be renewed automatically thereafter with respect to a Fund by the Investment Adviser and the Subadviser for successive periods not exceeding one year, if and only if such renewal and continuance is specifically approved at least annually by the Board of Trustees of the Trust or by a vote of the majority of the outstanding voting securities of the Fund as prescribed by the 1940 Act and provided further that such continuance is approved at least annually thereafter by a vote of a majority of the Trust’s Trustees, who are not parties to such Agreement or interested persons of such a party, cast in person at a meeting called for the purpose of voting on such approval. This Agreement will terminate with respect to a Fund without the payment of any penalty upon termination of the Investment Advisory Agreement relating to the Fund by either party thereto (accompanied by simultaneous notice to the Subadviser) or upon sixty days’ written notice to the Subadviser that the Trustees of the Trust, the Investment Adviser or the shareholders by vote of a majority of the outstanding voting securities of the Fund, as provided by the 1940 Act, have terminated this Agreement. Notwithstanding the foregoing, this Agreement may be terminated upon less than sixty days’ notice to the Subadviser upon a material breach of this Agreement or if the Trustees determine that other circumstances have, or likely will have, a material adverse effect on the Subadviser’s abilities to perform its obligations hereunder, including without limitation, notification of the departure of a portfolio manager of the Fund or other key personnel change. This Agreement may also be terminated by the Subadviser with respect to a Fund without penalty upon sixty days’ written notice to the Investment Adviser and the Trust.
This Agreement shall terminate automatically with respect to a Fund in the event of its assignment or, upon notice thereof to the Subadviser, the assignment of the Investment Advisory Agreement, unless its continuation thereafter is approved by the Board of Trustees of the Trust and the shareholders of the Fund if so required by the 1940 Act (in each case as the term “assignment” is defined in Section 2(a)(4) of the 1940 Act, subject to such exemptions as may be granted by the Securities and Exchange Commission (“SEC”) by any rule, regulation, order or interpretive guidance).
5. Subject to the oversight of the Board of Trustees of the Trust and the Investment Adviser, the Subadviser will provide an investment program for the Allocated Assets, including investment research and management with respect to securities and investments, including cash and cash equivalents, and will determine from time to time what securities and other investments will be purchased, retained or sold. The Subadviser will provide the services under this Agreement in accordance with each Fund’s investment objective, policies and restrictions as stated in the Prospectus, as provided to the Subadviser by the Investment Adviser. The Subadviser further agrees that, in all matters relating to the performance of this Agreement, it:
(a) shall act in conformity with the Trust’s Declaration of Trust, By-Laws and currently effective registration statements under the 1940 Act and the Securities Act of 1933 (the “1933 Act”) and any amendments or supplements thereto (the “Registration Statements”) and with the written policies, procedures and guidelines of each Fund, and written instructions and directions of the Trustees of the Trust and shall comply with the requirements of the 1940 Act and the Investment Advisers Act of
C-2
1940 (the “Advisers Act”) and the rules thereunder, and all other applicable federal and state laws and regulations. The Trust agrees to provide Subadviser with copies of the Trust’s Declaration of Trust, By-Laws, Registration Statements, written policies, procedures and guidelines, and written instructions and directions of the Trustees, and any amendments or supplements to any of them at, or, if practicable, before the time such materials, instructions or directives become effective;
(b) will maintain at all times during the term of this Agreement, in full force and effect, insurance, including without limitation errors and omissions insurance, with reputable insurance carriers, in such amounts, covering such risks and liabilities, and with such deductibles and self-insurance as are consistent with customary industry practice;
(c) will pay expenses incurred by it in connection with its activities under this Agreement other than the cost of securities and other investments (including brokerage commissions and other transaction charges, if any) purchased for each Fund, provided that the Subadviser will not pay for or provide a credit with respect to any research provided to it in accordance with Section 5(d);
(d) will place orders pursuant to its investment determinations for the Allocated Assets either directly with any broker or dealer, or with the issuer. In placing orders with brokers or dealers, the Subadviser will attempt to obtain the best overall price and the most favorable execution of its orders. Subject to policies established by the Trustees of the Trust and communicated to the Subadviser, it is understood that the Subadviser will not be deemed to have acted unlawfully, or to have breached a fiduciary duty to the Trust or in respect of a Fund, or be in breach of any obligation owing to the Investment Adviser or the Trust or in respect of a Fund under this Agreement, or otherwise, solely by reason of its having caused the Fund to pay a member of a securities exchange, a broker or a dealer a commission for effecting a securities transaction for the Fund in excess of the amount of commission another member of an exchange, broker or dealer would have charged if the Subadviser determines in good faith that the commission paid was reasonable in relation to the brokerage or research services (as those terms are defined in Section 28(e) of the Securities Exchange Act of 1934 and interpretive guidance issued by the SEC thereunder) provided by such member, broker or dealer, viewed in terms of that particular transaction or the Subadviser’s overall responsibilities with respect to the accounts, including the Fund, as to which it exercises investment discretion;
(e) will review the daily valuation of securities comprising the Allocated Assets of each Fund as obtained on a daily basis by the Fund’s administrator and furnished by it to Subadviser, and will promptly notify the Trust and the Investment Adviser if the Subadviser believes that any such valuations may not properly reflect the market value of any securities owned by the Fund, provided, however, that the Subadviser is not required by this subparagraph to obtain valuations of any such securities from brokers or dealers or otherwise, or to otherwise independently verify valuations of any such securities;
(f) unless otherwise instructed, will be responsible for voting all proxies of the Allocated Assets in accordance with the Proxy Voting Policies and Guidelines of Subadviser (the “Proxy Policy”), provided that such Proxy Policy and any amendments thereto are furnished to the Trust;
(g) will attend regular business and investment-related meetings with the Trust’s Board of Trustees and the Investment Adviser if requested to do so by the Trust and/or the Investment Adviser, and at its expense, shall supply the Board, the officers of the Trust, and the Investment Adviser with all information and reports reasonably required by them and reasonably available to the Subadviser relating to the services provided by the Subadviser hereunder;
C-3
(h) will maintain books and records with respect to the securities transactions for the Allocated Assets of each Fund and proxy voting record for the Allocated Assets of the Fund, furnish to the Investment Adviser and the Trust’s Board of Trustees such periodic and special reports as they may request with respect to the Fund, and provide in advance to the Investment Adviser all of the Subadviser’s reports to the Trust’s Board of Trustees for examination and review within a reasonable time prior to the Trust’s Board meetings; and
(i) will pay reasonable expenses incurred by the Trust for any matters related to any transaction or event that is deemed to result in a change of control of the Subadviser or otherwise result in the assignment of the Sub-Investment Advisory Agreement under the 1940 Act.
6. The Investment Adviser or its affiliates may, from time to time, engage other subadvisers to advise other series of the Trust (or portions thereof) or other registered investment companies (or series or portions thereof) that may be deemed to be under common control (each a “Sub-Advised Fund”). The Subadviser agrees that it will not consult with any other subadviser engaged by the Investment Adviser or its affiliates with respect to transactions in securities or other assets concerning a Fund or another Sub-Advised Fund, except to the extent permitted by the rules under the 1940 Act that permit certain transactions with a subadviser or its affiliates.
7. Subadviser agrees with respect to the services provided to each Fund that:
(a) it will promptly communicate to the Investment Adviser such information relating to Fund transactions as the officers and Trustees of the Trust may reasonably request and as communicated to the Subadviser;
(b) it will treat confidentially and as proprietary information of the Trust all records and other information relative to each Fund and its prior, present or potential shareholders (“Confidential Information”), will comply at all times with all applicable laws and regulations relating to the confidentiality of “nonpublic personal information” including the Gramm-Leach-Bliley Act or other federal or state privacy laws and the regulations promulgated thereunder, and will not use such Confidential Information for any purpose other than the performance of its responsibilities and duties hereunder (except after prior notification to and approval in writing by the Trust, which approval may not be withheld where Subadviser is advised by counsel that the Subadviser may be exposed to civil or criminal contempt or other proceedings for failure to comply, when requested to divulge such information by duly constituted authorities, or when so requested by the Trust); and
(c) during the term of this Agreement and for a period of eighteen (18) months following the termination of this Agreement, Subadviser (and its directors, officers, stockholders, employees, and agents) will not, directly or indirectly, solicit or induce any of the Fund’s shareholders to be withdrawn from investment in any series of the Trust.
8. Each party represents and warrants to the other party that the execution, delivery and performance of this Agreement is within its powers and have been duly authorized by all necessary actions of its directors or members, and no action by, or in respect of, or filing with, any governmental body, agency or official is required on the part of either party for execution, delivery and performance of this Agreement, and the execution, delivery and performance by either party of this Agreement do not contravene or constitute a violation of, or a material default under, (i) any provision of applicable law, rule or regulation, (ii) such party’s governing instruments, or (iii) any agreement, judgment, injunction, order, decree or other instrument binding upon such party.
C-4
9. In compliance with the requirements of Rule 31a-3 under the 1940 Act, Subadviser acknowledges that all records which it maintains for the Trust are the property of the Trust and agrees to surrender promptly to the Trust any of such records upon the Trust’s request, provided that Subadviser may retain copies thereof at its own expense. Subadviser further agrees to preserve for the periods prescribed by Rule 31a-2 under the 1940 Act the records required to be maintained by Rule 31a-1 under the 1940 Act relating to transactions placed by Subadviser for the Fund. Subadviser further agrees to maintain each Fund’s proxy voting record with respect to the Allocated Assets in a form mutually agreeable between the parties and which contains the information required by Form N-PX under the 1940 Act.
10. It is expressly understood and agreed that the services to be rendered by the Subadviser to the Investment Adviser under the provisions of this Agreement are not to be deemed to be exclusive, and the Subadviser shall be free to provide similar or different services to others so long as its ability to provide the services provided for in this Agreement shall not be materially impaired thereby. In addition, but without limiting any separate agreement between the Subadviser and the Investment Adviser to the contrary, nothing in this Agreement shall limit or restrict the right of any director, officer, or employee of the Subadviser who may also be a Trustee, officer, or employee of the Trust, to engage in any other business or to devote his or her time and attention in part to the management or other aspects of any other business, whether of a similar nature or a dissimilar nature.
11. The Investment Adviser agrees that it will furnish currently to the Subadviser all information with reference to each Fund and the Trust that is reasonably necessary to permit the Subadviser to carry out its responsibilities under this Agreement, and the parties agree that they will from time to time consult and make appropriate arrangements as to specific information that is required under this paragraph and the frequency and manner with which it shall be supplied. Without limiting the generality of the foregoing, Investment Adviser will furnish to Subadviser procedures consistent with the Trust’s contract with each Fund’s custodian from time to time (the “Custodian”), and reasonably satisfactory to Subadviser, for consummation of portfolio transactions for each Fund by payment to or delivery by the Custodian of all cash and/or securities or other investments due to or from the Fund, and Subadviser shall not have possession or custody thereof or any responsibility or liability with respect to such custody. Upon giving proper instructions to the Custodian, Subadviser shall have no responsibility or liability with respect to custodial arrangements or the acts, omissions or other conduct of the Custodian.
12. The Subadviser and its directors, officers, stockholders, employees and agents shall not be liable for any error of judgment or mistake of law or for any loss suffered by the Investment Adviser or the Trust in connection with any matters to which this Agreement relates or for any other act or omission in the performance by the Subadviser of its duties under this Agreement except that nothing herein contained shall be construed to protect the Subadviser against any liability by reason of the Subadviser’s willful misfeasance, bad faith, or gross negligence in the performance of its duties or by reckless disregard of its obligations or duties under this Agreement.
13. Each party shall indemnify and hold harmless the other party and its respective control persons (as described in Section 15 of the 1933 Act) and their respective directors, stockholders, members and employees (collectively, “Indemnitees”) against any and all losses, claims, damages, liabilities or expenses (including reasonable legal and other expenses of investigating or defending any alleged loss, claim, damages or liabilities) to which any of the Indemnitees may become subject under the 1933 Act, the 1940 Act, or the Advisers Act, or under any other statute, at common law or otherwise, arising out of or based on (i) any willful misfeasance, bad faith, or gross negligence of the other party in the performance of, or reckless disregard of, any of its duties or obligations hereunder, or (ii) any material breach of this Agreement by the other party.
C-5
14. If any provision of this Agreement shall be held or made invalid by a court decision, statute, rule or otherwise, the remainder of the Agreement shall not be affected thereby. Except to the extent governed by federal law including the 1940 Act, this Agreement shall be governed by, and construed in accordance with, the laws of the State of Delaware, without applying the principles of conflicts of law thereunder.
15. No provision of this Agreement may be changed, discharged or terminated orally, but only by an instrument in writing signed by the party against which enforcement of the change, discharge or termination is sought. No amendment of this Agreement shall be effective with respect to the Trust until approved as required by applicable law.
16. Any notice to be given hereunder may be given by personal notification or by facsimile transmission, to the party specified at the address stated below:
To the Investment Adviser at:
Aston Asset Management, LP
120 N. LaSalle Street
25th Floor
Chicago, IL 60602
Attn: President
Facsimile: (312) 268-1380
To the Subadviser at:
Lee Munder Capital Group, LLC
200 Clarendon Street
28th Floor
Boston, Massachusetts 02116
Attn: Client Service Director
Facsimile: (617) 380-5598
To a Fund or the Trust at:
Aston Funds
120 N. LaSalle Street
25th Floor
Chicago, IL 60602
Attn: President
Facsimile: (312) 268-1380
or addressed as such party may from time to time designate by notice to other parties in accordance herewith.
17. The Subadviser agrees that for any claim by it against a Fund in connection with this Agreement or the services rendered under this Agreement, it shall look only to assets of a Fund for satisfaction and that it shall have no claim against the assets of any other portfolios of the Trust.
[The Remainder of Page Intentionally Left Blank]
C-6
IN WITNESS WHEREOF, the parties hereto have caused this Agreement to be signed by their duly authorized officers as of the day and year first above written.
| | |
| ASTON ASSET MANAGEMENT, LP |
| |
| By: | | |
| | |
| Name: | | Gerald Dillenburg |
| |
| Title: | | CCO |
| | |
|
| LEE MUNDER CAPITAL GROUP, LLC |
| |
| By: | | |
| | |
| Name: | | Joseph F. Tower III |
| |
| Title: | | COO & CCO |
C-7
SCHEDULE A
| | | | |
Fund | | Effective Date | | Initial Term |
| | |
| ASTON Small Cap Growth Fund (to be renamed ASTON/LMCG Small Cap Growth Fund) | | February 17, 2012 | | December 31, 2013 |
| | |
| ASTON Small Cap Fund | | January 31, 2013 | | December 31, 2013 |
C-8
APPENDIX D
PRINCIPAL EXECUTIVE OFFICERS AND DIRECTORS OF ASTON AND LMCG
Principal Officers and Partners of Aston
| | |
Name and Address | | Principal Occupation |
| |
Stuart D. Bilton, CFA 120 N. LaSalle Street 25th Floor Chicago, IL 60602 | | Chief Executive Officer and Partner |
| |
Kenneth C. Anderson, CPA 120 N. LaSalle Street 25th Floor Chicago, IL 60602 | | President and Partner |
| |
Gerald F. Dillenburg, CPA 120 N. LaSalle Street 25th Floor Chicago, IL 60602 | | Chief Compliance Officer and Partner |
| |
Laura M. Curylo, CPA 120 N. LaSalle Street 25th Floor Chicago, IL 60602 | | Chief Financial Officer and Partner |
Principal Officers and Directors of LMCG
| | |
Name and Address | | Principal Occupation |
| |
Kenneth L. Swan Lee Munder Capital Group, LLC 200 Clarendon Street 28th Floor Boston, MA 02116 | | Chief Executive Officer and Board Member |
| |
Jeffrey P. Davis, CFA Lee Munder Capital Group, LLC 200 Clarendon Street 28th Floor Boston, MA 02116 | | Chief Investment Officer |
| |
Joseph F. Tower III Lee Munder Capital Group, LLC 200 Clarendon Street 28th Floor Boston, MA 02116 | | Chief Operating Officer and Chief Compliance Officer |
| |
R. Todd Vingers, CFA Lee Munder Capital Group, LLC 200 Clarendon Street 28th Floor Boston, MA 02116 | | Portfolio Manager and Board Member |
| |
Lee P. Munder, CFA, CIC c/o Rednum Family Investments, LP 422 Sunset Road West Palm Beach, FL 33401 | | Board Member |
| |
Richard H. Adler Convergent Capital Management LLC c/o City National Bank City National Center 400 North Roxbury Drive Beverly Hills, CA 90210 | | Board Member |
| |
William J. Freeman City National Bank City National Center 400 North Roxbury Drive Beverly Hills, CA 90210 | | Board Member |
| |
Richard S. Gershen City National Bank City National Center 400 North Roxbury Drive Beverly Hills, CA 90210 | | Board Member |
D-1
APPENDIX E
TRUSTEES AND EXECUTIVE OFFICERS OWNERSHIP OF ACQUIRING FUND SHARES
ASTON/LMCG Small Cap Growth Fund
| | | | | | |
Class | | Name of Trustee/Executive Officer | | Number of
Shares Owned | | Percent of
Class |
Class N | | Stuart D. Bilton | | 27,579.195 | | 4.899% |
| | | |
Class N | | Trustees and Officers as a group | | 27,579.195 | | 4.899% |
| | | |
Class I | | Kenneth C. Anderson | | 43,246.630 | | 59.277% |
| | | |
Class I | | Gerald F. Dillenburg | | 27,473.998 | | 37.657% |
| | | |
Class I | | Trustees and Officers as a group | | 70,720.627 | | 96.934% |
E-1
EVERY SHAREHOLDER’S VOTE IS IMPORTANT
| | | | |
| | EASY VOTING OPTIONS: |
| | |
| |  | | VOTE ON THE INTERNET Log on to: www.proxy-direct.com or scan the QR code Follow the on-screen instructions available 24 hours |
| | |
| |  | | VOTE BY PHONE Call 1-800-337-3503 Follow the recorded instructions available 24 hours |
| | |
| |  | | VOTE BY MAIL Vote, sign and date this Proxy Card and return in the postage-paid envelope |
| | |
| |  | | VOTE IN PERSON Attend the Shareholder Meeting 120 North LaSalle Street 25th Floor Chicago, IL 60602 on April 16, 2013 |
Please detach at perforation before mailing.
| | | | |
PROXY | | ASTON SMALL CAP FUND (formerly, ASTON/Veredus Small Cap Growth Fund) SPECIAL MEETING OF SHAREHOLDERS TO BE HELD ON APRIL16, 2013 | | PROXY |
THIS PROXY IS BEING SOLICITED BY THE BOARD OF TRUSTEES. The undersigned shareholder(s) of the ASTON Small Cap Fund (formerly, ASTON/Veredus Small Cap Growth Fund), a series of Aston Funds (the “Trust”), revoking previous proxies, hereby appoints Diana Roman-Podgorny and Erin Heitman or any one of them true and lawful attorneys with power of substitution of each, to vote all shares of ASTON Small Cap Fund which the undersigned is entitled to vote, at the Special Meeting of Shareholders to be held on April 16, 2013, at 9:00 a.m. Central Time, at the offices of the Trust, 120 North LaSalle Street, 25th Floor, Chicago, Illinois 60602, and at any adjournment or postponement thereof as indicated on the reverse side. In their discretion, the proxy holders named above are authorized to vote upon such other matters as may properly come before the meeting.
Receipt of the Notice of the Special Meeting of Shareholders and the accompanying Proxy Statement/Prospectus is hereby acknowledged. The shares of ASTON Small Cap Fund represented hereby will be voted as indicated or FOR the proposal if no choice is indicated.
| | |
| | VOTE VIA THE INTERNET: www.proxy-direct.com |
| | VOTE VIA TELEPHONE: 1-800-337-3503 |
| | |
| | Please sign exactly as your name appears at left. Joint owners each should sign. When signing as attorney, executor, administrator, trustee or guardian, please give full title as such. If a corporation, please sign in full corporate name by president or authorized officer. If a partnership, please sign in partnership name by authorized person. Please sign, date and return. |
| | |
| | Signature and Title, if applicable |
| | |
| | Signature (if held jointly) |
| | |
| | Date AST_24317_012913A |
EVERY SHAREHOLDER’S VOTE IS IMPORTANT
Important Notice Regarding the Availability of Proxy Materials for the
ASTON Small Cap Fund
Shareholders Meeting to Be Held on April 16, 2013
The Proxy Statement/Prospectus and Proxy Card for this meeting are available at:
https://www.proxy-direct.com/ast-24317
IF YOU VOTE ON THE INTERNET OR BY TELEPHONE,
YOU NEED NOT RETURN THIS PROXY CARD
Please detach at perforation before mailing.
Properly executed proxies will be voted as specified. If no other specification is made, such shares will be voted “FOR” the proposal.
TO VOTE, MARK BLOCKS BELOW IN BLUE OR BLACK INK. Example: ¢
| | | | | | | | | | | | | | | | |
| | | | | | FOR | | | | AGAINST | | | | ABSTAIN | | |
1. | | To approve an Agreement and Plan of Reorganization (and the related transactions) which provides for (i) the transfer of all the assets of ASTON Small Cap Fund (formerly, ASTON/Veredus Small Cap Growth Fund) (the “Target Fund”) to ASTON/LMCG Small Cap Growth Fund (formerly, ASTON Small Cap Growth Fund) (the “Acquiring Fund”) in exchange solely for shares of beneficial interest of the Acquiring Fund and the assumption by the Acquiring Fund of all the liabilities of the Target Fund; and (ii) the distribution by the Target Fund of all the shares of each class of the Acquiring Fund received by the Target Fund to the holders of shares of the corresponding class of the Target Fund in complete liquidation and termination of the Target Fund. | | | | ¨ | | | | ¨ | | | | ¨ | | |
| | | | | | | | |
2. | | To transact such other business as may properly come before the meeting or any adjournment or postponement thereof. | | | | | | | | | | | | | | |
PLEASE SIGN AND DATE ON THE REVERSE SIDE
AST_24317_012913A

Aston Funds
ASTON/LMCG Small Cap Growth Fund
Class N Shares – ACWDX
Class I Shares – ACWIX
Prospectus
February 28, 2013
A diversified, actively managed fund family with a process-
driven approach to investing.
Not FDIC Insured. No Bank Guarantee. May Lose Value.
The Securities and Exchange Commission has not approved or disapproved these or any mutual fund’s shares or determined if this prospectus is accurate or complete. Any representation to the contrary is a crime.
TABLE OF CONTENTS
ASTON/LMCG Small Cap Growth Fund
(formerly, ASTON Small Cap Growth Fund)
INVESTMENT OBJECTIVE
The Fund seeks to provide long-term capital appreciation.
FEES AND EXPENSES
The table below describes the fees and expenses that you may pay if you buy and hold shares of the Fund.
ANNUAL FUND OPERATING EXPENSES
(expenses that you pay each year as a percentage of the value of your investment)
| | | | | | | | |
| | | Class N
Shares | | | Class I
Shares | |
Management Fees | | | 1.00% | | | | 1.00% | |
Distribution and Service (12b-1) Fees | | | 0.25% | | | | None | |
Other Expenses | | | 1.61% | | | | 1.61% | |
Acquired Fund Fees and Expenses | | | 0.01% | | | | 0.01% | |
Total Annual Fund Operating Expenses | | | 2.87% | | | | 2.62% | |
Fee Waiver and/or Expense Reimbursement | | | (1.51)% | ( a) | | | (1.51)% | ( a) |
| Total Annual Fund Operating Expenses After Fee Waiver and/or Expense Reimbursement | | | 1.36% | (a) | | | 1.11% | (a) |
(a) The adviser is contractually obligated to waive management fees and/or reimburse ordinary operating expenses, not including investment-related costs (such as brokerage commissions), interest, taxes, extraordinary expenses and acquired fund fees and expenses, through February 28, 2014, to the extent that operating expenses exceed 1.35% of the Fund’s average daily net assets with respect to Class N shares and 1.10% of the Fund’s average daily net assets with respect to Class I shares (the “Operating Expense Limit”). Prior to February 28, 2014, the arrangement may be amended or terminated for a class only by a vote of the Board of Trustees of Aston Funds. For a period of up to three years from the fiscal year end during which such amount was waived or reimbursed, the adviser is entitled to be reimbursed by the Fund for fees waived and expenses reimbursed from commencement of operations through the completion of the first three full fiscal years to the extent that the Fund’s Total Annual Operating Expenses for a class, not including investment-related costs (such as brokerage commissions), interest, taxes, extraordinary expenses and acquired fund fees and expenses, remains at or below the Operating Expense Limit after such reimbursement.
EXAMPLE
This example is intended to help you compare the cost of investing in the Fund with the cost of investing in other mutual funds. The example shows the operating expenses you would incur as a shareholder if you invested $10,000 in the Fund over the time periods shown and you redeem all your shares at the end of those periods. The example assumes that the average annual return was 5%, operating expenses remained the same and expenses were capped for one year in each period.
Although your actual costs may be higher or lower, based on the above assumptions, your costs would be:
| | | | | | | | | | | | | | | | |
| | | 1 Year | | | 3 Years | | | 5 Years | | | 10 Years | |
Class N Shares | | $ | 138 | | | $ | 746 | | | $ | 1,380 | | | $ | 3,086 | |
Class I Shares | | | 113 | | | | 671 | | | | 1,255 | | | | 2,842 | |
PORTFOLIO TURNOVER
The Fund pays transaction costs, such as commissions, when it buys and sells securities (or “turns over” its portfolio). A higher portfolio turnover rate may indicate higher transaction costs and may result in higher taxes when Fund shares are held in a taxable account. These costs, which are not reflected in annual Fund operating expenses or in the example, affect the Fund’s performance. During the most recent fiscal year, the Fund’s portfolio turnover rate was 168.05%.
|
| ASTON/LMCG Small Cap Growth Fund | 3 |
PRINCIPAL INVESTMENT STRATEGIES
Under normal circumstances, the Fund invests at least 80% of its assets in common stocks and other equity securities of small-cap companies. The Fund defines a small-cap company as one with a market capitalization below $3 billion at the time of acquisition. The portfolio manager seeks to achieve above average risk-adjusted returns by identifying unrecognized growth potential. The portfolio manager utilizes a fundamental bottom-up security selection process to identify characteristics such as: revenue growth, margin expansion, surprise potential and strong balance sheets. The focus of the fundamental research process is to confirm that the growth is durable and sustainable, as well as to conduct due diligence on the key drivers of each security. The final step in the process applies a valuation framework to each security that meets the criteria of the fundamental research process.
The Fund may also invest in mid-cap stocks, including companies with a market capitalization up to $10 billion at the time of acquisition.
To manage risk, the portfolio manager limits position sizes, employs a strategy of diversification, and adheres to a structured sell discipline based on fundamental drivers and company valuations.
PRINCIPAL RISKS
You could lose money by investing in the Fund. There can be no assurance that the Fund’s investment objective will be achieved. The following is a summary of the principal risks of investing in the Fund.
Growth Style Risk. Growth investing involves buying stocks that have relatively high price-to-earnings ratios. Growth stocks may be more volatile than other stocks because they are generally more sensitive to investor perceptions and market moves. During periods of growth stock underperformance, the Fund’s performance may suffer.
Liquidity Risk. When there is no willing buyer and investments cannot be readily sold at the desired time or price, the Fund may need to accept a lower price or may not be able to sell the security at all. An inability to sell securities can adversely affect the Fund’s value or prevent the Fund from being able to take advantage of other investment opportunities. Less liquid securities are more difficult to dispose of at their recorded values and are subject to increased spreads and volatility.
Manager Risk. The performance of the Fund is dependent upon the investment adviser’s skill in selecting managers and the portfolio manager’s skill in making appropriate investments. As a result, the Fund may underperform its benchmark or its peers.
Market Risk. The Fund’s share price can move down in response to stock market conditions, changes in the economy or changes in a particular company’s stock price. An individual stock may decline in value even when the value of stocks in general is rising.
Portfolio Turnover Risk. Frequent trading of the Fund’s portfolio holdings may result in a higher than average level of capital gains, including short-term gains, and will result in greater transaction costs to the Fund. To the extent distributions to shareholders are made from net short-term capital gains (i.e., net capital gain on securities held or treated as held by the Fund for one year or less minus any net capital losses on securities held or treated as held by the Fund for more than one year), the distributions will be taxed at ordinary income rates for federal income tax purposes, rather than at the lower long-term capital gains rates. Greater transaction costs and higher expenses as a result of portfolio turnover can negatively impact the Fund’s performance.
Small-Cap and Mid-Cap Company Risk. Investing in securities of small-cap and mid-cap companies may involve greater risks than investing in securities of larger, more established issuers. Small-cap and mid-cap companies generally have limited product lines, markets and financial resources. Their securities may trade less frequently and in more limited volume than the securities of larger, more established companies. Also, small-cap and mid-cap companies are typically subject to greater changes in earnings and business prospects than larger companies. As a result, their stock prices may experience greater volatility and may decline significantly in market downturns.
|
| ASTON/LMCG Small Cap Growth Fund | 4 |
FUND PERFORMANCE
The bar chart shows how the performance of the Class N shares of the Fund has varied from year to year over the periods shown. Class N shares and Class I shares are invested in the same portfolio of securities, so the annual returns would differ only to the extent that the classes have different expenses. The annual returns of the Class I shares would be higher than the returns of the Class N shares due to 12b-1 fees paid by Class N shares. This information may help illustrate the risks of investing in the Fund. The Fund makes updated performance information available on the Fund’s website, www.astonfunds.com, or by calling 800-992-8151. As with all mutual funds, past performance (before and after taxes) does not guarantee future performance.
Class N Shares
Calendar Year Total Return
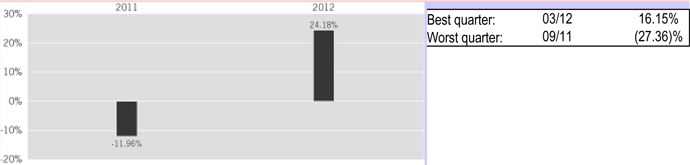
The following table indicates how the Fund’s average annual returns for different calendar periods compared to the returns of a broad-based securities market index.
Average Annual Total Returns
(For the periods ended December 31, 2012)
| | | | | | |
| | | ASTON/LMCG Small Cap Growth Fund | |
| | | 1 Year | | Since Inception | |
Class N Shares (Inception 11/03/10): | | | | | | |
Return Before Taxes | | 24.18% | | | 9.09 | % |
Return After Taxes on Distributions | | 21.31% | | | 7.92 | % |
Return After Taxes on Distributions and Sale of Fund Shares | | 16.07% | | | 7.16 | % |
Class I Shares (Inception 6/1/11): | | | | | | |
Return Before Taxes | | 24.43% | | | (1.43 | )% |
| Russell 2000 Growth Index (Reflects no deduction for taxes, expenses or fees. Index return since inception for Class N shares is computed from October 31, 2010. Index return for Class I shares, since inception, computed from 05/31/11, is 0.16%.) | | 14.59% | | | 10.81 | % |
As of February 28, 2013, the Fund changed its name from ASTON Small Cap Growth Fund to ASTON/LMCG Small Cap Growth Fund. As of February 17, 2012, the Fund changed its name from ASTON/Crosswind Small Cap Growth Fund to ASTON Small Cap Growth Fund and Lee Munder Capital Group, LLC (“LMCG” or the “Subadviser”)) became the subadviser. Performance prior to that date reflects the performance of a previous subadviser. However, Mr. Morey has served as the Fund’s portfolio manager since its inception.
After-tax returns are calculated using the historical highest individual federal marginal income tax rates and do not reflect the impact of state and local taxes. After-tax returns depend on an investor’s tax situation and may differ from those shown. After-tax returns shown are not relevant to investors who hold their shares through tax-deferred arrangements, such as 401(k) plans or individual retirement accounts. After-tax returns are shown only for Class N shares. After-tax returns for Class I shares will vary.
|
| ASTON/LMCG Small Cap Growth Fund | 5 |
MANAGEMENT
Aston Asset Management, LP serves as the investment adviser to the Fund. LMCG serves as the subadviser to the Fund.
Mr. Andrew Morey, CFA, lead portfolio manager for LMCG’s small-and small/mid-cap investment strategies, has served as the Fund’s Portfolio Manager since the Fund’s inception in November 2010.
PURCHASE AND SALE OF FUND SHARES
Shares of the Fund may be purchased, exchanged, or redeemed on any business day by written request (Aston Funds, P.O. Box 9765, Providence, RI 02940), wire transfer, online access (www.astonfunds.com), or by telephone (800-992-8151). Investors who wish to purchase, exchange or redeem Fund shares through a broker-dealer should contact the broker-dealer directly.
| | | | |
| Class and Account Type | | Minimum
Initial Investment | | Subsequent Investments |
Class N - Regular Accounts | | $2,500 | | $50 |
Individual Retirement Accounts (IRAs) | | $500 | | $50 |
Education Savings Accounts (ESAs) | | $500 | | $50 |
Custodial Accounts for Minors (UGMA/UTMA) | | $500 | | $50 |
Class I - Institutional Accounts | | $1 Million | | $50 |
TAX INFORMATION
The Fund’s distributions are generally taxable as ordinary income or capital gains for federal income tax purposes, unless you are investing through a tax-deferred account such as a 401(k) or individual retirement account. Distributions on investments made through tax-deferred vehicles, such as 401(k) plans or IRAs, may be taxed later upon withdrawal of assets from those plans or accounts.
PAYMENTS TO BROKER-DEALERS AND OTHER FINANCIAL INTERMEDIARIES
If you purchase shares of the Fund through a broker-dealer or other financial intermediary (such as a bank), the Fund and its related companies may pay the intermediary for the sale of shares and related services. These payments may create a conflict of interest by influencing the broker-dealer or other intermediary and your salesperson to recommend the Fund over another investment. Ask your salesperson or visit your financial intermediary’s website for more information.
|
| ASTON/LMCG Small Cap Growth Fund | 6 |
Additional Information Regarding Investment Strategies
The Fund’s non-fundamental investment policies may be changed by the Board of Trustees without shareholder approval. The Fund has adopted a non-fundamental investment policy of investing at least 80% of its assets in the type of investments suggested by its name in accordance with Rule 35d-1 of the Investment Company Act of 1940, as amended (“the 1940 Act”). Pursuant to such rule, shareholders will receive at least 60 days’ notice of a change in such policy.
The Fund generally intends to purchase securities for long-term investment. However, the Fund may at times purchase securities in anticipation of relatively short-term gains. The Fund may trim its position in a security or eliminate a security from its portfolio for various reasons, including in connection with the Fund’s liquidity requirements, as a result of the security having reached a target price ratio or yield objective determined by the Subadviser, the Subadviser’s loss of confidence in the company’s management, the Subadviser’s belief that another security offers a better opportunity, or by reason of an unforeseen economic or other development. The Fund may also sell a security and simultaneously purchase the same or a comparable security to take advantage of short-term differentials in securities prices.
In addition to the principal investment strategies described in the Fund Summary, there may be times when the Fund uses secondary investment strategies in seeking to achieve its investment objective. Information regarding such secondary strategies, as well as additional information regarding certain principal strategies (as designated by an asterisk), is shown below.
Defensive Strategy
There may be times when the Fund takes temporary positions that may not follow its principal investment strategies for defensive reasons. This includes investing all or a portion of its total assets in cash or cash equivalents, such as money market securities and repurchase agreements. Although the Fund would do this in seeking to avoid losses, following a defensive strategy could reduce the benefit from any market upswings.
Depositary Receipts of Foreign Securities
Depositary receipts represent ownership of securities in foreign companies and are held in banks and trust companies. They can include American Depositary Receipts (“ADRs”), which are traded on U.S. exchanges and are U.S. dollar-denominated, European Depositary Receipts (“EDRs”), which are traded on European exchanges and may not be denominated in the same currency as the security they represent, and Global Depositary Receipts (“GDRs”), which are issued globally and evidence a similar ownership arrangement.
Although ADRs, EDRs and GDRs do not eliminate the risks inherent in investing in the securities of foreign issuers, which include market, political, currency and regulatory risk, by investing in ADRs, EDRs or GDRs rather than directly in securities of foreign issuers, the Fund may avoid currency risks during the settlement period for purchases or sales. In general, there is a large, liquid market in the United States for many ADRs. The information available for ADRs is subject to the accounting, auditing and financial reporting standards of the domestic market or exchange on which they are traded, in which standards are more uniform and more exacting than those to which many foreign issuers may be subject. The Fund may invest in ADRs sponsored or unsponsored by the issuer of the underlying security. In the case of an unsponsored ADR, the Fund may bear higher expenses and encounter greater difficulty in receiving shareholder communications than it would have with a sponsored ADR.
|
| ASTON/LMCG Small Cap Growth Fund | 7 |
Additional Information (cont’d)
Equity Securities*
Equity securities represent a share of an issuer’s earnings and assets, after the issuer pays its liabilities. The Fund cannot predict the income it will receive from equity securities because issuers generally have discretion as to the payment of any dividends or distributions. However, equity securities offer greater potential for appreciation than many other types of securities, because their values may increase with the value of the issuer’s business. Types of equity securities include common stocks, preferred stocks, warrants and rights, convertible securities and other securities that represent underlying local shares, such as depositary receipts.
ETFs
An ETF is an investment company that seeks to track the performance of an index by holding in its portfolio shares of all the companies, or a representative sample of the companies, that are components of a particular index. ETFs are traded on a securities exchange based on their market value. When a Fund invests in another investment company, shareholders of the Fund bear their proportionate share of the other investment company’s fees and expenses, including operating, registration, trustee, licensing and marketing, as well as their share of the Fund’s fees and expenses.
REITs
REITs are generally publicly traded entities that invest in office buildings, apartment complexes, industrial facilities, shopping centers and other commercial spaces. REITs are pooled investment vehicles that typically invest directly in real estate, in mortgages and loans collateralized by real estate, or in a combination of the two. Equity REITs invest primarily in real estate that produces income from rentals. Mortgage REITs invest primarily in mortgages and derive their income from interest payments. REITs usually specialize in a particular type of property and may concentrate their investments in particular geographical areas. REITs issue stocks and most REIT stocks trade on the major stock exchanges or over-the-counter.
|
| ASTON/LMCG Small Cap Growth Fund | 8 |
Portfolio Holdings
A description of the policies and procedures with respect to the disclosure of the Fund’s portfolio holdings is available in the Statement of Additional Information (“SAI”) and on our website at www.astonfunds.com.
|
| ASTON/LMCG Small Cap Growth Fund | 9 |
Investment Terms
The following is a list of terms with definitions that you may find helpful as you read this prospectus.
American Depositary Receipts (ADRs). ADRs represent ownership of securities in foreign stock and are issued by U.S. banks and trust companies. ADRs are denominated in U.S. dollars and are traded on a U.S. exchange.
Bottom-Up Investing. Bottom-up investing is an investing approach in which securities are researched and chosen individually with less consideration given to economic or market cycles.
Diversification. Diversification is the practice of investing in a broad range of securities to reduce risk.
Equity Securities. Equity securities are ownership interests in corporations and other entities, such as common stocks, preferred stocks, convertible securities, rights and warrants.
European Depositary Receipts (EDRs). EDRs represent ownership of securities in foreign stock and are issued by a foreign bank. EDRs are generally denominated in foreign currencies and may not be denominated in the same currency as the securities they represent. Generally, EDRs are designed for use in the foreign securities markets.
Exchange-Traded Fund (ETF). An ETF is an investment company that seeks to track the performance of an index by holding in its portfolio either the contents of the index or a representative sample of the securities in the index.
Expense Ratio. A fund’s expense ratio is its cost of doing business, expressed as a percentage of its net assets and disclosed in a prospectus.
Fundamental Analysis. Fundamental analysis involves assessing whether a particular stock or group of stocks is undervalued or overvalued at its current market price based on an analysis of the balance sheet and income statement of the company. Fundamental analysis considers various historical financial statistics or metrics such as return on equity, free cash flow, price-to-earnings ratio, and similar measures to determine future trends in a company’s stock.
Global Depositary Receipts (GDRs). GDRs represent ownership of securities in foreign stock and are issued by a foreign bank. GDRs are generally denominated in foreign currencies and may not be denominated in the same currency as the securities they represent. Generally, GDRs are designed for use in the foreign securities markets.
Growth Style Investing. Growth style investing involves buying stocks of companies that are generally industry leaders with above-average, sustainable growth rates. Typically, growth stocks are the stocks of the fastest growing companies in the most rapidly growing sectors of the economy. Growth stock valuation levels (e.g., price-to-earnings ratio) will generally be higher than those of value stocks.
Investment Objective. A fund’s investment objective is the goal that an investor and a mutual fund seek together. Examples include current income, total return, long-term capital growth, etc.
Issuer. An issuer is a company, municipality or government agency that issues a security, such as a stock, bond or money market security.
Management Fee. The management fee is the amount that a mutual fund pays to the investment adviser for its services.
Market Capitalization. Market capitalization is the value of a corporation or other entity as determined by the market price of its securities.
|
| ASTON/LMCG Small Cap Growth Fund | 10 |
Investment Terms (cont’d)
Mid-Cap Stocks. Mid-cap stocks are stocks issued by mid-sized companies. Unless otherwise defined by the Fund, a mid-cap company is defined as one with a market capitalization between $1.5 billion and $5 billion, which is similar to the range of the Standard & Poor’s MidCap 400 Index (S&P 400).
Mutual Fund. A mutual fund is an investment company that stands ready to buy back its shares at their current net asset value. Most mutual funds continuously offer new shares to investors.
Net Asset Value (NAV). The NAV is the per share value of a mutual fund, found by subtracting the fund’s liabilities from its assets and dividing by the number of shares outstanding. Mutual funds calculate their NAVs at least once a day.
Real Estate Investment Trusts (REITs). REITs are pooled investment vehicles that typically invest directly in real estate, in mortgages and loans collateralized by real estate, or in a combination of the two.
Risk/Reward Trade-Off. Risk/reward trade-off is the principle that an investment must offer higher potential returns as compensation for the likelihood of increased volatility.
Small-Cap Stocks. Small-cap stocks are stocks issued by smaller companies. Unless otherwise defined by the Fund, a small-cap company is defined as one with a market capitalization of less than $1.5 billion, which approximates the size of the largest company in the Russell 2000 Index.
12b-1 Fee. A 12b-1 fee is a mutual fund fee, named for the SEC rule that permits it, used to pay for distribution costs (such as advertising and commissions paid to dealers) and shareholder services. If a fund has a 12b-1 fee, it is found in the fee table of its prospectus. (See “Distribution and Services Plan 12b-1 Fees” in the “Shareholder Information” Section.)
Yield. Yield is a measure of net income (dividends and interest) earned by the securities in a fund’s portfolio, less a fund’s expenses, during a specified period. A fund’s yield is expressed as a percentage of the maximum offering price per share on a specified day.
|
| ASTON/LMCG Small Cap Growth Fund | 11 |
Management of the Fund
INVESTMENT ADVISER
ASTON ASSET MANAGEMENT, LP
Aston Asset Management, LP (“Aston” or the “Adviser”), 120 N. LaSalle Street, 25th Floor, Chicago, Illinois 60602, is the investment adviser to the Fund. Aston is a majority-owned and independently managed indirect subsidiary of Affiliated Managers Group, Inc. (“AMG”). More information on AMG is available in the SAI. Aston was formed in April 2006 and as of December 31, 2012, Aston had approximately $11.5 billion in assets under management.
Aston provides investment advisory, mutual fund administration and distribution-related services to Aston Funds. Aston manages the Fund by selecting one or more other investment managers to manage the Fund’s portfolio on a subadvisory basis. Aston is responsible for identifying and selecting the Fund’s investment managers, monitoring the performance of such managers, and terminating managers. Aston manages the Fund by engaging LMCG as Subadviser to manage the Fund’s investments.
The SEC has granted an exemptive order to Aston and Aston Funds that allows Aston to allocate and reallocate the assets of the Fund between and among any subadvisers so selected pursuant to a ‘‘manager-of-managers’’ structure. Under this structure, Aston has the authority to retain and terminate subadvisers, engage new subadvisers and make material revisions to the terms of the subadvisory agreements subject to the approval of the Board of Trustees, but not shareholder approval.
GENERAL
As the investment adviser to the Fund, Aston is paid an annual management fee based on the average daily net assets of the Fund. Out of its fee, Aston pays the Subadviser of the Fund. For its advisory services, Aston is entitled to receive a management fee from the Fund at an annual rate of 1.00% based on the average daily net assets. The investment advisory agreement with Aston may be terminated at any time by the Fund or by Aston upon 60 days’ written notice to the other party. The Fund may effect termination by an action of the Board of Trustees or by a vote of a majority of the Fund’s outstanding voting securities.
A discussion regarding the basis for the Board of Trustees’ approval of the Fund’s investment advisory agreement and subadvisory agreement will be included in the Fund’s next annual or semi-annual report to shareholders following such approval.
SUBADVISER
The accompanying information highlights the Fund’s Subadviser and its portfolio manager.
Lee Munder Capital Group, LLC, 200 Clarendon Street, 28th Floor, Boston, MA 02116, was founded in August 2000. LMCG is majority-owned by Convergent Capital Management, LLC. As of December 31, 2012, LMCG had assets of approximately $5.0 billion under management.
PORTFOLIO MANAGER
Andrew Morey, CFA, has served as the Fund’s Portfolio Manager since the Fund’s inception in November 2010. Mr. Morey, portfolio manager for LMCG’s Small-and Small/Mid-Cap Growth investment strategies, joined LMCG in February 2012. Mr. Morey has 20 years of investment management experience and prior to joining LMCG, he served as portfolio manager at Crosswind Investments, LLC for Crosswind’s Small-and Small/Mid-Cap investment strategies. Previously, Mr. Morey was the founder and a portfolio manager of Tartan Partners, LLC from 2005 to 2007. Prior to Tartan Partners, Mr. Morey worked at State Street Research & Management as a portfolio manager, and at Gabelli & Co. as a research analyst. Mr. Morey holds the Chartered Financial Analyst designation.
Additional information about the portfolio manager’s compensation, other accounts managed by the portfolio manager and the portfolio manager’s ownership of securities of the Fund is available in the SAI.
|
| ASTON/LMCG Small Cap Growth Fund | 12 |
Management of the Fund (cont’d)
LMCG Small Cap Growth Related Performance
The following tables show the performance of LMCG‘s small-cap growth composite. The composite is comprised of all fully discretionary accounts in LMCG’s small-cap U.S. growth equity strategy (the “Strategy”), excluding the Fund. As of December 31, 2012, the composite was comprised of 3 accounts with assets of $37 million. The investment objective, policies and strategies of the Fund are substantially similar to those of the accounts comprising the composite.
The performance of the composite does not represent the historical performance of the Fund and should not be considered indicative of future performance of the Fund.
Effective January 2012, the portfolio manager of the composite joined LMCG. Performance for periods prior to February 2012 represent the performance that occurred while the portfolio manager was at a prior firm and not the historical results of LMCG, and there is no assurance that similar results will be achieved at LMCG. Results may differ because of, among other factors, differences in brokerage commissions, account expenses including management fees, the size of positions taken in relation to account size, diversification of the portfolio, timing of purchases and sales and availability of cash for new investment. The Fund has been advised that, as the lead portfolio manager of the Strategy at his prior firm, Mr. Morey had full discretionary authority over the selection of investments for accounts comprising the composite and no other person played a significant role in the investment decision-making process.
An independent third party, whose primary function is the verification of performance data for compliance with Global Investment Performance Standards (GIPS®) conducted a review of the track record for compliance with GIPS®. The prior firm has a written agreement with LMCG allowing its use of the performance history and supporting records.
The performance of the separate accounts presented below is not calculated using the same methodology as that which is prescribed for performance calculations used by registered investment companies. The net-of-fee returns below are calculated by deducting the standard fees, representing the highest investment management fees for the Strategy from the accounts’ gross returns. In addition, the separate accounts for which performance is presented are not subject to the same type of expenses as the Fund. If the Fund’s fees and expenses had been used in calculating the composite’s performance, the performance of the composite would have been lower.
In addition, the accounts comprising the composite are not subject to certain investment limitations, diversification requirements and other restrictions imposed by the 1940 Act and the Internal Revenue Code of 1986, as amended (the “Code”), which if applicable, may have adversely affected the performance results of the composite. The results for different products may vary.
Total Return
| | | | |
Calendar Year end | | LMCG Small Cap
Growth Composite | | Russell 2000
Growth Index |
2012 | | 23.68% | | 14.59% |
2011 | | (9.37)% | | (2.91)% |
2010 | | 32.60% | | 29.09% |
2009 | | 51.79% | | 34.47% |
2008 | | (34.01)% | | (38.54)% |
Average Annual Total Return
(For the periods ended December 31, 2012)
| | | | |
| Period | | LMCG Small Cap
Growth Composite | | Russell 2000
Growth Index |
One Year | | 23.68% | | 14.59% |
Five Year | | 8.29% | | 3.49% |
Since Inception(a) | | 8.29% | | 3.49% |
(a) Since Inception return is computed from 12/31/07.
|
| ASTON/LMCG Small Cap Growth Fund | 13 |
Shareholder Information
OPENING AN ACCOUNT
| • | Read this prospectus carefully. |
| • | Determine how much you want to invest. The minimum initial and subsequent investment requirements for the applicable class of the Fund are as follows: |
| | | | |
| Class and Account Type | | Minimum Initial Investment | | Subsequent Investments |
Class N - Regular Accounts | | $2,500 | | $50 |
Individual Retirement Accounts (IRAs) | | $500 | | $50 |
Education Savings Accounts (ESAs) | | $500 | | $50 |
| Uniform Gift to Minor Accounts/Uniform Transfer to Minor Accounts (UGMA/UTMA) | | $500 | | $50 |
Class I - Institutional Accounts | | $1 Million | | $50 |
| • | Minimum initial investment requirements may be waived: |
| | - | For trustees of Aston Funds, employees of Aston, Aston’s employees’ spouses, employees of LMCG, LMCG’s employees’ spouses, and affiliates of Aston. |
| | - | By means of a “letter of intent” from an investor or financial adviser/consultant expressing intent to purchase shares over a specified period of time to meet the minimum investment requirement (Class I only). |
| | - | For certain omnibus accounts, mutual fund advisory platforms and registered investment advisors, banks, trust companies or similar financial institutions investing for their own accounts or for the accounts of their clients or customers for whom such institution is exercising investment discretion, or otherwise acting on behalf of clients or customers. |
| | - | For individual accounts of a financial intermediary that charges an ongoing fee to its customers for its services or offers Fund shares through a no-load network or platform, and for accounts invested through fee-based advisory accounts, certain “wrap” programs and similar programs with approved financial intermediaries. |
| | - | By Aston Funds at its discretion. |
| • | Balances within the same Fund may be aggregated to meet the Class I minimum initial investment requirements for the accounts of: |
| | - | Clients of a financial adviser/consultant or clients of a financial intermediary that acts in an advisory capacity. |
| | - | Immediate family members (i.e., an individual’s spouse, parents, children, siblings and in-laws). |
| | - | A corporation or other legal entity. |
| • | Complete the account application and carefully follow the instructions. If you have any questions, please call 800-992-8151. Remember to complete the “Purchase, Exchange and Redemption Authorization” section of the account application to establish your account privileges, and to avoid any delay and inconvenience of needing to request these in writing at a later date. |
| • | Purchase, exchange and redemption requests (each an “Investment Request”) must be in “good order.” Investment Requests received in “good order” and processed before the New York Stock Exchange (the “NYSE”) market close, typically 4:00 p.m. Eastern Time (“ET”), receive that business day’s closing NAV. Investment Requests received after that time receive the following business day’s NAV. |
| • | An Investment Request received that is not in “good order” will receive the NAV on the date the Investment Request is received in “good order.” |
|
| ASTON/LMCG Small Cap Growth Fund | 14 |
Shareholder Information (cont’d)
An Investment Request is in “good order” when:
| • | The account number and Fund name are included; |
| • | The amount of the transaction is specified in dollars or shares; |
| • | Signatures of all owners appear exactly as they are registered on the account in original form, as photocopies are not acceptable; |
| • | Any required Medallion Signature Guarantees are included; and |
| • | Other supporting legal documents (as necessary) are present, including such “Requirements for Written Requests” as described later in this “Shareholder Information” Section. |
Make your initial investment using the following table as a guideline. If your Investment Request is your initial purchase into the Fund, your account number will be assigned to you upon the Fund’s receipt of the Investment Request in “good order.”
| | |
| TO OPEN AN ACCOUNT | | TO ADD TO AN ACCOUNT ($50 MINIMUM) |
| Buying Shares Through Your Financial Representative |
¡ Your financial representative is responsible for transmitting the order promptly. | | ¡ Your financial representative is responsible for transmitting the order promptly. |
Buying Shares By Mail: Aston Funds n P.O. Box 9765 n Providence, RI 02940 Buying Shares Via Overnight Delivery: Aston Funds n 4400 Computer Drive n Westborough, MA 01581 |
¡ Complete and sign your application. ¡ We accept checks, bank drafts and money orders for purchases. Checks must be drawn on U.S. banks. There is a charge of a minimum of $20 for returned checks. Please see “Other Features” later in this “Shareholder Information” Section. ¡ Make checks payable to Aston Funds and mail them to the address listed above. ¡ We do not accept cash travelers checks, temporary checks, post-dated checks, credit card courtesy checks or second/third party checks (which are checks made payable to someone other than the Fund, including you). ¡ If you anticipate the need to make subsequent trades via telephone or via bank transfer (wire transfer or ACH transfer), please indicate that in the “Purchase, Exchange and Redemption Authorizations” section of your account application. ¡ If you have indicated on your account application that you intend to make trades in your account via ACH bank transfer, please verify that your bank or credit union is a member of the ACH (Automated Clearing House). | | ¡ Return the investment slip from a statement with your check in the envelope provided and mail to us at the above address. ¡ We accept checks, bank drafts, money orders, wires and ACH for purchases. Checks must be drawn on U.S. banks. There is a charge of a minimum of $20 for returned checks. Please see “Other Features” later in this “Shareholder Information” Section. ¡ Make checks payable to Aston Funds and mail them to the address listed above. ¡ We do not accept cash, travelers checks, temporary checks, post-dated checks, credit card courtesy checks or second/third party checks (which are checks made payable to someone other than the Fund, including you). ¡ For purchases via bank wire transfer or ACH transfer, give the following wire/ACH information to your bank: The Bank of New York Mellon ABA #011001234 For: Aston Funds A/C 0000733296 FBO “Aston Fund Number” “Your Account Number” “Your Name” ¡ For your protection, our current Internet capabilities allow Class N and Class I shareholders to check balances and transfer monies only between Aston Funds in the same class. Please contact us via mail with a signed letter of instruction for all other changes to your account. |
|
| ASTON/LMCG Small Cap Growth Fund | 15 |
Shareholder Information (cont’d)
| | |
| TO OPEN AN ACCOUNT | | TO ADD TO AN ACCOUNT ($50 MINIMUM) |
| Buying Shares By Phone: 800-992-8151 |
¡ You cannot open an account over the phone. | | ¡ When you are ready to add to your account, call Aston Funds and tell the representative the Fund name, account number, the name(s) in which the account is registered and the amount of your investment. ¡ To place your request with an Investor Services Associate, call between 9:00 a.m. and 7:00 p.m. ET, Monday-Friday. ¡ Trade authorizations via telephone or via bank must be valid and on file, as indicated on the “Purchase, Exchange and Redemption Authorizations” section of your account application. ¡ For purchases via bank wire or ACH transfer, instruct your bank to wire or ACH transfer the amount of your investment and provide your bank with the below information. Your bank may charge a fee for wire or ACH transfers: The Bank of New York Mellon ABA #011001234 For: Aston Funds A/C 0000733296 FBO “Aston Fund Number” “Your Account Number” “Your Name” |
| Buying Shares By Internet: www.astonfunds.com |
(Class N shares only*) ¡ To open a new account you’ll need to provide bank account information plus the social security number and date of birth for each account owner and beneficiary. ¡ Open an account online by completing the Aston Funds online account application. or Class N and Class I shares) ¡ Download the appropriate account application(s) from the website. Complete and sign the application(s). Make your check payable to Aston Funds and mail it to the address under “By Mail” above. | | ¡ Complete the “Purchase, Exchange and Redemption Authorization” section of your account application. ¡ Self-register for online account access at www.astonfunds.com. Your social security number or employer identification number, account number and other security validating information will be required for registration. ¡ When you are ready to add to your account, access your account through Aston Funds’ website and enter your purchase instructions in the secure area for shareholders only called “Shareholder Account Access.” ACH purchases on the Internet may take 3 or 4 business days. ¡ For your protection, our current Internet capabilities allow Class N and Class I shareholders to check balances and transfer monies only between Aston Funds in the same class. Please contact us via mail with a signed letter of instruction for all other changes to your account. |
*Class I shares are not eligible for the establishment of new accounts through the Aston Funds website.
The Fund or its agents will not be responsible for any unauthorized telephone or online order when reasonable procedures designed to verify the identity of the investor are followed.
|
| ASTON/LMCG Small Cap Growth Fund | 16 |
Shareholder Information (cont’d)
Other Aston Funds and share classes may be available through separate prospectuses. Please call 800-992-8151 for more information.
EXCHANGING SHARES
When you exchange your shares, you authorize the sale of your shares in one fund to purchase shares of another fund. In other words, you are requesting a sale and then a purchase. The exchange of your shares may be a taxable event for federal income tax purposes if the shares are not held in a tax-deferred account and may subject you to a redemption fee. After you have opened an account with us, you can exchange your shares within Aston Funds to meet your changing investment goals or other needs. This privilege is not designed for frequent trading (which may subject you to a redemption fee) and may be difficult to implement in times of drastic market changes.
You can exchange shares from one Aston Fund to another within the same class of shares. All exchanges to open new accounts must meet the minimum initial investment requirements. Exchanges may be made by mail, through the Internet or by phone at 800-992-8151 if you chose this option when you opened your account.
In addition, the Aston Money Market Fund – Bedford Shares of the Money Market Portfolio of The RBB Fund, Inc. offered in connection with the Aston Funds (the “Aston Money Market Fund”) is available as an exchange option for shareholders of the Aston Funds Class N shares. The Aston Money Market Fund prospectus, including applicable investment minimums, is available by contacting Aston Funds by mail, through the Internet or by phone at 800-992-8151. Please read the Aston Money Market Fund prospectus carefully before investing.
For federal income tax purposes, each exchange into a different fund is treated as a sale and a new purchase. As a result, an investor holding shares in a non-tax-deferred account is generally subject to federal income tax on any appreciation on the shares exchanged.
Aston Funds reserves the right to limit, impose charges upon, terminate or otherwise modify the exchange privilege by sending written notice to shareholders. All exchange requests must be in “good order.”
Aston Funds may allow eligible shareholders to convert their shares between classes within the same Fund, for example from Class I to Class N or vice versa, if offered in the shareholder’s state of residence. No sales charges or other charges will apply to any such exchange. For federal income tax purposes, a same-fund exchange is not expected to result in the recognition by the investor of a capital gain or loss.
SELLING/REDEEMING SHARES
You can sell your shares to meet your changing investment goals or other needs. All redemption requests must be in “good order.” The following table shows guidelines for selling shares.
|
| ASTON/LMCG Small Cap Growth Fund | 17 |
Shareholder Information (cont’d)
| | |
| APPLIES TO | | TO SELL SOME OR ALL OF YOUR SHARES |
| Selling Through Your Financial Representative |
¡ All share classes and accounts of any type. | | ¡ Your financial representative is responsible for transmitting the order promptly. |
Selling Shares By Mail: Aston Funds n P.O. Box 9765 n Providence, RI 02940 Selling Shares Via Overnight Delivery: Aston Funds n 4400 Computer Drive n Westborough, MA 01581 |
¡ All share classes and accounts of any type. ¡ For sales or redemptions of any size please see the “Medallion Signature Guarantees” Section, later in this “Shareholder Information” Section, to determine if a Medallion Signature Guarantee is required for your transaction. | | ¡ Write and sign a letter of instruction indicating the Fund name, Fund number, your account number, the name(s) in which the account is registered and the dollar value or number of shares you wish to sell. ¡ Include all signatures and any additional documents that may be required. Signatures must be in original form, as photocopies are not accepted. Please see “Selling Shares in Writing” later in this “Shareholder Information” Section). ¡ Mail to us at the address above. ¡ A check will be mailed to the name(s) and address in which the account is registered. If you would like the check mailed to a different address, you must write a letter of instruction and have it Medallion Signature Guaranteed. ¡ Proceeds may also be sent by wire or ACH. Please see “Other Features” later in this “Shareholder Information” Section. |
| Selling Shares By Phone: 800-992-8151 |
¡ Class N and Class I non-retirement accounts. ¡ Sales of up to $50,000 (for accounts with telephone account privileges). | | ¡ For automated service 24 hours a day using your touch-tone phone, call 800-992-8151. ¡ To place your request with an Investor Services Associate, call between 9:00 a.m. and 7:00 p.m. ET, Monday-Friday. ¡ A check will be mailed to the name(s) and address to which the account is registered. If you would like the check to be mailed to a different address, you must write a letter of instruction and have it Medallion Signature Guaranteed. ¡ Proceeds may also be sent by wire or ACH. Please see “Other Features” later in this “Shareholder Information” Section. ¡ The Fund reserves the right to refuse any telephone sales request and may modify the procedures at any time. The Fund makes reasonable attempts to verify that telephone instructions are genuine, but you are responsible for any loss that you may incur from telephone requests. |
|
| ASTON/LMCG Small Cap Growth Fund | 18 |
Shareholder Information (cont’d)
| | |
| APPLIES TO | | TO SELL SOME OR ALL OF YOUR SHARES |
| Selling Shares By Internet: www.astonfunds.com |
¡ Class N and Class I non-retirement accounts. | | ¡ Complete the “Purchase, Exchange and Redemption Authorization” section of your account application. ¡ Self-register online for account access at www.astonfunds.com. Your social security number or employer identification number, account number and other security validating information will be required for registration. ¡ When you are ready to redeem a portion of your account, access your account through Aston Funds’ website and enter your redemption instructions in the secure area for shareholders only called “Shareholder Account Access.” A check for the proceeds will be mailed to you at your address of record. ¡ Proceeds may also be sent by wire or ACH. Please see “Other Features” later in this “Shareholder Information” Section. |
The Fund or its agents will not be responsible for any unauthorized telephone or online order when reasonable procedures designed to verify the identity of the investor are followed.
Selling Shares in Writing
In certain circumstances, you must make your request to sell shares in writing. You may need to include a Medallion Signature Guarantee (which protects you against fraudulent orders) and additional items with your request, as described in the following Medallion Signature Guarantee section.
Medallion Signature Guarantees
¡We require Medallion Signature Guarantees if:
¡Your address of record has changed within the past 30 days;
¡You are selling more than $50,000 worth of shares; or
¡You are requesting payment other than by a check mailed to the address of record and payable to the registered owner(s) or other than by wire or ACH sent to the bank account of the registered owner(s).
¡What is a Medallion Signature Guarantee?
A Medallion Signature Guarantee verifies the authenticity of your signature and may be obtained from a domestic bank or trust company, broker, dealer, clearing agency, savings association or other financial institution that participates in a Medallion Program recognized by the Securities Transfer Association.
Medallion Signature Guarantees help ensure that major transactions or changes to your account are in fact authorized by you. For example, we require a Medallion Signature Guarantee on written redemption requests for more than $50,000. The three recognized Medallion Programs are Securities Transfer Agents Medallion Program (STAMP), Stock Exchanges Medallion Program (SEMP) and New York Stock Exchange, Inc. Medallion Signature Program (NYSE MSP). Signature guarantees from financial institutions that do not participate in one of these programs will not be accepted.
A notary public stamp or seal cannot be substituted for a Medallion Signature Guarantee.
|
| ASTON/LMCG Small Cap Growth Fund | 19 |
Shareholder Information (cont’d)
| | |
| Seller | | Requirements for Written Requests |
| Owners of individual, joint, sole proprietorship, UGMA/UTMA, or general partner accounts | | • Letter of instruction • On the letter, the signatures and titles of all persons authorized to sign for the account, exactly as the account is registered, must be in original form, as photocopies are not accepted • Medallion Signature Guarantee, if applicable (see above) |
| Owners of corporate or association accounts | | • Letter of instruction • On the letter, the signatures and titles of all persons authorized to sign for the account, exactly as the account is registered, must be in original form, as photocopies are not accepted • Medallion Signature Guarantee, if applicable (see above) |
| Owners or trustees of trust accounts | | • Letter of instruction • On the letter, the signature of the trustee(s) must be in original form, as photocopies are not accepted • If the names of all trustees are not registered on the account, a copy of the trust document certified within the past 12 months • Medallion Signature Guarantee, if applicable (see above) |
| Joint tenancy shareholders whose co-tenants are deceased | | • Letter of instruction signed by the surviving tenant must be in original form, as photocopies are not accepted • Certified copy of death certificate • Medallion Signature Guarantee, if applicable (see above) |
| Executors of shareholder estates | | • Letter of instruction signed by executor must be in original form, as photocopies are not accepted • Certified copy of order appointing executor • Medallion Signature Guarantee, if applicable (see above) |
| Administrators, conservators, guardians and other sellers or account types not listed above | | • Call 800-992-8151 for instructions • Medallion Signature Guarantee, if applicable (see above) |
| IRA accounts | | • IRA distribution request form completed and signed. Call 800-992-8151 for a form, or download a form from our website, www.astonfunds.com. |
In addition to the situations described above, Aston Funds may require Medallion Signature Guarantees in other circumstances based on the amount of the redemption request or other factors.
Other Features
The following other features are also available to buy and sell shares of the Fund.
Wire. To purchase and sell shares via the Federal Reserve Wire System:
| • | You must authorize Aston Funds to honor wire instructions before using this feature. Complete the appropriate section on the application when opening your account or call 800-992-8151 to add the feature after your account is opened. Call 800-992-8151 before your first use to verify that this feature is set up on your account. |
| • | To sell shares by wire, you must designate the U.S. commercial bank account(s) into which you wish the redemption proceeds deposited. |
For accounts with existing wire instructions, wire redemptions may be placed over the phone. Consult your banking institution for any fees it may charge associated with wire transfers. Any changes made to existing wire instructions will only be accepted with a Medallion Signature Guaranteed letter of instruction.
|
| ASTON/LMCG Small Cap Growth Fund | 20 |
Shareholder Information (cont’d)
Automated Clearing House (ACH). To transfer money between your bank account and your Aston Funds account(s):
| • | You must authorize Aston Funds to honor ACH instructions before using this feature. Complete the appropriate section on the application when opening your account or call 800-992-8151 to add the feature after your account is opened. Call 800-992-8151 before your first use to verify that this feature is set up on your account. |
| • | Most transfers are completed within three business days of your call. ACH purchases will receive the NAV calculated on the day the money is received. |
| • | There is no fee to your mutual fund account for this transaction. |
Redemptions in Kind
The Fund has elected, under Rule 18f-1 under the 1940 Act, as amended, to pay sales proceeds in cash up to $250,000 or 1% of the Fund’s total value, whichever is less, during any 90-day period to any one shareholder.
Larger redemptions may be detrimental to existing shareholders. While we intend to pay all sales proceeds in cash, we reserve the right to make higher payments to you in the form of certain marketable securities of the Fund. This is called “redemption in kind.” You may need to pay certain sales charges related to a redemption in kind, such as brokerage commissions, when you sell the securities. For shares that are not held in a tax deferred account, redemptions in kind are taxable events for federal income tax purposes in the same manner as when the sales proceeds are paid in cash.
Involuntary Redemptions
To reduce expenses, we may convert your Fund position(s), redeem your Fund position(s) and/or close your Fund position(s) if the balance in your Fund position(s) falls below the required investment minimum due to transaction activity or for any other reason. We may convert your position(s) in Class I shares of the Fund to the respective Class N shares of the Fund, if applicable. Unless you did not meet the minimum initial investment, we will give you 30 days’ notice before we convert, redeem, or close your Fund position(s). This gives you an opportunity to purchase enough shares to raise the value of your Fund position(s) above the applicable minimum initial investment. We will not redeem or close Fund position(s) in IRAs, Education Savings Accounts, custodial accounts for minors, or active Automatic Investment Plans because they do not meet the applicable minimum investment requirement. We may close Fund position(s) in IRAs, Education Savings Accounts, custodial accounts for minors, or active Automatic Investment Plans due to insufficient information as it relates to customer identification procedures. If these account types are invested in Class I shares below the required minimum investment, we may convert the Fund position(s) to the Class N. Additionally, we will not convert Class I accounts where there is an effective “letter of intent.” Redemption fees will not be assessed on involuntary redemptions or involuntary conversions.
TRANSACTION POLICIES
Calculating Share Price
When you buy, exchange, or sell shares, the NAV next determined is used to price your purchase or sale. The NAV for each share class of the Fund is determined each business day at the close of regular trading on the NYSE (typically 4:00 p.m. ET) by dividing the net assets of the class by the number of its shares outstanding. Currently, the Fund observes the following holidays: New Year’s Day, Martin Luther King, Jr. Day, Presidents’ Day, Good Friday, Memorial Day, Independence Day, Labor Day, Thanksgiving Day and Christmas Day. Generally, securities are priced using market quotes or, for debt securities, evaluated prices obtained from independent pricing services. If market quotations are not available or are deemed unreliable, securities are valued at fair value as determined by the Adviser in accordance with guidelines adopted and periodically reviewed by the Board of Trustees. These circumstances may arise, for instance, when trading in a security is suspended, the exchange or market on which a security is
|
| ASTON/LMCG Small Cap Growth Fund | 21 |
Shareholder Information (cont’d)
traded closes early, or the trading volume in a security is limited, calling into question the reliability of market quotations. In such a case, the Fund’s value for a security may be different from the last quoted market price. Fair value pricing for certain types of securities in which the Fund may invest, including prices received from pricing services, is inherently a process of estimates and judgments. Changes in the value of portfolio investments priced at fair value may be less frequent and of greater magnitude than changes in the price of securities that trade frequently in the market place, resulting in potentially greater net asset value volatility. In addition, due to the subjective and variable nature of fair value pricing, it is possible that the fair value determined for a particular security may be materially different from the value realized upon such security’s sale. Since 2008, certain segments of the mortgage-backed securities market, in particular, have been volatile and difficult to value.
Quotations of foreign securities denominated in foreign currency are converted to U.S. dollar equivalents using foreign exchange quotations received from independent dealers. Events affecting the values of portfolio securities that occur between the time when their prices are determined and the close of regular trading on the NYSE may not be reflected in the calculation of NAV. If events materially affecting the value of such securities occur during such period, then these securities may be valued at fair value as determined by the Adviser in accordance with guidelines adopted by the Aston Funds Board of Trustees.
The Fund may invest in certain securities which are primarily listed on foreign exchanges that trade on weekends and other days when the Fund does not price its shares. Therefore, the value of the Fund’s holdings may change on days when you will not be able to purchase or redeem its shares.
In addition, changes in values in the U.S. market subsequent to the close of a foreign market may affect the values of securities traded in the foreign market. Under the Fund’s fair value pricing policies, the values of foreign securities may be adjusted from their last closing prices if such movements in the U.S. market exceed a specified threshold. As a result of the foregoing, it is possible that fair value prices will be used by the Fund to a significant extent. The Fund has retained an independent statistical fair value pricing service to assist in the fair valuation of securities principally traded in a foreign market in order to adjust for possible changes in value that may occur between the close of the foreign exchange and the time as of which Fund shares are priced.
Execution of Requests
The Fund is open on each business day that the NYSE is open for trading. The NYSE is not open on weekends or national holidays. Investment requests are executed at the NAV next calculated after Aston Funds or an authorized broker or designee receives your mail, telephone or Internet request in “good order.” Purchase orders and redemption requests must be received by the close of regular trading on the NYSE (typically 4:00 p.m. ET) for same day processing. On days when the Federal Reserve Cash Settlement System closes earlier than normal, these times may be accelerated. Sales proceeds are normally sent the next business day, but are always sent within seven days of receipt of a request in “good order.” Brokers and their authorized designees are responsible for forwarding purchase orders and redemption requests to the Fund.
Shares of the Fund can also be purchased through broker-dealers, banks and trust departments that may charge you a transaction or other fee for their services. These fees are not charged if you purchase shares directly from Aston Funds.
The Fund may be required to “freeze” or redeem your account if there appears to be suspicious activity or if account information matches information on a government list of known terrorists or other suspicious persons.
Aston Funds reserves the right to:
| • | Refuse any purchase or exchange of shares if it could adversely affect the Fund or its operations; |
| • | Suspend the offering of Fund shares; |
|
| ASTON/LMCG Small Cap Growth Fund | 22 |
Shareholder Information (cont’d)
| • | Change the initial and additional investment minimums or waive these minimums for any investor; |
| • | Delay sending you your sales proceeds for up to 15 days if you purchased shares by check. A charge of a minimum of $20 will be assessed if any check used to purchase shares is returned; and |
| • | Change, withdraw or waive various services, fees and account policies. |
Customer Identification Program
Federal law requires Aston Funds to obtain, verify and record identifying information for each investor who opens or reopens an account with Aston Funds. An investor may be an individual or a person other than an individual (such as a corporation, partnership or trust). Such identifying information may include the name, residential or business street address, principal place of business, local office or other physical location (for a person other than an individual), date of birth (for an individual), social security or taxpayer identification number or other identifying information. Applications without the required information, or without any indication that a social security or taxpayer identification number has been applied for, may not be accepted. After acceptance, to the extent permitted by applicable law and its customer identification program, Aston Funds reserves the right (a) to place limits on transactions in any account until the identity of the investor is verified; or (b) to refuse an investment in Aston Funds or to involuntarily redeem an investor’s shares at the current share price and close an account in the event that an investor’s identity is not verified within 90 days regardless of the type of account. This may cause shares in the investor’s account to be redeemed at a loss. You may be subject to taxes if Aston Funds liquidates your account due to insufficient information as it relates to customer identification procedures. Aston Funds and its agents will not be responsible for any loss or adverse tax effect in an investor’s account resulting from the investor’s delay in providing all required identifying information or from closing an account and redeeming an investor’s shares when an investor’s identity cannot be verified.
Short-Term and Excessive Trading
The Fund is designed for long-term investors. The Fund discourages and does not knowingly accommodate short-term and excessive trading. Such trading increases brokerage and administrative costs, may result in increased taxable gains to remaining shareholders and may disrupt portfolio management. For example, the Fund may be unable to effectively invest the proceeds from certain purchase or exchange requests under certain market conditions or may incur losses on the sale of investments. These risks may be more pronounced for the Fund if it invests in securities that are more difficult to value or that are susceptible to pricing arbitrage (e.g., foreign securities, high yield securities and small cap securities). Thus, such trading may negatively impact the Fund’s NAV and result in dilution to long-term shareholders.
In an effort to protect long-term shareholders, Aston Funds’ Board of Trustees has adopted policies and procedures that seek to deter short-term trading and excessive trading and to detect such trading activity at levels that may be detrimental to the Fund. In addition, the Fund has adopted certain fair valuation practices intended to protect the Fund from time zone arbitrage with respect to foreign securities and other trading practices that seek to exploit stale prices. In accordance with these policies and procedures, the Fund reserves the right to:
| • | Reject any purchase, including exchange purchases that could adversely affect the Fund or its operations. |
| • | Limit, terminate or otherwise modify the exchange privilege of any shareholder deemed to be engaged in activities that may be detrimental to the Fund. |
| • | Reject any purchase, including exchange purchases, from investors if there appears to be evidence of short-term or excessive trading. |
| • | Permanently prevent future purchases and exchanges from occurring in accounts where short-term or excessive trading is apparent. |
| • | Delay sending redemption proceeds for up to seven days (generally applies in cases of very large redemptions, excessive trading, or during unusual market conditions). |
| • | Suspend redemptions as permitted by law (e.g., in emergency situations). |
|
| ASTON/LMCG Small Cap Growth Fund | 23 |
Shareholder Information (cont’d)
In making the determination to exercise these rights, the Fund may consider an investor’s trading history in the Fund and accounts under common ownership or control.
The Fund seeks to employ reasonable measures to detect short-term and excessive trading at levels that may be detrimental to the Fund. Accordingly, the Fund uses certain materiality and volume thresholds in applying the policies and procedures, but otherwise seeks to apply the policies and procedures uniformly to all shareholders. With respect to accounts held through intermediaries, such intermediaries generally are contractually obligated to provide the Fund with certain shareholder trading information. However, the Fund cannot directly control activity through all channels and is dependent on intermediaries to enforce the Fund’s policies and procedures. In certain cases, intermediaries may be unable to implement these policies or may not be able to implement policies and procedures in the same manner as the Fund due to system or other constraints. Shareholders who invest through omnibus accounts may be subject to policies and procedures that differ from those applied by the Fund to direct shareholders. The Fund reserves the right to limit an intermediary’s future access to the Fund, up to and including terminating the selling agreement with the intermediary. There is no assurance that the Fund’s policies and procedures will be effective in limiting and deterring short-term and excessive trading in all circumstances.
ACCOUNT POLICIES AND DIVIDENDS
Account Statements
In general, you will receive quarterly account statements. In addition, you will also receive account statements:
| • | After every transaction that affects your account balance (except for dividend reinvestments, Automatic Investment Plans or Systematic Withdrawal Plans); and |
| • | After any change of name or address of the registered owner(s). |
You will also receive an annual statement that describes the federal income tax characteristics of any dividends and distributions the Fund has paid to shareholders during the year.
Aston Funds may charge a fee for certain services, such as providing historical account documents.
Mailings to Shareholders
To help reduce Fund expenses and environmental waste, Aston Funds combines mailings for multiple accounts going to a single household by delivering Fund reports (annual and semi-annual reports, prospectuses, etc.) in a single envelope. If you do not want us to continue consolidating your Fund mailings and would prefer to receive separate mailings with multiple copies of Fund reports, please call one of our Investor Services Associates at 800-992-8151.
Distributions
The Fund distributes income dividends and net capital gains. Income dividends represent the earnings from the Fund’s investments less its expenses; capital gains generally occur when the Fund sells a portfolio security for more than the original purchase price.
Dividends
The Fund will declare and pay dividends, if any, annually. Net capital gains, if any, will be distributed at least once a year, generally in December.
Dividend Reinvestments
Investors may have their dividends and distributions reinvested in additional shares of the Fund. If you choose this option, or if you do not indicate a choice, your dividends and distributions will be automatically reinvested on the dividend payable date. You can also choose to have a check for your dividends and distributions mailed to you by choosing this option on your account application.
|
| ASTON/LMCG Small Cap Growth Fund | 24 |
Shareholder Information (cont’d)
Uncashed Checks
Checks should be cashed upon receipt, as interest will not be paid on uncashed checks. State escheat laws generally require Aston Funds to remit uncashed checks to the appropriate state after a specific period of time, which varies by state.
ADDITIONAL INVESTOR SERVICES
Automatic Investment Plan (Class N Shares only)
The Automatic Investment Plan (“AIP”) allows you to set up a scheduled transfer of funds from your bank account to the Aston Fund(s) of your choice. You determine the AIP investment amount (the minimum AIP investment amount is $50), and you can terminate the program at any time. The minimum initial investment for accounts containing an AIP instruction is the same as all other accounts. To take advantage of this feature, complete the appropriate sections of the account application.
Aston Funds Website
Aston Funds maintains a website located at www.astonfunds.com. You can purchase, exchange and redeem shares and access information such as your account balance and the Fund’s NAV through our website. Self-register for online account access at www.astonfunds.com. Your social security number or employee identification number, account number and other security validity information will be required for registration. You may also need to have bank account information, wire instructions, ACH instructions or other options established on your account.
Aston Funds has procedures in place to try to prevent unauthorized access to your account information. The Fund and its agents will not be responsible for any losses resulting from unauthorized transactions on our website.
Systematic Withdrawal Plan (Class N Shares only)
This plan may be used for periodic withdrawals (at least $50 by check or ACH) from your account. To take advantage of this feature you must:
| • | Have at least $50,000 in your account; |
| • | Determine the schedule: monthly, quarterly, semi-annually or annually; and |
| • | Call 800-992-8151 to add a Systematic Withdrawal Plan to your account. |
Retirement Plans and Education Savings Accounts (Class N Shares)
Aston Funds offer a range of retirement plans, including Traditional, Roth, SIMPLE IRAs and SEP IRAs for Class N shareholders. Aston Funds also offers Education Savings Accounts for Class N shareholders, which allow you to save for qualified elementary, secondary and higher education costs. Using these plans, you can invest in any Aston Fund with a low minimum investment of $500. The annual maintenance fee for IRAs and Education Savings Accounts is $15 per account (not to exceed $30 per shareholder), but it is waived if you have $35,000 or more in assets. The fee is assessed every December for the current calendar year. To find out more, call Aston Funds at 800-992-8151.
DISTRIBUTION AND SERVICES PLAN 12b-1 FEES
To pay for the cost of promoting the Fund and servicing your shareholder account, the Fund has adopted a Rule 12b-1 plan for Class N shares. Under this plan, the Fund pays a fee at an annual rate of not more than 0.25% of the Fund’s Class N shares’ average daily net assets to the distributor for certain expenses associated with the distribution of Fund shares and administrative services provided to Fund shareholders. The fee is accrued daily and payable monthly. Over time, these fees may increase the cost of your investment and may cost more than paying other types of sales charges.
|
| ASTON/LMCG Small Cap Growth Fund | 25 |
Shareholder Information (cont’d)
Payments to Intermediaries
In addition to payments under a Rule 12b-1 plan, the Fund may bear costs associated with compensating intermediaries that perform sub-transfer agency, sub-accounting and/or shareholder services for Fund shareholder accounts. Aston may also compensate intermediaries that distribute and/or service investors in the Fund out of its own assets and not as an additional charge to the Fund. Additional payments to intermediaries may represent a premium over payments made by other fund families, and may create an added incentive for investment professionals to sell or recommend the Fund over other funds offered by competing fund families. The additional payments may differ for each fund within the Aston family of funds, including within the same intermediary, and across intermediaries, or within the same fund at the same intermediary.
In addition, representatives of the distributor may be compensated through Adviser incentive programs in a manner that favors one Aston Fund or group of Aston Funds over another Aston Fund.
PORTFOLIO TRANSACTIONS AND BROKERAGE COMMISSIONS
The Subadviser attempts to obtain the best possible price and most favorable execution of transactions in its portfolio securities. There may be times when the Subadviser may pay one broker-dealer a commission that is greater than the amount that another broker-dealer may charge for the same transaction. The Subadviser generally determines in good faith if the commission paid was reasonable in relation to the brokerage or research services provided by the broker-dealer. In selecting and monitoring broker-dealers and negotiating commissions, the Subadviser considers, among other factors, a broker-dealer’s reliability, availability of research, the quality of its execution services and its financial condition.
|
| ASTON/LMCG Small Cap Growth Fund | 26 |
Dividends, Distributions and Taxes
Dividends and Distributions
The Fund pays dividends and distributes capital gains annually. All dividends and distributions are automatically reinvested at NAV unless you choose to receive them in a cash payment. You can change your payment options at any time by writing to us.
Taxes
Certain tax considerations may apply to your investment in the Fund. The following is a general description of certain federal income tax considerations. Further information regarding the federal income tax consequences of investing in the Fund is included in the SAI. If you have any tax-related questions relating to your own investment in the Fund, please consult your tax adviser.
For federal income tax purposes:
| • | The tax treatment of dividends and distributions is the same whether you reinvest the dividends and distributions or elect to receive them in cash. We will send you a statement with the federal income tax status of your dividends and distributions for the prior year generally by February 15. |
| • | Distributions of any net investment income, other than “qualified dividend income,” are taxable to you as ordinary income. |
| • | Distributions of qualified dividend income (i.e., generally dividends received by the Fund from domestic corporations and certain foreign corporations) generally will be taxed to individuals and other non-corporate investors in the Fund at federal income tax rates applicable to long-term capital gains, provided you meet certain holding period and other requirements contained in the Code with respect to your Fund shares and the Fund meets similar holding period and other requirements with respect to the dividend paying stock. Dividends received from most REITs and certain foreign corporations are not expected to qualify for treatment as qualified dividend income when distributed by the Fund. |
| • | If the Fund receives dividends from another investment company that qualifies as a regulated investment company, including an ETF, for federal income tax purposes and the investment company designates such dividends as qualified dividend income, then the Fund may in turn designate that portion of its distributions derived from those dividends as qualified dividend income, provided the Fund meets certain holding period and other requirements with respect to the shares of the investment company. |
| • | Distributions of net capital gain (net long-term capital gain less any net short-term capital loss) are taxable as long-term capital gain regardless of how long you may have held shares of the Fund. In contrast, distributions of net short-term capital gain (net short-term capital gain less any net long-term capital loss) are taxable as ordinary income regardless of how long you may have held shares of the Fund. Because distributions of net short-term capital gain are taxable as ordinary income, you generally cannot offset net short-term capital gain distributions you receive from the Fund with capital losses. |
| • | Generally, the character of the dividends and distributions the Fund receives from another investment company will “pass through” to you, subject to certain exceptions, as long as the Fund and the investment company each qualify as a regulated investment company under the Code. |
| • | Some of the Fund’s investments may be subject to special provisions of the Code that may increase the amount of gain recognized by the Fund, defer the Fund’s losses, accelerate the Fund’s |
|
| ASTON/LMCG Small Cap Growth Fund | 27 |
Dividends, Distributions and Taxes (cont’d)
| | recognition of gain, affect the character of such income and affect the amount, timing and type of distributions from the Fund, which may increase the amount of taxes payable by you. |
| • | Distributions declared to the shareholders of record in October, November or December and paid on or before January 31 of the succeeding year will be treated for federal income tax purposes as if received by shareholders on December 31 of the year in which the distribution was declared. |
| • | When you sell shares or exchange shares for shares of another fund (other than shares held in a tax-deferred account) it generally is considered a taxable event for you. Depending on the purchase price and the sale price of the shares you sell or exchange, you may have a gain or a loss on the transaction. The gain or loss will generally be treated as a long-term capital gain or loss if you held your shares for more than one year. If you held your shares for one year or less, the gain or loss will generally be treated as a short-term capital gain or loss. You are responsible for any tax liabilities generated by your transactions. |
| • | If you do not provide Aston Funds with your complete and correct taxpayer identification number and required certification, or if the Internal Revenue Service so notifies us, you may be subject to backup withholding tax on dividends, distributions and redemption proceeds. |
| • | If you purchase shares of the Fund just before a dividend or distribution, you will pay the full price for the shares and receive a portion of the purchase price back as a taxable distribution. This is referred to as “buying a dividend.” |
| • | If the Fund qualifies (by having more than 50% of the value of its total assets at the close of the taxable year consist of stock or securities in foreign corporations or by being a qualified fund of funds) and elects to pass through foreign taxes paid on its investments during the year, such taxes will be reported to you as income. You may, however, be able to claim an offsetting tax credit or deduction on your federal income tax return, depending on your particular circumstances and provided you meet certain holding period and other requirements. Tax-exempt holders of Fund shares, such as qualified tax-deferred retirement plans, will not benefit from such a deduction or credit. |
| • | The Fund’s ability to invest in some investments may be significantly limited by the federal income tax rules applicable to regulated investment companies. |
| • | Tax reporting changes effective January 1, 2012 require Aston Funds to report cost basis and holding period information to both the Internal Revenue Service and shareholders for gross proceeds from the sales of shares of Aston Funds purchased on or after January 1, 2012. This information will be reported on Form 1099-B. The deadline for mailing Form 1099-B to shareholders is February 15. Absent shareholder instructions, Aston Funds will calculate and report cost basis information using its default method of average cost. If you hold shares of Aston Funds through a financial intermediary, the financial intermediary will be responsible for this reporting and the financial intermediary’s default cost basis method may apply. Please consult your tax adviser for additional information regarding cost basis reporting and your situation. |
|
| ASTON/LMCG Small Cap Growth Fund | 28 |
Financial Highlights
These financial highlights tables are intended to help you understand the Fund’s financial performance. The following schedules present financial highlights for one outstanding share of each Fund throughout the periods indicated. The total returns in the tables represent the rate that an investor would have earned or lost on an investment in a Fund (assuming reinvestment of all dividends and distributions). This information has been derived from the Aston Funds’ financial statements as of October 31, 2012. The financial statements for the Aston Funds have been audited by Ernst & Young LLP, whose report along with those Aston Funds’ financial statements, is included in the Aston Funds’ annual report, which is available upon request.
| | | | | | | | |
ASTON/LMCG Small Cap Growth Fund – Class N Year Ended October 31 (formerly, ASTON Small Cap Growth Fund) | | 2012 | | | 2011(a) | |
Per Share Operating Data: | | | | | | | | |
Net Asset Value, Beginning of Period | | | $9.95 | | | | $10.00 | |
Income from Investment Operations: | | | | | | | | |
Net investment loss | | | (0.12 | )(b) | | | (0.04 | ) |
Net realized and unrealized gain on investments | | | 1.59 | | | | (0.01 | ) |
| | | | | | | | |
Total from investment operations | | | 1.47 | | | | (0.05 | ) |
Less Distributions: | | | | | | | | |
Distributions from and in excess of net investment income | | | — | | | | — | |
| | | | | | | | |
Total distributions | | | — | | | | — | |
Net decrease in net asset value | | | 1.47 | | | | (0.05 | ) |
Net Asset Value, End of Period | | | $11.42 | | | | $9.95 | |
Total Return(c) | | | 14.77 | % | | | (0.50 | )%(d) |
Ratios/Supplemental Data: | | | | | | | | |
Net Assets, End of Period (in 000’s) | | | $5,659 | | | | $5,411 | |
Ratios of expenses to average net assets: | | | | | | | | |
Before reimbursement and/or waiver of expenses by Adviser | | | 2.86 | % | | | 8.27 | %(e) |
After reimbursement and/or waiver of expenses by Adviser | | | 1.35 | % | | | 1.35 | %(e) |
Ratios of net investment loss to average net assets: | | | | | | | | |
Before reimbursement and/or waiver of expenses by Adviser | | | (2.68 | )% | | | (8.14 | )%(e) |
After reimbursement and/or waiver of expenses by Adviser | | | (1.17 | )% | | | (1.21 | )%(e) |
Portfolio Turnover | | | 168.05 | %(f) | | | 205.85 | %(d) |
| | |
ASTON/LMCG Small Cap Growth Fund – Class I Year Ended October 31 (formerly, ASTON Small Cap Growth Fund) | | | 2012 | | | | 2011 | (g) |
Per Share Operating Data: | | | | | | | | |
Net Asset Value, Beginning of Period | | | $9.97 | | | | $12.40 | |
Income from Investment Operations: | | | | | | | | |
Net investment loss | | | (0.10 | )(b) | | | (0.04 | ) |
Net realized and unrealized gain on investments | | | 1.59 | | | | (2.39 | ) |
| | | | | | | | |
Total from investment operations | | | 1.49 | | | | (2.43 | ) |
Less Distributions: | | | | | | | | |
Distributions from and in excess of net investment income | | | — | | | | — | |
| | | | | | | | |
Total distributions | | | — | | | | — | |
Net decrease in net asset value | | | 1.49 | | | | (2.43 | ) |
Net Asset Value, End of Period | | | $11.46 | | | | $9.97 | |
Total Return(c) | | | 14.95 | % | | | (19.60 | )%(d) |
Ratios/Supplemental Data: | | | | | | | | |
Net Assets, End of Period (in 000’s) | | | $755 | | | | $2,551 | |
Ratios of expenses to average net assets: | | | | | | | | |
Before reimbursement and/or waiver of expenses by Adviser | | | 2.61 | % | | | 6.25 | %(e) |
After reimbursement and/or waiver of expenses by Adviser | | | 1.10 | % | | | 1.10 | %(e) |
Ratios of net investment loss to average net assets: | | | | | | | | |
Before reimbursement and/or waiver of expenses by Adviser | | | (2.43 | )% | | | (6.11 | )%(e) |
After reimbursement and/or waiver of expenses by Adviser | | | (0.92 | )% | | | (0.96 | )%(e) |
Portfolio Turnover | | | 168.05 | %(f) | | | 205.85 | %(d) |
| | (a) | ASTON Small Cap Growth Fund began issuing Class N shares on November 2, 2010. |
| | (b) | The selected per share data was calculated using the weighted average shares outstanding method for the period. |
|
| ASTON/LMCG Small Cap Growth Fund | 29 |
| | (c) | The total return is calculated using the Net Asset Values used for trading at the close of business at period end. |
| | (f) | Portfolio turnover rate excludes securities delivered from processing a redemption-in-kind. |
| | (g) | ASTON Small Cap Growth Fund began issuing Class I shares on May 31, 2011. |
|
| ASTON/LMCG Small Cap Growth Fund | 30 |
General Information
If you wish to know more about Aston Funds, you will find additional information in the following documents:
SHAREHOLDER REPORTS
You will receive an unaudited Semi-Annual Report dated April 30 and an Annual Report dated October 31, which is audited by an independent registered public accounting firm. The Annual Report contains a discussion of the market conditions and investment strategies that significantly affected the Fund’s performance during its last fiscal year.
STATEMENT OF ADDITIONAL INFORMATION
The SAI, which is incorporated into this prospectus by reference and dated February 28, 2013 as amended from time to time, is available to you without charge and can be mailed to you upon request. It contains more detailed information about the Fund.
HOW TO OBTAIN REPORTS
Contacting Aston Funds
You can get free copies of the reports and SAI, request other information and obtain answers to your questions about the Fund by contacting:
| | |
| Address: | | Aston Funds P.O. Box 9765 Providence, RI 02940 |
| |
| Phone: | | Shareholder Services & Fund Literature 800-992-8151 |
| |
| | Investment Advisor Services 800-597-9704 |
| |
| Website: | | www.astonfunds.com |
Obtaining Information from the SEC
You can visit the EDGAR Database on the SEC’s website at http://www.sec.gov to view the SAI and other information. You can also view and copy information about the Fund at the SEC’s Public Reference Room in Washington, D.C. To find out more about the Public Reference Room, you can call the SEC at 202-551-8090. Also, you can obtain copies of this information after paying a duplicating fee, by electronic request at the following E-mail address: publicinfo@sec.gov, or by writing the SEC’s Public Reference Section, Washington D.C. 20549-1520.

Aston Funds
Class N, I and R Shares
Prospectus - February 28, 2013
| | | | | | |
| | | Ticker Symbols |
| EQUITY FUNDS | | Class N | | Class I | | Class R |
ASTON/Montag & Caldwell Growth Fund | | MCGFX | | MCGIX | | MCRGX |
ASTON/Herndon Large Cap Value Fund | | AALIX | | AHRNX | | — |
ASTON/Cornerstone Large Cap Value Fund | | RVALX | | AAVIX | | — |
ASTON/TAMRO Diversified Equity Fund | | ATLVX | | ATDEX | | — |
ASTON/River Road Dividend All Cap Value Fund | | ARDEX | | ARIDX | | — |
ASTON/River Road Dividend All Cap Value Fund II | | ADVTX | | ADIVX | | |
ASTON/Fairpointe Mid Cap Fund | | CHTTX | | ABMIX | | — |
ASTON/Montag & Caldwell Mid Cap Growth Fund | | AMCMX | | — | | — |
ASTON/TAMRO Small Cap Fund | | ATASX | | ATSIX | | — |
ASTON/River Road Select Value Fund | | ARSMX | | ARIMX | | — |
ASTON/River Road Small Cap Value Fund | | ARSVX | | ARSIX | | — |
ASTON/River Road Independent Value Fund | | ARIVX | | ARVIX | | — |
ASTON/LMCG Small Cap Growth Fund | | ACWDX | | ACWIX | | — |
ASTON Small Cap Fund | | VERDX | | AVEIX | | — |
ASTON/Silvercrest Small Cap Fund | | ASCTX | | ACRTX | | |
| | | |
| FIXED INCOME FUNDS | | | | | | |
ASTON/DoubleLine Core Plus Fixed Income Fund | | ADBLX | | ADLIX | | — |
ASTON/TCH Fixed Income Fund | | CHTBX | | CTBIX | | — |
| | | |
| ALTERNATIVE FUNDS | | | | | | |
ASTON/Lake Partners LASSO Alternatives Fund | | ALSNX | | ALSOX | | — |
ASTON/Anchor Capital Enhanced Equity Fund | | AMBEX | | AMDSX | | — |
ASTON/River Road Long-Short Fund | | ARLSX | | ALSIX | | — |
| | | |
| INTERNATIONAL FUND | | | | | | |
ASTON/Barings International Fund | | ABARX | | ABIIX | | — |
| | | |
| SECTOR FUND | | | | | | |
ASTON/Harrison Street Real Estate Fund | | ARFCX | | AARIX | | — |
| | | |
| BALANCED FUND | | | | | | |
ASTON/Montag & Caldwell Balanced Fund | | MOBAX | | MOBIX | | — |
Not FDIC Insured. No Bank Guarantee. May Lose Value.
The Securities and Exchange Commission has not approved or disapproved these or any mutual fund’s shares or determined if this prospectus is accurate or complete. Any representation to the contrary is a crime.
TABLE OF CONTENTS
ASTON/Montag & Caldwell Growth Fund
INVESTMENT OBJECTIVES
The Fund seeks long-term capital appreciation and, secondarily, current income, by investing primarily in common stocks and convertible securities.
FEES AND EXPENSES
The table below describes the fees and expenses that you may pay if you buy and hold shares of the Fund.
ANNUAL FUND OPERATING EXPENSES
(expenses that you pay each year as a percentage of the value of your investment)
| | | | | | | | | | | | |
| | | Class N Shares | | | Class I Shares | | | Class R Shares | |
| Management Fees | | | 0.64 | % | | | 0.64 | % | | | 0.64 | % |
| Distribution and Service (12b-1) Fees | | | 0.25 | % | | | None | | | | 0.50 | % |
| Other Expenses | | | 0.16 | % | | | 0.16 | % | | | 0.16 | % |
| Acquired Fund Fees and Expenses | | | 0.01 | % | | | 0.01 | % | | | 0.01 | % |
| Total Annual Fund Operating Expenses | | | 1.06 | % | | | 0.81 | % | | | 1.31 | % |
Example
This example is intended to help you compare the cost of investing in the Fund with the cost of investing in other mutual funds. The example shows the operating expenses you would incur as a shareholder if you invested $10,000 in the Fund over the time periods shown and you redeem all your shares at the end of those periods. The example assumes that the average annual return was 5% and operating expenses remained the same.
Although your actual costs may be higher or lower, based on the above assumptions, your costs would be:
| | | | | | | | | | | | | | | | |
| | | 1 Year | | | 3 Years | | | 5 Years | | | 10 Years | |
| Class N Shares | | $ | 108 | | | $ | 337 | | | $ | 585 | | | $ | 1,294 | |
| Class I Shares | | | 83 | | | | 259 | | | | 450 | | | | 1,002 | |
| Class R Shares | | | 133 | | | | 415 | | | | 718 | | | | 1,579 | |
PORTFOLIO TURNOVER
The Fund pays transaction costs, such as commissions, when it buys and sells securities (or “turns over” its portfolio). A higher portfolio turnover rate may indicate higher transaction costs and may result in higher taxes when Fund shares are held in a taxable account. These costs, which are not reflected in annual Fund operating expenses or in the example, affect the Fund’s performance. During the most recent fiscal year, the Fund’s portfolio turnover rate was 46.42%.
PRINCIPAL INVESTMENT STRATEGIES
The Fund invests primarily in common stocks and convertible securities. The portfolio manager uses a bottom-up approach to stock selection and seeks high quality, well-established large-cap companies that the portfolio manager believes are growing their near-term earnings at an above average rate. The Fund defines a large-cap company as one having a market capitalization of $5 billion or more at the time of acquisition. The portfolio manager emphasizes valuation to find companies selling at a discount to their intrinsic value. These companies must pass an initial capitalization screen and:
| n | | Have a strong history of earnings growth |
| n | | Be attractively priced, relative to the company’s potential for above average long-term earnings and revenue growth |
| n | | Have strong balance sheets |
| n | | Have a sustainable competitive advantage |
| n | | Be currently, or have the potential to become, industry leaders |
| n | | Have the potential to outperform during market downturns |
The Fund may invest in foreign securities (directly and through depositary receipts).
To manage risk, the portfolio manager limits sector and individual security exposure, and adheres to a strong sell discipline.
PRINCIPAL RISKS
You could lose money by investing in the Fund. There can be no assurance that the Fund’s investment objective will be achieved. The following is a summary of the principal risks of investing in the Fund.
Convertible Risk. Convertible preferred securities are subject to the risks of equity securities and fixed income securities. The lower the premium, the more likely the price of the convertible will follow the price of the underlying common stock. Higher premium convertibles are more likely to exhibit the behavior of bonds because the likelihood of conversion is lower. In that case, the price of convertible preferred shares normally will fall as interest rates rise. Conversely, as rates fall, the price of convertible preferred shares will rise.
Prospectus | 3
The value of convertible securities is also affected by prevailing interest rates, the credit quality of the issuer and any call provisions. There is the risk that the issuer of the security will not be able to make principal and/or interest payments as well as the risk that the holder of the security may not take advantage of the convertible features in the appropriate time frame.
Foreign Securities Risk. Investing in the securities of foreign issuers involves special risks and considerations not typically associated with investing in U.S. companies. The securities of foreign companies may be less liquid and may fluctuate more widely than those traded in U.S. markets. Foreign companies and markets may also have less governmental supervision. There may be difficulty in enforcing contractual obligations and little public information about the companies. Trades typically take more time to settle and clear, and the cost of buying and selling foreign securities is generally higher than similar costs associated with securities traded in U.S. markets.
The value of the securities held by the Fund may be affected by changes in exchange rates or control regulations. If a local currency gains against the U.S. dollar, the value of the holding increases in U.S. dollar terms. If a local currency declines against the U.S. dollar, the value of the holding decreases in U.S. dollar terms. Changes in economic, tax or foreign investment policies, or other political, governmental or economic actions can adversely affect the value of the securities in the Fund. In foreign countries, accounting, auditing and financial reporting standards and other regulatory practices and requirements are generally different from those required for U.S. companies. Investments in securities of foreign issuers may also be subject to foreign withholding and other taxes.
Growth Style Risk. Growth investing involves buying stocks that have relatively high price-to-earnings ratios. Growth stocks may be more volatile than other stocks because they are generally more sensitive to investor perceptions and market moves. During periods of growth stock underperformance, the Fund’s performance may suffer.
Liquidity Risk. When there is no willing buyer and investments cannot be readily sold at the desired time or price, the Fund may need to accept a lower price or may not be able to sell the security at all. An inability to sell securities can adversely affect the Fund’s value or prevent the Fund from being able to take advantage of other investment opportunities. Less liquid securities are more difficult to dispose of at their recorded values and are subject to increased spreads and volatility.
Manager Risk. The performance of the Fund is dependent upon the investment adviser’s skill in selecting managers and the portfolio manager’s skill in making appropriate investments. As a result, the Fund may underperform its benchmark or its peers.
Market Risk. The Fund’s share price can move down in response to stock market conditions, changes in the economy or changes in a particular company’s stock price. An individual stock may decline in value even when the value of stocks in general is rising.
FUND PERFORMANCE
The bar chart shows how the performance of the Class N shares of the Fund has varied from year to year over the periods shown. Class N shares, Class I shares, and Class R shares are invested in the same portfolio of securities, so the annual returns would differ only to the extent that the classes have different expenses. The annual returns of the Class I shares would be higher than the returns of Class N shares and Class R shares due to 12b-1 fees paid by Class N shares and Class R shares. This information may help illustrate the risks of investing in the Fund. The Fund makes updated performance information available on the Fund’s website, www.astonfunds.com, or by calling 800-992-8151. As with all mutual funds, past performance (before and after taxes) does not guarantee future performance.
Class N Shares
Calendar Year Total Return
| | | | | | | | | | |
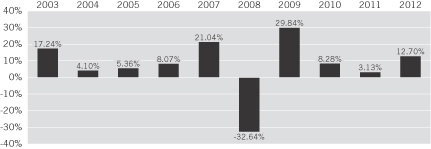 | | | | | | | | | | |
| | Best quarter: | | | 06/09 | | | | 14.92 | % |
| | Worst quarter: | | | 12/08 | | | | (20.35 | )% |
| | | | | | | | | | |
| | | | | | | | | | |
| | | | | | | | | | |
Prospectus | 4
The following table indicates how the Fund’s average annual returns for different calendar periods compared to the returns of a broad-based securities market index.
Average Annual Total Return
(For the periods ended December 31, 2012)
| | | | | | | | | | | | | | | | |
| | | ASTON/Montag & Caldwell Growth Fund | |
| | | 1 Year | | | 5 Years | | | 10 Years | | | Since Inception | |
| Class N Shares (Inception 11/2/94): | | | | | | | | | | | | | | | | |
Return Before Taxes | | | 12.70 | % | | | 1.93 | % | | | 6.35 | % | | | 8.49 | % |
Return After Taxes on Distributions | | | 11.41 | % | | | 1.31 | % | | | 5.77 | % | | | 7.88 | % |
Return After Taxes on Distributions and Sale of Fund Shares | | | 9.92 | % | | | 1.58 | % | | | 5.51 | % | | | 7.58 | % |
| Class I Shares (Inception 6/28/96): | | | | | | | | | | | | | | | | |
Return Before Taxes | | | 13.00 | % | | | 2.19 | % | | | 6.64 | % | | | 6.75 | % |
| Class R Shares (Inception 12/31/02): | | | | | | | | | | | | | | | | |
Return Before Taxes | | | 12.39 | % | | | 1.68 | % | | | 6.10 | % | | | 6.10 | % |
| Russell 1000 Growth Index (Reflects no deduction for taxes, expenses or fees. Index return since inception for Class N shares is computed from October 31, 1994. Index return for Class I shares, since inception, computed from June 30, 1996, is 5.54%. Index return for Class R shares, since inception, computed from December 31, 2002, is 7.52%.) | | | 15.26 | % | | | 3.12 | % | | | 7.52 | % | | | 7.44 | % |
After-tax returns are calculated using the historical highest individual federal marginal income tax rates and do not reflect the impact of state and local taxes. After-tax returns depend on an investor’s tax situation and may differ from those shown. After-tax returns shown are not relevant to investors who hold their shares through tax-deferred arrangements, such as 401(k) plans or individual retirement accounts. After-tax returns are shown only for Class N shares. After-tax returns for Class I shares and Class R shares will vary.
MANAGEMENT
Aston Asset Management, LP serves as investment adviser to the Fund. Montag & Caldwell, LLC (“Montag & Caldwell”) serves as the subadviser to the Fund.
Mr. Ronald E. Canakaris, Chairman and Chief Investment Officer of Montag & Caldwell, has served as the Fund’s Portfolio Manager since November 1994.
PURCHASE AND SALE OF FUND SHARES
Shares of the Fund may be purchased, exchanged, or redeemed on any business day by written request (Aston Funds, P.O. Box 9765, Providence, RI 02940), wire transfer, online access (www.astonfunds.com), or by telephone (800-992-8151). Investors who wish to purchase, exchange or redeem Fund shares through a broker-dealer should contact the broker-dealer directly.
| | | | | | | | |
| Class and Account Type | | Minimum Initial Investment | | | Subsequent Investments | |
| Class N—Regular Accounts | | $ | 2,500 | | | $ | 50 | |
| Individual Retirement Accounts (IRAs) | | $ | 500 | | | $ | 50 | |
| Education Savings Accounts (ESAs) (except R Class) | | $ | 500 | | | $ | 50 | |
| Custodial Accounts for Minors (UGMA/UTMA) | | $ | 500 | | | $ | 50 | |
| Class I—Institutional Accounts | | $ | 1 Million | | | $ | 50 | |
| Class R—Retirement Plans | | $ | 2,500 | | | $ | 50 | |
Class R shares are only intended for use within retirement plans offered through a financial representative or a plan sponsor.
TAX INFORMATION
The Fund’s distributions are generally taxable as ordinary income or capital gains for federal income tax purposes, unless you are investing through a tax-deferred account such as a 401(k) or individual retirement account. Distributions on investments made through tax-deferred vehicles, such as 401(k) plans or IRAs, may be taxed later upon withdrawal of assets from those plans or accounts.
PAYMENTS TO BROKER-DEALERS AND OTHER FINANCIAL INTERMEDIARIES
If you purchase shares of the Fund through a broker-dealer or other financial intermediary (such as a bank), the Fund and its related companies may pay the intermediary for the sale of shares and related services. These payments may create a conflict of interest by influencing the broker-dealer or other intermediary and your salesperson to recommend the Fund over another investment. Ask your salesperson or visit your financial intermediary’s website for more information.
Prospectus | 5
ASTON/Herndon Large Cap Value Fund
INVESTMENT OBJECTIVE
The Fund seeks to provide long-term capital appreciation.
FEES AND EXPENSES
The table below describes the fees and expenses that you may pay if you buy and hold shares of the Fund.
ANNUAL FUND OPERATING EXPENSES
(expenses that you pay each year as a percentage of the value of your investment)
| | | | | | | | |
| | | Class N Shares | | | Class I Shares | |
| Management Fees | | | 0.80 | % | | | 0.80 | % |
| Distribution and Service (12b-1) Fees | | | 0.25 | % | | | None | |
| Other Expenses | | | 0.36 | % | | | 0.36 | % |
| Acquired Fund Fees and Expenses | | | 0.01 | % | | | 0.01 | % |
| Total Annual Fund Operating Expenses | | | 1.42 | % | | | 1.17 | % |
Fee Waiver and/or Expense Reimbursement | | | (0.11 | )%(a) | | | (0.11 | )%(a) |
| Total Annual Fund Operating Expenses After Fee Waiver and/or Expense Reimbursement | | | 1.31 | %(a) | | | 1.06 | %(a) |
| (a) | The adviser is contractually obligated to waive management fees and/or reimburse ordinary operating expenses, not including investment-related costs (such as brokerage commissions), interest, taxes, extraordinary expenses and acquired fund fees and expenses, through February 28, 2014, to the extent that operating expenses exceed 1.30% of the Fund’s average daily net assets with respect to Class N shares and 1.05% of the Fund’s average daily net assets with respect to Class I shares (the “Operating Expense Limit”). Prior to February 28, 2014, the arrangement may be amended or terminated for a class only by a vote of the Board of Trustees of Aston Funds. For a period of up to three years from the fiscal year end during which such amount was waived or reimbursed, the adviser is entitled to be reimbursed by the Fund for fees waived and expenses reimbursed from commencement of operations through the completion of the first three full fiscal years to the extent that the Fund’s Total Annual Operating Expenses for a class, not including investment-related costs (such as brokerage commissions), interest, taxes, extraordinary expenses and acquired fund fees and expenses, remains at or below the Operating Expense Limit after such reimbursement. |
Example
This example is intended to help you compare the cost of investing in the Fund with the cost of investing in other mutual funds. The example shows the operating expenses you would incur as a shareholder if you invested $10,000 in the Fund over the time periods shown and you redeem all your shares at the end of those periods. The example assumes that the average annual return was 5%, operating expenses remained the same, and expenses were capped for one year in each period.
Although your actual costs may be higher or lower, based on the above assumptions, your costs would be:
| | | | | | | | | | | | | | | | |
| | | 1 Year | | | 3 Years | | | 5 Years | | | 10 Years | |
| Class N Shares | | $ | 133 | | | $ | 439 | | | $ | 766 | | | $ | 1,692 | |
| Class I Shares | | | 108 | | | | 361 | | | | 633 | | | | 1,411 | |
PORTFOLIO TURNOVER
The Fund pays transaction costs, such as commissions, when it buys and sells securities (or “turns over” its portfolio). A higher portfolio turnover rate may indicate higher transaction costs and may result in higher taxes when Fund shares are held in a taxable account. These costs, which are not reflected in annual Fund operating expenses or in the example, affect the Fund’s performance. During the most recent fiscal year, the Fund’s portfolio turnover rate was 80.56%.
PRINCIPAL INVESTMENT STRATEGIES
Under normal circumstances, the Fund invests at least 80% of its assets in securities of large-cap companies that the portfolio manager believes are undervalued compared to their perceived worth. The Fund invests primarily in common stocks and other equity securities. Value companies tend to have stock prices that are low relative to their earnings, dividends, assets or other financial measures. The Fund defines large-cap companies as companies with market capitalizations, at the time of acquisition, within the range of market capitalizations of companies constituting the Russell 1000 Index. The market capitalization range of the Russell 1000 Index changes periodically, and the capitalization of companies in which the Fund invests also changes. As of December 31, 2012, the market capitalization range of the Russell 1000 Index was approximately $313 million to $498.4 billion.
The portfolio manager combines a value-oriented approach with fundamental analysis to seek to identify companies primarily from the Russell 1000 Index that he believes have strong fundamentals and are undervalued relative to other companies comprising the Russell 1000 Index. Companies that meet minimum capitalization and quality screens are evaluated and ranked based on a number of fundamental metrics. The portfolio manager seeks to construct a portfolio that has the following characteristics relative to the Russell 1000 Index:
| n | | Higher dividend growth rates |
Prospectus | 6
| n | | Stronger earnings growth |
To manage risk, the portfolio manager seeks to limit sector and security exposure, maintain sector diversification, maintain a bias towards liquidity and adhere to a disciplined sell process.
PRINCIPAL RISKS
You could lose money by investing in the Fund. There can be no assurance that the Fund’s investment objective will be achieved. The following is a summary of the principal risks of investing in the Fund.
Liquidity Risk. When there is no willing buyer and investments cannot be readily sold at the desired time or price, the Fund may need to accept a lower price or may not be able to sell the security at all. An inability to sell securities can adversely affect the Fund’s value or prevent the Fund from being able to take advantage of other investment opportunities. Less liquid securities are more difficult to dispose of at their recorded values and are subject to increased spreads and volatility.
Manager Risk. The performance of the Fund is dependent upon the investment adviser’s skill in selecting managers and the portfolio manager’s skill in making appropriate investments. As a result, the Fund may underperform its benchmark or its peers.
Market Risk. The Fund’s share price can move down in response to stock market conditions, changes in the economy or changes in a particular company’s stock price. An individual stock may decline in value even when the value of stocks in general is rising.
Value Style Risk. Value investing involves buying stocks that are out of favor and/or undervalued in comparison to their peers or their prospects for growth. Typically, their valuation levels are less than those of growth stocks. Because different types of stocks go out of favor with investors depending on market and economic conditions, the Fund’s return may be adversely affected during a market downturn and when value stocks are out of favor.
FUND PERFORMANCE
The bar chart shows how the performance of the Class N shares of the Fund has varied from year to year for the periods shown. Class N shares and Class I shares are invested in the same portfolio of securities, so the annual returns would differ only to the extent that the classes have different expenses. The annual returns of the Class I shares would be higher than the returns of the Class N shares due to 12b-1 fees paid by Class N shares. This information may help illustrate the risks of investing in the Fund. The Fund makes updated performance information available on the Fund’s website, www.astonfunds.com, or by calling 800-992-8151. As with all mutual funds, past performance (before and after taxes) does not guarantee future performance.
Class N Shares
Calendar Year Total Return
| | | | | | | | | | |
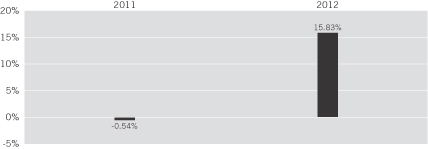 | | | | | | | | | | |
| | Best quarter: | | | 03/12 | | | | 16.26 | % |
| | Worst quarter: | | | 09/11 | | | | (15.38 | )% |
| | | | | | | | | | |
| | | | | | | | | | |
| | | | | | | | | | |
Prospectus | 7
The following table indicates how the Fund’s average annual returns for different calendar periods compared to the returns of a broad-based securities market index.
Average Annual Total Returns
(For the periods ended December 31, 2012)
| | | | | | | | |
| | | ASTON/Herndon Large Cap Value Fund | |
| | | 1 Year | | | Since Inception | |
| Class N Shares (Inception 3/31/10): | | | | | | | | |
Return Before Taxes | | | 15.83 | % | | | 9.02 | % |
Return After Taxes on Distributions | | | 14.82 | % | | | 7.98 | % |
Return After Taxes on Distributions and Sale of Fund Shares | | | 10.77 | % | | | 7.26 | % |
| Class I Shares (Inception 3/2/11): | | | | | | | | |
Return Before Taxes | | | 16.24 | % | | | 5.78 | % |
| Russell 1000 Value Index (Reflects no deduction for taxes, expenses or fees. Index return since inception for Class N shares is computed from March 31, 2010. Index return for Class I shares, since inception, computed from February 28, 2011, is 5.99%.) | | | 17.51 | % | | | 9.27 | % |
After-tax returns are calculated using the historical highest individual federal marginal income tax rates and do not reflect the impact of state and local taxes. After-tax returns depend on an investor’s tax situation and may differ from those shown. After-tax returns shown are not relevant to investors who hold their shares through tax-deferred arrangements, such as 401(k) plans or individual retirement accounts. After-tax returns are shown only for Class N shares. After-tax returns for Class I shares will vary.
MANAGEMENT
Aston Asset Management, LP serves as investment adviser to the Fund. Herndon Capital Management, LLC (“Herndon”) serves as the subadviser to the Fund.
Randell A. Cain Jr., CFA, a principal of Herndon, serves as the Portfolio Manager of the Fund. Mr. Cain has served as the Portfolio Manager since the Fund’s inception in March 2010.
PURCHASE AND SALE OF FUND SHARES
Shares of the Fund may be purchased, exchanged, or redeemed on any business day by written request (Aston Funds, P.O. Box 9765, Providence, RI 02940), wire transfer, online access (www.astonfunds.com), or by telephone (800-992-8151). Investors who wish to purchase, exchange or redeem Fund shares through a broker-dealer should contact the broker-dealer directly.
| | | | | | | | |
| Class and Account Type | | Minimum Initial Investment | | | Subsequent Investments | |
| Class N—Regular Accounts | | $ | 2,500 | | | $ | 50 | |
| Individual Retirement Accounts (IRAs) | | $ | 500 | | | $ | 50 | |
| Education Savings Accounts (ESAs) | | $ | 500 | | | $ | 50 | |
| Custodial Accounts for Minors (UGMA/UTMA) | | $ | 500 | | | $ | 50 | |
| Class I—Institutional Accounts | | $ | 1 Million | | | $ | 50 | |
TAX INFORMATION
The Fund’s distributions are generally taxable as ordinary income or capital gains for federal income tax purposes, unless you are investing through a tax-deferred account such as a 401(k) or individual retirement account. Distributions on investments made through tax-deferred vehicles, such as 401(k) plans or IRAs, may be taxed later upon withdrawal of assets from those plans or accounts.
PAYMENTS TO BROKER-DEALERS AND OTHER FINANCIAL INTERMEDIARIES
If you purchase shares of the Fund through a broker-dealer or other financial intermediary (such as a bank), the Fund and its related companies may pay the intermediary for the sale of shares and related services. These payments may create a conflict of interest by influencing the broker-dealer or other intermediary and your salesperson to recommend the Fund over another investment. Ask your salesperson or visit your financial intermediary’s website for more information.
Prospectus | 8
ASTON/Cornerstone Large Cap Value Fund
INVESTMENT OBJECTIVE
The Fund seeks to provide total return through long-term capital appreciation and current income.
FEES AND EXPENSES
The table below describes the fees and expenses that you may pay if you buy and hold shares of the Fund.
ANNUAL FUND OPERATING EXPENSES
(expenses that you pay each year as a percentage of the value of your investment)
| | | | | | | | |
| | | Class N Shares | | | Class I Shares | |
| Management Fees | | | 0.80 | % | | | 0.80 | % |
| Distribution and Service (12b-1) Fees | | | 0.25 | % | | | None | |
| Other Expenses | | | 0.53 | % | | | 0.53 | % |
| Acquired Fund Fees and Expenses | | | 0.01 | % | | | 0.01 | % |
| Total Annual Fund Operating Expenses | | | 1.59 | % | | | 1.34 | % |
Fee Waiver and/or Expense Reimbursement | | | (0.28 | )%(a) | | | (0.28 | )%(a) |
| Total Annual Fund Operating Expenses After Fee Waiver and/or Expense Reimbursement | | | 1.31 | %(a) | | | 1.06 | %(a) |
| (a) | The adviser is contractually obligated to waive management fees and/or reimburse ordinary operating expenses, not including investment-related costs (such as brokerage commissions), interest, taxes, extraordinary expenses and acquired fund fees and expenses, through February 28, 2014, to the extent that operating expenses exceed 1.30% of the Fund’s average daily net assets with respect to Class N shares and 1.05% of the Fund’s average daily net assets with respect to Class I shares. Prior to February 28, 2014, the arrangement may be amended or terminated for a class only by a vote of the Board of Trustees of Aston Funds. |
Example
This example is intended to help you compare the cost of investing in the Fund with the cost of investing in other mutual funds. The example shows the operating expenses you would incur as a shareholder if you invested $10,000 in the Fund over the time periods shown and you redeem all your shares at the end of those periods. The example assumes that the average annual return was 5%, operating expenses remained the same, and expenses were capped for one year in each period.
Although your actual costs may be higher or lower, based on the above assumptions, your costs would be:
| | | | | | | | | | | | | | | | |
| | | 1 Year | | | 3 Years | | | 5 Years | | | 10 Years | |
| Class N Shares | | $ | 133 | | | $ | 474 | | | $ | 839 | | | $ | 1,866 | |
| Class I Shares | | | 108 | | | | 397 | | | | 707 | | | | 1,588 | |
PORTFOLIO TURNOVER
The Fund pays transaction costs, such as commissions, when it buys and sells securities (or “turns over” its portfolio). A higher portfolio turnover rate may indicate higher transaction costs and may result in higher taxes when Fund shares are held in a taxable account. These costs, which are not reflected in annual Fund operating expenses or in the example, affect the Fund’s performance. During the most recent fiscal year, the Fund’s portfolio turnover rate was 58.21%.
PRINCIPAL INVESTMENT STRATEGIES
Under normal circumstances, the Fund invests at least 80% of its net assets in equity securities of large-cap companies. The portfolio managers seek to identify companies they believe are undervalued compared to their perceived worth (value companies). Value companies tend to have stock prices that are low relative to their earnings, dividends, assets, or other financial measures. The Fund defines a large-cap company as one having a market capitalization of $5 billion or more at the time of acquisition.
The portfolio managers use a bottom-up investment approach in buying and selling investments for the Fund. Investments are selected primarily based on fundamental analysis of issuers and their potential in light of their current financial condition and industry position, including market, economic, political, and regulatory conditions. Factors considered may include analysis of:
Quantitative analysis of these and other factors may also be considered.
The Fund may invest in foreign securities (directly and through depositary receipts).
To manage risk, the portfolio managers generally limit position sizes, diversify among sectors, and adhere to a strong sell discipline.
Prospectus | 9
PRINCIPAL RISKS
You could lose money by investing in the Fund. There can be no assurance that the Fund’s investment objective will be achieved. The following is a summary of the principal risks of investing in the Fund.
Foreign Securities Risk. Investing in the securities of foreign issuers involves special risks and considerations not typically associated with investing in U.S. companies. The securities of foreign companies may be less liquid and may fluctuate more widely than those traded in U.S. markets. Foreign companies and markets may also have less governmental supervision. There may be difficulty in enforcing contractual obligations and little public information about the companies. Trades typically take more time to settle and clear, and the cost of buying and selling foreign securities is generally higher than similar costs associated with securities traded in U.S. markets.
The value of the securities held by the Fund may be affected by changes in exchange rates or control regulations. If a local currency gains against the U.S. dollar, the value of the holding increases in U.S. dollar terms. If a local currency declines against the U.S. dollar, the value of the holding decreases in U.S. dollar terms. Changes in economic, tax or foreign investment policies, or other political, governmental or economic actions can adversely affect the value of the securities in the Fund. In foreign countries, accounting, auditing and financial reporting standards and other regulatory practices and requirements are generally different from those required for U.S. companies. Investments in securities of foreign issuers may also be subject to foreign withholding and other taxes.
Liquidity Risk. When there is no willing buyer and investments cannot be readily sold at the desired time or price, the Fund may need to accept a lower price or may not be able to sell the security at all. An inability to sell securities can adversely affect the Fund’s value or prevent the Fund from being able to take advantage of other investment opportunities. Less liquid securities are more difficult to dispose of at their recorded values and are subject to increased spreads and volatility.
Manager Risk. The performance of the Fund is dependent upon the investment adviser’s skill in selecting managers and the portfolio manager’s skill in making appropriate investments. As a result, the Fund may underperform its benchmark or its peers.
Market Risk. The Fund’s share price can move down in response to stock market conditions, changes in the economy or changes in a particular company’s stock price. An individual stock may decline in value even when the value of stocks in general is rising.
Value Style Risk. Value investing involves buying stocks that are out of favor and/or undervalued in comparison to their peers or their prospects for growth. Typically, their valuation levels are less than those of growth stocks. Because different types of stocks go out of favor with investors depending on market and economic conditions, the Fund’s return may be adversely affected during a market downturn and when value stocks are out of favor.
FUND PERFORMANCE
The bar chart shows how the performance of the Class N shares of the Fund has varied from year to year over the periods shown. Class N shares and Class I shares are invested in the same portfolio of securities, so the annual returns would differ only to the extent that the classes have different expenses. The annual returns of the Class I shares would be higher than the returns of the Class N shares due to 12b-1 fees paid by Class N shares. This information may help illustrate the risks of investing in the Fund. The Fund makes updated performance information available on the Fund’s website, www.astonfunds.com, or by calling 800-992-8151. As with all mutual funds, past performance (before and after taxes) does not guarantee future performance.
Class N Shares
Calendar Year Total Return
| | | | | | | | | | |
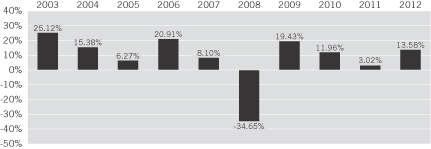 | | | | | | | | | | |
| | Best quarter: | | | 06/09 | | | | 15.00 | % |
| | Worst quarter: | | | 12/08 | | | | (19.32 | )% |
| | | | | | | | | | |
| | | | | | | | | | |
| | | | | | | | | | |
Prospectus | 10
The following table indicates how the Fund’s average annual returns for different calendar periods compared to the returns of a broad-based securities market index.
Average Annual Total Returns
(For the periods ended December 31, 2012)
| | | | | | | | | | | | | | | | |
| | | ASTON/Cornerstone Large Cap Value Fund | |
| | | 1 Year | | | 5 Years | | | 10 Years | | | Since Inception | |
| Class N Shares (Inception 1/04/93): | | | | | | | | | | | | | | | | |
Return Before Taxes | | | 13.58 | % | | | 0.45 | % | | | 7.44 | % | | | 7.17 | % |
Return After Taxes on Distributions | | | 13.41 | % | | | (0.19 | )% | | | 6.75 | % | | | 5.62 | % |
Return After Taxes on Distributions and Sale of Fund Shares | | | 9.05 | % | | | 0.20 | % | | | 6.45 | % | | | 5.61 | % |
| Class I Shares (Inception 9/20/05): | | | | | | | | | | | | | | | | |
Return Before Taxes | | | 13.88 | % | | | 0.71 | % | | | N/A | | | | 4.49 | % |
| Russell 1000 Value Index (Reflects no deduction for taxes, expenses or fees. Index return since inception for Class N shares is computed from December 31, 1992. Index return for Class I shares, since inception, computed from September 30, 2005, is 3.38%.) | | | 17.51 | % | | | 0.59 | % | | | 7.38 | % | | | 9.08 | % |
Cornerstone Investment Partners, LLC (“Cornerstone”) became the subadviser to the Fund on July 15, 2011. Performance prior to that date reflects the performance of a previous subadviser. Performance prior to September 27, 2001 reflects the performance of a predecessor fund.
After-tax returns are calculated using the historical highest individual federal marginal income tax rates and do not reflect the impact of state and local taxes. After-tax returns depend on an investor’s tax situation and may differ from those shown. After-tax returns shown are not relevant to investors who hold their shares through tax-deferred arrangements, such as 401(k) plans or individual retirement accounts. After-tax returns are shown only for Class N shares. After-tax returns for Class I shares will vary.
MANAGEMENT
Aston Asset Management, LP serves as investment adviser to the Fund. Cornerstone serves as the subadviser to the Fund.
Mr. John Campbell, CFA, Chief Investment Officer of Cornerstone, Mr. Rick van Nostrand, CFA, a Cornerstone portfolio manager, Mr. Cameron Clement, CFA, a Cornerstone portfolio manager and Mr. Dean Morris, CFA, a Cornerstone portfolio manager, serve as Portfolio Managers of the Fund. Messrs. Campbell, van Nostrand, Clement and Morris have served as the Fund’s Portfolio Managers since July 2011.
PURCHASE AND SALE OF FUND SHARES
Shares of the Fund may be purchased, exchanged, or redeemed on any business day by written request (Aston Funds, P.O. Box 9765, Providence, RI 02940), wire transfer, online access (www.astonfunds.com), or by telephone (800-992-8151). Investors who wish to purchase, exchange or redeem Fund shares through a broker-dealer should contact the broker-dealer directly.
| | | | | | | | |
| Class and Account Type | | Minimum Initial Investment | | | Subsequent Investments | |
| Class N—Regular Accounts | | $ | 2,500 | | | $ | 50 | |
| Individual Retirement Accounts (IRAs) | | $ | 500 | | | $ | 50 | |
| Education Savings Accounts (ESAs) | | $ | 500 | | | $ | 50 | |
| Custodial Accounts for Minors (UGMA/UTMA) | | $ | 500 | | | $ | 50 | |
| Class I—Institutional Accounts | | $ | 1 Million | | | $ | 50 | |
TAX INFORMATION
The Fund’s distributions are generally taxable as ordinary income or capital gains for federal income tax purposes, unless you are investing through a tax-deferred account such as a 401(k) or individual retirement account. Distributions on investments made through tax-deferred vehicles, such as 401(k) plans or IRAs, may be taxed later upon withdrawal of assets from those plans or accounts.
PAYMENTS TO BROKER-DEALERS AND OTHER FINANCIAL INTERMEDIARIES
If you purchase shares of the Fund through a broker-dealer or other financial intermediary (such as a bank), the Fund and its related companies may pay the intermediary for the sale of shares and related services. These payments may create a conflict of interest by influencing the broker-dealer or other intermediary and your salesperson to recommend the Fund over another investment. Ask your salesperson or visit your financial intermediary’s website for more information.
Prospectus | 11
ASTON/TAMRO Diversified Equity Fund
INVESTMENT OBJECTIVE
The Fund seeks to provide long-term capital appreciation.
FEES AND EXPENSES
The table below describes the fees and expenses that you may pay if you buy and hold shares of the Fund.
ANNUAL FUND OPERATING EXPENSES
(expenses that you pay each year as a percentage of the value of your investment)
| | | | | | | | |
| | | Class N Shares | | | Class I Shares | |
| Management Fees | | | 0.80 | % | | | 0.80 | % |
| Distribution and Service (12b-1) Fees | | | 0.25 | % | | | None | |
| Other Expenses | | | 0.63 | % | | | 0.63 | % |
| Total Annual Fund Operating Expenses | | | 1.68 | % | | | 1.43 | % |
Fee Waiver and/or Expense Reimbursement | | | (0.48 | )%(a) | | | (0.48 | )%(a) |
| Total Annual Fund Operating Expenses After Fee Waiver and/or Expense Reimbursement | | | 1.20 | %(a) | | | 0.95 | %(a) |
| (a) | The adviser is contractually obligated to waive management fees and/or reimburse ordinary operating expenses, not including investment-related costs (such as brokerage commissions), interest, taxes, extraordinary expenses and acquired fund fees and expenses, through February 28, 2014, to the extent that operating expenses exceed 1.20% of the Fund’s average daily net assets with respect to Class N shares and 0.95% of the Fund’s average daily net assets with respect to Class I shares. Prior to February 28, 2014, the arrangement may be amended or terminated for a class only by a vote of the Board of Trustees of Aston Funds. |
Example
This example is intended to help you compare the cost of investing in the Fund with the cost of investing in other mutual funds. The example shows the operating expenses you would incur as a shareholder if you invested $10,000 in the Fund over the time periods shown and you redeem all your shares at the end of those periods. The example assumes that the average annual return was 5%, operating expenses remained the same, and expenses were capped for one year in each period.
Although your actual costs may be higher or lower, based on the above assumptions, your costs would be:
| | | | | | | | | | | | | | | | |
| | | 1 Year | | | 3 Years | | | 5 Years | | | 10 Years | |
| Class N Shares | | $ | 122 | | | $ | 483 | | | $ | 867 | | | $ | 1,947 | |
| Class I Shares | | | 97 | | | | 405 | | | | 736 | | | | 1,672 | |
PORTFOLIO TURNOVER
The Fund pays transaction costs, such as commissions, when it buys and sells securities (or “turns over” its portfolio). A higher portfolio turnover rate may indicate higher transaction costs and may result in higher taxes when Fund shares are held in a taxable account. These costs, which are not reflected in annual Fund operating expenses or in the example, affect the Fund’s performance. During the most recent fiscal year, the Fund’s portfolio turnover rate was 52.56%.
PRINCIPAL INVESTMENT STRATEGIES
Under normal circumstances, the Fund invests at least 80% of its assets in equity securities. The portfolio managers seek opportunities across the growth/value spectrum, resulting in what is generally considered a diversified “core” portfolio.
The portfolio managers’ investment process focuses on bottom-up stock selection with the goal of identifying companies that possess a sustainable competitive advantage combined with an attractive valuation. A sustainable competitive advantage may be derived from a unique product or service offering, a capable and proven management team, and sound financials.
Through the use of both qualitative and quantitative evaluation, the portfolio managers seek securities that meet the specific criteria of one of three investment categories: leaders (leading market share and above average profitability), laggards (companies undergoing a restructuring), and innovators (dedication to introducing new products or services).
The Fund may invest in real estate investment trusts (“REITs”), foreign securities (directly and through depositary receipts), below investment grade securities, and convertible bonds. The Fund may invest in options on securities and securities indices for hedging purposes or to seek capital appreciation. For example, the portfolio managers may purchase call options on securities they believe possess appreciation potential. Conversely, the portfolio managers may sell covered call options on securities held in the portfolio.
To manage risk, the portfolio managers limit position sizes, diversify across both market sectors and capitalization, and adhere to a strong sell discipline.
Prospectus | 12
PRINCIPAL RISKS
You could lose money by investing in the Fund. There can be no assurance that the Fund’s investment objective will be achieved. The following is a summary of the principal risks of investing in the Fund.
Below Investment Grade (High Yield) Securities Risk. Bonds and other fixed income securities are rated by national ratings agencies. These ratings generally assess the ability of the issuer to pay principal and interest. Issuers of securities that are rated below investment grade (i.e., Ba1/BB+ or lower) and their unrated equivalents are typically in poor financial health, and their ability to pay interest and principal is uncertain. The prices of such securities may be more vulnerable to bad economic news, or even the expectation of bad news, than higher rated or investment grade bonds and other fixed income securities. These securities are considered speculative and are commonly known as “junk bonds.”
Convertible Risk. Convertible preferred securities are subject to the risks of equity securities and fixed income securities. The lower the premium, the more likely the price of the convertible will follow the price of the underlying common stock. Higher premium convertibles are more likely to exhibit the behavior of bonds because the likelihood of conversion is lower. In that case, the price of convertible preferred shares normally will fall as interest rates rise. Conversely, as rates fall, the price of convertible preferred shares will rise.
The value of convertible securities is also affected by prevailing interest rates, the credit quality of the issuer and any call provisions. There is the risk that the issuer of the security will not be able to make principal and/or interest payments as well as the risk that the holder of the security may not take advantage of the convertible features in the appropriate time frame.
Derivatives Risk. Risks associated with derivatives may include the risk that the derivative is not well correlated with the security, index or currency to which it relates, the risk that derivatives may not have the intended effects and may result in losses or missed opportunities, the risk that the Fund will be unable to sell the derivative because of an illiquid secondary market, the risk that a counterparty is unwilling or unable to meet its obligations, and the risk that the derivative transaction could expose the Fund to the effects of leverage, which could increase the Fund’s exposure to the market and magnify potential losses. There is no guarantee that derivatives, to the extent employed, will have the intended effect, and their use could cause lower returns or even losses to the Fund. The use of derivatives by the Fund to hedge risk may reduce the opportunity for gain by offsetting the positive effect of favorable price movements. The use of over-the-counter derivatives subjects the Fund to credit risk of the counterparty instrument. The use of certain derivatives provides exposure to the underlying market or other reference asset in excess of the cash investment of the Fund. The use of derivatives can magnify gains and losses.
Foreign Securities Risk. Investing in the securities of foreign issuers involves special risks and considerations not typically associated with investing in U.S. companies. The securities of foreign companies may be less liquid and may fluctuate more widely than those traded in U.S. markets. Foreign companies and markets may also have less governmental supervision. There may be difficulty in enforcing contractual obligations and little public information about the companies. Trades typically take more time to settle and clear, and the cost of buying and selling foreign securities is generally higher than similar costs associated with securities traded in U.S. markets.
The value of the securities held by the Fund may be affected by changes in exchange rates or control regulations. If a local currency gains against the U.S. dollar, the value of the holding increases in U.S. dollar terms. If a local currency declines against the U.S. dollar, the value of the holding decreases in U.S. dollar terms. Changes in economic, tax or foreign investment policies, or other political, governmental or economic actions can adversely affect the value of the securities in the Fund. In foreign countries, accounting, auditing and financial reporting standards and other regulatory practices and requirements are generally different from those required for U.S. companies. Investments in securities of foreign issuers may also be subject to foreign withholding and other taxes.
Growth Style Risk. Growth investing involves buying stocks that have relatively high price-to-earnings ratios. Growth stocks may be more volatile than other stocks because they are generally more sensitive to investor perceptions and market moves. During periods of growth stock underperformance, the Fund’s performance may suffer.
Liquidity Risk. When there is no willing buyer and investments cannot be readily sold at the desired time or price, the Fund may need to accept a lower price or may not be able to sell the security at all. An inability to sell securities can adversely affect the Fund’s value or prevent the Fund from being able to take advantage of other investment opportunities. Less liquid securities are more difficult to dispose of at their recorded values and are subject to increased spreads and volatility.
Manager Risk. The performance of the Fund is dependent upon the investment adviser’s skill in selecting managers and the portfolio manager’s skill in making appropriate investments. As a result, the Fund may underperform its benchmark or its peers.
Market Risk. The Fund’s share price can move down in response to stock market conditions, changes in the economy or changes in a particular company’s stock price. An individual stock may decline in value even when the value of stocks in general is rising.
REIT Risk. Securities of REITs may be affected by changes in the values of their underlying properties and by defaults by borrowers or tenants. Some REITs may have limited diversification and may be subject to risks inherent in investments in a limited number of properties, in a narrow geographic area, or in a single property type. Real estate is also affected by general economic conditions. When growth is slowing, demand for property decreases and prices may decline. Rising interest rates, which drive up mortgage and financing costs, can restrain construction and buying and selling activity, and may reduce the appeal of real estate investments. REITs depend generally on their ability to generate cash flow to make distributions to shareholders or unitholders, and may be subject to defaults by borrowers and self-liquidations. A REIT’s return may be adversely affected when interest rates are high or rising. Distributions from REITs generally are taxed as ordinary income for federal income tax purposes.
Prospectus | 13
Value Style Risk. Value investing involves buying stocks that are out of favor and/or undervalued in comparison to their peers or their prospects for growth. Typically, their valuation levels are less than those of growth stocks. Because different types of stocks go out of favor with investors depending on market and economic conditions, the Fund’s return may be adversely affected during a market downturn and when value stocks are out of favor.
FUND PERFORMANCE
The bar chart shows how the Fund’s performance of Class N shares of the Fund has varied from year to year over the periods shown. Class N shares and Class I shares are invested in the same portfolio of securities, so the annual returns would differ only to the extent that the classes have different expenses. The annual returns of the Class I shares would be higher than the returns of the Class N shares due to 12b-1 fees paid by Class N shares. This information may help illustrate the risks of investing in the Fund. The Fund makes updated performance information available on the Fund’s website, www.astonfunds.com, or by calling 800-992-8151. As with all mutual funds, past performance (before and after taxes) does not guarantee future performance.
Class N Shares
Calendar Year Total Return
| | | | | | | | | | |
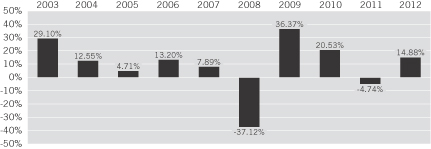 | | | | | | | | | | |
| | Best quarter: | | | 06/03 | | | | 19.96 | % |
| | Worst quarter: | | | 12/08 | | | | (23.58 | )% |
| | | | | | | | | | |
| | | | | | | | | | |
| | | | | | | | | | |
The table below indicates how the Fund’s average annual returns for different calendar periods compared to the returns of a broad-based securities market index.
Average Annual Total Returns
(For the periods ended December 31, 2012)
| | | | | | | | | | | | | | | | |
| | | ASTON/TAMRO Diversified Equity Fund(a) | |
| | | 1 Year | | | 5 Years | | | 10 Years | | | Since Inception | |
| Class N Shares (Inception 11/30/00): | | | | | | | | | | | | | | | | |
Return Before Taxes | | | 14.88 | % | | | 2.49 | % | | | 7.71 | % | | | 5.07 | % |
Return After Taxes on Distributions | | | 14.83 | % | | | 2.40 | % | | | 7.28 | % | | | 4.69 | % |
Return After Taxes on Distributions and Sale of Fund Shares | | | 9.74 | % | | | 2.12 | % | | | 6.76 | % | | | 4.38 | % |
| Russell 1000 Index (Reflects no deduction for taxes, expenses or fees.) | | | 16.42 | % | | | 1.92 | % | | | 7.52 | % | | | 3.03 | % |
| (a) | Class I shares commenced operations on February 29, 2012, therefore no returns are shown for Class I shares. |
As of June 30, 2009, the Fund changed its name from ASTON/TAMRO All Cap Fund to ASTON/TAMRO Diversified Equity Fund. As of January 1, 2008, the Fund changed its name from ASTON/TAMRO Large Cap Value Fund to ASTON/TAMRO All Cap Fund. Performance prior to such times reflects the Fund’s former strategy and the performance may have differed if the current strategy was in place.
After-tax returns are calculated using the historical highest individual federal marginal income tax rates and do not reflect the impact of state and local taxes. After-tax returns depend on an investor’s tax situation and may differ from those shown. After-tax returns shown are not relevant to investors who hold their shares through tax-deferred arrangements, such as 401(k) plans or individual retirement accounts. After-tax returns are shown only for Class N shares. After-tax returns for Class I shares will vary.
MANAGEMENT
Aston Asset Management, LP serves as investment adviser to the Fund. TAMRO Capital Partners, LLC (“TAMRO”) serves as the subadviser to the Fund.
Mr. Philip D. Tasho, CFA, Chief Executive Officer and Chief Investment Officer of TAMRO, and Mr. Timothy A. Holland, CFA, a principal for TAMRO, serve as Portfolio Managers of the Fund. Mr. Tasho has served as Portfolio Manager of the Fund since November 2000. Mr. Holland has served as Portfolio Manager of the Fund since March 2010.
PURCHASE AND SALE OF FUND SHARES
Shares of the Fund may be purchased, exchanged, or redeemed on any business day by written request (Aston Funds, P.O. Box 9765, Providence, RI 02940), wire transfer, online access (www.astonfunds.com), or by telephone (800-992-8151). Investors who wish to purchase, exchange or redeem Fund shares through a broker-dealer should contact the broker-dealer directly.
Prospectus | 14
| | | | | | | | |
| Class and Account Type | | Minimum Initial Investment | | | Subsequent Investments | |
| Class N—Regular Accounts | | $ | 2,500 | | | $ | 50 | |
| Individual Retirement Accounts (IRAs) | | $ | 500 | | | $ | 50 | |
| Education Savings Accounts (ESAs) | | $ | 500 | | | $ | 50 | |
| Custodial Accounts for Minors (UGMA/UTMA) | | $ | 500 | | | $ | 50 | |
| Class I—Institutional Accounts | | $ | 1 Million | | | $ | 50 | |
TAX INFORMATION
The Fund’s distributions are generally taxable as ordinary income or capital gains for federal income tax purposes, unless you are investing through a tax-deferred account such as a 401(k) or individual retirement account. Distributions on investments made through tax-deferred vehicles, such as 401(k) plans or IRAs, may be taxed later upon withdrawal of assets from those plans or accounts.
PAYMENTS TO BROKER-DEALERS AND OTHER FINANCIAL INTERMEDIARIES
If you purchase shares of the Fund through a broker-dealer or other financial intermediary (such as a bank), the Fund and its related companies may pay the intermediary for the sale of shares and related services. These payments may create a conflict of interest by influencing the broker-dealer or other intermediary and your salesperson to recommend the Fund over another investment. Ask your salesperson or visit your financial intermediary’s website for more information.
Prospectus | 15
ASTON/River Road Dividend All Cap Value Fund
INVESTMENT OBJECTIVES
The Fund seeks to provide high current income and, secondarily, long-term capital appreciation.
FEES AND EXPENSES
The table below describes the fees and expenses that you may pay if you buy and hold shares of the Fund.
ANNUAL FUND OPERATING EXPENSES
(expenses that you pay each year as a percentage of the value of your investment)
| | | | | | | | |
| | | Class N Shares | | | Class I Shares | |
| Management Fees | | | 0.70 | % | | | 0.70 | % |
| Distribution and Service (12b-1) Fees | | | 0.25 | % | | | None | |
| Other Expenses | | | 0.17 | % | | | 0.17 | % |
| Acquired Fund Fees and Expenses | | | 0.01 | % | | | 0.01 | % |
| Total Annual Fund Operating Expenses | | | 1.13 | % | | | 0.88 | % |
Example
This example is intended to help you compare the cost of investing in the Fund with the cost of investing in other mutual funds. The example shows the operating expenses you would incur as a shareholder if you invested $10,000 in the Fund over the time periods shown and you redeem all your shares at the end of those periods. The example assumes that the average annual return was 5% and operating expenses remained the same.
Although your actual costs may be higher or lower, based on the above assumptions, your costs would be:
| | | | | | | | | | | | | | | | |
| | | 1 Year | | | 3 Years | | | 5 Years | | | 10 Years | |
| Class N Shares | | $ | 115 | | | $ | 359 | | | $ | 622 | | | $ | 1,375 | |
| Class I Shares | | | 90 | | | | 281 | | | | 488 | | | | 1,084 | |
PORTFOLIO TURNOVER
The Fund pays transaction costs, such as commissions, when it buys and sells securities (or “turns over” its portfolio). A higher portfolio turnover rate may indicate higher transaction costs and may result in higher taxes when Fund shares are held in a taxable account. These costs, which are not reflected in annual Fund operating expenses or in the example, affect the Fund’s performance. During the most recent fiscal year, the Fund’s portfolio turnover rate was 28.17%.
PRINCIPAL INVESTMENT STRATEGIES
Under normal conditions, the Fund invests at least 80% of its assets in equity securities. The Fund invests in a diversified, all-cap portfolio of income-producing equity securities with yields that the portfolio managers believe will exceed the Russell 3000 Value Index. The Fund invests primarily in dividend paying common stocks, publicly traded partnerships (“PTPs”), and real estate investment trusts (“REITs”). The Fund may also invest in foreign securities (directly and through depositary receipts), closed-end funds or other investment companies, convertible preferred stocks and royalty income trusts. Using systematic and dynamic internal research through multiple sources, the portfolio managers narrow the field of companies into a more refined working universe. The portfolio managers then employ a value-driven, bottom-up approach that seeks to identify companies that they believe have certain characteristics including:
| n | | High, growing dividend yield |
| n | | Priced at a discount to absolute value |
| n | | Attractive business model |
| n | | Shareholder-oriented management |
| n | | Undiscovered, underfollowed, misunderstood companies |
To manage risk, the portfolio managers employ a structured sell discipline and a strategy of balanced diversification.
PRINCIPAL RISKS
You could lose money by investing in the Fund. There can be no assurance that the Fund’s investment objective will be achieved. The following is a summary of the principal risks of investing in the Fund.
Convertible Risk. Convertible preferred securities are subject to the risks of equity securities and fixed income securities. The lower the premium, the more likely the price of the convertible will follow the price of the underlying common stock. Higher premium convertibles are more likely to exhibit the behavior of
Prospectus | 16
bonds because the likelihood of conversion is lower. In that case, the price of convertible preferred shares normally will fall as interest rates rise. Conversely, as rates fall, the price of convertible preferred shares will rise.
The value of convertible securities is also affected by prevailing interest rates, the credit quality of the issuer and any call provisions. There is the risk that the issuer of the security will not be able to make principal and/or interest payments as well as the risk that the holder of the security may not take advantage of the convertible features in the appropriate time frame.
Foreign Securities Risk. Investing in the securities of foreign issuers involves special risks and considerations not typically associated with investing in U.S. companies. The securities of foreign companies may be less liquid and may fluctuate more widely than those traded in U.S. markets. Foreign companies and markets may also have less governmental supervision. There may be difficulty in enforcing contractual obligations and little public information about the companies. Trades typically take more time to settle and clear, and the cost of buying and selling foreign securities is generally higher than similar costs associated with securities traded in U.S. markets.
The value of the securities held by the Fund may be affected by changes in exchange rates or control regulations. If a local currency gains against the U.S. dollar, the value of the holding increases in U.S. dollar terms. If a local currency declines against the U.S. dollar, the value of the holding decreases in U.S. dollar terms. Changes in economic, tax or foreign investment policies, or other political, governmental or economic actions can adversely affect the value of the securities in the Fund. In foreign countries, accounting, auditing and financial reporting standards and other regulatory practices and requirements are generally different from those required for U.S. companies. Investments in securities of foreign issuers may also be subject to foreign withholding and other taxes.
Investment Company Risk. The Fund may invest in securities of other investment companies, including ETFs, open-end funds and closed-end funds. The risks of investment in other investment companies typically reflect the risks of the types of securities in which the funds invest. Investments in ETFs and closed-end funds are subject to the additional risk that shares of the fund may trade at a premium or discount to their net asset value per share. When the Fund invests in another investment company, shareholders of the Fund bear their proportionate share of the other investment company’s fees and expenses as well as their share of the Fund’s fees and expenses.
Liquidity Risk. When there is no willing buyer and investments cannot be readily sold at the desired time or price, the Fund may need to accept a lower price or may not be able to sell the security at all. An inability to sell securities can adversely affect the Fund’s value or prevent the Fund from being able to take advantage of other investment opportunities. Less liquid securities are more difficult to dispose of at their recorded values and are subject to increased spreads and volatility.
Manager Risk. The performance of the Fund is dependent upon the investment adviser’s skill in selecting managers and the portfolio manager’s skill in making appropriate investments. As a result, the Fund may underperform its benchmark or its peers.
Market Risk. The Fund’s share price can move down in response to stock market conditions, changes in the economy or changes in a particular company’s stock price. An individual stock may decline in value even when the value of stocks in general is rising.
PTP Risk. Investing in publicly traded partnerships (including master limited partnerships) involves risks not typically associated with publicly traded companies. PTPs are exposed to the risks of their underlying assets, which in many cases includes the same types of risks as energy and natural resources companies, such as commodity pricing risk, supply and demand risk and depletion and exploration risk. PTPs are also subject to capital markets risk, which is the risk that they are unable to raise capital to execute their growth strategies. PTPs are also subject to tax risk, which is the risk that they lose their partnership status for tax purposes.
REIT Risk. Securities of REITs may be affected by changes in the values of their underlying properties and by defaults by borrowers or tenants. Some REITs may have limited diversification and may be subject to risks inherent in investments in a limited number of properties, in a narrow geographic area, or in a single property type. Real estate is also affected by general economic conditions. When growth is slowing, demand for property decreases and prices may decline. Rising interest rates, which drive up mortgage and financing costs, can restrain construction and buying and selling activity, and may reduce the appeal of real estate investments. REITs depend generally on their ability to generate cash flow to make distributions to shareholders or unitholders, and may be subject to defaults by borrowers and self-liquidations. A REIT’s return may be adversely affected when interest rates are high or rising. Distributions from REITs generally are taxed as ordinary income for federal income tax purposes.
Royalty Income Trust Risk. Investing in royalty income trusts involves risks not typically associated with publicly traded companies. Royalty income trusts are exposed to many of the same risks as energy and natural resources companies, such as commodity pricing risk, supply and demand risk and depletion and exploration risk. Royalty income trusts are also subject to capital markets risk, which is the risk that they are unable to raise capital to execute their growth strategies.
Small-Cap and Mid-Cap Company Risk. Investing in securities of small-cap and mid-cap companies may involve greater risks than investing in securities of larger, more established issuers. Small-cap and mid-cap companies generally have limited product lines, markets and financial resources. Their securities may trade less frequently and in more limited volume than the securities of larger, more established companies. Also, small-cap and mid-cap companies are typically subject to greater changes in earnings and business prospects than larger companies. As a result, their stock prices may experience greater volatility and may decline significantly in market downturns.
Value Style Risk. Value investing involves buying stocks that are out of favor and/or undervalued in comparison to their peers or their prospects for growth. Typically, their valuation levels are less than those of growth stocks. Because different types of stocks go out of favor with investors depending on market and economic conditions, the Fund’s return may be adversely affected during a market downturn and when value stocks are out of favor.
Prospectus | 17
FUND PERFORMANCE
The bar chart shows how the performance of the Class N shares of the Fund has varied from year to year over the periods shown. Class N shares and Class I shares are invested in the same portfolio of securities, so the annual returns would differ only to the extent that the classes have different expenses. The annual returns of the Class I shares would be higher than the returns of the Class N shares due to 12b-1 fees paid by Class N shares. This information may help illustrate the risks of investing in the Fund. The Fund makes updated performance information available on the Fund’s website, www.astonfunds.com, or by calling 800-992-8151. As with all mutual funds, past performance (before and after taxes) does not guarantee future performance.
Class N Shares
Calendar Year Total Return
| | | | | | | | | | |
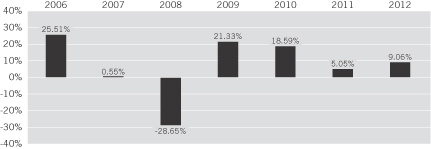 | | | | | | | | | | |
| | Best quarter: | | | 09/09 | | | | 12.76 | % |
| | Worst quarter: | | | 12/08 | | | | (19.54 | )% |
| | | | | | | | | | |
| | | | | | | | | | |
| | | | | | | | | | |
The following table indicates how the Fund’s average annual returns for different calendar periods compared to the returns of a broad-based securities market index.
Average Annual Total Returns
(For the periods ended December 31, 2012)
| | | | | | | | | | | | |
| | | ASTON/River Road Dividend All Cap Value Fund | |
| | | 1 Year | | | 5 Years | | | Since Inception | |
| Class N Shares (Inception 6/28/05): | | | | | | | | | | | | |
Return Before Taxes | | | 9.06 | % | | | 3.30 | % | | | 5.96 | % |
Return After Taxes on Distributions | | | 7.90 | % | | | 2.74 | % | | | 5.13 | % |
Return After Taxes on Distributions and Sale of Fund Shares | | | 7.27 | % | | | 2.75 | % | | | 4.96 | % |
| Class I Shares (Inception 6/28/07): | | | | | | | | | | | | |
Return Before Taxes | | | 9.35 | % | | | 3.55 | % | | | 2.06 | % |
| Russell 3000 Value Index (Reflects no deduction for taxes, expenses or fees. Index return since inception for Class N shares is computed from June 30, 2005. Index return for Class I shares, since inception, computed from June 30, 2007, is (0.50)%.) | | | 17.55 | % | | | 0.83 | % | | | 3.83 | % |
After-tax returns are calculated using the historical highest individual federal marginal income tax rates and do not reflect the impact of state and local taxes. After-tax returns depend on an investor’s tax situation and may differ from those shown. After-tax returns shown are not relevant to investors who hold their shares through tax-deferred arrangements, such as 401(k) plans or individual retirement accounts. After-tax returns are shown only for Class N shares. After-tax returns for Class I shares will vary.
MANAGEMENT
Aston Asset Management, LP serves as investment adviser to the Fund. River Road Asset Management, LLC (“River Road”) serves as the subadviser to the Fund.
Mr. Henry W. Sanders, CFA, Executive Vice President of River Road, serves as Lead Portfolio Manager of the Fund, Mr. Thomas S. Forsha, CFA, Vice President of River Road, and Mr. James C. Shircliff, CFA, Chief Investment Officer of River Road, serve as Co-Portfolio Managers of the Fund. Mr. Shircliff and Mr. Sanders have served as the Fund’s Portfolio Managers since June 2005. Mr. Forsha has served as the Fund’s Portfolio Manager since June 2007.
Prospectus | 18
PURCHASE AND SALE OF FUND SHARES*
Shares of the Fund may be purchased, exchanged, or redeemed on any business day by written request (Aston Funds, P.O. Box 9765, Providence, RI 02940), wire transfer, online access (www.astonfunds.com), or by telephone (800-992-8151). Investors who wish to purchase, exchange or redeem Fund shares through a broker-dealer should contact the broker-dealer directly.
| | | | | | | | |
| Class and Account Type | | Minimum Initial Investment | | | Subsequent Investments | |
| Class N—Regular Accounts | | $ | 2,500 | | | $ | 50 | |
| Individual Retirement Accounts (IRAs) | | $ | 500 | | | $ | 50 | |
| Education Savings Accounts (ESAs) | | $ | 500 | | | $ | 50 | |
| Custodial Accounts for Minors (UGMA/UTMA) | | $ | 500 | | | $ | 50 | |
| Class I—Institutional Accounts | | $ | 1 Million | | | $ | 50 | |
| * | The Fund is currently accepting additional investments from existing investors only. The Fund will remain closed to new investors until further notice, with certain limited exceptions as listed in the “Shareholder Information” Section of the statutory prospectus. |
TAX INFORMATION
The Fund’s distributions are generally taxable as ordinary income or capital gains for federal income tax purposes, unless you are investing through a tax-deferred account such as a 401(k) or individual retirement account. Distributions on investments made through tax-deferred vehicles, such as 401(k) plans or IRAs, may be taxed later upon withdrawal of assets from those plans or accounts.
PAYMENTS TO BROKER-DEALERS AND OTHER FINANCIAL INTERMEDIARIES
If you purchase shares of the Fund through a broker-dealer or other financial intermediary (such as a bank), the Fund and its related companies may pay the intermediary for the sale of shares and related services. These payments may create a conflict of interest by influencing the broker-dealer or other intermediary and your salesperson to recommend the Fund over another investment. Ask your salesperson or visit your financial intermediary’s website for more information.
Prospectus | 19
ASTON/River Road Dividend All Cap Value Fund II
INVESTMENT OBJECTIVES
The Fund seeks to provide long term capital appreciation and high current income.
FEES AND EXPENSES
The table below describes the fees and expenses that you may pay if you buy and hold shares of the Fund.
ANNUAL FUND OPERATING EXPENSES
(expenses that you pay each year as a percentage of the value of your investment)
| | | | | | | | |
| | | Class N Shares | | | Class I Shares | |
| Management Fees | | | 0.70 | % | | | 0.70 | % |
| Distribution and Service (12b-1) Fees | | | 0.25 | % | | | None | |
| Other Expenses | | | 4.04 | % | | | 4.04 | % |
| Acquired Fund Fees and Expenses | | | 0.01 | % | | | 0.01 | % |
| Total Annual Fund Operating Expenses | | | 5.00 | % | | | 4.75 | % |
Fee Waiver and/or Expense Reimbursement | | | (3.69 | )% (a) | | | (3.69 | ) %(a) |
| Total Annual Fund Operating Expenses After Fee Waiver and/or Expense Reimbursement | | | 1.31 | %(a) | | | 1.06 | %(a) |
| (a) | The adviser is contractually obligated to waive management fees and/or reimburse ordinary operating expenses, not including investment-related costs (such as brokerage commissions), interest, taxes, extraordinary expenses and acquired fund fees and expenses, through February 28, 2014, to the extent that operating expenses exceed 1.30% of the Fund’s average daily net assets with respect to Class N shares and 1.05% of the Fund’s average daily net assets with respect to Class I shares (the “Operating Expense Limit”). Prior to February 28, 2014, the arrangement may be amended or terminated for a class only by a vote of the Board of Trustees of Aston Funds. For a period of up to three years from the fiscal year end during which such amount was waived or reimbursed, the adviser is entitled to be reimbursed by the Fund for fees waived and expenses reimbursed from the commencement of operations through the completion of the first three full fiscal years to the extent that the Fund’s Total Annual Operating Expenses for a class, not including investment-related costs (such as brokerage commissions), interest, taxes, extraordinary expenses and acquired fund fees and expenses, remains below the Operating Expense Limit after such reimbursement. |
Example
This example is intended to help you compare the cost of investing in the Fund with the cost of investing in other mutual funds. The example shows the operating expenses you would incur as a shareholder if you invested $10,000 in the Fund over the time periods shown and you redeem all your shares at the end of those periods. The example assumes that the average annual return was 5%, operating expenses remained the same and expenses were capped for one year in each period.
Although your actual costs may be higher or lower, based on the above assumptions, your costs would be:
| | | | | | | | |
| | | 1 Year | | | 3 Years | |
| Class N Shares | | $ | 133 | | | $ | 1,170 | |
| Class I Shares | | | 108 | | | | 1,098 | |
PORTFOLIO TURNOVER
The Fund pays transaction costs, such as commissions, when it buys and sells securities (or “turns over” its portfolio). A higher portfolio turnover rate may indicate higher transaction costs and may result in higher taxes when Fund shares are held in a taxable account. These costs, which are not reflected in annual Fund operating expenses or in the example, affect the Fund’s performance. For the period from June 27, 2012, when the Fund commenced investment operations, through the Fund’s fiscal year end on October 31, 2012, the Fund’s portfolio turnover rate was 5.58%.
PRINCIPAL INVESTMENT STRATEGIES
Under normal conditions the Fund invests at least 80% of its assets in equity securities. The Fund invests in a diversified, all-cap portfolio of income-producing equity securities, typically of companies with a market capitalization of at least $1 billion at the time of initial purchase. The portfolio managers seek to obtain a portfolio yield that exceeds the Russell 3000 Value Index. The Fund invests primarily in dividend-paying common stocks, publicly traded partnerships (“PTPs”), and real estate investment trusts (“REITs”). The Fund may also invest in foreign securities (directly and through depositary receipts), closed-end funds or other investment companies, convertible preferred stocks and royalty income trusts. Using a proprietary research process, the portfolio managers narrow the field of potential investments into a more refined working universe. The portfolio managers then employ a value-driven, bottom-up approach that seeks to identify companies that they believe have certain characteristics including:
| n | | High, growing dividend yield |
| n | | Priced at a discount to absolute value |
| n | | Attractive business model |
| n | | Shareholder-oriented management |
| n | | Undiscovered, underfollowed, misunderstood companies |
To manage risk, the portfolio managers employ a structured sell discipline and a strategy of balanced diversification.
Prospectus | 20
PRINCIPAL RISKS
You could lose money by investing in the Fund. There can be no assurance that the Fund’s investment objective will be achieved. The following is a summary of the principal risks of investing in the Fund.
Convertible Risk. Convertible preferred securities are subject to the risks of equity securities and fixed income securities. The lower the premium, the more likely the price of the convertible will follow the price of the underlying common stock. Higher premium convertibles are more likely to exhibit the behavior of bonds because the likelihood of conversion is lower. In that case, the price of convertible preferred shares normally will fall as interest rates rise. Conversely, as rates fall, the price of convertible preferred shares will rise.
The value of convertible securities is also affected by prevailing interest rates, the credit quality of the issuer and any call provisions. There is the risk that the issuer of the security will not be able to make principal and/or interest payments as well as the risk that the holder of the security may not take advantage of the convertible features in the appropriate time frame.
Foreign Securities Risk. Investing in the securities of foreign issuers involves special risks and considerations not typically associated with investing in U.S. companies. The securities of foreign companies may be less liquid and may fluctuate more widely than those traded in U.S. markets. Foreign companies and markets may also have less governmental supervision. There may be difficulty in enforcing contractual obligations and little public information about the companies. Trades typically take more time to settle and clear, and the cost of buying and selling foreign securities is generally higher than similar costs associated with securities traded in U.S. markets.
The value of the securities held by the Fund may be affected by changes in exchange rates or control regulations. If a local currency gains against the U.S. dollar, the value of the holding increases in U.S. dollar terms. If a local currency declines against the U.S. dollar, the value of the holding decreases in U.S. dollar terms. Changes in economic, tax or foreign investment policies, or other political, governmental or economic actions can adversely affect the value of the securities in the Fund. In foreign countries, accounting, auditing and financial reporting standards and other regulatory practices and requirements are generally different from those required for U.S. companies. Investments in securities of foreign issuers may also be subject to foreign withholding and other taxes.
Investment Company Risk. The Fund may invest in securities of other investment companies, including ETFs, open-end funds and closed-end funds. The risks of investment in other investment companies typically reflect the risks of the types of securities in which the funds invest. Investments in ETFs and closed-end funds are subject to the additional risk that shares of the fund may trade at a premium or discount to their net asset value per share. When the Fund invests in another investment company, shareholders of the Fund bear their proportionate share of the other investment company’s fees and expenses as well as their share of the Fund’s fees and expenses.
Liquidity Risk. When there is no willing buyer and investments cannot be readily sold at the desired time or price, the Fund may need to accept a lower price or may not be able to sell the security at all. An inability to sell securities can adversely affect the Fund’s value or prevent the Fund from being able to take advantage of other investment opportunities. Less liquid securities are more difficult to dispose of at their recorded values and are subject to increased spreads and volatility.
Manager Risk. The performance of the Fund is dependent upon the investment adviser’s skill in selecting managers and the portfolio manager’s skill in making appropriate investments. As a result, the Fund may underperform its benchmark or its peers.
Market Risk. The Fund’s share price can move down in response to stock market conditions, changes in the economy or changes in a particular company’s stock price. An individual stock may decline in value even when the value of stocks in general is rising.
PTP Risk. Investing in publicly traded partnerships (including master limited partnerships) involves risks not typically associated with publicly traded companies. PTPs are exposed to the risks of their underlying assets, which in many cases include the same types of risks as energy and natural resources companies, such as commodity pricing risk, supply and demand risk and depletion and exploration risk. PTPs are also subject to capital markets risk, which is the risk that they are unable to raise capital to execute their growth strategies. PTPs are also subject to tax risk, which is the risk that they lose their partnership status for tax purposes.
REIT Risk. Securities of REITs may be affected by changes in the values of their underlying properties and by defaults by borrowers or tenants. Some REITs may have limited diversification and may be subject to risks inherent in investments in a limited number of properties, in a narrow geographic area, or in a single property type. Real estate is also affected by general economic conditions. When growth is slowing, demand for property decreases and prices may decline. Rising interest rates, which drive up mortgage and financing costs, can restrain construction and buying and selling activity, and may reduce the appeal of real estate investments. REITs depend generally on their ability to generate cash flow to make distributions to shareholders or unitholders, and may be subject to defaults by borrowers and self-liquidations. A REIT’s return may be adversely affected when interest rates are high or rising. Distributions from REITs generally are taxed as ordinary income for federal income tax purposes.
Royalty Income Trust Risk. Investing in royalty income trusts involves risks not typically associated with publicly traded companies. Royalty income trusts are exposed to many of the same risks as energy and natural resources companies, such as commodity pricing risk, supply and demand risk and depletion and exploration risk. Royalty income trusts are also subject to capital markets risk, which is the risk that they are unable to raise capital to execute their growth strategies.
Small-Cap and Mid-Cap Company Risk. Investing in securities of small-cap and mid-cap companies may involve greater risks than investing in securities of larger, more established issuers. Small-cap and mid-cap companies generally have limited product lines, markets and financial resources. Their securities may trade less frequently and in more limited volume than the securities of larger, more established companies. Also, small-cap and mid-cap companies are typically subject to greater changes in earnings and business prospects than larger companies. As a result, their stock prices may experience greater volatility and may decline significantly in market downturns.
Prospectus | 21
Value Style Risk. Value investing involves buying stocks that are out of favor and/or undervalued in comparison to their peers or their prospects for growth. Typically, their valuation levels are less than those of growth stocks. Because different types of stocks go out of favor with investors depending on market and economic conditions, the Fund’s return may be adversely affected during a market downturn and when value stocks are out of favor.
FUND PERFORMANCE
The Fund does not have a full calendar year of operations. Performance information will be included in the Fund’s shareholder reports.
MANAGEMENT
Aston Asset Management, LP serves as the investment adviser to the Fund. River Road Asset Management, LLC (“River Road”) serves as the subadviser to the Fund.
Mr. Henry W. Sanders, CFA, Executive Vice President of River Road, serves as Lead Portfolio Manager of the Fund. Mr. Thomas S. Forsha, CFA, Vice President of River Road, and Mr. James C. Shircliff, CFA, Chief Investment Officer of River Road, serve as Co-Portfolio Managers of the Fund. Mr. Sanders, Mr. Forsha, and Mr. Shircliff have served as the Fund’s Portfolio Managers since the Fund’s inception in June 2012.
PURCHASE AND SALE OF FUND SHARES
Shares of the Fund may be purchased, exchanged, or redeemed on any business day by written request (Aston Funds, P.O. Box 9765, Providence, RI 02940), wire transfer, online access (www.astonfunds.com), or by telephone (800-992-8151). Investors who wish to purchase, exchange or redeem Fund shares through a broker-dealer should contact the broker-dealer directly.
| | | | | | | | |
| Class and Account Type | | Minimum Initial Investment | | | Subsequent Investments | |
| Class N—Regular Accounts | | $ | 2,500 | | | $ | 50 | |
| Individual Retirement Accounts (IRAs) | | $ | 500 | | | $ | 50 | |
| Education Savings Accounts (ESAs) | | $ | 500 | | | $ | 50 | |
| Custodial Accounts for Minors (UGMA/UTMA) | | $ | 500 | | | $ | 50 | |
| Class I—Institutional Accounts | | $ | 100,000 | | | $ | 50 | |
TAX INFORMATION
The Fund’s distributions are generally taxable as ordinary income or capital gains for federal income tax purposes, unless you are investing through a tax-deferred account such as a 401(k) or individual retirement account. Distributions on investments made through tax-deferred vehicles, such as 401(k) plans or IRAs, may be taxed later upon withdrawal of assets from those plans or accounts.
PAYMENTS TO BROKER-DEALERS AND OTHER FINANCIAL INTERMEDIARIES
If you purchase shares of the Fund through a broker-dealer or other financial intermediary (such as a bank), the Fund and its related companies may pay the intermediary for the sale of shares and related services. These payments may create a conflict of interest by influencing the broker-dealer or other intermediary and your salesperson to recommend the Fund over another investment. Ask your salesperson or visit your financial intermediary’s website for more information.
Prospectus | 22
ASTON/Fairpointe Mid Cap Fund
INVESTMENT OBJECTIVE
The Fund seeks long-term total return through capital appreciation by investing primarily in common and preferred stocks and convertible securities.
FEES AND EXPENSES
The table below describes the fees and expenses that you may pay if you buy and hold shares of the Fund.
ANNUAL FUND OPERATING EXPENSES
(expenses that you pay each year as a percentage of the value of your investment)
| | | | | | | | |
| | | Class N Shares | | | Class I Shares | |
| Management Fees | | | 0.71 | % | | | 0.71 | % |
| Distribution and Service (12b-1) Fees | | | 0.25 | % | | | None | |
| Other Expenses | | | 0.15 | % | | | 0.15 | % |
| Total Annual Fund Operating Expenses | | | 1.11 | % | | | 0.86 | % |
Example
This example is intended to help you compare the cost of investing in the Fund with the cost of investing in other mutual funds. The example shows the operating expenses you would incur as a shareholder if you invested $10,000 in the Fund over the time periods shown and you redeem all your shares at the end of those periods. The example assumes that the average annual return was 5% and operating expenses remained the same.
Although your actual costs may be higher or lower, based on the above assumptions, your costs would be:
| | | | | | | | | | | | | | | | |
| | | 1 Year | | | 3 Years | | | 5 Years | | | 10 Years | |
| Class N Shares | | $ | 113 | | | $ | 353 | | | $ | 612 | | | $ | 1,352 | |
| Class I Shares | | | 88 | | | | 274 | | | | 477 | | | | 1,061 | |
PORTFOLIO TURNOVER
The Fund pays transaction costs, such as commissions, when it buys and sells securities (or “turns over” its portfolio). A higher portfolio turnover rate may indicate higher transaction costs and may result in higher taxes when Fund shares are held in a taxable account. These costs, which are not reflected in annual Fund operating expenses or in the example, affect the Fund’s performance. During the most recent fiscal year, the Fund’s portfolio turnover rate was 28.06%.
PRINCIPAL INVESTMENT STRATEGIES
Under normal conditions, the Fund invests at least 80% of its assets in mid-cap stocks of companies with an improving revenue and earnings growth outlook. The Fund defines a mid-cap company as one having a market capitalization of between $1 and $12 billion at the time of acquisition. The portfolio managers select approximately 40 – 50 stocks based on bottom-up fundamental analysis.
Important investment criteria include:
| n | | Focused business franchise with ability to grow market share |
The portfolio managers take a long-term approach with a focus on maximizing after-tax returns.
The Fund may invest in small-cap stocks, convertible securities, and foreign securities (directly and through depositary receipts).
To manage risk, the portfolio managers employ a valuation discipline to limit downside risk, limit position sizes and sector exposure, and adhere to a strong sell discipline.
PRINCIPAL RISKS
You could lose money by investing in the Fund. There can be no assurance that the Fund’s investment objective will be achieved. The following is a summary of the principal risks of investing in the Fund.
Convertible Risk. Convertible preferred securities are subject to the risks of equity securities and fixed income securities. The lower the premium, the more likely the price of the convertible will follow the price of the underlying common stock. Higher premium convertibles are more likely to exhibit the behavior of bonds because the likelihood of conversion is lower. In that case, the price of convertible preferred shares normally will fall as interest rates rise. Conversely, as rates fall, the price of convertible preferred shares will rise.
Prospectus | 23
The value of convertible securities is also affected by prevailing interest rates, the credit quality of the issuer and any call provisions. There is the risk that the issuer of the security will not be able to make principal and/or interest payments as well as the risk that the holder of the security may not take advantage of the convertible features in the appropriate time frame.
Foreign Securities Risk. Investing in the securities of foreign issuers involves special risks and considerations not typically associated with investing in U.S. companies. The securities of foreign companies may be less liquid and may fluctuate more widely than those traded in U.S. markets. Foreign companies and markets may also have less governmental supervision. There may be difficulty in enforcing contractual obligations and little public information about the companies. Trades typically take more time to settle and clear, and the cost of buying and selling foreign securities is generally higher than similar costs associated with securities traded in U.S. markets.
The value of the securities held by the Fund may be affected by changes in exchange rates or control regulations. If a local currency gains against the U.S. dollar, the value of the holding increases in U.S. dollar terms. If a local currency declines against the U.S. dollar, the value of the holding decreases in U.S. dollar terms. Changes in economic, tax or foreign investment policies, or other political, governmental or economic actions can adversely affect the value of the securities in the Fund. In foreign countries, accounting, auditing and financial reporting standards and other regulatory practices and requirements are generally different from those required for U.S. companies. Investments in securities of foreign issuers may also be subject to foreign withholding and other taxes.
Growth Style Risk. Growth investing involves buying stocks that have relatively high price-to-earnings ratios. Growth stocks may be more volatile than other stocks because they are generally more sensitive to investor perceptions and market moves. During periods of growth stock underperformance, the Fund’s performance may suffer.
Liquidity Risk. When there is no willing buyer and investments cannot be readily sold at the desired time or price, the Fund may need to accept a lower price or may not be able to sell the security at all. An inability to sell securities can adversely affect the Fund’s value or prevent the Fund from being able to take advantage of other investment opportunities. Less liquid securities are more difficult to dispose of at their recorded values and are subject to increased spreads and volatility.
Manager Risk. The performance of the Fund is dependent upon the investment adviser’s skill in selecting managers and the portfolio manager’s skill in making appropriate investments. As a result, the Fund may underperform its benchmark or its peers.
Market Risk. The Fund’s share price can move down in response to stock market conditions, changes in the economy or changes in a particular company’s stock price. An individual stock may decline in value even when the value of stocks in general is rising.
Small-Cap and Mid-Cap Company Risk. Investing in securities of small-cap and mid-cap companies may involve greater risks than investing in securities of larger, more established issuers. Small-cap and mid-cap companies generally have limited product lines, markets and financial resources. Their securities may trade less frequently and in more limited volume than the securities of larger, more established companies. Also, small-cap and mid-cap companies are typically subject to greater changes in earnings and business prospects than larger companies. As a result, their stock prices may experience greater volatility and may decline significantly in market downturns.
Value Style Risk. Value investing involves buying stocks that are out of favor and/or undervalued in comparison to their peers or their prospects for growth. Typically, their valuation levels are less than those of growth stocks. Because different types of stocks go out of favor with investors depending on market and economic conditions, the Fund’s return may be adversely affected during a market downturn and when value stocks are out of favor.
FUND PERFORMANCE
The bar chart shows how the performance of the Class N shares of the Fund has varied from year to year over the periods shown. Class N shares and Class I shares are invested in the same portfolio of securities, so the annual returns would differ only to the extent that the classes have different expenses. The annual returns of the Class I shares would be higher than the returns of the Class N shares due to 12b-1 fees paid by Class N shares. This information may help illustrate the risks of investing in the Fund. The Fund makes updated performance information available on the Fund’s website, www.astonfunds.com, or by calling 800-992-8151. As with all mutual funds, past performance (before and after taxes) does not guarantee future performance.
Class N Shares
Calendar Year Total Return
| | | | | | | | | | |
 | | | | | | | | | | |
| | Best quarter: | | | 06/03 | | | | 30.10 | % |
| | Worst quarter: | | | 12/08 | | | | (29.83 | )% |
| | | | | | | | | | |
| | | | | | | | | | |
| | | | | | | | | | |
Prospectus | 24
The following table indicates how the Fund’s average annual returns for different calendar periods compared to the returns of a broad-based securities market index.
Average Annual Total Returns
(For the periods ended December 31, 2012)
| | | | | | | | | | | | | | | | |
| | | ASTON/Fairpointe Mid Cap Fund | |
| | | 1 Year | | | 5 Years | | | 10 Years | | | Since Inception | |
| Class N Shares (Inception 9/19/94): | | | | | | | | | | | | | | | | |
Return Before Taxes | | | 16.44 | % | | | 4.92 | % | | | 11.45 | % | | | 11.89 | % |
Return After Taxes on Distributions | | | 15.90 | % | | | 4.68 | % | | | 10.98 | % | | | 10.72 | % |
Return After Taxes on Distributions and Sale of Fund Shares | | | 11.39 | % | | | 4.18 | % | | | 10.16 | % | | | 10.19 | % |
| Class I Shares (Inception 7/06/04): | | | | | | | | | | | | | | | | |
Return Before Taxes | | | 16.76 | % | | | 5.18 | % | | | N/A | | | | 7.98 | % |
| S&P MidCap 400 Index (Reflects no deduction for taxes, expenses or fees. Index return since inception for Class N shares is computed from September 30, 1994. Index return for Class I shares, since inception, computed from June 30, 2004, is 7.79%.) | | | 17.88 | % | | | 5.15 | % | | | 10.53 | % | | | 11.65 | % |
Fairpointe Capital LLC (“Fairpointe”) became the subadviser to the Fund on April 30, 2011. Performance prior to that date reflects the performance of previous subadvisers. However, Ms. Zerhusen has served as a portfolio manager since May 1999.
After-tax returns are calculated using the historical highest individual federal marginal income tax rates and do not reflect the impact of state and local taxes. After-tax returns depend on an investor’s tax situation and may differ from those shown. After-tax returns shown are not relevant to investors who hold their shares through tax-deferred arrangements, such as 401(k) plans or individual retirement accounts. After-tax returns are shown only for Class N shares. After-tax returns for Class I shares will vary.
MANAGEMENT
Aston Asset Management, LP serves as investment adviser to the Fund. Fairpointe serves as the subadviser to the Fund.
Ms. Thyra E. Zerhusen, founder, Chief Executive Officer and Chief Investment Officer of Fairpointe, Ms. Marie L. Lorden, partner and portfolio manager of Fairpointe, and Ms. Mary L. Pierson, partner and portfolio manager of Fairpointe, serve as Portfolio Managers of the Fund. Ms. Zerhusen has served as the Fund’s Portfolio Manager since May 1999. Ms. Lorden and Ms. Pierson have served as the Fund’s Co-Portfolio Managers of the Fund since March 2009.
PURCHASE AND SALE OF FUND SHARES
Shares of the Fund may be purchased, exchanged, or redeemed on any business day by written request (Aston Funds, P.O. Box 9765, Providence, RI 02940), wire transfer, online access (www.astonfunds.com), or by telephone (800-992-8151). Investors who wish to purchase, exchange or redeem Fund shares through a broker-dealer should contact the broker-dealer directly.
| | | | | | | | |
| Class and Account Type | | Minimum Initial Investment | | | Subsequent Investments | |
| Class N—Regular Accounts | | $ | 2,500 | | | $ | 50 | |
| Individual Retirement Accounts (IRAs) | | $ | 500 | | | $ | 50 | |
| Education Savings Accounts (ESAs) | | $ | 500 | | | $ | 50 | |
| Custodial Accounts for Minors (UGMA/UTMA) | | $ | 500 | | | $ | 50 | |
| Class I—Institutional Accounts | | $ | 1 Million | | | $ | 50 | |
TAX INFORMATION
The Fund’s distributions are generally taxable as ordinary income or capital gains for federal income tax purposes, unless you are investing through a tax-deferred account such as a 401(k) or individual retirement account. Distributions on investments made through tax-deferred vehicles, such as 401(k) plans or IRAs, may be taxed later upon withdrawal of assets from those plans or accounts.
PAYMENTS TO BROKER-DEALERS AND OTHER FINANCIAL INTERMEDIARIES
If you purchase shares of the Fund through a broker-dealer or other financial intermediary (such as a bank), the Fund and its related companies may pay the intermediary for the sale of shares and related services. These payments may create a conflict of interest by influencing the broker-dealer or other intermediary and your salesperson to recommend the Fund over another investment. Ask your salesperson or visit your financial intermediary’s website for more information.
Prospectus | 25
ASTON/Montag & Caldwell Mid Cap Growth Fund
INVESTMENT OBJECTIVES
The Fund seeks to provide long-term capital appreciation and, secondarily, current income, by investing primarily in common stocks and convertible securities.
FEES AND EXPENSES
The table below describes the fees and expenses that you may pay if you buy and hold shares of the Fund.
ANNUAL FUND OPERATING EXPENSES
(expenses that you pay each year as a percentage of the value of your investment)
| | | | |
| | | Class N Shares | |
| Management Fees | | | 0.85 | % |
| Distribution and Service (12b-1) Fees | | | 0.25 | % |
| Other Expenses | | | 1.40 | % |
| Acquired Fund Fees and Expenses | | | 0.01 | % |
| Total Annual Fund Operating Expenses | | | 2.51 | % |
Fee Waiver and/or Expense Reimbursement | | | (1.25 | )%(a) |
| Total Annual Fund Operating Expenses After Fee Waiver and/or Reimbursement | | | 1.26 | %(a) |
| (a) | The adviser is contractually obligated to waive management fees and/or reimburse ordinary operating expenses, not including investment-related costs (such as brokerage commissions), interest, taxes, extraordinary expenses and acquired fund fees and expenses, through February 28, 2014, to the extent that operating expenses exceed 1.25% of the Fund’s average daily net assets (“Operating Expense Limit”). Prior to February 28, 2014, the arrangement may be amended or terminated only by a vote of the Board of Trustees of Aston Funds. For a period of up to three years from the fiscal year end during which such amount was waived or reimbursed, the adviser is entitled to be reimbursed by the Fund for fees waived and expenses reimbursed from the commencement of operations through the completion of the first three full fiscal years to the extent that the Fund’s Total Annual Operating Expenses, not including investment-related costs (such as brokerage commissions), interest, taxes, extraordinary expenses and acquired fund fees and expenses, remains at or below the Operating Expense Limit after such reimbursement. |
Example
This example is intended to help you compare the cost of investing in the Fund with the cost of investing in other mutual funds. The example shows the operating expenses you would incur as a shareholder if you invested $10,000 in the Fund over the time periods shown and you redeem all your shares at the end of those periods. The example assumes that the average annual return was 5%, operating expenses remained the same, and expenses were capped for one year in each period.
Although your actual costs may be higher or lower, based on the above assumptions, your costs would be:
| | | | | | | | | | | | | | | | |
| | | 1 Year | | | 3 Years | | | 5 Years | | | 10 Years | |
| Class N Shares | | $ | 128 | | | $ | 662 | | | $ | 1,223 | | | $ | 2,752 | |
PORTFOLIO TURNOVER
The Fund pays transaction costs, such as commissions, when it buys and sells securities (or “turns over” its portfolio). A higher portfolio turnover rate may indicate higher transaction costs and may result in higher taxes when Fund shares are held in a taxable account. These costs, which are not reflected in annual Fund operating expenses or in the example, affect the Fund’s performance. During the most recent fiscal year, the Fund’s portfolio turnover rate was 36.60%.
PRINCIPAL INVESTMENT STRATEGIES
The Fund invests primarily in common stocks and convertible securities. Under normal circumstances, the Fund invests at least 80% of its assets in securities of mid-cap companies. The Fund defines a mid-cap company as one having a market capitalization, at the time of acquisition, within the range of market capitalizations of companies constituting the Russell Midcap Growth Index. The market capitalization range of the Russell Midcap Growth Index changes periodically, and the capitalization of mid-cap companies in which the Fund invests also changes. As of December 31, 2012, the market capitalization range of the Russell Midcap Growth Index was approximately $418 million to $24.9 billion.
The portfolio managers use a bottom-up approach to stock selection and seek high quality, well-established mid-cap companies that:
| n | | Offer a compelling combination of earnings growth and attractive value |
| n | | Sell at a discount to intrinsic value |
| n | | Exhibit above-median near-term relative earnings strength |
| n | | Are leading franchises and have proven management teams, strong finances and attractive long-term secular growth characteristics |
The Fund may invest in convertible securities and foreign securities (directly and through depositary receipts).
To manage risk, the portfolio managers adhere to a strong sell discipline.
Prospectus | 26
PRINCIPAL RISKS
You could lose money by investing in the Fund. There can be no assurance that the Fund’s investment objective will be achieved. The following is a summary of the principal risks of investing in the Fund.
Convertible Risk. Convertible preferred securities are subject to the risks of equity securities and fixed income securities. The lower the premium, the more likely the price of the convertible will follow the price of the underlying common stock. Higher premium convertibles are more likely to exhibit the behavior of bonds because the likelihood of conversion is lower. In that case, the price of convertible preferred shares normally will fall as interest rates rise. Conversely, as rates fall, the price of convertible preferred shares will rise.
The value of convertible securities is also affected by prevailing interest rates, the credit quality of the issuer and any call provisions. There is the risk that the issuer of the security will not be able to make principal and/or interest payments as well as the risk that the holder of the security may not take advantage of the convertible features in the appropriate time frame.
Foreign Securities Risk. Investing in the securities of foreign issuers involves special risks and considerations not typically associated with investing in U.S. companies. The securities of foreign companies may be less liquid and may fluctuate more widely than those traded in U.S. markets. Foreign companies and markets may also have less governmental supervision. There may be difficulty in enforcing contractual obligations and little public information about the companies. Trades typically take more time to settle and clear, and the cost of buying and selling foreign securities is generally higher than similar costs associated with securities traded in U.S. markets.
The value of the securities held by the Fund may be affected by changes in exchange rates or control regulations. If a local currency gains against the U.S. dollar, the value of the holding increases in U.S. dollar terms. If a local currency declines against the U.S. dollar, the value of the holding decreases in U.S. dollar terms. Changes in economic, tax or foreign investment policies, or other political, governmental or economic actions can adversely affect the value of the securities in the Fund. In foreign countries, accounting, auditing and financial reporting standards and other regulatory practices and requirements are generally different from those required for U.S. companies. Investments in securities of foreign issuers may also be subject to foreign withholding and other taxes.
Growth Style Risk. Growth investing involves buying stocks that have relatively high price-to-earnings ratios. Growth stocks may be more volatile than other stocks because they are generally more sensitive to investor perceptions and market moves. During periods of growth stock underperformance, the Fund’s performance may suffer.
Liquidity Risk. When there is no willing buyer and investments cannot be readily sold at the desired time or price, the Fund may need to accept a lower price or may not be able to sell the security at all. An inability to sell securities can adversely affect the Fund’s value or prevent the Fund from being able to take advantage of other investment opportunities. Less liquid securities are more difficult to dispose of at their recorded values and are subject to increased spreads and volatility.
Manager Risk. The performance of the Fund is dependent upon the investment adviser’s skill in selecting managers and the portfolio manager’s skill in making appropriate investments. As a result, the Fund may underperform its benchmark or its peers.
Market Risk. The Fund’s share price can move down in response to stock market conditions, changes in the economy or changes in a particular company’s stock price. An individual stock may decline in value even when the value of stocks in general is rising.
Mid-Cap Company Risk. Investments in mid-cap companies may entail greater risks than investments in larger, more established companies. Mid-cap companies generally have narrower product lines, more limited financial resources and a more limited trading market for their stocks compared with larger companies. As a result, their stock prices may experience greater volatility and may decline significantly in market downturns.
FUND PERFORMANCE
The bar chart shows how the performance of the Fund has varied from year to year over the periods shown. This information may help illustrate the risks of investing in the Fund. The Fund makes updated performance information available on the Fund’s website, www.astonfunds.com, or by calling 800-992-8151. As with all mutual funds, past performance (before and after taxes) does not guarantee future performance.
Calendar Year Total Return
| | | | | | | | | | |
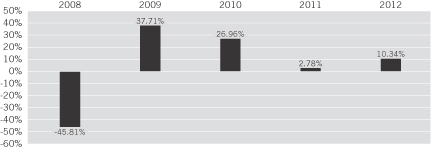 | | | | | | | | | | |
| | Best quarter: | | | 09/09 | | | | 15.63 | % |
| | Worst quarter: | | | 12/08 | | | | (31.59 | )% |
| | | | | | | | | | |
| | | | | | | | | | |
| | | | | | | | | | |
Prospectus | 27
The following table indicates how the Fund’s average annual returns for different calendar periods compared to the returns of a broad-based securities market index.
Average Annual Total Returns
(For the periods ended December 31, 2012)
| | | | | | | | | | | | |
| | | ASTON/Montag & Caldwell Mid Cap Growth Fund | |
| | | 1 Year | | | 5 Years | | | Since Inception | |
| Class N Shares (Inception 11/02/07): | | | | | | | | | | | | |
Return Before Taxes | | | 10.34 | % | | | 1.45 | % | | | 1.22 | % |
Return After Taxes on Distributions | | | 10.18 | % | | | 1.41 | % | | | 1.19 | % |
Return After Taxes on Distributions and Sale of Fund Shares | | | 6.94 | % | | | 1.23 | % | | | 1.04 | % |
| Russell Midcap Growth Index (Reflects no deduction for taxes, expenses or fees. Index return is computed from October 31, 2007.) | | | 15.81 | % | | | 3.23 | % | | | 2.29 | % |
After-tax returns are calculated using the historical highest individual federal marginal income tax rates and do not reflect the impact of state and local taxes. After-tax returns depend on an investor’s tax situation and may differ from those shown. After-tax returns shown are not relevant to investors who hold their shares through tax-deferred arrangements, such as 401(k) plans or individual retirement accounts.
MANAGEMENT
Aston Asset Management, LP serves as investment adviser to the Fund. Montag & Caldwell, LLC (“Montag & Caldwell”) serves as the subadviser to the Fund.
Mr. Andrew W. Jung, CFA, a security analyst and Vice President for Montag & Caldwell, and Mr. M. Scott Thompson, CFA, a security analyst and Vice President for Montag & Caldwell, serve as Portfolio Managers to the Fund. Mr. Jung and Mr. Thompson have served as the Fund’s Portfolio Managers since November 2007.
PURCHASE AND SALE OF FUND SHARES
Shares of the Fund may be purchased, exchanged, or redeemed on any business day by written request (Aston Funds, P.O. Box 9765, Providence, RI 02940), wire transfer, online access (www.astonfunds.com), or by telephone (800-992-8151). Investors who wish to purchase, exchange or redeem Fund shares through a broker-dealer should contact the broker-dealer directly.
| | | | | | | | |
| Class and Account Type | | Minimum Initial Investment | | | Subsequent Investments | |
| Class N—Regular Accounts | | $ | 2,500 | | | $ | 50 | |
| Individual Retirement Accounts (IRAs) | | $ | 500 | | | $ | 50 | |
| Education Savings Accounts (ESAs) | | $ | 500 | | | $ | 50 | |
| Custodial Accounts for Minors (UGMA/UTMA) | | $ | 500 | | | $ | 50 | |
TAX INFORMATION
The Fund’s distributions are generally taxable as ordinary income or capital gains for federal income tax purposes, unless you are investing through a tax-deferred account such as a 401(k) or individual retirement account. Distributions on investments made through tax-deferred vehicles, such as 401(k) plans or IRAs, may be taxed later upon withdrawal of assets from those plans or accounts.
PAYMENTS TO BROKER-DEALERS AND OTHER FINANCIAL INTERMEDIARIES
If you purchase shares of the Fund through a broker-dealer or other financial intermediary (such as a bank), the Fund and its related companies may pay the intermediary for the sale of shares and related services. These payments may create a conflict of interest by influencing the broker-dealer or other intermediary and your salesperson to recommend the Fund over another investment. Ask your salesperson or visit your financial intermediary’s website for more information.
Prospectus | 28
ASTON/TAMRO Small Cap Fund
INVESTMENT OBJECTIVE
The Fund seeks to provide long-term capital appreciation.
FEES AND EXPENSES
The table below describes the fees and expenses that you may pay if you buy and hold shares of the Fund.
ANNUAL FUND OPERATING EXPENSES
(expenses that you pay each year as a percentage of the value of your investment)
| | | | | | | | |
| | | Class N Shares | | | Class I Shares | |
| Management Fees | | | 0.90 | % | | | 0.90 | % |
| Distribution and Service (12b-1) Fees | | | 0.25 | % | | | None | |
| Other Expenses | | | 0.13 | % | | | 0.13 | % |
| Total Annual Fund Operating Expenses | | | 1.28 | % | | | 1.03 | % |
Example
This example is intended to help you compare the cost of investing in the Fund with the cost of investing in other mutual funds. The example shows the operating expenses you would incur as a shareholder if you invested $10,000 in the Fund over the time periods shown and you redeem all your shares at the end of those periods. The example assumes that the average annual return was 5% and operating expenses remained the same.
Although your actual costs may be higher or lower, based on the above assumptions, your costs would be:
| | | | | | | | | | | | | | | | |
| | | 1 Year | | | 3 Years | | | 5 Years | | | 10 Years | |
| Class N Shares | | $ | 130 | | | $ | 406 | | | $ | 702 | | | $ | 1,545 | |
| Class I Shares | | | 105 | | | | 328 | | | | 569 | | | | 1,259 | |
PORTFOLIO TURNOVER
The Fund pays transaction costs, such as commissions, when it buys and sells securities (or “turns over” its portfolio). A higher portfolio turnover rate may indicate higher transaction costs and may result in higher taxes when Fund shares are held in a taxable account. These costs, which are not reflected in annual Fund operating expenses or in the example, affect the Fund’s performance. During the most recent fiscal year, the Fund’s portfolio turnover rate was 48.22%.
PRINCIPAL INVESTMENT STRATEGIES
Under normal market conditions, the Fund invests at least 80% of its assets in a blended portfolio of growth and value stocks of small-cap companies. The Fund defines companies with market capitalizations of up to $2.75 billion, at the time of acquisition, to be small-cap companies. The portfolio managers seek opportunities across the growth/value spectrum, resulting in what is generally considered a “core” portfolio.
The portfolio managers’ investment process focuses on bottom-up stock selection with the goal of identifying companies that possess a sustainable competitive advantage combined with an attractive valuation. A sustainable competitive advantage may be derived from a unique product or service offering, a capable and proven management team, and sound financials.
Through the use of both qualitative and quantitative evaluation, the portfolio managers seek securities that meet the specific criteria of one of three investment categories:
| n | | Leaders (leading market share and above average profitability) |
| n | | Laggards (companies undergoing a restructuring) |
| n | | Innovators (dedication to introducing new products or services) |
The Fund may invest in real estate investment trusts (“REITs”), foreign securities (directly and through depositary receipts), convertible bonds, securities outside the small-cap range and cash-equivalent securities.
To manage risk, the portfolio managers limit position sizes, diversify across market sectors and adhere to a strong sell discipline.
PRINCIPAL RISKS
You could lose money by investing in the Fund. There can be no assurance that the Fund’s investment objective will be achieved. The following is a summary of the principal risks of investing in the Fund.
Convertible Risk. Convertible preferred securities are subject to the risks of equity securities and fixed income securities. The lower the premium, the more likely the price of the convertible will follow the price of the underlying common stock. Higher premium convertibles are more likely to exhibit the behavior of bonds because the likelihood of conversion is lower. In that case, the price of convertible preferred shares normally will fall as interest rates rise. Conversely, as rates fall, the price of convertible preferred shares will rise.
Prospectus | 29
The value of convertible securities is also affected by prevailing interest rates, the credit quality of the issuer and any call provisions. There is the risk that the issuer of the security will not be able to make principal and/or interest payments as well as the risk that the holder of the security may not take advantage of the convertible features in the appropriate time frame.
Foreign Securities Risk. Investing in the securities of foreign issuers involves special risks and considerations not typically associated with investing in U.S. companies. The securities of foreign companies may be less liquid and may fluctuate more widely than those traded in U.S. markets. Foreign companies and markets may also have less governmental supervision. There may be difficulty in enforcing contractual obligations and little public information about the companies. Trades typically take more time to settle and clear, and the cost of buying and selling foreign securities is generally higher than similar costs associated with securities traded in U.S. markets.
The value of the securities held by the Fund may be affected by changes in exchange rates or control regulations. If a local currency gains against the U.S. dollar, the value of the holding increases in U.S. dollar terms. If a local currency declines against the U.S. dollar, the value of the holding decreases in U.S. dollar terms. Changes in economic, tax or foreign investment policies, or other political, governmental or economic actions can adversely affect the value of the securities in the Fund. In foreign countries, accounting, auditing and financial reporting standards and other regulatory practices and requirements are generally different from those required for U.S. companies. Investments in securities of foreign issuers may also be subject to foreign withholding and other taxes.
Growth Style Risk. Growth investing involves buying stocks that have relatively high price-to-earnings ratios. Growth stocks may be more volatile than other stocks because they are generally more sensitive to investor perceptions and market moves. During periods of growth stock underperformance, the Fund’s performance may suffer.
Liquidity Risk. When there is no willing buyer and investments cannot be readily sold at the desired time or price, the Fund may need to accept a lower price or may not be able to sell the security at all. An inability to sell securities can adversely affect the Fund’s value or prevent the Fund from being able to take advantage of other investment opportunities. Less liquid securities are more difficult to dispose of at their recorded values and are subject to increased spreads and volatility.
Manager Risk. The performance of the Fund is dependent upon the investment adviser’s skill in selecting managers and the portfolio manager’s skill in making appropriate investments. As a result, the Fund may underperform its benchmark or its peers.
Market Risk. The Fund’s share price can move down in response to stock market conditions, changes in the economy or changes in a particular company’s stock price. An individual stock may decline in value even when the value of stocks in general is rising.
REIT Risk. Securities of REITs may be affected by changes in the values of their underlying properties and by defaults by borrowers or tenants. Some REITs may have limited diversification and may be subject to risks inherent in investments in a limited number of properties, in a narrow geographic area, or in a single property type. Real estate is also affected by general economic conditions. When growth is slowing, demand for property decreases and prices may decline. Rising interest rates, which drive up mortgage and financing costs, can restrain construction and buying and selling activity, and may reduce the appeal of real estate investments. REITs depend generally on their ability to generate cash flow to make distributions to shareholders or unitholders, and may be subject to defaults by borrowers and self-liquidations. A REIT’s return may be adversely affected when interest rates are high or rising. Distributions from REITs generally are taxed as ordinary income for federal income tax purposes.
Small-Cap and Mid-Cap Company Risk. Investing in securities of small-cap and mid-cap companies may involve greater risks than investing in securities of larger, more established issuers. Small-cap and mid-cap companies generally have limited product lines, markets and financial resources. Their securities may trade less frequently and in more limited volume than the securities of larger, more established companies. Also, small-cap and mid-cap companies are typically subject to greater changes in earnings and business prospects than larger companies. As a result, their stock prices may experience greater volatility and may decline significantly in market downturns.
Value Style Risk. Value investing involves buying stocks that are out of favor and/or undervalued in comparison to their peers or their prospects for growth. Typically, their valuation levels are less than those of growth stocks. Because different types of stocks go out of favor with investors depending on market and economic conditions, the Fund’s return may be adversely affected during a market downturn and when value stocks are out of favor.
Prospectus | 30
FUND PERFORMANCE
The bar chart shows how the performance of the Class N shares of the Fund has varied from year to year over the periods shown. Class N shares and Class I shares are invested in the same portfolio of securities, so the annual returns would differ only to the extent that the classes have different expenses. The annual returns of the Class I shares would be higher than the returns of the Class N shares due to 12b-1 fees paid by Class N shares. This information may help illustrate the risks of investing in the Fund. The Fund makes updated performance information available on the Fund’s website, www.astonfunds.com, or by calling 800-992-8151. As with all mutual funds, past performance (before and after taxes) does not guarantee future performance.
Class N Shares
Calendar Year Total Return
| | | | | | | | | | |
 | | | | | | | | | | |
| | Best quarter: | | | 06/03 | | | | 25.28 | % |
| | Worst quarter: | | | 12/08 | | | | (25.91 | )% |
| | | | | | | | | | |
| | | | | | | | | | |
| | | | | | | | | | |
The following table indicates how the Fund’s average annual returns for different calendar periods compared to the returns of a broad-based securities market index.
Average Annual Total Returns
(For the periods ended December 31, 2012)
| | | | | | | | | | | | | | | | |
| | | ASTON/TAMRO Small Cap Fund | |
| | | 1 Year | | | 5 Years | | | 10 Years | | | Since Inception | |
| Class N Shares (Inception 11/30/00): | | | | | | | | | | | | | | | | |
Return Before Taxes | | | 16.69 | % | | | 5.33 | % | | | 11.56 | % | | | 10.37 | % |
Return After Taxes on Distributions | | | 14.76 | % | | | 4.60 | % | | | 10.52 | % | | | 9.47 | % |
Return After Taxes on Distributions and Sale of Fund Shares | | | 12.73 | % | | | 4.50 | % | | | 9.99 | % | | | 9.00 | % |
| Class I Shares (Inception 1/04/05): | | | | | | | | | | | | | | | | |
Return Before Taxes | | | 16.90 | % | | | 5.60 | % | | | N/A | | | | 7.58 | % |
| Russell 2000 Index (Reflects no deduction for taxes, expenses or fees. Index return for Class I shares, since inception, computed from December 31, 2004, is 4.76%.) | | | 16.35 | % | | | 3.56 | % | | | 9.72 | % | | | 6.89 | % |
After-tax returns are calculated using the historical highest individual federal marginal income tax rates and do not reflect the impact of state and local taxes. After-tax returns depend on an investor’s tax situation and may differ from those shown. After-tax returns shown are not relevant to investors who hold their shares through tax-deferred arrangements, such as 401(k) plans or individual retirement accounts. After-tax returns are shown only for Class N shares. After-tax returns for Class I shares will vary.
MANAGEMENT
Aston Asset Management, LP serves as investment adviser to the Fund. TAMRO Capital Partners, LLC (“TAMRO”) serves as the subadviser to the Fund.
Mr. Philip D. Tasho, CFA, Chief Executive Officer and Chief Investment Officer of TAMRO, and Mr. Timothy A. Holland, CFA, a principal for TAMRO, serve as Portfolio Managers of the Fund. Mr. Tasho has served as Portfolio Manager of the Fund since November 2000. Mr. Holland has served as Portfolio Manager of the Fund since February 2010.
PURCHASE AND SALE OF FUND SHARES*
Shares of the Fund may be purchased, exchanged, or redeemed on any business day by written request (Aston Funds, P.O. Box 9765, Providence, RI 02940), wire transfer, online access (www.astonfunds.com), or by telephone (800-992-8151). Investors who wish to purchase, exchange or redeem Fund shares through a broker-dealer should contact the broker-dealer directly.
| | | | | | | | |
| Class and Account Type | | Minimum Initial Investment | | | Subsequent Investments | |
| Class N—Regular Accounts | | $ | 2,500 | | | $ | 50 | |
| Individual Retirement Accounts (IRAs) | | $ | 500 | | | $ | 50 | |
| Education Savings Accounts (ESAs) | | $ | 500 | | | $ | 50 | |
| Custodial Accounts for Minors (UGMA/UTMA) | | $ | 500 | | | $ | 50 | |
| Class I—Institutional Accounts | | $ | 1 Million | | | $ | 50 | |
| * | The Fund is currently accepting additional investments from existing investors only. The Fund will remain closed to new investors until further notice, with certain limited exceptions as listed in the “Shareholder Information” Section of the statutory prospectus. |
Prospectus | 31
TAX INFORMATION
The Fund’s distributions are generally taxable as ordinary income or capital gains for federal income tax purposes, unless you are investing through a tax-deferred account such as a 401(k) or individual retirement account. Distributions on investments made through tax-deferred vehicles, such as 401(k) plans or IRAs, may be taxed later upon withdrawal of assets from those plans or accounts.
PAYMENTS TO BROKER-DEALERS AND OTHER FINANCIAL INTERMEDIARIES
If you purchase shares of the Fund through a broker-dealer or other financial intermediary (such as a bank), the Fund and its related companies may pay the intermediary for the sale of shares and related services. These payments may create a conflict of interest by influencing the broker-dealer or other intermediary and your salesperson to recommend the Fund over another investment. Ask your salesperson or visit your financial intermediary’s website for more information.
Prospectus | 32
ASTON/River Road Select Value Fund
INVESTMENT OBJECTIVE
The Fund seeks to provide long-term capital appreciation.
FEES AND EXPENSES
The table below describes the fees and expenses that you may pay if you buy and hold shares of the Fund.
ANNUAL FUND OPERATING EXPENSES
(expenses that you pay each year as a percentage of the value of your investment)
| | | | | | | | |
| | | Class N Shares | | | Class I Shares | |
| Management Fees | | | 1.00 | % | | | 1.00 | % |
| Distribution and Service (12b-1) Fees | | | 0.25 | % | | | None | |
| Other Expenses | | | 0.18 | % | | | 0.18 | % |
| Acquired Fund Fees and Expenses | | | 0.01 | % | | | 0.01 | % |
| Total Annual Fund Operating Expenses | | | 1.44 | % | | | 1.19 | % |
Example
This example is intended to help you compare the cost of investing in the Fund with the cost of investing in other mutual funds. The example shows the operating expenses you would incur as a shareholder if you invested $10,000 in the Fund over the time periods shown and you redeem all your shares at the end of those periods. The example assumes that the average annual return was 5% and operating expenses remained the same.
Although your actual costs may be higher or lower, based on the above assumptions, your costs would be:
| | | | | | | | | | | | | | | | |
| | | 1 Year | | | 3 Years | | | 5 Years | | | 10 Years | |
| Class N Shares | | $ | 147 | | | $ | 456 | | | $ | 787 | | | $ | 1,724 | |
| Class I Shares | | | 121 | | | | 378 | | | | 654 | | | | 1,443 | |
PORTFOLIO TURNOVER
The Fund pays transaction costs, such as commissions, when it buys and sells securities (or “turns over” its portfolio). A higher portfolio turnover rate may indicate higher transaction costs and may result in higher taxes when Fund shares are held in a taxable account. These costs, which are not reflected in annual Fund operating expenses or in the example, affect the Fund’s performance. During the most recent fiscal year, the Fund’s portfolio turnover rate was 38.84%.
PRINCIPAL INVESTMENT STRATEGIES
Under normal conditions, the Fund invests at least 80% of its assets in common stocks and other equity securities of small-cap companies with market capitalizations of less than $6 billion at the time of acquisition which the portfolio managers believe are undervalued. Value investing involves buying stocks that are out of favor and/or undervalued in comparison to their peers or their prospects for growth. The Fund may also invest in common stock of companies with market capitalizations that exceed $6 billion, real estate investment trusts (“REITs”), convertible securities and foreign securities (directly and through depositary receipts).
Using systematic and dynamic internal research, the portfolio managers narrow the field of small- and mid-cap companies into a more refined working universe. The portfolio managers then employ a value-driven, bottom-up fundamental approach that seeks to identify certain characteristics including:
| n | | Priced at a discount to absolute value |
| n | | Attractive business model |
| n | | Shareholder-oriented management |
| n | | Undiscovered, underfollowed or misunderstood companies |
To manage risk, the portfolio managers employ a strategy of balanced diversification, and adhere to a structured sell discipline.
PRINCIPAL RISKS
You could lose money by investing in the Fund. There can be no assurance that the Fund’s investment objective will be achieved. The following is a summary of the principal risks of investing in the Fund.
Convertible Risk. Convertible preferred securities are subject to the risks of equity securities and fixed income securities. The lower the premium, the more likely the price of the convertible will follow the price of the underlying common stock. Higher premium convertibles are more likely to exhibit the behavior of bonds because the likelihood of conversion is lower. In that case, the price of convertible preferred shares normally will fall as interest rates rise. Conversely, as rates fall, the price of convertible preferred shares will rise.
Prospectus | 33
The value of convertible securities is also affected by prevailing interest rates, the credit quality of the issuer and any call provisions. There is the risk that the issuer of the security will not be able to make principal and/or interest payments as well as the risk that the holder of the security may not take advantage of the convertible features in the appropriate time frame.
Foreign Securities Risk. Investing in the securities of foreign issuers involves special risks and considerations not typically associated with investing in U.S. companies. The securities of foreign companies may be less liquid and may fluctuate more widely than those traded in U.S. markets. Foreign companies and markets may also have less governmental supervision. There may be difficulty in enforcing contractual obligations and little public information about the companies. Trades typically take more time to settle and clear, and the cost of buying and selling foreign securities is generally higher than similar costs associated with securities traded in U.S. markets.
The value of the securities held by the Fund may be affected by changes in exchange rates or control regulations. If a local currency gains against the U.S. dollar, the value of the holding increases in U.S. dollar terms. If a local currency declines against the U.S. dollar, the value of the holding decreases in U.S. dollar terms. Changes in economic, tax or foreign investment policies, or other political, governmental or economic actions can adversely affect the value of the securities in the Fund. In foreign countries, accounting, auditing and financial reporting standards and other regulatory practices and requirements are generally different from those required for U.S. companies. Investments in securities of foreign issuers may also be subject to foreign withholding and other taxes.
Liquidity Risk. When there is no willing buyer and investments cannot be readily sold at the desired time or price, the Fund may need to accept a lower price or may not be able to sell the security at all. An inability to sell securities can adversely affect the Fund’s value or prevent the Fund from being able to take advantage of other investment opportunities. Less liquid securities are more difficult to dispose of at their recorded values and are subject to increased spreads and volatility.
Manager Risk. The performance of the Fund is dependent upon the investment adviser’s skill in selecting managers and the portfolio manager’s skill in making appropriate investments. As a result, the Fund may underperform its benchmark or its peers.
Market Risk. The Fund’s share price can move down in response to stock market conditions, changes in the economy or changes in a particular company’s stock price. An individual stock may decline in value even when the value of stocks in general is rising.
REIT Risk. Securities of REITs may be affected by changes in the values of their underlying properties and by defaults by borrowers or tenants. Some REITs may have limited diversification and may be subject to risks inherent in investments in a limited number of properties, in a narrow geographic area, or in a single property type. Real estate is also affected by general economic conditions. When growth is slowing, demand for property decreases and prices may decline. Rising interest rates, which drive up mortgage and financing costs, can restrain construction and buying and selling activity, and may reduce the appeal of real estate investments. REITs depend generally on their ability to generate cash flow to make distributions to shareholders or unitholders, and may be subject to defaults by borrowers and self-liquidations. A REIT’s return may be adversely affected when interest rates are high or rising. Distributions from REITs generally are taxed as ordinary income for federal income tax purposes.
Small-Cap and Mid-Cap Company Risk. Investing in securities of small-cap and mid-cap companies may involve greater risks than investing in securities of larger, more established issuers. Small-cap and mid-cap companies generally have limited product lines, markets and financial resources. Their securities may trade less frequently and in more limited volume than the securities of larger, more established companies. Also, small-cap and mid-cap companies are typically subject to greater changes in earnings and business prospects than larger companies. As a result, their stock prices may experience greater volatility and may decline significantly in market downturns.
Value Style Risk. Value investing involves buying stocks that are out of favor and/or undervalued in comparison to their peers or their prospects for growth. Typically, their valuation levels are less than those of growth stocks. Because different types of stocks go out of favor with investors depending on market and economic conditions, the Fund’s return may be adversely affected during a market downturn and when value stocks are out of favor.
Prospectus | 34
FUND PERFORMANCE
The bar chart shows how the performance of the Class N shares of the Fund has varied from year to year over the periods shown. Class N shares and Class I shares are invested in the same portfolio of securities, so the annual returns would differ only to the extent that the classes have different expenses. The annual returns of the Class I shares would be higher than the returns of Class N shares due to 12b-1 fees paid by Class N shares. This information may help illustrate the risks of investing in the Fund. The Fund makes updated performance information available on the Fund’s website, www.astonfunds.com, or by calling 800-992-8151. As with all mutual funds, past performance (before and after taxes) does not guarantee future performance.
Class N Shares
Calendar Year Total Return
| | | | | | | | | | |
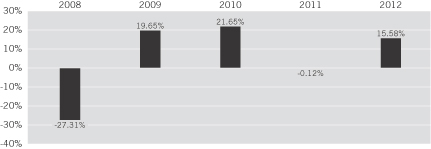 | | | | | | | | | | |
| | Best quarter: | | | 12/11 | | | | 14.59 | % |
| | Worst quarter: | | | 12/08 | | | | (22.40 | )% |
| | | | | | | | | | |
| | | | | | | | | | |
| | | | | | | | | | |
The following table indicates how the Fund’s average annual returns for different calendar periods compared to the returns of broad-based securities market indices.
Average Annual Total Returns
(For the periods ended December 31, 2012)
| | | | | | | | | | | | |
| | | ASTON/River Road Select Value Fund | |
| | | 1 Year | | | 5 Years | | | Since Inception | |
| Class N Shares (Inception 3/29/07): | | | | | | | | | | | | |
Return Before Taxes | | | 15.58 | % | | | 4.08 | % | | | 2.29 | % |
Return After Taxes on Distributions | | | 14.31 | % | | | 3.15 | % | | | 1.50 | % |
Return After Taxes on Distributions and Sale of Fund Shares | | | 11.76 | % | | | 3.42 | % | | | 1.89 | % |
| Class I Shares (Inception 6/28/07): | | | | | | | | | | | | |
Return Before Taxes | | | 15.90 | % | | | 4.37 | % | | | 1.74 | % |
| Russell 2500 Value Index (Reflects no deduction for taxes, expenses or fees. Index return since inception for Class N shares is computed from March 31, 2007. Index return for Class I shares, since inception, computed from June 30, 2007, is 1.60%.) | | | 19.21 | % | | | 4.54 | % | | | 2.04 | % |
| Russell 2000 Value Index (Reflects no deduction for taxes, expenses or fees. Index return since inception for Class N shares is computed from March 31, 2007. Index return for Class I shares, since inception, computed from June 30, 2007, is 0.62%.) | | | 18.05 | % | | | 3.55 | % | | | 0.99 | % |
After-tax returns are calculated using the historical highest individual federal marginal income tax rates and do not reflect the impact of state and local taxes. After-tax returns depend on an investor’s tax situation and may differ from those shown. After-tax returns shown are not relevant to investors who hold their shares through tax-deferred arrangements, such as 401(k) plans or individual retirement accounts. After-tax returns are shown only for Class N shares. After-tax returns for Class I shares will vary.
MANAGEMENT
Aston Asset Management, LP serves as investment adviser to the Fund. River Road Asset Management, LLC (“River Road”) serves as the subadviser to the Fund.
Mr. James C. Shircliff, CFA, Chief Investment Officer of River Road, Mr. R. Andrew Beck, CEO and President of River Road, and Mr. J. Justin Akin, a River Road portfolio manager, serve as Portfolio Managers for the Fund. Mr. Shircliff and Mr. Beck have served as Portfolio Managers since March 2007. Mr. Akin has served as Portfolio Manager since March 2012.
Prospectus | 35
PURCHASE AND SALE OF FUND SHARES
Shares of the Fund may be purchased, exchanged, or redeemed on any business day by written request (Aston Funds, P.O. Box 9765, Providence, RI 02940), wire transfer, online access (www.astonfunds.com), or by telephone (800-992-8151). Investors who wish to purchase, exchange or redeem Fund shares through a broker-dealer should contact the broker-dealer directly.
| | | | | | | | |
| Class and Account Type | | Minimum Initial Investment | | | Subsequent Investments | |
| Class N—Regular Accounts | | $ | 2,500 | | | $ | 50 | |
| Individual Retirement Accounts (IRAs) | | $ | 500 | | | $ | 50 | |
| Education Savings Accounts (ESAs) | | $ | 500 | | | $ | 50 | |
| Custodial Accounts for Minors (UGMA/UTMA) | | $ | 500 | | | $ | 50 | |
| Class I—Institutional Accounts | | $ | 1 Million | | | $ | 50 | |
TAX INFORMATION
The Fund’s distributions are generally taxable as ordinary income or capital gains for federal income tax purposes, unless you are investing through a tax-deferred account such as a 401(k) or individual retirement account. Distributions on investments made through tax-deferred vehicles, such as 401(k) plans or IRAs, may be taxed later upon withdrawal of assets from those plans or accounts.
PAYMENTS TO BROKER-DEALERS AND OTHER FINANCIAL INTERMEDIARIES
If you purchase shares of the Fund through a broker-dealer or other financial intermediary (such as a bank), the Fund and its related companies may pay the intermediary for the sale of shares and related services. These payments may create a conflict of interest by influencing the broker-dealer or other intermediary and your salesperson to recommend the Fund over another investment. Ask your salesperson or visit your financial intermediary’s website for more information.
Prospectus | 36
ASTON/River Road Small Cap Value Fund
INVESTMENT OBJECTIVE
The Fund seeks to provide long-term capital appreciation.
FEES AND EXPENSES
The table below describes the fees and expenses that you may pay if you buy and hold shares of the Fund.
ANNUAL FUND OPERATING EXPENSES
(expenses that you pay each year as a percentage of the value of your investment)
| | | | | | | | |
| | | Class N Shares | | | Class I Shares | |
| Management Fees | | | 0.90 | % | | | 0.90 | % |
| Distribution and Service (12b-1) Fees | | | 0.25 | % | | | None | |
| Other Expenses | | | 0.22 | % | | | 0.22 | % |
| Acquired Fund Fees and Expenses | | | 0.09 | % | | | 0.09 | % |
| Total Annual Fund Operating Expenses | | | 1.46 | % | | | 1.21 | % |
Example
This example is intended to help you compare the cost of investing in the Fund with the cost of investing in other mutual funds. The example shows the operating expenses you would incur as a shareholder if you invested $10,000 in the Fund over the time periods shown and you redeem all your shares at the end of those periods. The example assumes that the average annual return was 5% and operating expenses remained the same.
Although your actual costs may be higher or lower, based on the above assumptions, your costs would be:
| | | | | | | | | | | | | | | | |
| | | 1 Year | | | 3 Years | | | 5 Years | | | 10 Years | |
| Class N Shares | | $ | 149 | | | $ | 462 | | | $ | 797 | | | $ | 1,746 | |
| Class I Shares | | | 123 | | | | 384 | | | | 665 | | | | 1,466 | |
PORTFOLIO TURNOVER
The Fund pays transaction costs, such as commissions, when it buys and sells securities (or “turns over” its portfolio). A higher portfolio turnover rate may indicate higher transaction costs and may result in higher taxes when Fund shares are held in a taxable account. These costs, which are not reflected in annual Fund operating expenses or in the example, affect the Fund’s performance. During the most recent fiscal year, the Fund’s portfolio turnover rate was 26.95%.
PRINCIPAL INVESTMENT STRATEGIES
Under normal conditions, the Fund invests at least 80% of its assets in common stocks and other equity securities of small-cap companies that the portfolio managers believe are undervalued. Value investing involves buying stocks that are out of favor and/or undervalued in comparison to their peers or their prospects for growth. The Fund considers companies with market capitalizations below $3 billion at the time of acquisition to be small-cap. The Fund may also invest in mid-cap stocks, real estate investment trusts (“REITs”), convertible securities, exchange-traded funds (“ETFs”), closed-end funds and foreign securities (directly and through depositary receipts). The Fund considers companies with market capitalizations between $3 billion and $6 billion at the time of acquisition to be mid-cap companies. Using systematic and dynamic internal research, the portfolio managers narrow the field of small- and mid-cap companies into a more refined working universe. The portfolio managers employ a value-driven, bottom-up fundamental approach that seeks to identify certain characteristics including:
| n | | Priced at a discount to absolute value |
| n | | Attractive business model |
| n | | Shareholder-oriented management |
| n | | Undiscovered, underfollowed or misunderstood companies |
To manage risk, the portfolio managers employ a strategy of balanced diversification, and adhere to a structured sell discipline.
PRINCIPAL RISKS
You could lose money by investing in the Fund. There can be no assurance that the Fund’s investment objective will be achieved. The following is a summary of the principal risks of investing in the Fund.
Convertible Risk. Convertible preferred securities are subject to the risks of equity securities and fixed income securities. The lower the premium, the more likely the price of the convertible will follow the price of the underlying common stock. Higher premium convertibles are more likely to exhibit the behavior of bonds because the likelihood of conversion is lower. In that case, the price of convertible preferred shares normally will fall as interest rates rise. Conversely, as rates fall, the price of convertible preferred shares will rise.
Prospectus | 37
The value of convertible securities is also affected by prevailing interest rates, the credit quality of the issuer and any call provisions. There is the risk that the issuer of the security will not be able to make principal and/or interest payments as well as the risk that the holder of the security may not take advantage of the convertible features in the appropriate time frame.
Foreign Securities Risk. Investing in the securities of foreign issuers involves special risks and considerations not typically associated with investing in U.S. companies. The securities of foreign companies may be less liquid and may fluctuate more widely than those traded in U.S. markets. Foreign companies and markets may also have less governmental supervision. There may be difficulty in enforcing contractual obligations and little public information about the companies. Trades typically take more time to settle and clear, and the cost of buying and selling foreign securities is generally higher than similar costs associated with securities traded in U.S. markets.
The value of the securities held by the Fund may be affected by changes in exchange rates or control regulations. If a local currency gains against the U.S. dollar, the value of the holding increases in U.S. dollar terms. If a local currency declines against the U.S. dollar, the value of the holding decreases in U.S. dollar terms. Changes in economic, tax or foreign investment policies, or other political, governmental or economic actions can adversely affect the value of the securities in the Fund. In foreign countries, accounting, auditing and financial reporting standards and other regulatory practices and requirements are generally different from those required for U.S. companies. Investments in securities of foreign issuers may also be subject to foreign withholding and other taxes.
Investment Company Risk. The Fund may invest in securities of other investment companies, including ETFs, open-end funds and closed-end funds. The risks of investment in other investment companies typically reflect the risks of the types of securities in which the funds invest. Investments in ETFs and closed-end funds are subject to the additional risk that shares of the fund may trade at a premium or discount to their net asset value per share. When the Fund invests in another investment company, shareholders of the Fund bear their proportionate share of the other investment company’s fees and expenses as well as their share of the Fund’s fees and expenses.
Liquidity Risk. When there is no willing buyer and investments cannot be readily sold at the desired time or price, the Fund may need to accept a lower price or may not be able to sell the security at all. An inability to sell securities can adversely affect the Fund’s value or prevent the Fund from being able to take advantage of other investment opportunities. Less liquid securities are more difficult to dispose of at their recorded values and are subject to increased spreads and volatility.
Manager Risk. The performance of the Fund is dependent upon the investment adviser’s skill in selecting managers and the portfolio manager’s skill in making appropriate investments. As a result, the Fund may underperform its benchmark or its peers.
Market Risk. The Fund’s share price can move down in response to stock market conditions, changes in the economy or changes in a particular company’s stock price. An individual stock may decline in value even when the value of stocks in general is rising.
REIT Risk. Securities of REITs may be affected by changes in the values of their underlying properties and by defaults by borrowers or tenants. Some REITs may have limited diversification and may be subject to risks inherent in investments in a limited number of properties, in a narrow geographic area, or in a single property type. Real estate is also affected by general economic conditions. When growth is slowing, demand for property decreases and prices may decline. Rising interest rates, which drive up mortgage and financing costs, can restrain construction and buying and selling activity, and may reduce the appeal of real estate investments. REITs depend generally on their ability to generate cash flow to make distributions to shareholders or unitholders, and may be subject to defaults by borrowers and self-liquidations. A REIT’s return may be adversely affected when interest rates are high or rising. Distributions from REITs generally are taxed as ordinary income for federal income tax purposes.
Small-Cap and Mid-Cap Company Risk. Investing in securities of small-cap and mid-cap companies may involve greater risks than investing in securities of larger, more established issuers. Small-cap and mid-cap companies generally have limited product lines, markets and financial resources. Their securities may trade less frequently and in more limited volume than the securities of larger, more established companies. Also, small-cap and mid-cap companies are typically subject to greater changes in earnings and business prospects than larger companies. As a result, their stock prices may experience greater volatility and may decline significantly in market downturns.
Value Style Risk. Value investing involves buying stocks that are out of favor and/or undervalued in comparison to their peers or their prospects for growth. Typically, their valuation levels are less than those of growth stocks. Because different types of stocks go out of favor with investors depending on market and economic conditions, the Fund’s return may be adversely affected during a market downturn and when value stocks are out of favor.
Prospectus | 38
FUND PERFORMANCE
The bar chart shows how the performance of the Class N shares of the Fund has varied from year to year over the periods shown. Class N shares and Class I shares are invested in the same portfolio of securities, so the annual returns would differ only to the extent that the classes have different expenses. The annual returns of the Class I shares would be higher than the returns of the Class N shares due to 12b-1 fees paid by Class N shares. This information may help illustrate the risks of investing in the Fund. The Fund makes updated performance information available on the Fund’s website, www.astonfunds.com, or by calling 800-992-8151. As with all mutual funds, past performance (before and after taxes) does not guarantee future performance.
Class N Shares
Calendar Year Total Return
| | | | | | | | | | |
 | | | | | | | | | | |
| | Best quarter: | | | 06/09 | | | | 16.81 | % |
| | Worst quarter: | | | 12/08 | | | | (22.89 | )% |
| | | | | | | | | | |
| | | | | | | | | | |
| | | | | | | | | | |
The following table indicates how the Fund’s average annual returns for different calendar periods compared to the returns of a broad-based securities market index.
Average Annual Total Returns
(For the periods ended December 31, 2012)
| | | | | | | | | | | | |
| | | ASTON/River Road Small Cap Value Fund | |
| | | 1 Year | | | 5 Years | | | Since Inception | |
| Class N Shares (Inception 6/28/05): | | | | | | | | | | | | |
Return Before Taxes | | | 13.40 | % | | | 2.20 | % | | | 5.51 | % |
Return After Taxes on Distributions | | | 12.60 | % | | | 2.04 | % | | | 5.21 | % |
Return After Taxes on Distributions and Sale of Fund Shares | | | 9.76 | % | | | 1.87 | % | | | 4.70 | % |
| Class I Shares (Inception 12/13/06): | | | | | | | | | | | | |
Return Before Taxes | | | 13.68 | % | | | 2.45 | % | | | 1.31 | % |
| Russell 2000 Value Index (Reflects no deduction for taxes, expenses or fees. Index return since inception for Class N shares is computed from June 30, 2005. Index return for Class I shares, since inception, computed from November 30, 2006, is 1.32%.) | | | 18.05 | % | | | 3.55 | % | | | 4.35 | % |
After-tax returns are calculated using the historical highest individual federal marginal income tax rates and do not reflect the impact of state and local taxes. After-tax returns depend on an investor’s tax situation and may differ from those shown. After-tax returns shown are not relevant to investors who hold their shares through tax-deferred arrangements, such as 401(k) plans or individual retirement accounts. After-tax returns are shown only for Class N shares. After-tax returns for Class I shares will vary.
MANAGEMENT
Aston Asset Management, LP serves as investment adviser to the Fund. River Road Asset Management, LLC (“River Road”) serves as the subadviser to the Fund.
Mr. James C. Shircliff, CFA, Chief Investment Officer of River Road, Mr. R. Andrew Beck, CEO and President of River Road, and Mr. J. Justin Akin, a River Road portfolio manager, serve as the Fund’s Portfolio Managers. Mr. Shircliff and Mr. Beck have served as Portfolio Managers since June 2005. Mr. Akin has served as Portfolio Manager since March 2012.
PURCHASE AND SALE OF FUND SHARES
Shares of the Fund may be purchased, exchanged, or redeemed on any business day by written request (Aston Funds, P.O. Box 9765, Providence, RI 02940), wire transfer, online access (www.astonfunds.com), or by telephone (800-992-8151). Investors who wish to purchase, exchange or redeem Fund shares through a broker-dealer should contact the broker-dealer directly.
| | | | | | | | |
| Class and Account Type | | Minimum Initial Investment | | | Subsequent Investments | |
| Class N—Regular Accounts | | $ | 2,500 | | | $ | 50 | |
| Individual Retirement Accounts (IRAs) | | $ | 500 | | | $ | 50 | |
| Education Savings Accounts (ESAs) | | $ | 500 | | | $ | 50 | |
| Custodial Accounts for Minors (UGMA/UTMA) | | $ | 500 | | | $ | 50 | |
| Class I—Institutional Accounts | | $ | 1 Million | | | $ | 50 | |
Prospectus | 39
TAX INFORMATION
The Fund’s distributions are generally taxable as ordinary income or capital gains for federal income tax purposes, unless you are investing through a tax-deferred account such as a 401(k) or individual retirement account. Distributions on investments made through tax-deferred vehicles, such as 401(k) plans or IRAs, may be taxed later upon withdrawal of assets from those plans or accounts.
PAYMENTS TO BROKER-DEALERS AND OTHER FINANCIAL INTERMEDIARIES
If you purchase shares of the Fund through a broker-dealer or other financial intermediary (such as a bank), the Fund and its related companies may pay the intermediary for the sale of shares and related services. These payments may create a conflict of interest by influencing the broker-dealer or other intermediary and your salesperson to recommend the Fund over another investment. Ask your salesperson or visit your financial intermediary’s website for more information.
Prospectus | 40
ASTON/River Road Independent Value Fund
INVESTMENT OBJECTIVE
The Fund seeks to provide long-term total return.
FEES AND EXPENSES
The table below describes the fees and expenses that you may pay if you buy and hold shares of the Fund.
ANNUAL FUND OPERATING EXPENSES
(expenses that you pay each year as a percentage of the value of your investment)
| | | | | | | | |
| | | Class N Shares | | | Class I Shares | |
| Management Fees | | | 1.00 | % | | | 1.00 | % |
| Distribution and Service (12b-1) Fees | | | 0.25 | % | | | None | |
| Other Expenses | | | 0.19 | % | | | 0.19 | % |
| Acquired Fund Fees and Expenses | | | 0.02 | % | | | 0.02 | % |
| Total Annual Fund Operating Expenses | | | 1.46 | % | | | 1.21 | % |
Fee Waiver and/or Expense Reimbursement | | | (0.02 | ) %(a) | | | (0.02 | ) %(a) |
| Total Annual Fund Operating Expenses After Fee Waiver and/or Expense Reimbursement | | | 1.44 | %(a) | | | 1.19 | %(a) |
| (a) | The adviser is contractually obligated to waive management fees and/or reimburse ordinary operating expenses, not including investment-related costs (such as brokerage commissions), interest, taxes, extraordinary expenses and acquired fund fees and expenses, through February 28, 2014, to the extent that operating expenses exceed 1.42% of the Fund’s average daily net assets with respect to Class N shares and 1.17% of the Fund’s average daily net assets with respect to Class I shares (the “Operating Expense Limit”). Prior to February 28, 2014, the arrangement may be amended or terminated for a class only by a vote of the Board of Trustees of Aston Funds. For a period of up to three years from the fiscal year end during which such amount was waived or reimbursed, the adviser is entitled to be reimbursed by the Fund for fees waived and expenses reimbursed from the commencement of operations through the completion of the first three full fiscal years to the extent that the Total Annual Operating Expenses for the class, not including investment-related costs (such as brokerage commissions), interest, taxes, extraordinary expenses and acquired fund fees and expenses, remains at or below the Operating Expense Limit after such reimbursement. |
Example
This example is intended to help you compare the cost of investing in the Fund with the cost of investing in other mutual funds. The example shows the operating expenses you would incur as a shareholder if you invested $10,000 in the Fund over the time periods shown and you redeem all your shares at the end of those periods. The example assumes that the average annual return was 5%, operating expenses remained the same, and expenses were capped for one year in each period.
Although your actual costs may be higher or lower, based on the above assumptions, your costs would be:
| | | | | | | | | | | | | | | | |
| | | 1 Year | | | 3 Years | | | 5 Years | | | 10 Years | |
| Class N Shares | | $ | 147 | | | $ | 460 | | | $ | 796 | | | $ | 1,745 | |
| Class I Shares | | | 121 | | | | 382 | | | | 663 | | | | 1,464 | |
PORTFOLIO TURNOVER
The Fund pays transaction costs, such as commissions, when it buys and sells securities (or “turns over” its portfolio). A higher portfolio turnover rate may indicate higher transaction costs and may result in higher taxes when Fund shares are held in a taxable account. These costs, which are not reflected in annual Fund operating expenses or in the example, affect the Fund’s performance. During the most recent fiscal year, the Fund’s portfolio turnover rate was 141.17%.
PRINCIPAL INVESTMENT STRATEGIES
The Fund invests in common stocks and other equity securities that the portfolio manager believes are undervalued. Under normal circumstances, the Fund typically invests in smaller cap companies with market capitalizations between $100 million and $5 billion at the time of acquisition. The Fund’s equity investments consist primarily of common stock but may also include other types of equity such as preferred stock, convertible securities, foreign securities and real estate investment trusts (“REITs”). Cash is a residual of the investment process. When the portfolio manager is unable to find investment opportunities that meet the Fund’s criteria, the Fund may have significant (more than 25%) cash balances, at times, for sustained periods. The portfolio manager employs a value driven, bottom-up fundamental approach that seeks to identify companies with certain characteristics including:
| n | | Priced at a discount to absolute value |
| n | | Considered high quality by the portfolio manager |
| n | | Consistent free cash flow |
The portfolio manager generally emphasizes a high quality portfolio and seeks absolute return while minimizing downside portfolio risk. As a result, the Fund’s returns may vary significantly from its benchmark index. To manage risk, the portfolio manager adheres to a structured sell discipline.
Prospectus | 41
PRINCIPAL RISKS
You could lose money by investing in the Fund. There can be no assurance that the Fund’s investment objective will be achieved. The following is a summary of the principal risks of investing in the Fund.
Convertible Risk. Convertible preferred securities are subject to the risks of equity securities and fixed income securities. The lower the premium, the more likely the price of the convertible will follow the price of the underlying common stock. Higher premium convertibles are more likely to exhibit the behavior of bonds because the likelihood of conversion is lower. In that case, the price of convertible preferred shares normally will fall as interest rates rise. Conversely, as rates fall, the price of convertible preferred shares will rise.
The value of convertible securities is also affected by prevailing interest rates, the credit quality of the issuer and any call provisions. There is the risk that the issuer of the security will not be able to make principal and/or interest payments as well as the risk that the holder of the security may not take advantage of the convertible features in the appropriate time frame.
Foreign Securities Risk. Investing in the securities of foreign issuers involves special risks and considerations not typically associated with investing in U.S. companies. The securities of foreign companies may be less liquid and may fluctuate more widely than those traded in U.S. markets. Foreign companies and markets may also have less governmental supervision. There may be difficulty in enforcing contractual obligations and little public information about the companies. Trades typically take more time to settle and clear, and the cost of buying and selling foreign securities is generally higher than similar costs associated with securities traded in U.S. markets.
The value of the securities held by the Fund may be affected by changes in exchange rates or control regulations. If a local currency gains against the U.S. dollar, the value of the holding increases in U.S. dollar terms. If a local currency declines against the U.S. dollar, the value of the holding decreases in U.S. dollar terms. Changes in economic, tax or foreign investment policies, or other political, governmental or economic actions can adversely affect the value of the securities in the Fund. In foreign countries, accounting, auditing and financial reporting standards and other regulatory practices and requirements are generally different from those required for U.S. companies. Investments in securities of foreign issuers may also be subject to foreign withholding and other taxes.
Liquidity Risk. When there is no willing buyer and investments cannot be readily sold at the desired time or price, the Fund may need to accept a lower price or may not be able to sell the security at all. An inability to sell securities can adversely affect the Fund’s value or prevent the Fund from being able to take advantage of other investment opportunities. Less liquid securities are more difficult to dispose of at their recorded values and are subject to increased spreads and volatility.
Manager Risk. The performance of the Fund is dependent upon the investment adviser’s skill in selecting managers and the portfolio manager’s skill in making appropriate investments. As a result, the Fund may underperform its benchmark or its peers.
Market Risk. The Fund’s share price can move down in response to stock market conditions, changes in the economy or changes in a particular company’s stock price. An individual stock may decline in value even when the value of stocks in general is rising.
Portfolio Turnover Risk. Frequent trading of the Fund’s portfolio holdings may result in a higher than average level of capital gains, including short-term gains, and will result in greater transaction costs to the Fund. To the extent distributions to shareholders are made from net short-term capital gains (i.e., net capital gain on securities held or treated as held by the Fund for one year or less minus any net capital losses on securities held or treated as held by the Fund for more than one year), the distributions will be taxed at ordinary income rates for federal income tax purposes, rather than at the lower long-term capital gains rates. Greater transaction costs and higher expenses as a result of portfolio turnover can negatively impact the Fund’s performance.
REIT Risk. Securities of REITs may be affected by changes in the values of their underlying properties and by defaults by borrowers or tenants. Some REITs may have limited diversification and may be subject to risks inherent in investments in a limited number of properties, in a narrow geographic area, or in a single property type. Real estate is also affected by general economic conditions. When growth is slowing, demand for property decreases and prices may decline. Rising interest rates, which drive up mortgage and financing costs, can restrain construction and buying and selling activity, and may reduce the appeal of real estate investments. REITs depend generally on their ability to generate cash flow to make distributions to shareholders or unitholders, and may be subject to defaults by borrowers and self-liquidations. A REIT’s return may be adversely affected when interest rates are high or rising. Distributions from REITs generally are taxed as ordinary income for federal income tax purposes.
Small-Cap Company Risk. Investing in securities of small-cap companies may involve greater risks than investing in securities of larger, more established issuers. Small-cap companies generally have limited product lines, markets and financial resources. Their securities may trade less frequently and in more limited volume than the securities of larger, more established companies. Also, small-cap companies are typically subject to greater changes in earnings and business prospects than larger companies. As a result, their stock prices may experience greater volatility and may decline significantly in market downturns.
Value Style Risk. Value investing involves buying stocks that are out of favor and/or undervalued in comparison to their peers or their prospects for growth. Typically, their valuation levels are less than those of growth stocks. Because different types of stocks go out of favor with investors depending on market and economic conditions, the Fund’s return may be adversely affected during a market downturn and when value stocks are out of favor.
Prospectus | 42
FUND PERFORMANCE
The bar chart shows how the performance of the Class N shares of the Fund has varied from year to year for the periods shown. Class N shares and Class I shares are invested in the same portfolio of securities, so the annual returns would differ only to the extent that the classes have different expenses. The annual returns of the Class I shares would be higher than the returns of the Class N shares due to 12b-1 fees paid by Class N shares. This information may help illustrate the risks of investing in the Fund. The Fund makes updated performance information available on the Fund’s website, www.astonfunds.com, or by calling 800-992-8151. As with all mutual funds, past performance (before and after taxes) does not guarantee future performance.
Class N Shares
Calendar Year Total Return
| | | | | | | | | | |
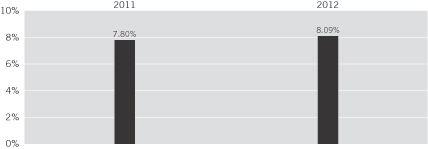 | | | | | | | | | | |
| | Best quarter: | | | 03/11 | | | | 7.22 | % |
| | Worst quarter: | | | 09/11 | | | | (7.45 | )% |
| | | | | | | | | | |
| | | | | | | | | | |
| | | | | | | | | | |
The following table indicates how the Fund’s average annual returns for different calendar periods compared to the returns of a broad-based securities market index.
Average Annual Total Returns
(For the periods ended December 31, 2012)
| | | | | | | | |
| | | ASTON/River Road Independent Value Fund | |
| | | 1 Year | | | Since Inception | |
| Class N Shares (Inception 12/31/10): | | | | | | | | |
Return Before Taxes | | | 8.09 | % | | | 7.77 | % |
Return After Taxes on Distributions | | | 6.14 | % | | | 6.63 | % |
Return After Taxes on Distributions and Sale of Fund Shares | | | 5.41 | % | | | 6.03 | % |
| Class I Shares (Inception 6/1/2011): | | | | | | | | |
Return Before Taxes | | | 8.37 | % | | | 4.21 | % |
| Russell 2000 Value Index (Reflects no deduction for taxes, expenses or fees. Index return for Class I shares, since inception, computed from May 31, 2011, is 3.04%.) | | | 18.05 | % | | | 5.62 | % |
After-tax returns are calculated using the historical highest individual federal marginal income tax rates and do not reflect the impact of state and local taxes. After-tax returns depend on an investor’s tax situation and may differ from those shown. After-tax returns shown are not relevant to investors who hold their shares through tax-deferred arrangements, such as 401(k) plans or individual retirement accounts. After-tax returns are shown only for Class N shares. After-tax returns for Class I shares will vary.
MANAGEMENT
Aston Asset Management, LP serves as investment adviser to the Fund. River Road Asset Management, LLC (“River Road”) serves as the subadviser to the Fund.
Mr. Eric Cinnamond, CFA, Vice President of River Road and portfolio manager of River Road’s Independent Value Strategy, has served as the Portfolio Manager since the Fund’s inception in December 2010.
PURCHASE AND SALE OF FUND SHARES*
Shares of the Fund may be purchased, exchanged, or redeemed on any business day by written request (Aston Funds, P.O. Box 9765, Providence, RI 02940), wire transfer, online access (www.astonfunds.com), or by telephone (800-992-8151). Investors who wish to purchase, exchange or redeem Fund shares through a broker-dealer should contact the broker-dealer directly.
| | | | | | | | |
| Class and Account Type | | Minimum Initial Investment | | | Subsequent Investments | |
| Class N—Regular Accounts | | $ | 2,500 | | | $ | 50 | |
| Individual Retirement Accounts (IRAs) | | $ | 500 | | | $ | 50 | |
| Education Savings Accounts (ESAs) | | $ | 500 | | | $ | 50 | |
| Custodial Accounts for Minors (UGMA/UTMA) | | $ | 500 | | | $ | 50 | |
| Class I—Institutional Accounts | | $ | 1 Million | | | $ | 50 | |
| * | The Fund is currently accepting additional investments from existing investors only. The Fund will remain closed to new investors until further notice, with certain limited exceptions as listed in the “Shareholder Information” Section of the statutory prospectus. |
Prospectus | 43
TAX INFORMATION
The Fund’s distributions are generally taxable as ordinary income or capital gains for federal income tax purposes, unless you are investing through a tax-deferred account such as a 401(k) or individual retirement account. Distributions on investments made through tax-deferred vehicles, such as 401(k) plans or IRAs, may be taxed later upon withdrawal of assets from those plans or accounts.
PAYMENTS TO BROKER-DEALERS AND OTHER FINANCIAL INTERMEDIARIES
If you purchase shares of the Fund through a broker-dealer or other financial intermediary (such as a bank), the Fund and its related companies may pay the intermediary for the sale of shares and related services. These payments may create a conflict of interest by influencing the broker-dealer or other intermediary and your salesperson to recommend the Fund over another investment. Ask your salesperson or visit your financial intermediary’s website for more information.
Prospectus | 44
ASTON/LMCG Small Cap Growth Fund
(formerly, ASTON Small Cap Growth Fund)
INVESTMENT OBJECTIVE
The Fund seeks to provide long-term capital appreciation.
FEES AND EXPENSES
The table below describes the fees and expenses that you may pay if you buy and hold shares of the Fund.
ANNUAL FUND OPERATING EXPENSES
(expenses that you pay each year as a percentage of the value of your investment)
| | | | | | | | |
| | | Class N Shares | | | Class I Shares | |
| Management Fees | | | 1.00 | % | | | 1.00 | % |
| Distribution and Service (12b-1) Fees | | | 0.25 | % | | | None | |
| Other Expenses | | | 1.61 | % | | | 1.61 | % |
| Acquired Fund Fees and Expenses | | | 0.01 | % | | | 0.01 | % |
| Total Annual Fund Operating Expenses | | | 2.87 | % | | | 2.62 | % |
Fee Waiver and/or Expense Reimbursement | | | (1.51 | )%(a) | | | (1.51 | )%(a) |
| Total Annual Fund Operating Expenses After Fee Waiver and/or Expense Reimbursement | | | 1.36 | %(a) | | | 1.11 | %(a) |
| (a) | The adviser is contractually obligated to waive management fees and/or reimburse ordinary operating expenses, not including investment-related costs (such as brokerage commissions), interest, taxes, extraordinary expenses and acquired fund fees and expenses, through February 28, 2014, to the extent that operating expenses exceed 1.35% of the Fund’s average daily net assets with respect to Class N shares and 1.10% of the Fund’s average daily net assets with respect to Class I shares (the “Operating Expense Limit”). Prior to February 28, 2014, the arrangement may be amended or terminated for a class only by a vote of the Board of Trustees of Aston Funds. For a period of up to three years from the fiscal year end during which such amount was waived or reimbursed, the adviser is entitled to be reimbursed by the Fund for fees waived and expenses reimbursed from commencement of operations through the completion of the first three full fiscal years to the extent that the Fund’s Total Annual Operating Expenses for a class, not including investment-related costs (such as brokerage commissions), interest, taxes, extraordinary expenses and acquired fund fees and expenses, remains at or below the Operating Expense Limit after such reimbursement. |
Example
This example is intended to help you compare the cost of investing in the Fund with the cost of investing in other mutual funds. The example shows the operating expenses you would incur as a shareholder if you invested $10,000 in the Fund over the time periods shown and you redeem all your shares at the end of those periods. The example assumes that the average annual return was 5%, operating expenses remained the same, and expenses were capped for one year in each period.
Although your actual costs may be higher or lower, based on the above assumptions, your costs would be:
| | | | | | | | | | | | | | | | |
| | | 1 Year | | | 3 Years | | | 5 Years | | | 10 Years | |
| Class N Shares | | $ | 138 | | | $ | 746 | | | $ | 1,380 | | | $ | 3,086 | |
| Class I Shares | | | 113 | | | | 671 | | | | 1,255 | | | | 2,842 | |
PORTFOLIO TURNOVER
The Fund pays transaction costs, such as commissions, when it buys and sells securities (or “turns over” its portfolio). A higher portfolio turnover rate may indicate higher transaction costs and may result in higher taxes when Fund shares are held in a taxable account. These costs, which are not reflected in annual Fund operating expenses or in the example, affect the Fund’s performance. During the most recent fiscal year, the Fund’s portfolio turnover rate was 168.05%.
PRINCIPAL INVESTMENT STRATEGIES
Under normal circumstances, the Fund invests at least 80% of its assets in common stocks and other equity securities of small-cap companies. The Fund defines a small-cap company as one with a market capitalization below $3 billion at the time of acquisition. The portfolio manager seeks to achieve above average risk-adjusted returns by identifying unrecognized growth potential. The portfolio manager utilizes a fundamental bottom-up security selection process to identify characteristics such as: revenue growth, margin expansion, surprise potential and strong balance sheets. The focus of the fundamental research process is to confirm that the growth is durable and sustainable, as well as to conduct due diligence on the key drivers of each security. The final step in the process applies a valuation framework to each security that meets the criteria of the fundamental research process.
The Fund may also invest in mid-cap stocks, including companies with a market capitalization up to $10 billion at the time of acquisition.
To manage risk, the portfolio manager limits position sizes, employs a strategy of diversification, and adheres to a structured sell discipline based on fundamental drivers and company valuations.
Prospectus | 45
PRINCIPAL RISKS
You could lose money by investing in the Fund. There can be no assurance that the Fund’s investment objective will be achieved. The following is a summary of the principal risks of investing in the Fund.
Growth Style Risk. Growth investing involves buying stocks that have relatively high price-to-earnings ratios. Growth stocks may be more volatile than other stocks because they are generally more sensitive to investor perceptions and market moves. During periods of growth stock underperformance, the Fund’s performance may suffer.
Liquidity Risk. When there is no willing buyer and investments cannot be readily sold at the desired time or price, the Fund may need to accept a lower price or may not be able to sell the security at all. An inability to sell securities can adversely affect the Fund’s value or prevent the Fund from being able to take advantage of other investment opportunities. Less liquid securities are more difficult to dispose of at their recorded values and are subject to increased spreads and volatility.
Manager Risk. The performance of the Fund is dependent upon the investment adviser’s skill in selecting managers and the portfolio manager’s skill in making appropriate investments. As a result, the Fund may underperform its benchmark or its peers.
Market Risk. The Fund’s share price can move down in response to stock market conditions, changes in the economy or changes in a particular company’s stock price. An individual stock may decline in value even when the value of stocks in general is rising.
Portfolio Turnover Risk. Frequent trading of the Fund’s portfolio holdings may result in a higher than average level of capital gains, including short-term gains, and will result in greater transaction costs to the Fund. To the extent distributions to shareholders are made from net short-term capital gains (i.e., net capital gain on securities held or treated as held by the Fund for one year or less minus any net capital losses on securities held or treated as held by the Fund for more than one year), the distributions will be taxed at ordinary income rates for federal income tax purposes, rather than at the lower long-term capital gains rates. Greater transaction costs and higher expenses as a result of portfolio turnover can negatively impact the Fund’s performance.
Small-Cap and Mid-Cap Company Risk. Investing in securities of small-cap and mid-cap companies may involve greater risks than investing in securities of larger, more established issuers. Small-cap and mid-cap companies generally have limited product lines, markets and financial resources. Their securities may trade less frequently and in more limited volume than the securities of larger, more established companies. Also, small-cap and mid-cap companies are typically subject to greater changes in earnings and business prospects than larger companies. As a result, their stock prices may experience greater volatility and may decline significantly in market downturns.
FUND PERFORMANCE
The bar chart shows how the performance of the Class N shares of the Fund has varied from year to year over the periods shown. Class N shares and Class I shares are invested in the same portfolio of securities, so the annual returns would differ only to the extent that the classes have different expenses. The annual returns of the Class I shares would be higher than the returns of the Class N shares due to 12b-1 fees paid by Class N shares. This information may help illustrate the risks of investing in the Fund. The Fund makes updated performance information available on the Fund’s website, www.astonfunds.com, or by calling 800-992-8151. As with all mutual funds, past performance (before and after taxes) does not guarantee future performance.
Class N Shares
Calendar Year Total Return
| | | | | | | | | | |
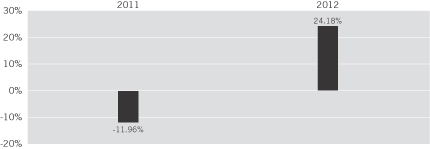 | | | | | | | | | | |
| | Best quarter: | | | 03/12 | | | | 16.15 | % |
| | Worst quarter: | | | 09/11 | | | | (27.36 | )% |
| | | | | | | | | | |
| | | | | | | | | | |
| | | | | | | | | | |
Prospectus | 46
The following table indicates how the Fund’s average annual returns for different calendar periods compared to the returns of a broad-based securities market index.
Average Annual Total Returns
(For the periods ended December 31, 2012)
| | | | | | | | |
| | | ASTON/LMCG Small Cap Growth Fund | |
| | | 1 Year | | | Since Inception | |
| Class N Shares (Inception 11/03/10): | | | | | | | | |
Return Before Taxes | | | 24.18 | % | | | 9.09 | % |
Return After Taxes on Distributions | | | 21.31 | % | | | 7.92 | % |
Return After Taxes on Distributions and Sale of Fund Shares | | | 16.07 | % | | | 7.16 | % |
| Class I Shares (Inception 6/1/11): | | | | | | | | |
Return Before Taxes | | | 24.43 | % | | | (1.43 | )% |
| Russell 2000 Growth Index (Reflects no deduction for taxes, expenses or fees. Index return since inception for Class N shares is computed from October 31, 2010. Index return for Class I shares, since inception, computed from May 31, 2011, is 0.16%.) | | | 14.59 | % | | | 10.81 | % |
As of February 28, 2013, the Fund changed its name from ASTON Small Cap Growth Fund to ASTON/LMCG Small Cap Growth Fund. As of February 17, 2012, the Fund changed its name from ASTON/Crosswind Small Cap Growth Fund to ASTON Small Cap Growth Fund and Lee Munder Capital Group, LLC (“LMCG”) became the subadviser. Performance prior to that date reflects the performance of a previous subadviser. However, Mr. Morey has served as the Fund’s portfolio manager since its inception.
After-tax returns are calculated using the historical highest individual federal marginal income tax rates and do not reflect the impact of state and local taxes. After-tax returns depend on an investor’s tax situation and may differ from those shown. After-tax returns shown are not relevant to investors who hold their shares through tax-deferred arrangements, such as 401(k) plans or individual retirement accounts. After-tax returns are shown only for Class N shares. After-tax returns for Class I shares will vary.
MANAGEMENT
Aston Asset Management, LP serves as investment adviser to the Fund. LMCG serves as the subadviser to the Fund.
Mr. Andrew Morey, CFA, lead portfolio manager for LMCG’s small and small/mid-cap investment strategies, has served as the Fund’s Portfolio Manager since the Fund’s inception in November 2010.
PURCHASE AND SALE OF FUND SHARES
Shares of the Fund may be purchased, exchanged, or redeemed on any business day by written request (Aston Funds, P.O. Box 9765, Providence, RI 02940), wire transfer, online access (www.astonfunds.com), or by telephone (800-992-8151). Investors who wish to purchase, exchange or redeem Fund shares through a broker-dealer should contact the broker-dealer directly.
| | | | | | | | |
| Class and Account Type | | Minimum Initial Investment | | | Subsequent Investments | |
| Class N—Regular Accounts | | $ | 2,500 | | | $ | 50 | |
| Individual Retirement Accounts (IRAs) | | $ | 500 | | | $ | 50 | |
| Education Savings Accounts (ESAs) | | $ | 500 | | | $ | 50 | |
| Custodial Accounts for Minors (UGMA/UTMA) | | $ | 500 | | | $ | 50 | |
| Class I—Institutional Accounts | | $ | 1 Million | | | $ | 50 | |
TAX INFORMATION
The Fund’s distributions are generally taxable as ordinary income or capital gains for federal income tax purposes, unless you are investing through a tax-deferred account such as a 401(k) or individual retirement account. Distributions on investments made through tax-deferred vehicles, such as 401(k) plans or IRAs, may be taxed later upon withdrawal of assets from those plans or accounts.
PAYMENTS TO BROKER-DEALERS AND OTHER FINANCIAL INTERMEDIARIES
If you purchase shares of the Fund through a broker-dealer or other financial intermediary (such as a bank), the Fund and its related companies may pay the intermediary for the sale of shares and related services. These payments may create a conflict of interest by influencing the broker-dealer or other intermediary and your salesperson to recommend the Fund over another investment. Ask your salesperson or visit your financial intermediary’s website for more information.
Prospectus | 47
ASTON Small Cap Fund
(formerly, ASTON/Veredus Small Cap Growth Fund)
INVESTMENT OBJECTIVE
The Fund seeks to provide capital appreciation.
FEES AND EXPENSES
The table below describes the fees and expenses that you may pay if you buy and hold shares of the Fund.
ANNUAL FUND OPERATING EXPENSES
(expenses that you pay each year as a percentage of the value of your investment)
| | | | | | | | |
| | | Class N Shares | | | Class I Shares | |
| Management Fees | | | 1.00 | % | | | 1.00 | % |
| Distribution and Service (12b-1) Fees | | | 0.25 | % | | | None | |
| Other Expenses | | | 0.58 | % | | | 0.58 | % |
| Total Annual Fund Operating Expenses | | | 1.83 | % | | | 1.58 | % |
Fee Waiver and/or Expense Reimbursement | | | (0.34 | )%(a) | | | (0.34 | )%(a) |
| Total Annual Fund Operating Expenses After Fee Waiver and/or Expense Reimbursement | | | 1.49 | %(a) | | | 1.24 | %(a) |
| (a) | The adviser is contractually obligated to waive management fees and/or reimburse ordinary operating expenses, not including investment-related costs (such as brokerage commissions), interest, taxes, extraordinary expenses and acquired fund fees and expenses, through February 28, 2014, to the extent that operating expenses exceed 1.49% of the Fund’s average daily net assets with respect to Class N shares and 1.24% of the Fund’s average daily net assets with respect to Class I shares. Prior to February 28, 2014, the arrangement may be amended or terminated for a class only by a vote of the Board of Trustees of Aston Funds. |
Example
This example is intended to help you compare the cost of investing in the Fund with the cost of investing in other mutual funds. The example shows the operating expenses you would incur as a shareholder if you invested $10,000 in the Fund over the time periods shown and you redeem all your shares at the end of those periods. The example assumes that the average annual return was 5%, operating expenses remained the same, and expenses were capped for one year in each period.
Although your actual costs may be higher or lower, based on the above assumptions, your costs would be:
| | | | | | | | | | | | | | | | |
| | | 1 Year | | | 3 Years | | | 5 Years | | | 10 Years | |
| Class N Shares | | $ | 152 | | | $ | 543 | | | $ | 959 | | | $ | 2,120 | |
| Class I Shares | | | 126 | | | | 466 | | | | 828 | | | | 1,850 | |
PORTFOLIO TURNOVER
The Fund pays transaction costs, such as commissions, when it buys and sells securities (or “turns over” its portfolio). A higher portfolio turnover rate may indicate higher transaction costs and may result in higher taxes when Fund shares are held in a taxable account. These costs, which are not reflected in annual Fund operating expenses or in the example, affect the Fund’s performance. During the most recent fiscal year, the Fund’s portfolio turnover rate was 158.83%.
PRINCIPAL INVESTMENT STRATEGIES
Under normal circumstances, the Fund invests at least 80% of its assets in common stocks and other equity securities of small-cap companies. The Fund seeks to invest in growth stocks of small-cap companies whose earnings are growing, or are expected to grow, at an accelerating rate. The Fund defines a small-cap company as one having a market capitalization of less than $2.5 billion at the time of acquisition. The portfolio managers look for inefficiencies in the market caused by inaccurate expectations (e.g., positive earnings surprises, estimate revisions). The focus is on companies that have:
| n | | Expanding unit volume growth |
| n | | Expanding profit margin potential |
| n | | High or improving cash flow return on investment |
| n | | Large markets with high barriers to entry |
The Fund may also invest in equity securities outside the small-cap range. Sector exposure is a residual of the investment process and the Fund may, from time to time, have exposure to a single sector or group of related sectors that react similarly to market, economic or other events.
The Fund may invest in exchange-traded funds (“ETFs”), publicly traded partnerships (“PTPs”) and foreign securities (directly and through depositary receipts).
To manage risk, the portfolio managers adhere to a strong sell discipline. The Fund’s investment strategies may result in high portfolio turnover.
Prospectus | 48
PRINCIPAL RISKS
You could lose money by investing in the Fund. There can be no assurance that the Fund’s investment objective will be achieved. The following is a summary of the principal risks of investing in the Fund.
Foreign Securities Risk. Investing in the securities of foreign issuers involves special risks and considerations not typically associated with investing in U.S. companies. The securities of foreign companies may be less liquid and may fluctuate more widely than those traded in U.S. markets. Foreign companies and markets may also have less governmental supervision. There may be difficulty in enforcing contractual obligations and little public information about the companies. Trades typically take more time to settle and clear, and the cost of buying and selling foreign securities is generally higher than similar costs associated with securities traded in U.S. markets.
The value of the securities held by the Fund may be affected by changes in exchange rates or control regulations. If a local currency gains against the U.S. dollar, the value of the holding increases in U.S. dollar terms. If a local currency declines against the U.S. dollar, the value of the holding decreases in U.S. dollar terms. Changes in economic, tax or foreign investment policies, or other political, governmental or economic actions can adversely affect the value of the securities in the Fund. In foreign countries, accounting, auditing and financial reporting standards and other regulatory practices and requirements are generally different from those required for U.S. companies. Investments in securities of foreign issuers may also be subject to foreign withholding and other taxes.
Growth Style Risk. Growth investing involves buying stocks that have relatively high price-to-earnings ratios. Growth stocks may be more volatile than other stocks because they are generally more sensitive to investor perceptions and market moves. During periods of growth stock underperformance, the Fund’s performance may suffer.
Investment Company Risk. The Fund may invest in securities of other investment companies, including ETFs, open-end funds and closed-end funds. The risks of investment in other investment companies typically reflect the risks of the types of securities in which the funds invest. Investments in ETFs and closed-end funds are subject to the additional risk that shares of the fund may trade at a premium or discount to their net asset value per share. When the Fund invests in another investment company, shareholders of the Fund bear their proportionate share of the other investment company’s fees and expenses as well as their share of the Fund’s fees and expenses.
Liquidity Risk. When there is no willing buyer and investments cannot be readily sold at the desired time or price, the Fund may need to accept a lower price or may not be able to sell the security at all. An inability to sell securities can adversely affect the Fund’s value or prevent the Fund from being able to take advantage of other investment opportunities. Less liquid securities are more difficult to dispose of at their recorded values and are subject to increased spreads and volatility.
Manager Risk. The performance of the Fund is dependent upon the investment adviser’s skill in selecting managers and the portfolio manager’s skill in making appropriate investments. As a result, the Fund may underperform its benchmark or its peers.
Market Risk. The Fund’s share price can move down in response to stock market conditions, changes in the economy or changes in a particular company’s stock price. An individual stock may decline in value even when the value of stocks in general is rising.
Portfolio Turnover Risk. Frequent trading of the Fund’s portfolio holdings may result in a higher than average level of capital gains, including short-term gains, and will result in greater transaction costs to the Fund. To the extent distributions to shareholders are made from net short-term capital gains (i.e., net capital gain on securities held or treated as held by the Fund for one year or less minus any net capital losses on securities held or treated as held by the Fund for more than one year), the distributions will be taxed at ordinary income rates for federal income tax purposes, rather than at the lower long-term capital gains rates. Greater transaction costs and higher expenses as a result of portfolio turnover can negatively impact the Fund’s performance.
PTP Risk. Investing in publicly traded partnerships (including master limited partnerships) involves risks not typically associated with publicly traded companies. PTPs are exposed to the risks of their underlying assets, which in many cases includes the same types of risks as energy and natural resources companies, such as commodity pricing risk, supply and demand risk and depletion and exploration risk. PTPs are also subject to capital markets risk, which is the risk that they are unable to raise capital to execute their growth strategies. PTPs are also subject to tax risk, which is the risk that they lose their partnership status for tax purposes.
Sector Concentration Risk. The Fund may entail greater risks than investing in funds diversified across sectors. Because the Fund may at times have a significant portion of its assets in one or more related sectors, the Fund may be subject to a greater level of market risk and its performance may be more volatile than a fund that does not concentrate its investments in a specific sector.
Small-Cap and Mid-Cap Company Risk. Investing in securities of small-cap and mid-cap companies may involve greater risks than investing in securities of larger, more established issuers. Small-cap and mid-cap companies generally have limited product lines, markets and financial resources. Their securities may trade less frequently and in more limited volume than the securities of larger, more established companies. Also, small-cap and mid-cap companies are typically subject to greater changes in earnings and business prospects than larger companies. As a result, their stock prices may experience greater volatility and may decline significantly in market downturns.
FUND PERFORMANCE
The bar chart shows how the performance of the Class N shares of the Fund has varied from year to year over the periods shown. Class N shares and Class I shares are invested in the same portfolio of securities, so the annual returns would differ only to the extent that the classes have different expenses. The annual returns of the Class I shares would be higher than the returns of the Class N shares due to 12b-1 fees paid by Class N shares. This information may
Prospectus | 49
help illustrate the risks of investing in the Fund. The Fund makes updated performance information available on the Fund’s website, www.astonfunds.com, or by calling 800-992-8151. As with all mutual funds, past performance (before and after taxes) does not guarantee future performance.
Class N Shares
Calendar Year Total Return
| | | | | | | | | | |
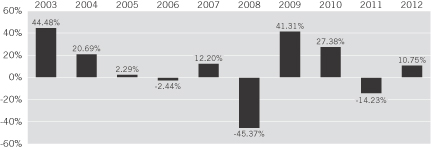 | | | | | | | | | | |
| | Best quarter: | | | 09/09 | | | | 30.94 | % |
| | Worst quarter: | | | 09/11 | | | | (28.07 | )% |
| | | | | | | | | | |
| | | | | | | | | | |
| | | | | | | | | | |
The following table indicates how the Fund’s average annual returns for different calendar periods compared to the returns of a broad-based securities market index.
Average Annual Total Returns
(For the periods ended December 31, 2012)
| | | | | | | | | | | | | | | | |
| | | ASTON Small Cap Fund | |
| | | 1 Year | | | 5 Years | | | 10 Years | | | Since Inception | |
| Class N Shares (Inception 6/30/98): | | | | | | | | | | | | | | | | |
Return Before Taxes | | | 10.75 | % | | | (1.35 | )% | | | 6.19 | % | | | 6.71 | % |
Return After Taxes on Distributions | | | 10.75 | % | | | (1.38 | )% | | | 5.36 | % | | | 5.40 | % |
Return After Taxes on Distributions and Sale of Fund Shares | | | 6.99 | % | | | (1.16 | )% | | | 5.21 | % | | | 5.33 | % |
| Class I Shares (Inception 10/05/01): | | | | | | | | | | | | | | | | |
Return Before Taxes | | | 11.11 | % | | | (1.09 | )% | | | 6.48 | % | | | 1.12 | % |
| Russell 2000 Growth Index (Reflects no deduction for taxes, expenses or fees. Index return for Class I shares, since inception, computed from September 30, 2001, is 7.44%.) | | | 14.59 | % | | | 3.49 | % | | | 9.80 | % | | | 3.80 | % |
As of January 31, 2013, the Fund changed its name from ASTON/Veredus Small Cap Growth Fund to ASTON Small Cap Fund and Lee Munder Capital Group, LLC (“LMCG”) became the subadviser. Performance prior to that date reflects the performance of a previous subadviser.
After-tax returns are calculated using the historical highest individual federal marginal income tax rates and do not reflect the impact of state and local taxes. In some instances, the “Return After Taxes on Distributions and Sale of Fund Shares” may be greater than “Return Before Taxes” because the investor is assumed to be able to use the capital loss of the sale of Fund shares to offset other taxable gains. After-tax returns depend on an investor’s tax situation and may differ from those shown. After-tax returns shown are not relevant to investors who hold their shares through tax-deferred arrangements, such as 401(k) plans or individual retirement accounts. After-tax returns are shown only for Class N shares. After-tax returns for Class I shares will vary.
MANAGEMENT
Aston Asset Management, LP serves as investment adviser to the Fund. LMCG serves as the subadviser to the Fund.
Mr. Andrew Morey, CFA, lead portfolio manager for LMCG’s small and small/mid-cap investment strategies, has served as the Fund’s Portfolio Manager since January 31, 2013.
PURCHASE AND SALE OF FUND SHARES
Shares of the Fund may be purchased, exchanged, or redeemed on any business day by written request (Aston Funds, P.O. Box 9765, Providence, RI 02940), wire transfer, online access (www.astonfunds.com), or by telephone (800-992-8151). Investors who wish to purchase, exchange or redeem Fund shares through a broker-dealer should contact the broker-dealer directly.
| | | | | | | | |
| Class and Account Type | | Minimum Initial Investment | | | Subsequent Investments | |
| Class N—Regular Accounts | | $ | 2,500 | | | $ | 50 | |
| Individual Retirement Accounts (IRAs) | | $ | 500 | | | $ | 50 | |
| Education Savings Accounts (ESAs) | | $ | 500 | | | $ | 50 | |
| Custodial Accounts for Minors (UGMA/UTMA) | | $ | 500 | | | $ | 50 | |
| Class I—Institutional Accounts | | $ | 1 Million | | | $ | 50 | |
Prospectus | 50
TAX INFORMATION
The Fund’s distributions are generally taxable as ordinary income or capital gains for federal income tax purposes, unless you are investing through a tax-deferred account such as a 401(k) or individual retirement account. Distributions on investments made through tax-deferred vehicles, such as 401(k) plans or IRAs, may be taxed later upon withdrawal of assets from those plans or accounts.
PAYMENTS TO BROKER-DEALERS AND OTHER FINANCIAL INTERMEDIARIES
If you purchase shares of the Fund through a broker-dealer or other financial intermediary (such as a bank), the Fund and its related companies may pay the intermediary for the sale of shares and related services. These payments may create a conflict of interest by influencing the broker-dealer or other intermediary and your salesperson to recommend the Fund over another investment. Ask your salesperson or visit your financial intermediary’s website for more information.
Prospectus | 51
ASTON/Silvercrest Small Cap Fund
INVESTMENT OBJECTIVE
The Fund seeks to provide long-term capital appreciation.
FEES AND EXPENSES
The table below describes the fees and expenses that you may pay if you buy and hold shares of the Fund.
ANNUAL FUND OPERATING EXPENSES
(expenses that you pay each year as a percentage of the value of your investment)
| | | | | | | | |
| | | Class N Shares | | | Class I Shares | |
| Management Fees | | | 1.00 | % | | | 1.00 | % |
| Distribution and Service (12b-1) Fees | | | 0.25 | % | | | None | |
| Other Expenses | | | 3.85 | % | | | 3.85 | % |
| Acquired Fund Fees and Expenses | | | 0.01 | % | | | 0.01 | % |
| Total Annual Fund Operating Expenses | | | 5.11 | % | | | 4.86 | % |
Fee Waiver and Expense Reimbursement | | | (3.70 | )%(a) | | | (3.70 | )%(a) |
| Total Annual Fund Operating Expenses After Fee Waiver and Reimbursement | | | 1.41 | %(a) | | | 1.16 | %(a) |
| (a) | The adviser is contractually obligated to waive management fees and/or reimburse ordinary operating expenses, not including investment-related costs (such as brokerage commissions), interest, taxes, extraordinary expenses and acquired fund fees and expenses, through February 28, 2014, to the extent that operating expenses exceed 1.40% of the Fund’s average daily net assets with respect to Class N shares and 1.15% of the Fund’s average daily net assets with respect to Class I shares (the “Operating Expense Limit”). Prior to February 28, 2014, the arrangement may be amended or terminated for a class only by a vote of the Board of Trustees of Aston Funds. For a period of up to three years from the fiscal year end during which such amount was waived or reimbursed, the adviser is entitled to be reimbursed by the Fund for fees waived and expenses reimbursed from the commencement of operations through the completion of the first three full fiscal years to the extent that the Total Annual Operating Expenses for a class, not including investment-related costs (such as brokerage commissions), interest, taxes, extraordinary expenses and acquired fund fees and expenses, remains at or below the Operating Expense Limit after such reimbursement. |
Example
This example is intended to help you compare the cost of investing in the Fund with the cost of investing in other mutual funds. The example shows the operating expenses you would incur as a shareholder if you invested $10,000 in the Fund over the time periods shown and you redeem all your shares at the end of those periods. The example assumes that the average annual return was 5%, operating expenses remained the same and expenses were capped for one year in each period.
Although your actual costs may be higher or lower, based on the above assumptions, your costs would be:
| | | | | | | | | | | | | | | | |
| | | 1 Year | | | 3 Years | | | 5 Years | | | 10 Years | |
| Class N Shares | | $ | 144 | | | $ | 1,201 | | | $ | 2,256 | | | $ | 4,884 | |
| Class I Shares | | | 118 | | | | 1,129 | | | | 2,143 | | | | 4,689 | |
PORTFOLIO TURNOVER
The Fund pays transaction costs, such as commissions, when it buys and sells securities (or “turns over” its portfolio). A higher portfolio turnover rate may indicate higher transaction costs and may result in higher taxes when Fund shares are held in a taxable account. These costs, which are not reflected in annual Fund operating expenses or in the example, affect the Fund’s performance. For the period from the Fund’s commencement of operations on December 21, 2011, when the Fund commenced operations, through the Fund’s fiscal year end on October 31, 2012, the Fund’s portfolio turnover rate was 26.22%.
PRINCIPAL INVESTMENT STRATEGIES
Under normal circumstances, the Fund invests at least 80% of its assets in common stocks and other equity securities of small-cap companies. The Fund considers companies with market capitalizations below $3 billion at the time of acquisition to be small-cap. The portfolio manager invests in companies that it believes to be undervalued at the time of purchase. These companies typically possess, in the opinion of the portfolio manager, one or more of the following attributes:
| n | | Business that results in relatively consistent longer-term earning and cash flow growth |
| n | | Franchise/asset value that may make the company attractive to potential acquirers |
| n | | Cyclically depressed earnings and/or cash flow that has potential for improvement |
| n | | A catalyst that will promote recognition of the company’s undervalued status |
The Fund may also invest in securities of companies outside the small-cap range, preferred stock, convertible securities and real estate investment trusts (“REITs”). The portfolio manager employs a strategy of diversification, and adheres to a structured sell discipline.
Prospectus | 52
PRINCIPAL RISKS
You could lose money by investing in the Fund. There can be no assurance that the Fund’s investment objective will be achieved. The following is a summary of the principal risks of investing in the Fund.
Convertible Risk. Convertible preferred securities are subject to the risks of equity securities and fixed income securities. The lower the premium, the more likely the price of the convertible will follow the price of the underlying common stock. Higher premium convertibles are more likely to exhibit the behavior of bonds because the likelihood of conversion is lower. In that case, the price of convertible preferred shares normally will fall as interest rates rise. Conversely, as rates fall, the price of convertible preferred shares will rise.
The value of convertible securities is also affected by prevailing interest rates, the credit quality of the issuer and any call provisions. There is the risk that the issuer of the security will not be able to make principal and/or interest payments as well as the risk that the holder of the security may not take advantage of the convertible features in the appropriate time frame.
Liquidity Risk. When there is no willing buyer and investments cannot be readily sold at the desired time or price, the Fund may need to accept a lower price or may not be able to sell the security at all. An inability to sell securities can adversely affect the Fund’s value or prevent the Fund from being able to take advantage of other investment opportunities. Less liquid securities are more difficult to dispose of at their recorded values and are subject to increased spreads and volatility.
Manager Risk. The performance of the Fund is dependent upon the investment adviser’s skill in selecting managers and the portfolio manager’s skill in making appropriate investments. As a result, the Fund may underperform its benchmark or its peers.
Market Risk. The Fund’s share price can move down in response to stock market conditions, changes in the economy or changes in a particular company’s stock price. An individual stock may decline in value even when the value of stocks in general is rising.
REIT Risk. Securities of REITs may be affected by changes in the values of their underlying properties and by defaults by borrowers or tenants. Some REITs may have limited diversification and may be subject to risks inherent in investments in a limited number of properties, in a narrow geographic area, or in a single property type. Real estate is also affected by general economic conditions. When growth is slowing, demand for property decreases and prices may decline. Rising interest rates, which drive up mortgage and financing costs, can restrain construction and buying and selling activity, and may reduce the appeal of real estate investments. REITs depend generally on their ability to generate cash flow to make distributions to shareholders or unitholders, and may be subject to defaults by borrowers and self-liquidations. A REIT’s return may be adversely affected when interest rates are high or rising. Distributions from REITs generally are taxed as ordinary income for federal income tax purposes.
Small-Cap and Mid-Cap Company Risk. Investing in securities of small-cap and mid-cap companies may involve greater risks than investing in securities of larger, more established issuers. Small-cap and mid-cap companies generally have limited product lines, markets and financial resources. Their securities may trade less frequently and in more limited volume than the securities of larger, more established companies. Also, small-cap and mid-cap companies are typically subject to greater changes in earnings and business prospects than larger companies. As a result, their stock prices may experience greater volatility and may decline significantly in market downturns.
Value Style Risk. Value investing involves buying stocks that are out of favor and/or undervalued in comparison to their peers or their prospects for growth. Typically, their valuation levels are less than those of growth stocks. Because different types of stocks go out of favor with investors depending on market and economic conditions, the Fund’s return may be adversely affected during a market downturn and when value stocks are out of favor.
FUND PERFORMANCE
The bar chart shows the performance of the Class N shares of the Fund for the period shown. Class N shares and Class I shares are invested in the same portfolio of securities, so the annual returns would differ only to the extent that the classes have different expenses. The annual returns of the Class I shares would be higher than the returns of the Class N shares due to 12b-1 fees paid by Class N shares. This information may help illustrate the risks of investing in the Fund. The Fund makes updated performance information available on the Fund’s website, www.astonfunds.com, or by calling 800-992-8151. As with all mutual funds, past performance (before and after taxes) does not guarantee future performance.
Class N Shares
Calendar Year Total Return
| | | | | | | | | | |
 | | | | | | | | | | |
| | Best quarter: | | | 03/12 | | | | 9.69 | % |
| | Worst quarter: | | | 06/12 | | | | (2.46 | )% |
| | | | | | | | | | |
| | | | | | | | | | |
| | | | | | | | | | |
Prospectus | 53
The following table indicates how the Fund’s average annual returns for different calendar periods compared to the returns of a broad-based securities market index.
Average Annual Total Returns
(For the periods ended December 31, 2012)
| | | | | | | | |
| | | ASTON/Silvercrest Small Cap Fund | |
| | | 1 Year | | | Since Inception | |
| Class N Shares (Inception 12/27/11): | | | | | | | | |
Return Before Taxes | | | 13.51 | % | | | 13.32 | % |
Return After Taxes on Distributions | | | 13.28 | % | | | 13.09 | % |
Return After Taxes on Distributions and Sale of Fund Shares | | | 9.04 | % | | | 11.30 | % |
| Class I Shares (Inception 12/27/11): | | | | | | | | |
Return Before Taxes | | | 13.79 | % | | | 13.58 | % |
| Russell 2000 Value Index (Reflects no deduction for taxes, expenses or fees. Index return since inception for Class N shares is computed from December 31, 2011. Index return for Class I shares, since inception, computed from December 31, 2011, is 18.05%.) | | | 18.05 | % | | | 18.05 | % |
After-tax returns are calculated using the historical highest individual federal marginal income tax rates and do not reflect the impact of state and local taxes. After-tax returns depend on an investor’s tax situation and may differ from those shown. After-tax returns shown are not relevant to investors who hold their shares through tax-deferred arrangements, such as 401(k) plans or individual retirement accounts. After-tax returns are shown only for Class N shares. After-tax returns for Class I shares will vary.
MANAGEMENT
Aston Asset Management, LP serves as investment adviser to the Fund. Silvercrest Asset Management Group LLC (“Silvercrest”) serves as the subadviser to the Fund.
Mr. Roger W. Vogel, CFA, a Managing Director of Silvercrest and lead portfolio manager of Silvercrest’s small-cap investment strategy, has served as the Fund’s Portfolio Manager since the Fund’s inception in December 2011.
PURCHASE AND SALE OF FUND SHARES
Shares of the Fund may be purchased, exchanged, or redeemed on any business day by written request (Aston Funds, P.O. Box 9765, Providence, RI 02940), wire transfer, online access (www.astonfunds.com), or by telephone (800-992-8151). Investors who wish to purchase, exchange or redeem Fund shares through a broker-dealer should contact the broker-dealer directly.
| | | | | | | | |
| Class and Account Type | | Minimum Initial Investment | | | Subsequent Investments | |
| Class N—Regular Accounts | | $ | 2,500 | | | $ | 50 | |
| Individual Retirement Accounts (IRAs) | | $ | 500 | | | $ | 50 | |
| Education Savings Accounts (ESAs) | | $ | 500 | | | $ | 50 | |
| Custodial Accounts for Minors (UGMA/UTMA) | | $ | 500 | | | $ | 50 | |
| Class I—Institutional Accounts | | $ | 1 Million | | | $ | 50 | |
TAX INFORMATION
The Fund’s distributions are generally taxable as ordinary income or capital gains for federal income tax purposes, unless you are investing through a tax-deferred account such as a 401(k) or individual retirement account. Distributions on investments made through tax-deferred vehicles, such as 401(k) plans or IRAs, may be taxed later upon withdrawal of assets from those plans or accounts.
PAYMENTS TO BROKER-DEALERS AND OTHER FINANCIAL INTERMEDIARIES
If you purchase shares of the Fund through a broker-dealer or other financial intermediary (such as a bank), the Fund and its related companies may pay the intermediary for the sale of shares and related services. These payments may create a conflict of interest by influencing the broker-dealer or other intermediary and your salesperson to recommend the Fund over another investment. Ask your salesperson or visit your financial intermediary’s website for more information.
Prospectus | 54
ASTON/DoubleLine Core Plus Fixed Income Fund
INVESTMENT OBJECTIVE
The Fund seeks to maximize total return.
FEES AND EXPENSES
The table below describes the fees and expenses that you may pay if you buy and hold shares of the Fund.
ANNUAL FUND OPERATING EXPENSES
(expenses that you pay each year as a percentage of the value of your investment)
| | | | | | | | |
| | | Class N Shares | | | Class I Shares | |
| Management Fees | | | 0.55 | % | | | 0.55 | % |
| Distribution and Service (12b-1) Fees | | | 0.25 | % | | | None | |
| Other Expenses | | | 0.55 | % | | | 0.55 | % |
| Acquired Fund Fees and Expenses | | | 0.01 | % | | | 0.01 | % |
| Total Annual Fund Operating Expenses | | | 1.36 | % | | | 1.11 | % |
Fee Waiver and Expense Reimbursement | | | (0.41 | )%(a) | | | (0.41 | )%(a) |
| Total Annual Fund Operating Expenses After Fee Waiver and Reimbursement | | | 0.95 | %(a) | | | 0.70 | %(a) |
| (a) | The adviser is contractually obligated to waive management fees and/or reimburse ordinary operating expenses, not including investment-related costs (such as brokerage commissions), interest, taxes, extraordinary expenses and acquired fund fees and expenses, through February 28, 2014, to the extent that operating expenses exceed 0.94% of the Fund’s average daily net assets with respect to Class N shares and 0.69% of the Fund’s average daily net assets with respect to Class I shares (the “Operating Expense Limit”). Prior to February 28, 2014, the arrangement may be amended or terminated for a class only by a vote of the Board of Trustees of Aston Funds. For a period of up to three years from the fiscal year end during which such amount was waived or reimbursed, the adviser is entitled to be reimbursed by the Fund for fees waived and expenses reimbursed from the commencement of operations through the completion of the first three full fiscal years to the extent that the Total Annual Operating Expenses for a class, not including investment-related cost (such as brokerage commissions), interest, taxes, extraordinary expenses and acquired fund fees and expenses, remains at or below the Operating Expense Limit after such reimbursement. |
Example
This example is intended to help you compare the cost of investing in the Fund with the cost of investing in other mutual funds. The example shows the operating expenses you would incur as a shareholder if you invested $10,000 in the Fund over the time periods shown and you redeem all your shares at the end of those periods. The example assumes that the average annual return was 5%, operating expenses remained the same, and expenses were capped for one year in each period.
Although your actual costs may be higher or lower, based on the above assumptions, your costs would be:
| | | | | | | | | | | | | | | | |
| | | 1 Year | | | 3 Years | | | 5 Years | | | 10 Years | |
| Class N Shares | | $ | 97 | | | $ | 390 | | | $ | 705 | | | $ | 1,599 | |
| Class I Shares | | | 72 | | | | 312 | | | | 572 | | | | 1,315 | |
PORTFOLIO TURNOVER
The Fund pays transaction costs, such as commissions, when it buys and sells securities (or “turns over” its portfolio). A higher portfolio turnover rate may indicate higher transaction costs and may result in higher taxes when Fund shares are held in a taxable account. These costs, which are not reflected in annual Fund operating expenses or in the example, affect the Fund’s performance. During the most recent fiscal year, the Fund’s portfolio turnover rate was 118.67%.
PRINCIPAL INVESTMENT STRATEGIES
Under normal circumstances, the Fund invests at least 80% of its net assets (plus the amount of borrowings for investment purposes) in fixed income securities. Fixed income securities include, but are not limited to, securities issued or guaranteed by the U.S. government or its agencies, instrumentalities or sponsored corporations; agency mortgage-backed securities; non-agency mortgage-backed securities; commercial mortgage-backed securities; asset-backed securities; foreign and domestic corporate bonds; fixed income securities issued by corporations and governments in foreign countries including emerging markets; securities issued by municipalities; and other securities bearing fixed interest rates of any maturity.
The Fund may invest without limit in below investment grade securities (commonly known as “junk bonds”). The subadviser allocates below investment grade securities broadly by industry and issuer in an attempt to reduce the impact of negative events on an industry or issuer. Below investment grade securities are instruments that are rated BB+ or lower by S&P, rated Ba1 or lower by Moody’s, or the equivalent by any other nationally recognized statistical rating organization (“NRSRO”), or if unrated, of comparable quality in the opinion of the subadviser.
The Fund may also invest in inverse floaters, interest-only and principal-only securities. In addition, the Fund may invest in senior bank loans and assignments, currently through other investment companies advised by DoubleLine Capital LP (“DoubleLine”).
Prospectus | 55
The subadviser actively manages the portfolio’s asset class exposure using a top-down approach based on analysis of sector fundamentals. Primary sectors include government/municipals, high yield, global developed credit, international sovereign debt, emerging markets, and mortgage- and asset-backed. The subadviser will rotate portfolio assets among sectors in various markets to attempt to maximize return. Individual securities within asset classes are selected using a bottom up approach.
The subadviser uses a controlled risk approach which includes consideration of:
| n | | Security selection within a given asset class |
| n | | Relative performance of the various market sectors and asset classes |
| n | | The shape of the yield curve |
| n | | Fluctuations in the overall level of interest rates |
The subadviser also monitors the duration of the securities held by the Fund to seek to mitigate exposure to interest rate risk. Under normal circumstances, the subadviser seeks to maintain an investment portfolio with a weighted average effective duration of no less than two years and no more than eight years. The duration of the Fund’s portfolio may vary materially from its target, from time to time, and there is no assurance that the duration of the Fund’s portfolio will meet its target.
Portfolio securities may be sold at any time. Sales may occur when the subadviser perceives deterioration in the credit fundamentals of the issuer, believes there are negative macro political considerations that may affect the issuer, determines to take advantage of a better investment opportunity, or the individual security has reached the subadviser’s sell target.
PRINCIPAL RISKS
You could lose money by investing in the Fund. There can be no assurance that the Fund’s investment objective will be achieved. The following is a summary of the principal risks of investing in the Fund.
Affiliated Fund Risk. The subadviser is subject to a potential conflict of interest in determining whether to invest in an underlying fund managed by the subadviser, and the subadviser may have an economic or other incentive to make or retain an investment in an affiliated fund in lieu of other investments that may also be appropriate for the Fund.
Asset-Backed and Mortgage-Backed Securities Risks. Asset-backed and mortgage-backed securities are subject to the risk of prepayment. This is more likely to occur when interest rates decline because many borrowers refinance mortgages to take advantage of more favorable rates. Prepayments on mortgage backed securities are also affected by other factors, such as the volume of home sales. The Fund’s yield will be reduced if cash from prepaid securities is reinvested in securities with lower interest rates. The risk of prepayment may also decrease the value of mortgage-backed securities. Asset-backed securities may have a higher level of default and recovery risk than mortgage-backed securities. However, both of these types of securities may decline in value because of mortgage foreclosures or defaults on the underlying obligations.
Credit risk is greater for mortgage-backed securities that are subordinate to another security (i.e., if the holder of a mortgage-backed security is entitled to receive payments only after payment obligations to holders of the other security are satisfied). Mortgage-backed securities issued by private issuers, whether or not such obligations are subject to guarantees by the private issuer, may entail greater risk than mortgage-backed securities guaranteed by the U.S. government. Recent market events have caused the markets for asset-backed and mortgage-backed securities to experience significantly lower valuations and reduced liquidity.
Below Investment Grade (High Yield) Securities Risk. Bonds and other fixed income securities are rated by national ratings agencies. These ratings generally assess the ability of the issuer to pay principal and interest. Issuers of securities that are rated below investment grade (i.e., Ba1/BB+ or lower) and their unrated equivalents are typically in poor financial health, and their ability to pay interest and principal is uncertain. The prices of such securities may be more vulnerable to bad economic news, or even the expectation of bad news, than higher rated or investment grade bonds and other fixed income securities. These securities are considered speculative and are commonly known as “junk bonds.”
Call Risk. Call risk is the possibility that an issuer may redeem a fixed income security before maturity (a call) at a price below its current market price. An increased likelihood of a call may reduce the security’s price. If a fixed income security is called, the Fund may have to reinvest the proceeds in other fixed income securities with lower interest rates, higher credit risks, or other less favorable characteristics.
Credit Risk. Credit risk (also called default risk) is the risk that the issuer of a security will not be able to make principal and interest payments on a debt issue. The credit ratings of issuers could change and negatively affect the Fund’s share price or yield. When the Fund uses derivative instruments to seek credit exposure to underlying issuers, it is subject to the credit risk of both the underlying issuer(s) and the counterparty (typically a broker or bank) to the instrument.
Emerging Market Risk. In addition to the general foreign securities risks, investing in emerging market countries is subject to a number of risks, including:
| n | | Economic structures that are less diverse and mature than those of developed countries |
| n | | Less stable political systems and less developed legal systems |
| n | | National policies that may restrict foreign investment |
| n | | Wide fluctuations in the value of investments |
| n | | Smaller securities markets making investments less liquid |
| n | | Special custody arrangements |
Prospectus | 56
Foreign Securities Risk. Investing in the securities of foreign issuers involves special risks and considerations not typically associated with investing in U.S. companies. The securities of foreign companies may be less liquid and may fluctuate more widely than those traded in U.S. markets. Foreign companies and markets may also have less governmental supervision. There may be difficulty in enforcing contractual obligations and little public information about the companies. Trades typically take more time to settle and clear, and the cost of buying and selling foreign securities is generally higher than similar costs associated with securities traded in U.S. markets.
The value of the securities held by the Fund may be affected by changes in exchange rates or control regulations. If a local currency gains against the U.S. dollar, the value of the holding increases in U.S. dollar terms. If a local currency declines against the U.S. dollar, the value of the holding decreases in U.S. dollar terms. Changes in economic, tax or foreign investment policies, or other political, governmental or economic actions can adversely affect the value of the securities in the Fund. In foreign countries, accounting, auditing and financial reporting standards and other regulatory practices and requirements are generally different from those required for U.S. companies. Investments in securities of foreign issuers may also be subject to foreign withholding and other taxes.
Investment Company Risk. The Fund may invest in securities of other investment companies, including ETFs, open-end funds and closed-end funds. The risks of investment in other investment companies typically reflect the risks of the types of securities in which the funds invest. Investments in ETFs and closed-end funds are subject to the additional risk that shares of the fund may trade at a premium or discount to their net asset value per share. When the Fund invests in another investment company, shareholders of the Fund bear their proportionate share of the other investment company’s fees and expenses as well as their share of the Fund’s fees and expenses.
Interest Rate Risk. If interest rates rise, bond prices will fall. The longer the maturity of a bond, the more sensitive a bond’s price will be to changes in interest rates. In other words, a long-term bond (30-year) will have greater price sensitivity than a short-term bond (2-year). Short-term and long-term bond prices and interest rates do not typically move the same amount or for the same reasons. Interest rate changes will impact high yield bonds in different ways depending on credit ratings. BB rated bonds are more vulnerable to prevailing rates and act more like their investment grade counterparts. For bonds rated B and below, credit risk is more significant than interest rate risk. The value of securities with variable interest rates are generally less sensitive to interest rate changes then fixed rate securities. However, variable rate securities may decrease in value if prevailing rates decrease or if variable rates do not rise as much as rates in general.
Inverse Floating Rate Securities Risk. Inverse floating rate securities (“inverse floaters”) are debt instruments that involve special risks as compared to investments in other fixed income securities. Inverse floaters are derivatives that involve leverage and could magnify the Fund’s gains or losses. In addition, an inverse floater will experience greater price volatility than a fixed-rate obligation of similar credit quality, particularly if it is leveraged. The interest payment received on inverse floaters generally will decrease when short-term interest rates increase. The markets for inverse floaters may be less developed and have less liquidity than the markets of more traditional fixed income securities. Inverse floaters have greater interest rate risk and a higher degree of volatility than more traditional fixed income securities. In addition, some inverse floaters display extreme sensitivity to changes in prepayments.
Liquidity Risk. When there is no willing buyer and investments cannot be readily sold at the desired time or price, the Fund may need to accept a lower price or may not be able to sell the security at all. An inability to sell securities can adversely affect the Fund’s value or prevent the Fund from being able to take advantage of other investment opportunities. Less liquid securities are more difficult to dispose of at their recorded values and are subject to increased spreads and volatility.
Manager Risk. The performance of the Fund is dependent upon the investment adviser’s skill in selecting managers and the portfolio manager’s skill in making appropriate investments. As a result, the Fund may underperform its benchmark or its peers.
Municipal Securities Risks. Municipal securities are subject to risks based on many factors, including deregulation, changes or proposed changes in the federal and state tax structure, economic and regulatory developments, court rulings and other factors. The value of municipal securities may be affected more by supply and demand factors or the creditworthiness of the issuer than by market interest rates. Repayment of municipal securities depends on the ability of the issuer or project backing such securities to generate taxes or revenues.
Portfolio Turnover Risk. Frequent trading of the Fund’s portfolio holdings may result in a higher than average level of capital gains, including short-term gains, and will result in greater transaction costs to the Fund. To the extent distributions to shareholders are made from net short-term capital gains (i.e., net capital gain on securities held or treated as held by the Fund for one year or less minus any net capital losses on securities held or treated as held by the Fund for more than one year), the distributions will be taxed at ordinary income rates for federal income tax purposes, rather than at the lower long-term capital gains rates. Greater transaction costs and higher expenses as a result of portfolio turnover can negatively impact the Fund’s performance.
Senior Loans Risk. Senior loans may not be rated by a rating agency, registered with the Securities and Exchange Commission or any state securities commission or listed on any national securities exchange. Therefore, there may be less publicly available information about them than for registered or exchange-listed securities. An economic downturn generally leads to a higher non-payment rate, and a senior loan may lose significant value before a default occurs. In addition, any specific collateral used to secure a senior loan may decline in value or become illiquid, which would adversely affect the senior loan’s value. There can be no assurance that liquidation of such collateral would satisfy the borrower’s obligation in the event of non-payment of scheduled interest or principal or that such collateral could be readily liquidated. No active trading market may exist for certain senior loans, which may impair the ability of a fund to realize full value in the event of the need to sell a senior loan and which may make it difficult to value senior loans.
U.S. Government Agency Securities Risk. Certain U.S. government agency securities are backed by the right of the issuer to borrow from the U.S. Treasury while others are supported only by the credit of the issuer or instrumentality. While the U.S. government may provide financial support to U.S. government-sponsored agencies or instrumentalities, such as various actions taken to stabilize the Federal National Mortgage Association and Federal Home Loan Mortgage Corporation in 2008, no assurance can be given that it will always do so. Such securities are neither issued nor guaranteed by the U.S. Treasury.
Prospectus | 57
FUND PERFORMANCE
The bar chart shows the performance of the Class N shares of the Fund for the period shown. Class N shares and Class I shares are invested in the same portfolio of securities, so the annual returns would differ only to the extent that the classes have different expenses. The annual returns of the Class I shares would be higher than the returns of the Class N shares due to 12b-1 fees paid by Class N shares. This information may help illustrate the risks of investing in the Fund. The Fund makes updated performance information available on the Fund’s website, www.astonfunds.com, or by calling 800-992-8151. As with all mutual funds, past performance (before and after taxes) does not guarantee future performance.
Class N Shares
Calendar Year Total Return
| | | | | | | | | | |
 | | | | | | | | | | |
| | Best quarter: | | | 09/12 | | | | 3.06 | % |
| | Worst quarter: | | | 12/12 | | | | 0.96 | % |
| | | | | | | | | | |
| | | | | | | | | | |
| | | | | | | | | | |
The following table indicates how the Fund’s average annual returns for different calendar periods compared to the returns of a broad-based securities market index.
Average Annual Total Returns
(For the periods ended December 31, 2012)
| | | | | | | | |
| | | ASTON/DoubleLine
Core Plus Fixed Income Fund | |
| | | 1 Year | | | Since Inception | |
| Class N Shares (Inception 7/18/11): | | | | | | | | |
Return Before Taxes | | | 9.27 | % | | | 11.17 | % |
Return After Taxes on Distributions | | | 7.85 | % | | | 9.68 | % |
Return After Taxes on Distributions and Sale of Fund Shares | | | 6.01 | % | | | 8.65 | % |
| Class I Shares (Inception 7/18/11): | | | 9.54 | % | | | 11.44 | % |
Return Before Taxes | | | | | | | | |
| Barclays Capital U.S. Aggregate Bond Index (Reflects no deduction for taxes, expenses or fees. Index return since inception for Class N shares is computed from July 31, 2011. Index return for Class I shares, since inception, computed from July 31, 2011, is 5.38%.) | | | 4.22 | % | | | 5.38 | % |
After-tax returns are calculated using the historical highest individual federal marginal income tax rates and do not reflect the impact of state and local taxes. After-tax returns depend on an investor’s tax situation and may differ from those shown. After-tax returns shown are not relevant to investors who hold their shares through tax-deferred arrangements, such as 401(k) plans or individual retirement accounts. After-tax returns are shown only for Class N shares. After-tax returns for Class I shares will vary.
MANAGEMENT
Aston Asset Management, LP serves as investment adviser to the Fund. DoubleLine® serves as the subadviser to the Fund.
Mr. Jeffrey E. Gundlach, founder and Chief Executive Officer of DoubleLine and lead portfolio manager of DoubleLine’s core plus fixed income investment strategy, has served as the Fund’s Lead Portfolio Manager since the Fund’s inception in July 2011. Mr. Philip A. Barach, President of DoubleLine, has served as Portfolio Manager for the Fund since its inception in July 2011. Ms. Bonnie Baha, CFA, a DoubleLine portfolio manager, has served as Portfolio Manager for the Fund since its inception in July 2011. Ms. Luz M. Padilla, a DoubleLine portfolio manager, has served as Portfolio Manager for the Fund since its inception in July 2011.
PURCHASE AND SALE OF FUND SHARES
Shares of the Fund may be purchased, exchanged, or redeemed on any business day by written request (Aston Funds, P.O. Box 9765, Providence, RI 02940), wire transfer, online access (www.astonfunds.com), or by telephone (800-992-8151). Investors who wish to purchase, exchange or redeem Fund shares through a broker-dealer should contact the broker-dealer directly.
| | | | | | | | |
| Class and Account Type | | Minimum Initial Investment | | | Subsequent Investments | |
| Class N—Regular Accounts | | $ | 2,500 | | | $ | 50 | |
| Individual Retirement Accounts (IRAs) | | $ | 500 | | | $ | 50 | |
| Education Savings Accounts (ESAs) | | $ | 500 | | | $ | 50 | |
| Custodial Accounts for Minors (UGMA/UTMA) | | $ | 500 | | | $ | 50 | |
| Class I—Institutional Accounts | | $ | 100,000 | | | $ | 50 | |
Prospectus | 58
TAX INFORMATION
The Fund’s distributions are generally taxable as ordinary income or capital gains for federal income tax purposes, unless you are investing through a tax-deferred account such as a 401(k) or individual retirement account. Distributions on investments made through tax-deferred vehicles, such as 401(k) plans or IRAs, may be taxed later upon withdrawal of assets from those plans or accounts.
PAYMENTS TO BROKER-DEALERS AND OTHER FINANCIAL INTERMEDIARIES
If you purchase shares of the Fund through a broker-dealer or other financial intermediary (such as a bank), the Fund and its related companies may pay the intermediary for the sale of shares and related services. These payments may create a conflict of interest by influencing the broker-dealer or other intermediary and your salesperson to recommend the Fund over another investment. Ask your salesperson or visit your financial intermediary’s website for more information.
Prospectus | 59
ASTON/TCH Fixed Income Fund
INVESTMENT OBJECTIVE
The Fund seeks high current income consistent with prudent risk of capital.
FEES AND EXPENSES
The table below describes the fees and expenses that you may pay if you buy and hold shares of the Fund.
ANNUAL FUND OPERATING EXPENSES
(expenses that you pay each year as a percentage of the value of your investment)
| | | | | | | | |
| | | Class N Shares | | | Class I Shares | |
| Management Fees | | | 0.55 | % | | | 0.55 | % |
| Distribution and Service (12b-1) Fees | | | 0.25 | % | | | None | |
| Other Expenses | | | 0.30 | % | | | 0.30 | % |
| Acquired Fund Fees and Expenses | | | 0.01 | % | | | 0.01 | % |
| Total Annual Fund Operating Expenses | | | 1.11 | % | | | 0.86 | % |
Fee Waiver and Expense Reimbursement | | | (0.16 | )%(a) | | | (0.16 | )%(a) |
| Total Annual Fund Operating Expenses After Fee Waiver and Reimbursement | | | 0.95 | %(a) | | | 0.70 | %(a) |
| (a) | The adviser is contractually obligated to waive management fees and/or reimburse ordinary operating expenses, not including investment-related costs (such as brokerage commissions), interest, taxes, extraordinary expenses and acquired fund fees and expenses, through February 28, 2014, to the extent that operating expenses exceed 0.94% of the Fund’s average daily net assets with respect to Class N shares and 0.69% of the Fund’s average daily net assets with respect to Class I shares. Prior to February 28, 2014, the arrangement may be amended or terminated for a class only by a vote of the Board of Trustees of Aston Funds. |
Example
This example is intended to help you compare the cost of investing in the Fund with the cost of investing in other mutual funds. The example shows the operating expenses you would incur as a shareholder if you invested $10,000 in the Fund over the time periods shown and you redeem all your shares at the end of those periods. The example assumes that the average annual return was 5%, operating expenses remained the same, and expenses were capped for one year in each period.
Although your actual costs may be higher or lower, based on the above assumptions, your costs would be:
| | | | | | | | | | | | | | | | |
| | | 1 Year | | | 3 Years | | | 5 Years | | | 10 Years | |
| Class N Shares | | $ | 97 | | | $ | 337 | | | $ | 596 | | | $ | 1,337 | |
| Class I Shares | | | 72 | | | | 258 | | | | 461 | | | | 1,046 | |
PORTFOLIO TURNOVER
The Fund pays transaction costs, such as commissions, when it buys and sells securities (or “turns over” its portfolio). A higher portfolio turnover rate may indicate higher transaction costs and may result in higher taxes when Fund shares are held in a taxable account. These costs, which are not reflected in annual Fund operating expenses or in the example, affect the Fund’s performance. During the most recent fiscal year, the Fund’s portfolio turnover rate was 57.43%.
PRINCIPAL INVESTMENT STRATEGIES
Under normal conditions, the Fund invests at least 80% of its assets in bonds, primarily intermediate-term investment-grade fixed income securities. The Fund may invest in securities of the U.S. government and its agencies, corporate notes and bonds, mortgage- and asset-backed securities and short-term money market instruments. The portfolio managers select securities based on various methods of quantitative and fundamental analysis and research.
The portfolio managers seek to maintain an average weighted portfolio maturity of three to ten years. The portfolio managers emphasize investment-grade fixed income securities, but may invest in high yield securities. The Fund may use futures, swaps and other derivatives for hedging purposes, to manage portfolio duration or to seek total return. Derivatives are expected to consist primarily of futures contracts, interest rate swaps and credit default swaps. Derivatives may be used to hedge interest rate risk and credit risk. Derivatives also may be used to seek exposure to asset classes in which the Fund is authorized to invest. For example, derivatives may provide exposure to specific credits that are not available in the cash markets, or may provide more efficient access to such credits. Derivatives will not be used to seek exposure to asset classes that the Fund may not invest in directly. The net notional (or market exposure) of derivatives instruments will not exceed the net assets of the Fund.
The Fund may invest in foreign securities.
The portfolio managers manage risk through ongoing monitoring of sector, quality and issuer exposures, and ongoing analysis of duration, convexity, and maturity.
Prospectus | 60
PRINCIPAL RISKS
You could lose money by investing in the Fund. There can be no assurance that the Fund’s investment objective will be achieved. The following is a summary of the principal risks of investing in the Fund.
Asset-Backed and Mortgage-Backed Securities Risks. Asset-backed and mortgage-backed securities are subject to the risk of prepayment. This is more likely to occur when interest rates decline because many borrowers refinance mortgages to take advantage of more favorable rates. Prepayments on mortgage backed securities are also affected by other factors, such as the volume of home sales. The Fund’s yield will be reduced if cash from prepaid securities is reinvested in securities with lower interest rates. The risk of prepayment may also decrease the value of mortgage-backed securities. Asset-backed securities may have a higher level of default and recovery risk than mortgage-backed securities. However, both of these types of securities may decline in value because of mortgage foreclosures or defaults on the underlying obligations.
Credit risk is greater for mortgage-backed securities that are subordinate to another security (i.e., if the holder of a mortgage-backed security is entitled to receive payments only after payment obligations to holders of the other security are satisfied). Mortgage-backed securities issued by private issuers, whether or not such obligations are subject to guarantees by the private issuer, may entail greater risk than mortgage-backed securities guaranteed by the U.S. government.
Below Investment Grade (High Yield) Securities Risk. Bonds and other fixed income securities are rated by national ratings agencies. These ratings generally assess the ability of the issuer to pay principal and interest. Issuers of securities that are rated below investment grade (i.e., Ba1/BB+ or lower) and their unrated equivalents are typically in poor financial health, and their ability to pay interest and principal is uncertain. The prices of such securities may be more vulnerable to bad economic news, or even the expectation of bad news, than higher rated or investment grade bonds and other fixed income securities. These securities are considered speculative and are commonly known as “junk bonds.”
Call Risk. Call risk is the possibility that an issuer may redeem a fixed income security before maturity (a call) at a price below its current market price. An increased likelihood of a call may reduce the security’s price. If a fixed income security is called, the Fund may have to reinvest the proceeds in other fixed income securities with lower interest rates, higher credit risks, or other less favorable characteristics.
Credit Risk. Credit risk (also called default risk) is the risk that the issuer of a security will not be able to make principal and interest payments on a debt issue. The credit ratings of issuers could change and negatively affect the Fund’s share price or yield. When the Fund uses derivative instruments to seek credit exposure to underlying issuers, it is subject to the credit risk of both the underlying issuer(s) and the counterparty (typically a broker or bank) to the instrument.
Derivatives Risk. Risks associated with derivatives may include the risk that the derivative is not well correlated with the security, index or currency to which it relates, the risk that derivatives may not have the intended effects and may result in losses or missed opportunities, the risk that the Fund will be unable to sell the derivative because of an illiquid secondary market, the risk that a counterparty is unwilling or unable to meet its obligations, and the risk that the derivative transaction could expose the Fund to the effects of leverage, which could increase the Fund’s exposure to the market and magnify potential losses. There is no guarantee that derivatives, to the extent employed, will have the intended effect, and their use could cause lower returns or even losses to the Fund. The use of derivatives by the Fund to hedge risk may reduce the opportunity for gain by offsetting the positive effect of favorable price movements. The use of over-the-counter derivatives subjects the Fund to credit risk of the counterparty of the instrument. The use of certain derivatives provides exposure to the underlying market or other reference asset in excess of the cash investment of the Fund. The use of derivatives can magnify gains and losses.
Foreign Securities Risk. Investing in the securities of foreign issuers involves special risks and considerations not typically associated with investing in U.S. companies. The securities of foreign companies may be less liquid and may fluctuate more widely than those traded in U.S. markets. Foreign companies and markets may also have less governmental supervision. There may be difficulty in enforcing contractual obligations and little public information about the companies. Trades typically take more time to settle and clear, and the cost of buying and selling foreign securities is generally higher than similar costs associated with securities traded in U.S. markets.
The value of the securities held by the Fund may be affected by changes in exchange rates or control regulations. If a local currency gains against the U.S. dollar, the value of the holding increases in U.S. dollar terms. If a local currency declines against the U.S. dollar, the value of the holding decreases in U.S. dollar terms. Changes in economic, tax or foreign investment policies, or other political, governmental or economic actions can adversely affect the value of the securities in the Fund. In foreign countries, accounting, auditing and financial reporting standards and other regulatory practices and requirements are generally different from those required for U.S. companies. Investments in securities of foreign issuers may also be subject to foreign withholding and other taxes.
Interest Rate Risk. If interest rates rise, bond prices will fall. The longer the maturity of a bond, the more sensitive a bond’s price will be to changes in interest rates. In other words, a long-term bond (30-year) will have greater price sensitivity than a short-term bond (2-year). Short-term and long-term bond prices and interest rates do not typically move the same amount or for the same reasons. Interest rate changes will impact high yield bonds in different ways depending on credit ratings. BB rated bonds are more vulnerable to prevailing rates and act more like their investment grade counterparts. For bonds rated B and below, credit risk is more significant than interest rate risk.
Liquidity Risk. When there is no willing buyer and investments cannot be readily sold at the desired time or price, the Fund may need to accept a lower price or may not be able to sell the security at all. An inability to sell securities can adversely affect the Fund’s value or prevent the Fund from being able to take advantage of other investment opportunities. Less liquid securities are more difficult to dispose of at their recorded values and are subject to increased spreads and volatility.
Manager Risk. The performance of the Fund is dependent upon the investment adviser’s skill in selecting managers and the portfolio manager’s skill in making appropriate investments. As a result, the Fund may underperform its benchmark or its peers.
Prospectus | 61
U.S. Government Agency Securities Risk. Certain U.S. government agency securities are backed by the right of the issuer to borrow from the U.S. Treasury while others are supported only by the credit of the issuer or instrumentality. While the U.S. government may provide financial support to U.S. government-sponsored agencies or instrumentalities, such as various actions taken to stabilize the Federal National Mortgage Association and Federal Home Loan Mortgage Corporation in 2008, no assurance can be given that it will always do so. Such securities are neither issued nor guaranteed by the U.S. Treasury.
FUND PERFORMANCE
The bar chart shows how the performance of the Class N shares of the Fund has varied from year to year over the periods shown. Class N shares and Class I shares are invested in the same portfolio of securities, so the annual returns would differ only to the extent that the classes have different expenses. The annual returns of the Class I shares would be higher than the returns of the Class N shares due to 12b-1 fees paid by Class N shares. This information may help illustrate the risks of investing in the Fund. The Fund makes updated performance information available on the Fund’s website, www.astonfunds.com, or by calling 800-992-8151. As with all mutual funds, past performance (before and after taxes) does not guarantee future performance.
Class N Shares
Calendar Year Total Return
| | | | | | | | | | |
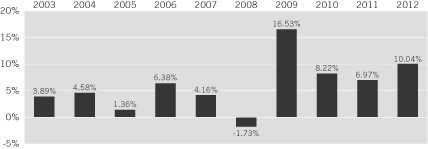 | | | | | | | | | | |
| | Best quarter: | | | 06/09 | | | | 7.86 | % |
| | Worst quarter: | | | 09/08 | | | | (4.95 | )% |
| | | | | | | | | | |
| | | | | | | | | | |
| | | | | | | | | | |
The table below indicates how the Fund’s average annual returns for different calendar periods compared to the returns of a broad-based securities market index.
Average Annual Total Returns
(For the periods ended December 31, 2012)
| | | | | | | | | | | | | | | | |
| | | ASTON/TCH Fixed Income Fund | |
| | | 1 Year | | | 5 Years | | | 10 Years | | | Since Inception | |
| Class N Shares (Inception 12/13/93): | | | | | | | | | | | | | | | | |
Return Before Taxes | | | 10.04 | % | | | 7.85 | % | | | 5.94 | % | | | 6.19 | % |
Return After Taxes on Distributions | | | 8.33 | % | | | 6.02 | % | | | 4.14 | % | | | 4.05 | % |
Return After Taxes on Distributions and Sale of Fund Shares | | | 6.48 | % | | | 5.64 | % | | | 4.00 | % | | | 3.97 | % |
| Class I Shares (Inception 7/31/00): | | | | | | | | | | | | | | | | |
Return Before Taxes | | | 10.31 | % | | | 8.06 | % | | | 6.18 | % | | | 6.66 | % |
| Barclays Capital U.S. Aggregate Bond Index (Reflects no deduction for taxes, expenses or fees. Index return since inception for Class N shares is computed from November 30, 1993. Index return for Class I shares, since inception, is 6.19%.) | | | 4.22 | % | | | 5.95 | % | | | 5.18 | % | | | 6.17 | % |
Taplin, Canida & Habacht, LLC (“TCH”) became the subadviser on December 1, 2006. Performance prior to that date reflects the performance of a previous subadviser.
After-tax returns are calculated using the historical highest individual federal marginal income tax rates and do not reflect the impact of state and local taxes. After-tax returns depend on an investor’s tax situation and may differ from those shown. After-tax returns shown are not relevant to investors who hold their shares through tax-deferred arrangements, such as 401(k) plans or individual retirement accounts. After-tax returns are shown only for Class N shares. After-tax returns for Class I shares will vary.
MANAGEMENT
Aston Asset Management, LP serves as investment adviser to the Fund. TCH serves as the subadviser to the Fund.
Ms. Tere Alvarez Canida, CFA, President and Managing Principal of TCH, Mr. Alan M. Habacht, a principal for TCH, Mr. William J. Canida, CFA, a principal for TCH, and Scott M. Kimball, a portfolio manager at TCH, serve as Portfolio Managers of the Fund. Ms. Canida, Mr. Habacht, and Mr. Canida have served as the Fund’s Portfolio Managers since December 2006. Mr. Kimball has served as the Fund’s Portfolio Manager since February 2013.
Prospectus | 62
PURCHASE AND SALE OF FUND SHARES
Shares of the Fund may be purchased, exchanged, or redeemed on any business day by written request (Aston Funds, P.O. Box 9765, Providence, RI 02940), wire transfer, online access (www.astonfunds.com), or by telephone (800-992-8151). Investors who wish to purchase, exchange or redeem Fund shares through a broker-dealer should contact the broker-dealer directly.
| | | | | | | | |
| Class and Account Type | | Minimum Initial Investment | | | Subsequent Investments | |
| Class N—Regular Accounts | | $ | 2,500 | | | $ | 50 | |
| Individual Retirement Accounts (IRAs) | | $ | 500 | | | $ | 50 | |
| Education Savings Accounts (ESAs) | | $ | 500 | | | $ | 50 | |
| Custodial Accounts for Minors (UGMA/UTMA) | | $ | 500 | | | $ | 50 | |
| Class I—Institutional Accounts | | $ | 1 Million | | | $ | 50 | |
TAX INFORMATION
The Fund’s distributions are generally taxable as ordinary income or capital gains for federal income tax purposes, unless you are investing through a tax-deferred account such as a 401(k) or individual retirement account. Distributions on investments made through tax-deferred vehicles, such as 401(k) plans or IRAs, may be taxed later upon withdrawal of assets from those plans or accounts.
PAYMENTS TO BROKER-DEALERS AND OTHER FINANCIAL INTERMEDIARIES
If you purchase shares of the Fund through a broker-dealer or other financial intermediary (such as a bank), the Fund and its related companies may pay the intermediary for the sale of shares and related services. These payments may create a conflict of interest by influencing the broker-dealer or other intermediary and your salesperson to recommend the Fund over another investment. Ask your salesperson or visit your financial intermediary’s website for more information.
Prospectus | 63
ASTON/Lake Partners LASSO Alternatives Fund
INVESTMENT OBJECTIVE
The Fund seeks to provide long-term total return with reduced correlation to the conventional stock and bond markets.
FEES AND EXPENSES
The table below describes the fee and expenses that you may pay if you buy and hold shares of the Fund.
ANNUAL FUND OPERATING EXPENSES
(expenses that you pay each year as a percentage of the value of your investment)
| | | | | | | | |
| | | Class N Shares | | | Class I Shares | |
| Management Fees | | | 1.00 | % | | | 1.00 | % |
| Distribution and Service (12b-1) Fees | | | 0.25 | % | | | None | |
| Other Expenses | | | 0.20 | %(a) | | | 0.20 | %(a) |
| Acquired Fund Fees and Expenses | | | 1.86 | %(b) | | | 1.86 | %(b) |
| Total Annual Fund Operating Expenses | | | 3.31 | % | | | 3.06 | % |
| (a) | Other expenses include fees equal to 0.04% recouped by the adviser pursuant to an expense reimbursement agreement. The expense reimbursement agreement provides that for a period of up to three years from the fiscal year end during which management fees were waived or operating expenses reimbursed, the adviser is entitled to be reimbursed by the Fund for such fees waived and expenses reimbursed from commencement of operations through the completion of the first three full fiscal years to the extent that the Fund’s Total Annual Operating Expenses for a class, not including investment related costs (such as brokerage commissions), interest, taxes, extraordinary expenses and acquired fund fees and expenses, remains at or below the operating expense limit applicable to each class after such reimbursement. |
| (b) | Acquired Fund Fees and Expenses includes dividend and interest expense on short sales in underlying funds that engage in short selling, currently estimated at 0.46% based on publicly available information. |
Example
This example is intended to help you compare the cost of investing in the Fund with the cost of investing in other mutual funds. The example shows the operating expenses you would incur as a shareholder if you invested $10,000 in the Fund over the time periods shown and you redeem all your shares at the end of those periods. The example assumes that the average annual return was 5%, operating expenses remained the same, and expenses were capped for one year in each period.
Although your actual costs may be higher or lower, based on the above assumptions, your costs would be:
| | | | | | | | | | | | | | | | |
| | | 1 Year | | | 3 Years | | | 5 Years | | | 10 Years | |
| Class N Shares | | $ | 334 | | | $ | 1,018 | | | $ | 1,726 | | | $ | 3,604 | |
| Class I Shares | | | 309 | | | | 945 | | | | 1,606 | | | | 3,374 | |
PORTFOLIO TURNOVER
The Fund pays transaction costs, such as commissions, when it buys and sells securities (or “turns over” its portfolio) except that it generally does not incur transaction costs when it buys mutual fund shares. Underlying funds will also incur these costs. A higher portfolio turnover rate may indicate higher transaction costs and may result in higher taxes when Fund shares are held in a taxable account. These costs, which are not reflected in annual Fund operating expenses or in the example, affect the Fund’s performance. During the most recent fiscal year, the Fund’s portfolio turnover rate was 45.60%.
PRINCIPAL INVESTMENT STRATEGIES
The Fund is structured as a fund of funds. Under normal circumstances, the Fund pursues its objective by investing primarily in a managed portfolio of other open-end investment companies registered under the Investment Company Act of 1940, as amended (the “1940 Act”), that use alternative or hedging strategies (“Alternative Mutual Funds”). The Fund may also invest in closed-end funds, exchange-traded funds and exchange-traded notes, which provide exposure to hedging or alternative investment strategies. Under normal circumstances, the Fund will invest at least 80% of its net assets in Alternative Mutual Funds and other investments with exposure to hedging or alternative investment strategies. The Fund’s strategy is implemented by the subadviser using its proprietary LASSO®, Long and Short Strategic Opportunities®, strategy. The LASSO strategy is intended to produce long-term total returns with less volatility than the overall stock market and reduced correlation to conventional asset classes, across a variety of market climates.
Hedging strategies used by underlying funds include the use of short selling, options, futures, derivatives or similar instruments in an attempt to mitigate risk. Alternative investment strategies include long/short, market neutral and arbitrage strategies; commodities or commodity-linked investments; leverage; derivatives for hedging and return purposes; illiquid, private placement or distressed securities; and other investments and investment techniques that are expected to have reduced correlation with major market indices. The Fund generally seeks to maintain net equity exposure ranging from twenty percent to fifty percent of net assets.
The subadviser employs a top down and bottom up approach to underlying fund selection. Top down measures include an assessment of economic trends and market opportunities and an evaluation of strategy dynamics and risks. The bottom up portion of the investment process involves both qualitative and quantitative measures. In selecting underlying funds the subadviser looks at certain criteria, including consistency of performance, on both an absolute and
Prospectus | 64
relative basis, changes in volatility and correlations over time, investment style of the underlying fund including the investment process and portfolio characteristics, character of the underlying fund manager and transparency with investors and sound organizational structure. To manage risk, the subadviser monitors volatility and net equity exposure, maintains a diversified portfolio, utilizes a dynamic and flexible allocation process across changing investment environments and applies judgment to a strong sell discipline. The Fund’s investment strategies may result in high portfolio turnover.
PRINCIPAL RISKS
You could lose money by investing in the Fund. There can be no assurance that the Fund’s investment objective will be achieved. The following is a summary of the principal risks of investing in the Fund. The risks discussed below for the underlying funds expose the Fund to the same risks.
Aggressive Investment Technique Risk. Investing in underlying funds that use investment techniques and financial instruments that may be considered aggressive, including the use of futures contracts, options on futures contracts, securities and indices, forward contracts, swap agreements and similar instruments, exposes the Fund to potentially dramatic changes (losses) in the value of certain of its portfolio holdings. Such techniques may include short sales or other techniques that are intended to provide inverse exposure to a particular market or other asset class.
CFTC Regulation Risk. The Fund is presently exempt from regulation as a “commodity pool” under Commodity Futures Trading Commission (“CFTC”) Rule 4.5. However, the CFTC has adopted amendments to CFTC Rule 4.5, which may subject the Fund to regulation by the CFTC, and the Fund may be required to operate subject to applicable CFTC requirements, including registration, disclosure and operational requirements under the Commodity Exchange Act. Compliance with these additional requirements may increase Fund expenses. While the investment adviser and subadviser intend to operate the Fund within the parameters of the exemption, the application of these amendments to “funds-of-funds” is not certain.
Commodity Risk. Investing in underlying funds that invest long or short in the commodities market and commodities-linked instruments, such as exchange-traded notes, may subject the Fund to greater volatility than investments in traditional securities. Commodities include energy, metals, agricultural products, livestock and minerals. Underlying funds may buy certain commodities (such as gold) or may invest in commodity linked derivative instruments. The value of commodities and commodity contracts are affected by a variety of factors, including global supply and demand, changes in interest rates, commodity index volatility, and factors affecting a particular industry or commodity, such as drought, floods, weather, livestock disease, embargos, government regulation, tariffs and taxes, world events and economic, political and regulatory developments. The Fund’s ability to invest in underlying funds that invest in the commodities market and its ability to invest in commodities linked instruments may be significantly limited by the federal income tax rules applicable to regulated investment companies. The Fund’s ability to invest in underlying funds that invest in the commodities market may also be limited by Commodity Exchange Act rules.
Credit Risk. Credit risk (also called default risk) is the risk that the issuer of a security will not be able to make principal and interest payments on a debt issue. The credit ratings of issuers could change and negatively affect the Fund’s share price or yield. When underlying funds use derivative instruments to seek credit exposure to underlying issuers, the underlying funds are subject to the credit risk of both the underlying issuer(s) and the counterparty (typically a broker or bank) to the instrument. When underlying funds invest in asset-backed securities, mortgage-backed securities and collateralized mortgage obligations, the underlying funds are subject to the credit risks of the underlying assets that collateralize the instrument. Recent instability in the credit markets has resulted in increased delinquencies and credit losses on certain asset-backed and mortgage-backed securities.
Currency Risk. The value of the securities held by an underlying fund may be affected by changes in exchange rates or control regulations. If a local currency gains against the U.S. dollar, the value of the security increases in U.S. dollar terms. If a local currency declines against the U.S. dollar, the value of the security decreases in U.S. dollar terms.
Derivatives Risk. Risks associated with derivatives may include the risk that the derivative is not well correlated with the security, index or currency to which it relates, the risk that derivatives may not have the intended effects and may result in losses or missed opportunities, the risk that an underlying fund will be unable to sell the derivative because of an illiquid secondary market, the risk that a counterparty is unwilling or unable to meet its obligations, and the risk that the derivative transaction could expose the underlying fund to the effects of leverage, which could increase the underlying fund’s exposure to the market and magnify potential losses. There is no guarantee that derivatives, to the extent employed, will have the intended effect, and their use could cause lower returns or even losses to the underlying fund. The use of derivatives by an underlying fund to hedge risk may reduce the opportunity for gain by offsetting the positive effect of favorable price movements. The use of over-the-counter derivatives subjects the Fund to credit risk of the counterparty of the instrument. The use of certain derivatives provides exposure to the underlying market or other reference asset in excess of the cash investment of the underlying fund. The use of derivatives can magnify gains or losses.
Exchange-Traded and Closed-End Fund Risk. The risks of investment in other investment companies typically reflect the risk of the types of securities in which the underlying funds invest. Investments in exchange-traded funds (“ETFs”) and closed-end funds are subject to the additional risk that shares of the underlying fund may trade at a premium or discount to their net asset value per share. There may also not be an active trading market available for shares of some ETFs or closed-end funds. Additionally, trading of ETF and closed-end fund shares may be halted or delisted by the listing exchange. When the Fund invests in another investment company, shareholders of the Fund bear their proportionate share of the other investment company’s fees and expenses as well as their share of the Fund’s fees and expenses.
Exchange-Traded Note Risk. The returns of exchange-traded notes (“ETNs”) are based on the performance of a specified market index minus applicable fees. The risks of ETNs include the risk of the reference index. The value of an ETN is also subject to the credit risk of the issuer. Thus, the value of an ETN may drop due to a decline in an issuer’s credit quality or a downgrade in the issuer’s credit rating, even if there is no change or an increase in the reference index. ETNs are subject to the additional risk that notes may trade at a premium or discount to their reference index. There may also not be an active trading market
Prospectus | 65
available for some ETNs. Additionally, trading of ETNs may be halted or delisted by the listing exchange. When the Fund invests in an ETN, shareholders of the Fund bear their proportionate share of the ETNs’ fees and expenses as well as their share of the Fund’s fees and expenses.
Fixed Income Risk. Investing in underlying funds that invest long or short in fixed income securities subjects the Fund to additional risks, which include credit risk, interest risk, maturity risk, investment grade securities risk, municipal securities risk and prepayment risk. These risks could affect the value of a particular investment by the Fund, possibly causing the Fund’s share price and total return to be reduced and fluctuate more than other types of investments.
Foreign Securities Risk. Investing in underlying funds that invest long or short in foreign issuers involves risks not associated with U.S. investments, including settlement risks, currency fluctuation, foreign tax risks, different financial reporting practices and regulatory standards, high costs of trading, changes in political conditions, expropriation, investment and repatriation restrictions as well as settlement and custody risks.
Fund-of-Funds Structure Risk. Your cost of investing in the Fund will be higher than the cost of investing directly in the underlying funds. In addition, costs may be higher than mutual funds that invest directly in stocks and bonds. Furthermore, the Fund may be prevented from fully allocating assets to an underlying fund due to regulatory limitations which may impact a fund-of-funds.
Leveraged ETF Risk. Leveraged ETFs seek to provide returns that are a multiple of a stated benchmark, typically using a combination of derivatives strategies. Like other forms of leverage, leveraged ETFs increase risk exposure relative to the amount invested and can lead to significantly greater losses than a comparable unleveraged portfolio. Because leveraged ETFs typically seek to obtain their objective on a daily basis, holding leveraged ETFs for longer than a day may produce unexpected results particularly when the benchmark index experiences large ups and downs.
Liquidity Risk. When there is no willing buyer and investments cannot be readily sold at the desired time or price, an underlying fund may need to accept a lower price or may not be able to sell the security at all. An inability to sell securities can adversely affect the underlying fund’s value or prevent the fund from being able to take advantage of other investment opportunities. Less liquid securities are more difficult to dispose of at their recorded values and are subject to increased spreads and volatility.
Manager Risk. The performance of the Fund is dependent upon the adviser’s skill in selecting managers and the portfolio manager’s skill in making appropriate investments. As a result, the Fund may underperform its benchmark or its peers.
Market Risk. The Fund’s share price can move down in response to stock market conditions, changes in the economy or changes in a particular underlying fund’s share price. An underlying fund may decline in value even when the values of stocks or bonds in general are rising. Overall financial market risks affect the value of the underlying funds and thus the share price of the Fund. Factors such as domestic, economic growth and market conditions, interest rate levels and political events affect the securities markets.
Non-Diversified Risk. An underlying fund that is non-diversified may invest a larger percentage of its assets in a given security than a diversified fund. As a result, it may be more susceptible to a single adverse economic, political or regulatory occurrence affecting one or more issuers in which a large percentage of its assets is invested and may experience increased volatility due to its investments in those securities.
Portfolio Turnover Risk. Frequent trading of securities by the Fund or underlying funds may result in a higher than average level of capital gains, including short-term gains, and will result in greater transaction costs to the Fund. To the extent distributions to shareholders are made from net-short-term capital gains of the Fund (i.e., net capital gain on securities held or treated as held by the Fund for one year or less minus any net capital losses on securities held or treated as held by the Fund for more than one year), the distributions will be taxed at ordinary income rates for federal income tax purposes, rather than at the lower long-term capital gains rates. Greater transaction costs and higher expenses as a result of portfolio turnover can negatively impact the Fund’s performance.
Short Sales Risk. The underlying funds may sell securities short. Short sales involve the risk that an underlying fund will incur a loss by subsequently buying a security at a higher price than the price at which the fund previously sold the security short. Any loss will be increased by the amount of compensation, dividends or interest the fund must pay to the lender of the security. Because a loss incurred by an underlying fund on a short sale results from increases in the value of the security, losses on a short sale are theoretically unlimited. In addition, the Fund may not be able to close out a short position at a particular time or at an acceptable price. A lender may request that borrowed securities be returned on short notice, and the fund may have to buy the securities sold short at an unfavorable price. If this occurs at a time when other short sellers of the same security want to close out their positions, it is more likely that the Fund would have to close out its short position at an unfavorable price. If underlying funds take both long and short positions, there is a risk that the value of securities held long might decrease and the value of securities sold short might increase in response to activities of an individual company or general market conditions. In this case, an underlying fund’s potential losses could exceed those of mutual funds that hold only long positions.
Prospectus | 66
FUND PERFORMANCE
The bar chart shows how the performance of the Class I shares of the Fund has varied from year to year over the periods shown. Class I shares and Class N shares are invested in the same portfolio of securities, so the annual returns would differ only to the extent that the classes have different expenses. The annual returns of the Class N shares would be lower than the returns of the Class I shares due to 12b-1 fees paid by Class N shares. This information may help illustrate the risks of investing in the Fund. The Fund makes updated performance information available on the Fund’s website, www.astonfunds.com, or by calling 800-992-8151. As with all mutual funds, past performance (before and after taxes) does not guarantee future performance.
Class I Shares
Calendar Year Total Return
| | | | | | | | | | |
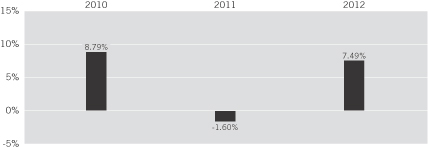 | | | | | | | | | | |
| | Best quarter: | | | 09/10 | | | | 5.38 | % |
| | Worst quarter: | | | 09/11 | | | | (7.25 | )% |
| | | | | | | | | | |
| | | | | | | | | | |
| | | | | | | | | | |
The following table indicates how the Fund’s average annual returns for different calendar periods compared to the returns of a broad-based securities market index.
Average Annual Total Returns
(For the periods ended December 31, 2012)
| | | | | | | | |
| | | ASTON/Lake
Partners LASSO Alternatives Fund | |
| | | 1 Year | | | Since Inception | |
| Class I Shares (Inception 4/01/09): | | | | | | | | |
Return Before Taxes | | | 7.49 | % | | | 7.75 | % |
Return After Taxes on Distributions | | | 7.05 | % | | | 7.25 | % |
Return After Taxes on Distributions and Sale of Fund Shares | | | 4.97 | % | | | 6.41 | % |
| Class N Shares (Inception 3/03/10): | | | | | | | | |
Return Before Taxes | | | 7.21 | % | | | 4.44 | % |
| HFRX Equity Hedge Index (Reflects no deduction for taxes, expenses or fees. Index return since inception for Class N shares computed from February 28, 2010 is (2.62)%). | | | 4.39 | % | | | 0.68 | % |
After-tax returns are calculated using the historical highest individual federal marginal income tax rates and do not reflect the impact of state and local taxes. After-tax returns depend on an investor’s tax situation and may differ from those shown. After-tax returns shown are not relevant to investors who hold their shares through tax-deferred arrangements, such as 401(k) plans or individual retirement accounts.
MANAGEMENT
Aston Asset Management, LP serves as investment adviser to the Fund. Lake Partners, Inc. (“Lake Partners”) serves as the subadviser to the Fund.
Mr. Frederick C. Lake, Co-Chairman and Treasurer of Lake Partners, and Mr. Ronald A. Lake, Co-Chairman and President of Lake Partners, have served as Co-Portfolio Managers of the Fund since the Fund’s inception in April 2009.
PURCHASE AND SALE OF FUND SHARES
Shares of the Fund may be purchased, exchanged, or redeemed on any business day by written request (Aston Funds, P.O. Box 9765, Providence, RI 02940), wire transfer, online access (www.astonfunds.com), or by telephone (800-992-8151). Investors who wish to purchase, exchange or redeem Fund shares through a broker-dealer should contact the broker-dealer directly.
| | | | | | | | |
| Class and Account Type | | Minimum Initial Investment | | | Subsequent Investments | |
| Class N—Regular Accounts | | $ | 2,500 | | | $ | 50 | |
| Individual Retirement Accounts (IRAs) | | $ | 500 | | | $ | 50 | |
| Education Savings Accounts (ESAs) | | $ | 500 | | | $ | 50 | |
| Custodial Accounts for Minors (UGMA/UTMA) | | $ | 500 | | | $ | 50 | |
| Class I—Institutional Accounts | | $ | 100,000 | | | $ | 50 | |
Prospectus | 67
TAX INFORMATION
The Fund’s distributions are generally taxable as ordinary income or capital gains for federal income tax purposes, unless you are investing through a tax-deferred account such as a 401(k) or individual retirement account. Distributions on investments made through tax-deferred vehicles, such as 401(k) plans or IRAs, may be taxed later upon withdrawal of assets from those plans or accounts.
PAYMENTS TO BROKER-DEALERS AND OTHER FINANCIAL INTERMEDIARIES
If you purchase shares of the Fund through a broker-dealer or other financial intermediary (such as a bank), the Fund and its related companies may pay the intermediary for the sale of shares and related services. These payments may create a conflict of interest by influencing the broker-dealer or other intermediary and your salesperson to recommend the Fund over another investment. Ask your salesperson or visit your financial intermediary’s website for more information.
Prospectus | 68
ASTON/Anchor Capital Enhanced Equity Fund
(formerly, ASTON/M.D. Sass Enhanced Equity Fund)
INVESTMENT OBJECTIVE
The Fund seeks total return through a combination of a high level of current income and capital appreciation.
FEES AND EXPENSES
The table below describes the fees and expenses that you may pay if you buy and hold shares of the Fund.
ANNUAL FUND OPERATING EXPENSES
(expenses that you pay each year as a percentage of the value of your investment)
| | | | | | | | |
| | | Class N Shares | | | Class I Shares | |
| Management Fees | | | 0.70 | % | | | 0.70 | % |
| Distribution and Service (12b-1) Fees | | | 0.25 | % | | | None | |
| Other Expenses | | | 0.27 | % | | | 0.27 | % |
| Total Annual Fund Operating Expenses | | | 1.22 | % | | | 0.97 | % |
Example
This example is intended to help you compare the cost of investing in the Fund with the cost of investing in other mutual funds. The example shows the operating expenses you would incur as a shareholder if you invested $10,000 in the Fund over the time periods shown and you redeem all your shares at the end of those periods. The example assumes that the average annual return was 5% and operating expenses remained the same.
Although your actual costs may be higher or lower, based on the above assumptions, your costs would be:
| | | | | | | | | | | | | | | | |
| | | 1 Year | | | 3 Years | | | 5 Years | | | 10 Years | |
| Class N Shares | | $ | 124 | | | $ | 387 | | | $ | 670 | | | $ | 1,477 | |
| Class I Shares | | | 99 | | | | 309 | | | | 536 | | | | 1,190 | |
PORTFOLIO TURNOVER
The Fund pays transaction costs, such as commissions, when it buys and sells securities (or “turns over” its portfolio). A higher portfolio turnover rate may indicate higher transaction costs and may result in higher taxes when Fund shares are held in a taxable account. These costs, which are not reflected in annual Fund operating expenses or in the example, affect the Fund’s performance. During the most recent fiscal year, the Fund’s portfolio turnover rate was 56.33%.
PRINCIPAL INVESTMENT STRATEGIES
The Fund pursues its objective by investing primarily in a diversified portfolio of large-cap and mid-cap equity securities traded in U.S. markets and by writing covered call options on a substantial portion of the Fund’s long equity portfolio. The portfolio managers focus on companies with regular quarterly dividends and with market capitalizations of $4 billion or more at the time of acquisition. The Fund places primary emphasis on the generation of income. Option premiums and dividend income are expected to constitute a significant portion of total return. Under normal circumstances, the Fund invests at least 80% of its assets in equity securities.
Equity Selection
The portfolio manager selects equity securities using a bottom-up investment approach focusing on the fundamentals of each company. The portfolio manager emphasizes a company’s current dividend yield, free cash flow and stability. The Fund may invest in equity securities of foreign issuers that are traded in U.S. markets.
Covered Call Strategy
On an ongoing and consistent basis, the portfolio manager intends to write (sell) covered call options on a substantial portion of the Fund’s long equity portfolio as a means of enhancing return. Call options are contracts that give the holder (buyer) of the option, in return for payment of a premium, the right, but not the obligation, to purchase from the writer of the option the security underlying the option at a specified exercise price prior to the expiration date. As the writer of a call option, the Fund receives the premium from the purchaser of the option and has the obligation, upon exercise of the option, to deliver the underlying security upon payment of the exercise price. If the option expires without being exercised, the Fund is not required to deliver the underlying security but retains the premium received.
The Fund generally writes covered call options that are out-of-the money to generate premium income for the Fund. A call option is out-of-the money if the exercise price is above the current market price for the underlying security. The Fund will generally buy back call options that reach the exercise price, in lieu of allowing them to be exercised, and write a new option at a higher exercise price.
Prospectus | 69
In addition to writing covered call options, the Fund may also use certain derivatives transactions for hedging purposes or to seek total return. The portfolio manager currently intends to purchase put options on securities in the Fund’s portfolio and put options on securities indices.
The portfolio manager actively manages risk and adheres to a strong sell discipline.
PRINCIPAL RISKS
You could lose money by investing in the Fund. There can be no assurance that the Fund’s investment objective will be achieved. The following is a summary of the principal risks of investing in the Fund.
Covered Call Option Risk. Investments in covered calls involve certain risks. These risks include:
| n | | By selling covered call options, the Fund limits its opportunity to profit from an increase in the price of the underlying stock above the exercise price, but continues to bear the risk of a decline in the value of the underlying stock. While the Fund receives a premium for writing the call option, the price the Fund realizes from the sale of stock upon exercise of the option could be substantially below its current market price. |
| n | | A liquid market may not exist for options held by the Fund. If the Fund is not able to close out an options transaction, the Fund will not be able to sell the underlying security until the option expires or is exercised. |
| n | | The Fund’s investment strategy may also result in a lack of liquidity of the purchase and sale of portfolio securities. Because the Fund generally will hold the stocks underlying the call options, the Fund may be less likely to sell the stocks in its portfolio to take advantage of new investment opportunities. |
If the Fund generates premiums from its sale of call options, these premiums typically will result in short-term capital gains for federal income tax purposes. Distributions of net short-term capital gain are taxable to shareholders as ordinary income for federal income tax purposes. Transactions involving the disposition of the Fund’s underlying securities (whether pursuant to the exercise of a call option or otherwise) will give rise to capital gains or losses. Because the Fund will have no control over the exercise of the call options, it may be forced to realize capital gains or losses at inopportune times and it will not be able to control whether such gains or losses are short-term or long-term for federal income tax purposes. The Fund’s portfolio turnover rate does not take into account short-term capital gains generated from premiums on the sale of call options. The Fund is not designed for investors seeking a tax efficient investment.
Derivatives Risk. Risks associated with derivatives may include the risk that the derivative is not well correlated with the security, index or currency to which it relates, the risk that derivatives may not have the intended effects and may result in losses or missed opportunities, the risk that the Fund will be unable to sell the derivative because of an illiquid secondary market, the risk that a counterparty is unwilling or unable to meet its obligations, and the risk that the derivative transaction could expose the Fund to the effects of leverage, which could increase the Fund’s exposure to the market and magnify potential losses. There is no guarantee that derivatives, to the extent employed, will have the intended effect, and their use could cause lower returns or even losses to the Fund. The use of derivatives by the Fund to hedge risk may reduce the opportunity for gain by offsetting the positive effect of favorable price movements. The use of over-the-counter derivatives subjects the Fund to credit risk of the counterparty instrument. The use of certain derivatives provides exposure to the underlying market or other reference asset in excess of the cash investment of the Fund. The use of derivatives can magnify gains and losses.
Liquidity Risk. When there is no willing buyer and investments cannot be readily sold at the desired time or price, the Fund may need to accept a lower price or may not be able to sell the security at all. An inability to sell securities can adversely affect the Fund’s value or prevent the Fund from being able to take advantage of other investment opportunities. Less liquid securities are more difficult to dispose of at their recorded values and are subject to increased spreads and volatility.
Manager Risk. The performance of the Fund is dependent upon the investment adviser’s skill in selecting managers and the portfolio manager’s skill in making appropriate investments. As a result, the Fund may underperform its benchmark or its peers.
Market Risk. The Fund’s share price can move down in response to stock market conditions, changes in the economy or changes in a particular company’s stock price. An individual stock may decline in value even when the value of stocks in general is rising.
Mid-Cap Company Risk. Investments in mid-cap companies may entail greater risks than investments in larger, more established companies. Mid-cap companies generally have narrower product lines, more limited financial resources and a more limited trading market for their stocks compared with larger companies. As a result, their stock prices may experience greater volatility and may decline significantly in market downturns.
Prospectus | 70
FUND PERFORMANCE
The bar chart shows how the performance of the Class N shares of the Fund has varied from year to year over the periods shown. Class N shares and Class I shares are invested in the same portfolio of securities, so the annual returns would differ only to the extent that the classes have different expenses. The annual returns of the Class I shares would be higher than the returns of the Class N shares due to 12b-1 fees paid by Class N shares. This information may help illustrate the risks of investing in the Fund. The Fund makes updated performance information available on the Fund’s website, www.astonfunds.com, or by calling 800-992-8151. As with all mutual funds, past performance (before and after taxes) does not guarantee future performance.
Class N Shares
Calendar Year Total Return
| | | | | | | | | | |
 | | | | | | | | | | |
| | Best quarter: | | | 06/09 | | | | 18.93 | % |
| | Worst quarter: | | | 03/09 | | | | (7.13 | )% |
| | | | | | | | | | |
| | | | | | | | | | |
| | | | | | | | | | |
The following table indicates how the Fund’s average annual return for the calendar period compared to the returns of a broad-based securities market index.
Average Annual Total Returns
(For the periods ended December 31, 2012)
| | | | | | | | |
| | | ASTON/Anchor Capital Enhanced Equity Fund | |
| | | 1 Year | | | Since Inception | |
| Class N Shares (Inception 1/15/08): | | | | | | | | |
Return Before Taxes | | | 2.81 | % | | | 3.25 | % |
Return After Taxes on Distributions | | | 1.60 | % | | | 1.17 | % |
Return After Taxes on Distributions and Sale of Fund Shares | | | 1.98 | % | | | 1.60 | % |
| Class I Shares (Inception 3/03/10): | | | | | | | | |
Return Before Taxes | | | 3.18 | % | | | 5.83 | % |
Standard & Poor’s (S&P) 500 Index (Reflects no deduction for taxes, expenses or fees. Index return since inception for
Class N shares is computed from December 31, 2007. Index return for Class I shares, since inception, computed from February 28, 2010 is 11.78%.) | | | 15.99 | % | | | 1.66 | % |
As of June 30, 2012, the Fund changed its name from ASTON/M.D. Sass Enhanced Equity Fund to ASTON/Anchor Capital Enhanced Equity Fund and Anchor Capital Advisors LLC (“Anchor Capital”) became the subadviser. Performance prior to that date reflects the performance of previous subadvisers. However, Mr. Altman has served as a portfolio manager since the Fund’s inception in January 2008.
After-tax returns are calculated using the historical highest individual federal marginal income tax rates and do not reflect the impact of state and local taxes. After-tax returns depend on an investor’s tax situation and may differ from those shown. After-tax returns shown are not relevant to investors who hold their shares through tax-deferred arrangements, such as 401(k) plans or individual retirement accounts. After-tax returns are shown only for Class N shares. After-tax returns for Class I shares will vary.
MANAGEMENT
Aston Asset Management, LP serves as investment adviser to the Fund. Anchor Capital serves as the subadviser to the Fund.
Mr. Ronald L. Altman, Senior Vice President and Senior Portfolio Manager of Anchor Capital, has served as the Fund’s Portfolio Manager since its inception in January 2008.
Prospectus | 71
PURCHASE AND SALE OF FUND SHARES
Shares of the Fund may be purchased, exchanged, or redeemed on any business day by written request (Aston Funds, P.O. Box 9765, Providence, RI 02940), wire transfer, online access (www.astonfunds.com), or by telephone (800-992-8151). Investors who wish to purchase, exchange or redeem Fund shares through a broker-dealer should contact the broker-dealer directly.
| | | | | | | | |
| Class and Account Type | | Minimum Initial Investment | | | Subsequent Investments | |
| Class N—Regular Accounts | | $ | 2,500 | | | $ | 50 | |
| Individual Retirement Accounts (IRAs) | | $ | 500 | | | $ | 50 | |
| Education Savings Accounts (ESAs) | | $ | 500 | | | $ | 50 | |
| Custodial Accounts for Minors (UGMA/UTMA) | | $ | 500 | | | $ | 50 | |
| Class I—Institutional Accounts | | $ | 1 Million | | | $ | 50 | |
TAX INFORMATION
The Fund’s distributions are generally taxable as ordinary income or capital gains for federal income tax purposes, unless you are investing through a tax-deferred account such as a 401(k) or individual retirement account. Distributions on investments made through tax-deferred vehicles, such as 401(k) plans or IRAs, may be taxed later upon withdrawal of assets from those plans or accounts.
PAYMENTS TO BROKER-DEALERS AND OTHER FINANCIAL INTERMEDIARIES
If you purchase shares of the Fund through a broker-dealer or other financial intermediary (such as a bank), the Fund and its related companies may pay the intermediary for the sale of shares and related services. These payments may create a conflict of interest by influencing the broker-dealer or other intermediary and your salesperson to recommend the Fund over another investment. Ask your salesperson or visit your financial intermediary’s website for more information.
Prospectus | 72
ASTON/River Road Long-Short Fund
INVESTMENT OBJECTIVE
The Fund seeks to provide absolute return while minimizing volatility over a full market cycle.
FEES AND EXPENSES
The table below describes the fees and expenses that you may pay if you buy and hold shares of the Fund.
ANNUAL FUND OPERATING EXPENSES
(expenses that you pay each year as a percentage of the value of your investment)
| | | | | | | | |
| | | Class N Shares | | | Class I Shares | |
| Management Fees | | | 1.20 | % | | | 1.20 | % |
| Distribution and Service (12b-1) Fees | | | 0.25 | % | | | None | |
| Other Expenses | | | | | | | | |
Other Operating Expenses | | | 2.17 | %(a) | | | 2.17 | %(a) |
Dividend and Interest Expense on Short Sales | | | 1.41 | %(a) | | | 1.41 | %(a) |
| Total Other Expenses | | | 3.58 | %(a) | | | 3.58 | %(a) |
| Acquired Fund Fees and Expenses | | | 0.05 | % | | | 0.05 | % |
| Total Annual Fund Operating Expenses | | | 5.08 | % | | | 4.83 | % |
Fee Waiver and/or Expense Reimbursement | | | (1.92 | )%(b) | | | (1.92 | )%(b) |
| Total Annual Fund Operating Expenses After Fee Waiver and/or Expense Reimbursement | �� | | 3.16 | %(b) | | | 2.91 | %(b) |
| (a) | Other expenses include dividends or interest on short sales of securities, which are paid to the lender of a security, and stock loan fees, which are paid to the prime broker. |
| (b) | The adviser is contractually obligated to waive management fees and/or reimburse ordinary operating expenses, not including investment-related costs (such as brokerage commissions), interest, taxes, extraordinary expenses and acquired fund fees and expenses and dividend and interest expenses related to short sales, through February 28, 2014, to the extent that operating expenses exceed 1.70% of the Fund’s average daily net assets with respect to Class N shares and 1.45% of the Fund’s average daily net assets with respect to Class I shares (“Operating Expense Limit”). Prior to February 28, 2014, the arrangement may be amended or terminated for a class only by a vote of the Board of Trustees of the Trust. For a period of up to three years from the fiscal year end during which such amount was waived or reimbursed, the adviser is entitled to be reimbursed by the Fund for fees waived and expenses reimbursed from commencement of operations through the completion of the first three full fiscal years to the extent that the Fund’s Total Annual Operating Expenses for a class, not including investment related costs (such as brokerage commissions), interest, taxes, extraordinary expenses, acquired fund fees and expenses, remains at or below the Operating Expense Limit after such reimbursement. |
Example
This example is intended to help you compare the cost of investing in the Fund with the cost of investing in other mutual funds. The example shows the operating expenses you would incur as a shareholder if you invested $10,000 in the Fund over the time periods shown and you redeem all your shares at the end of those periods. The example assumes that the average annual return was 5%, operating expenses remained the same, and expenses were capped for one year in each period.
Although your actual costs may be higher or lower, based on the above assumptions, your costs would be:
| | | | | | | | | | | | | | | | |
| | | 1 Year | | | 3 Years | | | 5 Years | | | 10 Years | |
| Class N Shares | | $ | 319 | | | $ | 1,353 | | | $ | 2,385 | | | $ | 4,958 | |
| Class I Shares | | | 294 | | | | 1,282 | | | | 2,273 | | | | 4,766 | |
PORTFOLIO TURNOVER
The Fund pays transaction costs, such as commissions, when it buys and sells securities (or “turns over” its portfolio). A higher portfolio turnover rate may indicate higher transaction costs and may result in higher taxes when Fund shares are held in a taxable account. These costs, which are not reflected in annual Fund operating expenses or in the example, affect the Fund’s performance. During the most recent fiscal year, the Fund’s portfolio turnover rate was 277.72%.
PRINCIPAL INVESTMENT STRATEGIES
The Fund pursues its investment objective by taking long and short positions in equity securities. The Fund’s portfolio managers believe that a combination of long and short positions may provide positive returns through a complete market cycle and may offer reduced risk. The allocation between long and short positions is a result of the fundamental investment process. The Fund does not intend to be market neutral and anticipates that it will normally hold a higher percentage of its assets in long positions (i.e., the Fund will be “net long”). The Fund’s equity investments consist primarily of domestic common stock but may also include other types of equity such as foreign stock, preferred stock, convertible securities and real estate investment trusts (“REITs”). The Fund may use instruments such as exchange-traded funds (“ETFs”), options, futures and other index-based investments to manage its exposure between long and short positions. Derivative use, if any, is expected to consist primarily of put and call options on securities. Cash is a residual of the investment process. When the portfolio manager is unable to find investment opportunities that meet the Fund’s criteria, the Fund’s cash balances may increase. The Fund is classified as non-diversified.
Prospectus | 73
In selecting both long and short positions, the portfolio managers employ a value-driven, bottom-up approach. When the Fund takes a long position, it purchases a stock outright. The Fund takes long positions in securities that the portfolio managers believe will rise in value. For long positions, the portfolio managers seek to identify companies they believe have certain characteristics including:
| n | | Priced at a discount to absolute value |
| n | | Attractive business model |
| n | | Shareholder-oriented management |
| n | | Undiscovered, under-followed, misunderstood |
The Fund takes short positions in securities that the portfolio managers believe will go down in value. For short positions, the portfolio managers seek to identify companies they believe have certain characteristics including:
| n | | Priced at a premium to absolute value |
| n | | Unattractive business model |
| n | | Poor shareholder-orientation |
| n | | Unrealistic expectations |
| n | | Avoiding strong momentum |
When the Fund takes a short position, it sells a stock that it does not own at the current market price in anticipation that the market price will go down. To complete a short sale, the Fund must borrow the security to make delivery to the buyer. The Fund is then obligated to replace the borrowed security by purchasing the security in the open market at the time of closing out the short sale. The price at such time may be more or less than at the time the security was sold. Until the borrowed security is returned, the Fund is required to pay the lender amounts equal to any dividends or interest that accrue during the period of the loan. To borrow the security, the Fund also may be required to pay a premium to the lender, which would increase the cost of the security sold. The proceeds of the short sale will be retained by the broker to the extent necessary to meet margin requirements, until the short position is closed. For additional information regarding short sales, please see the “Additional Information Regarding Investment Strategies” Section.
The net market exposure will fluctuate with market opportunities but will generally be between 10% and 90%. To manage risk the portfolio managers may use controls and techniques to systemically reduce market exposure upon the occurrence of certain trigger events.
PRINCIPAL RISKS
You could lose money by investing in the Fund. There can be no assurance that the Fund’s investment objective will be achieved. The following is a summary of the principal risks of investing in the Fund. The Fund may be subject to the following risks directly through investment in individual securities or indirectly through investment in ETFs or derivative instruments.
Convertible Risk. Convertible preferred securities are subject to the risks of equity securities and fixed income securities. The lower the premium, the more likely the price of the convertible will follow the price of the underlying common stock. Higher premium convertibles are more likely to exhibit the behavior of bonds because the likelihood of conversion is lower. In that case, the price of convertible preferred shares normally will fall as interest rates rise. Conversely, as rates fall, the price of convertible preferred shares will rise.
The value of convertible securities is also affected by prevailing interest rates, the credit quality of the issuer and any call provisions. There is the risk that the issuer of the security will not be able to make principal and/or interest payments as well as the risk that the holder of the security may not take advantage of the convertible features in the appropriate time frame.
Derivatives Risk. Risks associated with derivatives may include the risk that the derivative is not well correlated with the security, index or currency to which it relates, the risk that derivatives may not have the intended effects and may result in losses or missed opportunities, the risk that the Fund will be unable to sell the derivative because of an illiquid secondary market, the risk that a counterparty is unwilling or unable to meet its obligations, and the risk that the derivative transaction could expose the Fund to the effects of leverage, which could increase the Fund’s exposure to the market and magnify potential losses. There is no guarantee that derivatives, to the extent employed, will have the intended effect, and their use could cause lower returns or even losses to the Fund. The use of derivatives by the Fund to hedge risk may reduce the opportunity for gain by offsetting the positive effect of favorable price movements. The use of over-the-counter derivatives subjects the Fund to credit risk of the counterparty instrument. The use of certain derivatives provides exposure to the underlying market or other reference asset in excess of the cash investment of the Fund. The use of derivatives can magnify gains and losses.
Exchange-Traded and Closed-End Fund Risk. The risks of investment in other investment companies typically reflect the types of securities in which the underlying funds invest. Investments in ETFs and closed-end funds are subject to the additional risk that shares of the underlying fund may trade at a premium or discount to their net asset value per share. There may also not be an active trading market available for shares of some ETFs or closed-end funds. Additionally, trading of ETF and closed-end fund shares may be halted or delisted by the listing exchange. An inverse ETF is a fund that is constructed by using various derivative instruments to profit from a decline in the underlying benchmark. Investing in these ETFs is similar to holding various short positions, or using a combination of advanced investment strategies to profit from falling prices. When the Fund invests in another investment company, shareholders of the Fund bear their proportionate share of the other investment company’s fees and expenses as well as their share of the Fund’s fees and expenses.
Prospectus | 74
Similarly, short sales of ETFs are subject to the specific risks described under “Short Sale Risk.” In addition, if the Fund sells short shares of ETFs that are financially leveraged, such short sales may be expected to exhibit enhanced volatility in market price as compared to short sales of similar ETFs without a leveraged capital structure.
Foreign Securities Risk. Investing in the securities of foreign issuers involves special risks and considerations not typically associated with investing in U.S. companies. The securities of foreign companies may be less liquid and may fluctuate more widely than those traded in U.S. markets. Foreign companies and markets may also have less governmental supervision. There may be difficulty in enforcing contractual obligations and little public information about the companies. Trades typically take more time to settle and clear, and the cost of buying and selling foreign securities is generally higher than similar costs associated with securities traded in U.S. markets.
The value of the securities held by the Fund may be affected by changes in exchange rates or control regulations. If a local currency gains against the U.S. dollar, the value of the holding increases in U.S. dollar terms. If a local currency declines against the U.S. dollar, the value of the holding decreases in U.S. dollar terms. Changes in economic, tax or foreign investment policies, or other political, governmental or economic actions can adversely affect the value of the securities in the Fund. In foreign countries, accounting, auditing and financial reporting standards and other regulatory practices and requirements are generally different from those required for U.S. companies. Investments in securities of foreign issuers may also be subject to foreign withholding and other taxes.
Liquidity Risk. When there is no willing buyer and investments cannot be readily sold at the desired time or price, the Fund may need to accept a lower price or may not be able to sell the security at all. An inability to sell securities can adversely affect the Fund’s value or prevent the Fund from being able to take advantage of other investment opportunities. Less liquid securities are more difficult to dispose of at their recorded values and are subject to increased spreads and volatility.
Manager Risk. The performance of the Fund is dependent upon the investment adviser’s skill in selecting managers and the portfolio manager’s skill in making appropriate investments. As a result, the Fund may underperform its benchmark or its peers.
Market Risk. The Fund’s share price can move down in response to stock market conditions, changes in the economy or changes in a particular company’s stock price. An individual stock may decline in value even when the value of stocks in general is rising.
Non-Diversification Risk. The Fund may invest a larger percentage of its assets in a given security than a diversified fund. As a result, it may be more susceptible to a single adverse economic, political or regulatory occurrence affecting one or more issuers in which a large percentage of its assets is invested and may experience increased volatility due to its investments in those securities.
Portfolio Turnover Risk. Frequent trading of the Fund’s portfolio holdings may result in a higher than average level of capital gains, including short-term gains, and will result in greater transaction costs to the Fund. To the extent distributions to shareholders are made from net short-term capital gains (i.e., net capital gain on securities held or treated as held by the Fund for one year or less minus any net capital losses on securities held or treated as held by the Fund for more than one year), the distributions will be taxed at ordinary income rates for federal income tax purposes, rather than at the lower long-term capital gains rates. Greater transaction costs and higher expenses as a result of portfolio turnover may negatively impact the Fund’s performance.
REIT Risk. Exposure to real estate markets, through securities of real estate investment trusts (“REITs”) or other instruments, will be subject to risks of specific properties or property types and by default rates of borrowers or tenants. Some REITs may have limited diversification and may be subject to risks inherent in investments in a limited number of properties, in a narrow geographic area, or in a single property type. REITs are also affected by general economic conditions. When growth is slowing, demand for property decreases and prices may decline. Rising interest rates, which drive up mortgage and financing costs, can restrain construction and buying and selling activity, and may reduce the appeal of real estate investments. REITs depend generally on their ability to generate cash flow to make distributions to shareholders or unitholders, and may be subject to defaults by borrowers and self-liquidations. A REIT’s return may be adversely affected when interest rates are high or rising. Distributions to shareholders attributable to dividends received from REITs generally are taxed as ordinary income for federal income purposes.
Short Sales Risk. Short sales involve the risk that the Fund will incur a loss by subsequently buying a security at a higher price than the price at which the Fund previously sold the security short. Any loss will be increased by the amount of compensation, dividends or interest the Fund must pay to the lender of the security. Because a loss incurred on a short sale results from increases in the value of the security, losses on a short sale are theoretically unlimited. In addition, the Fund may not be able to close out a short position at a particular time or at an acceptable price. A lender may request that borrowed securities be returned on short notice, and the Fund may have to buy the securities sold short at an unfavorable price. If this occurs at a time when other short sellers of the same security want to close out their positions, it is more likely that the Fund would have to close out its short position at an unfavorable price. If this occurs at a time when other short sellers of the same security also want to close out their positions, a “short squeeze” may occur. A “short squeeze” occurs when demand is greater than supply for the security sold short. A short squeeze makes it more likely that the Fund will have to cover its short sale at an unfavorable price. If that happens, the Fund will lose some or all of the potential profit from, or even incur a loss on, the short sale. The Fund’s use of short sales may have a leveraging effect on the Fund’s portfolio.
Value Style Risk. Value investing involves buying stocks that are out of favor and/or undervalued in comparison to their peers or their prospects for growth. Typically, their valuation levels are less than those of growth stocks. Because different types of stocks go out of favor with investors depending on market and economic conditions, the Fund’s return may be adversely affected during a market downturn and when value stocks are out of favor.
Prospectus | 75
FUND PERFORMANCE
The bar chart shows the performance of the Class N shares of the Fund for the period shown. Class N shares and Class I shares are invested in the same portfolio of securities, so the annual returns would differ only to the extent that the classes have different expenses. The annual returns of the Class I shares would be higher than the returns of the Class N shares due to 12b-1 fees paid by Class N shares. This information may help illustrate the risks of investing in the Fund. The Fund makes updated performance information available on the Fund’s website, www.astonfunds.com, or by calling 800-992-8151. As with all mutual funds, past performance (before and after taxes) does not guarantee future performance.
Class N Shares
Calendar Year Total Return
| | | | | | | | | | |
 | | | | | | | | | | |
| | Best quarter: | | | 03/12 | | | | 5.41 | % |
| | Worst quarter: | | | 06/12 | | | | (0.76 | )% |
| | | | | | | | | | |
| | | | | | | | | | |
| | | | | | | | | | |
The following table indicates how the Fund’s average annual returns for different calendar periods compared to the returns of a broad-based securities market index.
Average Annual Total Returns
(For the periods ended December 31, 2012)
| | | | | | | | |
| | | ASTON/River Road Long-Short Fund(a) | |
| | | 1 Year | | | Since Inception | |
| Class N Shares (Inception 5/4/11): | | | | | | | | |
Return Before Taxes | | | 9.58 | % | | | 5.53 | % |
Return After Taxes on Distributions | | | 7.90 | % | | | 4.55 | % |
Return After Taxes on Distributions and Sale of Fund Shares | | | 6.52 | % | | | 4.22 | % |
| Russell 3000 Index (Reflects no deduction for taxes, expenses or fees. Index return since inception for Class N shares is computed from April 30, 2011.) | | | 16.42 | % | | | 4.35 | % |
| (a) | Class I shares are new, and therefore no returns are shown for Class I shares. |
After-tax returns are calculated using the historical highest individual federal marginal income tax rates and do not reflect the impact of state and local taxes. After-tax returns depend on an investor’s tax situation and may differ from those shown. After-tax returns shown are not relevant to investors who hold their shares through tax-deferred arrangements, such as 401(k) plans or individual retirement accounts.
MANAGEMENT
Aston Asset Management, LP serves as investment adviser to the Fund. River Road Asset Management, LLC (“River Road”) serves as subadviser to the Fund.
Mr. Matthew W. Moran, CFA, a portfolio manager at River Road, serves as the Fund’s Lead Portfolio Manager and Mr. Daniel Johnson, CFA, CPA, a portfolio manager at River Road, serves as the Fund’s Co-Portfolio Manager. Mr. Moran has served as the Fund’s Portfolio Manager since the Fund’s inception in May 2011. Mr. Johnson has served as the Fund’s Portfolio Manager since March 2012.
PURCHASE AND SALE OF FUND SHARES
Shares of the Fund may be purchased, exchanged, or redeemed on any business day by written request (Aston Funds, P.O. Box 9765, Providence, RI 02940), wire transfer, online access (www.astonfunds.com), or by telephone (800-992-8151). Investors who wish to purchase, exchange or redeem Fund shares through a broker-dealer should contact the broker-dealer directly.
| | | | | | | | |
| Class and Account Type | | Minimum Initial Investment | | | Subsequent Investments | |
| Class N—Regular Accounts | | $ | 2,500 | | | $ | 50 | |
| Individual Retirement Accounts (IRAs) | | $ | 500 | | | $ | 50 | |
| Education Savings Accounts (ESAs) | | $ | 500 | | | $ | 50 | |
| Custodial Accounts for Minors (UGMA/UTMA) | | $ | 500 | | | $ | 50 | |
| Class I—Institutional Accounts | | $ | 1 Million | | | $ | 50 | |
Prospectus | 76
TAX INFORMATION
The Fund’s distributions are generally taxable as ordinary income or capital gains for federal income tax purposes, unless you are investing through a tax-deferred account such as a 401(k) or individual retirement account. Distributions on investments made through tax-deferred vehicles, such as 401(k) plans or IRAs, may be taxed later upon withdrawal of assets from those plans or accounts.
PAYMENTS TO BROKER-DEALERS AND OTHER FINANCIAL INTERMEDIARIES
If you purchase shares of the Fund through a broker-dealer or other financial intermediary (such as a bank), the Fund and its related companies may pay the intermediary for the sale of shares and related services. These payments may create a conflict of interest by influencing the broker-dealer or other intermediary and your salesperson to recommend the Fund over another investment. Ask your salesperson or visit your financial intermediary’s website for more information.
Prospectus | 77
ASTON/Barings International Fund
INVESTMENT OBJECTIVE
The Fund seeks to provide total return.
FEES AND EXPENSES
The table below describes the fee and expenses that you may pay if you buy and hold shares of the Fund.
SHAREHOLDER FEES
(fees paid directly from your investment)
| | | | | | | | |
| | | Class N Shares | | | Class I Shares | |
| Redemption Fee on Shares Held Less Than 90 Days (as a percentage of amount redeemed) | | | 2.00 | % | | | 2.00 | % |
ANNUAL FUND OPERATING EXPENSES (expenses that you pay each year as a percentage of the value of your investment) | | | | | | | | |
| | | Class N Shares | | | Class I Shares | |
| Management Fees | | | 1.00 | % | | | 1.00 | % |
| Distribution and Service (12b-1) Fees | | | 0.25 | % | | | None | |
| Other Expenses | | | 0.35 | % | | | 0.35 | % |
| Total Annual Fund Operating Expenses | | | 1.60 | % | | | 1.35 | % |
Fee Waiver and/or Expense Reimbursement | | | (0.20 | )%(a) | | | (0.20 | )%(a) |
| Total Annual Fund Operating Expenses After Fee Waiver and/or Expense Reimbursement | | | 1.40 | %(a) | | | 1.15 | %(a) |
| (a) | The adviser is contractually obligated to waive management fees and/or reimburse ordinary operating expenses, not including investment-related costs (such as brokerage commissions), interest, taxes, extraordinary expenses and acquired fund fees and expenses, through February 28, 2014, to the extent that operating expenses exceed 1.40% of the Fund’s average daily net assets with respect to Class N shares and 1.15% of the Fund’s average daily net assets with respect to Class I shares (the “Operating Expense Limit”). Prior to February 28, 2014, the arrangement may be amended or terminated for a class only by a vote of the Board of Trustees of Aston Funds. For a period of up to three years from the fiscal year end during which such amount was waived or reimbursed, the adviser is entitled to be reimbursed by the Fund for fees waived and expenses reimbursed from the commencement of operations through the completion of the first three full fiscal years to the extent that the Fund’s Total Annual Operating Expenses for a class, not including investment-related costs (such as brokerage commissions), interest, taxes, extraordinary expenses and acquired fund fees and expenses remains at or below the Operating Expense Limit after such reimbursement. |
Example
This example is intended to help you compare the cost of investing in the Fund with the cost of investing in other mutual funds. The example shows the operating expenses you would incur as a shareholder if you invested $10,000 in the Fund over the time periods shown and you redeem all your shares at the end of those periods. The example assumes that the average annual return was 5%, operating expenses remained the same, and expenses were capped for one year in each period.
Although your actual costs may be higher or lower, based on the above assumptions, your costs would be:
| | | | | | | | | | | | | | | | |
| | | 1 Year | | | 3 Years | | | 5 Years | | | 10 Years | |
| Class N Shares | | $ | 143 | | | $ | 485 | | | $ | 852 | | | $ | 1,883 | |
| Class I Shares | | | 117 | | | | 408 | | | | 720 | | | | 1,606 | |
PORTFOLIO TURNOVER
The Fund pays transaction costs, such as commissions, when it buys and sells securities (or “turns over” its portfolio). A higher portfolio turnover rate may indicate higher transaction costs and may result in higher taxes when Fund shares are held in a taxable account. These costs, which are not reflected in annual Fund operating expenses or in the example, affect the Fund’s performance. During the most recent fiscal year, the Fund’s portfolio turnover rate was 33.48%.
PRINCIPAL INVESTMENT STRATEGIES
Under normal conditions, the Fund invests at least 80% of its assets in common stock and other equity securities of non-U.S. companies.
The portfolio managers employ a growth at a reasonable price (“GARP”) strategy. GARP investing involves buying stocks that have a reasonable price/earnings ratio in relationship to a company’s earnings growth rate. The investment process combines bottom-up and top-down analysis. Bottom-up analysis is based on global company research that seeks to identify positive catalysts for outperformance or earnings surprise based on both growth and value factors. Top-down analysis seeks to assess the relative attractiveness of countries and sectors.
The Fund may invest in companies of all sizes and market capitalization levels. The Fund’s investment strategies may result in high portfolio turnover. The Fund invests primarily in companies in Europe, Australasia, Middle East and the Far East (“EAFE”) and emerging markets. Under normal conditions, the Fund will invest in issuers from at least five countries excluding the U.S.
Prospectus | 78
PRINCIPAL RISKS
You could lose money by investing in the Fund. There can be no assurance that the Fund’s investment objective will be achieved. The following is a summary of the principal risks of investing in the Fund.
Emerging Market Risk. In addition to the general foreign securities risks, investing in emerging market countries is subject to a number of risks, including:
| n | | Economic structures which are less diverse and mature than those of developed countries |
| n | | Less stable political systems and less developed legal systems |
| n | | National policies that may restrict foreign investment |
| n | | Wide fluctuations in the value of investments |
| n | | Smaller securities markets, making investments less liquid |
| n | | Special custody arrangements |
Foreign Securities Risk. Investing in the securities of foreign issuers involves special risks and considerations not typically associated with investing in U.S. companies. The securities of foreign companies may be less liquid and may fluctuate more widely than those traded in U.S. markets. Foreign companies and markets may also have less governmental supervision. There may be difficulty in enforcing contractual obligations and little public information about the companies. Trades typically take more time to settle and clear, and the cost of buying and selling foreign securities is generally higher than similar costs associated with securities traded in U.S. markets.
The value of the securities held by the Fund may be affected by changes in exchange rates or control regulations. If a local currency gains against the U.S. dollar, the value of the holding increases in U.S. dollar terms. If a local currency declines against the U.S. dollar, the value of the holding decreases in U.S. dollar terms. Changes in economic, tax or foreign investment policies, or other political, governmental or economic actions can adversely affect the value of the securities in the Fund. In foreign countries, accounting, auditing and financial reporting standards and other regulatory practices and requirements are generally different from those required for U.S. companies. Investments in securities of foreign issuers may also be subject to foreign withholding and other taxes.
GARP Style Risk. GARP investing involves buying stocks that have a reasonable price/earnings ratio in relationship to a company’s earnings growth rate. Growth stocks may be more volatile than other stocks because they are generally more sensitive to investor perceptions and market moves. During periods of growth stock underperformance, the Fund’s performance may suffer.
Geographic Concentration Risk. To the extent the Fund invests a substantial amount of its assets in securities of issuers located in a single country or geographic region, any changes to the regulatory, political, social or economic conditions in such country or geographic region will generally have greater impact on the Fund than such changes would have on a more geographically diversified fund, and may result in increased volatility and greater losses.
Liquidity Risk. When there is no willing buyer and investments cannot be readily sold at the desired time or price, the Fund may need to accept a lower price or may not be able to sell the security at all. An inability to sell securities can adversely affect the Fund’s value or prevent the Fund from being able to take advantage of other investment opportunities. Less liquid securities are more difficult to dispose of at their recorded values and are subject to increased spreads and volatility.
Manager Risk. The performance of the Fund is dependent upon the investment adviser’s skill in selecting managers and the portfolio manager’s skill in making appropriate investments. As a result, the Fund may underperform its benchmark or its peers.
Market Risk. The Fund’s share price can move down in response to stock market conditions, changes in the economy or changes in a particular company’s stock price. An individual stock may decline in value even when the value of stocks in general is rising.
Portfolio Turnover Risk. Frequent trading of the Fund’s portfolio holdings may result in a higher than average level of capital gains, including short-term gains, and will result in greater transaction costs to the Fund. To the extent distributions to shareholders are made from net short-term capital gains (i.e., net capital gain on securities held or treated as held by the Fund for one year or less minus any net capital losses on securities held or treated as held by the Fund for more than one year), the distributions will be taxed at ordinary income rates for federal income tax purposes, rather than at the lower long-term capital gains rates. Greater transaction costs and higher expenses as a result of portfolio turnover can negatively impact the Fund’s performance.
Small-Cap and Mid-Cap Company Risk. Investing in securities of small-cap and mid-cap companies may involve greater risks than investing in securities of larger, more established issuers. Small-cap and mid-cap companies generally have limited product lines, markets and financial resources. Their securities may trade less frequently and in more limited volume than the securities of larger, more established companies. Also, small-cap and mid-cap companies are typically subject to greater changes in earnings and business prospects than larger companies. As a result, their stock prices may experience greater volatility and may decline significantly in market downturns.
Prospectus | 79
FUND PERFORMANCE
The bar chart shows how the performance of the Class I shares of the Fund has varied from year to year over the periods shown. Class I shares and Class N shares are invested in the same portfolio of securities, so the annual returns would differ only to the extent that the classes have different expenses. The annual returns of the Class N shares would be lower than the returns of the Class I shares due to 12b-1 fees paid by Class N shares. This information may help illustrate the risks of investing in the Fund. The Fund makes updated performance information available on the Fund’s website, www.astonfunds.com, or by calling 800-992-8151. As with all mutual funds, past performance (before and after taxes) does not guarantee future performance.
Class I Shares
Calendar Year Total Return
| | | | | | | | | | |
 | | | | | | | | | | |
| | Best quarter: | | | 06/09 | | | | 20.89 | % |
| | Worst quarter: | | | 09/08 | | | | (22.66 | )% |
| | | | | | | | | | |
| | | | | | | | | | |
| | | | | | | | | | |
The following table indicates how the Fund’s average annual returns of Class I shares for different calendar periods compared to the returns of a broad-based securities market index.
Average Annual Total Returns
(For the periods ended December 31, 2012)
| | | | | | | | | | | | |
| | | ASTON/Barings International Fund | |
| | | 1 Year | | | 5 Years | | | Since Inception | |
| Class I Shares (Inception 11/02/07): | | | | | | | | | | | | |
Return Before Taxes | | | 13.22 | % | | | (4.70 | )% | | | (5.40 | )% |
Return After Taxes on Distributions | | | 12.75 | % | | | (4.97 | )% | | | (5.66 | )% |
Return After Taxes on Distributions and Sale of Fund Shares | | | 9.21 | % | | | (3.96 | )% | | | (4.53 | )% |
| Class N Shares (Inception 3/03/10): | | | | | | | | | | | | |
Return Before Taxes | | | 12.96 | % | | | N/A | | | | 4.89 | % |
| MSCI EAFE Index (Reflects no deduction for taxes, expenses or fees. Index return since inception for Class I shares is computed from October 31, 2007. Index return for Class N shares, since inception, computed from February 28, 2010, is 5.69%) | | | 17.32 | % | | | (3.69 | )% | | | (4.62 | )% |
After-tax returns are calculated using the historical highest individual federal marginal income tax rates and do not reflect the impact of state and local taxes. In some instances, the “Return After Taxes on Distributions and Sale of Fund Shares” may be greater than “Return Before Taxes” because the investor is assumed to be able to use the capital loss of the sale of Fund shares to offset other taxable gains. After-tax returns depend on an investor’s tax situation and may differ from those shown. After-tax returns shown are not relevant to investors who hold their shares through tax-deferred arrangements, such as 401(k) plans or individual retirement accounts. After-tax returns are shown only for Class I shares. After-tax returns for Class N shares will vary.
MANAGEMENT
Aston Asset Management, LP serves as investment adviser to the Fund. Baring International Investment Limited (“Barings”) serves as the subadviser to the Fund.
Mr. David Bertocchi, CFA, International & World Equity Investment Manager of Barings serves as Portfolio Manager of the Fund. Mr. Bertocchi has served as Portfolio Manager of the Fund since April 2008.
PURCHASE AND SALE OF FUND SHARES
Shares of the Fund may be purchased, exchanged, or redeemed on any business day by written request (Aston Funds, P.O. Box 9765, Providence, RI 02940), wire transfer, online access (www.astonfunds.com), or by telephone (800-992-8151). Investors who wish to purchase, exchange or redeem Fund shares through a broker-dealer should contact the broker-dealer directly.
| | | | | | | | |
| Class and Account Type | | Minimum Initial Investment | | | Subsequent Investments | |
| Class N—Regular Accounts | | $ | 2,500 | | | $ | 50 | |
| Individual Retirement Accounts (IRAs) | | $ | 500 | | | $ | 50 | |
| Education Savings Accounts (ESAs) | | $ | 500 | | | $ | 50 | |
| Custodial Accounts for Minors (UGMA/UTMA) | | $ | 500 | | | $ | 50 | |
| Class I—Institutional Accounts | | $ | 1 Million | | | $ | 50 | |
Prospectus | 80
TAX INFORMATION
The Fund’s distributions are generally taxable as ordinary income or capital gains for federal income tax purposes, unless you are investing through a tax-deferred account such as a 401(k) or individual retirement account. Distributions on investments made through tax-deferred vehicles, such as 401(k) plans or IRAs, may be taxed later upon withdrawal of assets from those plans or accounts.
PAYMENTS TO BROKER-DEALERS AND OTHER FINANCIAL INTERMEDIARIES
If you purchase shares of the Fund through a broker-dealer or other financial intermediary (such as a bank), the Fund and its related companies may pay the intermediary for the sale of shares and related services. These payments may create a conflict of interest by influencing the broker-dealer or other intermediary and your salesperson to recommend the Fund over another investment. Ask your salesperson or visit your financial intermediary’s website for more information.
Prospectus | 81
ASTON/Harrison Street Real Estate Fund
INVESTMENT OBJECTIVE
The Fund seeks total return through a combination of growth and income.
FEES AND EXPENSES
The table below describes the fees and expenses that you may pay if you buy and hold shares of the Fund.
SHAREHOLDER FEES
(fees paid directly from your investment)
| | | | | | | | |
| | | Class N Shares | | | Class I Shares | |
| Redemption Fee on Shares Held Less Than 90 Days (as a percentage of amount redeemed) | | | 2.00 | % | | | 2.00 | % |
ANNUAL FUND OPERATING EXPENSES
(expenses that you pay each year as a percentage of the value of your investment)
| | | | | | | | |
| | | Class N Shares | | | Class I Shares | |
| Management Fees | | | 1.00 | % | | | 1.00 | % |
| Distribution and Service (12b-1) Fees | | | 0.25 | % | | | None | |
| Other Expenses | | | 1.11 | % | | | 1.11 | % |
| Total Annual Fund Operating Expenses | | | 2.36 | % | | | 2.11 | % |
Fee Waiver and/or Expense Reimbursement | | | (0.99 | )%(a) | | | (0.99 | )%(a) |
| Total Annual Fund Operating Expenses After Fee Waiver and/or Expense Reimbursement | | | 1.37 | %(a) | | | 1.12 | %(a) |
| (a) | The adviser is contractually obligated to waive management fees and/or reimburse ordinary operating expenses, not including investment-related costs (such as brokerage commissions), interest, taxes, extraordinary expenses and acquired fund fees and expenses, through February 28, 2014, to the extent that operating expenses exceed 1.37% of the Fund’s average daily net assets with respect to Class N shares and 1.12% of the Fund’s average daily net assets with respect to Class I shares. Prior to February 28, 2014, the arrangement may be amended or terminated for a class only by a vote of the Board of Trustees of Aston Funds. |
Example
This example is intended to help you compare the cost of investing in the Fund with the cost of investing in other mutual funds. The example shows the operating expenses you would incur as a shareholder if you invested $10,000 in the Fund over the time periods shown and you redeem all your shares at the end of those periods. The example assumes that the average annual return was 5%, operating expenses remained the same, and expenses were capped for one year in each period.
Although your actual costs may be higher or lower, based on the above assumptions, your costs would be:
| | | | | | | | | | | | | | | | |
| | | 1 Year | | | 3 Years | | | 5 Years | | | 10 Years | |
| Class N Shares | | $ | 139 | | | $ | 642 | | | $ | 1,171 | | | $ | 2,620 | |
| Class I Shares | | | 114 | | | | 565 | | | | 1,043 | | | | 2,363 | |
PORTFOLIO TURNOVER
The Fund pays transaction costs, such as commissions, when it buys and sells securities (or “turns over” its portfolio). A higher portfolio turnover rate may indicate higher transaction costs and may result in higher taxes when Fund shares are held in a taxable account. These costs, which are not reflected in annual Fund operating expenses or in the example, affect the Fund’s performance. During the most recent fiscal year, the Fund’s portfolio turnover rate was 86.62%.
PRINCIPAL INVESTMENT STRATEGIES
Under normal conditions, the Fund invests at least 80% of its assets in real estate investment trusts (“REITs”) and common stocks and other equity securities of U.S. and foreign companies principally engaged in the real estate sector.
The Fund emphasizes publicly traded real estate-related securities of companies domiciled in the United States and Canada. The Fund does not invest in real estate directly. The Fund is classified as non-diversified.
Securities are selected for the Fund using a fundamental bottom-up stock selection process. The portfolio managers use a proprietary relative cash flow multiple analysis to estimate values of portfolio companies, which takes into account multiple factors including:
Prospectus | 82
The portfolio managers also use a proprietary model to assess net asset value (“NAV”) based on both quantitative measures and incorporating a qualitative assessment of management ability. A warranted share price is calculated from a combination of the outputs from the multiple analysis model and the NAV model. While securities are selected primarily from the universe of companies comprising the benchmark index, the Fund may invest to a limited degree in companies outside of the benchmark index. To manage risk, the portfolio managers employ portfolio constraints such as limits on position size, market capitalization and geographic and sector exposure. The Fund’s investment strategies may result in high portfolio turnover.
PRINCIPAL RISKS
You could lose money by investing in the Fund. There can be no assurance that the Fund’s investment objective will be achieved. The following is a summary of the principal risks of investing in the Fund.
Foreign Securities Risk. Investing in the securities of foreign issuers involves special risks and considerations not typically associated with investing in U.S. companies. The securities of foreign companies may be less liquid and may fluctuate more widely than those traded in U.S. markets. Foreign companies and markets may also have less governmental supervision. There may be difficulty in enforcing contractual obligations and little public information about the companies. Trades typically take more time to settle and clear, and the cost of buying and selling foreign securities is generally higher than similar costs associated with securities traded in U.S. markets.
The value of the securities held by the Fund may be affected by changes in exchange rates or control regulations. If a local currency gains against the U.S. dollar, the value of the holding increases in U.S. dollar terms. If a local currency declines against the U.S. dollar, the value of the holding decreases in U.S. dollar terms. Changes in economic, tax or foreign investment policies, or other political, governmental or economic actions can adversely affect the value of the securities in the Fund. In foreign countries, accounting, auditing and financial reporting standards and other regulatory practices and requirements are generally different from those required for U.S. companies. Investments in securities of foreign issuers may also be subject to foreign withholding and other taxes.
Growth Style Risk. Growth investing involves buying stocks that have relatively high price-to-earnings ratios. Growth stocks may be more volatile than other stocks because they are generally more sensitive to investor perceptions and market moves. During periods of growth stock underperformance, the Fund’s performance may suffer.
Liquidity Risk. When there is no willing buyer and investments cannot be readily sold at the desired time or price, the Fund may need to accept a lower price or may not be able to sell the security at all. An inability to sell securities can adversely affect the Fund’s value or prevent the Fund from being able to take advantage of other investment opportunities. Less liquid securities are more difficult to dispose of at their recorded values and are subject to increased spreads and volatility.
Manager Risk. The performance of the Fund is dependent upon the investment adviser’s skill in selecting managers and the portfolio manager’s skill in making appropriate investments. As a result, the Fund may underperform its benchmark or its peers.
Market Risk. The Fund’s share price can move down in response to stock market conditions, changes in the economy or changes in a particular company’s stock price. An individual stock may decline in value even when the value of stocks in general is rising.
Non-Diversification Risk. The Fund may invest a larger percentage of its assets in a given security than a diversified fund. As a result, it may be more susceptible to a single adverse economic, political or regulatory occurrence affecting one or more issuers in which a large percentage of its assets is invested and may experience increased volatility due to its investments in those securities.
Portfolio Turnover Risk. Frequent trading of the Fund’s portfolio holdings may result in a higher than average level of capital gains, including short-term gains, and will result in greater transaction costs to the Fund. To the extent distributions to shareholders are made from net short-term capital gains (i.e., net capital gain on securities held or treated as held by the Fund for one year or less minus any net capital losses on securities held or treated as held by the Fund for more than one year), the distributions will be taxed at ordinary income rates for federal income tax purposes, rather than at the lower long-term capital gains rates. Greater transaction costs and higher expenses as a result of portfolio turnover can negatively impact the Fund’s performance.
REIT Risk. Securities of REITs may be affected by changes in the values of their underlying properties and by defaults by borrowers or tenants. Some REITs may have limited diversification and may be subject to risks inherent in investments in a limited number of properties, in a narrow geographic area, or in a single property type. Real estate is also affected by general economic conditions. When growth is slowing, demand for property decreases and prices may decline. Rising interest rates, which drive up mortgage and financing costs, can restrain construction and buying and selling activity, and may reduce the appeal of real estate investments. REITs depend generally on their ability to generate cash flow to make distributions to shareholders or unitholders, and may be subject to defaults by borrowers and self-liquidations. A REIT’s return may be adversely affected when interest rates are high or rising. Distributions from REITs generally are taxed as ordinary income for federal income tax purposes.
Sector Concentration Risk. The Fund may entail greater risks than investing in funds diversified across sectors. Because the Fund may at times have a significant portion of its assets in one or more related sectors, the Fund may be subject to a greater level of market risk and its performance may be more volatile than a fund that does not concentrate its investments in a specific sector.
Value Style Risk. Value investing involves buying stocks that are out of favor and/or undervalued in comparison to their peers or their prospects for growth. Typically, their valuation levels are less than those of growth stocks. Because different types of stocks go out of favor with investors depending on market and economic conditions, the Fund’s return may be adversely affected during a market downturn and when value stocks are out of favor.
Prospectus | 83
FUND PERFORMANCE
The bar chart shows how the performance of the Class N shares of the Fund has varied from year to year over the periods shown. Class N shares and Class I shares are invested in the same portfolio of securities, so the annual returns would differ only to the extent that the classes have different expenses. The annual returns of the Class I shares would be higher than the returns of the Class N shares due to 12b-1 fees paid by Class N shares. This information may help illustrate the risks of investing in the Fund. The Fund makes updated performance information available on the Fund’s website, www.astonfunds.com, or by calling 800-992-8151. As with all mutual funds, past performance (before and after taxes) does not guarantee future performance.
Class N Shares
Calendar Year Total Return
| | | | | | | | | | |
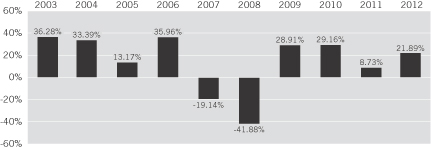 | | | | | | | | | | |
| | Best quarter: | | | 09/09 | | | | 31.09 | % |
| | Worst quarter: | | | 12/08 | | | | (39.07 | )% |
| | | | | | | | | | |
| | | | | | | | | | |
| | | | | | | | | | |
The following table indicates how the Fund’s average annual returns for different calendar periods compared to the returns of broad-based securities market indices. Average annual total returns for both indices are included in the table below.
Average Annual Total Returns
(For the periods ended December 31, 2012)
| | | | | | | | | | | | | | | | |
| | | ASTON/Harrison Street Real Estate Fund | |
| | | 1 Year | | | 5 Years | | | 10 Years | | | Since Inception | |
| Class N Shares (Inception 12/30/97): | | | | | | | | | | | | | | | | |
Return Before Taxes | | | 21.89 | % | | | 5.10 | % | | | 11.24 | % | | | 8.78 | % |
Return After Taxes on Distributions | | | 21.27 | % | | | 4.50 | % | | | 9.35 | % | | | 6.88 | % |
Return After Taxes on Distributions and Sale of Fund Shares | | | 14.26 | % | | | 4.00 | % | | | 9.32 | % | | | 6.89 | % |
| Class I Shares (Inception 9/20/05): | | | | | | | | | | | | | | | | |
Return Before Taxes | | | 22.18 | % | | | 5.35 | % | | | N/A | | | | 5.47 | % |
| FTSE/NAREIT All Equity REITs Total Return Index (Reflects no deduction for taxes, expenses or fees. Index return since inception for Class N shares is computed from December 31, 1997. Index return for Class I shares, since inception, computed from September 30, 2005, is 6.03%.) | | | 19.70 | % | | | 5.74 | % | | | 11.78 | % | | | 8.88 | % |
Harrison Street Securities, LLC (“HSS”) became the subadviser to the Fund on June 30, 2011. Performance prior to that date reflects the performance of a previous subadviser. Performance prior to September 22, 2001 reflects the performance of a predecessor fund.
After-tax returns are calculated using the historical highest individual federal marginal income tax rates and do not reflect the impact of state and local taxes. After-tax returns depend on an investor’s tax situation and may differ from those shown. After-tax returns shown are not relevant to investors who hold their shares through tax-deferred arrangements, such as 401(k) plans or individual retirement accounts. After-tax returns are shown only for Class N shares. After-tax returns for Class I shares will vary.
MANAGEMENT
Aston Asset Management, LP serves as investment adviser to the Fund. HSS serves as the subadviser to the Fund.
Mr. Reagan Pratt and Mr. James Kammert, CFA, each a principal and managing member of HSS, serve as Co-Portfolio Managers of the Fund. Mr. Pratt and Mr. Kammert have served as the Fund’s Portfolio Managers since June 2011.
Prospectus | 84
PURCHASE AND SALE OF FUND SHARES
Shares of the Fund may be purchased, exchanged, or redeemed on any business day by written request (Aston Funds, P.O. Box 9765, Providence, RI 02940), wire transfer, online access (www.astonfunds.com), or by telephone (800-992-8151). Investors who wish to purchase, exchange or redeem Fund shares through a broker-dealer should contact the broker-dealer directly.
| | | | | | | | |
| Class and Account Type | | Minimum Initial Investment | | | Subsequent Investments | |
| Class N—Regular Accounts | | $ | 2,500 | | | $ | 50 | |
| Individual Retirement Accounts (IRAs) | | $ | 500 | | | $ | 50 | |
| Education Savings Accounts (ESAs) | | $ | 500 | | | $ | 50 | |
| Custodial Accounts for Minors (UGMA/UTMA) | | $ | 500 | | | $ | 50 | |
| Class I—Institutional Accounts | | $ | 1 Million | | | $ | 50 | |
TAX INFORMATION
The Fund’s distributions are generally taxable as ordinary income or capital gains for federal income tax purposes, unless you are investing through a tax-deferred account such as a 401(k) or individual retirement account. Distributions on investments made through tax-deferred vehicles, such as 401(k) plans or IRAs, may be taxed later upon withdrawal of assets from those plans or accounts.
PAYMENTS TO BROKER-DEALERS AND OTHER FINANCIAL INTERMEDIARIES
If you purchase shares of the Fund through a broker-dealer or other financial intermediary (such as a bank), the Fund and its related companies may pay the intermediary for the sale of shares and related services. These payments may create a conflict of interest by influencing the broker-dealer or other intermediary and your salesperson to recommend the Fund over another investment. Ask your salesperson or visit your financial intermediary’s website for more information.
Prospectus | 85
ASTON/Montag & Caldwell Balanced Fund
INVESTMENT OBJECTIVE
The Fund seeks long-term total return.
FEES AND EXPENSES
The table below describes the fees and expenses that you may pay if you buy and hold shares of the Fund.
ANNUAL FUND OPERATING EXPENSES
(expenses that you pay each year as a percentage of the value of your investment)
| | | | | | | | |
| | | Class N Shares | | | Class I Shares | |
| Management Fees | | | 0.75 | % | | | 0.75 | % |
| Distribution and Service (12b-1) Fees | | | 0.25 | % | | | None | |
| Other Expenses | | | 0.55 | % | | | 0.55 | % |
| Acquired Fund Fees and Expenses | | | 0.01 | % | | | 0.01 | % |
| Total Annual Fund Operating Expenses | | | 1.56 | % | | | 1.31 | % |
Fee Waiver and/or Expense Reimbursement | | | (0.20 | )%(a) | | | (0.20 | )%(a) |
| Total Annual Fund Operating Expenses After Fee Waiver and/or Expense Reimbursement | | | 1.36 | %(a) | | | 1.11 | %(a) |
| (a) | The adviser is contractually obligated to waive management fees and/or reimburse ordinary operating expenses, not including investment-related costs (such as brokerage commissions), interest, taxes, extraordinary expenses and acquired fund fees and expenses, through February 28, 2014, to the extent that operating expenses exceed 1.35% of the Fund’s average daily net assets with respect to Class N shares and 1.10% of the Fund’s average daily net assets with respect to Class I shares. Prior to February 28, 2014, the arrangement may be amended or terminated for a class only by a vote of the Board of Trustees of Aston Funds. |
Example
This example is intended to help you compare the cost of investing in the Fund with the cost of investing in other mutual funds. The example shows the operating expenses you would incur as a shareholder if you invested $10,000 in the Fund over the time periods shown and you redeem all your shares at the end of those periods. The example assumes that the average annual return was 5%, operating expenses remained the same, and expenses were capped for each period.
Although your actual costs may be higher or lower, based on the above assumptions, your costs would be:
| | | | | | | | | | | | | | | | |
| | | 1 Year | | | 3 Years | | | 5 Years | | | 10 Years | |
| Class N Shares | | $ | 138 | | | $ | 473 | | | $ | 831 | | | $ | 1,839 | |
| Class I Shares | | | 113 | | | | 395 | | | | 699 | | | | 1,562 | |
PORTFOLIO TURNOVER
The Fund pays transaction costs, such as commissions, when it buys and sells securities (or “turns over” its portfolio). A higher portfolio turnover rate may indicate higher transaction costs and may result in higher taxes when Fund shares are held in a taxable account. These costs, which are not reflected in annual Fund operating expenses or in the example, affect the Fund’s performance. During the most recent fiscal year, the Fund’s portfolio turnover rate was 35.48%.
PRINCIPAL INVESTMENT STRATEGIES
The Fund invests primarily in a combination of equity, fixed income and short-term securities. Generally, between 50% and 70% of the Fund’s total assets will be invested in equity securities and at least 25% will be invested in fixed income securities to provide a stable flow of income. The portfolio allocation will vary based upon the portfolio manager’s assessment of the return potential of each asset class. For equity investments, the portfolio manager uses a bottom-up approach to stock selection and seeks high quality, well-established large-cap companies that the portfolio manager believes are growing their near-term earnings at an above average rate. The Fund defines a large-cap company as one having a market capitalization of $5 billion or more at the time of acquisition. The portfolio manager emphasizes valuation to find companies selling at a discount to their intrinsic value. These companies must pass an initial capitalization screen and:
| n | | Have a strong history of earnings growth |
| n | | Be attractively priced, relative to the company’s potential for above average long-term earnings and revenue growth |
| n | | Have strong balance sheets |
| n | | Have a sustainable competitive advantage |
| n | | Be currently, or have the potential to become, industry leaders |
| n | | Have the potential to outperform during market downturns |
Prospectus | 86
The Fund may invest in foreign securities (directly and through depositary receipts).
When selecting equity securities, the portfolio manager limits sector and individual security exposure and adheres to a strong sell discipline in order to minimize risk.
When selecting fixed income securities, the portfolio manager strives to maximize total return and minimize risk primarily through actively adjusting the portfolio’s duration and sector weightings. Emphasis is also placed on diversification and credit analysis.
The Fund will invest only in fixed income securities with an “A” or better rating. Investments will include:
| n | | U.S. government securities |
| n | | Mortgage/asset-backed securities |
| n | | Money market securities and repurchase agreements |
PRINCIPAL RISKS
You could lose money by investing in the Fund. There can be no assurance that the Fund’s investment objective will be achieved. The following is a summary of the principal risks of investing in the Fund.
Credit Risk. Credit risk (also called default risk) is the risk that the issuer of a security will not be able to make principal and interest payments on a debt issue. The credit ratings of issuers could change and negatively affect the Fund’s share price or yield.
Foreign Securities Risk. Investing in the securities of foreign issuers involves special risks and considerations not typically associated with investing in U.S. companies. The securities of foreign companies may be less liquid and may fluctuate more widely than those traded in U.S. markets. Foreign companies and markets may also have less governmental supervision. There may be difficulty in enforcing contractual obligations and little public information about the companies. Trades typically take more time to settle and clear, and the cost of buying and selling foreign securities is generally higher than similar costs associated with securities traded in U.S. markets.
The value of the securities held by the Fund may be affected by changes in exchange rates or control regulations. If a local currency gains against the U.S. dollar, the value of the holding increases in U.S. dollar terms. If a local currency declines against the U.S. dollar, the value of the holding decreases in U.S. dollar terms. Changes in economic, tax or foreign investment policies, or other political, governmental or economic actions can adversely affect the value of the securities in the Fund. In foreign countries, accounting, auditing and financial reporting standards and other regulatory practices and requirements are generally different from those required for U.S. companies. Investments in securities of foreign issuers may also be subject to foreign withholding and other taxes.
Growth Style Risk. Growth investing involves buying stocks that have relatively high price-to-earnings ratios. Growth stocks may be more volatile than other stocks because they are generally more sensitive to investor perceptions and market moves. During periods of growth stock underperformance, the Fund’s performance may suffer.
Interest Rate Risk. If interest rates rise, bond prices will fall. The longer the maturity of a bond, the more sensitive a bond’s price will be to changes in interest rates. In other words, a long-term bond (30-year) will have greater price sensitivity than a short-term bond (2-year). Short-term and long-term bond prices and interest rates do not typically move the same amount or for the same reasons. Interest rate changes will impact high yield bonds in different ways depending on credit ratings. BB rated bonds are more vulnerable to prevailing rates and act more like their investment grade counterparts. For bonds rated B and below, credit risk is more significant than interest rate risk.
Liquidity Risk. When there is no willing buyer and investments cannot be readily sold at the desired time or price, the Fund may need to accept a lower price or may not be able to sell the security at all. An inability to sell securities can adversely affect the Fund’s value or prevent the Fund from being able to take advantage of other investment opportunities. Less liquid securities are more difficult to dispose of at their recorded values and are subject to increased spreads and volatility.
Manager Risk. The performance of the Fund is dependent upon the investment adviser’s skill in selecting managers and the portfolio manager’s skill in making appropriate investments. As a result, the Fund may underperform its benchmark or its peers.
Market Risk. The Fund’s share price can move down in response to stock market conditions, changes in the economy or changes in a particular company’s stock price. An individual stock may decline in value even when the value of stocks in general is rising.
Prepayment Risk. Mortgage-backed securities carry prepayment risk. Prices and yields of mortgage-backed securities assume that the underlying mortgages will be paid off according to a preset schedule. If the underlying mortgages are paid off early, such as when homeowners refinance as interest rates decline, the Fund may be forced to reinvest the proceeds in lower yielding, higher priced securities. This may reduce the Fund’s total return.
U.S. Government Agency Securities Risk. Certain U.S. government agency securities are backed by the right of the issuer to borrow from the U.S. Treasury while others are supported only by the credit of the issuer or instrumentality. While the U.S. government may provide financial support to U.S. government-sponsored agencies or instrumentalities, such as various actions taken to stabilize the Federal National Mortgage Association and Federal Home Loan Mortgage Corporation in 2008, no assurance can be given that it will always do so. Such securities are neither issued nor guaranteed by the U.S. Treasury.
Prospectus | 87
FUND PERFORMANCE
The bar chart shows how the performance of the Class N shares of the Fund has varied from year to year over the periods shown. Class N shares and Class I shares are invested in the same portfolio of securities, so the annual returns would differ only to the extent that the classes have different expenses. The annual returns of the Class I shares would be higher than the returns of the Class N shares due to 12b-1 fees paid by Class N shares. This information may help illustrate the risks of investing in the Fund. The Fund makes updated performance information available on the Fund’s website, www.astonfunds.com, or by calling 800-992-8151. As with all mutual funds, past performance (before and after taxes) does not guarantee future performance.
Class N Shares
Calendar Year Total Return
| | | | | | | | | | |
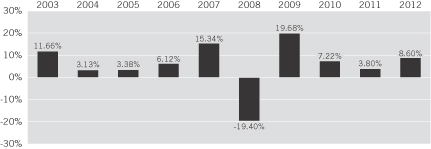 | | | | | | | | | | |
| | Best quarter: | | | 06/09 | | | | 9.21 | % |
| | Worst quarter: | | | 12/08 | | | | (10.36 | )% |
| | | | | | | | | | |
| | | | | | | | | | |
| | | | | | | | | | |
The table below indicates how the Fund’s average annual returns for different calendar periods compared to the returns of broad-based securities market indices and a composite intended to reflect the asset allocation characteristics of balanced funds in general.
Average Annual Total Returns
(For the periods ended December 31, 2012)
| | | | | | | | | | | | | | | | |
| | | ASTON/Montag & Caldwell Balanced Fund | |
| | | 1 Year | | | 5 Years | | | 10 Years | | | Since Inception | |
| Class N Shares (Inception 11/2/94): | | | | | | | | | | | | | | | | |
Return Before Taxes | | | 8.60 | % | | | 3.12 | % | | | 5.44 | % | | | 7.44 | % |
Return After Taxes on Distributions | | | 8.36 | % | | | 2.85 | % | | | 5.12 | % | | | 6.58 | % |
Return After Taxes on Distributions and Sale of Fund Shares | | | 5.84 | % | | | 2.58 | % | | | 4.62 | % | | | 6.18 | % |
| Class I Shares (Inception 12/31/98): | | | | | | | | | | | | | | | | |
Return Before Taxes | | | 8.66 | % | | | 3.28 | % | | | 5.65 | % | | | 3.51 | % |
| S&P 500 Index (Reflects no deduction for taxes, expenses or fees. Index shares are computed from October 31, 1994. Index return for Class I shares, since inception, computed from December 31, 1998, is 2.94%.) | | | 15.99 | % | | | 1.66 | % | | | 7.10 | % | | | 8.29 | % |
| Barclays Capital U.S. Government Credit Bond Index (Reflects no deduction for taxes, expenses or fees. Index shares are computed from October 31, 1994. Index return for Class I shares, since inception, is 5.79%.) | | | 4.82 | % | | | 6.06 | % | | | 5.25 | % | | | 6.72 | % |
| 60% S&P 500 Index/40% Barclays Capital U.S. Government Credit Bond Index (Reflects no deduction for taxes, expenses or fees. Index shares are computed from October 31, 1994. Index return for Class I shares, since inception, is 4.42%.) | | | 11.58 | % | | | 3.86 | % | | | 6.66 | % | | | 8.01 | % |
After-tax returns are calculated using the historical highest individual federal marginal income tax rates and do not reflect the impact of state and local taxes. After-tax returns depend on an investor’s tax situation and may differ from those shown. After-tax returns shown are not relevant to investors who hold their shares through tax-deferred arrangements, such as 401(k) plans or individual retirement accounts. After-tax returns are shown only for Class N shares. After-tax returns for Class I shares will vary.
MANAGEMENT
Aston Asset Management, LP serves as investment adviser to the Fund. Montag & Caldwell, LLC (“Montag & Caldwell”) serves as the subadviser to the Fund.
Mr. Ronald E. Canakaris, CFA, Chairman and Chief Investment Officer of Montag & Caldwell, has served as Portfolio Manager of the Fund since November 2004. Ms. Helen M. Donahue, CFA, Vice President of Montag & Caldwell, has served as Portfolio Manager of the Fund since February 2013.
Prospectus | 88
PURCHASE AND SALE OF FUND SHARES
Shares of the Fund may be purchased, exchanged, or redeemed on any business day by written request (Aston Funds, P.O. Box 9765, Providence, RI 02940), wire transfer, online access (www.astonfunds.com), or by telephone (800-992-8151). Investors who wish to purchase, exchange or redeem Fund shares through a broker-dealer should contact the broker-dealer directly.
| | | | | | | | |
| Class and Account Type | | Minimum Initial Investment | | | Subsequent Investments | |
| Class N—Regular Accounts | | $ | 2,500 | | | $ | 50 | |
| Individual Retirement Accounts (IRAs) | | $ | 500 | | | $ | 50 | |
| Education Savings Accounts (ESAs) | | $ | 500 | | | $ | 50 | |
| Custodial Accounts for Minors (UGMA/UTMA) | | $ | 500 | | | $ | 50 | |
| Class I—Institutional Accounts | | $ | 1 Million | | | $ | 50 | |
TAX INFORMATION
The Fund’s distributions are generally taxable as ordinary income or capital gains for federal income tax purposes, unless you are investing through a tax-deferred account such as a 401(k) or individual retirement account. Distributions on investments made through tax-deferred vehicles, such as 401(k) plans or IRAs, may be taxed later upon withdrawal of assets from those plans or accounts.
PAYMENTS TO BROKER-DEALERS AND OTHER FINANCIAL INTERMEDIARIES
If you purchase shares of the Fund through a broker-dealer or other financial intermediary (such as a bank), the Fund and its related companies may pay the intermediary for the sale of shares and related services. These payments may create a conflict of interest by influencing the broker-dealer or other intermediary and your salesperson to recommend the Fund over another investment. Ask your salesperson or visit your financial intermediary’s website for more information.
Prospectus | 89
Additional Information Regarding Investment Strategies
Each Fund’s non-fundamental investment policies may be changed by the Board of Trustees without shareholder approval. Each of ASTON/Herndon Large Cap Value Fund, ASTON/Cornerstone Large Cap Value Fund, ASTON/TAMRO Diversified Equity Fund, ASTON/Fairpointe Mid Cap Fund, ASTON/Montag & Caldwell Mid Cap Growth Fund, ASTON/TAMRO Small Cap Fund, ASTON/Silvercrest Small Cap Fund, ASTON/River Road Small Cap Value Fund, ASTON/LMCG Small Cap Growth Fund, ASTON Small Cap Fund, ASTON/DoubleLine Core Plus Fixed Income Fund, ASTON/TCH Fixed Income Fund, ASTON/Lake Partners LASSO Alternatives Fund, ASTON/Anchor Capital Enhanced Equity Fund and ASTON/Harrison Street Real Estate Fund has adopted a non-fundamental policy of investing at least 80% of its assets in the type of investments suggested by its name in accordance with Rule 35d-1 of the 1940 Act. Pursuant to such rule, shareholders will receive at least 60 days’ notice of a change in such policy.
Each Fund generally intends to purchase securities for long-term investment. However, each Fund may at times purchase securities in anticipation of relatively short-term gains. A Fund may trim its position in a security or eliminate a security from its portfolio for various reasons, including: in connection with the Fund’s liquidity requirements, as a result of the security having reached a certain weighting in the portfolio, the sector, asset class or other characteristic associated with the security having reached a certain percentage of the portfolio’s weighting, the security having reached a target price ratio or yield objective determined by the Fund’s subadviser, the subadviser’s belief that the particular investment has become overvalued, the subadviser’s loss of confidence in the company’s management, the company’s results being inconsistent with the subadviser’s forecast, the subadviser’s belief that another security offers a better opportunity, as a result of the security suffering losses, changes in interest rates or the credit rating of an issuer, changes in certain fundamentals of a security, or by reason of an unforeseen economic or other development. A Fund may also sell a security and simultaneously purchase the same or a comparable security to take advantage of short-term differentials in bond yields or securities prices.
In addition to the principal investment strategies described in the Fund Summaries, there may be times when the Funds use secondary investment strategies in seeking to achieve their investment objectives. Information regarding such secondary strategies, as well as additional information regarding certain principal strategies, is shown below.
Affiliated Funds
Investing in other investment companies managed by a Fund’s subadviser involves potential conflicts of interest. For example, the subadviser or its affiliates may receive fees based on the amount of assets invested in those funds, which fees may be higher than the fees the subadviser receives for managing the Fund. Investments by a Fund in those other funds may be beneficial in the management of those other funds, by helping to achieve economies of scale or enhancing cash flows. The subadviser may have an incentive to delay selling or redeeming a Fund’s investment in an affiliated fund in order to minimize any adverse effect on that fund. These and other factors may give the subadviser an economic or other incentive to make or retain an investment for a Fund in an affiliated fund in lieu of other investments that may also be appropriate for the Fund.
Asset-Backed Securities
Asset-backed securities are payable from pools of obligations other than mortgages. Most asset-backed securities involve consumer or commercial debts with maturities of less than ten years. However, almost any type of fixed income assets (including other fixed income securities) may be used to create an asset-backed security. Asset-backed securities may take the form of notes or pass through certificates. Asset-backed securities are subject to prepayment risk.
Below Investment Grade (High Yield) Securities
Below investment grade (high yield) securities are lower rated, higher yielding securities issued by corporations. They are generally rated below investment-grade (i.e., Ba1/BB+ and below) by national bond rating agencies, or if unrated, are judged by an adviser or a subadviser to be of equivalent quality. They are considered speculative and are commonly known as “junk bonds.”
Collateralized Mortgage Obligations
Collateralized mortgage obligations are fixed income securities secured by mortgage loans and other mortgage-backed securities. Collateralized mortgage obligations carry general fixed income securities risks and risks associated with mortgage-backed securities.
Commercial Paper
Commercial paper is a short-term fixed income security issued by a bank, corporation or other borrower. There is the risk that the issuer of the commercial paper will not be able to make principal and/or interest payments. Commercial paper may include securities issued in reliance on the private placement exemption under Section 4(2) of the Securities Act of 1933, as amended. Section 4(2) paper is generally sold to an institutional investor, such as a Fund, that agrees that it is purchasing the paper for investment and not with a view to public distribution. Any resale of Section 4(2) commercial paper must similarly be in an exempt transaction.
Convertible Securities
Convertible securities are fixed income or equity securities that pay interest or dividends and that may be exchanged on certain terms into common stock of the same corporation.
Because of the conversion feature, the market value of convertible securities tends to move together with the market value of the underlying stock. The value of convertible securities is also affected by prevailing interest rates, the credit quality of the issuer and any call provisions. There is the risk that the issuer of
Prospectus | 90
the security will not be able to make principal and/or interest payments as well as the risk that the holder of the security may not take advantage of the convertible features in the appropriate time frame.
Corporate Debt Securities
Corporate debt securities are fixed income securities issued by businesses. Notes, bonds, debentures and commercial paper are the most prevalent types of corporate debt securities. A Fund may also purchase interests in bank loans made to companies. The credit risks of corporate debt securities vary widely among issuers.
In addition, the credit risk of an issuer’s debt security may vary based on its priority for repayment. For example, higher ranking (senior) debt securities have a higher priority than lower ranking (subordinated) securities. This means that the issuer might not make payments on subordinated securities while continuing to make payments on senior securities. In addition, in the event of bankruptcy, holders of senior securities may receive amounts otherwise payable to the holders of subordinated securities.
Some subordinated securities, such as trust preferred and capital securities notes, also permit the issuer to defer payments under certain circumstances. For example, insurance companies issue securities known as surplus notes that permit the insurance company to defer any payment that would reduce its capital below regulatory requirements.
Debentures
Debentures are bonds or promissory notes that are secured by the general credit of the issuer, but not secured by specific assets of the issuer. There is the risk that the issuer of the security will not be able to make principal and/or interest payments.
Defensive Strategy
There may be times when a Fund takes temporary positions that may not follow its principal investment strategies for defensive reasons. This includes investing all or a portion of its total assets in cash or cash equivalents, such as money market securities and repurchase agreements. Although a Fund would do this in seeking to avoid losses, following a defensive strategy could reduce the benefit from any market upswings.
Depositary Receipts of Foreign Securities
Depositary receipts represent ownership of securities in foreign companies and are held in banks and trust companies. They can include American Depositary Receipts (“ADRs”), which are traded on U.S. exchanges and are U.S. dollar-denominated, European Depositary Receipts (“EDRs”), which are traded on European exchanges and may not be denominated in the same currency as the security they represent, and Global Depositary Receipts (“GDRs”), which are issued globally and evidence a similar ownership arrangement.
Although ADRs, EDRs and GDRs do not eliminate the risks inherent in investing in the securities of foreign issuers, which include market, political, currency and regulatory risk, by investing in ADRs, EDRs or GDRs rather than directly in securities of foreign issuers, a Fund may avoid currency risks during the settlement period for purchases or sales. In general, there is a large, liquid market in the United States for many ADRs. The information available for ADRs is subject to the accounting, auditing and financial reporting standards of the domestic market or exchange on which they are traded, in which standards are more uniform and more exacting than those to which many foreign issuers may be subject. A Fund may invest in ADRs sponsored or unsponsored by the issuer of the underlying security. In the case of an unsponsored ADR, a Fund may bear higher expenses and encounter greater difficulty in receiving shareholder communications than it would have with a sponsored ADR.
Derivatives
The Funds may invest in derivatives primarily for hedging purposes, to maintain liquidity or in anticipation of changes in portfolio composition, as set forth in the principal strategies of a Fund. Derivatives have a return tied to a formula based upon an interest rate, index, price of a security, or other measurement. Derivatives include options, futures, forward contracts, swaps and related products.
Hedging involves using derivatives to offset a potential loss in one position by establishing an interest in an opposite position. Any loss generated by the derivative should be offset by gains in the hedged investment. While hedging can reduce or eliminate losses, it can also reduce or eliminate gains. A Fund may realize a loss if interest rates, security prices or indices move in the opposite direction than the subadviser anticipates.
Derivatives will only be used when consistent with the objectives and strategy of a Fund. The subadviser will ensure that the effective market exposure resulting from the use of derivatives will not exceed the total amount available for investment within a Fund (i.e., the use of derivatives will not result in a Fund being leveraged). All derivative positions will be covered by that Fund’s existing assets.
Equity Securities
Equity securities represent a share of an issuer’s earnings and assets, after the issuer pays its liabilities. A Fund cannot predict the income it will receive from equity securities because issuers generally have discretion as to the payment of any dividends or distributions. However, equity securities offer greater potential for appreciation than many other types of securities, because their values may increase with the value of the issuer’s business. Types of equity securities include common stocks, preferred stocks, warrants and rights, convertible securities and other securities that represent underlying local shares, such as depositary receipts.
Prospectus | 91
ETFs
An ETF is an investment company that seeks to track the performance of an index by holding in its portfolio shares of all the companies, or a representative sample of the companies, that are components of a particular index. ETFs are traded on a securities exchange based on their market value. When a Fund invests in another investment company, shareholders of the Fund bear their proportionate share of the other investment company’s fees and expenses, including operating, registration, trustee, licensing and marketing, as well as their share of the Fund’s fees and expenses.
ETNs
An ETN is a security that combines aspects of a bond and an ETF. ETN returns are based upon the performance of a market index or a specific strategy, and can be held to maturity as a debt security. ETNs are traded on a securities exchange. Their value is based on their reference index or strategy and the credit quality of the issuer. ETNs are subject to the additional risk that they may trade at a premium or discount to value attributable to their reference index. When a Fund invests in an ETN, shareholders of the Fund bear their proportionate share of the ETN’s fees and expenses, as well as their share of the Fund’s fees and expenses.
Fixed Income Securities
Fixed income securities pay interest, dividends or distributions at a specified rate. The rate may be a fixed percentage of the principal or adjusted periodically. In addition, the issuer of a fixed income security must repay the principal amount of the security, normally within a specified time. Fixed income securities provide more regular income than equity securities. However, the returns on fixed income securities are limited and normally do not increase with the issuer’s earnings. This limits the potential appreciation of fixed income securities as compared to equity securities.
A security’s yield measures the annual income earned on a security as a percentage of its price. A security’s yield will increase or decrease depending upon whether it costs less (a discount) or more (a premium) than the principal amount. If the issuer may redeem the security before its scheduled maturity, the price and yield on a discount or premium security may change based upon the probability of an early redemption. Securities with higher risks generally have higher yields. Equity Funds may invest in fixed income securities to offset the volatility of the stock market. Fixed income securities provide a stable flow of income for a Fund.
Foreign Securities
Foreign securities are securities issued by corporations, governments and other issuers located outside the United States. Foreign securities are subject to risks in addition to the risks associated with the securities of issuers located in the United States.
Interest Only Security
A type of fixed income security that entitles the holder to payments derived from the interest payments on underlying loan pools or securities.
Inverse Floaters
Inverse floaters are debt instruments with a floating rate of interest that bears an inverse relationship to changes in short-term market interest rates. In addition, like most other fixed-income securities, the value of inverse floaters will decrease as interest rates increase. As a result, as short-term rates increase, both the market price and the yield of an inverse floater will fall.
Mortgage-Backed Securities
Mortgage-backed securities represent interests in pools of mortgages. The mortgages that comprise a pool normally have similar interest rates, maturities and other terms. Mortgages may have fixed or adjustable interest rates. Interests in pools of adjustable rate mortgages are known as ARMs. Mortgage-backed securities come in a variety of forms. Many have extremely complicated terms. The simplest form of mortgage-backed securities is pass-through certificates. An issuer of pass-through certificates gathers monthly payments from an underlying pool of mortgages. Then, the issuer deducts its fees and expenses and passes the balance of the payments onto the certificate holders once a month. Holders of pass-through certificates receive a pro rata share of all payments and prepayments from the underlying mortgages. As a result, the holders assume all the prepayment risks of the underlying mortgages.
Municipal Securities
Municipal securities, including municipal bonds and notes, are fixed income securities issued by states, counties, cities and other political subdivisions and authorities. Municipal bonds include general obligation bonds, which are backed by the full faith and credit of the issuer and may be repaid from any revenue source, and revenue bonds, which may be repaid only from the revenue of a specific facility or source. Municipal securities may be issued by industrial and economic development authorities, school and college authorities, housing authorities, healthcare facility authorities, municipal utilities, transportation authorities and other public agencies. Many municipalities issue short-term municipal notes to fund their current operations before collecting taxes or other municipal revenues. Municipalities also may issue notes to fund capital projects prior to issuing long-term bonds. Issuers typically repay the notes at the end of their fiscal year, either with taxes, other revenues or proceeds from newly issued notes or bonds.
Principal Only Security
A principal only security entitles the holder to payments derived from the principal payments on underlying loan pools or securities. The yield on a principal only security depends primarily on the prepayment rates of the underlying loans or securities and generally increases as the prepayment speed of the underlying loan or security increases.
Prospectus | 92
Other Investment Companies
The Funds may invest in securities of other investment companies, including ETFs, open-end funds and closed-end funds. An ETF is an investment company that seeks to track the performance of an index by holding in its portfolio shares of all the companies, or a representative sample of the companies, that are components of a particular index. Closed-end funds are investment companies that typically issue a fixed number of shares that trade on a securities exchange or over-the-counter. The risks of investment in other investment companies typically reflect the risk of the types of securities in which the funds invest. Investments in ETFs and closed-end funds are subject to the additional risk that shares of the fund may trade at a premium or discount to their net asset value per share. A Fund may not purchase more than 3% of another investment company’s outstanding shares unless the investment company and/or the Fund has received an order for exemptive relief from such limitation from the SEC and the investment company and the Fund take appropriate steps to comply with any conditions of such order. When a Fund invests in another investment company, shareholders of the Fund bear their proportionate share of the other investment company’s fees and expenses as well as their share of the Fund’s fees and expenses.
Preferred Stocks
Preferred stocks are stocks that pay dividends at a specified rate. Dividends are paid on preferred stocks before they are paid on common stocks. In addition, preferred stockholders have priority over common stockholders as to the proceeds from the liquidation of a company’s assets, but are subordinate to the claims of all creditors.
PTPs
PTPs include master limited partnerships and certain other partnerships that meet conditions contained in the Internal Revenue Code of 1986, as amended (the “Code”). In order to be treated as a partnership for federal income tax purposes, a PTP must generally derive a substantial amount of its income and gains from certain sources, including from the exploration, development, mining or production, processing, refining, transportation or marketing of minerals or natural resources. Other PTPs may be treated as partnerships for federal income tax purposes if certain other limited exceptions under the Code apply. PTPs are typically organized as either limited partnerships or limited liability companies and are listed and traded on a U.S. securities exchange.
REITs
REITs are generally publicly traded entities that invest in office buildings, apartment complexes, industrial facilities, shopping centers and other commercial spaces. REITs are pooled investment vehicles that typically invest directly in real estate, in mortgages and loans collateralized by real estate, or in a combination of the two. Equity REITs invest primarily in real estate that produces income from rentals. Mortgage REITs invest primarily in mortgages and derive their income from interest payments. REITs usually specialize in a particular type of property and may concentrate their investments in particular geographical areas. REITs issue stocks and most REIT stocks trade on the major stock exchanges or over-the-counter.
Repurchase Agreements
Repurchase agreements, or repos, are transactions in which a security (usually a government security) is purchased with a simultaneous commitment to sell it back to the seller (a commercial bank or recognized securities dealer) at an agreed upon price on an agreed upon date, usually the next day. If the seller of the underlying security under the repurchase agreement should default on its obligation to repurchase the underlying security, a Fund may experience delay or difficulty in exercising its right to realize upon the security. Additionally, a Fund may incur a loss if the value of the security should decline, as well as any disposition costs in liquidating the security.
Royalty Income Trusts
Royalty income trusts can be organized in a variety of ways in the United States, Canada and other countries. Beneficial units in royalty income trusts generally represent interests in profits derived from the production of oil or other minerals.
Rule 144A Securities
Rule 144A securities are restricted securities that can be sold to qualified institutional buyers under the Securities Act of 1933, as amended. Investing in Rule 144A securities may increase the illiquidity of a Fund’s investments in the event that an adequate trading market does not exist for these securities.
U.S. Government Securities
U.S. government securities are fixed income obligations of the U.S. government and its various agencies. U.S. government securities issued by the U.S. Treasury (bills, notes and bonds) are backed by the full faith and credit of the federal government. Some government securities not issued by the U.S. Treasury also carry the government’s full faith and credit backing on principal or interest payments. Some securities are backed by the issuer’s right to borrow from the U.S. Treasury and some are backed only by the credit of the issuing organization. All government securities are considered creditworthy. This guarantee, however, does not extend to the market prices for such securities, which can fluctuate.
Prospectus | 93
Summary of Investment Strategies
| | | | | | | | | | | | | | | | | | | | | | | | | | | | | | | | | | | | | | | | |
| Fund | | Asset-and-Mortgage Backed Securities | | Below Investment Grade (High Yield) Securities | | Collateralized Mortgage Obligations | | Convertible Securities | | Corporate Debt Securities | | Defensive Strategy | | Depositary Receipts of Foreign Securities | | Derivatives (e.g., Options, Forwards, Futures, Swaps) | | Equity Securities | | ETFs/ ETNs | | Fixed Income Securities | | Foreign Securities | | Preferred Stocks | | PTPs | | REITs | | Royalty Income Trusts | | Rule 144A Securities | | Securities of Other Investment Companies* | | U.S. Government Securities | | |
ASTON/Montag & Caldwell Growth | | | | | | | | X | | X | | X | | X | | X | | XP | | | | X | | X | | X | | | | | | | | X | | | | X | | |
ASTON/Herndon Large Cap Value | | | | | | | | X | | | | X | | X | | | | XP | | | | | | X | | X | | | | X | | | | | | | | | | |
ASTON/Cornerstone Large Cap Value | | | | | | | | | | | | X | | X | | | | XP | | | | | | X | | | | | | X | | | | | | | | | | |
ASTON/TAMRO Diversified Equity | | | | X | | | | X | | | | X | | X | | X | | XP | | | | | | X | | X | | | | X | | | | X | | | | X | | |
ASTON/River Road Dividend All Cap Value | | | | | | | | X | | | | X | | X | | X | | XP | | | | X | | X | | X | | X | | X | | X | | X | | X | | X | | |
ASTON/River Road Dividend All Cap Value II | | | | | | | | X | | | | X | | X | | X | | XP | | | | X | | X | | X | | X | | X | | X | | X | | X | | X | | |
ASTON/Fairpointe Mid Cap | | | | | | | | X | | X | | X | | X | | X | | XP | | | | X | | X | | X | | | | | | | | X | | | | X | | |
ASTON/Montag & Caldwell Mid Cap Growth | | | | | | | | X | | | | X | | X | | X | | XP | | | | | | X | | X | | | | X | | | | X | | | | X | | |
ASTON/TAMRO Small Cap | | | | X | | | | X | | | | X | | X | | | | XP | | | | | | X | | X | | | | X | | | | X | | | | X | | |
ASTON/River Road Select Value | | | | | | | | X | | | | X | | X | | X | | XP | | | | | | X | | X | | | | X | | | | X | | | | X | | |
ASTON/River Road Small Cap Value | | | | | | | | X | | | | X | | X | | X | | XP | | | | | | X | | X | | | | X | | | | X | | X | | X | | |
ASTON/River Road Independent Value | | | | | | | | X | | | | X | | X | | X | | XP | | X | | | | X | | X | | X | | X | | X | | | | | | X | | |
ASTON/LMCG Small Cap Growth | | | | | | | | | | | | X | | X | | | | XP | | X | | | | | | | | | | X | | | | | | | | | | |
ASTON Small Cap | | | | | | | | X | | X | | X | | X | | X | | XP | | X | | | | X | | X | | X | | | | | | X | | | | X | | |
ASTON/Silvercrest Small Cap | | | | | | | | X | | | | X | | | | | | XP | | | | | | X | | X | | | | X | | | | X | | | | | | |
ASTON/DoubleLine Core Plus Fixed Income | | XP | | XP | | XP | | X | | XP | | X | | | | X | | | | X | | XP | | XP | | | | | | X | | | | X | | X | | XP | | |
ASTON/TCH Fixed Income | | XP | | X | | X | | X | | XP | | X | | | | X | | | | | | XP | | X | | | | | | | | | | X | | | | XP | | |
ASTON/Lake Partners LASSO Alternatives** | | | | | | | | | | | | X | | | | | | | | X | | X | | | | | | | | | | | | | | XP | | X | | |
ASTON/Anchor Capital Enhanced Equity | | | | | | | | | | | | X | | X | | XP | | XP | | | | | | | | X | | | | | | | | | | | | X | | |
ASTON/River Road Long-Short | | | | | | | | X | | | | X | | X | | XP | | XP | | X | | | | | | | | X | | X | | X | | | | | | | | |
ASTON/Barings International | | | | | | | | X | | | | X | | X | | X | | XP | | | | | | XP | | X | | | | | | | | X | | | | X | | |
ASTON/Harrison Street Real Estate | | | | | | | | | | | | X | | | | | | XP | | | | | | X | | X | | X | | XP | | | | | | | | | | |
ASTON/Montag & Caldwell Balanced | | XP | | | | X | | XP | | XP | | X | | X | | X | | XP | | | | XP | | X | | X | | | | | | | | X | | | | XP | | |
| * | All of the Funds may use securities of other investment companies as a cash sweep vehicle. This category on the chart does not reflect the usage of securities of other investment companies as a cash sweep vehicle or the use of ETFs/ETNs. |
| ** | Reflects investment strategies of the Fund and is not intended to reflect the investment strategies of the underlying funds in which the Fund may invest. |
| X | = Investment strategy applicable to a Fund. |
| P | = Components of a Fund’s principal investment strategy. |
Portfolio Holdings
A description of the policies and procedures with respect to the disclosure of each Fund’s portfolio holdings is available in the Statement of Additional Information (“SAI”) and on our website at www.astonfunds.com.
Prospectus | 94
Investment Terms
The following is a list of terms with definitions that you may find helpful as you read this prospectus.
All-Cap Strategy. An all-cap strategy invests in the equity securities of issuers of any market capitalization, and generally will hold securities of issuers representing a range of sizes.
American Depositary Receipts (ADRs). ADRs represent ownership of securities in foreign stock and are issued by U.S. banks and trust companies. ADRs are denominated in U.S. dollars and are traded on a U.S. exchange.
Bottom-Up Investing. Bottom-up investing is an investing approach in which securities are researched and chosen individually with less consideration given to economic or market cycles.
Call Option. A call option is an agreement that gives an investor the right (but not the obligation) to buy a stock, bond, commodity, or other instrument at a specified price within a specific time period.
Closed-End Fund. A closed-end fund is a registered investment company that typically issues a fixed number of shares that trade on a securities exchange or over-the-counter.
Convexity. Convexity is a measure of how the duration of a bond changes as interest rates change; the greater the convexity of a bond, the greater the exposure of interest rate risk to the portfolio.
Correlation. Correlation is a statistical measure of how two securities move in relation to each other.
Covered Call. A covered call is an options strategy whereby an investor holds a long position in an asset and writes (sells) call options on the same asset in an attempt to generate increased income from the asset.
Derivative. A derivative is a security whose price is dependent upon or derived from one or more underlying assets. The derivative itself is merely a contract between two or more parties.
Diversification. Diversification is the practice of investing in a broad range of securities to reduce risk.
Duration. Duration is a calculation of the average life of a bond (or portfolio of bonds) that is a useful measure of the bond’s price sensitivity to interest rate changes. The higher the duration number, the greater the risk and reward potential of the bond.
EAFE Countries. EAFE countries are countries located in Europe, Australasia and the Far East.
Emerging Markets. Emerging markets are countries whose economy and securities markets are considered by the World Bank to be emerging or developing. Emerging market countries may be located in such regions as Asia, Latin America, the Middle East, Southern Europe, Eastern Europe and Africa.
Equity Securities. Equity securities are ownership interests in corporations and other entities, such as common stocks, preferred stocks, convertible securities, rights and warrants.
European Depositary Receipts (EDRs). EDRs represent ownership of securities in foreign stock and are issued by a foreign bank. EDRs are generally denominated in foreign currencies and may not be denominated in the same currency as the securities they represent. Generally, EDRs are designed for use in the foreign securities markets.
Exchange-Traded Fund (ETF). An ETF is an investment company that seeks to track the performance of an index by holding in its portfolio either the contents of the index or a representative sample of the securities in the index.
Exchange-Traded Note (ETN). An ETN is a security that combines aspects of a bond and an ETF. ETN returns are based upon the performance of a market index or a specific strategy, and can be held to maturity as a debt security.
Expense Ratio. A fund’s expense ratio is its cost of doing business, expressed as a percentage of its net assets and disclosed in a prospectus.
Fundamental Analysis. Fundamental analysis involves assessing whether a particular stock or group of stocks is undervalued or overvalued at its current market price based on an analysis of the balance sheet and income statement of the company. Fundamental analysis considers various historical financial statistics or metrics such as return on equity, free cash flow, price-to-earnings ratio, and similar measures to determine future trends in a company’s stock.
Global Depositary Receipts (GDRs). GDRs represent ownership of securities in foreign stock and are issued by a foreign bank. GDRs are generally denominated in foreign currencies and may not be denominated in the same currency as the securities they represent. Generally, GDRs are designed for use in the foreign securities markets.
Growth at a Reasonable Price (GARP). GARP investing involves buying stocks that have a reasonable price-to-earnings ratio in relationship to a company’s earnings growth rate.
Growth Style Investing. Growth style investing involves buying stocks of companies that are generally industry leaders with above-average, sustainable growth rates. Typically, growth stocks are the stocks of the fastest growing companies in the most rapidly growing sectors of the economy. Growth stock valuation levels (e.g., price-to-earnings ratio) will generally be higher than those of value stocks.
Prospectus | 95
Hedged Mutual Fund. A hedged mutual fund is a mutual fund that uses short-selling, hedging or other alternative strategies. Short-selling and other hedging instruments may be used in an effort to manage risk or to profit from downward movements of securities or markets. The risks of hedged mutual funds may differ and are sometimes greater than those of conventional mutual funds.
Investment Objective. A fund’s investment objective is the goal that an investor and a mutual fund seek together. Examples include current income, total return, long-term capital growth, etc.
Intrinsic Value. A company’s intrinsic value is an estimation of its actual value, irrespective of its stock price.
Issuer. An issuer is a company, municipality or government agency that issues a security, such as a stock, bond or money market security.
Large-Cap Stocks. Large-cap stocks are stocks issued by large companies. Unless otherwise defined by a Fund, a large-cap company is defined as one having a market capitalization, at the time of acquisition, within the range of market capitalizations of companies constituting the Russell 1000 Index . Typically, large-cap companies are established, well-known companies; some may be multinationals.
Limited Partnerships. A limited partnership is a business organization with one or more general partners who manage the business and are personally liable for the partnership’s debts, and one or more limited partners who are liable only to the extent of their investment in the partnership.
Management Fee. The management fee is the amount that a mutual fund pays to the investment adviser for its services.
Market Capitalization. Market capitalization is the value of a corporation or other entity as determined by the market price of its securities.
Mid-Cap Stocks. Mid-cap stocks are stocks issued by mid-sized companies. Unless otherwise defined by a Fund, a mid-cap company is defined as one having a market capitalization, at the time of acquisition, within the range of market capitalizations of companies constituting the Russell Midcap Index.
Mutual Fund. A mutual fund is an investment company that stands ready to buy back its shares at their current net asset value. Most mutual funds continuously offer new shares to investors.
Net Asset Value (NAV). The NAV is the per share value of a mutual fund, found by subtracting the fund’s liabilities from its assets and dividing by the number of shares outstanding. Mutual funds calculate their NAVs at least once a day.
Publicly Traded Partnerships (PTPs). PTPs are limited partnerships that have interests traded in the equity securities market.
Put Option. A put option is an agreement that gives an investor the right (but not the obligation) to sell a stock, commodity, or other instrument at a specific price within a specific time period.
Real Estate Investment Trusts (REITs). REITs are pooled investment vehicles that typically invest directly in real estate, in mortgages and loans collateralized by real estate, or in a combination of the two.
Risk/Reward Trade-Off. Risk/reward trade-off is the principle that an investment must offer higher potential returns as compensation for the likelihood of increased volatility.
Royalty Income Trusts. Royalty income trusts are trusts whose securities are listed on a securities exchange, generally in Canada or the U.S., and which control an underlying company whose business is the acquisition, exploitation, production and sale of oil and natural gas. Royalty income trusts generally pay out to unit holders the majority of the cash flow that they receive from the production and sale of underlying oil and natural gas reserves. The amount of distributions paid on royalty income trust units will vary from time based on production levels, commodity prices, royalty rates and certain expenses, deductions and costs, as well as on the distribution payouts ratio policies adopted.
Small-Cap Stocks. Small-cap stocks are stocks issued by smaller companies. Unless otherwise defined by a Fund, a small-cap company is defined as one having a market capitalization, at the time of acquisition, within the range of market capitalizations of companies constituting the Russell 2000 Index.
Top-Down Investing. Top-down investing is an investing approach in which securities are chosen by looking at the industry or sector level based on market trends and/or economic forecasts.
Total Return. Total return is a measure of a fund’s performance that encompasses all elements of return: dividends, capital gains distributions and changes in net asset value. Total return is the change in value of an investment over a given period, assuming investment of dividends and capital gains distributions, expressed as a percentage of the initial investment.
12b-1 Fee. A 12b-1 fee is a mutual fund fee, named for the SEC rule that permits it, used to pay for distribution costs (such as advertising and commissions paid to dealers) and shareholder services. If a fund has a 12b-1 fee, it is found in the fee table of its prospectus. (See “Distribution and Services Plan 12b-1 Fees” in the “Shareholder Information” Section.)
Value Style Investing. Value style investing involves buying stocks that are out of favor and/or undervalued compared to their peers. Generally, value stock valuation levels are lower than growth stock valuation levels.
Volatility. Volatility reflects how much the value of the markets or a security may change. High volatility means that prices change dramatically over a short time period. Low volatility means that prices do not fluctuate dramatically, but change at a steady pace. Volatility is a measure of risk.
Prospectus | 96
Weighted Average Effective Duration. Weighted average effective duration is a calculation of the weighted average life of a portfolio of bonds that provides a measure of the portfolio of bonds’ sensitivity to cash flow changes, which takes into account interest rate changes and cash flow changes (i.e. having a bond called).
Yield. Yield is a measure of net income (dividends and interest) earned by the securities in a fund’s portfolio, less a fund’s expenses, during a specified period. A fund’s yield is expressed as a percentage of the maximum offering price per share on a specified day.
Yield Curve. The yield curve is the relation between the interest rate (or cost of borrowing) and the time to maturity of the debt. A normal yield curve is upward sloping, in other words, the yield increases as the maturity lengthens. An inverted yield curve occurs when short-term yields are higher than long-term yields.
Zero-Coupon Bonds. Zero-coupon bonds are debt securities that do not pay interest at regular intervals and are issued at a discount from face value. The discount approximates the total amount of interest the bond will accrue from the date of issuance to maturity.
Prospectus | 97
Management of the Funds
INVESTMENT ADVISER
Aston Asset Management, LP
Aston Asset Management, LP (“Aston” or the “Adviser”), 120 N. LaSalle Street, 25th Floor, Chicago, IL 60602, is the investment adviser to the Funds. Aston is a majority-owned and independently managed indirect subsidiary of Affiliated Managers Group, Inc. (“AMG”). More information on AMG is available in the SAI. Aston was formed in April 2006 and as of December 31, 2012, Aston had approximately $11.5 billion in assets under management.
Aston provides investment advisory, mutual fund administration and distribution-related services to Aston Funds. Aston manages each Fund by selecting one or more investment managers (each a “Subadviser”) to manage the Fund’s portfolio on a subadvisory basis. Aston is responsible for identifying and selecting each Fund’s investment managers, monitoring the performance of such managers, and terminating managers.
The SEC has granted an exemptive order to Aston and Aston Funds that allows Aston to allocate and reallocate assets of the Funds between and among any subadvisers so selected pursuant to a “manager of managers” structure. Under this structure, Aston has the authority to retain and terminate subadvisers, engage new subadvisers and make material revisions to the terms of the subadvisory agreements subject to the approval of the Board of Trustees, but not shareholder approval.
General
As the investment adviser to the Funds, Aston is paid an annual management fee based on the average daily net assets of a Fund. Out of its fee, Aston pays the Subadviser(s) of each Fund. The table, later in this “Management of the Funds” Section, shows the management fees paid by each Fund to Aston for the most recent fiscal year. The investment advisory agreement with Aston may be terminated at any time by the Fund or the Adviser upon 60 days’ written notice to the other party. A Fund may effect termination by an action of the Board of Trustees or by a vote of a majority of the Fund’s outstanding voting securities.
A discussion regarding the basis for the Board of Trustees’ approval of the Funds’ investment advisory agreement and subadvisory agreements will be included in the Funds’ next annual or semi-annual report to shareholders following such approval.
SUBADVISERS
The accompanying information highlights each Fund’s Subadviser and its portfolio manager(s).
ASTON/Montag & Caldwell Growth Fund
ASTON/Montag & Caldwell Mid Cap Growth Fund
ASTON/Montag & Caldwell Balanced Fund
Montag & Caldwell, LLC (and its predecessor), 3455 Peachtree Road NE Suite 1200, Atlanta, Georgia 30326, was founded in 1945. As of December 31, 2012, Montag & Caldwell managed approximately $12.9 billion in assets.
ASTON/Herndon Large Cap Value Fund
Herndon Capital Management, LLC, 191 Peachtree Street, NE, Suite 2500, Atlanta, GA 30303, is an institutional investment management firm specializing in large capitalization equity strategies. Founded in 2001, the firm is majority-owned by Atlanta Life Financial Group, a 100 year old financial services firm, which is majority owned by the Alonzo F. and Norris B. Herndon Foundation, Inc. Members of Herndon senior management currently own 45% of the firm. As of December 31, 2012, Herndon managed approximately $7.6 billion in assets.
ASTON/Cornerstone Large Cap Value Fund
Cornerstone Investment Partners, LLC, Phipps Tower, 3438 Peachtree Road NE, Suite 900, Atlanta, GA 30326, was founded in 2001. Cornerstone is 100% owned by CIM Holdings, LLC, which is 100% owned by Cornerstone’s employees. As of December 31, 2012, Cornerstone had approximately $5.7 billion in assets under management.
ASTON/TAMRO Diversified Equity Fund
ASTON/TAMRO Small Cap Fund
TAMRO Capital Partners LLC, 1701 Duke Street, Suite 250, Alexandria, Virginia 22314, was founded in 2000. TAMRO is majority-owned by the principals of the firm. As of December 31, 2012, TAMRO managed approximately $1.9 billion in assets.
ASTON/River Road Dividend All Cap Value Fund
ASTON/River Road Dividend All Cap Value Fund II
ASTON/River Road Select Value Fund
ASTON/River Road Small Cap Value Fund
ASTON/River Road Independent Value Fund
ASTON/River Road Long-Short Fund
River Road Asset Management, LLC, Meidinger Tower, 462 South Fourth Street, Suite 1600, Louisville, Kentucky 40202, was founded in 2005. River Road is a wholly-owned subsidiary of Aviva Investors North America Holdings, Inc., which is an indirect subsidiary of Aviva plc. As of December 31, 2012, River Road managed approximately $7.1 billion in assets.
Prospectus | 98
ASTON/Fairpointe Mid Cap Fund
Fairpointe Capital LLC, One North Franklin, Suite 3300, Chicago, Illinois 60606, was founded in 2011. Fairpointe is majority-owned by its employees. As of December 31, 2012, Fairpointe managed approximately $3.9 billion in assets.
ASTON/LMCG Small Cap Growth Fund
ASTON Small Cap Fund
Lee Munder Capital Group, LLC, 200 Clarendon Street, 28th Floor, Boston, MA 02116, was founded in August 2000. LMCG is majority-owned by Convergent Capital Management, LLC. As of December 31, 2012, LMCG had assets of approximately $5.0 billion under management.
ASTON/Silvercrest Small Cap Fund
Silvercrest Asset Management Group LLC, 1330 Avenue of the Americas, 38th Fl., New York NY 10019, was founded in 2002. Silvercrest is majority-owned by its employees. As of December 31, 2012, Silvercrest managed approximately $8.1 billion in assets.
ASTON/DoubleLine Core Plus Fixed Income Fund
DoubleLine Capital LP, 333 South Grand Avenue, Suite 1800, Los Angeles, CA 90071, was founded in December 2009 by Mr. Jeffrey Gundlach and other key members of DoubleLine’s investment team. As of December 31, 2012, DoubleLine managed approximately $52.0 billion in assets.
ASTON/TCH Fixed Income Fund
Taplin, Canida & Habacht LLC, 1001 Brickell Bay Drive, Suite 2100 Miami, Florida 33131, was founded in 1985. TCH is a majority-owned subsidiary of BMO Financial Corp., a subsidiary of the Bank of Montreal. As of December 31, 2012, TCH had approximately $7.4 billion in assets under management.
ASTON/Lake Partners LASSO Alternatives Fund
Lake Partners, Inc., 4 High Ridge Park, Suite 300, Stamford, CT 06905, was founded in 1989. The firm is wholly owned by its senior investment professionals and founders, Mr. Frederick C. Lake and Mr. Ronald A. Lake. As of December 31, 2012, Lake Partners managed approximately $480.9 million in assets and provided investment consulting services to approximately $3.9 billion in assets.
ASTON/Anchor Capital Enhanced Equity Fund
Anchor Capital Advisors LLC, One Post Office Square, Suite 3850, Boston, MA 02109, was established in 1983. Eighty percent (80%) of Anchor Capital is owned by Anchor Capital Holdings LLC, which is a wholly-owned subsidiary of publicly-held Boston Private Financial Holdings, Inc. As of December 31, 2012, Anchor Capital had assets of approximately $6.9 billion under management. Anchor Capital has not previously managed mutual fund accounts.
ASTON/Barings International Fund
Baring International Investment Limited, 155 Bishopsgate, London, EC2M 3XY, United Kingdom, was founded in 1980. Baring International Investment Limited is a subsidiary of Baring Asset Management Limited (together with its subsidiaries and Baring Asset Management LLC constitute “Barings”). As of December 31, 2012, Barings managed approximately $52.7 billion in assets.
ASTON/Harrison Street Real Estate Fund
Harrison Street Securities, LLC, 71 South Wacker Drive, Suite 3575, Chicago, Illinois 60606. HSS was founded in 2005 as Transwestern Securities Management, L.L.C. by Transwestern Investment Company, L.L.C. (“TIC”), James Kammert and Reagan Pratt. As of December 31, 2010, the controlling members and managers of the firm are HS Securities Holdings, LLC, a Delaware limited liability company that acquired the interests of TIC, James Kammert and Reagan Pratt. As of December 31, 2012, HSS managed approximately $624.9 million in assets.
| | |
| PORTFOLIO MANAGEMENT |
| ASTON/Montag & Caldwell Growth Fund |
| | |
| Ronald E. Canakaris, CFA, CIC | | Portfolio Manager since the Fund’s inception in 1994; Chairman and Chief Investment Officer of Montag & Caldwell. Mr. Canakaris has been with the firm since 1972 and is responsible for developing the firm’s investment process. He has a BSBA from the University of Florida and holds the Chartered Financial Analyst designation. |
| ASTON/Montag & Caldwell Balanced Fund |
| | |
| Ronald E. Canakaris, CFA, CIC | | Portfolio Manager since the Fund’s inception in 1994. Please see above. |
| | |
| Helen M. Donahue, CFA | | Co-Portfolio Manager of the Fund since March 2013; Ms. Donahue is a portfolio manager of equities and fixed income at Montag & Caldwell. Ms. Donahue joined Montag & Caldwell in 1997 and has over 20 years of investment industry experience. Prior to joining Montag & Caldwell, she served as an Assistant Vice President and fixed income portfolio manager for Legg Mason Capital Management. Ms. Donahue holds the Chartered Financial Analyst designation. Her professional affiliations include the CFA Institute and the CFA Society of Atlanta. |
Prospectus | 99
| | |
| ASTON/Montag & Caldwell Mid Cap Growth Fund |
| | |
| Andrew W. Jung, CFA | | Co-Portfolio Manager since the Fund’s inception in November 2007, Vice President and Security Analyst. Mr. Jung joined Montag & Caldwell in 2001 as a research analyst. Prior to joining Montag & Caldwell, he was an analyst at Strong Capital Management, following the financial services sector for several large-cap growth funds, and at the Robinson-Humphrey Company in Atlanta, where he followed banks and thrifts. He has a BA from Marquette University and an MBA from Emory University, and holds the Chartered Financial Analyst designation. His professional affiliations include the CFA Institute and the CFA Society of Atlanta. |
| | |
| M. Scott Thompson, CFA | | Co-Portfolio Manager since the Fund’s inception in November 2007, Vice President and Security Analyst. Mr. Thompson joined Montag & Caldwell in 1992 upon graduating from the University of the South with a BA in Economics. He has an MBA from Emory University and holds the Chartered Financial Analyst designation. His professional affiliations include the CFA Institute and the CFA Society of Atlanta, for which he formerly served as trustee. |
| ASTON/Herndon Large Cap Value Fund |
| | |
| Randell Cain Jr., CFA | | Portfolio Manager since the Fund’s inception in March 2010. Mr. Cain joined Herndon in 2002 and is a principal and Portfolio Manager. Prior to joining Herndon, he was a portfolio manager at NCM Capital for five years. Mr. Cain received a BS from Morehouse College, a Bachelor of Industrial Engineering from Georgia Institute of Technology, and an MBA from Harvard Business School. Mr. Cain holds the Chartered Financial Analyst designation. |
| ASTON/Cornerstone Large Cap Value Fund |
| | |
| John Campbell, CFA | | Portfolio Manager since July 2011. Mr. Campbell is Chief Investment Officer of Cornerstone and is responsible for maintaining and adhering to the firm’s overall investment philosophy and process. Mr. Campbell has been with the firm since 2005 and has been in the industry since 1982. He has a BS from State University of New York at Fredonia and holds the Chartered Financial Analyst designation. |
| | |
| Rick van Nostrand, CFA | | Portfolio Manager since July 2011. Mr. Van Nostrand is a portfolio manager of Cornerstone and is responsible for fundamental research and oversight coverage for a portion of the portfolio holdings. Mr. van Nostrand has been with the firm since 2005. He has a BS from Southern Methodist University and an MBA from the Wharton School at the University of Pennsylvania, and he holds the Chartered Financial Analyst designation. |
| | |
| Cameron Clement, CFA | | Portfolio Manager since July 2011. Mr. Clement is a portfolio manager of Cornerstone and is responsible for fundamental research and oversight coverage for a portion of the portfolio holdings. Mr. Clement has been with the firm since 2008. Prior to joining Cornerstone in 2008, Mr. Clement was a portfolio manager with Invesco Capital Management since January 2003. He is a graduate of the University of Strathclyde in Glasgow, Scotland and holds the Chartered Financial Analyst designation. |
| | |
| Dean Morris, CFA | | Portfolio Manager since July 2011. Mr. Morris is a portfolio manager of Cornerstone and is responsible for fundamental research and oversight coverage for a portion of the portfolio holdings. Mr. Morris has been with the firm since 2008. Prior to joining Cornerstone in 2008, Mr. Morris was a quantitative analyst with Invesco Capital Management since October 1997. He is a graduate of Williams College and has an MBA from the University of Chicago, and he holds the Chartered Financial Analyst designation. |
ASTON/TAMRO Diversified Equity Fund ASTON/TAMRO Small Cap Fund |
| | |
| Philip D. Tasho, CFA | | Portfolio Manager since the Funds’ inception in November 2000 and Chief Executive Officer and Chief Investment Officer of TAMRO. Mr. Tasho is responsible for the day-to-day management of the Funds. He began his investment management career in 1980. He received his MBA from George Washington University and holds the Chartered Financial Analyst designation. |
| | |
| Timothy A. Holland, CFA | | Co-Portfolio Manager since February 2010. Mr. Holland is a principal and analyst at TAMRO, covering companies within the Financial and Materials sectors. He also monitors broad economic and political trends and analyzes the potential impact on portfolios at the sector level. Mr. Holland joined TAMRO in April 2005 after nearly five years with Manley Asset Management LP. Mr. Holland earned his BA from Drew University and holds the Chartered Financial Analyst designation. |
Prospectus | 100
| | |
ASTON/River Road Dividend All Cap Value Fund ASTON/River Road Dividend All Cap Value Fund II |
| | |
| Henry W. Sanders, III, CFA | | Lead Portfolio Manager of ASTON/River Road Dividend All Cap Value Fund and ASTON/River Road Dividend All Cap Value Fund II since each Fund’s inception and Executive Vice President of River Road. Mr. Sanders was formerly employed as Senior Vice President and portfolio manager for Commonwealth SMC Capital Inc. from 2002 to 2005. He received his BS from Bellarmine University, his MBA from Boston College, and he holds the Chartered Financial Analyst designation. |
| | |
| Thomas S. Forsha, CFA | | Co-Portfolio Manager of ASTON/River Road Dividend All Cap Value Fund since June 2007, Co-Portfolio Manager of ASTON/River Road Dividend All Cap Value Fund II since inception and Vice President of River Road. Mr. Forsha was formerly employed by ABN AMRO from 1998 to 2005, where he served as equity analyst and portfolio manager and was responsible for the management of the North America equity allocation of the firm’s Global High Income Equity Fund. He received his BS in Finance from The Ohio State University’s Fisher College of Business and his MBA from The University of Chicago’s Graduate School of Business. Mr. Forsha holds the Chartered Financial Analyst designation and is a member of the CFA Institute and the CFA Society of Louisville. |
| | |
| James C. Shircliff, CFA | | Co-Portfolio Manager of ASTON/River Road Dividend All Cap Value Fund and ASTON/River Road Dividend All Cap Value Fund II since each Fund’s inception and Chief Investment Officer of River Road. Mr. Shircliff was formerly employed as portfolio manager and Director of Research for Commonwealth SMC (SMC Capital, Inc.) from 1998 to 2005. Additionally, Mr. Shircliff has more than 35 years of investment management experience. He received his BS from the University of Louisville and holds the Chartered Financial Analyst designation. |
ASTON/River Road Select Value Fund ASTON/River Road Small Cap Value Fund |
| | |
| James C. Shircliff, CFA | | Portfolio Manager since each Fund’s inception. Please see above. |
| | |
| R. Andrew Beck | | Portfolio Manager since each Fund’s inception, as well as CEO and President of River Road. Mr. Beck was formerly employed as Senior Vice President and Portfolio Manager for Commonwealth SMC (SMC Capital, Inc.) from 1999-2005. Mr. Beck received his BS from the University of Louisville and his MBA from Babson College. |
| | |
| J. Justin Akin | | Portfolio Manager since March 2012 and portfolio manager of River Road. Mr. Akin was formerly employed as an equity research analyst at Commonwealth SMC (SMC Capital, Inc.) from 2003-2005. Mr. Akin received a BS in economics from Centre College. |
| ASTON/River Road Independent Value Fund |
| | |
| Eric Cinnamond, CFA | | Portfolio Manager since the Fund’s inception in December 2010, Mr. Cinnamond is Vice President and Portfolio Manager of River Road’s independent value investment strategy. Mr. Cinnamond has 18 years of investment industry experience. Prior to joining River Road, Mr. Cinnamond served as a portfolio manager at Intrepid Capital Management from 1998 to 2010. Prior to Intrepid Capital Management, Mr. Cinnamond was a co-portfolio manager and analyst at Evergreen Asset Management from 1996 to 1998. Mr. Cinnamond received his BBA in Finance from Stetson University, his MBA from the University of Florida, and he holds the Chartered Financial Analyst designation. |
| ASTON/River Road Long-Short Fund |
| | |
| Matthew W. Moran, CFA | | Lead Portfolio Manager since the Fund’s inception in May 2011, Mr. Moran is a portfolio manager at River Road. Mr. Moran has 10 years of investment industry experience. Prior to joining River Road, Mr. Moran was employed by Morningstar from 2005 to 2006, as an equity analyst. Mr. Moran was employed by Citigroup as an associate from 2001 to 2005. He received his BS in Finance from Bradley University, his MBA from the University of Chicago Booth School of Business, and he holds the Chartered Financial Analyst designation. |
| | |
| Daniel Johnson, CFA | | Co-Portfolio Manager since March 2012, Mr. Johnson is a portfolio manager at River Road. Prior to joining River Road, Mr. Johnson served as a public accountant with PricewaterhouseCoopers from 2005 to 2006. He received his BS in accounting and a Masters in Accountancy from the University of Kentucky. Mr. Johnson holds the Certified Public Accountant and Chartered Financial Analyst designations. |
Prospectus | 101
| | |
| ASTON/Fairpointe Mid Cap Fund |
| | |
| Thyra E. Zerhusen | | Portfolio Manager of the Fund since May 1999. Ms. Zerhusen is the principal founder, CEO and Chief Investment Officer of Fairpointe Capital. Prior to founding Fairpointe Capital in 2011, Ms. Zerhusen was the Chief Investment Officer of Mid Cap Equities at Optimum Investment Advisors beginning in October 2003. From April 1999 to September 2003 she was on the investment team of Talon Asset Management. She has a Diplom Ingenieur from the Swiss Federal Institute of Technology and an MA in Economics from the University of Illinois. |
| | |
| Marie L. Lorden | | Co-Portfolio Manager of the Fund since March 2009; Ms. Lorden is a co-founder and a portfolio manager of Fairpointe Capital. Prior to co-founding Fairpointe Capital in 2011, Ms. Lorden served as a member of the Mid Cap Investment Team at Optimum Investment Advisors for over 7 years. Ms. Lorden is responsible for research and analysis of existing and potential holdings, as well as mutual fund, institutional relationships, and portfolio management. Previously, Ms. Lorden held positions specializing in equity product analysis with Zurich Insurance Group, Driehaus Capital Management, and The Burridge Group. Ms. Lorden received her BS from Elmhurst College and her MBA from the Keller Graduate School of Management. |
| | |
| Mary L. Pierson | | Co-Portfolio Manager of the Fund since March 2009; Ms. Pierson is a co-founder and a portfolio manager of Fairpointe Capital. Prior to co-founding Fairpointe Capital in 2011, Ms. Pierson served as a member of the Mid Cap Investment Team at Optimum Investment Advisors for 7 years. Ms. Pierson is responsible for research and analysis of existing and potential holdings, as well as mutual fund, institutional relationships, and portfolio management. Her prior experience includes 15 years with Harris Bancorp and Harris Futures Corporation. While General Manager at Harris Futures Corporation, she was responsible for managing all aspects of the institution, which operated as a financial futures broker. Ms. Pierson received her BA in Economics from DePauw University, her MA in Economics from Northwestern University and her MBA in Finance from The University of Chicago. |
ASTON/LMCG Small Cap Growth Fund ASTON Small Cap Fund |
| | |
| Andrew Morey, CFA | | Portfolio Manager of ASTON/LMCG Small Cap Growth Fund since the Fund’s inception in November 2010 and Portfolio Manager of ASTON Small Cap Fund since January 31, 2013. Mr. Morey, portfolio manager for LMCG’s Small-and Small/Mid-Cap Growth investment strategies, joined LMCG in February 2012. Mr. Morey has 20 years of investment management experience and prior to joining LMCG, he served as portfolio manager at Crosswind Investments, LLC for Crosswind’s Small-and Small/Mid-Cap investment strategies. Previously, Mr. Morey was the founder and a portfolio manager of Tartan Partners, LLC from 2005 to 2007. Prior to Tartan Partners, Mr. Morey worked at State Street Research & Management as a portfolio manager, and at Gabelli & Co. as a research analyst. Mr. Morey holds the Chartered Financial Analyst designation. |
| ASTON/Silvercrest Small Cap Fund |
| | |
| Roger W. Vogel, CFA | | Portfolio Manager since inception in December 2011. Mr. Vogel is a Managing Director of Silvercrest and has been the lead portfolio manager for Silvercrest’s value equity investment strategies, including its small cap investment strategy, since he joined Silvercrest in April of 2002. Prior to Silvercrest, Mr. Vogel was a Managing Director at Credit Suisse Asset Management where he co-managed both small-cap and large-cap portfolios. He arrived at Credit Suisse as a result of the merger with Donaldson, Lufkin and Jenrette, where he worked since 1993 in a similar capacity. Previously, Mr. Vogel was a portfolio manager at Chemical Bank and Manufacturers Hanover Trust. |
| ASTON/DoubleLine Core Plus Fixed Income Fund |
| | |
| Jeffrey E. Gundlach | | Lead Portfolio Manager of the Fund since its inception in July 2011 and lead portfolio manager of the DoubleLine core plus fixed income investment strategy. Mr. Gundlach is the founder of DoubleLine and has been Chief Executive Officer and Chief Investment Officer of DoubleLine since its inception in December 2009. For the five-year period prior to founding DoubleLine, Mr. Gundlach was Chief Investment Officer and Group Managing Director for Trust Company of the West (“TCW”). He was also President and Chief Investment Officer for TCW Asset Management Company. |
| | |
| Philip A. Barach | | Mr. Barach has been Portfolio Manager of the Fund since its inception in July 2011 and President of DoubleLine since its inception in December 2009. As part of the Fund’s portfolio management team, Mr. Barach assists in overseeing the implementation of the Fund’s overall strategy. For the five-year period prior to founding DoubleLine, Mr. Barach was Group Managing Director at TCW, where he partnered with Mr. Gundlach to manage over $70 billion in fixed income assets. |
| | |
| Bonnie Baha, CFA | | Ms. Baha has been Portfolio Manager of the Fund since its inception in July 2011 and a portfolio manager of DoubleLine since its inception in December 2009. As part of the Fund’s portfolio management team, Ms. Baha manages the global developed credit portion of the Fund’s portfolio. For the five-year period prior to joining DoubleLine, Ms. Baha was a Managing Director at TCW. |
| | |
| Luz M. Padilla | | Ms. Padilla has been Portfolio Manager of the Fund since its inception in July 2011 and a portfolio manager of DoubleLine since January 2010. As part of the Fund’s portfolio management team, Ms. Padilla manages the emerging markets fixed income portion of the Fund’s portfolio. For the five-year period prior to joining DoubleLine, Ms. Padilla was a Managing Director at TCW. |
Prospectus | 102
| | |
| ASTON/TCH Fixed Income Fund |
| | |
| Tere Alvarez Canida, CFA | | Co-Portfolio Manager of the Fund since December 2006 and President and Managing Principal of TCH. Ms. Canida has over 25 years of investment experience. She previously served as Vice President and Senior Investment Officer of Southeast Bank. She received her BS from Georgetown University, and her MBA from George Washington University. Ms. Canida holds the Chartered Financial Analyst designation. |
| | |
| Alan M. Habacht | | Co-Portfolio Manager of the Fund since December 2006 and a principal of TCH. Mr. Habacht has over 35 years of investment experience. Before joining TCH, he served as Senior Vice President and portfolio manager for INVESCO Capital Management. He received his BA in Finance from Boston University. |
| | |
| William J. Canida, CFA | | Co-Portfolio Manager of the Fund since December 2006 and a principal of TCH. Mr. Canida has over 30 years of investment experience. Prior to joining TCH, he served as Vice President and Senior Investment Officer for Harris Trust Company of Florida. Mr. Canida received his BA and his MBA from Indiana University. He has also attended the National Graduate Trust School of Northwestern University. Mr. Canida holds the Chartered Financial Analyst designation. |
| | |
| Scott M. Kimball, CFA | | Co-Portfolio Manager of the Fund since February 2013 and portfolio manager at TCH. Mr. Kimball joined TCH in 2007 and the TCH portfolio management team in 2011. In his current role he is responsible for implementing the team’s strategies and monitoring the return objectives and guidelines set forth for client accounts. He has over eight years of investment experience and has previously worked with Merrill Lynch and Charles D. Hyman and Company. Mr. Kimball graduated from Stetson University in 2003 and holds the Chartered Financial Analyst designation. |
| ASTON/Lake Partners LASSO Alternatives Fund |
| | |
| Frederick C. Lake | | Portfolio Manager of the LASSO strategy and the Fund since the Fund’s inception in April 2009. He is the Co-Chairman and Treasurer of Lake Partners, which he co-founded in 1989. Mr. Lake has over 30 years of experience in the investment industry. He directs research and portfolio management of investment programs using multiple mutual funds and alternative mutual funds. Mr. Lake received a BA from Harvard University. |
| | |
| Ronald A. Lake | | Co-Portfolio Manager of the LASSO strategy and the Fund since the Fund’s inception in April 2009. He is the Co-Chairman and President of Lake Partners, which he co-founded in 1989. Mr. Lake is editor-in-chief of Evaluating and Implementing Hedge Fund Strategies. He has over 30 years of investment experience. He is responsible for asset allocation, investment strategy and supervision of multi-manager programs focusing on alternative investments, or integrating alternative and traditional investments. Mr. Lake received a BA from Harvard University and an MCRP in public policy from Harvard University. |
| ASTON/Anchor Capital Enhanced Equity Fund |
| | |
| Ronald L. Altman | | Portfolio Manager since the Fund’s inception in January 2008. Mr. Altman joined Anchor Capital in June 2012 as Senior Vice President and Senior Portfolio Manager. Prior to Anchor Capital, Mr. Altman was a Portfolio Manager of the enhanced equity strategy at M.D. Sass Investors Services, Inc., the previous subadviser to the Fund. From 2005 to 2009, Mr. Altman was a Partner and Portfolio Manager of the enhanced equity income strategy at MB Investment Partners, Inc. Mr. Altman has over 40 years of experience in the investment research and money management business in various positions. |
| ASTON/Barings International Fund |
| | |
| David Bertocchi, CFA | | Portfolio Manager of the Fund since April 2008. Mr. Bertocchi joined Barings in 2000 and was appointed Divisional Director in 2004. With over 10 years of investment experience, Mr. Bertocchi is a member of the World Equity Group at Barings and is responsible for international equity, focused on EAFE markets, and global portfolios. In 2010 he was appointed to the Strategic Policy Group at Barings, the company’s global macro research and asset allocation team. Previously, he managed the Baring Global Equity Unit Trust and the global institutional funds. He is a past member of Barings European and UK equity teams. Mr. Bertocchi holds an MBA from London Business School and a BS in Mechanical Engineering from the University of Calgary (Canada). He holds the Chartered Financial Analyst designation. |
Prospectus | 103
| | |
| ASTON/Harrison Street Real Estate Fund |
| | |
| Reagan A. Pratt | | Co-Portfolio Manager since June 2011. Mr. Pratt is a principal and portfolio manager as well as a member of the Board of Managers of HSS. Mr. Pratt founded HSS in 2005, in association with TIC and Mr. Kammert. From 2001 through 2004, Mr. Pratt was a portfolio manager with Heitman Real Estate Securities LLC. Mr. Pratt is responsible for managing the public real estate securities portfolios of HSS and the day-to-day operation of HSS. Mr. Pratt has a bachelor’s degree in economics and geography from the University of Guelph (Ontario, Canada) and a Master of Science Business Administration (Urban Land Economics) from the University of British Columbia (British Columbia, Canada). |
| | |
| James H. Kammert, CFA | | Co-Portfolio Manager since June 2011. Mr. Kammert is a principal and portfolio manager as well as a member of the Board of Managers of HSS. Mr. Kammert founded HSS in March 2005, in association with TIC and Mr. Pratt. Along with Mr. Pratt, Mr. Kammert is responsible for managing the public real estate securities portfolios of HSS. Mr. Kammert joined HSS in August 2005. From 2003 through mid-2005, Mr. Kammert was Director of Research for European Investors, Inc. Prior to joining European Investors, Mr. Kammert was Vice President and co-head of Goldman Sachs & Co.’s U.S. REIT research team for over four years. Mr. Kammert graduated from Lafayette College with a BA in Economics & Business and earned an MBA from the University of Chicago. Mr. Kammert holds the Chartered Financial Analyst designation and is a CPA. |
Additional information about the portfolio managers’ compensation, other accounts managed by the portfolio managers and the portfolio managers’ ownership of securities in the Funds is available in the SAI.
Prospectus | 104
MANAGEMENT FEES
| | | | | | |
| Fund Name | | Management Fee | | Management Fee Paid for
Fiscal Year Ended 10/31/12 | |
| | | (as a percentage of net assets) | | (as a percentage of net assets) | |
| ASTON/Montag & Caldwell Growth Fund | | First $800 million 0.80%
Over $800 million up to $6 billion 0.60% Over $6 billion up to $12 billion 0.55% Over $12 billion 0.50% | | | 0.64 | % |
| ASTON/Herndon Large Cap Value Fund (a) | | 0.80% | | | 0.69 | % |
| ASTON/Cornerstone Large Cap Value Fund (a),(b) | | 0.80% | | | 0.49 | % |
| ASTON/TAMRO Diversified Equity Fund (a) | | 0.80% | | | 0.32 | % |
| ASTON/River Road Dividend All Cap Value Fund (a) | | 0.70% | | | 0.70 | % |
| ASTON/River Road Dividend All Cap Value Fund II (a),(d) | | 0.70% | | | 0.00 | % |
| ASTON/Fairpointe Mid Cap Fund | | First $100 million 0.80%
Next $300 million 0.75% Over $400 million 0.70% | | | 0.71 | % |
| ASTON/Montag & Caldwell Mid Cap Growth Fund (a),(c) | | 0.85% | | | 0.00 | % |
| ASTON/TAMRO Small Cap Fund | | 0.90% | | | 0.90 | % |
| ASTON/River Road Select Value Fund | | 1.00% | | | 1.00 | % |
| ASTON/River Road Small Cap Value Fund | | 0.90% | | | 0.90 | % |
| ASTON/River Road Independent Value Fund (a),(d) | | 1.00% | | | 0.98 | % |
| ASTON/LMCG Small Cap Growth Fund (a) | | 1.00% | | | 0.00 | % |
| ASTON Small Cap Fund (a ) | | 1.00% | | | 0.66 | % |
| ASTON/Silvercrest Small Cap Fund (a),(d) | | 1.00% | | | 0.00 | % |
| ASTON/DoubleLine Core Plus Fixed Income Fund (a),(f) | | 0.55% | | | 0.14 | % |
| ASTON/TCH Fixed Income Fund (a) | | 0.55% | | | 0.39 | % |
| ASTON/Lake Partners LASSO Alternatives Fund (e) | | 1.00% | | | 1.04 | % |
| ASTON/Anchor Capital Enhanced Equity Fund (e) | | 0.70% | | | 0.74 | % |
| ASTON/River Road Long-Short Fund (a) | | 1.20% | | | 0.00 | % |
| ASTON/Barings International Fund (a) | | 1.00% | | | 0.80 | % |
| ASTON/Harrison Street Real Estate Fund (a) | | 1.00% | | | 0.01 | % |
| ASTON/Montag & Caldwell Balanced Fund (a) | | 0.75% | | | 0.55 | % |
(a) Taking into account fee waivers then in effect.
(b) The Adviser voluntarily waived management fees and/or reimbursed expenses for the ASTON/Cornerstone Large Cap Value Fund at 1.19% and 0.94% for the Class N and Class I shares, respectively through February 28, 2012. Effective February 29, 2012, the voluntary expense limitation was replaced with a contractual expense limitation of 1.30% for Class N and 1.05% for Class I shares.
(c) Effective February 29, 2012, the voluntary expense limitation for the ASTON/Montag & Caldwell Mid Cap Growth Fund was replaced with a contractual expense limitation of 1.25%.
(d) The ASTON/Silvercrest Small Cap Fund began issuing Class N shares and Class I shares on December 23, 2011. The ASTON/River Road Dividend All Cap Value Fund II began issuing Class N shares and Class I shares on June 26, 2012.
(e) For the year ended October 31, 2012, the Adviser was reimbursed by the Fund for recoupment of prior year fee waivers.
(f) The Adviser and the Subadviser will each waive its respective portion of the Fund’s management fee attributable to the Fund’s assets invested in an affiliated fund, if any.
Prospectus | 105
RELATED PERFORMANCE
LMCG Related Performance
The following tables show the performance of LMCG’s small-cap growth composite. The composite is comprised of all fully discretionary accounts in LMCG’s small-cap U.S. growth equity strategy (the “Strategy”), excluding the ASTON/LMCG Small Cap Growth Fund. As of December 31, 2012, the composite was comprised of 3 accounts with assets of $37 million. The investment objective, policies and strategies of the ASTON/LMCG Small Cap Growth Fund are substantially similar to those of the accounts comprising the composite.
The performance of the composite does not represent the historical performance of the ASTON/LMCG Small Cap Growth Fund and should not be considered indicative of future performance of the Fund.
Effective January 2012, the portfolio manager of the composite joined LMCG. Performance for periods prior to February 2012 represent the performance that occurred while the portfolio manager was at a prior firm and not the historical results of LMCG, and there is no assurance that similar results will be achieved at LMCG. Results may differ because of, among other factors, differences in brokerage commissions, account expenses including management fees, the size of positions taken in relation to account size, diversification of the portfolio, timing of purchases and sales and availability of cash for new investment. The Fund has been advised that, as the lead portfolio manager of the Strategy at his prior firm, Mr. Morey had full discretionary authority over the selection of investments for accounts comprising the composite and no other person played a significant role in the investment decision-making process.
An independent third party, whose primary function is the verification of performance data for compliance with Global Investment Performance Standards (GIPS®) conducted a review of the track record for compliance with GIPS®. The prior firm has a written agreement with LMCG allowing its use of the performance history and supporting records.
The performance of the separate accounts presented below is not calculated using the same methodology as that which is prescribed for performance calculations used by registered investment companies. The net-of-fee returns below are calculated by deducting the standard fees, representing the highest investment management fees for the Strategy from the accounts gross returns. In addition, the separate accounts for which performance is presented are not subject to the same type of expenses as the Fund. If the Fund’s fees and expenses had been used in calculating the composite’s performance, the performance of the composite would have been lower.
In addition, the accounts comprising the composite are not subject to certain investment limitations, diversification requirements and other restrictions imposed by the 1940 Act and the Code, which if applicable, may have adversely affected the performance results of the composite. The results for different products may vary.
Total Return
| | | | | | | | |
Calendar Year end | | LMCG
Small Cap
Growth
Composite | | | Russell
2000
Growth
Index | |
| 2012 | | | 23.68 | % | | | 14.59 | % |
| 2011 | | | (9.37 | )% | | | (2.91 | )% |
| 2010 | | | 32.60 | % | | | 29.09 | % |
| 2009 | | | 51.79 | % | | | 34.47 | % |
| 2008 | | | (34.01 | )% | | | (38.54 | )% |
Average Annual Total Return
(For the periods ended December 31, 2012)
| | | | | | | | |
| Period | | LMCG
Small Cap
Growth
Composite | | | Russell
2000
Growth
Index | |
| One Year | | | 23.68 | % | | | 14.59 | % |
| Five Year | | | 8.29 | % | | | 3.49 | % |
| Since Inception(a) | | | 8.29 | % | | | 3.49 | % |
(a) Since Inception return is computed from 12/31/07.
Prospectus | 106
Herndon Related Performance
The following tables show the performance of a composite of all fully discretionary U.S. large-cap value equity accounts managed by Herndon, including the ASTON/Herndon Large Cap Value Fund. As of December 31, 2012, the composite was comprised of 123 accounts and assets of $4.3 billion. The investment objective, policies and strategies of the ASTON/Herndon Large Cap Value Fund are substantially similar to those of the accounts comprising the composite.
The performance of the composite does not represent the historical performance of the ASTON/Herndon Large Cap Value Fund and should not be considered indicative of future performance of the Fund. Results may differ because of, among other factors, differences in brokerage commissions, account expenses including management fees, the size of positions taken in relation to account size, diversification of the portfolio, timing of purchases and sales and availability of cash for new investment.
The performance of the accounts presented below is not calculated using the same methodology as that which is prescribed for performance calculations used by registered investment companies. The net-of-fee returns below are calculated by deducting investment management fees of the accounts from gross returns. Gross returns are calculated in accordance with GIPS®. In addition, the accounts for which performance is presented are not subject to the same type of expenses as the Fund. If the Fund’s fees and expenses had been used in calculating the composite’s performance, the performance of the composite would have been lower.
In addition, the accounts comprising the composite are not subject to certain investment limitations, diversification requirements and other restrictions imposed by the 1940 Act and the Code, as amended, which if applicable, may have adversely affected the performance results of the composite. The results for different products may vary.
Total Return
| | | | | | | | |
| Year end | | Herndon
Large Cap
U.S. Value
Composite | | | Russell
1000
Value
Index | |
| 2012 | | | 18.03 | % | | | 17.51 | % |
| 2011 | | | 1.15 | % | | | 0.39 | % |
| 2010 | | | 18.77 | % | | | 15.51 | % |
| 2009 | | | 35.85 | % | | | 19.69 | % |
| 2008 | | | (32.17 | )% | | | (36.85 | )% |
| 2007 | | | 9.89 | % | | | (0.17 | )% |
| 2006 | | | 14.81 | % | | | 22.25 | % |
| 2005 | | | 15.30 | % | | | 7.05 | % |
| 2004 | | | 28.63 | % | | | 16.49 | % |
| 2003 | | | 31.02 | % | | | 30.03 | % |
Average Annual Total Return
(For the periods ended December 31, 2012)
| | | | | | | | |
| Period | | Herndon
Large Cap
U.S. Value
Composite | | | Russell
1000
Value
Index | |
| One Year | | | 18.03 | % | | | 17.51 | % |
| Five Years | | | 5.71 | % | | | 0.59 | % |
| Ten Years | | | 12.63 | % | | | 7.38 | % |
Prospectus | 107
River Road Independent Value Related Performance
The following tables show the performance of a composite comprised of all fully discretionary accounts in River Road’s independent value investment strategy, including the ASTON/River Road Independent Value Fund. As of December 31, 2012, the composite was comprised of 8 accounts with assets of $984 million. The investment objective, policies and strategies of the ASTON/River Road Independent Value Fund are substantially similar to those of the accounts comprising the composite, notwithstanding changes in the market capitalization range of the strategy over time. Prior to 2009, the market capitalization range for the independent value strategy was $100 million to $2 billion. Due to market volatility causing changes in the benchmark index of the composite, the current market capitalization range of the strategy is from $100 million to $5 billion. The performance of the composite does not represent the historical performance of the ASTON/River Road Independent Value Fund and should not be considered indicative of future performance of the Fund.
Performance for periods prior to September 1, 2010 represent the performance that occurred while the portfolio manager was at a prior firm and not the historical results of River Road, and included the fully discretionary small-cap equity accounts that were managed by the firm and reported in accordance with GIPS®. There is no assurance that similar results will be achieved at River Road. Results may differ because of, among other factors, differences in brokerage commissions, account expenses including management fees, the size of positions taken in relation to account size, diversification of the portfolio, timing of purchases and sales and availability of cash for new investment. The Fund has been advised that, as the lead portfolio manager of the strategy at his prior firm, Mr. Cinnamond had full discretionary authority over the selection of investments for accounts comprising the composite and no other person played a significant role in the investment decision-making process.
An independent third party, whose primary function is the verification of performance data for compliance to GIPS® standards, conducted a review of this track record for compliance with the portability requirements of the GIPS® standards for River Road. The prior firm has a written agreement with River Road allowing its use of the performance history and supporting records.
The performance of the accounts presented below is not calculated using the same methodology as that which is prescribed for performance calculations used by registered investment companies. The net-of-fee returns below are calculated by deducting investment management fees of the accounts from gross returns. Gross returns are calculated in accordance with GIPS®. In addition, the accounts for which performance is presented are not subject to the same type of expenses as the Fund. If the Fund’s fees and expenses had been used in calculating the composite’s performance, the performance of the composite would have been lower.
In addition, the accounts comprising the composite are not subject to certain investment limitations, diversification requirements and other restrictions imposed by the 1940 Act and the Code, which if applicable, may have adversely affected the performance results of the composite. The results for different products may vary.
Total Return
| | | | | | | | |
| Year end | | River Road
Independent
Value
Composite | | | Russell
2000
Value | |
| 2012 | | | 8.65 | % | | | 18.05 | % |
| 2011 | | | 8.41 | % | | | (5.50 | )% |
| 2010 | | | 18.25 | % | | | 24.50 | % |
| 2009 | | | 30.55 | % | | | 20.58 | % |
| 2008 | | | (7.10 | )% | | | (28.92 | )% |
| 2007 | | | 7.96 | % | | | (9.78 | )% |
| 2006 | | | 11.44 | % | | | 23.48 | % |
| 2005 | | | 3.38 | % | | | 4.71 | % |
| 2004 | | | 12.82 | % | | | 22.25 | % |
| 2003 | | | 16.91 | % | | | 46.03 | % |
Average Annual Total Return
(For the periods ended December 31, 2012)
| | | | | | | | |
| Period | | River Road
Independent
Value
Composite | | | Russell
2000
Value | |
| One Year | | | 8.65 | % | | | 18.05 | % |
| Five Years | | | 11.05 | % | | | 3.55 | % |
| Ten Years | | | 10.73 | % | | | 9.50 | % |
Prospectus | 108
Silvercrest Related Performance
The following tables show the performance of a composite of all fully discretionary small-cap equity accounts managed by Silvercrest, including the ASTON/Silvercrest Small Cap Fund. As of December 31, 2012, the composite was comprised of 120 separately managed accounts with aggregate assets of $685.8 million. The investment objective, policies and strategies of the ASTON/Silvercrest Small Cap Fund are substantially similar to those of the accounts comprising the composite.
The performance of the composite does not represent the historical performance of the ASTON/Silvercrest Small Cap Fund and should not be considered indicative of future performance of the Fund. Results may differ because of, among other factors, differences in brokerage commissions, account expenses including management fees, the size of positions taken in relation to account size, diversification of the portfolio, timing of purchases and sales, and availability of cash for new investment.
The performance of the separate accounts presented below is not calculated using the same methodology as that which is prescribed for performance calculations used by registered investment companies. The net-of-fee returns below are calculated by deducting investment management fees of the accounts from gross returns. Gross returns are calculated in accordance with Global Investment Performance Standards (GIPS®). In addition, the separate accounts for which performance is presented are not subject to the same type of expenses as the Fund. If the Fund’s fees and expenses had been used in calculating the composite’s performance, the performance of the composite would have been lower.
In addition, the accounts comprising the composite are not subject to certain investment limitations, diversification requirements and other restrictions imposed by the 1940 Act, and the Code, which if applicable, may have adversely affected the performance results of the composite. The results for different products may vary.
Total Return
| | | | | | | | |
| Year end | | Silvercrest
Small Cap
Equity
Composite | | | Russell
2000
Value | |
| 2012 | | | 14.85 | % | | | 18.05 | % |
| 2011 | | | 0.55 | % | | | (5.50 | )% |
| 2010 | | | 24.56 | % | | | 24.50 | % |
| 2009 | | | 23.49 | % | | | 20.58 | % |
| 2008 | | | (15.25 | )% | | | (28.92 | )% |
| 2007 | | | 3.50 | % | | | (9.78 | )% |
| 2006 | | | 18.38 | % | | | 23.48 | % |
| 2005 | | | 3.30 | % | | | 4.71 | % |
| 2004 | | | 20.98 | % | | | 22.25 | % |
| 2003 | | | 26.69 | % | | | 46.03 | % |
Average Annual Total Return
(For the periods ended December 31, 2012)
| | | | | | | | |
| Periods | | Silvercrest
Small Cap
Equity
Composite | | | Russell
2000
Value | |
| One Year | | | 14.85 | % | | | 18.05 | % |
| Five Years | | | 8.53 | % | | | 3.55 | % |
| Ten Years | | | 11.31 | % | | | 9.50 | % |
Prospectus | 109
Shareholder Information
OPENING AN ACCOUNT
| n | | Read this prospectus carefully. |
| n | | Determine how much you want to invest. The minimum initial and subsequent investment requirements for the applicable class of each Aston Fund are as follows: |
| | | | | | | | |
| Class and Account Type | | Minimum Initial Investment | | | Subsequent Investments | |
| Class N—Regular Accounts | | $ | 2,500 | | | $ | 50 | |
| Individual Retirement Accounts (IRAs) | | $ | 500 | | | $ | 50 | |
| Education Savings Accounts (ESAs) (except R Class) | | $ | 500 | | | $ | 50 | |
| Uniform Gift to Minor Accounts/Uniform Transfer to Minor Accounts (UGMA/UTMA) | | $ | 500 | | | $ | 50 | |
| Class I—Institutional Accounts (except ASTON/DoubleLine Core Plus Fixed Income Fund, ASTON/Lake Partners LASSO Alternatives Fund and ASTON/River Road Dividend All Cap Value Fund II) | | $ | 1 Million | | | $ | 50 | |
| Class I—ASTON/DoubleLine Core Plus Fixed Income Fund, ASTON/Lake Partners LASSO Alternatives Fund and ASTON/River Road Dividend All Cap Value Fund II | | $ | 100,000 | | | $ | 50 | |
| Class R—Retirement Plans | | $ | 2,500 | | | $ | 50 | |
Class R shares are sold primarily to qualified retirement plans, retirement savings programs and other similar programs offered primarily through financial intermediaries. Contact your financial representative or plan sponsor.
| n | | Minimum initial investment requirements may be waived: |
| | n | | For trustees of Aston Funds, employees of the Adviser, the Adviser’s employees’ spouses, employees of the Subadvisers, the Subadvisers’ employees’ spouses, and affiliates of the Adviser. |
| | n | | By means of a “letter of intent” from an investor or financial adviser/consultant expressing intent to purchase shares over a specified period of time to meet the minimum investment requirement (Class I only). |
| | n | | For certain omnibus accounts, mutual fund advisory platforms and registered investment advisors, banks, trust companies or similar financial institutions investing for their own account or for the account of their clients or customers for whom such institution is exercising investment discretion, or otherwise acting on behalf of clients or customers. |
| | n | | For individual accounts of a financial intermediary that charges an ongoing fee to its customers for its services or offers Fund shares through a no-load network or platform, and for accounts invested through fee-based advisory accounts, certain “wrap” programs and similar programs with approved financial intermediaries. |
| | n | | By Aston Funds at its discretion. |
| n | | Balances within the same Fund may be aggregated to meet the Class I minimum initial investment requirements for the accounts of: |
| | n | | Clients of a financial adviser/consultant or clients of a financial intermediary that acts in an advisory capacity. |
| | n | | Immediate family members (i.e., an individual’s spouse, parents, children, siblings and in-laws). |
| | n | | A corporation or other legal entity. |
| n | | For Class N and Class I shareholders, complete the account application and carefully follow the instructions. If you have any questions, please call 800-992-8151. Remember to complete the “Purchase, Exchange and Redemption Authorization” section of the account application to establish your account privileges, and to avoid any delay and inconvenience of needing to request these in writing at a later date. |
| n | | For Class R shareholders, complete the account application through your financial representative. |
| n | | Purchase, exchange and redemption requests (each an “Investment Request”) must be in “good order.” Investment Requests received in “good order” and processed before the New York Stock Exchange (the “NYSE”) market close, typically 4:00 p.m. Eastern Time (“ET”), receive that business day’s closing NAV. Investment Requests received after that time receive the following business day’s NAV. |
| n | | An Investment Request received that is not in “good order” will receive the NAV on the date the Investment Request is received in “good order.” |
An Investment Request is in “good order” when:
| n | | The account number and Fund name are included; |
| n | | The amount of the transaction is specified in dollars or shares; |
| n | | Signatures of all owners appear exactly as they are registered on the account in original form, as photocopies are not acceptable; |
| n | | Any required Medallion Signature Guarantees are included; and |
| n | | Other supporting legal documents (as necessary) are present, including such “Requirements for Written Requests” as described later in this “Shareholder Information” Section. |
Prospectus | 110
Effective on the respective dates shown (each, a “Soft Close Effective Date”), each of the following Funds (each, a “Closed Fund”), ASTON/TAMRO Small Cap Fund (October 16, 2009), ASTON/River Road Dividend All Cap Value Fund (December 16, 2011), and ASTON/River Road Independent Value Fund (January 18, 2013) are closed to new investors until further notice, with the following limited exceptions, where the particular Closed Fund determines that the exception processing is operationally feasible and will not harm the Closed Fund’s investment process:
| | n | | Financial advisors and/or financial consultants who have clients invested in ASTON/TAMRO Small Cap Fund and ASTON/River Road Independent Value Fund may continue to recommend the Funds to their clients and/or open new accounts or add to the accounts of their clients; |
| | n | | Financial advisors and/or financial consultants who have clients invested in ASTON/River Road Dividend All Cap Value Fund may continue to recommend the Fund to such clients and/or add to the accounts of such clients. Financial advisors and/or financial consultants who have clients invested in ASTON/River Road Dividend All Cap Value Fund may only recommend the Fund and/or open new accounts for clients that are not invested in the Fund with Fund approval; |
| | n | | Financial advisors who have approved the inclusion of ASTON/River Road Independent Value Fund as an investment option for their clients, and such inclusion has been approved by the Fund, may designate the Fund as an investment option for their clients; |
| | n | | Participants in a retirement plan that includes a Closed Fund as an investment option on the Fund’s Soft Close Effective Date may continue to designate the particular Closed Fund as an investment option; |
| | n | | Trustees of Aston Funds, employees of Aston and the respective Subadviser of a Closed Fund and their immediate household family members may open new accounts in the particular Closed Fund and add to such accounts; |
| | n | | Each Closed Fund reserves the right to make additional exceptions to limit the above exceptions or otherwise to modify its respective closure policy at any time and to reject any investment for any reason. |
Make your initial investment using the table below as a guideline. If your Investment Request is your initial purchase into the Funds, your account number will be assigned to you upon the Funds’ receipt of the Investment Request in “good order.”
| | |
TO OPEN AN ACCOUNT (Class N and Class I shares only*) | | TO ADD TO AN ACCOUNT ($50 MINIMUM) (All share Classes) |
| Buying Shares Through Your Financial Representative |
n Your financial representative is responsible for transmitting the order promptly. | | n Your financial representative is responsible for transmitting the order promptly. |
Buying Shares By Mail: Aston Funds• P.O. Box 9765• Providence, RI 02940 Buying Shares Via Overnight Delivery: Aston Funds• 4400 Computer Drive• Westborough, MA 01581 |
n Complete and sign your application. n We accept checks, bank drafts and money orders for purchases. Checks must be drawn on U.S. banks. There is a charge of a minimum of $20 for returned checks. Please see “Other Features” later in this “Shareholder Information” Section. n Make checks payable to Aston Funds and mail them with your application to the address listed above. n We do not accept cash, travelers checks, temporary checks, post-dated checks, credit card courtesy checks or second/third party checks (which are checks made payable to someone other than the Funds, including you). n If you anticipate the need to make subsequent trades via telephone or via bank transfer (wire transfer or ACH transfer), please indicate that in the “Purchase, Exchange and Redemption Authorizations” section of your account application. n If you have indicated on your account application that you intend to make trades in your account via ACH bank transfer, please verify that your bank or credit union is a member of the ACH (Automated Clearing House). | | n Return the investment slip from a statement with your check in the envelope provided and mail to us at the above address. n We accept checks, bank drafts, money orders, wires and ACH for purchases. Checks must be drawn on U.S. banks. There is a charge of a minimum of $20 for returned checks. Please see “Other Features” later in this “Shareholder Information” Section. n Make checks payable to Aston Funds and mail them to the address listed above. n We do not accept cash, travelers checks, temporary checks, post-dated checks, credit card courtesy checks or second/third party checks (which are checks made payable to someone other than the Funds, including you). n For purchases via bank wire transfer or ACH transfer, give the following wire/ACH information to your bank: The Bank of New York Mellon ABA #011001234 For: Aston Funds A/C 0000733296 FBO “Aston Fund Number” “Your Account Number” “Your Name” n For your protection, our current Internet capabilities allow Class N and Class I shareholders to check balances and transfer monies only between Aston Funds in the same class. Please contact us via mail with a signed letter of instruction for all other changes to your account. |
Prospectus | 111
| | |
TO OPEN AN ACCOUNT (Class N and Class I shares only*) | | TO ADD TO AN ACCOUNT ($50 MINIMUM) (All share Classes) |
| Buying Shares By Phone: 800-992-8151 |
n You cannot open an account over the phone. | | n When you are ready to add to your account, call Aston Funds and tell the representative the Fund name, account number, the name(s) in which the account is registered and the amount of your investment. n To place your request with an Investor Services Associate, call between 9:00 a.m. and 7:00 p.m. ET, Monday - Friday. n Trade authorizations via telephone or via bank must be valid and on file, as indicated on the “Purchase, Exchange and Redemption Authorizations” section of your account application. n For purchase via bank wire or ACH transfer, instruct your bank to wire or ACH transfer the amount of your investment and provide your bank with the below information. Your bank may charge a fee for wire or ACH transfers. The Bank of New York Mellon ABA #011001234 For: Aston Funds A/C 0000733296 FBO “Aston Fund Number” “Your Account Number” “Your Name” |
| Buying Shares By Internet: www.astonfunds.com |
(Class N shares only*) n To open a new account you’ll need to provide bank account information plus the social security number and date of birth for each account owner and beneficiary. n Open an account online by completing the Aston Funds online account application. or (Class N and Class I shares only*) n Download the appropriate account application(s) from the website. Complete and sign the application(s). Make your check payable to Aston Funds and mail it to the address under “By Mail” above. | | n Complete the “Purchase, Exchange and Redemption Authorization” section of your account application. n Self-register for online account access at www.astonfunds.com. Your social security number or employer identification number, account number and other security validating information will be required for registration. n When you are ready to add to your account, access your account through Aston Funds’ website and enter your purchase instructions in the secure area for shareholders only called “Shareholder Account Access.” ACH purchases on the Internet may take 3 or 4 business days. n For your protection, our current Internet capabilities allow Class N and Class I shareholders to check balances and transfer monies only between Aston Funds in the same class. Please contact us via mail with a signed letter of instruction for all other changes to your account. |
| * | Class R shares are sold primarily to qualified retirement plans, retirement savings programs and similar programs offered primarily through financial intermediaries. To open an account for Class R shares of an applicable Aston Fund, please contact your financial representative or plan sponsor. Class I shares are not eligible for the establishment of new accounts through the Aston Funds website. |
The Funds or their agents will not be responsible for any unauthorized telephone or online order when reasonable procedures designed to verify the identity of the investor are followed.
Other Aston Funds and share classes may be available through separate prospectuses. Please call 800-992-8151 for more information.
EXCHANGING SHARES
When you exchange your shares, you authorize the sale of your shares in one fund to purchase shares of another fund. In other words, you are requesting a sale and then a purchase. The exchange of your shares may be a taxable event for federal income tax purposes if the shares are not held in a tax-deferred account and may subject you to a redemption fee. After you have opened an account with us, you can exchange your shares within Aston Funds to meet your changing investment goals or other needs. This privilege is not designed for frequent trading (which may subject you to a redemption fee) and may be difficult to implement in times of drastic market changes.
You can exchange shares from one Aston Fund to another within the same class of shares. All exchanges to open new accounts must meet the minimum initial investment requirements. Exchanges may be made by mail, through the Internet or by phone at 800-992-8151 if you chose this option when you opened your account.
Prospectus | 112
In addition, the Aston Money Market Fund—Bedford Shares of the Money Market Portfolio of The RBB Fund, Inc. offered in connection with the Aston Funds (the “Aston Money Market Fund”) is available as an exchange option for shareholders of the Aston Funds Class N shares. The Aston Money Market Fund prospectus, including applicable investment minimums, is available by contacting Aston Funds by mail, through the Internet or by phone at 800-992-8151. Please read the Aston Money Market Fund prospectus carefully before investing.
For federal income tax purposes, each exchange into a different fund is treated as a sale and a new purchase. As a result, an investor holding shares in a non-tax-deferred account is generally subject to federal income tax on any appreciation on the shares exchanged.
Aston Funds reserves the right to limit, impose charges upon, terminate or otherwise modify the exchange privilege by sending written notice to shareholders. All exchange requests must be in “good order.”
Aston Funds may allow eligible shareholders to convert their shares between classes within the same Fund, for example from Class I to Class N or vice versa, if offered in the shareholder’s state of residence. No sales charges or other charges will apply to any such exchange. For federal income tax purposes, a same-fund exchange is not expected to result in the recognition by the investor of a capital gain or loss.
SELLING/REDEEMING SHARES
You can sell your shares to meet your changing investment goals or other needs. You may redeem Class R shares through your financial representative or directly from Aston Funds. All redemption requests must be in “good order.”
The following table shows guidelines for selling shares.
| | |
| APPLIES TO: | | TO SELL SOME OR ALL OF YOUR SHARES: |
| Selling Through Your Financial Representative |
n All share classes and accounts of any type. | | n Your financial representative is responsible for transmitting the order promptly. |
Selling Shares By Mail: Aston Funds• P.O. Box 9765• Providence, RI 02940 Selling Shares Via Overnight Delivery: Aston Funds• 4400 Computer Drive• Westborough, MA 01581 |
n All share classes and accounts of any type. n For sales or redemptions of any size, please see the “Medallion Signature Guarantees” Section later in this “Shareholder Information” Section to determine if a Medallion Signature Guarantee is required for your transaction. | | n Write and sign a letter of instruction indicating the Fund name, Fund number, your account number, the name(s) in which the account is registered and the dollar value or number of shares you wish to sell. n Include all signatures and any additional documents that may be required. Signatures must be in original form, as photocopies are not accepted. Please see “Selling Shares in Writing” later in this “Shareholder Information” Section. n Mail to us at the address above. n A check will be mailed to the name(s) and address in which the account is registered. If you would like the check mailed to a different address, you must write a letter of instruction and have it Medallion Signature Guaranteed. n Proceeds may also be sent by wire or ACH. Please see “Other Features” later in this “Shareholder Information” Section. |
| Selling Shares By Phone: 800-992-8151 |
n Class N and Class I non-retirement accounts. n Sales of up to $50,000 (for accounts with telephone account privileges). | | n For automated service 24 hours a day using your touch-tone phone, call 800-992-8151. n To place your request with an Investor Services Associate, call between 9:00 a.m. and 7:00 p.m. ET, Monday - Friday. n A check will be mailed to the name(s) and address in which the account is registered. If you would like the check to be mailed to a different address, you must write a letter of instruction and have it Medallion Signature Guaranteed. n Proceeds may also be sent by wire or ACH. Please see “Other Features” later in this “Shareholder Information” Section. n The Funds reserve the right to refuse any telephone sales request and may modify the procedures at any time. The Funds make reasonable attempts to verify that telephone instructions are genuine, but you are responsible for any loss that you may incur from telephone requests. |
Prospectus | 113
| | |
| APPLIES TO: | | TO SELL SOME OR ALL OF YOUR SHARES: |
| Selling Shares By Internet: www.astonfunds.com |
n Class N and Class I non-retirement accounts. | | n Complete the “Purchase, Exchange and Redemption Authorization” section of your account application. n Self-register online for account access at www.astonfunds.com. Your social security number or employer identification number, account number and other security validating information will be required for registration. n When you are ready to redeem a portion of your account, access your account through Aston Funds’ website and enter your redemption instructions in the secure area for shareholders only called “Shareholder Account Access.” A check for the proceeds will be mailed to you at your address of record. n Proceeds may also be sent by wire or ACH. Please see “Other Features” later in this “Shareholder Information” Section. |
The Funds or their agents will not be responsible for any unauthorized telephone or online order when reasonable procedures designed to verify the identity of the investor are followed.
Selling Shares in Writing
In certain circumstances, you must make your request to sell shares in writing. You may need to include a Medallion Signature Guarantee (which protects you against fraudulent orders) and additional items with your request, as described in the following Medallion Signature Guarantee section.
Medallion Signature Guarantees
| n | | We require Medallion Signature Guarantees if: |
| | n | | Your address of record has changed within the past 30 days; |
| | n | | You are selling more than $50,000 worth of shares (exceptions may apply for ASTON/Montag & Caldwell Growth Fund Class I and ASTON/Montag & Caldwell Balanced Fund Class I); or |
| | n | | You are requesting payment other than by a check mailed to the address of record and payable to the registered owner(s) or other than by wire or ACH sent to the bank account of the registered owner(s). |
Prospectus | 114
| n | | What is a Medallion Signature Guarantee? |
A Medallion Signature Guarantee verifies the authenticity of your signature and may be obtained from a domestic bank or trust company, broker, dealer, clearing agency, savings association or other financial institution that participates in a Medallion Program recognized by the Securities Transfer Association.
Medallion Signature Guarantees help ensure that major transactions or changes to your account are in fact authorized by you. For example, we require a Medallion Signature Guarantee on written redemption requests for more than $50,000. The three recognized Medallion Programs are Securities Transfer Agents Medallion Program (STAMP), Stock Exchanges Medallion Program (SEMP) and New York Stock Exchange, Inc. Medallion Signature Program (NYSE MSP). Signature guarantees from financial institutions that do not participate in one of these programs will not be accepted.
A notary public stamp or seal cannot be substituted for a Medallion Signature Guarantee.
| | |
| Seller | | Requirements for Written Requests |
| Owners of individual, joint, sole proprietorship, UGMA/UTMA, or general partner accounts | | n Letter of instruction n On the letter, the signatures and titles of all persons authorized to sign for the account, exactly as the account is registered, must be in original form, as photocopies are not accepted n Medallion Signature Guarantee, if applicable (see above) |
| Owners of corporate or association accounts | | n Letter of instruction n On the letter, the signatures and titles of all persons authorized to sign for the account, exactly as the account is registered, must be in original form, as photocopies are not accepted n Medallion Signature Guarantee, if applicable (see above) |
| Owners or trustees of trust accounts | | n Letter of instruction n On the letter, the signature of the trustee(s) must be in original form, as photocopies are not accepted n If the names of all trustees are not registered on the account, a copy of the trust document certified within the past 12 months n Medallion Signature Guarantee, if applicable (see above) |
| Joint tenancy shareholders whose co-tenants are deceased | | n Letter of instruction signed by the surviving tenant must be in original form, as photocopies are not accepted n Certified copy of death certificate n Medallion Signature Guarantee, if applicable (see above) |
| Executors of shareholder estates | | n Letter of instruction signed by executor must be in original form, as photocopies are not accepted n Certified copy of order appointing executor n Medallion Signature Guarantee, if applicable (see above) |
| Administrators, conservators, guardians and other sellers or account types not listed above | | n Call 800-992-8151 for instructions n Medallion Signature Guarantee, if applicable (see above) |
| IRA accounts | | n IRA distribution request form completed and signed. Call 800-992-8151 for a form, or download a form from our website, www.astonfunds.com. |
In addition to the situations described above, Aston Funds may require Medallion Signature Guarantees in other circumstances based on the amount of the redemption request or other factors.
Other Features
The following other features are also available to buy and sell shares of the Funds.
Wire. To purchase and sell shares via the Federal Reserve Wire System:
| n | | You must authorize Aston Funds to honor wire instructions before using this feature. Complete the appropriate section on the application when opening your account or call 800-992-8151 to add the feature after your account is opened. Call 800-992-8151 before your first use to verify that this feature is set up on your account. |
| n | | To sell shares by wire, you must designate the U.S. commercial bank account(s) into which you wish the redemption proceeds deposited. |
For accounts with existing wire instructions, wire redemptions may be placed over the phone. Consult your banking institution for any fees it may charge associated with wire transfers. Any changes made to existing wire instructions will only be accepted with a Medallion Signature Guaranteed letter of instruction.
Prospectus | 115
Automated Clearing House (ACH). To transfer money between your bank account and your Aston Funds account(s):
| n | | You must authorize Aston Funds to honor ACH instructions before using this feature. Complete the appropriate section on the application when opening your account or call 800-992-8151 to add the feature after your account is opened. Call 800-992-8151 before your first use to verify that this feature is set up on your account. |
| n | | Most transfers are completed within three business days of your call. ACH purchases will receive the NAV calculated on the day the money is received. |
| n | | There is no fee to your mutual fund account for this transaction. |
Redemptions in Kind
The Funds have elected, under Rule 18f-1 under the 1940 Act, to pay sales proceeds in cash up to $250,000 or 1% of each Fund’s total value, whichever is less, during any 90-day period to any one shareholder.
Larger redemptions may be detrimental to existing shareholders. While we intend to pay all sales proceeds in cash, we reserve the right to make higher payments to you in the form of certain marketable securities of a Fund. This is called “redemption in kind.” You may need to pay certain sales charges related to a redemption in kind, such as brokerage commissions, when you sell the securities. For shares that are not held in a tax-deferred account, redemptions in kind are taxable events for federal income tax purposes in the same manner as when the sales proceeds are paid in cash.
Involuntary Redemptions
To reduce expenses, we may convert your fund position(s), redeem your fund position(s) and/or close your fund position(s) if the balance in your fund position(s) falls below the required investment minimum due to transaction activity or for any other reason. We may convert your fund position(s) in Class I shares of a Fund to the respective Class N shares of that Fund, if applicable. Unless you did not meet the minimum initial investment, we will give you 30 days’ notice before we convert, redeem, or close your fund position(s). This gives you an opportunity to purchase enough shares to raise the value of your fund position(s) above the applicable minimum initial investment. We will not redeem or close Fund position(s) in IRAs, Education Savings Accounts, custodial accounts for minors, or active Automatic Investment Plans because they do not meet the applicable minimum investment requirement. We may close Fund position(s) in IRAs, Education Savings Accounts, custodial accounts for minors, or active Automatic Investment Plans due to insufficient information as it relates to customer identification procedures. If these account types are invested in Class I shares below the required minimum investment, we may convert the Fund position(s) to the Class N. Additionally, we will not convert Class I accounts where there is an effective “letter of intent.” Redemption fees will not be assessed on involuntary redemptions or involuntary conversions.
TRANSACTION POLICIES
Calculating Share Price
When you buy, exchange, or sell shares, the NAV next determined is used to price your purchase or sale. The NAV for each share class of a Fund is determined each business day at the close of regular trading on the NYSE (typically 4:00 p.m. ET) by dividing the net assets of the class by the number of shares outstanding. Currently, the Funds observe the following holidays: New Year’s Day, Martin Luther King, Jr. Day, Presidents’ Day, Good Friday, Memorial Day, Independence Day, Labor Day, Thanksgiving Day and Christmas Day. Generally, securities are priced using market quotes or, for debt securities, evaluated prices obtained from independent pricing services. If market quotations are not available or are deemed unreliable, securities are valued at fair value as determined by the Adviser in accordance with guidelines adopted and periodically reviewed by the Board of Trustees. These circumstances may arise, for instance, when trading in a security is suspended, the exchange or market on which a security is traded closes early, or the trading volume in a security is limited, calling into question the reliability of market quotations. In such a case, a Fund’s value for a security may be different from the last quoted market price. Fair value pricing for certain types of securities in which a Fund may invest, including prices received from pricing services, is inherently a process of estimates and judgments. Changes in the value of portfolio investments priced at fair value may be less frequent and of greater magnitude than changes in the price of securities that trade frequently in the market place, resulting in potentially greater net asset value volatility. In addition, due to the subjective and variable nature of fair value pricing, it is possible that the fair value determined for a particular security may be materially different from the value realized upon such security’s sale. Since 2008, certain segments of the mortgage-backed securities market, in particular, have been volatile and difficult to value.
Quotations of foreign securities denominated in foreign currency are converted to U.S. dollar equivalents using foreign exchange quotations received from independent dealers. Events affecting the values of portfolio securities that occur between the time when their prices are determined and the close of regular trading on the NYSE may not be reflected in the calculation of NAV. If events materially affecting the value of such securities occur during such period, then these securities may be valued at fair value as determined by the Adviser in accordance with guidelines adopted by the Aston Funds Board of Trustees.
Certain Funds may invest in certain securities which are primarily listed on foreign exchanges that trade on weekends and other days when a Fund does not price its shares. Therefore, the value of a Fund’s holdings may change on days when you will not be able to purchase or redeem its shares.
In addition, changes in values in the U.S. markets subsequent to the close of a foreign market may affect the values of securities traded in the foreign market. Under a Fund’s fair value pricing policies, the values of foreign securities may be adjusted from their last closing prices if such movements in the U.S. market exceed a specified threshold. As a result of the foregoing, it is possible that fair value prices will be used by a Fund to a significant extent. The Funds have retained an independent statistical fair value pricing service to assist in the fair valuation of securities principally traded in a foreign market in order to adjust for possible changes in value that may occur between the close of the foreign exchange and the time as of which Fund shares are priced.
Prospectus | 116
Execution of Requests
Each Fund is open on each business day that the NYSE is open for trading. The NYSE is not open on weekends or national holidays. Investment requests are executed at the NAV next calculated after Aston Funds or an authorized broker or designee receives your mail, telephone or Internet request in “good order.” Purchase orders and redemption requests for each Fund must be received by the close of regular trading on the NYSE (typically 4:00 p.m. ET) for same day processing. On days when the Federal Reserve Cash Settlement System closes earlier than normal, these times may be accelerated. Sales proceeds are normally sent the next business day, but are always sent within seven days of receipt of a request in “good order.” Brokers and their authorized designees are responsible for forwarding purchase orders and redemption requests to the Funds.
Shares of Aston Funds can also be purchased through broker-dealers, banks and trust departments that may charge you a transaction or other fee for their services. These fees are not charged if you purchase shares directly from Aston Funds.
A Fund may be required to “freeze” or redeem your account if there appears to be suspicious activity or if account information matches information on a government list of known terrorists or other suspicious persons.
Aston Funds reserves the right to:
| n | | Refuse any purchase or exchange of shares if it could adversely affect a Fund or its operations; |
| n | | Suspend the offering of Fund shares; |
| n | | Change the initial and additional investment minimums or waive these minimums for any investor; |
| n | | Delay sending you your sales proceeds for up to 15 days if you purchased shares by check. A charge of a minimum of $20 will be assessed if any check used to purchase shares is returned; and |
| n | | Change, withdraw or waive various services, fees and account policies. |
Customer Identification Program
Federal law requires Aston Funds to obtain, verify and record identifying information for each investor who opens or reopens an account with Aston Funds. An investor may be an individual or a person other than an individual (such as a corporation, partnership or trust). Such identifying information may include the name, residential or business street address, principal place of business, local office or other physical location (for a person other than an individual), date of birth (for an individual), social security or taxpayer identification number or other identifying information. Applications without the required information, or without any indication that a social security or taxpayer identification number has been applied for, may not be accepted. After acceptance, to the extent permitted by applicable law and its customer identification program, Aston Funds reserves the right (a) to place limits on transactions in any account until the identity of the investor is verified; or (b) to refuse an investment in Aston Funds or to involuntarily redeem an investor’s shares at the current share price and close an account in the event that an investor’s identity is not verified within 90 days, regardless of the type of account. This may cause shares in the investor’s account to be redeemed at a loss. You may be subject to taxes if Aston Funds liquidates your account due to insufficient information as it relates to customer identification procedures. Aston Funds and its agents will not be responsible for any loss or adverse tax effect in an investor’s account resulting from the investor’s delay in providing all required identifying information or from closing an account and redeeming an investor’s shares when an investor’s identity cannot be verified.
Short-Term and Excessive Trading
The Funds are designed for long-term investors. Each Fund discourages and does not knowingly accommodate short-term and excessive trading. Such trading increases brokerage and administrative costs, may result in increased taxable gains to remaining shareholders, and may disrupt portfolio management. For example, the Funds may be unable to effectively invest the proceeds from certain purchase or exchange requests under certain market conditions or may incur losses on the sale of investments. These risks may be more pronounced for Funds investing in securities that are more difficult to value or that are susceptible to pricing arbitrage (e.g., foreign securities, high yield securities and small-cap securities). Thus, such trading may negatively impact a Fund’s NAV and result in dilution to long-term shareholders.
In an effort to protect long-term shareholders, the Funds’ Board of Trustees has adopted policies and procedures that seek to deter short-term trading and excessive trading and to detect such trading activity at levels that may be detrimental to the Funds. These policies and procedures include the following:
| n | | Certain Funds have adopted a redemption fee of 2.00% for shares that are held less than 90 calendar days; |
| n | | The Funds have adopted certain fair valuation practices intended to protect the Funds from time zone arbitrage with respect to foreign securities and other trading practices that seek to exploit stale prices; and the Funds reserve the right to: |
| | n | | Reject any purchase, including exchange purchases, which could adversely affect the Funds or their operations. |
| | n | | Limit, terminate or otherwise modify the exchange privilege of any shareholder deemed to be engaged in activities that may be detrimental to the Funds. |
| | n | | Reject any purchase, including exchange purchases, from investors if there appears to be evidence of short-term or excessive trading. |
| | n | | Permanently prevent future purchases and exchanges from occurring in accounts where short-term or excessive trading is apparent. |
| | n | | Delay sending redemption proceeds for up to seven days (generally applies in cases of very large redemptions, excessive trading, or during unusual market conditions). |
| | n | | Suspend redemptions as permitted by law (e.g., in emergency situations). |
In making the determination to exercise these rights, the Funds may consider an investor’s trading history in the Funds and accounts under common ownership or control.
Prospectus | 117
The Funds seek to employ reasonable measures to detect short-term and excessive trading at levels that may be detrimental to the Funds. Accordingly, the Funds use certain materiality and volume thresholds in applying the policies and procedures, but otherwise seek to apply the policies and procedures uniformly to all shareholders. With respect to accounts held through intermediaries, such intermediaries generally are contractually obligated to provide the Funds with certain shareholder trading information. However, the Funds cannot directly control activity through all channels and are dependent on intermediaries to enforce the Funds’ policies and procedures. In certain cases, intermediaries may be unable to implement these policies or may not be able to implement policies and procedures in the same manner as the Funds due to system or other constraints. Shareholders who invest through omnibus accounts may be subject to policies and procedures that differ from those applied by the Funds to direct shareholders. The Funds reserve the right to limit an intermediary’s future access to the Funds, up to and including terminating the selling agreement with the intermediary. There is no assurance that the Funds’ policies and procedures will be effective in limiting and deterring short-term and excessive trading in all circumstances.
Redemption Fees
The following Funds assess a 2.00% fee on redemptions (including exchanges) of Fund shares sold or exchanged within 90 calendar days of purchase: ASTON/Barings International Fund and ASTON/Harrison Street Real Estate Fund.
Redemption fees are paid to the respective Fund to help offset transaction costs and to protect the Fund’s long-term shareholders. Each Fund will use the “first-in, first-out” (FIFO) method to determine the holding period. Under this method, the date of the redemption or exchange will be compared to the earliest purchase date of shares held in the account. If this holding period is less than the required holding period, the fee will be charged.
The Funds will notify intermediaries, such as broker-dealers or plan administrators, of the Funds’ policies and procedures and request the intermediaries to track and remit redemption fees to the Fund. However, due to limitations with system capabilities or for other reasons, certain broker-dealers, banks, plan administrators and other intermediaries may not track and collect redemption fees at this time, or their methods for tracking and calculating redemption fees may differ from those of the Funds. There is no assurance that the Funds’ redemption fee policies and procedures will be effective in limiting or deterring short-term and excessive trading in all circumstances. Redemption fees may not be assessed in certain circumstances, including the following: shares purchased through reinvested distributions; certain distributions required by law or due to shareholder hardship; redemptions through a Systematic Withdrawal Plan; redemption of shares through an Automatic Investment Plan; accounts held through intermediaries that are unable to assess redemption fees or do not report sufficient information to the Funds to impose a redemption fee (as discussed above); and circumstances where the Funds’ administrator believes it to be in the best interest of the Funds and in accordance with the Funds’ policies and procedures to waive the redemption fee on behalf of the Funds.
ACCOUNT POLICIES AND DIVIDENDS
Account Statements
In general, you will receive quarterly account statements. In addition, you will also receive account statements:
| n | | After every transaction that affects your account balance (except for dividend reinvestments, Automatic Investment Plans or Systematic Withdrawal Plans); and |
| n | | After any change of name or address of the registered owner(s). |
You will also receive an annual statement that describes the federal income tax characteristics of any dividends and distributions your Fund has paid to shareholders during the year.
Aston Funds may charge a fee for certain services, such as providing historical account documents.
Mailings to Shareholders
To help reduce Fund expenses and environmental waste, Aston Funds combines mailings for multiple accounts going to a single household by delivering Fund reports (annual and semi-annual reports, prospectuses, etc.) in a single envelope. If you do not want us to continue consolidating your Fund mailings and would prefer to receive separate mailings with multiple copies of Fund reports, please call one of our Investor Services Associates at 800-992-8151.
Distributions
The Funds distribute income dividends and net capital gains. Income dividends represent the earnings from a Fund’s investments less its expenses; capital gains generally occur when a Fund sells a portfolio security for more than the original purchase price.
Prospectus | 118
Dividends
The following table shows the Funds’ dividend and distribution schedules.
| | | | |
| | | Distribution Schedule | | |
| Funds | | Dividends, if any | | Capital Gains Distributions, if any |
ASTON/DoubleLine Core Plus Fixed Income Fund, ASTON/River Road Dividend All Cap Value Fund, ASTON/River Road Dividend All Cap Value Fund II and ASTON/TCH Fixed Income Fund | | n Declared and paid monthly | | n Distributed at least once a year, generally in December |
ASTON/Anchor Capital Enhanced Equity Fund and ASTON/Montag & Caldwell Balanced Fund | | n Declared and paid quarterly | | n Distributed at least once a year, generally in December |
All Other Funds | | n Declared and paid annually | | n Distributed at least once a year, generally in December |
Dividend Reinvestments
Investors may have their dividends and distributions reinvested in additional shares of the same Fund. If you choose this option, or if you do not indicate a choice, your dividends and distributions will be automatically reinvested on the dividend payable date. You can also choose to have a check for your dividends and distributions mailed to you by choosing this option on your account application.
Uncashed Checks
Checks should be cashed upon receipt, as interest will not be paid on uncashed checks. State escheat laws generally require Aston Funds to remit uncashed checks to the appropriate state after a specific period of time, which varies by state.
ADDITIONAL INVESTOR SERVICES
Automatic Investment Plan (Class N Shares only)
The Automatic Investment Plan (“AIP”) allows you to set up a scheduled transfer of funds from your bank account to the Fund(s) of your choice. You determine the AIP investment amount (the minimum AIP investment amount is $50) and you can terminate the program at any time. The minimum initial investment for accounts containing an AIP instruction is the same as all other accounts. To take advantage of this feature, complete the appropriate sections of the account application.
Aston Funds Website
Aston Funds maintains a website located at www.astonfunds.com. You can purchase, exchange and redeem shares and access information such as your account balance and the Funds’ NAVs through our website. Self-register for online account access at www.astonfunds.com. Your social security number or employee identification number, account number and other security validity information will be required for registration. You may also need to have bank account information, wire instructions, ACH instructions or other options established on your account.
Aston Funds has procedures in place to try to prevent unauthorized access to your account information. The Funds and their agents will not be responsible for any losses resulting from unauthorized transactions on our website.
Systematic Withdrawal Plan (Class N Shares only)
This plan may be used for periodic withdrawals (at least $50 by check or ACH) from your account. To take advantage of this feature you must:
| n | | Have at least $50,000 in your account; |
| n | | Determine the schedule: monthly, quarterly, semi-annually or annually; and |
| n | | Call 800-992-8151 to add a Systematic Withdrawal Plan to your account. |
Retirement Plans and Education Savings Accounts (Class N and Class R Shares, as applicable)
Aston Funds offer a range of retirement plans, including Traditional, Roth, SIMPLE IRAs and SEP IRAs for Class N and Class R shareholders. Aston Funds also offers Education Savings Accounts for Class N shareholders, which allow you to save for qualified elementary, secondary and higher education costs. Using these plans, you can invest in any Fund with a low minimum investment of $500. The annual maintenance fee for IRAs and Education Savings Accounts is $15 per account (not to exceed $30 per shareholder), but it is waived if you have $35,000 or more in assets. The fee is assessed every December for the current calendar year. To find out more, call Aston Funds at 800-992-8151.
DISTRIBUTION AND SERVICES PLAN 12b-1 FEES
To pay for the cost of promoting the Funds and servicing your shareholder account, the Funds have adopted a Rule 12b-1 plan for Class N and Class R shares. Under this plan, a Fund pays a fee at an annual rate of not more than 0.25% of each Fund’s Class N shares’ average daily net assets and 0.50% of Class R
Prospectus | 119
shares’ average daily net assets to the distributor for certain expenses associated with the distribution of Fund shares and administrative services provided to Fund shareholders. The fee is accrued daily and payable monthly. Over time, these fees may increase the cost of your investment and may cost more than paying other types of sales charges.
PAYMENTS TO INTERMEDIARIES
In addition to payments under a Rule 12b-1 plan, the Funds may bear costs associated with compensating intermediaries that perform sub-transfer agency, sub-accounting and/or shareholder services for Fund shareholder accounts. Aston may also compensate intermediaries that distribute and/or service investors in the Funds out of its own assets and not as an additional charge to the Funds. Additional payments to intermediaries may represent a premium over payments made by other fund families, and may create an added incentive for investment professionals to sell or recommend the Funds over other funds offered by competing fund families. The additional payments may differ for each Fund within the Aston family of funds, including within the same intermediary, and across intermediaries, or within the same Fund at the same intermediary.
In addition, representatives of the distributor may be compensated through Adviser incentive programs in a manner that favors one Aston Fund or group of Funds over another Aston Fund.
PORTFOLIO TRANSACTIONS AND BROKERAGE COMMISSIONS
The Subadvisers attempt to obtain the best possible price and most favorable execution of transactions in their portfolio securities. There may be times when a Subadviser may pay one broker-dealer a commission that is greater than the amount that another broker-dealer may charge for the same transaction. The Subadvisers generally determine in good faith if the commission paid was reasonable in relation to the brokerage or research services provided by the broker-dealer. In selecting and monitoring broker-dealers and negotiating commissions, the Subadvisers consider, among other factors, a broker-dealer’s reliability, availability of research, the quality of its execution services and its financial condition.
Prospectus | 120
Dividends, Distributions and Taxes
Dividends and Distributions
The Funds pay dividends and distribute capital gains at different intervals. All dividends and distributions are automatically reinvested at NAV unless you choose to receive them in a cash payment. You can change your payment options at any time by writing to us.
Taxes
Certain tax considerations may apply to your investment in an Aston Fund. The following is a general description of certain federal income tax considerations. Further information regarding the federal income tax consequences of investing in the Funds is included in the SAI. If you have any tax-related questions relating to your investment in an Aston Fund, please consult your tax adviser.
For federal income tax purposes:
| n | | Dividends and distributions on Class R shares will generally not be subject to current federal income taxation provided such shares are held in a qualified tax-deferred retirement plan. Distributions to you from a qualified tax-deferred retirement plan, however, will generally be subject to federal income tax and possibly federal withholding tax. In addition, backup withholding tax (see below) may apply to dividends, distributions and redemption proceeds received by a qualified tax-deferred retirement plan unless the required certification is provided to Aston Funds. To the extent Fund shares are not held in a qualified tax-deferred retirement plan, the following federal income tax consequences will generally apply. Please consult with your plan administrator regarding the tax status of your retirement plan. |
| n | | The tax treatment of dividends and distributions is the same whether you reinvest the dividends and distributions or elect to receive them in cash. We will send you a statement with the federal income tax status of your dividends and distributions for the prior year generally by February 15. |
| n | | Distributions of any net investment income, other than “qualified dividend income,” are taxable to you as ordinary income. |
| n | | Distributions of qualified dividend income (i.e., generally dividends received by a Fund from domestic corporations and certain foreign corporations) generally will be taxed to individuals and other non-corporate investors in the Funds at federal income tax rates applicable to long-term capital gains, provided you meet certain holding period and other requirements contained in the Code with respect to your Fund shares, and the Fund meets similar holding period and other requirements with respect to the dividend paying stock. Dividends received by a Fund from most REITs and certain foreign corporations are not expected to qualify for treatment as qualified dividend income when distributed by a Fund. Therefore, it is not expected that a significant amount of the ASTON/Harrison Street Real Estate Fund’s distributions will be eligible for qualified dividend income treatment. |
| n | | If a Fund receives dividends from another investment company that qualifies as a regulated investment company, including an ETF, for federal income tax purposes and the investment company designates such dividends as qualified dividend income, then the Fund may in turn designate that portion of its distributions derived from those dividends as qualified dividend income, provided the Fund meets certain holding period and other requirements with respect to the shares of the investment company. |
| n | | Distributions of net capital gain (net long-term capital gain less any net short-term capital loss) are taxable as long-term capital gain regardless of how long you may have held shares of a Fund. In contrast, distributions of net short-term capital gain (net short-term capital gain less any net long-term capital loss) are taxable as ordinary income regardless of how long you may have held shares of a Fund. Because distributions of net short-term capital gain are taxable as ordinary income, you generally cannot offset net short-term capital gain distributions you receive from a Fund with capital losses. |
| n | | A Fund’s use of a fund-of-funds structure could affect the amount, timing and type of distributions from the Fund and, therefore, may increase the amount of taxes payable by you. Generally, the character of the dividends and distributions a Fund receives from another investment company will “pass through” to you, subject to certain exceptions, as long as the Fund and the investment company each qualify as a regulated investment company under the Code. |
| n | | Some of a Fund’s investments may be subject to special provisions of the Code that may increase the amount of gain recognized by the Fund, defer the Fund’s losses, accelerate the Fund’s recognition of gain, affect the character of such income and affect the amount, timing and type of distributions from the Fund, which may increase the amount of taxes payable by you. |
| n | | Distributions declared to the shareholders of record in October, November or December and paid on or before January 31 of the succeeding year will be treated for federal income tax purposes as if received by shareholders on December 31 of the year in which the distribution was declared. |
| n | | When you sell shares or exchange shares for shares of another Fund (other than shares held in a tax-deferred account), it generally is considered a taxable event for you. Depending on the purchase price and the sale price of the shares you sell or exchange, you may have a gain or a loss on the transaction. The gain or loss will generally be treated as a long-term capital gain or loss if you held your shares for more than one year. If you held your shares for one year or less, the gain or loss will generally be treated as a short-term capital gain or loss. You are responsible for any tax liabilities generated by your transactions. |
| n | | If you do not provide Aston Funds with your complete and correct taxpayer identification number and required certification, or if the Internal Revenue Service so notifies us, you may be subject to backup withholding tax on dividends, distributions and redemption proceeds. |
| n | | If you purchase shares of a Fund just before a dividend or distribution, you will pay the full price for the shares and receive a portion of the purchase price back as a taxable distribution. This is referred to as “buying a dividend.” |
Prospectus | 121
| n | | If a Fund qualifies (by having more than 50% of the value of its total assets at the close of the taxable year consist of stock or securities in foreign corporations or by being a qualified fund of funds) and elects to pass through foreign taxes paid on its investments during the year, such taxes will be reported to you as income. You may, however, be able to claim an offsetting tax credit or deduction on your federal income tax return, depending on your particular circumstances and provided you meet certain holding period and other requirements. Tax-exempt holders of Fund shares, such as qualified tax-deferred retirement plans, will not benefit from such a deduction or credit. |
| n | | A Fund’s ability to invest in some investments, including certain ETFs that invest in the commodities market and commodity-linked instruments, may be significantly limited by the federal income tax rules applicable to regulated investment companies. |
| n | | Tax reporting changes effective January 1, 2012 require Aston Funds to report cost basis and holding period information to both the Internal Revenue Service and shareholders for gross proceeds from the sales of shares of Aston Funds purchased on or after January 1, 2012. This information will be reported on Form 1099-B. The deadline for mailing Form 1099-B to shareholders is February 15. Absent shareholder instructions, Aston Funds will calculate and report cost basis information using its default method of average cost. If you hold shares of Aston Funds through a financial intermediary, the financial intermediary will be responsible for this reporting and the financial intermediary’s default cost basis method may apply. Please consult your tax adviser for additional information regarding cost basis reporting and your situation. |
Prospectus | 122
Financial Highlights
These financial highlights tables are intended to help you understand the Funds’ financial performance. The following schedules present financial highlights for one outstanding share of each Fund throughout the periods indicated. The total returns in the tables represent the rate that an investor would have earned or lost on an investment in a Fund (assuming reinvestment of all dividends and distributions). This information has been derived from the Funds’ financial statements as of October 31, 2012. The financial statements for the Funds have been audited by Ernst & Young LLP, whose report, along with those Funds’ financial statements, is included in the Funds’ annual report, which is available upon request.
| | | | | | | | | | | | | | | | | | | | |
| ASTON/Montag & Caldwell Growth Fund – Class N Year Ended October 31, | | 2012 | | | 2011 | | | 2010 | | | 2009 | | | 2008 | |
Per Share Operating Data: | | | | | | | | | | | | | | | | | | | | |
Net Asset Value, Beginning of Period | | | $24.72 | | | | $22.92 | | | | $20.87 | | | | $18.84 | | | | $31.51 | |
Income from Investment Operations: | | | | | | | | | | | | | | | | | | | | |
Net investment income(a) | | | 0.15 | | | | 0.14 | | | | 0.12 | | | | 0.08 | | | | 0.07 | |
Net realized and unrealized gain (loss) on investments | | | 2.45 | | | | 1.83 | | | | 2.01 | (b) | | | 2.61 | | | | (8.66 | ) |
| | | | | | | | |
Total from investment operations | | | 2.60 | | | | 1.97 | | | | 2.13 | | | | 2.69 | | | | (8.59 | ) |
Less Distributions: | | | | | | | | | | | | | | | | | | | | |
Distributions from and in excess of net investment income | | | (0.13 | ) | | | (0.13 | ) | | | (0.08 | ) | | | (0.06 | ) | | | (0.05 | ) |
Distributions from net realized gain on investments | | | (1.88 | ) | | | (0.04 | ) | | | — | | | | (0.60 | ) | | | (4.03 | ) |
| | | | | | | | |
Total distributions | | | (2.01 | ) | | | (0.17 | ) | | | (0.08 | ) | | | (0.66 | ) | | | (4.08 | ) |
Net increase (decrease) in net asset value | | | 0.59 | | | | 1.80 | | | | 2.05 | | | | 2.03 | | | | (12.67 | ) |
Net Asset Value, End of Period | | | $25.31 | | | | $24.72 | | | | $22.92 | | | | $20.87 | | | | $18.84 | |
Total Return(c) | | | 11.40 | % | | | 8.56 | % | | | 10.20 | % | | | 15.08 | % | | | (31.13 | )% |
| | | | | | | | | | | | | | | | | | | | |
Ratios/Supplemental Data: | | | | | | | | | | | | | | | | | | | | |
Net Assets, End of Period (in 000’s) | | | $1,908,663 | | | | $1,683,183 | | | | $1,506,075 | | | | $1,277,346 | | | | $602,905 | |
Ratios of expenses to average net assets: | | | | | | | | | | | | | | | | | | | | |
Before reimbursement and/or waiver of expenses by Adviser | | | 1.05 | % | | | 1.06 | % | | | 1.08 | %(d) | | | 1.11 | % | | | 1.08 | %(d) |
After reimbursement and/or waiver of expenses by Adviser | | | 1.05 | % | | | 1.06 | % | | | 1.08 | %(d) | | | 1.11 | % | | | 1.08 | %(d) |
Ratios of net investment income to average net assets: | | | | | | | | | | | | | | | | | | | | |
Before reimbursement and/or waiver of expenses by Adviser | | | 0.60 | % | | | 0.59 | % | | | 0.56 | % | | | 0.41 | % | | | 0.26 | % |
After reimbursement and/or waiver of expenses by Adviser | | | 0.60 | % | | | 0.59 | % | | | 0.56 | % | | | 0.41 | % | | | 0.26 | % |
Portfolio Turnover | | | 46.42 | % | | | 63.48 | % | | | 57.39 | %(e) | | | 35.09 | %(f) | | | 52.32 | % |
| | (a) | The selected per share data was calculated using the weighted average shares outstanding method for the period. |
| | (b) | Includes payments by affiliates which is less than $0.005 per share. |
| | (c) | The total return is calculated using the Net Asset Values used for trading at the close of business at period end. |
| | (d) | Ratios of expenses to average net assets include interest expense of less than 0.005% for the years ended October 31, 2010 and October 31, 2008. The interest expense is from utilizing the line of credit. |
| | (e) | Portfolio turnover rate excludes securities received from a reorganization. |
| | (f) | Portfolio turnover rate excludes securities received from processing a subscription-in-kind. |
Prospectus | 123
| | | | | | | | | | | | | | | | | | | | |
| ASTON/Montag & Caldwell Growth Fund – Class I Year Ended October 31, | | 2012 | | | 2011 | | | 2010 | | | 2009 | | | 2008 | |
Per Share Operating Data: | | | | | | | | | | | | | | | | | | | | |
Net Asset Value, Beginning of Period | | | $24.85 | | | | $23.05 | | | | $20.97 | | | | $18.94 | | | | $31.61 | |
Income from Investment Operations: | | | | | | | | | | | | | | | | | | | | |
Net investment income(a) | | | 0.21 | | | | 0.21 | | | | 0.18 | | | | 0.12 | | | | 0.13 | |
Net realized and unrealized gain (loss) on investments | | | 2.47 | | | | 1.82 | | | | 2.02 | (b) | | | 2.62 | | | | (8.70 | ) |
| | | | | | | | |
Total from investment operations | | | 2.68 | | | | 2.03 | | | | 2.20 | | | | 2.74 | | | | (8.57 | ) |
Less Distributions: | | | | | | | | | | | | | | | | | | | | |
Distributions from and in excess of net investment income | | | (0.19 | ) | | | (0.19 | ) | | | (0.12 | ) | | | (0.11 | ) | | | (0.07 | ) |
Distributions from net realized gain on investments | | | (1.88 | ) | | | (0.04 | ) | | | — | | | | (0.60 | ) | | | (4.03 | ) |
| | | | | | | | |
Total distributions | | | (2.07 | ) | | | (0.23 | ) | | | (0.12 | ) | | | (0.71 | ) | | | (4.10 | ) |
Net increase (decrease) in net asset value | | | 0.61 | | | | 1.80 | | | | 2.08 | | | | 2.03 | | | | (12.67 | ) |
Net Asset Value, End of Period | | | $25.46 | | | | $24.85 | | | | $23.05 | | | | $20.97 | | | | $18.94 | |
Total Return(d) | | | 11.67 | % | | | 8.82 | % | | | 10.49 | % | | | 15.36 | % | | | (30.96 | )% |
| | | | | | | | | | | | | | | | | | | | |
Ratios/Supplemental Data: | | | | | | | | | | | | | | | | | | | | |
Net Assets, End of Period (in 000’s) | | | $2,406,145 | | | | $1,749,183 | | | | $1,528,981 | | | | $1,205,637 | | | | $754,671 | |
Ratios of expenses to average net assets: | | | | | | | | | | | | | | | | | | | | |
Before reimbursement and/or waiver of expenses by Adviser | | | 0.80 | % | | | 0.81 | % | | | 0.83 | %(e) | | | 0.86 | % | | | 0.83 | %(e) |
After reimbursement and/or waiver of expenses by Adviser | | | 0.80 | % | | | 0.81 | % | | | 0.83 | %(e) | | | 0.86 | % | | | 0.83 | %(e) |
Ratios of net investment income to average net assets: | | | | | | | | | | | | | | | | | | | | |
Before reimbursement and/or waiver of expenses by Adviser | | | 0.85 | % | | | 0.84 | % | | | 0.81 | % | | | 0.66 | % | | | 0.51 | % |
After reimbursement and/or waiver of expenses by Adviser | | | 0.85 | % | | | 0.84 | % | | | 0.81 | % | | | 0.66 | % | | | 0.51 | % |
Portfolio Turnover | | | 46.42 | % | | | 63.48 | % | | | 57.39 | %(f) | | | 35.09 | %(g) | | | 52.32 | % |
| | | | | |
| ASTON/Montag & Caldwell Growth Fund – Class R Year Ended October 31, | | 2012 | | | 2011 | | | 2010 | | | 2009 | | | 2008 | |
Per Share Operating Data: | | | | | | | | | | | | | | | | | | | | |
Net Asset Value, Beginning of Period | | | $24.45 | | | | $22.70 | | | | $20.73 | | | | $18.69 | | | | $31.33 | |
Income from Investment Operations: | | | | | | | | | | | | | | | | | | | | |
Net investment income(a) | | | 0.09 | | | | 0.08 | | | | 0.07 | | | | 0.03 | | | | — | (c) |
Net realized and unrealized gain (loss) on investments | | | 2.43 | | | | 1.80 | | | | 1.98 | (b) | | | 2.61 | | | | (8.58 | ) |
| | | | | | | | |
Total from investment operations | | | 2.52 | | | | 1.88 | | | | 2.05 | | | | 2.64 | | | | (8.58 | ) |
Less Distributions: | | | | | | | | | | | | | | | | | | | | |
Distributions from and in excess of net investment income | | | (0.07 | ) | | | (0.09 | ) | | | (0.08 | ) | | | — | | | | (0.03 | ) |
Distributions from net realized gain on investments | | | (1.88 | ) | | | (0.04 | ) | | | — | | | | (0.60 | ) | | | (4.03 | ) |
| | | | | | | | |
Total distributions | | | (1.95 | ) | | | (0.13 | ) | | | (0.08 | ) | | | (0.60 | ) | | | (4.06 | ) |
Net increase (decrease) in net asset value | | | 0.57 | | | | 1.75 | | | | 1.97 | | | | 2.04 | | | | (12.64 | ) |
Net Asset Value, End of Period | | | $25.02 | | | | $24.45 | | | | $22.70 | | | | $20.73 | | | | $18.69 | |
Total Return(d) | | | 11.10 | % | | | 8.29 | % | | | 9.90 | % | | | 14.87 | % | | | (31.28 | )% |
| | | | | | | | | | | | | | | | | | | | |
Ratios/Supplemental Data: | | | | | | | | | | | | | | | | | | | | |
Net Assets, End of Period (in 000’s) | | | $8,771 | | | | $8,654 | | | | $7,292 | | | | $3,840 | | | | $266 | |
Ratios of expenses to average net assets: | | | | | | | | | | | | | | | | | | | | |
Before reimbursement and/or waiver of expenses by Adviser | | | 1.30 | % | | | 1.31 | % | | | 1.33 | %(e) | | | 1.36 | % | | | 1.33 | %(e) |
After reimbursement and/or waiver of expenses by Adviser | | | 1.30 | % | | | 1.31 | % | | | 1.33 | %(e) | | | 1.36 | % | | | 1.33 | %(e) |
Ratios of net investment income to average net assets: | | | | | | | | | | | | | | | | | | | | |
Before reimbursement and/or waiver of expenses by Adviser | | | 0.35 | % | | | 0.34 | % | | | 0.31 | % | | | 0.16 | % | | | 0.01 | % |
After reimbursement and/or waiver of expenses by Adviser | | | 0.35 | % | | | 0.34 | % | | | 0.31 | % | | | 0.16 | % | | | 0.01 | % |
Portfolio Turnover | | | 46.42 | % | | | 63.48 | % | | | 57.39 | %(f) | | | 35.09 | %(g) | | | 52.32 | % |
| | (a) | The selected per share data was calculated using the weighted average shares outstanding method for the period. |
| | (b) | Includes payments by affiliates which is less than $0.005 per share. |
| | (c) | Represents less than $0.005 per share. |
| | (d) | The total return is calculated using the Net Asset Values used for trading at the close of business at period end. |
| | (e) | Ratios of expenses to average net assets include interest expense of less than 0.005% for the years ended October 31, 2010 and October 31, 2008. The interest expense is from utilizing the line of credit. |
| | (f) | Portfolio turnover rate excludes securities received from a reorganization. |
| | (g) | Portfolio turnover rate excludes securities received from processing a subscription-in-kind. |
Prospectus | 124
| | | | | | | | | | | | |
| ASTON/Herndon Large Cap Value Fund – Class N Year Ended October 31, | | 2012 | | | 2011 | | | 2010(a) | |
Per Share Operating Data: | | | | | | | | | | | | |
Net Asset Value, Beginning of Period | | | $11.31 | | | | $10.39 | | | | $10.00 | |
Income from Investment Operations: | | | | | | | | | | | | |
Net investment income | | | 0.18 | (b) | | | 0.12 | (b) | | | 0.03 | |
Net realized and unrealized gain on investments | | | 0.91 | | | | 0.81 | | | | 0.36 | |
| | | | | | | | |
Total from investment operations | | | 1.09 | | | | 0.93 | | | | 0.39 | |
Less Distributions: | | | | | | | | | | | | |
Distributions from and in excess of net investment income | | | (0.11 | ) | | | (0.01 | ) | | | — | |
Distributions from net realized gain on investments | | | (0.56 | ) | | | — | | | | — | |
| | | | | | | | |
Total distributions | | | (0.67 | ) | | | (0.01 | ) | | | — | |
Net increase in net asset value | | | 0.42 | | | | 0.92 | | | | 0.39 | |
Net Asset Value, End of Period | | | $11.73 | | | | $11.31 | | | | $10.39 | |
Total Return(c) | | | 10.39 | % | | | 9.09 | % | | | 3.90 | %(d) |
| | | | | | | | | | | | |
Ratios/Supplemental Data: | | | | | | | | | | | | |
Net Assets, End of Period (in 000’s) | | | $20,832 | | | | $6,089 | | | | $1,472 | |
Ratios of expenses to average net assets: | | | | | | | | | | | | |
Before reimbursement and/or waiver of expenses by Adviser | | | 1.41 | % | | | 2.38 | % | | | 13.84 | %(e) |
After reimbursement and/or waiver of expenses by Adviser | | | 1.30 | % | | | 1.30 | % | | | 1.30 | %(e) |
Ratios of net investment income (loss) to average net assets: | | | | | | | | | | | | |
Before reimbursement and/or waiver of expenses by Adviser | | | 1.44 | % | | | (0.05 | )% | | | (11.94 | )%(e) |
After reimbursement and/or waiver of expenses by Adviser | | | 1.55 | % | | | 1.03 | % | | | 0.60 | %(e) |
Portfolio Turnover | | | 80.56 | % | | | 189.70 | % | | | 38.64 | %(d) |
| | | |
| ASTON/Herndon Large Cap Value Fund – Class I Year Ended October 31, | | | | | 2012 | | | 2011(f) | |
Per Share Operating Data: | | | | | | | | | | | | |
Net Asset Value, Beginning of Period | | | | | | | $11.33 | | | | $11.48 | |
Income from Investment Operations: | | | | | | | | | | | | |
Net investment income | | | | | | | 0.21 | (b) | | | 0.10 | (b) |
Net realized and unrealized gain on investments | | | | | | | 0.91 | | | | (0.25 | ) |
| | | | | | | | | | | | |
Total from investment operations | | | | | | | 1.12 | | | | (0.15 | ) |
Less Distributions: | | | | | | | | | | | | |
Distributions from and in excess of net investment income | | | | | | | (0.14 | ) | | | — | |
Distributions from net realized gain on investments | | | | | | | (0.56 | ) | | | — | |
| | | | | | | | | | | | |
Total distributions | | | | | | | (0.70 | ) | | | — | |
Net increase in net asset value | | | | | | | 0.42 | | | | (0.15 | ) |
Net Asset Value, End of Period | | | | | | | $11.75 | | | | $11.33 | |
Total Return(c) | | | | | | | 10.69 | % | | | (1.31 | )%(d) |
| | | | | | | | | | | | |
Ratios/Supplemental Data: | | | | | | | | | | | | |
Net Assets, End of Period (in 000’s) | | | | | | | $34,575 | | | | $11,881 | |
Ratios of expenses to average net assets: | | | | | | | | | | | | |
Before reimbursement and/or waiver of expenses by Adviser | | | | | | | 1.16 | % | | | 2.13 | %(e) |
After reimbursement and/or waiver of expenses by Adviser | | | | | | | 1.05 | % | | | 1.05 | %(e) |
Ratios of net investment income (loss) to average net assets: | | | | | | | | | | | | |
Before reimbursement and/or waiver of expenses by Adviser | | | | | | | 1.69 | % | | | 0.20 | %(e) |
After reimbursement and/or waiver of expenses by Adviser | | | | | | | 1.80 | % | | | 1.28 | %(e) |
Portfolio Turnover | | | | | | | 80.56 | % | | | 189.70 | %(d) |
| | (a) | ASTON/Herndon Large Cap Value Fund began issuing Class N shares on March 30, 2010. |
| | (b) | The selected per share data was calculated using the weighted average shares outstanding method for the period. |
| | (c) | The total return is calculated using the Net Asset Values used for trading at the close of business at period end. |
| | (f) | ASTON/Herndon Large Cap Value Fund began issuing Class I shares on March 1, 2011. |
Prospectus | 125
| | | | | | | | | | | | | | | | | | | | |
| ASTON/Cornerstone Large Cap Value Fund – Class N Year Ended October 31, | | 2012 | | | 2011 | | | 2010 | | | 2009 | | | 2008 | |
Per Share Operating Data: | | | | | | | | | | | | | | | | | | | | |
Net Asset Value, Beginning of Period | | | $10.04 | | | | $9.20 | | | | $8.31 | | | | $9.07 | | | | $15.57 | |
Income from Investment Operations: | | | | | | | | | | | | | | | | | | | | |
Net investment income | | | 0.10 | (a) | | | 0.12 | (a) | | | 0.13 | | | | 0.15 | | | | 0.15 | |
Net realized and unrealized gain (loss) on investments | | | 0.94 | | | | 0.83 | | | | 0.89 | | | | 0.41 | | | | (5.08 | ) |
| | | | |
Total from investment operations | | | 1.04 | | | | 0.95 | | | | 1.02 | | | | 0.56 | | | | (4.93 | ) |
Less Distributions: | | | | | | | | | | | | | | | | | | | | |
Distributions from and in excess of net investment income | | | (0.04 | ) | | | (0.11 | ) | | | (0.13 | ) | | | (0.15 | ) | | | (0.16 | ) |
Distributions from net realized gain on investments | | | — | | | | — | | | | — | | | | (1.17 | ) | | | (1.41 | ) |
| | | | |
Total distributions | | | (0.04 | ) | | | (0.11 | ) | | | (0.13 | ) | | | (1.32 | ) | | | (1.57 | ) |
Net increase (decrease) in net asset value | | | 1.00 | | | | 0.84 | | | | 0.89 | | | | (0.76 | ) | | | (6.50 | ) |
Net Asset Value, End of Period | | | $11.04 | | | | $10.04 | | | | $9.20 | | | | $8.31 | | | | $9.07 | |
Total Return(b) | | | 10.43 | % | | | 10.44 | % | | | 12.37 | % | | | 8.60 | % | | | (34.85 | )% |
| | | | | | | | | | | | | | | | | | | | |
Ratios/Supplemental Data: | | | | | | | | | | | | | | | | | | | | |
Net Assets, End of Period (in 000’s) | | | $21,105 | | | | $24,631 | | | | $19,984 | | | | $20,173 | | | | $19,704 | |
Ratios of expenses to average net assets: | | | | | | | | | | | | | | | | | | | | |
Before reimbursement and/or waiver of expenses by Adviser | | | 1.58 | % | | | 1.61 | % | | | 1.19 | %(c) | | | 1.21 | % | | | 1.18 | %(c) |
After reimbursement and/or waiver of expenses by Adviser | | | 1.26 | %(d) | | | 1.14 | %(d) | | | 1.07 | %(c) | | | 1.07 | %(e) | | | 1.02 | %(c) |
Ratios of net investment income to average net assets: | | | | | | | | | | | | | | | | | | | | |
Before reimbursement and/or waiver of expenses by Adviser | | | 0.60 | % | | | 0.80 | % | | | 1.32 | % | | | 1.77 | % | | | 1.22 | % |
After reimbursement and/or waiver of expenses by Adviser | | | 0.92 | % | | | 1.27 | % | | | 1.44 | % | | | 1.91 | % | | | 1.38 | % |
Portfolio Turnover | | | 58.21 | % | | | 59.07 | %(f) | | | 37.44 | % | | | 39.00 | % | | | 67.57 | % |
| | | | | | | | | | | | | | | | | | | | |
| ASTON/Cornerstone Large Cap Value Fund – Class I Year Ended October 31, | | 2012 | | | 2011 | | | 2010 | | | 2009 | | | 2008 | |
Per Share Operating Data: | | | | | | | | | | | | | | | | | | | | |
Net Asset Value, Beginning of Period | | | $10.05 | | | | $9.19 | | | | $8.31 | | | | $9.06 | | | | $15.57 | |
Income from Investment Operations: | | | | | | | | | | | | | | | | | | | | |
Net investment income | | | 0.11 | (a) | | | 0.16 | (a) | | | 0.15 | | | | 0.17 | | | | 0.20 | |
Net realized and unrealized gain (loss) on investments | | | 0.96 | | | | 0.84 | | | | 0.88 | | | | 0.42 | | | | (5.10 | ) |
| | | | | | | | |
Total from investment operations | | | 1.07 | | | | 1.00 | | | | 1.03 | | | | 0.59 | | | | (4.90 | ) |
Less Distributions: | | | | | | | | | | | | | | | | | | | | |
Distributions from and in excess of net investment income | | | (0.05 | ) | | | (0.14 | ) | | | (0.15 | ) | | | (0.17 | ) | | | (0.20 | ) |
Distributions from net realized gain on investments | | | — | | | | — | | | | — | | | | (1.17 | ) | | | (1.41 | ) |
| | | | | | | | |
Total distributions | | | (0.05 | ) | | | (0.14 | ) | | | (0.15 | ) | | | (1.34 | ) | | | (1.61 | ) |
Net increase (decrease) in net asset value | | | 1.02 | | | | 0.86 | | | | 0.88 | | | | (0.75 | ) | | | (6.51 | ) |
Net Asset Value, End of Period | | | $11.07 | | | | $10.05 | | | | $9.19 | | | | $8.31 | | | | $9.06 | |
Total Return(b) | | | 10.66 | % | | | 10.95 | % | | | 12.53 | % | | | 9.01 | % | | | (34.73 | )% |
| | | | | | | | | | | | | | | | | | | | |
Ratios/Supplemental Data: | | | | | | | | | | | | | | | | | | | | |
Net Assets, End of Period (in 000’s) | | | $5,397 | | | | $126 | | | | $204,051 | | | | $205,580 | | | | $188,688 | |
Ratios of expenses to average net assets: | | | | | | | | | | | | | | | | | | | | |
Before reimbursement and/or waiver of expenses by Adviser | | | 1.33 | % | | | 1.36 | % | | | 0.94 | %(c) | | | 0.96 | % | | | 0.93 | %(c) |
After reimbursement and/or waiver of expenses by Adviser | | | 1.01 | %(g) | | | 0.89 | %(g) | | | 0.82 | %(c) | | | 0.82 | %(h) | | | 0.77 | %(c) |
Ratios of net investment income to average net assets: | | | | | | | | | | | | | | | | | | | | |
Before reimbursement and/or waiver of expenses by Adviser | | | 0.85 | % | | | 1.05 | % | | | 1.57 | % | | | 2.02 | % | | | 1.47 | % |
After reimbursement and/or waiver of expenses by Adviser | | | 1.17 | % | | | 1.52 | % | | | 1.69 | % | | | 2.16 | % | | | 1.63 | % |
Portfolio Turnover | | | 58.21 | % | | | 59.07 | %(f) | | | 37.44 | % | | | 39.00 | % | | | 67.57 | % |
| | (a) | The selected per share data was calculated using the weighted average shares outstanding method for the period. |
| | (b) | The total return is calculated using the Net Asset Values used for trading at the close of business at period end. |
| | (c) | Ratios of expenses to average net assets include interest expense of less than 0.005% for the years ended October 31, 2010 and October 31, 2008, which is not included in the contractual expense limitation. The interest expense is from utilizing the line of credit. |
| | (d) | Effective March 22, 2011, the Adviser changed the voluntary expense limitation from 1.07% to 1.19%. Subsequently on February 29, 2012, the Adviser removed the voluntary expense limitation and replaced it with a contractual expense limitaion of 1.30%. |
| | (e) | The contractual expense limitation of 1.07%, which excludes interest, taxes, other investment-related costs (such as brokerage commissions), extraordinary expenses and acquired fund fees and expenses, was removed by the Adviser and replaced with a voluntary expense limitation of 1.07% effective March 1, 2009. Voluntary expense waivers can end at any time. |
| | (f) | Portfolio turnover rate excludes securities delivered from processing a redemption-in-kind. |
| | (g) | Effective March 22, 2011, the Adviser changed the voluntary expense limitation from 0.82% to 0.94%. Subsequently on February 29, 2012, the Adviser removed the voluntary expense limitation and replaced it with a contractual expense limitation of 1.05%. |
| | (h) | The contractual expense limitation of 0.82%, which excludes interest, taxes, other investment-related costs (such as brokerage commissions), extraordinary expenses and acquired fund fees and expenses, was removed by the Adviser and replaced with a voluntary expense limitation of 0.82% effective March 1, 2009. Voluntary expense waivers can end at any time. |
Prospectus | 126
| | | | | | | | | | | | | | | | | | | | |
| ASTON/TAMRO Diversified Equity Fund – Class N Year Ended October 31, | | 2012 | | | 2011 | | | 2010 | | | 2009 | | | 2008 | |
Per Share Operating Data: | | | | | | | | | | | | | | | | | | | | |
Net Asset Value, Beginning of Period | | | $12.34 | | | | $11.83 | | | | $9.72 | | | | $8.34 | | | | $14.41 | |
Income from Investment Operations: | | | | | | | | | | | | | | | | | | | | |
Net investment income (loss) | | | — | (a) | | | (0.02 | ) | | | — | (a) | | | — | (a) | | | 0.04 | |
Net realized and unrealized gain (loss) on investments | | | 1.44 | | | | 0.53 | | | | 2.13 | | | | 1.42 | | | | (4.94 | ) |
| | | | | | | | |
Total from investment operations | | | 1.44 | | | | 0.51 | | | | 2.13 | | | | 1.42 | | | | (4.90 | ) |
Less Distributions: | | | | | | | | | | | | | | | | | | | | |
Distributions from and in excess of net investment income | | | — | | | | — | | | | (0.02 | ) | | | (0.04 | ) | | | (0.01 | ) |
Distributions from net realized gain on investments | | | (0.26 | ) | | | — | | | | — | | | | — | | | | (1.16 | ) |
| | | | | | | | |
Total distributions | | | (0.26 | ) | | | — | | | | (0.02 | ) | | | (0.04 | ) | | | (1.17 | ) |
Net increase (decrease) in net asset value | | | 1.18 | | | | 0.51 | | | | 2.11 | | | | 1.38 | | | | (6.07 | ) |
Net Asset Value, End of Period | | | $13.52 | | | | $12.34 | | | | $11.83 | | | | $9.72 | | | | $8.34 | |
Total Return(b) | | | 11.94 | % | | | 4.31 | % | | | 21.95 | % | | | 17.13 | % | | | (36.75 | )% |
| | | | | | | | | | | | | | | | | | | | |
Ratios/Supplemental Data: | | | | | | | | | | | | | | | | | | | | |
Net Assets, End of Period (in 000’s) | | | $21,980 | | | | $24,354 | | | | $15,670 | | | | $10,486 | | | | $8,562 | |
Ratios of expenses to average net assets: | | | | | | | | | | | | | | | | | | | | |
Before reimbursement and/or waiver of expenses by Adviser | | | 1.68 | %(c) | | | 1.62 | %(c) | | | 1.63 | % | | | 1.95 | % | | | 1.88 | % |
After reimbursement and/or waiver of expenses by Adviser | | | 1.20 | %(c) | | | 1.20 | %(c) | | | 1.20 | % | | | 1.20 | % | | | 1.20 | % |
Ratios of net investment income (loss) to average net assets: | | | | | | | | | | | | | | | | | | | | |
Before reimbursement and/or waiver of expenses by Adviser | | | (0.47 | )% | | | (0.63 | )% | | | (0.45 | )% | | | (0.77 | )% | | | (0.37 | )% |
After reimbursement and/or waiver of expenses by Adviser | | | — | %(a) | | | (0.21 | )% | | | (0.02 | )% | | | (0.02 | )% | | | 0.31 | % |
Portfolio Turnover | | | 52.56 | % | | | 65.96 | % | | | 81.75 | % | | | 85.49 | % | | | 93.82 | % |
| | | | | |
| ASTON/TAMRO Diversified Equity Fund – Class I Year Ended October 31, | | | | | | | | | | | | | | 2012(d) | |
Per Share Operating Data: | | | | | | | | | | | | | | | | | | | | |
Net Asset Value, Beginning of Period | | | | | | | | | | | | | | | | | | | $13.27 | |
Income from Investment Operations: | | | | | | | | | | | | | | | | | | | | |
Net investment loss | | | | | | | | | | | | | | | | | | | (0.05 | ) |
Net realized and unrealized gain on investments | | | | | | | | | | | | | | | | | | | 0.33 | |
Total from investment operations | | | | | | | | | | | | | | | | | | | 0.28 | |
Net increase in net asset value | | | | | | | | | | | | | | | | | | | 0.28 | |
Net Asset Value, End of Period | | | | | | | | | | | | | | | | | | | $13.55 | |
Total Return(b) | | | | | | | | | | | | | | | | | | | 2.04 | %(e) |
| | | | | | | | | | | | | | | | | | | | |
Ratios/Supplemental Data: | | | | | | | | | | | | | | | | | | | | |
Net Assets, End of Period (in 000’s) | | | | | | | | | | | | | | | | | | | $569 | |
Ratios of expenses to average net assets: | | | | | | | | | | | | | | | | | | | | |
Before reimbursement and/or waiver of expenses by Adviser | | | | | | | | | | | | | | | | | | | 1.45 | %(f) |
After reimbursement and/or waiver of expenses by Adviser | | | | | | | | | | | | | | | | | | | 0.95 | %(f) |
Ratios of net investment loss to average net assets: | | | | | | | | | | | | | | | | | | | | |
Before reimbursement and/or waiver of expenses by Adviser | | | | | | | | | | | | | | | | | | | (1.11 | )%(f) |
After reimbursement and/or waiver of expenses by Adviser | | | | | | | | | | | | | | | | | | | (0.61 | )%(f) |
Portfolio Turnover | | | | | | | | | | | | | | | | | | | 52.56 | % |
| | (a) | Represents less than $(0.005) per share or less than (0.005)%. |
| | (b) | The total return is calculated using the Net Asset Values used for trading at the close of business at period end. |
| | (c) | Ratios of expenses to average net assets include interest expenses of less than 0.005% for each of the years ended October 31, 2012 and October 31, 2011, which are not included in the contractual expense limitation. The interest expenses are from utilizing the line of credit. |
| | (d) | ASTON/TAMRO Diversified Equity Fund began issuing Class I shares on March 1, 2012. |
Prospectus | 127
| | | | | | | | | | | | | | | | | | | | |
| ASTON/River Road Dividend All Cap Value Fund – Class N Year Ended October 31, | | 2012 | | | 2011 | | | 2010 | | | 2009 | | | 2008 | |
Per Share Operating Data: | | | | | | | | | | | | | | | | | | | | |
Net Asset Value, Beginning of Period | | | $10.68 | | | | $10.23 | | | | $8.58 | | | | $8.43 | | | | $12.58 | |
Income from Investment Operations: | | | | | | | | | | | | | | | | | | | | |
Net investment income | | | 0.31 | (a) | | | 0.29 | (a) | | | 0.26 | (a) | | | 0.26 | (a) | | | 0.38 | |
Net realized and unrealized gain (loss) on investments | | | 1.05 | | | | 0.42 | | | | 1.62 | | | | 0.08 | | | | (3.54 | ) |
| | | | | | | | |
Total from investment operations | | | 1.36 | | | | 0.71 | | | | 1.88 | | | | 0.34 | | | | (3.16 | ) |
Less Distributions: | | | | | | | | | | | | | | | | | | | | |
Distributions from and in excess of net investment income | | | (0.30 | ) | | | (0.26 | ) | | | (0.23 | ) | | | (0.19 | ) | | | (0.32 | ) |
Return of capital | | | — | | | | — | | | | — | | | | — | | | | (0.01 | ) |
Distributions from net realized gain on investments | | | (0.07 | ) | | | — | | | | — | | | | — | | | | (0.66 | ) |
| | | | | | | | |
Total distributions | | | (0.37 | ) | | | (0.26 | ) | | | (0.23 | ) | | | (0.19 | ) | | | (0.99 | ) |
Net increase (decrease) in net asset value | | | 0.99 | | | | 0.45 | | | | 1.65 | | | | 0.15 | | | | (4.15 | ) |
Net Asset Value, End of Period | | | $11.67 | | | | $10.68 | | | | $10.23 | | | | $8.58 | | | | $8.43 | |
Total Return(b) | | | 12.96 | % | | | 6.94 | % | | | 22.20 | % | | | 4.33 | % | | | (26.82 | )% |
| | | | | | | | | | | | | | | | | | | | |
Ratios/Supplemental Data: | | | | | | | | | | | | | | | | | | | | |
Net Assets, End of Period (in 000’s) | | | $338,166 | | | | $301,290 | | | | $135,544 | | | | $81,842 | | | | $51,504 | |
Ratios of expenses to average net assets: | | | | | | | | | | | | | | | | | | | | |
Before reimbursement and/or waiver of expenses by Adviser | | | 1.12 | % | | | 1.12 | % | | | 1.14 | % | | | 1.21 | % | | | 1.35 | %(c) |
After reimbursement and/or waiver of expenses by Adviser | | | 1.12 | % | | | 1.12 | % | | | 1.14 | % | | | 1.21 | % | | | 1.30 | %(c) |
Ratios of net investment income to average net assets: | | | | | | | | | | | | | | | | | | | | |
Before reimbursement and/or waiver of expenses by Adviser | | | 2.74 | % | | | 2.70 | % | | | 2.69 | % | | | 3.36 | % | | | 3.81 | % |
After reimbursement and/or waiver of expenses by Adviser | | | 2.74 | % | | | 2.70 | % | | | 2.69 | % | | | 3.36 | % | | | 3.86 | % |
Portfolio Turnover | | | 28.17 | % | | | 24.65 | % | | | 29.92 | % | | | 47.34 | % | | | 48.95 | % |
| | | | | |
| ASTON/River Road Dividend All Cap Value Fund – Class I Year Ended October 31, | | 2012 | | | 2011 | | | 2010 | | | 2009 | | | 2008 | |
Per Share Operating Data: | | | | | | | | | | | | | | | | | | | | |
Net Asset Value, Beginning of Period | | | $10.67 | | | | $10.22 | | | | $8.57 | | | | $8.42 | | | | $12.57 | |
Income from Investment Operations: | | | | | | | | | | | | | | | | | | | | |
Net investment income | | | 0.34 | (a) | | | 0.32 | (a) | | | 0.28 | (a) | | | 0.29 | (a) | | | 0.41 | |
Net realized and unrealized gain (loss) on investments | | | 1.05 | | | | 0.42 | | | | 1.63 | | | | 0.07 | | | | (3.55 | ) |
| | | | | | | | |
Total from investment operations | | | 1.39 | | | | 0.74 | | | | 1.91 | | | | 0.36 | | | | (3.14 | ) |
Less Distributions: | | | | | | | | | | | | | | | | | | | | |
Distributions from and in excess of net investment income | | | (0.33 | ) | | | (0.29 | ) | | | (0.26 | ) | | | (0.21 | ) | | | (0.34 | ) |
Return of capital | | | — | | | | — | | | | — | | | | — | | | | (0.01 | ) |
Distributions from net realized gain on investments | | | (0.07 | ) | | | — | | | | — | | | | — | | | | (0.66 | ) |
| | | | | | | | |
Total distributions | | | (0.40 | ) | | | (0.29 | ) | | | (0.26 | ) | | | (0.21 | ) | | | (1.01 | ) |
Net increase (decrease) in net asset value | | | 0.99 | | | | 0.45 | | | | 1.65 | | | | 0.15 | | | | (4.15 | ) |
Net Asset Value, End of Period | | | $11.66 | | | | $10.67 | | | | $10.22 | | | | $8.57 | | | | $8.42 | |
Total Return(b) | | | 13.25 | % | | | 7.21 | % | | | 22.53 | % | | | 4.59 | % | | | (26.66 | )% |
| | | | | | | | | | | | | | | | | | | | |
Ratios/Supplemental Data: | | | | | | | | | | | | | | | | | | | | |
Net Assets, End of Period (in 000’s) | | | $586,043 | | | | $318,863 | | | | $137,629 | | | | $77,185 | | | | $144 | |
Ratios of expenses to average net assets: | | | | | | | | | | | | | | | | | | | | |
Before reimbursement and/or waiver of expenses by Adviser | | | 0.87 | % | | | 0.87 | % | | | 0.89 | % | | | 0.96 | % | | | 1.10 | %(c) |
After reimbursement and/or waiver of expenses by Adviser | | | 0.87 | % | | | 0.87 | % | | | 0.89 | % | | | 0.96 | % | | | 1.05 | %(c) |
Ratios of net investment income to average net assets: | | | | | | | | | | | | | | | | | | | | |
Before reimbursement and/or waiver of expenses by Adviser | | | 2.99 | % | | | 2.95 | % | | | 2.94 | % | | | 3.61 | % | | | 4.06 | % |
After reimbursement and/or waiver of expenses by Adviser | | | 2.99 | % | | | 2.95 | % | | | 2.94 | % | | | 3.61 | % | | | 4.11 | % |
Portfolio Turnover | | | 28.17 | % | | | 24.65 | % | | | 29.92 | % | | | 47.34 | % | | | 48.95 | % |
| | (a) | The selected per share data was calculated using the weighted average shares outstanding method for the period. |
| | (b) | The total return is calculated using the Net Asset Values used for trading at the close of business at period end. |
| | (c) | Ratios of expenses to average net assets include interest expense of less than 0.005% for the year ended October 31, 2008, which is not included in the contractual expense limitation. The interest expense is from utilizing the line of credit. |
Prospectus | 128
| | | | |
| ASTON/River Road Dividend All Cap Value Fund II – Class N Year Ended October 31, | | 2012(a) | |
Per Share Operating Data: | | | | |
Net Asset Value, Beginning of Period | | | $10.00 | |
Income from Investment Operations: | | | | |
Net investment income | | | 0.09 | (b) |
Net realized and unrealized gain on investments | | | 0.41 | |
Total from investment operations | | | 0.50 | |
Less Distributions: | | | | |
Distributions from and in excess of net investment income | | | (0.06 | ) |
Total distributions | | | (0.06 | ) |
Net increase in net asset value | | | 0.44 | |
Net Asset Value, End of Period | | | $10.44 | |
Total Return(c) | | | 5.09 | %(d) |
| | | | |
Ratios/Supplemental Data: | | | | |
Net Assets, End of Period (in 000’s) | | | $1,049 | |
Ratios of expenses to average net assets: | | | | |
Before reimbursement and/or waiver of expenses by Adviser | | | 4.99 | %(e) |
After reimbursement and/or waiver of expenses by Adviser | | | 1.30 | %(e) |
Ratios of net investment income (loss) to average net assets: | | | | |
Before reimbursement and/or waiver of expenses by Adviser | | | (1.24 | )%(e) |
After reimbursement and/or waiver of expenses by Adviser | | | 2.45 | %(e) |
Portfolio Turnover | | | 5.58 | %(d)(f) |
| | | | |
| ASTON/River Road Dividend All Cap Value Fund II – Class I Year Ended October 31, | | 2012(a) | |
Per Share Operating Data: | | | | |
Net Asset Value, Beginning of Period | | | $10.00 | |
Income from Investment Operations: | | | | |
Net investment income | | | 0.10 | (b) |
Net realized and unrealized gain on investments | | | 0.42 | |
Total from investment operations | | | 0.52 | |
Less Distributions: | | | | |
Distributions from and in excess of net investment income | | | (0.07 | ) |
Total distributions | | | (0.07 | ) |
Net increase in net asset value | | | 0.45 | |
Net Asset Value, End of Period | | | $10.45 | |
Total Return(c) | | | 5.17 | %(d) |
| | | | |
Ratios/Supplemental Data: | | | | |
Net Assets, End of Period (in 000’s) | | | $9,370 | |
Ratios of expenses to average net assets: | | | | |
Before reimbursement and/or waiver of expenses by Adviser | | | 4.74 | %(e) |
After reimbursement and/or waiver of expenses by Adviser | | | 1.05 | %(e) |
Ratios of net investment income (loss) to average net assets: | | | | |
Before reimbursement and/or waiver of expenses by Adviser | | | (0.99 | )%(e) |
After reimbursement and/or waiver of expenses by Adviser | | | 2.70 | %(e) |
Portfolio Turnover | | | 5.58 | %(d)(f) |
| | (a) | ASTON/River Road Dividend All Cap Value Fund II began issuing Class N shares and Class I shares on June 27, 2012. |
| | (b) | The selected per share data was calculated using the weighted average shares outstanding method for the period. |
| | (c) | The total return is calculated using the Net Asset Values used for trading at the close of business at period end. |
| | (f) | Portfolio turnover excludes securities received from processing a subscription-in-kind. |
Prospectus | 129
| | | | | | | | | | | | | | | | | | | | |
| ASTON/Fairpointe Mid Cap Fund – Class N Year Ended October 31, | | 2012 | | | 2011 | | | 2010 | | | 2009 | | | 2008 | |
Per Share Operating Data: | | | | | | | | | | | | | | | | | | | | |
Net Asset Value, Beginning of Period | | | $29.76 | | | | $29.04 | | | | $22.73 | | | | $17.25 | | | | $32.32 | |
Income from Investment Operations: | | | | | | | | | | | | | | | | | | | | |
Net investment income (loss) | | | 0.16 | | | | 0.06 | (a) | | | 0.01 | | | | 0.09 | | | | 0.05 | |
Net realized and unrealized gain (loss) on investments | | | 3.13 | | | | 0.82 | | | | 6.35 | | | | 5.82 | | | | (12.93 | ) |
| | | | | | | | |
Total from investment operations | | | 3.29 | | | | 0.88 | | | | 6.36 | | | | 5.91 | | | | (12.88 | ) |
Less Distributions: | | | | | | | | | | | | | | | | | | | | |
Distributions from and in excess of net investment income | | | (0.05 | ) | | | (0.08 | ) | | | (0.05 | ) | | | (0.14 | ) | | | — | |
Distributions from net realized gain on investments | | | (0.21 | ) | | | (0.08 | ) | | | — | | | | (0.29 | ) | | | (2.19 | ) |
| | | | | | | | |
Total distributions | | | (0.26 | ) | | | (0.16 | ) | | | (0.05 | ) | | | (0.43 | ) | | | (2.19 | ) |
Net increase (decrease) in net asset value | | | 3.03 | | | | 0.72 | | | | 6.31 | | | | 5.48 | | | | (15.07 | ) |
Net Asset Value, End of Period | | | $32.79 | | | | $29.76 | | | | $29.04 | | | | $22.73 | | | | $17.25 | |
Total Return(b) | | | 11.15 | % | | | 2.98 | % | | | 28.01 | % | | | 35.60 | % | | | (42.50 | )% |
| | | | | | | | | | | | | | | | | | | | |
Ratios/Supplemental Data: | | | | | | | | | | | | | | | | | | | | |
Net Assets, End of Period (in 000’s) | | | $1,561,510 | | | | $1,502,266 | | | | $1,469,354 | | | | $842,233 | | | | $508,886 | |
Ratios of expenses to average net assets: | | | | | | | | | | | | | | | | | | | | |
Before reimbursement and/or waiver of expenses by Adviser | | | 1.11 | %(c) | | | 1.14 | %(c) | | | 1.14 | %(c) | | | 1.20 | %(c) | | | 1.16 | %(c) |
After reimbursement and/or waiver of expenses by Adviser | | | 1.11 | %(c) | | | 1.14 | %(c) | | | 1.14 | %(c) | | | 1.20 | %(c) | | | 1.16 | %(c) |
Ratios of net investment income (loss) to average net assets: | | | | | | | | | | | | | | | | | | | | |
Before reimbursement and/or waiver of expenses by Adviser | | | 0.50 | % | | | 0.21 | % | | | — | %(d) | | | 0.46 | % | | | 0.18 | % |
After reimbursement and/or waiver of expenses by Adviser | | | 0.50 | % | | | 0.21 | % | | | — | %(d) | | | 0.46 | % | | | 0.18 | % |
Portfolio Turnover | | | 28.06 | %(e) | | | 11.20 | % | | | 13.82 | % | | | 17.72 | % | | | 22.58 | % |
| | | | | |
ASTON/Fairpointe Mid Cap Fund – Class I Year Ended October 31, | | 2012 | | | 2011 | | | 2010 | | | 2009 | | | 2008 | |
Per Share Operating Data: | | | | | | | | | | | | | | | | | | | | |
Net Asset Value, Beginning of Period | | | $30.20 | | | | $29.41 | | | | $23.00 | | | | $17.47 | | | | $32.64 | |
Income from Investment Operations: | | | | | | | | | | | | | | | | | | | | |
Net investment income | | | 0.24 | | | | 0.14 | (a) | | | 0.07 | | | | 0.13 | | | | 0.11 | |
Net realized and unrealized gain (loss) on investments | | | 3.18 | | | | 0.82 | | | | 6.43 | | | | 5.89 | | | | (13.09 | ) |
| | | | | | | | |
Total from investment operations | | | 3.42 | | | | 0.96 | | | | 6.50 | | | | 6.02 | | | | (12.98 | ) |
Less Distributions: | | | | | | | | | | | | | | | | | | | | |
Distributions from and in excess of net investment income | | | (0.13 | ) | | | (0.09 | ) | | | (0.09 | ) | | | (0.20 | ) | | | — | |
Distributions from net realized gain on investment | | | (0.21 | ) | | | (0.08 | ) | | | — | | | | (0.29 | ) | | | (2.19 | ) |
| | | | | | | | |
Total distributions | | | (0.34 | ) | | | (0.17 | ) | | | (0.09 | ) | | | (0.49 | ) | | | (2.19 | ) |
Net increase (decrease) in net asset value | | | 3.08 | | | | 0.79 | | | | 6.41 | | | | 5.53 | | | | (15.17 | ) |
Net Asset Value, End of Period | | | $33.28 | | | | $30.20 | | | | $29.41 | | | | $23.00 | | | | $17.47 | |
Total Return(b) | | | 11.46 | % | | | 3.22 | % | | | 28.31 | % | | | 35.97 | % | | | (42.39 | )% |
| | | | | | | | | | | | | | | | | | | | |
Ratios/Supplemental Data: | | | | | | | | | | | | | | | | | | | | |
Net Assets, End of Period (in 000’s) | | | $1,464,222 | | | | $1,339,223 | | | | $499,651 | | | | $150,953 | | | | $93,176 | |
Ratios of expenses to average net assets: | | | | | | | | | | | | | | | | | | | | |
Before reimbursement and/or waiver of expenses by Adviser | | | 0.86 | %(c) | | | 0.89 | %(c) | | | 0.89 | %(c) | | | 0.95 | %(c) | | | 0.91 | %(c) |
After reimbursement and/or waiver of expenses by Adviser | | | 0.86 | %(c) | | | 0.89 | %(c) | | | 0.89 | %(c) | | | 0.95 | %(c) | | | 0.91 | %(c) |
Ratios of net investment income to average net assets: | | | | | | | | | | | | | | | | | | | | |
Before reimbursement and/or waiver of expenses by Adviser | | | 0.75 | % | | | 0.46 | % | | | 0.25 | % | | | 0.71 | % | | | 0.43 | % |
After reimbursement and/or waiver of expenses by Adviser | | | 0.75 | % | | | 0.46 | % | | | 0.25 | % | | | 0.71 | % | | | 0.43 | % |
Portfolio Turnover | | | 28.06 | %(e) | | | 11.20 | % | | | 13.82 | % | | | 17.72 | % | | | 22.58 | % |
| | (a) | The selected per share data was calculated using the weighted average shares outstanding method for the period. |
| | (b) | The total return is calculated using the Net Asset Values used for trading at the close of business at period end. |
| | (c) | Ratios of expenses to average net assets include interest expense of less than 0.005% for each of the years ended October 31, 2012, October 31, 2011, October 31, 2010, October 31, 2009 and October 31, 2008, which is not included in the contractual expense limitation. The interest expenses are from utilizing the line of credit. |
| | (d) | Represents less than 0.005%. |
| | (e) | Portfolio turnover rate excludes securities delivered from processing a redemption-in-kind. |
Prospectus | 130
| | | | | | | | | | | | | | | | | | | | |
| ASTON/Montag & Caldwell Mid Cap Growth Fund – Class N Year Ended October 31, | | 2012 | | | 2011 | | | 2010 | | | 2009 | | | 2008(a) | |
Per Share Operating Data: | | | | | | | | | | | | | | | | | | | | |
Net Asset Value, Beginning of Period | | | $9.71 | | | | $8.51 | | | | $6.83 | | | | $5.85 | | | | $10.00 | |
Income from Investment Operations: | | | | | | | | | | | | | | | | | | | | |
Net investment loss | | | (0.07 | )(b) | | | (0.07 | ) | | | (0.04 | ) | | | (0.04 | ) | | | (0.05 | ) |
Net realized and unrealized gain (loss) on investments | | | 0.72 | | | | 1.27 | | | | 1.74 | | | | 1.02 | | | | (4.10 | ) |
| | | | | | | | |
Total from investment operations | | | 0.65 | | | | 1.20 | | | | 1.70 | | | | 0.98 | | | | (4.15 | ) |
Less Distributions: | | | | | | | | | | | | | | | | | | | | |
Distributions from and in excess of net investment income | | | — | | | | — | | | | (0.02 | ) | | | — | | | | — | |
| | | | | | | | |
Total distributions | | | — | | | | — | | | | (0.02 | ) | | | — | | | | — | |
Net increase (decrease) in net asset value | | | 0.65 | | | | 1.20 | | | | 1.68 | | | | 0.98 | | | | (4.15 | ) |
Net Asset Value, End of Period | | | $10.36 | | | | $9.71 | | | | $8.51 | | | | $6.83 | | | | $5.85 | |
Total Return(c) | | | 6.70 | % | | | 14.10 | % | | | 24.85 | % | | | 16.75 | % | | | (41.50 | )%(d) |
| | | | | | | | | | | | | | | | | | | | |
Ratios/Supplemental Data: | | | | | | | | | | | | | | | | | | | | |
Net Assets, End of Period (in 000’s) | | | $7,369 | | | | $4,507 | | | | $3,399 | | | | $2,959 | | | | $1,815 | |
Ratios of expenses to average net assets: | | | | | | | | | | | | | | | | | | | | |
Before reimbursement and/or waiver of expenses by Adviser | | | 2.50 | % | | | 3.07 | % | | | 3.55 | % | | | 5.02 | % | | | 5.80 | %(e) |
After reimbursement and/or waiver of expenses by Adviser | | | 1.25 | %(f) | | | 1.39 | %(f) | | | 1.40 | % | | | 1.40 | % | | | 1.40 | %(e) |
Ratios of net investment loss to average net assets: | | | | | | | | | | | | | | | | | | | | |
Before reimbursement and/or waiver of expenses by Adviser | | | (1.88 | )% | | | (2.39 | )% | | | (2.75 | )% | | | (4.13 | )% | | | (5.07 | )%(e) |
After reimbursement and/or waiver of expenses by Adviser | | | (0.63 | )% | | | (0.71 | )% | | | (0.60 | )% | | | (0.51 | )% | | | (0.67 | )%(e) |
Portfolio Turnover | | | 36.60 | % | | | 29.31 | % | | | 31.49 | % | | | 54.37 | % | | | 63.66 | %(d) |
| | (a) | ASTON/Montag & Caldwell Mid Cap Growth Fund began issuing Class N shares on November 1, 2007. |
| | (b) | The selected per share data was calculated using the weighted average shares outstanding method for the period. |
| | (c) | The total return is calculated using the Net Asset Values used for trading at the close of business at period end. |
| | (f) | For the period November 1, 2010 through September 29, 2011 the Adviser contractually waived management fees and/or reimbursed expenses so that the net expense ratio is no more than 1.40%, excluding interest, taxes, other investment-related costs (such as brokerage commissions), extraordinary expenses and acquired fund fees and expenses. Effective September 30, 2011, the Adviser implemented a voluntary expense limitation of 1.25%. Subsequently on February 29, 2012, the Adviser removed the voluntary expense limitation and replaced it with a contractual expense limitation of 1.25%. |
Prospectus | 131
| | | | | | | | | | | | | | | | | | | | |
| ASTON/TAMRO Small Cap Fund – Class N Year Ended October 31, | | 2012 | | | 2011 | | | 2010 | | | 2009 | | | 2008 | |
Per Share Operating Data: | | | | | | | | | | | | | | | | | | | | |
Net Asset Value, Beginning of Period | | | $20.57 | | | | $19.42 | | | | $14.67 | | | | $13.64 | | | | $20.99 | |
Income from Investment Operations: | | | | | | | | | | | | | | | | | | | | |
Net investment income (loss) | | | (0.12 | )(a) | | | (0.15 | )(a) | | | (0.08 | )(a) | | | (0.05 | )(a) | | | 0.05 | |
Net realized and unrealized gain (loss) on investments | | | 2.09 | | | | 1.75 | | | | 4.83 | | | | 1.08 | | | | (6.43 | ) |
| | | | | | | | |
Total from investment operations | | | 1.97 | | | | 1.60 | | | | 4.75 | | | | 1.03 | | | | (6.38 | ) |
Less Distributions: | | | | | | | | | | | | | | | | | | | | |
Distributions from net realized gain on investments | | | (2.02 | ) | | | (0.45 | ) | | | — | | | | — | | | | (0.97 | ) |
| | | | | | | | |
Total distributions | | | (2.02 | ) | | | (0.45 | ) | | | — | | | | — | | | | (0.97 | ) |
Net increase (decrease) in net asset value | | | (0.05 | ) | | | 1.15 | | | | 4.75 | | | | 1.03 | | | | (7.35 | ) |
Net Asset Value, End of Period | | | $20.52 | | | | $20.57 | | | | $19.42 | | | | $14.67 | | | | $13.64 | |
Total Return(b) | | | 10.70 | % | | | 8.16 | % | | | 32.29 | % | | | 7.63 | % | | | (31.58 | )% |
| | | | | | | | | | | | | | | | | | | | |
Ratios/Supplemental Data: | | | | | | | | | | | | | | | | | | | | |
Net Assets, End of Period (in 000’s) | | | $389,125 | | | | $375,969 | | | | $335,809 | | | | $241,524 | | | | $159,965 | |
Ratios of expenses to average net assets: | | | | | | | | | | | | | | | | | | | | |
Before reimbursement and/or waiver of expenses by Adviser | | | 1.28 | %(c) | | | 1.29 | % | | | 1.34 | % | | | 1.37 | % | | | 1.32 | % |
After reimbursement and/or waiver of expenses by Adviser | | | 1.28 | %(c) | | | 1.29 | % | | | 1.34 | % | | | 1.36 | %(d) | | | 1.30 | % |
Ratios of net investment income (loss) to average net assets: | | | | | | | | | | | | | | | | | | | | |
Before reimbursement and/or waiver of expenses by Adviser | | | (0.59 | )% | | | (0.69 | )% | | | (0.49 | )% | | | (0.41 | )% | | | 0.29 | % |
After reimbursement and/or waiver of expenses by Adviser | | | (0.59 | )% | | | (0.69 | )% | | | (0.49 | )% | | | (0.40 | )% | | | 0.31 | % |
Portfolio Turnover | | | 48.22 | %(e) | | | 47.25 | % | | | 62.13 | % | | | 89.92 | % | | | 66.65 | % |
| | | | | | | | | | | | | | | | | | | | |
| ASTON/TAMRO Small Cap Fund – Class I Year Ended October 31, | | 2012 | | | 2011 | | | 2010 | | | 2009 | | | 2008 | |
Per Share Operating Data: | | | | | | | | | | | | | | | | | | | | |
Net Asset Value, Beginning of Period | | | $20.91 | | | | $19.69 | | | | $14.87 | | | | $13.79 | | | | $21.16 | |
Income from Investment Operations: | | | | | | | | | | | | | | | | | | | | |
Net investment income (loss) | | | (0.07 | )(a) | | | (0.09 | )(a) | | | (0.04 | )(a) | | | (0.02 | )(a) | | | 0.02 | |
Net realized and unrealized gain (loss) on investments | | | 2.14 | | | | 1.76 | | | | 4.87 | | | | 1.12 | | | | (6.42 | ) |
| | | | | | | | |
Total from investment operations | | | 2.07 | | | | 1.67 | | | | 4.83 | | | | 1.10 | | | | (6.40 | ) |
Less Distributions: | | | | | | | | | | | | | | | | | | | | |
Distributions from and in excess of net investment income | | | — | | | | — | | | | (0.01 | ) | | | (0.02 | ) | | | — | |
Distributions from net realized gain on investments | | | (2.02 | ) | | | (0.45 | ) | | | — | | | | — | | | | (0.97 | ) |
| | | | | | | | |
Total distributions | | | (2.02 | ) | | | (0.45 | ) | | | (0.01 | ) | | | (0.02 | ) | | | (0.97 | ) |
Net increase (decrease) in net asset value | | | 0.05 | | | | 1.22 | | | | 4.82 | | | | 1.08 | | | | (7.37 | ) |
Net Asset Value, End of Period | | | $20.96 | | | | $20.91 | | | | $19.69 | | | | $14.87 | | | | $13.79 | |
Total Return(b) | | | 10.98 | % | | | 8.40 | % | | | 32.62 | % | | | 7.94 | % | | | (31.42 | )% |
| | | | | | | | | | | | | | | | | | | | |
Ratios/Supplemental Data: | | | | | | | | | | | | | | | | | | | | |
Net Assets, End of Period (in 000’s) | | | $635,663 | | | | $625,315 | | | | $549,627 | | | | $515,592 | | | | $238,399 | |
Ratios of expenses to average net assets: | | | | | | | | | | | | | | | | | | | | |
Before reimbursement and/or waiver of expenses by Adviser | | | 1.03 | %(c) | | | 1.04 | % | | | 1.09 | % | | | 1.12 | % | | | 1.07 | % |
After reimbursement and/or waiver of expenses by Adviser | | | 1.03 | %(c) | | | 1.04 | % | | | 1.09 | % | | | 1.11 | %(f) | | | 1.05 | % |
Ratios of net investment income (loss) to average net assets: | | | | | | | | | | | | | | | | | | | | |
Before reimbursement and/or waiver of expenses by Adviser | | | (0.34 | )% | | | (0.44 | )% | | | (0.24 | )% | | | (0.16 | )% | | | 0.54 | % |
After reimbursement and/or waiver of expenses by Adviser | | | (0.34 | )% | | | (0.44 | )% | | | (0.24 | )% | | | (0.15 | )% | | | 0.56 | % |
Portfolio Turnover | | | 48.22 | %(e) | | | 47.25 | % | | | 62.13 | % | | | 89.92 | % | | | 66.65 | % |
| | (a) | The selected per share data was calculated using the weighted average shares outstanding method for the period. |
| | (b) | The total return is calculated using the Net Asset Values used for trading at the close of business at period end. |
| | (c) | Ratios of expenses to average net assets include interest expenses of less than 0.005% for the year ended October 31, 2012, which is not included in the contractual expense limitation. The interest expenses are from utilizing the line of credit. |
| | (d) | The Adviser removed the contractual expense limitation of 1.30%, excluding interest, taxes, other investment-related costs (such as brokerage commissions), extraordinary expenses and acquired fund fees and expenses, effective March 1, 2009. |
| | (e) | Portfolio turnover rate excludes securities delivered from processing redemptions-in-kind. |
| | (f) | The Adviser removed the contractual expense limitation of 1.05%, excluding interest, taxes, other investment-related costs (such as brokerage commissions), extraordinary expenses and acquired fund fees and expenses, effective March 1, 2009. |
Prospectus | 132
| | | | | | | | | | | | | | | | | | | | |
| ASTON/River Road Select Value Fund – Class N Year Ended October 31, | | 2012 | | | 2011 | | | 2010 | | | 2009 | | | 2008 | |
Per Share Operating Data: | | | | | | | | | | | | | | | | | | | | |
Net Asset Value, Beginning of Period | | | $9.54 | | | | $9.01 | | | | $7.71 | | | | $7.13 | | | | $10.13 | |
Income from Investment Operations: | | | | | | | | | | | | | | | | | | | | |
Net investment income (loss) | | | 0.01 | (a) | | | (0.02 | )(a) | | | 0.02 | (a) | | | — | (a)(b) | | | — | (a)(b) |
Net realized and unrealized gain (loss) on investments | | | 1.01 | | | | 0.66 | | | | 1.28 | | | | 0.59 | | | | (3.00 | ) |
| | | | | | | | |
Total from investment operations | | | 1.02 | | | | 0.64 | | | | 1.30 | | | | 0.59 | | | | (3.00 | ) |
Less Distributions: | | | | | | | | | | | | | | | | | | | | |
Distributions from net investment income | | | — | | | | (0.03 | ) | | | — | | | | (0.01 | ) | | | — | |
Distributions from net realized gains on investments | | | (2.06 | ) | | | (0.08 | ) | | | — | | | | — | | | | — | |
| | | | | | | | |
Total distribution | | | (2.06 | ) | | | (0.11 | ) | | | — | | | | (0.01 | ) | | | — | |
Net increase (decrease) in net asset value | | | (1.04 | ) | | | 0.53 | | | | 1.30 | | | | 0.58 | | | | (3.00 | ) |
Net Asset Value, End of Period | | | $8.50 | | | | $9.54 | | | | $9.01 | | | | $7.71 | | | | $7.13 | |
Total Return(c) | | | 12.87 | % | | | 7.12 | % | | | 16.86 | % | | | 8.33 | % | | | (29.62 | )% |
| | | | | | | | | | | | | | | | | | | | |
Ratios/Supplemental Data: | | | | | | | | | | | | | | | | | | | | |
Net Assets, End of Period (in 000’s) | | | $6,270 | | | | $13,160 | | | | $52,522 | | | | $41,801 | | | | $26,714 | |
Ratios of expenses to average net assets: | | | | | | | | | | | | | | | | | | | | |
Before recoupment and/or waiver of expenses by Adviser | | | 1.43 | %(d) | | | 1.42 | %(d) | | | 1.41 | %(d) | | | 1.44 | % | | | 1.56 | % |
After recoupment and/or waiver of expenses by Adviser | | | 1.43 | %(d) | | | 1.42 | %(d) | | | 1.43 | %(d) | | | 1.50 | % | | | 1.50 | % |
Ratios of net investment income (loss) to average net assets: | | | | | | | | | | | | | | | | | | | | |
Before recoupment and/or waiver of expenses by Adviser | | | 0.07 | % | | | (0.18 | )% | | | 0.31 | % | | | 0.04 | % | | | (0.08 | )% |
After recoupment and/or waiver of expenses by Adviser | | | 0.07 | % | | | (0.18 | )% | | | 0.29 | % | | | (0.02 | )% | | | (0.02 | )% |
Portfolio Turnover | | | 38.84 | % | | | 48.22 | % | | | 53.73 | % | | | 44.09 | % | | | 54.93 | % |
| | | | | |
| ASTON/River Road Select Value Fund – Class I Year Ended October 31, | | 2012 | | | 2011 | | | 2010 | | | 2009 | | | 2008 | |
Per Share Operating Data: | | | | | | | | | | | | | | | | | | | | |
Net Asset Value, Beginning of Period | | | $9.59 | | | | $9.04 | | | | $7.73 | | | | $7.14 | | | | $10.13 | |
Income from Investment Operations: | | | | | | | | | | | | | | | | | | | | |
Net investment income | | | 0.03 | (a) | | | 0.01 | (a) | | | 0.05 | (a) | | | 0.02 | (a) | | | 0.02 | (a) |
Net realized and unrealized gain (loss) on investments | | | 1.02 | | | | 0.67 | | | | 1.28 | | | | 0.59 | | | | (3.00 | ) |
| | | | | | | | |
Total from investment operations | | | 1.05 | | | | 0.68 | | | | 1.33 | | | | 0.61 | | | | (2.98 | ) |
Less Distributions: | | | | | | | | | | | | | | | | | | | | |
Distributions from net investment income | | | — | | | | (0.05 | ) | | | (0.02 | ) | | | (0.02 | ) | | | (0.01 | ) |
Distributions from net realized gains on investments | | | (2.06 | ) | | | (0.08 | ) | | | — | | | | — | | | | — | |
| | | | | | | | |
Total distributions | | | (2.06 | ) | | | (0.13 | ) | | | (0.02 | ) | | | (0.02 | ) | | | (0.01 | ) |
Net increase (decrease) in net asset value | | | (1.01 | ) | | | 0.55 | | | | 1.31 | | | | 0.59 | | | | (2.99 | ) |
Net Asset Value, End of Period | | | $8.58 | | | | $9.59 | | | | $9.04 | | | | $7.73 | | | | $7.14 | |
Total Return(c) | | | 13.18 | % | | | 7.56 | % | | | 17.19 | % | | | 8.52 | % | | | (29.49 | )% |
| | | | | | | | | | | | | | | | | | | | |
Ratios/Supplemental Data: | | | | | | | | | | | | | | | | | | | | |
Net Assets, End of Period (in 000’s) | | | $156,510 | | | | $130,527 | | | | $163,232 | | | | $167,334 | | | | $84,002 | |
Ratios of expenses to average net assets: | | | | | | | | | | | | | | | | | | | | |
Before recoupment and/or waiver of expenses by Adviser | | | 1.18 | %(d) | | | 1.17 | %(d) | | | 1.16 | %(d) | | | 1.19 | % | | | 1.31 | % |
After recoupment and/or waiver of expenses by Adviser | | | 1.18 | %(d) | | | 1.17 | %(d) | | | 1.18 | %(d) | | | 1.25 | % | | | 1.25 | % |
Ratios of net investment income (loss) to average net assets: | | | | | | | | | | | | | | | | | | | | |
Before recoupment and/or waiver of expenses by Adviser | | | 0.32 | % | | | 0.07 | % | | | 0.56 | % | | | 0.29 | % | | | 0.17 | % |
After recoupment and/or waiver of expenses by Adviser | | | 0.32 | % | | | 0.07 | % | | | 0.54 | % | | | 0.23 | % | | | 0.23 | % |
Portfolio Turnover | | | 38.84 | % | | | 48.22 | % | | | 53.73 | % | | | 44.09 | % | | | 54.93 | % |
| | (a) | The selected per share data was calculated using the weighted average shares outstanding method for the period. |
| | (b) | Represents less than $(0.005) per share. |
| | (c) | The total return is calculated using the Net Asset Values used for trading at the close of business at period end. |
| | (d) | Ratios of expenses to average net assets include interest expenses of less than 0.005% for each of the years ended October 31, 2012, October 31, 2011 and October 31, 2010, which are not included in the contractual expense limitation. The interest expenses are from utilizing the line of credit. |
Prospectus | 133
| | | | | | | | | | | | | | | | | | | | |
| ASTON/River Road Small Cap Value Fund – Class N Year Ended October 31, | | 2012 | | | 2011 | | | 2010 | | | 2009 | | | 2008 | |
Per Share Operating Data: | | | | | | | | | | | | | | | | | | | | |
Net Asset Value, Beginning of Period | | | $12.20 | | | | $11.60 | | | | $10.22 | | | | $9.30 | | | | $14.37 | |
Income from Investment Operations: | | | | | | | | | | | | | | | | | | | | |
Net investment income (loss) | | | 0.03 | (a) | | | (0.03 | ) | | | 0.03 | | | | 0.01 | | | | 0.01 | (a) |
Net realized and unrealized gain (loss) on investments | | | 1.33 | | | | 0.67 | | | | 1.36 | | | | 0.92 | | | | (4.54 | ) |
| | | | | | | | |
Total from investment operations | | | 1.36 | | | | 0.64 | | | | 1.39 | | | | 0.93 | | | | (4.53 | ) |
Less Distributions: | | | | | | | | | | | | | | | | | | | | |
Distributions from and in excess of net investment income | | | — | | | | (0.04 | ) | | | (0.01 | ) | | | (0.01 | ) | | | — | |
Distributions from net realized gain on investments | | | — | | | | — | | | | — | | | | — | | | | (0.54 | ) |
| | | | | | | | |
Total distributions | | | — | | | | (0.04 | ) | | | (0.01 | ) | | | (0.01 | ) | | | (0.54 | ) |
Net increase (decrease) in net asset value | | | 1.36 | | | | 0.60 | | | | 1.38 | | | | 0.92 | | | | (5.07 | ) |
Net Asset Value, End of Period | | | $13.56 | | | | $12.20 | | | | $11.60 | | | | $10.22 | | | | $9.30 | |
Total Return(b) | | | 11.15 | % | | | 5.46 | % | | | 13.60 | % | | | 9.99 | % | | | (32.51 | )% |
| | | | | | | | | | | | | | | | | | | | |
Ratios/Supplemental Data: | | | | | | | | | | | | | | | | | | | | |
Net Assets, End of Period (in 000’s) | | | $49,154 | | | | $91,347 | | | | $213,326 | | | | $216,221 | | | | $160,245 | |
Ratios of expenses to average net assets: | | | | | | | | | | | | | | | | | | | | |
Before reimbursement and/or waiver of expenses by Adviser | | | 1.37 | % | | | 1.37 | %(c) | | | 1.39 | %(c) | | | 1.40 | % | | | 1.45 | %(c) |
After reimbursement and/or waiver of expenses by Adviser | | | 1.37 | % | | | 1.37 | %(c) | | | 1.39 | %(c) | | | 1.40 | %(d) | | | 1.45 | %(c) |
Ratios of net investment income (loss) to average net assets: | | | | | | | | | | | | | | | | | | | | |
Before reimbursement and/or waiver of expenses by Adviser | | | 0.22 | % | | | (0.13 | )% | | | 0.27 | % | | | 0.05 | % | | | 0.08 | % |
After reimbursement and/or waiver of expenses by Adviser | | | 0.22 | % | | | (0.13 | )% | | | 0.27 | % | | | 0.05 | % | | | 0.08 | % |
Portfolio Turnover | | | 26.95 | % | | | 42.29 | % | | | 51.05 | % | | | 35.83 | % | | | 57.32 | % |
| | | | | | | | | | | | | | | | | | | | |
| ASTON/River Road Small Cap Value Fund – Class I Year Ended October 31, | | 2012 | | | 2011 | | | 2010 | | | 2009 | | | 2008 | |
Per Share Operating Data: | | | | | | | | | | | | | | | | | | | | |
Net Asset Value, Beginning of Period | | | $12.22 | | | | $11.62 | | | | $10.24 | | | | $9.32 | | | | $14.37 | |
Income from Investment Operations: | | | | | | | | | | | | | | | | | | | | |
Net investment income | | | 0.06 | (a) | | | 0.01 | | | | 0.06 | | | | 0.03 | | | | 0.04 | (a) |
Net realized and unrealized gain (loss) on investments | | | 1.34 | | | | 0.65 | | | | 1.35 | | | | 0.92 | | | | (4.54 | ) |
| | | | | | | | |
Total from investment operations | | | 1.40 | | | | 0.66 | | | | 1.41 | | | | 0.95 | | | | (4.50 | ) |
Less Distributions: | | | | | | | | | | | | | | | | | | | | |
Distributions from and in excess of net investment income | | | — | | | | (0.06 | ) | | | (0.03 | ) | | | (0.03 | ) | | | (0.01 | ) |
Distributions from net realized gain on investments | | | — | | | | — | | | | — | | | | — | | | | (0.54 | ) |
| | | | | | | | |
Total distributions | | | — | | | | (0.06 | ) | | | (0.03 | ) | | | (0.03 | ) | | | (0.55 | ) |
Net increase (decrease) in net asset value | | | 1.40 | | | | 0.60 | | | | 1.38 | | | | 0.92 | | | | (5.05 | ) |
Net Asset Value, End of Period | | | $13.62 | | | | $12.22 | | | | $11.62 | | | | $10.24 | | | | $9.32 | |
Total Return(b) | | | 11.46 | % | | | 5.70 | % | | | 13.80 | % | | | 10.31 | % | | | (32.34 | )% |
| | | | | | | | | | | | | | | | | | | | |
Ratios/Supplemental Data: | | | | | | | | | | | | | | | | | | | | |
Net Assets, End of Period (in 000’s) | | | $240,075 | | | | $246,141 | | | | $255,344 | | | | $282,542 | | | | $114,666 | |
Ratios of expenses to average net assets: | | | | | | | | | | | | | | | | | | | | |
Before reimbursement and/or waiver of expenses by Adviser | | | 1.12 | % | | | 1.12 | %(c) | | | 1.14 | %(c) | | | 1.15 | % | | | 1.20 | %(c) |
After reimbursement and/or waiver of expenses by Adviser | | | 1.12 | % | | | 1.12 | %(c) | | | 1.14 | %(c) | | | 1.15 | %(e) | | | 1.20 | %(c) |
Ratios of net investment income to average net assets: | | | | | | | | | | | | | | | | | | | | |
Before reimbursement and/or waiver of expenses by Adviser | | | 0.47 | % | | | 0.12 | % | | | 0.52 | % | | | 0.30 | % | | | 0.33 | % |
After reimbursement and/or waiver of expenses by Adviser | | | 0.47 | % | | | 0.12 | % | | | 0.52 | % | | | 0.30 | % | | | 0.33 | % |
Portfolio Turnover | | | 26.95 | % | | | 42.29 | % | | | 51.05 | % | | | 35.83 | % | | | 57.32 | % |
| | (a) | The selected per share data was calculated using the weighted average shares outstanding method for the period. |
| | (b) | The total return is calculated using the Net Asset Values used for trading at the close of business at period end. |
| | (c) | Ratios of expenses to average net assets include interest expenses of less than 0.005% for each of the years ended October 31, 2011, October 31, 2010 and October 31, 2008, which are not included in the contractual expense limitation. The interest expenses are from utilizing the line of credit. |
| | (d) | The Adviser removed the contractual expense limitation of 1.50%, excluding interest, taxes, other investment-related costs (such as brokerage commissions), extraordinary expenses and acquired fund fees and expenses, effective March 1, 2009. |
| | (e) | The Adviser removed the contractual expense limitation of 1.25%, excluding interest, taxes, other investment-related costs (such as brokerage commissions), extraordinary expenses and acquired fund fees and expenses, effective March 1, 2009. |
Prospectus | 134
| | | | | | | | |
| ASTON/River Road Independent Value Fund – Class N Year Ended October 31, | | 2012 | | | 2011(a) | |
Per Share Operating Data: | | | | | | | | |
Net Asset Value, Beginning of Period | | | $10.75 | | | | $10.00 | |
Income from Investment Operations: | | | | | | | | |
Net investment loss | | | (0.09 | )(b) | | | (0.07 | )(b) |
Net realized and unrealized gain on investments | | | 0.88 | | | | 0.82 | |
| | | | | | | | |
Total from investment operations | | | 0.79 | | | | 0.75 | |
Less Distributions: | | | | | | | | |
Distributions from and in excess of net investment income | | | (0.12 | ) | | | — | |
| | | | | | | | |
Total distributions | | | (0.12 | ) | | | — | |
Net increase in net asset value | | | 0.67 | | | | 0.75 | |
Net Asset Value, End of Period | | | $11.42 | | | | $10.75 | |
Total Return(c) | | | 7.41 | % | | | 7.50 | %(d) |
| | | | | | | | |
Ratios/Supplemental Data: | | | | | | | | |
Net Assets, End of Period (in 000’s) | | | $362,416 | | | | $306,223 | |
Ratios of expenses to average net assets: | | | | | | | | |
Before reimbursement and/or waiver of expenses by Adviser | | | 1.44 | %(f) | | | 1.59 | %(e) |
After reimbursement and/or waiver of expenses by Adviser | | | 1.42 | %(f) | | | 1.42 | %(e) |
Ratios of net investment loss to average net assets: | | | | | | | | |
Before reimbursement and/or waiver of expenses by Adviser | | | (0.81 | )% | | | (0.98 | )%(e) |
After reimbursement and/or waiver of expenses by Adviser | | | (0.79 | )% | | | (0.80 | )%(e) |
Portfolio Turnover | | | 141.17 | % | | | 105.69 | %(d) |
| | | | | | | | |
| ASTON/River Road Independent Value Fund – Class I Year Ended October 31, | | 2012 | | | 2011(g) | |
Per Share Operating Data: | | | | | | | | |
Net Asset Value, Beginning of Period | | | $10.75 | | | | $10.92 | |
Income from Investment Operations: | | | | | | | | |
Net investment loss | | | (0.06 | )(b) | | | (0.02 | )(b) |
Net realized and unrealized loss on investments | | | 0.89 | | | | (0.15 | ) |
| | | | | | | | |
Total from investment operations | | | 0.83 | | | | (0.17 | ) |
Less Distributions: | | | | | | | | |
Distributions from and in excess of net investment income | | | (0.12 | ) | | | — | |
| | | | | | | | |
Total distributions | | | (0.12 | ) | | | — | |
Net decrease in net asset value | | | 0.71 | | | | (0.17 | ) |
Net Asset Value, End of Period | | | $11.46 | | | | $10.75 | |
Total Return(c) | | | 7.68 | % | | | (1.47 | )%(d) |
| | | | | | | | |
Ratios/Supplemental Data: | | | | | | | | |
Net Assets, End of Period (in 000’s) | | | $338,234 | | | | $85,478 | |
Ratios of expenses to average net assets: | | | | | | | | |
Before reimbursement and/or waiver of expenses by Adviser | | | 1.19 | %(f) | | | 1.34 | %(e) |
After reimbursement and/or waiver of expenses by Adviser | | | 1.17 | %(f) | | | 1.17 | %(e) |
Ratios of net investment loss to average net assets: | | | | | | | | |
Before reimbursement and/or waiver of expenses by Adviser | | | (0.56 | )% | | | (0.73 | )%(e) |
After reimbursement and/or waiver of expenses by Adviser | | | (0.54 | )% | | | (0.55 | )%(e) |
Portfolio Turnover | | | 141.17 | % | | | 105.69 | %(d) |
| | (a) | ASTON/River Road Independent Value Fund began issuing Class N shares on December 30, 2010. |
| | (b) | The selected per share data was calculated using the weighted average shares outstanding method for the period. |
| | (c) | The total return is calculated using the Net Asset Values used for trading at the close of business at period end. |
| | (f) | Ratios of expenses to average net assets include Earnings Credits of less than 0.005% for the year ended October 31, 2012, which is not included in the contractual expense limitation. |
| | (g) | ASTON/River Road Independent Value Fund began issuing Class I shares on May 31, 2011. |
Prospectus | 135
| | | | | | | | |
ASTON/LMCG Small Cap Growth Fund – Class N Year Ended October 31, (formerly, ASTON Small Cap Growth Fund) | | 2012 | | | 2011(a) | |
Per Share Operating Data: | | | | | | | | |
Net Asset Value, Beginning of Period | | | $9.95 | | | | $10.00 | |
Income from Investment Operations: | | | | | | | | |
Net investment loss | | | (0.12 | )(b) | | | (0.04 | ) |
Net realized and unrealized gain on investments | | | 1.59 | | | | (0.01 | ) |
| | | | | | | | |
Total from investment operations | | | 1.47 | | | | (0.05 | ) |
Less Distributions: | | | | | | | | |
Distributions from and in excess of net investment income | | | — | | | | — | |
| | | | | | | | |
Total distributions | | | — | | | | — | |
Net decrease in net asset value | | | 1.47 | | | | (0.05 | ) |
Net Asset Value, End of Period | | | $11.42 | | | | $9.95 | |
Total Return(c) | | | 14.77 | % | | | (0.50 | )%(d) |
| | | | | | | | |
Ratios/Supplemental Data: | | | | | | | | |
Net Assets, End of Period (in 000’s) | | | $5,659 | | | | $5,411 | |
Ratios of expenses to average net assets: | | | | | | | | |
Before reimbursement and/or waiver of expenses by Adviser | | | 2.86 | % | | | 8.27 | %(e) |
After reimbursement and/or waiver of expenses by Adviser | | | 1.35 | % | | | 1.35 | %(e) |
Ratios of net investment loss to average net assets: | | | | | | | | |
Before reimbursement and/or waiver of expenses by Adviser | | | (2.68 | )% | | | (8.14 | )%(e) |
After reimbursement and/or waiver of expenses by Adviser | | | (1.17 | )% | | | (1.21 | )%(e) |
Portfolio Turnover | | | 168.05 | %(f) | | | 205.85 | %(d) |
| | | | | | | | |
ASTON/LMCG Small Cap Growth Fund – Class I Year Ended October 31, (formerly, ASTON Small Cap Growth Fund) | | 2012 | | | 2011(g) | |
Per Share Operating Data: | | | | | | | | |
Net Asset Value, Beginning of Period | | | $9.97 | | | | $12.40 | |
Income from Investment Operations: | | | | | | | | |
Net investment loss | | | (0.10 | )(b) | | | (0.04 | ) |
Net realized and unrealized gain on investments | | | 1.59 | | | | (2.39 | ) |
| | | | | | | | |
Total from investment operations | | | 1.49 | | | | (2.43 | ) |
Less Distributions: | | | | | | | | |
Distributions from and in excess of net investment income | | | — | | | | — | |
| | | | | | | | |
Total distributions | | | — | | | | — | |
Net decrease in net asset value | | | 1.49 | | | | (2.43 | ) |
Net Asset Value, End of Period | | | $11.46 | | | | $9.97 | |
Total Return(c) | | | 14.95 | % | | | (19.60 | )%(d) |
| | | | | | | | |
Ratios/Supplemental Data: | | | | | | | | |
Net Assets, End of Period (in 000’s) | | | $755 | | | | $2,551 | |
Ratios of expenses to average net assets: | | | | | | | | |
Before reimbursement and/or waiver of expenses by Adviser | | | 2.61 | % | | | 6.25 | %(e) |
After reimbursement and/or waiver of expenses by Adviser | | | 1.10 | % | | | 1.10 | %(e) |
Ratios of net investment loss to average net assets: | | | | | | | | |
Before reimbursement and/or waiver of expenses by Adviser | | | (2.43 | )% | | | (6.11 | )%(e) |
After reimbursement and/or waiver of expenses by Adviser | | | (0.92 | )% | | | (0.96 | )%(e) |
Portfolio Turnover | | | 168.05 | %(f) | | | 205.85 | %(d) |
| | (a) | ASTON Small Cap Growth Fund began issuing Class N shares on November 2, 2010. |
| | (b) | The selected per share data was calculated using the weighted average shares outstanding method for the period. |
| | (c) | The total return is calculated using the Net Asset Values used for trading at the close of business at period end. |
| | (f) | Portfolio turnover rate excludes securities delivered from processing a redemption-in-kind. |
| | (g) | ASTON Small Cap Growth Fund began issuing Class I shares on May 31, 2011. |
Prospectus | 136
| | | | | | | | | | | | | | | | | | | | |
ASTON Small Cap Fund – Class N Year Ended October 31, (formerly, ASTON/Veredus Small Cap Growth Fund) | | 2012 | | | 2011 | | | 2010 | | | 2009 | | | 2008 | |
Per Share Operating Data: | | | | | | | | | | | | | | | | | | | | |
Net Asset Value, Beginning of Period | | | $12.36 | | | | $11.80 | | |
| $8.97
|
| | | $8.38 | | | | $22.42 | |
Income from Investment Operations: | | | | | | | | | | | | | | | | | | | | |
Net investment loss | | | (0.12 | )(a) | | | (0.14 | )(a) | | | (0.14 | )(a) | | | (0.10 | ) | | | (0.17 | ) |
Net realized and unrealized gain (loss) on investments | | | 0.79 | | | | 0.70 | | | | 2.97 | | | | 0.74 | | | | (8.31 | ) |
| | | | | | | | |
Total from investment operations | | | 0.67 | | | | 0.56 | | | | 2.83 | | | | 0.64 | | | | (8.48 | ) |
Less Distributions: | | | | | | | | | | | | | | | | | | | | |
Distributions from net realized gain on investments | | | — | | | | — | | | | — | | | | (0.05 | ) | | | (5.56 | ) |
| | | | | | | | |
Total distributions | | | — | | | | — | | | | — | | | | (0.05 | ) | | | (5.56 | ) |
Net increase (decrease) in net asset value | | | 0.67 | | | | 0.56 | | | | 2.83 | | | | 0.59 | | | | (14.04 | ) |
Net Asset Value, End of Period | | | $13.03 | | | | $12.36 | | | | $11.80 | | | | $8.97 | | | | $8.38 | |
Total Return(b) | | | 5.42 | % | | | 4.75 | % | | | 31.55 | % | | | 7.79 | % | | | (47.87 | )% |
| | | | | | | | | | | | | | | | | | | | |
Ratios/Supplemental Data: | | | | | | | | | | | | | | | | | | | | |
Net Assets, End of Period (in 000’s) | | | $21,763 | | | | $26,300 | | | | $33,594 | | | | $32,140 | | | | $43,149 | |
Ratios of expenses to average net assets: | | | | | | | | | | | | | | | | | | | | |
Before reimbursement and/or waiver of expenses by Adviser | | | 1.83 | % | | | 1.65 | %(c) | | | 1.63 | % | | | 1.82 | %(c) | | | 1.55 | %(c) |
After reimbursement and/or waiver of expenses by Adviser | | | 1.49 | % | | | 1.49 | %(c) | | | 1.49 | % | | | 1.49 | %(c) | | | 1.49 | %(c) |
Ratios of net investment loss to average net assets: | | | | | | | | | | | | | | | | | | | | |
Before reimbursement and/or waiver of expenses by Adviser | | | (1.32 | )% | | | (1.19 | )% | | | (1.40 | )% | | | (1.48 | )% | | | (1.21 | )% |
After reimbursement and/or waiver of expenses by Adviser | | | (0.98 | )% | | | (1.03 | )% | | | (1.27 | )% | | | (1.15 | )% | | | (1.15 | )% |
Portfolio Turnover | | | 158.83 | %(d) | | | 197.43 | % | | | 187.83 | % | | | 264.98 | % | | | 166.19 | % |
| | | | | |
ASTON Small Cap Fund – Class I Year Ended October 31, (formerly, ASTON/Veredus Small Cap Growth Fund) | | 2012 | | | 2011 | | | 2010 | | | 2009 | | | 2008 | |
Per Share Operating Data: | | | | | | | | | | | | | | | | | | | | |
Net Asset Value, Beginning of Period | | | $12.80 | | | | $12.19 | | |
| $9.25
|
| | | $8.61 | | | | $22.83 | |
Income from Investment Operations: | | | | | | | | | | | | | | | | | | | | |
Net investment loss | | | (0.09 | )(a) | | | (0.11 | )(a) | |
| (0.11
| )(a)
| | | (0.08 | ) | | | (0.21 | ) |
Net realized and unrealized gain (loss) on investments | | | 0.82 | | | | 0.72 | | |
| 3.05
|
| | | 0.77 | | | | (8.45 | ) |
| | | | | | | | |
Total from investment operations | | | 0.73 | | | | 0.61 | | |
| 2.94
|
| | | 0.69 | | | | (8.66 | ) |
Less Distributions: | | | | | | | | | | | | | | | | | | | | |
Distributions from net realized gain on investments | | | — | | | | — | | |
| —
|
| | | (0.05 | ) | | | (5.56 | ) |
| | | | | | | | |
Total distributions | | | — | | | | — | | |
| —
|
| | | (0.05 | ) | | | (5.56 | ) |
Net increase (decrease) in net asset value | | | 0.73 | | | | 0.61 | | |
| 2.94
|
| | | 0.64 | | | | (14.22 | ) |
Net Asset Value, End of Period | | | $13.53 | | | | $12.80 | | |
| $12.19
|
| | | $9.25 | | | | $8.61 | |
Total Return(b) | | | 5.62 | % | | | 5.09 | % | |
| 31.78
| %
| | | 8.16 | % | | | (47.77 | )% |
| | | | | | | | | | | | | | | | | | | | |
Ratios/Supplemental Data: | | | | | | | | | | | | | | | | | | | | |
Net Assets, End of Period (in 000’s) | | | $2,400 | | | | $16,891 | | |
| $16,190
|
| | | $13,356 | | | | $16,719 | |
Ratios of expenses to average net assets: | | | | | | | | | | | | | | | | | | | | |
Before reimbursement and/or waiver of expenses by Adviser | | | 1.58 | % | | | 1.40 | %(c) | |
| 1.38
| %
| | | 1.57 | %(c) | | | 1.30 | %(c) |
After reimbursement and/or waiver of expenses by Adviser | | | 1.24 | % | | | 1.24 | %(c) | |
| 1.24
| %
| | | 1.24 | %(c) | | | 1.24 | %(c) |
Ratios of net investment loss to average net assets: | | | | | | | | | | | | | | | | | | | | |
Before reimbursement and/or waiver of expenses by Adviser | | | (1.07 | )% | | | (0.94 | )% | |
| (1.15
| )%
| | | (1.23 | )% | | | (0.96 | )% |
After reimbursement and/or waiver of expenses by Adviser | | | (0.73 | )% | | | (0.78 | )% | |
| (1.02
| )%
| | | (0.90 | )% | | | (0.90 | )% |
Portfolio Turnover | | | 158.83 | %(d) | | | 197.43 | % | |
| 187.83
| %
| | | 264.98 | % | | | 166.19 | % |
| | (a) | The selected per share data was calculated using the weighted average shares outstanding method for the period. |
| | (b) | The total return is calculated using the Net Asset Values used for trading at the close of business at period end. |
| | (c) | Ratios of expenses to average net assets include interest expense of less than 0.005% for the years ended October 31, 2011, October 31, 2009 and October 31, 2008, which is not included in the contractual expense limitation. The interest expense is from utilizing the line of credit. |
| | (d) | Portfolio turnover rate excludes securities delivered from processing a redemption-in-kind. |
Prospectus | 137
| | | | |
| ASTON/Silvercrest Small Cap Fund – Class N Year Ended October 31, | | 2012(a) | |
Per Share Operating Data: | | | | |
Net Asset Value, Beginning of Period | | | $10.00 | |
Income from Investment Operations: | | | | |
Net investment income | | | 0.01 | |
Net realized and unrealized gain on investments | | | 0.89 | |
Total from investment operations | | | 0.90 | |
Net increase in net asset value | | | 0.90 | |
Net Asset Value, End of Period | | | $10.90 | |
Total Return(b) | | | 9.00 | %(c) |
| | | | |
Ratios/Supplemental Data: | | | | |
Net Assets, End of Period (in 000’s) | | | $750 | |
Ratios of expenses to average net assets: | | | | |
Before reimbursement and/or waiver of expenses by Adviser | | | 5.10 | %(c) |
After reimbursement and/or waiver of expenses by Adviser | | | 1.40 | %(d) |
Ratios of net investment income (loss) to average net assets: | | | | |
Before reimbursement and/or waiver of expenses by Adviser | | | (3.51 | )%(d) |
After reimbursement and/or waiver of expenses by Adviser | | | 0.19 | %(d) |
Portfolio Turnover | | | 26.22 | %(c)(e) |
| |
| ASTON/Silvercrest Small Cap Fund – Class I Year Ended October 31, | | 2012(a) | |
Per Share Operating Data: | | | | |
Net Asset Value, Beginning of Period | | | $10.00 | |
Income from Investment Operations: | | | | |
Net investment income | | | 0.03 | |
Net realized and unrealized gain on investments | | | 0.90 | |
Total from investment operations | | | 0.93 | |
Net increase in net asset value | | | 0.93 | |
Net Asset Value, End of Period | | | $10.93 | |
Total Return(b) | | | 9.30 | %(c) |
| | | | |
Ratios/Supplemental Data: | | | | |
Net Assets, End of Period (in 000’s) | | | $4,962 | |
Ratios of expenses to average net assets: | | | | |
Before reimbursement and/or waiver of expenses by Adviser | | | 4.85 | %(d) |
After reimbursement and/or waiver of expenses by Adviser | | | 1.15 | %(d) |
Ratios of net investment income (loss) to average net assets: | | | | |
Before reimbursement and/or waiver of expenses by Adviser | | | (3.26 | )%(d) |
After reimbursement and/or waiver of expenses by Adviser | | | 0.44 | %(d) |
Portfolio Turnover | | | 26.22 | %(c)(e) |
| | (a) | ASTON/Silvercrest Small Cap Fund began issuing Class N shares and Class I shares on December 23, 2011. |
| | (b) | The total return is calculated using the Net Asset Values used for trading at the close of business at period end. |
| | (e) | Portfolio turnover rate excludes securities delivered from processing a redemption-in-kind. |
Prospectus | 138
| | | | | | | | |
| ASTON/DoubleLine Core Plus Fixed Income Fund – Class N Year Ended October 31, | | 2012 | | | 2011(a) | |
Per Share Operating Data: | | | | | | | | |
Net Asset Value, Beginning of Period | | | $10.44 | | | | $10.00 | |
Income from Investment Operations: | | | | | | | | |
Net investment income | | | 0.33 | (b) | | | 0.12 | (b) |
Net realized and unrealized gain on investments | | | 0.72 | | | | 0.41 | |
| | | | | | | | |
Total from investment operations | | | 1.05 | | | | 0.53 | |
Less Distributions: | | | | | | | | |
Distributions from and in excess of net investment income | | | (0.37 | ) | | | (0.09 | ) |
Distributions from net realized gain on investments | | | (0.02 | ) | | | — | |
| | | | | | | | |
Total distributions | | | (0.39 | ) | | | (0.09 | ) |
Net increase in net asset value | | | 0.66 | | | | 0.44 | |
Net Asset Value, End of Period | | | $11.10 | | | | $10.44 | |
Total Return(c) | | | 10.25 | % | | | 5.33 | (d) |
| | | | | | | | |
Ratios/Supplemental Data: | | | | | | | | |
Net Assets, End of Period (in 000’s) | | | $71,546 | | | | $22,657 | |
Ratios of expenses to average net assets: | | | | | | | | |
Before reimbursement and/or waiver of expenses by Adviser | | | 1.35 | % | | | 3.16 | %(e) |
After reimbursement and/or waiver of expenses by Adviser | | | 0.94 | % | | | 0.94 | %(e) |
Ratios of net investment income to average net assets: | | | | | | | | |
Before reimbursement and/or waiver of expenses by Adviser | | | 2.59 | % | | | 1.63 | %(e) |
After reimbursement and/or waiver of expenses by Adviser | | | 3.01 | % | | | 3.85 | %(e) |
Portfolio Turnover | | | 118.67 | % | | | 38.49 | %(d) |
| | | | | | | | |
| ASTON/DoubleLine Core Plus Fixed Income Fund – Class I Year Ended October 31, | | 2012 | | | 2011(a) | |
Per Share Operating Data: | | | | | | | | |
Net Asset Value, Beginning of Period | | | $10.44 | | | | $10.00 | |
Income from Investment Operations: | | | | | | | | |
Net investment income | | | 0.35 | (b) | | | 0.13 | (b) |
Net realized and unrealized gain on investments | | | 0.73 | | | | 0.41 | |
| | | | | | | | |
Total from investment operations | | | 1.08 | | | | 0.54 | |
Less Distributions: | | | | | | | | |
Distributions from and in excess of net investment income | | | (0.40 | ) | | | (0.10 | ) |
Distributions from net realized gain on investments | | | (0.02 | ) | | | — | |
| | | | | | | | |
Total distributions | | | (0.42 | ) | | | (0.10 | ) |
Net increase in net asset value | | | 0.66 | | | | 0.44 | |
Net Asset Value, End of Period | | | $11.10 | | | | $10.44 | |
Total Return(c) | | | 10.52 | % | | | 5.38 | (d) |
| | | | | | | | |
Ratios/Supplemental Data: | | | | | | | | |
Net Assets, End of Period (in 000’s) | | | $105,335 | | | | $4,486 | |
Ratios of expenses to average net assets: | | | | | | | | |
Before reimbursement and/or waiver of expenses by Adviser | | | 1.10 | % | | | 2.91 | %(e) |
After reimbursement and/or waiver of expenses by Adviser | | | 0.69 | % | | | 0.69 | %(e) |
Ratios of net investment income to average net assets: | | | | | | | | |
Before reimbursement and/or waiver of expenses by Adviser | | | 2.84 | % | | | 1.88 | %(e) |
After reimbursement and/or waiver of expenses by Adviser | | | 3.26 | % | | | 4.10 | %(e) |
Portfolio Turnover | | | 118.67 | % | | | 38.49 | %(d) |
| | (a) | ASTON/DoubleLine Core Plus Fixed Income Fund, began issuing Class N shares and Class I shares on July 15, 2011. |
| | (b) | The selected per share data was calculated using the weighted average shares outstanding method for the period. |
| | (c) | The total return is calculated using the Net Asset Values used for trading at the close of business at period end. |
Prospectus | 139
| | | | | | | | | | | | | | | | | | | | |
| ASTON/TCH Fixed Income Fund – Class N Year Ended October 31, | | 2012 | | | 2011 | | | 2010 | | | 2009 | | | 2008 | |
Per Share Operating Data: | | | | | | | | | | | | | | | | | | | | |
Net Asset Value, Beginning of Period | | | $10.59 | | | | $10.49 | | | | $10.02 | | | | $8.60 | | | | $9.73 | |
Income from Investment Operations: | | | | | | | | | | | | | | | | | | | | |
Net investment income | | | 0.45 | (a) | | | 0.47 | (a) | | | 0.50 | (a) | | | 0.49 | (a) | | | 0.47 | |
Net realized and unrealized gain (loss) on investments | | | 0.56 | | | | 0.10 | | | | 0.47 | | | | 1.44 | | | | (1.10 | ) |
| | | | |
Total from investment operations | | | 1.01 | | | | 0.57 | | | | 0.97 | | | | 1.93 | | | | (0.63 | ) |
Less Distributions: | | | | | | | | | | | | | | | | | | | | |
Distributions from and in excess of net investment income | | | (0.49 | ) | | | (0.47 | ) | | | (0.50 | ) | | | (0.51 | ) | | | (0.50 | ) |
| | | | |
Total distributions | | | (0.49 | ) | | | (0.47 | ) | | | (0.50 | ) | | | (0.51 | ) | | | (0.50 | ) |
Net increase (decrease) in net asset value | | | 0.52 | | | | 0.10 | | | | 0.47 | | | | 1.42 | | | | (1.13 | ) |
Net Asset Value, End of Period | | | $11.11 | | | | $10.59 | | | | $10.49 | | | | $10.02 | | | | $8.60 | |
Total Return(b) | | | 9.74 | % | | | 5.62 | % | | | 9.98 | % | | | 22.99 | % | | | (6.89 | )% |
| | | | | | | | | | | | | | | | | | | | |
Ratios/Supplemental Data: | | | | | | | | | | | | | | | | | | | | |
Net Assets, End of Period (in 000’s) | | | $59,772 | | | | $62,346 | | | | $46,274 | | | | $47,008 | | | | $42,765 | |
Ratios of expenses to average net assets: | | | | | | | | | | | | | | | | | | | | |
Before reimbursement and/or waiver of expenses by Adviser | | | 1.02 | % | | | 1.14 | % | | | 0.98 | % | | | 0.96 | % | | | 1.06 | % |
After reimbursement and/or waiver of expenses by Adviser | | | 0.86 | % | | | 0.88 | %(c) | | | 0.62 | % | | | 0.61 | % | | | 0.65 | %(c) |
Ratios of net investment income to average net assets: | | | | | | | | | | | | | | | | | | | | |
Before reimbursement and/or waiver of expenses by Adviser | | | 4.03 | % | | | 4.20 | % | | | 4.51 | % | | | 4.93 | % | | | 4.59 | % |
After reimbursement and/or waiver of expenses by Adviser | | | 4.19 | % | | | 4.46 | % | | | 4.87 | % | | | 5.28 | % | | | 5.00 | % |
Portfolio Turnover | | | 57.43 | % | | | 37.51 | % | | | 23.92 | % | | | 40.81 | % | | | 78.39 | % |
| | | | | | | | | | | | | | | | | | | | |
| ASTON/TCH Fixed Income Fund – Class I Year Ended October 31, | | 2012 | | | 2011 | | | 2010 | | | 2009 | | | 2008 | |
Per Share Operating Data: | | | | | | | | | | | | | | | | | | | | |
Net Asset Value, Beginning of Period | | | $10.59 | | | | $10.49 | | | | $10.02 | | | | $8.60 | | | | $9.73 | |
Income from Investment Operations: | | | | | | | | | | | | | | | | | | | | |
Net investment income | | | 0.47 | (a) | | | 0.49 | (a) | | | 0.51 | (a) | | | 0.50 | (a) | | | 0.48 | |
Net realized and unrealized gain (loss) on investments | | | 0.55 | | | | 0.11 | | | | 0.48 | | | | 1.44 | | | | (1.09 | ) |
| | | | |
Total from investment operations | | | 1.02 | | | | 0.60 | | | | 0.99 | | | | 1.94 | | | | (0.61 | ) |
Less Distributions: | | | | | | | | | | | | | | | | | | | | |
Distributions from and in excess of net investment income | | | (0.50 | ) | | | (0.50 | ) | | | (0.52 | ) | | | (0.52 | ) | | | (0.52 | ) |
| | | | |
Total distributions | | | (0.50 | ) | | | (0.50 | ) | | | (0.52 | ) | | | (0.52 | ) | | | (0.52 | ) |
Net increase (decrease) in net asset value | | | 0.52 | | | | 0.10 | | | | 0.47 | | | | 1.42 | | | | (1.13 | ) |
Net Asset Value, End of Period | | | $11.11 | | | | $10.59 | | | | $10.49 | | | | $10.02 | | | | $8.60 | |
Total Return(b) | | | 9.93 | % | | | 5.89 | % | | | 10.11 | % | | | 23.14 | % | | | (6.65 | )% |
| | | | | | | | | | | | | | | | | | | | |
Ratios/Supplemental Data: | | | | | | | | | | | | | | | | | | | | |
Net Assets, End of Period (in 000’s) | | | $10,396 | | | | $10,423 | | | | $14,881 | | | | $20,276 | | | | $25,891 | |
Ratios of expenses to average net assets: | | | | | | | | | | | | | | | | | | | | |
Before reimbursement and/or waiver of expenses by Adviser | | | 0.85 | % | | | 0.89 | % | | | 0.85 | % | | | 0.84 | % | | | 0.81 | % |
After reimbursement and/or waiver of expenses by Adviser | | | 0.69 | % | | | 0.63 | %(d) | | | 0.49 | % | | | 0.49 | % | | | 0.40 | %(d) |
Ratios of net investment income to average net assets: | | | | | | | | | | | | | | | | | | | | |
Before reimbursement and/or waiver of expenses by Adviser | | | 4.20 | % | | | 4.45 | % | | | 4.64 | % | | | 5.05 | % | | | 4.84 | % |
After reimbursement and/or waiver of expenses by Adviser | | | 4.36 | % | | | 4.71 | % | | | 5.00 | % | | | 5.40 | % | | | 5.25 | % |
Portfolio Turnover | | | 57.43 | % | | | 37.51 | % | | | 23.92 | % | | | 40.81 | % | | | 78.39 | % |
| | (a) | The selected per share data was calculated using the weighted average shares outstanding method for the period. |
| | (b) | The total return is calculated using the Net Asset Values used for trading at the close of business at period end. |
| | (c) | The Adviser’s contractual expense limitation, which affects the net expense ratio, was changed from 0.74% to 0.64% on September 1, 2007. Subsequently, on October 1, 2008, the Adviser’s expense reimbursement level changed from 0.64% to 0.74%. Subsequently, on March 1, 2011, the Adviser’s expense reimbursement level changed from 0.74% to 0.94%. The contractual expense limitation excludes interest, taxes, other investment-related costs (such as brokerage commissions), extraordinary expenses and acquired fund fees and expenses. |
| | (d) | The Adviser’s contractual expense limitation, which affects the net expense ratio, was changed from 0.49% to 0.39% on September 1, 2007. Subsequently, on October 1, 2008, the Adviser’s expense reimbursement level changed from 0.39% to 0.49%. Subsequently, on March 1, 2011, the Adviser’s expense reimbursement level changed from 0.49% to 0.69%. The contractual expense limitation excludes interest, taxes, other investment-related costs (such as brokerage commissions), extraordinary expenses and acquired fund fees and expenses. |
Prospectus | 140
| | | | | | | | | | | | |
| ASTON/Lake Partners LASSO Alternatives Fund – Class N Year Ended October 31, | | 2012 | | | 2011 | | | 2010(a) | |
Per Share Operating Data: | | | | | | | | | | | | |
Net Asset Value, Beginning of Period | | | $11.94 | | | | $11.97 | | | | $11.48 | |
Income from Investment Operations: | | | | | | | | | | | | |
Net investment gain | | | 0.04 | (b) | | | (0.01 | )(b) | | | 0.04 | (b) |
Net realized and unrealized gain on investments | | | 0.59 | | | | 0.13 | | | | 0.45 | |
| | | | | | | | |
Total from investment operations | | | 0.63 | | | | 0.12 | | | | 0.49 | |
Less Distributions: | | | | | | | | | | | | |
Distributions from and in excess of net investment income | | | (0.18 | ) | | | (0.08 | ) | | | — | |
Distributions from capital gains | | | — | | | | (0.07 | ) | | | — | |
| | | | | | | | |
Total distributions | | | (0.18 | ) | | | (0.15 | ) | | | — | |
Net increase (decrease) in net asset value | | | 0.45 | | | | (0.03 | ) | | | 0.49 | |
Net Asset Value, End of Period | | | $12.39 | | | | $11.94 | | | | $11.97 | |
Total Return(c) | | | 5.34 | % | | | 0.92 | % | | | 4.27 | %(d) |
| | | | | | | | | | | | |
Ratios/Supplemental Data: | | | | | | | | | | | | |
Net Assets, End of Period (in 000’s) | | | $33,719 | | | | 17,626 | | | | $8,296 | |
Ratios of expenses to average net assets: | | | | | | | | | | | | |
Before reimbursement and/or waiver of expenses by Adviser(e) | | | 1.41 | %(g)(k) | | | 1.53 | % | | | 2.19 | %(f) |
After reimbursement and/or waiver of expenses by Adviser(e) | | | 1.45 | %(g)(k) | | | 1.45 | % | | | 1.45 | %(f)(h) |
Ratios of net investment loss to average net assets: | | | | | | | | | | | | |
Before reimbursement and/or waiver of expenses by Adviser | | | 0.36 | %(g) | | | (0.17 | )% | | | (0.25 | )%(f) |
After reimbursement and/or waiver of expenses by Adviser | | | 0.32 | %(g) | | | (0.10 | )% | | | 0.49 | %(f) |
Portfolio Turnover | | | 45.60 | % | | | 79.77 | % | | | 116.68 | % |
| | | | | | | | | | | | | | | | |
| | | | |
| ASTON/Lake Partners LASSO Alternatives Fund – Class I Year Ended October 31, | | 2012 | | | 2011 | | | 2010 | | | 2009(i) | |
Per Share Operating Data: | | | | | | | | | | | | | | | | |
Net Asset Value, Beginning of Period | | | $11.97 | | | | $11.98 | | | | $11.15 | | | | $10.00 | |
Income from Investment Operations: | | | | | | | | | | | | | | | | |
Net investment income (loss) | | | 0.07 | (b) | | | 0.02 | (b) | | | 0.08 | (b) | | | (— | )(j) |
Net realized and unrealized gain on investments | | | 0.59 | | | | 0.13 | | | | 0.89 | | | | 1.15 | |
| | | | | | | | |
Total from investment operations | | | 0.66 | | | | 0.15 | | | | 0.97 | | | | 1.15 | |
Less Distributions: | | | | | | | | | | | | | | | | |
Distributions from and in excess of net investment income | | | (0.21 | ) | | | (0.09 | ) | | | (0.07 | ) | | | — | |
Distributions from net realized gain on investments | | | — | | | | (0.07 | ) | | | (0.07 | ) | | | — | |
| | | | | | | | |
Total distributions | | | (0.21 | ) | | | (0.16 | ) | | | (0.14 | ) | | | — | |
Net increase (decrease) in net asset value | | | 0.45 | | | | (0.01 | ) | | | 0.83 | | | | 1.15 | |
Net Asset Value, End of Period | | | $12.42 | | | | $11.97 | | | | $11.98 | | | | $11.15 | |
Total Return(c) | | | 5.56 | % | | | 1.22 | % | | | 8.74 | % | | | 11.50 | %(d) |
| | | | | | | | | | | | | | | | |
Ratios/Supplemental Data: | | | | | | | | | | | | | | | | |
Net Assets, End of Period (in 000’s) | | | $253,343 | | | | $189,999 | | | | $19,723 | | | | $1,845 | |
Ratios of expenses to average net assets: | | | | | | | | | | | | | | | | |
Before reimbursement and/or waiver of expenses by Adviser(e) | | | 1.16 | %(g)(k) | | | 1.28 | % | | | 2.32 | % | | | 18.16 | %(f) |
After reimbursement and/or waiver of expenses by Adviser(e) | | | 1.20 | %(g)(k) | | | 1.20 | % | | | 1.24 | %(l) | | | 1.35 | %(f) |
Ratios of net investment income (loss) to average net assets: | | | | | | | | | | | | | | | | |
Before reimbursement and/or waiver of expenses by Adviser | | | 0.61 | %(g) | | | 0.08 | % | | | (0.41 | )% | | | (16.92 | )%(f) |
After reimbursement and/or waiver of expenses by Adviser | | | 0.57 | %(g) | | | 0.15 | % | | | 0.67 | % | | | (0.11 | )%(f) |
Portfolio Turnover | | | 45.60 | % | | | 79.77 | % | | | 116.68 | % | | | 65.93 | %(d) |
| | (a) | ASTON/Lake Partners LASSO Alternatives Fund began issuing Class N shares on March 2, 2010. |
| | (b) | The selected per share data was calculated using the weighted average shares outstanding method for the period. |
| | (c) | The total return is calculated using the Net Asset Values used for trading at the close of business at period end. |
| | (e) | Does not include expenses of the underlying funds in which the Fund invests. |
| | (g) | Ratios of expenses and net investment income to average net assets include advisory fee waiver of less than 0.005% for the year ended October 31, 2012. |
| | (h) | Effective March 30, 2010, the contractual expense limitation was decreased from 1.60% to 1.45% excluding interest, taxes, other investment-related costs (such as brokerage commissions), extraordinary expenses and acquired fund fees and expenses. |
| | (i) | ASTON/Lake Partners LASSO Alternatives Fund began issuing Class I shares on March 31, 2009. |
| | (j) | Represents less than $(0.005) per share. |
| | (k) | Ratios of expenses to average net assets includes Earnings Credits of less than 0.005% for the year ended October 31, 2012, which is not included in the contractual expense limitation. |
| | (l) | Effective March 30, 2010, the contractual expense limitation was decreased from 1.35% to 1.20% excluding interest, taxes, other investment-related costs (such as brokerage commissions), extraordinary expenses and acquired fund fees and expenses. |
Prospectus | 141
| | | | | | | | | | | | | | | | | | | | |
ASTON/Anchor Capital Enhanced Equity Fund – Class N Year Ended October 31, (formerly, ASTON/M.D. Sass Enhanced Equity Fund) | | 2012 | | | 2011 | | | 2010 | | | 2009 | | | 2008(a) | |
Per Share Operating Data: | | | | | | | | | | | | | | | | | | | | |
Net Asset Value, Beginning of Period | | | $9.61 | | | | $9.41 | | | | $8.57 | | | | $8.09 | | | | $10.00 | |
Income from Investment Operations: | | | | | | | | | | | | | | | | | | | | |
Net investment income | | | 0.16 | | | | 0.14 | | | | 0.10 | | | | 0.11 | | | | 0.14 | |
Net realized and unrealized gain (loss) on investments | | | 0.11 | | | | 0.56 | | | | 0.84 | | | | 1.02 | | | | (1.91 | ) |
| | | | | | | | |
Total from investment operations | | | 0.27 | | | | 0.70 | | | | 0.94 | | | | 1.13 | | | | (1.77 | ) |
Less Distributions: | | | | | | | | | | | | | | | | | | | | |
Distributions from and in excess of net investment income | | | (0.16 | ) | | | (0.13 | ) | | | (0.10 | ) | | | (0.13 | ) | | | (0.14 | ) |
Distributions from net realized gain on investments | | | (1.04 | ) | | | (0.37 | ) | | | — | | | | (0.52 | ) | | | — | |
| | | | | | | | |
Total distributions | | | (1.20 | ) | | | (0.50 | ) | | | (0.10 | ) | | | (0.65 | ) | | | (0.14 | ) |
Net increase (decrease) in net asset value | | | (0.93 | ) | | | 0.20 | | | | 0.84 | | | | 0.48 | | | | (1.91 | ) |
Net Asset Value, End of Period | | | $8.68 | | | | $9.61 | | | | $9.41 | | | | $8.57 | | | | $8.09 | |
Total Return(b) | | | 3.12 | % | | | 7.69 | % | | | 11.05 | % | | | 15.86 | % | | | (17.91 | )%(c) |
| | | | | | | | | | | | | | | | | | | | |
Ratios/Supplemental Data: | | | | | | | | | | | | | | | | | | | | |
Net Assets, End of Period (in 000’s) | | | $106,191 | | | | $48,365 | | | | $46,423 | | | | $22,552 | | | | $14,389 | |
Ratios of expenses to average net assets: | | | | | | | | | | | | | | | | | | | | |
Before reimbursement, waiver and/or recoupment of expenses by Adviser | | | 1.22 | %(d)(f) | | | 1.24 | %(d) | | | 1.37 | % | | | 2.11 | % | | | 2.38 | %(e) |
After reimbursement, waiver and/or recoupment of expenses by Adviser | | | 1.27 | %(d)(f) | | | 1.33 | %(d) | | | 1.40 | % | | | 1.25 | %(g) | | | 1.10 | %(e) |
Ratios of net investment income to average net assets: | | | | | | | | | | | | | | | | | | | | |
Before reimbursement, waiver and/or recoupment of expenses by Adviser | | | 1.82 | % | | | 1.51 | % | | | 1.20 | % | | | 0.55 | % | | | 0.86 | %(e) |
After reimbursement, waiver and/or recoupment of expenses by Adviser | | | 1.78 | % | | | 1.41 | % | | | 1.17 | % | | | 1.41 | % | | | 2.14 | %(e) |
Portfolio Turnover | | | 56.33 | % | | | 87.37 | % | | | 41.33 | % | | | 51.56 | % | | | 23.68 | %(c) |
| | | | | | | | | | | | |
ASTON/Anchor Capital Enhanced Equity Fund – Class I Year Ended October 31, (formerly, ASTON/M.D. Sass Enhanced Equity Fund) | | 2012 | | | 2011 | | | 2010(h) | |
Per Share Operating Data: | | | | | | | | | | | | |
Net Asset Value, Beginning of Period | | | $9.62 | | | | $9.41 | | | | $9.04 | |
Income from Investment Operations: | | | | | | | | | | | | |
Net investment income | | | 0.18 | | | | 0.16 | | | | 0.09 | |
Net realized and unrealized gain on investments | | | 0.11 | | | | 0.57 | | | | 0.37 | |
| | | | | | | | |
Total from investment operations | | | 0.29 | | | | 0.73 | | | | 0.46 | |
Less Distributions: | | | | | | | | | | | | |
Distributions from and in excess of net investment income | | | (0.18 | ) | | | (0.15 | ) | | | (0.09 | ) |
Distributions from net realized gain on investments | | | (1.04 | ) | | | (0.37 | ) | | | — | |
| | | | | | | | |
Total distributions | | | (1.22 | ) | | | (0.52 | ) | | | (0.09 | ) |
Net increase in net asset value | | | (0.93 | ) | | | 0.21 | | | | 0.37 | |
Net Asset Value, End of Period | | | $ 8.69 | | | | $ 9.62 | | | | $9.41 | |
Total Return(b) | | | 3.46 | % | | | 7.97 | % | | | 5.10 | %(c) |
| | | | | | | | | | | | |
Ratios/Supplemental Data: | | | | | | | | | | | | |
Net Assets, End of Period (in 000’s) | | | $71,618 | | | | $64,840 | | | | $46,140 | |
Ratios of expenses to average net assets: | | | | | | | | | | | | |
Before reimbursement, waiver and/or recoupment of expenses by Adviser | | | 0.97 | %(d)(f) | | | 0.99 | %(d) | | | 1.10 | %(e) |
After reimbursement, waiver and/or recoupment of expenses by Adviser | | | 1.02 | %(d)(f) | | | 1.08 | %(d) | | | 1.15 | %(e) |
Ratios of net investment income to average net assets: | | | | | | | | | | | | |
Before reimbursement, waiver and/or recoupment of expenses by Adviser | | | 2.07 | % | | | 1.76 | % | | | 1.37 | %(e) |
After reimbursement, waiver and/or recoupment of expenses by Adviser | | | 2.03 | % | | | 1.66 | % | | | 1.32 | %(e) |
Portfolio Turnover | | | 56.33 | % | | | 87.37 | % | | | 41.33 | %(c) |
| | (a) | ASTON/Anchor Capital Enhanced Equity Fund began issuing Class N shares on January 14, 2008. |
| | (b) | The total return is calculated using the Net Asset Values used for trading at the close of business at period end. |
| | (d) | Ratios of expenses to average net assets include interest expenses of less than 0.005% for each of the years ended October 31, 2012 and October 31, 2011, which are not included in the contractual expense limitation. The interest expenses are from utilizing the line of credit. |
| | (f) | Ratios of expenses to average net assets include Earnings Credits of less than 0.005% for the year ended October 31, 2012, which is not included in the contractual expense limitation. |
| | (g) | Effective June 1, 2009, due to the change in Subadviser, the contractual expense limitation was increased from 1.10% to 1.40% excluding interest, taxes, other investment-related costs (such as brokerage commissions), extraordinary expenses and acquired fund fee’s and expenses. |
| | (h) | ASTON/Anchor Capital Enhanced Equity Fund began issuing Class I shares on March 2, 2010. |
Prospectus | 142
| | | | | | | | |
| ASTON/River Road Long-Short Fund – Class N Year Ended October 31, | | 2012 | | | 2011(a) | |
Per Share Operating Data: | | | | | | | | |
Net Asset Value, Beginning of Period | | | $9.91 | | | | $10.00 | |
Income from Investment Operations: | | | | | | | | |
Net investment loss | | | (0.18 | ) | | | (0.04 | )(b) |
Net realized and unrealized loss on investments | | | 1.00 | | | | (0.05 | ) |
| | | | | | | | |
Total from investment operations | | | 0.82 | | | | (0.09 | ) |
Less Distributions: | | | | | | | | |
Distributions from and in excess of net investment income | | | — | | | | — | |
Distributions from net realized gains on investments | | | — | | | | — | |
| | | | | | | | |
Total distributions | | | — | | | | — | |
Net decrease in net asset value | | | 0.82 | | | | (0.09 | ) |
Net Asset Value, End of Period | | | $10.73 | | | | $ 9.91 | |
Total Return(c) | | | 8.17 | % | | | (0.80 | )%(d) |
| | | | | | | | |
Ratios/Supplemental Data: | | | | | | | | |
Net Assets, End of Period (in 000’s) | | | $7,506 | | | | $4,594 | |
Ratios of expenses to average net assets: | | | | | | | | |
Before reimbursement and/or waiver of expenses by Adviser including interest and dividend expense for securities sold short | | | 5.03 | % | | | 8.68 | %(e) |
After reimbursement and/or waiver of expenses by Adviser including interest and dividend expense for securities sold short | | | 3.11 | % | | | 2.72 | %(e) |
After reimbursement and/or waiver of expenses by Adviser excluding interest and dividend expense for securities sold short | | | 1.70 | % | | | 1.70 | % |
Ratios of net investment income to average net assets: | | | | | | | | |
Before reimbursement and/or waiver of expenses by Adviser | | | (3.63 | )% | | | (6.80 | )%(e) |
After reimbursement and/or waiver of expenses by Adviser | | | (1.71 | )% | | | (0.84 | )%(e) |
Portfolio Turnover | | | 277.72 | % | | | 127.32 | %(d) |
| | (a) | ASTON/River Road Long-Short Fund began issuing Class N shares on May 3, 2011. |
| | (b) | The selected per share data was calculated using the weighted average shares outstanding method for the period. |
| | (c) | The total return is calculated using the Net Asset Values used for trading at the close of business at period end. |
Prospectus | 143
| | | | | | | | | | | | | | | | | | | | |
| ASTON/Barings International Fund – Class N Year Ended October 31, | | | | | | | | 2012 | | | 2011 | | | 2010(a) | |
Per Share Operating Data: | | | | | | | | | | | | | | | | | | | | |
Net Asset Value, Beginning of Period | | | | | | | | | | | $6.81 | | | | $7.24 | | | | $6.48 | |
Income from Investment Operations: | | | | | | | | | | | | | | | | | | | | |
Net investment income | | | | | | | | | | | 0.10 | (b) | | | 0.07 | (b) | | | 0.06 | (b) |
Net realized and unrealized gain (loss) on investments | | | | | | | | | | | 0.17 | | | | (0.37 | ) | | | 0.70 | |
| | | | | | | | | | | | | | | | |
Total from investment operations | | | | | | | | | | | 0.27 | | | | (0.30 | ) | | | 0.76 | |
Less Distributions: | | | | | | | | | | | | | | | | | | | | |
Distributions from and in excess of net investment income | | | | | | | | | | | (0.04 | ) | | | (0.13 | ) | | | — | |
Distributions from net realized gain on investments | | | | | | | | | | | (0.17 | ) | | | — | | | | — | |
| | | | | | | | | | | | | | | | |
Total distributions | | | | | | | | | | | (0.21 | ) | | | (0.13 | ) | | | — | |
Net increase (decrease) in net asset value | | | | | | | | | | | 0.06 | | | | (0.43 | ) | | | 0.76 | |
Net Asset Value, End of Period | | | | | | | | | | | $6.87 | | | | $6.81 | | | | $7.24 | |
Total Return(c) | | | | | | | | | | | 4.28 | % | | | (4.22 | )% | | | 11.73 | %(d) |
| | | | | | | | | | | | | | | | | | | | |
Ratios/Supplemental Data: | | | | | | | | | | | | | | | | | | | | |
Net Assets, End of Period (in 000’s) | | | | | | | | | | | $421 | | | | $393 | | | | $184 | |
Ratios of expenses to average net assets: | | | | | | | | | | | | | | | | | | | | |
Before reimbursement and/or waiver of expenses by Adviser | | | | | | | | | | | 1.60 | % | | | 1.68 | %(e) | | | 1.72 | %(f) |
After reimbursement and/or waiver of expenses by Adviser | | | | | | | | | | | 1.40 | % | | | 1.40 | %(e) | | | 1.40 | %(f) |
Ratios of net investment income to average net assets: | | | | | | | | | | | | | | | | | | | | |
Before reimbursement and/or waiver of expenses by Adviser | | | | | | | | | | | 1.30 | % | | | 0.76 | %(e) | | | 1.07 | %(f) |
After reimbursement and/or waiver of expenses by Adviser | | | | | | | | | | | 1.50 | % | | | 1.04 | %(e) | | | 1.39 | %(f) |
Portfolio Turnover | | | | | | | | | | | 33.48 | % | | | 58.96 | % | | | 65.32 | %(d) |
| | | | | |
| ASTON/Barings International Fund – Class I Year Ended October 31, | | 2012 | | | 2011 | | | 2010 | | | 2009 | | | 2008(g) | |
Per Share Operating Data: | | | | | | | | | | | | | | | | | | | | |
Net Asset Value, Beginning of Period | | | $6.82 | | | | $7.26 | | | | $6.44 | | | | $5.08 | | | | $10.00 | |
Income from Investment Operations: | | | | | | | | | | | | | | | | | | | | |
Net investment income | | | 0.12 | (b) | | | 0.09 | (b) | | | 0.06 | (b) | | | 0.10 | (b) | | | 0.10 | |
Net realized and unrealized gain (loss) on investments | | | 0.18 | | | | (0.38 | ) | | | 0.78 | | | | 1.27 | (h) | | | (5.02 | ) |
| | | | | | | | |
Total from investment operations | | | 0.30 | | | | (0.29 | ) | | | 0.84 | | | | 1.37 | | | | (4.92 | ) |
Less Distributions: | | | | | | | | | | | | | | | | | | | | |
Distributions from and in excess of net investment income | | | (0.06 | ) | | | (0.15 | ) | | | (0.02 | ) | | | (0.01 | ) | | | — | |
Distributions from net realized gain on investments | | | (0.17 | ) | | | — | | | | — | | | | — | | | | — | |
| | | | | | | | |
Total distributions | | | (0.23 | ) | | | (0.15 | ) | | | (0.02 | ) | | | (0.01 | ) | | | — | |
Net increase (decrease) in net asset value | | | 0.07 | | | | (0.44 | ) | | | 0.82 | | | | 1.36 | | | | (4.92 | ) |
Net Asset Value, End of Period | | | $6.89 | | | | $6.82 | | | | $7.26 | | | | $6.44 | | | | $5.08 | |
Total Return(c) | | | 4.72 | % | | | (4.09 | )% | | | 12.89 | % | | | 27.11 | % | | | (49.20 | )%(d) |
| | | | | | | | | | | | | | | | | | | | |
Ratios/Supplemental Data: | | | | | | | | | | | | | | | | | | | | |
Net Assets, End of Period (in 000’s) | | | $61,662 | | | | $52,390 | | | | $47,985 | | | | $28,277 | | | | $5,517 | |
Ratios of expenses to average net assets: | | | | | | | | | | | | | | | | | | | | |
Before reimbursement and/or waiver of expenses by Adviser | | | 1.35 | % | | | 1.43 | %(i) | | | 1.47 | % | | | 2.01 | % | | | 3.95 | %(f)(j) |
After reimbursement and/or waiver of expenses by Adviser | | | 1.15 | % | | | 1.15 | %(i) | | | 1.15 | % | | | 1.15 | % | | | 1.18 | %(f)(j) |
Ratios of net investment income (loss) to average net assets: | | | | | | | | | | | | | | | | | | | | |
Before reimbursement and/or waiver of expenses by Adviser | | | 1.55 | % | | | 1.01 | % | | | 0.63 | % | | | 0.80 | % | | | (1.11 | )%(f) |
After reimbursement and/or waiver of expenses by Adviser | | | 1.75 | % | | | 1.29 | % | | | 0.95 | % | | | 1.66 | % | | | 1.66 | %(f) |
Portfolio Turnover | | | 33.48 | % | | | 58.96 | % | | | 65.32 | % | | | 115.51 | % | | | 121.99 | %(d) |
| | (a) | ASTON/Barings International Fund began issuing Class N shares on March 2, 2010. |
| | (b) | The selected per share data was calculated using the weighted average shares outstanding method for the period. |
| | (c) | The total return is calculated using the Net Asset Values used for trading at the close of business at period end. |
| | (e) | For the period November 1, 2010 through February 28, 2011, the Adviser voluntarily waived management fees and/or reimbursed expenses at 1.40%. Effective March 1, 2011, the contractual expense limitation was decreased from 1.50% to 1.40% excluding interest, taxes, other investment-related costs (such as brokerage commissions), extraordinary expenses and acquired fund fees and expenses. |
| | (g) | ASTON/Barings International Fund began issuing Class I shares on November 1, 2007. |
| | (h) | Includes payments by affiliates which is less than $0.005 per share. |
| | (i) | For the period November 1, 2010 through February 28, 2011, the Adviser voluntarily waived management fees and/or reimbursed expenses at 1.15%. Effective March 1, 2011, the contractual expense limitation was decreased from 1.25% to 1.15% excluding interest, taxes, other investment-related costs (such as brokerage commissions), extraordinary expenses and acquired fund fees and expenses. |
| | (j) | Ratios of expenses to average net assets include interest expense of less than 0.01% for the period ended October 31, 2008, which is not included in the contractual or voluntary expense limitations. The interest expense is from utilizing the line of credit. |
Prospectus | 144
| | | | | | | | | | | | | | | | | | | | |
| ASTON/Harrison Street Real Estate Fund – Class N Year Ended October 31, | | 2012 | | | 2011 | | | 2010 | | | 2009 | | | 2008 | |
Per Share Operating Data: | | | | | | | | | | | | | | | | | | | | |
Net Asset Value, Beginning of Period | | | $8.97 | | | | $8.16 | | | | $5.77 | | | | $6.08 | | | | $15.59 | |
Income from Investment Operations: | | | | | | | | | | | | | | | | | | | | |
Net investment income | | | 0.15 | (a) | | | 0.15 | (a) | | | 0.14 | (a) | | | 0.15 | (a) | | | 0.07 | (a) |
Net realized and unrealized gain (loss) on investments | | | 1.44 | | | | 0.79 | | | | 2.36 | | | | (0.28 | ) | | | (5.50 | ) |
| | | | |
Total from investment operations | | | 1.59 | | | | 0.94 | | | | 2.50 | | | | (0.13 | ) | | | (5.43 | ) |
Less Distributions: | | | | | | | | | | | | | | | | | | | | |
Distributions from and in excess of net investment income | | | (0.07 | ) | | | (0.13 | ) | | | (0.11 | ) | | | (0.18 | ) | | | (0.09 | ) |
Distributions from net realized gain on investments | | | — | | | | — | | | | — | | | | — | | | | (3.99 | ) |
| | | | |
Total distributions | | | (0.07 | ) | | | (0.13 | ) | | | (0.11 | ) | | | (0.18 | ) | | | (4.08 | ) |
Net increase (decrease) in net asset value | | | 1.52 | | | | 0.81 | | | | 2.39 | | | | (0.31 | ) | | | (9.51 | ) |
Net Asset Value, End of Period | | | $10.49 | | | | $8.97 | | | | $8.16 | | | | $5.77 | | | | $6.08 | |
Total Return(b) | | | 17.85 | % | | | 11.66 | % | | | 43.77 | % | | | (1.44 | )% | | | (43.76 | )% |
| | | | | | | | | | | | | | | | | | | | |
Ratios/Supplemental Data: | | | | | | | | | | | | | | | | | | | | |
Net Assets, End of Period (in 000’s) | | | $10,381 | | | | $6,287 | | | | $6,158 | | | | $4,011 | | | | $6,030 | |
Ratios of expenses to average net assets: | | | | | | | | | | | | | | | | | | | | |
Before reimbursement and/or waiver of expenses by Adviser | | | 2.36 | % | | | 1.61 | %(c) | | | 1.68 | %(c) | | | 1.94 | % | | | 1.57 | %(c) |
After reimbursement and/or waiver of expenses by Adviser | | | 1.37 | % | | | 1.29 | %(c) | | | 1.37 | %(c) | | | 1.37 | % | | | 1.37 | %(c) |
Ratios of net investment income to average net assets: | | | | | | | | | | | | | | | | | | | | |
Before reimbursement and/or waiver of expenses by Adviser | | | 0.53 | % | | | 1.36 | % | | | 1.65 | % | | | 2.55 | % | | | 0.49 | % |
After reimbursement and/or waiver of expenses by Adviser | | | 1.52 | % | | | 1.68 | % | | | 1.96 | % | | | 3.12 | % | | | 0.69 | % |
Portfolio Turnover | | | 86.62 | %(d) | | | 143.86 | % | | | 75.30 | % | | | 139.76 | % | | | 85.08 | % |
| | | | | | | | | | | | | | | | | | | | |
| ASTON/Harrison Street Real Estate Fund – Class I Year Ended October 31, | | 2012 | | | 2011 | | | 2010 | | | 2009 | | | 2008 | |
Per Share Operating Data: | | | | | | | | | | | | | | | | | | | | |
Net Asset Value, Beginning of Period | | | $8.92 | | | | $8.12 | | | | $5.74 | | | | $6.08 | | | | $15.62 | |
Income from Investment Operations: | | | | | | | | | | | | | | | | | | | | |
Net investment income | | | 0.15 | (a) | | | 0.16 | (a) | | | 0.16 | (a) | | | 0.16 | (a) | | | 0.09 | (a) |
Net realized and unrealized gain (loss) on investments | | | 1.46 | | | | 0.79 | | | | 2.34 | | | | (0.28 | ) | | | (5.51 | ) |
| | | | |
Total from investment operations | | | 1.61 | | | | 0.95 | | | | 2.50 | | | | (0.12 | ) | | | (5.42 | ) |
Less Distributions: | | | | | | | | | | | | | | | | | | | | |
Distributions from and in excess of net investment income | | | (0.09 | ) | | | (0.15 | ) | | | (0.12 | ) | | | (0.22 | ) | | | (0.13 | ) |
Distributions from net realized gain on investments | | | — | | | | — | | | | — | | | | — | | | | (3.99 | ) |
| | | | |
Total distributions | | | (0.09 | ) | | | (0.15 | ) | | | (0.12 | ) | | | (0.22 | ) | | | (4.12 | ) |
Net increase (decrease) in net asset value | | | 1.52 | | | | 0.80 | | | | 2.38 | | | | (0.34 | ) | | | (9.54 | ) |
Net Asset Value, End of Period | | | $10.44 | | | | $8.92 | | | | $8.12 | | | | $5.74 | | | | $6.08 | |
Total Return(b) | | | 18.16 | % | | | 11.82 | % | | | 44.14 | % | | | (1.27 | )% | | | (43.58 | )% |
| | | | | | | | | | | | | | | | | | | | |
Ratios/Supplemental Data: | | | | | | | | | | | | | | | | | | | | |
Net Assets, End of Period (in 000’s) | | | $166 | | | | $32,925 | | | | $29,425 | | | | $21,905 | | | | $23,411 | |
Ratios of expenses to average net assets: | | | | | | | | | | | | | | | | | | | | |
Before reimbursement and/or waiver of expenses by Adviser | | | 2.11 | % | | | 1.44 | %(c) | | | 1.43 | %(c) | | | 1.69 | % | | | 1.32 | %(c) |
After reimbursement and/or waiver of expenses by Adviser | | | 1.12 | % | | | 1.12 | %(c) | | | 1.12 | %(c) | | | 1.12 | % | | | 1.12 | %(c) |
Ratios of net investment income to average net assets: | | | | | | | | | | | | | | | | | | | | |
Before reimbursement and/or waiver of expenses by Adviser | | | 0.78 | % | | | 1.53 | % | | | 1.90 | % | | | 2.80 | % | | | 0.74 | % |
After reimbursement and/or waiver of expenses by Adviser | | | 1.77 | % | | | 1.85 | % | | | 2.21 | % | | | 3.37 | % | | | 0.94 | % |
Portfolio Turnover | | | 86.62 | %(d) | | | 143.86 | % | | | 75.30 | % | | | 139.76 | % | | | 85.08 | % |
| | (a) | The selected per share data was calculated using the weighted average shares outstanding method for the period. |
| | (b) | The total return is calculated using the Net Asset Values used for trading at the close of business at period end. |
| | (c) | Ratios of expenses to average net assets include interest expense of less than 0.005% for the years ended October 31, 2011, October 31, 2010 and October 31, 2008, which is not included in the contractual expense limitation. The interest expenses is from utilizing the line of credit. |
| | (d) | Portfolio turnover rate excludes securities delivered from processing a redemption-in-kind. |
Prospectus | 145
| | | | | | | | | | | | | | | | | | | | |
| ASTON/Montag & Caldwell Balanced Fund – Class N Year Ended October 31, | | 2012 | | | 2011 | | | 2010 | | | 2009 | | | 2008 | |
Per Share Operating Data: | | | | | | | | | | | | | | | | | | | | |
Net Asset Value, Beginning of Period | | | $20.09 | | | | $19.13 | | | | $17.73 | | | | $15.61 | | | | $19.98 | |
Income from Investment Operations: | | | | | | | | | | | | | | | | | | | | |
Net investment income | | | 0.16 | (a) | | | 0.15 | (a) | | | 0.21 | (a) | | | 0.21 | (a) | | | 0.29 | |
Net realized and unrealized gain (loss) on investments | | | 1.45 | | | | 1.03 | | | | 1.47 | | | | 2.15 | | | | (4.42 | ) |
| | | | | | | | |
Total from investment operations | | | 1.61 | | | | 1.18 | | | | 1.68 | | | | 2.36 | | | | (4.13 | ) |
Less Distributions: | | | | | | | | | | | | | | | | | | | | |
Distributions from and in excess of net investment income | | | (0.24 | ) | | | (0.22 | ) | | | (0.28 | ) | | | (0.24 | ) | | | (0.24 | ) |
| | | | | | | | |
Total distributions | | | (0.24 | ) | | | (0.22 | ) | | | (0.28 | ) | | | (0.24 | ) | | | (0.24 | ) |
Net increase (decrease) in net asset value | | | 1.37 | | | | 0.96 | | | | 1.40 | | | | 2.12 | | | | (4.37 | ) |
Net Asset Value, End of Period | | | $21.46 | | | | $20.09 | | | | $19.13 | | | | $17.73 | | | | $15.61 | |
Total Return(b) | | | 8.03 | % | | | 6.20 | % | | | 9.54 | % | | | 15.32 | % | | | (20.87 | )% |
| | | | | | | | | | | | | | | | | | | | |
Ratios/Supplemental Data: | | | | | | | | | | | | | | | | | | | | |
Net Assets, End of Period (in 000’s) | | | $31,536 | | | | $23,315 | | | | $29,194 | | | | $14,938 | | | | $16,586 | |
Ratios of expenses to average net assets: | | | | | | | | | | | | | | | | | | | | |
Before reimbursement and/or waiver of expenses by Adviser | | | 1.42 | % | | | 1.57 | %(c) | | | 1.38 | % | | | 1.73 | % | | | 1.74 | % |
After reimbursement and/or waiver of expenses by Adviser | | | 1.22 | % | | | 1.35 | %(c) | | | 1.13 | % | | | 1.26 | % | | | 1.35 | % |
Ratios of net investment income to average net assets: | | | | | | | | | | | | | | | | | | | | |
Before reimbursement and/or waiver of expenses by Adviser | | | 0.57 | % | | | 0.53 | % | | | 0.89 | % | | | 0.81 | % | | | 0.74 | % |
After reimbursement and/or waiver of expenses by Adviser | | | 0.77 | % | | | 0.76 | % | | | 1.15 | % | | | 1.28 | % | | | 1.13 | % |
Portfolio Turnover | | | 35.48 | % | | | 40.31 | % | | | 51.68 | %(d) | | | 38.72 | % | | | 43.65 | % |
| | | | | |
| ASTON/Montag & Caldwell Balanced Fund – Class I Year Ended October 31, | | 2012 | | | 2011 | | | 2010 | | | 2009 | | | 2008 | |
Per Share Operating Data: | | | | | | | | | | | | | | | | | | | | |
Net Asset Value, Beginning of Period | | | $20.05 | | | | $19.08 | | | | $17.68 | | | | $15.57 | | | | $19.94 | |
Income from Investment Operations: | | | | | | | | | | | | | | | | | | | | |
Net investment income | | | 0.19 | (a) | | | 0.20 | (a) | | | 0.22 | (a) | | | 0.23 | (a) | | | 0.27 | |
Net realized and unrealized gain (loss) on investments | | | 1.44 | | | | 1.04 | | | | 1.46 | | | | 2.16 | | | | (4.35 | ) |
| | | | | | | | |
Total from investment operations | | | 1.63 | | | | 1.24 | | | | 1.68 | | | | 2.39 | | | | (4.08 | ) |
Less Distributions: | | | | | | | | | | | | | | | | | | | | |
Distributions from and in excess of net investment income | | | (0.27 | ) | | | (0.27 | ) | | | (0.28 | ) | | | (0.28 | ) | | | (0.29 | ) |
| | | | | | | | |
Total distributions | | | (0.27 | ) | | | (0.27 | ) | | | (0.28 | ) | | | (0.28 | ) | | | (0.29 | ) |
Net increase (decrease) in net asset value | | | 1.36 | | | | 0.97 | | | | 1.40 | | | | 2.11 | | | | (4.37 | ) |
Net Asset Value, End of Period | | | $21.41 | | | | $20.05 | | | | $19.08 | | | | $17.68 | | | | $15.57 | |
Total Return(b) | | | 8.14 | % | | | 6.52 | % | | | 9.57 | % | | | 15.53 | % | | | (20.71 | )% |
| | | | | | | | | | | | | | | | | | | | |
Ratios/Supplemental Data: | | | | | | | | | | | | | | | | | | | | |
Net Assets, End of Period (in 000’s) | | | $1,930 | | | | $1,415 | | | | $1,362 | | | | $1,149 | | | | $919 | |
Ratios of expenses to average net assets: | | | | | | | | | | | | | | | | | | | | |
Before reimbursement and/or waiver of expenses by Adviser | | | 1.30 | % | | | 1.32 | %(e) | | | 1.35 | % | | | 1.57 | % | | | 1.49 | % |
After reimbursement and/or waiver of expenses by Adviser | | | 1.10 | % | | | 1.10 | %(e) | | | 1.10 | % | | | 1.10 | % | | | 1.10 | % |
Ratios of net investment income to average net assets: | | | | | | | | | | | | | | | | | | | | |
Before reimbursement and/or waiver of expenses by Adviser | | | 0.69 | % | | | 0.79 | % | | | 0.92 | % | | | 0.97 | % | | | 0.99 | % |
After reimbursement and/or waiver of expenses by Adviser | | | 0.89 | % | | | 1.02 | % | | | 1.17 | % | | | 1.44 | % | | | 1.38 | % |
Portfolio Turnover | | | 35.48 | % | | | 40.31 | % | | | 51.68 | %(d) | | | 38.72 | % | | | 43.65 | % |
| | (a) | The selected per share data was calculated using the weighted average shares outstanding method for the period. |
| | (b) | The total return is calculated using the Net Asset Values used for trading at the close of business at period end. |
| | (c) | Ratios of expenses to average net assets include interest expense of less than 0.005% for the year ended October 31, 2011, which is not included in the voluntary expense limitation. The interest expenses are from utilizing the line of credit. |
| | (d) | Portfolio turnover rate excludes securities received from the reorganization. |
| | (e) | Ratios of expenses to average net assets include interest expenses of less than 0.01% for the years ended October 31, 2011, which is not included in the voluntary expense limitation. The interest expenses are from utilizing the line of credit. |
Prospectus | 146
General Information
If you wish to know more about Aston Funds, you will find additional information in the following documents:
SHAREHOLDER REPORTS
You will receive an unaudited semi-annual report dated April 30 and an annual report dated October 31, which is audited by an independent registered public accounting firm. The annual report contains a discussion of the market conditions and investment strategies that significantly affected each Fund’s performance during its last fiscal year.
STATEMENT OF ADDITIONAL INFORMATION (SAI)
The SAI, which is incorporated into this prospectus by reference and dated February 28, 2013, as amended from time to time, is available to you without charge and can be mailed to you upon request. It contains more detailed information about the Funds.
HOW TO OBTAIN REPORTS
Contacting Aston Funds
You can get free copies of the reports and SAI, request other information and get answers to your questions about the Funds by contacting:
| | | | |
| Address: | | Aston Funds P.O. Box 9765 Providence, RI 02940 | | |
| | |
| Phone: | | Shareholder Services & Fund Literature Investment Advisor Services | | 800-992-8151 800-597-9704 |
| | |
| Website: | | www.astonfunds.com | | |
Obtaining Information from the SEC
You can visit the EDGAR Database on the SEC’s website at http://www.sec.gov to view the SAI and other information. You can also view and copy information about the Funds at the SEC’s Public Reference Room in Washington, D.C. To find out more about the Public Reference Room, you can call the SEC at 202 551-8090. Also, you can obtain copies of this information after paying a duplicating fee, by electronic request at the following E-mail address: publicinfo@sec.gov, or by writing the SEC’s Public Reference Section, Washington D.C. 20549-1520.
Investment Company Act File Number: 811-8004
Prospectus | 147

Aston Funds
P.O. Box 9765
Providence, RI 02940
ATN PRO 13
STATEMENT OF ADDITIONAL INFORMATION
Dated , 2013
Relating to the Acquisition of the Assets and Liabilities of
ASTON Small Cap Fund (formerly, ASTON/Veredus Small Cap Growth Fund)
120 N. LaSalle St.
Chicago, Illinois 60602
Telephone: (312) 268-1400
This Statement of Additional Information (“SAI”) is not a prospectus but should be read in conjunction with the Proxy Statement/Prospectus dated , 2013 for use in connection with the Special Meeting of Shareholders (the “Special Meeting”) of ASTON Small Cap Fund (the “Target Fund”), a series of Aston Funds (the “Trust”), to be held on April 16, 2013. At the Special Meeting, shareholders of the Target Fund will be asked to approve the reorganization (the “Reorganization”) of the Target Fund into ASTON/LMCG Small Cap Growth Fund (the “Acquiring Fund” and together with the Target Fund, the “Funds”) as described in the Proxy Statement/Prospectus. Copies of the Proxy Statement/Prospectus may be obtained at no charge by writing to the Trust at the address shown above or by calling (800) 992-8151.
Further information about the Funds is contained in the Trust’s Statement of Additional Information dated February 28, 2013 which is incorporated herein by reference only insofar as it relates to the Target Fund or Acquiring Fund. No other parts are incorporated by reference herein.
The unaudited pro forma financial information, attached hereto as Appendix A, is intended to present the financial condition and related results of operations of the Acquiring Fund as if the Reorganization had been consummated on November 1, 2011.
The Trust’s audited financial statements and related independent registered public accounting firm’s report contained in the Trust’s Annual Report for the fiscal year ended October 31, 2012 are incorporated herein by reference only insofar as they relate to the Acquiring Fund and the Target Fund. No other parts of the Annual Report are incorporated by reference herein.
The date of this Statement of Additional Information is , 2013.
1
APPENDIX A
UNAUDITED PRO FORMA FINANCIAL INFORMATION
The unaudited pro forma financial information set forth below is for informational purposes only and does not purport to be indicative of the financial condition that actually would have resulted if the Reorganization had been consummated. These pro forma numbers have been estimated in good faith based on information regarding the Target Fund and Acquiring Fund for the fiscal year ended October 31, 2012, using the fees and expenses information shown in the Proxy Statement/Prospectus. The unaudited pro forma financial information should be read in conjunction with the historical financial statements of the Target Fund and Acquiring Fund, which are available in the Trust’s Annual Report.
Narrative Description of the Pro Forma Effects of the Reorganization
Note 1—Reorganization
The unaudited pro forma information has been prepared to give effect to the proposed Reorganization of the Target Fund into the Acquiring Fund pursuant to an Agreement and Plan of Reorganization (the “Agreement”) as if the Reorganization had occurred at the beginning of the most recently completed fiscal year (i.e., on November 1, 2011).
| | |
Target Fund | | Acquiring Fund |
| |
ASTON Small Cap Fund | | ASTON/LMCG Small Cap Growth Fund |
Note 2—Basis of Pro Forma
The Reorganization will be accounted for as a tax-free reorganization for federal income tax purposes; therefore, no gain or loss will be recognized by the Target Fund or its shareholders as a direct result of the Reorganization. The Target Fund and the Acquiring Fund are both series of the Trust, a registered open-end management investment company. The Reorganization would be accomplished by the acquisition of all of the assets and the assumption of all of the liabilities of the Target Fund by the Acquiring Fund in exchange for shares of the Acquiring Fund and the distribution of such shares to Target Fund shareholders in complete liquidation of the Target Fund. The table below shows the class and shares that Target Fund shareholders would have received if the Reorganization had taken place on October 31, 2012.
| | | | |
Target Fund Share Class | | Acquiring Fund
Shares Issued | | Acquiring Fund
Share Class |
| | |
N | | 1,905,690 | | N |
I | | 209,453 | | I |
Under accounting principles generally accepted in the United States of America, the historical cost of investment securities will be carried forward to the surviving entity, the Acquiring Fund, and the results of operations of the Acquiring Fund for pre-reorganization periods will not be restated.
| | | | | | |
Fund | �� | Net Assets | | | As-of Date |
| | |
ASTON Small Cap Fund (Target Fund) | | | 24,163,305 | | | 10/31/12 |
ASTON/LMCG Small Cap Growth Fund
(Acquiring Fund) | | | 6,413,230 | | | 10/31/12 |
ASTON/LMCG Small Cap Growth Fund (Pro Forma Combined) | | | 30,576,535 | | | 10/31/12 |
1
Note 3—Pro Forma Adjustments
The table below reflects adjustments to annual expenses made to the pro forma combined fund financial information as if the Reorganization had taken place at the beginning of the most recently completed fiscal year (i.e., on November 1, 2011) using the fees and expenses information shown in the Proxy Statement/Prospectus. The pro forma information has been derived from the books and records used in calculating daily net asset values of the Target Fund and Acquiring Fund and has been prepared in accordance with accounting principles generally accepted in the United States of America, which require management to make estimates and assumptions that affect this information. Actual results could differ from those estimates.
| | |
Expense Category | | Increase
(Decrease) |
Management Fees(1) | | – |
Professional fees(2) (3) | | $62,505 |
Shareholders’ reports–printing and mailing expenses(4) | | $19,400 |
Custodian’s fees and expenses(2) | | – |
Federal and state registration fees(2) | | $(31,689) |
Investment Advisory fees waived | | $(32,260) |
Transfer agent fees(2) | | $(40,385) |
Administration fees(2) | | $(12,000) |
Other expenses(2) | | $(4,678) |
| (1) | The Funds have the same management fees. |
| (2) | Reflects the anticipated reduction of certain duplicative expenses eliminated as a result of the Reorganization and applicable Reorganization costs. |
| (3) | Includes estimated Reorganization costs of $15,000 for audit and $65,000 for legal. |
| (4) | Reorganization costs related to proxy solicitation. |
No significant accounting policies will change as a result of the Reorganization, specifically policies regarding security valuation or compliance with Subchapter M of the Internal Revenue Code of 1986, as amended. No significant changes to any existing material agreements of the Acquiring Fund are expected as a result of the Reorganization.
Note 4—Fair Value Measurements
The inputs and valuation techniques used to measure fair value of the Funds’ net assets are summarized into three levels as described in the hierarchy below:
| | • | | Level 1 - unadjusted quoted prices in active markets for identical assets or liabilities |
| | • | | Level 2 - other significant observable inputs (including quoted prices for similar securities, interest rates, prepayments speeds, credit risk, etc.) |
| | • | | Level 3 - significant unobservable inputs (including the Funds’ own assumptions in determining the fair value of the investments) |
The inputs or methodology used for valuing securities are not necessarily an indication of the risk associated with investing in those securities. Transfers in and out of the levels are recognized at the market value at the end of the period. The summary of each Fund’s investments that are measured at fair value by Level within the fair value hierarchy as of October 31, 2012 is as follows:
| | | | | | | | |
Fund | | Total Value at
10/31/12 | | Level 1 Quoted
Prices | | Level 2 Significant
Observable Inputs | | Level 3 Significant
Unobservable
Inputs |
| ASTON Small Cap Fund (Target Fund) | | $24,652,246 | | $24,652,246 | | $— | | $— |
| | | | |
| ASTON/LMCG Small Cap Growth Fund (Acquiring Fund) | | $6,619,173 | | $6,619,173 | | $— | | $— |
| | | | |
| Aston/LMCG Small Cap Growth Fund (Pro Forma Combined) | | $31,271,419 | | $31,271,419 | | $— | | $— |
At the end of each calendar quarter, management evaluates the Level 2 and 3 assets and liabilities for changes in liquidity, including but not limited to: whether a broker is willing to execute at the quoted price, the depth and consistency of prices from third party services, and the existence of contemporaneous observable trades in the market. Additionally, management evaluates the Level 1 and 2 assets and liabilities on a quarterly basis for changes in listings or delistings on national exchanges. Due to the inherent uncertainty of determining the fair value of investments that do not have a readily available market value, the fair value of the Funds’ investments may fluctuate from period to period. Additionally, the fair value of investments may differ significantly from the values that would have been used had a ready market existed for such investments and may differ materially from the values the Funds may ultimately realize. Further, such investments may be subject to legal and other restrictions on resale or otherwise less liquid than publicly-traded securities.
Note 5—Reorganization Costs
The Target Fund is expected to be charged an estimated $74,200 in Reorganization costs. These costs represent the estimated nonrecurring expense of the Target Fund carrying out its obligations under the Agreement and consist of management’s estimate of professional services fees, filing fees, printing costs and mailing charges related to the proposed Reorganization to be borne by the Target Fund. The Acquiring Fund is expected to be charged approximately $25,200 of expenses in connection with the Reorganization.
Note 6—Accounting Survivor
The Acquiring Fund will be the accounting survivor. The surviving fund will have the portfolio management team, portfolio composition, strategies, investment objective, expense structure and policies/restrictions of the Acquiring Fund.
Note 7—Capital Loss Carryforward
On October 31, 2012 the Target Fund had capital loss carryforwards of approximately $18,854,524 million. On October 31, 2012 the Acquiring Fund did not have any capital loss carryforwards. For additional information regarding capital loss limitations, please see the section
2
entitled “The Proposed Reorganization—Material Federal Income Tax Consequences” in the Proxy Statement/Prospectus.
3
Aston Funds
Supplement dated March 4, 2013
to the Statement of Additional Information dated February 28, 2013
IMPORTANT NOTICE
This supplement provides new and additional information beyond that contained in the Statement of Additional Information (“SAI”) and should be retained and read in conjunction with the SAI. Keep it for future reference.
The following information replaces the first paragraph under the “Control Persons and Principal Holders of Securities” section on page 68 of the SAI in its entirety:
Listed below are the names and addresses of those shareholders who, as of January 30, 2013, owned of record or beneficially 5% or more of the shares of a class of a Fund. Shareholders who have the power to vote a large percentage of shares (at least 25% of the voting shares of a Fund) of a particular Fund can control the Fund and determine the outcome of a shareholder meeting.
The following information is added to the “Control Persons and Principal Holders of Securities – ASTON/River Road Dividend All Cap Value Fund” on page 73 of the SAI:
| | | | | | |
ASTON/River Road Dividend All Cap Value Fund |
Shareholder Name and Address | | Class | | Shares Owned | | Percent of Class |
| | | |
Raymond James OMNIBUS for Mutual Funds ATTN Courtney Waller 880 Carillon PKWY Saint Petersburg, FL 33716 | | I | | 7,248,188.689 | | 14.3058% |
The following information replaces the third entry under the “Control Persons and Principal Holders of Securities – ASTON/Lake Partners LASSO Alternatives Fund” on page 85 of the SAI in its entirety:
| | | | | | |
ASTON/Lake Partners LASSO Alternatives Fund |
Shareholder Name and Address | | Class | | Shares Owned | | Percent of Class |
| | | |
Pershing LLC PO Box 2052 Jersey City, NJ 07399 | | N | | 503,816.455 | | 17.2138% |
SAI SUP 313

ASTON FUNDS
STATEMENT OF ADDITIONAL INFORMATION
February 28, 2013
| | | | | | |
| | | Ticker Symbols |
EQUITY FUNDS | | Class N | | Class I | | Class R |
ASTON/Montag & Caldwell Growth Fund | | MCGFX | | MCGIX | | MCRGX |
ASTON/Herndon Large Cap Value Fund | | AALIX | | AHRNX | | — |
ASTON/Cornerstone Large Cap Value Fund | | RVALX | | AAVIX | | — |
ASTON/TAMRO Diversified Equity Fund | | ATLVX | | ATDEX | | — |
ASTON/River Road Dividend All Cap Value Fund | | ARDEX | | ARIDX | | — |
ASTON/River Road Dividend All Cap Value Fund II | | ADVTX | | ADIVX | | __ |
ASTON/Fairpointe Mid Cap Fund | | CHTTX | | ABMIX | | — |
ASTON/Montag & Caldwell Mid Cap Growth Fund | | AMCMX | | — | | — |
ASTON/TAMRO Small Cap Fund | | ATASX | | ATSIX | | — |
ASTON/River Road Select Value Fund | | ARSMX | | ARIMX | | — |
ASTON/River Road Small Cap Value Fund | | ARSVX | | ARSIX | | — |
ASTON/River Road Independent Value Fund | | ARIVX | | ARVIX | | — |
ASTON/LMCG Small Cap Growth Fund | | ACWDX | | ACWIX | | — |
ASTON Small Cap Fund | | VERDX | | AVEIX | | — |
ASTON/Silvercrest Small Cap Fund | | ASCTX | | ACRTX | | __ |
| | | |
FIXED INCOME FUNDS | | | | | | |
ASTON/DoubleLine Core Plus Fixed Income Fund | | ADBLX | | ADLIX | | — |
ASTON/TCH Fixed Income Fund | | CHTBX | | CTBIX | | — |
| | | |
ALTERNATIVE FUNDS | | | | | | |
ASTON/Lake Partners LASSO Alternatives Fund | | ALSNX | | ALSOX | | — |
ASTON/Anchor Capital Enhanced Equity Fund | | AMBEX | | AMDSX | | — |
ASTON/River Road Long-Short Fund | | ARLSX | | ALSIX | | |
| | | |
INTERNATIONAL FUND | | | | | | |
ASTON/Barings International Fund | | ABARX | | ABIIX | | — |
| | | |
SECTOR FUND | | | | | | |
ASTON/Harrison Street Real Estate Fund | | ARFCX | | AARIX | | — |
| | | |
BALANCED FUND | | | | | | |
ASTON/Montag & Caldwell Balanced Fund | | MOBAX | | MOBIX | | — |
SAI213
This Statement of Additional Information dated February 28, 2013 (“SAI”) provides supplementary information pertaining to shares representing interests in the twenty-three currently available investment portfolios (each a “Fund” and collectively, the “Funds”) of Aston Funds (the “Trust”).
This SAI is not a prospectus and should be read only in conjunction with the Funds’ current prospectus dated February 28, 2013, as amended or supplemented from time to time (the “Prospectus”). No investment in any of the Funds should be made without first reading the Prospectus.
The audited financial statements for the fiscal year ended October 31, 2012 for the Funds are incorporated herein by reference to the Funds’ Annual Reports as filed with the Securities and Exchange Commission (“SEC”). This SAI is incorporated by reference to the Prospectus.
You may obtain a prospectus, annual report or semi-annual report, when available, at no charge by contacting the Trust at Aston Funds, P.O. Box 9765, Providence, RI 02940 or 800-992-8151 or by downloading such information from www.astonfunds.com. The website does not form a part of the Prospectus or SAI.
TABLE OF CONTENTS
i
NO PERSON HAS BEEN AUTHORIZED TO GIVE ANY INFORMATION OR TO MAKE ANY REPRESENTATIONS NOT CONTAINED IN THIS SAI OR IN THE PROSPECTUS IN CONNECTION WITH THE OFFERINGS MADE BY THE PROSPECTUS. IF GIVEN OR MADE, SUCH INFORMATION OR REPRESENTATIONS MUST NOT BE RELIED UPON AS HAVING BEEN AUTHORIZED BY THE TRUST OR THE DISTRIBUTOR. THE PROSPECTUS DOES NOT CONSTITUTE AN OFFERING BY THE TRUST OR THE DISTRIBUTOR IN ANY JURISDICTION IN WHICH SUCH OFFERING MAY NOT LAWFULLY BE MADE.
THE FUNDS
Aston Funds, 120 N. LaSalle Street, 25th Floor, Chicago, Illinois 60602, is an open-end management investment company. Each Fund is classified as diversified under the Investment Company Act of 1940, as amended (the “1940 Act”), except ASTON/Harrison Street Real Estate Fund and ASTON/River Road Long-Short Fund, which are classified as non-diversified. Each Fund is a series of the Trust, which was formed as a Delaware statutory trust on September 10, 1993.
INVESTMENT OBJECTIVES, STRATEGIES AND RISK CONSIDERATIONS
The following supplements the information contained in the Prospectus concerning the investment objective(s), strategies and risks of investing in the Funds. Except as otherwise stated below or in the Prospectus, a Fund may invest in the portfolio investments included in this section. The investment practices described below, except as further set forth in “Investment Restrictions” are not fundamental and may be changed by the Board of Trustees of the Trust (the “Board”) without the approval of shareholders.
American Depositary Receipts (“ADRs”), Continental Depositary Receipts (“CDRs”), European Depositary Receipts (“EDRs”) and Global Depositary Receipts (“GDRs”)
ADRs are securities, typically issued by a U.S. financial institution (a “depositary”), that evidence ownership interest in a security or a pool of securities issued by a foreign issuer and deposited with the depositary. EDRs, which are sometimes referred to as CDRs, are securities, typically issued by a non-U.S. financial institution, that evidence ownership interest in a security or a pool of securities issued by either a U.S. or foreign issuer. GDRs are issued globally and evidence a similar ownership arrangement. Generally, ADRs are designed for trading in the U.S. securities market. EDRs are designed for trading in European securities markets and GDRs are designed for trading in non-U.S. securities markets. Generally, depositary receipts may be available through “sponsored” or “unsponsored” facilities. A sponsored facility is established jointly by the issuer of the security underlying the receipt and a depositary, whereas an unsponsored facility may be established by a depositary without participation by the issuer of the underlying security. Holders of unsponsored depositary receipts generally bear all the costs of the unsponsored facility. The depositary of an unsponsored facility frequently is under no obligation to distribute shareholder communications received from the issuer of the deposited security or to pass through, to the holders of the receipts, voting rights with respect to the deposited securities.
Asset-Backed Securities
Asset-backed securities are securities backed by installment contracts, credit card and other receivables or other financial assets. Asset-backed securities represent interests in “pools” of assets in which payments of both interest and principal on the securities are made monthly, thus in effect “passing through” monthly payments made by the individual borrowers on the assets underlying securities, net of any fees paid to the issuer or guarantor of the securities. The average life of asset-backed securities varies with the maturities of the underlying assets. An asset-backed security’s stated maturity may be shortened if the underlying assets are pre paid, and the security’s total return may be difficult to predict precisely. The risk that recovery on repossessed collateral might be unavailable or inadequate to support payments on asset-backed securities is greater than in the case for mortgage-backed securities. Falling interest rates generally result in an increase in the rate of prepayments while rising interest rates generally decrease the rate of prepayments. An acceleration in prepayments in response to sharply falling interest rates will shorten the security’s average maturity and limit the potential appreciation in the security’s value relative to a conventional debt security.
1
Below Investment-Grade (High Yield) Debt Securities
Fixed income securities rated Ba or lower by Moody’s Investor Service (“Moody’s”) or BB or lower by Standard & Poor’s (“S&P”), frequently referred to as “junk bonds,” are considered to be predominantly speculative. They generally offer higher yields than bonds issued by entities with stronger creditworthiness. Such securities are subject to a substantial degree of credit risk. High-yield bonds held by a Fund may be issued as a consequence of corporate restructurings, such as leveraged buy-outs, mergers, acquisitions, debt recapitalizations or similar events. Additionally, high-yield bonds are often issued by smaller, less creditworthy companies or by highly leveraged firms, which are generally less able than more financially stable firms to make scheduled payments of interest and principal. The risks posed by bonds issued under such circumstances are substantial. Changes by recognized rating agencies in their rating of any security and in the ability of an issuer to make payments of interest and principal will ordinarily have a more dramatic effect on the values of these investments than on the values of higher-rated securities. Such changes in value will not affect cash income derived from these securities, unless the issuers fail to pay interest or principal when due. Such changes will, however, affect a Fund’s net asset value per share.
The higher yields from low-grade bonds are intended to compensate for the higher default rates on such securities. However, there can be no assurance that diversification will protect a Fund from widespread bond defaults brought about by a sustained economic downturn, or that yields will offset default rates on high-yield bonds. Issuers of these securities are often highly leveraged, so that their ability to service their debt obligations during an economic downturn or during sustained periods of rising interest rates may be impaired. In addition, such issuers may not have more traditional methods of financing available to them and may be unable to repay debt at maturity by refinancing.
The value of lower-rated debt securities will be influenced not only by changing interest rates, but also by the bond market’s perception of credit quality and the outlook for economic growth. When economic conditions appear to be deteriorating, lower rated bonds may decline in market value due to investors’ heightened concern over credit quality, regardless of prevailing interest rates. Adverse publicity and investor perceptions, whether or not based on fundamental analysis, may decrease the value and liquidity of lower-rated securities held by a Fund, especially in a thinly traded market. Illiquid or restricted securities held by a Fund may involve valuation difficulties. Trading in the secondary market for high-yield bonds may become thin and market liquidity may be significantly reduced. Even under normal conditions, the market for high-yield bonds may be less liquid than the market for investment-grade corporate bonds. There are fewer securities dealers in the high-yield market, and purchasers of high-yield bonds are concentrated among a smaller group of securities dealers and institutional investors. In periods of reduced market liquidity, high-yield bond prices may become more volatile.
Lower-Rated Securities Market – An economic downturn or increase in interest rates is likely to have an adverse effect on the lower-rated securities market generally (resulting in more defaults) and on the value of lower-rated securities contained in the portfolios of a Fund.
Sensitivity to Economic and Interest Rate Changes – The economy and interest rates can affect lower-rated securities differently from other securities. For example, the prices of lower-rated securities are more sensitive to adverse economic changes or individual corporate developments than are the prices of higher-rated investments. Also, during an economic downturn or substantial period of rising interest rates, highly leveraged issuers may experience financial stress which would adversely affect their ability to service their principal and interest payment obligations, to meet projected business goals or to obtain additional financing. If the issuer of a lower-rated security defaulted, a Fund may incur additional expenses to seek recovery. In addition, periods of economic uncertainty and changes can be expected to result in increased volatility of market prices of lower-rated securities and a Fund’s net asset values.
2
Liquidity and Valuation – To the extent that an established secondary market does not exist and a particular obligation is thinly traded, the obligation’s fair value may be difficult to determine because of the absence of reliable, objective data. As a result, a Fund’s valuation of the obligation and the price it could obtain upon its disposition could differ.
Credit Ratings – The credit ratings of Moody’s and S&P are evaluations of the safety of principal and interest payments. There is a risk that credit rating agencies may fail to timely change the credit ratings to reflect subsequent events. Therefore, in addition to using recognized rating agencies and other sources, the investment adviser or subadviser also performs its own analysis of issuers in selecting investments for a Fund. The investment adviser or subadviser’s analysis of issuers may include, among other things, historic and current financial condition, current and anticipated cash flow and borrowing strength of management, responsiveness to business conditions, credit standing and current and anticipated results of operations.
Yields and Ratings – The yields on certain obligations are dependent on a variety of factors, including general market conditions, conditions in the particular market for the obligation, the financial condition of the issuer, the size of the offering, the maturity of the obligation and the ratings of the issue. The ratings of Moody’s and S&P represent their respective opinions as to the quality of the obligations they undertake to rate. Ratings, however, are general and are not absolute standards of quality. Consequently, obligations with the same rating, maturity and interest rate may have different market prices.
While any investment carries some risk, certain risks associated with lower-rated securities are different from those for investment-grade securities. The risk of loss through default is greater because lower-rated securities are usually unsecured and are often subordinate to an issuer’s other obligations. Additionally, the issuers of these securities frequently have high debt levels and are thus more sensitive to difficult economic conditions, individual corporate developments and rising interest rates. Consequently, the market price of these securities may be quite volatile and may result in wider fluctuations of a Fund’s net asset value per share.
Borrowing
A Fund may not borrow money or issue senior securities, except as described in this paragraph or as described in “Investment Restrictions.” Any policy under “Investment Restrictions” which contradicts policies described in this paragraph governs that applicable Fund’s policy on borrowing. A Fund may borrow from banks or enter into reverse repurchase agreements for temporary purposes in amounts up to 10% of the value of its total assets. A Fund may not mortgage, pledge or hypothecate any assets, except in connection with permitted borrowing or other permitted investment techniques. Any borrowing will be from a bank with asset coverage of at least 300%, if required. In the event that such asset coverage shall at any time fall below 300%, a Fund shall, within three days thereafter (not including Sundays or holidays) or such longer period as the SEC may prescribe by rules and regulations, reduce the amount of its borrowings to such an extent that the asset coverage of such borrowings shall be at least 300%.
Convertible Securities
Common stock occupies the most junior position in a company’s capital structure. Convertible securities entitle the holder to exchange the securities for a specified number of shares of common stock, usually of the same company, at specified prices within a certain period of time, and to receive interest or dividends until the holder elects to convert. The provisions of any convertible security determine its ranking in a company’s capital structure. In the case of subordinated convertible debentures, the holder’s claims on assets and earnings are subordinated to the claims of other creditors and are senior to the claims of preferred and common shareholders. In the case of preferred stock and convertible preferred stock, the
3
holder’s claims on assets and earnings are subordinated to the claims of all creditors but are senior to the claims of common shareholders.
Derivative Instruments
The term “derivatives” has been used to identify a range and variety of financial instruments. In general, a derivative is commonly defined as a financial instrument whose performance and value are derived, at least in part, from another source, such as the performance of an underlying asset, a specific security or an index of securities. As is the case with other types of investments, a Fund’s derivative instruments may entail various types and degrees of risk, depending upon the characteristics of the derivative instrument and a Fund’s overall portfolio.
Each Fund may use derivative instruments for hedging purposes, to maintain liquidity or in anticipation of changes in the composition of its portfolio holdings or as otherwise provided in the Prospectus. Certain Funds may use derivatives to seek exposure to a particular market or asset class in an attempt to achieve their objective. A Fund will invest in one or more derivatives only to the extent that the instrument under consideration is judged by the investment adviser or subadviser to be consistent with a Fund’s overall investment objective and policies. In making such judgment, the potential benefits and risks will be considered in relation to a Fund’s other portfolio investments.
Where not specified, investment limitations with respect to a Fund’s derivative instruments will be consistent with such Fund’s existing percentage limitations with respect to its overall investment policies and restrictions. The types of derivative securities in which certain Funds are permitted to invest include, but are not limited to, forward commitments, foreign currency contracts, futures contracts, options, and swap agreements.
Certain investment transactions expose the Funds to an obligation to make future payments to third parties. Examples of these types of transactions, include, but are not limited to, derivatives such as swaps, futures, forwards, and options. To the extent that a Fund engages in such transactions, the Fund will (to the extent required by applicable law) either (1) segregate cash or liquid assets in the prescribed amount or (2) otherwise “cover” its future obligations under the transaction, such as by holding an offsetting investment. If a Fund segregates sufficient cash or other liquid assets or otherwise covers its obligations under such transactions, the Fund will not consider the transactions to be borrowings for purposes of its investment restrictions or “senior securities” under the 1940 Act, and therefore, such transactions will not be subject to the 300% asset coverage requirement under the 1940 Act otherwise applicable to borrowings by the Fund.
In some cases (e.g., with respect to futures and forwards that are contractually required to “cash-settle”), a Fund will segregate cash or other liquid assets with respect to the amount of the daily net (marked-to-market) obligation arising from the transaction, rather than the notional amount of the underlying contract. By segregating assets in an amount equal to the net obligation rather than the notional amount, a Fund will have the ability to employ leverage to a greater extent than if it set aside cash or other liquid assets equal to the notional amount of the contract which may increase the risk associated with such transactions. Whenever a Fund is required to segregate assets for 1940 Act purposes, notations on the books of the Trust’s custodian or fund accounting agent are sufficient to constitute a segregated account.
Assets used as segregation or “cover” cannot be sold while the position in the corresponding transaction is open, unless they are replaced with other appropriate assets. As a result, the commitment of a large portion of the Fund’s assets for segregation and “cover” purposes could impede portfolio management or the Fund’s ability to meet redemption requests or other current obligations. Segregating
4
assets or otherwise “covering” for these purposes does not necessarily limit the percentage of the assets of the Fund that may be at risk with respect to certain derivative transactions.
Dollar Rolls
Dollar roll transactions consist of the sale of mortgage-backed securities to a bank or broker-dealer, together with a commitment to purchase similar, but not necessarily identical, securities at a future date. Any difference between the sale price and the purchase price is netted against the interest income foregone on the securities to arrive at an implied borrowing (reverse repurchase) rate. Alternatively, the sale and purchase transactions that constitute the dollar roll can be executed at the same price, with a Fund being paid a fee as consideration for entering into the commitment to purchase. Dollar rolls may be renewed after cash settlement and initially may involve only a firm commitment agreement by a Fund to buy a security. A Fund will segregate cash or liquid securities in an amount at least equal to its obligations under the dollar roll transaction. Whenever a Fund is required to segregate assets for 1940 Act purposes, notations on the books of the Trust’s custodian or fund accounting agent are sufficient to constitute a segregated account.
If the broker-dealer to whom a Fund sells the security becomes insolvent, a Fund’s right to purchase or repurchase the security may be restricted. Also, the value of the security may change adversely over the term of the dollar roll, such that the security that a Fund is required to repurchase may be worth less than the security that a Fund originally held.
Emerging Market Securities
Investments in emerging market countries may be subject to additional and potentially higher risks than investments in developed countries or in foreign countries in general. Such additional risks include (i) less social, political and economic stability; (ii) a small market for securities and/or a low or nonexistent volume of trading, which result in a lack of liquidity and in greater price volatility; (iii) foreign exchanges and broker-dealers may be subject to less scrutiny and regulation by local authorities; (iv) certain national policies that may restrict a Fund’s investment opportunities, including restrictions on investment in issuers or industries deemed sensitive to national interests; (v) foreign taxation; (vi) issuers facing restrictions on dollar or euro payments imposed by local governments may attempt to make dividend or interest payments to foreign investors in the local currency; (vii) investors may experience difficulty in enforcing legal claims related to the securities and/or local judges may favor the interests of the issuer over those of foreign investors; (vii) bankruptcy judgments may only be permitted to be paid in the local currency; (ix) limited public information regarding the issuer may result in greater difficulty in determining market valuations of the securities, and (x) infrequent financial reporting, substandard disclosure, and differences in accounting standards may make it difficult to ascertain the financial health of an issuer. In addition, unlike developed countries, many emerging countries’ economic growth highly depends on exports and inflows of external capital, making them more vulnerable to the downturns of the world economy. The recent global financial crisis weakened the global demand for emerging countries’ exports and tightened international credit supplies and, as a result, many emerging countries faced significant economic difficulties and some countries fell into recession.
Authoritarian governments in certain developing countries may require that a governmental or quasi-governmental authority act as custodian of a Fund’s assets invested in such country. To the extent such governmental or quasi-governmental authorities do not satisfy the requirements of the 1940 Act, with respect to the custody of a Fund’s cash and securities, a Fund’s investment in such countries may be limited or may be required to be effected through intermediaries. The risk of loss through governmental confiscation may be increased in such countries.
5
Many emerging market countries in which a Fund may invest lack the social, political, and economic stability characteristic of the U.S. Political instability among emerging market countries can be common and may be caused by an uneven distribution of wealth, social unrest, labor strikes, civil wars, and religious oppression. Economic instability in emerging market countries may take the form of: (i) high interest rates; (ii) high levels of inflation, including hyperinflation; (iii) high levels of unemployment or underemployment; (iv) changes in government economic and tax policies, including confiscatory taxation (or taxes on foreign investments); and (v) imposition of trade barriers. In recent years, many emerging market countries have undergone political changes that have reduced government’s role in economic and personal affairs and have stimulated investment and growth.
Currencies of emerging market countries are subject to significantly greater risks than currencies of developed countries. Some emerging market currencies may not be internationally traded or may be subject to strict controls by local governments, resulting in undervalued or overvalued currencies. Some emerging market countries have experienced balance of payment deficits and shortages in foreign exchange reserves. As a result, some governments have responded by restricting currency conversions. Future restrictive exchange controls could prevent or restrict a company’s ability to make dividend or interest payments in the original currency of the obligation (usually U.S. dollars). In addition, even though the currencies of some emerging market countries may be convertible into U.S. dollars, the conversion rates may be artificial to their actual market values.
Securities of issuers located in countries with developing securities markets pose greater liquidity risks and other risks than securities of issuers located in developed countries and traded in more established markets. Low liquidity in markets may adversely affect a Fund’s ability to buy and sell securities and cause increased volatility. Developing countries may at various times have less stable political environments than more developed nations. Changes of control may adversely affect the pricing of securities from time to time. Some developing countries may afford only limited opportunities for investing. In certain developing countries, a Fund may be able to invest solely or primarily through ADRs or similar securities and government approved investment vehicles, including closed-end investment companies.
The settlement systems in certain emerging markets, including Asian, South American and Eastern European countries, are less developed than in more established markets. As a result, there may be a risk that settlement may be delayed and that cash or securities of a Fund may be in jeopardy because of failures or of defects in the systems used. In particular, market practice may require that payment be made prior to receipt of the security which is being purchased or that delivery of a security must be made before payment is received. In such cases, default by the executing broker or bank might result in a loss to a Fund investing in emerging market securities. Governments of many emerging market countries have become overly reliant on the international capital markets and other forms of foreign credit to finance large public spending programs which cause huge budget deficits. Often, interest payments have become too overwhelming for these governments to meet, as these payments may represent a large percentage of a country’s total GDP. Accordingly, these foreign obligations have become the subject of political debate and resulted in pressure on governments not to make payments to foreign creditors, but instead to use these funds for social programs. Either due to an inability to pay or submission to political pressure, some governments have been forced to seek a restructuring of their credit obligations, have declared a temporary suspension of interest payments, or have defaulted on their outstanding obligations. These events have adversely affected the values of securities issued by the governments and corporations domiciled in these emerging market countries and have negatively affected not only their cost of borrowing, but their ability to borrow in the future as well.
Equity Securities
Equity securities represent a share of an issuer’s earnings and assets, after the issuer pays its liabilities. The Funds cannot predict the income they will receive from equity securities because issuers
6
generally have discretion as to the payment of any dividends or distributions. However, equity securities offer greater potential for appreciation than many other types of securities, because their value may increase with the value of the issuer’s business. The following describes various types of equity securities in which the Funds invest.
Common Stocks
Common stocks are the most prevalent type of equity security. Common stocks receive the issuer’s earnings after the issuer pays its creditors and any preferred stockholders. As a result, changes in an issuer’s earnings may influence the value of its common stock.
Preferred Stocks
Preferred stocks have the right to receive specified dividends or distributions before the issuer makes payments on its common stock. Some preferred stocks also participate in dividends and distributions paid on common stock. Preferred stocks may also permit the issuer to redeem the stock. A Fund may treat such redeemable preferred stock as a fixed income security.
Warrants and Rights
Warrants give a Fund the option to buy the issuer’s equity securities at a specified price (the exercise price) at a specified future date (the expiration date). A Fund may buy the designated securities by paying the exercise price before the expiration date. Warrants may become worthless if the price of the stock does not rise above the exercise price by the expiration date. This increases the market risks of warrants as compared to the underlying security.
Rights are the same as warrants, except companies typically issue rights to existing stockholders.
Exchange-Traded Notes
Exchange-traded notes (“ETNs”) are securities that combine aspects of a bond and an exchange-traded fund (“ETF”). ETN returns are based upon the performance of a market index or other reference asset less fees, and can be held to maturity as a debt security. ETNs are traded on a securities exchange. Their value is based on their reference index or strategy and the credit quality of the issuer. ETNs are subject to the additional risk that they may trade at a premium or discount to value attributable to their reference index. When a Fund invests in an ETN, shareholders of the Fund bear their proportionate share of the ETN’s fees and expenses, as well as their share of the Fund’s fees and expenses. There may also not be an active trading market available for some ETNs. Additionally, trading of ETNs may be halted or delisted by the listing exchange.
Fixed Income Securities
Fixed income securities pay interest, dividends or distributions at a specified rate. The rate may be a fixed percentage of the principal or adjusted periodically. In addition, the issuer of a fixed income security must repay the principal amount of the security, normally within a specified time. Fixed income securities provide more regular income than equity securities. However, the returns on fixed income securities are limited and normally do not increase with the issuer’s earnings. This limits the potential appreciation of fixed income securities as compared to equity securities.
A security’s yield measures the annual income earned on a security as a percentage of its price. A security’s yield will increase or decrease depending upon whether it costs less (a discount) or more (a premium) than the principal amount. If the issuer may redeem the security before its scheduled maturity,
7
the price and yield on a discount or premium security may change based upon the probability of an early redemption. Securities with higher risks generally have higher yields.
The following describes various types of fixed income securities in which a Fund may invest.
Treasury Securities
Treasury securities are direct obligations of the federal government. Treasury securities are generally regarded as having the lowest credit risks.
Agency Securities
Agency securities are issued or guaranteed by a federal agency or other government sponsored entity (a “GSE”) acting under federal authority. The U.S. government supports some GSEs with its full faith and credit. Other GSEs receive support through federal subsidies, loans or other benefits. A few GSEs have no explicit financial support, but are regarded as having implied support because the federal government sponsors their activities. Agency securities are generally regarded as having low credit risks, but not as low as treasury securities.
Although a GSE guarantee protects against credit risks, it does not reduce the market and prepayment risks of these mortgage-backed securities.
Corporate Debt Securities
Corporate debt securities are fixed income securities issued by businesses. Notes, bonds, debentures and commercial paper are the most prevalent types of corporate debt securities. Certain Funds may also purchase interests in bank loans to companies. The credit risks of corporate debt securities vary widely among issuers.
In addition, the credit risk of an issuer’s debt security may vary based on its priority for repayment. For example, higher ranking (senior) debt securities have a higher priority than lower ranking (subordinated) securities. This means that the issuer might not make payments on subordinated securities while continuing to make payments on senior securities. In addition, in the event of bankruptcy, holders of senior securities may receive amounts otherwise payable to the holders of subordinated securities. Some subordinated securities, such as trust preferred and capital securities notes, also permit the issuer to defer payments under certain circumstances. For example, insurance companies issue securities known as surplus notes that permit the insurance company to defer any payment that would reduce its capital below regulatory requirements.
Commercial Paper
Commercial paper is an issuer’s obligation with a maturity of less than nine months. Companies typically issue commercial paper to pay for current expenditures. Most issuers constantly reissue their commercial paper and use the proceeds (or bank loans) to repay maturing paper. If the issuer cannot continue to obtain liquidity in this fashion, its commercial paper may default.
Demand Instruments
Demand instruments are corporate debt securities that the issuer must repay upon demand. Other demand instruments require a third party, such as a dealer or bank, to repurchase the security for its face value upon demand.
8
Pooled Vehicles
The Funds may invest in debt securities indirectly through pooled products typically organized as trust structures (e.g., TRAINS and TRACERS) and typically sold pursuant to Rule 144A under the Securities Act of 1933, as amended (the “1933 Act”). TRAINS, TRACERS and similar products contain a basket of debt securities that are designed to provide broad credit exposure in a single product. The Funds will incur transaction costs associated with such products and may be subject to the credit risk of the sponsoring entity.
Forward Foreign Currency Exchange Contracts
Many international equity securities in which a Fund may invest will be traded in foreign currencies. A Fund may engage in certain foreign currency transactions, such as forward foreign currency exchange contracts, to guard against fluctuations in currency exchange rates in relation to the U.S. dollar or to the weighting of particular foreign currencies. In addition, a Fund may buy and sell foreign currency futures contracts and options on foreign currencies and foreign currency futures. A Fund may use such investments for hedging purposes or as otherwise provided in the Prospectus, including for total return purposes.
A forward foreign currency exchange contract involves an obligation to purchase or sell a specific currency at a future date, which may be any fixed number of days from the date of the contract agreed upon by the parties, at a price set at the time of the contract. By entering into a forward foreign currency exchange contract, a Fund “locks in” the exchange rate between the currency it will deliver and the currency it will receive for the duration of the contract. As a result, a Fund reduces its exposure to changes in the value of the currency it will deliver and increases its exposure to changes in the value of the currency it will exchange into. Contracts to sell foreign currencies would limit any potential gain which might be realized by a Fund if the value of the hedged currency increases. A Fund may enter into these contracts for the purpose of hedging against foreign exchange risks arising from a Fund’s investment or anticipated investment in securities denominated in foreign currencies. Such hedging transactions may not be successful and may eliminate any chance for a Fund to benefit from favorable fluctuations in relevant foreign currencies. In the case of a forward foreign currency exchange contract, a Fund will segregate cash or liquid securities at least in an amount equal to its obligations under the contract. Whenever a Fund is required to segregate assets for 1940 Act purposes, notations on the books of the Trust’s custodian or fund accounting agent are sufficient to constitute a segregated account. See also “Derivative Instruments.”
A Fund may also enter into forward foreign currency exchange contracts for purposes of increasing exposure to a foreign currency or to shift exposure to foreign currency fluctuations from one currency to another. To the extent that it does so, a Fund will be subject to the additional risk that the relative value of currencies will be different than anticipated by the particular Fund’s investment adviser or subadviser. A Fund may use one currency (or a basket of currencies) to hedge against adverse changes in the value of another currency (or a basket of currencies) when exchange rates between the two currencies are positively correlated. A Fund may also use foreign currency futures contracts and related options on currencies for the same reasons for which forward foreign currency exchange contracts are used.
The use of currency transactions can result in a Fund incurring losses as a result of a number of factors including the imposition of exchange controls, suspension of settlements, or the inability to deliver or receive a specified currency.
9
Foreign Securities
Foreign securities may subject a Fund to investment risks that differ in some respects from those related to investments in U.S. domestic issuers. Such risks may include costs in connection with conversions between various currencies, limited publicly available information regarding foreign issuers, lack of uniformity in accounting, auditing and financial standards and requirements, greater securities market volatility, less liquidity of securities, less government supervision and regulations of securities markets, future adverse political and economic developments, the possible imposition of withholding taxes on interest, dividends or other income, possible seizure, nationalization, or expropriation of foreign deposits, the possible establishment of exchange controls or taxation at the source, greater fluctuations in value due to changes in exchange rates, or the adoption of other foreign governmental restrictions which might adversely affect the payment of principal and interest on such obligations. Such investments may also entail higher custodial fees and sales commissions than domestic investments. Foreign issuers of securities or obligations are often subject to accounting treatment and engage in business practices different from those with respect to domestic issuers of similar securities or obligations. Foreign branches of U.S. banks and foreign banks may be subject to less stringent reserve requirements than those applicable to domestic branches of U.S. banks. Government regulation in many of the countries of interest to a Fund may limit the extent of a Fund’s investment in companies in those countries. Further, it may be more difficult for a Fund’s agents to keep currently informed about corporate actions that may affect the prices of portfolio securities. Communications between the U.S. and foreign countries may be less reliable than within the U.S., increasing the risk of delayed settlements of portfolio securities. Certain markets may require payment for securities before delivery. A Fund’s ability and decisions to purchase and sell portfolio securities may be affected by laws or regulations relating to the convertibility of currencies and repatriation of assets. Some countries restrict the extent to which foreigners may invest in their securities markets.
Investments in securities of foreign issuers are frequently denominated in foreign currencies (including the Euro and other multinational currency units) and the value of a Fund’s assets measured in U.S. dollars may be affected favorably or unfavorably by changes in currency rates and in exchange control regulations, and a Fund may incur costs in connection with conversions between various currencies. A Fund may enter into forward foreign currency contracts as a hedge against possible variations in foreign exchange rates or to hedge a specific security transaction or portfolio position. Currently, only a limited market, if any, exists for hedging transactions relating to currencies in emerging markets, including Latin American and Asian markets. This may limit a Fund’s ability to effectively hedge its investments in such markets if it chose to do so.
Foreign investments involve risks unique to the local political, economic, and regulatory structures in place, as well as the potential for social instability, military unrest, or diplomatic developments that could prove adverse to the interests of U.S. investors. Individual foreign economies can differ favorably or unfavorably from the U.S. economy in such respects as growth of gross national product, rate of inflation, capital reinvestment, resource self-sufficiency, and balance of payments position. In addition, significant external political and economic risks currently affect some foreign countries. For example, both Taiwan and China still claim sovereignty over one another and there is a demilitarized border and hostile relations between North and South Korea. War and terrorism affect many countries, especially those in Africa and the Middle East. Many countries throughout the world are dependent on a healthy U.S. economy and are adversely affected when the U.S. economy weakens or its markets decline. For example, in 2007 and 2008, the meltdown in the U.S. subprime mortgage market quickly spread throughout global credit markets, triggering a liquidity crisis that affected fixed-income and equity markets around the world. European countries can be significantly affected by the tight fiscal and monetary controls that the European Economic and Monetary Union (“EMU”) imposes for membership. Europe’s economies are diverse, its governments are decentralized, and its cultures vary
10
widely. Recently, several EU countries, including Greece, Ireland, Italy, Spain, and Portugal, have faced budget issues, some of which may have negative long-term effects for the economies of those countries and other EU countries. There is continued concern about national-level support for the euro and the accompanying coordination of fiscal and wage policy among EMU member countries. Member countries are required to maintain tight control over inflation, public debt, and budget deficit to qualify for membership in the EMU. These requirements can severely limit EMU member countries’ ability to implement monetary policy to address regional economic conditions.
Governments in certain foreign countries continue to participate to a significant degree, through ownership interest or regulation, in their respective economies. Action by these governments could have a significant effect on market prices of securities and payment of dividends. The economies of many foreign countries are heavily dependent upon international trade and are accordingly affected by protective trade barriers and economic conditions of their trading partners. The enactment by these trading partners of protectionist trade legislation could have a significant adverse effect upon the securities markets of such countries.
In making investment decisions for a Fund, the subadviser evaluates the risks associated with investing Fund assets in a particular country, including risks stemming from a country’s financial infrastructure and settlement practices; the likelihood of expropriation, nationalization or confiscation of invested assets; prevailing or developing custodial practices in the country; the country’s laws and regulations regarding the safekeeping, maintenance and recovery of invested assets; the likelihood of government-imposed exchange control restrictions which could impair the liquidity of Fund assets maintained with custodians in that country, as well as risks from political acts of foreign governments. An investment adviser’s or subadviser’s decisions regarding these risks may not be correct or may prove to be unwise and any losses resulting from investing in foreign countries will be borne by the Fund.
Holding Fund assets in foreign countries presents additional risks including, but not limited to, the risks that a particular foreign custodian or depositary will not exercise proper care with respect to Fund assets or will not have the financial strength or adequate practices and procedures to properly safeguard Fund assets. A Fund may be precluded from investing in certain foreign countries until such time as adequate custodial arrangements can be established.
Forward Commitments, When-Issued Securities and Delayed Delivery Transactions
A Fund may purchase or sell securities on a when-issued or delayed-delivery basis and make contracts to purchase or sell securities for a fixed price at a future date beyond customary settlement time. Securities purchased or sold on a when-issued, delayed-delivery or forward commitment basis involve a risk of loss if the value of the security to be purchased declines prior to the settlement date. Although a Fund would generally purchase securities on a when-issued, delayed-delivery or forward commitment basis with the intention of acquiring the securities, a Fund may dispose of such securities prior to settlement if its investment adviser or subadviser deems it appropriate to do so.
A Fund may dispose of or re-negotiate a when-issued or forward commitment after entering into these transactions. A Fund will normally realize a capital gain or loss in connection with these transactions. For purposes of determining a Fund’s average dollar-weighted maturity, the maturity of when-issued or forward commitment securities will be calculated from the commitment date.
When a Fund purchases securities on a when-issued, delayed-delivery or forward commitment basis, a Fund will segregate cash or liquid securities having a value (determined daily) at least equal to the amount of a Fund’s purchase commitments. In the case of a forward commitment to sell portfolio securities, a Fund will segregate the portfolio securities while the commitment is outstanding. Whenever a Fund is required to segregate assets for 1940 Act purposes, notations on the books of the Trust’s
11
custodian or fund accounting agent are sufficient to constitute a segregated account. See also “Derivative Instruments.”
These procedures are designed to ensure that a Fund will maintain sufficient assets at all times to cover its obligations under when-issued purchases, forward commitments and delayed-delivery transactions.
Futures Contracts
Futures contracts are generally considered to be derivative securities. Typically, maintaining a futures contract or selling an option thereon requires a Fund to deposit with a financial intermediary as security for its obligations an amount of cash or other specified assets (initial margin) which initially is typically 1% to 10% of the face amount of the contract (but may be higher in some circumstances). Additional cash or assets (variation margin) may be required to be deposited thereafter on a daily basis as the marked to market value of the contract fluctuates.
At maturity, a futures contract obligates a Fund to take or make delivery of certain securities or the cash value of a securities index. A Fund may sell a futures contract in order to offset a decrease in the market value of its portfolio securities that might otherwise result from a market decline. A Fund may do so either to hedge the value of its portfolio of securities as a whole, or to protect against declines, occurring prior to sales of securities, in the value of the securities to be sold. Conversely, a Fund may purchase a futures contract in anticipation of purchases of securities. In addition, a Fund may utilize futures contracts in anticipation of changes in the composition of its portfolio holdings or to seek exposure to a particular market or asset class in an attempt to achieve its objective.
For federal income tax purposes, some gains derived by a Fund from the use of such instruments will be treated as a combination of short-term and long-term capital gains and, if not offset by realized capital losses incurred by a Fund, will be distributed to shareholders and will be taxable to shareholders as a combination of ordinary income and long-term capital gain.
A Fund may purchase and sell call and put options on futures contracts traded on an exchange or board of trade. When a Fund purchases an option on a futures contract, it has the right to assume a position as a purchaser or seller of a futures contract at a specified exercise price at any time during the option period. When a Fund sells an option on a futures contract, it becomes obligated to purchase or sell a futures contract if the option is exercised. In anticipation of a market advance, a Fund may purchase call options on futures contracts as a substitute for the purchase of futures contracts to hedge against a possible increase in the price of securities that a Fund intends to purchase. Similarly, if the market is expected to decline, a Fund might purchase put options or sell call options on futures contracts rather than sell futures contracts. In connection with a Fund’s position in a futures contract or option thereon, a Fund will segregate cash or liquid securities or will otherwise cover its position in accordance with applicable requirements of the SEC. Whenever a Fund is required to segregate assets for 1940 Act purposes, notations on the books of the Trust’s custodian or fund accounting agent are sufficient to constitute a segregated account. See also “Derivative Instruments.”
A Fund may enter into a contract for the purchase or sale for future delivery of securities, including index contracts. While futures contracts provide for the delivery of securities, deliveries usually do not occur. Contracts are generally terminated by entering into offsetting transactions.
A Fund may enter into such futures contracts to protect against the adverse effects of fluctuations in security prices or interest rates without actually buying or selling the securities. For example, if interest rates are expected to increase, a Fund might enter into futures contracts for the sale of debt securities. Such a sale would have much the same effect as selling an equivalent value of the debt
12
securities owned by a Fund. If interest rates did increase, the value of the debt securities in the portfolio would decline, but the value of the futures contracts to a Fund would increase at approximately the same rate, thereby keeping the net asset value of a Fund from declining as much as it otherwise would have. Similarly, when it is expected that interest rates may decline, futures contracts may be purchased to hedge in anticipation of subsequent purchases of securities at higher prices. Since the fluctuations in the value of futures contracts should be similar to those of debt securities, a Fund could take advantage of the anticipated rise in value of debt securities without actually buying them until the market had stabilized. At that time, the futures contracts could be liquidated and a Fund could then buy debt securities on the cash market.
A stock index futures contract obligates the seller to deliver (and the purchaser to take) an amount of cash equal to a specific dollar amount times the difference between the value of a specific stock index at the close of the last trading day of the contract and the price at which the agreement was made. Open futures contracts are valued on a daily basis and a Fund may be obligated to provide or receive cash reflecting any decline or increase in the contract’s value. No physical delivery of the underlying stocks in the index is made in the future.
With respect to options on futures contracts, when a Fund is temporarily not fully invested, it may purchase a call option on a futures contract to hedge against a market advance. The purchase of a call option on a futures contract is similar in some respects to the purchase of a call option on an individual security. Depending on the pricing of the option compared to either the price of the futures contract upon which it is based, or the price of the underlying debt securities, it may or may not be less risky than ownership of the futures contract or underlying debt securities. As with the purchase of futures contracts, when a Fund is not fully invested, it may purchase a call option on a futures contract to hedge against a market advance.
The writing of a call option on a futures contract constitutes a partial hedge against the declining price of the security or foreign currency that is deliverable upon exercise of the futures contract. If the futures price at the expiration of the option is below the exercise price, a Fund will retain the full amount of the option premium which provides a partial hedge against any decline that may have occurred in the value of a Fund’s portfolio holdings. The writing of a put option on a futures contract constitutes a partial hedge against the increasing price of the security or foreign currency, which is deliverable upon exercise of the futures contract. If the futures price at the expiration of the option is higher than the exercise price, a Fund will retain the full amount of the option premium, which provides a partial hedge against any increase in the price of securities that a Fund intends to purchase.
Call and put options on stock index futures are similar to options on securities except that, rather than the right to purchase or sell stock at a specified price, options on a stock index future give the holder the right to receive cash. Upon exercise of the option, the delivery of the futures position by the writer of the option to the holder of the option will be accompanied by delivery of the accumulated balance in the writer’s futures margin account, which represents the amount by which the market price of the futures contract, at exercise, exceeds (in the case of a call) or is less than (in the case of a put) the exercise price of the futures contract. If an option is exercised on the last trading day prior to the expiration date of the option, the settlement will be made entirely in cash equal to the difference between the exercise price of the option and the closing price of the futures contract on the expiration date.
If a put or call option which a Fund has written is exercised, that Fund may incur a loss which will be reduced by the amount of the premium it received. Depending on the degree of correlation between changes in the value of its portfolio securities and changes in the value of its options positions, a Fund’s losses from existing options on futures may to some extent be reduced or increased by changes in the value of portfolio securities.
13
To the extent that market prices move in an unexpected direction, a Fund may not achieve the anticipated benefits of futures contracts or options on futures contracts or may realize a loss. For example, if a Fund is hedged against the possibility of an increase in interest rates and interest rates decrease instead, that Fund would lose part or all of the benefit of the increased value, which it has because it would have offsetting losses in its futures position. In addition, in such situations, if a Fund had insufficient cash, it may be required to sell securities from its portfolio to meet daily variation margin requirements. Such sales of securities may, but will not necessarily, be at increased prices which reflect the rising market. A Fund may be required to sell securities at a time when it may be disadvantageous to do so.
Options on securities, futures contracts, options on futures contracts and options on currencies may be traded on foreign exchanges. Such transactions may not be regulated as effectively as similar transactions in the U.S., may not involve a clearing mechanism and related guarantees and are subject to the risk of governmental actions affecting trading in or the prices of foreign securities. Some foreign exchanges may be principal markets so that no common clearing facility exists and a trader may look only to the broker for performance of the contract. The value of such positions also could be adversely affected by (i) other complex foreign political, legal and economic factors, (ii) lesser availability than in the U.S. of data on which to make trading decisions, (iii) delays in the Trust’s ability to act upon economic events occurring in foreign markets during non-business hours in the U.S., (iv) the imposition of different exercise and settlement terms and procedures and margin requirements than in the U.S. and (v) lesser trading volume. In addition, unless a Fund hedges against fluctuations in the exchange rate between the U.S. dollar and the currencies in which trading is done on foreign exchanges, any profits that a Fund might realize in trading could be eliminated by adverse changes in the exchange rate, or a Fund could incur losses as a result of those changes.
Further, with respect to options on futures contracts, a Fund may seek to close out an option position by writing or buying an offsetting position covering the same securities or contracts with the same exercise price and expiration date. The ability to establish and close out positions on options will be subject to the maintenance of a liquid secondary market, which cannot be assured.
Illiquid Securities
A Fund may invest up to 15% of its net assets in securities that are illiquid. Securities are generally considered illiquid if they cannot be disposed of within seven days in the ordinary course of business at approximately the price at which a Fund values the security. Illiquid securities will generally include but are not limited to: insurance funding agreements, repurchase agreements and time deposits with notice/termination dates in excess of seven days; unlisted over-the-counter options; swap agreements, interest rate caps, floors and collars; and certain securities which are subject to trading restrictions because they are not registered under the 1933 Act. Foreign securities that are restricted as to resale in the U.S., but are freely tradable in their local market, are not considered illiquid.
Investment Company Shares
Investments by a Fund in other investment companies, including closed-end funds and ETFs, will be subject to the limitations of the 1940 Act, the rules and regulations thereunder and in certain circumstances SEC exemptive orders. By investing in securities of an investment company, Fund shareholders will indirectly bear the fees and expenses of that investment company in addition to a Fund’s own fees and expenses. The Funds may rely on SEC orders that permit them to invest in certain investment companies beyond the limits contained in the 1940 Act, subject to certain terms and conditions of those orders. Pursuant to SEC rules, the Funds may invest in shares of affiliated and unaffiliated money market funds.
14
Money Market Instruments
Money market instruments include but are not limited to the following: short-term corporate obligations, Certificates of Deposit (“CDs”), Eurodollar Certificates of Deposit (“Euro CDs”), Yankee Certificates of Deposit (“Yankee CDs”), foreign bankers’ acceptances, foreign commercial paper, letter of credit-backed commercial paper, time deposits, loan participations (“LPs”), variable- and floating-rate instruments, separately traded interest and principal securities (“STRIPS”) and master demand notes. Bank obligations may include bankers’ acceptances, negotiable certificates of deposit and non-negotiable time deposits earning a specified return, issued for a definite period of time by a U.S. bank that is a member of the Federal Reserve System or is insured by the Federal Deposit Insurance Corporation (“FDIC”), or by a savings and loan association or savings bank that is insured by the FDIC. Bank obligations also include U.S. dollar-denominated obligations of foreign branches of U.S. banks or of U.S. branches of foreign banks, all of the same type as domestic bank obligations. Investments in bank obligations are limited to the obligations of financial institutions having more than $1 billion in total assets at the time of purchase.
Domestic and foreign banks are subject to extensive but different government regulations, which may limit the amount and types of their loans and the interest rates that may be charged. In addition, the profitability of the banking industry is largely dependent upon the availability and cost of funds to finance lending operations and the quality of underlying bank assets.
Investments in obligations of foreign branches of U.S. banks and of U.S. branches of foreign banks may subject a Fund to additional investment risks, including future political and economic developments, possible imposition of withholding taxes on interest income, possible seizure or nationalization of foreign deposits, possible establishment of exchange controls or the adoption of other foreign governmental restrictions which might adversely affect the payment of principal and interest on such obligations. In addition, foreign branches of U.S. banks and U.S. branches of foreign banks may be subject to less stringent reserve requirements and to different accounting, auditing, reporting and record keeping standards than those applicable to domestic branches of U.S. banks. Investments in the obligations of U.S. branches of foreign banks or foreign branches of U.S. banks will be made only when the investment adviser or subadviser believes that the credit risk with respect to the investment is minimal.
Euro CDs, Yankee CDs and foreign bankers’ acceptances involve risks that are different from investments in securities of U.S. banks. The major risk, which is sometimes referred to as “sovereign risk,” pertains to possible future unfavorable political and economic developments, possible withholding taxes, seizures of foreign deposits, currency controls, interest limitations or other governmental restrictions which might affect payment of principal or interest. Investment in foreign commercial paper also involves risks that are different from investments in securities of commercial paper issued by U.S. companies. Non-U.S. securities markets generally are not as developed or efficient as those in the U.S. Such securities may be less liquid and more volatile than securities of comparable U.S. corporations. Non-U.S. issuers are not generally subject to uniform accounting and financial reporting standards, practices and requirements comparable to those applicable to U.S. issuers. In addition, there may be less public information available about foreign banks, their branches and other issuers.
Time deposits usually trade at a premium over Treasuries of the same maturity. Investors regard such deposits as carrying some credit risk, which Treasuries may not. Also, investors regard time deposits as being sufficiently less liquid than Treasuries; hence, investors demand some extra yield for buying time deposits rather than Treasuries.
Commercial paper may include variable- and floating-rate instruments, which are unsecured instruments that permit the interest on indebtedness thereunder to vary. Variable-rate instruments provide
15
for periodic adjustments in the interest rate. Floating-rate instruments provide for automatic adjustment of the interest rate whenever some other specified interest rate changes. Some variable- and floating-rate obligations are direct lending arrangements between the purchaser and the issuer and there may be no active secondary market. However, in the case of variable- and floating-rate obligations with the demand feature, a Fund may demand payment of principal and accrued interest at a time specified in the instrument or may resell the instrument to a third party. In the event an issuer of a variable- or floating-rate obligation defaulted on its payment obligation, a Fund might be unable to dispose of the note because of the absence of a secondary market and could, for this or other reasons, suffer a loss to the extent of the default. Substantial holdings of variable- and floating-rate instruments could reduce portfolio liquidity.
Mortgage-Backed Securities and Mortgage Pass-Through Securities
Ginnie Mae (formally known as the Government National Mortgage Association) is a government-owned corporation that is an agency of the U.S. Department of Housing and Urban Development. The timely payment of principal and interest on mortgage-backed securities issued or guaranteed by Ginnie Mae is backed by Ginnie Mae and the full faith and credit of the U.S. government, Fannie Mae (formally known as the Federal National Mortgage Association) and Freddie Mac (formally known as the Federal Home Loan Mortgage Corporation) were government-sponsored corporations owned entirely by private stockholders until 2008. Both issue mortgage-related securities that contain guarantees as to timely payment of interest and principal but that are not backed by the full faith and credit of the U.S. government. Securities issued by Ginnie Mae and other mortgage-backed securities may be purchased at a premium over the maturity value of the underlying mortgages. This premium is not guaranteed and would be lost if prepayment occurs. Mortgage-backed securities issued by U.S. government agencies or instrumentalities other than Ginnie Mae are not “full faith and credit” obligations. Certain obligations, such as those issued by the Federal Home Loan Banks, Fannie Mae and Freddie Mac, are supported only by the credit of the issuer. Unscheduled or early payments on the underlying mortgages may shorten the securities’ effective maturities and reduce returns. A Fund may agree to purchase or sell these securities with payment and delivery taking place at a future date.
The value of the securities issued by Fannie Mae and Freddie Mac fell sharply in 2008 due to concerns that the firms did not have sufficient capital to offset losses. In September 2008, the U.S. Treasury announced that Fannie Mae and Freddie Mac had been placed in conservatorship by the Federal Housing Finance Agency (FHFA), a newly created independent regulator created under the Federal Housing Finance Regulatory Reform Act of 2008 (the “Reform Act”). Fannie Mae and Freddie Mac continue to rely on the support of the U.S. Treasury and FHFA to continue operations, and it is not known when the conservatorships will be terminated or what changes will be made to their operations following the conservatorships.
FHFA, as conservator or receiver for Fannie Mae and Freddie Mac, has the power to repudiate any contract entered into by Fannie Mae or Freddie Mac prior to FHFA’s appointment as conservator or receiver, as applicable, if FHFA determines, in its sole discretion, that performance of the contract is burdensome and that repudiation of the contract promotes the orderly administration of Fannie Mae’s or Freddie Mac’s affairs. The Reform Act requires FHFA to exercise its right to repudiate any contract within a reasonable period of time after its appointment as conservator or receiver. Such a repudiation may result in a reduction in interest payments made to holders of Fannie Mae or Freddie Mac securities.
In addition, under the Reform Act, certain rights provided to holders of mortgage-backed securities issued by Fannie Mae and Freddie Mac under the operative documents related to such securities may not be enforced against FHFA, or enforcement of such rights may be delayed, during the conservatorship or any future receivership. For example, the operative documents for Fannie Mae and Freddie Mac mortgage-backed securities may provide that an event of default on the part of Fannie Mae
16
or Freddie Mac includes the appointment of a conservator or receiver. However, under the Reform Act, holders of such securities may not enforce their rights if the event of default arises solely because a conservator or receiver has been appointed. The Reform Act also provides that no person may exercise any right or power to terminate, accelerate or declare an event of default under certain contracts to which Fannie Mae or Freddie Mac is a party, or obtain possession of or exercise control over any property of Fannie Mae or Freddie Mac, or affect any contractual rights of Fannie Mae or Freddie Mac, without the approval of FHFA, as conservator or receiver, for a period of 45 or 90 days following the appointment of FHFA as conservator or receiver, respectively.
Other mortgage-backed securities are issued by private issuers, generally originators of and investors in mortgage loans, including savings associations, mortgage bankers, commercial banks, investment bankers and special purpose entities. These private label securities may be supported by U.S. government mortgage-backed securities or some form of non-government credit enhancement. Mortgage-backed securities have either fixed or adjustable interest rates. The rate of return on mortgage-backed securities may be affected by prepayments of principal on the underlying loans, which generally increase as interest rates decline. As a result, when interest rates decline, holders of these securities normally do not benefit from appreciation in market value to the same extent as holders of other non-callable debt securities. In addition, like other debt securities, the values of mortgage-related securities, including government and government-related mortgage pools, generally will fluctuate in response to market interest rates.
The market value and yield of these mortgage-backed securities can vary due to market interest rate fluctuations and early prepayments of underlying mortgages. These securities represent ownership in a pool of federally insured mortgage loans with a maximum maturity of 30 years. A decline in interest rates may lead to a faster rate of repayment of the underlying mortgages, and may expose a Fund to a lower rate of return upon reinvestment. To the extent that such mortgage-backed securities are held by a Fund, the prepayment right will tend to limit to some degree the increase in net asset value of a Fund because the value of the mortgage-backed securities held by a Fund may not appreciate as rapidly as the price of non-callable debt securities. Mortgage-backed securities are subject to the risk of prepayment and the risk that the underlying loans will not be repaid. Because principal may be prepaid at any time, mortgage-backed securities may involve significantly greater price and yield volatility than traditional debt securities. At times, a Fund may invest in securities that pay higher than market interest rates by paying a premium above the securities’ par value. Prepayments of these securities may cause losses on securities purchased at a premium. Unscheduled payments, which are made at par value, will cause a Fund to experience a loss equal to any unamortized premium.
When interest rates rise, mortgage prepayment rates tend to decline, thus lengthening the life of a mortgage-related security and increasing the price volatility of that security, affecting the price volatility of a Fund’s shares. The negative effect of interest rate increases on the market-value of mortgage backed securities is usually more pronounced than it is for other types of fixed-income securities potentially increasing the volatility of a Fund.
Interests in pools of mortgage-backed securities differ from other forms of debt securities, which normally provide for periodic payment of interest in fixed amounts with principal payments at maturity or specified call dates. Instead, these securities provide a monthly payment which consists of both interest and principal payments. In effect, these payments are a “pass-through” of the monthly payments made by the individual borrowers on their mortgage loans, net of any fees paid to the issuer or guarantor of such securities. Additional payments are caused by repayments of principal resulting from the sale of the underlying property, refinancing or foreclosure, net of fees or costs which may be incurred. Some mortgage-related securities (such as securities issued by Ginnie Mae) are described as “modified pass-throughs.” These securities entitle the holder to receive all interest and principal payments owed on the
17
mortgage pool, net of certain fees, at the scheduled payment dates regardless of whether or not the mortgagor actually makes the payment.
Certain Funds may also invest in pass-through certificates issued by non-governmental issuers. Pools of conventional residential mortgage loans created by such issuers generally offer a higher rate of interest than government and government-related pools because there are no direct or indirect government guarantees of payment. Timely payment of interest and principal of these pools is, however, generally supported by various forms of insurance or guarantees, including individual loan, title, pool and hazard insurance. The insurance and guarantees are issued by government entities, private insurance and the mortgage poolers. A Fund may buy mortgage-related securities with or without insurance or guarantees if through an examination of the loan experience and practices of the poolers, an investment adviser or subadviser determines that the securities meet a Fund’s investment objectives and policies. The markets for certain mortgage-backed securities, particularly private label (non-governmental) securities, may be very thin. A Fund’s ability to dispose of its positions in such securities will depend upon the degree of liquidity in the market for such securities. It is impossible to predict the degree of liquidity of such securities in the future.
Multiple Class Mortgage-Backed Securities – A Fund may invest in multiple class mortgage-backed securities including collateralized mortgage obligations (“CMOs”) and real estate mortgage investment conduits (“REMIC Certificates”). CMOs and REMIC Certificates are debt instruments, and these securities may be issued by U.S. government agencies and instrumentalities such as Fannie Mae or Freddie Mac or by trusts formed by private originators of, or investors in, mortgage loans, including savings and loan associations, mortgage bankers, commercial banks, insurance companies, investment banks and special purpose subsidiaries of the foregoing. In general, CMOs are debt obligations of a legal entity that are collateralized by a pool of mortgage loans or mortgage-backed securities the payments on which are used to make payments on the CMOs or multiple class mortgage-backed securities. REMIC Certificates represent beneficial ownership interests in a REMIC trust, generally consisting of mortgage loans or Fannie Mae, Freddie Mac or Ginnie Mae guaranteed mortgage-backed securities. To the extent that a CMO or REMIC Certificate is collateralized by Ginnie Mae guaranteed mortgage-backed securities, holders of the CMO or REMIC Certificate receive all interest and principal payments owed on the mortgage pool, net of certain fees, regardless of whether the mortgagor actually makes the payments, as a result of the Ginne Mae guaranty, which is backed by the full faith and credit of the U.S. government. The obligations of Fannie Mae or Freddie Mac under their respective guaranty of the REMIC Certificates are obligations solely of Fannie Mae or Freddie Mac, respectively.
The principal of and interest on the mortgage-backed securities may be allocated among the several classes, also referred to as “tranches” in various ways. Each tranche of a mortgage-backed security is issued at a specified coupon rate or adjustable rate and has a stated maturity or final distribution date. Principal prepayments on collateral underlying a mortgage-backed security may cause it to be retired substantially earlier than the stated maturities or final distribution dates. Interest is paid or accrued on all classes on a monthly, quarterly or semi-annual basis. In certain structures (known as “sequential pay” CMOs or REMIC Certificates), payments of principal, including any principal prepayments, on the mortgage-backed securities generally are applied to the classes of CMOs or REMIC Certificates in the order of their respective final distribution dates. Thus, no payment of principal will be made on any class of sequential pay CMOs or REMIC Certificates until all other classes having an earlier final distribution date have been paid in full. Additional structures of CMOs and REMIC Certificates include, among others, “parallel pay” CMOs and REMIC Certificates. Parallel pay CMOs or REMIC Certificates are those which are structured to apply principal payments and prepayments of the mortgage-backed securities to two or more classes concurrently on a proportionate or disproportionate basis. These simultaneous payments are taken into account in calculating the final distribution date of each class.
18
A wide variety of REMIC Certificates may be issued in parallel pay or sequential pay structures. These securities include accrual certificates (“Z Bonds”), which only accrue interest at a specified rate until all other certificates having an earlier final distribution date have been retired and are converted thereafter to an interest-paying security, and planned amortization class (PAC) certificates, which are parallel pay REMIC Certificates that generally require that specified amounts of principal be applied on each payment date to one or more classes of REMIC Certificates (“PAC Certificates”), even though all other principal payments and prepayments of the mortgage-backed securities are then required to be applied to one or more other classes of the PAC Certificates. The scheduled principal payments for the PAC Certificates generally have the highest priority on each payment date after interest due has been paid to all classes entitled to receive interest currently. Shortfalls, if any, are added to the amount payable on the next payment date. The PAC Certificate payment schedule is taken into account in calculating the final distribution date of each class of PAC. In order to create PAC tranches, one or more tranches generally must be created that absorb most of the volatility in the underlying mortgage-backed securities. These tranches tend to have market prices and yields that are much more volatile than other PAC classes.
One or more tranches of a CMO or a REMIC Certificate (collectively, “floating-rate CMOs”) may have coupon rates which reset periodically at a specified increment over an index such as the London Interbank Offered Rate (“LIBOR”). These floating-rate CMOs may be backed by fixed-rate or adjustable-rate mortgages. Floating-rate CMOs are typically issued with lifetime “caps” on the coupon rate. These caps, similar to the caps on adjustable-rate mortgages, represent a ceiling beyond which the coupon rate on a floating-rate CMO may not be increased regardless of increases in the interest rate index to which the floating-rate CMO is geared. The structure and performance of floating-rate tranches will vary widely as interest rates change.
Resets – The interest rates paid on the floating-rate CMOs in which a Fund may invest generally are readjusted at intervals of one year or less to an increment over some predetermined interest rate index. There are three main categories of indices: those based on U.S. Treasury securities, those derived from a calculated measure such as a cost of funds index or a moving average of mortgage rates. Commonly utilized indices include: the one-year, three-year and five-year constant maturity Treasury rates, the three-month Treasury bill rate, the six-month Treasury bill rate, rates on longer-term Treasury securities, the 11th District Federal Home Loan Bank Cost of Funds, the National Median Cost of Funds, the one-, three- or six-month or one-year LIBOR, the prime rate of a specific bank or commercial paper rates. Some indices, such as the one-year constant maturity Treasury rate, closely mirror changes in market interest rate levels. Others, such as the 11th District Federal Home Loan Bank Cost of Funds index, tend to lag behind changes in market rate levels and tend to be somewhat less volatile.
Caps and Floors – The underlying mortgages which collateralize the floating-rate CMOs in which a Fund may invest will frequently have caps and floors which limit the maximum amount by which the loan rate to the residential borrower may change up or down (1) per reset or adjustment interval and (2) over the life of the loan. Some residential mortgage loans restrict periodic adjustments by limiting changes in the borrower’s monthly principal and interest payments rather than limiting interest rate changes. These payment caps may result in negative amortization.
CMOs and REMIC Certificates are subject to credit risk, interest rate risk and liquidity risk. Generally, CMOs and REMIC Certificates issued by U.S. government agencies and instrumentalities have lower credit risk than private label CMOs and REMIC Certificates because the underlying mortgages are either guaranteed by the U.S. government or carry an implicit guarantee of a government-sponsored enterprise. Private label CMOs and REMIC Certificates may carry higher credit risk, depending on the underlying collateral. The degree of credit risk will be reflected in the credit rating of the security. Yields on private label CMOs and REMIC Certificates historically have been higher than the yields on CMOs and REMIC Certificates issued or guaranteed by U.S. government agencies.
19
However, the risk of loss due to default on such instruments is higher since they are not guaranteed by the U.S. government. The Funds will not invest in subordinated privately issued CMOs and REMIC Certificates. CMOs and REMIC Certificates have a high degree of interest rate risk. The value of a CMO and a REMIC Certificate will fluctuate more widely in response to interest rate changes than a standard debt security.
Liquidity risk is the risk that the investor will be unable to find a buyer interested in purchasing the security or willing to pay the desired price for the security. If a Fund has to sell the security before maturity, some of the principal could be lost. The markets for CMOs and REMIC Certificates, particularly private label CMOs and REMIC Certificates, at times may be very thin. A Fund’s ability to dispose of its positions in such securities will depend upon the degree of liquidity in the market for such securities. It is impossible to predict the degree of liquidity of such securities in the future.
The prices of certain CMOs and REMIC Certificates, depending on their structure and the rate of prepayments, may be volatile. Some CMOs may also not be as liquid as other securities. In addition, the value of a CMO or REMIC Certificate, including those collateralized by mortgage-backed securities issued or guaranteed by U.S. government agencies or instrumentalities, may be affected by other factors, such as the availability of information concerning the pool and its structure, the creditworthiness of the servicing agent for the pool, the originator of the underlying assets, or the entities providing credit enhancement. The value of these securities also can depend on the ability of their servicers to service the underlying collateral and is, therefore, subject to risks associated with servicers’ performance, including mishandling of documentation. A Fund is permitted to invest in other types of mortgage-backed securities that may be available in the future to the extent consistent with its investment policies and objective.
Stripped Mortgage Securities – Stripped Mortgage Securities may be issued by Federal agencies, or by private originators of, or investors in, mortgage loans, including savings and loan associations, mortgage banks, commercial banks, investment banks and special purpose subsidiaries of the foregoing. Stripped Mortgage Securities not issued by Federal agencies will be treated by the Funds as illiquid securities so long as the staff of the Securities and Exchange Commission maintains its position that such securities are illiquid. Stripped Mortgage Securities issued by Federal agencies generally will be treated by the Funds as liquid securities under procedures adopted by the Funds and approved by the Board.
Stripped Mortgage Securities usually are structured with two classes that receive different proportions of the interest and principal distribution of a pool of mortgage assets. A common type of Stripped Mortgage Security will have one class receiving some of the interest and most of the principal from the mortgage assets, while the other class will receive most of the interest and the remainder of the principal. In the most extreme case, one class will receive all of the interest (the interest-only or “IO” class), while the other class will receive all of the principal (the principal-only or “PO” class). PO classes generate income through the accretion of the deep discount at which such securities are purchased, and, while PO classes do not receive periodic payments of interest, they receive monthly payments associated with scheduled amortization and principal prepayment from the mortgage assets underlying the PO class. The yield to maturity on a PO or an IO class security is extremely sensitive to the rate of principal payments (including prepayments) on the related underlying mortgage assets. A slower than expected rate of principal payments may have an adverse effect on a PO class security’s yield to maturity. If the underlying mortgage assets experience slower than anticipated principal repayment, the Fund may fail to fully recoup its initial investment in these securities. Conversely, a rapid rate of principal payments may have a material adverse effect on an IO class security’s yield to maturity. If the underlying mortgage assets experience greater than anticipated prepayments of principal, the Fund may fail to fully recoup its initial investment in these securities even if the securities are rated in the highest rating categories (“Aaa”
20
by Moody’s or “AAA” by S&P). Stripped mortgage securities have greater market volatility than other types of mortgage securities in which a Fund invests.
A Fund may purchase Stripped Mortgage Securities for income, or for hedging purposes to protect the Fund’s portfolio against interest rate fluctuations. For example, since an IO class will tend to increase in value as interest rates rise, it may be utilized to hedge against a decrease in value of other fixed-income securities in a rising interest rate environment.
Impact of Sub-Prime Mortgage Market – A Fund may invest in mortgage-backed, asset-backed and other fixed-income securities whose value and liquidity may be adversely affected by the critical downturn in the sub-prime mortgage lending market in the United States. Sub-prime loans, which have higher interest rates, are made to borrowers with low credit ratings or other factors that increase the risk of default. Concerns about widespread defaults on sub-prime loans have also created heightened volatility and turmoil in the general credit markets. As a result, a Fund’s investments in certain fixed-income securities may decline in value, their market value may be more difficult to determine, and a Fund may have more difficulty disposing of them.
Other Mortgage-Backed Securities – The investment adviser or subadviser anticipates that governmental, government-related or private entities may create mortgage loan pools and other mortgage-related securities offering mortgage pass-through and mortgage-collateralized investments in addition to those described above. The mortgages underlying these securities may include alternative mortgage instruments, that is, mortgage instruments whose principal or interest payments may vary or whose terms to maturity may differ from customary long-term fixed-rate mortgages. As new types of mortgage-related securities are developed and offered to investors, the investment adviser or subadviser will, consistent with a Fund’s investment objective and policies, consider making investments in such new types of mortgage-related securities.
General Risks Of Mortgage Securities – Mortgage securities differ from conventional bonds in that principal is paid back over the life of the mortgage security rather than at maturity. As a result, the holder of the mortgage securities (i.e., the Fund) receives monthly scheduled payments of principal and interest and may receive unscheduled principal payments representing payments on the underlying mortgages. When the holder reinvests the payments and any unscheduled prepayments of principal it receives, it may receive a rate of interest that is lower than the rate on the existing mortgage securities. For this reason, mortgage securities may be less effective than other types of securities as a means of “locking in” long-term interest rates.
A decline in interest rates may lead to a faster rate of repayment of the underlying mortgages and expose a Fund to a lower rate of return upon reinvestment. To the extent that such mortgage-backed securities are held by a Fund, the prepayment right of mortgagors may decrease or limit the increase in net asset value of a Fund because the value of the mortgage-backed securities held by a Fund may decline more than or may not appreciate as much as the price of non-callable debt securities. To the extent market interest rates increase beyond the applicable cap or maximum rate on a mortgage security, the market value of the mortgage security would likely decline to the same extent as a conventional fixed-rate security. The volatility of the security would likely increase, however, because the expected decline in prepayments would lead to longer effective maturity of the underlying mortgages. An investment in mortgage securities is also subject to extension risk, which is the risk that interest rates will rise and prepayment speeds will slow, and the Fund will be left holding the security longer than expected and miss out on opportunities to earn higher rates in the new interest rate environment.
In addition, to the extent mortgage securities are purchased at a premium, mortgage foreclosures and unscheduled principal prepayments may result in some loss of the holder’s principal investment to the
21
extent of the premium paid. On the other hand, if mortgage securities are purchased at a discount, both a scheduled payment of principal and an unscheduled prepayment of principal will increase current and total returns and, in the case of an unscheduled payment of principal, will accelerate the recognition of income which when distributed to shareholders will be taxable as ordinary income for federal income tax purposes.
With respect to pass-through mortgage pools issued by non-governmental issuers, there can be no assurance that the private insurers associated with such securities can meet their obligations under the policies. Securities issued by certain private organizations may not be readily marketable. The purchase of such securities is subject to each Fund’s limit with respect to investment in illiquid securities.
Municipal Securities
Municipal securities consist of (i) debt obligations issued by or on behalf of public authorities to obtain funds to be used for various public facilities, for refunding outstanding obligations, for general operating expenses, and for lending such funds to other public institutions and facilities, and (ii) certain private activity and industrial development bonds issued by or on behalf of public authorities to obtain funds to provide for the construction, equipment, repair, or improvement of privately operated facilities. General obligation bonds are backed by the taxing power of the issuing municipality. Revenue bonds are backed by the revenues of a project or facility; tolls from a toll bridge for example. The payment of principal and interest on private activity and industrial development bonds generally is dependent solely on the ability of the facility’s user to meet its financial obligations and the pledge, if any, of real and personal property so financed as security for such payment.
Municipal securities include both municipal notes and municipal bonds. Municipal notes include general obligation notes, tax anticipation notes, revenue anticipation notes, bond anticipation notes, certificates of indebtedness, demand notes and construction loan notes. Municipal bonds include general obligation bonds, revenue or special obligation bonds, private activity and industrial development bonds.
A Fund’s investments in municipal securities is limited to those obligations that are sufficiently liquid that they can be sold at or near their carrying value within a reasonably short period of time and either (i) are subject to no greater than moderate credit risk; or (ii) if the issuer of the municipal securities, or the entity supplying the revenues or other payments from which the issue is to be paid, has been in continuous operation for less than three years, including the operation of any predecessors, the securities are subject to a minimal or low amount of credit risk.
The municipal securities in which a Fund may invest include both tax-exempt and taxable securities. The interest paid on most municipal obligations is generally exempt from federal income tax for most investors. However, certain municipal obligations do not qualify for federal tax-exempt status because (i) they did not receive necessary authorization for tax-exempt treatment from state or local government authorities; (ii) they exceed certain regulatory limitations on the cost of issuance for tax-exempt financing; or (iii) they finance public or private activities that do not qualify for the federal income tax exemption. These non-qualifying activities might include, for example, certain types of multi-family housing, certain professional and local sports facilities, refinancing of certain municipal debt, and borrowing to replenish a municipality’s underfunded pension plan.
If permitted by a Fund’s investment policies, the investment adviser or subadviser, as applicable, may purchase industrial development and pollution control bonds. These bonds are issued by or on behalf of public authorities to raise money to finance various privately-operated facilities for business and manufacturing, housing, sports, and pollution control. These bonds are also used to finance public facilities such as airports, mass transit systems, ports and parking facilities. The payment of the principal
22
and interest on such bonds is dependent solely on the ability of the facility’s user to meet its financial obligations and the pledge, if any, of real and personal property so financed as security for such payment.
Options
A call option enables the purchaser, in return for the premium paid, to purchase securities from the writer of the option at an agreed price up to an agreed date. The advantage is that the purchaser may hedge against an increase in the price of securities it ultimately wishes to buy or may take advantage of a rise in a particular index. Except as otherwise provided in the Prospectus or in this SAI, a Fund will only purchase call options to the extent that the premiums paid on all outstanding call options do not exceed 20% of such Fund’s total assets. A Fund will only sell or write call options on a covered basis (e.g., on securities it holds in its portfolio). A put option enables the purchaser of the option, in return for the premium paid, to sell the security underlying the option to the writer at the exercise price during the option period. The writer of the option has the obligation to purchase the security from the purchaser of the option. The advantage is that the purchaser can be protected should the market value of the security decline or should a particular index decline. Except as otherwise provided in the Funds’ Prospectus or in this SAI, a Fund will only purchase put options to the extent that the premiums on all outstanding put options do not exceed 20% of that Fund’s total assets. A Fund will only write put options on a secured basis. Cash or other collateral will be segregated by a Fund for such options. Whenever a Fund is required to segregate assets for 1940 Act purposes, notations on the books of the Trust’s custodian or fund accounting agent are sufficient to constitute a segregated account. A Fund will receive premium income from writing put options, although it may be required, when the put is exercised, to purchase securities at higher prices than the current market price. At the time of purchase, a Fund will receive premium income from writing call options, which may offset the cost of purchasing put options and may also contribute to that Fund’s total return. A Fund may lose potential market appreciation if the judgment of its investment adviser or subadviser is incorrect with respect to interest rates, security prices or the movement of indices. See also “Derivative Instruments.”
An option on a securities index gives the purchaser of the option, in return for the premium paid, the right to receive cash from the seller equal to the difference between the closing price of the index and the exercise price of the option.
Closing transactions essentially let a Fund offset put options or call options prior to exercise or expiration. If a Fund cannot effect a closing transaction, it may have to hold a security it would otherwise sell, or deliver a security it might want to hold.
A Fund may use exchange-traded options, and as permitted by law, options traded over-the-counter. It is the position of the SEC that over-the-counter options are illiquid. Accordingly, a Fund will invest in such options only to the extent consistent with its 15% limit on investments in illiquid securities.
Options are generally considered to be derivative securities. Options may relate to particular securities, stock indices or financial instruments, they may or may not be listed on a national securities exchange and they may or may not be issued by the Options Clearing Corporation. Options trading is a highly specialized activity which entails greater than ordinary investment risk. Options on particular securities may be more volatile than the underlying securities, and on a percentage basis, an investment in options may be subject to greater fluctuation than an investment in the underlying securities themselves.
A Fund will write call options only if they are “covered.” In the case of a call option on a security, the option is “covered” if a Fund owns the security underlying the call or has an absolute and immediate right to acquire that security without additional cash consideration (or, if additional cash consideration is required, cash or liquid securities in such amount will be segregated by a Fund) upon conversion or exchange of other securities held by it. For a call option on an index, the option is covered
23
if a Fund maintains with its custodian a diversified stock portfolio or liquid assets equal to the contract value.
A call option is also covered if a Fund holds a call on the same security or index as the call written where the exercise price of the call held is (i) equal to or less than the exercise price of the call written or (ii) greater than the exercise price of the call written provided the difference is maintained by a Fund in cash or liquid securities in a segregated account with its custodian or fund accounting agent. A Fund will write put options only if they are “secured” by liquid assets maintained in a segregated account by the Trust’s custodian or fund accounting agent in an amount not less than the exercise price of the option at all times during the option period. Whenever a Fund is required to segregate assets for 1940 Act purposes, notations on the books of the Trust’s custodian or fund accounting agent are sufficient to constitute a segregated account. See also “Derivative Instruments.“A Fund’s obligation to sell a security subject to a covered call option written by it, or to purchase a security subject to a secured put option written by it, may be terminated prior to the expiration date of the option by a Fund’s execution of a closing purchase transaction, which is effected by purchasing on an exchange an option of the same series as the previously written option. Such a purchase does not result in the ownership of an option. A closing purchase transaction will ordinarily be effected to realize a profit on an outstanding option, to prevent an underlying security from being called, to permit the sale of the underlying security or to permit the writing of a new option containing different terms on such underlying security. The cost of such a liquidation purchase plus transaction costs may be greater than the premium received upon the original option, in which event a Fund will have incurred a loss in the transaction.
There is no assurance that a liquid secondary market will exist for any particular option. An option writer, unable to effect a closing purchase transaction, will not be able to sell the underlying security (in the case of a covered call option) or liquidate the segregated securities (in the case of a secured put option) until the option expires or the optioned security is delivered upon exercise with the result that the writer in such circumstances will be subject to the risk of market decline or appreciation in the security during such period.
Purchasing Call Options – Except as otherwise provided in the Funds’ Prospectus or in this SAI, each Fund may purchase call options to the extent that premiums paid by a Fund do not aggregate more than 20% of that Fund’s total assets. When a Fund purchases a call option in return for a premium paid by the Fund to the writer of the option, that Fund obtains the right to buy the security underlying the option at a specified exercise price at any time during the term of the option. The writer of the call option, who receives the premium upon writing the option, has the obligation, upon exercise of the option, to deliver the underlying security against payment of the exercise price. The advantage of purchasing call options is that a Fund may alter portfolio characteristics and modify portfolio maturities without incurring the cost associated with transactions, except the cost of the option.
Following the purchase of a call option, a Fund may liquidate its position by effecting a closing sale transaction by selling an option of the same series as the option previously purchased. A Fund will realize a profit from a closing sale transaction if the price received on the transaction is more than the premium paid to purchase the original call option; a Fund will realize a loss from a closing sale transaction if the price received on the transaction is less than the premium paid to purchase the original call option.
Although a Fund will generally purchase only those call options for which there appears to be an active secondary market, there is no assurance that a liquid secondary market on an exchange will exist for any particular option, or at any particular time, and for some options no secondary market on an exchange may exist. In such event, it may not be possible to effect closing transactions in particular options, with the result that a Fund would have to exercise its options in order to realize any profit and
24
would incur brokerage commissions upon the exercise of such options and upon the subsequent disposition of the underlying securities acquired through the exercise of such options. Further, unless the price of the underlying security changes sufficiently, a call option purchased by a Fund may expire without any value to a Fund, in which event a Fund would realize a capital loss which will be short-term unless the option was held for more than one year.
Covered Call Writing – A Fund may write covered call options from time to time on such portions of their portfolios, without limit, as an investment adviser or subadviser determines is appropriate in pursuing a Fund’s investment objective. The advantage to a Fund of writing covered calls is that the Fund receives a premium that is additional income. However, if the security rises in value, a Fund may not fully participate in the market appreciation.
During the option period, a covered call option writer may be assigned an exercise notice by the broker-dealer, through whom such call option was sold, requiring the writer to deliver the underlying security against payment of the exercise price. This obligation is terminated upon the expiration of the option or upon entering a closing purchase transaction. A closing purchase transaction, in which a Fund, as writer of an option, terminates its obligation by purchasing an option of the same series as the option previously written, cannot be effected with respect to an option once the option writer has received an exercise notice for such option.
Closing purchase transactions will ordinarily be effected to realize a profit on an outstanding call option, to prevent an underlying security from being called, to permit the sale of the underlying security or to enable a Fund to write another call option on the underlying security with either a different exercise price or expiration date or both. A Fund may realize a net gain or loss from a closing purchase transaction depending upon whether the net amount of the original premium received on the call option is more or less than the cost of effecting the closing purchase transaction. Any loss incurred in a closing purchase transaction may be partially or entirely offset by the premium received from a sale of a different call option on the same underlying security. Such a loss may also be wholly or partially offset by unrealized appreciation in the market value of the underlying security. Conversely, a gain resulting from a closing purchase transaction could be offset in whole or in part by a decline in the market value of the underlying security.
If a call option expires unexercised, a Fund will realize a short-term capital gain in the amount of the premium on the option less the commission paid. Such a gain, however, may be offset by depreciation in the market value of the underlying security during the option period if such security is sold or there is another recognition event. If a call option is exercised, a Fund will realize a gain or loss from the sale of the underlying security equal to the difference between the cost of the underlying security and the proceeds of the sale of the security plus the amount of the premium on the option less the commission paid.
A Fund will write call options only on a covered basis, which means that a Fund will own the underlying security subject to a call option at all times during the option period. Unless a closing purchase transaction is effected, a Fund would be required to continue to hold a security which it might otherwise wish to sell, or deliver a security it would want to hold. The exercise price of a call option may be below, equal to, or above the current market value of the underlying security at the time the option is written.
Purchasing Put Options – Except as otherwise provided in the Funds’ Prospectus or in this SAI, a Fund will only purchase put options to the extent that the premiums on all outstanding put options do not exceed 20% of the Fund’s total assets. Except as otherwise provided in the Funds’ Prospectus or in this SAI, with regard to the writing of put options, each Fund will limit the aggregate value of the obligations underlying such put options to 50% of its total assets. The purchase of the put option on
25
substantially identical securities held by a Fund will constitute a short sale for federal income tax purposes, which may result in a short-term capital gain on the sale of the security if such substantially identical securities were held by that Fund for not more than one year as of the date of the short sale or were acquired by that Fund after the short sale and on or before the closing date of the short sale.
A put option purchased by a Fund gives it the right to sell one of its securities for an agreed price up to an agreed date. A Fund may purchase put options in order to protect against a decline in the market value of the underlying security below the exercise price less the premium paid for the option (“protective puts”). The ability to purchase put options allows a Fund to protect unrealized gains in an appreciated security in their portfolios without actually selling the security. If the security does not drop in value, a Fund will lose the value of the premium paid. A Fund may sell a put option which it has previously purchased prior to the sale of the securities underlying such option. Such sale will result in a net gain or loss depending on whether the amount received on the sale is more or less than the premium and other transaction costs paid on the put option.
A Fund may sell a put option purchased on individual portfolio securities. Additionally, a Fund may enter into closing sale transactions. A closing sale transaction is one in which a Fund, when it is the holder of an outstanding option, liquidates its position by selling an option of the same series as the option previously purchased.
Writing Put Options – A Fund may also write put options on a secured basis which means that a Fund will segregate liquid assets with its custodian or fund accounting agent in an amount not less than the exercise price of the option at all times during the option period. Whenever a Fund is required to segregate assets, notations on the books of the Trust’s custodian or fund accounting agent are sufficient to constitute a segregated account. The amount of liquid assets held in the segregated account will be adjusted on a daily basis to reflect changes in the market value of the securities covered by the put option written by a Fund. Secured put options will generally be written in circumstances where the investment adviser or subadviser wishes to purchase the underlying security for a Fund’s portfolio at a price lower than the current market price of the security. In such event, that Fund would write a secured put option at an exercise price which, reduced by the premium received on the option, reflects the lower price it is willing to pay. See also “Derivative Instruments.”
Following the writing of a put option, a Fund may wish to terminate the obligation to buy the security underlying the option by effecting a closing purchase transaction. This is accomplished by buying an option of the same series as the option previously written. However, a Fund may not effect such a closing transaction after it has been notified of the exercise of the option.
Foreign Currency Options – A Fund may buy or sell put and call options on foreign currencies either on exchanges or in the over-the-counter market. A put option on a foreign currency gives the purchaser of the option the right to sell a foreign currency at the exercise price until the option expires. A call option on a foreign currency gives the purchaser of the option the right to purchase the currency at the exercise price until the option expires. Currency options traded on U.S. or other exchanges may be subject to position limits that may limit the ability of a Fund to reduce foreign currency risk using such options.
Publicly Traded Partnerships
Publicly traded partnerships are generally limited partnerships (or limited liability companies), the units of which may be listed and traded on a securities exchange or are readily tradeable on a secondary market (or its substantial equivalent). The Funds may invest in publicly traded partnerships that are treated as partnerships for federal income tax purposes, subject to certain limitations contained in the Internal Revenue Code of 1986, as amended (the “Code”), for qualification as a regulated investment company. These include master limited partnerships (“MLPs”) and other entities qualifying under limited
26
exceptions in the Code. Many MLPs derive income and gain from the exploration, development, mining or production, processing, refining, transportation or marketing of any mineral or natural resource or from real property. The value of MLP units fluctuates predominantly based on prevailing market conditions and the success of the MLP. The Funds may purchase common units of a MLP on an exchange as well as directly from the MLP or other parties in private placements. Unlike owners of common stock of a corporation, owners of common units of a MLP have limited voting rights and have no ability to annually elect directors. MLPs generally distribute all available cash flow (cash flow from operations less maintenance capital expenditures) in the form of quarterly distributions, but a Fund will be required to include in its taxable income its allocable share of the MLP’s income regardless of whether any distributions are made by the MLP. Thus, if the distributions received by a Fund are less than that Fund’s allocable share of the MLP’s income, the Fund may be required to sell other securities so that it may satisfy the requirements to qualify as a regulated investment company and avoid federal income and excise taxes. Common units typically have priority as to minimum quarterly distributions. In the event of liquidation, common units have preference over subordinated units, but not debt or preferred units, to the remaining assets of the MLP.
An investment in MLP units involves some risks that differ from an investment in the common stock of a corporation. Holders of MLP units have limited control and voting rights on matters affecting the partnership. Holders of MLP units of a particular MLP are also exposed to a remote possibility of liability for the obligations of that MLP under limited circumstances not expected to be applicable to the Funds. A Fund will not acquire any interests in MLPs that are believed to expose the assets of a Fund to liabilities incurred by the MLP. In addition, the value of a Fund’s investment in MLPs depends largely on the MLPs being treated as partnerships for federal income tax purposes. If an MLP does not meet certain federal income tax requirements to maintain partnership status, or if it is unable to do so because of tax law changes, it would be taxed as a corporation. In that case, the MLP would be obligated to pay income tax at the entity level and distributions received by a Fund generally would be taxed as dividend income. As a result, there could be a reduction in a Fund’s cash flow and there could be a material decrease in the value of that Fund’s shares.
Real Estate Investment Trusts
Securities of real estate investment trusts (“REITs”) may be affected by changes in the value of their underlying properties and by defaults by borrowers or tenants. Mortgage REITs may be affected by the quality of the credit extended. Furthermore, REITs are dependent on specialized management skills. Some REITs may have limited diversification and may be subject to risks inherent in investments in a limited number of properties, in a narrow geographic area, or in a single property type. REITs depend generally on their ability to generate cash flow to make distributions to shareholders or unitholders, and may be subject to defaults by borrowers and to self-liquidations. Investment in REITs may subject a Fund to risks associated with the direct ownership of real estate, such as decreases in real estate values, overbuilding, increased competition and other risks related to local or general economic conditions, increases in operating costs and property taxes, changes in zoning laws, casualty or condemnation losses, possible environmental liabilities, regulatory limitations on rent and fluctuations in rental income. Equity REITs generally experience these risks directly through fee or leasehold interests, whereas mortgage REITs generally experience these risks indirectly through mortgage interests unless the mortgage REIT forecloses on the underlying real estate. Changes in interest rates may also affect the value of a Fund’s investment in REITs. In addition, the performance of a REIT may be affected by its failure to qualify for tax-free pass-through of income under the Code, or its failure to maintain exemption from registration under the 1940 Act. Rising interest rates may cause the value of the REIT securities in which a Fund may invest to fall. Conversely, falling interest rates may cause their value to rise. Changes in the value of portfolio securities does not necessarily affect cash income derived from these securities but may affect a Fund’s net asset value.
27
Repurchase Agreements
A Fund may enter into repurchase agreements pursuant to which a Fund purchases portfolio assets from a bank or broker-dealer concurrently with an agreement by the seller to repurchase the same assets from a Fund at a later date at a fixed price. If the seller should default on its obligation to repurchase the underlying security, a Fund may experience delay or difficulty in exercising its right to realize upon the security. Additionally, a Fund may incur a loss if the value of the security should decline, as well as disposition costs in liquidating the security.
The repurchase price generally equals the price paid by a Fund plus interest negotiated on the basis of current short-term rates (which may be more or less than the rate on the securities underlying the repurchase agreement).
The financial institutions with which a Fund may enter into repurchase agreements are banks and non-bank dealers of U.S. government securities that are listed on the Federal Reserve Bank of New York’s list of reporting dealers and banks, if such banks and non-bank dealers are deemed creditworthy by the investment adviser or subadviser. The investment adviser or subadviser will continue to monitor the creditworthiness of the seller under a repurchase agreement and will require the seller to maintain during the term of the agreement the value of the securities subject to the agreement at not less than the repurchase price.
Restricted Securities
Each Fund will limit investments in securities of issuers which a Fund is restricted from selling to the public without registration under the 1933 Act, to no more than 5% of a Fund’s total assets, excluding restricted securities eligible for resale pursuant to Rule 144A or Regulation S under the 1933 Act, that have been determined to be liquid by the Fund’s investment adviser or subadviser, pursuant to guidelines adopted by the Board. Securities of foreign issuers that are restricted as to resale in the U.S., but are freely tradeable in their local market, are not subject to this restriction.
Reverse Repurchase Agreements
Reverse repurchase agreements involve the sale of securities held by a Fund pursuant to that Fund’s agreement to repurchase the securities at an agreed upon price, date and rate of interest. During the reverse repurchase agreement period, a Fund continues to receive principal and interest payments on these securities. Such agreements are considered to be borrowings under the 1940 Act and may be entered into only for temporary or emergency purposes. While reverse repurchase transactions are outstanding, a Fund will segregate cash or liquid securities in an amount at least equal to the market value of the securities, plus accrued interest. (Liquid securities as used in the Prospectus and this SAI include equity securities and debt securities that are unencumbered and marked-to-market daily.) Whenever a Fund is required to segregate assets for 1940 Act purposes, notations on the books of the Trust’s custodian or fund accounting agent are sufficient to constitute a segregated account. Reverse repurchase agreements involve the risk that the market value of the securities sold by a Fund may decline below the price at which a Fund is obligated to repurchase such securities. See also “Derivative Instruments.”
Royalty Income Trusts
A royalty income trust is a trust whose securities are listed on a securities exchange, generally in Canada or the U.S., and which controls an underlying company whose business is the acquisition, exploitation, production and sale of oil and natural gas. Royalty income trusts generally pay out to unit holders the majority of the cash flow that they receive from the production and sale of underlying oil and natural gas reserves. The amount of distributions paid on royalty income trust units will vary from time to
28
time based on production levels, commodity prices, royalty rates and certain expenses, deductions and costs, as well as on the distribution payout ratio policies adopted. As a result of distributing the bulk of their cash flow to unitholders, the ability of a royalty income trust to finance internal growth through exploration is limited. Royalty income trusts generally grow through acquisition of additional oil and gas properties or producing companies with proven reserves of oil and gas, funded through the issuance of additional equity or, where the trust is able, additional debt. Royalty income trusts are exposed to many of the same risks as energy and natural resources companies, such as commodity pricing risk, supply and demand risk and depletion and exploration risk.
Rule 144A Securities
A Fund may purchase securities which are not registered under the 1933 Act but which can be sold to “qualified institutional buyers” in accordance with Rule 144A under the 1933 Act. Any such security will not be considered illiquid so long as it is determined by the investment adviser or subadviser, under guidelines approved by the Board, that an adequate trading market exists for that security. This investment practice could have the effect of increasing the level of illiquidity in a Fund during any period that qualified institutional buyers become uninterested in purchasing these restricted securities.
Securities Lending
A Fund may seek additional income at times by lending its portfolio securities to broker-dealers and financial institutions provided that: (1) the loan is secured by collateral that is continuously maintained in an amount at least equal to the current market value of the securities loaned, (2) the Fund may call the loan at any time with proper notice and receive the securities loaned, (3) the Fund will continue to receive interest and/or dividends paid on the loaned securities and may simultaneously earn interest on the investment of any cash collateral, and (4) the aggregate market value of all securities loaned by the Fund will not at any time exceed 25% of the total assets of such Fund.
Collateral will normally consist of cash or cash equivalents, securities issued by the U.S. government or its agencies or instrumentalities or irrevocable letters of credit. Securities lending by a Fund involves the risk that the borrower may fail to return the loaned securities or maintain the proper amount of collateral. Therefore, a Fund will only enter into such lending after a review by the investment adviser or subadviser of the borrower’s financial statements, reports and other information as may be necessary to evaluate the creditworthiness of the borrower. Such reviews will be conducted on an ongoing basis as long as the loan is outstanding.
Short Sales
Selling securities short involves selling securities the seller (e.g., a Fund) does not own (but has borrowed) in anticipation of a decline in the market price of such securities. To deliver the securities to the buyer, the seller must arrange through a broker to borrow the securities and, in so doing, the seller becomes obligated to replace the securities borrowed at their market price at the time of the replacement. In a short sale, the proceeds the seller receives from the sale are retained by a broker until the seller replaces the borrowed securities. The seller may have to pay a premium to borrow the securities and must pay any dividends or interest payable on the securities until they are replaced.
The Fund may incur a loss as a result of the short sale if the price of the security increases between the date of the short sale and the date on which the Fund replaces the borrowed security, and the Fund may realize a gain if the security declines in price between those same dates. Although the Fund’s potential for gain as a result of a short sale is limited to the price at which it sold the security short less the cost of borrowing the security, the potential for loss is theoretically unlimited because there is no limit to the cost of replacing the borrowed security. To borrow the security, the Fund may also be required to pay
29
a premium, which would increase the cost of the security sold. The Fund may not always be able to close out a short position at a particular time or at an acceptable price. A lender may request that the borrowed securities be returned to it on short notice, and the Fund may have to buy the borrowed securities at an unfavorable price. If this occurs at a time when other short sellers of the same security also want to close out their positions, it is more likely that the Fund will have to cover its short sale at an unfavorable price and potentially reduce or eliminate any gain, or cause a loss, as a result of the short sale.
A short sale is “against the box” if, at all times during which the short position is open, a Fund owns at least an equal amount of the securities or securities convertible into, or exchangeable without further consideration for, securities of the same issuer as the securities that are sold short.
A Fund may also maintain short positions in forward currency exchange transactions, in which a Fund agrees to exchange currency that it does not own at that time for another currency at a future date and specified price in anticipation of a decline in the value of the currency sold short relative to the currency that a Fund has contracted to receive in the exchange. To ensure that any short position of a Fund is not used to achieve leverage, a Fund segregates cash or liquid assets equal to the fluctuating market value of the currency as to which any short position is being maintained. Whenever a Fund is required to segregate assets for 1940 Act purposes, notations on the books of the Trust’s custodian or fund accounting agent are sufficient to constitute a segregated account.
Short-Term Trading
Securities may be sold in anticipation of a market decline or purchased in anticipation of a market rise and later sold. In addition, a security may be sold and another purchased at approximately the same time to take advantage of what a Fund believes to be a temporary disparity in the normal yield relationship between the two securities. Such trading may be expected to increase a Fund’s portfolio turnover rate and the expenses incurred in connection with such trading and may result in recognition of greater levels of short-term capital gain, which is taxed for federal income tax purposes, to shareholders as ordinary income when distributed by a Fund.
Swap Agreements
A Fund may enter into interest rate, index, credit default, equity and currency exchange rate swap agreements. These transactions would be entered into in an attempt to obtain a particular return when it is considered desirable to do so, possibly at a lower cost to a Fund than if the Fund had invested directly in the asset that yielded the desired return. Swap agreements are two-party contracts entered into primarily by institutional investors for periods ranging from a few weeks to more than one year. In a standard swap transaction, two parties agree to exchange the returns (or differentials in rates of return) earned or realized on particular predetermined investments or instruments, which may be adjusted for an interest factor. The gross returns to be exchanged or “swapped” between the parties are generally calculated with respect to a “notional amount,” i.e., the return on or increase in value of a particular dollar amount invested at a particular interest rate, in a particular foreign currency, or in a “basket” of securities representing a particular index.
A Fund may enter into credit default swap agreements. The “buyer” in a credit default contract is obligated to pay the “seller” a periodic stream of payments over the term of the contract provided that no credit event with respect to any underlying reference obligation has occurred. If a credit event occurs, the seller typically must pay the buyer the “par value” (full notional value) of the reference obligation in exchange for the reference obligation. A Fund may either be the buyer or the seller in the transaction. If a Fund is a buyer and no credit event occurs, the Fund loses its investment and recovers nothing. However, if a credit event occurs, the buyer receives full notional value for a reference obligation that may have little or no value. As a seller, a Fund typically receives a fixed rate of income throughout the
30
term of the contract, which typically is between six months and three years, provided a credit event does not occur. If a credit event occurs, the seller typically must pay the buyer the full notional amount of the reference obligation. Credit default swaps involve more risk than if a Fund had invested in the reference obligation directly because the Fund can obtain credit exposure in excess of its cash obligations under the agreement.
Most swap agreements entered into by a Fund calculate the obligations of the parties to the agreement on a “net basis.” Consequently, the Fund’s current obligations (or rights) under a swap agreement will generally be equal only to the net amount to be paid or received under the agreement based on the relative values of the positions held by each party to the agreement (the “net amount”). The Fund’s current obligations under a swap agreement will be accrued daily (offset against amounts owed to the Fund) and any accrued but unpaid net amounts owed to a swap counterparty will be covered by the maintenance of a segregated account consisting of liquid assets to limit any potential leveraging of the Fund’s portfolio. Whenever a Fund is required to segregate assets for 1940 Act purposes, notations on the books of the Trust’s custodian or fund accounting agent are sufficient to constitute a segregated account. See also “Derivative Instruments.”
Obligations under swap agreements so covered will not be construed to be “senior securities” for purposes of the Funds’ investment restriction concerning senior securities. Except as otherwise indicated in the Funds’ Prospectus or in this SAI, a Fund will not enter into a swap agreement with any single party if the net amount owed or to be received under existing contracts with that party would exceed 5% of the Fund’s assets.
Whether a Fund’s use of swap agreements will be successful in furthering its investment objective will depend on the investment adviser or subadviser’s ability to correctly predict whether certain types of investments are likely to produce greater returns than other investments. Because they are two-party contracts and because they may have terms of greater than seven days, swap agreements may be considered to be illiquid investments. Moreover, a Fund bears the risk of loss of the amount expected to be received under a swap agreement in the event of the default or bankruptcy of a swap agreement counterparty. A Fund will enter into swap agreements only with counterparties that meet certain standards for creditworthiness (generally, such counterparties would have to be eligible counterparties under the terms of the Fund’s repurchase agreement guidelines). Certain restrictions imposed by the Code for qualification as a regulated investment company may limit a Fund’s ability to use swap agreements. The swap market is a relatively new market and is largely unregulated. It is possible that developments in the swap market, including potential government regulation, could adversely affect the Fund’s ability to terminate existing swap agreements or to realize amounts to be received under such agreements.
Temporary Defensive Positioning
The investments and strategies described throughout the Funds’ Prospectus are those the subadvisers intend to use under normal circumstances. When a subadviser determines that market or other conditions warrant, a Fund may invest up to 100% of its assets in money market instruments or hold U.S. dollars. When a Fund is investing for temporary or defensive purposes, it is not pursuing its investment goal.
Unit Investment Trusts
A Unit Investment Trust (“UIT”) is a type of investment company. Investments in UITs are subject to regulations limiting a Fund’s acquisition of investment company securities. Standard and Poor’s Depositary Receipts (“SPDRs”), DIAMONDS, MDYs and similar investments are interests in UITs that may be obtained directly from the UIT or purchased in the secondary market. SPDRs consist of
31
a portfolio of securities substantially similar to the component securities of the Standard and Poor’s 500 Composite Stock Price Index. DIAMONDS and MDYs consist of a portfolio of securities substantially similar to the component securities of the Dow Jones Industrial Average and of the Standard and Poor’s MidCap 400 Index, respectively.
The price of a UIT interest is derived and based upon the securities held by the UIT. Accordingly, the level of risk involved in the purchase or sale of a UIT interest is similar to the risk involved in the purchase or sale of traditional common stock, with the exception that the pricing mechanism for UITs is based on a basket of stocks. Disruptions in the markets for the securities underlying UITs purchased or sold by a Fund could result in losses on UITs. Trading in UITs involves risks similar to the risks, involved in the writing of options on securities, described above under “Options.”
Interests in UITs are not individually redeemable, except upon termination of the UIT. To redeem, a Fund must accumulate a certain amount of UIT interests. The liquidity of small holdings of UITs, therefore, depends upon the existence of a secondary market. Upon redemption of a UIT interest, a Fund receives securities and cash identical to the deposit required of an investor wishing to purchase a UIT interest that day.
Zero Coupon Bonds
Zero coupon securities are debt securities issued or sold at a discount from their face value that do not entitle the holder to any periodic payment of interest prior to maturity, a specified redemption date or a cash payment date. The amount of the discount varies depending on the time remaining until maturity or cash payment date, prevailing interest rates, liquidity of the security and perceived credit quality of the issuer.
Zero coupon securities also may take the form of debt securities that have been stripped of their unmatured interest coupons, the coupons themselves and receipts or certificates representing interests in such stripped debt obligations and coupons. The market prices of zero coupon securities are generally more volatile than the market prices of interest-bearing securities and respond more to changes in interest rates than interest-bearing securities with similar maturities and credit qualities. For federal income tax purposes, the original issue discount on the zero coupon bonds must be included ratably in the income of a Fund as the income accrues even though payment has not been received. The Funds nevertheless intend to distribute an amount of cash equal to the currently accrued original issue discount, and this may require liquidating securities at times they might not otherwise do so and may result in capital gain or loss.
Other Investments
The Board may, in the future, authorize a Fund to invest in securities other than those listed here and in the Funds’ Prospectus, provided that such investment would be consistent with that Fund’s investment objective and that it would not violate any fundamental investment policies or restrictions applicable to that Fund.
CFTC Regulation
A notice of eligibility for exclusion from the definition of the term “commodity pool operator” has been filed with the National Futures Association with respect to the Funds. On February 9, 2012, the Commodity Futures Trading Commission (“CFTC”) adopted amendments to its rules that became effective on December 31, 2012. Each Fund (except for the “fund-of-funds”) intends to limit its use of futures and options on futures or commodities or engage in swap transactions so as to remain eligible for the exclusion. If a Fund was no longer able to claim the exclusion, Aston Asset Management, LP
32
(“Aston” or the “Adviser”) would be required to register as a “commodity pool operator,” and the Fund and the Adviser would be subject to regulation under the Commodity Exchange Act.
The application of the amended rules to “funds-of-funds” remains unclear. Accordingly, the Adviser has filed for relief with respect to the Fund that operates as “a fund-of-funds” which defers compliance until the later of June 30, 2013 or six months following the effective date of any CFTC guidance regarding the application of the amended rules to “fund-of-funds.”
Fund-of-Funds Structure
Section 12(d)(1)(A) of the 1940 Act, in relevant part, prohibits a registered investment company from acquiring shares of an investment company if after such acquisition the securities represent more than 3% of the total outstanding voting stock of the acquired company, more than 5% of the total assets of the acquiring company, or, together with the securities of any other investment companies, more than 10% of the total assets of the acquiring company except in reliance on certain exceptions contained in the 1940 Act and the rules and regulations thereunder. The Trust and Aston have obtained an exemptive order from the SEC that allows the Funds to invest in both affiliated and unaffiliated investment companies in excess of the limits in Section 12(d)(1) of the 1940 Act, subject to the terms and conditions of such order. Prior to its investment in shares of an unaffiliated investment company in excess of the limit in section 12(d)(1)(A)(i) of the 1940 Act, the Trust, on behalf of a Fund, and the underlying fund must execute an agreement that is designed to ensure that the board of the underlying fund and its investment advisers understand the terms and conditions of the order and agree to fulfill their responsibilities under the order. ASTON/Lake Partners LASSO Alternatives Fund currently relies on the exemptive order.
The following supplements the information set forth above and in the Prospectus concerning the investment objective, strategies and risks of investing in ASTON/Lake Partners LASSO Alternatives Fund. For this portion of the SAI, the term “Fund” refers only to ASTON/Lake Partners LASSO Alternatives Fund.
Other Investment Companies
Investment Company Shares
As indicated above, investments by the Fund in underlying funds will be subject to the limitations of the 1940 Act, the rules and regulations thereunder and in certain circumstances SEC exemptive orders. The Fund may rely on SEC orders that permit it to invest in certain underlying fund shares beyond the limits contained in the 1940 Act, subject to the terms and conditions of those orders. By investing in securities of an underlying fund, the Fund’s shareholders will indirectly bear the fees and expenses of that underlying fund in addition to the Fund’s own fees and expenses. Pursuant to SEC rules, the Fund may invest in shares of affiliated and unaffiliated money market funds.
Open-End Mutual Funds
Open-end mutual funds are investment companies that issue new shares continuously and redeem shares daily. The risks of investment of open-end mutual funds typically reflect securities in which the funds invest. The net asset value per share of an open-end fund will fluctuate daily depending upon the performance of the securities held by the fund. Open-end mutual funds are offered in a wide variety of asset classes including: large cap, mid cap, small cap, equity, international, sector, fixed-income and alternative non-traditional strategies. Each type of fund may have a different investment objective and strategy and different investment portfolio. Different funds may also be subject to different risks,
33
volatility and fees and expenses. When the Fund invests in shares of an open-end fund, shareholders of the Fund bear their proportionate share of the open-end funds’ fees and expenses, as well as their share of the Fund’s fees and expenses.
Exchange-Traded Funds
ETFs are typically organized as open-end investment companies or unit investment trusts. ETFs are traded on exchanges similar to stocks. A passive ETF is an investment company that seeks to track the performance of an index (before fees and expenses) by holding in its portfolio either the securities that comprise the index or a representative sample of the securities in the index. An actively managed ETF is an investment company that seeks to outperform the performance of an index. ETFs offer investment in a wide variety of asset classes, including: large-cap, mid-cap, small-cap, equity, international, commodities, real estate, fixed income, derivatives and currency. ETFs offer investments in a range of securities including index based, actively managed and target date funds. As new ETF products become available, the asset classes and strategies available to the Fund will expand.
Unlike interests in conventional mutual funds, ETFs are traded throughout the day on a national securities exchange, whereas mutual fund interests are typically only bought and sold at closing net asset values. ETFs are designed to be tradable in the secondary market on a national securities exchange on an intra-day basis, and to be created and redeemed principally in-kind in large blocks (typically 50,000 shares), called creation units, at each day’s next calculated net asset value. The in-kind creation or redemption is for a portfolio of the underlying securities of the ETF. There may also be a cash component. These arrangements are designed to protect ongoing shareholders from adverse effects on the portfolio of the ETF that could arise from frequent cash creation and redemption transactions. In a conventional mutual fund, redemptions can have an adverse tax impact on taxable shareholders because of the mutual fund’s need to sell portfolio securities to obtain cash to meet fund redemptions. These sales may generate taxable gains for the shareholders of the mutual fund, whereas an ETF’s in-kind redemption mechanism generally will not lead to a federal income tax event for a Fund or its ongoing shareholders. The Fund does not intend to purchase and redeem creation units, but intends to purchase and sell ETFs primarily through national securities exchanges.
There is a risk that the ETFs in which the Fund invests may terminate due to extraordinary events that may cause any of the service providers to the ETFs, such as the trustee or sponsor, to close or otherwise fail to perform their obligations to the ETF. Also, because the ETFs in which the Fund intends to principally invest may be granted licenses by agreement to use the indices as a basis for determining their compositions and/or otherwise to use certain trade names, the ETFs may terminate if such license agreements are terminated. In addition, an ETF may terminate if its entire net asset value falls below a certain amount. Although the Fund believes that, in the event of the termination of an underlying ETF, it will be able to invest instead in shares of an alternate ETF tracking the same market index or another market index with the same general market, there is no guarantee that shares of an alternate ETF would be available for investment at that time. Unlike many investment companies, many ETFs are not currently “actively” managed. Thus, an ETF would not necessarily sell a security because the security’s issuer was in financial trouble unless that security is removed from the index.
Closed-End Funds
Closed-end funds are investment companies that typically issue a fixed number of shares that trade on a securities exchange or over-the-counter. The risks of investment in closed-end funds typically reflect the risk of the types of securities in which the funds invest. Investments in closed-end funds are subject to the additional risk that shares of the fund may trade at a premium or discount to their net asset value per share. Closed-end funds come in many varieties and can have different investment objectives,
34
strategies and investment portfolios. They also can be subject to different risks, volatility and fees and expenses. When the Fund invests in shares of a closed-end fund, shareholders of the Fund bear their proportionate share of the closed-end fund’s fees and expenses, as well as their share of the Fund’s fees and expenses.
Exchange-Traded Notes
The Fund and underlying funds may invest in ETNs. ETNs are securities that combine aspects of a bond and an ETF. ETN returns are based upon the performance of a market index or other reference asset less fees, and can be held to maturity as a debt security. ETNs are traded on a securities exchange. Their value is based on their reference index or strategy and the credit quality of the issuer. ETNs are subject to the additional risk that they may trade at a premium or discount to value attributable to their reference index. When the Fund invests in an ETN, shareholders of the Fund bear their proportionate share of the ETN’s fees and expenses, as well as their share of the Fund’s fees and expenses. There may also not be an active trading market available for some ETNs. Additionally, trading of ETNs may be halted or delisted by the listing exchange.
Illiquid Securities
The Fund may invest up to 15% of its net assets in securities that are illiquid. Securities are generally considered illiquid if they cannot be disposed of in seven days in the ordinary course of business at approximately the price at which the Fund values the security. The underlying funds may also invest in illiquid securities. Illiquid securities will generally include but are not limited to: insurance funding agreements, repurchase agreements and time deposits with notice/termination dates in excess of seven days; unlisted over-the-counter options; swap agreements, interest rate caps, floors and collars; and certain securities which are subject to trading restrictions because they are not registered under the 1933 Act. Foreign securities that are restricted as to resale in the U.S., but are freely tradable in their local market, are not considered illiquid.
Investment Risk
The underlying funds cover a wide variety of asset classes. The risks associated with various types of underlying funds that invest in different asset classes are described below. As new underlying fund products become available, the Fund will be able to invest in those funds, consistent with its investment objective and subject to its investment policies and restrictions.
Aggressive Investment Technique Risk
Underlying funds may use investment techniques and financial instruments that could be considered aggressive, including the use of futures contracts, options on futures contracts, securities and indices, forward contracts, swap agreements and similar instruments. An underlying fund’s investment in financial instruments may involve a small investment relative to the amount of investment exposure assumed and may result in losses that exceed the amounts invested in those instruments. Such instruments, particularly when used to create leverage, may expose the underlying fund to potentially dramatic changes (losses or gains) in the value of the instruments and imperfect correlation between the value of the instruments and the relevant security or index. The use of aggressive investment techniques also exposes an underlying fund to risks different from, or possibly greater than, the risks associated with investing directly in securities on which the aggressive technique is based, including: 1) the risk that an instrument is temporarily mispriced; 2) credit, performance or documentation risk on the amount each underlying fund expects to receive from a counterparty; 3) the risk that securities prices, interest rates and currency markets will move adversely and an underlying fund will incur significant losses; 4) imperfect
35
correlation between the price of financial instruments and movements in the prices of the underlying securities; 5) the risk that the cost of holding a financial instrument might exceed its total return; and 6) the possible absence of a liquid secondary market for any particular instrument and possible exchange imposed price fluctuation limits, both of which may make it difficult or impossible to adjust an underlying fund’s position in a particular instrument when desired.
Currency Risk
The Fund’s assets and net asset value are denominated in U.S. dollars. Investing in underlying funds that have exposure to currencies other than the U.S. dollar involves certain risks. The value of such underlying fund’s shares relate directly to the value of foreign securities held by the underlying fund. Fluctuations in the price of foreign securities could materially and adversely affect the value of the underlying fund’s shares. The price of the currency may fluctuate widely. Several factors may affect the price of the currency, including, but not limited to: debt level and trade deficit; inflation rates of the United States and foreign countries and investors’ expectations concerning inflation rates; investment and trading activities of mutual funds, hedge funds and currency funds; and global or regional political, economic or financial events and conditions. In addition, a currency may not maintain its long-term value in terms of purchasing power in the future. When the price of the country’s currency declines relative to another currency, it is expected that the price of an underlying fund holding such a currency will decline as well.
Commodity Risk
Investing in underlying funds that have exposure to investments in the commodities market may subject the Fund to greater volatility than investments in traditional securities. Commodities include metals, energy, agricultural products, livestock and minerals. Certain underlying funds may buy certain commodities (such as gold) or may invest in commodity-linked derivative instruments. The value of commodities and commodity contracts are affected by a variety of factors, including, but not limited to: global supply and demand, changes in interest rates, commodity index volatility, and factors affecting a particular industry or commodity, such as drought, floods, weather, livestock disease, embargos, government regulation, tariffs and taxes, world events and economic, political and regulatory developments. The Fund’s ability to invest in underlying funds that invest in or have exposure to investments in the commodities market may be significantly limited by the federal income tax rules applicable to regulated investment companies.
Concentration Risk
Some underlying funds may be concentrated in a narrow industry. Concentration risk results from maintaining exposure to issuers conducting business in a specific industry. The risk of concentrating investments in a limited number of issuers in a particular industry is that the underlying fund will be more susceptible to the risks associated with that industry than a fund that does not concentrate its investments. An index-based underlying fund may have significant exposure to individual companies or industry sectors that constitute a significant portion of the referenced index. As a result, such an underlying fund will be more susceptible to the risks associated with that specific company or industry sector, which may be different from the risks generally associated with the companies contained in the index. In addition, the Fund limits its investments to a limited universe of investment companies that focus on hedging or alternative investment strategies.
36
Derivative Instruments Risk
The term “derivatives” has been used to identify a range and variety of financial instruments. In general, a derivative is commonly defined as a financial instrument whose performance and value are derived, at least in part, from another source, such as the performance of an underlying asset, a specific security or an index of securities. As is the case with other types of investments, an underlying fund’s derivative instruments may entail various types and degrees of risk, depending upon the characteristics of the derivative instrument and an underlying fund’s overall portfolio. Underlying funds may use derivative instruments for hedging purposes, to maintain liquidity or in anticipation of changes in the composition of its portfolio holdings or as otherwise provided in an underlying fund’s prospectus.
The types of derivative securities in which underlying funds invest may include, but are not limited to, forward commitments, foreign currency contracts, futures contracts, options, swap agreements and commodity-linked derivative instruments.
Forward Foreign Currency Exchange Contracts Risk. An underlying fund may engage in certain foreign currency transactions, such as forward foreign currency exchange contracts, to guard against fluctuations in currency exchange rates in relation to the U.S. dollar or to the weighting of particular foreign currencies. In addition, an underlying fund may buy and sell foreign currency futures contracts and options on foreign currencies and foreign currency futures.
A forward foreign currency exchange contract involves an obligation to purchase or sell a specific currency at a future date, which may be any fixed number of days from the date of the contract agreed upon by the parties, at a price set at the time of the contract. By entering into a forward foreign currency exchange contract, an underlying fund “locks in” the exchange rate between the currency it will deliver and the currency it will receive for the duration of the contract. As a result, an underlying fund reduces its exposure to changes in the value of the currency it will deliver and increases its exposure to changes in the value of the currency it will exchange into. Contracts to sell foreign currencies would limit any potential gain which might be realized by an underlying fund if the value of the hedged currency increases. An underlying fund may enter into these contracts for the purpose of hedging against foreign exchange risks arising from an underlying fund’s investment or anticipated investment in securities denominated in foreign currencies. Such hedging transactions may not be successful and may eliminate any chance for an underlying fund to benefit from favorable fluctuations in relevant foreign currencies.
An underlying fund may also enter into forward foreign currency exchange contracts for purposes of increasing exposure to a foreign currency or to shift exposure to foreign currency fluctuations from one currency to another. To the extent that it does so, an underlying fund will be subject to the additional risk that the relative value of currencies will be different than anticipated by the particular fund’s investment adviser or subadviser. An underlying fund may use one currency (or a basket of currencies) to hedge against adverse changes in the value of another currency (or a basket of currencies) when exchange rates between the two currencies are positively correlated. An underlying fund may also use foreign currency futures contracts and related options on currencies for the same reasons for which forward foreign currency exchange contracts are used.
The use of currency transactions can result in an underlying fund incurring losses as a result of a number of factors including the imposition of exchange controls, suspension of settlements, or the inability to deliver or receive a specified currency.
Futures Contracts Risk. Futures contracts are generally considered to be derivative securities. An underlying fund may engage in such practices for hedging purposes or to maintain liquidity or as otherwise provided in the fund’s prospectus. Typically, maintaining a futures contract or selling an option
37
thereon requires an underlying fund to deposit with a financial intermediary as security for its obligations an amount of cash or other specified assets (initial margin) which initially is typically 1% to 10% of the face amount of the contract (but may be higher in some circumstances). Additional cash or assets (variation margin) may be required to be deposited thereafter on a daily basis as the marked- to- market value of the contract fluctuates.
At maturity, a futures contract obligates an underlying fund to take or make delivery of certain securities or the cash value of a securities index. An underlying fund may sell a futures contract in order to offset a decrease in the market value of its portfolio securities that might otherwise result from a market decline. An underlying fund may do so either to hedge the value of its portfolio of securities as a whole, or to protect against declines, occurring prior to sales of securities, in the value of the securities to be sold. Conversely, an underlying fund may purchase a futures contract in anticipation of purchases of securities. In addition, an underlying fund may utilize futures contracts in anticipation of changes in the composition of its portfolio holdings.
For federal income tax purposes, some gains derived by a fund from the use of such instruments will be treated as a combination of short-term and long-term capital gains and, if not offset by realized capital losses incurred by a fund, will be distributed to shareholders and will be taxable to shareholders as a combination of ordinary income and long-term capital gain.
Underlying funds may purchase and sell call and put options on futures contracts traded on an exchange or board of trade. When a fund purchases an option on a futures contract, it has the right to assume a position as a purchaser or seller of a futures contract at a specified exercise price at any time during the option period. When a fund sells an option on a futures contract, it becomes obligated to purchase or sell a futures contract if the option is exercised. In anticipation of a market advance, a fund may purchase call options on futures contracts as a substitute for the purchase of futures contracts to hedge against a possible increase in the price of securities that a fund intends to purchase. Similarly, if the market is expected to decline, an underlying fund might purchase put options or sell call options on futures contracts rather than sell futures contracts.
Underlying funds may enter into a contract for the purchase or sale for future delivery of securities, including index contracts. While futures contracts provide for the delivery of securities, deliveries usually do not occur. Contracts are generally terminated by entering into offsetting transactions.
Underlying funds may enter into such futures contracts to protect against the adverse effects of fluctuations in security prices or interest rates without actually buying or selling the securities. For example, if interest rates are expected to increase, an underlying fund might enter into futures contracts for the sale of debt securities. Such a sale would have much the same effect as selling an equivalent value of the debt securities owned by an underlying fund. If interest rates did increase, the value of the debt securities in the portfolio would decline, but the value of the futures contracts to an underlying fund would increase at approximately the same rate, thereby keeping the net asset value of an underlying fund from declining as much as it otherwise would have. Similarly, when it is expected that interest rates may decline, futures contracts may be purchased to hedge in anticipation of subsequent purchases of securities at higher prices. Since the fluctuations in the value of futures contracts is expected to be similar to those of debt securities, an underlying fund could take advantage of the anticipated rise in value of debt securities without actually buying them until the market had stabilized. At that time, the futures contracts could be liquidated and an underlying fund could then buy debt securities on the cash market.
A stock index futures contract obligates the seller to deliver (and the purchaser to take) an amount of cash equal to a specific dollar amount times the difference between the value of a specific stock index at the close of the last trading day of the contract and the price at which the agreement was made. Open
38
futures contracts are valued on a daily basis and an underlying fund may be obligated to provide or receive cash reflecting any decline or increase in the contract’s value. No physical delivery of the underlying stocks in the index is made in the future.
With respect to options on futures contracts, when an underlying fund is temporarily not fully invested, it may purchase a call option on a futures contract to hedge against a market advance. The purchase of a call option on a futures contract is similar in some respects to the purchase of a call option on an individual security. Depending on the pricing of the option compared to either the price of the futures contract upon which it is based, or the price of the underlying debt securities, it may or may not be less risky than ownership of the futures contract or underlying debt securities. As with the purchase of futures contracts, when an underlying fund is not fully invested, it may purchase a call option on a futures contract to hedge against a market advance.
The writing of a call option on a futures contract constitutes a partial hedge against the declining price of the security or foreign currency that is deliverable upon exercise of the futures contract. If the futures price at the expiration of the option is below the exercise price, an underlying fund will retain the full amount of the option premium which provides a partial hedge against any decline that may have occurred in the value of an underlying fund’s portfolio holdings. The writing of a put option on a futures contract constitutes a partial hedge against the increasing price of the security or foreign currency, which is deliverable upon exercise of the futures contract. If the futures price at the expiration of the option is higher than the exercise price, an underlying fund will retain the full amount of the option premium, which provides a partial hedge against any increase in the price of securities that an underlying fund intends to purchase.
Call and put options on stock index futures are similar to options on securities except that, rather than the right to purchase or sell stock at a specified price, options on a stock index future give the holder the right to receive cash. Upon exercise of the option, the delivery of the futures position by the writer of the option to the holder of the option will be accompanied by delivery of the accumulated balance in the writer’s futures margin account, which represents the amount by which the market price of the futures contract, at exercise, exceeds (in the case of a call) or is less than (in the case of a put) the exercise price of the futures contract. If an option is exercised on the last trading day prior to the expiration date of the option, the settlement will be made entirely in cash equal to the difference between the exercise price of the option and the closing price of the futures contract on the expiration date.
If a put or call option which an underlying fund has written is exercised, that underlying fund may incur a loss which will be reduced by the amount of the premium it received. Depending on the degree of correlation between changes in the value of its portfolio securities and changes in the value of its options positions, an underlying fund’s losses from existing options on futures may to some extent be reduced or increased by changes in the value of portfolio securities.
To the extent that market prices move in an unexpected direction, an underlying fund may not achieve the anticipated benefits of futures contracts or options on futures contracts or may realize a loss. For example, if an underlying fund is hedged against the possibility of an increase in interest rates and interest rates decrease instead, that underlying fund would lose part or all of the benefit of the increased value, which it has because it would have offsetting losses in its futures position. In addition, in such situations, if an underlying fund had insufficient cash, it may be required to sell securities from its portfolio to meet daily variation margin requirements. Such sales of securities may, but will not necessarily, be at increased prices which reflect the rising market. An underlying fund may be required to sell securities at a time when it may be disadvantageous to do so.
Options on securities, futures contracts, options on futures contracts and options on currencies may be traded on foreign exchanges. Such transactions may not be regulated as effectively as similar
39
transactions in the U.S., may not involve a clearing mechanism and related guarantees and are subject to the risk of governmental actions affecting trading in or the prices of foreign securities. Some foreign exchanges may be principal markets so that no common clearing facility exists and a trader may look only to the broker for performance of the contract. The value of such positions also could be adversely affected by (i) other complex foreign political, legal and economic factors, (ii) lesser availability than in the U.S. of data on which to make trading decisions, (iii) delays in the underlying fund’s ability to act upon economic events occurring in foreign markets during non-business hours in the U.S., (iv) the imposition of different exercise and settlement terms and procedures and margin requirements than in the U.S. and (v) lesser trading volume. In addition, unless a fund hedges against fluctuations in the exchange rate between the U.S. dollar and the currencies in which trading is done on foreign exchanges, any profits that a fund might realize in trading could be eliminated by adverse changes in the exchange rate, or a fund could incur losses as a result of those changes.
Further, with respect to options on futures contracts, an underlying fund may seek to close out an option position by writing or buying an offsetting position covering the same securities or contracts and have the same exercise price and expiration date. The ability to establish and close out positions on options will be subject to the maintenance of a liquid secondary market, which cannot be assured.
Options Risk. A call option enables the purchaser, in return for the premium paid, to purchase securities from the writer of the option at an agreed price up to an agreed date. The advantage is that the purchaser may hedge against an increase in the price of securities it ultimately wishes to buy or may take advantage of a rise in a particular index. A put option enables the purchaser of the option, in return for the premium paid, to sell the security underlying the option to the writer at the exercise price during the option period. The writer of the option has the obligation to purchase the security from the purchaser of the option. The advantage is that the purchaser can be protected should the market value of the security decline or should a particular index decline. An underlying fund will receive premium income from writing put options, although it may be required, when the put is exercised, to purchase securities at higher prices than the current market price. At the time of purchase, an underlying fund will receive premium income from writing call options, which may offset the cost of purchasing put options and may also contribute to that underlying fund’s total return. An underlying fund may lose potential market appreciation if the judgment of its investment adviser or subadviser is incorrect with respect to interest rates, security prices or the movement of indices.
An option on a securities index gives the purchaser of the option, in return for the premium paid, the right to receive cash from the seller equal to the difference between the closing price of the index and the exercise price of the option.
Closing transactions essentially let an underlying fund offset put options or call options prior to exercise or expiration. If an underlying fund cannot effect a closing transaction, it may have to hold a security it would otherwise sell or deliver a security it might want to hold.
Options are generally considered to be derivative securities. Options may relate to particular securities, stock indices or financial instruments they may or may not be listed on a national securities exchange, and they may or may not be issued by the Options Clearing Corporation. Options trading is a highly specialized activity which entails greater than ordinary investment risk. Options on particular securities may be more volatile than the underlying securities, and on a percentage basis, an investment in options may be subject to greater fluctuation than an investment in the underlying securities themselves.
In the case of a call option on a security, the option is “covered” if an underlying fund owns the security underlying the call or has an absolute and immediate right to acquire that security without additional cash consideration (or, if additional cash consideration is required, cash or liquid securities in such amount will be segregated by a fund) upon conversion or exchange of other securities held by it. For
40
a call option on an index, the option is covered if an underlying fund maintains with its custodian a diversified stock portfolio or liquid assets equal to the contract value.
A call option is also covered if a fund holds a call on the same security or index as the call written where the exercise price of the call held is (i) equal to or less than the exercise price of the call written or (ii) greater than the exercise price of the call written provided the difference is maintained by a fund in cash or liquid securities in a segregated account with its custodian or fund accounting agent.
An underlying fund’s obligation to sell a security subject to a covered call option written by it, or to purchase a security subject to a secured put option written by it, may be terminated prior to the expiration date of the option by a fund’s execution of a closing purchase transaction, which is effected by purchasing on an exchange an option of the same series as the previously written option. Such a purchase does not result in the ownership of an option. A closing purchase transaction will ordinarily be effected to realize a profit on an outstanding option, to prevent an underlying security from being called, to permit the sale of the underlying security or to permit the writing of a new option containing different terms on such underlying security. The cost of such a liquidation purchase plus transaction costs may be greater than the premium received upon the original option, in which event a fund will have incurred a loss in the transaction.
There is no assurance that a liquid secondary market will exist for any particular option. An option writer, unable to effect a closing purchase transaction, will not be able to sell the underlying security (in the case of a covered call option) or liquidate the segregated securities (in the case of a secured put option) until the option expires or the optioned security is delivered upon exercise with the result that the writer in such circumstances will be subject to the risk of market decline or appreciation in the security during such period.
Purchasing Call Options: When an underlying fund purchases a call option, in return for a premium paid by the fund to the writer of the option, that fund obtains the right to buy the security underlying the option at a specified exercise price at any time during the term of the option. The writer of the call option, who receives the premium upon writing the option, has the obligation, upon exercise of the option, to deliver the underlying security against payment of the exercise price. The advantage of purchasing call options is that a fund may alter portfolio characteristics and modify portfolio maturities without incurring the cost associated with transactions, except the cost of the option.
Following the purchase of a call option, an underlying fund may liquidate its position by effecting a closing sale transaction by selling an option of the same series as the option previously purchased. An underlying fund will realize a profit from a closing sale transaction if the price received on the transaction is more than the premium paid to purchase the original call option; an underlying fund will realize a loss from a closing sale transaction if the price received on the transaction is less than the premium paid to purchase the original call option.
There is no assurance that a liquid secondary market on an exchange will exist for any particular option, or at any particular time, and for some options no secondary market on an exchange may exist. In such event, it may not be possible to effect closing transactions in particular options, with the result that a fund would have to exercise its options in order to realize any profit and would incur brokerage commissions upon the exercise of such options and upon the subsequent disposition of the underlying securities acquired through the exercise of such options. Further, unless the price of the underlying security changes sufficiently, a call option purchased by an underlying fund may expire without any value to the underlying fund, in which event the underlying fund would realize a capital loss which will be short-term unless the option was held for more than one year.
41
Covered Call Writing: An underlying fund may write covered call options. The advantage to an underlying fund of writing covered calls is that the fund receives a premium that is additional income. However, if the security rises in value, an underlying fund may not fully participate in the market appreciation.
During the option period, a covered call option writer may be assigned an exercise notice by the broker-dealer through whom such call option was sold, requiring the writer to deliver the underlying security against payment of the exercise price. This obligation is terminated upon the expiration of the option or upon entering a closing purchase transaction. A closing purchase transaction, in which an underlying fund, as writer of an option, terminates its obligation by purchasing an option of the same series as the option previously written, cannot be effected with respect to an option once the option writer has received an exercise notice for such option.
Closing purchase transactions will ordinarily be effected to realize a profit on an outstanding call option, to prevent an underlying security from being called, to permit the sale of the underlying security or to enable an underlying fund to write another call option on the underlying security with either a different exercise price or expiration date or both. An underlying fund may realize a net gain or loss from a closing purchase transaction depending upon whether the net amount of the original premium received on the call option is more or less than the cost of effecting the closing purchase transaction. Any loss incurred in a closing purchase transaction may be partially or entirely offset by the premium received from a sale of a different call option on the same underlying security. Such a loss may also be wholly or partially offset by unrealized appreciation in the market value of the underlying security. Conversely, a gain resulting from a closing purchase transaction could be offset in whole or in part by a decline in the market value of the underlying security.
If a call option expires unexercised, an underlying fund will realize a short-term capital gain in the amount of the premium on the option less the commission paid. Such a gain, however, may be offset by depreciation in the market value of the underlying security during the option period if such security is sold or there is another recognition event. If a call option is exercised, an underlying fund will realize a gain or loss from the sale of the underlying security equal to the difference between the cost of the underlying security and the proceeds of the sale of the security plus the amount of the premium on the option less the commission paid.
Purchasing Put Options: An underlying fund may invest in put options. The purchase of the put option on substantially identical securities held by an underlying fund will constitute a short sale for federal income tax purposes, which may result in a short-term capital gain on the sale of the security if such substantially identical securities were held by that fund for not more than one year as of the date of the short sale or were acquired by that fund after the short sale and on or before the closing date of the short sale.
A put option purchased by an underlying fund gives it the right to sell one of its securities for an agreed price up to an agreed date. An underlying fund would purchase put options in order to protect against a decline in the market value of the underlying security below the exercise price less the premium paid for the option (“protective puts”). The ability to purchase put options allows an underlying fund to protect unrealized gains in an appreciated security in their portfolios without actually selling the security. If the security does not drop in value, an underlying fund will lose the value of the premium paid. An underlying fund may sell a put option which it has previously purchased prior to the sale of the securities underlying such option. Such sale will result in a net gain or loss depending on whether the amount received on the sale is more or less than the premium and other transaction costs paid on the put option which is sold.
42
An underlying fund may sell a put option purchased on individual portfolio securities. Additionally, an underlying fund may enter into closing sale transactions. A closing sale transaction is one in which an underlying fund, when it is the holder of an outstanding option, liquidates its position by selling an option of the same series as the option previously purchased.
Writing Put Options: Underlying funds may also write put options. Secured put options will generally be written in circumstances where the investment adviser of the underlying fund wishes to purchase the underlying security for the fund’s portfolio at a price lower than the current market price of the security. In such event, that underlying fund would write a secured put option at an exercise price which, reduced by the premium received on the option, reflects the lower price it is willing to pay.
Following the writing of a put option, an underlying fund may wish to terminate the obligation to buy the security underlying the option by effecting a closing purchase transaction. This is accomplished by buying an option of the same series as the option previously written. However, an underlying fund may not affect such a closing transaction after it has been notified of the exercise of the option.
Foreign Currency Options: Underlying funds may buy or sell put and call options on foreign currencies either on exchanges or in the over-the-counter market. A put option on a foreign currency gives the purchaser of the option the right to sell a foreign currency at the exercise price until the option expires. A call option on a foreign currency gives the purchaser of the option the right to purchase the currency at the exercise price until the option expires. Currency options traded on U.S. or other exchanges may be subject to position limits that may limit the ability of an underlying fund to reduce foreign currency risk using such options.
Swap Agreements Risk. Underlying funds may enter into interest rate, index, credit default, equity, and currency exchange rate swap agreements. These transactions would be entered into in an attempt to obtain a particular return when it is considered desirable to do so, possibly at a lower cost to a fund than if the underlying fund had invested directly in the asset that yielded the desired return. Swap agreements are two-party contracts entered into primarily by institutional investors for periods ranging from a few weeks to more than one year. In a standard swap transaction, two parties agree to exchange the returns (or differentials in rates of return) earned or realized on particular predetermined investments or instruments, which may be adjusted for an interest factor. The gross returns to be exchanged or “swapped” between the parties are generally calculated with respect to a “normal amount,” i.e., the return on or increase in value of a particular dollar amount invested at a particular interest rate, in a particular foreign currency, or in a “basket” of securities representing a particular index.
An underlying fund may enter into credit default swap agreements. The “buyer” in a credit default contract is obligated to pay the “seller” a periodic stream of payments over the term of the contract provided that no credit event with respect to any underlying reference obligation has occurred. If a credit event occurs, the seller typically must pay the buyer the “par value” (full notional value) of the reference obligation in exchange for the reference obligation. An underlying fund may either be the buyer or the seller in the transaction. If an underlying fund is a buyer and no credit event occurs, the fund loses its investment and recovers nothing. However, if a credit event occurs, the buyer receives full notional value for a reference obligation that may have little or no value. As a seller, an underlying fund typically receives a fixed rate of income throughout the term of the contract, which typically is between six months and three years, provided a credit event does not occur. If a credit event occurs, the seller typically must pay the buyer the full notional amount of the reference obligation even though the reference obligation may have little or no value. Credit default swaps involve more risk than if an underlying fund had invested in the reference obligation directly because the fund can obtain credit exposure in excess of its cash obligations under the agreement.
43
Many swap agreements entered into by an underlying fund calculate the obligations of the parties to the agreement on a “net basis.” Consequently, the underlying fund’s current obligations (or rights) under a swap agreement will generally be equal only to the net amount to be paid or received under the agreement based on the relative values of the positions held by each party to the agreement (the “net amount”). Payments under certain swap agreements, however, including credit default swaps, are not calculated on a “net basis.” For example, when an underlying fund sells credit protection, it has an obligation to pay the buyer the full notional value of the reference obligation, which amount generally is not determined on a net basis.
Whether an underlying fund’s use of swap agreements will be successful in furthering its investment objective will depend on the fund’s investment adviser or subadviser’s ability to correctly predict whether certain types of investments are likely to produce greater returns than other investments. Because they are two-party contracts and because they may have terms of greater than seven days, swap agreements may be considered to be illiquid investments. Moreover, an underlying fund bears the risk of loss of the amount expected to be received under a swap agreement in the event of the default or bankruptcy of a swap agreement counterparty. Generally, an underlying fund will enter into swap agreements only with counterparties that meet certain standards for creditworthiness (generally, such counterparties would have to be eligible counterparties under the terms of the fund’s repurchase agreement guidelines). Certain restrictions imposed by the Code for qualification as a regulated investment company may limit an underlying fund’s ability to use swap agreements. The swap market is a relatively new market and is largely unregulated. It is possible that developments in the swap market, including potential government regulation, could adversely affect the fund’s ability to terminate existing swap agreements or to realize amounts to be received under such agreements.
Commodity-Linked Derivative Instruments Risk. An underlying fund may invest in commodity-linked derivative instruments, including structured notes. The value of a commodity-linked derivative instrument typically is based on the price movements of a particular commodity, a commodity futures contract or commodity index, or some other readily measurable economic variable dependent upon changes in the value of commodities or the commodities markets.
An underlying fund may invest in derivative debt instruments with principal and/or coupon payments linked to the value of commodities, commodity futures contracts, or the performance of commodity indices. These are “commodity-linked” or “index-linked” notes. They are sometimes referred to as “structured notes” because the terms of the debt instrument may be structured by the issuer of the note and the purchaser of the note, such as the underlying fund. These notes may be issued by banks, brokerage firms, insurance companies and other corporations.
The values of these notes will rise and fall in response to changes in the underlying commodity or related index or investment. These notes expose the underlying fund economically to movements in commodity prices, but a particular note is primarily a debt obligation. These notes also are subject to credit and interest rate risks that in general affect the value of debt securities. Therefore, at the maturity of the note, the underlying fund may receive more or less principal than it originally invested. The underlying fund might receive interest payments on the note that are more or less than the stated coupon interest rate payments.
The structured notes an underlying fund enters into are expected to involve leverage, meaning that the value of the instrument will be calculated as a multiple of the upward or downward price movement of the underlying index. The prices of commodity-linked instruments may move in different directions than investments in traditional equity and debt securities in periods of rising inflation. Of course, there can be no guarantee that the underlying fund’s commodity-linked investments would not be correlated with traditional financial assets under any particular market conditions.
44
Commodity-linked structured notes may be issued by U.S. and foreign banks, brokerage firms, insurance companies and other corporations. These notes are debt securities of the issuer and so, in addition to fluctuating in response to changes in the underlying commodity index, will be subject to credit and interest rate risks that typically affect debt securities.
Distressed and Defaulted Securities Risk
The underlying funds may invest in the securities of financially distressed and bankrupt issuers, including debt obligations that are in covenant or payment default. Such investments generally trade significantly below par and are considered speculative. The repayment of defaulted obligations is subject to significant uncertainties. Defaulted obligations might be repaid only after lengthy workout or bankruptcy proceedings, during which the issuer might not make any interest or other payments. Typically such workout or bankruptcy proceedings result in only partial recovery of cash payments or an exchange of the defaulted obligation for other debt or equity securities of the issuer or its affiliates, which may in turn be illiquid or speculative.
Equity Risk
Underlying funds may invest long or short in a wide variety of equities, including U.S., foreign and emerging market equities, as well as large cap, mid-cap and small cap stocks. Equities and securities with equity characteristics entail various risks which can affect underlying funds.
Credit Risk. Credit risk is the risk that the issuer of a security or counterparty to a transaction will be unable or unwilling to make timely principal and/or interest payments, or otherwise will be unable or unwilling to honor its financial obligations. If the issuer or counterparty fails to honor its obligations, the value of that security and of the particular underlying fund’s shares may be reduced.
Market Risk. Overall stock market risks affect the value of underlying funds, and thus the share price of the Funds. Factors such as domestic economic growth and market conditions, interest rate levels and political events affect the securities markets.
Small and Mid-Cap Company Risk. Investing in underlying funds that own securities of small- and mid-cap companies may involve greater risks than investing in securities of larger, more established issuers. Small- and mid-cap companies generally have limited product lines, markets and financial resources. Their securities may trade less frequently and in more limited volume than the securities of larger, more established companies. Also, small- and mid-cap companies are typically subject to greater changes in earnings and business prospects than larger companies. As a result, their stock prices may experience greater volatility and may decline significantly in market downturns.
Foreign Securities Risk. Investing in underlying funds that invest in foreign issuers involves risks not associated with U.S. investments, including settlement risks, currency fluctuation, local withholding and other taxes, different financial reporting practices and regulatory standards, high costs of trading, changes in political conditions, expropriation, investment and repatriation restrictions and settlement and custody risks.
Emerging Market Risk. The Funds may invest in underlying funds that invest in issuers located in emerging markets. Emerging market countries may have relatively unstable governments, less diverse economies and less liquid securities markets. Companies in emerging markets are often smaller, less seasoned and more recently organized.
45
Exchange-Traded Note Risk
Underlying funds may invest in ETNs. The returns of ETNs are based on the performance of a specified market index minus applicable fees. The risks of ETNs include the risk of the reference index. The value of an ETN is also subject to the credit risk of the issuer. Thus, the value of an ETN may drop due to a decline in an issuer’s credit quality or a downgrade in the issuer’s credit rating, even if there is no change or an increase in the reference index. ETNs are subject to the additional risk that notes may trade at a premium or discount to their reference index. When the Fund invests in an ETN, shareholders of the Fund bear their proportionate share of the ETN’s fees and expenses as well as their share of the Fund’s fees and expenses. There may also not be an active trading market available for some ETNs. Additionally, trading of ETNs may be halted or delisted by the listing exchange.
Fixed Income Risk
Underlying funds may invest long or short in a wide variety of fixed income securities and instruments. Fixed income securities and instruments entail various risks which can affect underlying funds.
Credit Risk. Credit risk is the risk that the issuer or guarantor of a debt security or counterparty to a transaction involving one or more bonds in an underlying fund’s portfolio will be unable or unwilling to make timely principal and/or interest payments, or otherwise will be unable or unwilling to honor its financial obligations. If the issuer, guarantor, or counterparty fails to pay interest, an underlying fund’s income may be reduced. If the issuer, guarantor, or counterparty fails to repay principal, the value of that security and of the particular underlying fund’s shares may be reduced. Underlying funds may be subject to credit risk to the extent that they invest in debt securities which involve a promise by a third party to honor an obligation with respect to the debt security. Credit risk is particularly significant for investments in “junk bonds” or lower than investment-grade securities.
Interest Rate Risk. The price of a bond or a fixed income security is dependent upon interest rates. Therefore, the share price and total return of an underlying fund, when investing a significant portion of its assets in bonds or fixed income securities, will vary in response to changes in interest rates. A rise in interest rates generally causes the value of a bond to decrease, and vice versa. There is the possibility that the value of the particular underlying fund’s investment in bonds or fixed income securities may fall because bonds or fixed income securities generally fall in value when interest rates rise. The longer the term of a bond or fixed income instrument, the more sensitive it will be to fluctuations in value from interest rate changes. Changes in interest rates may have a significant effect if the particular underlying fund is then holding a significant portion of its assets in fixed income securities with long-term maturities.
In the case of mortgage-backed securities, rising interest rates tend to extend the term to maturity of the securities, making them even more susceptible to interest rate changes. When interest rates drop, not only can the value of fixed income securities drop, but also the yield can drop, particularly where the yield is tied to changes in interest rates, such as adjustable mortgages. Also when interest rates drop, the holdings of mortgage-backed securities by an underlying fund can reduce returns if the owners of the underlying mortgages pay off their mortgages sooner than expected since the funds prepaid must be reinvested at the then lower prevailing rates. This is known as prepayment risk. When interest rates rise, the holdings of mortgage-backed securities by an underlying fund can reduce returns if the owners of the underlying mortgages pay off their mortgages later than anticipated. This is known as extension risk.
Maturity Risk. Maturity risk is another factor that can affect the value of a particular underlying fund’s debt holdings. Certain underlying funds may not have a limitation policy regarding the length of maturity of its debt holdings. In general, the longer the maturity of a debt obligation, the higher its yield
46
and the greater its sensitivity to changes in interest rates. Conversely, the shorter the maturity, the lower the yield and the greater the price stability.
Investment-Grade Securities Risk. Debt securities are rated by national bond rating agencies. Securities rated BBB by S&P or Fitch’s Investor Service, Inc. (“Fitch”) or Baa by Moody’s are considered investment-grade securities, but are somewhat riskier than more highly rated investment-grade obligations (those rated A or better by S&P or Fitch and Aa or better by Moody’s) because they are regarded as having only an adequate capacity to pay principal and interest, are considered to lack outstanding investment characteristics, and may be speculative. Such investment-grade securities will be subject to higher credit risk and may be subject to greater fluctuations in value than higher-rated securities.
Municipal Securities Risk. Municipal securities are subject to the risk that litigation, legislation or other political events, local business or economic conditions or the bankruptcy of the issuer could have a significant effect on an issuer’s ability to make payments of principal and/or interest.
Municipal securities can be significantly affected by political changes as well as uncertainties in the municipal market related to taxation, legislative changes or the rights of municipal security holders. Because many securities are issued to finance similar projects, especially those relating to education, health care, transportation and utilities, conditions in those sectors can affect the overall municipal market. In addition, changes in the financial condition of an individual municipal insurer can affect the overall municipal market.
Municipal securities backed by current or anticipated revenues from a specific project or specific assets can be negatively affected by the discontinuance of the taxation supporting the project or assets or the inability to collect revenues from the project or from the assets. If the Internal Revenue Service (“IRS”) determines an issuer of a municipal security has not complied with applicable federal income tax requirements, interest from the security could become taxable for federal income tax purposes and the security could decline significantly in value.
Below Investment Grade (High Yield) Debt Securities Risk
Fixed income securities rated Ba or lower by Moody’s or BB or lower by S&P, frequently referred to as “junk bonds,” are considered to be of poor standing and predominantly speculative. They generally offer higher yields than higher rated bonds. Such securities are subject to a substantial degree of credit risk. Such medium- and low-grade bonds held by an underlying fund may be issued as a consequence of corporate restructurings, such as leveraged buy-outs, mergers, acquisitions, debt recapitalizations or similar events. Additionally, high-yield bonds are often issued by smaller, less creditworthy companies or by highly leveraged firms, which are generally less able than more financially stable firms to make scheduled payments of interest and principal. The risks posed by bonds issued under such circumstances are substantial. Changes by recognized rating agencies in their rating of any security and in the ability of an issuer to make payments of interest and principal will ordinarily have a more dramatic effect on the values of these investments than on the values of higher-rated securities. Such changes in value will not affect cash income derived from these securities, unless the issuers fail to pay interest or dividends when due. Such changes will, however, affect an underlying fund’s net asset value per share.
In the past, the high yields from low-grade bonds have more than compensated for the higher default rates on such securities. However, there can be no assurance that diversification will protect an underlying fund from widespread bond defaults brought about by a sustained economic downturn, or that yields will continue to offset default rates on high-yield bonds in the future. Issuers of these securities are
47
often highly leveraged, so that their ability to service their debt obligations during an economic downturn or during sustained periods of rising interest rates may be impaired. In addition, such issuers may not have more traditional methods of financing available to them and may be unable to repay debt at maturity by refinancing.
The value of lower-rated debt securities will be influenced not only by changing interest rates, but also by the bond market’s perception of credit quality and the outlook for economic growth. When economic conditions appear to be deteriorating, low- and medium-rated bonds may decline in market value due to investors’ heightened concern over credit quality, regardless of prevailing interest rates. Adverse publicity and investor perceptions, whether or not based on fundamental analysis, may decrease the value and liquidity of lower-rated securities held by an underlying fund, especially in a thinly traded market. Illiquid or restricted securities held by an underlying fund may involve valuation difficulties. Trading in the secondary market for high-yield bonds may become thin and market liquidity may be significantly reduced. Even under normal conditions, the market for high-yield bonds may be less liquid than the market for investment-grade corporate bonds. There are fewer securities dealers in the high-yield market, and purchasers of high-yield bonds are concentrated among a smaller group of securities dealers and institutional investors. In periods of reduced market liquidity, high-yield bond prices may become more volatile.
Lower-Rated Securities Market – An economic downturn or increase in interest rates is likely to have an adverse effect on the lower-rated securities market generally (resulting in more defaults) and on the value of lower-rated securities contained in the portfolios of an underlying fund which holds these securities.
Sensitivity to Economic and Interest Rate Changes – The economy and interest rates can affect lower-rated securities differently from other securities. For example, the prices of lower-rated securities are more sensitive to adverse economic changes or individual corporate developments than are the prices of higher-rated investments. Also, during an economic downturn or substantial period of rising interest rates, highly leveraged issuers may experience financial stress which would adversely affect their ability to service their principal and interest payment obligations, to meet projected business goals or to obtain additional financing. If the issuer of a lower-rated security defaulted, an underlying fund may incur additional expenses to seek recovery. In addition, periods of economic uncertainty and changes can be expected to result in increased volatility of market prices of lower-rated securities and an underlying fund’s net asset values.
Liquidity and Valuation – To the extent that an established secondary market does not exist and a particular obligation is thinly traded, the obligation’s fair value may be difficult to determine because of the absence of reliable, objective data. As a result, an underlying fund’s valuation of the obligation and the price it could obtain upon its disposition could differ.
Credit Ratings – The credit ratings of Moody’s and S&P are evaluations of the safety of principal and interest payments of lower-rated securities. There is a risk that credit rating agencies may fail to timely change the credit ratings to reflect subsequent events. Therefore, in addition to using recognized rating agencies and other sources, an underlying fund’s investment adviser or subadviser also performs its own analysis of issuers in selecting investments for an underlying fund. An underlying fund’s investment adviser or subadviser’s analysis of issuers may include, among other things, historic and current financial condition, current and anticipated cash flow and borrowing strength of management, responsiveness to business conditions, credit standing and current and anticipated results of operations.
Yields and Ratings – The yields on certain obligations are dependent on a variety of factors, including general market conditions, conditions in the particular market for the obligation, the financial condition of the issuer, the size of the offering, the maturity of the obligation and the ratings of the issue.
48
The ratings of Moody’s and S&P represent their respective opinions as to the quality of the obligations they undertake to rate. Ratings, however, are general and are not absolute standards of quality. Consequently, obligations with the same rating, maturity and interest rate may have different market prices.
While any investment carries some risk, certain risks associated with lower-rated securities are different from those for investment-grade securities. The risk of loss through default is greater because lower-rated securities are usually unsecured and are often subordinate to an issuer’s other obligations. Additionally, the issuers of these securities frequently have high debt levels and are thus more sensitive to difficult economic conditions, individual corporate developments and rising interest rates. Consequently, the market price of these securities may be quite volatile and may result in wider fluctuations of an underlying fund’s net asset value per share.
Geographical Concentration Risk
Certain underlying funds that focus their investments in particular countries or geographic regions may be particularly susceptible to economic, political or regulatory events affecting those countries or regions. In addition, currency devaluations could occur in countries that have not yet experienced currency devaluation to date, or could continue to occur in countries that have already experienced such devaluations. As a result, underlying funds that focus their investments in a particular geographic region or country may be more volatile than a more geographically diversified fund.
Correlation Risk
There is a risk that changes in the value of hedging instruments used on underlying funds will not match those of the investment being hedged. Underlying funds benchmarked to an inverse multiple of an index should lose value as the index or security underlying such ETF’s benchmark is increasing (gaining value), a result that is the opposite from traditional mutual funds.
Borrowing/Leverage Risk
Underlying funds may borrow money for investment purposes, commonly referred to as “leveraging.” As a result, the underlying fund’s exposure to fluctuations in the price of its assets will be increased as compared to its exposure if the fund did not borrow. Borrowing activities by an underlying fund will amplify any increase or decrease in the net asset value of the fund. In addition, the interest which the underlying fund pays on borrowed money, together with the additional costs of maintaining a borrowing facility, are additional costs borne by the fund and could reduce or eliminate any net investment profits. Unless profits on assets acquired with borrowed funds exceed the costs of borrowing, the use of borrowing will diminish the investment performance of the underlying fund compared with what it would have been without borrowing. When the underlying fund borrows money it must comply with certain asset coverage requirements, which at times may require the fund to dispose of some of its portfolio holdings even though it may be disadvantageous to do so at the time.
Short Sales Risk
Underlying funds may sell securities short. Selling securities short involves selling securities the seller (e.g., a fund) does not own (but has borrowed) in anticipation of a decline in the market price of such securities. To deliver the securities to the buyer, the seller must arrange through a broker to borrow the securities and, in so doing, the seller becomes obligated to replace the securities borrowed at their market price at the time of the replacement. In a short sale, the proceeds the seller receives from the sale are retained by a broker until the seller replaces the borrowed securities. The seller may have to pay a
49
premium to borrow the securities and must pay any dividends or interest payable on the securities until they are replaced.
A short sale is “against the box” if, at all times during which the short position is open, a fund owns at least an equal amount of the securities or securities convertible into, or exchangeable without further consideration for, securities of the same issuer as the securities that are sold short.
An underlying fund may also maintain short positions in forward currency exchange transactions, in which a fund agrees to exchange currency that it does not own at that time for another currency at a future date and specified price in anticipation of a decline in the value of the currency sold short relative to the currency that a fund has contracted to receive in the exchange.
Short sales involve the risk that an underlying fund will incur a loss by subsequently buying a security at a higher price than the price at which the underlying fund previously sold the security short. Any loss will be increased by the amount of compensation, dividends or interest the fund must pay to the lender of the security. Because a loss incurred by an underlying fund on a short sale results from increases in the value of the security, losses on a short sale are theoretically unlimited and disproportionate to its potential profit. In addition, an underlying fund may not be able to close out a short position at a particular time or at an acceptable price. A lender may request that borrowed securities be returned on short notice, and the underlying fund may have to buy the securities sold short at an unfavorable price. If this occurs at a time when other short sellers of the same security want to close out their positions, it is more likely that the underlying fund would have to close out its short position at an unfavorable price.
If an underlying fund takes both long and short positions, there is a risk that the value of securities held long might decrease and the value of securities sold short might increase in response to activities of an individual company or general market conditions. In this case, an underlying fund’s potential losses could exceed those of mutual funds that hold only long positions.
Real Estate Investment Trust Risk
Investing in underlying funds that own securities of real estate investment trusts (“REITs”) subjects the underlying fund to the risk of changes in the value of the REIT’s properties and defaults by borrowers or tenants. Some REITs may have limited diversification and may be subject to risks inherent in investments in a limited number of properties, in a narrow geographic area, or in a single property type. REITs depend generally on their ability to generate cash flow to make distributions to shareholders or unitholders, and may be subject to defaults by borrowers and self-liquidations. A REIT’s return may be adversely affected when interest rates are high or rising. A REIT’s return may be adversely affected if financing is not readily available or if regulations governing REITs change.
Non-Diversified Risk
Certain underlying funds have the ability to concentrate a relatively high percentage of their investments in the securities of a small number of issuers. This would make the performance of the underlying fund more susceptible to a single economic, political or regulatory event than a diversified mutual fund or ETF might be. This risk may be particularly acute with respect to an underlying fund whose index underlying its benchmark comprises a small number of stocks or other securities.
50
INVESTMENT RESTRICTIONS
The investment objective of each Fund and investment restrictions set forth below are fundamental policies and may not be changed as to a Fund without the approval of a majority of the outstanding voting shares (as defined in the 1940 Act) of the Fund. Unless otherwise indicated, all percentage limitations governing the investments of each Fund apply only at the time of transaction. Accordingly, if a percentage restriction is adhered to at the time of investment, a later increase or decrease in the percentage which results from a relative change in values or from a change in a Fund’s total assets will not be considered a violation.
The Funds subject to each investment restriction are listed below such restriction. The applicable Funds may not:
(1) Purchase or sell real estate (but this restriction shall not prevent the Funds from investing directly or indirectly in portfolio instruments secured by real estate or interests therein or acquiring securities of real estate investment trusts or other issuers that deal in real estate), interests in oil, gas and/or mineral exploration or development programs or leases.
ASTON/Montag & Caldwell Growth
ASTON/Cornerstone Large Cap Value
ASTON/TAMRO Diversified Equity
ASTON/Fairpointe Mid Cap
ASTON/TAMRO Small Cap
ASTON Small Cap
ASTON/TCH Fixed Income
ASTON/Harrison Street Real Estate
ASTON/Montag & Caldwell Balanced
(2) Purchase or sell real estate (but this restriction shall not prevent the Funds from investing directly or indirectly in portfolio instruments secured by real estate or interests therein or acquiring securities of real estate investment trusts or other issuers that deal in real estate).
ASTON/Herndon Large Cap Value
ASTON/River Road Dividend All Cap Value
ASTON/River Road Dividend All Cap Value II
ASTON/Montag & Caldwell Mid Cap Growth
ASTON/River Road Select Value
ASTON/River Road Small Cap Value
ASTON/River Road Independent Value
ASTON/LMCG Small Cap Growth
ASTON/DoubleLine Core Plus Fixed Income
ASTON/Lake Partners LASSO Alternatives
ASTON/Anchor Capital Enhanced Equity
ASTON/River Road Long-Short
ASTON/Barings International
ASTON/Silvercrest Small Cap
51
(3) Purchase the securities of issuers conducting their principal business activities in the same industry (other than obligations issued or guaranteed by the U.S. government, its agencies or instrumentalities) if immediately after such purchase the value of a Fund’s investments in such industry would exceed 25% of the value of the total assets of the Fund, except ASTON/Harrison Street Real Estate Fund, which will have a concentration in the real estate sector.
ASTON/Montag & Caldwell Growth
ASTON/Herndon Large Cap Value
ASTON/Cornerstone Large Cap Value
ASTON/TAMRO Diversified Equity
ASTON/River Road Dividend All Cap Value
ASTON/River Road Dividend All Cap Value II
ASTON/Fairpointe Mid Cap
ASTON/Montag & Caldwell Mid Cap Growth
ASTON/TAMRO Small Cap
ASTON/River Road Select Value
ASTON/River Road Small Cap Value
ASTON/River Road Independent Value
ASTON/LMCG Small Cap Growth
ASTON Small Cap
ASTON/DoubleLine Core Plus Fixed Income
ASTON/TCH Fixed Income
ASTON/Anchor Capital Enhanced Equity
ASTON/River Road Long-Short
ASTON/Barings International
ASTON/Harrison Street Real Estate
ASTON/Montag & Caldwell Balanced
ASTON/Silvercrest Small Cap
(4) Act as an underwriter of securities, except that, in connection with the disposition of a security, a Fund may be deemed to be an “underwriter” as that term is defined in the 1933 Act.
ASTON/Montag & Caldwell Growth
ASTON/Herndon Large Cap Value
ASTON/Cornerstone Large Cap Value
ASTON/TAMRO Diversified Equity
ASTON/River Road Dividend All Cap Value
ASTON/River Road Dividend All Cap Value II
ASTON/Fairpointe Mid Cap
ASTON/Montag & Caldwell Mid Cap Growth
ASTON/TAMRO Small Cap
ASTON/River Road Select Value
ASTON/River Road Small Cap Value
ASTON/River Road Independent Value
ASTON/LMCG Small Cap Growth
ASTON Small Cap
ASTON/DoubleLine Core Plus Fixed Income
ASTON/TCH Fixed Income
ASTON/Lake Partners LASSO Alternatives
ASTON/Anchor Capital Enhanced Equity
ASTON/River Road Long-Short
52
ASTON/Barings International
ASTON/Harrison Street Real Estate
ASTON/Montag & Caldwell Balanced
ASTON/Silvercrest Small Cap
(5) As to 75% of the total assets of each Fund, purchase the securities of any one issuer (other than securities issued by the U.S. government or its agencies or instrumentalities) if immediately after such purchase, more than 5% of the value of the Fund’s total assets would be invested in securities of such issuer.
ASTON/Montag & Caldwell Growth
ASTON/TAMRO Diversified Equity
ASTON/Fairpointe Mid Cap
ASTON/TAMRO Small Cap
ASTON/River Road Small Cap Value
ASTON Small Cap
ASTON/TCH Fixed Income
ASTON/Montag & Caldwell Balanced
(6) Borrow money or issue senior securities, except that each Fund may borrow from banks and enter into reverse repurchase agreements for temporary purposes in amounts up to one-third of the value of its total assets at the time of such borrowing. The Funds may not mortgage, pledge or hypothecate any assets, except in connection with any such borrowing and in amounts not in excess of the lesser of the dollar amounts borrowed or 10% of the value of the total assets of the Fund at the time of its borrowing. All borrowings will be done from a bank and asset coverage of at least 300% is required. A Fund will not purchase securities when borrowings exceed 5% of that Fund’s total assets.
ASTON/Montag & Caldwell Growth
ASTON/TAMRO Diversified Equity
ASTON/River Road Dividend All Cap Value
ASTON/Fairpointe Mid Cap
ASTON/TAMRO Small Cap
ASTON/River Road Small Cap Value
ASTON Small Cap
ASTON/TCH Fixed Income
ASTON/Montag & Caldwell Balanced
(7) Invest more than 5% of its total assets in securities of companies less than three years old. Such three-year periods shall include the operation of any predecessor trust or companies.
ASTON/Montag & Caldwell Growth
ASTON/TAMRO Diversified Equity
ASTON/Fairpointe Mid Cap
ASTON/TAMRO Small Cap
ASTON/River Road Small Cap Value
ASTON Small Cap
ASTON/TCH Fixed Income
ASTON/Montag & Caldwell Balanced
(8) Purchase or sell commodities or commodity contracts, except that a Fund may enter into futures contracts and options thereon in accordance with such Fund’s investment objectives and policies.
53
ASTON/Montag & Caldwell Growth
ASTON/Herndon Large Cap Value
ASTON/TAMRO Diversified Equity
ASTON/River Road Dividend All Cap Value
ASTON/Fairpointe Mid Cap
ASTON/Montag & Caldwell Mid Cap Growth
ASTON/TAMRO Small Cap
ASTON/River Road Select Value
ASTON/River Road Small Cap Value
ASTON/River Road Independent Value
ASTON/LMCG Small Cap Growth
ASTON Small Cap
ASTON/DoubleLine Core Plus Fixed Income
ASTON/TCH Fixed Income
ASTON/Anchor Capital Enhanced Equity
ASTON/River Road Long-Short
ASTON/Barings International
ASTON/Montag & Caldwell Balanced
ASTON/Silvercrest Small Cap
(9) Make investments in securities for the purpose of exercising control.
ASTON/Montag & Caldwell Growth
ASTON/Herndon Large Cap Value
ASTON/TAMRO Diversified Equity
ASTON/River Road Dividend All Cap Value
ASTON/River Road Dividend All Cap Value II
ASTON/Fairpointe Mid Cap
ASTON/Montag & Caldwell Mid Cap Growth
ASTON/TAMRO Small Cap
ASTON/River Road Select Value
ASTON/River Road Small Cap Value
ASTON/River Road Independent Value
ASTON/LMCG Small Cap Growth
ASTON Small Cap
ASTON/DoubleLine Core Plus Fixed Income
ASTON/TCH Fixed Income
ASTON/Lake Partners LASSO Alternatives
ASTON/Anchor Capital Enhanced Equity
ASTON/River Road Long-Short
ASTON/Barings International
ASTON/Montag & Caldwell Balanced
ASTON/Silvercrest Small Cap
(10) Purchase the securities of any one issuer if, immediately after such purchase, a Fund would own more than 10% of the outstanding voting securities of such issuer.
ASTON/Montag & Caldwell Growth
ASTON/Herndon Large Cap Value
ASTON/TAMRO Diversified Equity
ASTON/River Road Dividend All Cap Value
54
ASTON/Fairpointe Mid Cap
ASTON/Montag & Caldwell Mid Cap Growth
ASTON/TAMRO Small Cap
ASTON/River Road Select Value
ASTON/River Road Small Cap Value
ASTON Small Cap
ASTON/TCH Fixed Income
ASTON/Anchor Capital Enhanced Equity
ASTON/Barings International
ASTON/Montag & Caldwell Balanced
(11) Sell securities short or purchase securities on margin, except such short-term credits as are necessary for the clearance of transactions. For this purpose, the deposit or payment by a Fund for initial or maintenance margin in connection with futures contracts is not considered to be the purchase or sale of a security on margin.
ASTON/Montag & Caldwell Growth
ASTON/Herndon Large Cap Value
ASTON/TAMRO Diversified Equity
ASTON/River Road Dividend All Cap Value
ASTON/Fairpointe Mid Cap
ASTON/Montag & Caldwell Mid Cap Growth
ASTON/TAMRO Small Cap
ASTON/River Road Select Value
ASTON/River Road Small Cap Value
ASTON/LMCG Small Cap Growth
ASTON Small Cap
ASTON/DoubleLine Core Plus Fixed Income
ASTON/TCH Fixed Income
ASTON/Lake Partners LASSO Alternatives
ASTON/Anchor Capital Enhanced Equity
ASTON/Barings International
ASTON/Montag & Caldwell Balanced
(12) Make loans, except that this restriction shall not prohibit (a) the purchase and holding of debt instruments in accordance with a Fund’s investment objectives and policies, (b) the lending of portfolio securities, or (c) the entry into repurchase agreements with banks or broker-dealers.
ASTON/Montag & Caldwell Growth
ASTON/Herndon Large Cap Value
ASTON/TAMRO Diversified Equity
ASTON/River Road Dividend All Cap Value
ASTON/Fairpointe Mid Cap
ASTON/Montag & Caldwell Mid Cap Growth
ASTON/TAMRO Small Cap
ASTON/River Road Select Value
ASTON/River Road Small Cap Value
ASTON/LMCG Small Cap Growth
ASTON Small Cap
ASTON/DoubleLine Core Plus Fixed Income
ASTON/TCH Fixed Income
55
ASTON/Lake Partners LASSO Alternatives
ASTON/Anchor Capital Enhanced Equity
ASTON/Barings International
ASTON/Montag & Caldwell Balanced
(13) Invest in puts, calls, straddles or combinations thereof, except to the extent disclosed in the SAI.
ASTON/Montag & Caldwell Growth
ASTON/Herndon Large Cap Value
ASTON/TAMRO Diversified Equity
ASTON/River Road Dividend All Cap Value
ASTON/Fairpointe Mid Cap
ASTON/Montag & Caldwell Mid Cap Growth
ASTON/TAMRO Small Cap
ASTON/River Road Select Value
ASTON/River Road Small Cap Value
ASTON/LMCG Small Cap Growth
ASTON Small Cap
ASTON/DoubleLine Core Plus Fixed Income
ASTON/TCH Fixed Income
ASTON/Lake Partners LASSO Alternatives
ASTON/Barings International
ASTON/Montag & Caldwell Balanced
(14) Borrow money or issue senior securities, except that a Fund may borrow from banks and enter into reverse repurchase agreements for temporary purposes in amounts up to one-third of the value of its total assets at the time of such borrowing.
ASTON/Herndon Large Cap Value
ASTON/Montag & Caldwell Mid Cap Growth
ASTON/River Road Select Value
ASTON/LMCG Small Cap Growth
ASTON/DoubleLine Core Plus Fixed Income
ASTON/Lake Partners LASSO Alternatives
ASTON/Anchor Capital Enhanced Equity
ASTON/Barings International
(15) As to 75% of the total assets of the Fund, purchase the securities of any one issuer (other than cash, other investment companies and securities issued by the U.S. government or its agencies or instrumentalities) if immediately after such purchase, more than 5% of the value of the Fund’s total assets would be invested in the securities of such issuer.
ASTON/Herndon Large Cap Value
ASTON/Montag & Caldwell Mid Cap Growth
ASTON/River Road Select Value
ASTON/LMCG Small Cap Growth
ASTON/Lake Partners LASSO Alternatives
ASTON/Anchor Capital Enhanced Equity
ASTON/Barings International
56
(16) Issue senior securities (as defined in the 1940 Act), except in connection with permitted borrowings as described above or as permitted by rule, regulation or order of the SEC.
ASTON/Herndon Large Cap Value
ASTON/Cornerstone Large Cap Value
ASTON/River Road Dividend All Cap Value
ASTON/River Road Dividend All Cap Value II
ASTON/Montag & Caldwell Mid Cap Growth
ASTON/River Road Select Value
ASTON/River Road Small Cap Value
ASTON/River Road Independent Value
ASTON/LMCG Small Cap Growth
ASTON/DoubleLine Core Plus Fixed Income
ASTON/Lake Partners LASSO Alternatives
ASTON/Anchor Capital Enhanced Equity
ASTON/River Road Long-Short
ASTON/Barings International
ASTON/Harrison Street Real Estate
ASTON/Silvercrest Small Cap
(17) Purchase the securities of issuers conducting their principal business activities in the same industry (other than obligations issued or guaranteed by the U.S. government, its agencies or instrumentalities) if immediately after such purchase the value of the Funds’ investments in such industry would exceed 25% of the value of the total assets of the Funds; provided that investments in another registered investment company are not considered to be issued by members of any industry.
ASTON/Lake Partners LASSO Alternatives
(18) Purchase or sell commodities or commodity contracts unless acquired as a result of ownership securities or other investments. This limitation does not preclude the Funds from entering into futures contracts and options thereon in accordance with the Funds’ investment objective and policies, from investing in securities or other instruments backed by commodities or from investing in companies, which are engaged in a commodities business or have a significant portion of their assets in commodities.
ASTON/Lake Partners LASSO Alternatives
(19) Borrow money, except that a Fund may borrow money (a) for temporary or emergency purposes in an amount not exceeding 5% of the Fund’s total assets determined at the time of the borrowing; and (b) from banks or by engaging in reverse repurchase agreements. Asset coverage of at least 300% is required for all borrowings, except where a Fund has borrowed money for temporary purposes in amounts not exceeding 5% of its total assets.
ASTON/Cornerstone Large Cap Value
ASTON/Harrison Street Real Estate
(20) Make loans, except as permitted by the 1940 Act, and the rules and regulations thereunder.
ASTON/Cornerstone Large Cap Value
ASTON/River Road Independent Value
ASTON/River Road Long-Short
ASTON/Harrison Street Real Estate
57
ASTON/River Road Dividend All Cap Value II
ASTON/Silvercrest Small Cap
(21) Purchase securities of any issuer (except securities issued or guaranteed by the U.S. government, its agencies or instrumentalities and repurchase agreements involving such securities) if as a result more than 5% of the total assets of the Fund would be invested in the securities of such issuer or more than 10% of the outstanding voting securities of such issuer would be owned by the Fund. This restriction applies to 75% of the Fund’s assets.
ASTON/Cornerstone Large Cap Value
(22) As to 75% of the total assets of the Fund, (i) purchase the securities of any one issuer (other than cash, other investment companies and securities issued by the U.S. government or its agencies or instrumentalities) if immediately after such purchase, more than 5% of the value of the Fund’s total assets would be invested in securities of such issuer; or (ii) purchase more than 10% of the outstanding voting securities of such issuer.
ASTON/River Road Independent Value
ASTON/DoubleLine Core Plus Fixed Income
ASTON/River Road Dividend All Cap Value II
ASTON/Silvercrest Small Cap
(23) Purchase securities on margin, except such short-term credits as are necessary for the clearance of transactions. For this purpose, the deposit or payment by the Fund for initial or maintenance margin in connection with futures contracts is not considered to be the purchase or sale of a security on margin.
ASTON/River Road Independent Value
ASTON/River Road Long-Short
ASTON/River Road Dividend All Cap Value II
ASTON/Silvercrest Small Cap
(24) Borrow money, except that the Fund may borrow from banks and enter into reverse repurchase agreements for temporary purposes in amounts up to one-third of the value of its total assets at the time of such borrowing.
ASTON/River Road Independent Value
ASTON/River Road Long-Short
ASTON/River Road Dividend All Cap Value II
ASTON/Silvercrest Small Cap
(25) Purchase physical commodities, except to the extent permitted under the 1940 Act, the rules and regulations thereunder and any applicable exemptive relief or unless acquired as a result of the ownership of securities or instruments, but this restriction shall not prohibit the Fund from purchasing futures contracts, options, foreign currencies or forward contracts, swaps, caps, collars, floors and other financial instruments or from investing in securities of any kind.
ASTON/River Road Dividend All Cap Value II
The underlying funds in which the ASTON/Lake Partners LASSO Alternatives Fund will invest have adopted certain investment restrictions that may be more or less restrictive than those listed for the Fund above, thereby allowing the Fund to participate in certain investment strategies indirectly that are
58
prohibited under the fundamental investment restrictions listed above for the Fund. The investment restrictions for such underlying funds will be set forth in their respective prospectuses and statements of additional information.
With respect to limitiation (8) above, such limitation should not be deemed to prohibit investments in forwards, swaps or other instruments that were not deemed “commodity interests” prior to July 21, 2010.
NON-FUNDAMENTAL INVESTMENT POLICIES
For purposes of ASTON/Harrison Street Real Estate Fund’s investment policies, a company is “principally engaged” in the real estate industry if (i) it derives at least 50% of its revenues or profits from the ownership, construction, management, financing, or sale of residential, commercial, or industrial real estate or (ii) it has at least 50% of the fair market value of its assets invested in residential, commercial, or industrial real estate. Companies in the real estate industry may include, but are not limited to, REITs or other securitized real estate investments, MLPs that are treated as corporations for federal income tax purposes and that invest in interests in real estate, real estate operating companies, real estate brokers or developers, financial institutions that make or service mortgages, and companies with substantial real estate holdings, such as lumber and paper companies, hotel companies, residential builders and land-rich companies.
ASTON/Cornerstone Large Cap Value and ASTON/Harrison Street Real Estate Funds may enter into futures contract transactions only to the extent that obligations under such contracts represent less than 20% of the Fund’s assets. The aggregate value of option positions may not exceed 10% of a Fund’s net assets as of the time such options are entered into by a Fund.
Each of ASTON/Herndon Large Cap Value Fund, ASTON/Cornerstone Large Cap Value Fund, ASTON/TAMRO Diversified Equity Fund, ASTON/Fairpointe Mid Cap Fund, ASTON/Montag & Caldwell Mid Cap Growth Fund, ASTON/TAMRO Small Cap Fund, ASTON/Silvercrest Small Cap Fund, ASTON/River Road Small Cap Value Fund, ASTON/LMCG Small Cap Growth Fund, ASTON Small Cap Fund, ASTON/DoubleLine Core Plus Fixed Income Fund, ASTON/TCH Fixed Income Fund, ASTON/Lake Partners LASSO Alternatives Fund, ASTON/Anchor Capital Enhanced Equity Fund and ASTON/Harrison Street Real Estate Fund has a policy to invest, under normal circumstances, at least 80% of its assets, plus the amount of any borrowings for investment purposes, in the type of investments suggested by its name as described in the Prospectus in accordance with Rule 35d-1 of the 1940 Act. Pursuant to such rule, shareholders will receive at least 60 days’ notice of a change of such policy.
59
TRUSTEES AND OFFICERS OF THE TRUST
Under Delaware law, the business and affairs of the Trust are managed under the direction of the Board. Information pertaining to the Trustees and officers of the Trust is set forth below. The term “officer” means the president, vice president, secretary, treasurer, controller or any other officer who performs a policy making function.
| | | | | | | | | | |
Name, Address, Age and Position(s) with Trust | | Term of
Office(1)
and
Length
of Time
Served | | Principal Occupation(s) During Past Five Years | | Number of
Portfolios
in Fund
Complex(2)
Overseen
by Trustee | | Other Trusteeships/ Directorships Held by Trustee
During Past Five Years | | Experience, Qualifications, Attributes, Skills for Board
Membership |
| | | | | |
Independent Trustees | | | | | | | | | | |
| | | | | |
William E. Chapman, II c/o Aston Funds 120 N. LaSalle Street Chicago, IL 60602 Age: 71 Trustee; Independent Chairman | | Since 2010 | | President and Owner, Longboat Retirement Planning Solutions (1998-present); Trustee of Bowdoin College (2002-present); Hewitt Associates, LLC (part time) (provider of Retirement and Investment Education Seminars) (2002-2009) | | 23 | | Director of Harding, Loevner Funds, Inc. (6 portfolios); Trustee of Third Avenue Trust (5 portfolios); Trustee of Third Avenue Variable Trust (1 portfolio); Trustee of The Managers Funds, Managers AMG Funds, Managers Trust I and Managers Trust II (36 portfolios) | | Significant board experience; significant executive experience with several financial services firms; continuing service as Independent Chairman of the Board. |
| | | | | |
Edward J. Kaier c/o Aston Funds 120 N. LaSalle Street Chicago, IL 60602 Age: 67 Trustee | | Since 2010 | | Attorney at Law and Partner, Teeters Harvey Gilboy & Kaier LLP (2007-present); Attorney at Law and Partner, Hepburn Willcox Hamilton & Putnam, LLP (1977-2007) | | 23 | | Trustee of Third Avenue Trust (5 portfolios); Trustee of Third Avenue Variable Trust (1 portfolio); Trustee of The Managers Funds, Managers AMG Funds, Managers Trust I and Managers Trust II (36 portfolios) | | Significant board experience; practicing attorney. |
| | | | | |
Gregory T. Mutz c/o Aston Funds 120 N. LaSalle Street Chicago, IL 60602 Age: 67 Trustee | | Since 1993 | | Chairman and CEO of AMLI Residential Properties Trust (a Multifamily REIT), a successor company to AMLI Realty Co. (2004-present); Vice Chairman of UICI (NYSE: UCI) (an insurance holding company) (2003-2004) | | 23 | | Member of Board of Genesis Financial Solutions (a privately-held company based in Portland, Oregon providing debt recovery, consumer lending and credit card services) (2005-present); a member of the Board of WAN S.A., a residential real estate company headquartered in Warsaw, Poland (2008-present); a member of the | | Significant board experience; previous service as lead independent trustee; significant executive experience with several financial services firms. |
60
| | | | | | | | | | |
Name, Address, Age and Position(s) with Trust | | Term of
Office(1)
and
Length
of Time
Served | | Principal Occupation(s) During Past Five Years | | Number of
Portfolios
in Fund
Complex(2)
Overseen
by Trustee | | Other Trusteeships/ Directorships Held by Trustee
During Past Five Years | | Experience, Qualifications, Attributes, Skills for Board
Membership |
| | | | | |
| | | | | | | | Board of Suknip International Limited, a residential real estate company headquartered in St. Petersburg, Russia (2008-present); Formerly, Director of Alico, Inc. (NASDAQ: ALCO) (agribusiness) (2005-2009) | | |
| | | | | |
Steven J. Paggioli c/o Aston Funds 120 N. LaSalle Street Chicago, IL 60602 Age: 62 Trustee | | Since 2010 | | Independent Consultant (2002-present); formerly Executive Vice President and Director, The Wadsworth Group (1986-2001); Executive Vice President, Secretary and Director, Investment Company Administration, LLC (1990-2001); Vice President, Secretary and Director, First Fund Distributors, Inc. (1991-2001) | | 23 | | Trustee, Professionally Managed Portfolios (43 portfolios); Trustee of The Managers Funds, Managers AMG Funds, Managers Trust I and Managers Trust II (36 portfolios); Advisory Board Member, Sustainable Growth Advisors, LP; Independent Director, Chase Investment Counsel | | Significant board experience; significant executive experience with several financial services firms; former service with financial service regulator. |
| | | | | |
Eric Rakowski c/o Aston Funds 120 N. LaSalle Street Chicago, IL 60602 Age: 54 Trustee | | Since 2010 | | Professor, University of California at Berkeley School of Law (1990-present) | | 23 | | Director of Harding, Loevner Funds, Inc. (6 portfolios); Trustee of Third Avenue Trust (5 portfolios); Trustee of Third Avenue Variable Trust (1 portfolio); Trustee of The Managers Funds, Managers AMG Funds, Managers Trust I and Managers Trust II (36 portfolios) | | Significant board experience; former practicing attorney; currently professor of law. |
| | | | | |
Robert B. Scherer c/o Aston Funds 120 N. LaSalle Street Chicago, IL 60602 Age: 71 Trustee | | Since 1999 | | President of The Rockridge Group, Ltd. (title insurance industry consulting services) (1994-present) | | 23 | | Director, Title Reinsurance Company (insurance for title agents)(1998-present) | | Significant board experience; continuing service as Chair of the Audit Committee; significant executive experience as chief financial officer of insurance and financial services firm. |
61
| | | | | | | | | | |
Name, Address, Age and Position(s) with Trust | | Term of
Office(1)
and
Length
of Time
Served | | Principal Occupation(s) During Past Five Years | | Number of
Portfolios
in Fund
Complex(2)
Overseen
by Trustee | | Other Trusteeships/ Directorships Held by Trustee
During Past Five Years | | Experience, Qualifications, Attributes, Skills for Board
Membership |
| | | | | |
Thomas R. Schneeweis, c/o Aston Funds 120 N. LaSalle Street Chicago, IL 60602 Age: 65 Trustee | | Since 2010 | | Professor of Finance, University of Massachusetts (1977-present); Director, CISDM at the University of Massachusetts, (1996-present); President, TRS Associates (1982-present); President, Alternative Investment Analytics, LLC (formerly Schneeweis Partners, LLC) (2001-2012); Partner, White Bear Partners, LLC (2007-2010); Partner, S Capital Management, LLC (2007-present); Partner, Northampton Capital Management, LLC (2004-2010) | | 23 | | Trustee of The Managers Funds, Managers AMG Funds, Managers Trust I and Managers Trust II (36 portfolios) | | Significant board experience; currently professor of finance; significant executive experience with several investment partnerships. |
| | | | | |
Interested Trustees | | | | | | | | | | |
| | | | | |
Stuart D. Bilton, CFA(3) c/o Aston Funds 120 N. LaSalle Street Chicago, IL 60602 Age: 66 Trustee; Chief Executive Officer | | Trustee
since 1993;
Chief
Executive
Officer
since 2010 | | Chief Executive Officer, Aston Asset Management, LP (2006-present); Chairman, Aston Funds (1993-2010) | | 23 | | Director, Baldwin & Lyons, Inc. (property and casualty insurance firm) (1987-present); Director, Highbury Financial Inc. (2009-2010) | | Significant board experience; significant executive experience with several financial services firms; former Chairman of the Board. |
| | | | | |
Jeffrey S. Murphy(3) c/o Aston Funds 120 N. LaSalle Street Chicago, IL 60602 Age: 46 Trustee | | Since 2010 | | Senior Vice President, Affiliated Managers Group, Inc. (2007-present); Vice President, Affiliated Managers Group, Inc. (1995-2007) | | 23 | | N/A | | Significant financial industry experience; significant executive experience with several financial services firms. |
| | | | | |
| Officer(s) Who Are Not Trustees | | | | | | | | | | |
| | | | | |
Kenneth C. Anderson c/o Aston Funds 120 N. LaSalle Street Chicago, IL 60602 Age: 48 President | | Since 1993 | | President, Aston Asset Management, LP (2006-present); Director, Highbury Financial Inc. (2009-2010); CPA | | N/A | | N/A | | N/A |
| | | | | |
Gerald F. Dillenburg c/o Aston Funds 120 N. LaSalle Street Chicago, IL 60602 Age: 46 Senior Vice President, Secretary, Chief Operating Officer and Chief Compliance Officer | | Since 1996 | | Chief Compliance Officer, Aston Asset Management, LP (2006-present); Chief Financial Officer, Aston Asset Management, LP (2006-2010); CPA | | N/A | | N/A | | N/A |
| | | | | |
Laura M. Curylo c/o Aston Funds 120 N. LaSalle Street Chicago, IL 60602 Age: 44 Chief Financial Officer and | | Since 2010 | | Chief Financial Officer, Aston Asset Management, LP (2010-present); Vice President and Controller, Aston Asset Management, LP (2006-present); CPA | | N/A | | N/A | | N/A |
62
| | | | | | | | | | |
Name, Address, Age and Position(s) with Trust | | Term of
Office(1)
and
Length
of Time
Served | | Principal Occupation(s) During Past Five Years | | Number of
Portfolios
in Fund
Complex(2)
Overseen
by Trustee | | Other Trusteeships/ Directorships Held by Trustee
During Past Five Years | | Experience, Qualifications, Attributes, Skills for Board
Membership |
Treasurer | | | | | | | | | | |
| | | | | |
Christine C. Carsman c/o Aston Funds 120 N. LaSalle Street Chicago, IL 60602 Age: 60 Chief Legal Officer | | Since 2010 | | Senior Vice President (2007-present) and Deputy General Counsel (2011-present), Chief Regulatory Counsel (2004-2011), Vice President (2004-2007), Affiliated Managers Group, Inc.; Trustee, Managers AMG Funds, The Managers Funds, Managers Trust I and Managers Trust II (2011-present); Senior Counsel, Vice President and Director of Operational Risk Management and Compliance, Wellington Management Company, LLP (1995-2004) | | N/A | | N/A | | N/A |
| (1) | A Trustee serves for an indefinite term until the earliest of: (i) removal by two-thirds of the Board or shareholders, (ii) resignation, death or incapacity, (iii) the election and qualification of his successor, in accordance with the By-Laws of the Trust, or (iv) the last day of the fiscal year in which he attains the age of 75 years. Officers serve for an indefinite term until the earliest of: (i) removal by the Board, (ii) resignation, death or incapacity, or (iii) the election and qualification of their successors, in accordance with the By-Laws of the Trust. |
| (2) | The term “Fund Complex” includes all series of Aston Funds. |
| (3) | “Interested person” of the Trust as defined in the 1940 Act. Mr. Bilton is considered an “interested person” because of his affiliation with Aston Asset Management, LP which acts as the Funds’ investment adviser. Mr. Murphy is considered an “interested person” because of his affiliation with Affiliated Managers Group, Inc., the ultimate parent of the investment adviser, and related entities. |
Board of Trustees, Leadership Structure and Committees
Experience and Qualifications
The table above provides a summary of the experience, qualifications, attributes and skills of each Trustee in light of the Trust’s business and structure. The Board believes that the significance of each Trustee’s experience, qualifications, attributes or skills is an individual matter (meaning that experience that is important for one Trustee may not have the same value for another) and that these factors are best evaluated at the board level, with no single Trustee, or particular factor, being indicative of Board effectiveness. However, the Board believes that Trustees need to be able to critically review, evaluate, question and discuss information provided to them, and to interact effectively with Trust management, service providers and counsel, in order to exercise effective business judgment in the performance of their duties. The Board believes that each of its members has these abilities based upon their skills, experience, judgment, analytical ability, diligence, ability to work effectively with other Board members, and a commitment to the interests of shareholders. Experience relevant to having these abilities may be achieved through a Trustee’s educational background; business, professional training or practice (e.g., finance or law), or academic positions; experience from service as a board member (including the Board of the Trust) or as an executive of investment funds, other financial services firms, not-for-profit entities or other organizations; and/or other life experiences.
63
Board Structure
The Board has general oversight responsibility with respect to the business and affairs of the Trust. Because all Funds in the Fund Complex are series of the Trust, a single Board oversees the operations of all the Aston Funds. The Board establishes policies and reviews and approves contracts and their continuance. The Trustees regularly request and/or receive reports from Aston, the Trust’s other service providers and the Trust’s Chief Compliance Officer (the “CCO”). The Board currently is composed of nine Trustees, seven of whom are not “interested persons” (as that term is defined in the 1940 Act) and are designated in the table above as “Independent Trustees.” An Independent Trustee serves as the Chairman of the Board (the “Independent Chairman”). The Independent Chairman, among other things, chairs meetings of the Trustees, consults with the Chief Executive Officer on the agenda, and facilitates communication among the Independent Trustees, management of the Funds and the full Board. The Board believes that a chairman without any conflicts of interests arising from a position with Trust management promotes the independent oversight function of the Board.
The Board has established three standing committees. The Audit Committee is responsible for monitoring the Funds’ accounting policies, financial reporting and internal control system; monitoring the work of the Funds’ independent accountants; and providing an open avenue of communication among the independent accountants, Fund management and the Board. The Nominating and Governance Committee is primarily responsible for the identification and recommendation of individuals for Board membership and for overseeing the administration of the Trust’s Governance Guidelines. The Nominating and Governance Committee will consider nominees recommended by shareholders whose resumes have been submitted by U.S. mail or courier service to the Trust’s Secretary for the attention of the Chairman of the Nominating and Governance Committee. All of the Independent Trustees serve as members of the Audit Committee and Nominating and Governance Committee. Mr. Scherer serves as Chairman of the Audit Committee. Mr. Mutz serves as Chairman of the Nominating and Governance Committee. The Valuation Committee is responsible for fair valuing securities of the Funds as may be necessary from time to time. The Valuation Committee members are Messrs. Bilton (Chairman), Scherer, Chapman (alternate) and Schneeweis (alternate). The Trust’s day-to-day operations are managed by the Adviser and other service providers. The Board and the committees meet regularly throughout the year to review the Trust’s activities, including, fund performance, valuation matters and compliance with regulatory requirements, and to review contractual arrangements with service providers. The Audit Committee, Nominating and Governance Committee and Valuation Committee held two, one and zero meeting(s), respectively, during the fiscal year ended October 31, 2012.
Risk Oversight
Through its oversight role, through its committees and through the Trust’s officers and service providers, the Board performs a risk oversight function for the Trust consisting, among other things, of the following activities: (1) receiving and reviewing reports related to the performance and operations of the Funds at regular Board meetings, and on an ad hoc basis as needed; (2) reviewing and approving, as applicable, the compliance policies and procedures of the Trust; (3) meeting with portfolio management teams to review investment strategies, techniques and the processes used to manage related risks; (4) meeting with representatives of key service providers, including the Adviser, administrator, distributor, transfer agent, custodian and independent registered public accounting firm of the Funds, to review and discuss the activities of the Funds and to provide direction with respect thereto; and (5) receiving reports from the CCO on a variety of matters at regular and special meetings of the Board and its committees, as applicable, including matters relating to risk management. The Trust’s treasurer also reports regularly to the Audit Committee on the Trust’s internal controls and accounting and financial reporting policies and practices. The Audit Committee also receives reports from the Trust’s independent registered public accounting firm on internal control and financial reporting matters. On at
64
least a quarterly basis, the Board meets with the Trust’s CCO, including separate meetings with the Independent Trustees in executive session, to discuss issues related to portfolio compliance and, on at least an annual basis, receives a report from the CCO regarding the effectiveness of the Trust’s compliance program. In addition, the Board receives reports from the Adviser and subadvisers on the investments and securities trading of the Funds, as well as reports from the Valuation Committee meetings. The Board also receives reports from the Trust’s primary service providers on a periodic or regular basis, including the Adviser and the Trust’s custodian, distributor and transfer agent. The Board also requires the Adviser to report to the Board on other matters relating to risk management on a regular and as needed basis, including reports on testing the compliance procedures of the Trust and its service providers.
Fund Ownership
Set forth in the table below is the dollar range of equity securities held in each Fund and the aggregate dollar range of securities in the same family of investment companies beneficially owned by each current Trustee at December 31, 2012.
| | | | |
| Name of Trustee | | Dollar Range of Equity Securities in the Fund | | Aggregate Dollar Range of
Equity Securities in All
Registered Investment
Companies Overseen by
Trustee in Family of
Investment Companies |
Independent Trustees |
| William E. Chapman, II | | ASTON/Montag & Caldwell Growth Fund - over $100,000 ASTON/Fairpointe Mid Cap Fund - over $100,000 ASTON/River Road Dividend All Cap Value Fund II - $50,001 - $100,000 ASTON/River Road Select Value Fund - $10,001 - $50,000 ASTON/River Road Long - Short Fund - over $100,000 ASTON/Cornerstone Large Cap Value Fund - $10,001 - $50,000 ASTON/DoubleLine Core Plus Fixed Income Fund - $10,000 -$50,000 ASTON/Lake Partners LASSO Alternatives Fund - $10,001-$50,000 | | Over $100,000 |
| Edward J. Kaier | | ASTON/Montag & Caldwell Growth Fund - $10,001 - $50,000 ASTON/Fairpointe Mid Cap Fund - $10,001 - $50,000 ASTON/River Road Dividend All Cap Value Fund - $10,001-$50,000 ASTON/Anchor Capital Enhanced Equity Fund - $10,001 - $50,000 ASTON/DoubleLine Core Plus Fixed Income Fund - $10,001-$50,000 ASTON/Lake Partners LASSO Alternatives Fund - $10,001-$50,000 | | Over $100,000 |
| Gregory T. Mutz | | ASTON/Montag & Caldwell Growth Fund - over $100,000 ASTON/TAMRO Diversified Equity Fund - over $100,000 ASTON/River Road Dividend All Cap Value Fund - over $100,000 ASTON/Fairpointe Mid Cap Fund - over $100,000 ASTON/TAMRO Small Cap Fund - $50,001 - $100,000 ASTON/River Road Select Value Fund - $10,001 - $50,000 ASTON/River Road Independent Value Fund - over $100,000 ASTON/DoubleLine Core Plus Fixed Income Fund - $10,001 -$50,000 ASTON/Lake Partners LASSO Alternatives Fund - $1 - $10,000 | | Over $100,000 |
| Steven J. Paggioli | | ASTON/River Road Dividend All Cap Value Fund - over $100,000 ASTON/DoubleLine Core Plus Fixed Income Fund - $1 - $10,000 ASTON/Harrison Street Real Estate Fund - $10,001 - $50,000 | | Over $100,000 |
65
| | | | |
| Name of Trustee | | Dollar Range of Equity Securities in the Fund | | Aggregate Dollar Range of
Equity Securities in All
Registered Investment
Companies Overseen by
Trustee in Family of
Investment Companies |
| Eric Rakowski | | ASTON/TAMRO Diversified Equity Fund - $10,001 - $50,000 ASTON/Fairpointe Mid Cap Fund - $10,001 - $50,000 ASTON/TCH Fixed Income Fund - $10,001 - $50,000 ASTON/DoubleLine Core Plus Fixed Income Fund - $10,001 - $50,000 ASTON/Harrison Stret Real Estate Fund - $10,001 - $50,000 | | Over $100,000 |
| Robert B. Scherer | | ASTON/Montag & Caldwell Growth Fund - $10,001 - $50,000 ASTON/River Road Dividend All Cap Value Fund - $10,001-$50,000 ASTON/TAMRO Small Cap Fund - $10,001 - $50,000 ASTON/River Road Small Cap Value Fund - $10,001 - $50,000 ASTON/Lake Partners LASSO Alternatives Fund - $10,001 -$50,000 | | Over $100,000 |
| Thomas. R. Schneeweis | | ASTON/Fairpointe Mid Cap Fund - $10,001 - $50,000 ASTON/DoubleLine Core Plus Fixed Income Fund - $10,001 - $50,000 ASTON/River Road Dividend All Cap Value Fund - $10,001 -$50,000 ASTON/Montag & Caldwell Growth Fund - $10,001 - $50,000 ASTON/Anchor Capital Enhanced Equity Fund - $10,001 - $50,000 ASTON/Herndon Large Cap Value Fund - $10,001 - $50,000 ASTON/River Road Long-Short Fund - $10,001 $50,000 ASTON/Lake Partners LASSO Alernatives Fund - $10,001 - $50,000 | | Over $100,000 |
Interested Trustees |
| Stuart D. Bilton | | ASTON/Montag & Caldwell Growth Fund - over $100,000 ASTON/Fairpointe Mid Cap Fund - over $100,000 ASTON/River Road Dividend All Cap Value Fund - over $100,000 ASTON/TAMRO Small Cap Fund - over $100,000 ASTON/LMCG Small Cap Growth Fund - over $100,000 ASTON/DoubleLine Core Plus Fixed Income Fund - over $100,000 ASTON/TAMRO Diversified Equity Fund - over $100,000 ASTON/River Road Independent Value Fund - over $100,000 ASTON/Herndon Large Cap Value Fund - over $100,000 | | Over $100,000 |
Jeffrey S. Murphy | | None | | None |
Remuneration
The Trustees of the Trust who are not affiliated with the Adviser or any subadviser receive an annual retainer, meeting fees and reimbursement for out-of-pocket expenses for each meeting of the Board they attend. The Independent Chairman and standing committee chairs receive an additional retainer. No officer or employee of the Adviser or any subadviser or their affiliates receives any compensation from Aston Funds for acting as a Trustee of the Trust. The officers of the Trust receive no compensation directly from Aston Funds for performing the duties of their offices, except that the Trust compensates the Administrator for providing an officer to serve as Funds’ Chief Compliance Officer.
The table below shows the total fees that were paid to each of the Trustees during the fiscal year ended October 31, 2012. No individual, including all Trustees and officers of the Trust, received more than $120,000 in aggregate compensation from the Trust for the same period.
66
| | | | | | | | | | | | |
Trustee | | Aggregate
Compensation
Received From the
Trust | | | Pension or Retirement
Benefits Accrued (as part of
Fund Expenses) | | Annual Benefits Upon
Retirement | | Total Compensation
from Trust and Fund
Complex | |
Independent Trustees | | | | | | | | | | | | |
William E. Chapman, II | | | $102,525 | | | NA | | NA | | | $102,525 | |
Edward J. Kaier | | | 82,525 | | | NA | | NA | | | 82,525 | |
Gregory T. Mutz | | | 85,025 | | | NA | | NA | | | 85,025 | |
Steven J. Paggioli | | | 82,525 | | | NA | | NA | | | 82,525 | |
Eric Rakowski | | | 82,525 | | | NA | | NA | | | 82,525 | |
Robert B. Scherer | | | 93,025 | | | NA | | NA | | | 93,025 | |
Thomas R. Schneeweis | | | 82,775 | | | NA | | NA | | | 82,775 | |
| | | | |
Interested Trustees | | | | | | | | | | | | |
Stuart D. Bilton | | | NA | | | NA | | NA | | | NA | |
Jeffrey S. Murphy | | | NA | | | NA | | NA | | | NA | |
As of January 31, 2013, Trustees and officers of the Trust as a group owned less than 1% of the outstanding shares of any class of each Fund, except for their ownership of 26.01% of ASTON/Barings International Fund – Class N, 2.54% of ASTON/Cornerstone Large Cap Value Fund – Class I, 4.90% of ASTON/LMCG Small Cap Growth Fund – Class N, 96.93% of ASTON/LMCG Small Cap Growth Fund – Class I, 1.20% of ASTON/DoubleLine Core Plus Fixed Income Fund – Class I, 74.75% of ASTON/Harrison Street Real Estate Fund – Class I, 2.80% of ASTON/Herndon Large Cap Value Fund – Class N, 1.30% of ASTON/Herndon Large Cap Value Fund – Class I, 4.64% of ASTON/River Road Dividend All Cap Value Fund II – Class N, 1.58% of ASTON/River Road Long-Short Fund – Class N, 1.84% of ASTON/River Road Select Value Fund – Class N, and 58.37% of ASTON/TAMRO Diversified Equity Fund – Class I.
Code of Ethics
The Trust, the Adviser, the subadvisers and the principal underwriter have each adopted a code of ethics (the “Codes of Ethics”) under Rule 17j-1 of the 1940 Act. The Codes of Ethics permit personnel, subject to the Codes of Ethics and their restrictive provisions, to invest in securities, including securities that may be purchased or held by the Trust on behalf of the Funds.
PROXY VOTING POLICIES AND PROCEDURES
The Trust has delegated the voting of portfolio securities on behalf of the Funds to its subadvisers. Each subadviser has adopted proxy voting policies and procedures (the “Proxy Voting Policies and Procedures”) for use in connection with determining how to vote proxies related to portfolio securities, including the procedures to be used if a vote presents a conflict of interest between the interests of a Fund’s shareholders and those of the applicable subadviser. The Proxy Voting Policies and Procedures are included under Appendix B.
If ASTON/Lake Partners LASSO Alternatives Fund relies on Section 12(d)(1)(F) in purchasing securities issued by another investment company, the Fund must either seek instructions from its shareholders with regard to the voting of all proxies with respect to its investment in such securities and vote such proxies only in accordance with the instructions, or vote the shares held by it in the same proportion as the vote of all other holders of the securities (echo voting). The Fund intends to vote such other investment companies shares in the same proportion as the vote of all other holders of such securities.
67
Information regarding how the Trust voted proxies related to portfolio securities during the most recent 12-month period ended June 30 is available without charge on the Trust’s website at www.astonfunds.com and on the SEC’s website at www.sec.gov.
CONTROL PERSONS AND PRINCIPAL HOLDERS OF SECURITIES
Listed below are the names and addresses of those shareholders who, as of January 31, 2013, owned of record or beneficially 5% or more of the shares of a class of a Fund. Shareholders who have the power to vote a large percentage of shares (at least 25% of the voting shares of a Fund) of a particular Fund can control the Fund and determine the outcome of a shareholder meeting.
| | | | | | | | |
ASTON/Montag & Caldwell Growth Fund |
Shareholder Name and Address | | Class | | Shares Owned | | | Percent of Class |
National Financial Services Corp (FBO) Our Customers ATTN Mutual Funds Department 5th Floor 499 Washington Blvd Jersey City, NJ 07310 | | N | | | 43,375,817.714 | | | 53.8209% |
| | | |
Charles Schwab & Co. Inc Special Custody Acct for Exclusive of Customers ATTN Mutual Funds 101 Montgomery St San Francisco, CA 94104 | | N | | | 8,268,922.352 | | | 10.2601% |
| | | |
Morgan Stanley Smith Barney Harborside Financial Center Plaza 2 3rd Floor Jersey City, NJ 07311 | | N | | | 7,015,588.501 | | | 8.7050% |
| | | |
Pershing LLC PO Box 2052 Jersey City, NJ 07399 | | N | | | 5,452,192.351 | | | 6.7651% |
| | | |
Charles Schwab & Co. Inc Special Custody Acct for Exclusive of Customers ATTN Mutual Funds 101 Montgomery St San Francisco, CA 94104 | | I | | | 19,597,954.216 | | | 19.7188% |
| | | |
Merrill Lynch Pierce Fenner & Smith Inc. For the Sole Benefit of Its Customers ATTN Service Team 4800 Deer Lake Dr East 3rd Fl Jacksonville, FL 32246 | | I | | | 16,774,890.063 | | | 16.8784% |
68
| | | | | | | | |
| | | |
First Clearing LLC Special Custody Acct for the Exclusive Benefit of Customer 2801 Market St St. Louis, MO 63103 | | I | | | 15,086,048.866 | | | 15.1791% |
| | | |
Morgan Smith Stanley Barney Harborside Financial Center Plaza 2 3rd Floor Jersey City, NJ 07310 | | I | | | 7,033,877.489 | | | 7.0773% |
| | | |
National Financial Services Corp (FBO) Our Customers ATTN Mutual Funds Department 5th Floor 499 Washington Blvd Jersey City, NJ 07310 | | I | | | 5,401,716.451 | | | 5.4350% |
| | | |
Reliance Trust Company FBO Retirement Plans Serviced by MetLife C/O Fascore LLC 8515 E Orchard Rd 2T2 Greenwood Village, CO 80111 | | R | | | 113,831.693 | | | 29.6436% |
| | | |
Merrill Lynch Pierce Fenner & Smith Inc. For the Sole Benefit of Its Customers ATTN Service Team 4800 Deer Lake Dr East 3rd Fl Jacksonville, FL 32246 | | R | | | 87,829.975 | | | 22.8723% |
| | | |
Hartford Securities Distribution Company Inc. as agent for Reliance Trust Company (FBO) Agents Plan Customer ATTN UIT Operations PO Box 2999 Hartford, CT 06104 | | R | | | 83,927.422 | | | 21.8561% |
| | | |
Nationwide Trust Company FSB C/O IPO Portfolio Accounting P.O. Box 182029 Columbus, OH 43218 | | R | | | 31,410.731 | | | 8.1799% |
| | | |
Reliance Trust Company FBO Diesel Truck P.O. Box 48529 Atlanta, GA 30362 | | R | | | 20,257.954 | | | 5.2755% |
69
| | | | | | | | |
ASTON/Herndon Large Cap Value Fund |
Shareholder Name and Address | | Class | | Shares Owned | | | Percent of Class |
UBS WM USA Omni Account M/F ATTN: Department Manager 1000 Harbor Blvd 5th Floor Weehawken, NJ 07086 | | N | | | 1,566,331.379 | | | 70.8419% |
| | | |
National Financial Services Corp (FBO) Our Customers ATTN Mutual Funds Department 5th Floor 499 Washington Blvd Jersey City, NJ 07310 | | N | | | 294,690.525 | | | 13.3282 |
| | | |
First Clearing LLC Special Custody Acct for the Exclusive Benefit of Our Customer 2801 Market St St. Louis, Mo 63103 | | N | | | 137,970.496 | | | 6.2401% |
| | | |
Vanguard Fiduciary Trust Co ABN AMRO Funds U/A DTD 12/31/02 PO Box 2600 Attn Outside Funds Valley Forge, PA 19482 | | I | | | 1,851,244.899 | | | 49.6288% |
| | | |
Saxon & Co FBO PO Box 7780-1888 Philadelphia, PA 19182 | | I | | | 603,562.328 | | | 16.1805% |
| | | |
Saxon & Co FBO PO Box 7780-1888 Philadelphia, PA 19182 | | I | | | 320,325.814 | | | 8.5874% |
| | | |
Great-West Trust FBO JPMorgan Chase TTEE FBO Certain Retirement Plans 8515 E Orchard Rd 2T2 Greenwood Village, CO 80111 | | I | | | 199,036.259 | | | 5.3358% |
70
| | | | | | | | |
ASTON/Cornerstone Large Cap Value Fund |
Shareholder Name and Address | | Class | | Shares Owned | | | Percent of Class |
Great-West Trust Co LLC FBO Putnam FBO Recrodkeeping for Various Benef 8515 E Orchard Rd 2T2 Greenwood Village, CO 80111 | | N | | | 398,397.501 | | | 20.0706% |
| | | |
DCGT as TTEE and/or CUST FBO Principal Financial Group Qualified PRIN ADVTG OMNIBUS ATTN NPIO Trade Desk 711 High Street Des Moines, IA 50303 | | N | | | 375,301.912 | | | 18.9070% |
| | | |
DCGT as TTEE and/or CUST FBO Principal Financial Group Qualified FIA OMNIBUS ATTN NPIO Trade Desk 711 High Street Des Moines, IA 50303 | | N | | | 331,657.527 | | | 16.7083% |
| | | |
National Financial Services for the Exclusive Benefit of Our Customers ATTN Mutual Funds Department 5th Floor 200 Liberty Street One World Financial Center New York, NY 10281 | | N | | | 141,037.155 | | | 7.1052% |
| | | |
TD Ameritrade Inc For the Exclusive Benefit of Our Clients PO Box 2226 Omaha, NE 68103 | | N | | | 108,748.529 | | | 5.4786% |
| | | |
Dingle & Co C/O Comrica BK PO Box 75000 Detroit, MI 48275 Attn Mutual Fund Unit | | I | | | 152,196.273 | | | 30.4601% |
| | | |
Charles Schwab & Co. Inc Special Custody Acct for Exclusive of Customers ATTN Mutual Funds 101 Montgomery St San Francisco, CA 94104 | | I | | | 143,564.909 | | | 28.7326% |
71
| | | | | | | | |
National Financial Services Corp (FBO) Our Customers ATTN Mutual Funds Department 5th Floor 499 Washington Blvd Jersey City, NJ 07310 | | I | | | 124,327.431 | | | 24.8825% |
| | | |
SEI Private Trust Co C/O SunTrust Bank Attn: Mutual Fund Admin One Freedom Valley Dr Oaks, PA 19456 | | I | | | 34,042.169 | | | 6.8131% |
|
ASTON/TAMRO Diversified Equity Fund |
Shareholder Name and Address | | Class | | Shares Owned | | | Percent of Class |
DCGT as TTEE and/or CUST FBO Principal Financial Group Qualified FIA OMNIBUS ATTN NPIO Trade Desk 711 High Street Des Moines, IA 50303 | | N | | | 338,470.896 | | | 20.6694% |
| | | |
DCGT as TTEE and/or CUST FBO Principal Financial Group Qualified PRIN ADVTG OMNIBUS ATTN NPIO Trade Desk 711 High Street Des Moines, IA 50303 | | N | | | 295,201.632 | | | 18.0271% |
| | | |
Charles Schwab & Co. Inc Special Custody Acct for Exclusive of Customers ATTN Mutual Funds 101 Montgomery St San Francisco, CA 94104 | | N | | | 278,230.713 | | | 16.9907% |
| | | |
National Financial Services Corp (FBO) Our Customers ATTN Mutual Funds Department 5th Floor 499 Washington Blvd Jersey City, NJ 07310 | | N | | | 160,868,465 | | | 9.8238% |
| | | |
Stuart D Bilton & Bette E Bilton JT Ten 120 N. LaSalle Street Chicago, IL 60602 | | I | | | 24,944.502 | | | 50.1237% |
72
| | | | | | | | |
| | | |
First Clearing LLC Special Custody Acct for the Exclusive Benefit of Customer 2801 Market St St. Louis, MO 63103 | | I | | | 12,479.104 | | | 25.0756% |
| | | |
Pershing LLC PO Box 2052 Jersey City, NJ 07399 | | I | | | 8,237.801 | | | 16.5531% |
| | | |
Gerald Dillenburg & Cheryl Dillenburg, JTWROS 120 N. LaSalle Street Chicago, IL 60602 | | I | | | 4,104.476 | | | 8.2476% |
|
ASTON/River Road Dividend All Cap Value Fund |
Shareholder Name and Address | | Class | | Shares Owned | | | Percent of Class |
National Financial Services Corp (FBO) Our Customers ATTN Mutual Funds Department 5th Floor 499 Washington Blvd Jersey City, NJ 07310 | | N | | | 16,824,860.308 | | | 55.3928% |
| | | |
BNY Mellon as Agent for BNYM I S Trust Co CUST FBO Morningstar Wrap Program Customers 760 Moore Road MS King of Prussia, PA 19406 | | N | | | 5,321,834.321 | | | 17.5212% |
| | | |
Charles Schwab & Co. Inc Special Custody Acct for Exclusive of Customers ATTN Mutual Funds 101 Montgomery St San Francisco, CA 94104 | | N | | | 3,761,109.942 | | | 12.3828% |
| | | |
Charles Schwab & Co. Inc Special Custody Acct for Exclusive of Customers ATTN Mutual Funds 101 Montgomery St San Francisco, CA 94104 | | I | | | 16,574,404.713 | | | 32.7131% |
73
| | | | | | | | |
National Financial Services Corp (FBO) Our Customers ATTN Mutual Funds Department 5th Floor 499 Washington Blvd Jersey City, NJ 07310 | | I | | | 6,659,850.133 | | | 13.1446% |
|
ASTON/River Road Dividend All Cap Value Fund II |
Shareholder Name and Address | | Class | | Shares Owned | | | Percent of Class |
Charles Schwab & Co. Inc Special Custody Acct for Exclusive of Customers ATTN Mutual Funds 101 Montgomery St San Francisco, CA 94104 | | N | | | 39,606.688 | | | 35.3390% |
| | | |
Matthew Cassaro and Theresa Culver Jtrwros Louisville, KY 40241 | | N | | | 24,192.232 | | | 21.5855 |
| | | |
Commonwealth BK & TR 4350 Brownsboro Road, Suite 210 ATTN Mutual Fund Processing Louisville, KY 40270 | | N | | | 20,280.238 | | | 18.0950 |
| | | |
Raymond James OMNIBUS for Mutual Funds ATTN Courtney Waller 880 Carillon PKWY Saint Petersburg, FL 33716 | | N | | | 9,759.783 | | | 8.7082% |
| | | |
TD Ameritrade Inc For the Exclusive Benefit of Our Clients PO Box 2226 Omaha, NE 68103 | | N | | | 9,490.398 | | | 8.4678% |
| | | |
Charles Schwab & Co. Inc Special Custody Acct for Exclusive of Customers ATTN Mutual Funds 101 Montgomery St San Francisco, CA 94104 | | I | | | 540,834.444 | | | 31.3409% |
| | | |
Pershing LLC PO Box 2052 Jersey City, NJ 07399 | | I | | | 153,430.952 | | | 8.8912% |
74
| | | | | | | | |
Raymond James OMNIBUS for Mutual Funds ATTN Courtney Waller 880 Carillon PKWY Saint Petersburg, FL 33716 | | I | | | 125,733.798 | | | 7.2862% |
| | | |
William Blair & Co LLC Craig J Duchossois Trustee 222 West Adams Street Chicago, IL 60606 | | I | | | 96,433.457 | | | 5.5882% |
|
ASTON/Fairpointe Mid Cap Fund |
Shareholder Name and Address | | Class | | Shares Owned | | | Percent of Class |
Charles Schwab & Co. Inc Special Custody Acct for Exclusive of Customers ATTN Mutual Funds 101 Montgomery St San Francisco, CA 94104 | | N | | | 10,941,878.262 | | | 22.7154% |
| | | |
National Financial Services Corp (FBO) Our Customers ATTN Mutual Funds Department 5th Floor 499 Washington Blvd Jersey City, NJ 07310 | | N | | | 10,648,137.234 | | | 22.1056% |
| | | |
New York Life Trust Co 169 Lackawanna Ave Parsippany, NJ 07054 | | N | | | 3,340,772.715 | | | 6.9355% |
| | | |
Pershing LLC PO Box 2052 Jersey City, NJ 07399 | | N | | | 3,287,743.314 | | | 6.8254% |
| | | |
Charles Schwab & Co. Inc Special Custody Acct for Exclusive of Customers ATTN Mutual Funds 101 Montgomery St San Francisco, CA 94104 | | I | | | 7,419,595.230 | | | 16.2959% |
| | | |
National Financial Services Corp (FBO) Our Customers ATTN Mutual Funds Department 5th Floor 499 Washington Blvd Jersey City, NJ 07310 | | I | | | 3,984,378.523 | | | 8.7510% |
75
| | | | | | | | |
Pershing LLC PO Box 2052 Jersey City, NJ 07399 | | I | | | 2,306,514.889 | | | 5.0659% |
|
ASTON/Montag & Caldwell Mid Cap Growth Fund |
Shareholder Name and Address | | Class | | Shares Owned | | | Percent of Class |
Charles Schwab & Co. Inc Special Custody Acct for Exclusive of Customers ATTN Mutual Funds 101 Montgomery St San Francisco, CA 94104 | | N | | | 304,376.558 | | | 29.1425% |
| | | |
Wells Fargo Bank NA FBO UH INTL PO Box 1533 Minneapolis, MN 55480 | | N | | | 191,851.174 | | | 18.3687% |
| | | |
TD Ameritrade Trust Company PO Box 17748 Denver, CO 80217 | | N | | | 137,961.292 | | | 13.2091% |
| | | |
Merrill Lynch Pierce Fenner & Smith Inc. For the Sole Benefit of Its Customers ATTN Service Team 4800 Deer Lake Dr East 3rd Fl Jacksonville, FL 32246 | | N | | | 111,860.880 | | | 10.7101% |
| | | |
William Vogel Atlanta, GA 30350-3617 | | N | | | 67,855.936 | | | 6.4969% |
|
ASTON/TAMRO Small Cap Fund |
Shareholder Name and Address | | Class | | Shares Owned | | | Percent of Class |
National Financial Services Corp (FBO) Our Customers ATTN Mutual Funds Department 5th Floor 499 Washington Blvd Jersey City, NJ 07310 | | N | | | 7,084,924.360 | | | 35.4385% |
| | | |
Charles Schwab & Co. Inc Special Custody Acct for Exclusive of Customers ATTN Mutual Funds 101 Montgomery St San Francisco, CA 94104 | | N | | | 2,942,366.243 | | | 14.7176% |
76
| | | | | | | | |
Vanguard Fiduciary Trust Co ABN AMRO Funds U/A DTD 12/31/02 PO Box 2600 ATTN Outside Funds Valley Forge, PA 19482 | | N | | | 1,665,395.266 | | | 8.3302% |
| | | |
Community Bank NA CUST FBO HANYS Downstate Retirement Plans 6 Rhoads DR Ste 7 Utica, NY 13502 | | N | | | 1,276,948.861 | | | 6.3873% |
| | | |
The Northern Trust Co As Trustee FBO Advocate-DV P.O. Box 92994 Chicago, IL 60675 | | I | | | 5,946,956.204 | | | 19.7778% |
| | | |
National Financial Services Corp (FBO) Our Customers ATTN Mutual Funds Department 5th Floor 499 Washington Blvd Jersey City, NJ 07310 | | I | | | 4,345,307.338 | | | 14.4512% |
| | | |
Charles Schwab & Co. Inc Special Custody Acct for Exclusive of Customers ATTN Mutual Funds 101 Montgomery St San Francisco, CA 94104 | | I | | | 4,061,936.378 | | | 13.5088% |
| | | |
Saxon & Co FBO P.O. Box 7780-1888 Philadelphia, PA 19182 | | I | | | 2,893,488.075 | | | 9.6229% |
ASTON/River Road Select Value Fund |
Shareholder Name and Address | | Class | | Shares Owned | | | Percent of Class |
Charles Schwab & Co. Inc Special Custody Acct for Exclusive of Customers ATTN Mutual Funds 101 Montgomery St San Francisco, CA 94104 | | N | | | 445,173.216 | | | 48.9092% |
| | | |
Pershing LLC PO Box 2052 Jersey City, NJ 07399 | | N | | | 149,451.959 | | | 16.4196% |
77
| | | | | | | | |
National Financial Services Corp (FBO) Our Customers ATTN Mutual Funds Department 5th Floor 499 Washington Blvd Jersey City, NJ 07310 | | N | | | 70,369.343 | | | 7.7312% |
| | | |
Charles Schwab & Co. Inc Special Custody Acct for Exclusive of Customers ATTN Mutual Funds 101 Montgomery St San Francisco, CA 94104 | | I | | | 7,666,841.623 | | | 41.3023% |
| | | |
National Financial Services Corp (FBO) Our Customers ATTN Mutual Funds Department 5th Floor 499 Washington Blvd Jersey City, NJ 07310 | | I | | | 6,127,774.572 | | | 33.0112% |
| | | |
Merrill Lynch Pierce Fenner & Smith Inc. For the Sole Benefit of Its Customers ATTN Service Team 4800 Deer Lake Dr East 3rd Fl Jacksonville, FL 32246 | | I | | | 2,048,835.758 | | | 11.0374% |
| | | |
Shepard Center Inc 2020 Peachtree Rd NW Atlanta GA 30309 | | I | | | 1,048,384.772 | | | 5.6478% |
|
ASTON/River Road Small Cap Value Fund |
Shareholder Name and Address | | Class | | Shares Owned | | | Percent of Class |
National Financial Services Corp (FBO) Our Customers ATTN Mutual Funds Department 5th Floor 499 Washington Blvd Jersey City, NJ 07310 | | N | | | 1,471,258.567 | | | 40.8608% |
| | | |
Charles Schwab & Co. Inc Special Custody Acct for Exclusive of Customers ATTN Mutual Funds 101 Montgomery St San Francisco, CA 94104 | | N | | | 1,144,318.672 | | | 31.7808% |
78
| | | | | | | | |
DWS Trust Co TTEE FBO Southwestern Energy 401K ATTN Share Recon DEPT PO Box 1757 Salem, NH 03079 | | N | | | 275,865.635 | | | 7.6615% |
| | | |
TD Ameritrade Trust Company PO Box 17748 Denver, CO 80217 | | N | | | 202,506.355 | | | 5.6241% |
| | | |
Raymond James Omnibus for Mutual Funds House Acct ATTN Courtney Waller 880 Carillon Pkwy Saint Petersburg, FL 33716 | | I | | | 9,070,700.722 | | | 49.2665% |
| | | |
Charles Schwab & Co. Inc Special Custody Acct for Exclusive of Customers ATTN Mutual Funds 101 Montgomery St San Francisco, CA 94104 | | I | | | 3,263,408.991 | | | 17.7249% |
| | | |
Minnesota Life 400 Robert St. N Saint Paul, MN 55101 | | I | | | 2,401,476.522 | | | 13.0434% |
|
ASTON/River Road Independent Value Fund |
Shareholder Name and Address | | Class | | Shares Owned | | | Percent of Class |
National Financial Services Corp (FBO) Our Customers ATTN Mutual Funds Department 5th Floor 499 Washington Blvd Jersey City, NJ 07310 | | N | | | 11,152,862.267 | | | 33.0360% |
| | | |
BNY Mellon as Agent for BNYM IS Trust Co Cust FBO Morningstar Wrap Program Customers 760 Moore Road King of Prussia, PA 19406 | | N | | | 6,922,187.491 | | | 20.5043% |
| | | |
Pershing LLC PO Box 2052 Jersey City, NJ 07399 | | N | | | 4,641,954.000 | | | 13.7500% |
79
| | | | | | | | |
Charles Schwab & Co. Inc Special Custody Acct for Exclusive of Customers ATTN Mutual Funds 101 Montgomery St San Francisco, CA 94104 | | N | | | 4,455,492.160 | | | 13.1977% |
| | | |
TD Ameritrade Inc For the Exclusive Benefit of Our Clients PO Box 2226 Omaha, NE 68103 | | N | | | 3,186,723.898 | | | 9.4394% |
| | | |
Charles Schwab & Co. Inc Special Custody Acct for Exclusive of Customers ATTN Mutual Funds 101 Montgomery St San Francisco, CA 94104 | | I | | | 18,022,162.661 | | | 54.2569% |
| | | |
National Financial Services Corp (FBO) Our Customers ATTN Mutual Funds Department 5th Floor 499 Washington Blvd Jersey City, NJ 07310 | | I | | | 7,644,897.142 | | | 23.0155% |
| | | |
Raymond James OMNIBUS for Mutual Funds ATTN Courtney Waller 880 Carillon PKWY Saint Petersburg, FL 33716 | | I | | | 1,918,023.100 | | | 5.7743% |
|
ASTON/LMCG Small Cap Growth Fund |
Shareholder Name and Address | | Class | | Shares Owned | | | Percent of Class |
National Financial Services Corp (FBO) Our Customers ATTN Mutual Funds Department 5th Floor 499 Washington Blvd Jersey City, NJ 07310 | | N | | | 351,922.948 | | | 63.0992% |
| | | |
ICMA Retirement Corporation 777 North Capitol Street, NE Washington, DC 2002 | | N | | | 105,046.754 | | | 18.8347% |
| | | |
Pershing LLC PO Box 2052 Jersey City, NJ 07399 | | N | | | 30,098.029 | | | 5.3965% |
80
| | | | | | | | |
Kenneth Anderson 120 N. LaSalle Street Chicago, IL 60602 | | I | | | 43,246.630 | | | 60.7684% |
| | | |
Gerald Dillenburg & Cheryl Dillenburg, JTWROS 120 N. LaSalle Street Chicago, IL 60602 | | I | | | 27,473.998 | | | 38.6054% |
| | | | | | | | |
ASTON Small Cap Fund |
Shareholder Name and Address | | Class | | Shares Owned | | | Percent of Class |
Charles Schwab & Co Inc Special Custody Acct for Exclusive of Customers ATTN Mutual Funds 101 Montgomery St San Francisco, CA 94104 | | N | | | 256,503.919 | | | 17.0044% |
| | | |
National Financial Services Corp (FBO) Our Customers ATTN Mutual Funds Department 5th Floor 499 Washington Blvd Jersey City, NJ 07310 | | N | | | 159,838.172 | | | 10.5962% |
| | | |
BNYM I S Trust Co Cust IRA FBO Joan Y Casi Louisville KY 40223 | | N | | | 88,587.750 | | | 5.8728% |
| | | |
Morgan Stanley Smith Barney Harborside Financial Center Plaza 2 3rd Floor Jersey City, NJ 07311 | | N | | | 83,611.009 | | | 5.5428% |
| | | |
DCGT as TTEE and/or CUST FBO Principal Financial Group Qualified PRIN ADVTG OMNIBUS ATTN NPIO Trade Desk 711 High Street Des Moines, IA 50303 | | I | | | 64,325.815 | | | 56.0738% |
| | | |
Morgan Stanley Smith Barney Harborside Financial Center Plaza 2 3rd Floor Jersey City, NJ 07311 | | I | | | 16,103.753 | | | 14.0379% |
81
| | | | | | | | |
First Clearing LLC Special Custody Acct for the Exclusive Benefit of the Customer 2801 Market St St. Louis, MO 63103 | | I | | | 11,645.781 | | | 10.1518% |
|
ASTON/Silvercrest Small Cap Fund |
Shareholder Name and Address | | Class | | Shares Owned | | | Percent of Class |
National Financial Services Corp (FBO) Our Customers ATTN Mutual Funds Department 5th Floor 499 Washington Blvd Jersey City, NJ 07310 | | N | | | 66,981.800 | | | 44.6916% |
| | | |
Aston Asset Management 120 N. LaSalle Street 25th FL Chicago, IL 60602 | | N | | | 43,610.659 | | | 29.0979% |
| | | |
Charles Schwab & Co Inc Special Custody Acct for Exclusive of Customers ATTN Mutual Funds 101 Montgomery St San Francisco, CA 94104 | | N | | | 28,956.361 | | | 19.3203% |
| | | |
Pershing LLC PO Box 2052 Jersey City, NJ 07399 | | I | | | 235,976.765 | | | 34.0615% |
| | | |
Charles Schwab & Co Inc Special Custody Acct for Exclusive of Customers ATTN Mutual Funds 101 Montgomery St San Francisco, CA 94104 | | I | | | 179,326.082 | | | 25.8844% |
| | | |
National Financial Services Corp (FBO) Our Customers ATTN Mutual Funds Department 5th Floor 499 Washington Blvd Jersey City, NJ 07310 | | I | | | 178,208.234 | | | 25.7230% |
82
| | | | | | | | |
ASTON/DoubleLine Core Plus Fixed Income Fund |
Shareholder Name and Address | | Class | | Shares Owned | | | Percent of Class |
National Financial Services Corp (FBO) Our Customers ATTN Mutual Funds Department 5th Floor 499 Washington Blvd Jersey City, NJ 07310 | | N | | | 3,177,215.102 | | | 37.2038% |
| | | |
Pershing LLC PO Box 2052 Jersey City, NJ 07399 | | N | | | 2,463,286.260 | | | 28.8440% |
| | | |
Charles Schwab & Co Inc Special Custody Acct for Exclusive of Customers ATTN Mutual Funds 101 Montgomery St San Francisco, CA 94104 | | N | | | 1,571,994.377 | | | 18.4074% |
| | | |
UBS WM USA Omni Account M/F ATTN: Department Manager 1000 Harbor Blvd 5th Floor Weehawken, NJ 07086 | | N | | | 735,972.831 | | | 8.6179% |
| | | |
National Financial Services Corp (FBO) Our Customers ATTN Mutual Funds Department 5th Floor 499 Washington Blvd Jersey City, NJ 07310 | | I | | | 4,175,487.153 | | | 41.0798% |
| | | |
TD Ameritrade Inc For the Exclusive Benefit of Our Clients PO Box 2226 Omaha, NE 68103 | | I | | | 2,453,062.306 | | | 24.1340% |
| | | |
Merrill Lynch Pierce Fenner & Smith Inc for the Sole Benefit of its Customers ATTN Service Team 4800 Deer Lake Drive East 3rd FL Jacksonville, FL 32246 | | I | | | 1,051,227.706 | | | 10.3423% |
83
| | | | | | | | |
Charles Schwab & Co Inc Special Custody Acct for Exclusive of Customers ATTN Mutual Funds 101 Montgomery St San Francisco, CA 94104 | | I | | | 718,799.463 | | | 7.0718% |
| | | |
Pershing LLC PO Box 2052 Jersey City, NJ 07399 | | I | | | 524,859.850 | | | 5.1637% |
|
ASTON/TCH Fixed Income Fund |
Shareholder Name and Address | | Class | | Shares Owned | | | Percent of Class |
DCGT as TTEE and/or CUST FBO Principal Financial Group Qualified PRIN ADVTG OMNIBUS ATTN NPIO Trade Desk 711 High Street Des Moines, IA 50303 | | N | | | 1,399,987.010 | | | 25.6664% |
| | | |
Great-West Trust Co LLC FBO Putnam FBO Recordkeeping for Various Benef 8515 E Orchard Rd 2T2 Greenwood Village, CO 80111 | | N | | | 839,958.990 | | | 15.3992% |
| | | |
Charles Schwab & Co Inc Special Custody Acct for Exclusive of Customers ATTN Mutual Funds 101 Montgomery St San Francisco, CA 94104 | | N | | | 672,930.193 | | | 12.3370% |
| | | |
DCGT as TTEE and/or CUST FBO Principal Financial Group Qualified PRIN ADVTG OMNIBUS ATTN NPIO Trade Desk 711 High Street Des Moines, IA 50303 | | I | | | 732,687.100 | | | 76.0310% |
| | | |
Merrill Lynch Pierce Fenner & Smith Inc for the Sole Benefit of its Customers ATTN Service Team 4800 Deer Lake Drive East 3rd FL Jacksonville, FL 32246 | | I | | | 124,348.017 | | | 12.9036% |
84
| | | | | | | | |
| | | |
First Clearing LLC Special Custody Acct for the Exclusive benefits of Customer 2801 Market St St. Louis, MO 63103 | | I | | | 65,278.675 | | | 6.7740% |
|
ASTON/Lake Partners LASSO Alternatives Fund |
Shareholder Name and Address | | Class | | Shares Owned | | | Percent of Class |
Charles Schwab & Co. Inc Special Custody Acct for Exclusive of Customers ATTN Mutual Funds 101 Montgomery St San Francisco, CA 94104 | | N | | | 1,202,411.036 | | | 41.0825% |
| | | |
National Financial Services Corp (FBO) Our Customers ATTN Mutual Funds Department 5th Floor 499 Washington Blvd Jersey City, NJ 07310 | | N | | | 952,561.509 | | | 32.5459% |
| | | |
Pershing LLC PO Box 2052 Jersey City, NJ 07399 | | N | | | 508,816.455 | | | 17.2138% |
| | | |
Charles Schwab & Co. Inc Special Custody Acct for Exclusive of Customers ATTN Mutual Funds 101 Montgomery St San Francisco, CA 94104 | | I | | | 15,798,983.463 | | | 75.3198% |
| | | |
Merrill Lynch Pierce Fenner & Smith Inc. For the Sole Benefit of Its Customers ATTN Service Team 4800 Deer Lake Dr East 3rd Fl Jacksonville, FL 32246 | | I | | | 2,532,198.826 | | | 12.0720% |
| | | |
National Financial Services Corp (FBO) Our Customers ATTN Mutual Funds Department 5th Floor 499 Washington Blvd Jersey City, NJ 07310 | | I | | | 1,445,919.566 | | | 6.8933% |
85
| | | | | | | | |
ASTON/Anchor Capital Enhanced Equity Fund |
Shareholder Name and Address | | Class | | Shares Owned | | | Percent of Class |
National Financial Services Corp (FBO) Our Customers ATTN Mutual Funds Department 5th Floor 499 Washington Blvd Jersey City, NJ 07310 | | N | | | 4,898,594.905 | | | 49.3269% |
| | | |
Charles Schwab & Co. Inc Special Custody Acct for Exclusive of Customers ATTN Mutual Funds 101 Montgomery St San Francisco, CA 94104 | | N | | | 2,668,885.490 | | | 26.8746% |
| | | |
UBS WM USA Omni Account M/F ATTN: Department Manager 1000 Harbor Blvd 5th Floor Weehawken, NJ 07086 | | N | | | 1,201,720.580 | | | 12.1008% |
| | | |
National Financial Services Corp (FBO) Our Customers ATTN Mutual Funds Department 5th Floor 499 Washington Blvd Jersey City, NJ 07310 | | I | | | 2,585.797.877 | | | 29.0243% |
| | | |
Charles Schwab & Co. Inc Special Custody Acct for Exclusive of Customers ATTN Mutual Funds 101 Montgomery St San Francisco, CA 94104 | | I | | | 1,784,757.759 | | | 20.0331% |
| | | |
Independence Trust Company 325 Bridge Street Franklin, TN 37064 | | I | | | 871,467.861 | | | 9.7818% |
| | | |
Fifth Third Bank TTEE FBO Lutheran Found-Mutal Funds Department 3385 Cincinnati, OH 45263 | | I | | | 597,540.312 | | | 6.7071 |
86
| | | | | | | | |
Merrill Lynch Pierce Fenner & Smith Inc. For the Sole Benefit of Its Customers ATTN Service Team 4800 Deer Lake Dr East 3rd Fl Jacksonville, FL 32246 | | I | | | 514,026.278 | | | 5.7697% |
|
ASTON/River Road Long-Short Fund |
Shareholder Name and Address | | Class | | Shares Owned | | | Percent of Class |
Commonwealth Bank & Trust Co 4350 Brownsboro Rd Ste 210 Louisville, KY 40207 | | N | | | 338,182.106 | | | 33.4121% |
| | | |
Charles Schwab & Co. Inc Special Custody Acct for Exclusive of Customers ATTN Mutual Funds 101 Montgomery St San Francisco, CA 94104 | | N | | | 292,311.912 | | | 28.8802% |
| | | |
National Financial Services Corp (FBO) Our Customers ATTN Mutual Funds Department 5th Floor 499 Washington Blvd Jersey City, NJ 07310 | | N | | | 199,693.592 | | | 19.7296% |
| | | |
Pershing LLC PO Box 2052 Jersey City, NJ 07399 Pershing LLC PO Box 2052 Jersey City, NJ 07399 | | N | | | 65,171.912 | | | 6.4389% |
| | | |
Aston Asset Management 120 N. LaSalle Street 25th FL Chicago, IL 60602 | | N | | | 52,782.435 | | | 5.2149% |
|
ASTON/Barings International Fund |
Shareholder Name and Address | | Class | | Shares Owned | | | Percent of Class |
Strafe & Co FBO Andrew McNally IV Roth IRA P.O. Box 6924 Newark, DE 19714 | | N | | | 41,081.730 | | | 64.1290% |
| | | |
Kenneth Anderson 120 N. LaSalle Street Chicago, IL 60602 | | N | | | 16,665.500 | | | 26.0150 |
87
| | | | | | | | |
Charles Schwab & Co. Inc Special Custody Acct for Exclusive of Customers ATTN Mutual Funds 101 Montgomery St San Francisco, CA 94104 | | I | | | 4,435,195.784 | | | 49.4831% |
| | | |
National Financial Services Corp (FBO) Our Customers ATTN Mutual Funds Department 5th Floor 499 Washington Blvd Jersey City, NJ 07310 | | I | | | 1,785,047.863 | | | 19.9156% |
| | | |
Strafe & Co FBO Tim Schwertfeger & G Waller PCCA P.O. Box 6924 Newark, DE 19714 | | I | | | 493,983.501 | | | 5.5113% |
| | | |
Merrill Lynch Pierce Fenner & Smith Inc. For the Sole Benefit of Its Customers ATTN Service Team 4800 Deer Lake Dr East 3rd Fl Jacksonville, FL 32246 | | I | | | 465,509.771 | | | 5.1937% |
| | | |
Strafe & Co FBO Credit Suisse Omnibus Mutual FU P.O. Box 6924 Newark, DE 19714 | | I | | | 457,511.785 | | | 5.1044% |
|
ASTON/Harrison Street Real Estate Fund |
Shareholder Name and Address | | Class | | Shares Owned | | | Percent of Class |
National Financial Services Corp (FBO) Our Customers ATTN Mutual Funds Department 5th Floor 499 Washington Blvd Jersey City, NJ 07310 | | N | | | 193,241.566 | | | 21.6791% |
| | | |
Charles Schwab & Co. Inc Special Custody Acct for Exclusive of Customers ATTN Mutual Funds 101 Montgomery St San Francisco, CA 94104 | | N | | | 156,073.137 | | | 17.5093% |
88
| | | | | | | | |
TD Ameritrade Inc For the Exclusive Benefit of Our Clients PO Box 2226 Omaha, NE 68103 | | N | | | 75,474.791 | | | 8.4673% |
| | | |
DCGT as TTEE and/or CUST FBO Principal Financial Group Qualified PRIN ADVTG OMNIBUS ATTN NPIO Trade Desk 711 High Street Des Moines, IA 50303 | | N | | | 45,373.269 | | | 5.0903% |
| | | |
Gerald Dillenburg & Cheryl Dillenburg, JTWROS 120 N. LaSalle Street Chicago, IL 60602 | | I | | | 6,487.644 | | | 37.6537% |
| | | |
Eric Rakowski TTEE Eric P Rakowski Living Trust 120 N. LaSalle Street Chicago, IL 60602 | | I | | | 3,820.439 | | | 22.1735% |
| | | |
Steven J Paggioli 120 N. LaSalle Street Chicago, IL 60602 | | I | | | 2,572.718 | | | 14.9318% |
| | | |
Merrill Lynch Pierce Fenner & Smith Inc. For the Sole Benefit of Its Customers ATTN Service Team 4800 Deer Lake Dr East 3rd Fl Jacksonville, FL 32246 | | I | | | 1,602.856 | | | 9.3028% |
| | | |
Raymond James OMNIBUS for Mutual Funds ATTN Courtney Waller 880 Carillon PKWY Saint Petersburg, FL 33716 | | I | | | 1,390.176 | | | 8.0685% |
| | | | | | | | |
ASTON/Montag & Caldwell Balanced Fund |
Shareholder Name and Address | | Class | | Shares Owned | | | Percent of Class |
Charles Schwab & Co. Inc Special Custody Acct for Exclusive of Customers ATTN Mutual Funds 101 Montgomery St San Francisco, CA 94104 | | N | | | 210,340.020 | | | 17.7859% |
89
| | | | | | | | |
National Financial Services Corp (FBO) Our Customers ATTN Mutual Funds Department 5th Floor 499 Washington Bvd Jersey City, NJ 07310 | | N | | | 117,665.937 | | | 9.9496% |
| | | |
DCGT as TTEE and/or CUST FBO Principal Financial Group Qualified PRIN ADVTG OMNIBUS ATTN NPIO Trade Desk 711 High Street Des Moines, IA 50303 | | N | | | 112,254.540 | | | 9.4920% |
| | | |
Merrill Lynch Pierce Fenner & Smith Inc. For the Sole Benefit of Its Customers ATTN Service Team 4800 Deer Lake Dr East 3rd Fl Jacksonville, FL 32246 | | I | | | 43,660.067 | | | 55.9770% |
| | | |
First Clearing LLC Secial Custody Acct for the Exclusive Benefit of Customer 2801 Market St St. Louis, MO 63103 | | I | | | 11,891.813 | | | 15.2466% |
| | | |
TD Ameritrade Trust Company C/O Montag & Caldwell 401K PSP PO Box 17748 Denver, CO 80217 | | I | | | 7,989.184 | | | 10.2430% |
| | | |
BNY Mellon I S Trust C/O Cust Rollover IRA James B Thomas Wilmington, DE 19806 | | I | | | 6,877.411 | | | 8.8176% |
90
INVESTMENT ADVISORY AND OTHER SERVICES
Investment Adviser
As described in the Prospectus, the Trust employs Aston to manage the investment and reinvestment of the assets of the Funds and to continuously review, supervise and administer the Funds’ investment programs under an investment advisory agreement with respect to each Fund (the “Investment Advisory Agreement”). Aston has engaged various subadvisers to manage the day-to-day investment management of the Funds’ portfolios. The advisory services provided by Aston for each Fund and the fees received by it for such services for the Fund’s most recent fiscal year are described in the Prospectus.
Aston is a majority-owned and independently managed indirect subsidiary of Affiliated Managers Group, Inc. (“AMG”). A wholly-owned subsidiary of AMG, Manor LLC, serves as the General Partner of Aston, and senior management and key employees of Aston have an equity interest in Aston. Aston commenced operations on December 1, 2006 and converted to a Delaware limited partnership on April 15, 2010 in connection with AMG’s acquisition of a controlling interest in Aston. Aston is located at 120 N. LaSalle Street, 25th Floor, Chicago, Illinois 60602. As of December 31, 2012, Aston had approximately $11.5 billion in assets under management.
AMG, a Delaware corporation with a principal place of business at 600 Hale Street, Prides Crossing, Massachusetts 01965, is an asset management company that holds interests in investment management firms. The common stock of AMG is publicly traded on the New York Stock Exchange under the symbol AMG. As of December 31, 2012, AMG’s affiliated managers had approximately $432 billion in assets under management.
For the services provided and the expenses assumed pursuant to the Investment Advisory Agreement with Aston, Aston receives a management fee from each Fund at an annual rate based on the Fund’s average daily net assets, computed daily and payable monthly, at the following annual rates:
91
| | |
Fund | | Gross Advisory Fee (as a % of average daily net assets) |
ASTON/Montag & Caldwell Growth | | 0.80% for the first $800 million 0.60% over $800 million up to $6 billion 0.55% over $6 billion up to $12 billion 0.50% over $12 billion |
ASTON/Herndon Large Cap Value | | 0.80% |
ASTON/Cornerstone Large Cap Value | | 0.80% |
ASTON/TAMRO Diversified Equity | | 0.80% |
ASTON/River Road Dividend All Cap Value | | 0.70% |
ASTON/River Road Dividend All Cap Value II | | 0.70% |
ASTON/Fairpointe Mid Cap | | 0.80% for the first $100 million 0.75% for next $300 million 0.70% over $400 million |
ASTON/Montag & Caldwell Mid Cap Growth | | 0.85% |
ASTON/TAMRO Small Cap | | 0.90% |
ASTON/River Road Select Value | | 1.00% |
ASTON/River Road Small Cap Value | | 0.90% |
ASTON/River Road Independent Value | | 1.00% |
ASTON/LMCG Small Cap Growth | | 1.00% |
ASTON Small Cap | | 1.00% |
ASTON/Silvercrest Small Cap | | 1.00% |
ASTON/DoubleLine Core Plus Fixed Income | | 0.55% |
ASTON/TCH Fixed Income | | 0.55% |
ASTON/Lake Partners LASSO Alternatives | | 1.00% |
ASTON/Anchor Capital Enhanced Equity | | 0.70% |
ASTON/River Road Long-Short | | 1.20% |
ASTON/Barings International | | 1.00% |
ASTON/Harrison Street Real Estate | | 1.00% |
ASTON/Montag & Caldwell Balanced | | 0.75% |
Aston has entered into an Expense Limitation Agreement with the Trust, on behalf of the Fund, through February 28, 2014, for the following Funds:
| | | | |
Fund | | Class I | | Class N |
ASTON/Cornerstone Large Cap Value | | 1.05% | | 1.30% |
ASTON/TAMRO Diversified Equity | | 0.95% | | 1.20% |
ASTON/River Road Dividend All Cap Value | | 1.05% | | 1.30% |
ASTON Small Cap | | 1.24% | | 1.49% |
ASTON/TCH Fixed Income | | 0.69% | | 0.94% |
ASTON/Harrison Street Real Estate | | 1.12% | | 1.37% |
ASTON/Montag & Caldwell Balanced | | 1.10% | | 1.35% |
Aston has entered into an Expense Reimbursement Agreement with the Trust, on behalf of each Fund, through February 28, 2014, under which Aston will waive its fees or reimburse the Fund’s expenses to the extent that the Fund’s annual operating expense ratio, not including interest, taxes, investment-related costs (such as brokerage commissions), extraordinary expenses and acquired fund fees and expenses, exceeds the applicable rate shown in the table below:
92
| | | | |
| Fund | | Class I | | Class N |
| | |
ASTON/Montag & Caldwell Mid Cap Growth | | — | | 1.25% |
ASTON/Herndon Large Cap Value | | 1.05% | | 1.30% |
ASTON/River Road Select Value | | 1.25% | | 1.50% |
ASTON/River Road Independent Value | | 1.17% | | 1.42% |
ASTON/LMCG Small Cap Growth | | 1.10% | | 1.35% |
ASTON/Lake Partners LASSO Alternatives | | 1.20% | | 1.45% |
ASTON/Anchor Capital Enhanced Equity | | 1.15% | | 1.40% |
ASTON/River Road Long-Short | | 1.45% | | 1.70% |
ASTON/DoubleLine Core Plus Fixed Income | | 0.69% | | 0.94% |
ASTON/Barings International | | 1.15% | | 1.40% |
ASTON/Silvercrest Small Cap | | 1.15% | | 1.40% |
ASTON/River Road Dividend All Cap Value II | | 1.05% | | 1.30% |
In connection with the Expense Reimbursement Agreement for each class of shares for each Fund listed above, the Fund has agreed that for a period of up to three years from the end of the fiscal year end in which such amount was waived or reimbursed, the Adviser is entitled to be reimbursed by the Fund for fees waived and expenses reimbursed from the commencement of operations of the class of shares through the completion of the Fund’s first three full fiscal years of that class to the extent that the Fund’s expense ratio with respect to that class, not including interest, taxes, investment-related costs (such as brokerage commissions), extraordinary expenses and acquired fund fees and expenses, remains at or below the operating expense cap after such reimbursement.
Investing in other investment companies managed by a Fund’s subadviser involves potential conflicts of interest. For example, the subadviser or its affiliates may receive fees based on the amount of assets invested in those funds, which fees may be higher than the fees the subadviser receives for managing the Fund. Investment by a Fund in those other funds may be beneficial in the management of those other funds, by helping to achieve economies of scale or enhancing cash flows. The subadviser may have an incentive to delay selling or redeeming a Fund’s investment in an affiliated fund in order to minimize any adverse effect on that other fund. These and other factors may give the subadviser an economic or other incentive to make or retain an investment for a Fund in an affiliated fund in lieu of other investments that may also be appropriate for the Fund.
The investment advisory fees earned by Aston for each Fund for the fiscal years ended October 31, 2012, October 31, 2011 and October 31, 2010 as well as the amount of fees waived or expenses reimbursed, are set forth below.
Fiscal year ended October 31, 2012
| | | | | | | | | | | | | | | | |
Fund | | Gross
Advisory
Fees | | | Waived
Fees | | | Net Advisory
Fees After Fee
Waivers | | | Reimbursed
Expenses | |
ASTON/Montag & Caldwell Growth | | $ | 24,380,211 | | | $ | — | | | $ | 24,380,211 | | | $ | — | |
ASTON/Herndon Large Cap Value | | | 323,690 | | | | (42,793 | ) | | | 280,897 | | | | — | |
ASTON/Cornerstone Large Cap Value | | | 205,311 | | | | (79,418 | ) | | | 125,893 | | | | — | |
ASTON/TAMRO Diversified Equity | | | 178,350 | | | | (107,785 | ) | | | 70,565 | | | | — | |
ASTON/River Road Dividend All Cap Value | | | 5,697,260 | | | | — | | | | 5,697,260 | | | | — | |
ASTON/River Road Dividend All Cap Value II(1) | | | 11,353 | | | | (11,353 | ) | | | — | | | | (48,507 | ) |
ASTON/Fairpointe Mid Cap | | | 20,664,084 | �� | | | — | | | | 20,664,084 | | | | — | |
ASTON/Montag & Caldwell Mid Cap Growth | | | 52,435 | | | | (52,435 | ) | | | — | | | | (24,754 | ) |
93
| | | | | | | | | | | | | | | | |
| Fund | | Gross Advisory Fees | | | Waived Fees | | | Net Advisory
Fees After Fee Waivers | | | Reimbursed
Expenses | |
ASTON/TAMRO Small Cap | | | 9,255,718 | | | | — | | | | 9,255,718 | | | | — | |
ASTON/River Road Select Value | | | 1,486,962 | | | | — | | | | 1,486,962 | | | | — | |
ASTON/River Road Small Cap Value | | | 2,722,734 | | | | — | | | | 2,722,734 | | | | — | |
ASTON/River Road Independent Value | | | 5,928,678 | | | | (143,528 | ) | | | 5,785,150 | | | | — | |
ASTON/LMCG Small Cap Growth | | | 81,515 | | | | (81,515 | ) | | | — | | | | (41,754 | ) |
ASTON Small Cap | | | 279,493 | | | | (94,164 | ) | | | 185,329 | | | | — | |
ASTON/Silvercrest Small Cap(2) | | | 39,768 | | | | (39,768 | ) | | | — | | | | (107,398 | ) |
ASTON/DoubleLine Core Plus Fixed Income | | | 520,833 | | | | (389,195 | ) | | | 131,638 | | | | — | |
ASTON/TCH Fixed Income | | | 393,159 | | | | (113,511 | ) | | | 279,648 | | | | — | |
ASTON/Lake Partners LASSO Alternatives | | | 2,606,348 | | | | — | | | | 2,606,348 | | | | — | |
ASTON/Anchor Capital Enhanced Equity | | | 1,077,035 | | | | — | | | | 1,077,035 | | | | — | |
ASTON/River Road Long-Short | | | 69,185 | | | | (69,185 | ) | | | — | | | | (41,565 | ) |
ASTON/Barings International | | | 596,736 | | | | (117,951 | ) | | | 478,785 | | | | — | |
ASTON/Harrison Street Real Estate | | | 109,157 | | | | (108,068 | ) | | | 1,089 | | | | — | |
ASTON/Montag & Caldwell Balanced | | | 220,017 | | | | (58,700 | ) | | | 161,317 | | | | — | |
(1)ASTON/River Road Dividend All Cap Value II began issuing Class N shares and Class I shares on June 26, 2012.
(2)ASTON/Silvercrest Small Cap began issuing Class N shares and Class I shares on December 23, 2011.
Fiscal year ended October 31, 2011
| | | | | | | | | | | | | | | | |
Fund | | Gross
Advisory
Fees | | | Waived
Fees | | | Net Advisory
Fees After Fee
Waivers | | | Reimbursed
Expenses | |
ASTON/Montag & Caldwell Growth | | $ | 21,121,626 | | | $ | — | | | $ | 21,121,626 | | | $ | — | |
ASTON/Herndon Large Cap Value | | | 96,494 | | | | (96,494 | ) | | | — | | | | (33,322 | ) |
ASTON/Cornerstone Large Cap Value | | | 852,399 | | | | (210,762 | ) | | | 641,637 | | | | — | |
ASTON/TAMRO Diversified Equity | | | 172,138 | | | | (91,258 | ) | | | 80,880 | | | | — | |
ASTON/ River Road Dividend All Cap Value | | | 2,883,458 | | | | — | | | | 2,883,458 | | | | — | |
ASTON/Fairpointe Mid Cap | | | 19,016,950 | | | | — | | | | 19,016,950 | | | | — | |
ASTON/Montag & Caldwell Mid Cap Growth | | | 36,460 | | | | (36,460 | ) | | | — | | | | (35,550 | ) |
ASTON/TAMRO Small Cap | | | 8,990,344 | | | | — | | | | 8,990,344 | | | | — | |
ASTON/River Road Select Value | | | 2,014,925 | | | | — | | | | 2,014,925 | | | | — | |
ASTON/River Road Small Cap Value | | | 3,896,599 | | | | — | | | | 3,896,599 | | | | — | |
ASTON/River Road Independent Value(1) | | | 1,398,166 | | | | (244,471 | ) | | | 1,153,695 | | | | — | |
ASTON/LMCG Small Cap Growth(2) | | | 30,281 | | | | (30,281 | ) | | | — | | | | (160,423 | ) |
ASTON Small Cap | | | 509,379 | | | | (81,097 | ) | | | 428,282 | | | | — | |
ASTON/DoubleLine Core Plus Fixed Income(3) | | | 26,172 | | | | (26,172 | ) | | | — | | | | (79,461 | ) |
ASTON/TCH Fixed Income | | | 338,364 | | | | (159,751 | ) | | | 178,613 | | | | — | |
ASTON/Lake Partners LASSO Alternatives | | | 1,165,120 | | | | (87,814 | ) | | | 1,077,306 | | | | — | |
ASTON/Anchor Capital Enhanced Equity | | | 889,094 | | | | — | | | | 889,094 | | | | — | |
ASTON/River Road Long-Short(4) | | | 19,573 | | | | (19,573 | ) | | | — | | | | (77,535 | ) |
ASTON/Barings International | | | 531,069 | | | | (147,896 | ) | | | 383,173 | | | | — | |
ASTON/Harrison Street Real Estate | | | 382,968 | | | | (123,339 | ) | | | 259,629 | | | | — | |
ASTON/Montag & Caldwell Balanced | | | 207,310 | | | | (61,944 | ) | | | 145,366 | | | | — | |
(1)ASTON/River Road Independent Value began issuing Class N shares on December 30, 2010.
(2)ASTON/LMCG Small Cap Growth began issuing Class N shares on November 2, 2010.
(3)ASTON/DoubleLine Core Plus Fixed Income began issuing Class N shares and Class I shares on July 15, 2011.
(4)ASTON/River Road Long-Short began issuing Class N shares on May 3, 2011.
94
Fiscal year ended October 31, 2010
| | | | | | | | | | | | | | | | |
Fund | | Gross
Advisory
Fees | | | Waived
Fees | | | Net Advisory
Fees After Fee
Waivers | | | Reimbursed
Expenses | |
ASTON/Montag & Caldwell Growth | | $ | 18,731,198 | | | $ | — | | | $ | 18,731,198 | | | $ | — | |
ASTON/Herndon Large Cap Value(1) | | | 4,738 | | | | (4,738 | ) | | | — | | | | (69,546 | ) |
ASTON/Cornerstone Large Cap Value | | | 1,857,670 | | | | (267,757 | ) | | | 1,589,913 | | | | — | |
ASTON/TAMRO Diversified Equity | | | 105,668 | | | | (56,667 | ) | | | 49,001 | | | | — | |
ASTON/River Road Dividend All Cap Value | | | 1,470,706 | | | | — | | | | 1,470,706 | | | | — | |
ASTON/Fairpointe Mid Cap | | | 10,708,348 | | | | — | | | | 10,708,348 | | | | — | |
ASTON/Montag & Caldwell Mid Cap Growth | | | 26,879 | | | | (26,879 | ) | | | — | | | | (41,091 | ) |
ASTON/TAMRO Small Cap | | | 8,052,494 | | | | — | | | | 8,052,494 | | | | — | |
ASTON/River Road Select Value | | | 2,235,492 | | | | — | | | | 2,235,492 | | | | — | |
ASTON/River Road Small Cap Value | | | 4,495,240 | | | | — | | | | 4,495,240 | | | | — | |
ASTON Small Cap | | | 521,879 | | | | (70,603 | ) | | | 451,276 | | | | — | |
ASTON/TCH Fixed Income | | | 347,172 | | | | (230,324 | ) | | | 116,848 | | | | — | |
ASTON/Lake Partners LASSO Alternatives | | | 136,762 | | | | (135,895 | ) | | | 867 | | | | — | |
ASTON/Anchor Capital Enhanced Equity | | | 411,608 | | | | — | | | | 411,608 | | | | — | |
ASTON/Barings International | | | 416,123 | | | | (134,828 | ) | | | 281,295 | | | | — | |
ASTON/Harrison Street Real Estate | | | 315,407 | | | | (97,802 | ) | | | 217,605 | | | | — | |
ASTON/Montag & Caldwell Balanced | | | 183,953 | | | | (62,328 | ) | | | 121,625 | | | | — | |
(1)ASTON/Herndon Large Cap Value began issuing Class N shares on March 30, 2010.
Under the Investment Advisory Agreement, the Adviser is not liable for any error of judgment or mistake of law or for any loss suffered by the Trust or a Fund in connection with the performance of the Investment Advisory Agreement, except a loss resulting from willful misfeasance, bad faith or gross negligence on its part in the performance of its duties, or from reckless disregard of its duties and obligations thereunder.
The Investment Advisory Agreement between the Trust and Aston may be terminated with respect to a Fund by vote of the Board or by the holders of a majority of the outstanding voting securities of the Fund, at any time without penalty, upon 60 days’ written notice to Aston. Aston may also terminate its advisory relationship with respect to a Fund upon 60 days’ written notice to the Trust. The Investment Advisory Agreement terminates automatically in the event of its assignment.
Under the Investment Advisory Agreement, Aston shall: (i) manage the investment and reinvestment of the assets of the Funds, (ii) continuously review, supervise and administer the investment program of the Funds, (iii) determine in its discretion, the assets to be held uninvested, (iv) provide the Trust with records concerning the Adviser’s activities which are required to be maintained by the Trust and (v) render regular reports to the Trust’s officers and Board concerning the Adviser’s discharge of the foregoing responsibilities. The Adviser shall discharge the foregoing responsibilities subject to the oversight of the Trust’s officers and the Board and in compliance with the objectives, policies and limitations set forth in the Trust’s then effective prospectus and SAI.
The Investment Advisory Agreement with respect to a Fund, continues in effect for the Fund from year to year, so long as its continuation is approved at least annually (a) by a majority of the Trustees who are not parties to such agreement or interested persons of any such party except in their capacity as Trustees of the Fund or (b) by the shareholders of the Fund or the Board.
95
The Investment Advisory Agreement with Aston also provides that Aston shall have the authority, subject to applicable provisions of the 1940 Act and the regulations thereunder, to select one or more subadvisers to provide day-to-day portfolio management with respect to all or a portion of the assets of any of the Funds and to allocate and reallocate the assets of a Fund between and among subadvisers so selected pursuant to a “manager-of-managers” structure. Under this structure, Aston also has the authority to retain and terminate subadvisers, engage new subadvisers and make material revisions to the terms of the sub-investment advisory agreement with respect to a Fund (each a “Sub-Investment Advisory Agreement), subject to approval of the Board, but not shareholder approval.
As described above, Aston is paid a management fee at an annual rate based on the average daily net assets of a Fund. Out of its fee, Aston pays the subadviser(s) of each Fund. Fees paid to a subadviser of a Fund with multiple subadvisers will depend upon the fee rate negotiated with Aston and upon the percentage of the Fund’s assets allocated to that subadviser by Aston. Because Aston will pay each subadviser’s fees out of its own fees from the Funds, there will not be any “duplication” of advisory fees paid by the Funds.
Subadvisers
Under the Sub-Investment Advisory Agreement between Aston and the subadviser(s) for each Fund, each subadviser manages a portfolio of the Fund, selects investments and places all orders for purchases and sales of that Fund’s securities, subject to the general oversight of the Board and the Adviser. In addition, except as may otherwise be prohibited by law or regulation, a subadviser may, in its discretion and from time to time, waive a portion of its fee.
Each Sub-Investment Advisory Agreement provides that neither a subadviser nor any of its directors, officers, stockholders, agents or employees shall have any liability to a Fund or any shareholder of a Fund for any error of judgment, mistake of law, or any loss arising out of any investment, or for any other act or omission in the performance by the subadviser of its duties under the Sub-Investment Advisory Agreement except for liability resulting from willful misfeasance, bad faith, or gross negligence on its part in the performance of its duties or from reckless disregard by it of its obligations and duties under the Sub-Investment Advisory Agreement. Each Sub-Investment Advisory Agreement continues for an initial team of not more than two years and is subject to the same requirements for renewal as the Investment Advisory Agreement.
For the services provided pursuant to the Sub-Investment Advisory Agreement, Aston pays each subadviser a fee computed daily and payable monthly. The standard sub-advisory fee rate is 50% of the applicable advisory fee less any expense waivers or reimbursements and certain payments to third-party intermediaries. In certain limited circumstances, exceptions to the standard fee schedule apply.
Anchor Capital Advisors LLC (“Anchor Capital”)
Anchor Capital is the subadviser to the ASTON/Anchor Capital Enhanced Equity Fund. Eighty percent (80%) of Anchor Capital is owned by Anchor Capital Holdings LLC, which is a wholly-owned subsidiary of publicly-held Boston Private Financial Holdings, Inc. Anchor Capital is located at One Post Office Square, Suite 3850, Boston, MA 02109.
The table below shows other accounts for which the portfolio manager of the Fund is primarily responsible for the day-to-day portfolio management as of October 31, 2012.
96
| | | | | | | | | | | | | | | | |
| | | Number of
Accounts
Managed | | | Total Assets
Managed (in
millions) | | | Number of
Accounts
Managed with
Advisory Fee
Based on
Performance | | | Assets
Managed with
Advisory Fee
Based on
Performance | |
Ronald A. Altman | | | | | | | | | | | | | | | | |
Registered Investment Companies | | | 0 | | | | NA | | | | 0 | | | | NA | |
Other Pooled Investment Vehicles | | | 0 | | | | NA | | | | 0 | | | | NA | |
Other Accounts | | | 1 | | | $ | 5.4 | | | | 0 | | | | NA | |
Compensation. Ronald L. Altman’s compensation includes a base salary. Mr. Altman also participates in standard company benefits including a 401(k) plan. Mr. Altman may also be entitled to receive a percentage of a bonus pool that is based on Anchor Capital’s net operating profits. Mr. Altman’s share of the pool is determined by Anchor Capital’s Chief Executive Officer and Chief Investment Officer. Accordingly, Mr. Altman’s compensation is not directly based on the performance of the Fund and is not directly based on the value of assets held in the Fund’s portfolio.
Material Conflicts of Interest. The portfolio manager for the Fund may manage multiple accounts following the same enhanced equity strategy. The portfolio manager makes decisions for each account based on the investment objectives, policies, practices and other relevant investment considerations. Consequently, the portfolio manager may purchase securities for one account and not another and the performance of the securities purchased for one account may vary from the performance of securities for another. Anchor Capital has adopted policies and procedures that it believes address the conflicts associated with managing multiple accounts for multiple clients including written policies and procedures reasonably designed that seek to allocate investment opportunities on a fair and equitable basis over time.
Baring International Investment Limited (“Barings”)
Barings is the subadviser to the ASTON/Barings International Fund. Barings is a subsidiary of Baring Asset Management Limited and is located at 155 Bishopsgate, London, EC2M 3XY, United Kingdom. The table below shows other accounts for which the portfolio manager of the Fund is primarily responsible for the day-to-day portfolio management as of October 31, 2012.
| | | | | | | | | | | | | | | | |
| | | Number of
Accounts
Managed | | | Total Assets
Managed (in
millions) | | | Number of
Accounts
Managed with
Advisory Fee
Based on
Performance | | | Assets
Managed with
Advisory Fee
Based on
Performance | |
David Bertocchi | | | | | | | | | | | | | | | | |
Registered Investment Companies | | | 1 | | | $ | 141 | | | | 0 | | | | NA | |
Other Pooled Investment Vehicles | | | 4 | | | | 1,512 | | | | 0 | | | | NA | |
Other Accounts | | | 11 | | | | 2,634 | | | | 1 | | | $ | 1,209 | |
Compensation. The portfolio manager receives a base salary, an annual bonus and an equity-based long-term incentive award. The Barings philosophy on compensation focuses on allowing key employees to participate in the success of the firm. Barings is incentive-oriented: contributions to client results are more important than an individual’s title or longevity with the firm in determining total compensation. For investment professionals, at least 2/3 of the bonus is based on investment performance,
97
via an analytical system that tracks the one- and three-year performance of our investment professionals. The remainder is a subjective assessment of the individuals sharing of investment insights firm-wide and their efforts in client service. The benefits of this approach are the transparency and accountability that it brings.The equity-based long-term incentive award is calculated by a formula linked to firm revenues, profits, and assets under management.
Material Conflicts of Interest. The portfolio manager for the Fund manages multiple accounts, including the Fund. The portfolio manager makes decisions for each account based on the investment objectives, policies, practices and other relevant investment considerations that the portfolio manager believes are applicable to that account. Consequently, the portfolio manager may purchase securities for one account and not another account, and the performance of securities purchased for one account may vary from the performance of securities purchased for other accounts. The portfolio manager may place transactions on behalf of other accounts that are contrary to investment decisions made on behalf of the Fund, or make investment decisions that are similar to those made for the Fund, both of which have the potential to adversely affect the price paid or received by the Fund or the size of the security position obtainable for the Fund.
It is possible that an investment opportunity may be suitable for both the Fund and other accounts managed by the portfolio manager, but may not be available in sufficient quantities for both the Fund and the other accounts to participate fully. Similarly, there may be a limited opportunity to sell an investment held by the Fund and another account. Barings has procedures designed to ensure fair treatment of clients in the allocation of trades. Barings has adopted policies and procedures that it believes address the conflicts associated with managing multiple accounts for multiple clients, although there is no assurance that such policies and procedures will adequately address such conflicts.
Cornerstone Investment Partners, LLC (“Cornerstone”)
Cornerstone is the subadviser to the ASTON/Cornerstone Large Cap Value Fund. Cornerstone is located at Phipps Tower, 3438 Peachtree Road NE, Suite 900, Atlanta, GA 30326. Cornerstone was founded in 2001 and is 100% owned by CIM Holdings, LLC, which is 100% owned by Cornerstone’s employees.
The table below shows other accounts for which the portfolio managers of the Fund are jointly and primarily responsible for the day-to-day portfolio management as of October 31, 2012.
| | | | | | | | | | | | | | | | |
| | | Number of
Accounts
Managed | | | Total Assets
Managed (in
millions) | | | Number of
Accounts
Managed with
Advisory Fee
Based on
Performance | | | Assets
Managed with
Advisory Fee
Based on
Performance | |
John Campbell, CPA | | | | | | | | | | | | | | | | |
Registered Investment Companies | | | 1 | | | $ | 26.2 | | | | 0 | | | | NA | |
Other Pooled Investment Vehicles | | | 6 | | | | 234.9 | | | | 0 | | | | NA | |
Other Accounts | | | 752 | | | | 5,301.0 | | | | 0 | | | | NA | |
| | | | |
Rick Van Nostrand, CPA | | | | | | | | | | | | | | | | |
Registered Investment Companies | | | 1 | | | | 26.2 | | | | 0 | | | | NA | |
Other Pooled Investment Vehicles | | | 6 | | | | 234.9 | | | | 0 | | | | NA | |
Other Accounts | | | 752 | | | | 5,301.0 | | | | 0 | | | | NA | |
98
| | | | | | | | | | | | | | | | |
Cameron Clement, CPA | | | | | | | | | | | | | | | | |
Registered Investment Companies | | | 1 | | | $ | 26.2 | | | | 0 | | | | NA | |
Other Pooled Investment Vehicles | | | 6 | | | | 234.9 | | | | 0 | | | | NA | |
Other Accounts | | | 752 | | | | 5,301.0 | | | | 0 | | | | NA | |
| | | | |
Dean Morris, CPA | | | | | | | | | | | | | | | | |
Registered Investment Companies | | | 1 | | | | 26.2 | | | | 0 | | | | NA | |
Other Pooled Investment Vehicles | | | 6 | | | | 234.9 | | | | 0 | | | | NA | |
Other Accounts | | | 752 | | | | 5,301.0 | | | | 0 | | | | NA | |
Compensation. The compensation structure for investment professionals has three components: a base salary, a discretionary bonus, and the opportunity to acquire equity in the firm. The discretionary bonus is a function of the overall profitability of the firm, the portfolio manager’s contribution to the investment process, and the overall success of Cornerstone’s clients. The discretionary bonus can be several times the amount of the base salary representing the bulk of an investment professional’s compensation. Compensation is not based on the performance of individual client accounts but rather of the success of the firm as a whole.
Material Conflict of Interest. In some cases, the portfolio managers for the Fund may manage multiple accounts following Cornerstone’s large-cap value and balanced strategies. The portfolio managers may place transactions on behalf of other accounts that are contrary to investment decisions made on behalf of the Fund, or make investment decisions that differ from those made for the Fund to the extent of client restrictions on accounts, both of which have the potential to adversely affect the price paid or received by the Fund or the size of the security position obtained for the Fund. Cornerstone has adopted policies and procedures that it believes address the conflict associated with managing multiple accounts for multiple clients, including written policies and procedures reasonably designed to allocate investment opportunities on a fair and equitable basis over time.
DoubleLine Capital LP (“DoubleLine”)
DoubleLine Capital LP is the subadviser to the ASTON/DoubleLine Core Plus Fixed Income Fund. DoubleLine was founded in 2009 by Jeffrey Gundlach and other key members of DoubleLine’s investment team. DoubleLine is located at 333 South Grand Avenue, Suite 1800, Los Angeles, CA 90071.
The table below shows other accounts for which the portfolio managers of the Fund are jointly and primarily responsible for the day-to-day portfolio management as of October 31, 2012.
| | | | | | | | | | | | | | | | |
| | | Number of
Accounts
Managed | | | Total Assets
Managed (in
millions) | | | Number of
Accounts
Managed with
Advisory Fee
Based on
Performance | | | Assets Managed
with Advisory
Fee Based on
Performance | |
Jeffrey Gundlach | | | | | | | | | | | | | | | | |
Registered Investment Companies | | | 9 | | | $ | 40,174 | | | | 0 | | | | NA | |
Other Pooled Investment Vehicles | | | 11 | | | | 3,603 | | | | 2 | | | $ | 3,386 | |
Other Accounts | | | 25 | | | | 3,703 | | | | 0 | | | | NA | |
99
| | | | | | | | | | | | | | | | |
Philip Barach | | | | | | | | | | | | | | | | |
Registered Investment Companies | | | 3 | | | | $36,142 | | | | 0 | | | | NA | |
Other Pooled Investment Vehicles | | | 11 | | | | 3,386 | | | | 2 | | | | $3,386 | |
Other Accounts | | | 25 | | | | 3,703 | | | | 0 | | | | NA | |
| | | | |
Bonnie Baha, CFA, CIC | | | | | | | | | | | | | | | | |
Registered Investment Companies | | | 3 | | | | 1,082 | | | | 0 | | | | NA | |
Other Pooled Investment Vehicles | | | 0 | | | | NA | | | | 0 | | | | NA | |
Other Accounts | | | 0 | | | | NA | | | | 0 | | | | NA | |
| | | | |
Luz Padilla | | | | | | | | | | | | | | | | |
Registered Investment Companies | | | 5 | | | | 1,791 | | | | 0 | | | | NA | |
Other Pooled Investment Vehicles | | | 0 | | | | NA | | | | 0 | | | | NA | |
Other Accounts | | | 4 | | | | 339 | | | | 0 | | | | NA | |
Material Conflicts of Interest. From time to time, potential and actual conflicts of interest may arise between a portfolio manager’s management of the investments of the Fund, on the one hand, and the management of other accounts, on the other. Potential and actual conflicts of interest also may result because of the firm’s other business activities. Other accounts managed by a portfolio manager might have similar investment objectives or strategies as the Fund, be managed (benchmarked) against the same index as the Fund’s benchmark, or otherwise hold, purchase, or sell securities that are eligible to be held, purchased or sold by the Fund. The other accounts might also have different investment objectives or strategies than the Fund.
Knowledge and Timing of Fund Trades. A potential conflict of interest may arise as a result of a portfolio manager’s management of the Fund. Because of their positions with the Fund, the portfolio managers know the size, timing and possible market impact of the Fund’s trades. It is theoretically possible that a portfolio manager could use this information to the advantage of other accounts under management, and it is also theoretically possible that actions could be taken (or not taken) to the detriment of the Fund.
Investment Opportunities. A potential conflict of interest may arise as a result of the portfolio managers’ management of a number of accounts with varying investment guidelines. Often, an investment opportunity may be suitable for both the Fund and other accounts managed by a portfolio manager, but securities may not be available in sufficient quantities for both the Fund and the other accounts to participate fully. Similarly, there may be limited opportunity to sell an investment held by the Fund and another account. DoubleLine has adopted policies and procedures reasonably designed to allocate investment opportunities on a fair and equitable basis over time.
Under DoubleLine’s allocation procedures, investment opportunities are allocated among various investment strategies based on individual account investment guidelines, the firm’s investment outlook, cash availability and a series of other factors. DoubleLine has also adopted additional internal practices to complement the general trade allocation policy that are designed to address potential conflicts of interest due to the side-by-side management of the Fund and certain pooled investment vehicles, including investment opportunity allocation issues.
Conflicts potentially limiting the Fund’s investment opportunities may also arise when the Fund and other clients of DoubleLine invest in different parts of an issuer’s capital structure, such as when the Fund owns senior debt obligations of an issuer and other clients own junior tranches of the same issuer. In such circumstances, decisions over whether to trigger an event of default, over the terms of any workout, or how to exit an investment may result in conflicts of interest. In order to minimize such conflicts, a portfolio manager may avoid certain investment opportunities that would potentially give rise to conflicts
100
with other clients or DoubleLine may enact internal procedures designed to minimize such conflicts, which could have the effect of limiting the Fund’s investment opportunities. Additionally, if DoubleLine acquires material non-public information in connection with its business activities for other clients, a portfolio manager or other investment personnel may be restricted from purchasing securities or selling certain securities for the Fund or other clients. When making investment decisions where a conflict of interest may arise, DoubleLine will endeavor to act in a fair and equitable manner between the Fund and other clients; however, in certain instances the resolution of the conflict may result in DoubleLine acting on behalf of another client in a manner that may not be in the best interest, or may be opposed to the best interest, of the Fund.
Performance Fees and Personal Investments. A portfolio manager may advise certain accounts with respect to which the advisory fee is based entirely or partially on performance or in respect of which the portfolio manager may have made a significant personal investment. Such circumstances may create a conflict of interest for a portfolio manager in that a portfolio manager may have an incentive to allocate the investment opportunities that he or she believes might be the most profitable to such other accounts instead of allocating them to the Fund. DoubleLine has adopted policies and procedures reasonably designed to allocate investment opportunities between the Fund and performance fee based accounts on a fair and equitable basis over time.
Compensation. The overall objective of DoubleLine’s compensation program for portfolio managers is to attract competent and expert investment professionals and to retain them over the long-term. Compensation is comprised of several components which, in the aggregate are designed to achieve these objectives and to reward the portfolio managers for their contribution to the success of their clients and the firm. Portfolio managers are compensated through a combination of base salary, discretionary bonus and equity participation. Bonuses and equity generally represent most of the portfolio managers’ compensation. However, in some cases, portfolio managers may have a profit sharing interest in the revenue or income related to the areas for which the portfolio managers are responsible. Such profit sharing arrangements can comprise a significant portion of a portfolio manager’s overall compensation.
Salary. Salary is agreed to with managers at time of employment and is reviewed from time to time. It does not change significantly and often does not constitute a significant part of a portfolio manager’s compensation.
Discretionary Bonus/Guaranteed Minimums. Portfolio managers receive discretionary bonuses. However, in some cases, pursuant to contractual arrangements, some portfolio managers may be entitled to a mandatory minimum bonus if the sum of their salary and profit sharing does not reach certain levels.
Equity Incentives. Portfolio managers participate in equity incentives based on overall firm performance, through direct ownership interests or participation in stock option or stock appreciation plans. These ownership interests or participation interests provide eligible portfolio managers the opportunity to participate in the financial performance of the firm as a whole. Participation is generally determined in the firm’s discretion, taking into account factors relevant to the portfolio manager’s contribution to the success of the firm.
Other Plans and Compensation Vehicles. Portfolio managers may elect to participate in DoubleLine’s 401(k) plan, to which they may contribute a portion of their pre- and post-tax compensation to the plan for investment on a tax-deferred basis. DoubleLine may also choose, from time to time, to offer certain other compensation plans and vehicles, such as a deferred compensation plan, to portfolio managers.
Summary. As described above, an investment professional’s total compensation is determined through a subjective process that evaluates numerous quantitative and qualitative factors, including the contribution made to the overall investment process. Not all factors apply to each investment professional,
101
and there is no particular weighting or formula for considering certain factors. Among the factors considered are: relative investment performance of portfolios (although there are no specific benchmarks or periods of time used in measuring performance); complexity of investment strategies; participation in the investment team’s dialogue; contribution to business results and overall business strategy; success of marketing/business development efforts and client servicing; seniority/length of service with the firm; management and supervisory responsibilities; and fulfillment of the firm’s leadership criteria.
Fairpointe Capital LLC (“Fairpointe”)
Fairpointe serves as subadviser to the ASTON/Fairpointe Mid Cap Fund. Fairpointe was founded in 2011 and is 100% employee-owned. Thyra E. Zerhusen, Marie L. Lorden and Mary L. Pierson, each a Principal and Executive Committee member, serve as co-portfolio managers of the Fund. Ms. Zerhusen, CEO and CIO of Fairpointe, has served as the Fund’s portfolio manager since May 1999. Ms. Lorden, Portfolio Manager of Fairpointe and Ms. Pierson, Portfolio Manager of Fairpointe, have served as portfolio managers of the Fund since April 2009 after serving as long time analysts to the Fund from 2003 and 2004, respectively. The firm provides investment advisory services to institutions and individuals. Fairpointe is located at One North Franklin, Suite 3300, Chicago, IL 60606.
The table below shows other accounts for which the portfolio managers of the Fund are jointly and primarily responsible for the day-to-day portfolio management as of October 31, 2012.
| | | | | | | | | | | | |
| | | Number of
Accounts
Managed | | Total Assets
Managed (in
millions) | | | Number of
Accounts Managed
with Advisory Fee
Based on
Performance | | Assets Managed
with Advisory Fee
Based on
Performance | |
Thyra Zerhusen | | | | | | | | | | | | |
Registered Investment Companies | | 2 | | $ | 378 | | | 0 | | | NA | |
Other Pooled Investment Vehicles | | 0 | | | NA | | | 0 | | | NA | |
Other Accounts | | 10 | | | 293 | | | 0 | | | NA | |
| | | | |
Marie Lorden | | | | | | | | | | | | |
Registered Investment Companies | | 2 | | | 378 | | | 0 | | | NA | |
Other Pooled Investment Vehicles | | 0 | | | NA | | | 0 | | | NA | |
Other Accounts | | 10 | | | 293 | | | 0 | | | NA | |
| | | | |
Mary Pierson | | | | | | | | | | | | |
Registered Investment Companies | | 2 | | | 378 | | | 0 | | | NA | |
Other Pooled Investment Vehicles | | 0 | | | NA | | | 0 | | | NA | |
Other Accounts | | 10 | | | 293 | | | 0 | | | NA | |
Compensation. Ms. Zerhusen, Ms. Lorden and Ms. Pierson are principals in the business of Fairpointe. Each receives a base salary and participates in the profits of Fairpointe. The majority of their compensation is tied to the success of Fairpointe.
102
Material Conflicts of Interest. The portfolio managers manage multiple accounts, including the Fund. The portfolio managers make investment decisions for each account based on the investment objectives, policies and other relevant investment considerations that the portfolio managers believe are applicable to each account. Such actions may be taken for one account and not another and may result in varying holding and performance among clients. Fairpointe has adopted policies and procedures designed to prevent conflicts among multiple accounts, although there can be no assurance that such policies and procedures will adequately address such conflicts.
Harrison Street Securities, LLC (“HSS”)
HSS is the subadviser to the ASTON/Harrison Street Real Estate Fund. HSS is located at 71 South Wacker Drive, Suite 3575, Chicago, IL 60606. HSS is majority-owned by HS Securities Holdings, LLC.
The table below shows other accounts for which the portfolio managers of the Fund are jointly and primarily responsible for the day-to-day portfolio management as of October 31, 2012.
| | | | | | | | | | | | |
| | | Number of
Accounts
Managed | | Total Assets
Managed (in
millions) | | | Number of
Accounts
Managed with
Advisory Fee
Based on
Performance | | Assets
Managed with
Advisory Fee
Based on
Performance | |
Reagan A. Pratt1 | | | | | | | | | | | | |
Registered Investment Companies | | 0 | | | NA | | | 0 | | | NA | |
Other Pooled Investment Vehicles | | 2 | | $ | 477 | | | 2 | | $ | 473 | |
Other Accounts | | 2 | | | 16 | | | 1 | | | 11 | |
| | | | |
James H. Kammert, CFA1 | | | | | | | | | | | | |
Registered Investment Companies | | 0 | | | NA | | | 0 | | | NA | |
Other Pooled Investment Vehicles | | 2 | | | 477 | | | 2 | | | 473 | |
Other Accounts | | 2 | | | 16 | | | 1 | | | 11 | |
1 Messrs. Pratt and Kammert are responsible for the management of the North American assets of the Other Pooled Investment Vehicles and Other Accounts. Their managed portion is represented above.
Compensation. Messrs. Pratt and Kammert are principals in the business of HSS. Both Mr. Pratt and Mr. Kammert receive a base salary and participate in profits of HSS. All of their compensation is tied to the success of HSS.
Material Conflicts of Interest. The portfolio managers manage multiple accounts, including the Fund. The portfolio managers make decisions for each account based on the investment objectives, policies, practices and other relevant investment considerations that the portfolio managers believe are applicable to that account. Consequently, the portfolio managers may purchase securities for one account and not another account, and the performance of securities purchased for one account may vary from the performance of securities purchased for other accounts. A portfolio manager may place transactions on behalf of other accounts that are contrary to investment decisions made on behalf of the Fund, or make investment decisions that are similar to those made for the Fund, both of which have the potential to adversely affect the price paid or received by the Fund or the size of the security position obtainable for the Fund. HSS has adopted policies and procedures that it believes address the conflicts associated with managing multiple accounts for multiple clients, although there is no assurance that such policies and procedures will adequately address such conflicts.
103
Herndon Capital Management, LLC (“Herndon”)
Herndon is the subadviser to the ASTON/Herndon Large Cap Value Fund. Herndon was founded and registered with the SEC in 2001 and began managing assets in June 2002. The firm is an affiliate of Atlanta Life Financial Group (ALFG), a 106-year-old financial services firm that is located at Herndon 191 Peachtree Street, NE, Suite 2500, Atlanta, GA 30303.
The table below shows other accounts for which the portfolio manager of the Fund is primarily responsible for the day-to-day portfolio management as of October 31, 2012.
| | | | | | | | | | | | |
| | | Number of
Accounts
Managed | | Total Assets
Managed (in
millions) | | | Number of
Accounts
Managed with
Advisory Fee
Based on
Performance | | Assets Managed
with Advisory
Fee Based on
Performance | |
Randell A. Cain Jr., CFA | | | | | | | | | | | | |
Registered Investment Companies | | 2 | | $ | 1,084.99 | | | 0 | | | NA | |
Other Pooled Investment Vehicles | | 3 | | | 459.73 | | | 0 | | | NA | |
Other Accounts | | 173 | | | 4,752.43 | | | 0 | | | NA | |
Compensation. Herndon has implemented a compensation program for its portfolio managers/principals based on several components including peer group performance of the portfolios as measured against a designated universe of managers as well as profitability of the firm. For the purposes of this Fund, peer group performance will be measured against the PSN Large Cap Value Universe. The goal of the portfolio management team is to outperform the medium manager in the PSN Large Cap Value Universe over a five-year period. When the portfolio management team outperforms or underperforms the median manager in the universe, it is rewarded accordingly. The Herndon executive team believes that tying performance of the Fund to compensation of the portfolio management team keeps the portfolio management team’s interests aligned with those of our underlying clients.
Analysts are compensated on the basis of a subjective assessment of their contribution to the analytical portion of the investment process. Herndon’s compensation program is designed to attract qualified talent, promote teamwork and to align employer and employee interests by giving key employees a vested interest in the company’s long-term performance.
All employees of Herndon, with the exception of the sales team who receive commissions, are entitled to receive a bonus that will be driven by the profits of the company. Every year a bonus pool is funded by a pre-determined percent of the company’s pre-tax profits. This bonus/profit sharing is distributed based on a combination of factors including tenure, role within the organization, and an evaluation by the employee’s immediate supervisor.
This bonus/profit sharing is expected to become the primary component of every employee’s overall compensation as the company’s profitability grows over time.
The portfolio manager has a five-year agreement effective July 1, 2009 with one year renewals thereafter. The portfolio manager has signed a non-compete agreement.
Material Conflicts of Interest. Herndon seeks to identify potential conflicts of interest resulting from a portfolio manager’s management of both the Fund and multiple separate accounts. The portfolio manager makes decisions for each account including the Fund based on the investment objectives,
104
guidelines, directions, policies, practices and other relevant investment considerations that the portfolio manager believes are applicable to that account. Consequently, the portfolio manager may purchase securities for one account and not another account, and the performance of securities purchased for one account may vary from the performance of the securities purchased for the accounts. The portfolio manager may place transactions on behalf of other accounts that are contrary to investment decisions made on behalf of the Fund, or make investment decisions that are similar to those made for the Fund, both of which have the potential to adversely affect the price paid or received by the Fund or the size of the security position obtainable for the Fund. Herndon has adopted policies and procedures that it believes addresses the potential conflicts of interest including the allocation of investment opportunities on a fair and equitable basis over time; although there is no assurance that such policies and procedures will adequately address such conflicts. The firm’s Code of Ethics governs personal trading by all employees and contains policies and procedures to ensure that client interests are paramount.
Lake Partners, Inc. (“Lake Partners”)
Lake Partners is the subadviser to the ASTON/Lake Partners LASSO Alternatives Fund. Lake Partners is wholly-owned by Messrs. Frederick C. Lake and Ronald A. Lake. Lake Partners is located at 4 High Ridge Park, Suite 300, Stamford, CT 06905.
The table below shows other accounts for which the portfolio managers of the Fund are jointly and primarily responsible for the day-to-day portfolio management as of October 31, 2012.
| | | | | | | | | | | | |
| | | Number of
Accounts
Managed | | Total Assets
Managed (in
millions) | | | Number of
Accounts
Managed with
Advisory Fee
Based on
Performance | | Assets
Managed with
Advisory Fee
Based on
Performance | |
Frederick C. Lake | | | | | | | | | | | | |
Registered Investment Companies | | 0 | | | NA | | | 0 | | | NA | |
Other Pooled Investment Vehicles | | 2 | | $ | 57.7 | | | 0 | | | NA | |
Other Accounts | | 80 | | | 97.6 | | | 0 | | | NA | |
| | | | |
Ronald A. Lake | | | | | | | | | | | | |
Registered Investment Companies | | 0 | | | NA | | | 0 | | | NA | |
Other Pooled Investment Vehicles | | 2 | | | 57.7 | | | 0 | | | NA | |
Other Accounts | | 49 | | | 92.5 | | | 1 | | $ | 15.2 | |
Compensation. As the sole owners of the subadviser, compensation to the portfolio managers for their services to the Fund is allocated out of the subadviser’s income, which is equal to net revenue minus the subadviser’s expenses.
The income of the subadviser and, therefore, the compensation of the portfolio managers, are determined primarily by the amount of assets under management or advisement at the subadviser as well as the investment performance of accounts managed by the subadviser.
Material Conflicts of Interest. The portfolio managers for the Fund manage multiple accounts, including the Fund. The portfolio managers make decisions for each account based on the investment objectives, policies, practices and other relevant investment considerations that the portfolio managers believe are applicable to that account. Consequently, the portfolio managers may purchase securities for one account and not another account, and the performance of securities purchased for one account may
105
vary from the performance of securities purchased for other accounts. A portfolio manager may place transactions on behalf of other accounts that are contrary to investment decisions made on behalf of a fund, or make investment decisions that are similar to those made for a fund, both of which have the potential to adversely affect the price paid or received by a fund or the size of the security position obtainable for a fund. Lake Partners has adopted policies and procedures that it believes address the conflicts associated with managing multiple accounts for multiple clients, although there is no assurance that such policies and procedures will adequately address such conflicts.
Lee Munder Capital Group, LLC (“LMCG”)
LMCG is the subadviser to the ASTON/LMCG Small Cap Growth Fund and the ASTON Small Cap Fund. LMCG was founded in 2000 and is majority-owned by Convergent Capital Management, LLC. LMCG is located at 200 Clarendon Street, 28th Floor, Boston, MA 02116.
The table below shows other accounts for which the portfolio manager of the Fund was primarily responsible for the day-to-day portfolio management as of October 31, 2012.
| | | | | | | | | | | | | | |
| | | Number of
Accounts
Managed | | Total Assets
Managed (in
millions) | | | Number of
Accounts
Managed with
Advisory Fee
Based on
Performance | | | Assets Managed
with Advisory
Fee Based on
Performance | |
Andrew Morey | | | | | | | | | | | | | | |
Registered Investment Companies | | 0 | | | NA | | | | NA | | | | NA | |
Other pooled Investment Vehicles | | 2 | | $ | 13.2 | | | | NA | | | | NA | |
Other Accounts | | 12 | | | 79.4 | | | | NA | | | | NA | |
Compensation. The portfolio manager’s compensation consists of three components: a competitive annual salary, a revenue share tied directly to the manager’s strategy and the benefits from equity ownership. Revenue share related incentives are based on the overall revenue derived from the applicable investment strategy. The percentage of revenue is determined by the investment team’s gross performance versus a peer group universe, on a blended basis, generally over a trailing one year, three year and five year time horizon.
Material Conflicts of Interest. The portfolio manager oversees multiple accounts in the investment strategy which includes the Funds. The portfolio manager makes decisions at the strategy level and implements those decisions at the account level based on the specific investment objectives, policies, practices and other relevant investment considerations that the portfolio manager believes are applicable to each account. Consequently, the portfolio manager may purchase securities for one account and not another account, and the performance of securities purchased for one account may vary from the performance of securities purchased for other accounts. LMCG has adopted policies and procedures that it believes address the conflicts associated with managing multiple accounts for multiple clients, although there is no assurance that such policies and procedures will adequately address such conflicts.
Montag & Caldwell, LLC (“Montag & Caldwell”)
Montag & Caldwell is the subadviser to the ASTON/Montag & Caldwell Growth Fund, ASTON/Montag & Caldwell Mid Cap Growth Fund and ASTON/Montag & Caldwell Balanced Fund. Montag & Caldwell is located at 3455 Peachtree Road NE, Suite 1200, Atlanta, GA 30326. Montag & Caldwell is 100% employee owned.
106
The table below shows other accounts for which the portfolio managers of the Funds listed above are jointly and primarily responsible for the day-to-day portfolio management as of October 31, 2012.
| | | | | | | | | | | | | | | | |
| | | Number of
Accounts
Managed | | | Total Assets
Managed (in
millions) | | | Number of
Accounts
Managed with
Advisory Fee
Based on
Performance | | | Assets
Managed with
Advisory Fee
Based on
Performance
(In Millions) | |
Ronald E. Canakaris, CFA1 | | | | | | | | | | | | | | | | |
Registered Investment Companies | | | 1 | | | $ | 356 | | | | 0 | | | | NA | |
Other Pooled Investment Vehicles | | | 0 | | | | NA | | | | 0 | | | | NA | |
Other Accounts | | | 3 | | | | 6 | | | | 0 | | | | NA | |
| | | | |
Helen M. Donahue, CFA1 | | | | | | | | | | | | | | | | |
Registered Investment Companies | | | 0 | | | | NA | | | | 0 | | | | NA | |
Other Pooled Investment Vehicles | | | 0 | | | | NA | | | | 0 | | | | NA | |
Other Accounts | | | 22 | | | | 130 | | | | 0 | | | | NA | |
| | | | |
Andrew W. Jung, CFA1 | | | | | | | | | | | | | | | | |
Registered Investment Companies | | | 0 | | | | NA | | | | 0 | | | | NA | |
Other Pooled Investment Vehicles | | | 0 | | | | NA | | | | 0 | | | | NA | |
Other Accounts | | | 0 | | | | NA | | | | 0 | | | | NA | |
| | | | |
M. Scott Thompson, CFA1 | | | | | | | | | | | | | | | | |
Registered Investment Companies | | | 0 | | | | NA | | | | 0 | | | | NA | |
Other Pooled Investment Vehicles | | | 0 | | | | NA | | | | 0 | | | | NA | |
Other Accounts | | | 0 | | | | NA | | | | 0 | | | | NA | |
1 Mr. Canakaris is responsible for the management of the ASTON/Montag & Caldwell Growth Fund; Mr. Canakaris and Ms. Donahue are jointly responsible for the management of ASTON/Montag & Caldwell Balanced Fund; and Messrs. Jung and Thompson are jointly responsible for the management of the ASTON/Montag & Caldwell Mid Cap Growth Fund.
Compensation. Compensation for the portfolio managers includes an annual fixed base salary plus incentive compensation, which may be significantly larger than the base salary. Compensation is determined by the Executive Committee, which is comprised of Montag & Caldwell’s Chairman and Chief Executive Officer/President, and is based on the success of the firm in achieving clients’ investment objectives and providing excellent client service. The portfolio managers may also participate in a bonus arrangement that is partially based on identifying new business prospects and obtaining new clients. Other components of the portfolio managers’ compensation include a 401(k) savings and profit sharing plan. Incentive compensation is not based on performance or the value of assets held in any Fund’s portfolio.
Compensation is not directly related to the size, growth or fees received from the management of any particular portfolios.
Material Conflicts of Interest. In some cases, the portfolio managers for the Funds may manage multiple accounts following Montag & Caldwell’s large cap-growth, mid-cap growth and balanced strategies. The portfolio managers may place transactions on behalf of other accounts that are contrary to investment decisions made on behalf of a Fund, or make investment decisions that are similar to those made for a Fund to the extent of client restrictions on accounts, both of which have the potential to adversely affect the price paid or received by a Fund or the size of the security position obtainable for a Fund. Some overlap in holdings may exist between Montag & Caldwell’s mid-cap growth strategy and its large-cap growth strategy. Montag & Caldwell has adopted policies and procedures that it believes
107
address the conflicts associated with managing multiple accounts for multiple clients, including written policies and procedures reasonably designed to allocate investment opportunities on a fair and equitable basis over time. Compensation is not based on the performance of individual client accounts but rather of the firm as a whole and the firm’s Code of Ethics governs personal trading by all employees and contains written policies and procedures to ensure that client interests are paramount.
River Road Asset Management, LLC (“River Road”)
River Road is the subadviser to the ASTON/River Road Dividend All Cap Value Fund, ASTON/River Road Dividend All Cap Value Fund II, ASTON/River Road Small Cap Value Fund, ASTON/River Road Select Value Fund, ASTON/River Road Independent Value Fund and ASTON/River Road Long-Short Fund. River Road is located at Meidinger Tower, Suite 1600, 462 South Fourth Street, Louisville, KY 40202, and is a wholly-owned subsidiary of Aviva Investors North America Holdings, Inc. which is an indirect subsidiary of Aviva plc.
The table below shows other accounts for which the portfolio managers of the Funds listed above are jointly and primarily responsible for the day-to-day portfolio management as of October 31, 2012.
| | | | | | | | | | | | |
| | | Number of
Accounts
Managed | | Total Assets
Managed (in
millions) | | | Number of
Accounts
Managed with
Advisory Fee
Based on
Performance | | Assets
Managed with
Advisory Fee
Based on
Performance | |
James C. Shircliff, CFA1,2 | | | | | | | | | | | | |
Registered Investment Companies | | 2 | | $ | 370.6 | | | 0 | | | NA | |
Other Pooled Investment Vehicles | | 19 | | | 1,547.3 | | | 0 | | | NA | |
Other Accounts | | 147 | | | 2,827.4 | | | 0 | | | NA | |
| | | | |
Henry W. Sanders, III, CFA1 | | | | | | | | | | | | |
Registered Investment Companies | | 0 | | | NA | | | 0 | | | NA | |
Other Pooled Investment Vehicles | | 16 | | | 1,396.4 | | | 0 | | | NA | |
Other Accounts | | 93 | | | 1,842.2 | | | 0 | | | NA | |
| | | | |
Thomas S. Forsha, CFA1 | | | | | | | | | | | | |
Registered Investment Companies | | 0 | | | NA | | | 0 | | | NA | |
Other Pooled Investment Vehicles | | 16 | | | 1,396.4 | | | 0 | | | NA | |
Other Accounts | | 97 | | | 1,845.4 | | | 0 | | | NA | |
| | | | |
R. Andrew Beck2 | | | | | | | | | | | | |
Registered Investment Companies | | 2 | | | 370.6 | | | 0 | | | NA | |
Other Pooled Investment Vehicles | | 3 | | | 151.0 | | | 0 | | | NA | |
Other Accounts | | 58 | | | 988.4 | | | 0 | | | NA | |
| | | | |
Eric K. Cinnamond 3 | | | | | | | | | | | | |
Registered Investment Companies | | 0 | | | NA | | | 0 | | | NA | |
Other Pooled Investment Vehicles | | 4 | | | 93.5 | | | 0 | | | NA | |
Other Accounts | | 4 | | | 171.7 | | | 0 | | | NA | |
108
| | | | | | | | | | | | |
| | | Number of
Accounts
Managed | | Total Assets
Managed (in
millions) | | | Number of
Accounts
Managed with
Advisory Fee
Based on
Performance | | Assets
Managed with
Advisory Fee
Based on
Performance | |
Matthew W. Moran, CFA4 | | | | | | | | | | | | |
Registered Investment Companies | | 0 | | | NA | | | 0 | | | NA | |
Other Pooled Investment Vehicles | | 0 | | | NA | | | 0 | | | NA | |
Other Accounts | | 0 | | | NA | | | 0 | | | NA | |
| | | | |
Daniel R. Johnson, CFA, CPA4 | | | | | | | | | | | | |
Registered Investment Companies | | 0 | | | NA | | | 0 | | | NA | |
Other Pooled Investment Vehicles | | 0 | | | NA | | | 0 | | | NA | |
Other Accounts | | 0 | | | NA | | | 0 | | | NA | |
| | | | |
J. Justin Akin2 | | | | | | | | | | | | |
Registered Investment Companies | | 2 | | $ | 370.6 | | | 0 | | | NA | |
Other Pooled Investment Vehicles | | 3 | | | 151.0 | | | 0 | | | NA | |
Other Accounts | | 54 | | | 985.2 | | | 0 | | | NA | |
1 Messrs. Shircliff, Sanders and Forsha are jointly responsible for the management of the ASTON/River Road Dividend All Cap Value Fund and ASTON/River Road Dividend All Cap Value Fund II.
2Messrs. Shircliff, Beck and Akin are jointly responsible for the management of the ASTON/River Road Small Cap Value Fund and ASTON/River Road Select Value Fund.
3Mr. Cinnamond is responsible for the management of the ASTON/River Road Independent Value Fund.
4Messers. Moran and Johnson are jointly responsible for the management of the ASTON/River Road Long-Short Fund.
Compensation. Compensation for each portfolio manager listed above includes an annual fixed base salary. Additionally, for non-contractual portfolio managers, there is potential incentive compensation up to a pre-determined fixed rate. The incentive compensation is primarily based on the composite portfolio performance relative to the relevant peer group and /or benchmark indices over a 1-, 3-, and 5-year period, with the longer term periods receiving greater emphasis. The relevant index for ASTON/River Road Small Cap Value Fund and ASTON/River Road Independent Value Fund is the Russell 2000 Value Index; for ASTON/River Road Dividend All Cap Value Fund, ASTON/River Road Dividend All Cap Value Fund II and ASTON/River Road Long-Short Fund, the Russell 3000 Value Index; and for ASTON/River Road Select Value Fund, the Russell 2500 Value Index. Additional incentive consideration may be awarded for professional development and contribution to the organization’s broader performance metrics. For portfolio managers with longer-term employment agreements (contractual arrangements), incentive compensation has been contractually determined at a fixed percentage of their base salary. R. Andrew Beck, James C. Shircliff, and Henry W. Sanders are contractual portfolio managers.
Material Conflicts of Interest. The portfolio managers for each Fund manage multiple accounts, including their respective Fund. The portfolio managers make decisions for each account based on the investment objectives, policies, practices and other relevant investment considerations that the portfolio managers believe are applicable to that account. Consequently, the portfolio managers may purchase securities for one account and not another account, and the performance of securities purchased for one account may vary from the performance of securities purchased for other accounts. A portfolio manager may place transactions on behalf of other accounts that are contrary to investment decisions made on behalf of a Fund, or make investment decisions that are similar to those made for a Fund, both of which have the potential to adversely affect the price paid or received by a Fund or the size of the security position obtainable for a Fund. River Road has adopted policies and procedures that it believes address the conflicts associated with managing multiple accounts for multiple clients, including long only and
109
long-short products, although there is no assurance that such policies and procedures will adequately address such conflicts.
Silvercrest Asset Management Group LLC (“Silvercrest”)
Silvercrest is the subadviser to the ASTON/Silvercrest Small Cap Fund. Silvercrest was founded in 2002 and is located at 1330 Avenue of the Americas, 38th Fl., New York, NY 10019. Silvercrest is a wholly-owned subsidiary of Silvercrest L.P., which is majority-owned by Silvercrest employees.
The table below shows other accounts for which the portfolio manager of the Fund is primarily responsible for the day-to-day portfolio management as of October 31, 2012.
| | | | | | | | | | | | |
| | | Number of
Accounts
Managed | | Total Assets
Managed (in
millions) | | | Number of
Accounts
Managed with
Advisory Fee
Based on
Performance | | Assets Managed
with Advisory
Fee Based on
Performance | |
Roger W. Vogel, CFA | | | | | | | | | | | | |
Registered Investment Companies | | 0 | | | NA | | | 0 | | | NA | |
Other Pooled Investment Vehicles | | 0 | | | NA | | | 0 | | | NA | |
Other Accounts | | 1,430 | | $ | 3,400 | | | 0 | | | NA | |
Material Conflicts of Interest. The portfolio manager for the Fund manages multiple accounts, including the Fund. Conflicts of interest may arise where the structure of financial or other benefits available to the portfolio manager differs among these accounts. The portfolio manager may advise other pooled investment vehicles which pay a performance-based advisory fee. This may create an incentive to favor such vehicles over other accounts advised by the portfolio manager. In addition, the portfolio manager may devote unequal time and attention to the funds and accounts for which he provides investment advice. As a result, the portfolio manager may not be able to formulate as complete a strategy or identify equally attractive investment opportunities for each of those funds and accounts as might be the case if he were to devote substantially more attention to a single fund. The portfolio manager makes decisions for each account based on the investment objectives, policies, practices and other relevant investment considerations that the portfolio manager believes are applicable to that account. Consequently, the portfolio manager may purchase securities for one account and not another account, and the performance of securities purchased for one account may vary from the performance of securities purchased for other accounts. The portfolio manager may place transactions on behalf of other accounts that are contrary to investment decisions made on behalf of the Fund, or make investment decisions that are similar to those made for the Fund, both of which have the potential to adversely affect the price paid or received by the Fund or the size of the security position obtainable for the Fund. If the portfolio manager identifies a limited investment opportunity that may be suitable for multiple funds and/or accounts, the opportunity may be allocated among these several funds or accounts, which may limit the fund’s ability to take full advantage of the investment opportunity. Silvercrest has adopted policies and procedures that it believes address the conflicts associated with managing multiple accounts for multiple clients, although there is no assurance that such policies and procedures will adequately address such conflicts.
Compensation. Compensation for the portfolio manager listed above includes an annual fixed based salary and potential incentive compensation up to a pre-determined fixed rate. The incentive compensation is primarily based on assets under management and composite portfolio performance relative to the relevant benchmark index over a rolling 2-year period. The relevant index for the Fund is
110
the Russell 2000 Value Index. Additional incentive consideration may be awarded for professional development and contribution to the organization’s broader performance metrics.
TAMRO Capital Partners LLC (“TAMRO”)
TAMRO is the subadviser to the ASTON/TAMRO Diversified Equity Fund and ASTON/TAMRO Small Cap Fund. TAMRO is located at 1701 Duke Street, Suite 250, Alexandria, VA 22314. TAMRO is majority-owned by the principals of the firm.
The table below shows other accounts for which the portfolio managers of the Funds listed above are jointly and primarily responsible for the day-to-day portfolio management as of October 31, 2012.
| | | | | | | | | | | | |
| | | Number of
Accounts
Managed | | Total Assets
Managed (in
millions) | | | Number of
Accounts
Managed with
Advisory Fee
Based on
Performance | | Assets
Managed with
Advisory Fee
Based on
Performance
(In Millions) | |
Philip D. Tasho, CFA | | | | | | | | | | | | |
Registered Investment Companies | | 3 | | $ | 91 | | | 0 | | | NA | |
Other Pooled Investment Vehicles | | 2 | | | 46 | | | 0 | | | NA | |
Other Accounts | | 277 | | | 583 | | | 1 | | $ | 129 | |
| | | | |
Timothy A. Holland | | | | | | | | | | | | |
Registered Investment Companies | | 3 | | | 91 | | | 0 | | | NA | |
Other Pooled Investment Vehicles | | 2 | | | 46 | | | 0 | | | NA | |
Other Accounts | | | | | | | | | | | | |
Compensation. Portfolio manager and equity analyst compensation is comprised of an annual base salary, potential for an annual bonus based on a combination of job performance and TAMRO’s overall company performance, and potential income through equity participation in the firm.
Material Conflicts of Interest. Certain conflicts of interest may arise in connection with the management of multiple portfolios. Potential conflicts include, for example, conflicts in the allocation of investment opportunities in a way that favors other accounts, including performance-based fee accounts, over a Fund. TAMRO has adopted policies and procedures that are designed to minimize the effects of these conflicts. Responsibility for managing TAMRO client portfolios is organized according to the investment discipline. When managing portfolios, the manager will generally purchase and sell securities across all portfolios that he manages in each investment discipline. TAMRO will aggregate orders to purchase or sell the same security for multiple accounts when it believes such aggregation is consistent with its duty to seek best execution on behalf of its clients. Some orders for certain client accounts may, by investment restriction or otherwise, not be available for aggregation. To the extent trades are aggregated, shares purchased or sold are generally allocated to the portfolios on a pro rata basis. TAMRO believes that it has implemented policies and procedures that are designed to manage any potential conflicts in an appropriate manner.
Taplin, Canida & Habacht, LLC (“TCH”)
TCH is the subadviser to the ASTON/TCH Fixed Income Fund. TCH is a registered investment adviser founded in 1985 with offices at 1001 Brickell Bay Drive, Suite 2100, Miami, FL 33131. A majority interest in TCH is owned by M&I Investment Management Corp., which is a wholly-owned subsidiary of BMO Financial Corp., which is in turn a wholly-owned subsidiary of Bank of Montreal
111
Holding, Inc. (“BMO”), a publicly-held Canadian bank holding. The table below shows other accounts for which the portfolio managers of the Fund are primarily responsible for the day-to-day portfolio management as of October 31, 2012
| | | | | | | | | | | | |
| | | Number of
Accounts
Managed | | Total Assets
Managed (in
millions) | | | Number of
Accounts
Managed with
Advisory Fee
Based on
Performance | | Assets
Managed with
Advisory Fee
Based on
Performance | |
Tere Alvarez Canida | | | | | | | | | | | | |
Registered Investment Companies | | 2 | | $ | 311 | | | 0 | | | NA | |
Other Pooled Investment Vehicles | | 0 | | | NA | | | 0 | | | NA | |
Other Accounts | | 64 | | | 7,037 | | | 0 | | | NA | |
| | | | |
Alan M. Habacht | | | | | | | | | | | | |
Registered Investment Companies | | 2 | | | 311 | | | 0 | | | NA | |
Other Pooled Investment Vehicles | | 0 | | | NA | | | 0 | | | NA | |
Other Accounts | | 64 | | | 7,037 | | | 0 | | | NA | |
| | | | |
William J. Canida | | | | | | | | | | | | |
Registered Investment Companies | | 2 | | | 311 | | | 0 | | | NA | |
Other Pooled Investment Vehicles | | 0 | | | NA | | | 0 | | | NA | |
Other Accounts | | 64 | | | 7,037 | | | 0 | | | NA | |
| | | | |
Scott M. Kimball | | | | | | | | | | | | |
Registered Investment Companies | | 2 | | | 311 | | | 0 | | | NA | |
Other Pooled Investment Vehicles | | 0 | | | NA | | | 0 | | | NA | |
Other Accounts | | 64 | | | 7,037 | | | 0 | | | NA | |
Compensation. Compensation for the portfolio managers listed above includes an annual base salary with an additional bonus based on the profits of the company. The portfolio managers’ compensation is not based on the performance of the Fund. Compensation is not directly based on value of assets held in the Fund.
Material Conflicts of Interest. TCH furnishes investment management and advisory services to other accounts, and TCH shall be at all times free, in its discretion, to make recommendations to other accounts which may be the same as, or may be different from those made to the Fund. It is TCH’s policy to allocate, within its reasonable discretion, investment opportunities to the Fund over a period of time on a fair and equitable basis relative to TCH’s other accounts. TCH, its affiliates, and any officer, director, stockholder, employee or any member of their families may or may not have an interest in the securities whose purchase and sale TCH may recommend, and such recommendations with respect to securities of the same kind may be the same as or different from the action which TCH, or any of its affiliates, or any partner, officer, director, stockholder, employee, or any member of their families, or other investors may take with respect hereto. In addition, TCH may aggregate certain trades done on the behalf of the client with trades in the same security on the same day done on behalf of other clients of TCH that utilize the same broker as the client. The purpose of such aggregation will be to obtain for the client, where possible, a better execution price(s) than would be the case if the client’s transaction were not aggregated with the trades of other clients. TCH has adopted policies and procedures that it believes address the conflicts associated with managing multiple accounts, although there is no assurance that such policies and procedures will adequately address such conflicts.
112
Ownership of Securities. The table below shows the dollar range of equity securities in each Fund beneficially owned by the Fund’s portfolio manager(s) as of October 31, 2012.
| | | | |
Fund | | Portfolio Manager | | Dollar Range of Securities in the Fund |
| | |
| ASTON/Montag & Caldwell Growth | | Ronald Canakaris | | Over $1,000,000 |
| | |
| ASTON/Herndon Large Cap Value | | Randell A. Cain Jr. | | $10,001 - $50,000 |
| | |
| ASTON/Cornerstone Large Cap Value | | Christopher Reynolds John Campbell Wayne Holbrook Rick van Nostrand | | $0 $0 $0 $0 |
| | |
| ASTON/TAMRO Diversified Equity | | Philip D. Tasho Timothy Holland | | Over $1,000,000 $10,001 - $50,000 |
| | |
| ASTON/River Road Dividend All Cap Value | | James C. Shircliff Henry W. Sanders, III Thomas S. Forsha | | Over $1,000,000 Over $1,000,000 $500,001 - $1,000,000 |
| | |
| ASTON/River Road Dividend All Cap Value II(1) | | James C. Shircliff Henry W. Sanders, III Thomas S. Forsha | | Over $1,000,000 $0 $0 |
| | |
| ASTON/Fairpointe Mid Cap | | Thyra Zerhusen Marie Lorden Mary Pierson | | Over $1,000,000 $100,001 - $500,000 $100,001 - $500,000 |
| | |
| ASTON/Montag & Caldwell Mid Cap Growth | | Andrew Jung M. Scott Thompson | | $100,001 - $500,000 $500,001 - $1,000,000 |
| | |
| ASTON/TAMRO Small Cap | | Philip D. Tasho Timothy Holland | | Over $1,000,000 $10,001 - $50,000 |
| | |
| ASTON/River Road Select Value | | James. C. Shircliff R. Andrew Beck J. Justin Akin | | $100,001 - $500,000 $50,001 - $100,000 $100,001 - $500,000 |
| | |
| ASTON/River Road Small Cap Value | | James C. Shircliff R. Andrew Beck J. Justin Akin | | $500,001 - $1,000,000 $100,001 - $500,000 $50,001 - $100,000 |
| | |
| ASTON/River Road Independent Value | | Eric K. Cinnamond | | $500,001 - $1,000,000 |
| | |
| ASTON/LMCG Small Cap Growth | | Andrew Morey | | $10,001 - $50,000 |
| | |
| ASTON Small Cap | | Andrew Morey | | $0 |
| | |
| ASTON/Silvercrest Small Cap(2) | | Roger W. Vogel | | $100,001 - $500,000 |
113
| | | | |
Fund | | Portfolio Manager | | Dollar Range of Securities in the Fund |
| | |
| ASTON/DoubleLine Core Plus Fixed Income | | Jeffrey Gundlach Philip Barach Bonnie Baha Luz Padilla | | $0 $0 $0 $0 |
| | |
| ASTON/TCH Fixed Income | | Tere Alvarez Canida Alan M. Habacht William J. Canida Scott M. Kimball | | $0 $0 $0 $0 |
| | |
| ASTON/Lake Partners LASSO Alternatives | | Frederick C. Lake Ronald A. Lake | | $500,001 - $1,000,000 $500,001 - $1,000,000 |
| | |
| ASTON/Anchor Capital Enhanced Equity | | Ronald A. Altman | | $10,001 - $50,000 |
| | |
| ASTON/River Road Long-Short | | Matthew W. Moran Daniel Johnson | | $100,001 - $500,000 $100,001 - $500,000 |
| | |
| ASTON/Barings International | | David Bertocchi | | $0 |
| | |
| ASTON/Harrison Street Real Estate | | James H. Kammert Reagan A. Pratt | | $0 $0 |
| | |
| ASTON/Montag & Caldwell Balanced | | Ronald Canakaris Helen M. Donahue | | $0 $10,001 - $50,000 |
(1)ASTON/River Road Dividend All Cap Value II began issuing Class N and Class I shares on June 26, 2012.
(2)ASTON/Silvercrest Small Cap began issuing Class N and Class I shares on December 23, 2011.
For the fiscal years ended October 31, 2012, October 31, 2011 and October 31, 2010, Aston Asset Management, LP paid the following sub-advisory fees to each Fund’s subadviser:
114
| | | | | | | | | | | | | | | | | | |
Fund | | Net
Fees FYE Paid-
2012 | | Net
Fees FYE Paid-
2011 | | Net
Fees FYE Paid-
2010 |
| | | | | | |
ASTON/Montag & Caldwell Growth | | | $11,615,392 | | | | | | $9,904,473 | | | | | | $8,862,061 | | | |
ASTON/Herndon Large Cap Value(1) | | | 126,753 | | | | | | * | | | | | | * | | | |
ASTON/Cornerstone Large Cap Value(2) | | | 38,293 | | | | | | 357,079 | | | | | | 821,626 | | | |
ASTON/TAMRO Diversified Equity | | | 89,175 | | | | | | 86,069 | | | | | | 48,538 | | | |
ASTON/River Road Dividend All Cap Value | | | 2,823,562 | | | | | | 1,429,589 | | | | | | 730,536 | | | |
ASTON/River Road Dividend All Cap Value II(3) | | | * | | | | | | NA | | | | | | NA | | | |
ASTON/Fairpointe Mid Cap(4) | | | 9,085,946 | | | | | | 8,178,725 | | | | | | 3,783,226 | | | |
ASTON/Montag & Caldwell Mid Cap Growth | | | * | | | | | | * | | | | | | * | | | |
ASTON/TAMRO Small Cap | | | 4,627,859 | | | | | | 4,495,173 | | | | | | 4,026,247 | | | |
ASTON/River Road Select Value | | | 698,454 | | | | | | 964,620 | | | | | | 1,090,959 | | | |
ASTON/River Road Small Cap Value | | | 1,300,899 | | | | | | 1,854,748 | | | | | | 2,189.106 | | | |
ASTON/River Road Independent Value(5) | | | 3,415,237 | | | | | | 681,859 | | | | | | NA | | | |
ASTON/LMCG Small Cap Growth(6) | | | * | | | | | | * | | | | | | NA | | | |
ASTON Small Cap(7) | | | 82,505 | | | | | | 197,840 | | | | | | 212,129 | | | |
ASTON/Silvercrest Small Cap(8) | | | * | | | | | | NA | | | | | | NA | | | |
ASTON/DoubleLine Core Plus Fixed Income(9) | | | 100,506 | | | | | | * | | | | | | NA | | | |
ASTON/TCH Fixed Income | | | 110,071 | | | | | | 60,562 | | | | | | 27,503 | | | |
ASTON/Lake Partners LASSO Alternatives(10) | | | 1,299,769 | | | | | | 534,676 | | | | | | 14,076 | | | |
ASTON/Anchor Capital Enhanced Equity(11) | | | 530,298 | | | | | | 387,422 | | | | | | 194,621 | | | |
ASTON/River Road Long-Short(12) | | | * | | | | | | * | | | | | | NA | | | |
ASTON/Barings International | | | 227,404 | | | | | | 179,102 | | | | | | 140,070 | | | |
ASTON/Harrison Street Real Estate(13) | | | 4,967 | | | | | | 108,600 | | | | | | 91,316 | | | |
ASTON/Montag & Caldwell Balanced | | | 73,921 | | | | | | 60,561 | | | | | | 51,893 | | | |
| * | The calculation of the sub-advisory fee is described on page 96. The formula resulted in a negative amount and therefore no sub-advisory fee was payable for the fiscal year. |
| (1) | ASTON/Herndon Large Cap Value began issuing Class N shares on March 30, 2010. |
| (2) | On July 15, 2011, Cornerstone became the subadviser to ASTON/Cornerstone Large Cap Value. Amounts prior to that time were paid to a previous subadviser. |
| (3) | ASTON/River Road Dividend All Cap Value II began issuing Class N shares and Class I shares on June 26, 2012. |
| (4) | On April 30, 2011, Fairpointe became the subadviser to ASTON/Fairpointe Mid Cap. Amounts prior to that time were paid to a previous subadviser. |
| (5) | ASTON/River Road Independent Value began issuing Class N shares on December 30, 2010. |
| (6) | ASTON/LMCG Small Cap Growth began issuing Class N shares on November 2, 2010. On February 17, 2012, LMCG became the subadviser to the Fund. Amounts prior to that time were paid to previous subadviser. |
| (7) | On January 31, 2013, LMCG became subadviser to ASTON Small Cap. Amounts prior to that time were paid to the previous subadviser. |
| (8) | ASTON/Silvercrest Small Cap began issuing Class N shares and Class I shares on December 23, 2011. |
| (9) | ASTON/DoubleLine Core Plus Fixed Income began issuing Class N and Class I shares on July 15, 2011. |
| (10) | ASTON/Lake Partners LASSO Alternatives began issuing Class I shares on March 31, 2009. |
| (11) | On June 30, 2012, Anchor Capital became the subadviser to ASTON/Anchor Capital Enhanced Equity. Amounts prior to that time were paid to previous subadvisers. |
| (12) | ASTON/River Road Long-Short began issuing Class N shares on May 3, 2011. |
| (13) | On June 30, 2011, HSS became the subadviser to ASTON/Harrison Street Real Estate. Amounts prior to that time were paid to a previous subadviser. |
Administrator
Under the Administration Agreement between Aston and the Trust, the Administrator is responsible for: (1) coordinating with the custodian and the transfer agent and monitoring the services they provide to the Funds, (2) coordinating with and monitoring any other third parties furnishing services to the Funds, (3) providing the Funds with necessary office space, telephones and other communications facilities and personnel competent to perform administrative and clerical functions, (4) supervising the maintenance by third parties of such books and records of the Funds as may be required by applicable federal or state law, (5) preparing or supervising the preparation by third parties of all federal, state and local tax returns and reports of the Funds required by applicable law, (6) preparing and, after approval by the Funds, filing and arranging for the distribution of proxy materials and periodic reports to shareholders
115
of the Funds as required by applicable law, (7) preparing and, after approval by the Trust, arranging for the filing of such registration statements and other documents with the SEC and other federal and state regulatory authorities as may be required by applicable law, (8) reviewing and submitting to the officers of the Trust for their approval invoices or other requests for payment of the Funds’ expenses and instructing the Custodian to issue checks in payment thereof and (9) taking such other action with respect to the Trust or the Funds as may be necessary in the opinion of the Administrator to perform its duties under the Administration Agreement.
As compensation for services performed under the Administration Agreement, the Administrator receives an administration fee payable monthly at the annual rate set forth below as a percentage of the average daily net assets of the Trust.
Administration Fees
As of July 1, 2012, the fee schedule to the Administration Agreement is as follows:
| | |
| Percentage | | Average Daily Net Assets (Aggregate Fund Complex) |
| |
| 0.0437% | | Up to $7.4 billion |
| 0.0412% | | Over $7.4 billion |
The Administrator also receives a monthly base fee in the amount of $1,000 per Fund.
Prior to July 1, 2012, the fee schedule to the Administration Agreement was as follows:
| | |
| Percentage | | Average Daily Net Assets (Aggregate Fund Complex) |
| |
| 0.0490% | | Up to $7.4 billion |
| 0.0465% | | Over $7.4 billion |
The Administrator also received a monthly base fee in the amount of $1,000 per Fund.
The following are the total fees paid to the Administrator by each Fund for the fiscal years ended October 31, 2012, October 31, 2011 and October 31, 2010:
116
| | | | | | | | | | | | |
Fund | | Administrative
Fees FYE
October 31,
2012 | | | Administrative
Fees FYE
October 31,
2011 | | | Administrative
Fees FYE
October 31,
2010 | |
| | | |
ASTON/Montag & Caldwell Growth | | | $1,841,475 | | | | $1,690,328 | | | | $1,501,253 | |
ASTON/Herndon Large Cap Value(1) | | | 34,196 | | | | 22,396 | | | | 9,025 | |
ASTON/Cornerstone Large Cap Value | | | 25,962 | | | | 73,364 | | | | 137,656 | |
ASTON/TAMRO Diversified Equity | | | 25,962 | | | | 27,703 | | | | 22,503 | |
ASTON/River Road Dividend All Cap Value | | | 409,284 | | | | 228,953 | | | | 126,494 | |
ASTON/River Road Dividend All Cap Value II(2) | | | 5,445 | | | | NA | | | | NA | |
ASTON/Fairpointe Mid Cap | | | 1,426,657 | | | | 1,395,964 | | | | 789,715 | |
ASTON/Montag & Caldwell Mid Cap Growth | | | 18,081 | | | | 18,684 | | | | 18,137 | |
ASTON/TAMRO Small Cap | | | 513,480 | | | | 529,989 | | | | 482,346 | |
ASTON/River Road Select Value | | | 88,039 | | | | 121,104 | | | | 130,969 | |
ASTON/River Road Small Cap Value | | | 163,427 | | | | 240,799 | | | | 278,111 | |
ASTON/River Road Independent Value(3) | | | 300,968 | | | | 84,211 | | | | NA | |
ASTON/LMCG Small Cap Growth(4) | | | 29,472 | | | | 17,738 | | | | N/A | |
ASTON Small Cap | | | 19,643 | | | | 43,920 | | | | 40,528 | |
ASTON/Silvercrest Small Cap(5) | | | 14,537 | | | | NA | | | | NA | |
ASTON/DoubleLine Core Plus Fixed Income(6) | | | 96,213 | | | | 8,191 | | | | NA | |
ASTON/TCH Fixed Income | | | 66,978 | | | | 62,708 | | | | 61,487 | |
ASTON/Lake Partners LASSO Alternatives | | | 135,076 | | | | 74,993 | | | | 21,769 | |
ASTON/Anchor Capital Enhanced Equity | | | 87,495 | | | | 76,855 | | | | 47,178 | |
ASTON/River Road Long-Short(7) | | | 18,294 | | | | 8,133 | | | | NA | |
ASTON/Barings International | | | 64,465 | | | | 66,399 | | | | 58,607 | |
ASTON/Harrison Street Real Estate | | | 19,466 | | | | 35,348 | | | | 29,720 | |
ASTON/Montag & Caldwell Balanced | | | 32,227 | | | | 33,901 | | | | 33,133 | |
(1)ASTON/Herndon Large Cap Value began issuing Class N shares on March 30, 2010.
(2)ASTON/River Road Dividend All Cap Value II began issuing Class N and Class I shares on June 26, 2012.
(3)ASTON/River Road Independent Value began issuing Class N shares on December 30 2010.
(4)ASTON/LMCG Small Cap Growth began issuing Class N shares on November 2, 2010.
(5)ASTON/Silvercrest Small Cap began issuing Class N shares and Class I shares on December 23, 2011.
(6)ASTON/DoubleLine Core Plus Fixed Income began issuing Class N and Class I shares on July 15, 2011.
(7)ASTON/River Road Long-Short began issuing Class N shares on May 3, 2011.
Subadministrator
BNY Mellon Investment Servicing (US) Inc. (“BNY Mellon” or the “Subadministrator”), 4400 Computer Drive, Westborough, Massachusetts 01581, provides certain administrative services for the Funds and Aston pursuant to a Subadministration and Accounting Services Agreement (the “Subadministration Agreement”) between Aston and BNY Mellon. On November 30, 2006, the Subadministration Agreement was assigned to Aston from AAIFS, the former administrator to the Funds.
As Subadministrator, BNY Mellon provides the Trust with subadministrative services, including fund accounting, regulatory reporting, necessary office space, equipment, personnel and facilities. Compensation for these services is paid under the Subadministration Agreement with the Administrator.
Subadministration Fees
The Subadministrator receives an administration fee payable by the Administrator. Effective July 1, 2012, under the terms of the Subadministration Agreement, subadministration fees (inclusive of tax service fees) paid by the Administrator, are accrued daily and paid monthly, at a rate of 0.0167%, respectively of average daily net assets of the Trust. In addition, the Administrator pays the
117
Subadministrator a base subadministration fee monthly in the amount of $1,000 per Fund. BNY Mellon did not provide tax services prior to July 1, 2012.
Underwriter
Foreside Funds Distributors LLC (formerly, BNY Mellon Distributors, LLC) (the “Distributor”), 400 Berwyn Park, 899 Cassatt Road, Berwyn, PA 19312, and the Trust are parties to a distribution agreement effective April 1, 2012 (the “Distribution Agreement”) under which the Distributor serves as statutory underwriter and facilitates the registration and distribution of shares of each series of the Trust on a continuous basis.
After the initial term, the Distribution Agreement shall be renewed for successive one-year terms, provided such continuance is specifically approved at least annually (i) by the Board or (ii) by a vote of a majority (as defined in the 1940 Act and Rule 18f-2 thereunder) of the outstanding voting securities of the Trust, provided that in either event the continuance is also approved by a majority of the Trustees who are not parties to the Distribution Agreement and who are not “interested persons” (as defined in the 1940 Act) of any party to the Distribution Agreement, by vote cast in person at a meeting called for the purpose of voting on such approval. The Distribution Agreement is terminable without penalty, on at least 60 days’ written notice, by the Board, by vote of a majority (as defined in the 1940 Act and Rule 18f-2 thereunder) of the outstanding voting securities of the Trust, or by the Distributor. This Agreement will also terminate automatically in the event of its assignment (as defined in the 1940 Act and the rules thereunder).
Distribution and Services Plans
The Board has adopted distribution and services plans (the “Plans”) pursuant to Rule 12b-1 under the 1940 Act, which permit the Class N and Class R shares of each Fund, as applicable, to pay certain expenses associated with the distribution of Fund shares and the provision of services to shareholder accounts.
Rule 12b-1 regulates the circumstances under which an investment company may directly or indirectly bear expenses relating to the distribution of its shares. Continuance of the Plans must be approved annually by a majority of the Trustees of the Trust and by a majority of the Trustees who are not “interested persons” of the Trust or the Distributor, as that term is defined in the 1940 Act (“Independent Trustees”). In adopting the Plans, the Independent Trustees concluded in accordance with the requirements of Rule 12b-1 that there is a reasonable likelihood that the Plans will benefit each Fund and its shareholders by resulting in greater sales of Fund shares. The Plans require that quarterly written reports of amounts spent under the Plans and the purposes of such expenditures be furnished to and reviewed by the Trustees. In accordance with Rule 12b-1 under the 1940 Act, the Plans may be terminated with respect to any Fund by a vote of a majority of the Independent Trustees, or by a vote of a majority of the outstanding shares of that Fund. The Plans may be amended by vote of the Board, including a majority of the Independent Trustees, cast in person at a meeting called for such purpose, except that any change that would effect a material increase in any distribution fee with respect to a Fund (or class) requires the approval of that Fund’s (or class’s) shareholders. All material amendments of the Plans will require approval by a majority of the Trustees of the Trust and of the Independent Trustees.
To the Trust’s knowledge, no “interested person” of the Trust, nor any Trustee who is not an “interested person,” has a direct or indirect financial interest in the operation of the Plans.
Under the Plans, each Fund may pay amounts not exceeding, on an annual basis, 0.25% of a Fund’s average daily net assets for Class N shares and 0.50% of a Fund’s average daily net assets for
118
Class R shares. From this amount, the Distributor may make payments to financial institutions and intermediaries such as banks, savings and loan associations, insurance companies, investment counselors, broker-dealers, and the Distributor’s affiliates and subsidiaries as compensation for services, reimbursement of expenses incurred in connection with distribution assistance or provision of shareholder services. The Plans for Class N shares are characterized as reimbursement plans and are directly tied to expenses incurred by the Distributor; the payments the Distributor receives during any year may not exceed its actual expenses. The Plan for Class R shares is characterized as a compensation plan and is not directly tied to expenses incurred by the Distributor; the payments the Distributor receives during any year may exceed its actual expenses.
Amounts spent on behalf of each Fund pursuant to such Plans during the fiscal year ended October 31, 2012, are set forth below.
| | | | | | | | | | | | | | | | |
| | | 12b-1 Plan Expenses | |
Fund – Class N Shares | | Printing | | | Distribution
Services | | | Compensation
to Broker
Dealers | | | Compensation
to Sales
Personnel | |
| | | | |
ASTON/Montag & Caldwell Growth | | | $ 208 | | | | $3,019 | | | | $4,501,512 | | | | $0 | |
ASTON/Herndon Large Cap Value | | | 234 | | | | 1,780 | | | | 19,582 | | | | 0 | |
ASTON/Cornerstone Large Cap Value | | | 25 | | | | 568 | | | | 52,813 | | | | 0 | |
ASTON/TAMRO Diversified Equity | | | 8 | | | | 560 | | | | 38,548 | | | | 0 | |
ASTON/River Road Dividend All Cap Value | | | 194 | | | | 2,370 | | | | 798,735 | | | | 0 | |
ASTON/River Road Dividend All Cap Value II(1) | | | 1 | | | | 117 | | | | 148 | | | | 0 | |
ASTON/Fairpointe Mid Cap | | | 2,859 | | | | 6,677 | | | | 3,801,953 | | | | 0 | |
ASTON/Montag & Caldwell Mid Cap Growth | | | 1 | | | | 1,696 | | | | 10,077 | | | | 0 | |
ASTON/TAMRO Small Cap | | | 622 | | | | 1,241 | | | | 939,903 | | | | 0 | |
ASTON/River Road Select Value | | | 16 | | | | 104 | | | | 18,683 | | | | 0 | |
ASTON/River Road Small Cap Value | | | 8 | | | | 578 | | | | 142,160 | | | | 0 | |
ASTON/River Road Independent Value | | | 2,674 | | | | 2,779 | | | | 839,074 | | | | 0 | |
ASTON/LMCG Small Cap Growth | | | 2 | | | | 812 | | | | 12,338 | | | | 0 | |
ASTON Small Cap | | | 7 | | | | 2,099 | | | | 44,767 | | | | 0 | |
ASTON/Silvercrest Small Cap(2) | | | 1 | | | | 360 | | | | 166 | | | | 0 | |
ASTON/DoubleLine Core Plus Fixed Income | | | 98 | | | | 659 | | | | 83,504 | | | | 0 | |
ASTON/TCH Fixed Income | | | 36 | | | | 2,885 | | | | 109,216 | | | | 0 | |
ASTON/Lake Partners LASSO Alternatives | | | 57 | | | | 127 | | | | 53,552 | | | | 0 | |
ASTON/Anchor Capital Enhanced Equity | | | 88 | | | | 1,004 | | | | 170,375 | | | | 0 | |
ASTON/River Road Long-Short | | | 5 | | | | 400 | | | | 10,295 | | | | 0 | |
ASTON/Barings International | | | 1 | | | | 374 | | | | 700 | | | | 0 | |
ASTON/Harrison Street Real Estate | | | 12 | | | | 1,745 | | | | 13,684 | | | | 0 | |
ASTON/Montag & Caldwell Balanced | | | 32 | | | | 2,124 | | | | 32,004 | | | | 0 | |
(1)ASTON/River Road Dividend All Cap Value II began issuing Class N shares and Class I shares on on June 26, 2012.
(2)ASTON/Silvercrest Small Cap began issuing Class N shares and Class I shares on December 23, 2011.
119
| | | | | | | | | | | | |
Fund – Class N Shares | | Marketing | | | Service
Providers | | | Total | |
| | | |
ASTON/Montag & Caldwell Growth | | | $129,475 | | | | $0 | | | | $4,634,214 | |
ASTON/Herndon Large Cap Value | | | 8,188 | | | | 0 | | | | 29,784 | |
ASTON/Cornerstone Large Cap Value | | | 3,126 | | | | 0 | | | | 56,531 | |
ASTON/TAMRO Diversified Equity | | | 18,311 | | | | 0 | | | | 57,427 | |
ASTON/River Road Dividend All Cap Value | | | 35,225 | | | | 0 | | | | 836,524 | |
ASTON/River Road Dividend All Cap Value II(1) | | | 81 | | | | 0 | | | | 347 | |
ASTON/Fairpointe Mid Cap | | | 147,217 | | | | 0 | | | | 3,958,705 | |
ASTON/Montag & Caldwell Mid Cap Growth | | | 6,008 | | | | 0 | | | | 17,782 | |
ASTON/TAMRO Small Cap | | | 35,578 | | | | 0 | | | | 977,343 | |
ASTON/River Road Select Value | | | 926 | | | | 0 | | | | 19,729 | |
ASTON/River Road Small Cap Value | | | 6,639 | | | | 0 | | | | 149,386 | |
ASTON/River Road Independent Value | | | 37,944 | | | | 0 | | | | 882,471 | |
ASTON/LMCG Small Cap Growth | | | 886 | | | | 0 | | | | 14,038 | |
ASTON Small Cap | | | 5,037 | | | | 0 | | | | 51,910 | |
ASTON/Silvercrest Small Cap(2) | | | 512 | | | | 0 | | | | 1,039 | |
ASTON/DoubleLine Core Plus Fixed Income | | | 10,416 | | | | 0 | | | | 94,677 | |
ASTON/TCH Fixed Income | | | 11,990 | | | | 0 | | | | 124,127 | |
ASTON/Lake Partners LASSO Alternatives | | | 3,969 | | | | 0 | | | | 57,706 | |
ASTON/Anchor Capital Enhanced Equity | | | 8,323 | | | | 0 | | | | 179,791 | |
ASTON/River Road Long-Short | | | 4,926 | | | | 0 | | | | 15,625 | |
ASTON/Barings International | | | 191 | | | | 0 | | | | 1,266 | |
ASTON/Harrison Street Real Estate | | | 2,217 | | | | 0 | | | | 17,659 | |
ASTON/Montag & Caldwell Balanced | | | 5,111 | | | | 0 | | | | 39,272 | |
(1)ASTON/River Road Dividend All Cap Value II began issuing Class N and Class I shares on June 26, 2012.
(2)ASTON/Silvercrest Small Cap began issuing Class N and and Class I shares on December 23, 2011.
| | | | | | | | | | | | | | |
| | | 12b-1 Plan Expenses | |
Fund – Class R Shares | | Printing | | | Distribution
Services | | Compensation
to Broker
Dealers | | | Compensation
to Sales
Personnel | |
ASTON/Montag & Caldwell Growth | | | $0 | | | $124 | | | $41,570 | | | | $0 | |
| | | | | | | | | | | | |
Fund – Class R Shares | | Marketing | | | Service
Providers | | | Total | |
ASTON/Montag & Caldwell Growth | | | $1,523 | | | | $0 | | | | $43,218 | |
Redemption Fees
The Trust requests that banks, broker-dealers and other intermediaries holding omnibus accounts with a Fund impose any applicable redemption fees at the shareholder account level. However, redemption fees may not apply to certain types of accounts held through intermediaries, including: (1) certain pension, profit-sharing and retirement plans; (2) certain broker wrap-fee and other fee-based programs; (3) certain omnibus accounts where the omnibus account holder does not have the system capability to impose a redemption fee on its underlying customers’ accounts; and (4) certain intermediaries that do not have, or do not report to the Funds, sufficient information to impose a redemption fee on their customers’ accounts.
In addition, redemption fees do not apply to: (i) premature distributions from retirement accounts due to the disability or health of the shareholder; (ii) minimum required distributions from retirement accounts; (iii) return of excess contributions in retirement accounts where the excess is reinvested into a
120
Fund; (iv) redemptions resulting in the settlement of an estate due to the death of the shareholder; (v) redemptions of shares purchased through an Automatic Investment Plan; (vi) redemptions as part of a systematic withdrawal plan; and (vii) reinvested distributions (dividends and capital gains). Contact your financial intermediary or refer to your plan documents for more information on how the redemption fee is applied to your shares.
In addition to the circumstances noted in the preceding paragraph, the Funds’ Administrator may waive the redemption fee at its discretion where it believes such waiver is in the best interests of a Fund and in accordance with the Funds’ policies and procedures, including, but not limited to, when it determines that imposition of the redemption fee is not necessary to deter short-term trading.
Custodian
The Bank of New York Mellon, One Wall Street, New York, NY 10286, serves as custodian of the Trust’s assets on behalf of the Funds.
Transfer Agent and Dividend Paying Agent
BNY Mellon Investment Servicing (US) Inc., 4400 Computer Drive, Westborough, MA 01581, serves as transfer agent and dividend paying agent for the Trust.
Counsel and Independent Registered Public Accounting Firm
Vedder Price P.C., with offices at 222 North LaSalle Street, Chicago, IL, 60601, serves as counsel to the Trust.
Mayer Brown LLP, with offices at 71 South Wacker Drive, Chicago, IL 60606, serves as counsel to the Independent Trustees.
Ernst & Young LLP, with offices at 155 N. Wacker Drive, Chicago, IL 60606, is the Trust’s independent registered public accounting firm.
PORTFOLIO TRANSACTIONS AND BROKERAGE COMMISSIONS
The subadvisers are responsible for decisions to buy and sell securities for the Funds, for the placement of their portfolio business and the negotiation of commissions, if any, paid on such transactions. In placing trades for a Fund, the subadvisers will follow the Trust’s policy of seeking best execution of orders under the circumstances. Securities traded in the over-the-counter market are generally traded on a net basis with dealers acting as principal for their own accounts without a stated commission. In over-the-counter transactions, orders are placed directly with a principal market-maker unless a better price and execution can be obtained by using a broker. Brokerage commissions are paid on transactions in listed securities, futures contracts and options.
The subadvisers attempt to obtain the best overall price and most favorable execution of transactions in portfolio securities. However, subject to policies established by the Board, a Fund may pay a broker-dealer a commission for effecting a portfolio transaction for a Fund in excess of the amount of commission another broker-dealer would have charged if a subadviser determines in good faith that the commission paid was reasonable in relation to the brokerage or research services provided by such broker-dealer, viewed in terms of that particular transaction or such firm’s overall responsibilities with respect to the clients, including the Fund, as to which it exercises investment discretion. In selecting and monitoring broker-dealers and negotiating commissions, consideration will be given to a broker-dealer’s
121
reliability, the quality of its execution services on a continuing basis and its financial condition, among other things. Research services furnished by broker-dealers through whom the Funds effect securities transactions may be used by the subadvisers, as the case may be, in servicing all of their respective accounts; not all such services may be used in connection with the Funds. The term “research services” may include, but is not limited to, advice as to the value of securities; the advisability of investing in, purchasing or selling securities; the availability of securities or purchasers or sellers of securities; and analyses or reports concerning issuers, industries, securities, economic factors and trends, portfolio strategy or the performance of accounts.
It is likely that the broker-dealers selected based on the foregoing considerations will include firms that also sell shares of the Funds to their customers. However, the subadvisers do not consider sales of Fund shares as a factor in the selection of broker-dealers to execute portfolio transactions for the Funds. The Trust has implemented policies and procedures reasonably designed to prevent sales of Fund shares from being considered as a factor in the selection of broker-dealers to execute portfolio transactions for the Funds.
The subadvisers effect portfolio transactions for other investment companies and advisory accounts. The subadvisers will attempt to equitably allocate portfolio transactions among the Funds and other client accounts whenever concurrent decisions are made to purchase or sell securities by the Funds and other accounts. In making such allocations between the Funds and other client accounts, the main, but not exclusive, factors to be considered are the availability of cash for investment, the duration of the portfolio, the respective investment objectives, the relative size of portfolio holdings of the same or comparable securities, the size of investment commitments generally held and the opinions of the persons responsible for recommending investments to the Funds and the others. In some cases, this procedure could have an adverse effect on the Funds. In the opinion of the subadvisers, however, the results of such procedure will generally be in the best interest of each of the clients.
122
Amounts spent on behalf of each Fund for brokerage commissions during the fiscal years ended October 31, 2012, October 31, 2011 and October 31, 2010 are set forth below.
| | | | | | | | | | | | |
Fund | | Brokerage
Commissions
FYE 2012 | | | Brokerage
Commissions
FYE 2011 | | | Brokerage
Commissions
FYE 2010 | |
ASTON/Montag & Caldwell Growth | | | $2,290,157 | | | | $2,498,421 | | | | $2,230,750 | |
ASTON/Herndon Large Cap Value(1) | | | 98,841 | | | | 55,067 | | | | 2,054 | |
ASTON/Cornerstone Large Cap Value | | | 24,164 | | | | 64,577 | | | | 150,286 | |
ASTON/TAMRO Diversified Equity(2) | | | 14,797 | | | | 25,226 | | | | 21,752 | |
ASTON/River Road Dividend All Cap Value | | | 411,338 | | | | 300,479 | | | | 148,627 | |
ASTON/River Road Dividend All Cap Value II(3) | | | 3,647 | | | | NA | | | | NA | |
ASTON/Fairpointe Mid Cap | | | 1,538,014 | | | | 858,607 | | | | 677,184 | |
ASTON/Montag & Caldwell Mid Cap Growth | | | 2,583 | | | | 1,426 | | | | 988 | |
ASTON/TAMRO Small Cap | | | 984,040 | | | | 944,692 | | | | 1,437,018 | |
ASTON/River Road Select Value | | | 119,150 | | | | 277,137 | | | | 306,128 | |
ASTON/River Road Small Cap Value | | | 267,238 | | | | 592,250 | | | | 806,045 | |
ASTON/River Road Independent Value(4) | | | 833,324 | | | | 289,100 | | | | NA | |
ASTON/LMCG Small Cap Growth(5) | | | 25,803 | | | | 16,854 | | | | NA | |
ASTON Small Cap | | | 189,289 | | | | 473,741 | | | | 587,824 | |
ASTON/Silvercrest Small Cap(6) | | | 16,732 | | | | NA | | | | NA | |
ASTON/DoubleLine Core Plus Fixed Income(7) | | | NA | | | | NA | | | | NA | |
ASTON/TCH Fixed Income | | | NA | | | | NA | | | | NA | |
ASTON/Lake Partners LASSO Alternatives(8) | | | 5,015 | | | | 4,786 | | | | 407 | |
ASTON/Anchor Capital Enhanced Equity(9) | | | 575,728 | | | | 482,737 | | | | 371,934 | |
ASTON/River Road Long-Short(10) | | | 35,912 | | | | 7,133 | | | | NA | |
ASTON/Barings International | | | 46,077 | | | | 81,379 | | | | 73,185 | |
ASTON/Harrison Street Real Estate | | | 17,137 | | | | 83,366 | | | | 51,749 | |
ASTON/Montag & Caldwell Balanced | | | 10,563 | | | | 13,895 | | | | 13,048 | |
(1)ASTON/Herndon Large Cap Value began issuing Class N shares on March 30, 2010.
(2)ASTON/TAMRO Diversified Equity’s aggregate amounts of brokerage commissions for 2010, 2011 and 2012 reflect $21,401, $24,042 and $14,184 of brokerage commissions on securities, respectively, and $351, $1,184 and $613 of brokerage commissions relating to options and short sales, respectively.
(3)ASTON/River Road Dividend All Cap Value II began issuing class N and Class I shares on June 26, 2012.
(4)ASTON/River Road Independent Value began issuing Class N shares on December 30, 2010.
(5)ASTON/LMCG Small Cap Growth began issuing Class N shares on November 2, 2010.
(6) ASTON/Silvercrest Small Cap began issuing Class N shares and Class I shares on December 23, 2011.
(7)ASTON/DoubleLine Core Plus Fixed Income began issuing Class N and Class I shares on July 15, 2011.
(8)ASTON/Lake Partners LASSO Alternatives began issuing Class I shares on March 30, 2009.
(9)ASTON/Anchor Capital Enhanced Equity’s aggregate amounts of brokerage commissions for 2010, 2011 and 2012 reflect $83,528, $96,293 and $129,040 of brokerage commissions on securities, respectively, and $288,406, $386,444 and $446,688 brokerage commissions relating to options, respectively.
(10)ASTON/River Road Long-Short began issuing Class N shares on May 3, 2011. The’s aggregate amount of brokerage commissions for 2011 and 2012 reflect $4,829 and $22,669 of brokerage commissions on securities, respectively, and $2,304 and $13,243 of brokerage commissions relating to short sales, respectively.
The aggregate dollar amount of brokerage commissions paid by certain Funds during the fiscal year ended October 31, 2012 differed materially from the aggregate amount of brokerage commissions paid by the Funds during the fiscal years ended October 31, 2011 and/or October 31, 2010 generally as a result of a significant change in net assets and/or a change in portfolio turnover.
There were no brokerage commissions paid by the Funds to any affiliates of the Funds or the Adviser or the subadvisers during the fiscal years ended October 31, 2012, October 31, 2011 and October 31, 2010.
As of October 31, 2012 the following Funds owned securities of their regular brokers or dealers, as defined in Rule 10b-1 under the 1940 Act, with the following market values:
123
| | | | |
Fund | | Broker Dealer | | Market Value |
ASTON/TAMRO Diversified Equity Fund | | JPMorgan Chase & Co. | | 463,607 |
ASTON/Cornerstone Large Cap Value Fund | | Morgan Stanley Citigroup | | 858,138
1,281,542 |
ASTON/LMCG Small Cap Growth Fund | | Stifel, Nicolaus & Co, Inc | | 59,406 |
ASTON/Anchor Capital Enhanced Equity Fund | | Bank of America | | 2,435,400* |
ASTON/Montag & Caldwell Balanced Fund | | JPMorgan Chase & Co. | | 503,449 |
ASTON/DoubleLine Core Plus Fixed Income Fund | | Bank of America/Merrill Lynch Citigroup JPMorgan Chase & Co./Bear Stearns Credit Suisse Barclays Bank/Lehman Brothers Commercial Mtg Morgan Stanley | | 3,720,976
2,749,948 4,308,714 3,548,639 277,328 2,337,618 |
ASTON/TCH Fixed Income Fund | | Bank of America/Merril Lynch JPMorgan Chase & Co./Bear Stearns Morgan Stanely | | 906,215
600,649 556,219 |
*Includes underlying security of written option value of $198,600.
Payments to Intermediaries
A financial intermediary may offer different classes of shares to its customers and differing services to the classes, and thus, receive compensation with respect to different classes. Intermediaries may also charge separate fees to their customers. Intermediaries that distribute Fund shares and/or provide sub-transfer agency, sub-accounting and/or shareholder services for Fund shareholder accounts may be compensated by the Adviser, in addition to any payments made by the Distributor under a Plan. These additional payments may be subject to reimbursement by the Funds, as described below, and/or they may be made by the Adviser out of its own assets, and not as additional charges to the Funds. The Funds may reimburse the Adviser for payments made to certain intermediaries that provide sub-transfer agency, sub-accounting and/or shareholder services to Fund shareholder accounts in an amount of up to 0.09% annually of a Fund’s average daily net assets. In addition, the Adviser may compensate intermediaries out of its own assets, and not as additional charges to the Funds, for providing distribution-related services to the Funds and/or services to Fund shareholder accounts, which may include, without limitation: 1) the sale of Fund shares, 2) sub-transfer agency, sub-accounting, administrative and shareholder processing services, and 3) marketing support, access to a third party platform, fund offering list or other marketing programs and/or “shelf space.” Payments in connection with marketing programs may include, but are not limited to, inclusion of a Fund on preferred or recommended sales lists, mutual fund “supermarket” platforms and other formal sales programs granting access to the intermediary’s sales force and obtaining other forms of marketing support. Additional payments may be a fixed dollar amount; may be based on the number of customer accounts maintained by the intermediary; may be based on a percentage of the value of shares sold to, or held by, customers of the intermediary involved; or may be calculated on another basis. Payments that are in addition to payments made by the Distributor under a Plan may represent a premium over payments made by other fund families, and intermediary investment professionals may have an added incentive to sell or recommend a Fund or share class over others offered by competing fund families. These payments may differ for each Fund within the Aston family of funds, including within the same intermediary or within the same Fund at the same intermediary, or for the same Fund across certain intermediaries.
A number of factors are considered in determining whether to make additional payments. Such factors may include, without limitation, the level or type of services provided by the intermediary, the
124
level or expected level of assets or sales of shares, the Fund’s status on a preferred or recommended fund list, access to an intermediary’s personnel, and other factors. In addition to such payments, the Adviser may offer other incentives, including sponsorship of intermediary and third-party sponsored educational seminars or other events for investment professionals and clients, and payment or reimbursement of expenses, including but not limited to meals and hotel accommodations, incurred by intermediary investment professionals in connection with certain meetings held by the Trust or the Adviser for the purpose of training or education of such intermediary investment professionals.
Portfolio Turnover
The portfolio turnover rate for each of the Funds is calculated by dividing the lesser of purchases or sales of portfolio investments for the reporting period by the monthly average value of the portfolio investments owned during the reporting period. The calculation excludes any in-kind transfers of securities into or out of the Funds, as well as all securities, including options, and short sales, whose maturities or expiration dates at the time of acquisition are one year or less. Portfolio turnover may vary greatly from year to year as well as within a particular year and may be affected by cash requirements for redemption of shares and by requirements which must be met for the Funds to receive favorable federal income tax treatment. Portfolio turnover is generally not expected to exceed 100% in the Funds, except for ASTON Small Cap Fund, ASTON/Barings International Fund, ASTON/Lake Partners LASSO Alternatives Fund, ASTON/River Road Long-Short Fund and ASTON/Harrison Street Real Estate Fund. A high portfolio turnover rate (i.e., over 100%) may result in the realization of substantial net short-term capital gains and involves correspondingly greater transaction costs. Distributions derived from net short-term capital gains of a Fund (i.e., net short-term capital gain in excess of net long-term capital loss) are taxable to shareholders as ordinary income for federal income tax purposes. To the extent that net long-term capital gains (i.e., net long-term capital gain in excess of net short-term capital loss) are realized, distributions derived from such gains are generally treated as capital gain dividends for federal income tax purposes and taxed to shareholders as long-term capital gain.
The portfolio turnover rate for each Fund for its most recent fiscal period may be found under “FINANCIAL HIGHLIGHTS” in each Fund’s Prospectus. The portfolio turnover rate for each of ASTON/Herndon Large Cap Value Fund and ASTON/Harrison Street Real Estate Fund varied significantly between fiscal year 2011 and fiscal year 2010 due to managing the Funds’ portfolios during periods of extremely high market volatility. The portfolio turnover rate for each of ASTON/LMCG Small Cap Growth Fund, ASTON/River Road Independent Value Fund and ASTON/River Road Long-Short Fund each exceeded 100% because each Fund commenced operations during the fiscal year ended October 31, 2011. The portfolio turnover rate for ASTON/Herndon Large Cap Value Fund, ASTON/DoubleLine Core Plus Fixed Income Fund, ASTON/River Road Long-Short Fund and ASTON/Harrison Street Real Estate Fund, varied significantly between fiscal year 2012 and 2011. For the ASTON/Herndon Large Cap Value Fund the significant decrease in portfolio turnover was primarily due to lower market volatility during the 2012 fiscal year. For the ASTON/DoubleLine Core Plus Fixed Income Fund the significant increase in portfolio turnover was primarily due to the growth of the Fund as well as increased trading in government securities. For the ASTON/River Road Long-Short Fund the significant decrease in portfolio turnover was primarily because the Fund commenced operations during the fiscal year ended October 31, 2011. For the ASTON/Harrison Street Real Estate Fund the significant decrease in portfolio turnover was primarily due to a change in the Fund’s subadviser during the fiscal year ended October 31, 2011.
125
DISCLOSURE OF PORTFOLIO HOLDINGS
Except for ASTON/TAMRO Small Cap Fund, ASTON/River Road Long-Short Fund and ASTON/Fairpointe Mid Cap Fund, each Fund’s complete portfolio holdings as of the end of each calendar month are generally posted on the Funds’ website, www.astonfunds.com, on or about the fifteenth day after the month-end. Complete portfolio holdings for ASTON/TAMRO Small Cap Fund, ASTON/River Road Long-Short Fund and ASTON/Fairpointe Mid Cap Fund are made available as of the end of each calendar quarter and are generally posted on the Funds’ website on or about the fifteenth day after the quarter-end. Portfolio holdings are made available to investors and to intermediaries selling Fund shares only after their public disclosure.
The Trust’s policies and procedures governing disclosure of portfolio holdings permit nonpublic portfolio holdings to be shared with the Funds’ service providers and others who generally need access to such information in the performance of their contractual duties and responsibilities, including the Trust’s custodian, pricing services, fund accountants, Adviser, subadvisers, Administrator, Subadministrator, independent public accountants, attorneys, officers and Trustees and each of their respective affiliates and advisers, and are subject to duties of confidentiality, including a duty not to trade on nonpublic information. Nonpublic portfolio holdings may also be disclosed by the Funds or their duly authorized service providers to certain third parties, including mutual fund evaluation services, rating agencies, lenders or providers of borrowing facilities, provided that (i) a good faith determination is made that the Funds have a legitimate business purpose to provide the information and the disclosure is in the Funds’ best interests; (ii) the recipient agrees not to distribute the portfolio holdings or the results of any related analysis to third parties, other departments, or persons who are likely to use the information for purposes of purchasing or selling shares of the Funds prior to the portfolio holdings becoming public information; and (iii) the recipient is subject to an obligation to maintain such information confidential. These conditions do not apply to portfolio holdings released to such third parties after they have been posted on the website.
Disclosure of the Funds’ portfolio holdings as an exception to the Trust’s policies and procedures must be approved by the CCO or Chief Executive Officer of the Trust. No compensation or other consideration is received by the Trust or any affiliates of the Trust for disclosure of portfolio holdings. The Board receives reports of any potential exceptions to, or violations of, the Trust’s policies and procedures governing disclosure of portfolio holdings that are deemed to constitute a material compliance matter. The CCO or his designee is responsible for monitoring compliance with these procedures, including requesting information from service providers.
Each Fund discloses its portfolio holdings to the extent required by law.
126
DESCRIPTION OF SHARES
The table below summarizes the class(es) of shares that each Fund offers.
| | | | | | |
Fund | | Class N | | Class I | | Class R |
ASTON/Montag & Caldwell Growth | | • | | • | | • |
ASTON/Herndon Large Cap Value | | • | | • | | |
ASTON/Cornerstone Large Cap Value | | • | | • | | |
ASTON/TAMRO Diversified Equity | | • | | • | | |
ASTON/River Road Dividend All Cap Value | | • | | • | | |
ASTON/River Road Dividend All Cap Value II | | • | | • | | |
ASTON/Fairpointe Mid Cap | | • | | • | | |
ASTON/Montag & Caldwell Mid Cap Growth | | • | | | | |
ASTON/TAMRO Small Cap | | • | | • | | |
ASTON/River Road Select Value | | • | | • | | |
ASTON/River Road Small Cap Value | | • | | • | | |
ASTON/River Road Independent Value | | • | | • | | |
ASTON/LMCG Small Cap Growth | | • | | • | | |
ASTON Small Cap | | • | | • | | |
ASTON/Silvercrest Small Cap | | • | | • | | |
ASTON/DoubleLine Core Plus Fixed Income | | • | | • | | |
ASTON/TCH Fixed Income | | • | | • | | |
ASTON/Lake Partners LASSO Alternatives | | • | | • | | |
ASTON/Anchor Capital Enhanced Equity | | • | | • | | |
ASTON/River Road Long-Short | | • | | • | | |
ASTON/Barings International | | • | | • | | |
ASTON/Harrison Street Real Estate | | • | | • | | |
ASTON/Montag & Caldwell Balanced | | • | | • | | |
Each Fund is authorized to issue an unlimited number of shares of beneficial interest without par value. Currently, there are three classes of shares issued by the Funds. Class N, I and R shares are not subject to an initial sales charge or a contingent deferred sales charge. Class N shares have a 12b-1 fee with a maximum annual fee of 0.25% of average daily net assets. Class R shares are subject to a 12b-1 fee with a maximum annual fee of 0.50% of average daily net assets. Because each class has different expenses, performance will vary. Shares of each Fund represent equal proportionate interests in the assets of that Fund only and have identical voting, dividend, redemption, liquidation and other rights, except that Class I shares have no rights with respect to a Fund’s Plan. All shares issued are fully paid and non-assessable, and shareholders have no preemptive or other right to subscribe to any additional shares and no conversion rights.
Minimum Initial Investments
The minimum initial investment for Class N and Class R shares is $2,500 for each Fund, and the subsequent minimum investment is $50. The minimum initial investment for the Class N shares of each Fund by Individual Retirement Accounts, Education Savings Accounts and Uniform Gift to Minor Accounts/Uniform Transfer to Minor Accounts is $500. The subsequent minimum investment for each account type is $50.
The minimal initial investment for Class I shares is $1,000,000, with the exception of ASTON/Lake Partners LASSO Alternatives Fund, ASTON/DoubleLine Core Plus Fixed Income Fund and ASTON/River Road Dividend All Cap Value Fund II, which is $100,000.
127
For purposes of the investment minimum, the balances of Fund accounts of clients of a financial consultant may be aggregated in determining whether the minimum investment has been met. This aggregation may also be applied to the accounts of immediate family members (i.e., a person’s spouse, parents, children, siblings and in-laws). In addition, the aggregation may be applied to the related accounts of a corporation or other legal entity. The Funds may waive the minimum initial investment by obtaining a letter of intent, evidencing an investor’s intention of meeting the minimum initial investment in a specified period of time as continually reviewed and approved by the Board. The minimum investment requirement may be waived for Trustees of the Trust and employees of the Adviser and their spouses, employees of the subadvisers and their spouses, and affiliates of the Adviser. The minimum investment requirement may be waived for certain omnibus accounts, mutual fund advisory platforms and registered investment advisors, banks, trust companies or similar financial institutions investing for their own account or for the account of their clients or customers for whom such institution is exercising investment discretion, or otherwise acting on behalf of clients or customers. The minimum investment requirement may be waived for individual accounts of a financial intermediary that charges an ongoing fee for its services or offers shares through a no-load network or platform, and for accounts invested through fee-based advisory accounts, certain “wrap” programs and similar programs with approved intermediaries. The Trust reserves the right to waive a Fund’s minimum initial investment requirement for any reason.
There is no sales load or charge in connection with the purchase of shares. The Trust reserves the right to reject any purchase order and to suspend the offering of shares of the Funds. The Funds also reserve the right to change the initial and subsequent investment minimums.
Anti-Money Laundering Laws
The Funds are required to comply with various federal anti-money laundering laws and regulations. Consequently, a Fund may be required to “freeze” the account of a shareholder if the shareholder appears to be involved in suspicious activity or if certain account information matches information on government lists of known terrorists or other suspicious persons, or the Fund may be required to transfer the account or proceeds of the account to a government agency.
Customer Identification Program
Federal law requires the Funds to obtain, verify and record identifying information for each investor who opens or reopens an account with Aston Funds. An investor may be an individual or a person other than an individual (such as a corporation, partnership or trust). Such identifying information may include the name, residential or business street address, principal place of business, local office or other physical location (for a person other than an individual), date of birth (for an individual), social security or taxpayer identification number or other identifying information. Applications without the required information, or without any indication that a social security or taxpayer identification number has been applied for, may not be accepted. After acceptance, to the extent permitted by applicable law or its customer identification program, Aston Funds reserves the right (a) to place limits on transactions in any account until the identity of the investor is verified; or (b) to refuse an investment in Aston Funds or to involuntarily redeem an investor’s shares at the current share price and close an account in the event that an investor’s identity is not verified within 90 days regardless of the type of account. This may cause shares in the investor’s account to be redeemed at a loss. You may be subject to taxes if Aston Funds liquidates your account due to insufficient information as it relates to customer identification procedures. Aston Funds and its agents will not be responsible for any loss or adverse tax effect in an investor’s account resulting from the investor’s delay in providing all required identifying information or from closing an account and redeeming an investor’s shares when an investor’s identity cannot be verified.
128
Voting Rights
Each issued and outstanding full and fractional share of a Fund is entitled to one full and fractional vote. Shares of a Fund participate equally in regard to dividends, distributions and liquidations with respect to that Fund subject to preferences (such as 12b-1 fees), rights or privileges of any share class. Shareholders have equal non-cumulative voting rights. Class N and Class R shares have exclusive voting rights with respect to the Plans for their class. On any matter submitted to a vote of shareholders, shares of each Fund will vote separately except when a vote of shareholders in the aggregate is required by law, or when the Trustees have determined that the matter affects the interests of more than one Fund, in which case the shareholders of all such Funds shall be entitled to vote thereon.
Shareholder Meetings
The Board does not intend to hold annual meetings of shareholders of the Funds. The Trust Instrument provides that the Board will call a meeting for the purpose of voting upon the question of removal of any Trustee when requested to do so by shareholders owning not less than 10% of the outstanding shares of the Funds entitled to vote. In addition, subject to certain conditions, shareholders of the Funds may apply to the Trust to communicate with other shareholders to request a shareholders’ meeting to vote upon the removal of a Trustee.
Certain Provisions of the Trust Instrument
Under Delaware law, the shareholders of the Funds will not be personally liable for the obligations of any Fund; a shareholder is entitled to the same limitation of personal liability extended to shareholders of corporations. To guard against the risk that Delaware law might not be applied in other states, the Trust Instrument requires that every written obligation of the Trust or a Fund contain a statement that such obligation may only be enforced against the assets of the Trust or Fund and provides for indemnification out of Trust or Fund property of any shareholder nevertheless held personally liable for Trust or Fund obligations.
Expenses
Expenses attributable to the Trust, but not to a particular Fund, will be allocated to each Fund on the basis of relative net assets of the Funds. Similarly, expenses attributable to a particular Fund, but not to a particular class thereof, will be allocated to each class of such Fund on the basis of relative net assets of the classes. General Trust expenses may include but are not limited to: insurance premiums, Trustee fees, expenses of maintaining the Trust’s legal existence and fees of industry organizations. General Fund expenses may include but are not limited to: audit fees, brokerage commissions, registration of Fund shares with the SEC, fees to the various state securities commissions, printing and postage expenses related to preparing and distributing required documents such as shareholder reports, prospectuses and proxy statements to current shareholders, fees of the Funds’ custodian, Administrator, Subadministrator, transfer agent and other service providers, including reimbursement to the Adviser for payments made to third-party service providers that provide sub-transfer agency, sub-accounting and/or shareholder services for shareholder accounts, and costs of obtaining quotations of portfolio securities and pricing of Fund shares. Class-specific expenses relating to distribution and service fee payments associated with a Plan for a particular class of shares and other costs relating to implementing or amending such Plan (including obtaining shareholder approval of such Plan or any amendment thereto) will be borne solely by shareholders of such class. Other fees and expense that may differ between classes may include but are not limited to, litigation or other legal expenses relating to a specific class, and expenses incurred as a result of matters relating to a specific class.
129
Notwithstanding the foregoing, the Adviser or other service providers may waive or reimburse the fees and expenses of a specific Fund or a class or classes to the extent permitted under Rule 18f-3 under the 1940 Act.
NET ASSET VALUE
The net asset value per share of each Fund is computed as of the close of the regular trading session on the NYSE on each day the NYSE is open for trading, typically 4:00 p.m. Eastern time. The NYSE is closed on New Year’s Day, Martin Luther King Jr. Day, Presidents’ Day, Good Friday, Memorial Day, Independence Day, Labor Day, Thanksgiving Day and Christmas Day.
The net asset value per share is computed by adding the value of all securities and other assets in the portfolio, deducting any liabilities (expenses and fees are accrued daily) and dividing by the number of shares outstanding. The equity portfolio securities of each Fund listed or traded on a national securities exchange or reported on the NASDAQ National Market System are valued at the last sale price or NASDAQ Official Closing Price, when appropriate. If no last sale price or NASDAQ Official Closing Price, when appropriate, is reported, the mean of the last bid and asked prices may be used. Securities traded over-the-counter are priced at the mean of the latest bid and asked prices. When market quotations are not readily available or are deemed unreliable, securities and other assets are valued at fair value as determined by the Adviser in accordance with guidelines adopted by the Board.
Fixed income securities are valued using evaluated prices obtained from independent pricing services in accordance with guidelines adopted and periodically reviewed by the Board. Options, futures and options on futures are valued at the settlement price as determined by the appropriate clearing corporation.
Quotations of foreign securities denominated in foreign currency are converted to U.S. dollar equivalents using foreign exchange quotations received from independent dealers. The calculation of the net asset value of each Fund may not take place contemporaneously with the determination of the prices of certain portfolio securities of foreign issuers used in such calculation. Further, under the Trust’s procedures, the prices of foreign securities are determined using information derived from pricing services and other sources. Information that becomes known to the Trust or its agents after the time that net asset value is calculated on any Business Day may be assessed in determining net asset value per share after the time of receipt of the information, but will not be used to retroactively adjust the price of the security so determined earlier or on a prior day. Events affecting the values of portfolio securities that occur between the time their prices are determined and the close of regular trading on the NYSE (normally 4:00 p.m., Eastern time) may not be reflected in the calculation of net asset value. If events materially affecting the value of such securities occur during such period, then these securities may be valued at fair value as determined by the Adviser and subadvisers in accordance with guidelines adopted by the Board. Under the fair valuation procedures adopted by the Board, certain Funds may rely primarily on the services of a third party pricing service to determine fair value prices for foreign securities if certain market events occur.
REDEMPTIONS-IN-KIND
Larger redemptions may be detrimental to a Fund’s existing shareholders. While each Fund intends to pay all sales proceeds in cash, the Trust, on behalf of each Fund, reserves the right to honor any request for redemption in excess of $250,000 during any 90-day period by making payment in whole or in part in the form of certain securities of the Fund chosen by the Fund and valued the same way as they are valued for purposes of computing the Fund’s net asset value. This is called “redemption-in-kind.” A shareholder may need to pay certain sales charges related to a redemption-in-kind, such as brokerage commissions, when the securities are sold. For shares that are not held in a tax deferred account,
130
redemptions-in-kind are taxable for federal income tax purposes in the same manner as when sales proceeds are paid in cash.
DIVIDENDS
Income dividends and capital gain distributions are reinvested automatically in additional shares at net asset value, unless you elect to receive them in cash. Distribution options may be changed at any time by requesting a change in writing. Any check in payment of dividends or other distributions which cannot be delivered by the Post Office or which remains uncashed for a period of more than one year may be reinvested in the shareholder’s account at the then current net asset value and the dividend option may be changed from cash to reinvest. Dividends are reinvested on the ex-dividend date at the net asset value determined at the close of business on that date. Please note that shares purchased shortly before the record date for a dividend or distribution may have the effect of returning capital, although such dividends and distributions are subject to federal income taxes in the same manner as other distributions.
FEDERAL INCOME TAXES
The following is intended to be a general summary of certain federal income tax consequences of investing in the Funds. It is not intended as a complete discussion of all such consequences or a discussion of circumstances applicable to certain types of shareholders. Investors are therefore advised to consult their tax advisors before making an investment decision.
Fund Taxation
Each Fund intends to qualify or to continue to qualify each year as a regulated investment company (“RIC”) under the Internal Revenue Code of 1986, as amended (the “Code”). In order to so qualify, a Fund must, among other things, (i) derive at least 90% of its gross income from dividends, interest, payments with respect to certain securities loans, gains from the sale or other disposition of stock, securities or foreign currencies, other income (including but not limited to gains from options, futures or forward contracts) derived with respect to its business of investing in such stock, securities or currencies and net income derived from interests in qualified publicly traded partnerships, (ii) distribute at least 90% of its dividend, interest and certain other taxable income each year and 90% of its net tax-exempt income, and (iii) at the end of each fiscal quarter (a) maintain at least 50% of the value of its total assets in cash and cash items, U.S. government securities, securities of other RICs, and other securities of issuers which represent, with respect to each issuer, no more than 5% of the value of the Fund’s total assets and 10% of the outstanding voting securities of such issuer, and (b) have no more than 25% of the value of its total assets invested in the securities (other than those of the U.S. government or other RICs) of any one issuer or of two or more issuers which the Fund controls and which are engaged in the same, similar or related trades and businesses or in the securities of one or more qualified publicly traded partnerships. The requirements for qualification as a RIC may significantly limit the extent to which a Fund may invest in some investments, including certain commodity ETFs and commodity-linked investments.
To the extent that a Fund qualifies for treatment as a RIC, it will not be subject to federal income tax on income and gains paid to shareholders in the form of dividends or capital gains distributions.
A federal excise tax at the rate of 4% will be imposed on the excess, if any, of a Fund’s “required distribution” over actual distributions in any calendar year. Generally, the “required distribution” is 98% of a Fund’s ordinary income for the calendar year plus 98.2% of its capital gain net income recognized
131
during the one-year period ending on October 31 plus undistributed amounts from prior years. Each Fund intends to make distributions sufficient to avoid imposition of the excise tax.
If a Fund invests in certain pay-in-kind securities, zero coupon securities, deferred interest securities or, in general, any other securities with original issue discount (or with market discount if the Fund elects to include market discount in income currently), the Fund must accrue income on such investments for each taxable year, which generally will be prior to the receipt of the corresponding cash payments. However, a Fund must distribute to shareholders, at least annually, all or substantially all of its investment company taxable income (determined without regard to the deduction for dividends paid), including such accrued income, to avoid federal income and excise taxes. Therefore, a Fund may have to dispose of its portfolio securities under disadvantageous circumstances to generate cash, or may have to leverage itself by borrowing the cash, to satisfy these distribution requirements.
A Fund may acquire market discount bonds. A market discount bond is a security acquired in the secondary market at a price below its redemption value (or its adjusted issue price if it is also an original issue discount bond). If a Fund invests in a market discount bond, it generally will be required to treat any gain recognized on the disposition of such market discount bond as ordinary income (instead of capital gain) to the extent of the accrued market discount, unless the Fund elects to include the market discount in income as it accrues.
A Fund’s investment in lower-rated or unrated debt securities may present issues for the Fund if the issuers of these securities default on their obligations because the federal income tax consequences to a holder of such securities are not certain.
A Fund’s transactions, if any, in forward contracts, options, futures contracts and hedged investments may be subject to special provisions of the Code that, among other things, may affect the character of gain and loss realized by a Fund (i.e., may affect whether gain or loss is ordinary or capital), accelerate recognition of income to a Fund, defer a Fund’s losses, and affect whether capital gain and loss is characterized as long-term or short-term. These rules could therefore affect the character, amount and timing of distributions to shareholders. These provisions also may require a Fund to mark-to-market certain types of positions (i.e., treat them as if they were closed out), which may cause a Fund to recognize income without receiving cash with which to make distributions in amounts necessary to satisfy the distribution requirements for avoiding federal income and excise taxes. The Funds will monitor their transactions, make the appropriate tax elections, and make the appropriate entries in their books and records when they acquire any option, futures contract, forward contract, or hedged investment in order to mitigate the effect of these rules, prevent disqualification of the Fund as a RIC, and minimize the imposition of federal income and excise taxes.
If an option which a Fund has written expires on its stipulated expiration date, the Fund recognizes a short-term capital gain. If a Fund enters into a closing purchase transaction with respect to an option which the Fund has written, the Fund realizes a short-term capital gain (or loss if the cost of the closing transaction exceeds the premium received when the option was sold) without regard to any unrealized gain or loss on the underlying security, and the liability related to such option is extinguished. If a call option which a Fund has written is exercised, the Fund realizes a capital gain or loss from the sale of the underlying security and the proceeds from such sale are increased by the premium originally received.
If an option which a Fund has purchased expires on the stipulated expiration date, the Fund realizes a short-term or long-term capital loss for federal income tax purposes in the amount of the cost of the option. If a Fund exercises a put option, it realizes a capital gain or loss (long-term or short-term, depending on the holding period of the underlying security) from the sale of the underlying security which will be decreased by the premium originally paid.
132
Options held by a Fund at the end of each fiscal year on a broad-based stock index are treated under the Code as Section 1256 contracts and will be required to be “marked-to-market” (i.e., treated as if they were sold) for federal income tax purposes. Sixty percent of any net gain or loss recognized on such deemed sales or on any actual sales will be treated as long-term capital gain or loss, and the remainder will be treated as short-term capital gain or loss (“60/40 gain or loss”). Certain other options, futures contracts and options on futures contracts utilized by the Funds are also Section 1256 contracts. These Section 1256 contracts held by the Funds at the end of each taxable year (and on October 31 of each year for purposes of the 4% excise tax) are also “marked-to-market” with the result that unrealized gains or losses are treated as though they were realized and the resulting gain or loss, together with the gain or loss on actual sales, is treated as a 60/40 gain or loss.
A Fund’s entry into a short sale transaction, an option or certain other transactions could be treated as the constructive sale of an appreciated financial position, causing a Fund to realize gain, but not loss, on the position.
The application of certain requirements for qualification as a RIC and the application of certain other federal income tax rules may be unclear in some respects in connection with investments in certain derivatives and other investments. As a result, a Fund may be required to limit the extent to which it invests in such investments and it is also possible that the Internal Revenue Service (the “IRS”) may not agree with a Fund’s treatment of such investments. In addition, the tax treatment of derivatives and certain other investments may be affected by future legislation, Treasury Regulations and guidance issued by the IRS (which could apply retroactively) that could affect the timing, character and amount of a Fund’s income and gains and distributions to shareholders, affect whether a Fund has made sufficient distributions and otherwise satisfied the requirements to maintain its qualification as a RIC and avoid federal income and excise taxes or limit the extent to which a Fund may invest in certain derivatives and other investments in the future.
Generally, the character of the income or capital gains that a Fund receives from another investment company will pass through to a Fund’s shareholders as long as a Fund and the other investment company each qualify as RICs. However, to the extent that another investment company that qualifies as a RIC realizes net losses on its investments for a given taxable year, a Fund will not be able to recognize its share of those losses until it disposes of shares of such investment company. Moreover, even when a Fund does make such a disposition, a portion of its loss may be recognized as a long-term capital loss, which will not be treated as favorably for federal income tax purposes as an ordinary deduction. In particular, a Fund will not be able to offset any capital losses from its dispositions of shares of other investment companies against its ordinary income. As a result of the foregoing rules, and certain other special rules, it is possible that the amounts of net investment income and net capital gains that a Fund will be required to distribute to shareholders will be greater than such amounts would have been had a Fund invested directly in the securities held by the investment companies in which it invests, rather than investing in shares of the investment companies. For similar reasons, the character of distributions from a Fund (e.g., long-term capital gain, qualified dividend income, etc.) will not necessarily be the same as it would have been had a Fund invested directly in the securities held by the investment companies in which it invests.
A Fund may invest to a limited degree in MLPs and ETFs that are treated as qualified publicly traded partnerships for federal income tax purposes. Net income derived from an interest in a qualified publicly traded partnership is included in the sources of income from which a RIC may derive 90% of its gross income. However, no more than 25% of the value of a RIC’s total assets at the end of each fiscal quarter may be invested in securities of qualified publicly traded partnerships. If an MLP or ETF in which a Fund invests is taxed as a partnership for federal income tax purposes, the Fund will be taxable on its allocable share of the MLP’s or ETF’s income regardless of whether the Fund receives any distribution
133
from the MLP or ETF. Thus, a Fund may be required to sell other securities in order to satisfy the distribution requirements to qualify as a RIC and to avoid federal income and excise taxes. Distributions to a Fund from an MLP or ETF that is taxed as a partnership for federal income tax purposes will constitute a return of capital to the extent of the Fund’s basis in its interest in the MLP or ETF. If a Fund’s basis is reduced to zero, distributions will constitute capital gain for federal income tax purposes.
Distributions from royalty income trusts will be treated as dividend income eligible under the 90% income test described above if the trust is treated as a corporation for U.S. federal income tax purposes. A Fund will invest only in royalty income trusts that are expected to be treated as corporations for U.S. federal income tax purposes.
Under the Code, gains or losses attributable to fluctuations in exchange rates which occur between the time a Fund accrues income or other receivables or accrues expenses or other liability denominated in a foreign currency and the time the Fund actually collects such receivable or pays such liabilities generally are treated as ordinary income or loss. Similarly, on disposition of debt securities denominated in a foreign currency and on disposition of certain other instruments, gains or losses attributable to fluctuations in the value of the foreign currency between the date of acquisition of the security or contract and the date of disposition also may be treated as ordinary gain or loss. These gains and losses, referred to under the Code as “Section 988” gains or losses, may increase or decrease the amount of a Fund’s investment company taxable income to be distributed to its shareholders as ordinary income.
If a Fund receives an “excess distribution” with respect to the stock of a passive foreign investment company (“PFIC”), the Fund itself may be subject to federal income tax on a portion of the excess distribution, whether or not the corresponding income is distributed by the Fund to shareholders. In general, a foreign corporation is classified as a PFIC for a taxable year if at least 50% of its assets constitute certain investment-type assets or 75% or more of its gross income is certain investment-type income.
Under the PFIC rules, an excess distribution is treated as having been realized ratably over the period during which the Funds held the PFIC stock. A Fund itself will be subject to U.S. federal income tax (including interest) on the portion, if any, of an excess distribution that is so allocated to prior taxable years. Certain distributions from a PFIC as well as gain from the sale of PFIC stock are treated as excess distributions. Excess distributions are characterized as ordinary income even though, absent application of the PFIC rules, certain excess distributions might have been classified as capital gain.
Rather than being taxed on the PFIC income as discussed above, a Fund may be eligible to elect alternative tax treatment. Under an election that currently is available in certain circumstances, a Fund generally would be required to include in its gross income its share of the PFIC’s income and net capital gain annually, regardless of whether distributions are received from the PFIC in a given year. In addition, another election may be available that would involve marking to market a Fund’s PFIC shares at the end of each taxable year (and on certain other dates prescribed in the Code), with the result that unrealized gains are treated as though they were realized and treated as ordinary income or loss (subject to certain limitations). If this election were made, federal income tax at the Fund level under the PFIC rules would generally be eliminated, but the Fund could, in limited circumstances, incur nondeductible interest charges. A Fund’s intention to qualify annually as a RIC may limit its options with respect to PFIC shares.
Because the application of the PFIC rules may affect, among other things, the character of gains and the amount of gain or loss and the timing of the recognition of income with respect to PFIC shares, and may subject a Fund itself to tax on certain income from PFIC shares, the amount that must be
134
distributed to shareholders and that will be taxed to shareholders as ordinary income or long-term capital gain may be increased or decreased as compared to a fund that did not invest in PFIC shares.
A Fund’s investments in REITs may result in the Fund’s receipt of cash in excess of the REIT’s earnings; if the Fund distributes these amounts, these distributions could constitute a return of capital to Fund shareholders for federal income tax purposes. Investments in REIT equity securities also may require a Fund to accrue and distribute income not yet received. To generate sufficient cash to make the requisite distributions, a Fund may be required to sell securities in its portfolio (including when it is not advantageous to do so) that it otherwise would have continued to hold. Dividends received by a Fund from a REIT will not qualify for the corporate dividends-received deduction and generally will not constitute qualified dividend income (see “Shareholder Taxation” below).
The Funds may invest in REITs that hold residual interests in real estate mortgage investment conduits (“REMICs”). Under a notice issued by the IRS, a portion of a Fund’s income from a REIT (or other pass-through entity) that is attributable to a residual interest in a REMIC (referred to in the Code as an “excess inclusion”) will be subject to federal income tax in all events. The notice provides that excess inclusion income of a RIC, such as a Fund, will be allocated to shareholders of the RIC in proportion to the dividends received by such shareholders, with the same consequences as if the shareholders held the related REMIC residual interest directly. In general, excess inclusion income allocated to shareholders (a) cannot be offset by net operating losses (subject to a limited exception for certain thrift institutions), (b) will constitute unrelated business taxable income to entities (including a qualified pension plan, an individual retirement account, a 401(k) plan, a Keogh plan or other tax-exempt entity) subject to tax on unrelated business income, thereby potentially requiring such an entity that is allocated excess inclusion income, and otherwise might not be required to file a federal income tax return, to file a tax return and pay tax on such income, and (c) in the case of a foreign shareholder, will not qualify for any reduction in U.S. federal withholding tax. In addition, if at any time during any taxable year a “disqualified organization” (as defined by the Code) is a record holder of a share in a RIC, then the RIC will be subject to a tax equal to that portion of its excess inclusion income for the taxable year that is allocable to the disqualified organization, multiplied by the highest federal income tax rate imposed on corporations.
Shareholder Taxation
Shareholders will be subject to federal income taxes on distributions made by the Funds whether received in cash or additional shares of the Funds. Distributions of net investment income (including any net short-term capital gain in excess of any net long-term capital loss), other than “qualified dividend income,” if any, will be taxable to shareholders as ordinary income. Distributions of qualified dividend income, as such term is defined in Section 1(h)(11) of the Code (generally dividends received from U.S. domestic corporations and certain qualified foreign corporations), by a Fund to its noncorporate shareholders generally will be taxed at the federal income tax rates applicable to net capital gain, provided certain holding period and other requirements described below are satisfied. Dividends received from REITs and certain foreign corporations generally will not constitute qualified dividend income. Distributions of net capital gain (the excess of net long-term capital gains over net short-term capital losses), if any, will be taxable to shareholders as long-term capital gain without regard to how long a shareholder has held shares of a Fund. Long-term capital gains are generally taxable to individuals and other noncorporate taxpayers at a maximum federal income tax rate of 15%, except that a 20% rate applies to taxpayers with taxable income exceeding certain thresholds. Dividends paid by a Fund may also qualify in part for the 70% dividends-received deduction available to corporate shareholders, provided that certain holding period and other requirements under the Code are satisfied. Generally, however, dividends received from most REITs and on stocks of foreign issuers are not eligible for the dividends-received deduction when distributed to the Funds’ corporate shareholders.
135
To be eligible for treatment as qualified dividend income, shareholders generally must hold their shares for more than 60 days during the 121-day period beginning 60 days before the ex-dividend date. In order for dividends received by a Fund’s shareholders to be treated as qualified dividend income, a Fund must also meet holding period and other requirements with respect to such dividend paying stocks it owns. A dividend will not be treated as qualified dividend income at the Fund level if the dividend is received with respect to any share of stock held for 60 days or fewer during the 121-day period beginning on the date which is 60 days before the date on which such share becomes ex-dividend with respect to such dividend (or, in the case of certain preferred stock, 90 days or fewer during the 181-day period beginning 90 days before such date). In addition to the above holding period requirements, a dividend will not be treated as qualified dividend income (at either the Fund or shareholder level), (1) to the extent that the recipient is under an obligation (whether pursuant to a short sale or otherwise) to make related payments with respect to positions in substantially similar or related property, (2) if the recipient elects to have the dividend income treated as investment income for purposes of the limitation on deductibility of investment interest, or (3) if the dividend is received from a foreign corporation that is (a) not eligible for the benefits of a comprehensive income tax treaty with the United States (with an exception for stock that is readily tradable on an established securities market in the United States) or (b) treated as a PFIC.
If a Fund receives dividends from an underlying fund, including an ETF, that qualifies as a RIC and the underlying fund designates such dividends as qualified dividend income, then the Fund may in turn designate that portion of its distributions derived from those dividends as qualified dividend income as well, provided the Fund meets the holding period and other requirements with respect to its shares of the underlying fund.
Distributions declared by a Fund during October, November or December to shareholders of record during such month and paid by January 31 of the following year will be taxable in the year they are declared, rather than the year in which they are received. Each Fund will notify its shareholders each year of the amount and type of dividends and distributions it paid.
Gain or loss realized upon a redemption or other disposition (such as an exchange) of shares of a Fund by a shareholder will generally be treated as long-term capital gain or loss if the shares have been held for more than one year and, if not held for such period, as short-term capital gain or loss. Any loss on the sale or exchange of shares held for six months or less will be treated as a long-term capital loss to the extent of any long-term capital gain dividends paid to the shareholder with respect to such shares. Any loss a shareholder realizes on a sale or exchange of shares will be disallowed if the shareholder acquires other shares of the Fund (whether through the automatic reinvestment of dividends or otherwise) or substantially identical stock or securities within a 61-day period beginning 30 days before and ending 30 days after the shareholder’s sale or exchange of the shares. In such case, the shareholder’s tax basis in the shares acquired will be adjusted to reflect the disallowed loss. Capital losses may be subject to limitations on their use by a shareholder.
When a shareholder opens an account, IRS regulations require that the shareholder provide a taxpayer identification number (TIN), certify that it is correct, and certify that he, she or it is not subject to backup withholding. If a shareholder fails to provide a TIN or the proper tax certifications, each Fund is required to withhold 28% of all distributions (including dividends and capital gain distributions) and redemption proceeds paid to the shareholder. Each Fund is also required to begin backup withholding on an account if the IRS instructs it to do so. Amounts withheld may be applied to the shareholder’s federal income tax liability and the shareholder may obtain a refund from the IRS if withholding results in an overpayment of federal income tax for such year.
For taxable years beginning after December 31, 2012, an additional 3.8% Medicare tax is imposed on certain net investment income (including ordinary dividends and capital gain distributions
136
received from a Fund and net gains from redemptions or other taxable dispositions of Fund shares) of U.S. individuals, estates and trusts to the extent that such person’s “modified adjusted gross income“ (in the case of an individual) or “adjusted gross income” (in the case of an estate or trust) exceeds a threshold amount.
Foreign Taxation
Income received by a Fund from sources within foreign countries may be subject to withholding and other taxes imposed by such countries. Tax conventions between certain countries and the U.S. may reduce or eliminate such taxes. In addition, the Adviser and subadvisers intend to manage the Funds with the intention of minimizing foreign taxation in cases where it is deemed prudent to do so. If more than 50% of the value of a Fund’s total assets at the close of its taxable year consists of stock or securities of foreign corporations, or if the Fund is a qualified fund of funds (see “Investment Companies” below), such Fund will be eligible to elect to “pass through” to the Fund’s shareholders the amount of eligible foreign income and similar taxes paid by the Fund or in the case of a qualified fund of funds, such taxes paid by an underlying fund that has made the election. If this election is made, a shareholder generally subject to federal income tax will be required to include in gross income (in addition to taxable dividends actually received) his or her pro rata share of foreign taxes in computing his or her taxable income and to use such amount as a foreign tax credit against his or her U.S. federal income tax liability or deduct such amount in lieu of claiming a credit, in each case subject to certain limitations. In particular, shareholders must hold their shares (without protection from risk of loss) for more than 15 days during the 31-day period beginning 15 days before the ex-dividend date to be eligible to claim a foreign tax credit with respect to such dividend. These same holding period rules also generally apply at the Fund level; thus a Fund that makes an election to pass through foreign taxes must also hold the stock in such foreign corporations for such specified periods. No deduction for foreign taxes may be claimed by a shareholder who does not itemize deductions. Each shareholder will be notified after the close of a Fund’s taxable year whether the foreign taxes paid by the Fund will “pass through” for that year.
Generally, a credit for foreign taxes is subject to the limitation that it may not exceed the shareholder’s U.S. federal income tax attributable to his or her total foreign source taxable income. For this purpose, if the pass-through election is made by a Fund, the source of the Fund’s income will flow through to shareholders of the Fund. Gains from the sale of securities will be treated as derived from U.S. sources and certain currency fluctuation gains, including fluctuation gains from foreign currency-denominated debt securities, receivables and payables will be treated as ordinary income derived from U.S. sources. The limitation on the foreign tax credit is applied separately to foreign source passive income. Shareholders may be unable to claim a credit for the full amount of their proportionate share of the foreign taxes paid by a Fund.
If the Fund does not satisfy the requirements for passing through to its shareholders their proportionate shares of any foreign taxes paid by the Fund, shareholders will not be required to include such taxes in their gross incomes and will not be entitled to a tax deduction or credit for such taxes on their own federal income tax returns.
Investment Companies
The use of a fund-of-funds structure by ASTON/Lake Partners LASSO Alternatives Fund (a “Fund-of-Funds”) could affect the amount, timing, and character of distributions from the Fund, and, therefore, may increase the amount of taxes payable by shareholders. Because the Fund-of-Funds will invest a large portion of its assets in shares of other funds, its distributable income and gains will normally consist largely of distributions from the underlying funds in which it invests and gains and losses on disposition of shares of the underlying funds.
137
Generally, the character of the income or capital gains that a Fund-of-Funds receives from an underlying fund will pass through to the Fund-of-Fund’s shareholders as long as the Fund-of-Funds and underlying fund qualify as RICs. However, to the extent that an underlying fund that qualifies as a RIC realizes net losses on its investments for a given taxable year, the Fund-of-Funds will not be able to recognize its share of those losses (so as to offset distributions of net income or capital gains from other underlying funds in which it invests) until it disposes of shares of such underlying fund. Moreover, even when the Fund-of-Funds does make such a disposition, a portion of its loss may be recognized as a long-term capital loss, which will not be treated as favorably for federal income tax purposes as an ordinary deduction. In particular, the Fund-of-Funds will not be able to offset any capital losses from its dispositions of underlying fund shares against its ordinary income (including distributions of any net short-term capital gains from an underlying fund that qualifies as a RIC).
In addition, in certain circumstances, the “wash sale” rules may apply to a Fund-of-Fund’s sales of underlying fund shares that have generated losses. A wash sale occurs if shares of an underlying fund are sold by the Fund-of-Funds at a loss and the Fund-of-Funds acquires additional shares of that same underlying fund or other substantially identical stock or securities 30 days before or after the date of the sale. The wash-sale rules could defer losses in the Fund-of-Fund’s hands on sales of underlying fund shares (to the extent such sales are wash sales) for extended (and, in certain cases, potentially indefinite) periods of time.
As a result of the foregoing rules, and certain other special rules, it is possible that the amounts of net investment income and net capital gains that the Fund-of-Funds will be required to distribute to shareholders will be greater than such amounts would have been had the Fund-of-Funds invested directly in the securities held by the underlying funds, rather than investing in shares of the underlying funds. For similar reasons, the character of distributions from the Fund-of-Funds (e.g., long-term capital gain, qualified dividend income, etc.) will not necessarily be the same as it would have been had the Fund-of-Funds invested directly in the securities held by the underlying funds.
If the Fund-of-Funds is a ‘qualified fund of funds’ (i.e., a RIC that invests at least 50% of its total assets in other RICs at the close of each quarter of its taxable year), it may elect to pass through to its own shareholders foreign tax credits received from underlying funds that make the election to pass such foreign tax credits through to their shareholders (see “Foreign Taxation” above).
The foregoing is only a general description of the federal income tax consequences of a fund-of-funds structure. Accordingly, prospective purchasers of shares of the Fund-of-Funds are urged to consult their tax advisers with specific reference to their own tax situation, including the potential application of state, local and foreign taxes.
Other Taxes
Dividends and distributions also may be subject to state and local taxes. Shareholders are urged to consult their tax advisers regarding the application of federal, foreign, state and local taxes to their particular situation.
The foregoing discussion relates solely to U.S. federal income tax law as applied to U.S. investors. Non-U.S. investors should consult their tax advisers concerning the tax consequences of ownership of shares of the Fund, including the possibility that distributions may be subject to a 30% U.S. withholding tax (or a reduced rate of withholding provided by an applicable treaty). However, effective for taxable years of the Funds beginning before January 1, 2014, a Fund will generally not be required to withhold tax on any amounts paid to a non-U.S. investor with respect to dividends attributable to “qualified short-term gain” (i.e., the excess of net short-term capital gain over net long-term capital loss) designated as such by a Fund and dividends attributable to certain U.S. source interest income that would
138
not be subject to federal withholding tax if earned directly by a non-U.S. person, provided such amounts are properly designated by such Fund. A Fund may choose not to designate such amounts.
Special rules apply to foreign persons who receive distributions from a Fund that are attributable to gain from “United States real property interests” (“USRPIs”). The Code defines USRPIs to include direct holdings of U.S. real property and any interest (other than an interest solely as a creditor) in a “United States real property holding corporation” or former United States real property holding corporation. The Code defines a United States real property holding corporation as any corporation whose USRPIs make up 50% or more of the fair market value of its USRPIs, its interests in real property located outside the United States, plus any other assets it uses in a trade or business. In general, if a Fund is a United States real property holding company (determined without regard to certain exceptions), distributions by the Fund that are attributable to (a) gains realized on the disposition of USRPIs by the Fund and (b) distributions received by the Fund from a lower-tier RIC or REIT that the Fund is required to treat as USRPI gain in its hands will retain their character as gains realized from USRPIs in the hands of the foreign persons. (However, absent the enactment of legislation, on or after January 1, 2014, this “look-through” treatment for distributions by a Fund to foreign persons applies only to such distributions that are attributable to distributions received by the Fund from a lower-tier REIT and are required to be treated as USRPI gain in the Fund’s hands.) If the foreign shareholder holds (or has held at any time during the prior year) more than a 5% interest in a class of stock of a Fund, such distributions received by the shareholder with respect to such class of stock will be treated as gains “effectively connected” with the conduct of a “U.S. trade or business,” and subject to tax at graduated rates. Moreover, such shareholders will be required to file a U.S. income tax return for the year in which the gain was recognized and the Fund will be required to withhold 35% of the amount of such distribution. In the case of all other foreign persons (i.e., those whose interest in the Fund did not exceed 5% at any time during the prior year), the USRPI distribution will be treated as ordinary income (regardless of any designation by the Fund that such distribution is qualified short-term gain or net capital gain) and the Fund must withhold 30% (or a lower applicable treaty rate) of the amount of the distribution paid to such foreign persons.
In addition, if a Fund is a United States real property holding corporation or former United States real property holding corporation, the Fund may be required to withhold U.S. tax upon a redemption of shares by a greater-than-5% shareholder that is a foreign person, and that shareholder would be required to file a U.S. income tax return for the year of the disposition of the USRPI and pay any additional tax due on the gain. Prior to January 1, 2014, no withholding is generally required with respect to amounts paid in redemption of shares of a fund if the fund is a domestically controlled qualified investment entity, or, in certain other limited cases, if a fund (whether or not domestically controlled) holds substantial investments in RICs that are domestically controlled qualified investment entities. Unless legislation is enacted, beginning on January 1, 2014, such withholding is required, without regard to whether a Fund or any RIC in which it invests is domestically controlled.
PERFORMANCE INFORMATION
From time to time, the Trust may include general comparative information, such as statistical data regarding inflation, securities indices or the features or performance of alternative investments, in advertisements, sales literature and reports to shareholders. The Trust may also include calculations in these communications, such as hypothetical compounding examples or tax-free compounding examples, which describe hypothetical investment results. Such performance examples will be based on an express set of assumptions and are not indicative of the performance of any Fund. In addition, the Trust may include charts comparing various tax-free yields versus taxable yield equivalents at different income levels.
139
From time to time, the yield and total return of a Fund may be quoted in advertisements, shareholder reports or other communications to shareholders.
FINANCIAL STATEMENTS
The Funds’ audited financial statements for the fiscal year ended October 31, 2012, including the report of the independent registered public accounting firm for each Fund, are incorporated herein by reference to the Funds’ Annual Report as filed with the SEC. The Funds’ Annual and Semi-Annual Reports are available upon request and without charge.
OTHER INFORMATION
The Prospectus and this SAI do not contain all the information included in the Registration Statement filed with the SEC under the 1933 Act with respect to the securities offered by the Trust’s Prospectus. Certain portions of the Registration Statement have been omitted from the Prospectus and this SAI pursuant to the rules and regulations of the SEC. The Registration Statement including the exhibits filed therewith may be examined at the office of the SEC in Washington, D.C.
Statements contained in the Prospectus or in this SAI as to the contents of any contract or other document referred to, are not necessarily complete. In each instance reference is made to the copy of such contract or other document filed as an exhibit to the Registration Statement of which the Prospectus and this SAI forms a part. Each such statement is qualified in all respects by such reference.
140
APPENDIX A
RATINGS OF INVESTMENTS
Standard & Poor’s Corporation—A brief description of the applicable Standard & Poor’s Financial Services LLC, a subsidiary of The McGraw-Hill Companies (“Standard & Poor’s” or “S&P”), rating symbols and their meanings (as published by S&P) follows:
A Standard & Poor’s issue credit rating is a current opinion of the creditworthiness of an obligor with respect to a specific financial obligation, a specific class of financial obligations, or a specific financial program (including ratings on medium term note programs and commercial paper programs). It takes into consideration the creditworthiness of guarantors, insurers, or other forms of credit enhancement on the obligation and takes into account the currency in which the obligation is denominated. The opinion evaluates the obligor’s capacity and willingness to meet its financial commitments as they come due, and may assess terms, such as collateral security and subordination, which could affect ultimate payment in the event of default. The issue credit rating is not a statement of fact or recommendation to purchase, sell, or hold a financial obligation or make any investment decisions. Nor is it a comment regarding an issue’s market price or suitability for a particular investor.
Issue credit ratings are based on current information furnished by the obligors or obtained by Standard & Poor’s from other sources it considers reliable. Standard & Poor’s does not perform an audit in connection with any credit rating and may, on occasion, rely on unaudited financial information. Credit ratings may be changed, suspended, or withdrawn as a result of changes in, or unavailability of, such information, or based on other circumstances.
Issue credit ratings can be either long-term or short-term. Short-term ratings are generally assigned to those obligations considered short-term in the relevant market. In the U.S., for example, that means obligations with an original maturity of no more than 365 days—including commercial paper. Short-term ratings are also used to indicate the creditworthiness of an obligor with respect to put features on long-term obligations. The result is a dual rating, in which the short-term rating addresses the put feature, in addition to the usual long-term rating. Medium-term notes are assigned long-term ratings.
Long-Term Issue Credit Ratings
Issue credit ratings are based, in varying degrees, on the following considerations:
| | 1. | Likelihood of payment—capacity and willingness of the obligor to meet its financial commitment on an obligation in accordance with the terms of the obligation; |
| | 2. | Nature of and provisions of the obligation; and |
| | 3. | Protection afforded by, and relative position of, the obligation in the event of bankruptcy, reorganization, or other arrangement under the laws of bankruptcy and other laws affecting creditors’ rights. |
The issue ratings are an assessment of default risk, but may incorporate an assessment of relative seniority or ultimate recovery in the event of default. Junior obligations are typically rated lower than senior obligations, to reflect the lower priority in bankruptcy, as noted above. (Such differentiation applies when an entity has both senior and subordinated obligations, secured and unsecured obligations, or operating company and holding company obligations.)
A-1
| | | | |
| | AAA | | An obligation rated ‘AAA’ has the highest rating assigned by Standard & Poor’s. The obligor’s capacity to meet its financial commitment on the obligation is extremely strong. |
| | |
| | AA | | An obligation rated ‘AA’ differs from the highest-rated obligations only to a small degree. The obligor’s capacity to meet its financial commitment on the obligation is very strong. |
| | |
| | A | | An obligation rated ‘A’ is somewhat more susceptible to the adverse effects of changes in circumstances and economic conditions than obligations in higher-rated categories. However, the obligor’s capacity to meet its financial commitment on the obligation is still strong. |
| | |
| | BBB | | An obligation rated ‘BBB’ exhibits adequate protection parameters. However, adverse economic conditions or changing circumstances are more likely to lead to a weakened capacity of the obligor to meet its financial commitment on the obligation. |
| | |
| | BB, B, CCC, | | |
| | CC, and C | | Obligations rated ‘BB’, ‘B’, ‘CCC’, ‘CC’, and ‘C’ are regarded as having significant speculative characteristics. ‘BB’ indicates the least degree of speculation and ‘C’ the highest. While such obligations will likely have some quality and protective characteristics, these may be outweighed by large uncertainties or major exposures to adverse conditions. |
| | |
| | BB | | An obligation rated ‘BB’ is less vulnerable to nonpayment than other speculative issues. However, it faces major ongoing uncertainties or exposure to adverse business, financial, or economic conditions, which could lead to the obligor’s inadequate capacity to meet its financial commitment on the obligation. |
| | |
| | B | | An obligation rated ‘B’ is more vulnerable to nonpayment than obligations rated ‘BB’, but the obligor currently has the capacity to meet its financial commitment on the obligation. Adverse business, financial, or economic conditions will likely impair the obligor’s capacity or willingness to meet its financial commitment on the obligation. |
| | |
| | CCC | | An obligation rated ‘CCC’ is currently vulnerable to nonpayment, and is dependent upon favorable business, financial, and economic conditions for the obligor to meet its financial commitment on the obligation. In the event of adverse business, financial, or economic conditions, the obligor is not likely to have the capacity to meet its financial commitment on the obligation. |
| | |
| | CC | | An obligation rated ‘CC’ is currently highly vulnerable to nonpayment. |
| | |
| | C | | A ‘C’ rating is assigned to obligations that are currently highly vulnerable to nonpayment, obligations that have payment arrearages allowed by the terms of the documents, or obligations of an issuer that is the subject of a bankruptcy petition or similar action which have not experienced a payment default. Among others, the ‘C’ rating may be assigned to subordinated debt, preferred stock or other obligations on which cash payments have been suspended in accordance with the instrument’s terms or when preferred stock is the subject of a distressed exchange offer, whereby some or all of the issue is either |
A-2
| | | | |
| | | | repurchased for an amount of cash or replaced by other instruments having a total value that is less than par. |
| | |
| | D | | An obligation rated ‘D’ is in payment default. The ‘D’ rating category is used when payments on an obligation, including a regulatory capital instrument, are not made on the date due, unless Standard & Poor’s believes that such payments will be made within the shorter of the stated grace period but not longer than five business days. Both a longer stated grace period and the absence of a stated grace period are irrelevant. The ‘D’ rating also will be used upon the filing of a bankruptcy petition or the taking of a similar action if payments on an obligation are jeopardized. An obligation’s rating is lowered to ‘D’ upon completion of a distressed exchange offer, whereby some or all of the issue is either repurchased for an amount of cash or replaced by other instruments having a total value that is less than par. |
Plus (+) or minus (-). The ratings from ‘AA’ to `CCC’ may be modified by the addition of a plus or minus sign to show relative standing within the major rating categories.
| | | | |
| | N.R. | | This indicates that no rating has been requested, that there is insufficient information on which to base a rating, or that Standard & Poor’s does not rate a particular obligation as a matter of policy. |
Short-Term Issue Credit Ratings
| | | | |
| | A-1 | | A short-term obligation rated ‘A-1’ is rated in the highest category by Standard & Poor’s. The obligor’s capacity to meet its financial commitment on the obligation is strong. Within this category, certain obligations are designated with a plus sign (+). This indicates that the obligor’s capacity to meet its financial commitment on these obligations is extremely strong. |
| | |
| | A-2 | | A short-term obligation rated ‘A-2’ is somewhat more susceptible to the adverse effects of changes in circumstances and economic conditions than obligations in higher rating categories. However, the obligor’s capacity to meet its financial commitment on the obligation is satisfactory. |
| | |
| | A-3 | | A short-term obligation rated ‘A-3’ exhibits adequate protection parameters. However, adverse economic conditions or changing circumstances are more likely to lead to a weakened capacity of the obligor to meet its financial commitment on the obligation. |
| | |
| | B | | A short-term obligation rated ‘B’ is regarded as having significant speculative characteristics. The obligor currently has the capacity to meet its financial commitment on the obligation; however, it faces major ongoing uncertainties which could lead to the obligor’s inadequate capacity to meet its financial commitment on the obligation. |
| | |
| | C | | A short-term obligation rated ‘C’ is currently vulnerable to nonpayment and is dependent upon favorable business, financial, and economic conditions for the obligor to meet its financial commitment on the obligation. |
A-3
| | | | |
| | D | | A short-term obligation rated ‘D’ is in payment default. The ‘D’ rating category is used when payments on an obligation, including a regulatory capital instrument, are not made on the date due even if the applicable grace period has not expired, unless Standard & Poor’s believes that such payments will be made during such grace period. The ‘D’ rating also will be used upon the filing of a bankruptcy petition or the taking of a similar action if payments on an obligation are jeopardized. |
Moody’s Investors Service, Inc.—A brief description of the applicable Moody’s Investors Service, Inc. (“Moody’s”) rating symbols and their meanings (as published by Moody’s) follows:
Long-Term Obligation Ratings
Moody’s long-term ratings are opinions of the relative credit risk of financial obligations with an original maturity of one year or more. They address the possibility that a financial obligation will not be honored as promised. Such ratings use Moody’s Global Scale and reflect both the likelihood of default and any financial loss suffered in the event of default.
| | | | |
| | Aaa | | Obligations rated Aaa are judged to be of the highest quality, subject to the lowest level credit risk. |
| | |
| | Aa | | Obligations rated Aa are judged to be of high quality and are subject to very low credit risk. |
| | |
| | A | | Obligations rated A are judged to be upper-medium grade and are subject to low credit risk. |
| | |
| | Baa | | Obligations rated Baa are judged to be medium-grade and subject to moderate credit risk and as such may possess certain speculative characteristics. |
| | |
| | Ba | | Obligations rated Ba are judged to be speculative and are subject to substantial credit risk. |
| | |
| | B | | Obligations rated B are considered speculative and are subject to high credit risk. |
| | |
| | Caa | | Obligations rated Caa are judged to be speculative, of poor standing ,and are subject to very high credit risk. |
| | |
| | Ca | | Obligations rated Ca are highly speculative and are likely in, or very near, default, with some prospect of recovery of principal and interest. |
| | |
| | C | | Obligations rated C are the lowest rated and are typically in default, with little prospect for recovery of principal or interest. |
Note: Moody’s appends numerical modifiers 1, 2, and 3 to each generic rating classification from Aaa through Caa. The modifier 1 indicates that the obligation ranks in the higher end of its generic rating category; the modifier 2 indicates a mid-range ranking; and the modifier 3 indicates a ranking in the lower end of that generic rating category.
A-4
Short-Term Obligation Ratings
Moody’s short-term ratings are opinions of the ability of issuers to honor short-term financial obligations. Ratings may be assigned to issuers, short-term programs or to individual short-term debt instruments. Such obligations generally have an original maturity not exceeding thirteen months, unless explicitly noted. Moody’s employs the following designations to indicate the relative repayment ability of rated issuers:
| | | | |
| | P-1 | | Issuers (or supporting institutions) rated Prime-1 have a superior ability to repay short-term debt obligations. |
| | |
| | P-2 | | Issuers (or supporting institutions) rated Prime-2 have a strong ability to repay short-term debt obligations. |
| | |
| | P-3 | | Issuers (or supporting institutions) rated Prime-3 have an acceptable ability to repay short-term obligations. |
| | |
| | NP | | Issuers (or supporting institutions) rated Not Prime do not fall within any of the Prime rating categories. |
Fitch Ratings, Inc.—A brief description of the applicable Fitch Ratings, Inc. (“Fitch”) ratings symbols and meanings (as published by Fitch) follows:
Rated entities in a number of sectors, including financial and non-financial corporations, sovereigns and insurance companies, are generally assigned Issuer Default Ratings (IDRs). IDRs opine on an entity’s relative vulnerability to default on financial obligations. The “threshold” default risk addressed by the IDR is generally that of the financial obligations whose non-payment would best reflect the uncured failure of that entity. As such, IDRs also address relative vulnerability to bankruptcy, administrative receivership or similar concepts, although the agency recognizes that issuers may also make pre-emptive and therefore voluntary use of such mechanisms.
In aggregate, IDRs provide an ordinal ranking of issuers based on the agency’s view of their relative vulnerability to default, rather than a prediction of a specific percentage likelihood of default. For historical information on the default experience of Fitch-rated issuers, please consult the transition and default performance studies available from the Fitch Ratings website.
Long-Term Credit Ratings
| | | | |
| | AAA | | Highest credit quality. ‘AAA’ ratings denote the lowest expectation of default risk. They are assigned only in case of exceptionally strong capacity for payment of financial commitments. This capacity is highly unlikely to be adversely affected by foreseeable events. |
| | |
| | AA | | Very high credit quality. ‘AA’ ratings denote expectations of a very low default risk. They indicate very strong capacity for payment of financial commitments. This capacity is not significantly vulnerable to foreseeable events. |
| | |
| | A | | High credit quality. ‘A’ ratings denote expectations of low default risk. The capacity for payment of financial commitments is considered strong. This |
A-5
| | | | | | |
| | | | | | capacity may, nevertheless, be more vulnerable to adverse business or economic conditions than is the case for higher ratings |
| | | |
| | BBB | | | | Good credit quality. ‘BBB’ ratings indicate that expectations of default risk are currently low. The capacity for payment of financial commitments is considered adequate, but adverse business or economic conditions are more likely to impair this capacity. |
| | | |
| | BB | | | | Speculative. ‘BB’ ratings indicate an elevated vulnerability to default risk developing, particularly in the event of adverse changes in business or economic conditions over time; however, business or financial flexibility exists which supports the servicing of financial commitments. |
| | | |
| | B | | | | Highly speculative. ‘B’ ratings indicate that material default risk is present, but a limited margin of safety remains. Financial commitments are currently being met; however, capacity for continued payment is vulnerable to deterioration in the business and economic environment. |
| | | |
| | CCC | | | | Substantial credit risk. Default is a real possibility. |
| | | |
| | CC | | | | Very high levels of credit risk. Default of some kind appears probable. |
| | | |
| | C | | | | Exceptionally high levels of credit risk. Default is imminent or inevitable, or the issuer is in standstill. Conditions that are indicative of a ‘C’ category rating for an issuer include: |
| | |
| | a. | | the issuer has entered into a grace or cure period following non-payment of a material financial obligation; |
| | |
| | b. | | the issuer has entered into a temporary negotiated waiver or standstill agreement following a payment default on a material financial obligation; or |
| | |
| | c. | | Fitch Ratings otherwise believes a condition of ‘RD’ or ‘D’ to be imminent or inevitable, including through the formal announcement of a distressed debt exchange. |
| | | |
| | RD | | | | Restricted default. ‘RD’ ratings indicate an issuer that in Fitch Ratings’ opinion has experienced an uncured payment default on a bond, loan or other material financial obligation but which has not entered into bankruptcy filings, administration, receivership, liquidation or other formal winding-up procedure, and which has not otherwise ceased operating. This would include: |
| | |
| | a. | | the selective payment default on a specific class or currency of debt; |
| | |
| | b. | | the uncured expiry of any applicable grace period, cure period or default forbearance period following a payment default on a bank loan, capital markets security or other material financial obligation; |
| | |
| | c. | | the extension of multiple waivers or forbearance periods upon a payment default on one or more material financial obligations, either in series or in parallel; or |
| | |
| | d. | | execution of a distressed debt exchange on one or more material financial obligations. |
A-6
| | | | |
| | D | | Default. ‘D’ ratings indicate an issuer that in Fitch Ratings’ opinion has entered into bankruptcy filings, administration, receivership, liquidation or other formal winding-up procedure, or which has otherwise ceased business. Default ratings are not assigned prospectively to entities or their obligations; within this context, non-payment on an instrument that contains a deferral feature or grace period will generally not be considered a default until after the expiration of the deferral or grace period, unless a default is otherwise driven by bankruptcy or other similar circumstance, or by a distressed debt exchange. |
“Imminent” default typically refers to the occasion where a payment default has been intimated by the issuer, and is all but inevitable. This may, for example, be where an issuer has missed a scheduled payment, but (as is typical) has a grace period during which it may cure the payment default. Another alternative would be where an issuer has formally announced a distressed debt exchange, but the date of the exchange still lies several days or weeks in the immediate future.
In all cases, the assignment of a default rating reflects the agency’s opinion as to the most appropriate rating category consistent with the rest of its universe of ratings, and may differ from the definition of default under the terms of an issuer’s financial obligations or local commercial practice.
Note: The modifiers “+” or “-” may be appended to a rating to denote relative status within major rating categories. Such suffixes are not added to the ‘AAA’ Long-Term IDR category, or to Long-Term IDR categories below ‘B’.
Specific limitations relevant to the issuer credit rating scale include:
| | • | | The ratings do not predict a specific percentage of default likelihood over any given time period. |
| | • | | The ratings do not opine on the market value of any issuer’s securities or stock, or the likelihood that this value may change. |
| | • | | The ratings do not opine on the liquidity of the issuer’s securities or stock. |
| | • | | The ratings do not opine on the possible loss severity on an obligation should an issuer default. |
| | • | | The ratings do not opine on the suitability of an issuer as a counterparty to trade credit. |
| | • | | The ratings do not opine on any quality related to an issuer’s business, operational or financial profile other than the agency’s opinion on its relative vulnerability to default. |
Ratings assigned by Fitch Ratings articulate an opinion on discrete and specific areas of risk. The above list is not exhaustive, and is provided for the reader’s convenience.
Short-Term Obligation Ratings
A short-term issuer or obligation rating is based in all cases on the short-term vulnerability to default of the rated entity or security stream and relates to the capacity to meet financial obligations in accordance with the documentation governing the relevant obligation. Short-Term Ratings are assigned to obligations whose initial maturity is viewed as “short term” based on market convention. Typically, this means up to 13 months for corporate, sovereign, and structured obligations, and up to 36 months for obligations in U.S. public finance markets.
A-7
| | | | |
| | F1 | | Highest short-term credit quality. Indicates the strongest intrinsic capacity for timely payment of financial commitments; may have an added “+” to denote any exceptionally strong credit feature. |
| | |
| | F2 | | Good short-term credit quality. Good intrinsic capacity for timely payment of financial commitments. |
| | |
| | F3 | | Fair short-term credit quality. The intrinsic capacity for timely payment of financial commitments is adequate. |
| | |
| | B | | Speculative short-term credit quality. Minimal capacity for timely payment of financial commitments, plus heightened vulnerability to near-term adverse changes in financial and economic conditions. |
| | |
| | C | | High short-term default risk. Default is a real possibility. |
| | |
| | RD | | Restricted default. Indicates an entity that has defaulted on one or more of its financial commitments, although it continues to meet other financial obligations. Applicable to entity ratings only. |
| | |
| | D | | Default. Indicates a broad-based default event for an entity, or the default of a specific short-term obligation. |
Specific limitations relevant to the Short-Term Ratings scale include:
| | • | | The ratings do not predict a specific percentage of default likelihood over any given time period. |
| | • | | The ratings do not opine on the market value of any issuer’s securities or stock, or the likelihood that this value may change. |
| | • | | The ratings do not opine on the liquidity of the issuer’s securities or stock. |
| | • | | The ratings do not opine on the possible loss severity on an obligation should an obligation default. |
| | • | | The ratings do not opine on any quality related to an issuer or transaction’s profile other than the agency’s opinion on the relative vulnerability to default of the rated issuer or obligation. |
Ratings assigned by Fitch Ratings articulate an opinion on discrete and specific areas of risk. The above list is not exhaustive, and is provided for the reader’s convenience.
Rating Watches and Rating Outlooks
Rating Watch
Rating Watches indicate that there is a heightened probability of a rating change and the likely direction of such a change. These are designated as “Positive”, indicating a potential upgrade, “Negative”, for a potential downgrade, or “Evolving”, if ratings may be raised, lowered or affirmed. However, ratings that are not on Rating Watch can be raised or lowered without being placed on Rating Watch first, if circumstances warrant such an action.
A-8
A Rating Watch is typically event-driven and, as such, it is generally resolved over a relatively short period. The event driving the Watch may be either anticipated or have already occurred, but in both cases, the exact rating implications remain undetermined. The Watch period is typically used to gather further information and/or subject the information to further analysis. Additionally, a Watch may be used where the rating implications are already clear, but where a triggering event (e.g. shareholder or regulatory approval) exists. The Watch will typically extend to cover the period until the triggering event is resolved or its outcome is predictable with a high enough degree of certainty to permit resolution of the Watch.
Rating Watches can be employed by all analytical groups and are applied to the ratings of individual entities and/or individual instruments. At the lowest categories of speculative grade (‘CCC’, ‘CC’ and ‘C’) the high volatility of credit profiles may imply that almost all ratings should carry a Watch. Watches are nonetheless only applied selectively in these categories, where a committee decides that particular events or threats are best communicated by the addition of the Watch designation.
Rating Outlook
Rating Outlooks indicate the direction a rating is likely to move over a one- to two-year period. They reflect financial or other trends that have not yet reached the level that would trigger a rating action, but which may do so if such trends continue. The majority of Outlooks are generally Stable, which is consistent with the historical migration experience of ratings over a one- to two-year period. Positive or Negative rating Outlooks do not imply that a rating change is inevitable and, similarly, ratings with Stable Outlooks can be raised or lowered without a prior revision to the Outlook, if circumstances warrant such an action. Occasionally, where the fundamental trend has strong, conflicting elements of both positive and negative, the Rating Outlook may be described as Evolving.
Outlooks are currently applied on the long-term scale to issuer ratings in corporate finance (including sovereigns, industrials, utilities, financial institutions and insurance companies) and public finance outside the U.S.; to issue ratings in public finance in the U.S.; to certain issues in project finance; to Insurer Financial Strength Ratings; to issuer and/or issue ratings in a number of National Rating scales; and to the ratings of structured finance transactions. Outlooks are not applied to ratings assigned on the short-term scale and are applied selectively to ratings in the ‘CCC’, ‘CC’ and ‘C’ categories. Defaulted ratings typically do not carry an Outlook.
Deciding When to Assign Rating Watch or Outlook
Timing is informative but not critical to the choice of a Watch rather than an Outlook. A discrete event that is largely clear and the terms of which are defined, but which will not happen for more than six months—such as a lengthy regulatory approval process—would nonetheless likely see ratings placed on Watch rather than a revision to the Outlook. An Outlook revision may, however, be deemed more appropriate where a series of potential event risks has been identified, none of which individually warrants a Watch but which cumulatively indicate heightened probability of a rating change over the following one to two years.
A revision to the Outlook may also be appropriate where a specific event has been identified, but where the conditions and implications of that event are largely unclear and subject to high execution risk over an extended period—for example a proposed, but politically controversial, privatization.
A-9
Standard Rating Actions
| | | | |
| | Affirmed* | | The rating has been reviewed and no change has been deemed necessary. |
| | |
| | Confirmed | | Action taken in response to an external request or change in terms. Rating has been reviewed in either context, and no rating change has been deemed necessary. |
| | |
| | Downgrade* | | The rating has been lowered in the scale. |
| | |
| | Matured | | This action is used when an issue has reached the end of its repayment term and rating coverage is discontinued. Denoted as ‘M’. |
| | |
| | Paid-In-Full | | This action indicates that the issue has been paid in full. As the issue no longer exists, it is therefore no longer rated. Denoted as ‘PIF’. |
| | |
| | New Rating* | | Rating has been assigned to a previously unrated issue primarily used in cases of shelf issues such as MTNs or similar programs. |
| | |
| | No Longer Applicable (NLA) | | Rating formerly assigned is no longer relevant due to a change in scale or some other non-credit event. |
| | |
| | Prerefunded* | | Assigned to long-term US Public Finance issues after Fitch assesses refunding escrow. |
| | |
| | Publish* | | Initial public announcement of rating on the agency’s website, although not necessarily the first rating assigned. This action denotes when a previously private rating is published. |
| | |
| | Upgrade* | | The rating has been raised in the scale. |
| | |
| | Withdrawn* | | The rating has been withdrawn and the issue or issuer is no longer rated by Fitch Ratings. Indicated in rating databases with the symbol ‘WD’. |
| | |
| | Rating Watch Maintained* | | The issue or issuer has been reviewed and remains on active Rating Watch status. |
| | |
| | Rating Watch On* | | The issue or issuer has been placed on active Rating Watch status. |
| | |
| | Rating Watch Revision* | | Rating Watch status has changed. |
| | |
| | Support Floor Rating Revision | | Applicable only to Support ratings related to Financial Institutions, which are amended only with this action. |
| | |
| | Under Review* | | Applicable to ratings that may undergo a change in scale not related to changes in fundamental credit quality. Final action will be “Revision Rating” |
A-10
| | | | |
| | Revision Outlook* | | The Rating Outlook status has changed independent of a full review of the underlying rating. |
* A rating action must be recorded for each rating in a required cycle to be considered compliant with Fitch policy concerning aging of ratings. Not all Ratings or Data Actions, or changes in rating modifiers, will meet this requirement. Actions that meet this requirement are noted with an * in the above definitions.
A-11
APPENDIX B
ASTON FUNDS
PROXY VOTING POLICIES AND PROCEDURES
“Sub-Adviser” shall mean any investment adviser hired to implement and oversee the investment program of a respective Fund through a sub-investment advisory agreement with Aston. The term includes all sub-advisers to the Funds.
“Sub-Advisers’ Proxy Voting Policies and Procedures” shall mean the Proxy Voting Policies and Procedures of each Sub-Adviser, as amended from time to time.
“Board” shall mean the Board of Trustees of Aston Funds.
“Fund” shall mean a series of Aston Funds.
“Fund Management” shall mean the Chairman of the Board of Trustees, Chief Executive Officer or Chief Financial Officer of Aston Funds.
“Trust” shall mean Aston Funds.
2. Delegation of Proxy Voting Authority. The Trust has delegated to the applicable Sub-Adviser responsibility for voting all proxies for which a Fund is entitled to vote in accordance with the Proxy Voting Policies and Procedures of each Sub-Adviser, and each Sub-Adviser has accepted such delegation. Each Sub-Adviser shall provide the Board with a copy of its Proxy Voting Policies and Procedures and such other information that the Board deems necessary.
3. Limitations on the Advisers’ Responsibilities.
(i) Limited Value. Each Sub-Adviser may abstain from voting a Fund proxy if it concludes that the Fund’s economic interests or the value of the portfolio holding is indeterminable or insignificant.
(ii) Unjustifiable Costs. Each Sub-Adviser may abstain from voting a Fund proxy for cost reasons (e.g., cost associated with voting proxies of non-U.S. securities). In accordance with the Sub-Adviser’s duties, it shall weigh the costs and benefits of voting proxy proposals relating to foreign securities and shall make an informed decision with respect to whether voting a given proxy proposal is prudent. The Sub-Adviser’s decision shall take into account the effect that the Fund’s vote, either by itself or together with other votes, is expected to have on the value of the Fund’s investment and whether this expected effect would outweigh the cost of voting.
(iii) Fund Restrictions. Each Sub-Adviser shall vote Fund proxies in accordance with any applicable investment restrictions of the affected Fund.
(iv) Board Direction. Notwithstanding the foregoing delegation to the Sub-Advisers, the Board may from time to time direct a Sub-Adviser to vote a Fund’s proxies in a manner that is different from the guidelines set forth in the Sub-Adviser’s Proxy Voting Policies and Procedures. After its receipt of any such direction, the Sub-Adviser shall follow any such direction for proxies received after its receipt of such direction.
B-1
4. Subdelegation. Each Sub-Adviser may delegate its responsibilities under these Proxy Voting Policies and Procedures to a third party, provided that no such delegation shall relieve the Sub-Adviser of its responsibilities hereunder and the Sub-Adviser shall retain final authority and fiduciary responsibility for proxy voting. If a Sub-Adviser delegates such responsibilities, the Sub-Adviser shall monitor the delegate’s compliance with these Proxy Voting Policies and Procedures.
5. Proxy Voting Expense. Each Sub-Adviser shall bear all expenses associated with voting its proxies and complying with applicable laws related to voting proxies (including expenses associated with engaging third parties to vote a Fund’s proxies. Each Fund shall promptly reimburse the applicable Sub-Adviser for any out-of-pocket expenses incurred by such Sub-Adviser in performing services related to Institutional Shareholder Services, Inc. maintaining a Fund’s proxy voting records or filings on Form N-PX.
6. Conflicts of Interest. Each Sub-Adviser shall follow the Conflict of Interest provisions set forth in its Proxy Voting Policies and Procedures. Until such time as each Sub-Adviser’s Proxy Voting Policies and Procedures address conflicts of interest, each Sub-Adviser shall comply with the following procedures: the Sub-Adviser shall review each Fund proxy to assess the extent, if any, to which there may be a material conflict between the interests of the applicable Fund on the one hand and the Sub-Adviser and its affiliates, directors, officers, employees (and other similar persons) on the other hand (a “potential conflict”). The Sub-Adviser shall perform this assessment on a proposal-by-proposal basis and a potential conflict with respect to one proposal in a proxy shall not indicate that a potential conflict exists with respect to any other proposal in such proxy. If the Sub-Adviser determines that a potential conflict may exist, it shall promptly report the matter to Fund Management. Fund Management shall determine whether a potential conflict exists and is authorized to resolve any such conflict in a manner that is in the collective best interests of the applicable Fund and Sub-Adviser’s other clients (excluding any client that may have a potential conflict). Without limiting the generality of the foregoing, Fund Management may resolve a potential conflict in any of the following manners:
(i) If the proposal that gives rise to a potential conflict is specifically addressed in the applicable Sub-Adviser’s Proxy Voting Policies and Procedures, Fund Management may direct the Sub-Adviser to vote the proxy in accordance with the pre-determined policies and guidelines set forth in the Sub-Adviser’s Proxy Voting Policies and Procedures; provided that such pre-determined policies and guidelines involve little discretion on the part of the Sub-Adviser;
(ii) Fund Management may disclose the potential conflict to the Board and obtain the Board’s consent before directing the Sub-Adviser to vote in the manner approved by the Board;
(iii) Fund Management may direct the Sub-Adviser to engage an independent third-party to determine how the proxy should be voted; or
(iv) Fund Management may direct the Sub-Adviser to establish an ethical wall or other informational barriers between the person(s) that are involved in the potential conflict and the person(s) making the voting decision in order to insulate the potential conflict from the decision maker.
Each Sub-Adviser shall use commercially reasonable efforts to determine whether a potential conflict may exist, and a potential conflict shall be deemed to exist if and only if one or more of the Sub-Adviser’s senior account representatives actually knew or reasonably should have known of the potential conflict.
7. Approval of Material Changes. Any material changes to the Trust’s Proxy Voting Policies and Procedures shall be promptly submitted to the Board for approval. Any material changes in the applicable Sub-Adviser’s Proxy Voting Policies and Procedures shall be reported to the Board at the next quarterly meeting following such changes.
B-2
8. Reports to the Board. At each quarterly meeting of the Board, each Sub-Adviser shall submit a report to the Board (Exhibit A) describing:
(i) any issues arising under these Proxy Voting Policies and Procedures since the last report to the Board and the resolution of such issues, including but not limited to, information about conflicts of interest not addressed in such Policies and Procedures; and
(ii) any proxy votes taken by the Sub-Adviser on behalf of the Funds since the last report to the Board which were exceptions from the Sub-Adviser’s Proxy Voting Policies and Procedures and the reasons for any such exceptions.
In addition, no less frequently than annually, Fund Management shall furnish to the Board, and the Board shall consider, a written report identifying any recommended changes in existing policies based upon the Sub-Advisers’ experience under these Proxy Voting Policies and Procedures and each Sub-Adviser’s Proxy Voting Policies and Procedures, evolving industry practices and developments in applicable laws or regulations.
9. Maintenance of Records. Each Sub-Adviser shall maintain at its principal place of business the records required to be maintained by the applicable Fund with respect to proxies by the Investment Company Act of 1940, as amended, and the Investment Advisers Act of 1940, as amended, in accordance with the requirements and interpretations thereof. Each Sub-Adviser must maintain proxy statements that it receives regarding Fund securities, but need not to the extent that such proxy statements are available on the SEC’s EDGAR system. The Sub-Advisers may also rely upon a third party to maintain certain records required to be maintained by the Advisers Act and 1940 Act. Each Sub-Adviser shall maintain and provide such records to the Fund in a mutually agreeable format for filing by the Fund on Form N-PX. Each Adviser acknowledges that the records maintained under the 1940 Act are the property of the Fund and agrees to transfer such records to the Fund upon request.
Adopted: November 30, 2006
Amended: September 30, 2007
Amended: September 30, 2010
B-3
Anchor Capital Advisors LLC
Proxy Voting Policies, Procedures and Guidelines
As a matter of policy and as a fiduciary to our clients, Anchor Capital has responsibility for voting proxies for portfolio securities consistent with the best economic interests of its clients.
The Chief Compliance Officer (CCO) and the Investment Policy Committee (IPC) are responsible for the Company’s Proxy Voting Policies and Procedures. The CCO shall be responsible for appointing an officer of the Company to serve as the Chief Proxy Voting Officer (CPVO) and the CPVO may, in turn, designate a Proxy Voting Associate to assist in implementation of the Proxy Voting Procedures. The CPVO is responsible for voting proxies solicited by companies and /or mutual fund sponsors (Registered Investment Companies) whose shares are held in the Company’s clients’ portfolios. The CPVO will decide how a Proxy will be voted.
The CPVO will review proxies solicited on behalf of the Company clients and analyze each proposal in order to determine, with consultation if necessary with the IPC how each proposal might effect and impact the financial and economic interests of the Company’s clients, and vote so as to achieve the most favorable short and long term economic impact for the Company’s clients.
| | I. | Proxy Voting Procedures: |
The Company has contracted with Broadridge Financial Solutions-Proxy Edge to provide the Company with a proxy voting service. This electronic interface will enable the CPVO and PVA to execute proxy votes on behalf of client accounts. In addition, Proxy Edge has agreed to vote as instructed by the PVA paper proxies sent to it. The Company has implemented procedures to notify client transfer agents and other service providers that Proxy Edge is authorized to transmit voting instructions and to vote proxies as instructed by the Company.
The CPVO shall insure that he and the PVA and other associates as might be appropriate shall be trained on the use and administration of the Proxy Edge service. The CPVO shall further insure that the systems records and tracks proxy votes submitted on behalf of clients, and, where required or requested, the CPVO shall provide clients with documentation regarding proxies voted on their behalf. Complete records of proxy votes are maintained electronically through Proxy Edge.
The following is a summary of the how the Company generally votes on specific proposals. All proposals will be voted in the best economic interest of all of the Company’s clients. All proxies from a specific issuer will be voted the same way for each client absent specific and agreed upon instructions from individual clients.
B-4
Proposals Concerning Governance
Vote in Favor Of:
| | • | | Appointment of Independent Auditors |
| | • | | Separate Chairman and Chief Executive Officer |
| | • | | Annual election of Directors |
| | • | | Broad representation of independent/non-management Directors |
Vote Against:
| | • | | Staggered board elections |
| | • | | Super majority and cumulative voting |
| | • | | Classification of board members |
| | • | | Actions that reduce representation of shareholders |
Proposals Concerning Ownership
Vote in Favor Of:
| | • | | Stock splits and share issuance involving non material change in ownership |
| | • | | Mergers and or acquisitions that are in the best economic interest of clients |
| | • | | Issuance of additional shares supported by sound economic reasons |
Vote Against:
| | • | | Issuance of shares with unequal voting rights |
| | • | | Different classifications of Common Stock |
| | • | | Anti-takeover “poison pill” structures |
Proposals Concerning Compensation
Vote in Favor Of:
| | • | | Realistic and relevant short and long term performance objectives |
| | • | | Non-excessive and non-dilutive employee stock purchase plans |
| | • | | Annual vote on non-binding Say on Pay |
Vote Against:
| | • | | Replacing and or re-pricing of underwater options |
| | • | | Excessive and or above peer group compensation for independent directors |
| | • | | Issuance of excessive and dilutive stock options |
| | • | | Issuance of options below current market price |
| | • | | Compensation when Chairman and or CEO is greater than 5X next highest executive |
| | • | | Incentive payments for results below median of peers |
Proposals Concerning Social, Political, Environmental Issues
All proposals concerning any social, political, and or environmental issues are voted on a case by case basis.
B-5
| | III. | Conflicts of Interest |
Should a conflict of interest arise, Anchor Capital will resolve the conflict with the view of the best interest of the investors. If Anchor Capital determines there is a material conflict of interest in connection with a proxy vote, Anchor will determine whether voting in accordance with the guidelines described above is in the best interest of the client. It will also determine whether it is appropriate to disclose the conflict to the affected client and provide the client the opportunity to vote the proxy themselves.
Anchor will disclose in its Form ADV 2A that clients may contact the CCO, Kathryn Kearney, via e-mail (kkearney@anchorcapital.com) or telephone at 617-338-3800 to obtain information on how Anchor Capital voted and to request a copy of the Proxy Voting Policy. If a client requests voting information, the CCO or CPVO will provide a response to the client that includes; (1) the name of the issuer; (2) the proposal voted on; and (3) how Anchor Capital voted.
Anchor will also provide a summary of the Proxy Policy in its Form ADV 2A which will be updated accordingly. Anchor will also post the Proxy Policy on the Company web site.
This Statement of Proxy Voting Policies and Procedures is declared effective as reviewed and approved by the Chief Compliance Officer and Investment Policy Committee on May 29, 2012.
B-6
Baring Asset Management Group Companies
(the “Companies”)
Proxy Voting Policies and Procedures
Executive Summary
The Companies owe fiduciary, contractual, and statutory duties to vote proxies on the securities that they manage for many of their clients. The Companies will vote client proxies in accordance with the procedures set forth below unless the client retains in writing the right to vote proxies or the Companies determine that any benefit the client may gain from voting a proxy would be outweighed by the costs associated therewith. For many clients, the Companies have assumed contractual responsibility to vote proxies on the securities that they manage for those clients’ accounts. For ERISA clients (i.e., employee benefit plans formed pursuant to the Employee Retirement Income Security Act of 1974), the Companies owe fiduciary and statutory duties to vote proxies on ERISA client securities unless the ERISA clients have explicitly retained the obligation to do so. The Companies also vote proxies for those clients who have invested in certain commingled funds, but do not vote proxies for clients who have invested in the “active/passive” commingled funds maintained at State Street Bank and Trust (“State Street”), as State Street retains authority to vote proxies for those clients. To ascertain whether a particular client has delegated proxy voting responsibility to the Companies, please contact the Global Events Department or Legal and Compliance Department.
The Companies reserve the right to amend these Proxy Voting Policies and Procedures from time to time without prior notice to their clients.
Special Circumstances When Proxy Votes May Not Be Cast
In some cases, the Companies may determine that it is not in the best economic interests of clients to vote proxies. For example, some non-U.S. securities issuers impose fees on shareholders or their custodians for exercising the right to vote proxies. Other issuers may “block,” or prohibit, shareholders from transferring or otherwise disposing of their shares for a period of time after the securities holders have noticed their intent to vote their proxies. Moreover, some issuers require the registration of securities in the name of the beneficial owners before permitting proxies to be cast, and thus mandate the disclosure of the identity of beneficial owners of securities, which may be contrary to the wishes of the Companies’ clients.
The U.S. Department of Labor (the “U.S. Labor Department”), which enforces ERISA, recognizes that ERISA clients may incur additional costs in voting proxies linked to shares of non-U.S. corporations. The U.S. Labor Department advises that investment advisers, such as the Companies, should weigh the effect of voting clients’ shares against the cost of voting.
In these instances, the Global Events Department will notify the appropriate portfolio managers of the costs or restrictions that may apply in voting proxies. Portfolio managers, with guidance from the Proxy Committee if desired, will weigh the economic benefit to the Companies’ clients of voting those proxies against the cost of doing so. The Global Events Department shall record the reason for any proxy not being voted, which record shall be kept with the proxy voting records of the Companies.
Institutional Shareholder Services (“ISS”)
The Companies have contracted with ISS, an independent third party service provider, to vote the Companies’ clients’ proxies according to ISS’s proxy voting recommendations. ISS will also provide
B-7
proxy analysis, vote recommendations, vote execution and record-keeping services for clients for which the Companies have proxy voting responsibility.
The clients’ custodians forward proxy materials to ISS for those clients who rely on the Companies to vote proxies. ISS forwards proxy proposals along with ISS proxy analysis and vote recommendations to the Companies. The Companies maintain standing instructions that direct ISS to vote all proxies in accordance with ISS recommendations.
ISS Conflict of Interest
There may be instances when ISS makes no recommendation on a proxy voting issue or is recused due to a conflict of interest. In these situations, the applicable portfolio manager will review the issue and, if the Companies do not also have a conflict of interest, direct the Global Events Department to direct ISS how to vote the proxies. If the Companies have a conflict of interest, the Companies, in their sole discretion, shall either engage an independent third party to provide a vote recommendation or contact the client for direction as to how to vote the proxies.
Override of ISS Recommendation
There may be occasions where the Companies’ portfolio managers seek to override ISS’s recommendations if they believe that ISS’s recommendations are not in accordance with the best economic interests of clients. In the event that the Companies’ portfolio managers disagree with an ISS recommendation on a particular voting issue, the appropriate portfolio manager shall document in writing the reasons that the portfolio manager believes that the ISS recommendation is not in accordance with clients’ best economic interests and submit such written documentation to the Global Events Department.
The Global Events Team shall review the rationale stated to ensure that it is expressed in clear, understandable and complete sentences. Any concerns should be returned to the Portfolio Manager for clarification and revision of the rationale. The Global Events Team shall ensure that when the company is a client of Barings and we wish to vote with the company contrary to the recommendation of ISS, that the procedure set out in this policy under ‘Conflicts of Interest’ is followed.
Responsibility for the provision of a clear rationale for each occasion when ISS recommendation is not to be followed rests with the Portfolio Manager. The Proxy Voting Committee at each meeting will collectively review and approve the rationale given. If any rationale is judged to be inadequate, further clarification will be requested from the Portfolio Manager.
The Global Events Team can refer the matter to the Proxy Committee where they are concerned with the rationale for overriding ISS recommendations.
Special Client Instructions
There are instances when a client has instructed the Companies how they would like the Companies to vote proxies on particular issues of corporate governance or other matters. The Companies will be responsible for voting in accordance with the client instructions. The Global Events Department will maintain a list of clients that have provided the Companies with special proxy voting instructions, and will ensure that the client’s account is set up as a segregated account with ISS. Furthermore, the Global Events Department is responsible for sending a request form to the Client Service Representative responsible for that client to obtain from the Client Service Representative the specific voting instructions on behalf of that client.
B-8
Proxy Committee
The Companies have established a Proxy Voting Committee, which shall include representatives from portfolio management, operations, and legal/compliance or other functional departments as deemed appropriate who are knowledgeable regarding the proxy process. A list of the current members of the Proxy Voting Committee is attached hereto as Schedule A. A majority of the members of the Proxy Committee shall constitute a quorum and the Proxy Committee shall act by a majority vote. The Proxy Committee meetings may be conducted in person, telephonically, or via electronic communication (e-mail). A member of the Global Events Department will manage the proxy voting process, which includes the taking of minutes of the Proxy Committee, the voting of proxies, and the maintenance of appropriate records.
The Global Events Department shall call Proxy Committee meetings, prior to the casting of a vote, to review votes where ISS is conflicted. In these situations, the Proxy Committee shall meet to review the issue and direct ISS how to vote the proxy. The Proxy Committee shall review information provided to it to determine if a real or perceived conflict of interest exists and the minutes of the Proxy Committee shall describe any real or perceived conflict of interest and any procedures used to address such conflict of interest.
The Global Events Department shall also call quarterly Proxy Committee meetings to: (i) monitor the Companies’ adherence to these Procedures; (ii) review votes against ISS recommendations or where ISS was conflicted; (iii) review the list of client requests for a copy of these Procedures and/or the proxy voting record; and (iv) review new corporate governance issues and industry trends and determine whether changes to these Procedures are necessary or appropriate.
Conflicts of Interest – general
To avoid voting proxies in circumstances where the Companies have or may have any conflict of interest, real or perceived, the Companies have contracted with ISS to provide proxy analysis, vote recommendations and voting of proxies, as discussed herein. In instances where ISS has recused itself and makes no recommendation on a particular matter the portfolio manager can direct the Global Events department to direct ISS how to vote proxies assuming the portfolio manager and the Proxy Committee confirm the Companies are not conflicted. If an override submission is requested by a portfolio manager, the Proxy Committee shall determine how the proxy is to be voted, in which case the Proxy Committee will determine whether a conflict of interest exists and that the rationale to vote against ISS is reasonable and is in the best interests of clients.
There may be occasions when a portfolio manager and/or member of its team who are involved in the proxy voting decision may have a conflict of interest, or the Companies have a business relationship with the company soliciting the proxy. A person shall not be considered to have a conflict of interest if the person did not know of the conflict of interest and did not attempt to influence the outcome of a proxy vote. Any person with actual knowledge of a conflict of interest relating to a particular item shall disclose that conflict to the Global Events Department.
The following are examples of situations where a conflict of interest may exist:
| | • | | The company soliciting the proxy is a client of the Companies; |
| | • | | The company soliciting the proxy is an affiliate of the Companies; |
| | • | | An employee of the Companies is a also a director, officer or employee of the company soliciting the proxy; and |
B-9
| | • | | A portfolio manager and/or a partner/spouse of a SIT member, who is involved in making the voting decision is a director, officer, or employee of the company soliciting the proxy. |
To monitor the above examples of where a conflict of interest may exist, the Global Events Department is responsible for maintaining a list of all publicly traded clients (and the client’s parent company) of the Companies. The Companies currently have no affiliates that are publicly traded companies. The London Legal Department shall maintain a list of all employees of the Companies who are directors or officers of publicly traded companies, and shall advise, as applicable, the London Head of Compliance, who will then advise the Global Events Department. The portfolio manager and members of the SIT who are involved in the voting decision are responsible for notifying the Global Events Department, via the proxy voting form, if said portfolio manager, member or said member’s partner/spouse is a director, officer or employee of the company soliciting the proxy or if the SIT member is aware of any other possible real or perceived conflicts of interest.
The Companies have a duty to vote proxies in the best interests of their clients. Therefore, in situations where there is a real or perceived conflict of interest, the Companies will either vote the securities in accordance with a pre-determined policy based upon the recommendations of an independent third party, such as a proxy voting service, or disclose the conflict to the client and obtain the client’s direction to vote the proxy.
Conflicts of interest – Barings Mutual Funds
Discretionary Clients.
Where the IMA requires it OR for UK mutual funds, we cannot vote our Clients’ holdings of any mutual funds or other securities managed or advised by Barings or any other member of the MassMutual group - an “In-House Vote” - unless we have obtained the relevant Client’s prior instructions on how to vote that particular holding - and irrespective of whether we are voting in line with ISS’s recommendation.
In this scenario, each Client will need to be contacted and their specific instructions sought on how we should vote. These instructions should be obtained in accordance with any applicable requirements as regards obtaining instructions as specified in the relevant IMA / Authorised Signatory list, with appropriate records maintained to demonstrate that this has been done.
The default position will be that it is assumed the client must be contacted unless proved otherwise (note: for UK mutual funds we must always contact the clients). Where the IMA does not require the client to be contacted, then we can only vote in line with ISS recommendations. If the Portfolio Manager wishes to override ISS recommendations they must get the written agreement of the client.
Mutual Funds
In a situation where one Barings mutual fund is invested in another Barings mutual fund then the following process should be followed.
UK Funds. These units cannot be voted. This is in accordance with FSA requirements.
Non UK Funds. Voting should be undertaken in accordance with the provisions stated in the general ‘Conflict of Interest’ section above. If a Portfolio Manager wishes to override ISS (or another independent third party) recommendation then this will be referred to the Proxy Voting Committee for review. Any decision by the Proxy Voting Committee to override the recommendation of an independent third party must demonstrate why it is considered to be in the interests of Barings’ clients.
B-10
ISS Proxy Voting Guidelines
A copy of ISS’s proxy voting guidelines can be found on the ISS Website at http://www.issproxy.com/policy/2006policy.jsp.
B-11
Cornerstone Investment Partners, LLC
PROXY VOTING POLICIES
Rule 204-2 of the Advisers Act requires that investment advisers adopt and implement policies and procedures for voting proxies in the best interest of clients, to describe the procedures to clients, and to tell clients how they may obtain information about how CIP has actually voted their proxies. While decisions about how to vote must be determined on a case-by-case basis, CIP’s general policies and procedures for voting proxies are set forth below.
| | B. | Proxy Voting Principles and Guidelines |
Please see Exhibit XII
| | C. | Specific Proxy Voting Policies and Procedures |
CIP believes that each proxy proposal should be individually reviewed to determine whether the proposal is in the best interests of its clients. As a result, similar proposals for different companies may receive different votes because of different corporate circumstances.
Edward Mitchell Jr., CFA, Managing Partner is responsible for overseeing the proxy voting program and Broadridge is Cornerstone’s proxy voting platform. Broadridge provides the connectivity with all of our custodians.
For each proxy, every ballot initiative is reviewed and compared to Cornerstone’s Principles and Guidelines and any client specific guidelines. Cornerstone uses research from Egan Jones to gain further insight into each ballot initiative. For any ballot items that require additional research, those items are referred to the Investment Committee for further review.
Cornerstone Investment Partners
Proxy Voting
Principles and Guidelines
Introduction
Our Proxy Voting Principles serve as the background for our Proxy Voting Guidelines, which, in turn, act as general guidelines for the specific recommendations that we make with respect to proxy voting. It is important to recognize that such principles are not intended to dictate but guide. Certain of the principles may be inappropriate for a given company, or in a given situation. Additionally, the principles are evolving and should be viewed in that light. Our principles are and will be influenced by current and forthcoming legislation, rules and regulations, and stock exchange rules. Examples include:
- the Sarbanes-Oxley Act of 2002 and implementing rules promulgated by the U.S. Securities & Exchange Commission
- revised corporate governance listing standards of the New York Stock Exchange and resulting SEC rules
- corporate governance reforms and subsequent proposed rule filings made with the SEC by The NASDAQ Stock Market, Inc. and resulting SEC rules in general:
B-12
- Directors should be accountable to shareholders, and management should be accountable to directors.
- Information on the Company supplied to shareholders should be transparent.
- Shareholders should be treated fairly and equitably according to the principle of one share, one vote.
Principles
A. Director independence
It is our view that:
- A two-thirds majority of the Board should be comprised of independent directors.
- Independent directors should meet alone at regularly scheduled meetings, no less frequently than semi-annually, without the Chief Executive Officer or other non-independent directors present.
- When the Chairman of the Board also serves as the company’s Chief Executive Officer, the Board should designate one independent director to act as a leader to coordinate the activities of the other independent directors.
- Committees of the Board dealing with the following responsibilities should consist only of independent directors: audit, compensation, nomination of directors, corporate governance, and compliance.
- No director should serve as a consultant or service provider to the Company.
- Director compensation should be a combination of cash and stock in the company, with stock constituting a significant component.
In our opinion, an independent director, by definition, has no material relationship with the Company other than his or her directorship. This avoids the potential for conflict of interest. Specifically such director:
- should not have been employed by the Company or an affiliate within the previous five years;
- should not be, and should not be affiliated with, a company that is an adviser or consultant to the Company or affiliate, or to a member of the Company’s senior management;
- should not be affiliated with a significant customer or supplier of the Company or affiliate;
- should have no personal services contract with the Company or affiliate, or a member of senior management;
- should not be affiliated with a not-for-profit organization that receives significant contributions from the Company or affiliate;
- within the previous five years, should not have had any business relationship with the Company or affiliate which required disclosure in the Company’s Form 10-K;
- should not be employed by a public company at which an executive officer of the Company serves as a director;
- should not be a member of the immediate family of any person described above.
B. Board operating procedures
- The Board should adopt a written statement of its governance principles, and regularly re-evaluate them.
- Independent directors should establish performance criteria and compensation incentives for the Chief Executive Officer, and regularly review his or her performance against such criteria. Such criteria should align the interests of the CEO with those of shareholders, and evaluate the CEO against peer groups.
- The independent directors should be provided access to professional advisers of their own choice, independent of management.
- The Board should have a CEO succession plan, and receive periodic reports from management on the development of other members of senior management.
- Directors should have access to senior management through a designated liaison person.
- The Board should periodically review its own size, and determine the appropriate size.
B-13
C. Requirements for individual directors
We recommend that:
- The Board should provide guidelines for directors serving on several Boards addressing competing commitments.
- The Board should establish performance criteria for itself and for individual directors regarding director attendance, preparedness, and participation at meetings of the Board and of committees of the Board, and directors should perform satisfactorily in accordance with such criteria in order to be re-nominated.
D. Shareholder rights
- A simple majority of shareholders should be able to amend the company’s bylaws, call special meetings, or act by written consent.
- In the election of directors, there should be multiple nominees for each seat on the Board
- “Greenmail” should be prohibited.
- Shareholder approval should be required to enact or amend a “poison pill” (i.e., “shareholder rights”) plan
- Directors should be elected annually.
- The Board should ordinarily implement a shareholder proposal that is approved by a majority of proxy votes.
- Shareholders should have effective access to the director nomination process.
Proxy Voting Guidelines
Consistent with the above-listed principles, the proxy voting guidelines outlined below are written to guide the specific recommendations that we make to our clients. Ordinarily, we do not recommend that clients ABSTAIN on votes; rather, we recommend that they vote FOR or AGAINST proposals (or, in the case of election of directors, that they vote FOR ALL nominees, AGAINST the nominees, or that they WITHHOLD votes for certain nominees). In the latter instance, the recommendation on our report takes the form ALL, EXCEPT FOR and lists the nominees from whom votes should be withheld.
Whether or not the guideline below indicates “case-by-case basis,” every case is examined to ensure that the recommendation is appropriate.
Board of Directors
Election of Directors in Uncontested Elections
Case-by-case basis, examining composition of board and key board committees, attendance history, corporate governance provisions and takeover activity, long-term company financial performance relative to a market index, directors’ investment in the company, etc.
WITHHOLD votes for nominees who:
are affiliated outside directors and sit on the Audit, Compensation, or Nominating committees
are inside directors and sit on the Audit, Compensation, or Nominating committees
are inside directors and the company does not have Audit, Compensation, or Nominating committees attend less than 75 percent of the board and committee meetings. Participation by phone is acceptable.
ignore a shareholder proposal that is approved by a majority of the shares outstanding
ignore a shareholder proposal that is approved by a majority of the votes cast for two consecutive years
fail to act on takeover offers where the majority of the shareholders have tendered their shares
implement or renew a “dead-hand” or modified “dead-hand” poison pill
sit on more than seven boards
In cases in which an issuer has engaged in the practice commonly referred to as “options backdating,” Cornerstone will typically withhold voting for nominees serving on the issuer’s compensation committee,
B-14
the issuer’s entire board of directors, and/or its chief executive officer. Such recommendations will be made on a case-by-case basis, taking into consideration such matters as intent of the individuals involved, scope and timing of the practice, significance of financial restatement required, and corrective action taken.
Furthermore, we may recommend withholding votes from either members of an issuer’s compensation committee, its entire board of directors and/or its chief executive officer where the issuer has engaged in what we judge to be other unsatisfactory compensation practices. Considerations may include such factors as “pay-for-failure” executive severance provisions, change-in-control payments which are either excessive or which are not tied to loss of job or significant reduction in duties, excessive executive perquisites, unjustified changes in the performance standards applied to performance-based compensation, and executive compensation out of proportion to performance of the issuer.
FOR responsible shareholder proposals calling for the company to name as directors only those who receive a majority of shareholder votes.
Separating Chairman and CEO
Case-by-case basis on shareholder proposals requiring that positions of chairman and CEO be held separately.
Independent Directors
FOR shareholder proposals asking that a two-thirds majority of directors be independent.
FOR shareholder proposals asking that board’s Audit, Compensation, and/or Nominating committees be composed exclusively of independent directors.
Case-by-case basis on proposals asking that the Chairman be independent.
Stock Ownership Requirements
AGAINST shareholder proposals requiring directors to own a minimum amount of company stock in order to qualify as a director or to remain on the board.
Term Limits
AGAINST shareholder proposals to limit tenure of outside directors.
Age Limits
AGAINST shareholder proposals to impose a mandatory retirement age for outside directors.
Director and Officer Indemnification and Liability
Case-by-case basis on director and officer indemnification and liability, using Delaware law as the standard.
AGAINST proposals to eliminate entirely directors and officers liability for monetary damages for violating the duty of care.
AGAINST indemnification proposals that would expand coverage beyond legal expenses to acts, such as negligence, that are more serious violations of fiduciary obligation than mere carelessness.
FOR only those proposals providing such expanded coverage in cases when a director’s or officer’s legal defense was unsuccessful if (1) the director was found to have acted in good faith and in a manner that he or she reasonably believed was in the best interests of the company, and (2) only if the director’s legal expenses would be covered.
Charitable or Political Contributions
AGAINST proposals regarding charitable or political contributions.
Proxy Contests (Contested Elections)
B-15
Election of Directors in Contested Elections
Case-by-case basis for voting for directors in contested elections, considering long-term financial performance of the target company relative to its industry, management’s track record, background to the proxy contest, qualifications of director nominees on both slates, evaluation of what each side is offering shareholders as well as likelihood that proposed objectives and goals will be met, and stock ownership positions.
Reimburse Proxy Solicitation Expenses
Case-by-case basis for reimbursement of proxy solicitation expenses. FOR reimbursing proxy solicitation expenses where is in favor of the dissidents.
Auditors
Ratifying Auditors
FOR proposals to ratify auditors, unless:
Non-audit fees exceed 50% of total fees.
Auditor has a financial interest in or association with the company, and is therefore not independent; or there is reason to believe that the independent auditor has rendered an opinion which is neither accurate nor indicative of the company’s financial position.
Proxy Contest Defenses
Classified Board vs. Annual Election
AGAINST proposals to classify the board.
FOR proposals to repeal (“de-stagger”) classified boards and to elect all directors annually.
Removal of Directors
AGAINST proposals that provide that directors may be removed only for cause.
FOR proposals to restore shareholder ability to remove directors with or without cause.
AGAINST proposals that provide that only continuing directors may elect replacements to fill board vacancies.
FOR proposals that permit shareholders to elect directors to fill board vacancies.
Cumulative Voting
Case-by-case basis on proposals to eliminate cumulative voting.
Calling Special Meetings
AGAINST proposals to restrict or prohibit shareholder ability to call special meetings.
FOR shareholder proposals to allow a shareholder holding a 25% or greater interest to call a special shareholder meeting.
FOR proposals that remove restrictions on the right of shareholders to act independently of management.
Acting by Written Consent
AGAINST proposals to restrict or prohibit shareholder ability to take action by written consent.
FOR proposals to allow or make easier shareholder action by written consent.
Altering Size of the Board
FOR proposals to fix the size of the board.
AGAINST proposals that give management the ability to alter size of the board without shareholder approval.
Tender Offer Defenses
B-16
“Poison Pills”
FOR shareholder proposals that ask the company to submit its “poison pill” for shareholder ratification.
Case-by-case basis for shareholder proposals to redeem a company’s existing “poison pill.”
Case-by-case basis for management proposals to ratify a “poison pill.”
Fair Price Provisions
Case-by-case basis for adopting fair price provisions, considering vote required to approve the proposed acquisition, vote required to repeal the fair price provision, and mechanism for determining the fair price.
AGAINST fair price provisions with shareholder vote requirements greater than a majority of disinterested shares.
“Greenmail”
FOR proposals to adopt anti-“greenmail” charter or bylaw amendments or otherwise restrict the company’s ability to make “greenmail” payments.
Case-by-case basis for anti-“greenmail” proposals which are bundled with other charter or bylaw amendments.
“Pale Greenmail”
Case-by-case basis for restructuring plans that involve the payment of pale greenmail.
Unequal Voting Rights
AGAINST dual-class exchange offers and dual-class recapitalizations.
Supermajority Requirement to Amend Charter or Bylaws
AGAINST management proposals to require a supermajority shareholder vote to approve charter and bylaw amendments.
FOR shareholder proposals to lower supermajority shareholder vote requirements for charter and bylaw amendments.
Supermajority Requirement to Approve Mergers
AGAINST management proposals to require a supermajority shareholder vote to approve mergers and other significant business combinations.
FOR shareholder proposals to lower supermajority shareholder vote requirements for mergers and other significant business combinations.
Placement of Equity with “White Squire”
FOR shareholder proposals to require approval of “blank check preferred stock” issues for other than general corporate purposes.
Other Governance Proposals
Confidential Voting
FOR shareholder proposals that request that the company adopt confidential voting, use independent tabulators, and use independent inspectors of election as long as the proposals include clauses for proxy contests as follows: In the case of a contested election, management should be permitted to request that the dissident group honor its confidential voting policy. If the dissidents agree, the policy remains in place. If the dissidents do not agree, the confidential voting policy is waived.
FOR management proposals to adopt confidential voting.
B-17
Equal Access
FOR shareholder proposals that would allow significant company shareholders equal access to management’s proxy material in order to evaluate and propose voting recommendations on proxy proposals and director nominees, and in order to nominate their own candidates to the board.
Bundled Proposals
Case-by-case basis for bundled or “conditioned” proxy proposals. Where items are conditioned upon each other, examine benefits and costs. AGAINST in instances when the joint effect of the conditioned items is not in shareholders’ best interests. FOR if the combined effect is positive.
Shareholder Advisory Committees
Case-by-case basis for establishing a shareholder advisory committee.
Capital Structure
Common Stock Authorization
Case-by case basis for increasing the number of shares of common stock authorized for issuance.
AGAINST increasing the number of authorized shares of the class of stock that has superior voting rights in companies that have dual-class capitalization structures.
Stock Distributions: Splits and Dividends
FOR management proposals to increase common share authorization for a stock split, provided that the increase in authorized shares would not result in an excessive number of shares available for issuance, considering the industry and company’s returns to shareholders.
Reverse Stock Splits
FOR management proposals to implement a reverse stock split when the number of shares will be proportionately reduced to avoid delisting.
Case-by-case basis on proposals to implement a reverse stock split that do not proportionately reduce the number of shares authorized for issuance.
Preferred Stock
AGAINST proposals authorizing creation of new classes of “blank check preferred stock” (i.e., classes with unspecified voting, conversion, dividend distribution, and other rights
FOR proposals to create “blank check preferred stock” in cases when the company specifically states that the stock will not be used as a takeover defense.
FOR proposals to authorize preferred stock in cases where the company specifies the voting, dividend, conversion, and other rights of such stock and the terms are reasonable.
Case-by-case basis on proposals to increase the number of “blank check preferred shares” after analyzing the number of preferred shares available for issuance considering the industry and company’s returns to shareholders.
“Blank Check Preferred Stock”
FOR shareholder proposals to have placements of “blank check preferred stock” submitted for shareholder approval, except when those shares are issued for the purpose of raising capital or making acquisitions in the normal course.
Adjustments to Par Value of Common Stock
FOR management proposals to reduce the par value of common stock.
B-18
Preemptive Rights
Case-by-case basis on shareholder proposals that seek preemptive rights, considering size of the company and shareholder characteristics.
Debt Restructurings
Case-by-case basis on proposals to increase number of common and/or preferred shares and to issue shares as part of a debt restructuring plan, considering dilution, any resulting change in control
FOR proposals that facilitate debt restructurings except where signs of self-dealing exist.
Share Repurchase Programs
FOR management proposals to institute open-market share repurchase plans in which all shareholders may participate on equal terms.
Tracking Stock
Case-by-case basis for creation of tracking stock, considering the strategic value of the transaction vs. adverse governance changes, excessive increases in authorized stock, inequitable distribution method, diminution of voting rights, adverse conversion features, negative impact on stock option plans, and other alternatives, such as spin-offs.
Compensation of Officers and Directors
Case-by-case basis for director and officer compensation plans, but generally favoring responsible proposals calling for more use of performance-based equity in compensation plans. The term “performance-based equity” will not be interpreted to include conventional stock options, but will include such tools as indexed options, restricted stock, performance-contingent options, and premium-priced options.
Management Proposals Seeking Approval to Re-price Options
Case-by-case basis on management proposals seeking approval to re-price options.
Director Compensation
Case-by-case basis on stock-based plans for directors.
Employee Stock Purchase Plans
Case-by-case basis on employee stock purchase plans.
Amendments that Place a Maximum limit on Annual Grants or Amend
Administrative Features
FOR plans that amend shareholder-approved plans to include administrative features or place maximum limit on annual grants that any participant may receive to comply with the provisions of Section 162(m) of the Omnibus Budget Reconciliation Act (OBRA).
Amendments to Added Performance-Based Goals
FOR amendments to add performance goals to existing compensation plans to comply with the provisions of Section 162(m) of OBRA.
Amendments to Increase Shares and Retain Tax Deductions under OBRA
B-19
Case-by-case basis on amendments to existing plans to increase shares reserved and to qualify the plan for favorable tax treatment under the provisions of Section 162(m).
Approval of Cash or Cash & Stock Bonus Plans
FOR cash or cash & stock bonus plans to exempt compensation from taxes under the provisions of Section 162(m) of OBRA.
Limits on Director and Officer Compensation
FOR shareholder proposals requiring additional disclosure of officer and director compensation.
Case-by-case basis for all other shareholder proposals seeking limits on officer and director compensation.
“Golden Parachutes” and “Tin Parachutes”
FOR shareholder proposals to have “golden and tin parachutes” submitted for shareholder ratification.
Case-by-case basis on proposals to ratify or cancel “golden or tin parachutes.”
Employee Stock Ownership Plans (ESOPs)
FOR proposals that request shareholder approval in order to implement an ESOP or to increase authorized number of shares for existing ESOPs, except in cases when the number of shares allocated to the ESOP is “excessive” (i.e., greater than five percent of outstanding shares).
401(k) Employee Benefit Plans
FOR proposals to implement a 401(k) savings plan for employees.
State of Incorporation
State Takeover Statutes
Case-by-case basis on proposals to opt in or out of state takeover statutes (including control share acquisition statutes, control share cash-out statutes, freeze-out provisions, fair price provisions, stakeholder laws, poison pill endorsements, severance pay and labor contract provisions, anti-“greenmail” provisions, and disgorgement provisions).
Reincorporation Proposals
Case-by-case basis on proposals to change the company’s state of incorporation.
Business Combinations and Corporate Restructurings
Mergers and Acquisitions
Case-by-case basis on mergers and acquisitions, considering projected financial and operating benefits, offer price, prospects of the combined companies, negotiation process, and changes in corporate governance.
Corporate Restructuring
Case-by-case basis on corporate restructurings, including minority squeeze-outs, leveraged buyouts, spin-offs, liquidations, and asset sales.
Spin-offs
Case-by-case basis on spin-offs, considering tax and regulatory advantages, planned use of proceeds, market focus, and managerial incentives.
Asset Sales
B-20
Case-by-case basis on asset sales, considering impact on the balance sheet and working capital, and value received.
Liquidations
Case-by-case basis on liquidations considering management’s efforts to pursue alternatives, appraisal value, and compensation for executives managing the liquidation.
Appraisal Rights
FOR providing shareholders with appraisal rights.
Mutual Fund Proxies
Election of Directors
Case-by-case basis for election of directors, considering board structure, director independence, director qualifications, compensation of directors within the fund and the family of funds, and attendance at board and committee meetings.
WITHHOLD votes for directors who:
are interested directors and sit on key board committees (Audit, Nominating or Compensation committees)
are interested directors and the company does not have one or more of the following committees: Audit, Nominating or Compensation.
attend less than 75 percent of the board and committee meetings. Participation by phone is acceptable.
ignore a shareholder proposal that is approved by a majority of shares outstanding
ignore a shareholder proposal that is approved by a majority of the votes cast for two consecutive years
serve as Chairman but are not independent (e.g. serve as an officer of the fund’s advisor)
Converting Closed-end Fund to Open-end Fund
Case-by-case basis for conversion of closed-end fund to open-end fund, considering past performance as a closed-end fund, market in which the fund invests, measures taken by the board to address the market discount, and past shareholder activism, board activity, and votes on related proposals.
Proxy Contests
Case-by-case basis on proxy contests, considering past performance, market in which fund invests, and measures taken by the board to address issues raised, past shareholder activism, board activity, and votes on related proposals.
Investment Advisory Agreements
Case-by-case basis on investment advisory agreements, considering proposed and current fee schedules, fund category and investment objective, performance benchmarks, share price performance relative to that of peers; and magnitude of any fee increase.
New Classes or Series of Shares
FOR creating new classes or series of shares.
Preferred Stock Authorization
Case-by-case basis for authorization for or increase in preferred shares, considering financing purpose and potential dilution for common shares.
1940 Act Policies
Case-by-case basis for 1940 Act policies, considering potential competitiveness, regulatory developments, current and potential returns, and current and potential risk.
B-21
Changing a Fundamental Restriction to a Non-fundamental
Restriction
Case-by-case basis on changing fundamental restriction to non-fundamental restriction, considering fund’s target investments, reasons for change, and projected impact on portfolio.
Changing Fundamental Investment Objective to Non-fundamental
AGAINST proposals to change the fund’s fundamental investment objective to non-fundamental.
Name Rule Proposals
Case-by-case basis for name rule proposals, considering the following factors: political/economic changes in target market; bundling with quorum requirements or with changes in asset allocation, and consolidation in the fund’s target market.
Disposition of Assets, Termination, Liquidation
Case-by-case basis for disposition of assets, termination or liquidation, considering strategies employed, company’s past performance, and terms of liquidation.
Charter Modification
Case-by-case basis for changes to the charter, considering degree of change, efficiencies that could result, state of incorporation, and regulatory standards and implications.
Change of Domicile
Case-by-case basis for changes in state of domicile, considering state regulations of each state, required fundamental policies of each state; and the increased flexibility available.
Change in Sub-classification
Case-by-case basis for change in sub-classification, considering potential competitiveness, current and potential returns, risk of concentration, and industry consolidation in the target industry.
Authorizing Board to Hire and Terminate Sub-advisors without
Shareholder Approval
AGAINST authorizing the board to hire and terminate sub-advisors without
shareholder approval
Distribution Agreements
Case-by-case basis for approving distribution agreements, considering fees charged to comparably sized funds with similar objectives, proposed distributor’s reputation and past performance, and competitiveness of fund in industry.
Master-Feeder Structure
FOR establishment of a master-feeder structure.
Changes to Charter
Case-by-case basis for changes to the charter, considering degree of change implied by the proposal, resulting efficiencies, state of incorporation, and regulatory standards and implications.
Mergers
Case-by-case basis for proposed merger, considering resulting fee structure, performance of each fund, and continuity of management.
B-22
Shareholder Proposals
Independent Directors
FOR shareholder proposals asking that a three-quarters majority of directors be independent.
FOR shareholder proposals asking that board’s Audit, Compensation, and/or Nominating committees be composed exclusively of independent directors.
For proposals asking that the Chairman be independent.
Establish Director Ownership Requirement
AGAINST establishing a director ownership requirement.
Reimbursement of Shareholder for Expenses Incurred
Case-by-case basis for reimbursing proxy solicitation expenses.
FOR reimbursing proxy solicitation expenses in cases where Cornerstone is in favor of the dissidents.
Terminate the Investment Advisor
Case-by-case basis for terminating the investment advisor, considering fund’s performance and history of shareholder relations.
Social Issues
Energy and Environment
AGAINST on proposals that request companies to follow the CERES Principles.
FOR reports that seek additional information, if it appears company has not adequately addressed shareholders’ relevant environmental concerns.
Northern Ireland
AGAINST on proposals related to the MacBride Principles.
FOR reports that seek additional information about progress being made toward eliminating employment discrimination, if it appears company has not adequately addressed shareholder relevant concerns.
Military Business
AGAINST on defense issue proposals.
FOR reports that seek additional information on military related operations, if the company has been unresponsive to shareholder relevant requests.
Maquiladora Standards and International Operations Policies
AGAINST on proposals relating to the Maquiladora Standards and international operating policies.
FOR reports on international operating policy issues, if it appears company has not adequately addressed shareholder relevant concerns.
World Debt Crisis
AGAINST on proposals dealing with Third World debt.
FOR reports on Third World debt issues, particularly when it appears company has not adequately addressed shareholder relevant concerns.
Equal Employment Opportunity and Discrimination
AGAINST on proposals regarding equal employment opportunities and discrimination.
FOR reports that seek additional information about affirmative action efforts, if it appears company has been unresponsive to shareholder relevant requests.
B-23
Animal Rights
AGAINST on proposals that deal with animal rights.
Product Integrity and Marketing
AGAINST on ceasing production of socially questionable products.
FOR reports that seek additional information regarding product integrity and marketing issues, if it appears company has been unresponsive to shareholder relevant requests.
Human Resources Issues
AGAINST on proposals regarding human resources issues.
FOR reports that seek additional information regarding human resources issues, if it appears company has been unresponsive to shareholder relevant requests.
B-24
Doubleline Funds Trust
Doubleline Capital, LP
Doubleline Private Funds
PROXY VOTING, CORPORATE ACTIONS AND CLASS ACTIONS
January 2011
This Proxy Voting, Corporate Actions and Class Actions Policy (“Policy”) is adopted by DoubleLine Capital LP (“DoubleLine”, the “Adviser” or the “Firm”) and DoubleLine Funds Trust (the “Trust”) on behalf of each of its series (“the Funds”) to provide a method of monitoring proxy voting and action taken in respect of corporate actions and class actions, and reporting appropriately, to meet regulatory requirements and client needs. DoubleLine generally will exercise voting authority on behalf of its separate account clients (“Clients”) pursuant to contractual delegation of such authority. Each private investment fund (such as, but not limited to, the DoubleLine Opportunistic Income Master Fund LP (and its related entities), each of which is a “Private Fund” and collectively “Private Funds”) managed by DoubleLine also adopts this policy.
The Funds and the Private Funds rely upon DoubleLine to provide advice as to how and when to vote proxies related to their portfolio holdings. The Funds have retained U.S. Bancorp Fund Services, LLC (“USBFS”) for various related administrative activities, including filing Form N-PX.
Rule 206(4)-6 under the Advisers Act requires every investment adviser who exercises voting authority with respect to client securities to adopt and implement written policies and procedures, reasonably designed to ensure that the adviser votes proxies in the best interest of its clients. The procedures must address material conflicts that may arise in connection with proxy voting. The Rule further requires the adviser to provide a concise summary of the adviser’s proxy voting policies and procedures and to provide copies of the complete proxy voting policy and procedures to clients upon request. Lastly, the Rule requires that the adviser disclose to clients how they may obtain information on how the adviser voted their proxies.
| | III. | Policy – Proxies and Corporate Actions |
As a fixed income manager, it is not anticipated that DoubleLine will vote many (if any) proxies. However, because this Proxy Policy also applies to voting and/or consent rights of securities held by DoubleLine Clients, DoubleLine will, on behalf of each Client (including the Funds or the Private Funds), with respect to debt securities, vote in circumstances such as, but not limited to, plans of reorganization, and waivers and consents under applicable indentures. The Proxy Policy does not apply, however, to consent rights that primarily entail decisions to buy or sell investments, such as tender or exchange offers, conversions, put options, redemption and Dutch auctions. Such decisions, while considered not to be covered within this Policy, shall be made with the Clients’ best interests in mind. To the extent that voting a proxy is desirable, DoubleLine votes proxies in a manner that it believes is most likely to enhance the economic value of the underlying securities held in client accounts and considers each proposal on a case-by-case basis taking into consideration any relevant contractual obligations as well as other relevant facts and circumstances at the time of the vote. DoubleLine will not respond to proxy solicitor requests unless DoubleLine determines that it is in the best interest of Clients to do so.
B-25
In certain limited circumstances, particularly in the area of structured finance, DoubleLine may, on behalf of clients, enter into voting agreements or other contractual obligations that govern the voting of shares. In the event of a conflict between any such contractual requirements and the Guidelines (listed below), DoubleLine will vote in accordance with its contractual obligations.
In addition, where the Adviser determines that there are unusual costs and/or difficulties associated with voting a proxy, which more typically might be the case with respect to proxies of non-U.S. issuers, the Adviser reserves the right to not vote a proxy unless it determines that the potential benefits of voting the proxy exceed the expected cost to the Client. Other factors that may influence DoubleLine’s determination not to vote a proxy for a debt or equity security include if: (1) the effect on the applicable Client’s economic interests or the value of the portfolio holding is insignificant in relation to the Client’s portfolio; (2) the cost of voting the proxy outweighs the possible benefit to the applicable Client, including, without limitation, situations where a jurisdiction imposes share blocking restrictions which may affect the ability of the portfolio managers to effect trades in the related security; or (3) DoubleLine otherwise has determined that it is consistent with its fiduciary obligations not to vote the proxy.
The Guidelines provide a basis for making decisions in the voting of proxies or corporate actions for Clients of DoubleLine. When voting proxies or corporate actions, DoubleLine’s utmost concern is that all decisions be made solely in the interests of the Client and with the goal of maximizing the value of the Client’s investments. With this goal in mind, the Guidelines cover various categories of voting decisions and generally specify whether DoubleLine will vote (assuming it votes at all) for or against a particular type of proposal. DoubleLine’s underlying philosophy, however, is that its portfolio managers, who are primarily responsible for evaluating the individual holdings of DoubleLine’s clients, are best able to determine how to further client interests and goals and are primarily responsible for determining how to vote proxies in accordance with this policy. The portfolio managers may, in their discretion, take into account the recommendations of appropriate members of DoubleLine’s executive and senior management and, if desired, an outside service.
All proxies or corporate actions received shall be retained by the Chief Risk Officer or designate. Such records shall include whether DoubleLine voted such proxy or corporate actions and, if so, how the proxy was voted. The records also shall be transcribed into a format such that any Client’s overall proxy and corporate actions voting record can be provided upon request.
DoubleLine provides no assurance to former clients that applicable proxy or corporate actions information will be delivered to them.
DoubleLine does not complete proofs-of-claim on behalf of Clients for current or historical holdings; however, DoubleLine will assist clients with collecting information relevant to filing proofs-of-claim when such information is in the possession of DoubleLine. DoubleLine does not undertake to complete or provide proofs-of-claim for securities that had been held any former client. DoubleLine will complete proofs-of-claim for the Funds and Private Funds.
As a fixed income manager, it is not anticipated that DoubleLine will receive regular or frequent notices regarding Class Action lawsuits related to Client portfolio securities. In the event that Client securities become the subject of a Class Action lawsuit, the portfolio manager will assess the value to Clients in participating in such legal action. If the portfolio manager decides that participating in the Class Action is in the Client’s best interest, DoubleLine will submit appropriate documentation on Clients’ behalf, subject to contractual or other authority. DoubleLine may consider any relevant information in determining
B-26
whether participation in a Class Action lawsuit is in a Client’s best interest, including the costs that would be incurred by the Client and the resources that would be expended in participating in a Class Action, including in comparison to the Client pursuing other legal recourse against the issuer. DoubleLine also may choose to notify Clients (other than the Funds and the Private Funds) of the Class Action, which would allow Clients to decide how or if to proceed.
DoubleLine provides no assurance to former clients that applicable class action information will be delivered to them.
| | VI. | Procedures for Lent Securities and Issuers in Share-blocking Countries |
At times, DoubleLine may not be able to vote proxies or take action in respect of corporate actions on behalf of Clients when a Client’s relevant securities are on loan in accordance with the Client’s securities lending program that is controlled by a securities lending agent or custodian acting independently of DoubleLine. Notwithstanding this fact, in the event that DoubleLine becomes aware of a proxy or corporate action voting matter that would enhance the economic value of the client’s position and that position is lent out, DoubleLine will make reasonable efforts to inform the Client that DoubleLine is not able to vote the proxy until or unless the Client recalls the lent security. When such situations relate to the Funds or the Private Funds, DoubleLine will take actions to recall the lent security.
In certain markets where share blocking occurs, shares must be frozen for trading purposes at the custodian or sub-custodian in order to vote. During the time that shares are blocked, any pending trades will not settle. Depending on the market, this period can last from one day to three weeks. Any sales that must be executed will settle late and potentially be subject to interest charges or other punitive fees. For this reason, in blocking markets, the Firm retains the right to vote or not, based on the determination of the Firm’s investment personnel as to whether voting would be in the Client’s best interest.
| | VII. | Procedures for Material Conflicts of Interest |
Should material conflicts of interest arise as to a proxy or corporate action, the proxy or corporate action shall be brought to the attention of the Chief Compliance Officer or designate, who shall involve other executive managers or legal counsel as may be deemed necessary by the Chief Compliance Officer to attempt to resolve such conflicts. Such individuals also shall determine the materiality of such conflict if the conflict cannot be resolved. (An example of a specific conflict of interest that should be brought to the Chief Compliance Officer (or designate) is a situation where a proxy contest involves securities issued by a DoubleLine Client. When in doubt as to a potential conflict, portfolio managers shall bring the proxy to the attention of the Chief Compliance Officer or designate.)
If, after appropriate review, a material conflict is deemed to exist, DoubleLine will seek to resolve any such conflict in the best interest of the Client whose assets it is voting by pursuing any one of the following courses of action: (i) voting (or not voting) in accordance with the voting guidelines or factors set forth in this Policy; (ii) convening a committee consisting of the Chief Compliance Officer and other non-investment executive officers of DoubleLine to assess and resolve the conflict; (iii) voting in accordance with the recommendation of an independent third-party service provider chosen non-investment executive officers of DoubleLine; or (iv) voting (or not voting) in accordance with the instructions of such Client or (v) not voting the Proxy (if consistent with DoubleLine’s fiduciary obligations).
| | VIII. | Procedures for Proxy Solicitation |
B-27
In the event that any Employee of DoubleLine receives a request to reveal or disclose DoubleLine’s voting intention on a specific proxy event, then the Employee must forward the solicitation request to the Chief Compliance Officer or designate. Such requests shall be reviewed with appropriate executive and senior management. Any written requests shall be retained with the proxy files maintained by the Chief Operating Officer or designate.
| | IX. | Additional Procedures for the Funds |
A. Filing Form N-PX
Rule 30b1-4 under the Investment Company Act of 1940 requires mutual funds to file an annual record of proxies voted by a Fund on Form N-PX. Form N-PX must be filed each year no later than August 31 and must contain the Funds’ proxy voting record for the most recent twelve-month period ending June 30.
The Funds rely upon USBFS to prepare and make their filings on Form N-PX. DoubleLine shall assist USBFS by providing information regarding any proxy votes made for the Funds within the most recent twelve-month period ending June 30. DoubleLine shall retain records of any such votes with sufficient information to make accurate annual Form N-PX filings.
B. Providing Policies and Procedures
Mutual funds that invest in voting securities are required to describe in their statements of additional information (“SAIs”) the policies and procedures that they use to determine how to vote proxies relating to securities held in their portfolios.
Funds are required to disclose in shareholder reports that a description of the fund’s proxy voting policies and procedures is available (i) without charge, upon request, by calling a specified toll-free (or collect) telephone number; (ii) on the fund’s website, if applicable; and (iii) on the Commission’s website at http://www.sec.gov. USBFS shall ensure that such disclosures are included when preparing shareholder reports on the Funds’ behalf.
A Fund is required to send this description of the fund’s proxy voting policies and procedures within three business days of receipt of the request, by first-class mail or other means designed to ensure equally prompt delivery. The Funds rely upon USBFS to provide this service.
The Funds may describe file these policies and procedures as part of their registration statements on Form N-1A or chose to include these policies and procedures as part of their registration statement.
A. DoubleLine must maintain the documentation described in this policy for a period of not less than five (5) years from the end of the fiscal year during which the last entry was made on such record, the first two (2) years at its principal place of business. DoubleLine will be responsible for the following procedures and for ensuring that the required documentation is retained.
| | B. | Client request to review proxy votes: |
Any request from a Client, whether written (including e-mail) or oral, received by any Employee of DoubleLine, must be retained.
B-28
The Client Service group will record the identity of the client, the date of the request, and the disposition (e.g., provided a written or oral response to client’s request, referred to third party, not a proxy voting client, other dispositions, etc.).
In order to facilitate the management of proxy voting record keeping process, and to facilitate dissemination of such proxy voting records to clients, the Client Service group will distribute to any Client requesting proxy voting information DoubleLine’s complete proxy voting record for the Client for the period requested. If deemed operationally more efficient, DoubleLine may choose to release its entire proxy voting record for the requested period, with any information identifying a particular client redacted.
Furnish the information requested, free of charge, to the Client within a reasonable time period (within 10 business days). Maintain a copy of the written record provided in response to Client’s written (including e-mail) or oral request. A copy of the written response should be attached and maintained with the Client’s written request, if applicable, and maintained in an appropriate file.
Clients can require the delivery of the proxy voting record relevant to their accounts for the five year period prior to their request.
C. Proxy voting records:
Documents prepared or created by DoubleLine that were material to making a decision on how to vote, or that memorialized the basis for the decision.
Documentation or notes or any communications received from third parties, other industry analysts, third party service providers, company’s management discussions, etc. that were material in the basis for the decision.
The CCO or designate will ensure that Part II of Form ADV is updated as necessary to reflect: (i) all material changes to this policy; and (ii) regulatory requirements related to proxy voting disclosure.
Attachment A to DoubleLine Capital LP and DoubleLine Funds Proxy Voting, Corporate Action and Class Action Policy
Guidelines
The proxy voting decisions set forth below refer to proposals by company management except for the categories of “Shareholder Proposals” and “Social Issue Proposals.” The voting decisions in these latter two categories refer to proposals by outside shareholders.
Governance
| • | | For trustee nominees in uncontested elections |
| • | | For management nominees in contested elections |
• For ratifying auditors, except against if the previous auditor was dismissed because of a disagreement with the company or if the fees for non-audit services exceed 51% of total fees
| • | | For changing the company name |
| • | | For approving other business |
| • | | For adjourning the meeting |
| • | | For technical amendments to the charter and/or bylaws |
B-29
| • | | For approving financial statements |
Capital Structure
| • | | For increasing authorized common stock |
| • | | For decreasing authorized common stock |
| • | | For amending authorized common stock |
| • | | For the issuance of common stock, except against if the issued common stock has superior voting rights |
| • | | For approving the issuance or exercise of stock warrants |
| • | | For authorizing preferred stock, except against if the board has unlimited rights to set the terms and conditions of the shares |
| • | | For increasing authorized preferred stock, except against if the board has unlimited rights to set the terms and conditions of the shares |
| • | | For decreasing authorized preferred stock |
| • | | For canceling a class or series of preferred stock |
| • | | For amending preferred stock |
| • | | For issuing or converting preferred stock, except against if the shares have voting rights superior to those of other shareholders |
| • | | For eliminating preemptive rights |
| • | | For creating or restoring preemptive rights |
| • | | Against authorizing dual or multiple classes of common stock |
| • | | For eliminating authorized dual or multiple classes of common stock |
| • | | For amending authorized dual or multiple classes of common stock |
| • | | For increasing authorized shares of one or more classes of dual or multiple classes of common stock, except against if it will allow the company to issue additional shares with superior voting rights |
| • | | For a stock repurchase program |
| • | | For a reverse stock split, except against if the company does not intend to proportionally reduce the number of authorized shares |
Mergers and Restructuring
| • | | For merging with or acquiring another company |
| • | | For restructuring the company |
| • | | For bankruptcy restructurings |
| • | | For reincorporating in a different state |
| • | | For a leveraged buyout of the company |
| • | | For spinning off certain company operations or divisions |
| • | | Against eliminating cumulative voting |
| • | | For adopting cumulative voting |
Board of Trustees
| • | | For limiting the liability of trustees |
| • | | For setting the board size |
B-30
| • | | For allowing the trustees to fill vacancies on the board without shareholder approval |
| • | | Against giving the board the authority to set the size of the board as needed without shareholder approval |
| • | | For a proposal regarding the removal of trustees, except against if the proposal limits the removal of trustees to cases where there is legal cause |
| • | | For non-technical amendments to the company’s certificate of incorporation, except against if an amendment would have the effect of reducing shareholders’ rights |
| • | | For non-technical amendments to the company’s bylaws, except against if an amendment would have the effect of reducing shareholder’s rights |
Anti-Takeover Provisions
| • | | Against a classified board |
| • | | Against amending a classified board |
| • | | For repealing a classified board |
| • | | Against ratifying or adopting a shareholder rights plan (poison pill) |
| • | | Against redeeming a shareholder rights plan (poison pill) |
| • | | Against eliminating shareholders’ right to call a special meeting |
| • | | Against limiting shareholders’ right to call a special meeting |
| • | | For restoring shareholders’ right to call a special meeting |
| • | | Against eliminating shareholders’ right to act by written consent |
| • | | Against limiting shareholders’ right to act by written consent |
| • | | For restoring shareholders’ right to act by written consent |
| • | | Against establishing a supermajority vote provision to approve a merger or other business combination |
| • | | For amending a supermajority vote provision to approve a merger or other business combination, except against if the amendment would increase the vote required to approve the transaction |
| • | | For eliminating a supermajority vote provision to approve a merger or other business combination |
| • | | Against adopting supermajority vote requirements (lock-ins) to change certain bylaw or charter provisions |
| • | | Against amending supermajority vote requirements (lock-ins) to change certain bylaw or charter provisions |
| • | | For eliminating supermajority vote requirements (lock-ins) to change certain bylaw or charter provisions |
| • | | Against expanding or clarifying the authority of the board of trustees to consider factors other than the interests of shareholders in assessing a takeover bid |
| • | | Against establishing a fair price provision |
B-31
Fairpointe Capital LLC
Proxy Voting Summary
Fairpointe Capital LLC (“Fairpointe”), as a matter of policy and as a fiduciary to our clients, has responsibility for voting proxies for portfolio securities consistent with the best economic interests of the clients. Our firm maintains written policies and procedures as to the handling, research, voting and reporting of proxy voting and makes appropriate disclosures about our firm’s proxy policies and practices. Our policy and practice includes the responsibility to monitor corporate actions, receive and vote client proxies and disclose any potential conflicts of interest as well as making information available to clients about the voting of proxies for their portfolio securities and maintaining relevant and required records. Clients may obtain information with respect to the voting of proxies for their securities by contacting their portfolio manager or the firm’s compliance officer.
Fairpointe has retained Risk Metric’s ISS and Broadridge’s ProxyEdge service to assist in the proxy voting process. The Portfolio Managers review each proxy and will approve or override the recommendations of ISS according to the firm’s guidelines. The proxies are voted electronically with Broadridge’s ProxyEdge system. Complete records of proxy votes are maintained electronically through ProxyEdge.
As a matter of firm policy the following guidelines are intended to assist in the proxy voting process:
| | (a) | Fairpointe generally vote in favor of the following routine matters: name changes, election of directors, appointment of independent auditors, increase in the outstanding common stock or other equity classes, date and place of annual meeting, ratification of directors’ actions on routine matters, indemnification of directors and/or officers; employee stock purchase or ownership plans within dilution limits, annual elections and confidential voting. |
| | (b) | Fairpointe generally votes in favor of mergers, acquisitions, restructurings, re-incorporations, changes in capitalization and employee and director compensation within reason and when pay and performance are aligned. However, other financial issues may need additional consideration and may involve issues such as hostile takeovers and mergers. |
| | (c) | Fairpointe will generally vote against any proposal that attempts to limit shareholder democracy, such as increased indemnification for directors and officers, certain supermajority rights, classified boards, cumulative voting, authorization of new securities that are unduly dilutive and amending state of corporation. |
| | (d) | Fairpointe intends to vote on a case-by-case basis on social issues. |
| | (e) | A client may have their own set of proxy voting guidelines which may conflict with Fairpointe or another client. If such situation arises, it is our intention to comply with client guidelines by voting proxies attributable to that client on a proportionate basis. |
Should a conflict of interest arise, Fairpointe will resolve the conflict with the view of the best interest of the investors. If Fairpointe determines there is a material conflict of interest in connection with a proxy vote, Fairpointe will vote clients’ proxies according to recommendations made by ISS, an independent third party.
B-32
Harrison Street Securities, LLC
Proxy Voting
Policy
HSS, as a matter of policy and as a fiduciary to our clients, has responsibility for voting proxies for portfolio securities consistent with the best economic interests of the clients. Our firm maintains written policies and procedures as to the handling, research, voting and reporting of proxy voting and makes appropriate disclosures about our firm’s proxy policies and practices. Our policy and practice includes the responsibility to monitor corporate actions, receive and vote client proxies and disclose any potential conflicts of interest as well as making information available to clients about the voting of proxies for their portfolio securities and maintaining relevant and required records.
Background
Proxy voting is an important right of shareholders and reasonable care and diligence must be undertaken to ensure that such rights are properly and timely exercised.
Investment advisers registered with the SEC, and which exercise voting authority with respect to client securities, are required by Rule 206(4)-6 of the Advisers Act to (a) adopt and implement written policies and procedures that are reasonably designed to ensure that client securities are voted in the best interests of clients, which must include how an adviser addresses material conflicts that may arise between an adviser’s interests and those of its clients; (b) to disclose to clients how they may obtain information from the adviser with respect to the voting of proxies for their securities; (c) to describe to clients a summary of its proxy voting policies and procedures and, upon request, furnish a copy to its clients; and (d) maintain certain records relating to the adviser’s proxy voting activities when the adviser does have proxy voting authority.
Responsibility
The Director of Operations has the responsibility for the implementation and monitoring of our proxy voting policy, practices, disclosures and record keeping, including outlining our voting guidelines in our procedures.
Procedure
HSS has adopted procedures to implement the firm’s policy and reviews to monitor and ensure the firm’s policy is observed, implemented properly and amended or updated, as appropriate, which include the following:
Voting Procedures
Ÿ All employees will forward any proxy materials received on behalf of clients to the Director of Operations;
Ÿ The Director of Operations will determine which client accounts hold the security to which the proxy relates;
Ÿ Absent material conflicts, the Director of Operations will determine how HSS should vote the proxy in accordance with applicable voting guidelines, complete the proxy and vote the proxy in a timely and appropriate manner.
Disclosure
• HSS will provide conspicuously displayed information in its Disclosure Document summarizing this proxy voting policy and procedures, including a statement that clients may request information regarding how HSS voted a client’s proxies, and that clients may request a copy of these policies and procedures.
• The Director of Operations will also send a copy of this summary to all existing clients who have previously received HSS’s Disclosure Document; or the Director of Operations
B-33
may send each client the amended Disclosure Document. Either mailing shall highlight the inclusion of information regarding proxy voting.
Client Requests for Information
• All client requests for information regarding proxy votes, or policies and procedures, received by any employee should be forwarded to the Director of Operations.
• In response to any request the Director of Operations will prepare a written response to the client with the information requested, and as applicable will include the name of the issuer, the proposal voted upon, and how HSS voted the client’s proxy with respect to each proposal about which client inquired.
Voting Guidelines
• In the absence of specific voting guidelines from the client, HSS will vote proxies in the best interests of each particular client. HSS’s policy is to vote all proxies from a specific issuer the same way for each client absent qualifying restrictions from a client. Clients are permitted to place reasonable restrictions on HSS’s voting authority in the same manner that they may place such restrictions on the actual selection of account securities.
• HSS will generally vote in favor of routine corporate housekeeping proposals such as the election of directors and selection of auditors absent conflicts of interest raised by an auditors non-audit services.
• HSS will generally vote against proposals that cause board members to become entrenched or cause unequal voting rights.
• In reviewing proposals, HSS will further consider the opinion of management and the effect on management, and the effect on shareholder value and the issuer’s business practices.
Conflicts of Interest
• HSS will identify any conflicts that exist between the interests of the adviser and the client by reviewing the relationship of HSS with the issuer of each security to determine if HSS or any of its employees has any financial, business or personal relationship with the issuer.
• If a material conflict of interest exists, the Director of Operations will determine whether it is appropriate to disclose the conflict to the affected clients, to give the clients an opportunity to vote the proxies themselves, or to address the voting issue through other objective means such as voting in a manner consistent with a predetermined voting policy or receiving an independent third party voting recommendation.
• HSS will maintain a record of the voting resolution of any conflict of interest.
Recordkeeping
The Director of Operations shall retain the following proxy records in accordance with the SEC’s five-year retention requirement.
• These policies and procedures and any amendments;
• Each proxy statement that HSS receives;
• A record of each vote that HSS casts;
• Any document HSS created that was material to making a decision how to vote proxies, or that memorializes that decision including periodic reports to the Director of Operations or proxy committee, if applicable.
• A copy of each written request from a client for information on how HSS voted such client’s proxies, and a copy of any written response.
(NOTE: In the event an adviser retains the research, voting and/or recordkeeping services of an outside
B-34
proxy firm, the adviser must tailor its proxy policy and procedures to be consistent with the services received and the firm’s actual proxy handling and voting processes.)
In addition, advisers should conduct initial due diligence reviews of any proxy service firm engaged as well as oversight on an on-going or periodic basis. These reviews of the proxy firms’ services and practices should include conflicts of interest, consistency of voting with guidelines, fees and disclosures, as relevant, among other things. Advisers as a matter of best practices should document any initial and oversight reviews.
B-35
Herndon Capital Management
Proxy Voting Policy
Herndon Capital Management, LLC (“HCM”) has a fiduciary obligation to, at all times, place the best interest of advisory clients (e.g. plan participants and beneficiaries) as the sole consideration when voting proxies of portfolio companies. HCM has retained Glass Lewis & Co. (“GL”) for proxy voting services. GL will analyze the voting issues and carry out the actual voting process in accordance with its guidelines which have been agreed to by HCM’s Proxy Committee. Proxy issues receive consideration based on all relevant facts and circumstances.
Some accounts for which HCM is investment manager may wish to retain responsibility for proxy voting or to assign that responsibility to a different investment manager. Such accounts must either provide HCM with a plan document that expressly precludes HCM from voting proxies or include in the contract that HCM will not vote their proxies. In the absence of such documentation HCM has the legal responsibility and the obligation to vote for its accounts, and will do so through GL.
Proxy Committee. HCM has established a Proxy Committee. The Proxy Committee considers its fiduciary responsibility to all clients when addressing proxy issues. The Proxy Committee has reviewed and agreed with GL’s proxy voting guidelines and instructed them to vote on HCM’s behalf in accordance with those guidelines for HCM’s clients. As GL amends their guidelines the Proxy Committee will review and based on the agreement of the terms will provide GL voting instruction.
HCM provides GL with the list of accounts and their holdings monthly to ensure that GL has record of the clients and their holdings for proxy purposes.
The Proxy Committee meets at least annually to review any guideline changes from GL, should any exist.
In compliance with the U. S. Department of Labor, the Director of Marketing and Operations maintains applicable records regarding proxy voting for accounts. The Director of Marketing and Operations can access a report online on any given day. Any voting decision that may require a deviation from the standard policies will be deferred to the Proxy Committee from GL for further analysis and a final decision. In these rare situations, outside legal counsel may be sought for additional guidance, and reasons for such action will be noted in the committee’s “special” meeting minutes.
ERISA Accounts. It is HCM’s policy to fully comply with ERISA requirements regarding proxy voting. Some ERISA accounts for which HCM is investment manager may wish to retain responsibility for proxy voting or to assign that responsibility to a different investment manager. Such accounts must either provide HCM with a plan document that expressly precludes HCM from voting proxies or include in the client agreement that HCM will not vote proxies on their behalf. In the absence of such documentation HCM has the legal responsibility and the obligation to vote for its ERISA accounts.
Material Conflicts. Regardless of material conflict, HCM through GL will, at all times, vote in the best interest of the client.
Criteria. GL on behalf of HCM votes proxies related to securities held by clients in a manner solely in the interest of the client, which is in accordance with written GL guidelines. Proxy votes generally will be cast in favor of proposals that maintain or strengthen the shared interest of shareholders and management, increase shareholder value, maintain or increase shareholder influence over the issuer’s board of directors and management, and maintain or increase the rights of shareholders; proxy votes generally will be cast
B-36
against proposals having the opposite effect. In voting on each and every issue, GL shall vote in the prudent and diligent fashion and only after a careful evaluation of the issue presented on the ballot.
Checks and Balances. Periodically, HCM will:
| | 1. | Spot check to verify that proxies received have been voted in a manner consistent with the Proxy Voting Policies and Procedures and the guidelines (if any) issued by the client, or in the case of an employee benefit plan, the plan’s trustee or other fiduciaries; |
| | 2. | Provide a proxy voting report to those clients that request it; in a manner consistent with the client’s request, which may vary. |
HCM through GL will provide investment company clients with the information necessary to comply with filing requirements of Form N-PX on a timely basis.
B-37
Lake Partners, Inc.
Proxy Voting
November 29, 2004
As amended: March 6, 2009
Policy
Lake Partners, Inc. (the “Adviser”) has adopted these policies and procedures in accordance with Rule 206(4)-6 under the Investment Advisers Act of 1940 (the “Advisers Act”). These policies and procedures are designed to ensure that the Adviser is administering proxy voting matters in a manner consistent with the best interests of its clients and in accordance with its fiduciary duties under the Advisers Act and other applicable laws and regulations.
The Adviser considers the proxy vote to be an asset of the client portfolio holding the security to which the proxy relates and for which the Adviser has voting authority. The Adviser’s authority to vote proxies is established by the investment management agreement (as amended from time to time) and/or the brokerage account application agreement with the client. In all circumstances, the Adviser will comply with specific client directions to vote proxies, whether or not such client directions deviate from the Adviser’s policies and procedures.
The Adviser seeks to discharge its fiduciary duty to clients for whom it has proxy voting authority by monitoring corporate events and voting proxies solely in the best interests of its clients. The Adviser evaluates all proxy proposals on an individual basis. Subject to its contractual obligations, there may be times when refraining from voting a proxy is in a client’s best interest, such as when the Adviser determines that the cost of voting the proxy exceeds the expected benefit to the client.
The Adviser typically is neither an activist in corporate governance nor an automatic supporter of management on all proxy proposals. Generally, the Adviser will oppose management in order to further the independence of the board of directors, to preserve the rights of shareholders (such as by resisting attempts to entrench management), and to oppose compensation packages that the Adviser deems to be excessive.
Proxy Committee: Proxy Voting Guidelines
The Adviser has established a Proxy Committee. The members of the Proxy Committee are appointed by the Board of Directors of the Adviser from time to time and are listed on Attachment A. The Proxy Committee meets at least annually and as necessary to fulfill its responsibilities. A majority of the members of the Proxy Committee constitutes a quorum for the transaction of business. The Controller acts as secretary of the Proxy Committee and maintains a record of Proxy Committee meetings and actions.
The Proxy Committee is responsible for (i) the oversight and administration of proxy voting on behalf of the Adviser’s clients, including developing, authorizing, implementing and updating the Adviser’s proxy voting policies and procedures; (ii) overseeing the proxy voting process; and (iii) engaging and overseeing any third party service provider as voting agent to receive proxy statements and/or to provide information, research or other services intended to facilitate the proxy voting decisions made by the Adviser. The Proxy Committee typically reviews reports on
B-38
the Adviser’s proxy voting activity at least annually and as necessary to fulfill its responsibilities. The Proxy Committee reports to the Adviser’s Board of Directors at least annually regarding the administration of these policies and procedures and any changes deemed appropriate.
The Proxy Committee has developed a set of criteria for evaluating proxy issues. These criteria and general voting guidelines are set forth in the Adviser’s Proxy Voting Guidelines (the “Guidelines”), a copy of which is attached hereto as Attachment B. The Proxy Committee may amend or supplement the Guidelines from time to time. All Guidelines are to be applied generally and not absolutely, such that the Adviser’s evaluation of each proposal will be performed in the context of the Guidelines giving appropriate consideration to the circumstances of the company or investment company whose proxy is being voted.
Proxy Voting Procedure
The Adviser establishes with respect to each client account whether the client retains the power to vote proxies or has delegated the responsibility for proxy voting to the Adviser. In every case where a client has delegated responsibility for voting proxies to the Adviser, the Adviser tracks the occurrence of shareholder meetings, and obtains and evaluates the proxy information provided by the companies whose shares are being voted.
Prior to a proxy voting deadline, the appropriate analyst of the Adviser (who may be a member of the Proxy Committee) will make a determination as to how to vote each proxy proposal based on his or her analysis of the proposal and the Guidelines. In evaluating a proxy proposal, an analyst may consider information from many sources, including management of the company or investment company, shareholder groups and independent proxy research services. An analyst may determine that the cost of voting a proxy exceeds the expected benefit to the client. For example, calling back securities that have been loaned in order to exercise voting rights could cause a client to forego income that otherwise would have been earned had the Adviser not sought to exercise voting rights with respect to those securities.
The Adviser is responsible for submitting, or arranging the submission of, the proxy votes to the shareholders meetings in a timely manner.
The Adviser will use echo voting for the investment company shares when required by law.
Conflicts of Interest
The Adviser may have a conflict of interest in voting a particular proxy. A conflict of interest could arise, for example, as a result of a business relationship with a company or investment company, or a direct or indirect business interest in the matter being voted upon, or as a result of a personal relationship with corporate directors or candidates for directorships. Whether a relationship creates a material conflict of interest will depend upon the facts and circumstances. Whenever an analyst determines that it is in a client’s best interest to vote on a particular proposal in a manner other than in accordance with the Guidelines (or the Guidelines do not address how to vote on the proposal), the analyst shall present the matter to the Proxy Committee, which shall be responsible for evaluating information relating to conflicts of interest in connection with voting the client proxy.
A. Identifying Conflicts of Interest
For purposes of identifying conflicts under these procedures, the Proxy Committee will rely on
B-39
publicly available information about a company or investment company and its affiliates, information about the company or investment company and its affiliates that is generally known by the Adviser’s employees, and other information actually known by a member of the Proxy Committee.
The Proxy Voting Committee may determine that the Adviser has a conflict of interest as a result of the following:
1. Significant Business Relationships – The Proxy Committee will consider whether the matter involves an issuer or proponent with which the Adviser has a significant business relationship. The Adviser has significant business relationships with certain entities, such as other investment advisory firms, vendors, clients and broker-dealers. For this purpose, a “significant business relationship” is one that might create an incentive for the Adviser to vote in favor of management.
2. Significant Personal or Family Relationships – The Proxy Committee will consider whether the matter involves an issuer, proponent or individual with which an employee of the Adviser who is involved in the proxy voting process may have a significant personal or family relationship. For this purpose, a “significant personal or family relationship” is one that would be reasonably likely to influence how the Adviser votes the proxy. Employees of the Adviser who are involved in the proxy voting process (e.g., analysts, portfolio managers, Proxy Committee members, senior management, as applicable) are required to disclose to the Proxy Committee any significant personal or family relationship they may have with the issuer, proponent or individual involved in the matter.
3. Contact with Proxy Committee Members – If an employee of the Adviser not involved in the proxy voting process contacts any Proxy Committee member for the purpose of influencing how a proxy is to be voted, the member will immediately contact the Adviser’s Chief Compliance Officer who will determine: (i) whether to treat the proxy in question as one involving a material conflict of interest; and (ii) if so, whether the member of the Proxy Committee who was contacted should recuse himself or herself from all further matters regarding the proxy.
B. Determining Whether a Conflict is Material
In the event that the Proxy Committee determines that the Adviser has a conflict of interest with respect to a proxy proposal, the Proxy Committee shall also determine whether the conflict is “material” to that proposal. The Proxy Committee may determine on a case-by-case basis that a particular proposal does not involve a material conflict of interest. To make this determination, the Proxy Committee must conclude that the proposal is not directly related to the Adviser’s conflict with the issuer. If the Proxy Committee determines that a conflict is not material, then the Adviser may vote the proxy in accordance with the recommendation of the analyst.
C. Voting Proxies Involving a Material Conflict
In the event that the Proxy Committee determines that the Adviser has a material conflict of interest with respect to a proxy proposal, the proposal shall be voted in accordance with Lake Partners’ proxy voting guidelines. However, if a material conflict of interest is identified and the guidelines do not address how to vote on the proposal, the Proxy Committee may: (i) contact an independent third party to recommend how to vote on the proposal and vote in accordance with
B-40
the recommendation of such third party (or have the third party vote such proxy); or (ii) fully disclose the nature of the conflict to the client and obtain the client’s consent as to how Lake Partners shall vote on the proposal (or otherwise obtain instructions from the client as to how the proxy should be voted).
The Adviser may not address a material conflict of interest by abstaining from voting, unless the Proxy Committee has determined that abstaining from voting on the proposal is in the best interests of clients.1
The Proxy Committee shall document the manner in which proxies involving a material conflict of interest have been voted as well as the basis for any determination that the Adviser does not have a material conflict of interest in respect of a particular matter. Such documentation shall be maintained with the records of the Proxy Committee.
5. DISCLOSURE
In accordance with the Advisers Act, the Adviser reports upon request to its clients regarding the manner in which their proxies are voted. It is the Adviser’s general policy not to disclose to any issuer or third party how it has voted client proxies, except as otherwise required by law.
6. RECORD RETENTION
The Adviser maintains the books and records required by Rule 204-2(c)(2) under the Advisers Act in the manner and for the periods required.
Attachments
Attachment A – Members of the Proxy Committee
Attachment B – Lake Partners, Inc. Proxy Voting Guidelines
| 1 | The existence of a material conflict of interest will not affect an analyst’s determination that it is in the best interests of clients not to vote a proxy. |
B-41
Attachment A
Members of the Proxy Committee
Members of the Proxy Committee
Ronald A. Lake, Co-Chairman, President, Director
Frederick C. Lake, Co-Chairman, Secretary, Treasurer
Maurice A. Cabral, Controller, Chief Compliance Officer
B-42
Attachment B
Lake Partners, Inc.
Proxy Voting Guidelines
One of the primary factors Lake Partners, Inc. (the “Adviser”) considers when determining the desirability of investing in a [particular company] or investment company is the quality and depth of its management. Accordingly, the Adviser believes that the recommendation of management on any issue should be given substantial weight in determining how proxy issues are resolved. As a matter of practice, the Adviser will vote on most issues presented in a [company] or investment company proxy statement in accordance with the position of the company’s management, unless the Adviser determines that voting in accordance with management’s recommendation would adversely affect the investment merits of owning the security. However, the Adviser will consider each issue on its own merits, and will not support the position of the company’s management in any situation where, in the Adviser’ judgment, it would not be in the best interests of the client to do so.
The Adviser generally characterizes proxy voting issues into three Levels (I, II and III). The Level of proposal will determine the depth of research required by the analyst when deciding how to vote each proxy. Level I matters normally are voted based on the recommendation of the issuer’s management. Matters that could meaningfully impact the position of existing shareholders (Levels II and III) are given special consideration and voted in a manner that is believed to support the interests of shareholders. Whenever an analyst determines that it is in a client’s best interest to vote on a particular proposal in a manner other than in accordance with the Guidelines (or the Guidelines do not address how to vote on the proposal), the analyst shall present the matter to the Proxy Committee, which shall be responsible for evaluating information relating to conflicts of interest in connection with voting the client proxy.
Level I proposals are those which do not propose to change the structure, bylaws, or operations of a company or investment company to the detriment of the shareholders. Given the routine nature of these proposals, proxies will nearly always be voted with management. However, the appropriate analyst of the Adviser will research the issue before making a conclusion as to how a vote would be in the best interest of the client.
- Approval of auditors
- Election of directors and officers of the corporation
- Indemnification provisions for directors
- Liability limitations of directors
- Name changes
- Declaring stock splits
- Elimination of preemptive rights
- Incentive compensation plans
- Changing the date and/or the location of the annual meetings
- Minor amendments to the articles of incorporation
- Employment contracts between the company and its executives and remuneration for directors
- Automatic dividend reinvestment plans
B-43
- Retirement plans, pensions plans and profit sharing plans, creation of and amendments thereto
Issues in this category are more likely to affect the structure and operations of a company or investment company and, therefore, will have a greater impact on the value of a client’s investment. The applicable analyst on the security will review each issue in this category on a case-by-case basis and perform diligent research to make a decision based on the best interest of the client. In those instances where the decision is not clear cut, the analyst will consult with the Proxy Committee and solicit their input. As stated previously, voting decisions will be made based on the perceived best interest of the clients. Level II proposals include:
- Mergers and acquisitions
- Restructuring
- Re-incorporation or formation
- Changes in capitalization
- Increase or decrease in number of directors
- Increase or decrease in preferred stock
- Increase or decrease in common stock
- Material changes in terms for fees or expenses of an investment company
- Material changes in investment policies or guidelines of an investment company
- Stock option plans or other compensation plans
- Social issues
| | B. | Level III (Corporate Governance) Proposals |
The Adviser generally will vote against any management proposal that clearly has the effect of restricting the ability of shareholders to realize the full potential value of their investment. In addition to the steps taken to render a decision in the above-mentioned scenarios (Level I and Level II proposals), the analyst may find it necessary to contact company or investment company management to discuss any such proposal to gain a more complete understanding before casting a vote. Proposals in Level III may include:
- Poison pills
- Golden parachutes
- Greenmail
- Supermajority voting
- Board classification without cumulative voting
- Confidential voting
B-44

Lee Munder Capital Group
Proxy Voting Policy and Procedures
At Lee Munder Capital Group, LLC (“LMCG”) we recognize that many decisions regarding proxy voting may affect the value of a client’s account and therefore should be based on careful consideration. The following proxy voting policy sets forth our general principles and our process for voting on securities held in client accounts where LMCG has discretion to vote proxies. Our authority to vote the proxies of our clients is established by our advisory contracts or comparable documents. In addition to SEC requirements governing advisers, our proxy voting policies reflect the long-standing fiduciary standards and responsibilities for ERISA accounts as well.
General Principles
In order to set a framework within which proxy questions should be considered and voted, the following general principles should be applied:
| | • | | As a fiduciary under ERISA or otherwise, the discretion to vote proxies for client’s account should be exercised keeping in mind a fiduciary’s duty to use its best efforts to preserve or enhance the value of the client’s account. LMCG should vote on proxy questions with the goal of fostering the interests of the client or the participants in the case of an ERISA account. |
| | • | | Proxy questions should be considered within the individual circumstances of the issuer. It is possible that individual circumstances might mean that a given proxy question could be voted differently than what is generally done in other cases. |
| | • | | It is LMCG’s general policy that when we are given authority to vote proxies for a client’s account, we must be authorized to vote all proxies for the account in our discretion. We do not generally accept partial voting authority or instructions from clients on how to vote on specific issues. Certain clients may direct us to vote proxies in accordance with a specific set of guidelines or recommendations appropriate to their circumstances in which case we will not have voting discretion but will vote in accordance with a client’s direction. Our clients may wish to retain proxy voting authority and vote their own proxies if necessary in order to satisfy their individual social, environmental or other goals. |
LMCG maintains a set of proxy voting guidelines that describe in greater detail how we will generally vote specific issues for our clients. While it is not an exhaustive list, it is intended to serve as the foundation on which we make most of our proxy voting decisions. These guidelines are available upon request. LMCG will from time to time review our proxy voting policy and guidelines and may adopt changes from time to time. Clients may contact their Client Service Officer or the Compliance Office by calling (617) 380-5600 or via e-mail at compliance@leemunder.com for a copy of our current guidelines or to obtain a record of how we voted the proxies for their account.
Process
LMCG is responsible for fair and accurate proxy voting and for ensuring that proxies are voted in a timely manner. At LMCG, we have a dedicated Proxy Voting Administrator in the Operations Department who
B-45
oversees the proxy voting process. LMCG has also hired a third-party proxy voting vendor (currently RiskMetrics Group) to assist with monitoring and completing the proxy voting process. LMCG works with RiskMetrics to ascertain that proxies are received and voted on a timely basis, as well as maintaining all of the proxy voting records with respect to our client’s holdings. Each day we send a list of portfolio holdings to RiskMetrics and they notify us of shareholder meetings and provide us with an electronic platform on which to vote proxies. RiskMetrics also provides us with recommendations for voting, based on criteria and guidelines LMCG has established and approved. Portfolio Managers also provide input when appropriate.
Limitations
LMCG may abstain from voting a client proxy if, in its opinion, the value obtained by voting the proxy is outweighed by the unique cost, operational or trading constraints to a client account or situation. In accordance with fiduciary duties, LMCG weighs the costs and benefits of voting certain proxy proposals and makes an informed decision with respect to whether voting a given proxy proposal is prudent.
Some of LMCG’s clients engage in securities lending programs under which shares of an issuer could be on loan while that issuer is conducting a proxy solicitation. As part of the securities lending program, if the securities are on loan at the record date, the proxy for that security generally cannot be voted. Because LMCG is generally not aware of when a security may be on loan, there may no be an opportunity to recall the security prior to record date. Therefore, in most cases, those shares will not be voted.
Conflicts of Interest
LMCG recognizes that the potential for conflicts of interest could arise in situations where we have discretion to vote client proxies and where LMCG has material business relationships or material personal or family relationships. In the event that LMCG holds a security issued by a client in client’s portfolios and we are required to vote that proxy, this situation may also represent a conflict of interest. To address these potential conflicts we have established a Proxy Voting Committee (“Committee”). The Committee consists of the Chief Compliance Officer, Head of Operations and relevant Portfolio Manager (or their designee). The Committee will use reasonable efforts to determine whether a potential conflict may exist, including maintaining a list of clients or securities that may pose a potential conflict. The list will be shared with the Proxy Voting Administrator, proxy votes for the securities on the list will be flagged in the proxy voting system, and a Committee meeting will be scheduled when appropriate by the Operations Group. The Committee will meet to decide how to vote the proxy of any security with respect to which LMCG has identified a potential conflict. The Committee will consider recommendations and make a decision on how to vote the proxy and also document the Committee’s rationale for its decision.
Lee Munder Capital Group, LLC is an indirect majority owned subsidiary of City National Corporation (CYN), a public company. It is LMCG’s general policy not to acquire or hold CYN stock on behalf of our clients. However, in the event that a client were to hold CYN in a portfolio which we manage, and LMCG was responsible for voting CYN on behalf of the client, the Proxy Voting Committee would decide on how to vote.
Recordkeeping
LMCG shall maintain proxy voting records pursuant to Section 206-2 of the Advisers Act. Such records will include a copy of policies and procedures, proxy statements, a record of each vote that is cast, any document created that was material to making a decision on how to vote, as well as a copy of client requests for proxy voting information and responses to such requests. LMCG’s Compliance Office also
B-46
relies on RiskMetrics to provide certain proxy voting details promptly upon request in order to respond to certain requests for information or records.
B-47
Montag & Caldwell, Inc.
Proxy Voting Policy
If directed by Client, decisions on voting of proxies will be made by Montag & Caldwell, LLC (“M&C”) in accordance with these guidelines (as amended from time to time). M&C will consider proxies as a Client asset and will vote consistently across all Client portfolios for which it has discretionary voting authority in the manner believed is most likely to enhance shareholder value. Where practical, M&C may consider requests to vote proxies in accordance with Client specific guidelines.
If M&C is authorized to make decisions on voting of proxies, we will have no obligation to furnish Client any proxies, notices of shareholder meetings, annual reports or other literature customarily mailed to shareholders.
Once discretionary voting authority has been delegated to M&C, Client may not at a later date direct how to vote the proxies. Clients who wish to adhere to a proprietary set of voting guidelines should exercise their right to reserve voting authority rather than delegating this responsibility to M&C.
Should the situation arise where M&C is an investment adviser to a company whose proxy we are authorized to vote or any other potential conflict of interest is perceived and the item falls outside the issues explicitly addressed by these guidelines, the matter will be reviewed by the entire Proxy Committee. If an item is explicitly addressed by these guidelines it will be voted accordingly. If an item falls outside the issues explicitly addressed by these guidelines and we would vote against management, no further review is needed. If further review is needed the Proxy Committee will first determine if the conflict is material. If it is material, the Proxy Committee will determine the steps needed to resolve the conflict before the proxy is voted.
It is against M&C’s policy for employees to serve on the board of directors of a company whose stock could be purchased for M&C’s advisory clients.
The following guidelines establish our position on many common issues addressed in proxy solicitations and represent how we will generally vote such issues; however, all proxy proposals will be reviewed by an investment professional to determine if shareholder interests warrant any deviation from these guidelines or if a proposal addresses an issue not covered in the guidelines.
1. Auditors
M&C will generally vote to ratify auditors, unless:
| | • | | An auditor has a financial interest in or association with the company and is thus not independent, |
| | • | | There is evidence the independent auditor has issued an inaccurate or misleading opinion, |
| | • | | Fees for non-audit services are excessive. |
2. Board of Directors
M&C will generally vote for routine election or re-election of directors.
M&C will generally vote for proposals to repeal classified boards, and to elect all directors annually.
M&C will generally vote against proposals to classify the board.
M&C will generally vote against proposals to allow cumulative voting.
B-48
3. Proxy Contests
M&C will review contested director elections on a case-by-case basis.
4. Takeover Defenses
M&C will generally vote for shareholder proposals requesting that a company submit its poison pill to a shareholder vote or redeem it unless the company has:
| | • | | A shareholder approved poison pill in place, |
| | • | | An acceptable policy covering the future adoption of a poison pill. |
M&C will generally vote for shareholder proposals calling for a poison pill to be put to a vote within a time period of less than one year after adoption.
M&C will review on a case-by-case basis management proposals on poison pill ratification.
M&C will generally vote against proposals to require a supermajority shareholder vote.
M&C will generally vote for proposals to lower supermajority vote requirements.
5. Mergers and Corporate Restructurings
M&C will review mergers, acquisitions, and restructurings on a case-by-case basis.
6. State of Incorporation
M&C will review proposals to change a company’s state of incorporation on a case-by-case basis.
7. Capital Structure
M&C will generally vote to increase the number of shares of common stock authorized, unless:
| | • | | The explicit purpose of the increase is to implement a non-shareholder approved rights plan (poison pill). |
M&C will generally vote against proposals authorizing the creation of new classes of preferred stock with unspecified voting, conversion, dividend distribution, and other rights (“blank check” preferred stock).
M&C will review other proposals regarding preferred stock on a case-by-case basis.
8. Compensation Issues
M&C will review the following issues on a case-by-case basis:
| | • | | Equity Compensation Plans |
| | • | | Employee Stock Purchase Plans – Qualified Plans |
| | • | | Employee Stock Purchase Plans – Non-Qualified Plans |
B-49
9. Corporate Responsibility
Shareholders often submit proposals to change lawful corporate activities in order to meet the goals of certain groups or private interests that they represent.
M&C will support management in instances where we feel acceptable efforts are made on behalf of special interests of social conscience. The burden of corporate responsibility rests with management. We will generally vote AGAINST shareholder proposals regarding the following areas:
| | • | | Drug Pricing and Re-importation |
| | • | | Genetically Modified Foods |
| | • | | Arctic National Wildlife Refuge |
| | • | | Concentrated Area Feeding Operations |
| | • | | Global Warming and Kyoto Protocol Compliance |
| | • | | Political Contributions |
| | • | | Outsourcing/Off-shoring |
| | • | | Country-specific Human Rights Reports |
| | • | | Placing arbitrary restrictions on environmental practices |
10. Administrative Issues
Proxy voting guidelines will be reviewed annually and approved by the Investment Policy Committee.
If a Client’s shares are on loan at the time of voting, it is not M&C’s policy to request that the custodian recall the shares on loan.
M&C will maintain a record of proxy voting guidelines and the annual updates electronically.
M&C has established a Proxy Committee that consists of at least three members of the Investment Policy Committee and includes at least one research analyst and two portfolio managers.
Proxy voting decisions will be made by at least one member of the Proxy Committee within the framework established by these guidelines that are designed to vote in the best interests of all Clients.
M&C will maintain a record of any document created by M&C or procured from an outside party that was material to making a decision how to vote proxies on behalf of a Client or that memorializes the basis of that decision.
M&C will maintain records detailing receipt of proxies, number of shares voted, date voted and how each issue was voted. These records will be available upon request to those Clients for whom we have proxy voting responsibility.
B-50
M&C will maintain records of all written Client requests for information as to how M&C voted proxies on their behalf and of M&C’s written response to the Client’s written or verbal requests.
The proxy voting process will be monitored for accuracy. A voting history report is generated by the Supervisor of Information Processing on a monthly basis. This report is provided to the Chief Compliance Officer to verify against ballot copies.
The Supervisor of Information Processing will provide the Chief Compliance Officer with a quarterly statement that all ballots were received or reasonable steps, under the circumstances, have been taken to obtain the ballots.
Reviewed March 24, 2011
B-51
River Road Asset Management, LLC
Proxy Voting Policies and Procedures
PROXY VOTING
Policy
River Road exercises discretionary voting authority over proxies issued on securities held in client accounts unless the client has explicitly reserved voting authority. Our policy and practice includes the responsibility to receive and vote client proxies, mitigate any potential conflicts of interest, make information available to clients about the voting of proxies for their portfolio securities, and maintain required records. River Road, as a matter of policy and as a fiduciary to our clients, votes proxies for client securities consistent with the best economic interests of the clients. River Road engages a third-party voting agent, Glass Lewis & Co. (“Glass Lewis”), to help discharge its duties.
Background
Registered investment advisers that exercise voting authority with respect to client securities are required by Rule 206(4)-6 of the Advisers Act to do the following:
| | § | Adopt and implement written policies and procedures that are reasonably designed to ensure that client securities are voted in the best interests of clients, which must include how an adviser addresses material conflicts that may arise between an adviser’s interests and those of its clients; |
| | § | Disclose to clients how they may obtain information from the adviser with respect to the voting of proxies for their securities; and |
| | § | Describe to clients a summary of its proxy voting policies and procedures and, upon request, furnish a copy to its clients. |
Advisers also must maintain certain records relating to proxy voting activities (See Books and Records).
Responsibility
The Proxy Voting Policy Committee, the Proxy Voting Procedure Committee, and the Compliance Department are responsible for implementing and monitoring this policy.
Procedure
River Road has adopted the following procedures to implement and monitor the firm’s policy:
Proxy Committees:
River Road established two proxy committees to oversee proxy voting activities.
The Proxy Voting Policy Committee is responsible for establishing voting guidelines and reviewing special issues. The Committee consists at a minimum of the Chief Investment Officer, the Director of Research, the Chief Compliance Officer, and a Compliance Department proxy designee (“Proxy Designee”). The Committee meets annually to review Glass Lewis’ proxy voting guidelines. The Committee must determine and document where River Road disagrees with the agent’s guidelines, if at all, and determine necessary action, if any. The Committee is responsible for adopting the final voting guidelines. The minutes from the meeting will be distributed to the investment team (as necessary) for
B-52
their reference as they make voting decisions throughout the year. Meetings may be called by any Committee member throughout the year, based on issues that arise.
The Proxy Voting Procedure Committee is responsible for operational and procedural aspects of the proxy voting process. The Committee consists at a minimum of the Chief Compliance Officer and the Proxy Designee. The Committee meets annually to review operational or procedural issues related to the proxy process. Meetings may be called by any Committee member throughout the year, based on issues that arise.
Voting Agent: Glass Lewis performs the following services:
| | § | provides analysis of proxy proposals, |
| | § | tracks and receives proxies for which River Road clients are entitled to vote, |
| | § | votes the proxies as directed by River Road, and |
| | § | compiles and provides client voting records. |
Voting Process:
The Proxy Designee coordinates the proxy voting process. The steps for reviewing and submitting votes are as follows:
| | § | The Proxy Designee reviews the Glass Lewis web-based system on at least a weekly basis for upcoming meetings. |
| | § | The Proxy Designee reconciles the number of ballots reflected by Glass Lewis to River Road’s records and reports any discrepancies to Glass Lewis for follow up. River Road makes its best efforts to ensure that all shares are voted. However, issues with receiving ballots from client custodians may prevent voting for a particular account. River Road continues to follow up with Glass Lewis and the custodian where necessary until issues are resolved. |
| | § | If the policy recommendation and the management recommendation for all votes on a ballot are the same, the Proxy Designee will vote accordingly. |
| | § | If the policy recommendation and management recommendation are different for a particular vote, the Proxy Designee distributes Glass Lewis’ proxy paper for the upcoming meeting to the appropriate member of the investment team. The investment team member is responsible for reviewing the proxy paper and making the appropriate vote decision based on this policy and the Proxy Voting Policy meeting minutes. Where the investment team member decides to vote differently from the policy recommendation, they must document the investment rationale. The Proxy Designee then obtains prior approval from the Chief Compliance Officer, the Compliance Manager, or their designee before submitting the vote decision. |
Client Direction: River Road’s policy is to vote all proxies the same way for each client. Clients are permitted to place reasonable restrictions on River Road’s voting authority by providing their own voting guidelines. If clients provide River Road with their voting guidelines and River Road accepts them, River Road will instruct the voting agent to vote proxies pursuant to the client guidelines.
Conflicts of Interest: River Road has eliminated most conflicts of interest by using an independent third party (Glass Lewis) that votes pursuant to the guidelines adopted by the Proxy Voting Policy Committee or in accordance with River Road’s direction after following this process. In cases where River Road believes there may be an actual or perceived conflict of interest, River Road requires additional steps that may include the following:
B-53
| | § | documenting the potential conflict of interest, |
| | § | obtaining the prior approval of the Chief Investment Officer and CCO, |
| | § | obtaining Committee review or approval, |
| | § | deferring to the voting recommendation of a third party, |
| | § | voting pursuant to client direction (following disclosure of the conflict), |
| | § | voting reflectively (in the same proportion and manner as other shareholders), or |
| | § | taking such other action as necessary to protect the interests of clients. |
River Road will maintain a record of the voting resolution of any conflict of interest.
Securities Lending: Where clients have implemented securities lending programs, River Road will be unable to vote proxies for securities on loan unless it issues instructions to the client custodian to callback the securities prior to record date. River Road typically does not instruct custodians to callback securities.
Disclosure and Client Requests for Information: River Road discloses a summary of this policy and information on how clients may obtain a copy of this policy and records of how River Road voted securities for their accounts in Form ADV Part 2A. Employees that receive a client request for information regarding proxy votes or policies and procedures must forward such request to the Compliance Department where necessary. The Compliance Department is responsible for gathering the relevant information.
Testing: The Compliance Department typically performs a monthly review of reconciliations and proxy voting records to ensure the process is being followed.
B-54
Silvercrest Asset Management Group LLC
Proxy Voting
Policies And Procedures
Silvercrest may be responsible for voting on shareholder proxies in connection with the securities held by its clients. Silvercrest will do so only in accordance with these policies and procedures, in the best interests of our clients, and/or as instructed by a specific client.
All capitalized terms used herein shall have the meaning set forth in the Firm’s Code of Conduct and Ethics, unless otherwise defined herein.
A. General.
In voting proxies, and determining whether to vote proxies, Silvercrest is guided by general fiduciary principles. The firm’s goal is to act prudently, and solely in the best interest of the beneficial owners of the accounts it manages. Silvercrest attempts to consider all aspects of its vote that could affect the value of the investment and will vote proxies in the manner that it believes will be consistent with efforts to maximize shareholder values. Silvercrest does not necessarily have an obligation to vote every proxy; for example, Silvercrest may forego voting proxies if the client account that held the position no longer holds the position at the time of the vote, or the cost of voting (such as in the case of a vote regarding a foreign issuer that requires being physically present to vote) outweighs the anticipated benefit to the client’s account.
B. Voting Guidelines.
Silvercrest generally divides proxies into two categories in determining how to vote: management proposals and shareholder proposals. Attached as Exhibit A hereto are guidelines to be applied in determining how to vote in each case. These guidelines are not strict, and each Silvercrest vote will depend on the facts and circumstances of each proposal, on a case-by-case basis. Depending on the facts of a specific vote, Silvercrest may deviate from the guidelines entirely where it deems it necessary in the best interests of our clients, and/or as instructed by a specific client.
C. Conflicts of Interest.
The firm’s policies and procedures regarding conflicts of interest, including those contained in the firm’s Code of Conduct and Ethics, govern those conflicts that arise in the context of proxy voting. Because Silvercrest’s business does not include proprietary trading, investment banking or short selling, few conflicts are likely to arise in the context of proxy voting. However, where they do, the following procedures should be followed.
All conflicts of interest must be brought to the attention of the Chief Compliance Officer for resolution. The Chief Compliance Officer will work with appropriate Silvercrest personnel to determine whether a conflict of interest is material. A conflict of interest will be considered material to the extent that it is determined that such conflict has the potential to influence Silvercrest’s decision-making in voting the proxy. A conflict of interest shall be deemed material in the event that the issuer or a member of management of the issuer that is the subject of the proxy has a client relationship with Silvercrest. All other materiality determinations will be based on an assessment of the particular facts and circumstances. The Chief Compliance Officer shall maintain a written record of all materiality determinations.
If it is determined that a conflict of interest is not material, Silvercrest may vote proxies notwithstanding the existence of the conflict. If it is determined that a conflict of interest is material, the Chief
B-55
Compliance Officer will work with appropriate Silvercrest personnel to agree upon a method to resolve such conflict of interest before voting proxies affected by the conflict of interest. Such methods may include:
• disclosing the conflict to clients and obtaining their consent before voting;
• suggesting to clients that they engage another party to vote the proxy on their behalf;
• engaging a third party to recommend a vote with respect to the proxy based on application of the policies set forth herein; or
• such other action as is deemed appropriate under the circumstances given the nature of the conflict.
D. ProxyEdge.
Silvercrest has contracted with Broadridge (formerly ADP) for the use of its ProxyEdge service, which is the automated solution for proxy voting, and retention of records related thereto.
Upon opening an account for a client, Silvercrest notifies the custodian(s) of the client’s assets and instructs the custodian(s) to direct all proxy notices to Broadridge for Silvercrest. Silvercrest then accesses ProxyEdge to review and vote proxies through the system. A historic record of the firm’s votes is available through ProxyEdge.
E. Notice to Clients.
Silvercrest delivers to clients notice of its proxy voting procedures in a form and format attached hereto as Exhibit B. This notice is sent upon opening an account and clients are also notified annually that they may obtain a copy of the notice upon request.
Associated Persons are encouraged to contact the Chief Compliance Officer with any questions regarding the Firm’s Policies and Procedures Regarding Proxy Voting.
Exhibit A
Proxy Voting General Guidelines
Management Proposals
I. Vote in support of management on the following ballot items, which are fairly common management-sponsored initiatives:
• Elections of directors who do not appear to have been remiss in the performance of their oversight responsibilities
• Approval of auditors
• Directors’ and auditors’ compensation
• Directors’ liability and indemnification
• Discharge of board members and auditors
• Financial statements and allocation of income
• Dividend payouts that are greater than or equal to country and industry standards
• Authorization of share repurchase programs
• General updating of or corrective amendments to charter
• Change in Corporation Name
• Elimination of cumulative voting
II. Vote in support of management on the following items, which have potentially substantial
B-56
financial or best-interest impact:
• Capitalization changes which eliminate other classes of stock and voting rights
• Changes in capitalization authorization for stock splits, stock dividends, and other specifiedneeds
which are no more than 50% of the existing authorization for U.S. companies and no more than
100% of existing authorization for non-U.S. companies
• Elimination of pre-emptive rights for share issuance of less than a given percentage (country
specific - ranging from 5% to 20%) of the outstanding shares
• Elimination of “poison pill” rights
• Stock purchase plans with an exercise price of not less that 85% of fair market value
• Stock option plans which are incentive based and not excessive
• Other stock-based plans which are appropriately structured
• Reductions in super-majority vote requirements
• Adoption of anti- “greenmail” provisions
III. Vote against management (or do not vote in favor of management) on the following items, which
have potentially substantial financial or best interest impact:
• Capitalization changes that add “blank check” classes of stock or classes that dilute the voting
interests of existing shareholders
• Changes in capitalization authorization where management does not offer an appropriate rationaleor which are contrary to the best interest of existing shareholders
• Anti-takeover and related provisions that serve to prevent the majority of shareholders fromexercising their rights or effectively deter appropriate tender offers and other offers
• Amendments to by-laws which would require super-majority shareholder vote to pass or repealcertain provisions
• Elimination of Shareholders’ Right to Call Special Meetings
• Establishment of classified boards of directors
• Reincorporation in a state which has more stringent anti-takeover and related provisions
• Shareholder rights plans that allow the board of directors to block appropriate offers toshareholders or which trigger provisions preventing legitimate offers from proceeding
• Excessive compensation
• Change-in-control provisions in non-salary compensation plans, employment contracts, andseverance agreements which benefit management and would be costly to shareholders if triggered
• Adjournment of Meeting to Solicit Additional Votes
• “Other business as properly comes before the meeting” proposals which extend “blank check“powers to those acting as proxy
Shareholder Proposals
Traditionally, shareholder proposals have been used to encourage management and other shareholders to
address socio-political issues. In accordance with ERISA, the investment manager holds that it is
inappropriate to use plan assets to attempt to affect such issues. Thus, examine shareholder proposals
primarily to determine their economic impact on shareholders.
I. Vote in support of shareholders on the following ballot items, which are fairly commonshareholder-sponsored initiatives:
• Requirements that auditors attend the annual meeting of shareholders
• Establishment of an annual election of the board of directors
• Mandates requiring a majority of independent directors on the Board of Directors and the audit,nominating, and compensation committees
B-57
• Mandates that amendments to bylaws or charters have shareholder approval
• Mandates that shareholder-rights plans be put to a vote or repealed
• Establishment of confidential voting
• Expansions to reporting of financial or compensation-related information, within reason
• Repeals of various anti-takeover related provisions
• Reduction or elimination of super-majority vote requirements
• Repeals or prohibitions of “greenmail” provisions
• “Opting-out” of business combination provisions
II. Vote against shareholders (or do not vote in favor of shareholders) on the following initiatives,which are fairly common shareholder-sponsored initiatives:
• Limits to tenure of directors
• Requirements that candidates for directorships own large amounts of stock before being eligible to be elected
•Restoration of cumulative voting in the election of directors
• Requirements that the company provide costly, duplicative, or redundant reports; or reports of a non-business nature
• Restrictions related to social, political, or special interest issues which affect the ability of thecompany to do business or be competitive and which have significant financial or best-interest impact
• Proposals which require inappropriate endorsements or corporate actions
Exhibit B
NOTICE TO CLIENTS CONCERNING SILVERCREST ASSET MANAGEMENT’S
PROXY VOTING POLICIES AND PROCEDURES
In voting proxies, and determining whether to vote proxies, Silvercrest Asset Management Group LLC is guided by general fiduciary principles. The firm’s goal is to act prudently, and solely in the best interest of the beneficial owners of the accounts it manages. Silvercrest attempts to consider all aspects of its vote that could affect the value of the investment and will vote proxies in the manner that it believes will be consistent with efforts to maximize shareholder values.
Enclosed are the firm’s guidelines with respect to proxy voting determinations. These guidelines are not strict, and each Silvercrest vote will depend on the facts and circumstances of each proposal, on a caseby-case basis. Depending on the facts of a specific vote, Silvercrest may deviate from the guidelines entirely where it deems it necessary in the best interests of our clients, and/or as instructed by a specific client.
After careful review and consideration, Silvercrest Asset Management Group has contracted with Broadridge (formerly ADP) for use of its ProxyEdge service for proxy data collection, vote submission and record storage.
Should you have any questions or concerns about any of this information, please feel free to contact me at kcampione@silvercrestgroup.com or by phone at (212) 649-0672.
B-58
TAMRO CAPITAL PARTNERS, LLC
PROXY VOTING
POLICIES AND PROCEDURES
Policy
TAMRO, as a matter of policy and as a fiduciary to clients, has responsibility for voting proxies for portfolio securities consistent with the best economic interests of clients. The Company maintains written policies and procedures as to the handling, research, voting and reporting of proxy voting and makes appropriate disclosures about the Company’s proxy policies and practices. Company policy and practice includes the responsibility to monitor corporate actions, receive and vote client proxies and disclose any potential conflicts of interest as well as make information available to clients about the voting of proxies for their portfolio securities and maintaining relevant and required records.
Unless voting authority has been explicitly reserved by the governing documents for the client or another party, TAMRO will exercise discretionary voting authority over proxies issued on securities held in client accounts. It is TAMRO policy to vote with a focus on the basis of the investment implications of each issue and in a manner that the Company believes is in the best interest of its clients.
Where possible, it is TAMRO policy to take action on behalf of clients with regard to portfolio holdings which are subject to mandatory corporate actions (of a non-proxy nature) so long as the Company is in a position to: (1) have reason to know that the client portfolio holds such a security for which there is a corporation action; and (2) have receipt of notice of corporate action from the client custodian who maintains custody of such security on behalf of the client. Common corporate actions include tender offers, spin-offs, mergers/de-mergers, and name changes.
Background
Proxy voting is an important right of shareholders and reasonable care and diligence must be undertaken to ensure that such rights are exercised properly and in a timely fashion. Investment advisers registered with the SEC, and who exercise voting authority with respect to client securities, are required by Rule 206(4)-6 of the Advisers Act to: (1) adopt and implement written policies and procedures that are reasonably designed to ensure that client securities are voted in the best interests of clients, which must include how an adviser addresses material conflicts that may arise between an adviser’s interests and those of its clients; (2) disclose to clients how they may obtain information from the adviser with respect to the voting of proxies for their securities; (3) describe to clients a summary of its proxy voting policies and procedures and, upon request, furnish a copy to its clients; and (4) maintain certain records relating to the adviser’s proxy voting activities when the adviser does have proxy voting authority.
B-59
Responsibility
It is the designated proxy voting specialist’s responsibility to review all proxies and the proxy voting service provider’s recommendations on how to vote each proxy. The person designated as the proxy voting specialist changes periodically and “proxy voting specialist” is not part of their formal job title, though it is part of their formal employment responsibilities. Please see the CCO to determine who this employee is at any given point in time. The proxy voting specialist brings proxy votes to the attention of the Investment Team for discussion when warranted. The Investment Team and its designated proxy service provider have the responsibility for the implementation and monitoring of the Company’s proxy voting policy, practices, disclosures and record keeping. The Investment Team considers the recommendations of the proxy service provider, but may override such recommendations as deemed appropriate. The CIO is responsible for all override approvals.
It is the responsibility of client custodians to notify the Company of pending corporate actions which impact securities held in client portfolios managed by TAMRO.
Procedures / Internal Controls
TAMRO has adopted procedures to implement, monitor, and amend as necessary the Company’s corporate action and proxy policies, as summarized below.
Role of Investment Team
It is the responsibility of the Investment Team to oversee the proxy process. At least annually, the Investment Team is responsible for approving or amending the guidelines it has established, reviewing the performance of the proxy service provider, and addressing any procedural issues that may arise in proxy voting processes. Meetings may be called by any Investment Team member throughout the year, based on issues that arise.
Proxy Voting
The proxy service provider offers analysis of proxy proposals, tracks and receives proxies for which TAMRO clients are entitled to vote, recommends proxy votes pursuant to agreed upon guidelines and compiles and provides voting records for the Company.
The steps for reviewing and submitting votes are as follows:
| | • | | The proxy voting specialist reviews the proxy system on a weekly basis |
| | • | | The proxy voting specialist reviews the voting agendas, determines if there are any issues to report to the Investment Team, documents evidence of Investment Team review of any issues, and maintains the copies in a proxy file. |
| | • | | Once a week the Operations Department submits a file of current clients and their holdings to the proxy provider. Only clients that have delegated voting to TAMRO are included in this feed. |
| | • | | Monthly, TAMRO and proxy service provider carry out a full account list reconciliation. |
| | • | | If the Investment Team chooses to override the proxy service provider’s recommendations, the CIO will approve the override. This approval will typically be documented in Investment Meeting notes; however, other documentation may occasionally be more appropriate. Documentation of CIO override approval is maintained by the proxy voting specialist. |
| | • | | The CCO, or designee, will review on a periodic basis the proxy files to ensure there is evidence of review. |
Under certain circumstances, TAMRO may choose not to vote proxies. Where clients have implemented securities lending programs, TAMRO will be unable to vote proxies on behalf of securities unless it
B-60
issues instructions to the client custodian to retrieve the securities prior to record date. TAMRO may choose to refrain from calling back such securities when the voting of the proxy is not deemed to be material or the benefits of voting do not outweigh the cost of terminating the particular lending arrangement.
Voting Guidelines
In the absence of specific voting guidelines from the client, TAMRO will vote proxies in the best interests of each particular client. The Company’s policy is to vote all proxies from a specific issuer the same way for each client absent qualifying restrictions from a client. Clients are permitted to place reasonable restrictions on the Company’s voting authority in the same manner that they may place such restrictions on the actual selection of account securities.
Conflicts of Interest
There may be instances where the Company or its access persons are subject to conflicts of interest in the voting of proxies. Conflicts of interest may exist, for example, due to personal or familial relationships of personnel or when TAMRO has a business relationship with, or is soliciting business from, the issuing company (or an employee group of a company), or a third party that is a proponent of a particular outcome on a proxy issue. The Investment Team is responsible to assess all aspects of the relationship between TAMRO and the issuing company in order to identify any possible or real conflicts of interest. Issues raising possible conflicts of interest are discussed by the Investment Team prior to the point of vote casting. With respect to personal conflicts of interest, the TAMRO Code of Ethics requires all employees to avoid placing themselves in a position where their interests may conflict with those of clients and restricts their ability to engage in certain outside business activities. Investment Team members with a personal conflict of interest regarding a particular proxy vote must recuse themselves from the proxy voting process with respect to the proxy in question. TAMRO requires documentation regarding potential conflicts of interest. In cases where it believes there may be an actual or perceived conflict of interest, the Company requires additional steps that may include obtaining the prior approval of the CCO, obtaining Investment Team review or approval, deferring to the voting recommendation of a third party, voting pursuant to client direction (following disclosure of the conflict), abstaining from voting, voting reflectively (in the same proportion and manner as other shareholders) or taking such other action as necessary to protect the interests of clients. In all such cases, proxy records will fully reflect such conflicts and their resolution, and include evidence of approvals as necessary.
Recordkeeping
TAMRO and the service provider shall retain the following proxy records in accordance with SEC retention requirements:
| | • | | These policies and procedures and any amendments. |
| | • | | Each proxy statement that TAMRO receives. |
| | • | | A record of each vote that TAMRO casts. |
| | • | | Any document TAMRO created that was material to making a decision how to vote proxies, or that memorializes that decision. |
| | • | | A copy of each written request from a client for information on how TAMRO voted such client’s proxies, and a copy of any written response. |
Disclosure
| | • | | TAMRO will provide information in its Form ADV Part 2A summarizing proxy voting policy and procedures, including a statement that clients may request information regarding how the Company voted proxies, and that clients may request a copy of these policies and procedures. Form ADV Part 2 A and B are provided at the time of contract execution and Part A is at least offered annually thereafter with a summary of material changes. |
B-61
Other Corporate Actions
| | • | | At the time of a new client relationship, TAMRO shall direct the client’s custodian to add the Company to the mailing/notification list should a corporate action notice come to the attention of the custodian for a holding in the client’s TAMRO portfolio. Copies of corporate action notices should be sent to the attention of the Trader. |
| | • | | The Investment Team shall act upon all such corporate action notices upon receipt, where possible, in a manner that is deemed to be in the client’s best interests. |
| | • | | All copies of approved, non-mandatory corporate action records are maintained in the designated centralized client files maintained by the COO. Typically, TAMRO does not have any such approval records as the corporate actions we process are generally mandatory. |
Client Requests for Information
| | • | | All client requests for information regarding proxy votes, or policies and procedures, received by any employee should be forwarded to the CCO. |
| | • | | In response to any request the Investment Team and its designated service provider will prepare a written response to the client with the information requested, and as applicable will include the name of the issuer, the proposal voted upon, and the manner in which TAMRO voted the client’s proxy with respect to each proposal about which the client inquired. |
B-62
TAPLIN, CANIDA & HABACHT, INC.
PROXY VOTING
POLICIES AND PROCEDURES
Policy
TCH, as a matter of policy and practice, has no authority to vote proxies on behalf of advisory clients. The Adviser may offer assistance as to proxy matters upon a client’s request, but the client in all cases has either retained the proxy voting responsibility or designated the responsibility to the custodian or other third party. Upon client request, TCH would consider accepting such responsibility. Consequently, TCH would amend current disclosures and adopt appropriate policies.
TCH’s policy of having no proxy voting responsibility is disclosed to clients in the ADV. TCH has also adopted the policy to include disclosure in all future contracts that the Adviser does not vote proxies.
The vast majority of ERISA accounts to which TCH acts as investment advisor are fixed-income accounts, which do not participate in proxy voting.
Background
Proxy voting is an important right of shareholders and reasonable care and diligence must be undertaken to ensure that such rights are property and timely exercised.
Investment advisers registered with the SEC, and which exercise voting authority with respect to client securities, are required by Rule 206(4)-6 of the Investment Advisers Act to (a) adopt and implement written policies and procedures that are reasonably designed to ensure that client securities are voted in the best interests of clients, which must include how your address material conflicts that may arise between your interests and those of your client’s (b) to disclose to clients how they may obtain information from you with respect to the voting of proxies for their securities; and (c) to describe to clients a summary of your proxy voting policies and procedures and, upon request, furnish a copy to your clients.
B-63
Aston Funds
Dear Fellow Shareholder:
Of all the phrases that dominated the lexicon of investing during the past several years, perhaps none was more often evoked or more memorable than the prediction that the world had entered a “new normal.” Simply put, the “new normal” camp believed that the macroeconomic dislocations the world had endured since 2007 would take decades to work through and would depress equity and bond returns to levels well below their historical averages in the future.
Admittedly, the past 12 months were anything but normal. Unusually accommodative monetary policies from central banks across the world were designed to stimulate economic growth. Even so, global economic growth remained stubbornly subpar compared with other periods of economic recovery as consumers, businesses, and governments continued to deleverage by curtailing spending and reducing debt. Natural disasters and political upheavals seemed to happen with greater frequency than they had in any time during modern history.
Despite these relatively “abnormal” conditions, there is evidence that some things remained or reverted to the “old” normal during the past year. U.S. stock prices resumed their relationship to corporate earnings, moving higher as earnings results surprised on the upside during most of the past year. U.S. bonds overall were anchored by ultra-low and declining interest rates, though they registered gains during the year. The more credit-sensitive sectors, such as corporate bonds, fared best, helped as well by improved corporate profitability. For the year ending October 31, 2012, the Standard & Poor’s 500 Index, a broad gauge of the U.S. stock market, gained 15.19%, while U.S. investment-grade bonds, as measured by the Barclays U.S. Aggregate Bond Index, advanced 5.25%. Although foreign equity markets produced significantly divergent results for the year, most ended the period with gains.
As we look out on the coming year, we’re mindful that each and every day brings a mixture of both change and normalcy. To capitalize on the opportunities presented by the day-to-day dynamics of markets, our managers apply their vast analytic resources and experience. We give history and the lessons learned from it the deference they deserve by adhering to the proven and time-tested principles that have provided the underpinnings of our long-term investment success.
Given the many choices investors enjoy, we are grateful to you for your continued support of the Aston Funds family and are pleased to present you with the Aston Funds annual report.
Sincerely,

Kenneth C. Anderson
President
Aston Funds
|
| The views expressed in this report reflect those of the portfolio managers only, through the end of the period covered and do not necessarily represent the views of Aston Funds or Aston Asset Management, LP. Any such views are subject to change at any time based upon market or other conditions and Aston Funds and Aston Asset Management, LP disclaim any responsibility to update such views. These views may not be relied on as investment advice and, because investment decisions for an Aston Fund are based on numerous factors, may not be relied on as an indication of trading intent on behalf of any Aston Fund. |
Aston Funds
Large Cap Funds
ASTON/Montag & Caldwell Growth Fund
ASTON/Veredus Select Growth Fund
ASTON/TAMRO Diversified Equity Fund
ASTON/Herndon Large Cap Value Fund
ASTON/Cornerstone Large Cap Value Fund
Equity Income Funds
ASTON/River Road Dividend All Cap Value Fund
ASTON/River Road Dividend All Cap Value Fund II
Mid Cap Funds
ASTON/Fairpointe Mid Cap Fund
ASTON/Montag & Caldwell Mid Cap Growth Fund
Table of Contents
Small Cap Funds
ASTON/Veredus Small Cap Growth Fund
(formerly, the ASTON/Veredus Aggressive Growth Fund)
ASTON Small Cap Growth Fund
(formerly, the ASTON/Crosswind Small Cap Growth Fund)
ASTON/Silvercrest Small Cap Fund
ASTON/TAMRO Small Cap Fund
ASTON/River Road Select Value Fund
ASTON/River Road Small Cap Value Fund
ASTON/River Road Independent Value Fund
Fixed Income Funds
ASTON/DoubleLine Core Plus Fixed Income Fund ASTON/TCH Fixed Income Fund
Alternative Funds
ASTON/Lake Partners LASSO Alternatives Fund ASTON Dynamic Allocation Fund
ASTON/Anchor Capital Enhanced Equity Fund
(formerly, the ASTON/M.D. Sass Enhanced Equity Fund)
ASTON/River Road Long-Short Fund
International Fund
ASTON/Barings International Fund
Sector Fund
ASTON/Harrison Street Real Estate Fund
Balanced Fund
ASTON/Montag & Caldwell Balanced Fund
This report is submitted for general information to the shareholders of the funds. It is not authorized for distribution to prospective investors in the funds unless preceded or accompanied by an effective prospectus which includes details regarding the funds’ objectives, policies, expenses and other information.
Aston Funds are distributed by Foreside Funds Distributors LLC, 400 Berwyn Park, 899 Cassatt Road, Berwyn, PA 19312
Shareholder Services 800-992-8151 • www.astonfunds.com
NOT FDIC INSURED • NO BANK GUARANTEE • MAY LOSE VALUE
ASTON/Montag & Caldwell Growth Fund
| | |
| |
| Portfolio Manager Commentary (unaudited) | | October 31, 2012 |
| | Ronald E. Canakaris, CFA, CIC |
| Q. | What were the most significant market factors affecting Fund performance and returns relative to the benchmark during the past 12 months? |
| A. | Class N Shares of the Fund gained 11.40% during the past year, slightly trailing the Russell 1000 Growth Index gain of 13.02% and the S&P 500, which rose 15.19%. The Fund benefited from good stock selection in the Information Technology, Materials and Industrials sectors, as well as the underweight position to the Energy sector. This was offset by negative stock selection in the Energy and Consumer Discretionary sectors, the Fund’s cash reserve and an underweight position in Information Technology relative to the Fund’s Index. |
| Q. | What were the best performing holdings for the Fund during the period? |
| A. | Visa was the Fund’s top performing stock for the 12-month period, as the company continues to enjoy strong revenue and earnings growth despite the increased regulatory environment. While Apple was the Fund’s second best performing stock on an absolute basis, the Fund’s weighting in the stock is less than the Index and thus, the underweight position slightly detracted from relative performance. TJX had another year of strong gains as the company continues to benefit from consumers’ focus on value in the weak economic environment. The Fund established a position in Amazon as the company is hopeful of accelerating growth in existing markets, has opportunity for expansion in international markets and is well positioned to benefit from increased consumption of digital media. The stock performed well during the period and the Fund exited the position after the stock appreciated to a 20% premium to our estimated present value. eBay was purchased during the period and enjoyed strong gains, as the company continues to benefit from growth in online commerce and it has become a leader in online payments with its PayPal division. |
| Q. | What were the weakest performing holdings? |
| A. | We initiated a position in Juniper Networks during the period after the stock had been weak, but it declined further subsequent to our purchase. While earnings are sub-par in 2012, as carriers have deferred spending, Juniper is well positioned to benefit from the company’s five new product launches and an expected return to normal carrier spending patterns in 2013. Occidental Petroleum was weak, as the company has experienced rising costs, which tempered investors’ enthusiasm for the company’s above industry production growth. A position was established in Starbucks during the period, but the stock declined after the purchase, as revenues were less than expected over the summer due to the weak economic environment. We continue to favor the company as it has continued domestic and international growth opportunities and is benefiting from declining commodity costs. JP Morgan declined during the period and was eliminated, as financial stocks continued to suffer multiple compression due to the global debt crisis and increased regulatory requirements. |
| Q. | How was the Fund positioned as of October 31, 2012? |
| A. | While central bank actions are supportive of share prices and may limit the stock market’s downside risk, the market may have gotten ahead of its fundamentals, and it would not be surprising if the period ahead is more challenging. Global economic growth has weakened; corporate profit growth has slowed; corporate profit expectations seem too high with global growth slowing and profit margins near record levels; and it is uncertain if the “fiscal cliff” will be dealt with effectively after the election. We believe the outlook for the higher quality growth stocks held in the Fund is very promising. The shares of these companies are reasonably valued, and their earnings growth potential is more assured due to their financial strength and global diversification. In addition, many of the Fund’s holdings have above average dividend yields and dividend growth prospects. |
Growth of a Hypothetical
$10,000 Investment—Class N
All dividends and capital gains are reinvested. Indexes are unmanaged and do not take into account fees, expenses or other costs.
Returns shown in the chart and table do not reflect taxes that a shareholder would pay on Fund distributions or on the sale of the Fund shares.
RETURNSFOR PERIOD ENDED 10/31/12
Average Annual Total Returns - Class N
| | | | |
One Year | | | 11.40 | % |
Five Year | | | 1.10 | % |
Ten Year | | | 5.91 | % |
Since Inception | | | 8.46 | % |
Inception Date 11/02/94
Average Annual Total Returns - Class I
| | | | |
One Year | | | 11.67 | % |
Five Year | | | 1.35 | % |
Ten Year | | | 6.19 | % |
Since Inception | | | 6.70 | % |
Inception Date 06/28/96
Average Annual Total Returns - Class R
| | | | |
One Year | | | 11.10 | % |
Five Year | | | 0.86 | % |
Since Inception | | | 6.01 | % |
Inception Date 12/31/02
The performance data quoted represents past performance. Past performance does not guarantee future results. Investment return and principal value will fluctuate so that an investor’s shares, upon redemption, may be worth more or less than their original cost. Current performance may be lower or higher than the performance data quoted. For performance data current to the most recent month-end, please visit our website at www.astonfunds.com.
The total expense ratio for the Class N, Class I and Class R Shares is 1.07%, 0.82% and 1.32% respectively, as disclosed in the prospectus dated March 1, 2012. Please refer to the Financial Highlights section in this report for more 2012 fiscal year-end related information.
| | |
| |
| ASTON/Montag & Caldwell Growth Fund | | October 31, 2012 |
| |
| Schedule of Investments | | |
| | | | | | | | |
Shares | | | | | Market
Value | |
|
| | COMMON STOCKS – 91.03% | |
| | |
| | | | Consumer Discretionary – 9.71% | | | | |
| | 1,421,300 | | | Bed Bath & Beyond * | | $ | 81,980,584 | |
| | 828,400 | | | Las Vegas Sands | | | 38,470,896 | |
| | 752,400 | | | McDonald’s | | | 65,308,320 | |
| | 500,000 | | | NIKE, Class B | | | 45,690,000 | |
| | 888,500 | | | Omnicom Group | | | 42,568,035 | |
| | 1,951,500 | | | Starbucks | | | 89,573,850 | |
| | 1,355,900 | | | TJX | | | 56,446,117 | |
| | | | | | | | |
| | | | | | | 420,037,802 | |
| | | | | | | | |
| | |
| | | | Consumer Staples – 26.24% | | | | |
| | 5,339,000 | | | Coca-Cola | | | 198,504,020 | |
| | 1,274,418 | | | Colgate-Palmolive | | | 133,762,913 | |
| | 1,326,300 | | | Costco Wholesale | | | 130,547,709 | |
| | 1,705,900 | | | Kraft Foods Group * | | | 77,584,332 | |
| | 5,766,700 | | | Mondelez International, Class A | | | 153,048,218 | |
| | 1,512,500 | | | PepsiCo | | | 104,725,500 | |
| | 1,594,000 | | | Philip Morris International | | | 141,164,640 | |
| | 1,475,000 | | | Procter & Gamble | | | 102,129,000 | |
| | 2,533,700 | | | Unilever (Netherlands) | | | 92,961,453 | |
| | | | | | | | |
| | | | | | | 1,134,427,785 | |
| | | | | | | | |
| | |
| | | | Energy – 6.61% | | | | |
| | 2,127,300 | | | Cameron International * | | | 107,726,472 | |
| | 1,400,000 | | | Occidental Petroleum | | | 110,544,000 | |
| | 969,800 | | | Schlumberger | | | 67,430,194 | |
| | | | | | | | |
| | | | | | | 285,700,666 | |
| | | | | | | | |
| | |
| | | | Financials – 2.30% | | | | |
| | 2,950,100 | | | Wells Fargo | | | 99,388,869 | |
| | | | | | | | |
| | |
| | | | Healthcare – 14.93% | | | | |
| | 2,843,300 | | | Abbott Laboratories | | | 186,293,016 | |
| | 1,574,900 | | | Allergan | | | 141,615,008 | |
| | | | | | | | |
Shares | | | | | Market
Value | |
| | |
| | | | Healthcare (continued) | | | | |
| | 2,400,000 | | | AmerisourceBergen | | $ | 94,656,000 | |
| | 2,104,254 | | | Express Scripts * | | | 129,495,791 | |
| | 1,774,500 | | | Stryker | | | 93,338,700 | |
| | | | | | | | |
| | | | | | | 645,398,515 | |
| | | | | | | | |
| | |
| | | | Industrials – 6.27% | | | | |
| | 8,355,500 | | | General Electric | | | 175,966,830 | |
| | 1,300,000 | | | United Parcel Service, Class B | | | 95,225,000 | |
| | | | | | | | |
| | | | | | | 271,191,830 | |
| | | | | | | | |
| | |
| | | | Information Technology – 21.37% | | | | |
| | 1,007,800 | | | Accenture, Class A (Ireland) | | | 67,935,798 | |
| | 257,180 | | | Apple | | | 153,047,818 | |
| | 1,874,200 | | | eBay * | | | 90,505,118 | |
| | 1,548,100 | | | EMC * | | | 37,804,602 | |
| | 120,000 | | | Google, Class A * | | | 81,572,400 | |
| | 4,647,787 | | | Juniper Networks * | | | 77,013,831 | |
| | 4,100,100 | | | Oracle | | | 127,308,105 | |
| | 2,800,000 | | | Qualcomm | | | 164,010,000 | |
| | 900,000 | | | Visa, Class A | | | 124,884,000 | |
| | | | | | | | |
| | | | | | | 924,081,672 | |
| | | | | | | | |
| | |
| | | | Materials – 3.60% | | | | |
| | 1,807,400 | | | Monsanto | | | 155,562,918 | |
| | | | | | | | |
| | |
| | | | Total Common Stocks
(Cost $3,468,623,067) | | | 3,935,790,057 | |
| | | | | | | | |
|
| | INVESTMENT COMPANY – 8.96% | |
| | |
| | 387,376,867 | | | BlackRock Liquidity Funds
TempCash Portfolio | | | 387,376,867 | |
| | | | | | | | |
| | |
| | | | Total Investment Company
(Cost $387,376,867) | | | 387,376,867 | |
| | | | | | | | |
| Total Investments – 99.99%
(Cost $3,855,999,934)** | | | 4,323,166,924 | |
| | | | | | | | |
| Net Other Assets and Liabilities – 0.01% | | | 411,957 | |
| | | | | | | | |
| Net Assets – 100.00% | | $ | 4,323,578,881 | |
| | | | | | | | |
| * | | Non-income producing security. |
| ** | | Aggregate cost for Federal income tax purposes is $3,863,518,548. |
| | | | |
Gross unrealized appreciation | | $ | 503,529,353 | |
Gross unrealized depreciation | | | (43,880,977 | ) |
| | | | |
Net unrealized appreciation | | $ | 459,648,376 | |
| | | | |
See accompanying Notes to Financial Statements.
ASTON/Veredus Select Growth Fund
| | |
| |
| Portfolio Manager Commentary (unaudited) | | October 31, 2012 |
| B. Anthony Weber; Charles F. Mercer, Jr., CFA; Michael E. Johnson, CFA; |
| John R. Prys, CFA & Katherine A. Kuntz, CFA |
| Q. | What were the most significant market factors affecting Fund performance and returns relative to the benchmark during the past 12 months? |
| A. | The Fund’s underperformance during the period was primarily due to two extremely poor months at the end of 2011 on the back of a dismal earnings season for some of the holdings in the portfolio. Not owning Apple hurt returns during the first quarter of 2012, a deficit that we were unable make up during the two subsequent quarters. Apple had missed its third quarter 2011 earnings target and we did not want to risk owning the stock going into the 2011 holiday season. That was definitely the wrong call. We did reestablished a position in Apple during the second quarter and still held a position as of the end of October 2012, but nowhere near a benchmark weighting. The environment for our brand of growth investing was also made worse during the period by the market’s tilt toward defensive names and fat dividends. |
| Q. | What were the best performing holdings for the Fund during the period? |
| A. | eBay was the best performing stock in the portfolio, as its PayPal subsidiary and growth in mobile payments propelled the stock strongly higher. Visa continued its quarterly progression of solid results with increasing transaction volumes pushing the stock. Michael Kors, a leading upscale women’s clothing and accessories retailer and the portfolio’s largest holding, gained from its efforts at building one of the most sought after brand names around. |
| Q. | What were the weakest performing holdings? |
| A. | Digital media company Rovi announced third quarter results that missed |
| | estimates and gave weak guidance. This had been a huge stock for the portfolio in the past, but the company missed a tremendous opportunity in the world of digital movie downloads. We exited the stock as it rallied back from the near-term sell-off, though still at a significant loss for the period. Herbalife, the global marketing firm of nutritional supplements, succumbed to multiple rumors that an activist hedge fund manager was in the market shorting the stock. The Fund owned Nokia early in 2012 based on new product flow which was obviously over-hyped, leading to a drop in the stock. |
| Q. | How was the Fund positioned as of October 31, 2012? |
| A. | Consumer Discretionary comprised the largest weighting in the Fund, led by Michael Kors, various specialty retailers, and some homebuilders as lower gasoline prices and enhanced consumer confidence is providing a boost to these areas. Information Technology makes up 19% of the portfolio, but this is somewhat misleading in our view as we think of eBay and Visa as more consumer plays. Not counting those two holdings, the portfolio’s Technology exposure is way down from what it has been historically. Healthcare is the next largest sector, with Illumina and Watson Pharmaceuticals the two largest positions. Financials make up 14.5% led by Citigroup, Energy is 7.2% focused on natural gas names and Materials comprise 9.2% led by Vulcan Materials. The Fund is severely underweight Industrials given the slowing nature of heavy industry. With the “fiscal cliff” looming, 2013 could very well be a difficult year. We will be watching Washington closely and would not rule out getting defensive in the not too distant future. |
Growth of a Hypothetical
$10,000 Investment—Class N
All dividends and capital gains are reinvested. Indexes are unmanaged and do not take into account fees, expenses or other costs.
Returns shown in the chart and table do not reflect taxes that a shareholder would pay on Fund distributions or on the sale of the Fund shares.
RETURNSFOR PERIOD ENDED 10/31/12
Average Annual Total Returns - Class N
| | | | |
One Year | | | 2.97 | % |
Five Year | | | -4.91 | % |
Ten Year | | | 5.99 | % |
Since Inception | | | 2.48 | % |
Inception Date 12/31/01
Average Annual Total Returns - Class I
| | | | |
One Year | | | 3.19 | % |
Five Year | | | -4.67 | % |
Since Inception | | | 1.65 | % |
Inception Date 09/11/06
The performance data quoted represents past performance. Past performance does not guarantee future results. Investment return and principal value will fluctuate so that an investor’s shares, upon redemption, may be worth more or less than their original cost. Current performance may be lower or higher than the performance data quoted. For performance data current to the most recent month-end, please visit our website at www.astonfunds.com.
The total expense ratio for the Class N and Class I Shares is 1.31% and 1.06% respectively, as disclosed in the prospectus dated March 1, 2012. Please refer to the Financial Highlights section in this report for more 2012 fiscal year-end related information.
| | |
| |
| ASTON/Veredus Select Growth Fund | | October 31, 2012 |
| |
| Schedule of Investments | | |
| | | | | | | | |
Shares | | | | | Market
Value | |
| |
| | COMMON STOCKS – 99.75% | | | | |
| | |
| | | | Consumer Discretionary – 26.41% | | | | |
| | 11,400 | | | D.R. Horton | | $ | 238,944 | |
| | 3,625 | | | Dick’s Sporting Goods | | | 181,250 | |
| | 6,600 | | | GNC Holdings, Class A | | | 255,222 | |
| | 6,800 | | | Lennar, Class A | | | 254,796 | |
| | 7,075 | | | Ltd. Brands | | | 338,822 | |
| | 7,275 | | | Mattel | | | 267,575 | |
| | 10,100 | | | Michael Kors Holdings * | | | 552,369 | |
| | 1,525 | | | Panera Bread, Class A * | | | 257,176 | |
| | 93,125 | | | Sirius XM Radio * | | | 260,750 | |
| | 2,525 | | | Tractor Supply | | | 243,006 | |
| | 3,725 | | | Ulta Salon Cosmetics & Fragrance | | | 343,520 | |
| | | | | | | | |
| | | | | | | 3,193,430 | |
| | | | | | | | |
| | |
| | | | Consumer Staples – 2.25% | | | | |
| | 3,925 | | | PepsiCo | | | 271,767 | |
| | | | | | | | |
| | |
| | | | Energy – 7.24% | | | | |
| | 8,875 | | | Cabot Oil & Gas | | | 416,947 | |
| | 2,375 | | | Continental Resources * | | | 170,667 | |
| | 8,300 | | | Southwestern Energy * | | | 288,010 | |
| | | | | | | | |
| | | | | | | 875,624 | |
| | | | | | | | |
| | |
| | | | Financials – 14.51% | | | | |
| | 4,325 | | | American Express | | | 242,070 | |
| | 11,075 | | | American International Group | | | 386,850 | |
| | 13,500 | | | CBRE Group, Class A | | | 243,270 | |
| | 11,400 | | | Citigroup | | | 426,246 | |
| | 13,225 | | | Fifth Third Bancorp | | | 192,159 | |
| | 15,200 | | | Morgan Stanley | | | 264,176 | |
| | | | | | | | |
| | | | | | | 1,754,771 | |
| | | | | | | | |
| | | | | | | | |
Shares | | | | | Market
Value | |
| | |
| | | | Healthcare – 14.74% | | | | |
| | 4,800 | | | Abbott Laboratories | | $ | 314,496 | |
| | 1,275 | | | Biogen Idec * | | | 176,230 | |
| | 8,025 | | | Illumina * | | | 381,268 | |
| | 7,225 | | | Merck & Co. | | | 329,677 | |
| | 4,950 | | | ResMed | | | 197,703 | |
| | 4,450 | | | Watson Pharmaceuticals * | | | 382,478 | |
| | | | | | | | |
| | | | | | | 1,781,852 | |
| | | | | | | | |
| | |
| | | | Industrials – 6.28% | | | | |
| | 3,000 | | | C.H. Robinson Worldwide | | | 180,990 | |
| | 16,700 | | | Masco | | | 252,003 | |
| | 12,600 | | | Quanta Services * | | | 326,718 | |
| | | | | | | | |
| | | | | | | 759,711 | |
| | | | | | | | |
| | |
| | | | Information Technology – 19.13% | | | | |
| | 3,300 | | | Accenture, Class A (Ireland) | | | 222,453 | |
| | 6,650 | | | Akamai Technologies * | | | 252,633 | |
| | 525 | | | Apple | | | 312,427 | |
| | 6,475 | | | eBay * | | | 312,678 | |
| | 8,725 | | | Microsoft | | | 248,968 | |
| | 5,075 | | | Teradata * | | | 346,673 | |
| | 4,450 | | | Visa, Class A | | | 617,482 | |
| | | | | | | | |
| | | | | | | 2,313,314 | |
| | | | | | | | |
| | |
| | | | Materials – 9.19% | | | | |
| | 8,000 | | | Newmont Mining | | | 436,400 | |
| | 2,550 | | | Rock-Tenn, Class A | | | 186,635 | |
| | 10,625 | | | Vulcan Materials | | | 488,431 | |
| | | | | | | | |
| | | | | | | 1,111,466 | |
| | | | | | | | |
| | |
| | | | Total Common Stocks
(Cost $11,228,523) | | | 12,061,935 | |
| | | | | | | | |
| |
| | INVESTMENT COMPANY – 2.08% | | | | |
| | |
| | 250,962 | | | BlackRock Liquidity Funds TempCash Portfolio | | | 250,962 | |
| | | | | | | | |
| | |
| | | | Total Investment Company
(Cost $250,962) | | | 250,962 | |
| | | | | | | | |
| Total Investments – 101.83%
(Cost $11,479,485)** | | | 12,312,897 | |
| | | | | | | | |
| Net Other Assets and Liabilities – (1.83)% | | | (221,358 | ) |
| | | | | | | | |
| Net Assets – 100.00% | | $ | 12,091,539 | |
| | | | | | | | |
| * | | Non-income producing security. |
| ** | | Aggregate cost for Federal income tax purposes is $11,481,872. |
| | | | |
Gross unrealized appreciation | | $ | 1,023,402 | |
Gross unrealized depreciation | | | (192,377 | ) |
| | | | |
Net unrealized appreciation | | $ | 831,025 | |
| | | | |
See accompanying Notes to Financial Statements.
ASTON/TAMRO Diversified Equity Fund
| | |
| |
| Portfolio Manager Commentary (unaudited) | | October 31, 2012 |
Philip D. Tasho, CFA & Timothy A. Holland, CFA
| Q. | What were the most significant market factors affecting Fund performance and returns relative to the benchmark during the past 12 months? |
| A. | While the U.S. and global economies saw a slowdown in growth, aggressively easy monetary policy provided ample liquidity that helped fuel double digit returns across all market capitalizations of the U.S. equity markets. The underperformance of the Fund relative to the benchmark, the Russell 1000 Index, was primarily due to weak stock selection in the Consumer Discretionary, Technology and Financials sectors that was not sufficiently offset by strength in the Consumer Staples, Energy and Healthcare sectors. |
| Q. | What were the best performing holdings for the Fund during the period? |
| A. | A rebound in the housing cycle benefitted the largest home improvement retailer, Home Depot. Demand for Apple’s premium mobility products sent its shares to new highs. Lastly, DaVita Healthcare Partners benefited from industry consolidation and rising demand for renal dialysis. |
| Q. | What were the weakest performing holdings? |
| A. | A softening in telecomm capital spending led to a slowdown for Acme Packet’s Session Border Control products that manage the quality of data as it crosses from one network to another. Rising competition in the specialty mattress segment impacted shares of Tempur-Pedic International, while a general slowdown in South America reduced earnings |
| | expectations for the number one McDonald’s franchisee there, Arcos Dorados Holdings. We maintain a position in Tempur-Pedic, but we eliminated the others due to the identification of other investments that we believe represent better relative opportunities. |
| Q. | How was the Fund positioned as of October 31, 2012? |
| A. | The Fund’s investment process focuses on individual, bottom-up stock selection to identify companies that we believe are best able to execute given their specific competitive advantage. Our approach to portfolio management is opportunistic and broadly diversified, with sector weights determined by where we see opportunities at the stock level. As of October 31, 2012, Financials, Consumer Discretionary and Healthcare were the largest sectors. Among our investment categories, higher quality Leaders and Innovators, which focus on low cost operations and efficiency, comprised 91% of the portfolio. Laggards, or companies undergoing restructuring, made up 9%. |
We believe the domestic economy will continue to grow at a slower than normal pace, led by an ongoing rebound in consumer spending and housing. The change in housing prices has turned positive in most regions of the country and consumer sentiment is the highest yet in the recovery. After the election is over, there should be more clarity concerning the direction of U.S. economic policy. Any interim volatility may provide opportunities to add to current positions or initiate new ones at attractive valuations.
Growth of a Hypothetical
$10,000 Investment—Class N
All dividends and capital gains are reinvested. Indexes are unmanaged and do not take into account fees, expenses or other costs.
Returns shown in the chart and table do not reflect taxes that a shareholder would pay on Fund distributions or on the sale of the Fund shares.
RETURNSFOR PERIOD ENDED 10/31/12
Average Annual Total Returns - Class N
| | | | |
One Year | | | 11.94 | % |
Five Year | | | 1.08 | % |
Ten Year | | | 7.67 | % |
Since Inception | | | 4.98 | % |
Inception Date 11/30/00
Total Return - Class I
| | | | |
Cumulative Since Inception | | | 2.04 | % |
Inception date 03/02/12
The performance data quoted represents past performance. Past performance does not guarantee future results. Investment return and principal value will fluctuate so that an investor’s shares, upon redemption, may be worth more or less than their original cost. Current performance may be lower or higher than the performance data quoted. For performance data current to the most recent month-end, please visit our website at www.astonfunds.com.
The performance quoted would have been lower if fee waivers and/or expense reimbursements had not been in effect.
The total expense ratio for the Class N and Class I Shares is 1.63% and 1.38% respectively, as disclosed in the prospectus dated March 1, 2012. Please refer to the Financial Highlights section in this report for more 2012 fiscal year-end related information.
| | |
| |
| ASTON/TAMRO Diversified Equity Fund | | October 31, 2012 |
| |
| Schedule of Investments | | |
| | | | | | | | |
Shares | | | | | Market
Value | |
|
| | COMMON STOCKS – 99.12% | |
| | |
| | | | Consumer Discretionary – 16.80% | | | | |
| | 3,070 | | | Amazon.com * | | $ | 714,757 | |
| | 6,480 | | | Bed Bath & Beyond * | | | 373,766 | |
| | 14,488 | | | CarMax * | | | 488,970 | |
| | 11,676 | | | GNC Holdings, Class A | | | 451,511 | |
| | 8,902 | | | Home Depot | | | 546,405 | |
| | 13,457 | | | Macy’s | | | 512,308 | |
| | 8,121 | | | Tempur-Pedic International * | | | 214,719 | |
| | 14,743 | | | Toll Brothers * | | | 486,666 | |
| | | | | | | | |
| | | | | | | 3,789,102 | |
| | | | | | | | |
| | |
| | | | Consumer Staples – 10.53% | | | | |
| | 6,598 | | | Kraft Foods Group * | | | 300,077 | |
| | 7,425 | | | McCormick & Co (Non-Voting Shares) | | | 457,528 | |
| | 12,780 | | | Mondelez International, Class A | | | 339,181 | |
| | 5,135 | | | Philip Morris International | | | 454,756 | |
| | 8,055 | | | United Natural Foods * | | | 428,848 | |
| | 11,147 | | | Walgreen | | | 392,709 | |
| | | | | | | | |
| | | | | | | 2,373,099 | |
| | | | | | | | |
| | |
| | | | Energy – 10.35% | | | | |
| | 2,718 | | | EOG Resources | | | 316,620 | |
| | 6,472 | | | Exxon Mobil | | | 590,052 | |
| | 10,205 | | | Phillips 66 | | | 481,268 | |
| | 6,827 | | | Range Resources | | | 446,213 | |
| | 14,366 | | | Southwestern Energy * | | | 498,500 | |
| | | | | | | | |
| | | | | | | 2,332,653 | |
| | | | | | | | |
| | |
| | | | Financials – 18.59% | | | | |
| | 10,233 | | | American Express | | | 572,741 | |
| | 3,850 | | | American Tower, REIT | | | 289,867 | |
| | 5,353 | | | Berkshire Hathaway, Class B * | | | 462,232 | |
| | 3,161 | | | Franklin Resources | | | 403,976 | |
| | 7,159 | | | Iberiabank | | | 356,447 | |
| | 11,123 | | | JPMorgan Chase | | | 463,607 | |
| | | | | | | | |
Shares | | | | | Market
Value | |
| | |
| | | | Financials (continued) | | | | |
| | 10,737 | | | MetLife | | $ | 381,056 | |
| | 3,339 | | | Portfolio Recovery Associates * | | | 349,426 | |
| | 13,436 | | | Raymond James Financial | | | 512,449 | |
| | 6,168 | | | T. Rowe Price Group | | | 400,550 | |
| | | | | | | | |
| | | | | | | 4,192,351 | |
| | | | | | | | |
| | |
| | | | Healthcare – 14.64% | | | | |
| | 9,737 | | | Advisory Board * | | | 462,507 | |
| | 4,275 | | | Allergan | | | 384,408 | |
| | 5,216 | | | Athenahealth * | | | 335,337 | |
| | 4,717 | | | DaVita * | | | 530,757 | |
| | 6,424 | | | Express Scripts * | | | 395,333 | |
| | 12,836 | | | HMS Holdings * | | | 296,383 | |
| | 6,863 | | | Johnson & Johnson | | | 486,038 | |
| | 10,169 | | | Teva Pharmaceutical, SP ADR (Israel) | | | 411,031 | |
| | | | | | | | |
| | | | | | | 3,301,794 | |
| | | | | | | | |
| | |
| | | | Industrials – 11.79% | | | | |
| | 5,912 | | | Boeing | | | 416,441 | |
| | 5,030 | | | C.H. Robinson Worldwide | | | 303,460 | |
| | 8,800 | | | Chicago Bridge & Iron (Netherlands) | | | 330,440 | |
| | 11,105 | | | Cintas | | | 464,300 | |
| | 12,688 | | | Colfax * | | | 436,340 | |
| | 8,503 | | | Danaher | | | 439,860 | |
| | 4,781 | | | Fluor | | | 267,019 | |
| | | | | | | | |
| | | | | | | 2,657,860 | |
| | | | | | | | |
| | |
| | | | Information Technology – 12.31% | | | | |
| | 2,028 | | | Apple | | | 1,206,863 | |
| | 3,869 | | | Factset Research Systems | | | 350,338 | |
| | 369 | | | Google, Class A * | | | 250,835 | |
| | 8,226 | | | Microchip Technology | | | 257,885 | |
| | 7,296 | | | QUALCOMM | | | 427,363 | |
| | 4,091 | | | Seagate Technology (Ireland) | | | 111,766 | |
| | 10,141 | | | Yahoo! * | | | 170,470 | |
| | | | | | | | |
| | | | | | | 2,775,520 | |
| | | | | | | | |
| | |
| | | | Materials – 4.11% | | | | |
| | 5,313 | | | Monsanto | | | 457,290 | |
| | 5,334 | | | Royal Gold | | | 469,819 | |
| | | | | | | | |
| | | | | | | 927,109 | |
| | | | | | | | |
| | |
| | | | Total Common Stocks
(Cost $17,981,931) | | | 22,349,488 | |
| | | | | | | | |
|
| | INVESTMENT COMPANY – 0.54% | |
| | |
| | 122,258 | | | BlackRock Liquidity Funds
TempCash Portfolio | | | 122,258 | |
| | | | | | | | |
| | |
| | | | Total Investment Company
(Cost $122,258) | | | 122,258 | |
| | | | | | | | |
| Total Investments – 99.66%
(Cost $18,104,189)** | | | 22,471,746 | |
| | | | | | | | |
| Net Other Assets and Liabilities – 0.34% | | | 77,231 | |
| | | | | | | | |
| Net Assets – 100.00% | | $ | 22,548,977 | |
| | | | | | | | |
See accompanying Notes to Financial Statements.
| | |
| |
| ASTON/TAMRO Diversified Equity Fund | | October 31, 2012 |
| |
| Schedule of Investments – continued | | |
| * | | Non-income producing security. |
| ** | | Aggregate cost for Federal income tax purposes is $18,231,067. |
| | | | |
Gross unrealized appreciation | | $ | 4,746,965 | |
Gross unrealized depreciation | | | (506,286 | ) |
| | | | |
Net unrealized appreciation | | $ | 4,240,679 | |
| | | | |
| ADR | | American Depositary Receipt |
| REIT | | Real Estate Investment Trust |
| SP ADR | | Sponsored American Depositary Receipt |
See accompanying Notes to Financial Statements.
ASTON/Herndon Large Cap Value Fund
| | |
| |
| Portfolio Manager Commentary (unaudited) | | October 31, 2012 |
| | Randell A. Cain, Jr., CFA |
| Q. | What were the most significant market factors affecting Fund performance and returns relative to the benchmark during the past 12 months? |
| A. | Over the past 12-month period, positive absolute returns to the Fund were produced by nine of the ten major sectors, with five of those sectors posting double digit gains. The portfolio’s positive absolute performance was the result of a strengthening U.S. economy, solid increase in corporate earnings and improving consumer sentiment. |
The Fund did, however, underperform the Russell 1000 Value Index by more than 600 basis points. Stock performance and relative weights in the Information Technology, Utilities and Industrials sectors contributed positively to the portfolio’s overall relative performance. The major detractors were stocks in the Materials, Consumer Staples and Consumer Discretionary sectors. The portfolio’s relative returns were most negatively impacted by the performance of Materials stocks as a weak global mining and commodities market led to these stocks underperforming.
| Q. | What were the best performing holdings for the Fund during the period? |
| A. | The highest individual stock contributors to the portfolio’s performance were Gilead Sciences (+61% return), Apple Inc. (+48%) and TJX Companies (+43%). These securities represent holdings in the Healthcare, Information Technology and Consumer Discretionary sectors, respectively. |
| Q. | What were the weakest performing holdings? |
| A. | The highest individual stock detractors to the portfolio’s performance were Cliff’s Natural Resources (-45% return), Chimera Investment Corp. (-19%) and Herbalife Ltd. (-16%) . These stocks are in the Materials, Financial Services and Consumer Staples sectors, respectively. |
| Q. | How was the Fund positioned as of October 31, 2012? |
| A. | As of October 31, 2012, the Fund was overweight the Energy, Information Technology, Consumer Staples, Consumer Discretionary, Materials and Industrials sectors. The underweight sectors were Financial Services, Utilities, Telecommunications and Healthcare. |
Growth of a Hypothetical
$10,000 Investment—Class N
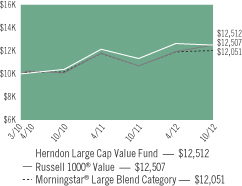
All dividends and capital gains are reinvested. Indexes are unmanaged and do not take into account fees, expenses or other costs.
Returns shown in the chart and table do not reflect taxes that a shareholder would pay on Fund distributions or on the sale of the Fund shares.
Value investing involves the risk that a Fund’s investing in companies believed to be undervalued will not appreciate as anticipated.
RETURNSFOR PERIOD ENDED 10/31/12
Average Annual Total Returns - Class N
| | | | |
1 Year | | | 10.39 | % |
Since Inception | | | 9.04 | % |
Inception Date 03/31/10
Average Annual Total Returns - Class I
| | | | |
1 Year | | | 10.69 | % |
Since Inception | | | 5.44 | % |
Inception Date 03/02/11
The performance data quoted represents past performance. Past performance does not guarantee future results. Investment return and principal value will fluctuate so that an investor’s shares, upon redemption, may be worth more or less than their original cost. Current performance may be lower or higher than the performance data quoted. For performance data current to the most recent month-end, please visit our website at www.astonfunds.com.
The performance quoted would have been lower if fee waivers and/or expense reimbursements had not been in effect.
| | |
| |
| ASTON/Herndon Large Cap Value Fund | | October 31, 2012 |
| |
| Schedule of Investments | | |
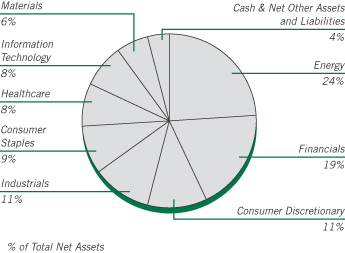
| | | | | | | | |
Shares | | | | | Market
Value | |
|
| | COMMON STOCKS – 95.14% | |
| | |
| | | | Consumer Discretionary – 10.84% | | | | |
| | 48,108 | | | Apollo Group, Class A * | | $ | 966,009 | |
| | 23,361 | | | Coach | | | 1,309,384 | |
| | 15,203 | | | Ross Stores | | | 926,623 | |
| | 36,312 | | | TJX | | | 1,511,669 | |
| | 18,471 | | | Yum! Brands | | | 1,295,002 | |
| | | | | | | | |
| | | | | | | 6,008,687 | |
| | | | | | | | |
| | |
| | | | Consumer Staples – 9.44% | | | | |
| | 43,623 | | | Altria Group | | | 1,387,211 | |
| | 8,042 | | | Colgate-Palmolive | | | 844,088 | |
| | 25,370 | | | Herbalife (Cayman) | | | 1,302,750 | |
| | 5,869 | | | Nu Skin Enterprises, Class A | | | 277,780 | |
| | 16,002 | | | Philip Morris International | | | 1,417,137 | |
| | | | | | | | |
| | | | | | | 5,228,966 | |
| | | | | | | | |
| | |
| | | | Energy – 23.62% | | | | |
| | 16,268 | | | Apache | | | 1,346,177 | |
| | 9,974 | | | Chevron | | | 1,099,235 | |
| | 19,512 | | | ConocoPhillips | | | 1,128,769 | |
| | 15,711 | | | Exxon Mobil | | | 1,432,372 | |
| | 42,074 | | | Halliburton | | | 1,358,569 | |
| | 32,149 | | | HollyFrontier | | | 1,241,916 | |
| | 23,603 | | | Marathon Petroleum | | | 1,296,513 | |
| | 38,927 | | | Newfield Exploration * | | | 1,055,700 | |
| | 65,943 | | | Patterson-UTI Energy | | | 1,066,958 | |
| | 95,889 | | | RPC | | | 1,098,888 | |
| | 20,912 | | | Superior Energy Services * | | | 425,141 | |
| | 23,445 | | | Ultra Petroleum * | | | 534,780 | |
| | | | | | | | |
| | | | | | | 13,085,018 | |
| | | | | | | | |
| | |
| | | | Financials – 18.64% | | | | |
| | 32,173 | | | Aflac | | | 1,601,572 | |
| | 41,808 | | | American Capital Agency, REIT | | | 1,380,500 | |
| | | | | | | | |
Shares | | | | | Market
Value | |
| | |
| | | | Financials (continued) | | | | |
| | 39,196 | | | Apartment Investment & Management, Class A, REIT | | $ | 1,046,141 | |
| | 39,242 | | | CBOE Holdings | | | 1,157,247 | |
| | 32,657 | | | Discover Financial Services | | | 1,338,937 | |
| | 35,538 | | | Eaton Vance | | | 1,000,039 | |
| | 74,416 | | | Federated Investors, Class B | | | 1,729,428 | |
| | 32,149 | | | Waddell & Reed Financial, Class A | | | 1,071,526 | |
| | | | | | | | |
| | | | | | | 10,325,390 | |
| | | | | | | | |
| | |
| | | | Healthcare – 8.23% | | | | |
| | 24,063 | | | Eli Lilly | | | 1,170,184 | |
| | 34,279 | | | Endo Health Solutions * | | | 982,436 | |
| | 20,166 | | | Gilead Sciences * | | | 1,354,349 | |
| | 144,475 | | | Health Management Associates, Class A * | | | 1,054,667 | |
| | | | | | | | |
| | | | | | | 4,561,636 | |
| | | | | | | | |
| | |
| | | | Industrials – 10.70% | | | | |
| | 10,264 | | | Caterpillar | | | 870,490 | |
| | 18,180 | | | Copa Holdings SA, Class A (Panama) | | | 1,687,468 | |
| | 10,264 | | | Cummins | | | 960,505 | |
| | 18,907 | | | Joy Global | | | 1,180,742 | |
| | 13,121 | | | Lockheed Martin | | | 1,229,044 | |
| | | | | | | | |
| | | | | | | 5,928,249 | |
| | | | | | | | |
| | |
| | | | Information Technology – 7.98% | | | | |
| | 2,203 | | | Apple | | | 1,311,005 | |
| | 6,173 | | | International Business Machines | | | 1,200,834 | |
| | 29,970 | | | Microsoft | | | 855,194 | |
| | 30,841 | | | Western Digital | | | 1,055,687 | |
| | | | | | | | |
| | | | | | | 4,422,720 | |
| | | | | | | | |
| | |
| | | | Materials – 5.69% | | | | |
| | 5,786 | | | CF Industries Holdings | | | 1,187,229 | |
| | 25,516 | | | Cliffs Natural Resources | | | 925,465 | |
| | 30,593 | | | Kronos Worldwide | | | 408,417 | |
| | 2,324 | | | Newmarket | | | 630,524 | |
| | | | | | | | |
| | | | | | | 3,151,635 | |
| | | | | | | | |
| | |
| | | | Total Common Stocks
(Cost $51,852,542) | | | 52,712,301 | |
| | | | | | | | |
|
| | INVESTMENT COMPANY – 5.42% | |
| | |
| | 3,005,231 | | | BlackRock Liquidity Funds
TempCash Portfolio | | | 3,005,231 | |
| | | | | | | | |
| | |
| | | | Total Investment Company
(Cost $3,005,231) | | | 3,005,231 | |
| | | | | | | | |
| Total Investments – 100.56%
(Cost $54,857,773)** | | | 55,717,532 | |
| | | | | | | | |
| Net Other Assets and Liabilities – (0.56)% | | | (310,580 | ) |
| | | | | | | | |
| Net Assets – 100.00% | | $ | 55,406,952 | |
| | | | | | | | |
See accompanying Notes to Financial Statements.
| | |
| |
| ASTON/Herndon Large Cap Value Fund | | October 31, 2012 |
| |
| Schedule of Investments – continued | | |
| * | | Non-income producing security. |
| ** | | Aggregate cost for Federal income tax purposes is $55,304,811. |
| | | | |
Gross unrealized appreciation | | $ | 3,460,988 | |
Gross unrealized depreciation | | | (3,048,267 | ) |
| | | | |
Net unrealized appreciation | | $ | 412,721 | |
| | | | |
| REIT | | Real Estate Investment Trust |
See accompanying Notes to Financial Statements.
ASTON/Cornerstone Large Cap Value Fund
| | |
| |
| Portfolio Manager Commentary (unaudited) | | October 31, 2012 |
John Campbell, CFA; Rick van Nostrand, CFA; Cameron Clement, CFA; & Dean Morris, CFA
| Q. | What were the most significant market factors affecting Fund performance and returns relative to the benchmark during the past 12 months? |
| A. | Despite continued overhangs from European sovereign debt, slowing emerging economies and political uncertainty in the U.S., the markets posted double digit gains over the past 12 months; as the Russell 1000 Value Index was up 16.89%. Attractive valuations coupled with improved economic reports from the U.S. drove investors back into equities. Additionally, the European Central Bank’s long-term refinancing operations attempted to allay investor fears of sovereign default by providing nearly $1.2 trillion in cheap loans to European banks. In the U.S., data surrounding housing, employment and manufacturing have begun to paint a more stable and improving picture. |
| Q. | What were the best performing holdings for the Fund during the period? |
| A. | Apple (+47.7%) was the best performing stock during the period. The company continued to post impressive growth driven largely by iPhone and tablet sales, while the successful launch of the third generation iPad added to investor enthusiasm. |
Western Digital (+29.3%) sold off in the 2nd quarter over fears of peak pricing and demand given the concerns over global PC demand. As a result, we added to our position and were rewarded as the company provided increased earnings guidance for FY13 driving the stock price considerably higher.
Wal-Mart (+35.6%) was a top performer for the period, as the market rewarded the company for regaining sales momentum in the U.S. Their international business is also seeing improved margins and should be a bigger contributor to earnings going forward.
| Q. | What were the weakest performing holdings? |
| A. | Hewlett-Packard (-49.4%) was the top overall detractor to performance over the past 12 months. The street reacted negatively to the earnings report in August, in which management provided a muted outlook for the remainder of 2012. Investors remain concerned about the ongoing turnaround at Hewlett-Packard and how quickly management can implement needed changes. |
Vale (-22.4%) was weaker for the 12-month period given macro concerns pertaining to China and overall global demand for steel. The Brazilian government’s influence over the company has also led some investors to question whose best interest company management is trying to appease—that of shareholders or the Brazilian government.
Hess Corp. (-15.8%) saw significant weakness during the period after posting disappointing forward guidance during its Q1 2012 quarterly earnings call. The stock was weak given its lackluster production results in the Bakken region—its primary growth area. Additionally, investors are focused on near-term capital expenditure costs and a portfolio that is viewed by some as being too diverse.
| Q. | How was the Fund positioned as of October 31, 2012? |
| A. | Despite the strong performance over the past 12 months, valuations remain compelling, both on traditional measures and our proprietary valuation work, which now indicates that 73% of the stocks in the 800 stock universe are undervalued relative to our assessment of their value. We continue to find a lot of value in the market, and are enthusiastic about the Fund’s positioning and our ability to improve the quality of the holdings while aiming to hold market leading, cash flow rich, and attractively priced companies in the process. |
Growth of a Hypothetical
$10,000 Investment—Class N
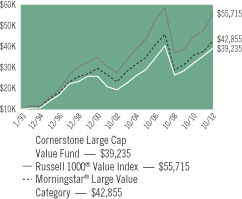
All dividends and capital gains are reinvested. Indexes are unmanaged and do not take into account fees, expenses or other costs.
Returns shown in the chart and table do not reflect taxes that a shareholder would pay on Fund distributions or on the sale of the Fund shares.
Value investing involves the risk that a Fund’s investing in companies believed to be undervalued will not appreciate as anticipated.
RETURNSFOR PERIOD ENDED 10/31/12
Average Annual Total Returns - Class N
| | | | |
One Year | | | 10.43 | % |
Five Year | | | -0.61 | % |
Ten Year | | | 7.34 | % |
Since Inception | | | 7.14 | % |
Inception Date 01/04/93
Average Annual Total Returns - Class I
| | | | |
One Year | | | 10.66 | % |
Five Year | | | -0.34 | % |
Since Inception | | | 4.35 | % |
Inception Date 09/20/05
The performance data quoted represents past performance. Past performance does not guarantee future results. Investment return and principal value will fluctuate so that an investor’s shares, upon redemption, may be worth more or less than their original cost. Current performance may be lower or higher than the performance data quoted. For performance data current to the most recent month-end, please visit our website at www.astonfunds.com.
The performance quoted would have been lower if fee waivers and/or expense reimbursements had not been in effect.
The total expense ratio for the Class N and Class I Shares is 1.61% and 1.36%, respectively, as disclosed in the prospectus dated March 1, 2012. Please refer to the Financial Highlights section in this report for more 2012 fiscal year-end related information.
| | |
| |
| ASTON/Cornerstone Large Cap Value Fund | | October 31, 2012 |
| |
| Schedule of Investments | | |
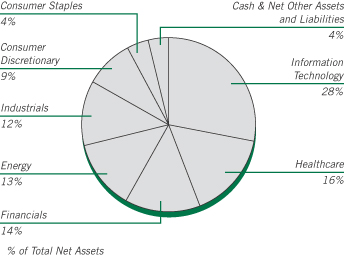
| | | | | | | | |
Shares | | | | | Market
Value | |
| |
| | COMMON STOCKS – 96.22% | | | | |
| | |
| | | | Consumer Discretionary – 8.57% | | | | |
| | 17,600 | | | Hasbro | | $ | 633,424 | |
| | 27,900 | | | Mattel | | | 1,026,162 | |
| | 53,100 | | | Staples | | | 611,447 | |
| | | | | | | | |
| | | | | | | 2,271,033 | |
| | | | | | | | |
| | |
| | | | Consumer Staples – 3.88% | | | | |
| | 13,700 | | | Wal-Mart Stores | | | 1,027,774 | |
| | | | | | | | |
| | |
| | | | Energy – 12.95% | | | | |
| | 7,750 | | | Apache | | | 641,312 | |
| | 9,275 | | | Chevron | | | 1,022,198 | |
| | 18,012 | | | Hess | | | 941,307 | |
| | 12,100 | | | Royal Dutch Shell PLC, ADR
(United Kingdom) | | | 828,608 | |
| | | | | | | | |
| | | | | | | 3,433,425 | |
| | | | | | | | |
| | |
| | | | Financials – 14.39% | | | | |
| | 10,925 | | | ACE (Switzerland) | | | 859,251 | |
| | 13,525 | | | Capital One Financial | | | 813,799 | |
| | 34,275 | | | Citigroup | | | 1,281,542 | |
| | 49,375 | | | Morgan Stanley | | | 858,138 | |
| | | | | | | | |
| | | | | | | 3,812,730 | |
| | | | | | | | |
| | |
| | | | Healthcare – 16.12% | | | | |
| | 11,175 | | | Eli Lilly | | | 543,440 | |
| | 19,025 | | | Merck | | | 868,111 | |
| | 22,550 | | | Sanofi, ADR (France) | | | 988,817 | |
| | 16,700 | | | Stryker | | | 878,420 | |
| | 24,575 | | | Teva Pharmaceutical, SP ADR (Israel) | | | 993,322 | |
| | | | | | | | |
| | | | | | | 4,272,110 | |
| | | | | | | | |
| | |
| | | | Industrials – 12.29% | | | | |
| | 7,100 | | | 3M | | | 621,960 | |
| | 19,300 | | | Eaton | | | 911,346 | |
| | | | | | | | |
Shares | | | | | Market
Value | |
| | |
| | | | Industrials (continued) | | | | |
| | 12,425 | | | General Dynamics | | $ | 845,894 | |
| | 11,175 | | | Parker Hannifin | | | 879,026 | |
| | | | | | | | |
| | | | | | | 3,258,226 | |
| | | | | | | | |
| | |
| | | | Information Technology – 28.02% | | | | |
| | 1,805 | | | Apple | | | 1,074,155 | |
| | 14,500 | | | eBay * | | | 700,205 | |
| | 1,545 | | | Google, Class A * | | | 1,050,245 | |
| | 33,700 | | | Hewlett-Packard | | | 466,745 | |
| | 23,200 | | | Intel | | | 501,700 | |
| | 3,455 | | | International Business Machines | | | 672,101 | |
| | 35,025 | | | Microsoft | | | 999,438 | |
| | 30,550 | | | Oracle | | | 948,577 | |
| | 29,625 | | | Western Digital * | | | 1,014,064 | |
| | | | | | | | |
| | | | | | | 7,427,230 | |
| | | | | | | | |
| | |
| | | | Total Common Stocks
(Cost $23,872,624) | | | 25,502,528 | |
| | | | | | | | |
| |
| | INVESTMENT COMPANY – 2.44% | | | | |
| | |
| | 645,820 | | | BlackRock Liquidity Funds TempCash Portfolio | | | 645,820 | |
| | | | | | | | |
| | |
| | | | Total Investment Company
(Cost $645,820) | | | 645,820 | |
| | | | | | | | |
| Total Investments – 98.66%
(Cost $24,518,444)** | | | 26,148,348 | |
| | | | | | | | |
| Net Other Assets and Liabilities – 1.34% | | | 354,520 | |
| | | | | | | | |
| Net Assets – 100.00% | | $ | 26,502,868 | |
| | | | | | | | |
| * | | Non-income producing security. |
| ** | | Aggregate cost for Federal income tax purposes is $24,749,261. |
| | | | |
Gross unrealized appreciation | | $ | 2,471,184 | |
Gross unrealized depreciation | | | (1,072,097 | ) |
| | | | |
Net unrealized appreciation | | $ | 1,399,087 | |
| | | | |
| ADR | | American Depositary Receipt |
| SP ADR | | Sponsored American Depositary Receipt |
See accompanying Notes to Financial Statements.
ASTON/River Road Dividend All Cap Value Fund
| | |
| |
| Portfolio Manager Commentary (unaudited) | | October 31, 2012 |
Henry W. Sanders, III, CFA; Thomas Forsha, CFA & James C. Shircliff, CFA
| Q. | What were the most significant market factors affecting Fund performance and returns relative to the benchmark during the past 12 months? |
| A. | Over the last 12 months, the most significant market factor affecting absolute performance was the ongoing extraordinary monetary policy (quantitative easing). According to Ned Davis Research,* among S&P 500 companies, performance declined as dividend yield increased, creating a significant relative headwind for a dividend-oriented strategy. The Energy sector had the highest impact on relative results, primarily due to strong stock selection and the underweight allocation in that sector. The Industrials sector had the most negative impact on relative results, primarily due to weak stock selection. |
| Q. | What were the best performing holdings for the Fund during the period? |
| A. | The two holdings with the largest positive contribution to the Fund’s total return were Sabra Healthcare REIT Inc., owner of a portfolio of skilled nursing and senior housing facilities, and Kimberly-Clark Corp., a global health and hygiene paper product manufacturer. During Q3 2012, Sabra reported quarterly results ahead of expectations and acquired two high-quality senior housing facilities, as well as a deal to acquire up to 10 newly constructed senior housing facilities. With its earnings release in August, Sabra reported aggressive refinancing activity, generating significant interest savings, and raised an additional $100 million of debt at an attractive interest rate. |
Kimberly-Clark reported Q1 results that topped analysts’ estimates, including +6% organic revenue growth. Sales at K-C International jumped +13%, bringing attention to its emerging markets business, which has grown +8% organically. Price increases, lower pulp costs, and benefits from cost reduction efforts contributed to a +29% increase in earnings before interest and tax year-over-year. Additionally, management announced the company will repurchase between $900 million and $1.1 billion worth of stock
from operating cash flow and raised its dividend +6% during the quarter.
| Q. | What were the weakest performing holdings? |
| A. | The two holdings with the lowest contribution to the Fund’s total return during the period were Telefonica Brasil SA ADR, the largest telecom company in Brazil, and Norfolk Southern Corp., a railroad operator in 22 eastern states. Despite solid fundamentals, Telefonica shares declined in Q2 2012 due to concerns about parent company Telefonica S.A. and weakness in the Brazilian Real. Investors are increasingly concerned about TEF’s debt burden and have begun to speculate whether they will be forced to sell all or part of their healthy, growing Latin American operations, including their 74% stake in VIV. While the parent company’s woes continue to make headlines, we remain confident in VIV’s strong cash production and modest financial leverage. |
In July, Norfolk Southern reported second quarter results in-line with our expectations, as strong efficiency gains and growth in merchandise traffic more than offset continued softness in the domestic coal business. As Q3 progressed, Chinese demand for U.S. coal exports faltered, reducing prices and the number of carloads traveling to eastern ports. Facing uncertain demand and lower fuel surcharge revenues, in late September, NSC forecasted that third quarter revenues would be down -4% versus last year and issued guidance below our expectations.
| Q. | How was the Fund positioned as of October 31, 2012? |
| A. | We continue to focus on stocks with high and growing dividends, healthy balance sheets, and attractive valuations that we believe can thrive in a low growth environment. |
*Ned Davis Research, Inc., Sarasota, FL, examined S&P 500 Stock Constituents ranked by quartiles (Dividend Yield) for the last twelve months as of October 31, 2012.
Growth of a Hypothetical
$10,000 Investment—Class N
All dividends and capital gains are reinvested. Indexes are unmanaged and do not take into account fees, expenses or other costs.
Returns shown in the chart and table do not reflect taxes that a shareholder would pay on Fund distributions or on the sale of the Fund shares.
Value investing involves the risk that a Fund’s investing in companies believed to be undervalued will not appreciate as anticipated.
Small-cap and mid-cap stocks may be subject to a higher degree of market risk than the securities of more established companies because they tend to be more volatile and less liquid.
RETURNSFOR PERIOD ENDED 10/31/12
Average Annual Total Returns - Class N
| | | | |
One Year | | | 12.96 | % |
Five Year | | | 2.42 | % |
Since Inception | | | 6.15 | % |
Inception Date 06/28/05
Average Annual Total Returns - Class I
| | | | |
One Year | | | 13.25 | % |
Five Year | | | 2.67 | % |
Since Inception | | | 2.20 | % |
Inception Date 06/28/07
The performance data quoted represents past performance. Past performance does not guarantee future results. Investment return and principal value will fluctuate so that an investor’s shares, upon redemption, may be worth more or less than their original cost. Current performance may be lower or higher than the performance data quoted. For performance data current to the most recent month-end, please visit our website at www.astonfunds.com.
| | |
| |
| ASTON/River Road Dividend All Cap Value Fund | | October 31, 2012 |
| |
| Schedule of Investments | | |
| | | | | | | | |
Shares | | | | | Market
Value | |
|
| | COMMON STOCKS – 96.32% | |
| | |
| | | | Consumer Discretionary – 14.91% | | | | |
| | 485,725 | | | American Greetings, Class A | | $ | 8,339,898 | |
| | 351,120 | | | Bob Evans Farms | | | 13,367,138 | |
| | 240,910 | | | Darden Restaurants | | | 12,676,684 | |
| | 135,110 | | | Genuine Parts | | | 8,455,184 | |
| | 400,675 | | | Hasbro | | | 14,420,293 | |
| | 575,430 | | | Hillenbrand | | | 11,779,052 | |
| | 295,665 | | | Kohl’s | | | 15,753,031 | |
| | 641,820 | | | National CineMedia | | | 9,922,537 | |
| | 680,400 | | | Regal Entertainment Group, Class A | | | 10,450,944 | |
| | 269,270 | | | Target | | | 17,165,963 | |
| | 546,160 | | | Thomson Reuters | | | 15,434,482 | |
| | | | | | | | |
| | | | | | | 137,765,206 | |
| | | | | | | | |
| | |
| | | | Consumer Staples – 15.51% | | | | |
| | 280,355 | | | Dr Pepper Snapple Group | | | 12,013,212 | |
| | 542,090 | | | General Mills | | | 21,726,967 | |
| | 254,030 | | | Kimberly-Clark | | | 21,198,804 | |
| | 278,675 | | | Molson Coors Brewing, Class B | | | 12,022,040 | |
| | 247,260 | | | PepsiCo | | | 17,120,282 | |
| | 180,650 | | | Procter & Gamble | | | 12,508,206 | |
| | 584,025 | | | Sysco | | | 18,145,657 | |
| | 176,365 | | | Wal-Mart Stores | | | 13,230,902 | |
| | 435,755 | | | Walgreen | | | 15,351,649 | |
| | | | | | | | |
| | | | | | | 143,317,719 | |
| | | | | | | | |
| | |
| | | | Energy – 5.67% | | | | |
| | 902,200 | | | BreitBurn Energy Partners LP | | | 18,188,352 | |
| | 160,995 | | | Chevron | | | 17,743,259 | |
| | 196,750 | | | ConocoPhillips | | | 11,381,988 | |
| | 142,055 | | | Transmontaigne Partners LP | | | 5,051,476 | |
| | | | | | | | |
| | | | | | | 52,365,075 | |
| | | | | | | | |
| | | | | | | | |
Shares | | | | | Market
Value | |
| | |
| | | | Financials – 13.42% | | | | |
| | 92,725 | | | BlackRock | | $ | 17,588,078 | |
| | 183,560 | | | Chubb | | | 14,130,449 | |
| | 210,895 | | | CME Group | | | 11,795,357 | |
| | 208,329 | | | Commerce Bancshares | | | 7,933,168 | |
| | 390,105 | | | Compass Diversified Holdings | | | 5,617,512 | |
| | 340,855 | | | OneBeacon Insurance Group, Class A (Bermuda) | | | 4,601,542 | |
| | 186,040 | | | PartnerRe (Bermuda) | | | 15,069,240 | |
| | 191,300 | | | PNC Financial Services Group | | | 11,131,747 | |
| | 720,870 | | | Sabra Health Care, REIT | | | 16,017,731 | |
| | 197,655 | | | Safety Insurance Group | | | 9,161,309 | |
| | 260,135 | | | Tower Group | | | 4,687,633 | |
| | 190,355 | | | U.S. Bancorp | | | 6,321,690 | |
| | | | | | | | |
| | | | | | | 124,055,456 | |
| | | | | | | | |
| | |
| | | | Healthcare – 8.59% | | | | |
| | 253,295 | | | AstraZeneca PLC, SP ADR (United Kingdom) | | | 11,752,888 | |
| | 143,350 | | | Becton, Dickinson | | | 10,848,728 | |
| | 201,440 | | | Johnson & Johnson | | | 14,265,981 | |
| | 40,123 | | | Landauer | | | 2,325,128 | |
| | 346,845 | | | Medtronic | | | 14,421,815 | |
| | 371,262 | | | Owens & Minor | | | 10,569,829 | |
| | 613,030 | | | Pfizer | | | 15,246,056 | |
| | | | | | | | |
| | | | | | | 79,430,425 | |
| | | | | | | | |
| | |
| | | | Industrials – 14.69% | | | | |
| | 88,840 | | | 3M | | | 7,782,384 | |
| | 413,935 | | | ABM Industries | | | 7,864,765 | |
| | 103,925 | | | Emerson Electric | | | 5,033,088 | |
| | 179,715 | | | General Dynamics | | | 12,234,997 | |
| | 339,075 | | | Iron Mountain | | | 11,731,995 | |
| | 166,445 | | | Lockheed Martin | | | 15,590,903 | |
| | 275,815 | | | Norfolk Southern | | | 16,921,250 | |
| | 214,915 | | | Raytheon | | | 12,155,592 | |
| | 408,935 | | | Republic Services | | | 11,593,307 | |
| | 244,070 | | | United Parcel Service, Class B | | | 17,878,128 | |
| | 65,280 | | | United Technologies | | | 5,102,285 | |
| | 362,815 | | | Waste Management | | | 11,878,563 | |
| | | | | | | | |
| | | | | | | 135,767,257 | |
| | | | | | | | |
| | |
| | | | Information Technology – 9.34% | | | | |
| | 386,805 | | | Automatic Data Processing | | | 22,353,461 | |
| | 433,150 | | | CA | | | 9,754,538 | |
| | 560,525 | | | Corning | | | 6,586,169 | |
| | 913,380 | | | Intel | | | 19,751,843 | |
| | 253,180 | | | j2 Global | | | 7,605,527 | |
| | 388,950 | | | Microsoft | | | 11,098,688 | |
| | 283,250 | | | Paychex | | | 9,185,798 | |
| | | | | | | | |
| | | | | | | 86,336,024 | |
| | | | | | | | |
| | |
| | | | Materials – 2.46% | | | | |
| | 326,265 | | | Bemis | | | 10,783,058 | |
| | 298,545 | | | Nucor | | | 11,980,611 | |
| | | | | | | | |
| | | | | | | 22,763,669 | |
| | | | | | | | |
See accompanying Notes to Financial Statements.
| | |
| |
| ASTON/River Road Dividend All Cap Value Fund | | October 31, 2012 |
| |
| Schedule of Investments – continued | | |
| | | | | | | | |
Shares | | | | | Market
Value | |
| | |
| | | | Telecommunication Services – 5.58% | | | | |
| | 127,675 | | | Atlantic Tele-Network | | $ | 5,290,852 | |
| | 483,162 | | | Telefonica Brasil SA, ADR (Brazil) | | | 10,639,227 | |
| | 375,875 | | | Verizon Communications | | | 16,779,060 | |
| | 692,225 | | | Vodafone Group, SP ADR (United Kingdom) | | | 18,842,365 | |
| | | | | | | | |
| | | | | | | 51,551,504 | |
| | | | | | | | |
| | |
| | | | Utilities – 6.15% | | | | |
| | 222,315 | | | AmeriGas Partners LP | | | 9,959,712 | |
| | 424,900 | | | Avista | | | 10,800,958 | |
| | 119,940 | | | Entergy | | | 8,705,245 | |
| | 176,220 | | | National Fuel Gas | | | 9,286,794 | |
| | 424,875 | | | UNS Energy | | | 18,116,670 | |
| | | | | | | | |
| | | | | | | 56,869,379 | |
| | | | | | | | |
| | |
| | | | Total Common Stocks
(Cost $797,171,955) | | | 890,221,714 | |
| | | | | | | | |
|
| | INVESTMENT COMPANY – 3.50% | |
| | |
| | 32,335,683 | | | BlackRock Liquidity Funds
TempCash Portfolio | | | 32,335,683 | |
| | | | | | | | |
| | |
| | | | Total Investment Company
(Cost $32,335,683) | | | 32,335,683 | |
| | | | | | | | |
| Total Investments – 99.82%
(Cost $829,507,638)* | | | 922,557,397 | |
| | | | | | | | |
| Net Other Assets and Liabilities – 0.18% | | | 1,651,971 | |
| | | | | | | | |
| Net Assets – 100.00% | | $ | 924,209,368 | |
| | | | | | | | |
| * | | Aggregate cost for Federal income tax purposes is $830,214,282. |
| | | | |
Gross unrealized appreciation | | $ | 101,045,034 | |
Gross unrealized depreciation | | | (8,701,919 | ) |
| | | | |
Net unrealized appreciation | | $ | 92,343,115 | |
| | | | |
| ADR | | American Depositary Receipt |
| REIT | | Real Estate Investment Trust |
| SP ADR | | Sponsored American Depositary Receipt |
See accompanying Notes to Financial Statements.
ASTON/River Road Dividend All Cap Value Fund II
| | |
| |
| Portfolio Manager Commentary (unaudited) | | October 31, 2012 |
Henry W. Sanders, III, CFA; Thomas Forsha, CFA & James C. Shircliff, CFA
| Q. | What were the most significant market factors affecting Fund performance and returns relative to the benchmark during the past 12 months? |
| A. | Since inception, the most significant market factor affecting absolute performance was the ongoing extraordinary monetary policy (quantitative easing). According to Ned Davis Research,* among S&P 500 companies, performance declined as dividend yield increased, a significant relative headwind for a dividend-oriented strategy. The Utilities sector was the only sector with a positive impact on relative results, primarily due to strong stock selection and the underweight allocation. The Financials sector had the most negative impact on relative results, primarily due to weak stock selection and the underweight allocation. |
| Q. | What were the best performing holdings for the Fund during the period? |
| A. | The two holdings with the largest positive contribution to the Fund’s total return were BreitBurn Energy Partners L.P., an independent oil and gas master limited partnership, and Iron Mountain Inc., which provides record management services. BreitBurn units ended Q2 trading near the 52-week low after making a $93 million acquisition in Wyoming’s Big Horn Basin and two acquisitions in the Permian Basin in Texas for $220 million. While the acquisitions raised concerns about the partnership’s leverage, rising oil prices in September enabled management to place 10 million new partnership units at prices well off the June/July lows. Investors continue to find BreitBurn’s strong yield (over 9%) attractive and were encouraged by the ninth consecutive quarterly dividend increase, announced in August. |
Iron Mountain posted solid Q2 2012 results. Earnings before interest, taxes, depreciation and amortization margins increased 130 bps to 31.3% year-over-year (yoy) on better fixed cost control, storage organic revenue increased 4% yoy, offset by lower commodity prices for recycled paper (down 33% yoy), and the international market had 8% organic growth. In June, Iron Mountain raised the dividend 8% to $1.08/share, and
the Board of Directors has committed to $1 billion in return-of-capital through 2013 via increased dividends and a one-time dividend.
| Q. | What were the weakest performing holdings? |
| A. | The two holdings with the lowest contribution to the Fund’s total return during the period were Intel Corp., the world’s largest semiconductor manufacturer, and Norfolk Southern Corp., a railroad operator in 22 eastern states. Intel shares were weak following a disappointing Q2 earnings release, which was below both our and Wall Street expectations, and a cut to guidance that was larger than anticipated. While the company’s Data Center and Software & Services groups continued to post strong growth, the core PC business was softer than expected despite the launch of new Ivy Bridge chips. Shares continued to slide after both Dell and HP, Intel’s largest customers, offered disappointing results and guidance in August. |
In July, Norfolk Southern reported second quarter results in-line with our expectations, as strong efficiency gains and growth in merchandise traffic more than offset continued softness in the domestic coal business. As Q3 progressed, Chinese demand for U.S. coal exports faltered, reducing prices and the number of carloads traveling to eastern ports. Facing uncertain demand and lower fuel surcharge revenues, in late September, Norfolk Southern forecasted that third quarter revenues would be down -4% versus last year and issued guidance below our expectations.
| Q. | How was the Fund positioned as of October 31, 2012? |
| A. | We continue to focus on stocks with high and growing dividends, healthy balance sheets, and attractive valuations that we believe can thrive in a low growth environment. |
*Ned Davis Research, Inc., Sarasota, FL, examined S&P 500 Stock Constituents ranked by quartiles (Dividend Yield) for the last twelve months as of October 31, 2012.
Growth of a Hypothetical
$10,000 Investment—Class N
All dividends and capital gains are reinvested. Indexes are unmanaged and do not take into account fees, expenses or other costs.
Returns shown in the chart and table do not reflect taxes that a shareholder would pay on Fund distributions or on the sale of the Fund shares.
Value investing involves the risk that a Fund’s investing in companies believed to be undervalued will not appreciate as anticipated.
Small-cap and mid-cap stocks may be subject to a higher degree of market risk than the securities of more established companies because they tend to be more volatile and less liquid.
RETURNSFOR PERIOD ENDED 10/31/12
Total Return - Class N
| | | | |
Cumulative Since Inception | | | 5.09 | % |
Inception Date 06/27/12
Total Return - Class I
| | | | |
Cumulative Since Inception | | | 5.17 | % |
Inception Date 06/27/12
The performance data quoted represents past performance. Past performance does not guarantee future results. Investment return and principal value will fluctuate so that an investor’s shares, upon redemption, may be worth more or less than their original cost. Current performance may be lower or higher than the performance data quoted. For performance data current to the most recent month-end, please visit our website at www.astonfunds.com.
The performance quoted would have been lower if fee waivers and/or expense reimbursements had not been in effect.
| | |
| |
| ASTON/River Road Dividend All Cap Value Fund II | | October 31, 2012 |
| |
| Schedule of Investments | | |
| | | | | | | | |
Shares | | | | | Market
Value | |
|
| | COMMON STOCKS – 95.25% | |
| | |
| | | | Consumer Discretionary – 12.91% | | | | |
| | 1,255 | | | Bob Evans Farms | | $ | 47,778 | |
| | 3,160 | | | Darden Restaurants | | | 166,279 | |
| | 1,735 | | | Genuine Parts | | | 108,576 | |
| | 5,265 | | | Hasbro | | | 189,487 | |
| | 2,915 | | | Hillenbrand | | | 59,670 | |
| | 3,720 | | | Kohl’s | | | 198,202 | |
| | 8,970 | | | Regal Entertainment Group, Class A | | | 137,779 | |
| | 3,670 | | | Target | | | 233,963 | |
| | 7,185 | | | Thomson Reuters | | | 203,048 | |
| | | | | | | | |
| | | | | | | 1,344,782 | |
| | | | | | | | |
| | |
| | | | Consumer Staples – 17.97% | | | | |
| | 3,345 | | | Dr Pepper Snapple Group | | | 143,333 | |
| | 7,400 | | | General Mills | | | 296,592 | |
| | 3,260 | | | Kimberly-Clark | | | 272,047 | |
| | 3,670 | | | Molson Coors Brewing, Class B | | | 158,324 | |
| | 3,245 | | | PepsiCo | | | 224,684 | |
| | 2,400 | | | Procter & Gamble | | | 166,176 | |
| | 7,350 | | | Sysco | | | 228,365 | |
| | 2,335 | | | Wal-Mart Stores | | | 175,172 | |
| | 5,905 | | | Walgreen | | | 208,033 | |
| | | | | | | | |
| | | | | | | 1,872,726 | |
| | | | | | | | |
| | |
| | | | Energy – 4.80% | | | | |
| | 5,650 | | | BreitBurn Energy Partners LP | | | 113,904 | |
| | 2,145 | | | Chevron | | | 236,400 | |
| | 2,590 | | | ConocoPhillips | | | 149,832 | |
| | | | | | | | |
| | | | | | | 500,136 | |
| | | | | | | | |
| | |
| | | | Financials – 10.20% | | | | |
| | 1,225 | | | BlackRock | | | 232,358 | |
| | 1,920 | | | Chubb | | | 147,802 | |
| | | | | | | | |
Shares | | | | | Market
Value | |
| | |
| | | | Financials (continued) | | | | |
| | 2,790 | | | CME Group | | $ | 156,045 | |
| | 2,672 | | | Commerce Bancshares | | | 101,750 | |
| | 2,400 | | | PartnerRe (Bermuda) | | | 194,400 | |
| | 2,590 | | | PNC Financial Services Group | | | 150,712 | |
| | 2,400 | | | U.S. Bancorp | | | 79,704 | |
| | | | | | | | |
| | | | | | | 1,062,771 | |
| | | | | | | | |
| | |
| | | | Healthcare – 9.85% | | | | |
| | 3,605 | | | AstraZeneca PLC, SP ADR (United Kingdom) | | | 167,272 | |
| | 1,935 | | | Becton, Dickinson | | | 146,441 | |
| | 2,655 | | | Johnson & Johnson | | | 188,027 | |
| | 4,535 | | | Medtronic | | | 188,565 | |
| | 4,560 | | | Owens & Minor | | | 129,823 | |
| | 8,300 | | | Pfizer | | | 206,421 | |
| | | | | | | | |
| | | | | | | 1,026,549 | |
| | | | | | | | |
| | |
| | | | Industrials – 15.96% | | | | |
| | 1,285 | | | 3M | | | 112,566 | |
| | 4,095 | | | ABM Industries | | | 77,805 | |
| | 1,305 | | | Emerson Electric | | | 63,201 | |
| | 2,470 | | | General Dynamics | | | 168,158 | |
| | 4,615 | | | Iron Mountain | | | 159,679 | |
| | 2,235 | | | Lockheed Martin | | | 209,352 | |
| | 3,670 | | | Norfolk Southern | | | 225,155 | |
| | 2,765 | | | Raytheon | | | 156,388 | |
| | 5,135 | | | Republic Services | | | 145,577 | |
| | 3,115 | | | United Parcel Service, Class B | | | 228,174 | |
| | 775 | | | United Technologies | | | 60,574 | |
| | 1,710 | | | Waste Management | | | 55,985 | |
| | | | | | | | |
| | | | | | | 1,662,614 | |
| | | | | | | | |
| | |
| | | | Information Technology – 9.86% | | | | |
| | 3,475 | | | Automatic Data Processing | | | 200,820 | |
| | 5,475 | | | CA | | | 123,297 | |
| | 7,175 | | | Corning | | | 84,306 | |
| | 11,955 | | | Intel | | | 258,527 | |
| | 3,245 | | | j2 Global | | | 97,480 | |
| | 4,975 | | | Microsoft | | | 141,962 | |
| | 3,750 | | | Paychex | | | 121,613 | |
| | | | | | | | |
| | | | | | | 1,028,005 | |
| | | | | | | | |
| | |
| | | | Materials – 2.81% | | | | |
| | 4,120 | | | Bemis | | | 136,166 | |
| | 3,900 | | | Nucor | | | 156,507 | |
| | | | | | | | |
| | | | | | | 292,673 | |
| | | | | | | | |
| | |
| | | | Telecommunication Services – 5.94% | | | | |
| | 6,951 | | | Telefonica Brasil SA ADR (Brazil) | | | 153,061 | |
| | 4,960 | | | Verizon Communications | | | 221,414 | |
| | 8,970 | | | Vodafone Group, SP ADR (United Kingdom) | | | 244,163 | |
| | | | | | | | |
| | | | | | | 618,638 | |
| | | | | | | | |
See accompanying Notes to Financial Statements.
| | |
| |
| ASTON/River Road Dividend All Cap Value Fund II | | October 31, 2012 |
| |
| Schedule of Investments – continued | | |
| | | | | | | | |
Shares | | | | | Market
Value | |
| | |
| | | | Utilities – 4.95% | | | | |
| | 1,760 | | | AmeriGas Partners LP | | $ | 78,848 | |
| | 2,720 | | | Avista | | | 69,142 | |
| | 1,695 | | | Entergy | | | 123,023 | |
| | 2,235 | | | National Fuel Gas | | | 117,785 | |
| | 2,970 | | | UNS Energy | | | 126,641 | |
| | | | | | | | |
| | | | | | | 515,439 | |
| | | | | | | | |
| | |
| | | | Total Common Stocks
(Cost $9,971,686) | | | 9,924,333 | |
| | | | | | | | |
|
| | INVESTMENT COMPANY – 3.55% | |
| | |
| | 369,982 | | | BlackRock Liquidity Funds
TempCash Portfolio | | | 369,982 | |
| | | | | | | | |
| | |
| | | | Total Investment Company
(Cost $369,982) | | | 369,982 | |
| | | | | | | | |
| Total Investments – 98.80%
(Cost $10,341,668)* | | | 10,294,315 | |
| | | | | | | | |
| Net Other Assets and Liabilities – 1.20% | | | 124,925 | |
| | | | | | | | |
| Net Assets – 100.00% | | $ | 10,419,240 | |
| | | | | | | | |
| * | | Aggregate cost for Federal income tax purposes is $10,342,918. |
| | | | |
Gross unrealized appreciation | | $ | 151,570 | |
Gross unrealized depreciation | | | (200,173 | ) |
| | | | |
Net unrealized depreciation | | $ | (48,603 | ) |
| | | | |
| ADR | | American Depositary Receipt |
| SP ADR | | Sponsored American Depositary Receipt |
See accompanying Notes to Financial Statements.
ASTON/Fairpointe Mid Cap Fund
| | |
| |
| Portfolio Manager Commentary (unaudited) | | October 31, 2012 |
Thyra E. Zerhusen, Marie L. Lorden & Mary L. Pierson
| Q. | What were the most significant market factors affecting Fund performance and returns relative to the benchmark during the past 12 months? |
| A. | Despite a multitude of macro concerns in Europe and the U.S. and significant volatility, equity markets fared quite well. The S&P 500 Index was up 15.21%, the S&P Midcap 400 Index increased 12.11% and the Russell Midcap Index was up 12.15%. The Fund was up 11.15% (11.46%, I–shares), slightly outperforming its Morningstar Mid-Blend category which increased 10.26%. |
| Q. | What were the best performing holdings for the Fund during the period? |
| A. | The best performing stocks were Akamai Technologies, a leader in accelerating delivery of internet content, up 44%; Gannett Company, a provider of media and marketing services, up 52%; and Lincare Holdings, a home health care provider, up 76%. We eliminated the position from the portfolio after it became a takeover target by Linde AG. Linde paid $41.50 per Lincare share. |
| Q. | What were the weakest performing holdings? |
| A. | Two stocks were down more than 20% during the period: Lexmark International and Unisys Corporation. Lexmark reported second quarter results below expectations. The company subsequently announced a significant share repurchase program and a major restructuring plan (including the exit of the low margin inkjet printer business). The stock is currently trading at book value, a yield of 5.2%, and P/E multiple of 5.6x. Unisys reported disappointing third quarter |
| | results. North American revenues in particular were weaker than expected. The stock appears attractively valued with a current P/E of 5x. We remain encouraged by the growing pipeline of opportunities in cloud computing and data security. |
| Q. | How was the Fund positioned as of October 31, 2012? |
| A. | The Fund is attractively valued with a P/E of 11.3x and a P/E to growth rate of 1.1. This valuation is more attractive than the S&P 400 benchmark which has a P/E of 14.2x and the Russell Midcap’s P/E of 12.2. At the same time, our mid-cap holdings have a better balance sheet profile and have the potential to be more profitable compared to the above mentioned benchmarks. Our mid-cap holdings are well diversified geographically, have the ability to grow market share, and in many cases represent “must have” products or services that make their clients more efficient. |
Concerns about the current economic problems in the U.S. and abroad have provided us with the opportunity to initiate or add to positions in companies with strong secular growth but which are currently under pressure due to the still weak economic environment. We look for companies that have the ability to weather the current storms and report strong results when conditions improve.
Note: The price/earnings (P/E) of a fund is the weighted average of the P/E ratios of all the companies in the fund’s portfolio. The P/E ratio of a company is a comparison of the price of the company’s stock divided by its estimated earnings per share.
Growth of a Hypothetical
$10,000 Investment—Class N
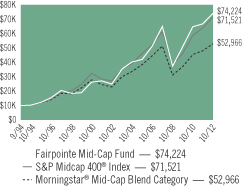
All dividends and capital gains are reinvested. Indexes are unmanaged and do not take into account fees, expenses or other costs.
Returns shown in the chart and table do not reflect taxes that a shareholder would pay on Fund distributions or on the sale of the Fund shares.
Small-cap and mid-cap stocks may be subject to a higher degree of market risk than the securities of more established companies because they tend to be more volatile and less liquid.
RETURNSFOR PERIOD ENDED 10/31/12
Average Annual Total Returns - Class N
| | | | |
One Year | | | 11.15 | % |
Five Year | | | 2.70 | % |
Ten Year | | | 11.51 | % |
Since Inception | | | 11.70 | % |
Inception Date 09/19/94
Average Annual Total Returns - Class I
| | | | |
One Year | | | 11.46 | % |
Five Year | | | 2.95 | % |
Since Inception | | | 7.49 | % |
Inception Date 07/06/04
The performance data quoted represents past performance. Past performance does not guarantee future results. Investment return and principal value will fluctuate so that an investor’s shares, upon redemption, may be worth more or less than their original cost. Current performance may be lower or higher than the performance data quoted. For performance data current to the most recent month-end, please visit our website at www.astonfunds.com.
The total expense ratio for the Class N and Class I Shares is 1.14% and 0.89% respectively, as disclosed in the prospectus dated March 1, 2012. Please refer to the Financial Highlights section in this report for more 2012 fiscal year-end related information.
| | |
| |
| ASTON/Fairpointe Mid Cap Fund | | October 31, 2012 |
| |
| Schedule of Investments | | |
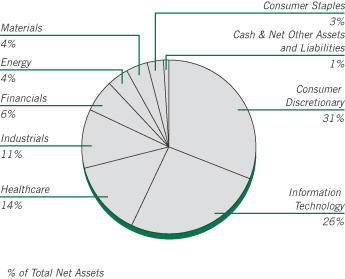
| | | | | | | | |
Shares | | | | | Market
Value | |
| |
| | COMMON STOCKS – 99.09% | | | | |
| | |
| | | | Consumer Discretionary – 30.69% | | | | |
| | 6,938,478 | | | Belo, Class A | | $ | 51,899,815 | |
| | 701,200 | | | BorgWarner * | | | 46,152,984 | |
| | 4,334,100 | | | DeVry | | | 113,813,466 | |
| | 6,501,400 | | | Gannett | | | 109,873,660 | |
| | 6,565,800 | | | H&R Block | | | 116,214,660 | |
| | 8,062,468 | | | Interpublic Group | | | 81,430,927 | |
| | 1,275,400 | | | Lear | | | 54,332,040 | |
| | 1,357,200 | | | Mattel | | | 49,917,816 | |
| | 1,482,555 | | | McGraw-Hill | | | 81,955,640 | |
| | 11,650,554 | | | New York Times, Class A * | | | 95,301,532 | |
| | 1,514,897 | | | Scholastic | | | 49,976,452 | |
| | 6,741,900 | | | Staples | | | 77,632,979 | |
| | | | | | | | |
| | | | | | | 928,501,971 | |
| | | | | | | | |
| | |
| | | | Consumer Staples – 3.28% | | | | |
| | 356,720 | | | Bunge | | | 25,337,822 | |
| | 1,709,486 | | | Molson Coors Brewing, Class B | | | 73,747,226 | |
| | | | | | | | |
| | | | | | | 99,085,048 | |
| | | | | | | | |
| | |
| | | | Energy – 4.45% | | | | |
| | 1,249,692 | | | Compagnie Generale de Geophysique-Veritas, SP ADR (France) | | | 40,589,996 | |
| | 1,711,329 | | | Denbury Resources * | | | 26,234,674 | |
| | 1,660,792 | | | FMC Technologies * | | | 67,926,393 | |
| | | | | | | | |
| | | | | | | 134,751,063 | |
| | | | | | | | |
| | |
| | | | Financials – 5.93% | | | | |
| | 1,429,800 | | | Cincinnati Financial | | | 56,963,232 | |
| | 1,862,285 | | | Eaton Vance | | | 52,404,700 | |
| | 1,467,888 | | | Northern Trust | | | 70,135,689 | |
| | | | | | | | |
| | | | | | | 179,503,621 | |
| | | | | | | | |
| | | | | | | | |
Shares | | | | | Market
Value | |
| | |
| | | | Healthcare – 14.20% | | | | |
| | 21,005,636 | | | Boston Scientific * | | $ | 107,968,969 | |
| | 1,821,719 | | | Charles River Laboratories * | | | 67,986,553 | |
| | 2,359,768 | | | Forest Laboratories * | | | 79,547,779 | |
| | 2,883,231 | | | Hospira * | | | 88,486,359 | |
| | 1,283,700 | | | Varian Medical Systems * | | | 85,699,812 | |
| | | | | | | | |
| | | | | | | 429,689,472 | |
| | | | | | | | |
| | |
| | | | Industrials – 10.99% | | | | |
| | 1,196,000 | | | Chicago Bridge & Iron (Netherlands) | | | 44,909,800 | |
| | 2,346,100 | | | Con-way | | | 68,294,971 | |
| | 1,553,944 | | | ManpowerGroup | | | 58,956,635 | |
| | 9,136,600 | | | Southwest Airlines | | | 80,584,812 | |
| | 3,445,400 | | | Werner Enterprises | | | 79,795,464 | |
| | | | | | | | |
| | | | | | | 332,541,682 | |
| | | | | | | | |
| | |
| | | | Information Technology – 25.69% | | | | |
| | 2,348,239 | | | Akamai Technologies * | | | 89,209,600 | |
| | 2,096,100 | | | Cree * | | | 63,574,713 | |
| | 1,219,900 | | | Harris | | | 55,847,022 | |
| | 2,279,798 | | | Itron * | | | 93,608,506 | |
| | 2,702,900 | | | Jabil Circuit | | | 46,868,286 | |
| | 3,608,400 | | | Lexmark International, Class A | | | 76,714,584 | |
| | 566,104 | | | Mentor Graphics * | | | 8,785,934 | |
| | 1,883,786 | | | Molex | | | 48,921,922 | |
| | 1,829,264 | | | Molex, Class A | | | 39,219,420 | |
| | 3,021,300 | | | Nuance Communications * | | | 67,254,138 | |
| | 4,677,300 | | | NVIDIA * | | | 55,987,281 | |
| | 3,856,628 | | | Unisys * | | | 65,755,507 | |
| | 1,824,659 | | | Zebra Technologies, Class A * | | | 65,559,998 | |
| | | | | | | | |
| | | | | | | 777,306,911 | |
| | | | | | | | |
| | |
| | | | Materials – 3.86% | | | | |
| | 928,600 | | | FMC | | | 49,698,672 | |
| | 957,900 | | | Sigma-Aldrich | | | 67,187,106 | |
| | | | | | | | |
| | | | | | | 116,885,778 | |
| | | | | | | | |
| | |
| | | | Total Common Stocks
(Cost $2,511,414,136) | | | 2,998,265,546 | |
| | | | | | | | |
| |
| | INVESTMENT COMPANY – 0.75% | | | | |
| | |
| | 22,475,495 | | | BlackRock Liquidity Funds TempCash Portfolio | | | 22,475,495 | |
| | | | | | | | |
| | |
| | | | Total Investment Company
(Cost $22,475,495) | | | 22,475,495 | |
| | | | | | | | |
| Total Investments – 99.84%
(Cost $2,533,889,631)** | | | 3,020,741,041 | |
| | | | | | | | |
| Net Other Assets and Liabilities – 0.16% | | | 4,990,591 | |
| | | | | | | | |
| Net Assets – 100.00% | | $ | 3,025,731,632 | |
| | | | | | | | |
See accompanying Notes to Financial Statements.
| | |
| |
| ASTON/Fairpointe Mid Cap Fund | | October 31, 2012 |
| |
| Schedule of Investments – continued | | |
| * | | Non-income producing security. |
| ** | | Aggregate cost for Federal income tax purposes is $2,535,470,394. |
| | | | |
Gross unrealized appreciation | | $ | 589,711,130 | |
Gross unrealized depreciation | | | (104,440,483 | ) |
| | | | |
Net unrealized appreciation | | $ | 485,270,647 | |
| | | | |
| SP ADR | | Sponsored American Depositary Receipt |
See accompanying Notes to Financial Statements.
ASTON/Montag & Caldwell Mid Cap Growth Fund
| | |
| |
| Portfolio Manager Commentary (unaudited) | | October 31, 2012 |
| | M. Scott Thompson, CFA & Andrew W. Jung, CFA |
| Q. | What were the most significant market factors affecting Fund performance and returns relative to the benchmark during the past 12 months? |
| A. | For the past 12 months, the Fund just slightly underperformed its primary benchmark as positive stock selection was offset by sector allocation. Stock selection in the Consumer Discretionary sector was again particularly good as was stock selection in the Energy and Materials sectors. Stock selection in Financials and Healthcare, by comparison, were detractors from performance, though allocation to these two sectors was neutral to modestly positive. In both cases, a single stock in both sectors accounted for the majority of the underperformance. |
| Q. | What were the best performing holdings for the Fund during the period? |
| A. | Over the past twelve months, LKQ Corporation, Inc. shares have benefited from above-average earnings growth during a period of both increased economic uncertainty as well as slowing corporate profit growth. The company was able to achieve better growth through ongoing improvements in the company’s core business, alternative collision replacement parts, as well as the attractive acquisition of Euro Car Parts in October 2011. |
Verisk Analytics, Inc., which provides information and data analytics about risk to companies in the insurance, healthcare, and mortgage industries, among others, benefited from consistent double-digit revenue growth and rising margins driving 15-20% quarterly earnings growth.
Ecolab Inc. shares performed well as solid organic growth for its core institutional cleaning and sanitizing business, combined with the accretive benefits of the Nalco acquisition, which closed in late 2011, offered investors visibility to accelerating earnings per share growth despite a slowing in global economic growth.
| Q. | What were the weakest performing holdings? |
| A. | Unusually weak telecom carrier spending in the second half of 2011 carried |
| | forward into the first half of 2012, which made for a difficult demand environment for Juniper Networks, causing its shares to underperform. |
MSCI experienced a sharp correction in its share price in recent months following Vanguard’s decision to eliminate the use of MSCI indices as benchmarks for their index mutual funds. In addition to the negative financial impact to MSCI, investors grew concerned that other providers of ETFs and index funds might follow suit, potentially causing a reduction in the company’s medium-term earnings power and growth trajectory.
For F5 Networks, rising political and macro uncertainty this past summer and early fall caused customers to postpone spending decisions, which led to an earnings shortfall in the September quarter and downward estimate revisions.
| Q. | How was the Fund positioned as of October 31, 2012? |
| A. | We continue to maintain what we believe is a balanced portfolio of both cyclical and non-cyclical growth stocks to reflect the challenge of dueling market forces—weakening economic and corporate profit growth offset by additional central bank accommodation. Political uncertainty remains high, which has implications for how the “fiscal cliff” is addressed. Based on experience with the showdown over the debt ceiling in 2011, our confidence that it gets resolved gracefully is low. Most investors seem to be adopting a more hopeful view that a last minute deal will be struck to prevent us from going over the cliff. Regardless of the outcome, we remain convinced that the longer-term growth outlook remains subdued as household and government sector deleveraging will likely remain dominant themes for the foreseeable future. In that environment, we continue to believe that high-quality growth stocks offer the greatest appeal. Their valuations are attractive on our work, and their earnings growth is possibly due to their financial strength and geographic diversification. |
Growth of a Hypothetical $10,000 Investment—Class N
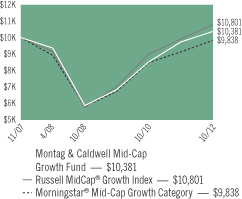
All dividends and capital gains are reinvested. Indexes are unmanaged and do not take into account fees, expenses or other costs.
Returns shown in the chart and table do not reflect taxes that a shareholder would pay on Fund distributions or on the sale of the Fund shares.
Mid-cap stocks may be subject to a higher degree of market risk than the securities of more established companies because they tend to be more volatile and less liquid.
RETURNSFOR PERIOD ENDED 10/31/12
Average Annual Total Returns - Class N
| | | | |
One Year | | | 6.70 | % |
Since Inception | | | 0.75 | % |
Inception Date 11/02/07
The performance data quoted represents past performance. Past performance does not guarantee future results. Investment return and principal value will fluctuate so that an investor’s shares, upon redemption, may be worth more or less than their original cost. Current performance may be lower or higher than the performance data quoted. For performance data current to the most recent month-end, please visit our website at www.astonfunds.com.
The performance quoted would have been lower if fee waivers and/or expense reimbursements had not been in effect.
| | |
| |
| ASTON/Montag & Caldwell Mid Cap Growth Fund | | October 31, 2012 |
| |
| Schedule of Investments | | |
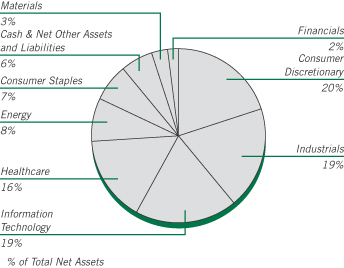
| | | | | | | | |
Shares | | | | | Market
Value | |
| |
| | COMMON STOCKS – 94.32% | | | | |
| | |
| | | | Consumer Discretionary – 20.45% | | | | |
| | 1,590 | | | Bed Bath & Beyond * | | $ | 91,711 | |
| | 1,890 | | | BorgWarner * | | | 124,400 | |
| | 1,970 | | | Dick’s Sporting Goods | | | 98,500 | |
| | 8,210 | | | LKQ * | | | 171,507 | |
| | 1,780 | | | O’Reilly Automotive * | | | 152,510 | |
| | 1,460 | | | Omnicom Group | | | 69,949 | |
| | 850 | | | Panera Bread, Class A * | | | 143,344 | |
| | 1,500 | | | PVH | | | 164,985 | |
| | 840 | | | Ralph Lauren | | | 129,100 | |
| | 1,170 | | | Ross Stores | | | 71,312 | |
| | 1,040 | | | Starwood Hotels & Resorts Worldwide | | | 53,924 | |
| | 960 | | | Tractor Supply | | | 92,390 | |
| | 2,030 | | | Warnaco Group (The) * | | | 143,277 | |
| | | | | | | | |
| | | | | | | 1,506,909 | |
| | | | | | | | |
| | |
| | | | Consumer Staples – 7.01% | | | | |
| | 2,710 | | | Church & Dwight | | | 137,560 | |
| | 1,730 | | | Fresh Market * | | | 98,108 | |
| | 2,240 | | | McCormick & Co (Non Voting Shares) | | | 138,029 | |
| | 2,320 | | | Mead Johnson Nutrition | | | 143,051 | |
| | | | | | | | |
| | | | | | | 516,748 | |
| | | | | | | | |
| | |
| | | | Energy – 8.03% | | | | |
| | 3,360 | | | Cameron International * | | | 170,150 | |
| | 950 | | | Core Laboratories (Netherlands) | | | 98,477 | |
| | 3,600 | | | Oceaneering International | | | 188,388 | |
| | 2,500 | | | SM Energy | | | 134,800 | |
| | | | | | | | |
| | | | | | | 591,815 | |
| | | | | | | | |
| | |
| | | | Financials – 2.38% | | | | |
| | 1,340 | | | IntercontinentalExchange * | | | 175,540 | |
| | | | | | | | |
| | | | | | | | |
Shares | | | | | Market
Value | |
| | |
| | | | Healthcare – 15.62% | | | | |
| | 4,320 | | | Dentsply International | | $ | 159,149 | |
| | 1,240 | | | Edwards Lifesciences * | | | 107,669 | |
| | 1,670 | | | Henry Schein * | | | 123,213 | |
| | 1,260 | | | IDEXX Laboratories * | | | 121,212 | |
| | 1,200 | | | Perrigo | | | 138,012 | |
| | 5,210 | | | ResMed | | | 208,087 | |
| | 2,310 | | | Varian Medical Systems * | | | 154,216 | |
| | 1,700 | | | Waters * | | | 139,077 | |
| | | | | | | | |
| | | | | | | 1,150,635 | |
| | | | | | | | |
| | |
| | | | Industrials – 19.14% | | | | |
| | 4,755 | | | AMETEK | | | 169,040 | |
| | 3,010 | | | Donaldson | | | 97,133 | |
| | 2,540 | | | Expeditors International Washington | | | 92,989 | |
| | 1,860 | | | Fastenal | | | 83,142 | |
| | 1,610 | | | J.B. Hunt Transport Services | | | 94,507 | |
| | 2,280 | | | Jacobs Engineering Group * | | | 87,985 | |
| | 2,050 | | | Joy Global | | | 128,023 | |
| | 6,540 | | | Robert Half International | | | 175,861 | |
| | 960 | | | Roper Industries | | | 104,803 | |
| | 2,040 | | | Stericycle * | | | 193,310 | |
| | 3,600 | | | Verisk Analytics, Class A * | | | 183,600 | |
| | | | | | | | |
| | | | | | | 1,410,393 | |
| | | | | | | | |
| | |
| | | | Information Technology – 18.85% | | | | |
| | 5,310 | | | Altera | | | 161,849 | |
| | 2,800 | | | Amphenol, Class A | | | 168,364 | |
| | 2,640 | | | ANSYS * | | | 187,123 | |
| | 1,900 | | | F5 Networks * | | | 156,712 | |
| | 1,300 | | | FactSet Research Systems | | | 117,715 | |
| | 2,520 | | | Fiserv * | | | 188,849 | |
| | 10,490 | | | Juniper Networks * | | | 173,819 | |
| | 8,760 | | | NVIDIA * | | | 104,857 | |
| | 1,900 | | | Teradata * | | | 129,789 | |
| | | | | | | | |
| | | | | | | 1,389,077 | |
| | | | | | | | |
| | |
| | | | Materials – 2.84% | | | | |
| | 3,010 | | | Ecolab | | | 209,496 | |
| | | | | | | | |
| | |
| | | | Total Common Stocks
(Cost $6,077,628) | | | 6,950,613 | |
| | | | | | | | |
| |
| | INVESTMENT COMPANY – 5.97% | | | | |
| | |
| | 439,467 | | | BlackRock Liquidity Funds TempCash Portfolio | | | 439,467 | |
| | | | | | | | |
| | |
| | | | Total Investment Company
(Cost $439,467) | | | 439,467 | |
| | | | | | | | |
| Total Investments – 100.29%
(Cost $6,517,095)** | | | 7,390,080 | |
| | | | | | | | |
| Net Other Assets and Liabilities – (0.29)% | | | (21,130 | ) |
| | | | | | | | |
| Net Assets – 100.00% | | $ | 7,368,950 | |
| | | | | | | | |
See accompanying Notes to Financial Statements.
| | |
| |
| ASTON/Montag & Caldwell Mid Cap Growth Fund | | October 31, 2012 |
| |
| Schedule of Investments – continued | | |
| * | | Non-income producing security. |
| ** | | Aggregate cost for Federal income tax purposes is $6,541,125. |
| | | | |
Gross unrealized appreciation | | $ | 1,079,040 | |
Gross unrealized depreciation | | | (230,085 | ) |
| | | | |
Net unrealized appreciation | | $ | 848,955 | |
| | | | |
See accompanying Notes to Financial Statements.
ASTON/Veredus Small Cap Growth Fund
| | |
| |
| Portfolio Manager Commentary (unaudited) | | October 31, 2012 |
(formerly, the ASTON/Veredus
Aggressive Growth Fund) | | B. Anthony Weber; Charles F. Mercer, Jr., CFA; Michael E. Johnson, CFA; John R. Prys, CFA |
| | & Katherine A. Kuntz, CFA |
| Q. | What were the most significant market factors affecting Fund performance and returns relative to the benchmark during the past 12 months? |
| A. | The great majority of the Fund’s underperformance occurred during the final two months of 2011, as the results have just barely lagged the benchmark in calendar 2012 through the end of October. October 2011 was a big up month for the market overall as it rallied strongly in reaction to the Federal Reserve’s announcement of its second round of quantitative easing (QE2) and the market digested those gains by gravitating toward defensive themes and richer dividends during the final two months of that year. We had a couple of holdings with earnings problems that quarter as well. |
| Q. | What were the best performing holdings for the Fund during the period? |
| A. | The portfolio’s position in Consumer Staples, led by Schiff Nutrition and Hain Celestial, posted strong gains. Schiff agreed to be acquired by Bayer at a significant premium in October, while increased earnings estimates boosted Hain. The best performer for the year, however, was the newly public Mexican restaurant concept Chuy’s, which we think is an outstanding concept with great economics and a lot of runway for growth going forward. |
| Q. | What were the weakest performing holdings? |
| A. | The majority of the weakness in the portfolio came from the Information Technology sector, as themes were very hard to come by unless a company was part of the supply chain for surging Apple |
| | products. Service Source International, a business services software company that provides cloud based solutions to better manage revenue flow, came under fire as revenue recognition was questioned. From our experience, once that starts to happen with a software company it’s time to exit. Digital media company Rovi announced third quarter results that missed estimates and gave weak guidance. This had been a huge stock for the portfolio in the past, but the company missed a tremendous opportunity in the world of digital movie downloads. We exited the stock as it rallied back from the near-termsell-off, though still at a significant loss for the period. Tangoe, another software firm, suffered as short sellers questioned the firm’s organic growth after a recent acquisition. |
| Q. | How was the Fund positioned as of October 31, 2012? |
| A. | The Fund’s biggest exposure is in consumer-related areas as we think gasoline prices will continue to decline, freeing up income for consumption elsewhere. The housing market also appears to be recovering, boosting consumer confidence. Our emphasis is on specialty retailers and homebuilders, with the portfolio’s Materials position also leveraged to the homebuilding sector. A stake in Healthcare is highly specialized until we see what the effects of the Affordable Care Act are truly going to be. Technology, as one might expect given the lack of any real themes, is at the lowest levels for the Fund in a long time. With the “fiscal cliff” looming, 2013 could be a difficult year. We will be watching Washington closely and would not rule out getting defensive in the not too distant future. |
Growth of a Hypothetical $10,000 Investment—Class N
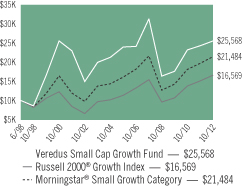
All dividends and capital gains are reinvested. Indexes are unmanaged and do not take into account fees, expenses or other costs.
Returns shown in the chart and table do not reflect taxes that a shareholder would pay on Fund distributions or on the sale of the Fund shares.
Small company stocks may be subject to a higher degree of market risk than the securities of more established companies because they tend to be more volatile and less liquid.
RETURNSFOR PERIOD ENDED 10/31/12
Average Annual Total Returns - Class N
| | | | |
One Year | | | 5.42 | % |
Five Year | | | -3.98 | % |
Ten Year | | | 5.51 | % |
Since Inception | | | 6.77 | % |
Inception Date 06/30/98
Average Annual Total Returns - Class I
| | | | |
One Year | | | 5.62 | % |
Five Year | | | -3.74 | % |
Ten Year | | | 5.79 | % |
Since Inception | | | 1.09 | % |
Inception Date 10/05/01
The performance data quoted represents past performance. Past performance does not guarantee future results. Investment return and principal value will fluctuate so that an investor’s shares, upon redemption, may be worth more or less than their original cost. Current performance may be lower or higher than the performance data quoted. For performance data current to the most recent month-end, please visit our website at www.astonfunds.com.
The performance quoted would have been lower if fee waivers and/or expense reimbursements had not been in effect.
The total expense ratio for the Class N and Class I Shares is 1.66% and 1.41% respectively, as disclosed in the prospectus dated March 1, 2012. Please refer to the Financial Highlights section in this report for more 2012 fiscal year-end related information.
| | |
| |
| ASTON/Veredus Small Cap Growth Fund | | October 31, 2012 |
| |
| Schedule of Investments | | |
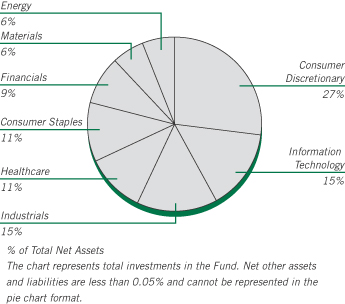
| | | | | | | | |
Shares | | | | | Market
Value | |
|
| | COMMON STOCKS – 100.15% | |
| | |
| | | | Consumer Discretionary – 27.10% | | | | |
| | 6,700 | | | Blue Nile * | | $ | 253,058 | |
| | 26,200 | | | Chico’s FAS | | | 487,320 | |
| | 19,220 | | | Chuy’s Holdings * | | | 469,544 | |
| | 8,625 | | | Five Below * | | | 285,832 | |
| | 26,394 | | | Francesca’s Holdings * | | | 779,414 | |
| | 7,858 | | | Gentherm * | | | 94,452 | |
| | 13,900 | | | Jack in the Box * | | | 361,539 | |
| | 18,500 | | | MDC Holdings | | | 707,440 | |
| | 16,150 | | | Pier 1 Imports | | | 329,460 | |
| | 10,175 | | | Ryland Group | | | 344,627 | |
| | 8,990 | | | Select Comfort * | | | 250,192 | |
| | 10,425 | | | Shutterfly * | | | 315,461 | |
| | 34,275 | | | Sinclair Broadcast Group, Class A | | | 431,865 | |
| | 8,750 | | | Stage Stores | | | 214,375 | |
| | 9,500 | | | Sturm Ruger | | | 448,685 | |
| | 11,350 | | | Tilly’s, Class A * | | | 183,189 | |
| | 4,340 | | | Ulta Salon Cosmetics & Fragrance | | | 400,235 | |
| | 3,350 | | | Vitamin Shoppe * | | | 191,754 | |
| | | | | | | | |
| | | | | | | 6,548,442 | |
| | | | | | | | |
| | |
| | | | Consumer Staples – 10.64% | | | | |
| | 25,400 | | | B&G Foods | | | 768,858 | |
| | 13,510 | | | Elizabeth Arden * | | | 637,402 | |
| | 4,907 | | | Hain Celestial Group * | | | 283,625 | |
| | 20,825 | | | Natural Grocers by Vitamin Cottage * | | | 422,331 | |
| | 13,550 | | | Schiff Nutrition International * | | | 458,532 | |
| | | | | | | | |
| | | | | | | 2,570,748 | |
| | | | | | | | |
| | |
| | | | Energy – 5.90% | | | | |
| | 3,900 | | | Approach Resources * | | | 96,057 | |
| | 9,475 | | | Carrizo Oil & Gas * | | | 254,120 | |
| | | | | | | | |
Shares | | | | | Market
Value | |
| | |
| | | | Energy (continued) | | | | |
| | 12,900 | | | Comstock Resources * | | $ | 220,848 | |
| | 4,125 | | | Oasis Petroleum * | | | 121,151 | |
| | 35,250 | | | PetroQuest Energy * | | | 215,025 | |
| | 25,200 | | | Rex Energy * | | | 333,648 | |
| | 7,400 | | | Western Refining | | | 184,038 | |
| | | | | | | | |
| | | | | | | 1,424,887 | |
| | | | | | | | |
| | |
| | | | Financials – 8.89% | | | | |
| | 34,300 | | | Apollo Global Management LLC, Class A | | | 521,017 | |
| | 11,575 | | | Banner | | | 335,559 | |
| | 8,950 | | | Community Bank System | | | 246,931 | |
| | 3,300 | | | Jones Lang Lasalle | | | 256,542 | |
| | 1,775 | | | Navigators Group * | | | 94,217 | |
| | 21,200 | | | Old National Bancorp | | | 260,124 | |
| | 7,500 | | | Piper Jaffray * | | | 201,375 | |
| | 6,325 | | | Wintrust Financial | | | 233,709 | |
| | | | | | | | |
| | | | | | | 2,149,474 | |
| | | | | | | | |
| | |
| | | | Healthcare – 10.85% | | | | |
| | 14,335 | | | Acadia Healthcare * | | | 294,871 | |
| | 19,600 | | | Alkermes * | | | 363,188 | |
| | 13,150 | | | Cynosure, Class A * | | | 346,371 | |
| | 22,521 | | | Exact Sciences * | | | 213,049 | |
| | 32,200 | | | Health Management Associates, Class A * | | | 235,060 | |
| | 12,967 | | | Healthstream * | | | 331,177 | |
| | 10,225 | | | PerkinElmer | | | 316,259 | |
| | 4,750 | | | Sirona Dental Systems * | | | 271,985 | |
| | 17,200 | | | Spectranetics * | | | 250,432 | |
| | | | | | | | |
| | | | | | | 2,622,392 | |
| | | | | | | | |
| | |
| | | | Industrials – 14.71% | | | | |
| | 12,875 | | | AAON | | | 270,118 | |
| | 11,750 | | | AZZ | | | 463,420 | |
| | 96,825 | | | Builders FirstSource * | | | 533,506 | |
| | 5,300 | | | Celadon Group | | | 90,630 | |
| | 5,300 | | | Marten Transport | | | 98,103 | |
| | 20,665 | | | MasTec * | | | 466,202 | |
| | 11,978 | | | Mistras Group * | | | 264,594 | |
| | 1,567 | | | Portfolio Recovery Associates * | | | 163,987 | |
| | 13,170 | | | Powell Industries * | | | 523,903 | |
| | 6,175 | | | Team * | | | 202,417 | |
| | 13,650 | | | Trex * | | | 476,931 | |
| | | | | | | | |
| | | | | | | 3,553,811 | |
| | | | | | | | |
| | |
| | | | Information Technology – 15.52% | | | | |
| | 8,085 | | | ACI Worldwide * | | | 316,124 | |
| | 11,800 | | | Allot Communications (Israel) * | | | 275,648 | |
| | 14,900 | | | Anaren * | | | 268,647 | |
| | 27,650 | | | CalAmp * | | | 245,532 | |
| | 73,600 | | | Callidus Software * | | | 341,504 | |
| | 8,600 | | | Cardtronics * | | | 244,326 | |
| | 10,250 | | | Cirrus Logic * | | | 417,790 | |
| | 4,850 | | | Ellie Mae * | | | 121,250 | |
| | 8,987 | | | Heartland Payment Systems | | | 234,381 | |
| | 15,827 | | | LivePerson * | | | 248,326 | |
| | 38,225 | | | Move * | | | 316,885 | |
See accompanying Notes to Financial Statements.
| | |
| |
| ASTON/Veredus Small Cap Growth Fund | | October 31, 2012 |
| |
| Schedule of Investments – continued | | |
| | | | | | | | |
Shares | | | | | Market
Value | |
| | |
| | | | Information Technology (continued) | | | | |
| | 77,772 | | | Silicon Image * | | $ | 342,197 | |
| | 21,050 | | | Tangoe * | | | 271,966 | |
| | 14,985 | | | TeleNav * | | | 105,494 | |
| | | | | | | | |
| | | | | | | 3,750,070 | |
| | | | | | | | |
| | |
| | | | Materials – 6.54% | | | | |
| | 5,150 | | | American Vanguard | | | 184,010 | |
| | 7,525 | | | Eagle Materials | | | 398,599 | |
| | 39,000 | | | Louisiana-Pacific * | | | 615,810 | |
| | 8,875 | | | Texas Industries * | | | 382,779 | |
| | | | | | | | |
| | | | | | | 1,581,198 | |
| | | | | | | | |
| | |
| | | | Total Common Stocks
(Cost $22,235,255) | | | 24,201,022 | |
| | | | | | | | |
|
| | WARRANTS – 0.00% | |
| | |
| | | | Energy – 0.00% | | | | |
| | 4,906 | | | Magnum Hunter Resources, Expiration 10/14/13 | | | 147 | |
| | | | | | | | |
| | |
| | | | Total Warrants
(Cost $—) | | | 147 | |
| | | | | | | | |
|
| | INVESTMENT COMPANY – 1.87% | |
| | |
| | 451,077 | | | BlackRock Liquidity Funds
TempCash Portfolio | | | 451,077 | |
| | | | | | | | |
| | |
| | | | Total Investment Company
(Cost $451,077) | | | 451,077 | |
| | | | | | | | |
| Total Investments – 102.02%
(Cost $22,691,645)** | | | 24,652,246 | |
| | | | | | | | |
| Net Other Assets and Liabilities – (2.02)% | | | (488,941 | ) |
| | | | | | | | |
| Net Assets – 100.00% | | $ | 24,163,305 | |
| | | | | | | | |
| * | | Non-income producing security. |
| ** | | Aggregate cost for Federal income tax purposes is $22,736,235. |
| | | | |
Gross unrealized appreciation | | $ | 2,983,366 | |
Gross unrealized depreciation | | | (1,067,355 | ) |
| | | | |
Net unrealized appreciation | | $ | 1,916,011 | |
| | | | |
See accompanying Notes to Financial Statements.
ASTON Small Cap Growth Fund
| | |
| |
| Portfolio Manager Commentary (unaudited) | | October 31, 2012 |
(formerly, the ASTON/Crosswind
Small Cap Growth Fund) | | Andrew Morey, CFA |
| Q. | What were the most significant market factors affecting Fund performance and returns relative to the index during the past 12 months? |
| A. | The most significant factors affecting the Fund’s performance relative to the index over the past year were the reemergence of growth-oriented stocks, and the breadth the market has exhibited in willingness to pay for revenue growth, margin expansion, and positive earnings. Coming off a challenging period in the prior fiscal year, we were confident in our overall positioning last fall—that the volatility of the prior period would create a pool of companies demonstrating the unrecognized growth characteristics we seek. That condition has occurred as several of our stocks surprised and revised earnings upward during the past year. Consequently, the Fund’s relative performance has turned sharply positive over the past year. |
| Q. | What were the best performing holdings for the Fund during the period? |
| A. | At the sector level, Information Technology was a strong area for the Fund, especially among our software holdings, where merger and acquisition activity helped boost returns. Kenexa was a top-performing stock and the most significant positive contributor to the Fund’s return comparison for the year. Kenexa is a leading developer of human resources software with a deep client base, and the key driver for the stock was its acquisition—at a significant premium—by IBM in August of this year. Ariba, acquired in the spring, was another key contributor to the Fund’s return for the year. In Healthcare, shares of acute care and rehabilitation hospital companies, where we have been well represented, helped Fund performance for the year, and Tenet HealthCare and HealthSouth have been two of our larger positions in this group. Lastly in Industrials, we have held a meaningful position in GEO Group, a private prison operator whose shares have risen steadily on key state contract extensions and positive earnings releases. |
| Q. | What were the weakest performing holdings? |
| A. | Among individual holdings, VeriFone Systems and DFC Global Corp. were among our weakest names for the period and key detractors from relative performance. VeriFone designs and sells electronic payment systems and devices, and the stock was weak through late spring on concerns about the company’s Eurozone exposure; the company also had a patent infringement case against it around the same time. DFC Global is a consumer finance company serving under-banked individuals and small businesses, and the stock was weak late in the period due partly to stricter collection requirements in the UK. Financials, where we have limited exposure overall, was the Fund’s weakest sector for the year. |
| Q. | How was the Fund positioned as of October 31, 2012? |
| A. | With a backdrop of ongoing macro uncertainties, both in the U.S. and globally, the investment team continues to identify companies that are growing revenues and expanding margins, and exhibiting sustainability in these growth characteristics based upon their competitive positions. On a stock by stock basis, the Fund is well positioned beginning the new fiscal year, and we remain optimistic for the medium term and longer. |
In recent months, we have built up our positions in Healthcare and Information Technology, increasing our overweights to these sectors even as we have reduced positions in several of the stocks highlighted above. The Fund’s largest holdings in Healthcare now include Volcano Corporation and Health Management Associates, with both names among the five largest holdings in the Fund at the end of October. We are also overweight in the Energy and Industrials sectors. The Fund’s largest underweights are in the Materials and Consumer sectors, including an almost-zero weight in Consumer Staples at the end of the period.
Growth of a Hypothetical $10,000 Investment—Class N

All dividends and capital gains are reinvested. Indexes are unmanaged and do not take into account fees, expenses or other costs.
Returns shown in the chart and table do not reflect taxes that a shareholder would pay on Fund distributions or on the sale of the Fund shares.
Small-cap stocks may be subject to a higher degree of market risk than the securities of more established companies because they tend to be more volatile and less liquid.
RETURNSFOR PERIOD ENDED 10/31/12
Average Annual Total Returns - Class N
| | | | |
One Year | | | 14.77 | % |
Since Inception | | | 6.88 | % |
Inception Date 11/03/10
Average Annual Total Returns - Class I
| | | | |
One Year | | | 14.95 | % |
Since Inception | | | -5.40 | % |
Inception Date 06/01/11
The performance data quoted represents past performance. Past performance does not guarantee future results. Investment return and principal value will fluctuate so that an investor’s shares, upon redemption, may be worth more or less than their original cost. Current performance may be lower or higher than the performance data quoted. For performance data current to the most recent month-end, please visit our website at www.astonfunds.com.
The performance quoted would have been lower if fee waivers and/or expense reimbursements had not been in effect.
| | |
| |
| ASTON Small Cap Growth Fund | | October 31, 2012 |
| |
| Schedule of Investments | | |
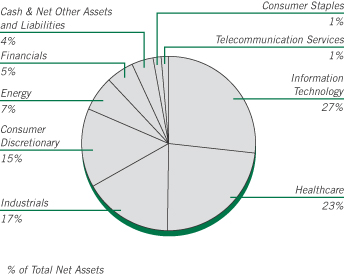
| | | | | | | | |
Shares | | | | | Market
Value | |
|
| | COMMON STOCKS – 95.97% | |
| | |
| | | | Consumer Discretionary – 14.63% | | | | |
| | 2,060 | | | Arctic Cat * | | $ | 74,716 | |
| | 6,733 | | | Black Diamond * | | | 63,964 | |
| | 2,949 | | | Brunswick | | | 69,567 | |
| | 938 | | | Cabela’s * | | | 42,032 | |
| | 4,029 | | | Cablevision Systems, Class A | | | 70,185 | |
| | 1,999 | | | Domino’s Pizza | | | 81,199 | |
| | 563 | | | Genesco * | | | 32,260 | |
| | 1,319 | | | GNC Holdings, Class A | | | 51,006 | |
| | 42,440 | | | Office Depot * | | | 105,251 | |
| | 10,885 | | | OfficeMax | | | 80,005 | |
| | 629 | | | Papa John’s International * | | | 33,538 | |
| | 1,232 | | | Select Comfort * | | | 34,287 | |
| | 6,614 | | | Shutterfly * | | | 200,140 | |
| | | | | | | | |
| | | | | | | 938,150 | |
| | | | | | | | |
| | |
| | | | Consumer Staples – 1.47% | | | | |
| | 1,630 | | | Hain Celestial Group * | | | 94,214 | |
| | | | | | | | |
| | |
| | | | Energy – 6.54% | | | | |
| | 811 | | | Berry Petroleum, Class A | | | 31,232 | |
| | 1,565 | | | Carrizo Oil & Gas * | | | 41,973 | |
| | 4,431 | | | Gulfport Energy * | | | 147,021 | |
| | 25,303 | | | Magnum Hunter Resources * | | | 96,658 | |
| | 2,350 | | | Oasis Petroleum * | | | 69,020 | |
| | 726 | | | Rosetta Resources * | | | 33,425 | |
| | | | | | | | |
| | | | | | | 419,329 | |
| | | | | | | | |
| | |
| | | | Financials – 5.14% | | | | |
| | 556 | | | Credit Acceptance * | | | 45,397 | |
| | 4,054 | | | DFC Global * | | | 68,310 | |
| | 4,727 | | | DuPont Fabros Technology, REIT | | | 101,441 | |
| | 1,716 | | | Highwoods Properties, REIT | | | 55,341 | |
| | | | | | | | |
Shares | | | | | Market
Value | |
| | |
| | | | Financials (continued) | | | | |
| | 1,874 | | | Stifel Financial * | | $ | 59,406 | |
| | | | | | | | |
| | | | | | | 329,895 | |
| | | | | | | | |
| | |
| | | | Healthcare – 23.43% | | | | |
| | 2,326 | | | Allscripts Healthcare Solutions * | | | 30,052 | |
| | 1,311 | | | Cubist Pharmaceuticals * | | | 56,242 | |
| | 38,664 | | | Health Management Associates, Class A * | | | 282,247 | |
| | 1,390 | | | HeartWare International * | | | 116,732 | |
| | 1,024 | | | HMS Holdings * | | | 23,644 | |
| | 5,092 | | | Incyte * | | | 81,268 | |
| | 863 | | | Jazz Pharmaceuticals PLC (Ireland) * | | | 46,369 | |
| | 1,716 | | | Masimo * | | | 37,701 | |
| | 14,062 | | | Merge Healthcare * | | | 47,951 | |
| | 2,195 | | | Puma Biotechnology * | | | 45,217 | |
| | 6,389 | | | Tenet Healthcare * | | | 150,780 | |
| | 6,548 | | | Threshold Pharmaceuticals * | | | 26,912 | |
| | 5,210 | | | Tornier NV (Netherlands) * | | | 89,091 | |
| | 15,759 | | | Vanguard Health Systems * | | | 152,547 | |
| | 6,536 | | | Volcano * | | | 187,060 | |
| | 2,706 | | | WellCare Health Plans * | | | 128,806 | |
| | | | | | | | |
| | | | | | | 1,502,619 | |
| | | | | | | | |
| | |
| | | | Industrials – 16.62% | | | | |
| | 4,686 | | | Encore Capital Group * | | | 135,894 | |
| | 2,257 | | | Genesee & Wyoming, Class A * | | | 163,565 | |
| | 9,463 | | | Geo Group | | | 262,314 | |
| | 2,802 | | | Hexcel * | | | 71,619 | |
| | 7,959 | | | Kelly Services, Class A | | | 105,775 | |
| | 4,437 | | | Triumph Group | | | 290,269 | |
| | 1,082 | | | Woodward | | | 36,247 | |
| | | | | | | | |
| | | | | | | 1,065,683 | |
| | | | | | | | |
| | |
| | | | Information Technology – 26.77% | | | | |
| | 947 | | | Aruba Networks * | | | 17,207 | |
| | 10,816 | | | AVG Technologies (Netherlands) * | | | 113,460 | |
| | 3,741 | | | Brightcove * | | | 47,211 | |
| | 5,243 | | | DealerTrack Holdings * | | | 143,291 | |
| | 1,836 | | | EPAM Systems * | | | 33,011 | |
| | 26,726 | | | Internap Network Services * | | | 183,073 | |
| | 5,645 | | | Kenexa * | | | 259,444 | |
| | 3,565 | | | Liquidity Services * | | | 146,985 | |
| | 8,317 | | | Microsemi * | | | 159,686 | |
| | 3,136 | | | Parametric Technology * | | | 63,285 | |
| | 2,338 | | | QLIK Technologies * | | | 43,043 | |
| | 4,039 | | | Semtech * | | | 100,854 | |
| | 4,280 | | | Skyworks Solutions * | | | 100,152 | |
| | 1,258 | | | Sourcefire * | | | 53,830 | |
| | 2,943 | | | Synchronoss Technologies * | | | 60,302 | |
| | 1,235 | | | TIBCO Software * | | | 31,134 | |
| | 5,427 | | | VeriFone Systems * | | | 160,856 | |
| | | | | | | | |
| | | | | | | 1,716,824 | |
| | | | | | | | |
| | |
| | | | Telecommunication Services – 1.37% | | | | |
| | 3,464 | | | tw telecom * | | | 88,228 | |
| | | | | | | | |
| | |
| | | | Total Common Stocks
(Cost $5,792,521) | | | 6,154,942 | |
| | | | | | | | |
See accompanying Notes to Financial Statements.
| | |
| |
| ASTON Small Cap Growth Fund | | October 31, 2012 |
| |
| Schedule of Investments – continued | | |
| | | | | | | | |
Shares | | | | | Market
Value | |
|
| | WARRANTS – 0.00% | |
| | |
| | | | Energy – 0.00% | | | | |
| | 1,091 | | | Magnum Hunter Resources,
Expiration 10/14/13 | | $ | 33 | |
| | | | | | | | |
| | |
| | | | Total Warrants
(Cost $—) | | | 33 | |
| | | | | | | | |
|
| | INVESTMENT COMPANY – 7.24% | |
| | |
| | 464,198 | | | BlackRock Liquidity Funds
TempCash Portfolio | | | 464,198 | |
| | | | | | | | |
| | |
| | | | Total Investment Company
(Cost $464,198) | | | 464,198 | |
| | | | | | | | |
| Total Investments – 103.21%
(Cost $6,256,719)** | | | 6,619,173 | |
| | | | | | | | |
| Net Other Assets and Liabilities – (3.21)% | | | (205,943 | ) |
| | | | | | | | |
| Net Assets – 100.00% | | $ | 6,413,230 | |
| | | | | | | | |
| * | | Non-income producing security. |
| ** | | Aggregate cost for Federal income tax purposes is $6,285,060. |
| | | | |
Gross unrealized appreciation | | $ | 590,449 | |
Gross unrealized depreciation | | | (256,336 | ) |
| | | | |
Net unrealized appreciation | | $ | 334,113 | |
| | | | |
| REIT | | Real Estate Investment Trust |
See accompanying Notes to Financial Statements.
ASTON/Silvercrest Small Cap Fund
| | |
| |
| Portfolio Manager Commentary (unaudited) | | October 31, 2012 |
| | Roger W. Vogel, CFA |
| Q. | What were the most significant market factors affecting Fund performance and returns relative to the benchmark during the past 12 months? |
| A. | By far, the most significant issue impacting Fund performance since inception in December 2011 relative to the Russell 2000 Value benchmark was our underweight and underperformance in the Financials sector. Our average weighting of 21% was far below the benchmark’s 37%, and given that the sector was the second best performing sector in the benchmark with a 19% advance for the period, this underexposure cost us roughly 100 bps of relative performance. Additionally, our stock holdings selection within the sector, gained just 9% vs. a 19% gain within the index sector. We struggled in two sub-sectors, Banks and REITs. Our banks gained just 2% versus 14% for the benchmark’s banks, and while our REITs came closer to the benchmark’s REITs, gaining 16% vs. 21%, our sharp underweighting at 5% vs. 13% hurt us. We have made some changes to our exposures in the Financials sector recently, and hope that we can improve our relative performance there. |
| Q. | What were the best performing holdings for the Fund during the period? |
| A. | Our biggest contributors to return since inception were AFC Enterprises, which posted our largest percentage gain at 69%, Horace Mann (+42%), ACI Worldwide (+33%), West Pharmaceutical Services (+45%), and Analogic Corp. |
| | (+33%). All tended to report earnings above expectations. |
| Q. | What were the weakest performing holdings? |
| A. | Our worst contributors to return included Swift Energy, our biggest decliner at (-46%), Schnitzer Steel Industries (-34%), Tennant Co. (-14%), Astec Industries (-16%), and MKS Instruments (-19%). All had disappointing fundamental results. We have eliminated our holding of Schnitzer Steel. |
| Q. | How was the Fund positioned as of October 31, 2012? |
| A. | We believe the Fund is very well positioned entering the new fiscal year. As we leave the September quarter earnings cycle, uncertainties abound. Company pre-announcements have been decidedly skewed negatively, as it appears business has slowed globally in late summer. Companies and investors alike appear somewhat skittish in front of an uncertain and likely partisan discourse surrounding the U.S. “fiscal cliff” and its impact on taxes. We continue to believe there is tremendous intrinsic value in our companies, and remain hopeful that in a more positive merger and acquisition environment we will catch our share. Our companies continue to appear undervalued, with generally strong cash flows and solid balance sheets that should permit them to take advantage of any opportunities in a modest global GDP growth environment. |
Growth of a Hypothetical
$10,000 Investment—Class N
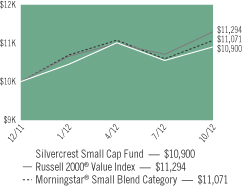
All dividends and capital gains are reinvested. Indexes are unmanaged and do not take into account fees, expenses or other costs.
Returns shown in the chart and table do not reflect taxes that a shareholder would pay on Fund distributions or on the sale of the Fund shares.
Small-cap stocks may be subject to a higher degree of market risk than the securities of more established companies because they tend to be more volatile and less liquid.
RETURNSFOR PERIOD ENDED 10/31/12
Total Return - Class N
| | | | |
Cumulative Since Inception | | | 9.00 | % |
Inception Date 12/27/11
Total Return - Class I
| | | | |
Cumulative Since Inception | | | 9.30 | % |
Inception Date 12/27/11
The performance data quoted represents past performance. Past performance does not guarantee future results. Investment return and principal value will fluctuate so that an investor’s shares, upon redemption, may be worth more or less than their original cost. Current performance may be lower or higher than the performance data quoted. For performance data current to the most recent month-end, please visit our website at www.astonfunds.com.
The performance quoted would have been lower if fee waivers and/or expense reimbursements had not been in effect.
| | |
| |
| ASTON/Silvercrest Small Cap Fund | | October 31, 2012 |
| |
| Schedule of Investments | | |
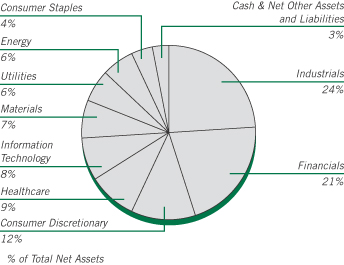
| | | | | | | | |
Shares | | | | | Market
Value | |
|
| | COMMON STOCKS – 97.53% | |
| | |
| | | | Consumer Discretionary – 11.70% | | | | |
| | 5,432 | | | AFC Enterprises * | | $ | 137,538 | |
| | 3,310 | | | Bob Evans Farms | | | 126,012 | |
| | 2,577 | | | Core-Mark Holding | | | 123,361 | |
| | 3,935 | | | Drew Industries * | | | 124,622 | |
| | 5,240 | | | La-Z-Boy * | | | 84,993 | |
| | 2,090 | | | Lithia Motors, Class A | | | 71,478 | |
| | | | | | | | |
| | | | | | | 668,004 | |
| | | | | | | | |
| | |
| | | | Consumer Staples – 4.35% | | | | |
| | 2,114 | | | J & J Snack Foods | | | 121,069 | |
| | 1,754 | | | Lancaster Colony | | | 127,656 | |
| | | | | | | | |
| | | | | | | 248,725 | |
| | | | | | | | |
| | |
| | | | Energy – 5.96% | | | | |
| | 4,810 | | | Forum Energy Technologies * | | | 107,311 | |
| | 3,299 | | | Rosetta Resources * | | | 151,886 | |
| | 4,865 | | | Swift Energy * | | | 81,294 | |
| | | | | | | | |
| | | | | | | 340,491 | |
| | | | | | | | |
| | |
| | | | Financials – 20.87% | | | | |
| | 7,240 | | | Duff & Phelps, Class A | | | 89,993 | |
| | 2,948 | | | EastGroup Properties, REIT | | | 153,473 | |
| | 8,518 | | | FirstMerit | | | 118,060 | |
| | 7,364 | | | Horace Mann Educators | | | 141,462 | |
| | 2,509 | | | Iberiabank | | | 124,923 | |
| | 5,123 | | | Independent Bank/Rockland MA | | | 151,180 | |
| | 2,254 | | | Mid-America Apartment Communities, REIT | | | 145,856 | |
| | 2,762 | | | Prosperity Bancshares | | | 115,617 | |
| | 5,548 | | | Protective Life | | | 151,460 | |
| | | | | | | | |
| | | | | | | 1,192,024 | |
| | | | | | | | |
| | |
| | | | Healthcare – 8.56% | | | | |
| | 1,487 | | | Analogic | | | 109,532 | |
| | 1,914 | | | ICU Medical * | | | 113,558 | |
| | | | | | | | |
Shares | | | | | Market
Value | |
| | |
| | | | Healthcare (continued) | | | | |
| | 2,120 | | | Integra LifeSciences Holdings * | | $ | 81,090 | |
| | 3,293 | | | Invacare | | | 44,950 | |
| | 2,593 | | | West Pharmaceutical Services | | | 139,685 | |
| | | | | | | | |
| | | | | | | 488,815 | |
| | | | | | | | |
| | |
| | | | Industrials – 24.55% | | | | |
| | 5,355 | | | Altra Holdings | | | 96,497 | |
| | 3,383 | | | Applied Industrial Technologies | | | 137,316 | |
| | 3,008 | | | Astec Industries * | | | 86,630 | |
| | 3,100 | | | Beacon Roofing Supply * | | | 100,254 | |
| | 2,113 | | | Cubic | | | 103,114 | |
| | 4,326 | | | EMCOR Group | | | 139,124 | |
| | 4,077 | | | Hexcel * | | | 104,208 | |
| | 2,559 | | | Mine Safety Appliances | | | 98,777 | |
| | 2,460 | | | TAL International Group | | | 83,984 | |
| | 1,740 | | | Teledyne Technologies * | | | 111,412 | |
| | 2,556 | | | Tennant | | | 95,646 | |
| | 6,529 | | | US Ecology | | | 154,933 | |
| | 2,240 | | | Watts Water Technologies, Class A | | | 90,115 | |
| | | | | | | | |
| | | | | | | 1,402,010 | |
| | | | | | | | |
| | |
| | | | Information Technology – 7.84% | | | | |
| | 2,229 | | | ACI Worldwide * | | | 87,154 | |
| | 2,297 | | | FEI | | | 126,450 | |
| | 2,005 | | | Littelfuse | | | 107,468 | |
| | 3,125 | | | MKS Instruments | | | 73,844 | |
| | 1,817 | | | Scansource * | | | 53,147 | |
| | | | | | | | |
| | | | | | | 448,063 | |
| | | | | | | | |
| | |
| | | | Materials – 7.21% | | | | |
| | 2,762 | | | HB Fuller | | | 83,965 | |
| | 2,307 | | | Innophos Holdings | | | 109,929 | |
| | 7,923 | | | PH Glatfelter | | | 141,109 | |
| | 2,109 | | | Sensient Technologies | | | 76,725 | |
| | | | | | | | |
| | | | | | | 411,728 | |
| | | | | | | | |
| | |
| | | | Utilities – 6.49% | | | | |
| | 2,492 | | | MGE Energy | | | 131,179 | |
| | 4,679 | | | Portland General Electric | | | 128,205 | |
| | 3,073 | | | UIL Holdings | | | 111,150 | |
| | | | | | | | |
| | | | | | | 370,534 | |
| | | | | | | | |
| | |
| | | | Total Common Stocks
(Cost $5,459,213) | | | 5,570,394 | |
| | | | | | | | |
|
| | INVESTMENT COMPANY – 2.75% | |
| | |
| | 156,940 | | | BlackRock Liquidity Funds
TempCash Portfolio | | | 156,940 | |
| | | | | | | | |
| | |
| | | | Total Investment Company
(Cost $156,940) | | | 156,940 | |
| | | | | | | | |
| Total Investments – 100.28%
(Cost $5,616,153)** | | | 5,727,334 | |
| | | | | | | | |
| Net Other Assets and Liabilities – (0.28)% | | | (15,767 | ) |
| | | | | | | | |
| Net Assets – 100.00% | | $ | 5,711,567 | |
| | | | | | | | |
See accompanying Notes to Financial Statements.
| | |
| |
| ASTON/Silvercrest Small Cap Fund | | October 31, 2012 |
| |
| Schedule of Investments – continued | | |
| * | | Non-income producing security. |
| ** | | Aggregate cost for Federal income tax purposes is $5,624,018. |
| | | | |
Gross unrealized appreciation | | $ | 312,380 | |
Gross unrealized depreciation | | | (209,064 | ) |
| | | | |
Net unrealized appreciation | | $ | 103,316 | |
| | | | |
| REIT | | Real Estate Investment Trust |
See accompanying Notes to Financial Statements.
ASTON/TAMRO Small Cap Fund
| | |
| |
| Portfolio Manager Commentary (unaudited) | | October 31, 2012 |
Philip D. Tasho, CFA & Timothy A. Holland, CFA
| Q. | What were the most significant market factors affecting Fund performance and returns relative to the benchmark during the past 12 months? |
| A. | While the U.S. and global economies saw a slowdown in growth, aggressively easy monetary policy provided ample liquidity that helped fuel double digit returns across all market capitalizations of the U.S. equity markets. October proved to be a challenging month for the Fund in terms of relative performance, causing the Fund to trail the benchmark, the Russell 2000 Index, for the fiscal year ending October 31, 2012. Overall, stock selection benefited the Fund with strength in the Healthcare and Materials sectors offset somewhat by weakness in the Industrials, Energy and Financials sectors. Sector allocation detracted from performance largely due to an overweight in Energy and under weights in the Financials and Materials sectors. |
| Q. | What were the best performing holdings for the Fund during the period? |
| A. | The three holdings that contributed the most to performance were Westlake Chemical, AMERIGROUP and Advisory Board. Westlake Chemical benefited from lower natural gas, feedstock prices and accelerating revenues and earnings. AMERIGROUP agreed to be acquired by Wellpoint at a +40% premium to its market price. Advisory Board saw strong demand from hospitals for its best-practices consulting services and software solutions. |
| Q. | What were the weakest performing holdings? |
| A. | Revenue and earnings growth deceleration impacted the three holdings that detracted the most from Fund performance. A softening in telecomm capital spending led to a slowdown for Acme Packet’s Session Border Control products |
| | that manage the quality of data as it crosses from one network to another. Commodity pricing pressured Precision Drilling, a provider of oil and natural gas drilling and related services via its fleet of rigs stationed throughout North America. Aero Vironmentis a technology solutions provider focused on small unmanned aerial systems and electric transportation solutions. Long term, we remain confident in the business strategies and maintain the positions. |
| Q. | How was the Fund positioned as of October 31, 2012? |
| A. | The Fund’s investment process focuses on individual, bottom-up stock selection to identify companies that we believe are best able to execute given their specific competitive advantage. Our approach to portfolio management is opportunistic and broadly diversified, with sector weights determined by where we see opportunities at the stock level. As of October 31, 2012, Financials, Consumer Discretionary and Industrials were the largest sectors in the Fund. Among our investment categories, Leaders and Innovators, which tend to be higher quality companies with leading market share and tenured management teams, comprised 72% of the portfolio. Laggards, or companies undergoing restructuring, made up 28%. |
We believe the domestic economy will continue to grow at a slower-than-normal pace, led by an ongoing rebound in consumer spending and housing. The change in housing prices has turned positive in most regions of the country and consumer sentiment is the highest yet in the recovery. Once the election is over, there should be more clarity concerning the direction of U.S. economic policy. Any interim volatility may provide opportunities to add to current positions or initiate new ones at attractive valuations.
Growth of a Hypothetical
$10,000 Investment—Class N
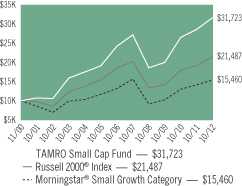
All dividends and capital gains are reinvested. Indexes are unmanaged and do not take into account fees, expenses or other costs.
Returns shown in the chart and table do not reflect taxes that a shareholder would pay on Fund distributions or on the sale of the Fund shares.
Small-cap stocks may be subject to a higher degree of market risk than the securities of more established companies because they tend to be more volatile and less liquid.
RETURNSFOR PERIOD ENDED 10/31/12
Average Annual Total Returns - Class N
| | | | |
One Year | | | 10.70 | % |
Five Year | | | 3.12 | % |
Ten Year | | | 11.58 | % |
Since Inception | | | 10.17 | % |
Inception Date 11/30/00
Average Annual Total Returns - Class I
| | | | |
One Year | | | 10.98 | % |
Five Year | | | 3.38 | % |
Since Inception | | | 7.22 | % |
Inception Date 01/04/05
The performance data quoted represents past performance. Past performance does not guarantee future results. Investment return and principal value will fluctuate so that an investor’s shares, upon redemption, may be worth more or less than their original cost. Current performance may be lower or higher than the performance data quoted. For performance data current to the most recent month-end, please visit our website at www.astonfunds.com.
The total expense ratio for the Class N and Class I Shares is 1.30% and 1.05% respectively, as disclosed in the prospectus dated March 1, 2012. Please refer to the Financial Highlights section in this report for more 2012 fiscal year-end related information.
| | |
| |
| ASTON/TAMRO Small Cap Fund | | October 31, 2012 |
| |
| Schedule of Investments | | |
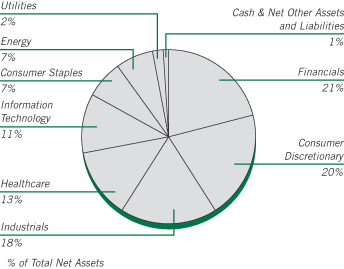
| | | | | | | | |
Shares | | | | | Market
Value | |
| |
| | COMMON STOCKS – 99.27% | | | | |
| | |
| | | | Consumer Discretionary – 20.26% | | | | |
| | 389,296 | | | BJ’s Restaurants * | | $ | 12,866,232 | |
| | 1,389,716 | | | Chico’s FAS | | | 25,848,717 | |
| | 334,858 | | | Coinstar * | | | 15,718,235 | |
| | 1,798,726 | | | EW Scripps (The), Class A * (a) | | | 19,084,483 | |
| | 1,165,373 | | | Grand Canyon Education * | | | 25,358,516 | |
| | 517,166 | | | Harman International Industries | | | 21,684,770 | |
| | 664,694 | | | MDC Holdings | | | 25,417,899 | |
| | 452,609 | | | Monro Muffler Brake | | | 15,352,497 | |
| | 412,403 | | | Red Robin Gourmet Burgers * | | | 13,774,260 | |
| | 452,031 | | | Tempur-Pedic International * | | | 11,951,700 | |
| | 1,261,228 | | | Texas Roadhouse | | | 20,532,792 | |
| | | | | | | | |
| | | | | | | 207,590,101 | |
| | | | | | | | |
| | |
| | | | Consumer Staples – 7.32% | | | | |
| | 999,776 | | | Cott (Canada) * | | | 7,648,286 | |
| | 392,315 | | | Fresh Market * | | | 22,248,184 | |
| | 405,803 | | | Tootsie Roll Industries | | | 10,814,650 | |
| | 219,983 | | | TreeHouse Foods * | | | 11,780,090 | |
| | 422,883 | | | United Natural Foods * | | | 22,514,291 | |
| | | | | | | | |
| | | | | | | 75,005,501 | |
| | | | | | | | |
| | |
| | | | Energy – 6.77% | | | | |
| | 961,865 | | | Cloud Peak Energy * | | | 20,295,352 | |
| | 1,415,772 | | | Comstock Resources * | | | 24,238,017 | |
| | 325,009 | | | Contango Oil & Gas * | | | 15,977,442 | |
| | 1,236,120 | | | Precision Drilling (Canada) * | | | 8,900,064 | |
| | | | | | | | |
| | | | | | | 69,410,875 | |
| | | | | | | | |
| | |
| | | | Financials – 21.15% | | | | |
| | 761,443 | | | Bank of the Ozarks | | | 24,929,643 | |
| | 1,540,647 | | | Glacier Bancorp | | | 22,339,382 | |
| | | | | | | | |
Shares | | | | | Market
Value | |
| | |
| | | | Financials (continued) | | | | |
| | 370,033 | | | Greenhill | | $ | 17,657,975 | |
| | 471,510 | | | Iberiabank | | | 23,476,483 | |
| | 891,047 | | | LaSalle Hotel Properties, REIT | | | 21,331,665 | |
| | 215,290 | | | Portfolio Recovery Associates * | | | 22,530,099 | |
| | 1,121,596 | | | Redwood Trust, REIT | | | 17,485,682 | |
| | 706,014 | | | Stifel Financial * | | | 22,380,644 | |
| | 404,571 | | | UMB Financial | | | 18,015,547 | |
| | 799,544 | | | Waddell & Reed Financial, Class A | | | 26,648,802 | |
| | | | | | | | |
| | | | | | | 216,795,922 | |
| | | | | | | | |
| | |
| | | | Healthcare – 12.47% | | | | |
| | 229,456 | | | Affymax * | | | 5,229,302 | |
| | 349,561 | | | Analogic | | | 25,748,663 | |
| | 278,832 | | | Athenahealth * | | | 17,926,109 | |
| | 1,311,931 | | | DexCom * | | | 17,186,296 | |
| | 2,608,702 | | | Health Management Associates, Class A * | | | 19,043,525 | |
| | 876,282 | | | HMS Holdings * | | | 20,233,351 | |
| | 330,489 | | | Teleflex | | | 22,456,728 | |
| | | | | | | | |
| | | | | | | 127,823,974 | |
| | | | | | | | |
| | |
| | | | Industrials – 17.93% | | | | |
| | 572,058 | | | Advisory Board * | | | 27,172,755 | |
| | 752,988 | | | Aerovironment * | | | 16,558,206 | |
| | 266,833 | | | Chicago Bridge & Iron
(Netherlands) | | | 10,019,579 | |
| | 710,358 | | | Colfax * | | | 24,429,212 | |
| | 501,185 | | | Corporate Executive Board | | | 22,533,278 | |
| | 299,655 | | | Franklin Electric | | | 17,362,010 | |
| | 318,924 | | | Morningstar | | | 20,085,834 | |
| | 741,244 | | | Titan International | | | 15,551,299 | |
| | 116,167 | | | Wabtec | | | 9,514,077 | |
| | 549,026 | | | Zillow, Class A * | | | 20,511,611 | |
| | | | | | | | |
| | | | | | | 183,737,861 | |
| | | | | | | | |
| | |
| | | | Information Technology – 11.38% | | | | |
| | 1,194,682 | | | Acme Packet * | | | 19,760,040 | |
| | 997,350 | | | Aruba Networks * | | | 18,121,849 | |
| | 324,687 | | | CommVault Systems * | | | 20,283,197 | |
| | 1,396,547 | | | Ixia * | | | 19,565,623 | |
| | 578,907 | | | Netgear * | | | 20,556,988 | |
| | 312,447 | | | Power Integrations | | | 9,242,182 | |
| | 686,607 | | | Websense * | | | 9,076,945 | |
| | | | | | | | |
| | | | | | | 116,606,824 | |
| | | | | | | | |
| | |
| | | | Utilities – 1.99% | | | | |
| | 437,365 | | | Northwest Natural Gas | | | 20,350,593 | |
| | | | | | | | |
| | |
| | | | Total Common Stocks
(Cost $827,375,266) | | | 1,017,321,651 | |
| | | | | | | | |
See accompanying Notes to Financial Statements.
| | |
| |
| ASTON/TAMRO Small Cap Fund | | October 31, 2012 |
| |
| Schedule of Investments – continued | | |
| | | | | | | | |
Shares | | | | | Market
Value | |
| |
| | INVESTMENT COMPANY – 1.72% | | | | |
| | |
| | 17,606,619 | | | BlackRock Liquidity Funds TempCash Portfolio | | $ | 17,606,619 | |
| | | | | | | | |
| | |
| | | | Total Investment Company
(Cost $17,606,619) | | | 17,606,619 | |
| | | | | | | | |
| Total Investments – 100.99%
(Cost $844,981,885)** | | | 1,034,928,270 | |
| | | | | | | | |
| Net Other Assets and Liabilities – (0.99)% | | | (10,140,187 | ) |
| | | | | | | | |
| Net Assets – 100.00% | | $ | 1,024,788,083 | |
| | | | | | | | |
| * | | Non-income producing security. |
| ** | | Aggregate cost for Federal income tax purposes is $846,326,847. |
| | | | |
Gross unrealized appreciation | | $ | 233,339,898 | |
Gross unrealized depreciation | | | (44,738,475 | ) |
| | | | |
Net unrealized appreciation | | $ | 188,601,423 | |
| | | | |
| (a) | | This security has been determined by the Subadviser to be an illiquid security. At October 31, 2012, this security amounted to $19,084,483 or 1.86% of net assets. |
| REIT | | Real Estate Investment Trust |
See accompanying Notes to Financial Statements.
ASTON/River Road Select Value Fund
| | |
| |
| Portfolio Manager Commentary (unaudited) | | October 31, 2012 |
James C. Shircliff, CFA; R. Andrew Beck & J. Justin Akin
| Q. | What were the most significant market factors affecting Fund performance and returns relative to the benchmark during the past 12 months? |
| A. | The Fund’s return lagged the benchmark Russell 2500 Value. The Fund’s performance was negatively impacted by the leadership of high beta, lower quality securities in the small/mid-cap market. As that trend reversed, however, the Fund’s relative performance significantly improved. Six of 10 sectors contributed positively to relative Fund performance. The largest contribution was from the Industrials sector, which benefited from strong stock selection. The largest detractor was the Financials sector, which lagged most significantly as the result of an underweight allocation. |
| Q. | What were the best performing holdings for the Fund during the period? |
| A. | The two holdings with the largest positive contribution to relative return were Madison Square Garden Co. and GEO Group Inc. Madison Square Garden owns the New York Knicks, the New York Rangers, the MSG regional sports cable network, plus the real estate of the “World’s Most Famous Arena.” The company has begun to realize operating benefits from its $1B renovation of the Garden. Also, the management team favorably resolved a pricing dispute with Time Warner Cable, which represents approximately 30% of the MSG subscriber base. GEO Group is the second largest private prison operator in the United States. In early 2012, the company initiated a dividend and subsequently increased it twice, which |
| | resulted in an attractive yield for investors. Secondly, the company is pursuing the possibility of converting into a Real Estate Investment Trust (REIT). We believe that the IRS will grant approval, which will improve GEO’s tax efficiency and could lead to multiple expansion. |
| Q. | What were the weakest performing holdings? |
| A. | The two holdings with the largest negative contribution to the Fund’s total return were Big Lots Inc. and Harris Teeter Supermarkets Inc. Big Lots is the largest broad line close-out retailer in the United States. The company reported disappointing Q2 results that were below expectations and also lowered its earnings guidance for 2012. Same-store sales declined due to weakness in its seasonal, home, and furniture categories. The Chief Merchandising Officer resigned as a result. Harris Teeter operates an upscale grocery chain in the mid-Atlantic region of the United States. In-store traffic trends have remained positive throughout the year. However, food inflation and higher levels of discounting have put a lid on margins which has limited profit growth. |
| Q. | How was the Fund positioned as of October 31, 2012? |
| A. | We continue to position the Fund in the shares of high quality companies that we believe will perform well in a period of weak economic growth. |
Note: Beta is a measure of risk which shows a fund’s volatility relative to its benchmark index.
Growth of a Hypothetical
$10,000 Investment—Class N
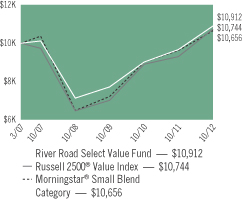
All dividends and capital gains are reinvested. Indexes are unmanaged and do not take into account fees, expenses or other costs.
Returns shown in the chart and table do not reflect taxes that a shareholder would pay on Fund distributions or on the sale of the Fund shares.
Small-cap and mid-cap stocks may be subject to a higher degree of market risk than the securities of more established companies because they tend to be more volatile and less liquid.
RETURNSFOR PERIOD ENDED 10/31/12
Average Annual Total Returns - Class N
| | | | |
One Year | | | 12.87 | % |
Five Year | | | 1.50 | % |
Since Inception | | | 1.57 | % |
Inception Date 03/29/07
Average Annual Total Returns - Class I
| | | | |
One Year | | | 13.18 | % |
Five Year | | | 1.77 | % |
Since Inception | | | 0.97 | % |
Inception Date 06/28/07
The performance data quoted represents past performance. Past performance does not guarantee future results. Investment return and principal value will fluctuate so that an investor’s shares, upon redemption, may be worth more or less than their original cost. Current performance may be lower or higher than the performance data quoted. For performance data current to the most recent month-end, please visit our website at www.astonfunds.com.
| | |
| |
| ASTON/River Road Select Value Fund | | October 31, 2012 |
| |
| Schedule of Investments | | |
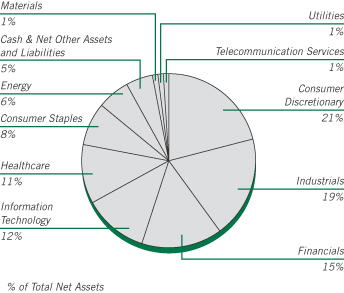
| | | | | | | | |
Shares | | | | | Market
Value | |
|
| | COMMON STOCKS – 94.98% | |
| | |
| | | | Consumer Discretionary – 20.82% | | | | |
| | 39,060 | | | Abercrombie & Fitch, Class A | | $ | 1,194,455 | |
| | 188,630 | | | Ascena Retail Group * | | | 3,734,874 | |
| | 25,980 | | | Ascent Capital Group, Class A * | | | 1,544,511 | |
| | 172,510 | | | Big Lots * | | | 5,025,216 | |
| | 86,250 | | | Bob Evans Farms | | | 3,283,537 | |
| | 75,000 | | | DreamWorks Animation SKG, Class A * | | | 1,527,750 | |
| | 101,620 | | | Fred’s, Class A | | | 1,376,951 | |
| | 97,720 | | | Iconix Brand Group * | | | 1,808,797 | |
| | 162,090 | | | Madison Square Garden, Class A * | | | 6,671,624 | |
| | 124,940 | | | Pep Boys - Manny, Moe, & Jack | | | 1,248,151 | |
| | 123,900 | | | Rent-A-Center | | | 4,129,587 | |
| | 49,200 | | | Service Corp International | | | 690,768 | |
| | 64,540 | | | True Religion Apparel | | | 1,655,451 | |
| | | | | | | | |
| | | | | | | 33,891,672 | |
| | | | | | | | |
| | |
| | | | Consumer Staples – 7.58% | | | | |
| | 36,810 | | | Constellation Brands, Class A * | | | 1,300,865 | |
| | 158,480 | | | Harris Teeter Supermarkets | | | 5,935,076 | |
| | 43,350 | | | Industrias Bachoco, SP ADR (Mexico) | | | 1,094,588 | |
| | 32,066 | | | J & J Snack Foods | | | 1,836,420 | |
| | 59,190 | | | Village Super Market, Class A | | | 2,170,497 | |
| | | | | | | | |
| | | | | | | 12,337,446 | |
| | | | | | | | |
| | |
| | | | Energy – 5.71% | | | | |
| | 38,090 | | | Cloud Peak Energy * | | | 803,699 | |
| | 75,370 | | | Endeavour International * | | | 547,186 | |
| | 38,810 | | | Energen | | | 1,810,486 | |
| | 214,509 | | | Miller Energy Resources * | | | 969,581 | |
| | 38,020 | | | Nordic American Tankers (Bermuda) | | | 319,368 | |
| | 67,230 | | | Patterson-UTI Energy | | | 1,087,781 | |
| | 112,580 | | | Resolute Energy * | | | 999,710 | |
| | 62,120 | | | Rex Energy * | | | 822,469 | |
| | | | | | | | |
Shares | | | | | Market
Value | |
| | |
| | | | Energy (continued) | | | | |
| | 147,760 | | | Tetra Technologies * | | $ | 790,516 | |
| | 139,500 | | | Vaalco Energy * | | | 1,139,715 | |
| | | | | | | | |
| | | | | | | 9,290,511 | |
| | | | | | | | |
| | |
| | | | Financials – 15.42% | | | | |
| | 8,205 | | | Alleghany * | | | 2,852,058 | |
| | 137,985 | | | Alterra Capital Holdings (Bermuda) | | | 3,370,974 | |
| | 127,760 | | | BGC Partners, Class A | | | 597,917 | |
| | 16,125 | | | Capital Southwest | | | 1,737,469 | |
| | 20,629 | | | Commerce Bancshares | | | 785,552 | |
| | 35,440 | | | FirstService (Canada) * | | | 1,022,090 | |
| | 86,810 | | | Hilltop Holdings * | | | 1,179,748 | |
| | 23,360 | | | Navigators Group * | | | 1,239,949 | |
| | 24,090 | | | Oppenheimer Holdings, Class A | | | 392,185 | |
| | 29,250 | | | PartnerRe (Bermuda) | | | 2,369,250 | |
| | 39,420 | | | SEI Investments | | | 862,510 | |
| | 43,700 | | | Tower Group | | | 787,474 | |
| | 69,110 | | | W. R. Berkley | | | 2,687,688 | |
| | 10,165 | | | White Mountains Insurance Group | | | 5,211,595 | |
| | | | | | | | |
| | | | | | | 25,096,459 | |
| | | | | | | | |
| | |
| | | | Healthcare – 10.88% | | | | |
| | 22,520 | | | Chemed | | | 1,514,470 | |
| | 79,410 | | | Ensign Group | | | 2,315,596 | |
| | 55,520 | | | Hill-Rom Holdings | | | 1,559,557 | |
| | 60,210 | | | ICU Medical * | | | 3,572,259 | |
| | 243,660 | | | Nordion (Canada) | | | 1,578,917 | |
| | 74,840 | | | Owens & Minor | | | 2,130,695 | |
| | 66,810 | | | Quality Systems | | | 1,165,835 | |
| | 108,780 | | | STERIS | | | 3,873,656 | |
| | | | | | | | |
| | | | | | | 17,710,985 | |
| | | | | | | | |
| | |
| | | | Industrials – 18.82% | | | | |
| | 72,400 | | | ABM Industries | | | 1,375,600 | |
| | 124,160 | | | Aircastle (Bermuda) | | | 1,381,901 | |
| | 71,340 | | | Brink’s | | | 1,876,955 | |
| | 25,520 | | | Cubic | | | 1,245,376 | |
| | 119,810 | | | Dolan * | | | 554,720 | |
| | 66,120 | | | Equifax | | | 3,308,645 | |
| | 59,230 | | | G & K Services, Class A | | | 1,910,168 | |
| | 257,750 | | | Geo Group | | | 7,144,830 | |
| | 62,310 | | | Heartland Express | | | 869,225 | |
| | 80,250 | | | Insperity | | | 2,095,328 | |
| | 83,150 | | | John Bean Technologies | | | 1,282,173 | |
| | 85,170 | | | Korn/Ferry International * | | | 1,140,426 | |
| | 36,930 | | | Layne Christensen * | | | 823,170 | |
| | 52,049 | | | Standard Parking * | | | 1,189,320 | |
| | 63,690 | | | Unifirst | | | 4,430,913 | |
| | | | | | | | |
| | | | | | | 30,628,750 | |
| | | | | | | | |
| | |
| | | | Information Technology – 11.82% | | | | |
| | 132,800 | | | Convergys | | | 2,232,368 | |
| | 53,650 | | | CSG Systems International * | | | 1,105,726 | |
| | 94,410 | | | Daktronics | | | 827,976 | |
| | 103,560 | | | DST Systems | | | 5,907,062 | |
| | 79,090 | | | Ingram Micro, Class A * | | | 1,202,168 | |
See accompanying Notes to Financial Statements.
| | |
| |
| ASTON/River Road Select Value Fund | | October 31, 2012 |
| |
| Schedule of Investments – continued | �� | |
| | | | | | | | |
Shares | | | | | Market
Value | |
| | |
| | | | Information Technology (continued) | | | | |
| | 43,140 | | | Ituran Location and Control (Israel) | | $ | 533,210 | |
| | 26,710 | | | j2 Global | | | 802,368 | |
| | 24,330 | | | Lexmark International, Class A | | | 517,256 | |
| | 142,840 | | | NeuStar, Class A * | | | 5,226,516 | |
| | 39,660 | | | Total System Services | | | 891,953 | |
| | | | | | | | |
| | | | | | | 19,246,603 | |
| | | | | | | | |
| | |
| | | | Materials – 1.55% | | | | |
| | 16,720 | | | Aptargroup | | | 857,402 | |
| | 60,210 | | | Kraton Performance Polymers * | | | 1,313,782 | |
| | 20,660 | | | Tredegar | | | 350,600 | |
| | | | | | | | |
| | | | | | | 2,521,784 | |
| | | | | | | | |
| | |
| | | | Telecommunication Services – 0.91% | | | | |
| | 35,610 | | | Atlantic Tele-Network | | | 1,475,678 | |
| | | | | | | | |
| | |
| | | | Utilities – 1.47% | | | | |
| | 55,420 | | | Avista | | | 1,408,776 | |
| | 30,720 | | | UGI | | | 991,949 | |
| | | | | | | | |
| | | | | | | 2,400,725 | |
| | | | | | | | |
| | |
| | | | Total Common Stocks
(Cost $133,054,206) | | | 154,600,613 | |
| | | | | | | | |
|
| | INVESTMENT COMPANY – 5.46% | |
| | |
| | 8,893,679 | | | BlackRock Liquidity Funds
TempCash Portfolio | | | 8,893,679 | |
| | | | | | | | |
| | |
| | | | Total Investment Company
(Cost $8,893,679) | | | 8,893,679 | |
| | | | | | | | |
| Total Investments – 100.44%
(Cost $141,947,885)** | | | 163,494,292 | |
| | | | | | | | |
| Net Other Assets and Liabilities – (0.44)% | | | (714,428 | ) |
| | | | | | | | |
| Net Assets – 100.00% | | $ | 162,779,864 | |
| | | | | | | | |
| * | | Non-income producing security. |
| ** | | Aggregate cost for Federal income tax purposes is $142,663,248. |
| | | | |
Gross unrealized appreciation | | $ | 27,411,399 | |
Gross unrealized depreciation | | | (6,580,355 | ) |
| | | | |
Net unrealized appreciation | | $ | 20,831,044 | |
| | | | |
| SP ADR | | Sponsored American Depositary Receipt |
See accompanying Notes to Financial Statements.
ASTON/River Road Small Cap Value Fund
| | |
| |
| Portfolio Manager Commentary (unaudited) | | October 31, 2012 |
| James C. Shircliff, CFA; R. Andrew Beck & J. Justin Akin |
| Q. | What were the most significant market factors affecting Fund performance and returns relative to the benchmark during the past 12 months? |
| A. | The Fund’s return lagged the benchmark Russell 2000 Value. The Fund’s performance was negatively impacted by the leadership of high beta, lower quality securities in the small cap market. As that trend reversed, however, the Fund’s relative performance significantly improved. Five of 10 sectors contributed positively to relative Fund performance. The largest contribution was from the Information Technology sector, which benefited from strong stock selection. The largest negative contributor was the Financials sector, which lagged most significantly as the result of an underweight allocation. |
| Q. | What were the best performing holdings for the Fund during the period? |
| A. | The two holdings with the largest positive contribution to relative return were GEO Group Inc. and Madison Square Garden Co. GEO Group is the second largest private prison operator in the United States. In early 2012, the company initiated a dividend and subsequently increased it twice, which resulted in an attractive yield for investors. Secondly, the company is pursuing the possibility of converting into a Real Estate Investment Trust (REIT). We believe that the IRS will grant approval, which will improve GEO’s tax efficiency and could lead to multiple expansion. Madison Square Garden owns the New York Knicks, the New York Rangers, the MSG regional sports cable network, plus the real estate of the |
| | “World’s Most Famous Arena.” The company has begun to realize operating benefits from its $1 billion renovation of the Garden. Also, the management team favorably resolved a pricing dispute with Time Warner Cable, which represents approximately 30% of the MSG subscriber base. |
| Q. | What were the weakest performing holdings? |
| A. | The two holdings with the largest negative contribution to the Fund’s total return were Big Lots Inc. and Harris Teeter Supermarkets Inc. Big Lots is the largest broad line close-out retailer in the United States. The company reported disappointing Q2 results that were below expectations and also lowered its earnings guidance for 2012. Same-store sales declined due to weakness in its seasonal, home, and furniture categories. The Chief Merchandising Officer resigned as a result. Harris Teeter operates an upscale grocery chain in the mid-Atlantic region of the United States. In-store traffic trends have remained positive throughout the year. However, food inflation and higher levels of discounting have put a lid on margins which has limited profit growth. |
| Q. | How was the Fund positioned as of October 31, 2012? |
| A. | We continue to position the Fund in the shares of high quality companies that we believe will perform well in a period of weak economic growth. |
Note: Beta is a measure of risk which shows a fund’s volatility relative to its benchmark index.
Growth of a Hypothetical
$10,000 Investment—Class N

All dividends and capital gains are reinvested. Indexes are unmanaged and do not take into account fees, expenses or other costs.
Returns shown in the chart and table do not reflect taxes that a shareholder would pay on Fund distributions or on the sale of the Fund shares.
Small-cap stocks may be subject to a higher degree of market risk than the securities of more established companies because they tend to be more volatile and less liquid.
Value investing involves the risk that a Fund’s investing in companies believed to be undervalued will not appreciate as anticipated.
RETURNSFOR PERIOD ENDED 10/31/12
Average Annual Total Returns - Class N
| | | | |
One Year | | | 11.15 | % |
Five Year | | | -0.23 | % |
Since Inception | | | 5.07 | % |
Inception Date 06/28/05
Average Annual Total Returns - Class I
| | | | |
One Year | | | 11.46 | % |
Five Year | | | 0.01 | % |
Since Inception | | | 0.67 | % |
Inception Date 12/13/06
The performance data quoted represents past performance. Past performance does not guarantee future results. Investment return and principal value will fluctuate so that an investor’s shares, upon redemption, may be worth more or less than their original cost. Current performance may be lower or higher than the performance data quoted. For performance data current to the most recent month-end, please visit our website at www.astonfunds.com.
| | |
| |
| ASTON/River Road Small Cap Value Fund | | October 31, 2012 |
| |
| Schedule of Investments | | |
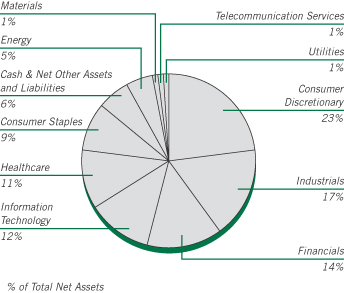
| | | | | | | | |
Shares | | | | | Market
Value | |
|
| | COMMON STOCKS – 94.22% | |
| | |
| | | | Consumer Discretionary – 23.21% | | | | |
| | 63,480 | | | Abercrombie & Fitch, Class A | | $ | 1,941,218 | |
| | 333,428 | | | Ascena Retail Group * | | | 6,601,874 | |
| | 45,811 | | | Ascent Capital Group, Class A * | | | 2,723,464 | |
| | 305,570 | | | Big Lots * | | | 8,901,254 | |
| | 153,680 | | | Bob Evans Farms | | | 5,850,598 | |
| | 132,380 | | | DreamWorks Animation SKG, Class A * | | | 2,696,581 | |
| | 176,798 | | | Fred’s, Class A | | | 2,395,613 | |
| | 173,160 | | | Iconix Brand Group * | | | 3,205,192 | |
| | 422,521 | | | Mac-Gray (a) | | | 5,492,773 | |
| | 285,920 | | | Madison Square Garden, Class A * | | | 11,768,467 | |
| | 161,359 | | | Monarch Casino & Resort * (a) | | | 1,471,594 | |
| | 179,740 | | | Motorcar Parts of America * | | | 844,778 | |
| | 220,420 | | | Pep Boys - Manny, Moe, & Jack | | | 2,201,996 | |
| | 221,927 | | | Rent-A-Center | | | 7,396,827 | |
| | 52,722 | | | Service Corp International | | | 740,217 | |
| | 113,480 | | | True Religion Apparel | | | 2,910,762 | |
| | | | | | | | |
| | | | | | | 67,143,208 | |
| | | | | | | | |
| | |
| | | | Consumer Staples – 9.02% | | | | |
| | 283,989 | | | Harris Teeter Supermarkets | | | 10,635,388 | |
| | 133,480 | | | Industrias Bachoco, SP ADR (Mexico) | | | 3,370,370 | |
| | 91,320 | | | Ingles Markets, Class A | | | 1,479,384 | |
| | 54,804 | | | J & J Snack Foods | | | 3,138,625 | |
| | 196,617 | | | Omega Protein * | | | 1,279,977 | |
| | 168,796 | | | Village Super Market, Class A | | | 6,189,749 | |
| | | | | | | | |
| | | | | | | 26,093,493 | |
| | | | | | | | |
| | |
| | | | Energy – 5.21% | | | | |
| | 68,000 | | | Cloud Peak Energy * | | | 1,434,800 | |
| | 112,843 | | | Endeavour International * | | | 819,240 | |
| | 558,393 | | | Evolution Petroleum * | | | 4,578,823 | |
| | | | | | | | |
Shares | | | | | Market
Value | |
| | |
| | | | Energy (continued) | | | | |
| | 532,508 | | | Miller Energy Resources * | | $ | 2,406,936 | |
| | 198,200 | | | Resolute Energy * | | | 1,760,016 | |
| | 85,570 | | | Rex Energy * | | | 1,132,947 | |
| | 171,507 | | | Tetra Technologies * | | | 917,562 | |
| | 245,985 | | | Vaalco Energy * | | | 2,009,697 | |
| | | | | | | | |
| | | | | | | 15,060,021 | |
| | | | | | | | |
| | |
| | | | Financials – 13.50% | | | | |
| | 244,111 | | | Alterra Capital Holdings (Bermuda) | | | 5,963,632 | |
| | 228,340 | | | BGC Partners, Class A | | | 1,068,631 | |
| | 28,667 | | | Capital Southwest | | | 3,088,869 | |
| | 229,952 | | | Dime Community Bancshares | | | 3,334,304 | |
| | 22,465 | | | First Citizens BancShares, Class A | | | 3,790,969 | |
| | 61,580 | | | FirstService (Canada) * | | | 1,775,967 | |
| | 158,170 | | | Hilltop Holdings * | | | 2,149,530 | |
| | 148,639 | | | Medallion Financial | | | 1,859,474 | |
| | 44,927 | | | Navigators Group * | | | 2,384,725 | |
| | 33,539 | | | Oppenheimer Holdings, Class A | | | 546,015 | |
| | 286,440 | | | SWS Group * | | | 1,629,844 | |
| | 35,728 | | | Tompkins Financial | | | 1,446,269 | |
| | 60,915 | | | Tower Group | | | 1,097,688 | |
| | 17,368 | | | White Mountains Insurance Group | | | 8,904,574 | |
| | | | | | | | |
| | | | | | | 39,040,491 | |
| | | | | | | | |
| | |
| | | | Healthcare – 10.84% | | | | |
| | 39,435 | | | Chemed | | | 2,652,004 | |
| | 144,863 | | | Ensign Group | | | 4,224,205 | |
| | 87,920 | | | Hill-Rom Holdings | | | 2,469,673 | |
| | 107,073 | | | ICU Medical * | | | 6,352,641 | |
| | 432,018 | | | Nordion (Canada) | | | 2,799,477 | |
| | 132,530 | | | Owens & Minor | | | 3,773,129 | |
| | 114,250 | | | Quality Systems | | | 1,993,662 | |
| | 198,960 | | | STERIS | | | 7,084,966 | |
| | | | | | | | |
| | | | | | | 31,349,757 | |
| | | | | | | | |
| | |
| | | | Industrials – 17.11% | | | | |
| | 124,170 | | | ABM Industries | | | 2,359,230 | |
| | 216,920 | | | Aircastle (Bermuda) | | | 2,414,320 | |
| | 125,950 | | | Brink’s | | | 3,313,744 | |
| | 44,026 | | | Cubic | | | 2,148,469 | |
| | 219,234 | | | Dolan * | | | 1,015,053 | |
| | 109,432 | | | G & K Services, Class A | | | 3,529,182 | |
| | 450,760 | | | Geo Group | | | 12,495,067 | |
| | 109,580 | | | Heartland Express | | | 1,528,641 | |
| | 140,989 | | | Insperity | | | 3,681,223 | |
| | 150,540 | | | John Bean Technologies | | | 2,321,327 | |
| | 154,650 | | | Korn/Ferry International * | | | 2,070,763 | |
| | 65,533 | | | Layne Christensen * | | | 1,460,730 | |
| | 152,459 | | | Standard Parking * | | | 3,483,688 | |
| | 110,073 | | | Unifirst | | | 7,657,779 | |
| | | | | | | | |
| | | | | | | 49,479,216 | |
| | | | | | | | |
| | |
| | | | Information Technology – 12.29% | | | | |
| | 32,461 | | | Computer Services | | | 886,185 | |
| | 239,860 | | | Convergys | | | 4,032,047 | |
| | 95,590 | | | CSG Systems International * | | | 1,970,110 | |
See accompanying Notes to Financial Statements.
| | |
| |
| ASTON/River Road Small Cap Value Fund | | October 31, 2012 |
| |
| Schedule of Investments – continued | | |
| | | | | | | | |
Shares | | | | | Market
Value | |
| | |
| | | | Information Technology (continued) | | | | |
| | 171,010 | | | Daktronics | | $ | 1,499,758 | |
| | 183,466 | | | DST Systems | | | 10,464,901 | |
| | 178,973 | | | Electro Rent | | | 2,813,455 | |
| | 93,973 | | | Ingram Micro, Class A * | | | 1,428,390 | |
| | 89,570 | | | Ituran Location and Control (Israel) | | | 1,107,085 | |
| | 39,860 | | | j2 Global | | | 1,197,394 | |
| | 42,660 | | | Lexmark International, Class A | | | 906,952 | |
| | 252,930 | | | NeuStar, Class A * | | | 9,254,709 | |
| | | | | | | | |
| | | | | | | 35,560,986 | |
| | | | | | | | |
| | |
| | | | Materials – 1.35% | | | | |
| | 18,773 | | | Aptargroup | | | 962,679 | |
| | 106,030 | | | Kraton Performance Polymers * | | | 2,313,575 | |
| | 36,521 | | | Tredegar | | | 619,761 | |
| | | | | | | | |
| | | | | | | 3,896,015 | |
| | | | | | | | |
| | |
| | | | Telecommunication Services – 0.91% | | | | |
| | 63,360 | | | Atlantic Tele-Network | | | 2,625,638 | |
| | | | | | | | |
| | |
| | | | Utilities – 0.78% | | | | |
| | 89,030 | | | Avista | | | 2,263,143 | |
| | | | | | | | |
| | |
| | | | Total Common Stocks
(Cost $204,872,610) | | | 272,511,968 | |
| | | | | | | | |
|
| | INVESTMENT COMPANY – 5.82% | |
| | |
| | 16,823,092 | | | BlackRock Liquidity Funds
TempFund Portfolio | | | 16,823,092 | |
| | | | | | | | |
| | |
| | | | Total Investment Company
(Cost $16,823,092) | | | 16,823,092 | |
| | | | | | | | |
| Total Investments – 100.04%
(Cost $221,695,702)** | | | 289,335,060 | |
| | | | | | | | |
| Net Other Assets and Liabilities – (0.04)% | | | (105,872 | ) |
| | | | | | | | |
| Net Assets – 100.00% | | $ | 289,229,188 | |
| | | | | | | | |
| * | | Non-income producing security. |
| ** | | Aggregate cost for Federal income tax purposes is $223,616,957. |
| | | | |
Gross unrealized appreciation | | $ | 73,808,558 | |
Gross unrealized depreciation | | | (8,090,455 | ) |
| | | | |
Net unrealized appreciation | | $ | 65,718,103 | |
| | | | |
| (a) | | These securities have been determined by the Subadviser to be illiquid securities. At October 31, 2012, these securities amounted to $6,964,367 or 2.41 % of net assets. |
| SP ADR | | Sponsored American Depositary Receipt |
See accompanying Notes to Financial Statements.
ASTON/River Road Independent Value Fund
| | |
| |
| Portfolio Manager Commentary (unaudited) | | October 31, 2012 |
| | Eric Cinnamond, CFA |
| Q. | What were the most significant market factors affecting Fund performance and returns relative to the benchmark during the past 12 months? |
| A. | Class N Shares of the Fund returned 7.41% during the past twelve months versus 14.47% for the Russell 2000 Value benchmark Index. The Fund’s high cash levels, which averaged 51%, were the driver of the underperformance during the period. Cash remained at above average levels throughout the last twelve months as the majority of the stocks on our possible buy list traded over our calculated valuations. On average, we did not believe we were being appropriately compensated relative to risk assumed during the year and opted to remain flexible until prices become more advantageous. |
| Q. | What were the best performing holdings for the Fund during the period? |
| A. | Core-Mark Holding Inc. and CSG Systems International Inc. were the largest positive contributors during the period. Core-Mark is the number two market leading convenience store distributor in North America with distribution to 28,000 convenience stores. The company’s results improved over the last several quarters due to increased end market demand and market share gains as it expanded its distribution customer base. CSG Systems is a market-leading provider of billing and customer relationship software for the satellite and cable industry. The firm’s operating results, cash flow generation, and balance sheet all strengthened throughout the period due to stabilizing demand trends and improved performance from a recent acquisition. |
| Q. | What were the weakest performing holdings? |
| A. | Bill Barrett Corp. and ManTech International Corp. were the largest negative contributors in the period. Bill Barrett is an oil and gas exploration and production company focused in the Rockies region that has suffered as natural gas prices declined throughout the first half of the year. ManTech is a leading provider of information technology services to the U.S. military and federal government agencies. The firm experienced weak bookings in 2012 caused by uncertainty around federal government spending. |
| Q. | How was the Fund positioned as of October 31, 2012? |
| A. | The Fund remained defensively positioned throughout the year as the rising small cap market provided few opportunities to purchase stocks on our buy list that we believe would provide us with adequate future rates of return. Cash levels remain above average and we continue to actively limit the operating or financial risk we take in the Fund. Early in the period, we added several Energy names that fell below our valuation as the sector sold off sharply due to falling oil and gas prices. This increased the operating risk of the Fund somewhat, but as of October 31, 2012 these positions have been significantly reduced as many approached valuation. We continue to be steadfast in our commitment to only taking risk when we are adequately compensated, and thus, believe our current defensive positioning is appropriate. We also remain prepared to take advantage of increased opportunities should volatility return to the small cap market. |
Growth of a Hypothetical $10,000 Investment—Class N
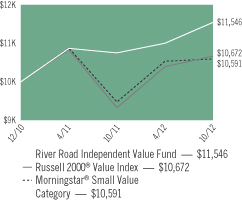
All dividends and capital gains are reinvested. Indexes are unmanaged and do not take into account fees, expenses or other costs.
Returns shown in the chart and table do not reflect taxes that a shareholder would pay on Fund distributions or on the sale of the Fund shares.
Value investing involves the risk that a Fund’s investing in companies believed to be undervalued will not appreciate as anticipated.
RETURNSFOR PERIOD ENDED 10/31/12
Average Annual Total Returns - Class N
| | | | |
One Year | | | 7.41 | % |
Since Inception | | | 8.15 | % |
Inception Date 12/31/10
Average Annual Total Returns - Class I
| | | | |
One Year | | | 7.68 | % |
Since Inception | | | 4.26 | % |
The performance data quoted represents past performance. Past performance does not guarantee future results. Investment return and principal value will fluctuate so that an investor’s shares, upon redemption, may be worth more or less than their original cost. Current performance may be lower or higher than the performance data quoted. For performance data current to the most recent month-end, please visit our website at www.astonfunds.com.
The performance quoted would have been lower if fee waivers and/or expense reimbursements had not been in effect.
| | |
| |
| ASTON/River Road Independent Value Fund | | October 31, 2012 |
| |
| Schedule of Investments | | |
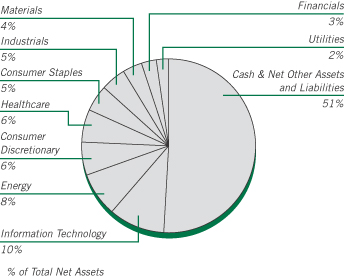
| | | | | | | | |
Shares | | | | | Market
Value | |
| |
| | COMMON STOCKS – 49.10% | | | | |
| | |
| | | | Consumer Discretionary – 6.14% | | | | |
| | 477,212 | | | Aaron’s * | | $ | 14,712,445 | |
| | 556,603 | | | American Greetings, Class A | | | 9,556,873 | |
| | 302,498 | | | Big Lots * | | | 8,811,767 | |
| | 43,625 | | | Core-Mark Holding | | | 2,088,329 | |
| | 302,449 | | | Valassis Communications * | | | 7,869,723 | |
| | | | | | | | |
| | | | | | | 43,039,137 | |
| | | | | | | | |
| | |
| | | | Consumer Staples – 4.89% | | | | |
| | 1,121,884 | | | Cott (Canada) * | | | 8,582,413 | |
| | 559,219 | | | Harris Teeter Supermarkets | | | 20,942,752 | |
| | 162,433 | | | Oil-Dri Corporation of America | | | 3,638,499 | |
| | 25,948 | | | Weis Markets | | | 1,068,020 | |
| | | | | | | | |
| | | | | | | 34,231,684 | |
| | | | | | | | |
| | |
| | | | Energy – 8.23% | | | | |
| | 263,359 | | | Bill Barrett * | | | 6,033,555 | |
| | 183,499 | | | Contango Oil & Gas * | | | 9,020,811 | |
| | 490,043 | | | Patterson-UTI Energy | | | 7,928,896 | |
| | 271,362 | | | QEP Resources | | | 7,869,498 | |
| | 301,190 | | | Tidewater | | | 14,309,537 | |
| | 310,013 | | | Unit * | | | 12,509,025 | |
| | | | | | | | |
| | | | | | | 57,671,322 | |
| | | | | | | | |
| | |
| | | | Financials – 2.80% | | | | |
| | 173,592 | | | Baldwin & Lyons, Class B | | | 4,226,965 | |
| | 211,175 | | | Brown & Brown | | | 5,395,521 | |
| | 259,937 | | | Potlatch, REIT | | | 10,002,376 | |
| | | | | | | | |
| | | | | | | 19,624,862 | |
| | | | | | | | |
| | |
| | | | Healthcare – 6.11% | | | | |
| | 30,163 | | | Bio-Rad Laboratories, Class A * | | | 3,057,020 | |
| | 303,804 | | | Covance * | | | 14,798,293 | |
| | | | | | | | |
Shares | | | | | Market
Value | |
| | |
| | | | Healthcare – (continued) | | | | |
| | 875,545 | | | Owens & Minor | | $ | 24,926,766 | |
| | | | | | | | |
| | | | | | | 42,782,079 | |
| | | | | | | | |
| | |
| | | | Industrials – 4.65% | | | | |
| | 122,838 | | | Alamo Group | | | 4,115,073 | |
| | 381,549 | | | Orbital Sciences * | | | 5,112,757 | |
| | 1,348,318 | | | Sykes Enterprises * | | | 18,364,091 | |
| | 71,613 | | | Unifirst | | | 4,982,116 | |
| | | | | | | | |
| | | | | | | 32,574,037 | |
| | | | | | | | |
| | |
| | | | Information Technology – 10.41% | | | | |
| | 425,031 | | | Benchmark Electronics * | | | 6,298,959 | |
| | 736,995 | | | CSG Systems International * | | | 15,189,467 | |
| | 1,180,634 | | | EPIQ Systems | | | 14,415,541 | |
| | 950,446 | | | FLIR Systems | | | 18,467,166 | |
| | 290,715 | | | Mantech International, Class A | | | 6,677,724 | |
| | 313,956 | | | Supertex * (a) | | | 5,999,699 | |
| | 263,079 | | | Total System Services | | | 5,916,647 | |
| | | | | | | | |
| | | | | | | 72,965,203 | |
| | | | | | | | |
| | |
| | | | Materials – 3.61% | | | | |
| | 1,150,828 | | | Pan American Silver (Canada) | | | 25,318,216 | |
| | | | | | | | |
| | |
| | | | Utilities – 2.26% | | | | |
| | 251,628 | | | Artesian Resources, Class A (a) | | | 5,789,960 | |
| | 138,998 | | | Avista | | | 3,533,329 | |
| | 352,084 | | | California Water Service Group | | | 6,485,387 | |
| | | | | | | | |
| | | | | | | 15,808,676 | |
| | | | | | | | |
| | |
| | | | Total Common Stocks
(Cost $333,734,578) | | | 344,015,216 | |
| | | | | | | | |
| Total Investments – 49.10%
(Cost $333,734,578)** | | | 344,015,216 | |
| | | | | | | | |
| Net Other Assets and Liabilities – 50.90% | | | 356,634,247 | |
| | | | | | | | |
| Net Assets – 100.00% | | $ | 700,649,463 | |
| | | | | | | | |
| * | | Non-income producing security. |
| ** | | Aggregate cost for Federal income tax purposes is $341,568,242. |
| | | | |
Gross unrealized appreciation | | $ | 23,160,321 | |
Gross unrealized depreciation | | | (20,713,347 | ) |
| | | | |
Net unrealized appreciation | | $ | 2,446,974 | |
| | | | |
| (a) | | These securities have been determined by the Subadviser to be illiquid securities. At October 31, 2012, these securities amounted to $11,789,659 or 1.68% of net assets. |
| REIT | | Real Estate Investment Trust |
See accompanying Notes to Financial Statements.
ASTON/DoubleLine Core Plus Fixed Income Fund
| | |
| |
| Portfolio Manager Commentary (unaudited) | | October 31, 2012 |
Jeffrey E. Gundlach; Philip A. Barach; Bonnie Baha, CFA & Luz M. Padilla
| Q. | What were the most significant market factors affecting Fund performance and returns relative to the benchmark during the past 12 months? |
| A. | The Fund outperformed significantly over the past twelve months ending October 31, 2012. This outperformance was driven by both the sector allocation among the varying sectors of the fixed income market as well as security selection within each of the respective sectors. For the year, both the Agency mortgage-backed securities (“MBS”) and U.S. Government sectors were the worst performing sectors of the Barclays Aggregate Index. The Fund was underweight the U.S. Government sector throughout the twelve month period which helped relative performance. Also, the Fund had a slight underweight to Agency MBS versus the benchmark, but when considering the Fund’s allocation of Agency pass through securities the underweight becomes much more significant. The Fund’s allocation to the overall MBS market, including non-Agency residentials, was more than the benchmark and considering these securities outperformed, performance benefitted. The Fund held a market-weighting in U.S. Corporate securities which performed in line with the benchmark over the period. The Fund also held overweights in Commercial MBS along with an allocation to U.S. dollar denominated Emerging Markets outside the benchmark. These two sectors outperformed the broad U.S. fixed income market and thus further enhanced returns. |
| Q. | What were the best performing holdings for the Fund during the period? |
| A. | Over the period, the non-benchmark holdings were the best performers. This includes the U.S. dollar denominated Emerging Markets holdings as well as non-Agency residential MBS. Emerging Market bonds continue to offer diversification benefits to the overall portfolio while also adding to outperformance. The non-Agency MBS sector also performed well over the previous twelve months. Securities backed by both prime and Alt-A collateral were the best performers over this period. |
| Q. | What were the weakest performing holdings? |
| A. | The Fund’s weakest holdings were in the U.S. Government debt (including Agency-backed securities) as well as U.S. Agency MBS. These sectors of the Fund were the worst performing sectors, however, these sectors performed in line with their respective portions of the benchmark. |
| Q. | How was the Fund positioned as of October 31, 2012? |
| A. | The Fund’s strategy has remained relatively constant throughout the twelve months ending October 31, 2012. The Fund continues to hold an allocation to non-benchmark sectors such as U.S. dollar-denominated Emerging Markets and non-Agency MBS. The non-Agency MBS allocations continue to be focused on prime and Alt-A backed collateral with very little subprime exposure. Additionally, the Fund continues to be underweight U.S. Government and Agency debt while maintaining a market weight in U.S. Corporates and no exposure to U.S. High Yield securities. |
Growth of a Hypothetical $10,000 Investment—Class N
All dividends and capital gains are reinvested. Indexes are unmanaged and do not take into account fees, expenses or other costs.
Returns shown in the chart and table do not reflect taxes that a shareholder would pay on Fund distributions or on the sale of the Fund shares.
Bond funds have the same interest rate, high yield and credit risks associated with the underlying bonds in the portfolio, all of which could reduce the Fund’s value. As interest rates rise, the value of the Fund can decline and an investor can lose principal.
RETURNSFOR PERIOD ENDED 10/31/12
Average Annual Total Returns - Class N
| | | | |
One Year | | | 10.25 | % |
Since Inception | | | 12.28 | % |
Inception Date 07/18/11
Average Annual Total Returns - Class I
| | | | |
One Year | | | 10.52 | % |
Since Inception | | | 12.54 | % |
Inception Date 07/18/11
The performance data quoted represents past performance. Past performance does not guarantee future results. Investment return and principal value will fluctuate so that an investor’s shares, upon redemption, may be worth more or less than their original cost. Current performance may be lower or higher than the performance data quoted. For performance data current to the most recent month-end, please visit our website at www.astonfunds.com.
The performance quoted would have been lower if fee waivers and/or expense reimbursements had not been in effect.
| | |
| |
| ASTON/DoubleLine Core Plus Fixed Income Fund | | October 31, 2012 |
| |
| Schedule of Investments | | |
| | | | | | | | |
Par Value | | | | | Market
Value | |
|
| | AGENCY COLLATERALIZED MORTGAGE OBLIGATIONS – 12.44% | |
| | |
| | | | Fannie Mae – 3.64% | | | | |
| | $ 947,959 | | | 5.000%, 09/25/33
Series 2003-92, Class PZ, REMIC | | $ | 1,083,780 | |
| | 1,025,577 | | | 5.589%, 09/25/36 (a) (b)
Series 2009-86, Class CI, REMIC | | | 128,368 | |
| | 697,534 | | | 6.409%, 10/25/36 (a) (b)
Series 2007-57, Class SX, REMIC | | | 103,835 | |
| | 193,778 | | | 5.500%, 03/25/38
Series 2008-14, Class ZA, REMIC | | | 219,997 | |
| | 283,966 | | | 4.000%, 01/25/41
Series 2010-156, Class ZC, REMIC | | | 309,954 | |
| | 427,528 | | | 4.000%, 03/25/41
Series 2011-18, Class UZ, REMIC | | | 466,701 | |
| | 79,318 | | | 4.000%, 08/25/41
Series 2011-77, Class CZ, REMIC | | | 79,952 | |
| | 196,639 | | | 8.871%, 09/25/41 (a)
Series 2011-88, Class SB, REMIC | | | 199,942 | |
| | 158,428 | | | 13.307%, 09/25/41 (a)
Series 2011-87, Class US, REMIC | | | 160,968 | |
| | 1,023,573 | | | 3.500%, 03/25/42
Series 2012-20, Class ZT, REMIC | | | 1,049,268 | |
| | 1,535,352 | | | 4.000%, 04/25/42
Series 2012-31, Class Z, REMIC | | | 1,657,566 | |
| | 1,002,917 | | | 3.500%, 10/25/42
Series 2012-105, Class Z, REMIC | | | 977,831 | |
| | | | | | | | |
| | | | | | | 6,438,162 | |
| | | | | | | | |
| | |
| | | | Freddie Mac – 6.88% | | | | |
| | 2,984,665 | | | 3.000%, 08/15/42
Series 269, Class 30, STRIP | | | 3,115,698 | |
| | 739,121 | | | 5.000%, 12/15/34
Series 2909, Class Z, REMIC | | | 825,783 | |
| | 1,634,703 | | | 5.000%, 03/15/35
Series 2945, Class CZ, REMIC | | | 1,805,409 | |
| | | | | | | | |
Par Value | | | | | Market
Value | |
| | |
| | | | Freddie Mac (continued) | | | | |
| | $ 581,443 | | | 5.500%, 08/15/36
Series 3626, Class AZ, REMIC | | $ | 666,090 | |
| | 495,442 | | | 5.886%, 04/15/37 (a) (b)
Series 3301, Class MS, REMIC | | | 61,099 | |
| | 444,250 | | | 5.786%, 11/15/37 (a) (b)
Series 3382, Class SB, REMIC | | | 42,888 | |
| | 380,070 | | | 6.176%, 11/15/37 (a) (b)
Series 3384, Class S, REMIC | | | 51,142 | |
| | 1,500,000 | | | 4.000%, 12/15/38
Series 3738, Class BP, REMIC | | | 1,634,508 | |
| | 1,218,342 | | | 5.306%, 01/15/39 (a) (b)
Series 3500, Class SA, REMIC | | | 129,225 | |
| | 1,246,321 | | | 4.500%, 01/15/40
Series 3818, Class JA, REMIC | | | 1,293,506 | |
| | 23,373 | | | 14.358%, 10/15/40 (a)
Series 3747, Class KS, REMIC | | | 23,626 | |
| | 107,238 | | | 4.000%, 01/15/41
Series 3795, Class VZ, REMIC | | | 117,072 | |
| | 97,339 | | | 9.472%, 01/15/41 (a)
Series 3796, Class SK, REMIC | | | 98,015 | |
| | 299,140 | | | 4.000%, 06/15/41
Series 3872, Class BA, REMIC | | | 320,505 | |
| | 210,237 | | | 4.000%, 07/15/41
Series 3888, Class ZG, REMIC | | | 227,960 | |
| | 370,163 | | | 4.500%, 07/15/41
Series 3894, Class ZA, REMIC | | | 414,998 | |
| | 317,500 | | | 9.131%, 09/15/41 (a)
Series 3924, Class US, REMIC | | | 321,880 | |
| | 516,278 | | | 3.500%, 11/15/41
Series 3957, Class DZ, REMIC | | | 533,772 | |
| | 466,778 | | | 4.000%, 11/15/41
Series 3957, Class HZ, REMIC | | | 490,449 | |
| | | | | | | | |
| | | | | | | 12,173,625 | |
| | | | | | | | |
| |
| | | | Government National Mortgage Association – 1.92% | |
| | 53,019 | | | 31.130%, 03/20/34 (a)
Series 2004-35, Class SA | | | 98,984 | |
| | 1,210,849 | | | 7.419%, 08/20/38 (a) (b)
Series 2008-69, Class SB | | | 194,584 | |
| | 1,310,838 | | | 5.951%, 03/20/39 (b)
Series 2010-98, Class IA | | | 111,138 | |
| | 1,165,864 | | | 4.500%, 05/16/39
Series 2009-32, Class ZE | | | 1,303,195 | |
| | 582,932 | | | 4.500%, 05/20/39
Series 2009-35, Class DZ | | | 663,496 | |
| | 574,269 | | | 4.500%, 09/20/39
Series 2009-75, Class GZ | | | 652,129 | |
| | 2,824,714 | | | 5.239%, 06/20/41 (a) (b)
Series 2011-89, Class SA | | | 376,421 | |
| | | | | | | | |
| | | | | | | 3,399,947 | |
| | | | | | | | |
| | |
| | | | Total Agency Collateralized Mortgage Obligations
(Cost $20,983,252) | | | 22,011,734 | |
| | | | | | | | |
See accompanying Notes to Financial Statements.
| | |
| |
| ASTON/DoubleLine Core Plus Fixed Income Fund | | October 31, 2012 |
| |
| Schedule of Investments – continued | | |
| | | | | | | | |
Par Value | | | | | Market
Value | |
| |
| | U.S. GOVERNMENT OBLIGATIONS – 18.18% | | | | |
| | |
| | | | U.S. Treasury Bill – 3.42% | | | | |
| | $2,800,000 | | | 0.114%, 12/06/12 | | $ | 2,799,742 | |
| | 3,250,000 | | | 0.075%, 01/10/13 | | | 3,249,480 | |
| | | | | | | | |
| | | | | | | 6,049,222 | |
| | | | | | | | |
| | |
| | | | U.S. Treasury Bond – 3.24% | | | | |
| | 4,830,000 | | | 3.750%, 08/15/41 | | | 5,734,872 | |
| | | | | | | | |
| | |
| | | | U.S. Treasury Notes – 11.52% | | | | |
| | 2,420,000 | | | 1.875%, 09/30/17 | | | 2,555,747 | |
| | 3,160,000 | | | 2.375%, 05/31/18 | | | 3,422,182 | |
| | 4,950,000 | | | 1.250%, 04/30/19 | | | 5,015,355 | |
| | 810,000 | | | 1.000%, 08/31/19 | | | 804,051 | |
| | 2,590,000 | | | 2.625%, 11/15/20 | | | 2,842,525 | |
| | 5,680,000 | | | 1.750%, 05/15/22 | | | 5,731,035 | |
| | | | | | | | |
| | | | | | | 20,370,895 | |
| | | | | | | | |
| | |
| | | | Total U.S. Government Obligations
(Cost $32,380,435) | | | 32,154,989 | |
| | | | | | | | |
|
| | U.S. GOVERNMENT MORTGAGE-BACKED SECURITIES – 7.49% | |
| | |
| | | | Fannie Mae – 7.03% | | | | |
| | 576,830 | | | 4.000%, 09/01/31
Pool # MA3894 | | | 622,462 | |
| | 1,287,948 | | | 3.500%, 12/01/31
Pool # MA0919 | | | 1,377,453 | |
| | 1,129,041 | | | 3.500%, 01/01/32
Pool # MA0949 | | | 1,207,503 | |
| | 861,529 | | | 4.000%, 02/01/42
Pool # AK4039 | | | 904,915 | |
| | 730,451 | | | 4.500%, 03/01/42
Pool # MA1050 | | | 772,411 | |
| | 1,810,528 | | | 3.500%, 05/01/42
Pool # MA1068 | | | 1,885,994 | |
| | 2,070,153 | | | 4.000%, 06/01/42
Pool # AB5459 | | | 2,174,403 | |
| | 3,351,015 | | | 3.500%, 07/01/42
Pool # MA1117 | | | 3,490,693 | |
| | | | | | | | |
| | | | | | | 12,435,834 | |
| | | | | | | | |
| | |
| | | | Freddie Mac – 0.46% | | | | |
| | 113,914 | | | 5.000%, 07/01/35
Gold Pool # G01840 | | | 123,865 | |
| | 49,539 | | | 5.500%, 12/01/38
Gold Pool # G06172 | | | 53,910 | |
| | 610,820 | | | 4.000%, 10/01/41
Gold Pool # T60392 | | | 640,626 | |
| | | | | | | | |
| | | | | | | 818,401 | |
| | | | | | | | |
| | |
| | | | Total U.S. Government Mortgage-Backed
Securities
(Cost $13,156,776) | | | 13,254,235 | |
| | | | | | | | |
| | | | | | | | |
Par Value | | | | | Market
Value | |
|
| | CORPORATE NOTES AND BONDS – 32.67% | |
| | |
| | | | Consumer Discretionary – 2.58% | | | | |
| | $ 425,000 | | | ADT
3.500%, 07/15/22 (c) | | $ | 432,942 | |
| | 340,000 | | | Daimler Finance North America
1.950%, 03/28/14 (c) | | | 344,042 | |
| | 325,000 | | | DIRECTV Holdings
5.000%, 03/01/21 | | | 369,900 | |
| | 550,000 | | | Ford Motor
Senior Unsecured Notes
7.450%, 07/16/31 | | | 698,500 | |
| | 425,000 | | | Mattel
Senior Unsecured Notes
2.500%, 11/01/16 | | | 443,092 | |
| | 225,000 | | | News America
6.650%, 11/15/37 | | | 297,324 | |
| | 350,000 | | | Omnicom Group
Senior Unsecured Notes
4.450%, 08/15/20 | | | 398,675 | |
| | 100,000 | | | Prime Holdings Labuan (Malaysia)
5.375%, 09/22/14 | | | 105,687 | |
| | | | Target
Senior Unsecured Notes | | | | |
| | 275,000 | | | 3.875%, 07/15/20 | | | 315,335 | |
| | 150,000 | | | 2.900%, 01/15/22 | | | 161,114 | |
| | | | Time Warner Cable | | | | |
| | 275,000 | | | 5.000%, 02/01/20 | | | 323,982 | |
| | 325,000 | | | 4.500%, 09/15/42 | | | 334,338 | |
| | 300,000 | | | Wynn Las Vegas
7.750%, 08/15/20 | | | 338,250 | |
| | | | | | | | |
| | | | | | | 4,563,181 | |
| | | | | | | | |
| | |
| | | | Consumer Staples – 3.10% | | | | |
| | 725,000 | | | Altria Group
2.850%, 08/09/22 | | | 727,875 | |
| | 200,000 | | | Anadolu Efes Biracilik Ve Malt Sanayii AS (Turkey)
Senior Unsecured Notes
3.375%, 11/01/22 (c) | | | 195,000 | |
| | 300,000 | | | CCL Finance (Cayman Islands)
9.500%, 08/15/14 | | | 339,000 | |
| | 225,000 | | | Coca-Cola
Senior Unsecured Notes
1.800%, 09/01/16 | | | 233,461 | |
| | 100,000 | | | Corp Lindley (Peru)
Senior Unsecured Notes
6.750%, 11/23/21 (c) | | | 115,850 | |
| | 100,000 | | | Corp Pesquera Inca (Peru)
9.000%, 02/10/17 | | | 108,500 | |
| | 350,000 | | | Diageo Capital (United Kingdom)
1.500%, 05/11/17 | | | 357,101 | |
| | 360,000 | | | General Mills
Senior Unsecured Notes
3.150%, 12/15/21 | | | 384,018 | |
| | 120,000 | | | Gruma (Mexico)
Senior Unsecured Notes
7.750%, 12/29/49 | | | 121,200 | |
See accompanying Notes to Financial Statements.
| | |
| |
| ASTON/DoubleLine Core Plus Fixed Income Fund | | October 31, 2012 |
| |
| Schedule of Investments – continued | | |
| | | | | | | | |
Par Value | | | | | Market
Value | |
| | |
| | | | Consumer Staples (continued) | | | | |
| | $ 400,000 | | | IOI Investment L Bhd (Malaysia)
4.375%, 06/27/22 | | $ | 413,984 | |
| | 70,000 | | | JBS USA
Senior Unsecured Notes
7.250%, 06/01/21 (d) | | | 68,600 | |
| | 268,000 | | | Kellogg
Senior Unsecured Notes
7.450%, 04/01/31 | | | 378,996 | |
| | 290,000 | | | Kraft Foods
Senior Unsecured Notes
5.375%, 02/10/20 | | | 356,231 | |
| | 625,000 | | | Kroger
Senior Unsecured Notes
3.400%, 04/15/22 | | | 667,616 | |
| | 380,000 | | | Tyson Foods
4.500%, 06/15/22 | | | 404,700 | |
| | 550,000 | | | Wal-Mart Stores
Senior Unsecured Notes
3.250%, 10/25/20 | | | 613,176 | |
| | | | | | | | |
| | | | | | | 5,485,308 | |
| | | | | | | | |
| | |
| | | | Energy – 4.72% | | | | |
| | 500,000 | | | AKTransneft OJSC Via TransCapitalInvest (Ireland)
Senior Unsecured Notes
5.670%, 03/05/14 | | | 529,165 | |
| | 300,000 | | | BP Capital Markets (United Kingdom)
4.750%, 03/10/19 | | | 352,990 | |
| | 400,000 | | | CNPC General Capital (British Virgin Islands)
Senior Unsecured Notes
2.750%, 04/19/17 | | | 413,781 | |
| | 275,000 | | | ConocoPhillips
6.500%, 02/01/39 | | | 404,949 | |
| | | | Devon Energy
Senior Unsecured Notes | | | | |
| | 200,000 | | | 6.300%, 01/15/19 | | | 251,949 | |
| | 350,000 | | | 4.000%, 07/15/21 | | | 392,772 | |
| | 600,000 | | | Gazprom OAO Via Gaz Capital SA (Luxembourg)
Senior Unsecured Notes
8.125%, 07/31/14 | | | 659,364 | |
| | 225,000 | | | Halliburton
Senior Unsecured Notes
6.150%, 09/15/19 | | | 286,683 | |
| | 275,000 | | | Kinder Morgan Energy Partners
Senior Unsecured Notes
6.950%, 01/15/38 | | | 369,430 | |
| | 325,000 | | | Marathon Petroleum
Senior Secured Notes
5.125%, 03/01/21 | | | 383,565 | |
| | 301,000 | | | ONEOK Partners
6.125%, 02/01/41 | | | 384,051 | |
| | | | Pacific Rubiales Energy (Canada) | | | | |
| | 100,000 | | | 7.250%, 12/12/21 | | | 119,000 | |
| | 215,000 | | | 7.250%, 12/12/21 (c) | | | 255,850 | |
| | 550,000 | | | Pemex Project Funding Master Trust
6.625%, 06/15/35 | | | 688,875 | |
| | | | | | | | |
Par Value | | | | | Market
Value | |
| | |
| | | | Energy (continued) | | | | |
| | $ 520,000 | | | Petrobras International Finance
(Cayman Islands)
3.875%, 01/27/16 | | $ | 554,863 | |
| | 200,000 | | | Petroleos Mexicanos (Mexico)
6.625%, 09/28/99 | | | 214,000 | |
| | 250,000 | | | Phillips 66
5.875%, 05/01/42 (c) | | | 312,664 | |
| | 250,000 | | | Reliance Holdings USA
5.400%, 02/14/22 (c) | | | 278,256 | |
| | 400,000 | | | Transocean (Cayman Islands)
6.000%, 03/15/18 | | | 471,602 | |
| | 200,000 | | | Transportadora de Gas Internacional SA ESP (Colombia)
Senior Unsecured Notes
5.700%, 03/20/22 | | | 224,000 | |
| | 500,000 | | | Tupras Turkiye Petrol Rafinerileri AS (Turkey)
Senior Unsecured Notes
4.125%, 05/02/18 (c) (d) (e) | | | 494,375 | |
| | 250,000 | | | Valero Energy
6.125%, 02/01/20 | | | 309,042 | |
| | | | | | | | |
| | | | | | | 8,351,226 | |
| | | | | | | | |
| | |
| | | | Financials – 8.44% | | | | |
| | 725,000 | | | American Express Credit
Senior Unsecured Notes
2.750%, 09/15/15 | | | 764,738 | |
| | 600,000 | | | Australia & New Zealand Banking Group (Australia)
Senior Unsecured Notes
4.875%, 01/12/21 (c) | | | 693,895 | |
| | 200,000 | | | Banco Bradesco SA/Cayman Islands (Brazil)
Subordinated Notes
5.750%, 03/01/22 (c) | | | 216,500 | |
| | 100,000 | | | Banco de Chile (Chile)
6.250%, 06/15/16 | | | 112,180 | |
| | 220,000 | | | Banco de Credito del Peru/Panama (Peru)
Senior Unsecured Notes
4.750%, 03/16/16 | | | 235,950 | |
| | 600,000 | | | Banco de Credito e Inversiones (Chile)
Senior Unsecured Notes
3.000%, 09/13/17 (c) | | | 610,339 | |
| | | | Banco do Brasil SA/Cayman Islands (Brazil) | | | | |
| | 200,000 | | | 3.875%, 10/10/22 | | | 199,900 | |
| | 400,000 | | | 8.500%, 10/20/99 (a) (d) | | | 490,000 | |
| | 300,000 | | | Banco Mercantil del Norte (Mexico)
Subordinated Notes
6.862%, 10/13/21 (a) | | | 328,500 | |
| | 100,000 | | | Banco Mercantil del Norte SA (Mexico)
Senior Unsecured Notes
4.375%, 07/19/15 | | | 106,250 | |
| | 100,000 | | | Bancolombia SA (Colombia)
Senior Unsecured Notes
4.250%, 01/12/16 | | | 105,750 | |
See accompanying Notes to Financial Statements.
| | |
| |
| ASTON/DoubleLine Core Plus Fixed Income Fund | | October 31, 2012 |
| |
| Schedule of Investments – continued | | |
| | | | | | | | |
Par Value | | | | | Market
Value | |
| | |
| | | | Financials (continued) | | | | |
| | $ 700,000 | | | Bank of Montreal
(Canada)
Senior Unsecured Notes
1.400%, 09/11/17 | | $ | 706,607 | |
| | 515,000 | | | BB&T
Senior Unsecured Notes
1.600%, 08/15/17 | | | 524,629 | |
| | 275,000 | | | Boston Properties
Senior Unsecured Notes, REIT
4.125%, 05/15/21 | | | 302,514 | |
| | 100,000 | | | Boston Properties LP
Senior Unsecured Notes
3.850%, 02/01/23 | | | 107,979 | |
| | 400,000 | | | DBS Bank (Singapore)
5.000%, 11/15/19 (a) | | | 424,441 | |
| | 625,000 | | | General Electric Capital
Senior Unsecured Notes
2.900%, 01/09/17 | | | 662,149 | |
| | | | Grupo Aval (Cayman Islands) | | | | |
| | 400,000 | | | 5.250%, 02/01/17 | | | 428,520 | |
| | 200,000 | | | 4.750%, 09/26/22 (c) | | | 200,500 | |
| | 102,522 | | | Iirsa Norte Finance (Cayman Islands)
Senior Secured Notes
8.750%, 05/30/24 | | | 126,614 | |
| | 100,000 | | | Industrial Senior Trust (Cayman Islands)
5.500%, 11/01/22 (c) (d) (e) | | | 100,600 | |
| | 100,000 | | | Industry & Construction Bank
St Petersburg
5.010%, 09/29/15 (a) | | | 100,125 | |
| | | | JPMorgan Chase
Senior Unsecured Notes | | | | |
| | 250,000 | | | 4.950%, 03/25/20 | | | 287,390 | |
| | 400,000 | | | 4.500%, 01/24/22 | | | 452,368 | |
| | 675,000 | | | Korea Development Bank (South Korea)
4.375%, 08/10/15 | | | 732,175 | |
| | 455,000 | | | Liberty Mutual
6.500%, 05/01/42 (c) | | | 519,049 | |
| | | | MetLife
Senior Unsecured Notes | | | | |
| | 197,000 | | | 6.375%, 06/15/34 | | | 258,227 | |
| | 125,000 | | | 5.700%, 06/15/35 | | | 154,989 | |
| | 590,000 | | | National Rural Utilities Cooperative Finance Collateral Trust
10.375%, 11/01/18 | | | 878,178 | |
| | 600,000 | | | Oversea-Chinese Banking (Singapore)
4.250%, 11/18/19 (a) | | | 623,877 | |
| | | | PNC Funding | | | | |
| | 200,000 | | | 6.700%, 06/10/19 | | | 258,208 | |
| | 250,000 | | | 4.375%, 08/11/20 | | | 289,140 | |
| | 350,000 | | | Pttep Australia International Finance Property (Australia)
4.152%, 07/19/15 | | | 370,778 | |
| | 500,000 | | | Qtel International Finance (Bermuda)
3.375%, 10/14/16 | | | 530,000 | |
| | 200,000 | | | Russian Agricultural Bank (Luxembourg) Senior Unsecured Notes
7.125%, 01/14/14 | | | 212,260 | |
| | | | | | | | |
Par Value | | | | | Market
Value | |
| | |
| | | | Financials (continued) | | | | |
| | | | Simon Property Group
Senior Unsecured Notes
| | | | |
| | $ 100,000 | | | 5.650%, 02/01/20 | | $ | 120,420 | |
| | 160,000 | | | 4.375%, 03/01/21 | | | 180,831 | |
| | 500,000 | | | United Overseas Bank
5.375%, 09/03/19 (a) | | | 531,050 | |
| | 300,000 | | | VTB Bank OJSC Via VTB Capital (Luxembourg)
Senior Unsecured Notes
6.875%, 05/29/18 | | | 324,408 | |
| | 575,000 | | | Wells Fargo
Senior Unsecured Notes
4.600%, 04/01/21 | | | 662,582 | |
| | | | | | | | |
| | | | | | | 14,934,610 | |
| | | | | | | | |
| | |
| | | | Healthcare – 1.43% | | | | |
| | | | Becton Dickinson
Senior Unsecured Notes | | | | |
| | 125,000 | | | 3.250%, 11/12/20 | | | 135,337 | |
| | 405,000 | | | 3.125%, 11/08/21 | | | 436,734 | |
| | 350,000 | | | Biogen Idec
Senior Unsecured Notes
6.875%, 03/01/18 | | | 437,753 | |
| | 425,000 | | | Celgene
Senior Unsecured Notes
3.250%, 08/15/22 | | | 438,560 | |
| | 375,000 | | | Express Scripts Holding
2.100%, 02/12/15 (c) | | | 383,737 | |
| | | | WellPoint
Senior Unsecured Notes | | | | |
| | 350,000 | | | 5.250%, 01/15/16 | | | 392,074 | |
| | 250,000 | | | 5.875%, 06/15/17 | | | 296,231 | |
| | | | | | | | |
| | | | | | | 2,520,426 | |
| | | | | | | | |
| | |
| | | | Industrials – 4.20% | | | | |
| | 300,000 | | | Boeing
Senior Unsecured Notes
6.875%, 03/15/39 | | | 470,049 | |
| | 250,000 | | | Cemex Finance (Mexico)
Senior Secured Notes
9.500%, 12/14/16 | | | 266,650 | |
| | 100,000 | | | Cemex Sab de CV (Mexico)
Senior Secured Notes
9.000%, 01/11/18 | | | 104,250 | |
| | 200,000 | | | Corp GEO Sab de CV
8.875%, 03/27/22 | | | 212,000 | |
| | 200,000 | | | Corp Nacional del Cobre de Chile (Chile)
Senior Unsecured Notes
3.000%, 07/17/22 (c) | | | 202,209 | |
| | | | Covidien International Finance (Luxembourg) | | | | |
| | 185,000 | | | 2.800%, 06/15/15 | | | 194,748 | |
| | 302,000 | | | 6.000%, 10/15/17 | | | 370,099 | |
| | 125,000 | | | Daimler Finance North America
6.500%, 11/15/13 | | | 132,456 | |
See accompanying Notes to Financial Statements.
| | |
| |
| ASTON/DoubleLine Core Plus Fixed Income Fund | | October 31, 2012 |
| |
| Schedule of Investments – continued | | |
| | | | | | | | |
Par Value | | | | | Market
Value | |
| | |
| | | | Industrials (continued) | | | | |
| | $ 325,000 | | | Eastman Chemical
Senior Unsecured Notes
2.400%, 06/01/17 | | $ | 337,453 | |
| | | | Embraer Overseas (Cayman Islands) | | | | |
| | 350,000 | | | 6.375%, 01/24/17 | | | 400,750 | |
| | 150,000 | | | 6.375%, 01/15/20 | | | 175,125 | |
| | | | Empresas ICA (Mexico) | | | | |
| | 150,000 | | | 8.375%, 07/24/17 | | | 160,500 | |
| | 200,000 | | | 8.900%, 02/04/21 | | | 218,000 | |
| | 400,000 | | | Freeport-McMoRan Copper & Gold
Senior Unsecured Notes
2.150%, 03/01/17 | | | 406,478 | |
| | 500,000 | | | Grupo KUO SAB de CV (Mexico)
9.750%, 10/17/17 | | | 535,000 | |
| | | | Illinois Tool Works
Senior Unsecured Notes | | | | |
| | 125,000 | | | 6.250%, 04/01/19 | | | 156,592 | |
| | 150,000 | | | 3.375%, 09/15/21 | | | 161,945 | |
| | 400,000 | | | NET Servicos de Comunicacao (Brazil)
7.500%, 01/27/20 | | | 464,000 | |
| | 350,000 | | | Novartis Capital
4.400%, 04/24/20 | | | 412,735 | |
| | 400,000 | | | Penerbangan Malaysia (Malaysia)
5.625%, 03/15/16 | | | 451,860 | |
| | | | Southwest Airlines
Senior Unsecured Notes | | | | |
| | 337,000 | | | 5.750%, 12/15/16 | | | 383,073 | |
| | 225,000 | | | 5.125%, 03/01/17 | | | 250,522 | |
| | 200,000 | | | United Technologies
Senior Unsecured Notes
3.100%, 06/01/22 | | | 215,584 | |
| | 450,000 | | | Waste Management
6.125%, 11/30/39 | | | 576,178 | |
| | 200,000 | | | WPE International Cooperatief (Netherlands)
10.375%, 09/30/20 | | | 174,000 | |
| | | | | | | | |
| | | | | | | 7,432,256 | |
| | | | | | | | |
| | |
| | | | Information Technology – 1.39% | | | | |
| | 200,000 | | | Arrow Electronics
Senior Unsecured Notes
3.375%, 11/01/15 | | | 209,674 | |
| | 300,000 | | | IBM
Senior Unsecured Notes
1.950%, 07/22/16 | | | 313,734 | |
| | 375,000 | | | Intel
Senior Unsecured Notes
3.300%, 10/01/21 | | | 411,916 | |
| | 450,000 | | | Motorola Solutions
Senior Unsecured Notes
6.000%, 11/15/17 | | | 534,764 | |
| | 425,000 | | | Oracle
Senior Unsecured Notes
1.200%, 10/15/17 | | | 427,470 | |
| | 525,000 | | | Xerox
Senior Unsecured Notes
4.250%, 02/15/15 | | | 557,956 | |
| | | | | | | | |
| | | | | | | 2,455,514 | |
| | | | | | | | |
| | | | | | | | |
Par Value | | | | | Market
Value | |
| | |
| | | | Materials – 2.25% | | | | |
| | $ 600,000 | | | Alfa MTN Invest
Senior Unsecured Notes
9.250%, 06/24/13 | | $ | 626,328 | |
| | | | Celulosa Arauco y Constitucion SA (Chile)
Senior Unsecured Notes | | | | |
| | 300,000 | | | 5.000%, 01/21/21 | | | 324,523 | |
| | 200,000 | | | 4.750%, 01/11/22 | | | 213,752 | |
| | 200,000 | | | Corp Nacional del Cobre de Chile (Chile)
Senior Unsecured Notes
3.875%, 11/03/21 | | | 218,887 | |
| | | | Ecolab
Senior Unsecured Notes | | | | |
| | 225,000 | | | 2.375%, 12/08/14 | | | 233,289 | |
| | 200,000 | | | 1.000%, 08/09/15 | | | 201,046 | |
| | 200,000 | | | Inversiones CMPC (Chile)
Senior Unsecured Notes
4.500%, 04/25/22 | | | 210,465 | |
| | | | Inversiones CMPC | | | | |
| | 100,000 | | | 4.875%, 06/18/13 | | | 101,987 | |
| | 150,000 | | | 4.500%, 04/25/22 (c) | | | 157,849 | |
| | 250,000 | | | Senior Unsecured Notes
4.750%, 01/19/18 | | | 270,119 | |
| | 600,000 | | | Mexichem SAB de CV (Mexico)
Senior Unsecured Notes
4.875%, 09/19/22 (c) | | | 636,000 | |
| | | | POSCO (South Korea)
Senior Unsecured Notes | | | | |
| | 100,000 | | | 4.250%, 10/28/20 (c) | | | 107,610 | |
| | 250,000 | | | 5.250%, 04/14/21 (c) | | | 290,273 | |
| | 375,000 | | | Teck Resources (Canada)
5.400%, 02/01/43 | | | 379,062 | |
| | | | | | | | |
| | | | | | | 3,971,190 | |
| | | | | | | | |
| | |
| | | | Telecommunications – 1.53% | | | | |
| | 300,000 | | | AT&T
Senior Unsecured Notes
5.350%, 09/01/40 | | | 368,345 | |
| | 150,000 | | | Axiata SPV1 Labuan (Malaysia)
5.375%, 04/28/20 | | | 170,149 | |
| | 596,000 | | | British Telecom (united Kingdom)
Senior Unsecured Notes
5.950%, 01/15/18 | | | 716,140 | |
| | 125,000 | | | Deutsche Telekom International Finance BV (Netherlands)
8.750%, 06/15/30 | | | 193,055 | |
| | 300,000 | | | France Telecom (France)
Senior Unsecured Notes
2.750%, 09/14/16 | | | 316,908 | |
| | | | Globo Comunicacao e Participacoes
(Brazil) | | | | |
| | 300,000 | | | 6.250%, 07/20/15 (f) | | | 327,000 | |
| | 200,000 | | | 5.307%, 05/11/22 (c) (f) | | | 222,500 | |
| | 100,000 | | | Koninklijke KPN NV (Netherlands)
Senior Unsecured Notes
8.375%, 10/01/30 | | | 135,739 | |
See accompanying Notes to Financial Statements.
| | |
| |
| ASTON/DoubleLine Core Plus Fixed Income Fund | | October 31, 2012 |
| |
| Schedule of Investments – continued | | |
| | | | | | | | |
Par Value | | | | | Market
Value | |
| | |
| | | | Telecommunications (continued) | | | | |
| | $ 250,000 | | | Vimpel Communications Via VIP Finance (Ireland)
Senior Unsecured Notes
8.375%, 04/30/13 | | $ | 258,170 | |
| | | | | | | | |
| | | | | | | 2,708,006 | |
| | | | | | | | |
| | |
| | | | Transportation Non Rail – 0.89% | | | | |
| | 700,000 | | | Gazprombank OJSC Via GPB Eurobond Finance (Ireland)
Senior Unsecured Notes
7.933%, 06/28/13 | | | 729,767 | |
| | 400,000 | | | Itau Unibanco Holding SA (Brazil)
Subordinated Notes
5.650%, 03/19/22 | | | 427,100 | |
| | | | Transnet SOC (South Africa)
Senior Unsecured Notes | | | | |
| | 200,000 | | | 4.500%, 02/10/16 | | | 212,761 | |
| | 200,000 | | | 4.000%, 07/26/22 (c) | | | 200,500 | |
| | | | | | | | |
| | | | | | | 1,570,128 | |
| | | | | | | | |
| | |
| | | | Utilities – 2.14% | | | | |
| | | | Abu Dhabi National Energy
(United Arab Emirates) Senior Unsecured Notes | | | | |
| | 100,000 | | | 4.750%, 09/15/14 | | | 106,025 | |
| | 400,000 | | | 5.875%, 12/13/21 | | | 478,000 | |
| | 500,000 | | | AES Andres Dominicana (Cayman Islands)
Senior Secured Notes
9.500%, 11/12/20 | | | 553,750 | |
| | 150,000 | | | AES Gener (Chile)
Senior Unsecured Notes
7.500%, 03/25/14 | | | 161,379 | |
| | 400,000 | | | Duke Energy
Senior Unsecured Notes
3.550%, 09/15/21 | | | 429,139 | |
| | 350,000 | | | EGE Haina Finance (Cayman Islands)
Senior Secured Notes
9.500%, 04/26/17 | | | 367,500 | |
| | 200,000 | | | Hongkong Electric Finance
(British Virgin Islands)
4.250%, 12/14/20 | | | 221,220 | |
| | 200,000 | | | Instituto Costarricense de Electricidad (Cost Rica)
Senior Unsecured Notes
6.950%, 11/10/21 (c) | | | 223,500 | |
| | | | Midamerican Energy Holdings
Senior Unsecured Notes | | | | |
| | 50,000 | | | 5.950%, 05/15/37 | | | 64,434 | |
| | 375,000 | | | 6.500%, 09/15/37 | | | 518,327 | |
| | 95,969 | | | Nakilat (Qatar)
6.267%, 12/31/33 | | | 118,264 | |
| | 500,000 | | | Southern Power
Senior Unsecured Notes
4.875%, 07/15/15 | | | 550,558 | |
| | | | | | | | |
| | | | | | | 3,792,096 | |
| | | | | | | | |
| | |
| | | | Total Corporate Notes and Bonds
(Cost $55,854,107) | | | 57,783,941 | |
| | | | | | | | |
| | | | | | | | |
Par Value | | | | | Market
Value | |
|
| | COLLATERALIZED MORTGAGE-BACKED SECURITIES – 22.22% | |
| | |
| | $ 1,072,000 | | | American General Mortgage Loan Trust
Series 2010-1A, Class A3
5.650%, 03/25/58 (a) (c) | | $ | 1,118,668 | |
| | 250,000 | | | Banc of America Commercial Mortgage Trust
Series 2007-5, Class AM
5.772%, 02/10/51 (a) | | | 280,840 | |
| | 810,806 | | | Banc of America Funding
Series 2010-R9, Class 3A3
5.500%, 12/26/35 (c) | | | 364,588 | |
| | 1,068,877 | | | Banc of America Funding
Series 2006-B, Class 7A1
5.614%, 03/20/36 (a) | | | 918,890 | |
| | 1,292,917 | | | Banc of America Funding
Series 2012-R4, Class A
0.474%, 03/04/39 (a) (c) (d) | | | 1,234,736 | |
| | 250,000 | | | Banc of America Large Loan Trust
Series 2007-BMB1, Class A2
0.964%, 08/15/29 (a) (c) | | | 246,610 | |
| | 75,000 | | | Banc of America Merrill Lynch Commercial Mortgage
Series 2006-4, Class AM
5.675%, 07/10/46 | | | 84,745 | |
| | 50,000 | | | Banc of America Merrill Lynch Commercial Mortgage
Series 2007-1, Class A4
5.451%, 01/15/49 | | | 58,155 | |
| | 100,000 | | | Banc of America Re-REMIC Trust
Series 2012-CLRN, Class B
1.814%, 08/15/29 (a) (c) | | | 100,743 | |
| | 100,000 | | | Banc of America Re-REMIC Trust
Series 2012-CLRN, Class D
2.914%, 08/15/29 (a) (c) | | | 100,872 | |
| | 638,299 | | | Bear Stearns Asset Backed Securities Trust
Series 2004-AC2, Class 2A
5.000%, 05/25/34 | | | 643,879 | |
| | 125,000 | | | Bear Stearns Commercial Mortgage Securities
Series 2006-PW14, Class AM
5.243%, 12/11/38 | | | 139,529 | |
| | 275,000 | | | Bear Stearns Commercial Mortgage Securities
Series 2007-PW16, Class AM
5.716%, 06/11/40 (a) | | | 309,678 | |
| | 100,000 | | | Bear Stearns Commercial Mortgage Securities
Series 2005-PWR8, Class A4
4.674%, 06/11/41 | | | 109,264 | |
| | 25,000 | | | Bear Stearns Commercial Mortgage Securities
Series 2006-PW13, Class AM
5.582%, 09/11/41 (a) | | | 28,170 | |
| | 100,000 | | | Bear Stearns Commercial Mortgage Securities
Series 2006-T24, Class AM
5.568%, 10/12/41 (a) | | | 113,689 | |
See accompanying Notes to Financial Statements.
| | |
| |
| ASTON/DoubleLine Core Plus Fixed Income Fund | | October 31, 2012 |
| |
| Schedule of Investments – continued | | |
| | | | | | | | |
Par Value | | | | | Market
Value | |
| | $ 100,000 | | | Bear Stearns Commercial Mortgage Securities
Series 2005-T18, Class AJ
5.005%, 02/13/42 (a) | | $ | 106,362 | |
| | 200,000 | | | Bear Stearns Commercial Mortgage Securities
Series 2007-PW17, Class AM
5.894%, 06/11/50 (a) | | | 224,300 | |
| | 431,338 | | | Citicorp Mortgage Securities
Series 2007-2, Class 3A1
5.500%, 02/25/37 | | | 436,863 | |
| | 50,000 | | | Citigroup Commercial Mortgage Trust
Series 2005-C3, Class AM
4.830%, 05/15/43 (a) | | | 53,666 | |
| | 1,000,000 | | | Citigroup Commercial Mortgage Trust
Series 2012-GC8, Class XA
2.268%, 09/10/45 (a) (b) (c) | | | 137,030 | |
| | 130,000 | | | Citigroup Commercial Mortgage Trust Series 2006-C5, Class AM
5.462%, 10/15/49 | | | 146,770 | |
| | 175,000 | | | Citigroup Commercial Mortgage Trust
Series 2007-C6, Class AM
5.699%, 12/10/49 (a) | | | 194,137 | |
| | 250,000 | | | Citigroup Commercial Mortgage Trust
Series 2008-C7, Class AM
6.061%, 12/10/49 (a) | | | 278,360 | |
| | 100,000 | | | Citigroup Commercial Mortgage Trust
Series 2008-C7, Class A4,
6.061%, 12/10/49 (a) | | | 121,381 | |
| | 7,240,376 | | | Citigroup/Deutsche Bank Commercial Mortgage Trust
Series 2007-CD5, Class XP
0.170%, 11/15/44 (a) (b) (c) | | | 28,209 | |
| | 60,000 | | | Citigroup/Deutsche Bank Commercial Mortgage Trust
Series 2007-CD4, Class A4
5.322%, 12/11/49 | | | 69,270 | |
| | 340,000 | | | Citigroup/Deutsche Bank Commercial Mortgage Trust
Series 2007-CD4, Class AMFX
5.366%, 12/11/49 (a) | | | 354,786 | |
| | 1,200,313 | | | Citimortgage Alternative Loan Trust
Series 2007-A4, Class 1A13
5.750%, 04/25/37 | | | 929,476 | |
| | 200,000 | | | Commercial Mortgage Pass Through Certificates
Series 2007-TFLA, Class B
0.364%, 02/15/22 (a) (c) | | | 193,591 | |
| | 150,000 | | | Commercial Mortgage Pass Through Certificates
Series 2012-FL2, Class GPI
3.714%, 09/17/29 (a) (c) (d) (e) | | | 149,588 | |
| | 300,000 | | | Commercial Mortgage Pass Through Certificates
Series 2006-C3, Class AM
5.805%, 06/15/38 (a) | | | 330,655 | |
| | 275,000 | | | Commercial Mortgage Pass Through Certificates
Series 2006-C4, Class AM
5.509%, 09/15/39 | | | 290,847 | |
| | | | | | | | |
Par Value | | | | | Market
Value | |
| | $ 175,000 | | | Commercial Mortgage Pass Through Certificates
Series 2006-C5, Class AM
5.343%, 12/15/39 | | $ | 187,933 | |
| | 2,000,000 | | | Commercial Mortgage Pass Through Certificates
Series 2012-CR3, Class XA
2.382%, 11/15/45 (a) (b) | | | 291,899 | |
| | 50,000 | | | Commercial Mortgage Pass Through Certificates
Series 2006-C7, Class AM
5.773%, 06/10/46 (a) | | | 54,397 | |
| | 182,678 | | | Commercial Mortgage Pass Through Certificates
Series 2010-C1, Class XPA
2.379%, 07/10/46 (a) (b) (c) | | | 11,042 | |
| | 1,754,531 | | | Countrywide Alternative Loan Trust
Series 2005-J8, Class 1A5
5.500%, 07/25/35 | | | 1,655,478 | |
| | 2,318,030 | | | Countrywide Alternative Loan Trust
Series 2005-86CB, Class A5
5.500%, 02/25/36 | | | 1,825,972 | |
| | 623,019 | | | Countrywide Alternative Loan Trust
Series 2006-J1, Class 2A1
7.000%, 02/25/36 | | | 307,534 | |
| | 140,906 | | | Countrywide Alternative Loan Trust
Series 2007-18CB, Class 2A17
6.000%, 08/25/37 | | | 115,724 | |
| | 535,902 | | | Countrywide Alternative Loan Trust
Series 2007-23CB, Class A3
0.711%, 09/25/37 (a) | | | 305,331 | |
| | 511,697 | | | Countrywide Alternative Loan Trust
Series 2007-23CB, Class A4
6.284%, 09/25/37 (a) (b) | | | 125,759 | |
| | 51,460 | | | Countrywide Home Loan Mortgage Pass Through Trust
Series 2005-16, Class A8
1.117%, 09/25/35 (a) | | | 51,340 | |
| | 1,247,177 | | | Countrywide Home Loan Mortgage Pass Through Trust
Series 2005-HYB8, Class 4A1
4.779%, 12/20/35 (a) | | | 928,316 | |
| | 1,198,975 | | | Countrywide Home Loan Mortgage Pass Through Trust
Series 2007-2, Class A13
6.000%, 03/25/37 | | | 1,054,390 | |
| | 278,984 | | | Countrywide Home Loan Mortgage Pass Through Trust
Series 2007-7, Class A4
5.750%, 06/25/37 | | | 258,296 | |
| | 100,000 | | | Credit Suisse First Boston Mortgage Securities
Series 1998 -C2 Class F
6.750%, 11/15/30 (a) (c) | | | 107,335 | |
| | 4,271,819 | | | Credit Suisse First Boston Mortgage Securities
Series 1997-C2, Class AX
0.159%, 01/17/35 (a) (b) | | | 6,335 | |
See accompanying Notes to Financial Statements.
| | |
| |
| ASTON/DoubleLine Core Plus Fixed Income Fund | | October 31, 2012 |
| |
| Schedule of Investments – continued | | |
| | | | | | | | |
Par Value | | | | | Market
Value | |
| | $ 174,533 | | | Credit Suisse First Boston Mortgage Securities
Series 2005-8, Class 9A4
5.500%, 09/25/35 | | $ | 165,787 | |
| | 158,362 | | | Credit Suisse Mortgage Capital Certificates
Series 2006-TF2A, Class A2
0.384%, 10/15/21 (a) (c) | | | 154,713 | |
| | 704,145 | | | Credit Suisse Mortgage Capital Certificates
Series 2006-7, Class 1A3
5.000%, 08/25/36 | | | 583,045 | |
| | 503,133 | | | Credit Suisse Mortgage Capital Certificates
Series 2009-13R, Class 2A1
6.000%, 01/26/37 (c) | | | 522,996 | |
| | 1,823,117 | | | Credit Suisse Mortgage Capital Certificates
Series 2007-1, Class 5A4
6.000%, 02/25/37 | | | 1,570,269 | |
| | 150,000 | | | Credit Suisse Mortgage Capital Certificates
Series 2010-RR2, Class 3B
5.342%, 12/15/43 (a) (c) | | | 160,857 | |
| | 250,000 | | | Credit Suisse Mortgage Capital Certificates
Series 2009-RR2, Class IQB
5.695%, 04/16/49 (a) (c) | | | 277,302 | |
| | 150,000 | | | CW Capital Cobalt Commercial Mortgage Trust
Series 2007-C2, Class AMFX
5.526%, 04/15/47 (a) | | | 162,994 | |
| | 200,000 | | | DBRR Trust
Series 2012-EZ1, Class A
0.946%, 09/25/45 (c) (d) | | | 200,213 | |
| | 250,000 | | | DBRR Trust
Series 2011-C32, Class A3B
5.750%, 06/17/49 (a) (c) | | | 279,426 | |
| | 96,396 | | | Extended Stay America Trust
Series 2010-ESHA, Class A
2.951%, 11/05/27 (c) | | | 96,848 | |
| | 275,000 | | | Fontainebleau Miami Beach Trust
Series 2001-FBLU, Class C
4.270%, 05/05/27 (c) | | | 288,729 | |
| | 100,000 | | | Fontainebleau Miami Beach Trust
Series 2012-FBLU, Class E
5.253%, 05/05/27 (c) | | | 105,695 | |
| | 100,000 | | | GE Capital Commercial Mortgage
Series 2005-C2, Class B
5.113%, 05/10/43 (a) | | | 103,930 | |
| | 50,000 | | | GMAC Commercial Mortgage Securities
Series 2006-C1, Class AM
5.290%, 11/10/45 (a) | | | 54,040 | |
| | 100,000 | | | GMAC Commercial Mortgage Securities
Series 2006-C1 Class AJ
5.349%, 11/10/45 (a) | | | 83,391 | |
| | 50,000 | | | Greenwich Capital Commercial Funding
Series 2007-GG9, Class A4
5.444%, 03/10/39 | | | 57,896 | |
| | | | | | | | |
Par Value | | | | | Market
Value | |
| | $ 250,000 | | | Greenwich Capital Commercial Funding
Series 2007-GG9, Class AMFX
5.475%, 03/10/39 | | $ | 269,398 | |
| | 250,000 | | | Greenwich Capital Commercial Funding
Series 2007-GG11, Class AM
5.867%, 12/10/49 (a) | | | 274,832 | |
| | 200,000 | | | GS Mortgage Securities Corp II
Series 2007-EOP, Class A2
1.260%, 03/06/20 (a) (c) | | | 199,967 | |
| | 100,000 | | | GS Mortgage Securities Corp II
Series 2006-GG6, Class AM
5.622%, 04/10/38 (a) | | | 110,173 | |
| | 100,000 | | | GS Mortgage Securities Corp II
Series 2004-GG2, Class A6
5.396%, 08/10/38 (a) | | | 106,900 | |
| | 75,000 | | | GS Mortgage Securities Corp II
Series 2006-GG8, Class A4
5.560%, 11/10/39 | | | 87,110 | |
| | 1,077,105 | | | GSR Mortgage Loan Trust
Series 2006-AR1, Class 3A1
4.786%, 01/25/36 (a) | | | 978,086 | |
| | 182,959 | | | HSBC Asset Loan Obligation
Series 2007-2, Class 1A1
5.500%, 09/25/37 | | | 183,471 | |
| | 40,000 | | | JPMorgan Chase Commercial Mortgage
Securities
Series 2006-CB16, Class A4
5.552%, 05/12/45 | | | 46,274 | |
| | 2,579,337 | | | JPMorgan Chase Commercial Mortgage
Securities
Series 2006-LDP8, Class X
0.542%, 05/15/45 (a) (b) | | | 42,560 | |
| | 995,143 | | | JPMorgan Chase Commercial Mortgage
Securities
Series 2012-CBX, Class XA
2.058%, 06/15/45 (a) (b) | | | 117,698 | |
| | 2,500,000 | | | JPMorgan Chase Commercial Mortgage Securities
Series 2012-C8, Class XA
2.380%, 10/15/45 (a) (b) | | | 340,874 | |
| | 1,276,481 | | | JPMorgan Chase Commercial Mortgage Securities
Series 2011-C4, Class XA
1.598%, 07/15/46 (a) (b) (c) | | | 90,655 | |
| | 350,000 | | | JPMorgan Chase Commercial Mortgage Securities
Series 2007-CB17 Class AM
5.728%, 02/12/49 (a) | | | 370,319 | |
| | 175,000 | | | JPMorgan Chase Commercial Mortgage Securities
Series 2009-RR2, Class GEB
5.543%, 12/17/49 (c) (d) | | | 189,333 | |
| | 50,000 | | | JPMorgan Chase Commercial Mortgage Securities
Series 2007-CB20, Class A4
5.794%, 02/12/51 (a) | | | 59,947 | |
See accompanying Notes to Financial Statements.
| | |
| |
| ASTON/DoubleLine Core Plus Fixed Income Fund | | October 31, 2012 |
| |
| Schedule of Investments – continued | | |
| | | | | | | | |
Par Value | | | | | Market
Value | |
| | $ 250,000 | | | JPMorgan Chase Commercial Mortgage Securities
Series 2007-CB20, Class AM
5.882%, 02/12/51 (a) | | $ | 287,708 | |
| | 50,000 | | | JPMorgan Chase Commercial Mortgage Securities
Series 2007-C1, Class A4
5.716%, 02/15/51 | | | 59,668 | |
| | 98,157 | | | JPMorgan Chase Commercial Mortgage Securities
Series 2007-C1, Class ASB
5.857%, 02/15/51 | | | 106,780 | |
| | 250,000 | | | JPMorgan Chase Commercial Mortgage Securities
Series 2007-LD12, Class AM
6.043%, 02/15/51 (a) | | | 272,269 | |
| | 250,000 | | | LB Commercial Mortgage Trust
Series 2007-C3, Class AMFL
5.889%, 07/15/44 (a) (c) | | | 277,328 | |
| | 70,202 | | | LB-UBS Commercial Mortgage Trust
Series 2004-C1, Class A3
4.361%, 01/15/29 | | | 71,228 | |
| | 100,000 | | | LB-UBS Commercial Mortgage Trust
Series 2003-C7, Class D
5.038%, 07/15/37 (a) | | | 103,355 | |
| | 100,000 | | | LB-UBS Commercial Mortgage Trust
Series 2006-C7 Class AJ
5.407%, 11/15/38 | | | 69,547 | |
| | 350,000 | | | LB-UBS Commercial Mortgage Trust
Series 2006-C6, Class AM
5.413%, 09/15/39 | | | 398,913 | |
| | 50,000 | | | LB-UBS Commercial Mortgage Trust
Series 2005-C3, Class AM
4.794%, 07/15/40 | | | 54,090 | |
| | 7,236,910 | | | LB-UBS Commercial Mortgage Trust
Series 2007-C7, Class XCL
0.082%, 09/15/45 (a) (b) (c) | | | 67,636 | |
| | 250,000 | | | Merrill Lynch Mortgage Trust
Series 2005-CIP1, Class AM
5.107%, 07/12/38 (a) | | | 274,760 | |
| | 50,000 | | | Merrill Lynch Mortgage Trust
Series 2006-C1, Class AM
5.685%, 05/12/39 (a) | | | 56,037 | |
| | 997,111 | | | Morgan Stanley Bank of America Merrill Lynch Trust
Series 2012-C5, Class XA
1.941%, 08/15/45 (a) (b) (c) | | | 114,318 | |
| | 250,000 | | | Morgan Stanley Capital I
Series 2007-IQ13, Class AM
5.406%, 03/15/44 | | | 266,269 | |
| | 31,464 | | | Morgan Stanley Capital I
Series 2006-HQ9, Class AAB
5.685%, 07/12/44 | | | 32,191 | |
| | 50,000 | | | Morgan Stanley Capital I
Series 2006-HQ9, Class AM
5.773%, 07/12/44 (a) | | | 56,314 | |
| | 1,467,549 | | | Morgan Stanley Capital I
Series 2011-C1, Class XA
0.969%, 09/15/47 (a) (b) (c) | | | 50,554 | |
| | | | | | | | |
Par Value | | | | | Market
Value | |
| | $7,244,413 | | | Morgan Stanley Capital I
Series 2007-1Q16, Class X2
0.224%, 12/12/49 (a) (b) (c) | | $ | 48,820 | |
| | 250,000 | | | Morgan Stanley Capital I
Series 2007-IQ16, Class AM
6.102%, 12/12/49 (a) | | | 289,444 | |
| | 1,390,842 | | | Morgan Stanley Mortgage Loan Trust
Series 2005-3AR, Class 2A2
2.745%, 07/25/35 (a) | | | 1,151,099 | |
| | 200,000 | | | Morgan Stanley Re-REMIC Trust
Series 2010-HQ4, Class AJ
4.970%, 04/15/40 (c) | | | 210,201 | |
| | 100,000 | | | Morgan Stanley Re-REMIC Trust
Series 2010-GG10, Class A4A
5.789%, 08/15/45 (a) (c) | | | 118,408 | |
| | 300,000 | | | Nomura Asset Acceptance
Series 2005-AP3, Class A3
5.318%, 08/25/35 (a) | | | 212,656 | |
| | 792,487 | | | Prime Mortgage Trust
Series 2006-DR1, Class 2A1
5.500%, 05/25/35 (c) | | | 775,259 | |
| | 298,461 | | | Residential Asset Securitization Trust
Series 2006-A6, Class 1A1
6.500%, 07/25/36 | | | 198,292 | |
| | 783,535 | | | Residential Asset Securitization Trust
Series 2007-A1, Class A8
6.000%, 03/25/37 | | | 594,708 | |
| | 7,286 | | | Rialto Real Estate Fund LP
Series 2012-LT1A, Class A
4.750%, 02/15/25 (c) | | | 7,290 | |
| | 554,535 | | | Structured Adjustable Rate Mortgage Loan Trust
Series 2006-1, Class 2A2
4.515%, 02/25/36 (a) | | | 445,395 | |
| | 233,790 | | | Structured Asset Securities
Series 2005-10, Class 1A1
5.750%, 06/25/35 | | | 234,954 | |
| | 100,000 | | | TIAA Seasoned Commercial Mortgage Trust
Series 2007-C4 Class AJ
5.585%, 08/15/39 (a) | | | 109,268 | |
| | 2,000,000 | | | UBS-Barclays Commercial Mortgage Trust
Series 2012-C3, Class XA
2.210%, 08/10/49 (a) (b) (c) | | | 286,634 | |
| | 25,000 | | | Wachovia Bank Commercial Mortgage Trust
Series 2005-C22, Class AM 5.344%, 12/15/44 (a) | | | 27,365 | |
| | 200,000 | | | Wachovia Bank Commercial Mortgage Trust
Series 2006-C23, Class AM 5.466%, 01/15/45 (a) | | | 223,020 | |
| | 250,000 | | | Wachovia Bank Commercial Mortgage Trust
Series 2007-C33, Class AM 5.923%, 02/15/51 (a) | | | 277,797 | |
See accompanying Notes to Financial Statements.
| | |
| |
| ASTON/DoubleLine Core Plus Fixed Income Fund | | October 31, 2012 |
| |
| Schedule of Investments – continued | | |
| | | | | | | | |
Par Value | | | | | Market
Value | |
| | $1,021,059 | | | Wachovia Mortgage Loan Trust
Series 2005-A, Class 2A1
2.628%, 08/20/35 (a) | | $ | 920,713 | |
| | 554,739 | | | Wells Fargo Alternative Loan Trust
Series 2007-PA2, Class 1A1
6.000%, 06/25/37 | | | 497,788 | |
| | 1,246,749 | | | Wells Fargo Mortgage Backed Securities Trust
Series 2006-AR2, Class 2A5
2.629%, 03/25/36 (a) | | | 1,167,886 | |
| | 918,275 | | | Wells Fargo Mortgage Backed Securities Trust
Series 2007-8, Class 1A16
6.000%, 07/25/37 | | | 902,483 | |
| | 875,790 | | | Wells Fargo Mortgage Backed Securities Trust
Series 2007-8, Class 2A2
6.000%, 07/25/37 | | | 867,656 | |
| | 827,782 | | | Wells Fargo Mortgage Backed Securities Trust
Series 2007-13, Class A6
6.000%, 09/25/37 | | | 825,736 | |
| | 407,262 | | | Wells Fargo Mortgage Loan Trust
Series 2012-RR1 Class A1
2.847%, 08/27/37 (a) (c) | | | 411,358 | |
| | 998,970 | | | WF-RBS Commercial Mortgage Trust Series 2012-C8, Class XA
2.259%, 08/15/45 (a) (b) (c) | | | 138,225 | |
| | 1,500,000 | | | WF-RBS Commercial Mortgage Trust Series 2012-C9, Class XA
2.451%, 11/15/45 (a) (b) (c) (d) | | | 218,907 | |
| | | | | | | | |
| | |
| | | | Total Collateralized Mortgage-Backed Securities
(Cost $37,224,507) | | | 39,301,483 | |
| | | | | | | | |
| |
| | ASSET-BACKED SECURITIES – 0.96% | | | | |
| | |
| | 100,000 | | | Credit-Based Asset Servicing and Securitization
Series 2007-MX1, Class A4
6.231%, 12/25/36 (c) (f) | | | 68,791 | |
| | 61,261 | | | Crest
Series 2003-2A, Class A1
0.842%, 12/28/18 (a) (c) (d) | | | 58,198 | |
| | 757,000 | | | GSAA Trust
Series 2006-15, Class AF3B
5.933%, 09/25/36 (a) | | | 153,511 | |
| | 472,916 | | | Residential Asset Mortgage Products
Series 2006-RS5, Class A3
0.381%, 09/25/36 (a) | | | 378,663 | |
| | 500,000 | | | Residential Asset Securities
Series 2004-KS6, Class A15
5.850%, 07/25/34 (a) | | | 430,021 | |
| | 640,584 | | | Series 2005-KS4, Class M1
0.621%, 05/25/35 (a) | | | 616,356 | |
| | | | | | | | |
| | |
| | | | Total Asset-Backed Securities
(Cost $1,658,302) | | | 1,705,540 | |
| | | | | | | | |
| | | | | | | | |
Par Value | | | | | Market
Value | |
|
| | FOREIGN GOVERNMENT BONDS – 2.69% | |
| | |
| | $ 300,000 | | | Banco Latinoamericano de Comercio Exterior Senior Unsecured Notes
3.750%, 04/04/17 (c) | | $ | 311,250 | |
| | 600,000 | | | Corp Andina de Fomento
Senior Unsecured Notes
3.750%, 01/15/16 | | | 632,963 | |
| | 600,000 | | | Costa Rica Government International Bond Senior Unsecured Notes
6.548%, 03/20/14 | | | 633,000 | |
| | 526,000 | | | Mexico Government International Bond
Senior Unsecured Notes
5.625%, 01/15/17 | | | 617,524 | |
| | 200,000 | | | Panama Government International Bond Senior Unsecured Notes
7.250%, 03/15/15 | | | 228,500 | |
| | 400,000 | | | Qatar Government International Bond
4.500%, 01/20/22 | | | 460,000 | |
| | 300,000 | | | Qatar Government International Bond Senior Unsecured Notes
4.000%, 01/20/15 | | | 319,050 | |
| | 199,375 | | | Ras Laffan Liquefied Natural Gas II
Senior Secured Notes
5.298%, 09/30/20 | | | 225,792 | |
| | 250,000 | | | Ras Laffan Liquefied Natural Gas III
5.838%, 09/30/27 | | | 305,000 | |
| | 161,600 | | | Ras Laffan Liquefied Natural Gas III
Senior Secured Notes
5.832%, 09/30/16 | | | 178,730 | |
| | 250,000 | | | Wakala Global Sukuk
2.991%, 07/06/16 | | | 261,590 | |
| | 500,000 | | | Wakala Global Sukuk
4.646%, 07/06/21 | | | 575,603 | |
| | | | | | | | |
| | |
| | | | Total Foreign Government Bonds
(Cost $4,576,003) | | | 4,749,002 | |
| | | | | | | | |
Shares | | | | | | |
|
| | INVESTMENT COMPANY – 2.25% | |
| | |
| | 3,970,786 | | | BlackRock Liquidity Funds TempCash Portfolio (g) | | | 3,970,786 | |
| | | | | | | | |
| | |
| | | | Total Investment Company
(Cost $3,970,786) | | | 3,970,786 | |
| | | | | | | | |
| Total Investments – 98.90%
(Cost $169,804,168)* | | | 174,931,710 | |
| | | | | | | | |
| Net Other Assets and Liabilities – 1.10% | | | 1,949,868 | |
| | | | | | | | |
| Net Assets – 100.00% | | $ | 176,881,578 | |
| | | | | | | | |
See accompanying Notes to Financial Statements.
| | |
| |
| ASTON/DoubleLine Core Plus Fixed Income Fund | | October 31, 2012 |
| |
| Schedule of Investments – continued | | |
| * | | Aggregate cost for Federal income tax purposes is $170,217,622. |
| | | | |
Gross unrealized appreciation | | $ | 5,963,093 | |
Gross unrealized depreciation | | | (1,249,005 | ) |
| | | | |
Net unrealized appreciation | | $ | 4,714,088 | |
| | | | |
| (a) | | Variable rate bond. The interest rate shown reflects the rate in effect at October 31, 2012. |
| (b) | | Interest only security. This type of security represents the right to receive the monthly interest payments on an underlying pool of mortgages. Payments of principal on the pool reduce the value of the “interest only” holding. |
| (c) | | Securities exempt from registration under Rule 144A of the Securities Act of 1933, as amended. These securities are purchased in accordance with guidelines approved by the Fund’s Board of Trustees and may only be resold, in transactions exempt from registration, to qualified institutional buyers. At October 31, 2012, these securities amounted to $16,716,963 or 9.45% of net assets. These securities have been determined by the Subadviser to be liquid securities. |
| (d) | | Securities with a total aggregate market value of $3,204,550 or 1.81% of net assets, were valued under the fair value procedures established by the Funds’ Board of Trustees. |
| (e) | | Delayed delivery security. See Note (B-3) in the Notes to Financial Statements. |
| (f) | | Step Coupon. Security becomes interest bearing at a future date. |
| (g) | | Security with a market value of $1,036,719 has been pledged as collateral for delayed delivery securities. |
| REIT | | Real Estate Investment Trust |
| REMIC | | Real Estate Mortgage Investment Conduit |
| STRIP | | Separate Trading of Registered Interest and Principal |
| | | | |
Portfolio Composition | | | | |
U.S. Government Obligations | | | 18% | |
U.S. Government Agency Obligations | | | 20% | |
Corporate Notes and Bonds | | | | |
(S&P Ratings unaudited) | | | | |
AAA | | | 5% | |
AA | | | 6% | |
A | | | 13% | |
BBB | | | 20% | |
BB | | | 1% | |
B | | | 3% | |
Lower than B | | | 11% | |
Not Rated | | | 3% | |
| | | | |
| | | 100% | |
| | | | |
See accompanying Notes to Financial Statements.
ASTON/TCH Fixed Income Fund
| | |
| |
| Portfolio Manager Commentary (unaudited) | | October 31, 2012 |
| Tere Alvarez Canida, CFA; Alan M. Habacht & William J. Canida, CFA |
| Q. | What were the most significant market factors affecting Fund performance and returns relative to the benchmark during the past 12 months? |
| A. | During the fiscal year ended October 31, 2012, sector, quality and yield curve selection benefitted the portfolio. The Fund is overweight credit securities, which outperformed duration matched Treasuries by 525 basis points. In addition, the portfolio is underweight Treasury securities, which by contrast were the worst performing sector during the year. Moreover, the majority of the Fund’s Treasury exposure is in the form of Treasury Inflation-Protected Securities (TIPS), which outperformed nominals during the year, returning 8.03% compared to 3.66% for nominal Treasuries. |
Our decision to overweight lower quality investment grade securities also benefitted the Fund, as lower quality investment grade securities outperformed during the year. BBB rated securities generated 669 basis points of excess return, outperforming AAA, AA and A rated securities by 578, 383 and 109 basis points, respectively, on a duration-adjusted basis.
Portfolio structure also had a positive effect on the Fund’s return. The portfolio is structured in a barbelled fashion emphasizing high quality floating rate notes on the short end of the yield curve and lower quality investment grade securities on the long end. During the year, longer duration credit securities outperformed as credit curves flattened. In the trailing twelve months, long credit outperformed intermediate credit by 708 basis points. Looking closer at structure, long BBB rated securities outperformed intermediate AAA securities by 1333 basis points.
| Q. | What were the best performing holdings for the Fund during the period? |
| A. | The best performing holdings within the Fund were longer-dated, lower quality, investment grade credit securities. In addition, our exposure to TIPS benefitted the Fund as TIPS outperformed nominal Treasuries by 437 basis points during the year. |
| Q. | What were the weakest performing holdings? |
| A. | Our exposure to floating rate notes underperformed in the declining interest rate environment. Despite their underperformance, floating rate notes provide a hedge against rising inflation risk overtime. |
| Q. | How was the Fund positioned as of October 31, 2012? |
| A. | We still favor a barbell portfolio structure in order to capture the steepness of the U.S. Treasury curve. At the same time, supply and demand factors for investment grade credit appear favorable, in our view, particularly given the amount of additional spread earned over U.S. Treasury securities remains generous by historical standards. TIPS also remain an attractive asset class which aligns investors with Federal Reserve purchase programs and provide a hedge against rising inflation expectations. |
Note: Bond funds have the same interest rate, high yield and credit risks associated with the underlying bonds in the portfolio, all of which could reduce the Fund’s value. As interest rates rise, the value of the Fund can decline and an investor can lose principal.
Growth of a Hypothetical
$10,000 Investment—Class N
All dividends and capital gains are reinvested. Indexes are unmanaged and do not take into account fees, expenses or other costs.
Returns shown in the chart and table do not reflect taxes that a shareholder would pay on Fund distributions or on the sale of the Fund shares.
RETURNSFOR PERIOD ENDED 10/31/12
Average Annual Total Returns - Class N
| | | | |
One Year | | | 9.74 | % |
Five Year | | | 7.86 | % |
Ten Year | | | 6.07 | % |
Since Inception | | | 6.21 | % |
Inception Date 12/13/93
Average Annual Total Returns - Class I
| | | | |
One Year | | | 9.93 | % |
Five Year | | | 8.06 | % |
Ten Year | | | 6.30 | % |
Since Inception | | | 6.68 | % |
Inception Date 07/31/00
The performance data quoted represents past performance. Past performance does not guarantee future results. Investment return and principal value will fluctuate so that an investor’s shares, upon redemption, may be worth more or less than their original cost. Current performance may be lower or higher than the performance data quoted. For performance data current to the most recent month-end, please visit our website at www.astonfunds.com.
The total expense ratio for the Class N and Class I Shares is 1.15% and 0.90%, respectively, as disclosed in the prospectus dated March 1, 2012. Please refer to the Financial Highlights section in this report for more 2012 fiscal year-end related information.
The performance quoted would have been lower if fee waivers and/or expense reimbursements had not been in effect.
| | |
| |
| ASTON/TCH Fixed Income Fund | | October 31, 2012 |
| |
| Schedule of Investments | | |
| | | | | | | | |
Par Value | | | | | Market
Value | |
|
| | CORPORATE NOTES AND BONDS – 64.64% | |
| | |
| | | | Consumer Discretionary – 3.92% | | | | |
| | $1,000,000 | | | Limited Brands
Senior Unsecured Notes
7.600%, 07/15/37 | | $ | 1,036,249 | |
| | 100,000 | | | Macy’s Retail Holdings
7.875%, 07/15/15 (a) | | | 117,678 | |
| | 500,000 | | | QVC
5.125%, 07/02/22 (b) | | | 523,313 | |
| | 250,000 | | | Staples
9.750%, 01/15/14 | | | 274,695 | |
| | 450,000 | | | Whirlpool, MTN
Unsecured Notes
8.600%, 05/01/14 | | | 498,922 | |
| | 250,000 | | | Wyndham Worldwide
Senior Unsecured Notes
7.375%, 03/01/20 | | | 300,039 | |
| | | | | | | | |
| | | | | | | 2,750,896 | |
| | | | | | | | |
| | |
| | | | Consumer Staples – 4.14% | | | | |
| | | | Altria Group | | | | |
| | 500,000 | | | 8.500%, 11/10/13 | | | 539,011 | |
| | 200,000 | | | 10.200%, 02/06/39 | | | 351,665 | |
| | 250,000 | | | Corn Products International
Senior Unsecured Notes
6.625%, 04/15/37 | | | 314,092 | |
| | 200,000 | | | Kellogg
Senior Unsecured Notes
5.125%, 12/03/12 | | | 200,740 | |
| | 150,000 | | | PepsiCo
Senior Unsecured Notes
7.900%, 11/01/18 | | | 204,697 | |
| | 500,000 | | | Ralcorp Holdings
6.625%, 08/15/39 | | | 539,433 | |
| | 200,000 | | | Reynolds American
7.750%, 06/01/18 | | | 252,286 | |
| | | | | | | | |
Par Value | | | | | Market
Value | |
| | |
| | | | Consumer Staples (continued) | | | | |
| | $ 500,000 | | | Walgreen
Senior Unsecured Notes
0.899%, 03/13/14 (c) | | $ | 501,564 | |
| | | | | | | | |
| | | | | | | 2,903,488 | |
| | | | | | | | |
| | |
| | | | Energy – 9.97% | | | | |
| | | | Chesapeake Energy
| | | | |
| | 500,000 | | | 6.775%, 03/15/19 | | | 501,874 | |
| | 250,000 | | | 6.625%, 08/15/20 | | | 263,750 | |
| | 250,000 | | | 6.125%, 02/15/21 | | | 254,375 | |
| | 500,000 | | | Dolphin Energy (United Arab Emirates)
5.500%, 12/15/21 (b) | | | 580,500 | |
| | 500,000 | | | Ecopetrol SA (Colombia)
Senior Unsecured Notes
7.625%, 07/23/19 | | | 650,000 | |
| | 250,000 | | | El Paso Pipeline Partners Operating
7.500%, 11/15/40 | | | 347,226 | |
| | 250,000 | | | Energy Transfer Partners
Senior Unsecured Notes
9.000%, 04/15/19 | | | 328,656 | |
| | 400,000 | | | Hess
Senior Unsecured Notes
8.125%, 02/15/19 | | | 533,439 | |
| | 400,000 | | | Kinder Morgan Energy Partners
Senior Unsecured Notes
9.000%, 02/01/19 | | | 541,770 | |
| | 250,000 | | | Markwest Energy Partners LP/Markwest Energy Finance
5.500%, 02/15/23 | | | 263,750 | |
| | 450,000 | | | Nabors Industries
9.250%, 01/15/19 | | | 604,159 | |
| | 250,000 | | | Pride International
Senior Unsecured Notes
6.875%, 08/15/20 | | | 321,694 | |
| | 750,000 | | | Rockies Express Pipeline
Senior Unsecured Notes
6.875%, 04/15/40 (b) | | | 656,250 | |
| | 250,000 | | | Rowan
Senior Unsecured Notes
5.000%, 09/01/17 | | | 274,296 | |
| | 250,000 | | | Valero Energy
9.375%, 03/15/19 | | | 343,872 | |
| | 400,000 | | | Weatherford International (Bermuda)
9.625%, 03/01/19 | | | 530,270 | |
| | | | | | | | |
| | | | | | | 6,995,881 | |
| | | | | | | | |
| | |
| | | | Financials – 22.04% | | | | |
| | 250,000 | | | AFLAC
Senior Unsecured Notes
8.500%, 05/15/19 | | | 339,950 | |
| | 450,000 | | | American Financial Group
Senior Unsecured Notes
9.875%, 06/15/19 | | | 589,573 | |
| | 250,000 | | | Banco Bradesco SA/Cayman Islands (Brazil)
Subordinated Notes
5.750%, 03/01/22 (b) | | | 270,625 | |
See accompanying Notes to Financial Statements.
| | |
| |
| ASTON/TCH Fixed Income Fund | | October 31, 2012 |
| |
| Schedule of Investments – continued | | |
| | | | | | | | |
Par Value | | | | | Market
Value | |
| | |
| | | | Financials (continued) | | | | |
| | | | Bancolombia SA (Colombia)
Senior Unsecured Notes | | | | |
| | $ 250,000 | | | 5.950%, 06/03/21 | | $ | 290,000 | |
| | | | Subordinated Notes | | | | |
| | 250,000 | | | 5.125%, 09/11/22 | | | 262,500 | |
| | 250,000 | | | Berkshire Hathaway Finance
Senior Unsecured Notes
0.868%, 02/11/13 (c) | | | 250,412 | |
| | 150,000 | | | Blackstone Holdings Finance
6.625%, 08/15/19 (b) (d) | | | 175,364 | |
| | 500,000 | | | 6.250%, 08/15/42 (b) | | | 548,558 | |
| | 250,000 | | | Bunge Ltd Finance
8.500%, 06/15/19 | | | 322,798 | |
| | 500,000 | | | Daimler Finance
1.130%, 04/10/14 (b) (c) | | | 501,944 | |
| | 250,000 | | | Discover Bank
Subordinated Notes
7.000%, 04/15/20 | | | 306,663 | |
| | 500,000 | | | Entertainment Properties Trust
5.750%, 08/15/22 | | | 524,531 | |
| | 1,000,000 | | | General Electric Capital, MTN
Senior Unsecured Notes
1.016%, 04/24/14 (c) | | | 1,008,189 | |
| | 800,000 | | | Goldman Sachs Capital I
6.345%, 02/15/34 | | | 825,317 | |
| | 250,000 | | | Goldman Sachs Group
Subordinated Notes
6.750%, 10/01/37 | | | 275,548 | |
| | 500,000 | | | ING US
5.500%, 07/15/22 (b) | | | 544,103 | |
| | | | IPIC, GMTN (Cayman Islands) | | | | |
| | 500,000 | | | 5.000%, 11/15/20 (b) | | | 558,750 | |
| | 500,000 | | | 6.875%, 11/01/41 (b) | | | 686,875 | |
| | 250,000 | | | Itau Unibanco Holding SA (Brazil)
5.500%, 08/06/22 (b) | | | 263,750 | |
| | 200,000 | | | Jefferies Group
Senior Unsecured Notes
8.500%, 07/15/19 | | | 235,000 | |
| | | | Lincoln National
Senior Unsecured Notes | | | | |
| | 250,000 | | | 6.300%, 10/09/37 | | | 294,932 | |
| | 750,000 | | | 7.000%, 06/15/40 | | | 969,569 | |
| | 300,000 | | | Marsh & McLennan
Senior Unsecured Notes
9.250%, 04/15/19 | | | 410,324 | |
| | 750,000 | | | Merrill Lynch, MTN
6.875%, 04/25/18 | | | 906,215 | |
| | 500,000 | | | Morgan Stanley
Senior Unsecured Notes
5.500%, 07/28/21 | | | 556,219 | |
| | 250,000 | | | NASDAQ OMX Group
Senior Unsecured Notes
5.550%, 01/15/20 | | | 272,811 | |
| | 1,000,000 | | | NB Capital Trust II
7.830%, 12/15/26 | | | 1,023,330 | |
| | 250,000 | | | Royal Bank of Canada (Canada)
Senior Unsecured Notes
1.013%, 10/30/14 (c) | | | 252,593 | |
| | | | | | | | |
Par Value | | | | | Market
Value | |
| | |
| | | | Financials (continued) | | | | |
| | $1,000,000 | | | SLM, MTN
Senior Unsecured Notes
5.625%, 08/01/33 | | $ | 940,000 | |
| | 500,000 | | | Unum Group
Senior Unsecured Notes
5.750%, 08/15/42 | | | 551,350 | |
| | 500,000 | | | Wells Fargo
1.287%, 06/26/15 (c) | | | 505,925 | |
| | | | | | | | |
| | | | | | | 15,463,718 | |
| | | | | | | | |
| | |
| | | | Healthcare – 3.23% | | | | |
| | | | Davita | | | | |
| | 125,000 | | | 6.375%, 11/01/18 | | | 133,750 | |
| | 375,000 | | | 6.625%, 11/01/20 | | | 402,187 | |
| | 200,000 | | | Hospira, GMTN
Senior Unsecured Notes
6.400%, 05/15/15 | | | 223,911 | |
| | 250,000 | | | Humana
Senior Unsecured Notes
8.150%, 06/15/38 | | | 345,779 | |
| | 500,000 | | | Lorillard Tobacco
8.125%, 05/01/40 | | | 687,898 | |
| | 200,000 | | | Quest Diagnostics
1.223%, 03/24/14 (c) | | | 201,447 | |
| | 250,000 | | | Watson Pharmaceuticals
Senior Unsecured Notes
4.625%, 10/01/42 | | | 268,854 | |
| | | | | | | | |
| | | | | | | 2,263,826 | |
| | | | | | | | |
| | |
| | | | Industrials – 4.18% | | | | |
| | 370,000 | | | Burlington Northern Santa Fe
Senior Unsecured Notes
7.000%, 02/01/14 | | | 399,083 | |
| | 250,000 | | | FedEx
Senior Notes
8.000%, 01/15/19 | | | 332,280 | |
| | 250,000 | | | Kazakhstan Temir Zholy Finance (Netherlands)
6.950%, 07/10/42 (b) | | | 305,760 | |
| | 500,000 | | | Mexichem SAB de CV (Mexico)
Senior Unsecured Notes
6.750%, 09/19/42 (b) | | | 541,250 | |
| | 175,000 | | | Mondelez International
Senior Unsecured Notes
6.000%, 02/11/13 | | | 177,488 | |
| | 250,000 | | | Transocean (Cayman Islands)
7.350%, 12/15/41 | | | 334,955 | |
| | 250,000 | | | Vale SA (Brazil)
Senior Unsecured Notes
5.625%, 09/11/42 | | | 268,359 | |
| | 250,000 | | | Waste Management
7.375%, 03/11/19 | | | 319,062 | |
| | 250,000 | | | Xstrata Finance Canada (Canada)
4.000%, 10/25/22 (b) | | | 251,368 | |
| | | | | | | | |
| | | | | | | 2,929,605 | |
| | | | | | | | |
See accompanying Notes to Financial Statements.
| | |
| |
| ASTON/TCH Fixed Income Fund | | October 31, 2012 |
| |
| Schedule of Investments – continued | | |
| | | | | | | | |
Par Value | | | | | Market
Value | |
| | |
| | | | Information Technology – 2.65% | | $ | | |
| | $ 500,000 | | | International Business Machines
Senior Unsecured Notes
6.500%, 10/15/13 | | | 529,519 | |
| | 250,000 | | | KLA Instruments
Senior Unsecured Notes
6.900%, 05/01/18 | | | 301,546 | |
| | 200,000 | | | Motorola
Senior Unsecured Notes
6.625%, 11/15/37 | | | 235,655 | |
| | 500,000 | | | Telecom Italia Capital SA (Luxembourg)
7.721%, 06/04/38 | | | 540,585 | |
| | 250,000 | | | Xerox
Senior Unsecured Notes
1.799%, 09/13/13 (c) | | | 252,014 | |
| | | | | | | | |
| | | | | | | 1,859,319 | |
| | | | | | | | |
| | |
| | | | Materials – 4.55% | | | | |
| | | | ArcelorMittal (Luxembourg)
Senior Unsecured Notes | | | | |
| | 750,000 | | | 5.750%, 03/01/21 | | | 724,774 | |
| | 650,000 | | | 7.250%, 10/15/39 | | | 603,988 | |
| | 200,000 | | | Bemis
Senior Unsecured Notes
6.800%, 08/01/19 | | | 244,367 | |
| | 250,000 | | | Braskem America Finance
7.125%, 07/22/41 (b) | | | 282,500 | |
| | 250,000 | | | Dow Chemical (The)
Senior Unsecured Notes
8.550%, 05/15/19 | | | 339,260 | |
| | 250,000 | | | International Paper
Senior Unsecured Notes
8.700%, 06/15/38 | | | 383,891 | |
| | 550,000 | | | Rio Tinto Finance (Australia)
8.950%, 05/01/14 | | | 616,562 | |
| | | | | | | | |
| | | | | | | 3,195,342 | |
| | | | | | | | |
| | |
| | | | Telecommunication Services – 6.47% | | | | |
| | 500,000 | | | British Telecommunications
(United Kingdom)
Senior Unsecured Notes
1.504%, 12/20/13 (c) | | | 503,461 | |
| | 250,000 | | | CBS
8.875%, 05/15/19 | | | 344,295 | |
| | | | CenturyLink | | | | |
| | | | Senior Unsecured Notes | | | | |
| | 500,000 | | | 7.600%, 09/15/39 | | | 512,887 | |
| | 500,000 | | | 7.650%, 03/15/42 | | | 511,967 | |
| | 400,000 | | | Expedia
5.950%, 08/15/20 | | | 442,013 | |
| | 350,000 | | | Frontier Communications
Senior Unsecured Notes
9.000%, 08/15/31 | | | 375,375 | |
| | 250,000 | | | Telefonica Emisiones SAU (Spain)
5.877%, 07/15/19 | | | 263,125 | |
| | 500,000 | | | Telefonica Europe BV (Netherlands)
8.250%, 09/15/30 | | | 563,750 | |
| | 450,000 | | | Time Warner Cable
8.250%, 02/14/14 | | | 492,373 | |
| | | | | | | | |
Par Value | | | | | Market
Value | |
| | |
| | | | Telecommunication Services (continued) | | | | |
| | $ 500,000 | | | Windstream
7.500%, 06/01/22 | | $ | 532,500 | |
| | | | | | | | |
| | | | | | | 4,541,746 | |
| | | | | | | | |
| | |
| | | | Utilities – 3.49% | | | | |
| | 200,000 | | | Allegheny Energy Supply
Senior Unsecured Notes
6.750%, 10/15/39 (b) | | | 222,005 | |
| | 500,000 | | | Dubai Electricity & Water Authority
(United Arab Emirates)
Senior Unsecured Notes
8.500%, 04/22/15 (b) | | | 569,375 | |
| | 450,000 | | | FPL Group Capital
7.875%, 12/15/15 | | | 542,094 | |
| | 150,000 | | | Pacific Gas & Electric
Senior Unsecured Notes
8.250%, 10/15/18 | | | 205,335 | |
| | 250,000 | | | Puget Energy
5.625%, 07/15/22 (b) | | | 272,721 | |
| | 450,000 | | | Sempra Energy
Senior Unsecured Notes
9.800%, 02/15/19 | | | 639,633 | |
| | | | | | | | |
| | | | | | | 2,451,163 | |
| | | | | | | | |
| | |
| | | | Total Corporate Notes and Bonds
(Cost $39,927,976) | | | 45,354,984 | |
| | | | | | | | |
|
| | U.S. GOVERNMENT AND AGENCY OBLIGATIONS – 27.98% | |
| | |
| | | | Fannie Mae – 6.72% | | | | |
| | 299,868 | | | 6.000%, 11/01/17,
Pool # 662854 | | | 322,981 | |
| | 118,306 | | | 6.000%, 04/01/18,
Pool # 725175 | | | 125,959 | |
| | 261,053 | | | 5.500%, 11/01/18,
Pool # 748886 | | | 284,195 | |
| | 112,955 | | | 4.500%, 06/01/19,
Pool # 747860 | | | 123,504 | |
| | 528,275 | | | 6.000%, 01/01/21,
Pool # 850787 | | | 577,755 | |
| | 213,895 | | | 6.000%, 09/01/32,
Pool # 847899 | | | 242,467 | |
| | 124,856 | | | 6.000%, 02/01/34,
Pool # 771952 | | | 141,846 | |
| | 107,734 | | | 7.500%, 02/01/35,
Pool # 787557 | | | 132,684 | |
| | 32,620 | | | 7.500%, 04/01/35,
Pool # 819231 | | | 38,473 | |
| | 196,554 | | | 6.000%, 11/01/35,
Pool # 844078 | | | 219,769 | |
| | 246,533 | | | 5.000%, 05/01/36,
Pool # 745581 | | | 269,600 | |
| | 164,198 | | | 6.000%, 12/01/36,
Pool # 888029 | | | 182,437 | |
| | 219,178 | | | 5.500%, 06/01/37,
Pool # 918778 | | | 240,365 | |
| | 207,645 | | | 6.500%, 10/01/37,
Pool # 888890 | | | 235,799 | |
See accompanying Notes to Financial Statements.
| | |
| |
| ASTON/TCH Fixed Income Fund | | October 31, 2012 |
| |
| Schedule of Investments – continued | | |
| | | | | | | | |
Par Value | | | | | Market
Value | |
| | |
| | | | Fannie Mae (continued) | | | | |
| | $ 699,402 | | | 5.500%, 03/01/38,
Pool # 962344 | | $ | 767,009 | |
| | 383,176 | | | 4.000%, 02/01/41,
Pool # AE0949 | | | 410,974 | |
| | 374,845 | | | 4.000%, 02/01/41,
Pool # AH5695 | | | 402,039 | |
| | | | | | | | |
| | | | | | | 4,717,856 | |
| | | | | | | | |
| | |
| | | | Freddie Mac – 6.70% | | | | |
| | 528,003 | | | 5.500%, 11/01/20,
Gold Pool # G18083 | | | 575,717 | |
| | 102,864 | | | 5.500%, 12/01/20,
Gold Pool # G11820 | | | 112,160 | |
| | 77,641 | | | 6.000%, 10/01/35,
Gold Pool # A47772 | | | 86,184 | |
| | 262,766 | | | 5.500%, 05/01/37,
Gold Pool # A60048 | | | 285,949 | |
| | 466,835 | | | 5.500%, 09/01/37,
Gold Pool # G03202 | | | 508,022 | |
| | 530,603 | | | 5.000%, 02/01/38,
Gold Pool # A73409 | | | 574,305 | |
| | 820,119 | | | 5.000%, 04/01/38,
Gold Pool # G04334 | | | 904,043 | |
| | 399,289 | | | 4.000%, 12/01/39,
Gold Pool # G06935 | | | 426,260 | |
| | 190,006 | | | 4.000%, 05/01/41,
Gold Pool # Q00870 | | | 203,078 | |
| | 959,449 | | | 4.000%, 11/01/41,
Gold Pool # Q04550 | | | 1,025,455 | |
| | | | | | | | |
| | | | | | | 4,701,173 | |
| | | | | | | | |
| |
| | | | Government National Mortgage Association – 3.10% | |
| | 269,479 | | | 5.000%, 05/20/37,
Pool # 782156 | | | 298,162 | |
| | 609,587 | | | 5.000%, 08/20/37,
Pool # 4015 | | | 674,472 | |
| | 479,746 | | | 6.000%, 07/20/38,
Pool # 4195 | | | 543,606 | |
| | 420,494 | | | 5.500%, 08/20/38,
Pool # 4215 | | | 447,988 | |
| | 184,068 | | | 6.000%, 01/15/39,
Pool # 698036 | | | 208,288 | |
| | | | | | | | |
| | | | | | | 2,172,516 | |
| | | | | | | | |
| | |
| | | | U.S. Treasury Bill – 2.85% | | | | |
| | 2,000,000 | | | 0.000%, 12/06/12 | | | 1,999,815 | |
| | | | | | | | |
| | |
| | | | U.S. Treasury Bond – 0.73% | | | | |
| | 500,000 | | | 3.000%, 05/15/42 | | | 514,766 | |
| | | | | | | | |
| |
| | | | U.S. Treasury Inflation Index Bonds – 6.38% | |
| | 1,602,240 | | | 1.375%, 07/15/18 | | | 1,870,740 | |
| | 1,021,980 | | | 0.625%, 07/15/21 | | | 1,168,890 | |
| | 1,099,480 | | | 1.750%, 01/15/28 | | | 1,439,976 | |
| | | | | | | | |
| | | | | | | 4,479,606 | |
| | | | | | | | |
| | | | | | | | |
Par Value | | | | | Market
Value | |
| | |
| | | | U.S. Treasury Note – 1.50% | | | | |
| | $1,000,000 | | | 4.000%, 02/15/14 | | $ | 1,048,438 | |
| | | | | | | | |
| | |
| | | | Total U.S. Government and Agency Obligations
(Cost $18,213,595) | | | 19,634,170 | |
| | | | | | | | |
|
| | COMMERCIAL MORTGAGE-BACKED SECURITIES – 0.85% | |
| | |
| | 275,000 | | | Bear Stearns Commercial Mortgage
Securities
Series 2007-T28, Class A4
5.742%, 09/11/42 (c) | | | 330,043 | |
| | 269,468 | | | JP Morgan Chase Commercial Mortgage Securities
Series 2005-CB13, Class A2
5.247%, 01/12/43 | | | 270,606 | |
| | | | | | | | |
| | |
| | | | Total Commercial Mortgage-Backed Securities
(Cost $442,723) | | | 600,649 | |
| | | | | | | | |
|
| | ASSET-BACKED SECURITIES – 2.68% | |
| | |
| | 3,773 | | | Capital Auto Receivables Asset Trust
Series 2008-2, Class A4
5.420%, 12/15/14 | | | 3,780 | |
| | 107,613 | | | CarMax Auto Owner Trust
Series 2009-1, Class A4
5.810%, 12/16/13 | | | 108,177 | |
| | | | Ford Credit Auto Owner Trust
Series 2009-A, Class A4 | | | | |
| | 535,907 | | | 6.070%, 05/15/14 | | | 542,325 | |
| | | | Series 2009-B, Class A4 | | | | |
| | 197,136 | | | 4.500%, 07/15/14 | | | 199,682 | |
| | | | Series 2009-C, Class A4 | | | | |
| | 699,744 | | | 4.430%, 11/15/14 | | | 712,700 | |
| | 309,947 | | | Nissan Auto Receivables Owner Trust
Series 2009-A, Class A4
4.740%, 08/17/15 | | | 311,524 | |
| | | | | | | | |
| | |
| | | | Total Asset-Backed Securities
(Cost $1,886,148) | | | 1,878,188 | |
| | | | | | | | |
|
| | FOREIGN GOVERNMENT BONDS – 1.13% | |
| | |
| | 500,000 | | | Republic of Poland
5.000%, 03/23/22 | | | 583,845 | |
| | 150,000 | | | State of Qatar
Senior Notes
6.400%, 01/20/40 (b) | | | 209,775 | |
| | | | | | | | |
| | |
| | | | Total Foreign Government Bonds
(Cost $643,276) | | | 793,620 | |
| | | | | | | | |
See accompanying Notes to Financial Statements.
| | |
| |
| ASTON/TCH Fixed Income Fund | | October 31, 2012 |
| |
| Schedule of Investments – continued | | |
| | | | | | | | |
Shares | | | | | Market
Value | |
|
| | INVESTMENT COMPANY – 1.60% | |
| | |
| | 1,121,862 | | | BlackRock Liquidity Funds
TempCash Portfolio | | $ | 1,121,862 | |
| | | | | | | | |
| | |
| | | | Total Investment Company
(Cost $1,121,862) | | | 1,121,862 | |
| | | | | | | | |
| Total Investments – 98.88%
(Cost $62,235,580) * | | | 69,383,473 | |
| | | | | | | | |
| Net Other Assets and Liabilities – 1.12% | | | 784,287 | |
| | | | | | | | |
| Net Assets – 100.00% | | $ | 70,167,760 | |
| | | | | | | | |
| * | | Aggregate cost for Federal income tax purposes is $62,008,880. |
| | | | |
Gross unrealized appreciation | | $ | 7,555,888 | |
Gross unrealized depreciation | | | (181,295 | ) |
| | | | |
Net unrealized appreciation | | $ | 7,374,593 | |
| | | | |
| (a) | | Step Coupon. A bond that pays an initial coupon rate for the first period and then a higher coupon rate for the following periods until maturity. The coupon rate will be 7.875% until maturity. |
| (b) | | Securities exempt from registration under Rule 144A of the Securities Act of 1933, as amended. These securities are purchased in accordance with guidelines approved by the Fund’s Board of Trustees and may only be resold, in transactions exempt from registration, to qualified institutional buyers. At October 31, 2012, these securities amounted to $7,964,786 or 11.35% of net assets. These securities have been determined by the Sub-Adviser to be liquid securities. |
| (c) | | Variable rate bond. The interest rate shown reflects the rate in effect at October 31, 2012. |
| (d) | | Standard & Poor’s (S&P) credit ratings are used in the absence of a rating by Moody’s Investors, Inc. |
| GMTN | | Global Medium Term Note |
| NASDAQ | | National Association of Securities Dealers Automated Quotations |
| | | | |
Portfolio Composition | | | | |
Investment Company | | | 2% | |
U.S. Government Obligations | | | 11% | |
U.S. Government Agency Obligations | | | 17% | |
Corporate Notes and Bonds | | | | |
(Moody’s Ratings (d) unaudited) | | | | |
Aaa | | | 3% | |
Aa | | | 5% | |
A | | | 7% | |
Baa | | | 42% | |
Ba | | | 12% | |
B | | | 1% | |
| | | | |
| | | 100% | |
| | | | |
See accompanying Notes to Financial Statements.
ASTON/Lake Partners LASSO Alternatives Fund
| | |
| |
| Portfolio Manager Commentary (unaudited) | | October 31, 2012 |
| Frederick C. Lake & Ronald A. Lake |
| Q. | What were the most significant market factors affecting Fund performance and returns relative to the benchmark during the past 12 months? |
| A. | Class N Shares of the Fund returned 5.34% versus 1.58% for the HFRX Equity Hedge Index. The Fund’s strategic diversification and moderate equity exposure enabled it to participate in the market’s upside while dampening the market’s downside volatility. In contrast, the benchmark reflected the relatively more hedged approaches of its constituent managers. |
Although equities finished the fiscal year higher, the trend was interrupted by several sharp corrections, as sentiment vacillated in reaction to policy developments. This is illustrated by dissecting the fiscal year into five sub-periods:
| | • | | The S&P 500 started the year with a tailspin, falling 7.3% by Thanksgiving on concerns about the global economy and the ongoing credit crisis in Europe. The Fund was off only 2.9%. |
| | • | | At the end of November there was an explosive rally after central banks launched a coordinated effort to support the European banks. The S&P rose over 23% through April 2, carried by liquidity, better U.S. economic data, the European Central Bank’s (ECB) LTRO program, and Greek debt restructuring. The Fund participated with a gain of 8.4%. |
| | • | | However, the S&P slid steadily over the next two months, losing 9.6% as U.S. data turned softer, China’s slowdown intensified, and Spain deteriorated seriously. The Fund was off only 3.8%. |
| | • | | Then, from June 1 through September 14, the index rallied 15.4%. Sparked by the ECB’s plan to recapitalize Spanish banks, momentum built on improving economic data in the U.S. and China, Draghi’s vow to “do whatever it takes” for the euro, the ECB’s Outright Monetary Transactions program, and expectations of the Fed easing. The Fund participated with a gain of 5.0%. |
| | • | | Ironically, the actual announcement of the third quantitative easing initiative |
| | | marked the peak. The S&P lost 3.5% from September 14 through October 31, as earnings disappointed. The Fund was off only 0.6%. |
| Q. | What were the best performing holdings for the Fund during the period? |
| A. | Returns were driven by solid gains from the core hedged equity allocations. Long-biased equity and hedged credit allocations also contributed meaningfully. |
| Q. | What were the weakest performing holdings? |
| A. | Long/short commodities and managed futures funds detracted from performance, but fortunately these were modest allocations. |
| Q. | How was the Fund positioned as of October 31, 2012? |
| A. | Throughout the year we positioned the portfolio to dampen the risk of conventional asset classes while aiming for relatively stable returns via a broad mix of alternatives. |
At fiscal year-end, equity-oriented funds (a diverse mix of long-biased, hedged, multi-asset and global strategies) accounted for 50% of the portfolio. Other allocations included 16% to Hedged Credit, 12% to Strategic Fixed Income, 10% to Arbitrage, and 8% to Global Macro.
We believe that volatility is likely to remain a feature of the investment landscape, as unresolved policy and political issues create uncertainty for investors. We therefore intend to maintain a diversified mix of strategies in an effort to mitigate volatility, while maintaining the potential to generate attractive risk-adjusted returns.
Note: A fund-of-funds that invest in funds using alternative or hedging strategies may be exposed to potentially dramatic changes in the value of certain of its portfolio holdings. Investments in a fund-of-funds are subject to higher costs than investing directly in the underlying funds.
Growth of a Hypothetical
$10,000 Investment—Class I
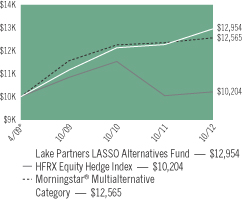
All dividends and capital gains are reinvested. Indexes are unmanaged and do not take into account fees, expenses or other costs.
Returns shown in the chart and table do not reflect taxes that a shareholder would pay on Fund distributions or on the sale of the Fund shares.
RETURNS FOR PERIOD ENDED 10/31/12
Average Annual Total Returns - Class N
| | | | |
One Year | | | 5.34 | % |
Since Inception | | | 3.94 | % |
Inception Date 03/03/10
Average Annual Total Returns - Class I
| | | | |
One Year | | | 5.56 | % |
Since Inception | | | 7.49 | % |
Inception Date 04/01/09*
* The Fund commenced operations on April 1, 2009. Because the Fund invests primarily in open-end investment companies which are priced as of the close of the NYSE, performance is shown from April 2, 2009.
The performance data quoted represents past performance. Past performance does not guarantee future results. Investment return and principal value will fluctuate so that an investor’s shares, upon redemption, may be worth more or less than their original cost. Current performance may be lower or higher than the performance data quoted. For performance data current to the most recent month-end, please visit our website at www.astonfunds.com.
The performance quoted would have been lower if fee waivers and/or expense reimbursements had not been in effect.
The total expense ratio for the Class N and Class I Shares is 3.07% and 2.82%, respectively, as disclosed in the prospectus dated March 1, 2012. Please refer to the Financial Highlights section in this report for more 2012 fiscal year-end related information.
| | |
| |
| ASTON/Lake Partners LASSO Alternatives Fund | | October 31, 2012 |
| |
| Schedule of Investments | | |
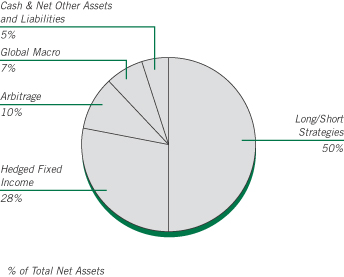
| | | | | | | | |
Shares | | | | | Market
Value | |
|
| | INVESTMENT COMPANIES – 95.40% | |
| | |
| | | | Merger Arbitrage – 9.95% | | | | |
| | 384,282 | | | Dunham Monthly Distribution Fund-N | | $ | 14,302,954 | |
| | 1,346,841 | | | Touchstone Merger Arbitrage Fund | | | 14,276,511 | |
| | | | | | | | |
| | | | | | | 28,579,465 | |
| | | | | | | | |
| |
| | | | Hedged Credit and Strategic Fixed Income – 27.65% | |
| | 956,219 | | | BlackRock Global Long/Short Credit Fund-INS | | | 10,088,108 | |
| | 677,708 | | | Driehaus Active Income Fund | | | 7,176,932 | |
| | 724,260 | | | Driehaus Select Credit Fund | | | 7,184,658 | �� |
| | 1,301,028 | | | John Hancock Funds II - Strategic Income Opportunities Fund | | | 14,415,394 | |
| | 2,088,579 | | | Metropolitan West High Yield Bond
Fund-I | | | 21,721,226 | |
| | 1,530,609 | | | PIMCO Income Fund | | | 18,780,578 | |
| | | | | | | | |
| | | | | | | 79,366,896 | |
| | | | | | | | |
| | |
| | | | Global Macro – 7.51% | | | | |
| | 2,016,060 | | | John Hancock Funds II - Global Absolute Return Strategies Fund * | | | 21,551,679 | |
| | | | | | | | |
| | | | | | | | |
Shares | | | | | Market
Value | |
| | |
| | | | Long/Short Strategies – 50.29% | | | | |
| | 948,271 | | | BlackRock Emerging Markets Long/Short Equity Fund-IS | | $ | 9,985,288 | |
| | 1,261,259 | | | FPA Crescent Fund-I | | | 35,920,658 | |
| | 2,683,645 | | | Robeco Boston Partners Long/Short Equity Fund-IS | | | 56,168,698 | |
| | 377,343 | | | Royce Global Select Fund-INV | | | 6,414,837 | |
| | 2,800,567 | | | The Weitz Funds - Partners III Opportunity Fund | | | 35,875,263 | |
| | | | | | | | |
| | | | | | | 144,364,744 | |
| | | | | | | | |
| | |
| | | | Total Investment Companies
(Cost $265,319,404) | | | 273,862,784 | |
| | | | | | | | |
| Total Investments – 95.40%
(Cost $265,319,404)** | | | 273,862,784 | |
| | | | | | | | |
| Net Other Assets and Liabilities – 4.60% | | | 13,198,817 | |
| | | | | | | | |
| Net Assets – 100.00% | | $ | 287,061,601 | |
| | | | | | | | |
| * | | Non-income producing security. |
| ** | | Aggregate cost for Federal income tax purposes is $266,062,572. |
| | | | |
Gross unrealized appreciation | | $ | 9,557,078 | |
Gross unrealized depreciation | | | (1,756,866 | ) |
| | | | |
Net unrealized appreciation | | $ | 7,800,212 | |
| | | | |
See accompanying Notes to Financial Statements.
ASTON Dynamic Allocation Fund
| | |
| |
| Portfolio Manager Commentary (unaudited) | | October 31, 2012 |
| | Bryce James |
| Q. | What were the most significant market factors affecting Fund performance and returns relative to the benchmark during the past 12 months? |
| A. | It has been an exceptionally challenging last 12 months for the Fund and our Dynamic Portfolio Optimization strategy. The adjective “more” comes to mind. We have witnessed more confusion, more contradictory economic statements from politicians, more market turmoil, more government interventions (in capital markets) than we can recall in nearly thirty years. Although we do not make economic forecasts nor engage in earnings estimates or similar exercises, ongoing macroeconomic confusion does manifest itself in the price action of the markets. This data is integrated into our model. |
| Q. | What were the best and weakest performing holdings for the Fund during the period? |
| A. | The past year witnessed some interesting disparities when the best, and worst exchange-traded fund (“ETF”) returns are examined in the portfolio. The best result, XLV-Healthcare, returned 22.36%. The worst performing, SKF Financial Inverse ETF, lost 26.22%. Ironically, the commonality, is that both sectors were subject to increasing government announcements and interventions. |
| Q. | How was the Fund positioned as of October 31, 2012? |
| A. | With all of the contradictory signals of short duration that we have seen the last 12 months, we continue to keep the portfolio in a relatively cautious and risk-averse posture. Our risk-centric focus does not allow for a high-risk/high-return proposition at this time. Our models recognize the historic tilt to current risks, even though it appears that many investors have already forgotten how quickly years of investment returns can be lost in a matter of months as seen in 2008. |
| | We are acutely cognizant of our prerogative to remain objective in the assessment of capital market risk, particularly in light of current macroeconomic issues. It appears to us that most investors have not fully considered the consequences of the U.S. Federal Reserve’s zero interest rate policy. The Fed policy creates and exacerbates the funding deficits for most defined-benefit pension plans and the structured life settlements provided by insurance companies. We think this area increasingly looks like a “bubble” or a setup for a future financial disaster. |
Growth of a Hypothetical
$10,000 Investment—Class N
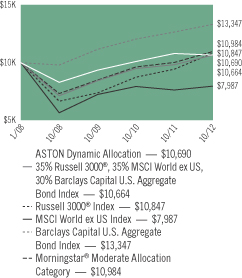
All dividends and capital gains are reinvested. Indexes are unmanaged and do not take into account fees, expenses or other costs.
Returns shown in the chart and table do not reflect taxes that a shareholder would pay on Fund distributions or on the sale of the Fund shares.
Investments in ETFs are subject to higher costs than investing directly in the underlying security. There are also certain investment limitations with a fund-of-funds.
RETURNSFOR PERIOD ENDED 10/31/12
Average Annual Total Returns - Class N
| | | | |
One Year | | | -1.17 | % |
Since Inception | | | 1.40 | % |
Inception Date 01/10/08
Average Annual Total Returns - Class I
| | | | |
One Year | | | -1.01 | % |
Since Inception | | | 2.87 | % |
Inception Date 11/02/10
The performance data quoted represents past performance. Past performance does not guarantee future results. Investment return and principal value will fluctuate so that an investor’s shares, upon redemption, may be worth more or less than their original cost. Current performance may be lower or higher than the performance data quoted. For performance data current to the most recent month-end, please visit our website at www.astonfunds.com.
The performance quoted would have been lower if fee waivers and/or expense reimbursements had not been in effect.
| | |
| |
| ASTON Dynamic Allocation Fund | | October 31, 2012 |
| |
| Schedule of Investments | | |
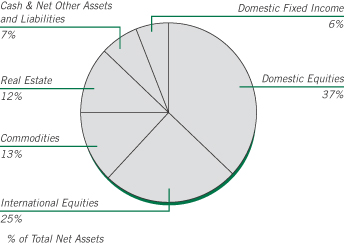
| | | | | | | | |
Shares | | | | | Market
Value | |
|
| | EXCHANGE TRADED FUNDS – 93.27% | |
| | |
| | | | Commodities – 12.80% | | | | |
| | 12,430 | | | SPDR Gold Shares * | | $ | 2,074,070 | |
| | 53,612 | | | United States Oil Fund LP * | | | 1,703,789 | |
| | | | | | | | |
| | | | | | | 3,777,859 | |
| | | | | | | | |
| | |
| | | | Domestic Equities – 37.37% | | | | |
| | 44,075 | | | Health Care Select Sector SPDR Fund | | | 1,763,000 | |
| | 20,896 | | | iShares Dow Jones U.S. Utilities Sector Index Fund | | | 1,890,879 | |
| | 9,965 | | | iShares Russell 2000 Growth Index Fund | | | 922,062 | |
| | 13,567 | | | iShares Russell 2000 Value Index
Fund | | | 987,949 | |
| | 29,444 | | | iShares Russell Midcap Growth Index Fund | | | 1,788,723 | |
| | 13,664 | | | PowerShares QQQ Trust Series 1 | | | 887,477 | |
| | 5,017 | | | SPDR S&P MidCap 400 ETF Trust | | | 894,280 | |
| | 51,366 | | | Utilities Select Sector SPDR Fund | | | 1,893,865 | |
| | | | | | | | |
| | | | | | | 11,028,235 | |
| | | | | | | | |
| | |
| | | | Domestic Fixed Income – 6.19% | | | | |
| | 21,638 | | | iShares Barclays 1-3 Year Treasury Bond Fund | | | 1,826,680 | |
| | | | | | | | |
| | |
| | | | International Equities – 24.59% | | | | |
| | 38,250 | | | iShares MSCI Australia Index Fund | | | 940,185 | |
| | 65,568 | | | iShares MSCI Canada Index Fund | | | 1,867,377 | |
| | 34,362 | | | iShares MSCI EAFE Index Fund | | | 1,840,772 | |
| | 69,411 | | | iShares MSCI Singapore Index Fund | | | 923,166 | |
| | 19,154 | | | iShares S&P Latin America 40 Index Fund | | | 809,448 | |
| | 49,166 | | | PowerShares India Portfolio | | | 877,613 | |
| | | | | | | | |
| | | | | | | 7,258,561 | |
| | | | | | | | |
| | | | | | | | |
Shares | | | | | Market
Value | |
| | |
| | | | Real Estate – 12.32% | | | | |
| | 23,401 | | | iShares Cohen & Steers Realty Majors Index Fund | | $ | 1,797,899 | |
| | 28,543 | | | Vanguard REIT | | | 1,837,598 | |
| | | | | | | | |
| | | | | | | 3,635,497 | |
| | | | | | | | |
| | |
| | | | Total Exchange Traded Funds
(Cost $27,237,623) | | | 27,526,832 | |
| | | | | | | | |
|
| | INVESTMENT COMPANY – 7.58% | |
| | |
| | 2,238,013 | | | BlackRock Liquidity Funds TempCash Portfolio | | | 2,238,013 | |
| | | | | | | | |
| | |
| | | | Total Investment Company
(Cost $2,238,013) | | | 2,238,013 | |
| | | | | | | | |
| Total Investments – 100.85%
(Cost $29,475,636)** | | | 29,764,845 | |
| | | | | | | | |
| Net Other Assets and Liabilities – (0.85)% | | | (251,868 | ) |
| | | | | | | | |
| Net Assets – 100.00% | | $ | 29,512,977 | |
| | | | | | | | |
| * | | Non-income producing security. |
| ** | | Aggregate cost for Federal income tax purposes is $29,596,378. |
| | | | |
Gross unrealized appreciation | | $ | 562,608 | |
Gross unrealized depreciation | | | (394,141 | ) |
| | | | |
Net unrealized appreciation | | $ | 168,467 | |
| | | | |
| EAFE | | Europe, Australasia, and Far East |
| EAFE | | Europe, Australasia, and Far East |
| MSCI | | Morgan Stanley Capital International |
| REIT | | Real Estate Investment Trust |
| SPDR | | Standard & Poor’s Depositary Receipt |
See accompanying Notes to Financial Statements.
ASTON/Anchor Capital Enhanced Equity Fund
| | |
| |
| Portfolio Manager Commentary (unaudited) | | October 31, 2012 |
| (formerly, the ASTON/M.D. Sass Enhanced Equity Fund) | | Ronald L. Altman |
| Q. | What were the most significant market factors affecting Fund performance and returns relative to the benchmark during the past 12 months? |
| A. | Class N Shares of the Fund returned 3.12% during the period, significantly less than the increase of 11.3% in the underlying stock holdings in the portfolio. The cost of using put options in order to provide downside protection in the event of a market break significantly reduced the portfolio’s total return, mainly because implied volatility (as represented by the Chicago Board Options Exchange Volatility Index-VIX) remained persistently low. Our strategy is to own put options when the VIX is less than 20, and to sell those options when the VIX is greater than 40. Continuing to maintain this hedge on the portfolio proved costly during the past 12 months, as the Index remained low, reducing overall returns. Although the cost of maintaining this hedge on the portfolio was substantially more than expected, we continue to think it prudent to hedge against the potential for future downside volatility given the current economic and market environment. |
| Q. | What were the best performing holdings for the Fund during the period? |
| A. | Looking at the equity-only portion of the portfolio, every sector contributed positively to the total return for this past year. The best performing sectors were Financials, Healthcare and Telecom. |
| Q. | What were the weakest performing holdings? |
| A. | Lagging sectors included Information Technology and Utilities. In addition, not owning traditional Energy and Materials companies had only a minimal impact on our overall performance versus the overall market. |
| Q. | How was the Fund positioned as of October 31, 2012? |
| A. | The Fund’s overriding commitment is to seek out attractive stocks using a value |
approach with an emphasis on companies with strong cash flows and above average dividend yields. We focus on dividend yield and free cash flow as we think that over time these are much better measures of valuation than net income. We also look for companies that have consistently increased their dividends over time, believing that dividend growth is often a strong signal of a company’s belief in its own growth potential. Whereas the broader investment community typically focuses on near-term cyclical issues, we think that the longer term secular growth potential of the business is more important in achieving investment success.
This investment process has, over the past two years, led the portfolio to be overweight large-cap Healthcare companies, both from a valuation perspective and due to our perception of a disparity between cyclical concerns and secular growth opportunities. Elsewhere on a sector level, the Fund continues to maintain significant overweight positions in Utilities and Industrials, with the most notable change from a year ago a reduction in its stake in Financials. Overall, the cash flow and weighted average dividend yield of the underlying holdings in the portfolio is greater than the Fund’s benchmark, while its average price/earnings ratio (a common measure of valuation) is lower.
In addition, we continually write covered call options on most positions in the portfolio. This forces us to keep the portfolio fresh. As stocks go up in value, and exceed the strike price of the call options written, they are frequently “called away” resulting in an opportunity to reexamine the most attractive candidates available. As previously noted, considering the potential economic risks (e.g. impending tax changes, lower government spending, Europe’s fiscal problems, and slowing economic growth in China), we remain convinced that owning put options to help protect against potential downside volatility is a prudent strategy.
Growth of a Hypothetical
$10,000 Investment—Class N
All dividends and capital gains are reinvested. Indexes are unmanaged and do not take into account fees, expenses or other costs.
Returns shown in the chart and table do not reflect taxes that a shareholder would pay on Fund distributions or on the sale of the Fund shares.
Investing in covered call options involves the risk of a lack of liquidity and can be negatively impacted by market price fluctuations.
RETURNSFOR PERIOD ENDED 10/31/12
Average Annual Total Returns - Class N
| | | | |
One Year | | | 3.12 | % |
Since Inception | | | 3.38 | % |
Inception Date 01/15/08
Average Annual Total Returns - Class I
| | | | |
One Year | | | 3.46 | % |
Since Inception | | | 6.20 | % |
Inception Date 03/03/10
The performance data quoted represents past performance. Past performance does not guarantee future results. Investment return and principal value will fluctuate so that an investor’s shares, upon redemption, may be worth more or less than their original cost. Current performance may be lower or higher than the performance data quoted. For performance data current to the most recent month-end, please visit our website at www.astonfunds.com.
| | |
| |
| ASTON/Anchor Capital Enhanced Equity Fund | | October 31, 2012 |
| |
| Schedule of Investments | | |
| | | | | | | | |
Shares | | | | | Market
Value | |
| |
| | COMMON STOCKS – 100.35% | | | | |
| | |
| | | | Consumer Discretionary – 12.54% | | | | |
| | 165,000 | | | Carnival (a) | | $ | 6,250,200 | |
| | 105,000 | | | Kohl’s (a) | | | 5,594,400 | |
| | 145,000 | | | Lowe’s (a) | | | 4,695,100 | |
| | 500,000 | | | Staples (a) | | | 5,757,500 | |
| | | | | | | | |
| | | | | | | 22,297,200 | |
| | | | | | | | |
| | |
| | | | Consumer Staples – 13.90% | | | | |
| | 230,000 | | | ConAgra Foods (a) | | | 6,403,200 | |
| | 90,000 | | | General Mills (a) | | | 3,607,200 | |
| | 87,100 | | | Procter & Gamble (a) | | | 6,030,804 | |
| | 90,000 | | | Sysco (a) | | | 2,796,300 | |
| | 167,000 | | | Walgreen (a) | | | 5,883,410 | |
| | | | | | | | |
| | | | | | | 24,720,914 | |
| | | | | | | | |
| | |
| | | | Financials – 7.43% | | | | |
| | 240,000 | | | Bank of America (a) | | | 2,236,800 | |
| | 176,000 | | | MetLife (a) | | | 6,246,240 | |
| | 50,000 | | | SunTrust Banks (a) | | | 1,360,000 | |
| | 100,000 | | | Wells Fargo (a) | | | 3,369,000 | |
| | | | | | | | |
| | | | | | | 13,212,040 | |
| | | | | | | | |
| | |
| | | | Healthcare – 11.56% | | | | |
| | 73,400 | | | Becton Dickinson (a) | | | 5,554,912 | |
| | 80,000 | | | Johnson & Johnson (a) | | | 5,665,600 | |
| | 140,000 | | | Medtronic (a) | | | 5,821,200 | |
| | 30,000 | | | Stryker (a) | | | 1,578,000 | |
| | 30,000 | | | Zimmer Holdings (a) | | | 1,926,300 | |
| | | | | | | | |
| | | | | | | 20,546,012 | |
| | | | | | | | |
| | | | | | | | |
Shares | | | | | Market
Value | |
| | |
| | | | Industrials – 16.38% | | | | |
| | 136,000 | | | Eaton (a) | | $ | 6,421,920 | |
| | 113,000 | | | Emerson Electric (a) | | | 5,472,590 | |
| | 160,000 | | | General Electric (a) | | | 3,369,600 | |
| | 25,000 | | | Lockheed Martin (a) | | | 2,341,750 | |
| | 99,900 | | | Raytheon (a) | | | 5,650,344 | |
| | 75,000 | | | United Technologies (a) | | | 5,862,000 | |
| | | | | | | | |
| | | | | | | 29,118,204 | |
| | | | | | | | |
| | |
| | | | Information Technology – 22.70% | | | | |
| | 500,000 | | | Applied Materials (a) | | | 5,300,000 | |
| | 340,000 | | | Cisco Systems (a) | | | 5,827,600 | |
| | 490,000 | | | Corning (a) | | | 5,757,500 | |
| | 130,000 | | | Harris (a) | | | 5,951,400 | |
| | 260,000 | | | Intel (a) | | | 5,622,500 | |
| | 195,000 | | | Microsoft (a) | | | 5,564,325 | |
| | 725,000 | | | Nokia OYJ, SP ADR (Finland) (a) | | | 1,935,750 | |
| | 685,000 | | | Xerox (a) | | | 4,411,400 | |
| | | | | | | | |
| | | | | | | 40,370,475 | |
| | | | | | | | |
| | |
| | | | Utilities – 15.84% | | | | |
| | 80,000 | | | Entergy (a) | | | 5,806,400 | |
| | 174,000 | | | Exelon (a) | | | 6,225,720 | |
| | 130,000 | | | FirstEnergy (a) | | | 5,943,600 | |
| | 155,000 | | | PPL (a) | | | 4,584,900 | |
| | 175,000 | | | Public Service Enterprise Group (a) | | | 5,607,000 | |
| | | | | | | | |
| | | | | | | 28,167,620 | |
| | | | | | | | |
| | |
| | | | Total Common Stocks (Cost $184,135,432) | | | 178,432,465 | |
| | | | | | | | |
Number of
Contracts | | | | | | |
| |
| | PURCHASED OPTIONS – 0.84% | | | | |
| | |
| | | | SPDR S&P 500 ETF Trust | | | | |
| | 1,300 | | | Strike @ $121 Exp 11/17/12 | | | 5,200 | |
| | 2,100 | | | Strike @ $122 Exp 11/17/12 | | | 8,400 | |
| | 2,100 | | | Strike @ $123 Exp 11/17/12 | | | 10,500 | |
| | 1,600 | | | Strike @ $124 Exp 11/17/12 | | | 9,600 | |
| | 2,000 | | | Strike @ $125 Exp 11/17/12 | | | 16,000 | |
| | 1,500 | | | Strike @ $126 Exp 11/17/12 | | | 15,000 | |
| | 1,500 | | | Strike @ $127 Exp 11/17/12 | | | 16,500 | |
| | 1,000 | | | Strike @ $130 Exp 11/17/12 | | | 16,000 | |
| | 1,000 | | | Strike @ $132 Exp 11/17/12 | | | 28,000 | |
| | 1,000 | | | Strike @ $131 Exp 11/17/12 | | | 22,000 | |
| | 1,000 | | | Strike @ $121 Exp 12/22/12 | | | 34,000 | |
| | 1,500 | | | Strike @ $122 Exp 12/22/12 | | | 57,000 | |
| | 2,000 | | | Strike @ $123 Exp 12/22/12 | | | 82,000 | |
| | 2,000 | | | Strike @ $124 Exp 12/22/12 | | | 94,000 | |
| | 2,000 | | | Strike @ $125 Exp 12/22/12 | | | 104,000 | |
| | 1,500 | | | Strike @ $128 Exp 12/22/12 | | | 118,500 | |
| | 1,500 | | | Strike @ $129 Exp 12/22/12 | | | 120,000 | |
| | 2,000 | | | Strike @ $129 Exp 12/31/12 | | | 200,000 | |
| | 2,000 | | | Strike @ $130 Exp 12/31/12 | | | 212,000 | |
| | 2,000 | | | Strike @ $131 Exp 12/31/12 | | | 254,000 | |
See accompanying Notes to Financial Statements.
| | |
| |
| ASTON/Anchor Capital Enhanced Equity Fund | | October 31, 2012 |
| |
| Schedule of Investments – continued | | |
| | | | | | | | |
Number of
Contracts | | | | | Market
Value | |
| | 500 | | | Strike @ $128 Exp 01/19/13 | | $ | 62,000 | |
| | | | | | | | |
| | |
| | | | Total Purchased Options
(Cost $2,273,051) | | | 1,484,700 | |
| | | | | | | | |
| Total Investments – 101.19%
(Cost $186,408,483)** | | | 179,917,165 | |
| | | | | | | | |
| Net Other Assets and Liabilities – (1.19)% | | | (2,107,845 | ) |
| | | | | | | | |
| Net Assets – 100.00% | | $ | 177,809,320 | |
| | | | | | | | |
| * | | Non-income producing security. |
| ** | | Aggregate cost for Federal income tax purposes is $186,675,910. |
| | | | |
Gross unrealized appreciation | | $ | 7,841,971 | |
Gross unrealized depreciation | | | (14,600,716 | ) |
| | | | |
Net unrealized depreciation | | $ | (6,758,745 | ) |
| | | | |
| (a) | | These securities are pledged as collateral for call options written. |
| SP ADR | | Sponsored American Depositary Receipt |
| SPDR | | Standard & Poor’s Depositary Receipt |
Transactions in written call options for the year ended October 31, 2012 were as follows:
| | | | | | | | |
| Contracts | | Number of
Contracts | | | Premium | |
Outstanding, October 31, 2011 | | | 37,160 | | | $ | 3,231,770 | |
Call Options Written | | | 151,796 | | | | 10,765,338 | |
Call Options Closed or Expired | | | (118,310 | ) | | | (8,797,416 | ) |
Call Options Exercised | | | (14,320 | ) | | | (1,259,996 | ) |
| | | | | | | | |
Outstanding, October 31, 2012 | | | 56,326 | | | $ | 3,939,696 | |
| | | | | | | | |
Premiums received and value of written call equity options outstanding as of October 31, 2012.
| | | | | | | | | | | | |
Number of
Contracts | | | Description | | Premium
Received | | | Market
Value | |
| | | | Applied Materials | | | | | | | | |
| | 2,566 | | | Strike @ $13 Exp 04/13 | | | $ 122,156 | | | | $ 17,962 | |
| | | |
| | | | Bank of America | | | | | | | | |
| | 1,800 | | | Strike @ $9 Exp 02/13 | | | 61,152 | | | | 156,600 | |
| | 600 | | | Strike @ $10 Exp 05/13 | | | 23,382 | | | | 42,000 | |
| | | |
| | | | Becton Dickinson | | | | | | | | |
| | 734 | | | Strike @ $80 Exp 03/13 | | | 114,124 | | | | 69,730 | |
| | | |
| | | | Carnival | | | | | | | | |
| | 210 | | | Strike @ $35 Exp 01/13 | | | 25,408 | | | | 73,500 | |
| | 150 | | | Strike @ $37 Exp 01/13 | | | 14,296 | | | | 32,250 | |
| | 262 | | | Strike @ $37 Exp 04/13 | | | 38,767 | | | | 77,290 | |
| | 1,028 | | | Strike @ $38 Exp 04/13 | | | 126,538 | | | | 254,430 | |
| | | |
| | | | Cisco Systems | | | | | | | | |
| | 800 | | | Strike @ $18 Exp 11/12 | | | 25,576 | | | | 24,000 | |
| | 2,600 | | | Strike @ $20 Exp 04/13 | | | 103,522 | | | | 88,400 | |
| | | | | | | | | | | | |
Number of
Contracts | | | Description | | Premium
Received | | | Market
Value | |
| | | | ConAgra Foods | | | | | | | | |
| | 300 | | | Strike @ $27 Exp 12/12 | | | $ 14,692 | | | | $ 42,000 | |
| | 340 | | | Strike @ $27 Exp 01/13 | | | 10,771 | | | | 49,300 | |
| | 500 | | | Strike @ $26 Exp 03/13 | | | 36,985 | | | | 125,000 | |
| | 1,160 | | | Strike @ $27 Exp 03/13 | | | 42,565 | | | | 179,800 | |
| | | |
| | | | Corning | | | | | | | | |
| | 3,000 | | | Strike @ $14 Exp 02/13 | | | 87,010 | | | | 45,000 | |
| | | |
| | | | Eaton | | | | | | | | |
| | 686 | | | Strike @ $46 Exp 01/13 | | | 74,069 | | | | 178,360 | |
| | 374 | | | Strike @ $48 Exp 04/13 | | | 78,733 | | | | 97,240 | |
| | 300 | | | Strike @ $50 Exp 04/13 | | | 51,534 | | | | 60,000 | |
| | | |
| | | | Emerson Electric | | | | | | | | |
| | 230 | | | Strike @ $48 Exp 01/13 | | | 30,583 | | | | 41,630 | |
| | 900 | | | Strike @ $50 Exp 01/13 | | | 73,206 | | | | 94,500 | |
| | | |
| | | | Entergy | | | | | | | | |
| | 690 | | | Strike @ $70 Exp 01/13 | | | 67,958 | | | | 208,725 | |
| | 110 | | | Strike @ $72.5 Exp 03/13 | | | 11,939 | | | | 20,900 | |
| | | |
| | | | Exelon | | | | | | | | |
| | 240 | | | Strike @ $40 Exp 04/13 | | | 8,160 | | | | 3,600 | |
| | | |
| | | | FirstEnergy | | | | | | | | |
| | 200 | | | Strike @ $46 Exp 01/13 | | | 11,800 | | | | 15,000 | |
| | 200 | | | Strike @ $47 Exp 01/13 | | | 8,800 | | | | 8,200 | |
| | 600 | | | Strike @ $47 Exp 04/13 | | | 45,899 | | | | 51,000 | |
| | 300 | | | Strike @ $48 Exp 04/13 | | | 16,200 | | | | 18,000 | |
| | | |
| | | | General Electric | | | | | | | | |
| | 450 | | | Strike @ $22 Exp 12/12 | | | 15,739 | | | | 12,600 | |
| | 1,150 | | | Strike @ $22 Exp 03/13 | | | 75,991 | | | | 66,700 | |
| | | |
| | | | General Mills | | | | | | | | |
| | 400 | | | Strike @ $41 Exp 04/13 | | | 32,378 | | | | 30,000 | |
| | 400 | | | Strike @ $42 Exp 04/13 | | | 19,766 | | | | 15,200 | |
| | | |
| | | | Harris | | | | | | | | |
| | 347 | | | Strike @ $45 Exp 11/12 | | | 42,451 | | | | 55,520 | |
| | 953 | | | Strike @ $45 Exp 02/13 | | | 230,255 | | | | 324,020 | |
| | | |
| | | | Intel | | | | | | | | |
| | 400 | | | Strike @ $27 Exp 04/13 | | | 11,988 | | | | 3,800 | |
| | | |
| | | | Johnson & Johnson | | | | | | | | |
| | 400 | | | Strike @ $67.5 Exp 01/13 | | | 46,029 | | | | 148,000 | |
| | 160 | | | Strike @ $70 Exp 01/13 | | | 18,875 | | | | 27,360 | |
| | 240 | | | Strike @ $70 Exp 04/13 | | | 29,152 | | | | 54,000 | |
| | | |
| | | | Kohls | | | | | | | | |
| | 880 | | | Strike @ $52.5 Exp 01/13 | | | 137,215 | | | | 250,800 | |
| | 170 | | | Strike @ $55 Exp 04/13 | | | 47,303 | | | | 42,500 | |
| | | |
| | | | Lockheed Martin | | | | | | | | |
| | 250 | | | Strike @ $90 Exp 12/12 | | | 45,243 | | | | 112,500 | |
| | | |
| | | | Lowes | | | | | | | | |
| | 200 | | | Strike @ $29 Exp 01/13 | | | 10,400 | | | | 78,000 | |
| | 500 | | | Strike @ $30 Exp 01/13 | | | 19,200 | | | | 157,500 | |
| | 300 | | | Strike @ $28 Exp 04/13 | | | 38,900 | | | | 156,000 | |
| | 300 | | | Strike @ $29 Exp 04/13 | | | 37,136 | | | | 132,000 | |
| | 150 | | | Strike @ $30 Exp 04/13 | | | 16,500 | | | | 51,000 | |
See accompanying Notes to Financial Statements.
| | |
| |
| ASTON/Anchor Capital Enhanced Equity Fund | | October 31, 2012 |
| |
| Schedule of Investments – continued | | |
| | | | | | | | | | | | |
Number of
Contracts | | | Description | | Premium
Received | | | Market
Value | |
| | | | Medtronic | | | | | | | | |
| | 200 | | | Strike @ $41 Exp 11/12 | | | $ 24,045 | | | | $ 22,400 | |
| | 50 | | | Strike @ $40 Exp 01/13 | | | 5,648 | | | | 12,650 | |
| | 250 | | | Strike @ $41 Exp 01/13 | | | 27,193 | | | | 47,250 | |
| | 850 | | | Strike @ $42 Exp 01/13 | | | 104,977 | | | | 123,250 | |
| | 50 | | | Strike @ $40 Exp 02/13 | | | 6,899 | | | | 14,025 | |
| | | |
| | | | MetLife | | | | | | | | |
| | 50 | | | Strike @ $35 Exp 12/12 | | | 6,299 | | | | 7,400 | |
| | 410 | | | Strike @ $35 Exp 01/13 | | | 44,378 | | | | 73,390 | |
| | 100 | | | Strike @ $35 Exp 03/13 | | | 10,297 | | | | 24,000 | |
| | 1,100 | | | Strike @ $38 Exp 03/13 | | | 148,317 | | | | 137,500 | |
| | 50 | | | Strike @ $40 Exp 03/13 | | | 5,051 | | | | 3,850 | |
| | 50 | | | Strike @ $39 Exp 06/13 | | | 7,248 | | | | 7,900 | |
| | | |
| | | | Microsoft | | | | | | | | |
| | 999 | | | Strike @ $33 Exp 04/13 | | | 73,316 | | | | 33,966 | |
| | 300 | | | Strike @ $31 Exp 07/13 | | | 27,599 | | | | 32,400 | |
| | 651 | | | Strike @ $32 Exp 07/13 | | | 46,069 | | | | 56,637 | |
| | | |
| | | | Nokia OYJ, SP ADR (Finland) | | | | | | | | |
| | 750 | | | Strike @ $10 Exp 01/13 | | | 7,481 | | | | 375 | |
| | 3,040 | | | Strike @ $7.5 Exp 01/13 | | | 43,490 | | | | 1,520 | |
| | 2,250 | | | Strike @ $5 Exp 04/13 | | | 47,881 | | | | 15,750 | |
| | | |
| | | | PPL | | | | | | | | |
| | 896 | | | Strike @ $29 Exp 01/13 | | | 48,664 | | | | 80,640 | |
| | 654 | | | Strike @ $30 Exp 01/13 | | | 25,216 | | | | 22,890 | |
| | | |
| | | | Procter & Gamble | | | | | | | | |
| | 671 | | | Strike @ $65 Exp 01/13 | | | 106,496 | | | | 322,080 | |
| | 200 | | | Strike @ $67.5 Exp 01/13 | | | 27,294 | | | | 56,800 | |
| | | |
| | | | Public Service Enterprise | | | | | | | | |
| | 400 | | | Strike @ $35 Exp 12/12 | | | 12,488 | | | | 1,000 | |
| | 450 | | | Strike @ $35 Exp 03/13 | | | 28,037 | | | | 6,750 | |
| | | |
| | | | Raytheon | | | | | | | | |
| | 50 | | | Strike @ $55 Exp 11/12 | | | 5,149 | | | | 9,450 | |
| | 700 | | | Strike @ $60 Exp 02/13 | | | 60,347 | | | | 51,100 | |
| | 249 | | | Strike @ $57.5 Exp 05/13 | | | 41,077 | | | | 57,146 | |
| | | |
| | | | Staples | | | | | | | | |
| | 160 | | | Strike @ $13 Exp 12/12 | | | 3,040 | | | | 3,200 | |
| | 100 | | | Strike @ $13 Exp 03/13 | | | 4,897 | | | | 4,500 | |
| | 2,000 | | | Strike @ $14 Exp 03/13 | | | 37,999 | | | | 50,000 | |
| | 1,450 | | | Strike @ $15 Exp 03/13 | | | 49,299 | | | | 18,125 | |
| | 325 | | | Strike @ $16 Exp 03/13 | | | 11,050 | | | | 1,625 | |
| | | |
| | | | Stryker | | | | | | | | |
| | 150 | | | Strike @ $55 Exp 03/13 | | | 28,199 | | | | 22,500 | |
| | 150 | | | Strike @ $57.5 Exp 03/13 | | | 14,700 | | | | 12,000 | |
| | | |
| | | | Suntrust | | | | | | | | |
| | 500 | | | Strike @ $27 Exp 01/13 | | | 51,487 | | | | 79,500 | |
| | | |
| | | | Sysco | | | | | | | | |
| | 500 | | | Strike @ $31 Exp 01/13 | | | 34,485 | | | | 42,500 | |
| | 300 | | | Strike @ $30 Exp 02/13 | | | 17,841 | | | | 49,500 | |
| | 100 | | | Strike @ $32 Exp 02/13 | | | 4,897 | | | | 5,500 | |
| | | |
| | | | United Technologies | | | | | | | | |
| | 680 | | | Strike @ $82.5 Exp 02/13 | | | 91,246 | | | | 105,400 | |
| | 70 | | | Strike @ $82.5 Exp 05/13 | | | 15,678 | | | | 18,900 | |
| | | | | | | | | | | | |
Number of
Contracts | | | Description | | Premium
Received | | | Market
Value | |
| | | | Walgreen | | | | | | | | |
| | 320 | | | Strike @ $33 Exp 01/13 | | | $ 30,071 | | | | $ 85,440 | |
| | 50 | | | Strike @ $35 Exp 01/13 | | | 4,999 | | | | 6,650 | |
| | 1,150 | | | Strike @ $36 Exp 01/13 | | | 48,212 | | | | 96,600 | |
| | 150 | | | Strike @ $36 Exp 04/13 | | | 28,471 | | | | 21,900 | |
| | | |
| | | | Wells Fargo | | | | | | | | |
| | 1,000 | | | Strike @ $36 Exp 04/13 | | | 151,967 | | | | 115,000 | |
| | | |
| | | | Xerox | | | | | | | | |
| | 945 | | | Strike @ $9 Exp 01/13 | | | 26,331 | | | | 2,835 | |
| | 1,976 | | | Strike @ $9 Exp 04/13 | | | 41,134 | | | | 7,904 | |
| | | |
| | | | Zimmer Holdings | | | | | | | | |
| | 100 | | | Strike @ $65 Exp 12/12 | | | 17,797 | | | | 16,500 | |
| | 100 | | | Strike @ $65 Exp 03/13 | | | 24,797 | | | | 30,000 | |
| | 100 | | | Strike @ $70 Exp 03/13 | | | 9,797 | | | | 11,200 | |
| | | | | | | | | | | | |
| | | |
| | | | Total Written Call Options | | | $3,939,696 | | | | $5,821,315 | |
| | | | | | | | | | | | |
See accompanying Notes to Financial Statements.
ASTON/River Road Long-Short Fund
| | |
| |
| Portfolio Manager Commentary (unaudited) | | October 31, 2012 |
| | |
| | Daniel Johnson, CFA & Matthew Moran, CFA |
| Q. | What were the most significant market factors affecting Fund performance and returns relative to the benchmark during the past 12 months? |
| A. | In the last 12 months, the Russell 3000 Index has returned 14.75%. The Fund returned 8.17%, capturing 69% of the market’s return with only 53% net exposure to the market over the same time period. The results were achieved due to strong stock selection. The long book returned 21.95% (outperforming the benchmark by 720 bps) and the individual short book returned 7.14% (outperforming the benchmark by 760 bps). |
| Q. | What were the best performing holdings for the Fund during the period? |
| A. | The holdings with the largest positive contribution to total return during the period were Madison Square Garden Co. and SEI Investments Co. Madison Square Garden is an entertainment company that owns the Garden, the New York Knicks, the New York Rangers, and a percentage of the air rights above the Garden. The company benefits from a long-term contract with Cablevision to broadcast everything that comes out of the Garden. The completion of the Garden’s transformation has removed an overhang and prompted rising ticket prices. SEI Investments provides middle and back office functions to financial institutions. The company benefits from long-term contracts and switching costs. Margins have been under pressure due to a rollout of their Global Wealth Platform, which will improve with |
time. The company maintains a rock solid balance sheet with net cash, a sizeable stake in quantitative value manager LSV Asset Management, and has reduced the share count aggressively over the past decade.
| Q. | What were the weakest performing holdings? |
| A. | The two holdings with the largest negative contribution to the Fund’s total return were a short position in AOL Inc. and a long position in Cloud Peak Energy Inc. AOL is a dial-up internet service provider that suffers from a dramatically declining customer base. Some questionable capital allocation decisions were overwhelmed by the sale of patents to Microsoft. We underestimated the value of the patents, but closed the position at our pre-established Stop-Loss. Cloud Peak Energy is the third largest coal producer in the Powder River Basin. The company was spun-out of Rio Tinto and is the only pure-play Powder River Basin producer. The PRB is the largest energy source in the world. The stock was eliminated due to our unrealized loss discipline. |
| Q. | How was the Fund positioned as of October 31, 2012? |
The Fund was closer to the lower end of its normal net market exposure range (50-70%) at 53% at the end of October. The market rally had made it challenging to find compelling longs. We remain prepared to take advantage of attractive purchase opportunities should volatility return to the market.
Growth of a Hypothetical
$10,000 Investment—Class N
All dividends and capital gains are reinvested. Indexes are unmanaged and do not take into account fees, expenses or other costs.
Returns shown in the chart and table do not reflect taxes that a shareholder would pay on Fund distributions or on the sale of the Fund shares.
Short sales may involve the risk that the Fund will incur a loss by subsequently buying a security at a higher price than which it was previously sold short. A loss incurred on a short sale results from increases in the value of the security, thus losses on a short sale are theoretically unlimited. Value investing often involves buying the stocks of companies that are currently out-of-favor that may decline further. Investing in exchange-traded and closed-end funds subjects the Fund to the additional risk that shares of the underlying fund may trade at a premium or discount to their net asset value.
RETURNFOR PERIOD ENDED 10/31/12
Average Annual Total Returns - Class N
| | | | |
One Year | | | 8.17 | % |
Since Inception | | | 4.82 | % |
Inception Date 05/04/11
The performance data quoted represents past performance. Past performance does not guarantee future results. Investment return and principal value will fluctuate so that an investor’s shares, upon redemption, may be worth more or less than their original cost. Current performance may be lower or higher than the performance data quoted. For performance data current to the most recent month-end, please visit our website at www.astonfunds.com.
The performance quoted would have been lower if fee waivers and/or expense reimbursements had not been in effect.
| | |
| |
| ASTON/River Road Long-Short Fund | | October 31, 2012 |
| |
| Schedule of Investments | | |
The chart represents total investments in the Fund. Exchange-Traded Funds and Telecommunication Services are negative 2.52% and 1.07%, respectively, and cannot be represented in the pie chart format.
| | | | | | | | |
Shares | | | | | Market
Value | |
|
| | COMMON STOCKS – 72.99% | |
| | |
| | | | Consumer Discretionary – 13.30% | | | | |
| | 6,288 | | | Big Lots * | | $ | 183,169 | |
| | 3,284 | | | General Motors * (a) | | | 83,742 | |
| | 5,283 | | | Guess? (a) | | | 130,913 | |
| | 2,428 | | | Kohl’s (a) | | | 129,364 | |
| | 3,245 | | | Madison Square Garden, Class A * (a) | | | 133,564 | |
| | 11,946 | | | Thomson Reuters (a) | | | 337,594 | |
| | | | | | | | |
| | | | | | | 998,346 | |
| | | | | | | | |
| | |
| | | | Consumer Staples – 6.24% | | | | |
| | 6,461 | | | Harris Teeter Supermarkets | | | 241,964 | |
| | 5,248 | | | Molson Coors Brewing, Class B (a) | | | 226,399 | |
| | | | | | | | |
| | | | | | | 468,363 | |
| | | | | | | | |
| | |
| | | | Energy – 7.76% | | | | |
| | 3,156 | | | Devon Energy (a) | | | 183,711 | |
| | 2,410 | | | Occidental Petroleum (a) | | | 190,294 | |
| | 3,930 | | | Williams Partners LP | | | 208,211 | |
| | | | | | | | |
| | | | | | | 582,216 | |
| | | | | | | | |
| | |
| | | | Financials – 11.46% | | | | |
| | 1,268 | | | Berkshire Hathaway, Class B * (a) | | | 109,492 | |
| | 1,058 | | | BlackRock | | | 200,681 | |
| | 2,878 | | | CME Group (a) | | | 160,966 | |
| | 4,894 | | | Loews (a) | | | 206,918 | |
| | 6,775 | | | MSCI * (a) | | | 182,518 | |
| | | | | | | | |
| | | | | | | 860,575 | |
| | | | | | | | |
| | |
| | | | Healthcare – 3.17% | | | | |
| | 3,142 | | | Becton, Dickinson (a) | | | 237,787 | |
| | | | | | | | |
| | | | | | | | |
Shares | | | | | Market
Value | |
| | |
| | | | Industrials – 14.29% | | | | |
| | 10,202 | | | ABM Industries | | $ | 193,838 | |
| | 6,238 | | | ADT * | | | 258,939 | |
| | 5,506 | | | Expeditors International of Washington (a) | | | 201,575 | |
| | 2,812 | | | General Dynamics | | | 191,441 | |
| | 9,516 | | | Heartland Express | | | 132,748 | |
| | 1,536 | | | Norfolk Southern | | | 94,234 | |
| | | | | | | | |
| | | | | | | 1,072,775 | |
| | | | | | | | |
| | |
| | | | Information Technology – 14.42% | | | | |
| | 2,422 | | | DST Systems (a) | | | 138,151 | |
| | 4,824 | | | Global Payments (a) | | | 206,226 | |
| | 8,986 | | | Microsoft (a) | | | 256,416 | |
| | 4,591 | | | Oracle (a) | | | 142,550 | |
| | 17,661 | | | Western Union (a) | | | 224,295 | |
| | 6,847 | | | Yahoo! * | | | 115,098 | |
| | | | | | | | |
| | | | | | | 1,082,736 | |
| | | | | | | | |
| | |
| | | | Utilities – 2.35% | | | | |
| | 3,343 | | | National Fuel Gas (a) | | | 176,176 | |
| | | | | | | | |
| | |
| | | | Total Common Stocks
(Cost $5,404,356) | | | 5,478,974 | |
| | | | | | | | |
|
| | INVESTMENT COMPANY – 28.40% | |
| | |
| | 2,132,110 | | | BlackRock Liquidity Funds
TempCash Portfolio | | | 2,132,110 | |
| | | | | | | | |
| | |
| | | | Total Investment Company
(Cost $2,132,110) | | | 2,132,110 | |
| | | | | | | | |
| Total Investments – 101.39%
(Cost $7,536,466)*** | | | 7,611,084 | |
| | | | | | | | |
| $1,127,727 in cash and $2,817,979 in securities was segregated or on
deposit with a prime broker to cover short sales as of October 31, 2012
and are included in “Net Other Assets and Liabilities”. |
|
|
| | SHORT SALES – (19.43)% | |
| | |
| | | | Consumer Discretionary – (8.58)% | | | | |
| | (1,903) | | | American Axle & Manufacturing Holdings ** | | | (20,686 | ) |
| | (489) | | | Bed Bath & Beyond ** | | | (28,206 | ) |
| | (320) | | | Charter Communications, Class A ** | | | (24,771 | ) |
| | (632) | | | Children’s Place Retail Stores ** | | | (36,928 | ) |
| | (717) | | | DineEquity ** | | | (44,956 | ) |
| | (845) | | | Finish Line , Class A | | | (17,580 | ) |
| | (1,595) | | | GameStop, Class A | | | (36,414 | ) |
| | (830) | | | Garmin (Switzerland) | | | (31,532 | ) |
| | (4,770) | | | Goodyear Tire & Rubber ** | | | (54,426 | ) |
| | (805) | | | Hanesbrands ** | | | (26,943 | ) |
| | (3,129) | | | Leggett & Platt | | | (83,012 | ) |
| | (662) | | | Life Time Fitness ** | | | (29,717 | ) |
| | (1,390) | | | Mattress Firm Holding ** | | | (44,494 | ) |
| | (1,716) | | | Monro Muffler Brake | | | (58,207 | ) |
| | (4,786) | | | Saks ** | | | (49,200 | ) |
| | (1,956) | | | Sonic ** | | | (19,501 | ) |
| | (989) | | | Thor Industries | | | (37,612 | ) |
| | | | | | | | |
| | | | | | | (644,185 | ) |
| | | | | | | | |
See accompanying Notes to Financial Statements.
| | |
| |
| ASTON/River Road Long-Short Fund | | October 31, 2012 |
| |
| Schedule of Investments – continued | | |
| | | | | | | | |
Shares | | | | | Market
Value | |
| | |
| | | | Consumer Staples – (1.26)% | | | | |
| | (1,626) | | | ConAgra Foods | | $ | (45,268 | ) |
| | (2,396) | | | Smithfield Foods ** | | | (49,046 | ) |
| | | | | | | | |
| | | | | | | (94,314 | ) |
| | | | | | | | |
| | |
| | | | Exchange-Traded Funds – (2.52)% | | | | |
| | (5,582) | | | United States Natural Gas Fund LP ** | | | (121,409 | ) |
| | (2,127) | | | United States Oil Fund LP ** | | | (67,596 | ) |
| | | | | | | | |
| | | | | | | (189,005 | ) |
| | | | | | | | |
| | |
| | | | Financials – (1.43)% | | | | |
| | (1,752) | | | Cincinnati Financial | | | (69,800 | ) |
| | (920) | | | Mercury General | | | (37,288 | ) |
| | | | | | | | |
| | | | | | | (107,088 | ) |
| | | | | | | | |
| | |
| | | | Healthcare – (0.58)% | | | | |
| | (1,107) | | | Emeritus ** | | | (24,852 | ) |
| | (888) | | | Insulet ** | | | (18,834 | ) |
| | | | | | | | |
| | | | | | | (43,686 | ) |
| | | | | | | | |
| | |
| | | | Industrials – (3.05)% | | | | |
| | (3,818) | | | Albany International, Class A | | | (83,881 | ) |
| | (883) | | | Deluxe | | | (27,823 | ) |
| | (983) | | | Granite Construction | | | (29,696 | ) |
| | (1,245) | | | Mobile Mini ** | | | (21,688 | ) |
| | (1,872) | | | RR Donnelley & Sons | | | (18,757 | ) |
| | (1,539) | | | Simpson Manufacturing | | | (46,878 | ) |
| | | | | | | | |
| | | | | | | (228,723 | ) |
| | | | | | | | |
| | |
| | | | Information Technology – (0.52)% | | | | |
| | (1,782) | | | RealPage ** | | | (38,901 | ) |
| | | | | | | | |
| | |
| | | | Telecommunication Services – (1.07)% | | | | |
| | (2,105) | | | CenturyLink | | | (80,790 | ) |
| | | | | | | | |
| | |
| | | | Utilities – (0.42)% | | | | |
| | (514) | | | DTE Energy | | | (31,919 | ) |
| | | | | | | | |
| Total Short Sales – (19.43)%
(Proceeds $1,426,545) | | | (1,458,611 | ) |
| | | | | | | | |
| Net Other Assets and Liabilities – 18.04% | | | 1,353,914 | |
| | | | | | | | |
| Net Assets – 100.00% | | $ | 7,506,387 | |
| | | | | | | | |
| * | | Non-income producing security. |
| ** | | No dividend payable on security sold short. |
| *** | | Aggregate cost for Federal income tax purposes is $7,579,024. |
| | | | |
Gross unrealized appreciation | | $ | 210,892 | |
Gross unrealized depreciation | | | (178,832 | ) |
| | | | |
Net unrealized appreciation | | $ | 32,060 | |
| | | | |
| (a) | | Security position is either entirely or partially held in a segregated account as collateral for securities sold short. |
| MSCI | | Morgan Stanley Capital International |
See accompanying Notes to Financial Statements.
ASTON/Barings International Fund
| | |
| |
| Portfolio Manager Commentary (unaudited) | | October 31, 2012 |
David Bertocchi, CFA
| Q. | What were the most significant market factors affecting Fund performance and returns relative to the benchmark during the past 12 months? |
| A. | For the year ended October 31, 2012, Class N Shares of the Fund returned 4.28% in US dollar terms versus the MSCI EAFE index, which returned 4.61%. The main sources of underperformance were our regional and sector allocation strategies. From a regional perspective, our overweight position in Emerging Markets was a drag on relative portfolio performance, although our underweight position in continental Europe partially alleviated this. From a sector perspective, our overweight positions in Information Technology and Energy, and our underweight position in Consumer Staples, were a drag on relative performance, although our overweight position in Healthcare and our underweight position in Utilities alleviated some of the negative impact. Overall, our stock selection produced positive results, particularly in continental Europe and Japan. |
| Q. | What were the best performing holdings for the Fund during the period? |
| A. | The largest positive impact on relative portfolio performance from an individual holding came from Sysmex, a Japanese-listed healthcare equipment manufacturer and service provider. The shares were trading at a discount to our determination of intrinsic value when we purchased the shares for the Fund. Since then, the shares have performed well due to strong operational delivery from the company. In addition, our holding in Japanese company Jupiter Telecom had a strong positive impact on portfolio performance. The company was recently the subject of a bid at a substantial premium to the undisturbed share price prior to the bid. Finally, our holding in Prudential Plc had a strongly positive impact on relative portfolio performance. The company is a UK-listed life insurer with a strongly growing Asian franchise. Continued growth of its business in Asia positively impacted its share price. |
| Q. | What were the weakest performing holdings? |
| A. | The largest negative impact on relative portfolio performance from an individual holding came from Niko Resources, a Canadian-listed emerging markets oil and gas exploration and production company. As well as drilling a number of dry wells as part of its exploration program, the company also wrote down reserves on its offshore D6 development after the company and its partner, Reliance, could not agree on adequate commercial terms with the Indian government. We see significant upside potential if the company is able to find commercial reserves as part of its drilling program, particularly in offshore Indonesia. Our holding in CentaminPlc, a UK-listed gold miner with most of its production coming from the Sukari mine in Egypt had a negative impact on portfolio performance, particularly towards the very end of the year. At this time, the company announced that an individual had filed a lawsuit against the Egyptian authorities, challenging the process by which Centamin had obtained its Sukari concession. |
| Q. | How was the Fund positioned as of October 31, 2012? |
| A. | The ongoing woes of the European economy lead us to an underweight position in continental Europe. This is manifested mostly through a significant underweight in European banks; we hold no euro-zone banks. In addition, we are heavily underweight Australia. We have concerns that the economic slowdown in China will have a substantially negative impact on the Australian economy. In addition, we have concerns that housing prices may see a substantial fall. These two underweight positions fund an overweight position in Emerging Markets, where we find an attractive risk-return trade-off in a number of names, particularly given the asset class’ superior growth prospects. At a sector level, we remain underweight Consumer Staples, where although we like the companies in the sector, we find the valuation levels too expensive to warrant profitable investment. We remain overweight the Information Technology sector, where we have a number of interesting individual stock ideas. |
Growth of a Hypothetical
$10,000 Investment—Class I
All dividends and capital gains are reinvested. Indexes are unmanaged and do not take into account fees, expenses or other costs.
Returns shown in the chart and table do not reflect taxes that a shareholder would pay on Fund distributions or on the sale of the Fund shares.
Investments made in securities of foreign companies may be less liquid and may fluctuate more widely than those traded in U.S. markets.
Emerging market securities may be subject to additional risks such as price volatility, currency fluctuation, financial reporting requirements as well as political and economic instability.
RETURNSFOR PERIOD ENDED 10/31/12
Average Annual Total Returns - Class N
| | | | |
One Year | | | 4.28 | % |
Since Inception | | | 4.20 | % |
Inception Date 03/03/10
Average Annual Total Returns - Class I
| | | | |
One Year | | | 4.72 | % |
Since Inception | | | -6.05 | % |
Inception Date 11/02/07
The performance data quoted represents past performance. Past performance does not guarantee future results. Investment return and principal value will fluctuate so that an investor’s shares, upon redemption, may be worth more or less than their original cost. Current performance may be lower or higher than the performance data quoted. For performance data current to the most recent month-end, please visit our website at www.astonfunds.com.
The performance quoted would have been lower if fee waivers and/or expense reimbursements had not been in effect.
| | |
| |
| ASTON/Barings International Fund | | October 31, 2012 |
| |
| Schedule of Investments | | |
| | | | | | | | |
Shares | | | | | Market
Value | |
| |
| | COMMON STOCKS – 97.17% | | | | |
| | |
| | | | Australia – 1.46% | | | | |
| | 33,104 | | | Newcrest Mining | | $ | 908,234 | |
| | | | | | | | |
| | |
| | | | Belgium – 1.81% | | | | |
| | 13,434 | | | Anheuser-Busch InBev | | | 1,123,273 | |
| | | | | | | | |
| | |
| | | | China – 1.27% | | | | |
| | 7,400 | | | Baidu, SP ADR * | | | 788,988 | |
| | | | | | | | |
| | |
| | | | Denmark – 1.33% | | | | |
| | 5,123 | | | Novo Nordisk, Class B | | | 825,594 | |
| | | | | | | | |
| | |
| | | | France – 6.28% | | | | |
| | 12,509 | | | Sanofi | | | 1,099,596 | |
| | 12,161 | | | Scor Se | | | 324,548 | |
| | 35,512 | | | SES | | | 982,711 | |
| | 64,173 | | | Suez Environnement | | | 681,472 | |
| | 16,159 | | | Total | | | 813,060 | |
| | | | | | | | |
| | | | | | | 3,901,387 | |
| | | | | | | | |
| | |
| | | | Germany – 8.24% | | | | |
| | 10,788 | | | Bayer | | | 939,503 | |
| | 18,365 | | | Deutsche Boerse | | | 994,041 | |
| | 9,386 | | | Fresenius | | | 1,070,572 | |
| | 7,163 | | | Muenchener Rueckversicherungs-Gesellschaft | | | 1,151,249 | |
| | 13,140 | | | SAP | | | 957,160 | |
| | | | | | | | |
| | | | | | | 5,112,525 | |
| | | | | | | | |
| | |
| | | | Hong Kong – 1.01% | | | | |
| | 45,000 | | | Sun Hung Kai Properties | | | 626,512 | |
| | | | | | | | |
| | |
| | | | India – 0.39% | | | | |
| | 19,209 | | | Niko Resources | | | 244,644 | |
| | | | | | | | |
| | | | | | | | |
Shares | | | | | Market
Value | |
| | |
| | | | Israel – 2.84% | | | | |
| | 83,586 | | | Israel Chemicals | | $ | 1,045,995 | |
| | 17,781 | | | Teva Pharmaceutical Industries, SP ADR | | | 718,708 | |
| | | | | | | | |
| | | | | | | 1,764,703 | |
| | | | | | | | |
| | |
| | | | Japan – 20.39% | | | | |
| | 10,300 | | | Daito Trust Construction | | | 1,039,935 | |
| | 14,600 | | | East Japan Railway | | | 1,002,230 | |
| | 4,400 | | | FANUC | | | 700,539 | |
| | 72,000 | | | Hitachi Metals | | | 673,732 | |
| | 26,900 | | | Honda Motor | | | 805,349 | |
| | 61,000 | | | Isuzu Motors | | | 322,460 | |
| | 738 | | | Jupiter Telecommunications | | | 1,003,044 | |
| | 2,990 | | | KEYENCE | | | 793,288 | |
| | 14,500 | | | Komatsu | | | 303,695 | |
| | 10,500 | | | Kyocera | | | 922,022 | |
| | 46,300 | | | Mitsubishi | | | 826,475 | |
| | 72,000 | | | Mitsubishi Electric | | | 537,542 | |
| | 10,500 | | | Nidec | | | 747,088 | |
| | 83,700 | | | Rakuten | | | 752,807 | |
| | 10,500 | | | Sysmex | | | 493,893 | |
| | 37,800 | | | Tokio Marine Holdings | | | 1,000,519 | |
| | 16,400 | | | Tokyo Electron | | | 736,490 | |
| | | | | | | | |
| | | | | | | 12,661,108 | |
| | | | | | | | |
| | |
| | | | Mexico – 3.50% | | | | |
| | 40,591 | | | America Movil, Class L, ADR | | | 1,026,546 | |
| | 36,925 | | | Fresnillo | | | 1,143,497 | |
| | | | | | | | |
| | | | | | | 2,170,043 | |
| | | | | | | | |
| | |
| | | | Netherlands – 3.40% | | | | |
| | 9,116 | | | ASML Holding | | | 501,574 | |
| | 12,619 | | | Fugro | | | 853,130 | |
| | 22,009 | | | Royal Dutch Shell | | | 754,677 | |
| | | | | | | | |
| | | | | | | 2,109,381 | |
| | | | | | | | |
| | |
| | | | Norway – 1.01% | | | | |
| | 28,583 | | | Subsea 7 | | | 627,179 | |
| | | | | | | | |
| | |
| | | | Papua New Guinea – 1.29% | | | | |
| | 103,595 | | | Oil Search | | | 800,078 | |
| | | | | | | | |
| | |
| | | | Russia – 1.09% | | | | |
| | 73,963 | | | Gazprom, SP ADR | | | 676,022 | |
| | | | | | | | |
| | |
| | | | Singapore – 3.07% | | | | |
| | 86,000 | | | DBS Group Holdings | | | 979,997 | |
| | 105,700 | | | Keppel | | | 923,727 | |
| | | | | | | | |
| | | | | | | 1,903,724 | |
| | | | | | | | |
| | |
| | | | South Korea – 3.47% | | | | |
| | 60,673 | | | KT, SP ADR | | | 1,028,407 | |
| | 936 | | | Samsung Electronics | | | 1,124,299 | |
| | | | | | | | |
| | | | | | | 2,152,706 | |
| | | | | | | | |
See accompanying Notes to Financial Statements.
| | |
| |
| ASTON/Barings International Fund | | October 31, 2012 |
| |
| Schedule of Investments – continued | | |
| | | | | | | | |
Shares | | | | | Market
Value | |
| | |
| | | | Sweden – 2.90% | | | | |
| | 62,828 | | | Elekta AB, B Shares | | $ | 895,121 | |
| | 137,120 | | | TeliaSonera | | | 902,777 | |
| | | | | | | | |
| | | | | | | 1,797,898 | |
| | | | | | | | |
| | |
| | | | Switzerland – 8.16% | | | | |
| | 29,721 | | | Julius Baer Group | | | 1,030,805 | |
| | 4,321 | | | Roche Holding | | | 830,979 | |
| | 2,549 | | | Syngenta | | | 995,733 | |
| | 78,583 | | | UBS | | | 1,177,943 | |
| | 4,190 | | | Zurich Financial Services | | | 1,032,540 | |
| | | | | | | | |
| | | | | | | 5,068,000 | |
| | | | | | | | |
| | |
| | | | United Kingdom – 24.26% | | | | |
| | 50,639 | | | Admiral Group | | | 905,450 | |
| | 37,899 | | | BG Group | | | 701,811 | |
| | 18,592 | | | British American Tobacco | | | 920,944 | |
| | 66,323 | | | Cairn Energy PLC | | | 300,004 | |
| | 445,208 | | | Centamin * | | | 416,707 | |
| | 28,520 | | | Experian | | | 492,462 | |
| | 41,050 | | | GlaxoSmithKline | | | 918,486 | |
| | 154,154 | | | ICAP | | | 808,744 | |
| | 26,795 | | | Imperial Tobacco Group | | | 1,011,834 | |
| | 86,002 | | | Prudential | | | 1,177,606 | |
| | 9,208 | | | Randgold Resources | | | 1,099,604 | |
| | 216,390 | | | Resolution | | | 762,308 | |
| | 57,474 | | | Rolls-Royce Holdings | | | 792,543 | |
| | 4,368,024 | | | Rolls-Royce Holdings, C Shares * (a) (b) | | | 7,049 | |
| | 26,758 | | | SABMiller | | | 1,146,241 | |
| | 29,188 | | | Shire | | | 820,996 | |
| | 35,287 | | | Standard Chartered | | | 833,387 | |
| | 31,265 | | | Tullow Oil | | | 708,378 | |
| | 95,917 | | | WPP | | | 1,237,524 | |
| | | | | | | | |
| | | | | | | 15,062,078 | |
| | | | | | | | |
| | |
| | | | Total Common Stocks
(Cost $59,216,083) | | | 60,324,077 | |
| | | | | | | | |
|
| | INVESTMENT COMPANY – 2.66% | |
| | |
| | 1,653,984 | | | BlackRock Liquidity Funds
TempCash Portfolio | | | 1,653,984 | |
| | | | | | | | |
| | |
| | | | Total Investment Company
(Cost $1,653,984) | | | 1,653,984 | |
| | | | | | | | |
| Total Investments – 99.83%
(Cost $60,870,067)** | | | 61,978,061 | |
| | | | | | | | |
| Net Other Assets and Liabilities – 0.17% | | | 105,595 | |
| | | | | | | | |
| Net Assets – 100.00% | | $ | 62,083,656 | |
| | | | | | | | |
| * | | Non-income producing security. |
| ** | | Aggregate cost for Federal income tax purposes is $61,184,602. |
| | | | |
Gross unrealized appreciation | | $ | 5,930,199 | |
Gross unrealized depreciation | | | (5,136,740 | ) |
| | | | |
Net unrealized appreciation | | $ | 793,459 | |
| | | | |
| (a) | | Security with a total aggregate market value of $7,049 or 0.01% of the net assets, was valued under the fair value procedures established by the Funds’ Board of Trustees. |
| (b) | | This security has been determined by the Subadviser to be an illiquid security. At October 31, 2012, this security amounted to $7,049 or 0.01% of net assets. |
| ADR | | American Depositary Receipt |
| SP ADR | | Sponsored American Depositary Receipt |
See accompanying Notes to Financial Statements.
ASTON/Harrison Street Real Estate Fund
| | |
| |
| Portfolio Manager Commentary (unaudited) | | October 31, 2012 |
| | | | |
| | | James Kammert, CFA & Reagan Pratt | |
| Q. | What were the most significant market factors affecting Fund performance and returns relative to the benchmark during the past 12 months? |
| A. | Stock selection and an underweight position in mostly underperforming large-cap real estate investment trusts (REITs) aided relative performance during the period, while strong stock selection across the mid- and small-cap portions of the real estate sector also generated positive performance. A “risk-on” market environment for much of the past 12 months favored more growth-oriented mid- and small-cap REITs. Broad investor demand for higher yields also favored the securities at the smaller end of the sector relative to the perceived “safety” of large-caps. |
| Q. | What were the best performing holdings for the Fund during the period? |
| A. | Positions in small-cap Sabra Health Care, an owner of assisted living facilities and nursing homes, and STAG Industrial, a middle market focused industrial/warehouse landlord each delivered total returns that were multiples of the Fund’s benchmark index. Both were highly acquisitive in their respective sectors and offered investors appealing discounted valuations relative to their peers, complemented by higher dividend yields. At the other end of the spectrum, a consistent overweight position in national mall owner Simon Properties Group, the largest REIT in the industry, outdistanced the benchmark given its sequential dividend growth and strong operating results. A timely position in large-cap, international industrial owner Prologis also boosted results as it was held in the portfolio during a span when it bounced from a discount cash flow multiple to fair value, leading us to sell the position. Mid-cap mall owner CBL & Associates continued to close the relative valuation gap |
| | with its larger cap peers and contributed positively to portfolio performance. |
| Q. | What were the weakest performing holdings? |
| A. | After an extended, multi-year span of outperformance, shares of the data center landlords DuPont Fabros Technology and Digital Realty Trust rolled over during the late summer and early fall of 2012, crimping performance. Although operating results continued to come in as expected for both, investor concerns relating to prospective rental rates/pricing power and data center space demand in the face of continued sluggish corporate capital spending/decision-making pressured the shares heavily. Despite sound, sustained operating metrics national apartment owner/developer UDR lagged its apartment peers and the benchmark. |
| Q. | How was the Fund positioned as of October 31, 2012? |
| A. | Despite the underperformance of large-cap REITs, we continue to think that relative valuation among mid- and small-cap companies remains more attractive as a whole. The valuation discrepancies among market-capitalizations tend to be more enduring and take longer to play out over time. Thus, at present, the portfolio remains tilted toward mid- and small-cap allocations (70% of assets) and underweight (30%) large-cap names. Meanwhile, we think our disciplined, bottom-up valuation screens allow us to identify relative value across the capitalization spectrum and tilt the portfolio toward stocks exhibiting visible external growth opportunities (acquisitions and largely pre-lease development) and stabilizing internal metrics (occupancy and rental rates) which should collectively translate to higher overall cash flow and dividend growth. |
Growth of a Hypothetical
$10,000 Investment—Class N
All dividends and capital gains are reinvested. Indexes are unmanaged and do not take into account fees, expenses or other costs.
Returns shown in the chart and table do not reflect taxes that a shareholder would pay on Fund distributions or on the sale of the Fund shares.
Real estate funds may be subject to a higher degree of market risk than diversified funds because of the concentration in a specific industry or geographical sector. Risks also include declines in the value of real estate, general and economic conditions, changes in the value of underlying property and defaults by borrowers.
RETURNSFOR PERIOD ENDED 10/31/12
Average Annual Total Returns - Class N
| | | | |
One Year | | | 17.85 | % |
Five Year | | | 0.95 | % |
Ten Year | | | 11.50 | % |
Since Inception | | | 8.65 | % |
Inception Date 12/30/97
Average Annual Total Returns - Class I
| | | | |
One Year | | | 18.16 | % |
Five Year | | | 1.19 | % |
Since Inception | | | 5.12 | % |
Inception Date 09/20/05
The performance data quoted represents past performance. Past performance does not guarantee future results. Investment return and principal value will fluctuate so that an investor’s shares, upon redemption, may be worth more or less than their original cost. Current performance may be lower or higher than the performance data quoted. For performance data current to the most recent month-end, please visit our website at www.astonfunds.com.
The performance quoted would have been lower if fee waivers and/or expense reimbursements had not been in effect.
The total expense ratio for the Class N and Class I Shares is 1.69% and 1.44% respectively, as disclosed in the prospectus dated March 1, 2012. The performance quoted would have been lower if waivers had not been in effect. Please refer to the Financial Highlights section in this report for more 2012 fiscal year-end related information.
| | |
| |
| ASTON/Harrison Street Real Estate Fund | | October 31, 2012 |
| |
| Schedule of Investments | | |
| | | | | | | | |
Shares | | | | | Market
Value | |
|
| | COMMON STOCKS – 99.15% | |
| | |
| | | | Diversified – 21.91% | | | | |
| | 12,200 | | | American Tower | | $ | 918,539 | |
| | 5,700 | | | Digital Realty Trust | | | 350,151 | |
| | 5,700 | | | Dundee Real Estate Investment Trust (Canada) | | | 209,166 | |
| | 13,300 | | | Dupont Fabros Technology | | | 285,418 | |
| | 4,500 | | | Entertainment Properties Trust | | | 200,025 | |
| | 7,100 | | | Rayonier | | | 347,971 | |
| | | | | | | | |
| | | | | | | 2,311,270 | |
| | | | | | | | |
| | |
| | | | Healthcare – 14.37% | | | | |
| | 14,500 | | | Health Care, REIT | | | 861,735 | |
| | 27,500 | | | Medical Properties Trust | | | 315,700 | |
| | 15,220 | | | Sabra Health Care | | | 338,188 | |
| | | | | | | | |
| | | | | | | 1,515,623 | |
| | | | | | | | |
| | |
| | | | Hotels – 5.74% | | | | |
| | 11,100 | | | LaSalle Hotel Properties | | | 265,734 | |
| | 13,600 | | | Orient-Express Hotels, Class A (Bermuda)* | | | 159,528 | |
| | 10,100 | | | RLJ Lodging Trust | | | 179,982 | |
| | | | | | | | |
| | | | | | | 605,244 | |
| | | | | | | | |
| | |
| | | | Industrial – 4.02% | | | | |
| | 19,500 | | | CubeSmart | | | 255,840 | |
| | 9,700 | | | STAG Industrial | | | 168,004 | |
| | | | | | | | |
| | | | | | | 423,844 | |
| | | | | | | | |
| | |
| | | | Office Properties – 14.51% | | | | |
| | 4,500 | | | Alexandria Real Estate Equities | | | 316,935 | |
| | 20,300 | | | BioMed Realty Trust | | | 388,136 | |
| | 10,200 | | | Corporate Office Properties Trust | | | 254,490 | |
| | 7,575 | | | SL Green Realty | | | 570,398 | |
| | | | | | | | |
| | | | | | | 1,529,959 | |
| | | | | | | | |
| | | | | | | | |
Shares | | | | | Market
Value | |
| | |
| | | | Residential – 14.80% | | | | |
| | 13,400 | | | Apartment Investment & Management, Class A | | $ | 357,646 | |
| | 5,100 | | | Camden Property Trust | | | 334,713 | |
| | 2,200 | | | Essex Property Trust | | | 330,000 | |
| | 3,900 | | | Mid-America Apartment Communities | | | 252,369 | |
| | 11,800 | | | UDR | | | 286,386 | |
| | | | | | | | |
| | | | | | | 1,561,114 | |
| | | | | | | | |
| | |
| | | | Retail – 23.80% | | | | |
| | 10,200 | | | CBL & Associates Properties | | | 228,174 | |
| | 2,700 | | | Federal Realty Investment Trust | | | 291,141 | |
| | 17,000 | | | General Growth Properties | | | 334,220 | |
| | 19,700 | | | Inland Real Estate | | | 160,949 | |
| | 19,700 | | | Kimco Realty | | | 384,544 | |
| | 7,300 | | | Simon Property Group | | | 1,111,133 | |
| | | | | | | | |
| | | | | | | 2,510,161 | |
| | | | | | | | |
| | |
| | | | Total Common Stocks
(Cost $9,877,857) | | | 10,457,215 | |
| | | | | | | | |
|
| | INVESTMENT COMPANY – 1.74% | |
| | |
| | 183,700 | | | BlackRock Liquidity Funds TempCash Portfolio | | | 183,700 | |
| | | | | | | | |
| | |
| | | | Total Investment Company
(Cost $183,700) | | | 183,700 | |
| | | | | | | | |
| Total Investments – 100.89%
(Cost $10,061,557)** | | | 10,640,915 | |
| | | | | | | | |
| Net Other Assets and Liabilities – (0.89)% | | | (94,311 | ) |
| | | | | | | | |
| Net Assets – 100.00% | | $ | 10,546,604 | |
| | | | | | | | |
| * | | Non-income producing security. |
| ** | | Aggregate cost for Federal income tax purposes is $10,193,571. |
| | | | |
Gross unrealized appreciation | | $ | 735,832 | |
Gross unrealized depreciation | | | (288,488 | ) |
| | | | |
Net unrealized appreciation | | $ | 447,344 | |
| | | | |
| REIT | | Real Estate Investment Trust |
See accompanying Notes to Financial Statements.
ASTON/Montag & Caldwell Balanced Fund
| | |
| |
| Portfolio Manager Commentary (unaudited) | | October 31, 2012 |
Ronald E. Canakaris, CFA, CIC
| Q. | What were the most significant market factors affecting Fund performance and returns relative to the benchmark during the past 12 months? |
| A. | The Fund’s Class N Shares generated a solid gain of 8.03% during the past year. The equity returns modestly trailed the Russell 1000 Growth Index and the S&P 500. The Fund benefited from good stock selection in the Information Technology, Materials and Industrials sectors, as well as the underweight position to the Energy sector. This was offset by negative stock selection in the Energy and Consumer Discretionary sectors, the Fund’s cash reserve and an underweight position in Information Technology relative to the Russell 1000 Growth Index. The fixed income returns lagged the Barclays U.S. Government Credit Index, as interest rates defied expectations and fell during the period. The Fund has continued to maintain a duration that is shorter than the benchmark, as low yield levels do not offer a compelling risk/reward tradeoff. The Fund owns corporate bonds rated A or higher, while the Index has a weighting of approximately 13% in BBB bonds, which significantly outperformed during the period. |
| Q. | What were the best performing holdings for the Fund during the period? |
| A. | Visa was the Fund’s top performing stock for the 12-month period as the company continues to enjoy strong revenue and earnings growth despite the increased regulatory environment. While Apple was the Fund’s second best performing stock on an absolute basis, the Fund’s weighting in the stock is less than the Russell 1000 Growth Index and thus the underweight position detracted from relative performance. TJX had another year of strong gains as the company continues to benefit from consumers’ focus on value in the weak economic environment. The Fund established a position in Amazon and the stock performed very well during the period, triggering a sale as the stock appreciated to a 20% premium to our estimated present value. eBay was purchased during the period and rose as the |
| | company continues to benefit from growth in online commerce and it has become a leader in online payments with its PayPal division. |
| Q. | What were the weakest performing holdings? |
| A. | We initiated a position in Juniper Networks during the period after the stock had been weak, but it declined further subsequent to our purchase. Juniper is well positioned to benefit from the company’s five new product launches and a return to normal carrier spending patterns in 2013. Occidental Petroleum was weak, as the company has experienced rising costs, which tempered investors’ enthusiasm for the company’s above industry production growth. A position was established in Starbuck’s during the period, but the stock declined after the purchase, as revenues were less than expected over the summer due to the weak economic environment. The company has domestic and international growth opportunities and is benefiting from declining commodity costs. JP Morgan declined during the period and was eliminated as financial stocks continued to suffer multiple compression. |
| Q. | How was the Fund positioned as of October 31, 2012? |
| A. | While central bank actions are supportive of share prices, the market may have gotten ahead of its fundamentals, and it would not be surprising if the period ahead is more challenging. Corporate profit expectations seem too high with global growth slowing and profit margins near record levels and it is uncertain if the fiscal cliff will be dealt with effectively after the election. We believe the outlook for the higher quality growth stocks held in the Fund is very promising. The shares of these companies are reasonably valued, and their earnings growth is more assured due to their financial strength and global diversification. The bond portion of the Fund continues to have a duration that is shorter than the benchmark and is overweight high quality intermediate corporate bonds. |
Growth of a Hypothetical
$10,000 Investment—Class N
All dividends and capital gains are reinvested. Indexes are unmanaged and do not take into account fees, expenses or other costs.
Returns shown in the chart and table do not reflect taxes that a shareholder would pay on Fund distributions or on the sale of the Fund shares.
The Fund is subject to interest rate risk associated with the underlying bond holdings in the portfolio. The value of the Fund can decline as interest rates rise and an investor can lose principal.
RETURNSFOR PERIOD ENDED 10/31/12
Average Annual Total Returns - Class N
| | | | |
One Year | | | 8.03 | % |
Five Year | | | 2.78 | % |
Ten Year | | | 5.24 | % |
Since Inception | | | 7.45 | % |
Inception Date 11/02/94
Average Annual Total Returns - Class I
| | | | |
One Year | | | 8.14 | % |
Five Year | | | 2.94 | % |
Ten Year | | | 5.45 | % |
Since Inception | | | 3.47 | % |
Inception Date 12/31/98
The performance data quoted represents past performance. Past performance does not guarantee future results. Investment return and principal value will fluctuate so that an investor’s shares, upon redemption, may be worth more or less than their original cost. Current performance may be lower or higher than the performance data quoted. For performance data current to the most recent month-end, please visit our website at www.astonfunds.com.
The performance quoted would have been lower if fee waivers and/or expense reimbursements had not been in effect.
The total expense ratio for the N class and I class is 1.61% and 1.36% respectively, as disclosed in the prospectus dated March 1, 2012. Please refer to the Financial Highlights section in this report for more 2012 fiscal year-end related information.
| | |
| |
| ASTON/Montag & Caldwell Balanced Fund | | October 31, 2012 |
| |
| Schedule of Investments | | |
| | | | | | | | |
Shares | | | | | Market
Value | |
|
| | COMMON STOCKS – 54.69% | |
| | |
| | | | Consumer Discretionary – 5.92% | | | | |
| | 6,600 | | | Bed Bath & Beyond * | | $ | 380,688 | |
| | 3,900 | | | Las Vegas Sands | | | 181,116 | |
| | 3,500 | | | McDonald’s | | | 303,800 | |
| | 2,650 | | | NIKE, Class B | | | 242,157 | |
| | 4,050 | | | Omnicom Group | | | 194,036 | |
| | 9,100 | | | Starbucks | | | 417,690 | |
| | 6,250 | | | TJX | | | 260,188 | |
| | | | | | | | |
| | | | | | | 1,979,675 | |
| | | | | | | | |
| | |
| | | | Consumer Staples – 15.36% | | | | |
| | 24,000 | | | Coca-Cola | | | 892,320 | |
| | 5,916 | | | Colgate-Palmolive | | | 620,943 | |
| | 6,100 | | | Costco Wholesale | | | 600,423 | |
| | 7,816 | | | Kraft Foods Group * | | | 355,472 | |
| | 26,550 | | | Mondelez International, Class A | | | 704,637 | |
| | 6,720 | | | PepsiCo | | | 465,293 | |
| | 7,400 | | | Philip Morris International | | | 655,344 | |
| | 6,250 | | | Procter & Gamble | | | 432,750 | |
| | 11,300 | | | Unilever (Netherlands) | | | 414,597 | |
| | | | | | | | |
| | | | | | | 5,141,779 | |
| | | | | | | | |
| | |
| | | | Energy – 4.14% | | | | |
| | 9,900 | | | Cameron International * | | | 501,336 | |
| | 7,200 | | | Occidental Petroleum | | | 568,512 | |
| | 4,550 | | | Schlumberger | | | 316,362 | |
| | | | | | | | |
| | | | | | | 1,386,210 | |
| | | | | | | | |
| | |
| | | | Financials – 1.36% | | | | |
| | 13,500 | | | Wells Fargo | | | 454,815 | |
| | | | | | | | |
| | |
| | | | Healthcare – 8.94% | | | | |
| | 13,450 | | | Abbott Laboratories | | | 881,244 | |
| | 7,250 | | | Allergan | | | 651,920 | |
| | 10,750 | | | AmerisourceBergen | | | 423,980 | |
| | | | | | | | |
Shares | | | | | Market
Value | |
| | |
| | | | Healthcare (continued) | | | | |
| | 9,865 | | | Express Scripts * | | $ | 607,092 | |
| | 8,150 | | | Stryker | | | 428,690 | |
| | | | | | | | |
| | | | | | | 2,992,926 | |
| | | | | | | | |
| | |
| | | | Industrials – 3.88% | | | | |
| | 39,100 | | | General Electric | | | 823,446 | |
| | 6,500 | | | United Parcel Service, Class B | | | 476,125 | |
| | | | | | | | |
| | | | | | | 1,299,571 | |
| | | | | | | | |
| | |
| | | | Information Technology – 12.94% | | | | |
| | 4,750 | | | Accenture, Class A (Ireland) | | | 320,198 | |
| | 1,187 | | | Apple | | | 706,384 | |
| | 8,600 | | | eBay * | | | 415,294 | |
| | 7,200 | | | EMC * | | | 175,824 | |
| | 592 | | | Google, Class A * | | | 402,424 | |
| | 21,660 | | | Juniper Networks * | | | 358,906 | |
| | 18,800 | | | Oracle | | | 583,740 | |
| | 12,900 | | | Qualcomm | | | 755,617 | |
| | 4,400 | | | Visa, Class A | | | 610,544 | |
| | | | | | | | |
| | | | | | | 4,328,931 | |
| | | | | | | | |
| | |
| | | | Materials – 2.15% | | | | |
| | 8,350 | | | Monsanto | | | 718,685 | |
| | | | | | | | |
| | |
| | | | Total Common Stocks
(Cost $16,015,205) | | | 18,302,592 | |
| | | | | | | | |
Par Value | | | | | | |
|
| | CORPORATE NOTES AND BONDS – 23.19% | |
| | |
| | | | Consumer Staples – 4.08% | | | | |
| | $350,000 | | | Coca-Cola
Senior Unsecured Notes
5.350%, 11/15/17 | | | 421,630 | |
| | 400,000 | | | PepsiCo
Senior Unsecured Notes
5.000%, 06/01/18 | | | 475,769 | |
| | 450,000 | | | Wal-Mart Stores
Senior Unsecured Notes
3.200%, 05/15/14 | | | 469,242 | |
| | | | | | | | |
| | | | | | | 1,366,641 | |
| | | | | | | | |
| | |
| | | | Energy – 0.30% | | | | |
| | 95,000 | | | ConocoPhillips
4.750%, 02/01/14 | | | 100,028 | |
| | | | | | | | |
| | |
| | | | Financials – 5.62% | | | | |
| | 425,000 | | | General Electric Capital
Senior Unsecured Notes, MTN 4.375%, 09/16/20 | | | 475,985 | |
| | 450,000 | | | JPMorgan Chase
Senior Unsecured Notes
4.350%, 08/15/21 | | | 503,449 | |
| | 400,000 | | | U.S. Bancorp
Senior Unsecured Notes
4.200%, 05/15/14 | | | 422,749 | |
See accompanying Notes to Financial Statements.
| | |
| |
| ASTON/Montag & Caldwell Balanced Fund | | October 31, 2012 |
| |
| Schedule of Investments – continued | | |
| | | | | | | | |
Par Value | | | | | Market
Value | |
| | |
| | | | Financials (continued) | | | | |
| | $450,000 | | | Wells Fargo
Senior Unsecured Notes, MTN, Series 1 3.750%, 10/01/14 | | $ | 477,789 | |
| | | | | | | | |
| | | | | | | 1,879,972 | |
| | | | | | | | |
| | |
| | | | Healthcare – 3.96% | | | | |
| | 400,000 | | | Abbott Laboratories
Senior Unsecured Notes
4.350%, 03/15/14 | | | 421,706 | |
| | 300,000 | | | Johnson & Johnson
Senior Unsecured Notes
5.950%, 08/15/37 | | | 428,863 | |
| | 450,000 | | | Medtronic
Senior Unsecured Notes
3.000%, 03/15/15 | | | 474,431 | |
| | | | | | | | |
| | | | | | | 1,325,000 | |
| | | | | | | | |
| | |
| | | | Industrials – 3.07% | | | | |
| | 450,000 | | | United Parcel Service
Senior Unsecured Notes
3.125%, 01/15/21 | | | 489,038 | |
| | 500,000 | | | United Technologies
Senior Unsecured Notes
3.100%, 06/01/22 | | | 538,960 | |
| | | | | | | | |
| | | | | | | 1,027,998 | |
| | | | | | | | |
| | |
| | | | Information Technology – 4.78% | | | | |
| | 400,000 | | | Cisco Systems
Senior Unsecured Notes
5.500%, 02/22/16 | | | 463,194 | |
| | 400,000 | | | Google
Senior Unsecured Notes
3.625%, 05/19/21 | | | 450,018 | |
| | 300,000 | | | Hewlett-Packard
Senior Unsecured Notes
4.500%, 03/01/13 | | | 303,286 | |
| | 375,000 | | | Oracle
Senior Unsecured Notes
4.950%, 04/15/13 | | | 382,619 | |
| | | | | | | | |
| | | | | | | 1,599,117 | |
| | | | | | | | |
| | |
| | | | Telecommunication Services – 1.38% | | | | |
| | 400,000 | | | Verizon Communications
Senior Unsecured Notes
5.550%, 02/15/16 | | | 460,653 | |
| | | | | | | | |
| | |
| | | | Total Corporate Notes and Bonds
(Cost $7,324,758) | | | 7,759,409 | |
| | | | | | | | |
|
| | U.S. GOVERNMENT AND AGENCY OBLIGATIONS – 15.32% | |
| | |
| | | | Fannie Mae – 0.95% | | | | |
| | 250,000 | | | 0.500%, 07/02/15 | | | 250,763 | |
| | 16,890 | | | 7.500%, 02/01/35,
Pool # 787557 | | | 20,802 | |
| | 5,115 | | | 7.500%, 04/01/35,
Pool # 819231 | | | 6,033 | |
| | | | | | | | |
Par Value | | | | | Market
Value | |
| | |
| | | | Fannie Mae (continued) | | | | |
| | $34,969 | | | 6.000%, 11/01/35,
Pool # 844078 | | $ | 39,100 | |
| | | | | | | | |
| | | | | | | 316,698 | |
| | | | | | | | |
| | |
| | | | Freddie Mac – 2.02% | | | | |
| | 200,000 | | | 4.500%, 01/15/13 | | | 201,793 | |
| | 450,000 | | | 1.000%, 09/29/17 | | | 453,750 | |
| | 18,293 | | | 5.500%, 12/01/20,
Gold Pool # G11820 | | | 19,946 | |
| | | | | | | | |
| | | | | | | 675,489 | |
| | | | | | | | |
| |
| | | | Government National Mortgage Association – 0.09% | |
| | 26,883 | | | 5.500%, 02/15/39,
Pool # 698060 | | | 29,712 | |
| | | | | | | | |
| | |
| | | | U.S. Treasury Bonds – 2.40% | | | | |
| | 375,000 | | | 5.375%, 02/15/31 | | | 539,355 | |
| | 250,000 | | | 3.125%, 11/15/41 | | | 264,414 | |
| | | | | | | | |
| | | | | | | 803,769 | |
| | | | | | | | |
| | |
| | | | U.S. Treasury Notes – 9.86% | | | | |
| | 350,000 | | | 0.250%, 02/15/15 | | | 349,453 | |
| | 400,000 | | | 4.000%, 02/15/15 | | | 433,438 | |
| | 300,000 | | | 4.500%, 02/15/16 | | | 339,750 | |
| | 475,000 | | | 2.625%, 04/30/16 | | | 510,514 | |
| | 425,000 | | | 4.625%, 02/15/17 | | | 497,316 | |
| | 500,000 | | | 3.125%, 05/15/19 | | | 566,407 | |
| | 575,000 | | | 2.125%, 08/15/21 | | | 604,558 | |
| | | | | | | | |
| | | | | | | 3,301,436 | |
| | | | | | | | |
| | |
| | | | Total U.S. Government and Agency Obligations
(Cost $4,868,465) | | | 5,127,104 | |
| | | | | | | | |
Shares | | | | | | |
| |
| | INVESTMENT COMPANY – 6.39% | | | | |
| | |
| | 2,139,288 | | | BlackRock Liquidity Funds TempCash Portfolio | | | 2,139,288 | |
| | | | | | | | |
| | |
| | | | Total Investment Company
(Cost $2,139,288) | | | 2,139,288 | |
| | | | | | | | |
| Total Investments – 99.59%
(Cost $30,347,716)** | | | 33,328,393 | |
| | | | | | | | |
| Net Other Assets and Liabilities – 0.41% | | | 137,862 | |
| | | | | | | | |
| Net Assets – 100.00% | | $ | 33,466,255 | |
| | | | | | | | |
| * | | Non-income producing security. |
| ** | | Aggregate cost for Federal income tax purposes is $30,726,840. |
| | | | |
Gross unrealized appreciation | | $ | 3,146,060 | |
Gross unrealized depreciation | | | (544,507 | ) |
| | | | |
Net unrealized appreciation | | $ | 2,601,553 | |
| | | | |
See accompanying Notes to Financial Statements.
This page intentionally left blank.
| | |
| |
| | October 31, 2012 |
| |
| Statements of Assets and Liabilities | | |
| | | | | | | | |
| | |
| | |
Montag & Caldwell
Growth Fund | | | Veredus Select
Growth Fund | |
| | | | | | | | |
| | |
ASSETS: | | | | | | | | |
Investments: | | | | | | | | |
Investments at cost | | $ | 3,855,999,934 | | | $ | 11,479,485 | |
Net unrealized appreciation (depreciation) | | | 467,166,990 | | | | 833,412 | |
| | | | | | | | |
Total investments at value | | | 4,323,166,924 | | | | 12,312,897 | |
Receivables: | | | | | | | | |
Dividends and interest | | | 4,136,310 | | | | 8,029 | |
Dividend reclaims | | | — | | | | — | |
Fund shares sold | | | 11,604,489 | | | | 4,856 | |
Investments sold | | | 28,794,991 | | | | — | |
Due from Adviser, net (Note G) | | | — | | | | — | |
Deferred offering costs (Note B-13) | | | — | | | | — | |
Other assets | | | 18,702 | | | | 314 | |
| | | | | | | | |
Total assets | | | 4,367,721,416 | | | | 12,326,096 | |
| | | | | | | | |
| | |
LIABILITIES: | | | | | | | | |
Payables: | | | | | | | | |
Dividend distribution | | | — | | | | — | |
Investments purchased | | | 10,522,744 | | | | 182,220 | |
Fund shares redeemed | | | 30,244,552 | | | | 5,120 | |
Due to Adviser, net (Note G) | | | 2,400,698 | | | | 6,804 | |
Administration fees (Note G) | | | 165,308 | | | | 1,943 | |
Distribution fees (Note G) | | | 79,205 | | | | 434 | |
Audit and tax fees | | | 22,457 | | | | 13,110 | |
Transfer agent fees | | | 482,094 | | | | 9,749 | |
Registration fees | | | 11,277 | | | | 13,114 | |
Trustees fees and related expenses (Note G) | | | 2,303 | | | | 7 | |
Offering costs | | | — | | | | — | |
Accrued expenses and other payables | | | 211,897 | | | | 2,056 | |
| | | | | | | | |
Total liabilities | | | 44,142,535 | | | | 234,557 | |
| | | | | | | | |
NET ASSETS | | $ | 4,323,578,881 | | | $ | 12,091,539 | |
| | | | | | | | |
| | |
NET ASSETS CONSIST OF: | | | | | | | | |
Paid in capital | | $ | 3,566,987,279 | | | $ | 28,941,960 | |
Accumulated undistributed (distribution in excess of) net investment income | | | 23,270,805 | | | | 174,730 | |
Accumulated net realized gain (loss) on investments and purchased options | | | 266,153,807 | | | | (17,858,563 | ) |
Net unrealized appreciation (depreciation) on investments and purchased options | | | 467,166,990 | | | | 833,412 | |
| | | | | | | | |
TOTAL NET ASSETS | | $ | 4,323,578,881 | | | $ | 12,091,539 | |
| | | | | | | | |
Class N: | | | | | | | | |
Net Assets | | $ | 1,908,662,599 | | | $ | 10,613,664 | |
Shares of beneficial interest outstanding (unlimited authorization) | | | 75,413,333 | | | | 957,448 | |
NET ASSET VALUE Offering and redemption price per share
(Net Assets/Shares Outstanding) | | $ | 25.31 | | | $ | 11.09 | |
| | | | | | | | |
Class I: | | | | | | | | |
Net Assets | | $ | 2,406,145,380 | | | $ | 1,477,875 | |
Shares of beneficial interest outstanding (unlimited authorization) | | | 94,494,505 | | | | 131,319 | |
NET ASSET VALUE Offering and redemption price per share
(Net Assets/Shares Outstanding) | | $ | 25.46 | | | $ | 11.25 | |
| | | | | | | | |
Class R: | | | | | | | | |
Net Assets | | $ | 8,770,902 | | | $ | — | |
Shares of beneficial interest outstanding (unlimited authorization) | | | 350,558 | | | | — | |
NET ASSET VALUE Offering and redemption price per share
(Net Assets/Shares Outstanding) | | $ | 25.02 | | | $ | — | |
| | | | | | | | |
See accompanying Notes to Financial Statements.
| | | | | | | | | | | | | | | | | | | | | | | | | | |
| | | | | | |
TAMRO
Diversified
Equity Fund | | | Herndon
Large Cap
Value Fund | | | Cornerstone
Large Cap
Value Fund | | | River Road
Dividend All
Cap Value Fund | | | River Road
Dividend All
Cap Value Fund II | | | Fairpointe
Mid Cap
Fund | | | Montag & Caldwell
Mid Cap
Growth Fund | |
| | | | | | | | | | | | | | | | | | | | | | | | | | |
| | | | | | |
| | | | | | | | | | | | | | | | | | | | | | | | | | |
| | | | | | | | | | | | | | | | | | | | | | | | | | |
| $ | 18,104,189 | | | $ | 54,857,773 | | | $ | 24,518,444 | | | $ | 829,507,638 | | | $ | 10,341,668 | | | $ | 2,533,889,631 | | | $ | 6,517,095 | |
| | 4,367,557 | | | | 859,759 | | | | 1,629,904 | | | | 93,049,759 | | | | (47,353 | ) | | | 486,851,410 | | | | 872,985 | |
| | | | | | | | | | | | | | | | | | | | | | | | | | |
| | 22,471,746 | | | | 55,717,532 | | | | 26,148,348 | | | | 922,557,397 | | | | 10,294,315 | | | | 3,020,741,041 | | | | 7,390,080 | |
| | | | | | | | | | | | | | | | | | | | | | | | | | |
| | 4,623 | | | | 50,677 | | | | 29,404 | | | | 3,229,852 | | | | 36,723 | | | | 2,543,010 | | | | 778 | |
| | — | | | | — | | | | 361 | | | | 1,182 | | | | — | | | | — | | | | — | |
| | 16,101 | | | | 10,850 | | | | 390,211 | | | | 1,442,381 | | | | 149,950 | | | | 6,222,320 | | | | 1,668 | |
| | 263,548 | | | | 15,167 | | | | — | | | | — | | | | — | | | | 8,282,494 | | | | — | |
| | 211 | | | | — | | | | — | | | | — | | | | — | | | | — | | | | — | |
| | — | | | | — | | | | — | | | | — | | | | 42,384 | | | | — | | | | — | |
| | 120 | | | | 119 | | | | 139 | | | | 3,744 | | | | — | | | | 14,692 | | | | 24 | |
| | | | | | | | | | | | | | | | | | | | | | | | | | |
| | 22,756,349 | | | | 55,794,345 | | | | 26,568,463 | | | | 927,234,556 | | | | 10,523,372 | | | | 3,037,803,557 | | | | 7,392,550 | |
| | | | | | | | | | | | | | | | | | | | | | | | | | |
| | | | | | |
| | | | | | | | | | | | | | | | | | | | | | | | | | |
| | | | | | | | | | | | | | | | | | | | | | | | | | |
| | — | | | | — | | | | — | | | | 420,712 | | | | 1,164 | | | | — | | | | — | |
| | 141,714 | | | | 302,343 | | | | — | | | | — | | | | — | | | | — | | | | — | |
| | 31,937 | | | | 6,182 | | | | 12,677 | | | | 1,862,468 | | | | 4,672 | | | | 9,486,783 | | | | — | |
| | — | | | | 45,301 | | | | 17,295 | | | | 550,018 | | | | 1,914 | | | | 1,846,214 | | | | 403 | |
| | 2,389 | | | | 3,577 | | | | 2,348 | | | | 36,828 | | | | 1,557 | | | | 118,066 | | | | 1,765 | |
| | 902 | | | | 848 | | | | 864 | | | | 13,838 | | | | 43 | | | | 63,770 | | | | 298 | |
| | 13,110 | | | | 13,360 | | | | 15,437 | | | | 16,187 | | | | 17,406 | | | | 22,457 | | | | 13,110 | |
| | 10,270 | | | | 7,335 | | | | 9,377 | | | | 81,211 | | | | 6,193 | | | | 330,300 | | | | 3,604 | |
| | 5,243 | | | | 4,943 | | | | 5,243 | | | | 4,943 | | | | 4,943 | | | | 8,618 | | | | 2,809 | |
| | 12 | | | | 30 | | | | 14 | | | | 474 | | | | 3 | | | | 1,588 | | | | 4 | |
| | — | | | | — | | | | — | | | | — | | | | 65,000 | | | | — | | | | — | |
| | 1,795 | | | | 3,474 | | | | 2,340 | | | | 38,509 | | | | 1,237 | | | | 194,129 | | | | 1,607 | |
| | | | | | | | | | | | | | | | | | | | | | | | | | |
| | 207,372 | | | | 387,393 | | | | 65,595 | | | | 3,025,188 | | | | 104,132 | | | | 12,071,925 | | | | 23,600 | |
| | | | | | | | | | | | | | | | | | | | | | | | | | |
| $ | 22,548,977 | | | $ | 55,406,952 | | | $ | 26,502,868 | | | $ | 924,209,368 | | | $ | 10,419,240 | | | $ | 3,025,731,632 | | | $ | 7,368,950 | |
| | | | | | | | | | | | | | | | | | | | | | | | | | |
| | | | | | |
| | | | | | | | | | | | | | | | | | | | | | | | | | |
| $ | 18,281,712 | | | $ | 53,311,586 | | | $ | 53,058,826 | | | $ | 797,381,742 | | | $ | 10,453,136 | | | $ | 2,460,864,049 | | | $ | 6,465,297 | |
| | 830 | | | | 601,291 | | | | 130,056 | | | | 132,637 | | | | 7,776 | | | | 11,980,487 | | | | (37,681 | ) |
| | (101,122 | ) | | | 634,316 | | | | (28,315,918 | ) | | | 33,645,230 | | | | 5,681 | | | | 66,035,686 | | | | 68,349 | |
| | 4,367,557 | | | | 859,759 | | | | 1,629,904 | | | | 93,049,759 | | | | (47,353 | ) | | | 486,851,410 | | | | 872,985 | |
| | | | | | | | | | | | | | | | | | | | | | | | | | |
| $ | 22,548,977 | | | $ | 55,406,952 | | | $ | 26,502,868 | | | $ | 924,209,368 | | | $ | 10,419,240 | | | $ | 3,025,731,632 | | | $ | 7,368,950 | |
| | | | | | | | | | | | | | | | | | | | | | | | | | |
| | | | | | | | | | | | | | | | | | | | | | | | | | |
| $ | 21,979,742 | | | $ | 20,832,465 | | | $ | 21,105,371 | | | $ | 338,166,102 | | | $ | 1,049,398 | | | $ | 1,561,509,927 | | | $ | 7,368,950 | |
| | 1,625,432 | | | | 1,775,810 | | | | 1,911,595 | | | | 28,974,101 | | | | 100,471 | | | | 47,617,723 | | | | 711,383 | |
| | | | | | | | | | | | | | | | | | | | | | | | | | |
| $ | 13.52 | | | $ | 11.73 | | | $ | 11.04 | | | $ | 11.67 | | | $ | 10.44 | | | $ | 32.79 | | | $ | 10.36 | |
| | | | | | | | | | | | | | | | | | | | | | | | | | |
| | | | | | | | | | | | | | | | | | | | | | | | | | |
| $ | 569,235 | | | $ | 34,574,487 | | | $ | 5,397,497 | | | $ | 586,043,266 | | | $ | 9,369,842 | | | $ | 1,464,221,705 | | | $ | — | |
| | 42,019 | | | | 2,943,589 | | | | 487,593 | | | | 50,240,372 | | | | 896,805 | | | | 43,992,278 | | | | — | |
| | | | | | | | | | | | | | | | | | | | | | | | | | |
| $ | 13.55 | | | $ | 11.75 | | | $ | 11.07 | | | $ | 11.66 | | | $ | 10.45 | | | $ | 33.28 | | | $ | — | |
| | | | | | | | | | | | | | | | | | | | | | | | | | |
| | | | | | | | | | | | | | | | | | | | | | | | | | |
| $ | — | | | $ | — | | | $ | — | | | $ | — | | | $ | — | | | $ | — | | | $ | — | |
| | — | | | | — | | | | — | | | | — | | | | — | | | | — | | | | — | |
| | | | | | | | | | | | | | | | | | | | | | | | | | |
| $ | — | | | $ | — | | | $ | — | | | $ | — | | | $ | — | | | $ | — | | | $ | — | |
| | | | | | | | | | | | | | | | | | | | | | | | | | |
See accompanying Notes to Financial Statements.
| | |
| |
| | October 31, 2012 |
| |
| Statements of Assets and Liabilities – continued | | |
| | | | | | | | |
| | |
| | | Veredus
Small Cap
Growth Fund | | | Small Cap
Growth Fund | |
| | | | | | | | |
| | |
ASSETS: | | | | | | | | |
Investments: | | | | | | | | |
Investments at cost | | $ | 22,691,645 | | | $ | 6,256,719 | |
Net unrealized appreciation | | | 1,960,601 | | | | 362,454 | |
| | | | | | | | |
Total investments at value | | | 24,652,246 | | | | 6,619,173 | |
Cash | | | — | | | | — | |
Receivables: | | | | | | | | |
Dividends and interest | | | 2,123 | | | | 64 | |
Fund shares sold | | | 4,955 | | | | 6,368 | |
Investments sold | | | — | | | | 44,144 | |
Due from Adviser, net (Note G) | | | — | | | | 1,421 | |
Deferred offering costs (Note B-13) | | | — | | | | — | |
Other assets | | | 155 | | | | 39 | |
| | | | | | | | |
Total assets | | | 24,659,479 | | | | 6,671,209 | |
| | | | | | | | |
| | |
LIABILITIES: | | | | | | | | |
Payables: | | | | | | | | |
Dividend distribution | | | — | | | | — | |
Investments purchased | | | 393,660 | | | | 229,095 | |
Fund shares redeemed | | | 44,644 | | | | — | |
Due to Adviser, net (Note G) | | | 19,322 | | | | — | |
Administration fees (Note G) | | | 2,553 | | | | 1,839 | |
Distribution fees (Note G) | | | 881 | | | | 232 | |
Audit and tax fees | | | 13,360 | | | | 13,110 | |
Transfer agent fees | | | 13,586 | | | | 6,560 | |
Registration fees | | | 5,243 | | | | 5,143 | |
Trustees fees and related expenses (Note G) | | | 13 | | | | 4 | |
Accrued expenses and other payables | | | 2,912 | | | | 1,996 | |
| | | | | | | | |
Total liabilities | | | 496,174 | | | | 257,979 | |
| | | | | | | | |
NET ASSETS | | $ | 24,163,305 | | | $ | 6,413,230 | |
| | | | | | | | |
| | |
NET ASSETS CONSIST OF: | | | | | | | | |
Paid in capital | | $ | 41,269,458 | | | $ | 5,647,265 | |
Accumulated undistributed (distribution in excess of) net investment income | | | (167,640 | ) | | | (5,175 | ) |
Accumulated net realized gain (loss) on investments | | | (18,899,114 | ) | | | 408,686 | |
Net unrealized appreciation on investments | | | 1,960,601 | | | | 362,454 | |
| | | | | | | | |
TOTAL NET ASSETS | | $ | 24,163,305 | | | $ | 6,413,230 | |
| | | | | | | | |
Class N: | | | | | | | | |
Net Assets | | $ | 21,762,975 | | | $ | 5,658,602 | |
Shares of beneficial interest outstanding (unlimited authorization) | | | 1,670,425 | | | | 495,521 | |
NET ASSET VALUE Offering and redemption price per share
(Net Assets/Shares Outstanding) | | $ | 13.03 | | | $ | 11.42 | |
| | | | | | | | |
Class I: | | | | | | | | |
Net Assets | | $ | 2,400,330 | | | $ | 754,628 | |
Shares of beneficial interest outstanding (unlimited authorization) | | | 177,344 | | | | 65,824 | |
NET ASSET VALUE Offering and redemption price per share
(Net Assets/Shares Outstanding) | | $ | 13.53 | | | $ | 11.46 | |
| | | | | | | | |
See accompanying Notes to Financial Statements.
| | | | | | | | | | | | | | | | | | | | | | | | | | |
| | | | | | |
Silvercrest
Small Cap
Fund | | | TAMRO
Small Cap
Fund | | | River Road
Select Value
Fund | | | River Road
Small Cap
Value Fund | | | River Road
Independent
Value Fund | | | DoubleLine Core
Plus Fixed Income
Fund | | | TCH
Fixed Income
Fund | |
| | | | | | | | | | | | | | | | | | | | | | | | | | |
| | | | | | |
| | | | | | | | | | | | | | | | | | | | | | | | | | |
| | | | | | | | | | | | | | | | | | | | | | | | | | |
| $ | 5,616,153 | | | $ | 844,981,885 | | | $ | 141,947,885 | | | $ | 221,695,702 | | | $ | 333,734,578 | | | $ | 169,804,168 | | | $ | 62,235,580 | |
| | 111,181 | | | | 189,946,385 | | | | 21,546,407 | | | | 67,639,358 | | | | 10,280,638 | | | | 5,127,542 | | | | 7,147,893 | |
| | | | | | | | | | | | | | | | | | | | | | | | | | |
| | 5,727,334 | | | | 1,034,928,270 | | | | 163,494,292 | | | | 289,335,060 | | | | 344,015,216 | | | | 174,931,710 | | | | 69,383,473 | |
| | — | | | | 3,090,359 | | | | — | | | | — | | | | 357,151,989 | | | | 1,725,610 | | | | 200,000 | |
| | | | | | | | | | | | | | | | | | | | | | | | | | |
| | 1,204 | | | | 401,701 | | | | 52,355 | | | | 92,456 | | | | 21,924 | | | | 1,201,203 | | | | 772,486 | |
| | — | | | | 2,254,719 | | | | 273,933 | | | | 281,657 | | | | 1,463,685 | | | | 396,202 | | | | 43,427 | |
| | — | | | | 354,745 | | | | 149,702 | | | | 146,615 | | | | — | | | | 237,368 | | | | — | |
| | 8,253 | | | | — | | | | — | | | | — | | | | — | | | | — | | | | — | |
| | 7,179 | | | | — | | | | — | | | | — | | | | — | | | | — | | | | — | |
| | 5 | | | | 5,346 | | | | 762 | | | | 1,768 | | | | 2,838 | | | | 265 | | | | 389 | |
| | | | | | | | | | | | | | | | | | | | | | | | | | |
| | 5,743,975 | | | | 1,041,035,140 | | | | 163,971,044 | | | | 289,857,556 | | | | 702,655,652 | | | | 178,492,358 | | | | 70,399,775 | |
| | | | | | | | | | | | | | | | | | | | | | | | | | |
| | | | | | |
| | | | | | | | | | | | | | | | | | | | | | | | | | |
| | | | | | | | | | | | | | | | | | | | | | | | | | |
| | — | | | | — | | | | — | | | | — | | | | — | | | | 33,522 | | | | 16,828 | |
| | — | | | | 9,263,874 | | | | 943,955 | | | | 26,107 | | | | 718,648 | | | | 1,187,619 | | | | — | |
| | — | | | | 5,961,220 | | | | 52,888 | | | | 257,889 | | | | 500,256 | | | | 264,917 | | | | 140,430 | |
| | — | | | | 818,589 | | | | 137,940 | | | | 219,187 | | | | 604,443 | | | | 45,750 | | | | 24,457 | |
| | 1,693 | | | | 42,208 | | | | 7,893 | | | | 12,643 | | | | 27,265 | | | | 14,975 | | | | 7,073 | |
| | 30 | | | | 15,889 | | | | 244 | | | | 2,012 | | | | 14,843 | | | | 2,917 | | | | 1,468 | |
| | 13,110 | | | | 15,687 | | | | 15,437 | | | | 15,437 | | | | 13,110 | | | | 17,040 | | | | 17,040 | |
| | 6,302 | | | | 69,633 | | | | 15,618 | | | | 70,661 | | | | 62,886 | | | | 25,631 | | | | 14,693 | |
| | 6,839 | | | | 5,243 | | | | 5,493 | | | | 9,268 | | | | 18,064 | | | | 5,143 | | | | 6,243 | |
| | 3 | | | | 561 | | | | 83 | | | | 144 | | | | 331 | | | | 85 | | | | 36 | |
| | 4,431 | | | | 54,153 | | | | 11,629 | | | | 15,020 | | | | 46,343 | | | | 13,181 | | | | 3,747 | |
| | | | | | | | | | | | | | | | | | | | | | | | | | |
| | 32,408 | | | | 16,247,057 | | | | 1,191,180 | | | | 628,368 | | | | 2,006,189 | | | | 1,610,780 | | | | 232,015 | |
| | | | | | | | | | | | | | | | | | | | | | | | | | |
| $ | 5,711,567 | | | $ | 1,024,788,083 | | | $ | 162,779,864 | | | $ | 289,229,188 | | | $ | 700,649,463 | | | $ | 176,881,578 | | | $ | 70,167,760 | |
| | | | | | | | | | | | | | | | | | | | | | | | | | |
| | | | | | |
| | | | | | | | | | | | | | | | | | | | | | | | | | |
| $ | 5,550,019 | | | $ | 742,562,257 | | | $ | 132,211,858 | | | $ | 213,116,337 | | | $ | 659,752,208 | | | $ | 171,056,571 | | | $ | 69,020,031 | |
| | 35,727 | | | | — | | | | 460,063 | | | | 1,294,664 | | | | (43,461 | ) | | | (380,739 | ) | | | 257,283 | |
| | 14,640 | | | | 92,279,441 | | | | 8,561,536 | | | | 7,178,829 | | | | 30,660,078 | | | | 1,078,204 | | | | (6,257,447 | ) |
| | 111,181 | | | | 189,946,385 | | | | 21,546,407 | | | | 67,639,358 | | | | 10,280,638 | | | | 5,127,542 | | | | 7,147,893 | |
| | | | | | | | | | | | | | | | | | | | | | | | | | |
| $ | 5,711,567 | | | $ | 1,024,788,083 | | | $ | 162,779,864 | | | $ | 289,229,188 | | | $ | 700,649,463 | | | $ | 176,881,578 | | | $ | 70,167,760 | |
| | | | | | | | | | | | | | | | | | | | | | | | | | |
| | | | | | | | | | | | | | | | | | | | | | | | | | |
| $ | 749,662 | | | $ | 389,124,895 | | | $ | 6,269,566 | | | $ | 49,154,009 | | | $ | 362,415,604 | | | $ | 71,546,413 | | | $ | 59,771,657 | |
| | 68,761 | | | | 18,962,398 | | | | 737,560 | | | | 3,625,337 | | | | 31,738,321 | | | | 6,445,656 | | | | 5,378,164 | |
$ |
10.90 |
| | $ | 20.52 | | | $ | 8.50 | | | $ | 13.56 | | | $ | 11.42 | | | $ | 11.10 | | | $ | 11.11 | |
| | | | | | | | | | | | | | | | | | | | | | | | | | |
| | | | | | | | | | | | | | | | | | | | | | | | | | |
| $ | 4,961,905 | | | $ | 635,663,188 | | | $ | 156,510,298 | | | $ | 240,075,179 | | | $ | 338,233,859 | | | $ | 105,335,165 | | | $ | 10,396,103 | |
| | 454,089 | | | | 30,331,379 | | | | 18,249,612 | | | | 17,628,506 | | | | 29,525,934 | | | | 9,489,617 | | | | 935,367 | |
$ |
10.93 |
| | $ | 20.96 | | | $ | 8.58 | | | $ | 13.62 | | | $ | 11.46 | | | $ | 11.10 | | | $ | 11.11 | |
| | | | | | | | | | | | | | | | | | | | | | | | | | |
See accompanying Notes to Financial Statements.
| | |
| |
| | October 31, 2012 |
| |
| Statements of Assets and Liabilities – continued | | |
| | | | | | | | |
| | |
| | | Lake Partners
LASSO Alternatives
Fund | | | Dynamic
Allocation
Fund | |
| | | | | | | | |
| | |
ASSETS: | | | | | | | | |
Investments: | | | | | | | | |
Investments at cost | | $ | 265,319,404 | | | $ | 29,475,636 | |
Net unrealized appreciation (depreciation) | | | 8,543,380 | | | | 289,209 | |
| | | | | | | | |
Total investments at value | | | 273,862,784 | | | | 29,764,845 | |
Foreign currency (Cost $7,769 and $3,570) | | | — | | | | — | |
Cash | | | 13,877,037 | | | | — | |
Segregated Cash (Note B) | | | — | | | | — | |
Receivables: | | | | | | | | |
Dividends and interest | | | 322,057 | | | | 343 | |
Dividend reclaims | | | — | | | | — | |
Fund shares sold | | | 267,744 | | | | 13,356 | |
Investments sold | | | — | | | | — | |
Other assets | | | 1,188 | | | | 253 | |
| | | | | | | | |
Total assets | | | 288,330,810 | | | | 29,778,797 | |
| | | | | | | | |
| | |
LIABILITIES: | | | | | | | | |
Payables: | | | | | | | | |
Interest and dividends on securities sold short | | | — | | | | — | |
Investments purchased | | | 325,436 | | | | — | |
Fund shares redeemed | | | 562,463 | | | | 205,206 | |
Due to Adviser, net (Note G) | | | 316,582 | | | | 13,085 | |
Administration fees (Note G) | | | 12,021 | | | | 2,404 | |
Distribution fees (Note G) | | | 1,387 | | | | 981 | |
Audit and tax fees | | | 14,674 | | | | 14,674 | |
Transfer agent fees | | | 19,864 | | | | 13,196 | |
Registration fees | | | 4,943 | | | | 13,514 | |
Trustees fees and related expenses (Note G) | | | 145 | | | | 16 | |
Accrued expenses and other payables | | | 11,694 | | | | 2,744 | |
Securities sold short, at value (proceeds $1,426,545) | | | — | | | | — | |
Call options written, at value (premiums received $3,939,696) | | | — | | | | — | |
| | | | | | | | |
Total liabilities | | | 1,269,209 | | | | 265,820 | |
| | | | | | | | |
NET ASSETS | | $ | 287,061,601 | | | $ | 29,512,977 | |
| | | | | | | | |
| | |
NET ASSETS CONSIST OF: | | | | | | | | |
Paid in capital | | $ | 283,350,503 | | | $ | 29,972,593 | |
Accumulated undistributed (distribution in excess of) net investment income | | | 781,026 | | | | 121,022 | |
Accumulated net realized gain (loss) on investments, purchased options, written options, securities sold short, foreign currency transactions and capital gain distributions received | | | (5,613,308 | ) | | | (869,847 | ) |
Net unrealized appreciation (depreciation) on investments, purchased options, written options, securities sold short and translation of assets and liabilities in foreign currency | | | 8,543,380 | | | | 289,209 | |
| | | | | | | | |
TOTAL NET ASSETS | | $ | 287,061,601 | | | $ | 29,512,977 | |
| | | | | | | | |
Class N: | | | | | | | | |
Net Assets | | $ | 33,718,695 | | | $ | 23,736,334 | |
Shares of beneficial interest outstanding (unlimited authorization) | | | 2,722,222 | | | | 2,789,715 | |
NET ASSET VALUE Offering and redemption price per share
(Net Assets/Shares Outstanding) | | $ | 12.39 | | | $ | 8.51 | |
| | | | | | | | |
Class I: | | | | | | | | |
Net Assets | | $ | 253,342,906 | | | $ | 5,776,643 | |
Shares of beneficial interest outstanding (unlimited authorization) | | | 20,396,742 | | | | 677,035 | |
NET ASSET VALUE Offering and redemption price per share
(Net Assets/Shares Outstanding) | | $ | 12.42 | | | $ | 8.53 | |
| | | | | | | | |
See accompanying Notes to Financial Statements.
| | | | | | | | | | | | | | | | | | |
| | | | |
Anchor Capital
Enhanced Equity
Fund | | | River Road
Long-Short
Fund | | | Barings
International
Fund | | | Harrison Street
Real Estate
Fund | | | Montag & Caldwell
Balanced Fund | |
| | | | | | | | | | | | | | | | | | |
| | | | |
| | | | | | | | | | | | | | | | | | |
| | | | | | | | | | | | | | | | | | |
| $ | 186,408,483 | | | $ | 7,536,466 | | | $ | 60,870,067 | | | $ | 10,061,557 | | | $ | 30,347,716 | |
| | (6,491,318 | ) | | | 74,618 | | | | 1,107,994 | | | | 579,358 | | | | 2,980,677 | |
| | | | | | | | | | | | | | | | | | |
| | 179,917,165 | | | | 7,611,084 | | | | 61,978,061 | | | | 10,640,915 | | | | 33,328,393 | |
| | — | | | | — | | | | 7,804 | | | | 3,532 | | | | — | |
| | 3,482,957 | | | | 303,919 | | | | — | | | | — | | | | — | |
| | — | | | | 1,127,727 | | | | — | | | | — | | | | — | |
| | | | | | | | | | | | | | | | | | |
| | 187,850 | | | | 7,989 | | | | 116,359 | | | | 1,846 | | | | 129,078 | |
| | — | | | | — | | | | 74,738 | | | | — | | | | — | |
| | 418,408 | | | | 1,000 | | | | 10,664 | | | | 5,158 | | | | 15,741 | |
| | — | | | | 23,453 | | | | — | | | | — | | | | 111,627 | |
| | 1,273 | | | | 26 | | | | 298 | | | | 55 | | | | 140 | |
| | | | | | | | | | | | | | | | | | |
| | 184,007,653 | | | | 9,075,198 | | | | 62,187,924 | | | | 10,651,506 | | | | 33,584,979 | |
| | | | | | | | | | | | | | | | | | |
| | | | |
| | | | | | | | | | | | | | | | | | |
| | | | | | | | | | | | | | | | | | |
| | — | | | | 2,207 | | | | — | | | | — | | | | — | |
| | — | | | | 66,741 | | | | — | | | | — | | | | 46,816 | |
| | 191,130 | | | | — | | | | 3,489 | | | | 66,689 | | | | 13,582 | |
| | 105,097 | | | | 3,313 | | | | 54,951 | | | | 3,562 | | | | 11,289 | |
| | 8,757 | | | | 1,915 | | | | 7,209 | | | | 1,706 | | | | 3,348 | |
| | 4,339 | | | | 310 | | | | 17 | | | | 424 | | | | 517 | |
| | 14,674 | | | | 15,924 | | | | 15,437 | | | | 13,860 | | | | 17,040 | |
| | 25,076 | | | | 3,358 | | | | 7,157 | | | | 8,356 | | | | 11,543 | |
| | 15,514 | | | | 13,730 | | | | 4,943 | | | | 8,443 | | | | 10,993 | |
| | 91 | | | | 4 | | | | 32 | | | | 5 | | | | 18 | |
| | 12,340 | | | | 2,698 | | | | 11,033 | | | | 1,857 | | | | 3,578 | |
| | — | | | | 1,458,611 | | | | — | | | | — | | | | — | |
| | 5,821,315 | | | | — | | | | — | | | | — | | | | — | |
| | | | | | | | | | | | | | | | | | |
| | 6,198,333 | | | | 1,568,811 | | | | 104,268 | | | | 104,902 | | | | 118,724 | |
| | | | | | | | | | | | | | | | | | |
| $ | 177,809,320 | | | $ | 7,506,387 | | | $ | 62,083,656 | | | $ | 10,546,604 | | | $ | 33,466,255 | |
| | | | | | | | | | | | | | | | | | |
| | | | |
| | | | | | | | | | | | | | | | | | |
| $ | 183,405,615 | | | $ | 7,108,203 | | | $ | 59,541,533 | | | $ | 23,151,276 | | | $ | 32,558,059 | |
| | 127,535 | | | | (29,732 | ) | | | 992,441 | | | | 125,494 | | | | (230,949 | ) |
|
2,649,107 |
| | | 385,364 | | | | 444,313 | | | | (13,309,485 | ) | | | (1,841,532 | ) |
|
(8,372,937 |
) | | | 42,552 | | | | 1,105,369 | | | | 579,319 | | | | 2,980,677 | |
| | | | | | | | | | | | | | | | | | |
| $ | 177,809,320 | | | $ | 7,506,387 | | | $ | 62,083,656 | | | $ | 10,546,604 | | | $ | 33,466,255 | |
| | | | | | | | | | | | | | | | | | |
| | | | | | | | | | | | | | | | | | |
| $ | 106,191,154 | | | $ | 7,506,387 | | | $ | 421,330 | | | $ | 10,380,840 | | | $ | 31,535,974 | |
| | 12,231,307 | | | | 699,705 | | | | 61,296 | | | | 989,224 | | | | 1,469,625 | |
$ |
8.68 |
| | $ | 10.73 | | | $ | 6.87 | | | $ | 10.49 | | | $ | 21.46 | |
| | | | | | | | | | | | | | | | | | |
| | | | | | | | | | | | | | | | | | |
| $ | 71,618,166 | | | $ | — | | | $ | 61,662,326 | | | $ | 165,764 | | | $ | 1,930,281 | |
| | 8,240,286 | | | | — | | | | 8,955,279 | | | | 15,873 | | | | 90,164 | |
$ |
8.69 |
| | $ | — | | | $ | 6.89 | | | $ | 10.44 | | | $ | 21.41 | |
| | | | | | | | | | | | | | | | | | |
See accompanying Notes to Financial Statements.
| | |
| |
| For the Year Ended October 31, 2012 | | |
| |
| Statements of Operations | | |
| | | | | | | | |
| | |
| | |
Montag & Caldwell
Growth Fund | | | Veredus Select
Growth Fund | |
| | | | | | | | |
INVESTMENT INCOME: | | | | | | | | |
Dividends | | $ | 63,023,934 | | | $ | 671,370 | |
Less: foreign taxes withheld | | | (306,956 | ) | | | — | |
| | | | | | | | |
Total investment income | | | 62,716,978 | | | | 671,370 | |
| | | | | | | | |
EXPENSES: | | | | | | | | |
Investment advisory fees (Note G) | | | 24,380,211 | | | | 352,118 | |
Distribution expenses (Note G)(b) | | | 4,520,587 | | | | 34,252 | |
Transfer agent fees | | | 3,107,943 | | | | 60,191 | |
Administration fees (Note G) | | | 1,841,475 | | | | 36,194 | |
Registration expenses | | | 172,508 | | | | 35,382 | |
Custodian fees | | | 133,881 | | | | 3,657 | |
Audit and tax fees | | | 30,332 | | | | 18,757 | |
Legal fees | | | 101,589 | | | | 939 | |
Amortization of offering costs (Note B-13) | | | — | | | | — | |
Reports to shareholder expense | | | 260,126 | | | | 3,048 | |
Trustees fees and related expenses (Note G) | | | 285,412 | | | | 4,012 | |
Interest expense (Note H) | | | — | | | | 71 | |
Other expenses | | | 151,570 | | | | 7,223 | |
| | | | | | | | |
Total expenses before waivers/reimbursements | | | 34,985,634 | | | | 555,844 | |
| | | | | | | | |
Less: Investment advisory fees waived (Note G) | | | — | | | | (59,367 | ) |
Less: Expenses reimbursed (Note G) | | | — | | | | — | |
| | | | | | | | |
Net expenses | | | 34,985,634 | | | | 496,477 | |
| | | | | | | | |
NET INVESTMENT INCOME (LOSS) | | | 27,731,344 | | | | 174,893 | |
| | | | | | | | |
NET REALIZED AND UNREALIZED GAIN (LOSS) ON INVESTMENTS: | | | | | | | | |
Net realized gain on investments | | | 287,451,677 | | | | 2,056,758 | |
Net realized loss on purchased options | | | — | | | | — | |
Net change in unrealized appreciation (depreciation) on investments | | | 78,274,829 | | | | (2,651,492 | ) |
Net change in unrealized appreciation on purchased options | | | — | | | | — | |
| | | | | | | | |
NET REALIZED AND UNREALIZED GAIN (LOSS) ON INVESTMENTS | | | 365,726,506 | | | | (594,734 | ) |
| | | | | | | | |
| | |
NET INCREASE (DECREASE) IN NET ASSETS FROM OPERATIONS | | $ | 393,457,850 | | | $ | (419,841 | ) |
| | | | | | | | |
| (a) | River Road Dividend All Cap Value Fund II began issuing shares on June 27, 2012. |
| (b) | Distribution expense is incurred at the Class N level for all funds except Montag & Caldwell Growth Fund. The distribution expense for Class N and R of the Montag & Caldwell Growth Fund is $4,475,917 and $44,670, respectively. |
| (c) | On January 13, 2012, Fairpointe Mid Cap Fund had a redemption-in-kind transfer of securities in the amount of $38,179,960. The net realized gain on the transaction of $2,483,994 will not be realized by the Fund for tax purposes. |
See accompanying Notes to Financial Statements.
| | | | | | | | | | | | | | | | | | | | | | | | | | |
| | | | | | |
TAMRO
Diversified
Equity Fund | | | Herndon
Large Cap
Value Fund | | | Cornerstone
Large Cap
Value Fund | | | River Road
Dividend All
Cap Value Fund | | | River Road
Dividend All
Cap Value Fund II(a) | | | Fairpointe
Mid Cap
Fund | | | Montag & Caldwell
Mid Cap
Growth Fund | |
| | | | | | | | | | | | | | | | | | | | | | | | | | |
| | | | | | | | | | | | | | | | | | | | | | | | | | |
| $ | 270,023 | | | $ | 1,153,800 | | | $ | 586,030 | | | $ | 31,448,065 | | | $ | 60,915 | | | $ | 47,068,708 | | | $ | 38,253 | |
| | (2,450 | ) | | | (559 | ) | | | (26,294 | ) | | | (74,001 | ) | | | (68 | ) | | | (46,653 | ) | | | (151 | ) |
| | | | | | | | | | | | | | | | | | | | | | | | | | |
| | 267,573 | | | | 1,153,241 | | | | 559,736 | | | | 31,374,064 | | | | 60,847 | | | | 47,022,055 | | | | 38,102 | |
| | | | | | | | | | | | | | | | | | | | | | | | | | |
| | | | | | | | | | | | | | | | | | | | | | | | | | |
| | 178,350 | | | | 323,690 | | | | 205,311 | | | | 5,697,260 | | | | 11,353 | | | | 20,664,084 | | | �� | 52,435 | |
| | 54,866 | | | | 30,138 | | | | 58,269 | | | | 826,838 | | | | 497 | | | | 3,860,391 | | | | 15,422 | |
| | 46,364 | | | | 39,567 | | | | 45,671 | | | | 643,468 | | | | 9,045 | | | | 2,062,997 | | | | 19,284 | |
| | 25,962 | | | | 34,196 | | | | 25,962 | | | | 409,284 | | | | 5,445 | | | | 1,426,657 | | | | 18,081 | |
| | 37,829 | | | | 34,701 | | | | 30,269 | | | | 100,347 | | | | 5,457 | | | | 81,272 | | | | 16,878 | |
| | 3,457 | | | | 6,091 | | | | 6,288 | | | | 37,365 | | | | 2,276 | | | | 114,951 | | | | 8,344 | |
| | 17,509 | | | | 18,011 | | | | 20,626 | | | | 22,678 | | | | 19,300 | | | | 27,536 | | | | 18,753 | |
| | 574 | | | | 1,039 | | | | 1,339 | | | | 24,271 | | | | 49 | | | | 76,362 | | | | 164 | |
| | — | | | | — | | | | — | | | | — | | | | 22,616 | | | | — | | | | — | |
| | 2,005 | | | | 2,187 | | | | — | | | | 42,974 | | | | 463 | | | | 270,254 | | | | 498 | |
| | 1,733 | | | | 2,589 | | | | 1,747 | | | | 60,348 | | | | 38 | | | | 223,376 | | | | 456 | |
| | 86 | | | | — | | | | — | | | | — | | | | — | | | | 12,242 | | | | — | |
| | 5,793 | | | | 5,563 | | | | 2,677 | | | | 39,330 | | | | 847 | | | | 137,441 | | | | 3,984 | |
| | | | | | | | | | | | | | | | | | | | | | | | | | |
| | 374,528 | | | | 497,772 | | | | 398,159 | | | | 7,904,163 | | | | 77,386 | | | | 28,957,563 | | | | 154,299 | |
| | | | | | | | | | | | | | | | | | | | | | | | | | |
| | (107,785 | ) | | | (42,793 | ) | | | (79,418 | ) | | | — | | | | (11,353 | ) | | | — | | | | (52,435 | ) |
| | — | | | | — | | | | — | | | | — | | | | (48,507 | ) | | | — | | | | (24,754 | ) |
| | | | | | | | | | | | | | | | | | | | | | | | | | |
| | 266,743 | | | | 454,979 | | | | 318,741 | | | | 7,904,163 | | | | 17,526 | | | | 28,957,563 | | | | 77,110 | |
| | | | | | | | | | | | | | | | | | | | | | | | | | |
| | 830 | | | | 698,262 | | | | 240,995 | | | | 23,469,901 | | | | 43,321 | | | | 18,064,492 | | | | (39,008 | ) |
| | | | | | | | | | | | | | | | | | | | | | | | | | |
| | | | | | | | | | | | | | | | | | | | | | | | | | |
| | 170,003 | | | | 930,577 | | | | 1,056,316 | | | | 35,184,296 | | | | 5,681 | | | | 70,142,404 | (c) | | | 426,097 | |
| | (204,029 | ) | | | — | | | | — | | | | — | | | | — | | | | — | | | | — | |
| | 2,400,339 | | | | 984,335 | | | | 1,197,003 | | | | 38,094,587 | | | | (47,353 | ) | | | 207,549,967 | | | | (74,900 | ) |
| | 149,516 | | | | — | | | | — | | | | — | | | | — | | | | — | | | | — | |
| | | | | | | | | | | | | | | | | | | | | | | | | | |
| | 2,515,829 | | | | 1,914,912 | | | | 2,253,319 | | | | 73,278,883 | | | | (41,672 | ) | | | 277,692,371 | | | | 351,197 | |
| | | | | | | | | | | | | | | | | | | | | | | | | | |
| | | | | | |
| $ | 2,516,659 | | | $ | 2,613,174 | | | $ | 2,494,314 | | | $ | 96,748,784 | | | $ | 1,649 | | | $ | 295,756,863 | | | $ | 312,189 | |
| | | | | | | | | | | | | | | | | | | | | | | | | | |
See accompanying Notes to Financial Statements.
| | |
| |
| For the Year Ended October 31, 2012 | | |
| |
| Statements of Operations – continued | | |
| | | | | | | | |
| | |
| | | Veredus
Small Cap
Growth Fund | | | Small Cap
Growth Fund | |
| | | | | | | | |
INVESTMENT INCOME: | | | | | | | | |
Dividends | | $ | 141,204 | | | $ | 14,894 | |
Less: foreign taxes withheld | | | — | | | | — | |
Interest | | | — | | | | — | |
| | | | | | | | |
Total investment income | | | 141,204 | | | | 14,894 | |
| | | | | | | | |
EXPENSES: | | | | | | | | |
Investment advisory fees (Note G) | | | 279,493 | | | | 81,515 | |
Distribution expenses (Note G) | | | 60,281 | | | | 14,116 | |
Transfer agent fees | | | 63,725 | | | | 36,803 | |
Administration fees (Note G) | | | 29,472 | | | | 19,643 | |
Registration expenses | | | 31,689 | | | | 36,809 | |
Custodian fees | | | 4,777 | | | | 5,248 | |
Audit and tax fees | | | 18,945 | | | | 17,495 | |
Legal fees | | | 674 | | | | 9,635 | |
Amortization of offering costs (Note B-13) | | | — | | | | — | |
Reports to shareholder expense | | | 3,497 | | | | 472 | |
Trustees fees and related expenses (Note G) | | | 2,309 | | | | 642 | |
Interest expense (Note H) | | | — | | | | — | |
Other expenses | | | 6,154 | | | | 4,651 | |
| | | | | | | | |
Total expenses before waivers/reimbursements | | | 501,016 | | | | 227,029 | |
| | | | | | | | |
Less: Investment advisory fees waived (Note G) | | | (94,164 | ) | | | (81,515 | ) |
Less: Expenses reimbursed (Note G) | | | — | | | | (41,754 | ) |
Less: Earnings credit | | | — | | | | — | |
| | | | | | | | |
Net expenses | | | 406,852 | | | | 103,760 | |
| | | | | | | | |
NET INVESTMENT INCOME (LOSS) | | | (265,648 | ) | | | (88,866 | ) |
| | | | | | | | |
NET REALIZED AND UNREALIZED GAIN (LOSS) ON INVESTMENTS: | | | | | | | | |
Net realized gain on investments | | | 3,149,755 | (b) | | | 793,830 | (c) |
Net change in unrealized appreciation (depreciation) on investments | | | (1,897,684 | ) | | | 504,009 | |
| | | | | | | | |
NET REALIZED AND UNREALIZED GAIN ON INVESTMENTS | | | 1,252,071 | | | | 1,297,839 | |
| | | | | | | | |
| | |
NET INCREASE IN NET ASSETS FROM OPERATIONS | | $ | 986,423 | | | $ | 1,208,973 | |
| | | | | | | | |
| (a) | Silvercrest Small Cap Fund began issuing shares on December 23, 2011. |
| (b) | On December 2, 2011, Veredus Small Cap Growth Fund had a redemption-in-kind transfer of securities in the amount of $13,225,479. The net realized gain on the transaction of $1,299,563 will not be realized by the Fund for tax purposes. |
| (c) | On September 25, 2012, Small Cap Growth Fund had a redemption-in-kind transfer of securities in the amount of $2,419,213. The net realized gain on the transaction of $114,052 will not be realized by the Fund for tax purposes. |
| (d) | On April 26, 2012, Silvercrest Small Cap Fund had a redemption-in-kind transfer of securities in the amount of $2,597,146. The net realized gain on the transaction of $211,366 will not be realized by the Fund for tax purposes. |
| (e) | On May 1, 2012 and June 27, 2012, TAMRO Small Cap Fund had redemption-in-kind transfers of securities in the amounts of $39,335,171 and $6,762,586, respectively. The net realized gains on the transactions of $2,612,293 and $289,177, respectively, will not be realized by the Fund for tax purposes. |
See accompanying Notes to Financial Statements.
| | | | | | | | | | | | | | | | | | | | | | | | | | |
| | | | | | |
Silvercrest
Small Cap
Fund(a) | | | TAMRO
Small Cap
Fund | | | River Road
Select Value
Fund | | | River Road
Small Cap
Value Fund | | | River Road
Independent
Value Fund | | | DoubleLine Core
Plus Fixed Income
Fund | | | TCH
Fixed Income
Fund | |
| | | | | | | | | | | | | | | | | | | | | | | | | | |
| | | | | | | | | | | | | | | | | | | | | | | | | | |
| $ | 63,091 | | | $ | 7,090,567 | | | $ | 2,246,039 | | | $ | 4,837,701 | | | $ | 3,788,146 | | | $ | 5,393 | | | $ | 3,188 | |
| | — | | | | (12,870 | ) | | | (16,266 | ) | | | (40,910 | ) | | | (17,635 | ) | | | — | | | | — | |
| | — | | | | — | | | | — | | | | — | | | | — | | | | 3,731,295 | | | | 3,603,811 | |
| | | | | | | | | | | | | | | | | | | | | | | | | | |
| | 63,091 | | | | 7,077,697 | | | | 2,229,773 | | | | 4,796,791 | | | | 3,770,511 | | | | 3,736,688 | | | | 3,606,999 | |
| | | | | | | | | | | | | | | | | | | | | | | | | | |
| | | | | | | | | | | | | | | | | | | | | | | | | | |
| | 39,768 | | | | 9,255,718 | | | | 1,486,962 | | | | 2,722,734 | | | | 5,928,678 | | | | 520,833 | | | | 393,159 | |
| | 1,238 | | | | 961,639 | | | | 19,672 | | | | 149,111 | | | | 864,895 | | | | 96,023 | | | | 102,097 | |
| | 29,795 | | | | 499,365 | | | | 74,926 | | | | 360,222 | | | | 560,140 | | | | 110,302 | | | | 68,414 | |
| | 14,537 | | | | 513,480 | | | | 88,039 | | | | 163,427 | | | | 300,968 | | | | 96,213 | | | | 66,978 | |
| | 23,236 | | | | 51,572 | | | | 31,927 | | | | 36,906 | | | | 47,837 | | | | 51,142 | | | | 32,023 | |
| | 5,787 | | | | 41,218 | | | | 14,990 | | | | 19,648 | | | | 30,930 | | | | 27,103 | | | | 6,276 | |
| | 17,413 | | | | 20,880 | | | | 20,642 | | | | 20,625 | | | | 18,794 | | | | 22,384 | | | | 22,795 | |
| | 3,519 | | | | 27,109 | | | | 3,793 | | | | 7,782 | | | | 16,509 | | | | 4,193 | | | | 1,859 | |
| | 56,642 | | | | — | | | | — | | | | — | | | | 9,185 | | | | 189,991 | | | | — | |
| | 211 | | | | 73,958 | | | | 12,906 | | | | 15,272 | | | | 92,513 | | | | 8,849 | | | | 3,404 | |
| | 250 | | | | 79,247 | | | | 10,889 | | | | 22,679 | | | | 44,470 | | | | 5,919 | | | | 5,437 | |
| | — | | | | 2,905 | | | | 2 | | | | — | | | | — | | | | — | | | | — | |
| | 1,741 | | | | 59,632 | | | | 10,941 | | | | 19,701 | | | | 29,246 | | | | 5,675 | | | | 6,402 | |
| | | | | | | | | | | | | | | | | | | | | | | | | | |
| | 194,137 | | | | 11,586,723 | | | | 1,775,689 | | | | 3,538,107 | | | | 7,944,165 | | | | 1,138,627 | | | | 708,844 | |
| | | | | | | | | | | | | | | | | | | | | | | | | | |
| | (39,768 | ) | | | — | | | | — | | | | — | | | | (143,528 | ) | | | (389,195 | ) | | | (113,511 | ) |
| | (107,398 | ) | | | — | | | | — | | | | — | | | | — | | | | — | | | | — | |
| | — | | | | — | | | | — | | | | — | | | | (23,757 | ) | | | — | | | | — | |
| | | | | | | | | | | | | | | | | | | | | | | | | | |
| | 46,971 | | | | 11,586,723 | | | | 1,775,689 | | | | 3,538,107 | | | | 7,776,880 | | | | 749,432 | | | | 595,333 | |
| | | | | | | | | | | | | | | | | | | | | | | | | | |
| | 16,120 | | | | (4,509,026 | ) | | | 454,084 | | | | 1,258,684 | | | | (4,006,369 | ) | | | 2,987,256 | | | | 3,011,666 | |
| | | | | | | | | | | | | | | | | | | | | | | | | | |
| | | | | | | | | | | | | | | | | | | | | | | | | | |
| | 226,287 | (d) | | | 104,050,686 | (e) | | | 10,079,561 | | | | 21,254,625 | | | | 36,018,328 | | | | 1,032,232 | | | | 1,541,463 | |
| | 111,181 | | | | 6,000,858 | | | | 7,191,158 | | | | 11,176,504 | | | | 10,854,961 | | | | 4,872,717 | | | | 2,125,017 | |
| | | | | | | | | | | | | | | | | | | | | | | | | | |
| | 337,468 | | | | 110,051,544 | | | | 17,270,719 | | | | 32,431,129 | | | | 46,873,289 | | | | 5,904,949 | | | | 3,666,480 | |
| | | | | | | | | | | | | | | | | | | | | | | | | | |
| | | | | | |
| $ | 353,588 | | | $ | 105,542,518 | | | $ | 17,724,803 | | | $ | 33,689,813 | | | $ | 42,866,920 | | | $ | 8,892,205 | | | $ | 6,678,146 | |
| | | | | | | | | | | | | | | | | | | | | | | | | | |
See accompanying Notes to Financial Statements.
| | |
| |
| For the Year Ended October 31, 2012 | | |
| |
| Statements of Operations – continued | | |
| | | | | | | | |
| | |
| | | Lake Partners
LASSO Alternatives
Fund | | | Dynamic
Allocation
Fund | |
| | | | | | | | |
INVESTMENT INCOME: | | | | | | | | |
Dividends | | $ | 4,444,523 | | | $ | 717,960 | |
Less: foreign taxes withheld | | | — | | | | — | |
Interest | | | — | | | | — | |
| | | | | | | | |
Total investment income | | | 4,444,523 | | | | 717,960 | |
| | | | | | | | |
EXPENSES: | | | | | | | | |
Investment advisory fees (Note G) | | | 2,517,804 | | | | 313,736 | |
Distribution expenses (Note G) | | | 60,107 | | | | 85,599 | |
Transfer agent fees | | | 157,884 | | | | 80,653 | |
Administration fees (Note G) | | | 135,076 | | | | 33,206 | |
Registration expenses | | | 37,152 | | | | 44,436 | |
Custodian fees | | | 8,279 | | | | 2,932 | |
Audit and tax fees | | | 19,030 | | | | 19,908 | |
Legal fees | | | 6,660 | | | | 1,046 | |
Interest and dividend expense on securities sold-short | | | — | | | | — | |
Amortization of offering costs (Note B-13) | | | — | | | | — | |
Reports to shareholder expense | | | 18,169 | | | | 4,278 | |
Trustees fees and related expenses (Note G) | | | 18,812 | | | | 3,252 | |
Interest expense (Note H) | | | — | | | | — | |
Other expenses | | | 13,739 | | | | 5,974 | |
| | | | | | | | |
Total expenses before waivers/reimbursements | | | 2,992,712 | | | | 595,020 | |
| | | | | | | | |
Less: Investment advisory fees waived (Note G) | | | — | | | | (98,710 | ) |
Less: Earnings credit | | | (2,453 | ) | | | — | |
Plus: Net expenses recouped (Note G) | | | 88,544 | | | | — | |
| | | | | | | | |
Net expenses | | | 3,078,803 | | | | 496,310 | |
| | | | | | | | |
NET INVESTMENT INCOME (LOSS) | | | 1,365,720 | | | | 221,650 | |
| | | | | | | | |
NET REALIZED AND UNREALIZED GAIN (LOSS) ON INVESTMENTS: | | | | | | | | |
Net realized gain (loss) on investments | | | (3,732,495 | ) | | | (853,449 | ) |
Net realized loss on purchased options | | | — | | | | — | |
Net realized gain on short sales | | | — | | | | — | |
Net realized gain on written option transactions | | | — | | | | — | |
Net realized loss on foreign currency transactions | | | — | | | | — | |
Capital gain distributions received | | | 5,290,364 | | | | — | |
Net change in unrealized appreciation (depreciation) on investments | | | 10,167,273 | | | | (60,432 | ) |
Net change in unrealized appreciation on purchased options | | | — | | | | — | |
Net change in unrealized depreciation on written options | | | — | | | | — | |
Net change in unrealized appreciation on securities sold short | | | — | | | | — | |
Net change in unrealized depreciation on translation of assets and liabilities denominated
in foreign currency | | | — | | | | — | |
| | | | | | | | |
NET REALIZED AND UNREALIZED GAIN (LOSS) ON INVESTMENTS | | | 11,725,142 | | | | (913,881 | ) |
| | | | | | | | |
| | |
NET INCREASE (DECREASE) IN NET ASSETS FROM OPERATIONS | | $ | 13,090,862 | | | $ | (692,231 | ) |
| | | | | | | | |
| (a) | On December 2, 2011, Harrison Street Real Estate Fund had a redemption-in-kind transfer of securities in the amount of $30,913,574. The net realized gain on the transaction of $664,979 will not be realized by the Fund for tax purposes. |
See accompanying Notes to Financial Statements.
| | | | | | | | | | | | | | | | | | |
| | | | |
Anchor Capital
Enhanced Equity
Fund | | | River Road
Long-Short
Fund | | | Barings
International
Fund | | | Harrison Street
Real Estate
Fund | | | Montag &
Caldwell
Balanced Fund | |
| | | | | | | | | | | | | | | | | | |
| | | | | | | | | | | | | | | | | | |
| $ | 4,470,235 | | | $ | 82,043 | | | $ | 1,871,158 | | | $ | 317,069 | | | $ | 295,064 | |
| | (54,940 | ) | | | (1,213 | ) | | | (139,970 | ) | | | (2,011 | ) | | | (1,449 | ) |
| | — | | | | — | | | | — | | | | — | | | | 289,629 | |
| | | | | | | | | | | | | | | | | | |
| | 4,415,295 | | | | 80,830 | | | | 1,731,188 | | | | 315,058 | | | | 583,244 | |
| | | | | | | | | | | | | | | | | | |
| | | | | | | | | | | | | | | | | | |
| | 1,015,845 | | | | 69,185 | | | | 596,736 | | | | 109,157 | | | | 220,017 | |
| | 182,804 | | | | 14,413 | | | | 988 | | | | 19,658 | | | | 33,452 | |
| | 154,572 | | | | 17,698 | | | | 35,113 | | | | 41,515 | | | | 56,770 | |
| | 87,495 | | | | 18,294 | | | | 64,465 | | | | 19,466 | | | | 32,227 | |
| | 51,679 | | | | 19,959 | | | | 30,009 | | | | 31,709 | | | | 35,764 | |
| | 33,144 | | | | 9,468 | | | | 42,079 | | | | 4,464 | | | | 3,460 | |
| | 19,594 | | | | 21,062 | | | | 20,650 | | | | 20,716 | | | | 22,794 | |
| | 10,765 | | | | 152 | | | | 1,573 | | | | 549 | | | | 763 | |
| | — | | | | 81,355 | | | | — | | | | — | | | | — | |
| | — | | | | 33,590 | | | | — | | | | — | | | | — | |
| | 20,209 | | | | 502 | | | | 2,078 | | | | — | | | | 2,418 | |
| | 10,818 | | | | 416 | | | | 4,609 | | | | 1,073 | | | | 2,093 | |
| | 690 | | | | — | | | | — | | | | — | | | | — | |
| | 8,582 | | | | 4,023 | | | | 6,888 | | | | 1,676 | | | | 5,085 | |
| | | | | | | | | | | | | | | | | | |
| | 1,596,197 | | | | 290,117 | | | | 805,188 | | | | 249,983 | | | | 414,843 | |
| | | | | | | | | | | | | | | | | | |
| | — | | | | (69,185 | ) | | | (117,951 | ) | | | (108,068 | ) | | | (58,700 | ) |
| | (1,467 | ) | | | (41,565 | ) | | | — | | | | — | | | | — | |
| | 61,190 | | | | — | | | | — | | | | — | | | | — | |
| | | | | | | | | | | | | | | | | | |
| | 1,655,920 | | | | 179,367 | | | | 687,237 | | | | 141,915 | | | | 356,143 | |
| | | | | | | | | | | | | | | | | | |
| | 2,759,375 | | | | (98,537 | ) | | | 1,043,951 | | | | 173,143 | | | | 227,101 | |
| | | | | | | | | | | | | | | | | | |
| | | | | | | | | | | | | | | | | | |
| | 6,296,016 | | | | 882,801 | | | | 913,139 | | | | 1,929,231 | (a) | | | 1,435,094 | |
| | (8,023,322 | ) | | | — | | | | — | | | | — | | | | — | |
| | — | | | | (269,534 | ) | | | — | | | | — | | | | — | |
| | 4,581,584 | | | | — | | | | — | | | | — | | | | — | |
| | — | | | | — | | | | (30,003 | ) | | | (74 | ) | | | — | |
| | — | | | | — | | | | — | | | | — | | | | — | |
| | 747,814 | | | | (101,505 | ) | | | 794,810 | | | | (2,376,578 | ) | | | 422,708 | |
| | 874,662 | | | | — | | | | — | | | | — | | | | — | |
| | (2,627,097 | ) | | | — | | | | — | | | | — | | | | — | |
| | — | | | | 27,982 | | | | — | | | | — | | | | — | |
| | | | | | | | | | | | | | | | | | |
| | — | | | | — | | | | (34,615 | ) | | | (30 | ) | | | — | |
| | | | | | | | | | | | | | | | | | |
| | 1,849,657 | | | | 539,744 | | | | 1,643,331 | | | | (447,451 | ) | | | 1,857,802 | |
| | | | | | | | | | | | | | | | | | |
| | | | |
| $ | 4,609,032 | | | $ | 441,207 | | | $ | 2,687,282 | | | $ | (274,308 | ) | | $ | 2,084,903 | |
| | | | | | | | | | | | | | | | | | |
See accompanying Notes to Financial Statements.
| | |
| |
| | |
| |
| Statements of Changes in Net Assets | | |
| | | | | | | | | | | | | | | | |
| | |
| | | Montag & Caldwell
Growth Fund | | | Veredus Select
Growth Fund | |
| | | Years Ended October 31, | | | Years Ended October 31, | |
| | | 2012 | | | 2011 | | | 2012 | | | 2011 | |
| | | | | | | | | | | | | | | | |
NET ASSETS at Beginning of Period | | $ | 3,441,019,426 | | | $ | 3,042,348,287 | | | $ | 80,277,274 | | | $ | 104,506,310 | |
| | | | | | | | | | | | | | | | |
Increase (decrease) in net assets from operations: | | | | | | | | | | | | | | | | |
Net investment income (loss) | | | 27,731,344 | | | | 23,212,618 | | | | 174,893 | | | | 12,937 | |
Net realized gain (loss) on investments and purchased options | | | 287,451,677 | | | | 276,464,229 | | | | 2,056,758 | | | | 2,087,190 | |
Net change in unrealized appreciation (depreciation) on investments and purchased options | | | 78,274,829 | | | | (24,507,953 | ) | | | (2,651,492 | ) | | | (6,313,915 | ) |
| | | | | | | | | | | | | | | | |
Net increase (decrease) in net assets from operations | | | 393,457,850 | | | | 275,168,894 | | | | (419,841 | ) | | | (4,213,788 | ) |
| | | | | | | | | | | | | | | | |
Distributions to shareholders from: | | | | | | | | | | | | | | | | |
Net investment income: | | | | | | | | | | | | | | | | |
Class N | | | (8,653,266 | ) | | | (8,322,107 | ) | | | — | | | | — | |
Class I | | | (13,404,436 | ) | | | (12,483,308 | ) | | | (27,060 | ) | | | — | |
Class R | | | (23,730 | ) | | | (29,409 | ) | | | — | | | | — | |
Net realized gain on investments: | | | | | | | | | | | | | | | | |
Class N | | | (125,020,421 | ) | | | (2,646,170 | ) | | | — | | | | — | |
Class I | | | (132,016,151 | ) | | | (2,724,240 | ) | | | — | | | | — | |
Class R | | | (653,567 | ) | | | (13,510 | ) | | | — | | | | — | |
| | | | | | | | | | | | | | | | |
Total distributions | | | (279,771,571 | ) | | | (26,218,744 | ) | | | (27,060 | ) | | | — | |
| | | | | | | | | | | | | | | | |
Capital share transactions: | | | | | | | | | | | | | | | | |
Proceeds from sales of shares: | | | | | | | | | | | | | | | | |
Class N | | | 441,340,857 | | | | 660,309,446 | | | | 534,868 | | | | 7,667,702 | |
Class I | | | 1,079,995,284 | | | | 621,098,679 | | | | 2,466,101 | | | | 11,926,061 | |
Class R | | | 2,438,971 | | | | 5,580,418 | | | | — | | | | — | |
Proceeds from reinvestment of distributions: | | | | | | | | | | | | | | | | |
Class N | | | 130,056,898 | | | | 10,562,918 | | | | — | | | | — | |
Class I | | | 100,607,628 | | | | 11,978,807 | | | | 26,846 | | | | — | |
Class R | | | 530,624 | | | | 21,213 | | | | — | | | | — | |
Cost of shares redeemed: | | | | | | | | | | | | | | | | |
Class N | | | (404,459,339 | ) | | | (618,544,121 | ) | | | (10,844,619 | ) | | | (28,127,415 | ) |
Class I | | | (578,526,415 | ) | | | (536,452,510 | ) | | | (59,922,030 | ) | | | (11,481,596 | ) |
Class R | | | (3,111,332 | ) | | | (4,833,861 | ) | | | — | | | | — | |
| | | | | | | | | | | | | | | | |
Net increase (decrease) from capital share transactions | | | 768,873,176 | | | | 149,720,989 | | | | (67,738,834 | ) | | | (20,015,248 | ) |
| | | | | | | | | | | | | | | | |
Total increase (decrease) in net assets | | | 882,559,455 | | | | 398,671,139 | | | | (68,185,735 | ) | | | (24,229,036 | ) |
| | | | | | | | | | | | | | | | |
NET ASSETS at End of Period | | $ | 4,323,578,881 | | | $ | 3,441,019,426 | | | $ | 12,091,539 | | | $ | 80,277,274 | |
| | | | | | | | | | | | | | | | |
Undistributed net investment income | | $ | 23,270,805 | | | $ | 17,620,893 | | | $ | 174,730 | | | $ | 26,897 | |
| | | | | | | | | | | | | | | | |
| (a) | Cornerstone Large Cap Value Fund had a redemption-in-kind on March 18, 2011, which resulted in a redemption out of the Fund of $222,180,158. The redemption was comprised of securities and cash in the amounts of $218,362,480 and $3,817,758, respectively. |
See accompanying Notes to Financial Statements.
| | | | | | | | | | | | | | | | | | | | | | |
| | |
TAMRO Diversified
Equity Fund | | | Herndon Large Cap
Value Fund | | | Cornerstone Large Cap
Value Fund | |
| Years Ended October 31, | | | Years Ended October 31, | | | Years Ended October 31, | |
| 2012 | | | 2011 | | | 2012 | | | 2011 | | | 2012 | | | 2011 | |
| | | | | | | | | | | | | | | | | | | | | | |
| $ | 24,353,652 | | | $ | 15,669,792 | | | $ | 17,969,968 | | | $ | 1,472,096 | | | $ | 24,756,738 | | | $ | 224,034,670 | |
| | | | | | | | | | | | | | | | | | | | | | |
| | | | | | | | | | | | | | | | | | | | | | |
| | 830 | | | | (44,914 | ) | | | 698,262 | | | | 136,661 | | | | 240,995 | | | | 1,616,818 | |
|
(34,026 |
) | | | 656,066 | | | | 930,577 | | | | 677,342 | | | | 1,056,316 | | | | 34,986,939 | |
|
2,549,855 |
| | | (699,407 | ) | | | 984,335 | | | | (196,751 | ) | | | 1,197,003 | | | | (15,657,682 | ) |
| | | | | | | | | | | | | | | | | | | | | | |
|
2,516,659 |
| | | (88,255 | ) | | | 2,613,174 | | | | 617,252 | | | | 2,494,314 | | | | 20,946,075 | |
| | | | | | | | | | | | | | | | | | | | | | |
| | | | | | | | | | | | | | | | | | | | | | |
| | | | | | | | | | | | | | | | | | | | | | |
| | — | | | | — | | | | (69,391 | ) | | | (13,657 | ) | | | (110,362 | ) | | | (265,642 | ) |
| | — | | | | — | | | | (154,780 | ) | | | — | | | | (577 | ) | | | (1,541,502 | ) |
| | — | | | | — | | | | — | | | | — | | | | — | | | | — | |
| | | | | | | | | | | | | | | | | | | | | | |
| | (473,355 | ) | | | — | | | | (340,506 | ) | | | — | | | | — | | | | — | |
| | — | | | | — | | | | (604,334 | ) | | | — | | | | — | | | | — | |
| | — | | | | — | | | | — | | | | — | | | | — | | | | — | |
| | | | | | | | | | | | | | | | | | | | | | |
| | (473,355 | ) | | | — | | | | (1,169,011 | ) | | | (13,657 | ) | | | (110,939 | ) | | | (1,807,144 | ) |
| | | | | | | | | | | | | | | | | | | | | | |
| | | | | | | | | | | | | | | | | | | | | | |
| | | | | | | | | | | | | | | | | | | | | | |
| | 2,735,793 | | | | 13,791,809 | | | | 19,089,187 | | | | 14,353,866 | | | | 5,930,111 | | | | 9,241,468 | |
| | 584,348 | | | | — | | | | 26,894,024 | | | | 12,434,600 | | | | 5,334,807 | | | | 413 | |
| | — | | | | — | | | | — | | | | — | | | | — | | | | — | |
| | | | | | | | | | | | | | | | | | | | | | |
| | 461,380 | | | | — | | | | 409,897 | | | | 13,657 | | | | 106,566 | | | | 254,223 | |
| | — | | | | — | | | | 759,114 | | | | — | | | | 577 | | | | 964,424 | |
| | — | | | | — | | | | — | | | | — | | | | — | | | | — | |
| | | | | | | | | | | | | | | | | | | | | | |
| | (7,598,556 | ) | | | (5,019,694 | ) | | | (5,463,083 | ) | | | (10,907,846 | ) | | | (11,895,211 | ) | | | (6,696,820 | ) |
| | (30,944 | ) | | | — | | | | (5,696,318 | ) | | | — | | | | (114,095 | ) | | | (222,180,571 | )(a) |
| | — | | | | — | | | | — | | | | — | | | | — | | | | — | |
| | | | | | | | | | | | | | | | | | | | | | |
|
(3,847,979 |
) | | | 8,772,115 | | | | 35,992,821 | | | | 15,894,277 | | | | (637,245 | ) | | | (218,416,863 | ) |
| | | | | | | | | | | | | | | | | | | | | | |
| | (1,804,675 | ) | | | 8,683,860 | | | | 37,436,984 | | | | 16,497,872 | | | | 1,746,130 | | | | (199,277,932 | ) |
| | | | | | | | | | | | | | | | | | | | | | |
| $ | 22,548,977 | | | $ | 24,353,652 | | | $ | 55,406,952 | | | $ | 17,969,968 | | | $ | 26,502,868 | | | $ | 24,756,738 | |
| | | | | | | | | | | | | | | | | | | | | | |
| $ | 830 | | | $ | — | | | $ | 601,291 | | | $ | 127,238 | | | $ | 130,056 | | | $ | — | |
| | | | | | | | | | | | | | | | | | | | | | |
See accompanying Notes to Financial Statements.
| | |
| |
| | |
| |
| Statements of Changes in Net Assets – continued | | |
| | | | | | | | | | | | |
| | |
| | | River Road Dividend
All Cap Value Fund | | | River Road
Dividend All Cap
Value Fund II | |
| | | Years Ended October 31, | | | Period Ended
October 31,
2012(a) | |
| | | 2012 | | | 2011 | | |
| | | | | | | | | | | | |
NET ASSETS at Beginning of Period | | $ | 620,152,985 | | | $ | 273,172,565 | | | $ | — | |
| | | | | | | | | | | | |
Increase (decrease) in net assets from operations: | | | | | | | | | | | | |
Net investment income (loss) | | | 23,469,901 | | | | 11,709,666 | | | | 43,321 | |
Net realized gain on investments | | | 35,184,296 | | | | 4,466,315 | | | | 5,681 | |
Net change in unrealized appreciation (depreciation) on investments | | | 38,094,587 | | | | 13,856,396 | | | | (47,353 | ) |
| | | | | | | | | | | | |
Net increase (decrease) in net assets from operations | | | 96,748,784 | | | | 30,032,377 | | | | 1,649 | |
| | | | | | | | | | | | |
Distributions to shareholders from: | | | | | | | | | | | | |
Net investment income: | | | | | | | | | | | | |
Class N | | | (8,876,757 | ) | | | (4,480,688 | ) | | | (4,217 | ) |
Class I | | | (14,324,347 | ) | | | (6,151,388 | ) | | | (38,951 | ) |
Net realized gain on investments: | | | | | | | | | | | | |
Class N | | | (2,301,513 | ) | | | — | | | | — | |
Class I | | | (2,349,496 | ) | | | — | | | | — | |
| | | | | | | | | | | | |
Total distributions | | | (27,852,113 | ) | | | (10,632,076 | ) | | | (43,168 | ) |
| | | | | | | | | | | | |
Capital share transactions: | | | | | | | | | | | | |
Proceeds from sales of shares: | | | | | | | | | | | | |
Class N | | | 113,881,567 | | | | 200,005,589 | | | | 1,042,531 | |
Class I | | | 274,730,584 | | | | 193,412,218 | | | | 9,388,289 | |
Proceeds from reinvestment of distributions: | | | | | | | | | | | | |
Class N | | | 11,027,472 | | | | 4,324,529 | | | | 3,909 | |
Class I | | | 11,799,898 | | | | 3,993,640 | | | | 36,423 | |
Cost of shares redeemed: | | | | | | | | | | | | |
Class N | | | (117,659,249 | ) | | | (52,119,639 | ) | | | (414 | ) |
Class I | | | (58,620,560 | ) | | | (22,036,218 | ) | | | (9,979 | ) |
| | | | | | | | | | | | |
Net increase (decrease) from capital share transactions | | | 235,159,712 | | | | 327,580,119 | | | | 10,460,759 | |
| | | | | | | | | | | | |
Total increase (decrease) in net assets | | | 304,056,383 | | | | 346,980,420 | | | | 10,419,240 | |
| | | | | | | | | | | | |
NET ASSETS at End of Period | | $ | 924,209,368 | | | $ | 620,152,985 | | | $ | 10,419,240 | |
| | | | | | | | | | | | |
Undistributed (distributions in excess of) net investment income (loss) | | $ | 132,637 | | | $ | (110,262 | ) | | $ | 7,776 | |
| | | | | | | | | | | | |
| (a) | River Road Dividend All Cap Value Fund II began issuing shares on June 27, 2012. |
| (b) | Fairpointe Mid Cap Fund had a redemption-in-kind on January 13, 2012, which resulted in a redemption out of the Fund of $38,722,763. The redemption was comprised of securities and cash in the amounts of $38,179,960 and $542,803, respectively. |
| (c) | Veredus Small Cap Growth Fund had a redemption-in-kind on December 2, 2011, which resulted in a redemption out of the Fund of $13,436,583. The redemption was comprised of securities and cash in the amounts of $13,225,479 and $211,104, respectively. |
See accompanying Notes to Financial Statements.
| | | | | | | | | | | | | | | | | | | | | | |
| | |
| Fairpointe Mid Cap Fund | | |
Montag & Caldwell
Mid Cap Growth Fund | | | Veredus Small Cap
Growth Fund | |
| Years Ended October 31, | | | Years Ended October 31, | | |
Years Ended October 31, | |
| 2012 | | | 2011 | | | 2012 | | | 2011 | | | 2012 | | | 2011 | |
| | | | | | | | | | | | | | | | | | | | | | |
| $ | 2,841,488,832 | | | $ | 1,969,004,161 | | | $ | 4,507,024 | | | $ | 3,399,072 | | | $ | 43,191,062 | | | $ | 49,784,390 | |
| | | | | | | | | | | | | | | | | | | | | | |
| | | | | | | | | | | | | | | | | | | | | | |
| | 18,064,492 | | | | 8,114,614 | | | | (39,008 | ) | | | (30,444 | ) | | | (265,648 | ) | | | (476,381 | ) |
| | 70,142,404 | | | | 18,380,917 | | | | 426,097 | | | | 299,123 | | | | 3,149,755 | | | | 6,542,782 | |
| | 207,549,967 | | | | (48,573,966 | ) | | | (74,900 | ) | | | 240,447 | | | | (1,897,684 | ) | | | (2,611,145 | ) |
| | | | | | | | | | | | | | | | | | | | | | |
| | 295,756,863 | | | | (22,078,435 | ) | | | 312,189 | | | | 509,126 | | | | 986,423 | | | | 3,455,256 | |
| | | | | | | | | | | | | | | | | | | | | | |
| | | | | | | | | | | | | | | | | | | | | | |
| | | | | | | | | | | | | | | | | | | | | | |
| | (2,661,253 | ) | | | (4,195,319 | ) | | | — | | | | — | | | | — | | | | — | |
| | (5,501,975 | ) | | | (1,840,072 | ) | | | — | | | | — | | | | — | | | | — | |
| | | | | | | | | | | | | | | | | | | | | | |
| | (10,321,076 | ) | | | (3,944,537 | ) | | | — | | | | — | | | | — | | | | — | |
| | (8,446,694 | ) | | | (1,492,202 | ) | | | — | | | | — | | | | — | | | | — | |
| | | | | | | | | | | | | | | | | | | | | | |
| | (26,930,998 | ) | | | (11,472,130 | ) | | | — | | | | — | | | | — | | | | — | |
| | | | | | | | | | | | | | | | | | | | | | |
| | | | | | | | | | | | | | | | | | | | | | |
| | | | | | | | | | | | | | | | | | | | | | |
| | 442,895,376 | | | | 723,036,262 | | | | 3,071,452 | | | | 738,840 | | | | 879,294 | | | | 3,538,598 | |
| | 655,170,800 | | | | 1,264,789,286 | | | | — | | | | — | | | | 354,546 | | | | 327,191 | |
| | | | | | | | | | | | | | | | | | | | | | |
| | 12,395,039 | | | | 7,690,209 | | | | — | | | | — | | | | — | | | | — | |
| | 9,858,507 | | | | 2,953,475 | | | | — | | | | — | | | | — | | | | — | |
| | | | | | | | | | | | | | | | | | | | | | |
| | (540,581,863 | ) | | | (731,287,676 | ) | | | (521,715 | ) | | | (140,014 | ) | | | (6,714,931 | ) | | | (13,481,571 | ) |
| | (664,320,924 | )(b) | | | (361,146,320 | ) | | | — | | | | — | | | | (14,533,089 | )(c) | | | (432,802 | ) |
| | | | | | | | | | | | | | | | | | | | | | |
| | (84,583,065 | ) | | | 906,035,236 | | | | 2,549,737 | | | | 598,826 | | | | (20,014,180 | ) | | | (10,048,584 | ) |
| | | | | | | | | | | | | | | | | | | | | | |
| | 184,242,800 | | | | 872,484,671 | | | | 2,861,926 | | | | 1,107,952 | | | | (19,027,757 | ) | | | (6,593,328 | ) |
| | | | | | | | | | | | | | | | | | | | | | |
| $ | 3,025,731,632 | | | $ | 2,841,488,832 | | | $ | 7,368,950 | | | $ | 4,507,024 | | | $ | 24,163,305 | | | $ | 43,191,062 | |
| | | | | | | | | | | | | | | | | | | | | | |
| $ | 11,980,487 | | | $ | 2,079,223 | | | $ | (37,681 | ) | | $ | — | | | $ | (167,640 | ) | | $ | — | |
| | | | | | | | | | | | | | | | | | | | | | |
See accompanying Notes to Financial Statements.
| | |
| |
| | |
| |
| Statements of Changes in Net Assets – continued | | |
| | | | | | | | | | | | |
| | |
| | | Small Cap
Growth Fund | | | Silvercrest
Small Cap Fund | |
| | | Year Ended
October 31,
2012 | | | Period Ended
October 31,
2011(a) | | | Period Ended
October 31, | |
| | | | | 2012(b) | |
| | | | | | | | | | | | |
NET ASSETS at Beginning of Period | | $ | 7,961,781 | | | $ | — | | | $ | — | |
| | | | | | | | | | | | |
Increase (decrease) in net assets from operations: | | | | | | | | | | | | |
Net investment income (loss) | | | (88,866 | ) | | | (34,103 | ) | | | 16,120 | |
Net realized gain (loss) on investments | | | 793,830 | | | | (183,520 | ) | | | 226,287 | |
Net change in unrealized appreciation (depreciation) on investments | | | 504,009 | | | | (141,555 | ) | | | 111,181 | |
| | | | | | | | | | | | |
Net increase (decrease) in net assets from
operations | | | 1,208,973 | | | | (359,178 | ) | | | 353,588 | |
| | | | | | | | | | | | |
Distributions to shareholders from: | | | | | | | | | | | | |
Net investment income: | | | | | | | | | | | | |
Class N | | | — | | | | — | | | | — | |
Class I | | | — | | | | — | | | | — | |
Net realized gain on investments: | | | | | | | | | | | | |
Class N | | | — | | | | — | | | | — | |
Class I | | | — | | | | — | | | | — | |
| | | | | | | | | | | | |
Total distributions | | | — | | | | — | | | | — | |
| | | | | | | | | | | | |
Capital share transactions: | | | | | | | | | | | | |
Proceeds from sales of shares: | | | | | | | | | | | | |
Class N | | | 1,039,380 | | | | 6,238,604 | | | | 706,680 | |
Class I | | | 297,740 | | | | 2,963,841 | | | | 7,290,194 | |
Proceeds from reinvestment of distributions: | | | | | | | | | | | | |
Class N | | | — | | | | — | | | | — | |
Class I | | | — | | | | — | | | | — | |
Cost of shares redeemed: | | | | | | | | | | | | |
Class N | | | (1,540,249 | ) | | | (881,486 | ) | | | (3,366 | ) |
Class I | | | (2,554,395 | )(c) | | | — | | | | (2,635,529 | )(d) |
| | | | | | | | | | | | |
Net increase (decrease) from capital share
transactions | | | (2,757,524 | ) | | | 8,320,959 | | | | 5,357,979 | |
| | | | | | | | | | | | |
Total increase (decrease) in net assets | | | (1,548,551 | ) | | | 7,961,781 | | | | 5,711,567 | |
| | | | | | | | | | | | |
NET ASSETS at End of Period | | $ | 6,413,230 | | | $ | 7,961,781 | | | $ | 5,711,567 | |
| | | | | | | | | | | | |
Undistributed (distributions in excess of)
net investment income (loss) | | $ | (5,175 | ) | | $ | (5,573 | ) | | $ | 35,727 | |
| | | | | | | | | | | | |
| (a) | Small Cap Growth Fund began issuing shares on November 2, 2010. |
| (b) | Silvercrest Small Cap Fund began issuing shares on December 23, 2011. |
| (c) | Small Cap Growth Fund had a redemption-in-kind on September 25, 2012, which resulted in a redemption out of the Fund of $2,554,395. The redemption was comprised of securities and cash in the amount of $2,419,213 and $135,182, respectively. |
| (d) | Silvercrest Small Cap Fund had a redemption-in-kind on April 26, 2012, which resulted in a redemption out of the Fund of $2,608,977. The redemption was comprised of securities and cash in the amount of $2,579,146 and $29,831, respectively. |
| (e) | TAMRO Small Cap Fund had redemptions-in-kind on May 1, 2012 and June 27, 2012, 2012, which resulted in redemptions out of the Fund of $40,667,980 and $7,010,475, respectively. The redemptions were comprised of securities and cash in the amounts of $39,335,174 and $6,762,586, respectively and $1,332,806 and $247,889, respectively. |
See accompanying Notes to Financial Statements.
| | | | | | | | | | | | | | | | | | | | | | |
| | |
TAMRO
Small Cap Fund | | | River Road
Select Value Fund | | | River Road
Small Cap Value Fund | |
Years Ended October 31, | | | Years Ended October 31, | | | Years Ended October 31, | |
| 2012 | | | 2011 | | | 2012 | | | 2011 | | | 2012 | | | 2011 | |
| | | | | | | | | | | | | | | | | | | | | | |
| $ | 1,001,284,211 | | | $ | 885,435,944 | | | $ | 143,687,434 | | | $ | 215,753,587 | | | $ | 337,488,064 | | | $ | 468,670,448 | |
| | | | | | | | | | | | | | | | | | | | | | |
| | | | | | | | | | | | | | | | | | | | | | |
| | (4,509,026 | ) | | | (5,328,724 | ) | | | 454,084 | | | | 42,145 | | | | 1,258,684 | | | | 83,034 | |
| | 104,050,686 | | | | 99,904,044 | | | | 10,079,561 | | | | 29,375,751 | | | | 21,254,625 | | | | 44,847,576 | |
| | 6,000,858 | | | | (22,100,977 | ) | | | 7,191,158 | | | | (13,992,847 | ) | | | 11,176,504 | | | | (11,965,485 | ) |
| | | | | | | | | | | | | | | | | | | | | | |
|
105,542,518 |
| | | 72,474,343 | | | | 17,724,803 | | | | 15,425,049 | | | | 33,689,813 | | | | 32,965,125 | |
| | | | | | | | | | | | | | | | | | | | | | |
| | | | | | | | | | | | | | | | | | | | | | |
| | | | | | | | | | | | | | | | | | | | | | |
| | — | | | | — | | | | — | | | | (176,001 | ) | | | — | | | | (643,153 | ) |
| | — | | | | — | | | | — | | | | (958,025 | ) | | | — | | | | (1,405,337 | ) |
| | | | | | | | | | | | | | | | | | | | | | |
| | (37,105,939 | ) | | | (7,598,056 | ) | | | (2,638,084 | ) | | | (475,433 | ) | | | — | | | | — | |
| | (60,086,992 | ) | | | (12,204,102 | ) | | | (26,691,130 | ) | | | (1,484,315 | ) | | | — | | | | — | |
| | | | | | | | | | | | | | | | | | | | | | |
| | (97,192,931 | ) | | | (19,802,158 | ) | | | (29,329,214 | ) | | | (3,093,774 | ) | | | — | | | | (2,048,490 | ) |
| | | | | | | | | | | | | | | | | | | | | | |
| | | | | | | | | | | | | | | | | | | | | | |
| | | | | | | | | | | | | | | | | | | | | | |
| | 100,985,943 | | | | 134,405,206 | | | | 2,113,833 | | | | 9,181,896 | | | | 11,250,505 | | | | 38,752,450 | |
| | 155,633,470 | | | | 203,159,987 | | | | 50,275,199 | | | | 40,104,315 | | | | 47,334,504 | | | | 51,580,650 | |
| | | | | | | | | | | | | | | | | | | | | | |
| | 36,431,124 | | | | 7,455,712 | | | | 2,564,966 | | | | 633,791 | | | | — | | | | 639,592 | |
| | 41,999,122 | | | | 8,709,830 | | | | 23,172,373 | | | | 2,107,208 | | | | — | | | | 1,383,335 | |
| | | | | | | | | | | | | | | | | | | | | | |
| | (126,301,603 | ) | | | (121,337,026 | ) | | | (10,015,665 | ) | | | (53,148,045 | ) | | | (61,115,685 | ) | | | (178,262,562 | ) |
| | (193,593,771 | )(e) | | | (169,217,627 | ) | | | (37,413,865 | ) | | | (83,276,593 | ) | | | (79,418,013 | ) | | | (76,192,484 | ) |
| | | | | | | | | | | | | | | | | | | | | | |
|
15,154,285 |
| | | 63,176,082 | | | | 30,696,841 | | | | (84,397,428 | ) | | | (81,948,689 | ) | | | (162,099,019 | ) |
| | | | | | | | | | | | | | | | | | | | | | |
| | 23,503,872 | | | | 115,848,267 | | | | 19,092,430 | | | | (72,066,153 | ) | | | (48,258,876 | ) | | | (131,182,384 | ) |
| | | | | | | | | | | | | | | | | | | | | | |
| $ | 1,024,788,083 | | | $ | 1,001,284,211 | | | $ | 162,779,864 | | | $ | 143,687,434 | | | $ | 289,229,188 | | | $ | 337,488,064 | |
| | | | | | | | | | | | | | | | | | | | | | |
$ |
— |
| | $ | — | | | $ | 460,063 | | | $ | — | | | $ | 1,294,664 | | | $ | — | |
| | | | | | | | | | | | | | | | | | | | | | |
See accompanying Notes to Financial Statements.
| | |
| |
| | |
| |
| Statements of Changes in Net Assets – continued | | |
| | | | | | | | | | | | | | | | |
| | |
| | | River Road
Independent Value Fund | | | DoubleLine
Core Plus
Fixed Income Fund | |
| | | Year Ended
October 31,
2012 | | | Period Ended
October 31,
2011(a) | | | Year Ended
October 31,
2012 | | | Period Ended
October 31,
2011(b) | |
| | | | | |
| | | | | | | | | | | | | | | | |
NET ASSETS at Beginning of Period | | $ | 391,700,125 | | | $ | — | | | $ | 27,143,189 | | | $ | — | |
| | | | | | | | | | | | | | | | |
Increase (decrease) in net assets from operations: | | | | | | | | | | | | | | | | |
Net investment income (loss) | | | (4,006,369 | ) | | | (1,085,446 | ) | | | 2,987,256 | | | | 186,165 | |
Net realized gain (loss) on investments and capital gain distributions | | | 36,018,328 | | | | 5,386,949 | | | | 1,032,232 | | | | 43,586 | |
Net change in unrealized appreciation (depreciation) on investments | | | 10,854,961 | | | | (574,323 | ) | | | 4,872,717 | | | | 254,825 | |
| | | | | | | | | | | | | | | | |
Net increase (decrease) in net assets from operations | | | 42,866,920 | | | | 3,727,180 | | | | 8,892,205 | | | | 484,576 | |
| | | | | | | | | | | | | | | | |
Distributions to shareholders from: | | | | | | | | | | | | | | | | |
Net investment income: | | | | | | | | | | | | | | | | |
Class N | | | — | | | | — | | | | (1,317,861 | ) | | | (148,691 | ) |
Class I | | | — | | | | — | | | | (2,043,553 | ) | | | (42,117 | ) |
Net realized gain on investments: | | | | | | | | | | | | | | | | |
Class N | | | (3,623,431 | ) | | | — | | | | (34,851 | ) | | | — | |
Class I | | | (2,074,734 | ) | | | — | | | | (24,248 | ) | | | — | |
| | | | | | | | | | | | | | | | |
Total distributions | | | (5,698,165 | ) | | | — | | | | (3,420,513 | ) | | | (190,808 | ) |
| | | | | | | | | | | | | | | | |
Capital share transactions: | | | | | | | | | | | | | | | | |
Proceeds from sales of shares: | | | | | | | | | | | | | | | | |
Class N | | | 202,967,411 | | | | 369,370,471 | | | | 71,060,094 | | | | 23,893,578 | |
Class I | | | 276,507,471 | | | | 87,929,924 | | | | 103,044,113 | | | | 5,325,160 | |
Proceeds from reinvestment of distributions: | | | | | | | | | | | | | | | | |
Class N | | | 3,615,800 | | | | — | | | | 1,344,828 | | | | 142,202 | |
Class I | | | 2,024,439 | | | | — | | | | 1,929,366 | | | | 42,117 | |
Cost of shares redeemed: | | | | | | | | | | | | | | | | |
Class N | | | (170,062,099 | ) | | | (65,670,819 | ) | | | (25,676,534 | ) | | | (1,531,005 | ) |
Class I | | | (43,272,439 | ) | | | (3,656,631 | ) | | | (7,435,170 | ) | | | (1,022,631 | ) |
| | | | | | | | | | | | | | | | |
Net increase (decrease) from capital share transactions | | | 271,780,583 | | | | 387,972,945 | | | | 144,266,697 | | | | 26,849,421 | |
| | | | | | | | | | | | | | | | |
Total increase (decrease) in net assets | | | 308,949,338 | | | | 391,700,125 | | | | 149,738,389 | | | | 27,143,189 | |
| | | | | | | | | | | | | | | | |
NET ASSETS at End of Period | | $ | 700,649,463 | | | $ | 391,700,125 | | | $ | 176,881,578 | | | $ | 27,143,189 | |
| | | | | | | | | | | | | | | | |
Undistributed (distributions in excess of)
net investment income (loss) | | $ | (43,461 | ) | | $ | (37,538 | ) | | $ | (380,739 | ) | | $ | (9,503 | ) |
| | | | | | | | | | | | | | | | |
| (a) | River Road Independent Value Fund began issuing shares on December 30, 2010. |
| (b) | DoubleLine Core Plus Fixed Income Fund began issuing shares on July 15, 2011. |
See accompanying Notes to Financial Statements.
| | | | | | | | | | | | | | | | | | | | | | |
| | |
TCH Fixed
Income Fund | | | Lake Partners
LASSO Alternatives Fund | | | Dynamic
Allocation Fund | |
Years Ended October 31, | | | Years Ended October 31, | | | Years Ended October 31, | |
| 2012 | | | 2011 | | | 2012 | | | 2011 | | | 2012 | | | 2011 | |
| | | | | | | | | | | | | | | | | | | | | | |
| $ | 72,769,324 | | | $ | 61,154,711 | | | $ | 207,625,322 | | | $ | 28,019,637 | | | $ | 49,240,524 | | | $ | 54,234,248 | |
| | | | | | | | | | | | | | | | | | | | | | |
| | | | | | | | | | | | | | | | | | | | | | |
| | 3,011,666 | | | | 2,777,397 | | | | 1,365,720 | | | | 141,372 | | | | 221,650 | | | | (167,249 | ) |
|
1,541,463 |
| | | 350,010 | | | | 1,557,869 | | | | (4,044,043 | ) | | | (853,449 | ) | | | 5,957,161 | |
|
2,125,017 |
| | | 153,269 | | | | 10,167,273 | | | | (2,659,656 | ) | | | (60,432 | ) | | | (2,211,531 | ) |
| | | | | | | | | | | | | | | | | | | | | | |
| | 6,678,146 | | | | 3,280,676 | | | | 13,090,862 | | | | (6,562,327 | ) | | | (692,231 | ) | | | 3,578,381 | |
| | | | | | | | | | | | | | | | | | | | | | |
| | | | | | | | | | | | | | | | | | | | | | |
| | | | | | | | | | | | | | | | | | | | | | |
| | (2,752,487 | ) | | | (2,179,922 | ) | | | (255,933 | ) | | | (60,987 | ) | | | (84,100 | ) | | | (145,930 | ) |
| | (479,605 | ) | | | (630,662 | ) | | | (3,425,003 | ) | | | (200,883 | ) | | | (10,445 | ) | | | (916 | ) |
| | | | | | | | | | | | | | | | | | | | | | |
| | — | | | | — | | | | — | | | | (51,647 | ) | | | (4,208,286 | ) | | | (1,740,103 | ) |
| | — | | | | — | | | | — | | | | (141,825 | ) | | | (428,748 | ) | | | (5,816 | ) |
| | | | | | | | | | | | | | | | | | | | | | |
| | (3,232,092 | ) | | | (2,810,584 | ) | | | (3,680,936 | ) | | | (455,342 | ) | | | (4,731,579 | ) | | | (1,892,765 | ) |
| | | | | | | | | | | | | | | | | | | | | | |
| | | | | | | | | | | | | | | | | | | | | | |
| | | | | | | | | | | | | | | | | | | | | | |
| | 11,970,554 | | | | 26,608,188 | | | | 20,838,852 | | | | 13,063,407 | | | | 7,144,660 | | | | 19,238,553 | |
| | 3,311,240 | | | | 3,668,580 | | | | 104,018,117 | | | | 200,746,741 | | | | 2,173,574 | | | | 6,991,108 | |
| | | | | | | | | | | | | | | | | | | | | | |
| | 2,642,277 | | | | 2,084,931 | | | | 254,528 | | | | 112,282 | | | | 4,285,707 | | | | 1,882,196 | |
| | 384,209 | | | | 473,715 | | | | 1,747,717 | | | | 314,308 | | | | 439,193 | | | | 6,732 | |
| | | | | | | | | | | | | | | | | | | | | | |
| | (20,139,538 | ) | | | (12,995,724 | ) | | | (5,931,093 | ) | | | (3,488,899 | ) | | | (27,591,473 | ) | | | (32,146,225 | ) |
| | (4,216,360 | ) | | | (8,695,169 | ) | | | (50,901,768 | ) | | | (24,124,485 | ) | | | (755,398 | ) | | | (2,651,704 | ) |
| | | | | | | | | | | | | | | | | | | | | | |
| | (6,047,618 | ) | | | 11,144,521 | | | | 70,026,353 | | | | 186,623,354 | | | | (14,303,737 | ) | | | (6,679,340 | ) |
| | | | | | | | | | | | | | | | | | | | | | |
| | (2,601,564 | ) | | | 11,614,613 | | | | 79,436,279 | | | | 179,605,685 | | | | (19,727,547 | ) | | | (4,993,724 | ) |
| | | | | | | | | | | | | | | | | | | | | | |
| $ | 70,167,760 | | | $ | 72,769,324 | | | $ | 287,061,601 | | | $ | 207,625,322 | | | $ | 29,512,977 | | | $ | 49,240,524 | |
| | | | | | | | | | | | | | | | | | | | | | |
$ |
257,283 |
| | $ | 276,876 | | | $ | 781,026 | | | $ | 67,864 | | | $ | 121,022 | | | $ | — | |
| | | | | | | | | | | | | | | | | | | | | | |
See accompanying Notes to Financial Statements.
| | |
| |
| | |
| |
| Statements of Changes in Net Assets – continued | | |
| | | | | | | | | | | | | | | | |
| | |
| | | Anchor Capital
Enhanced Equity Fund | | | River Road
Long-Short Fund | |
| | | Years Ended October 31, | | | Year Ended
October 31,
2012 | | | Period Ended
October 31,
2011(a) | |
| | | 2012 | | | 2011 | | | |
| | | | | | | | | | | | | | | | |
NET ASSETS at Beginning of Period | | $ | 113,205,174 | | | $ | 92,563,052 | | | $ | 4,593,930 | | | $ | — | |
| | | | | | | | | | | | | | | | |
Increase (decrease) in net assets from operations: | | | | | | | | | | | | | | | | |
Net investment income (loss) | | | 2,759,375 | | | | 1,731,594 | | | | (98,537 | ) | | | (30,424 | ) |
Net realized gain (loss) on investments, purchased options, written options, securities sold short and foreign currency transactions | | | 2,854,278 | | | | 11,844,073 | | | | 613,267 | | | | (150,888 | ) |
Net change in unrealized appreciation (depreciation) on investments, purchased options, written options, securities sold short and translation of assets and liabilities denominated in foreign currency | | | (1,004,621 | ) | | | (5,531,012 | ) | | | (73,523 | ) | | | 116,075 | |
| | | | | | | | | | | | | | | | |
Net increase (decrease) in net assets from operations | | | 4,609,032 | | | | 8,044,655 | | | | 441,207 | | | | (65,237 | ) |
| | | | | | | | | | | | | | | | |
Distributions to shareholders from: | | | | | | | | | | | | | | | | |
Net investment income: | | | | | | | | | | | | | | | | |
Class N | | | (1,259,013 | ) | | | (652,123 | ) | | | — | | | | — | |
Class I | | | (1,453,347 | ) | | | (1,009,975 | ) | | | — | | | | — | |
Net realized gain on investments: | | | | | | | | | | | | | | | | |
Class N | | | (5,377,824 | ) | | | (1,928,441 | ) | | | — | | | | — | |
Class I | | | (6,563,185 | ) | | | (2,282,232 | ) | | | — | | | | — | |
| | | | | | | | | | | | | | | | |
Total distributions | | | (14,653,369 | ) | | | (5,872,771 | ) | | | — | | | | — | |
| | | | | | | | | | | | | | | | |
Capital share transactions: | | | | | | | | | | | | | | | | |
Proceeds from sales of shares: | | | | | | | | | | | | | | | | |
Class N | | | 89,657,148 | | | | 26,609,227 | | | | 3,037,084 | | | | 4,660,217 | |
Class I | | | 42,752,026 | | | | 25,630,704 | | | | — | | | | — | |
Proceeds from reinvestment of distributions: | | | | | | | | | | | | | | | | |
Class N | | | 6,562,788 | | | | 2,544,539 | | | | — | | | | — | |
Class I | | | 5,836,625 | | | | 2,663,560 | | | | — | | | | — | |
Cost of shares redeemed: | | | | | | | | | | | | | | | | |
Class N | | | (34,343,989 | ) | | | (28,044,291 | ) | | | (565,834 | ) | | | (1,050 | ) |
Class I | | | (35,816,115 | ) | | | (10,933,501 | ) | | | — | | | | — | |
| | | | | | | | | | | | | | | | |
Net increase (decrease) from capital share
transactions | | | 74,648,483 | | | | 18,470,238 | | | | 2,471,250 | | | | 4,659,167 | |
| | | | | | | | | | | | | | | | |
Total increase (decrease) in net assets | | | 64,604,146 | | | | 20,642,122 | | | | 2,912,457 | | | | 4,593,930 | |
| | | | | | | | | | | | | | | | |
NET ASSETS at End of Period | | $ | 177,809,320 | | | $ | 113,205,174 | | | $ | 7,506,387 | | | $ | 4,593,930 | |
| | | | | | | | | | | | | | | | |
Undistributed (distributions in excess of)
net investment income (loss) | | $ | 127,535 | | | $ | 80,520 | | | $ | (29,732 | ) | | $ | (8,210 | ) |
| | | | | | | | | | | | | | | | |
| (a) | River Road Long-Short Fund began issuing shares on May 3, 2011. |
| (b) | Harrison Street Real Estate Fund had a redemption-in-kind on December 2, 2011, which resulted in a redemption out of the Fund of $31,399,368. The redemption was comprised of securities and cash in the amounts of $30,913,574 and $485,794, respectively. |
See accompanying Notes to Financial Statements.
| | | | | | | | | | | | | | | | | | | | | | |
| | |
Barings
International Fund | | | Harrison Street
Real Estate Fund | | | Montag & Caldwell
Balanced Fund | |
Years Ended October 31, | | | Years Ended October 31, | | | Years Ended October 31, | |
| 2012 | | | 2011 | | | 2012 | | | 2011 | | | 2012 | | | 2011 | |
| | | | | | | | | | | | | | | | | | | | | | |
| $ | 52,782,652 | | | $ | 48,168,829 | | | $ | 39,212,065 | | | $ | 35,582,298 | | | $ | 24,729,716 | | | $ | 30,555,528 | |
| | | | | | | | | | | | | | | | | | | | | | |
| | | | | | | | | | | | | | | | | | | | | | |
| | 1,043,951 | | | | 683,032 | | | | 173,143 | | | | 321,324 | | | | 227,101 | | | | 216,304 | |
|
883,136 |
| | | 3,681,538 | | | | 1,929,157 | | | | 8,172,513 | | | | 1,435,094 | | | | 2,651,240 | |
|
760,195 |
| | | (6,777,543 | ) | | | (2,376,608 | ) | | | (4,472,206 | ) | | | 422,708 | | | | (947,217 | ) |
| | | | | | | | | | | | | | | | | | | | | | |
| | 2,687,282 | | | | (2,412,973 | ) | | | (274,308 | ) | | | 4,021,631 | | | | 2,084,903 | | | | 1,920,327 | |
| | | | | | | | | | | | | | | | | | | | | | |
| | | | | | | | | | | | | | | | | | | | | | |
| | | | | | | | | | | | | | | | | | | | | | |
| | (2,517 | ) | | | (3,391 | ) | | | (46,752 | ) | | | (95,034 | ) | | | (309,427 | ) | | | (266,744 | ) |
| | (507,253 | ) | | | (1,016,220 | ) | | | (823 | ) | | | (532,220 | ) | | | (22,048 | ) | | | (45,549 | ) |
| | | | | | | | | | | | | | | | | | | | | | |
| | (9,564 | ) | | | — | | | | — | | | | — | | | | — | | | | — | |
| | (1,371,156 | ) | | | — | | | | — | | | | — | | | | — | | | | — | |
| | | | | | | | | | | | | | | | | | | | | | |
| | (1,890,490 | ) | | | (1,019,611 | ) | | | (47,575 | ) | | | (627,254 | ) | | | (331,475 | ) | | | (312,293 | ) |
| | | | | | | | | | | | | | | | | | | | | | |
| | | | | | | | | | | | | | | | | | | | | | |
| | | | | | | | | | | | | | | | | | | | | | |
| | 11,495 | | | | 299,750 | | | | 6,295,128 | | | | 3,015,671 | | | | 12,344,202 | | | | 1,639,927 | |
| | 17,971,181 | | | | 15,930,055 | | | | 208,772 | | | | 37,683 | | | | 641,711 | | | | 4,647,220 | |
| | | | | | | | | | | | | | | | | | | | | | |
| | 12,081 | | | | 3,391 | | | | 44,264 | | | | 93,419 | | | | 301,482 | | | | 258,918 | |
| | 1,167,329 | | | | 816,360 | | | | 539 | | | | 532,220 | | | | 9,037 | | | | 33,009 | |
| | | | | | | | | | | | | | | | | | | | | | |
| | (271 | ) | | | (68,520 | ) | | | (3,336,601 | ) | | | (3,431,764 | ) | | | (6,067,796 | ) | | | (9,141,134 | ) |
| | (10,657,603 | ) | | | (8,934,629 | ) | | | (31,555,680 | )(b) | | | (11,839 | ) | | | (245,525 | ) | | | (4,871,786 | ) |
| | | | | | | | | | | | | | | | | | | | | | |
|
8,504,212 |
| | | 8,046,407 | | | | (28,343,578 | ) | | | 235,390 | | | | 6,983,111 | | | | (7,433,846 | ) |
| | | | | | | | | | | | | | | | | | | | | | |
| | 9,301,004 | | | | 4,613,823 | | | | (28,665,461 | ) | | | 3,629,767 | | | | 8,736,539 | | | | (5,825,812 | ) |
| | | | | | | | | | | | | | | | | | | | | | |
| $ | 62,083,656 | | | $ | 52,782,652 | | | $ | 10,546,604 | | | $ | 39,212,065 | | | $ | 33,466,255 | | | $ | 24,729,716 | |
| | | | | | | | | | | | | | | | | | | | | | |
$ |
992,441 |
| | $ | 488,263 | | | $ | 125,494 | | | $ | 149,433 | | | $ | (230,949 | ) | | $ | (190,512 | ) |
| | | | | | | | | | | | | | | | | | | | | | |
See accompanying Notes to Financial Statements.
| | |
| |
| ASTON/Montag & Caldwell Growth Fund – Class N | | October 31, 2012 |
| |
| Financial Highlights | | |
| | | | | | | | | | | | | | | | | | | | |
| | | Year
Ended
10/31/12 | | | Year
Ended
10/31/11 | | | Year
Ended
10/31/10 | | | Year
Ended
10/31/09 | | | Year
Ended
10/31/08 | |
Net Asset Value, Beginning of Period | | $ | 24.72 | | | $ | 22.92 | | | $ | 20.87 | | | $ | 18.84 | | | $ | 31.51 | |
| | | | | | | | | | | | | | | | | | | | |
Income from Investment Operations: | | | | | | | | | | | | | | | | | | | | |
Net investment income | | | 0.15 | (a) | | | 0.14 | (a) | | | 0.12 | (a) | | | 0.08 | (a) | | | 0.07 | (a) |
Net realized and unrealized gain (loss)
on investments | | | 2.45 | | | | 1.83 | | | | 2.01 | (b) | | | 2.61 | | | | (8.66 | ) |
| | | | | | | | | | | | | | | | | | | | |
Total from investment operations | | | 2.60 | | | | 1.97 | | | | 2.13 | | | | 2.69 | | | | (8.59 | ) |
| | | | | | | | | | | | | | | | | | | | |
Less Distributions: | | | | | | | | | | | | | | | | | | | | |
Distributions from and in excess of net
investment income | | | (0.13 | ) | | | (0.13 | ) | | | (0.08 | ) | | | (0.06 | ) | | | (0.05 | ) |
Distributions from net realized gain
on investments | | | (1.88 | ) | | | (0.04 | ) | | | — | | | | (0.60 | ) | | | (4.03 | ) |
| | | | | | | | | | | | | | | | | | | | |
Total distributions | | | (2.01 | ) | | | (0.17 | ) | | | (0.08 | ) | | | (0.66 | ) | | | (4.08 | ) |
| | | | | | | | | | | | | | | | | | | | |
Net increase (decrease) in net asset value . | | | 0.59 | | | | 1.80 | | | | 2.05 | | | | 2.03 | | | | (12.67 | ) |
| | | | | | | | | | | | | | | | | | | | |
Net Asset Value, End of Period | | $ | 25.31 | | | $ | 24.72 | | | $ | 22.92 | | | $ | 20.87 | | | $ | 18.84 | |
| | | | | | | | | | | | | | | | | | | | |
Total Return (c) | | | 11.40 | % | | | 8.56 | % | | | 10.20 | % | | | 15.08 | % | | | (31.13 | )% |
| | | | | |
Ratios/Supplemental Data: | | | | | | | | | | | | | | | | | | | | |
Net Assets, End of Period (in 000’s) | | $ | 1,908,663 | | | $ | 1,683,183 | | | $ | 1,506,075 | | | $ | 1,277,346 | | | $ | 602,905 | |
Ratios of expenses to average net assets: | | | | | | | | | | | | | | | | | | | | |
Before reimbursement and/or waiver of
expenses by Adviser | | | 1.05 | % | | | 1.06 | % | | | 1.08 | %(d) | | | 1.11 | % | | | 1.08 | %(d) |
After reimbursement and/or waiver of
expenses by Adviser | | | 1.05 | % | | | 1.06 | % | | | 1.08 | %(d) | | | 1.11 | % | | | 1.08 | %(d) |
Ratios of net investment income to average net assets: | | | | | | | | | | | | | | | | | | | | |
Before reimbursement and/or waiver of
expenses by Adviser | | | 0.60 | % | | | 0.59 | % | | | 0.56 | % | | | 0.41 | % | | | 0.26 | % |
After reimbursement and/or waiver of
expenses by Adviser | | | 0.60 | % | | | 0.59 | % | | | 0.56 | % | | | 0.41 | % | | | 0.26 | % |
Portfolio Turnover | | | 46.42 | % | | | 63.48 | % | | | 57.39 | %(e) | | | 35.09 | %(f) | | | 52.32 | % |
| | (a) | The selected per share data was calculated using the weighted average shares outstanding method for the period. |
| | (b) | Includes payments by affiliates of less than $0.005 per share. |
| | (c) | The total return is calculated using the Net Asset Values used for trading at the close of business at period end. |
| | (d) | Ratios of expenses to average net assets include interest expenses of less than 0.005% for each of the years ended October 31, 2010 and October 31, 2008. The interest expenses are from utilizing the line of credit as discussed in Note H to Financial Statements. |
| | (e) | Portfolio turnover rate excludes securities received from a reorganization. |
| | (f) | Portfolio turnover rate excludes securities received from processing a subscription-in-kind. |
See accompanying Notes to Financial Statements.
| | |
| |
| ASTON/Montag & Caldwell Growth Fund – Class I | | October 31, 2012 |
| |
| Financial Highlights | | |
| | | | | | | | | | | | | | | | | | | | |
| | | Year
Ended
10/31/12 | | | Year
Ended
10/31/11 | | | Year
Ended
10/31/10 | | | Year
Ended
10/31/09 | | | Year
Ended
10/31/08 | |
Net Asset Value, Beginning of Period | | $ | 24.85 | | | $ | 23.05 | | | $ | 20.97 | | | $ | 18.94 | | | $ | 31.61 | |
| | | | | | | | | | | | | | | | | | | | |
Income from Investment Operations: | | | | | | | | | | | | | | | | | | | | |
Net investment income | | | 0.21 | (a) | | | 0.21 | (a) | | | 0.18 | (a) | | | 0.12 | (a) | | | 0.13 | (a) |
Net realized and unrealized gain (loss)
on investments | | | 2.47 | | | | 1.82 | | | | 2.02 | (b) | | | 2.62 | | | | (8.70 | ) |
| | | | | | | | | | | | | | | | | | | | |
Total from investment operations | | | 2.68 | | | | 2.03 | | | | 2.20 | | | | 2.74 | | | | (8.57 | ) |
| | | | | | | | | | | | | | | | | | | | |
Less Distributions: | | | | | | | | | | | | | | | | | | | | |
Distributions from and in excess of net
investment income | | | (0.19 | ) | | | (0.19 | ) | | | (0.12 | ) | | | (0.11 | ) | | | (0.07 | ) |
Distributions from net realized gain
on investments | | | (1.88 | ) | | | (0.04 | ) | | | — | | | | (0.60 | ) | | | (4.03 | ) |
| | | | | | | | | | | | | | | | | | | | |
Total distributions | | | (2.07 | ) | | | (0.23 | ) | | | (0.12 | ) | | | (0.71 | ) | | | (4.10 | ) |
| | | | | | | | | | | | | | | | | | | | |
Net increase (decrease) in net asset value | | | 0.61 | | | | 1.80 | | | | 2.08 | | | | 2.03 | | | | (12.67 | ) |
| | | | | | | | | | | | | | | | | | | | |
Net Asset Value, End of Period | | $ | 25.46 | | | $ | 24.85 | | | $ | 23.05 | | | $ | 20.97 | | | $ | 18.94 | |
| | | | | | | | | | | | | | | | | | | | |
Total Return (c) | | | 11.67 | % | | | 8.82 | % | | | 10.49 | % | | | 15.36 | % | | | (30.96 | )% |
| | | | | |
Ratios/Supplemental Data: | | | | | | | | | | | | | | | | | | | | |
Net Assets, End of Period (in 000’s) | | $ | 2,406,145 | | | $ | 1,749,183 | | | $ | 1,528,981 | | | $ | 1,205,637 | | | $ | 754,671 | |
Ratios of expenses to average net assets: | | | | | | | | | | | | | | | | | | | | |
Before reimbursement and/or waiver of
expenses by Adviser | | | 0.80 | % | | | 0.81 | % | | | 0.83 | %(d) | | | 0.86 | % | | | 0.83 | %(d) |
After reimbursement and/or waiver of
expenses by Adviser | | | 0.80 | % | | | 0.81 | % | | | 0.83 | %(d) | | | 0.86 | % | | | 0.83 | %(d) |
Ratios of net investment income to average net assets: | | | | | | | | | | | | | | | | | | | | |
Before reimbursement and/or waiver of
expenses by Adviser | | | 0.85 | % | | | 0.84 | % | | | 0.81 | % | | | 0.66 | % | | | 0.51 | % |
After reimbursement and/or waiver of
expenses by Adviser | | | 0.85 | % | | | 0.84 | % | | | 0.81 | % | | | 0.66 | % | | | 0.51 | % |
Portfolio Turnover | | | 46.42 | % | | | 63.48 | % | | | 57.39 | %(e) | | | 35.09 | %(f) | | | 52.32 | % |
| | (a) | The selected per share data was calculated using the weighted average shares outstanding method for the period. |
| | (b) | Includes payments by affiliates of less than $0.005 per share. |
| | (c) | The total return is calculated using the Net Asset Values used for trading at the close of business at period end. |
| | (d) | Ratios of expenses to average net assets include interest expenses of less than 0.005% for each of the years ended October 31, 2010 and October 31, 2008. The interest expenses are from utilizing the line of credit as discussed in Note H to Financial Statements. |
| | (e) | Portfolio turnover rate excludes securities received from a reorganization. |
| | (f) | Portfolio turnover rate excludes securities received from processing a subscription-in-kind. |
See accompanying Notes to Financial Statements.
| | |
| |
| ASTON/Montag & Caldwell Growth Fund – Class R | | October 31, 2012 |
| |
| Financial Highlights | | |
| | | | | | | | | | | | | | | | | | | | |
| | | Year
Ended
10/31/12 | | | Year
Ended
10/31/11 | | | Year
Ended
10/31/10 | | | Year
Ended
10/31/09 | | | Year
Ended
10/31/08 | |
Net Asset Value, Beginning of Period | | $ | 24.45 | | | $ | 22.70 | | | $ | 20.73 | | | $ | 18.69 | | | $ | 31.33 | |
| | | | | | | | | | | | | | | | | | | | |
Income from Investment Operations: | | | | | | | | | | | | | | | | | | | | |
Net investment income | | | 0.09 | (a) | | | 0.08 | (a) | | | 0.07 | (a) | | | 0.03 | (a) | | | — | (a)(b) |
Net realized and unrealized gain (loss)
on investments | | | 2.43 | | | | 1.80 | | | | 1.98 | (c) | | | 2.61 | | | | (8.58 | ) |
| | | | | | | | | | | | | | | | | | | | |
Total from investment operations | | | 2.52 | | | | 1.88 | | | | 2.05 | | | | 2.64 | | | | (8.58 | ) |
| | | | | | | | | | | | | | | | | | | | |
Less Distributions: | | | | | | | | | | | | | | | | | | | | |
Distributions from and in excess of net
investment income | | | (0.07 | ) | | | (0.09 | ) | | | (0.08 | ) | | | — | | | | (0.03 | ) |
Distributions from net realized gain
on investments | | | (1.88 | ) | | | (0.04 | ) | | | — | | | | (0.60 | ) | | | (4.03 | ) |
| | | | | | | | | | | | | | | | | | | | |
Total distributions | | | (1.95 | ) | | | (0.13 | ) | | | (0.08 | ) | | | (0.60 | ) | | | (4.06 | ) |
| | | | | | | | | | | | | | | | | | | | |
Net increase (decrease) in net asset value . | | | 0.57 | | | | 1.75 | | | | 1.97 | | | | 2.04 | | | | (12.64 | ) |
| | | | | | | | | | | | | | | | | | | | |
Net Asset Value, End of Period | | $ | 25.02 | | | $ | 24.45 | | | $ | 22.70 | | | $ | 20.73 | | | $ | 18.69 | |
| | | | | | | | | | | | | | | | | | | | |
Total Return (d) | | | 11.10 | % | | | 8.29 | % | | | 9.90 | % | | | 14.87 | % | | | (31.28 | )% |
| | | | | |
Ratios/Supplemental Data: | | | | | | | | | | | | | | | | | | | | |
Net Assets, End of Period (in 000’s) | | $ | 8,771 | | | $ | 8,654 | | | $ | 7,292 | | | $ | 3,840 | | | $ | 266 | |
Ratios of expenses to average net assets: | | | | | | | | | | | | | | | | | | | | |
Before reimbursement and/or waiver of
expenses by Adviser | | | 1.30 | % | | | 1.31 | % | | | 1.33 | %(e) | | | 1.36 | % | | | 1.33 | %(e) |
After reimbursement and/or waiver of
expenses by Adviser | | | 1.30 | % | | | 1.31 | % | | | 1.33 | %(e) | | | 1.36 | % | | | 1.33 | %(e) |
Ratios of net investment income to average net assets: | | | | | | | | | | | | | | | | | | | | |
Before reimbursement and/or waiver of
expenses by Adviser | | | 0.35 | % | | | 0.34 | % | | | 0.31 | % | | | 0.16 | % | | | 0.01 | % |
After reimbursement and/or waiver of
expenses by Adviser | | | 0.35 | % | | | 0.34 | % | | | 0.31 | % | | | 0.16 | % | | | 0.01 | % |
Portfolio Turnover | | | 46.42 | % | | | 63.48 | % | | | 57.39 | %(f) | | | 35.09 | %(g) | | | 52.32 | % |
| | (a) | The selected per share data was calculated using the weighted average shares outstanding method for the period. |
| | (b) | Represents less than $0.005 per share. |
| | (c) | Includes payments by affiliates of less than $0.005 per share. |
| | (d) | The total return is calculated using the Net Asset Values used for trading at the close of business at period end. |
| | (e) | Ratios of expenses to average net assets include interest expenses of less than 0.005% for each of the years ended October 31, 2010 and October 31, 2008. The interest expenses are from utilizing the line of credit as discussed in Note H to Financial Statements. |
| | (f) | Portfolio turnover rate excludes securities received from a reorganization. |
| | (g) | Portfolio turnover rate excludes securities received from processing a subscription-in-kind. |
See accompanying Notes to Financial Statements.
| | |
| |
| ASTON/Veredus Select Growth Fund – Class N | | October 31, 2012 |
| |
| Financial Highlights | | |
| | | | | | | | | | | | | | | | | | | | |
| | | Year
Ended
10/31/12 | | | Year
Ended
10/31/11 | | | Year
Ended
10/31/10 | | | Year
Ended
10/31/09 | | | Year
Ended
10/31/08 | |
Net Asset Value, Beginning of Period | | $ | 10.77 | | | $ | 11.35 | | | $ | 9.07 | | | $ | 8.69 | | | $ | 16.77 | |
| | | | | | | | | | | | | | | | | | | | |
Income from Investment Operations: | | | | | | | | | | | | | | | | | | | | |
Net investment income (loss) | | | 0.02 | (a) | | | (0.02 | )(a) | | | (0.04 | ) | | | (0.01 | ) | | | (0.06 | ) |
Net realized and unrealized gain income (loss)
on investments | | | 0.30 | | | | (0.56 | ) | | | 2.32 | | | | 0.39 | | | | (5.60 | ) |
| | | | | | | | | | | | | | | | | | | | |
Total from investment operations | | | 0.32 | | | | (0.58 | ) | | | 2.28 | | | | 0.38 | | | | (5.66 | ) |
| | | | | | | | | | | | | | | | | | | | |
Less Distributions: | | | | | | | | | | | | | | | | | | | | |
Distributions from and in excess of net
investment income | | | — | | | | — | | | | — | (b) | | | — | | | | — | |
Distributions from net realized gain
on investments | | | — | | | | — | | | | — | | | | — | | | | (2.42 | ) |
| | | | | | | | | | | | | | | | | | | | |
Total distributions | | | — | | | | — | | | | — | | | | — | | | | (2.42 | ) |
| | | | | | | | | | | | | | | | | | | | |
Net increase (decrease) in net asset value . | | | 0.32 | | | | (0.58 | ) | | | 2.28 | | | | 0.38 | | | | (8.08 | ) |
| | | | | | | | | | | | | | | | | | | | |
Net Asset Value, End of Period | | $ | 11.09 | | | $ | 10.77 | | | $ | 11.35 | | | $ | 9.07 | | | $ | 8.69 | |
| | | | | | | | | | | | | | | | | | | | |
Total Return (c) | | | 2.97 | % | | | (5.11 | )% | | | 25.15 | % | | | 4.37 | % | | | (39.09 | )% |
| | | | | |
Ratios/Supplemental Data: | | | | | | | | | | | | | | | | | | | | |
Net Assets, End of Period (in 000’s) | | $ | 10,614 | | | $ | 20,733 | | | $ | 42,567 | | | $ | 39,437 | | | $ | 37,142 | |
Ratios of expenses to average net assets: | | | | | | | | | | | | | | | | | | | | |
Before reimbursement and/or waiver of
expenses by Adviser | | | 1.44 | %(d) | | | 1.30 | % | | | 1.33 | % | | | 1.37 | % | | | 1.34 | % |
After reimbursement and/or waiver of
expenses by Adviser | | | 1.30 | %(d) | | | 1.30 | % | | | 1.30 | % | | | 1.30 | % | | | 1.30 | % |
Ratios of net investment income (loss)
to average net assets: | | | | | | | | | | | | | | | | | | | | |
Before reimbursement and/or waiver of
expenses by Adviser | | | 0.09 | % | | | (0.15 | )% | | | (0.38 | )% | | | (0.24 | )% | | | (0.55 | )% |
After reimbursement and/or waiver of
expenses by Adviser | | | 0.23 | % | | | (0.15 | )% | | | (0.35 | )% | | | (0.17 | )% | | | (0.51 | )% |
Portfolio Turnover | | | 202.81 | % | | | 312.62 | % | | | 325.01 | % | | | 331.55 | % | | | 387.57 | % |
| | (a) | The selected per share data was calculated using the weighted average shares outstanding method for the period. |
| | (b) | Represents less than $(0.005) per share. |
| | (c) | The total return is calculated using the Net Asset Values used for trading at the close of business at period end. |
| | (d) | Ratios of expenses to average net assets include interest expense of less than 0.005% for the year ended October 31, 2012, which is not included in the contractual expense limitation. The interest expense is from utilizing the line of credit as discussed in Note H to Financial Statements. |
See accompanying Notes to Financial Statements.
| | |
| |
| ASTON/Veredus Select Growth Fund – Class I | | October 31, 2012 |
| |
| Financial Highlights | | |
| | | | | | | | | | | | | | | | | | | | |
| | | Year
Ended
10/31/12 | | | Year
Ended
10/31/11 | | | Year
Ended
10/31/10 | | | Year
Ended
10/31/09 | | | Year
Ended
10/31/08 | |
Net Asset Value, Beginning of Period | | $ | 10.92 | | | $ | 11.48 | | | $ | 9.16 | | | $ | 8.74 | | | $ | 16.83 | |
| | | | | | | | | | | | | | | | | | | | |
Income from Investment Operations: | | | | | | | | | | | | | | | | | | | | |
Net investment income (loss) | | | 0.05 | (a) | | | 0.01 | (a) | | | (0.01 | ) | | | 0.01 | | | | (0.02 | ) |
Net realized and unrealized gain (loss)
on investments | | | 0.29 | | | | (0.57 | ) | | | 2.34 | | | | 0.41 | | | | (5.65 | ) |
| | | | | | | | | | | | | | | | | | | | |
Total from investment operations | | | 0.34 | | | | (0.56 | ) | | | 2.33 | | | | 0.42 | | | | (5.67 | ) |
| | | | | | | | | | | | | | | | | | | | |
Less Distributions: | | | | | | | | | | | | | | | | | | | | |
Distributions from and in excess of net
investment income | | | (0.01 | ) | | | — | | | | (0.01 | ) | | | — | | | | — | |
Distributions from net realized gain
on investments | | | — | | | | — | | | | — | | | | — | | | | (2.42 | ) |
| | | | | | | | | | | | | | | | | | | | |
Total distributions | | | (0.01 | ) | | | — | | | | (0.01 | ) | | | — | | | | (2.42 | ) |
| | | | | | | | | | | | | | | | | | | | |
Net increase (decrease) in net asset value . | | | 0.33 | | | | (0.56 | ) | | | 2.32 | | | | 0.42 | | | | (8.09 | ) |
| | | | | | | | | | | | | | | | | | | | |
Net Asset Value, End of Period | | $ | 11.25 | | | $ | 10.92 | | | $ | 11.48 | | | $ | 9.16 | | | $ | 8.74 | |
| | | | | | | | | | | | | | | | | | | | |
Total Return (b) | | | 3.19 | % | | | (4.88 | )% | | | 25.39 | % | | | 4.81 | % | | | (38.96 | )% |
| | | | | |
Ratios/Supplemental Data: | | | | | | | | | | | | | | | | | | | | |
Net Assets, End of Period (in 000’s) | | $ | 1,478 | | | $ | 59,544 | | | $ | 61,939 | | | $ | 47,699 | | | $ | 46,040 | |
Ratios of expenses to average net assets: | | | | | | | | | | | | | | | | | | | | |
Before reimbursement and/or waiver of
expenses by Adviser | | | 1.19 | %(c) | | | 1.05 | % | | | 1.08 | % | | | 1.12 | % | | | 1.09 | % |
After reimbursement and/or waiver of
expenses by Adviser | | | 1.05 | %(c) | | | 1.05 | % | | | 1.05 | % | | | 1.05 | % | | | 1.05 | % |
Ratios of net investment income (loss)
to average net assets: | | | | | | | | | | | | | | | | | | | | |
Before reimbursement and/or waiver of
expenses by Adviser | | | 0.34 | % | | | 0.10 | % | | | (0.13 | )% | | | 0.01 | % | | | (0.30 | )% |
After reimbursement and/or waiver of
expenses by Adviser | | | 0.48 | % | | | 0.10 | % | | | (0.10 | )% | | | 0.08 | % | | | (0.26 | )% |
Portfolio Turnover | | | 202.81 | % | | | 312.62 | % | | | 325.01 | % | | | 331.55 | % | | | 387.57 | % |
| | (a) | The selected per share data was calculated using the weighted average shares outstanding method for the period. |
| | (b) | The total return is calculated using the Net Asset Values used for trading at the close of business at period end. |
| | (c) | Ratios of expenses to average net assets include interest expense of less than 0.005% for the year ended October 31, 2012, which is not included in the contractual expense limitation. The interest expense is from utilizing the line of credit as discussed in Note H to Financial Statements. |
See accompanying Notes to Financial Statements.
| | |
| |
| ASTON/TAMRO Diversified Equity Fund – Class N | | October 31, 2012 |
| |
| Financial Highlights | | |
| | | | | | | | | | | | | | | | | | | | |
| | | Year
Ended
10/31/12 | | | Year
Ended
10/31/11 | | | Year
Ended
10/31/10 | | | Year
Ended
10/31/09 | | | Year
Ended
10/31/08 | |
Net Asset Value, Beginning of Period | | $ | 12.34 | | | $ | 11.83 | | | $ | 9.72 | | | $ | 8.34 | | | $ | 14.41 | |
| | | | | | | | | | | | | | | | | | | | |
Income from Investment Operations: | | | | | | | | | | | | | | | | | | | | |
Net investment income (loss) | | | — | (a) | | | (0.02 | ) | | | — | (a) | | | — | (a) | | | 0.04 | |
Net realized and unrealized gain (loss)
on investments | | | 1.44 | | | | 0.53 | | | | 2.13 | | | | 1.42 | | | | (4.94 | ) |
| | | | | | | | | | | | | | | | | | | | |
Total from investment operations | | | 1.44 | | | | 0.51 | | | | 2.13 | | | | 1.42 | | | | (4.90 | ) |
| | | | | | | | | | | | | | | | | | | | |
Less Distributions: | | | | | | | | | | | | | | | | | | | | |
Distributions from and in excess of net
investment income | | | — | | | | — | | | | (0.02 | ) | | | (0.04 | ) | | | (0.01 | ) |
Distributions from net realized gain
on investments | | | (0.26 | ) | | | — | | | | — | | | | — | | | | (1.16 | ) |
| | | | | | | | | | | | | | | | | | | | |
Total distributions | | | (0.26 | ) | | | — | | | | (0.02 | ) | | | (0.04 | ) | | | (1.17 | ) |
| | | | | | | | | | | | | | | | | | | | |
Net increase (decrease) in net asset value . | | | 1.18 | | | | 0.51 | | | | 2.11 | | | | 1.38 | | | | (6.07 | ) |
| | | | | | | | | | | | | | | | | | | | |
Net Asset Value, End of Period | | $ | 13.52 | | | $ | 12.34 | | | $ | 11.83 | | | $ | 9.72 | | | $ | 8.34 | |
| | | | | | | | | | | | | | | | | | | | |
Total Return (b) | | | 11.94 | % | | | 4.31 | % | | | 21.95 | % | | | 17.13 | % | | | (36.75 | )% |
| | | | | |
Ratios/Supplemental Data: | | | | | | | | | | | | | | | | | | | | |
Net Assets, End of Period (in 000’s) | | $ | 21,980 | | | $ | 24,354 | | | $ | 15,670 | | | $ | 10,486 | | | $ | 8,562 | |
Ratios of expenses to average net assets: | | | | | | | | | | | | | | | | | | | | |
Before reimbursement and/or waiver of
expenses by Adviser | | | 1.68 | %(c) | | | 1.62 | %(c) | | | 1.63 | % | | | 1.95 | % | | | 1.88 | % |
After reimbursement and/or waiver of
expenses by Adviser | | | 1.20 | %(c) | | | 1.20 | %(c) | | | 1.20 | % | | | 1.20 | % | | | 1.20 | % |
Ratios of net investment income (loss)
to average net assets: | | | | | | | | | | | | | | | | | | | | |
Before reimbursement and/or waiver of
expenses by Adviser | | | (0.47 | )% | | | (0.63 | )% | | | (0.45 | )% | | | (0.77 | )% | | | (0.37 | )% |
After reimbursement and/or waiver of
expenses by Adviser | | | — | %(a) | | | (0.21 | )% | | | (0.02 | )% | | | (0.02 | )% | | | 0.31 | % |
Portfolio Turnover | | | 52.56 | % | | | 65.96 | % | | | 81.75 | % | | | 85.49 | % | | | 93.82 | % |
| | (a) | Represents less than $(0.005) per share or less than (0.005)%. |
| | (b) | The total return is calculated using the Net Asset Values used for trading at the close of business at period end. |
| | (c) | Ratios of expenses to average net assets include interest expenses of less than 0.005% for each of the years ended October 31, 2012 and October 31, 2011, which are not included in the contractual expense limitation. The interest expenses are from utilizing the line of credit as discussed in Note H to Financial Statements. |
See accompanying Notes to Financial Statements.
| | |
| |
| ASTON/TAMRO Diversified Equity Fund – Class I | | October 31, 2012 |
| |
| Financial Highlights | | |
| | | | |
| | | Period
Ended
10/31/12(a) | |
Net Asset Value, Beginning of Period | | $ | 13.27 | |
| | | | |
Income from Investment Operations: | | | | |
Net investment loss | | | (0.05 | ) |
Net realized and unrealized gain on investments | | | 0.33 | |
| | | | |
Total from investment operations | | | 0.28 | |
| | | | |
Net increase in net asset value | | | 0.28 | |
| | | | |
Net Asset Value, End of Period | | $ | 13.55 | |
| | | | |
Total Return (b) | | | 2.04 | %(c) |
| |
Ratios/Supplemental Data: | | | | |
Net Assets, End of Period (in 000’s) | | $ | 569 | |
Ratios of expenses to average net assets: | | | | |
Before reimbursement and/or waiver of expenses by Adviser | | | 1.45 | %(d) |
After reimbursement and/or waiver of expenses by Adviser | | | 0.95 | %(d) |
Ratios of net investment loss to average net assets: | | | | |
Before reimbursement and/or waiver of expenses by Adviser | | | (1.11 | )%(d) |
After reimbursement and/or waiver of expenses by Adviser | | | (0.61 | )%(d) |
Portfolio Turnover | | | 52.56 | % |
| | (a) | TAMRO Diversified Equity Fund began issuing Class I shares on March 1, 2012. |
| | (b) | The total return is calculated using the Net Asset Values used for trading at the close of business at period end. |
See accompanying Notes to Financial Statements.
| | |
| |
| ASTON/Herndon Large Cap Value Fund – Class N | | October 31, 2012 |
| |
| Financial Highlights | | |
| | | | | | | | | | | | |
| | | Year
Ended
10/31/12 | | | Year
Ended
10/31/11 | | | Period
Ended
10/31/10(a) | |
Net Asset Value, Beginning of Period | | $ | 11.31 | | | $ | 10.39 | | | $ | 10.00 | |
| | | | | | | | | | | | |
Income from Investment Operations: | | | | | | | | | | | | |
Net investment income | | | 0.18 | (b) | | | 0.12 | (b) | | | 0.03 | |
Net realized and unrealized gain on investments | | | 0.91 | | | | 0.81 | | | | 0.36 | |
| | | | | | | | | | | | |
Total from investment operations | | | 1.09 | | | | 0.93 | | | | 0.39 | |
| | | | | | | | | | | | |
Less Distributions: | | | | | | | | | | | | |
Distributions from and in excess of net investment income | | | (0.11 | ) | | | (0.01 | ) | | | — | |
Distributions from net realized gain on investments | | | (0.56 | ) | | | — | | | | — | |
| | | | | | | | | | | | |
Total distributions | | | (0.67 | ) | | | (0.01 | ) | | | — | |
| | | | | | | | | | | | |
Net increase in net asset value | | | 0.42 | | | | 0.92 | | | | 0.39 | |
| | | | | | | | | | | | |
Net Asset Value, End of Period | | $ | 11.73 | | | $ | 11.31 | | | $ | 10.39 | |
| | | | | | | | | | | | |
Total Return (c) | | | 10.39 | % | | | 9.09 | % | | | 3.90 | %(d) |
| | | |
Ratios/Supplemental Data: | | | | | | | | | | | | |
Net Assets, End of Period (in 000’s) | | $ | 20,832 | | | $ | 6,089 | | | $ | 1,472 | |
Ratios of expenses to average net assets: | | | | | | | | | | | | |
Before reimbursement and/or waiver of expenses by Adviser | | | 1.41 | % | | | 2.38 | % | | | 13.84 | %(e) |
After reimbursement and/or waiver of expenses by Adviser | | | 1.30 | % | | | 1.30 | % | | | 1.30 | %(e) |
Ratios of net investment income (loss) to average net assets: | | | | | | | | | | | | |
Before reimbursement and/or waiver of expenses by Adviser | | | 1.44 | % | | | (0.05 | )% | | | (11.94 | )%(e) |
After reimbursement and/or waiver of expenses by Adviser | | | 1.55 | % | | | 1.03 | % | | | 0.60 | %(e) |
Portfolio Turnover | | | 80.56 | % | | | 189.70 | % | | | 38.64 | %(d) |
| | (a) | Herndon Large Cap Value Fund began issuing Class N shares on March 30, 2010. |
| | (b) | The selected per share data was calculated using the weighted average shares outstanding method for the period. |
| | (c) | The total return is calculated using the Net Asset Values used for trading at the close of business at period end. |
See accompanying Notes to Financial Statements.
| | |
| |
| ASTON/Herndon Large Cap Value Fund – Class I | | October 31, 2012 |
| |
| Financial Highlights | | |
| | | | | | | | |
| | | Year
Ended
10/31/12 | | | Period
Ended
10/31/11(a) | |
Net Asset Value, Beginning of Period | | $ | 11.33 | | | $ | 11.48 | |
| | | | | | | | |
Income from Investment Operations: | | | | | | | | |
Net investment income | | | 0.21 | (b) | | | 0.10 | (b) |
Net realized and unrealized gain (loss) on investments | | | 0.91 | | | | (0.25 | ) |
| | | | | | | | |
Total from investment operations | | | 1.12 | | | | (0.15 | ) |
| | | | | | | | |
Less Distributions: | | | | | | | | |
Distributions from and in excess of net investment income | | | (0.14 | ) | | | — | |
Distributions from net realized gain on investments | | | (0.56 | ) | | | — | |
| | | | | | | | |
Total distributions | | | (0.70 | ) | | | — | |
| | | | | | | | |
Net increase (decrease) in net asset value | | | 0.42 | | | | (0.15 | ) |
| | | | | | | | |
Net Asset Value, End of Period | | $ | 11.75 | | | $ | 11.33 | |
| | | | | | | | |
Total Return (c) | | | 10.69 | % | | | (1.31 | )%(d) |
| | |
Ratios/Supplemental Data: | | | | | | | | |
Net Assets, End of Period (in 000’s) | | $ | 34,575 | | | $ | 11,881 | |
Ratios of expenses to average net assets: | | | | | | | | |
Before reimbursement and/or waiver of expenses by Adviser | | | 1.16 | % | | | 2.13 | %(e) |
After reimbursement and/or waiver of expenses by Adviser | | | 1.05 | % | | | 1.05 | %(e) |
Ratios of net investment income to average net assets: | | | | | | | | |
Before reimbursement and/or waiver of expenses by Adviser | | | 1.69 | % | | | 0.20 | %(e) |
After reimbursement and/or waiver of expenses by Adviser | | | 1.80 | % | | | 1.28 | %(e) |
Portfolio Turnover | | | 80.56 | % | | | 189.70 | % |
| | (a) | Herndon Large Cap Value Fund began issuing Class I shares on March 1, 2011. |
| | (b) | The selected per share data was calculated using the weighted average shares outstanding method for the period. |
| | (c) | The total return is calculated using the Net Asset Values used for trading at the close of business at period end. |
See accompanying Notes to Financial Statements.
| | |
| |
| ASTON/Cornerstone Large Cap Value Fund – Class N | | October 31, 2012 |
| |
| Financial Highlights | | |
| | | | | | | | | | | | | | | | | | | | |
| | | Year
Ended
10/31/12 | | | Year
Ended
10/31/11 | | | Year
Ended
10/31/10 | | | Year
Ended
10/31/09 | | | Year
Ended
10/31/08 | |
Net Asset Value, Beginning of Period | | $ | 10.04 | | | $ | 9.20 | | | $ | 8.31 | | | $ | 9.07 | | | $ | 15.57 | |
| | | | | | | | | | | | | | | | | | | | |
Income from Investment Operations: | | | | | | | | | | | | | | | | | | | | |
Net investment income | | | 0.10 | (a) | | | 0.12 | (a) | | | 0.13 | | | | 0.15 | | | | 0.15 | |
Net realized and unrealized gain (loss)
on investments | | | 0.94 | | | | 0.83 | | | | 0.89 | | | | 0.41 | | | | (5.08 | ) |
| | | | | | | | | | | | | | | | | | | | |
Total from investment operations | | | 1.04 | | | | 0.95 | | | | 1.02 | | | | 0.56 | | | | (4.93 | ) |
| | | | | | | | | | | | | | | | | | | | |
Less Distributions: | | | | | | | | | | | | | | | | | | | | |
Distributions from and in excess of net
investment income | | | (0.04 | ) | | | (0.11 | ) | | | (0.13 | ) | | | (0.15 | ) | | | (0.16 | ) |
Distributions from net realized gain
on investments | | | — | | | | — | | | | — | | | | (1.17 | ) | | | (1.41 | ) |
| | | | | | | | | | | | | | | | | | | | |
Total distributions | | | (0.04 | ) | | | (0.11 | ) | | | (0.13 | ) | | | (1.32 | ) | | | (1.57 | ) |
| | | | | | | | | | | | | | | | | | | | |
Net increase (decrease) in net asset value . | | | 1.00 | | | | 0.84 | | | | 0.89 | | | | (0.76 | ) | | | (6.50 | ) |
| | | | | | | | | | | | | | | | | | | | |
Net Asset Value, End of Period | | $ | 11.04 | | | $ | 10.04 | | | $ | 9.20 | | | $ | 8.31 | | | $ | 9.07 | |
| | | | | | | | | | | | | | | | | | | | |
Total Return (b) | | | 10.43 | % | | | 10.44 | % | | | 12.37 | % | | | 8.60 | % | | | (34.85 | )% |
| | | | | |
Ratios/Supplemental Data: | | | | | | | | | | | | | | | | | | | | |
Net Assets, End of Period (in 000’s) | | $ | 21,105 | | | $ | 24,631 | | | $ | 19,984 | | | $ | 20,173 | | | $ | 19,704 | |
Ratios of expenses to average net assets: | | | | | | | | | | | | | | | | | | | | |
Before reimbursement and/or waiver of
expenses by Adviser | | | 1.58 | % | | | 1.61 | % | | | 1.19 | %(c) | | | 1.21 | % | | | 1.18 | %(c) |
After reimbursement and/or waiver of
expenses by Adviser | | | 1.26 | %(d) | | | 1.14 | %(d) | | | 1.07 | %(c) | | | 1.07 | %(e) | | | 1.02 | %(c) |
Ratios of net investment income to average net assets: | | | | | | | | | | | | | | | | | | | | |
Before reimbursement and/or waiver of
expenses by Adviser | | | 0.60 | | | | 0.80 | % | | | 1.32 | % | | | 1.77 | % | | | 1.22 | % |
After reimbursement and/or waiver of
expenses by Adviser | | | 0.92 | % | | | 1.27 | % | | | 1.44 | % | | | 1.91 | % | | | 1.38 | % |
Portfolio Turnover | | | 58.21 | % | | | 59.07 | %(f) | | | 37.44 | % | | | 39.00 | % | | | 67.57 | % |
| | (a) | The selected per share data was calculated using the weighted average shares outstanding method for the period. |
| | (b) | The total return is calculated using the Net Asset Values used for trading at the close of business at period end. |
| | (c) | Ratios of expenses to average net assets include interest expenses of less than 0.005% for each of the years ended October 31, 2010 and October 31, 2008, which are not included in the contractual expense limitation. The interest expenses are from utilizing the line of credit as discussed in Note H to Financial Statements. |
| | (d) | Effective March 22, 2011, the Adviser changed the voluntary expense limitation from 1.07% to 1.19%. Subsequently on February 29, 2012, the Adviser removed the voluntary expense limitation and replaced it with a contractual expense limitation of 1.30%. |
| | (e) | The contractual expense limitation of 1.07%, which excludes interest, taxes, other investment-related costs (such as brokerage commissions), extraordinary expenses and acquired fund fees and expenses, was removed by the Adviser and replaced with a voluntary expense limitation of 1.07% effective March 1, 2009. Voluntary expense waivers can end at any time. |
| | (f) | Portfolio turnover rate excludes securities delivered from processing a redemption-in-kind. |
See accompanying Notes to Financial Statements.
| | |
| |
| ASTON/Cornerstone Large Cap Value Fund – Class I | | October 31, 2012 |
| |
| Financial Highlights | | |
| | | | | | | | | | | | | | | | | | | | |
| | | Year
Ended
10/31/12 | | | Year
Ended
10/31/11 | | | Year
Ended
10/31/10 | | | Year
Ended
10/31/09 | | | Year
Ended
10/31/08 | |
Net Asset Value, Beginning of Period | | $ | 10.05 | | | $ | 9.19 | | | $ | 8.31 | | | $ | 9.06 | | | $ | 15.57 | |
| | | | | | | | | | | | | | | | | | | | |
Income from Investment Operations: | | | | | | | | | | | | | | | | | | | | |
Net investment income | | | 0.11 | (a) | | | 0.16 | (a) | | | 0.15 | | | | 0.17 | | | | 0.20 | |
Net realized and unrealized gain (loss)
on investments | | | 0.96 | | | | 0.84 | | | | 0.88 | | | | 0.42 | | | | (5.10 | ) |
| | | | | | | | | | | | | | | | | | | | |
Total from investment operations | | | 1.07 | | | | 1.00 | | | | 1.03 | | | | 0.59 | | | | (4.90 | ) |
| | | | | | | | | | | | | | | | | | | | |
Less Distributions: | | | | | | | | | | | | | | | | | | | | |
Distributions from and in excess of net
investment income | | | (0.05 | ) | | | (0.14 | ) | | | (0.15 | ) | | | (0.17 | ) | | | (0.20 | ) |
Distributions from net realized gain
on investments | | | — | | | | — | | | | — | | | | (1.17 | ) | | | (1.41 | ) |
| | | | | | | | | | | | | | | | | | | | |
Total distributions | | | (0.05 | ) | | | (0.14 | ) | | | (0.15 | ) | | | (1.34 | ) | | | (1.61 | ) |
| | | | | | | | | | | | | | | | | | | | |
Net increase (decrease) in net asset value . | | | 1.02 | | | | 0.86 | | | | 0.88 | | | | (0.75 | ) | | | (6.51 | ) |
| | | | | | | | | | | | | | | | | | | | |
Net Asset Value, End of Period | | $ | 11.07 | | | $ | 10.05 | | | $ | 9.19 | | | $ | 8.31 | | | $ | 9.06 | |
| | | | | | | | | | | | | | | | | | | | |
Total Return (b) | | | 10.66 | % | | | 10.95 | % | | | 12.53 | % | | | 9.01 | % | | | (34.73 | )% |
| | | | | |
Ratios/Supplemental Data: | | | | | | | | | | | | | | | | | | | | |
Net Assets, End of Period (in 000’s) | | $ | 5,397 | | | $ | 126 | | | $ | 204,051 | | | $ | 205,580 | | | $ | 188,688 | |
Ratios of expenses to average net assets: | | | | | | | | | | | | | | | | | | | | |
Before reimbursement and/or waiver of
expenses by Adviser | | | 1.33 | % | | | 1.36 | % | | | 0.94 | %(c) | | | 0.96 | % | | | 0.93 | %(c) |
After reimbursement and/or waiver of
expenses by Adviser | | | 1.01 | %(d) | | | 0.89 | %(d) | | | 0.82 | %(c) | | | 0.82 | %(e) | | | 0.77 | %(c) |
Ratios of net investment income to average net assets: | | | | | | | | | | | | | | | | | | | | |
Before reimbursement and/or waiver of
expenses by Adviser | | | 0.85 | % | | | 1.05 | % | | | 1.57 | % | | | 2.02 | % | | | 1.47 | % |
After reimbursement and/or waiver of
expenses by Adviser | | | 1.17 | % | | | 1.52 | % | | | 1.69 | % | | | 2.16 | % | | | 1.63 | % |
Portfolio Turnover | | | 58.21 | % | | | 59.07 | %(f) | | | 37.44 | % | | | 39.00 | % | | | 67.57 | % |
| | (a) | The selected per share data was calculated using the weighted average shares outstanding method for the period. |
| | (b) | The total return is calculated using the Net Asset Values used for trading at the close of business at period end. |
| | (c) | Ratios of expense to average net assets included interest expenses of less than 0.005% for each of the years ended October 31, 2010 and October 31, 2008, which are not included in the contractual expense limitation. The interest expenses are from utilizing the line of credit as discussed in Note H to Financial Statements. |
| | (d) | Effective March 22, 2011, the Adviser changed the voluntary expense limitation from 0.82% to 0.94%. Subsequently on February 29, 2012, the Adviser removed the voluntary expense limitation and replaced it with a contractual expense limitation of 1.05%. |
| | (e) | The contractual expense limitation of 0.82%, which excludes interest, taxes, other investment-related costs (such as brokerage commissions), extraordinary expenses and acquired fund fees and expenses, was removed by the Adviser and replaced with a voluntary expense limitation of 0.82% effective March 1, 2009. Voluntary expense waivers can end at any time. |
| | (f) | Portfolio turnover rate excludes securities delivered from processing a redemption-in-kind. |
See accompanying Notes to Financial Statements.
| | |
| |
| ASTON/River Road Dividend All Cap Value Fund – Class N | | October 31, 2012 |
| |
| Financial Highlights | | |
| | | | | | | | | | | | | | | | | | | | |
| | | Year
Ended
10/31/12 | | | Year
Ended
10/31/11 | | | Year
Ended
10/31/10 | | | Year
Ended
10/31/09 | | | Year
Ended
10/31/08 | |
Net Asset Value, Beginning of Period | | $ | 10.68 | | | $ | 10.23 | | | $ | 8.58 | | | $ | 8.43 | | | $ | 12.58 | |
| | | | | | | | | | | | | | | | | | | | |
Income from Investment Operations: | | | | | | | | | | | | | | | | | | | | |
Net investment income | | | 0.31 | (a) | | | 0.29 | (a) | | | 0.26 | (a) | | | 0.26 | (a) | | | 0.38 | |
Net realized and unrealized gain (loss)
on investments | | | 1.05 | | | | 0.42 | | | | 1.62 | | | | 0.08 | | | | (3.54 | ) |
| | | | | | | | | | | | | | | | | | | | |
Total from investment operations | | | 1.36 | | | | 0.71 | | | | 1.88 | | | | 0.34 | | | | (3.16 | ) |
| | | | | | | | | | | | | | | | | | | | |
Less Distributions: | | | | | | | | | | | | | | | | | | | | |
Distributions from and in excess of net
investment income | | | (0.30 | ) | | | (0.26 | ) | | | (0.23 | ) | | | (0.19 | ) | | | (0.32 | ) |
Return of capital | | | — | | | | — | | | | — | | | | — | | | | (0.01 | ) |
Distributions from net realized gain
on investments | | | (0.07 | ) | | | — | | | | — | | | | — | | | | (0.66 | ) |
| | | | | | | | | | | | | | | | | | | | |
Total distributions | | | (0.37 | ) | | | (0.26 | ) | | | (0.23 | ) | | | (0.19 | ) | | | (0.99 | ) |
| | | | | | | | | | | | | | | | | | | | |
Net increase (decrease) in net asset value . | | | 0.99 | | | | 0.45 | | | | 1.65 | | | | 0.15 | | | | (4.15 | ) |
| | | | | | | | | | | | | | | | | | | | |
Net Asset Value, End of Period | | $ | 11.67 | | | $ | 10.68 | | | $ | 10.23 | | | $ | 8.58 | | | $ | 8.43 | |
| | | | | | | | | | | | | | | | | | | | |
Total Return (b) | | | 12.96 | % | | | 6.94 | % | | | 22.20 | % | | | 4.33 | % | | | (26.82 | )% |
| | | | | |
Ratios/Supplemental Data: | | | | | | | | | | | | | | | | | | | | |
Net Assets, End of Period (in 000’s) | | $ | 338,166 | | | $ | 301,290 | | | $ | 135,544 | | | $ | 81,842 | | | $ | 51,504 | |
Ratios of expenses to average net assets: | | | | | | | | | | | | | | | | | | | | |
Before reimbursement and/or waiver of
expenses by Adviser | | | 1.12 | % | | | 1.12 | % | | | 1.14 | % | | | 1.21 | % | | | 1.35 | %(c) |
After reimbursement and/or waiver of
expenses by Adviser | | | 1.12 | % | | | 1.12 | % | | | 1.14 | % | | | 1.21 | % | | | 1.30 | %(c) |
Ratios of net investment income to average net assets: | | | | | | | | | | | | | | | | | | | | |
Before reimbursement and/or waiver of
expenses by Adviser | | | 2.74 | % | | | 2.70 | % | | | 2.69 | % | | | 3.36 | % | | | 3.81 | % |
After reimbursement and/or waiver of
expenses by Adviser | | | 2.74 | % | | | 2.70 | % | | | 2.69 | % | | | 3.36 | % | | | 3.86 | % |
Portfolio Turnover | | | 28.17 | % | | | 24.65 | % | | | 29.92 | % | | | 47.34 | % | | | 48.95 | % |
| | (a) | The selected per share data was calculated using the weighted average shares outstanding method for the period. |
| | (b) | The total return is calculated using the Net Asset Values used for trading at the close of business at period end. |
| | (c) | Ratios of expenses to average net assets include interest expense of less than 0.005% for the year ended October 31, 2008, which is not included in the contractual expense limitation. The interest expense is from utilizing the line of credit as discussed in Note H to Financial Statements. |
See accompanying Notes to Financial Statements.
| | |
| |
| ASTON/River Road Dividend All Cap Value Fund – Class I | | October 31, 2012 |
| |
| Financial Highlights | | |
| | | | | | | | | | | | | | | | | | | | |
| | | Year
Ended
10/31/12 | | | Year
Ended
10/31/11 | | | Year
Ended
10/31/10 | | | Year
Ended
10/31/09 | | | Year
Ended
10/31/08 | |
Net Asset Value, Beginning of Period | | $ | 10.67 | | | $ | 10.22 | | | $ | 8.57 | | | $ | 8.42 | | | $ | 12.57 | |
| | | | | | | | | | | | | | | | | | | | |
Income from Investment Operations: | | | | | | | | | | | | | | | | | | | | |
Net investment income | | | 0.34 | (a) | | | 0.32 | (a) | | | 0.28 | (a) | | | 0.29 | (a) | | | 0.41 | |
Net realized and unrealized gain (loss)
on investments | | | 1.05 | | | | 0.42 | | | | 1.63 | | | | 0.07 | | | | (3.55 | ) |
| | | | | | | | | | | | | | | | | | | | |
Total from investment operations | | | 1.39 | | | | 0.74 | | | | 1.91 | | | | 0.36 | | | | (3.14 | ) |
| | | | | | | | | | | | | | | | | | | | |
Less Distributions: | | | | | | | | | | | | | | | | | | | | |
Distributions from and in excess of net
investment income | | | (0.33 | ) | | | (0.29 | ) | | | (0.26 | ) | | | (0.21 | ) | | | (0.34 | ) |
Return of capital | | | — | | | | — | | | | — | | | | — | | | | (0.01 | ) |
Distributions from net realized gain
on investments | | | (0.07 | ) | | | — | | | | — | | | | — | | | | (0.66 | ) |
| | | | | | | | | | | | | | | | | | | | |
Total distributions | | | (0.40 | ) | | | (0.29 | ) | | | (0.26 | ) | | | (0.21 | ) | | | (1.01 | ) |
| | | | | | | | | | | | | | | | | | | | |
Net increase (decrease) in net asset value . | | | 0.99 | | | | 0.45 | | | | 1.65 | | | | 0.15 | | | | (4.15 | ) |
| | | | | | | | | | | | | | | | | | | | |
Net Asset Value, End of Period | | $ | 11.66 | | | $ | 10.67 | | | $ | 10.22 | | | $ | 8.57 | | | $ | 8.42 | |
| | | | | | | | | | | | | | | | | | | | |
Total Return (b) | | | 13.25 | % | | | 7.21 | % | | | 22.53 | % | | | 4.59 | % | | | (26.66 | )% |
| | | | | |
Ratios/Supplemental Data: | | | | | | | | | | | | | | | | | | | | |
Net Assets, End of Period (in 000’s) | | $ | 586,043 | | | $ | 318,863 | | | $ | 137,629 | | | $ | 77,185 | | | $ | 144 | |
Ratios of expenses to average net assets: | | | | | | | | | | | | | | | | | | | | |
Before reimbursement and/or waiver of
expenses by Adviser | | | 0.87 | % | | | 0.87 | % | | | 0.89 | % | | | 0.96 | % | | | 1.10 | %(c) |
After reimbursement and/or waiver of
expenses by Adviser | | | 0.87 | % | | | 0.87 | % | | | 0.89 | % | | | 0.96 | % | | | 1.05 | %(c) |
Ratios of net investment income to average net assets: | | | | | | | | | | | | | | | | | | | | |
Before reimbursement and/or waiver of
expenses by Adviser | | | 2.99 | % | | | 2.95 | % | | | 2.94 | % | | | 3.61 | % | | | 4.06 | % |
After reimbursement and/or waiver of
expenses by Adviser | | | 2.99 | % | | | 2.95 | % | | | 2.94 | % | | | 3.61 | % | | | 4.11 | % |
Portfolio Turnover | | | 28.17 | % | | | 24.65 | % | | | 29.92 | % | | | 47.34 | % | | | 48.95 | % |
| | (a) | The selected per share data was calculated using the weighted average shares outstanding method for the period. |
| | (b) | The total return is calculated using the Net Asset Values used for trading at the close of business at period end. |
| | (c) | Ratios of expenses to average net assets include interest expense of less than 0.005% for the year ended October 31, 2008, which is not included in the contractual expense limitation. The interest expense is from utilizing the line of credit as discussed in Note H to Financial Statements. |
See accompanying Notes to Financial Statements.
| | |
| |
| ASTON/River Road Dividend All Cap Value Fund II – Class N | | October 31, 2012 |
| |
| Financial Highlights | | |
| | | | |
| | | Period
Ended
10/31/12(a) | |
Net Asset Value, Beginning of Period | | $ | 10.00 | |
| | | | |
Income from Investment Operations: | | | | |
Net investment income | | | 0.09 | (b) |
Net realized and unrealized gain on investments | | | 0.41 | |
| | | | |
Total from investment operations | | | 0.50 | |
| | | | |
Less Distributions: | | | | |
Distributions from and in excess of net investment income | | | (0.06 | ) |
| | | | |
Total distributions | | | (0.06 | ) |
| | | | |
Net increase in net asset value | | | 0.44 | |
| | | | |
Net Asset Value, End of Period | | $ | 10.44 | |
| | | | |
Total Return (c) | | | 5.09 | %(d) |
| |
Ratios/Supplemental Data: | | | | |
Net Assets, End of Period (in 000’s) | | $ | 1,049 | |
Ratios of expenses to average net assets: | | | | |
Before reimbursement and/or waiver of expenses by Adviser | | | 4.99 | %(e) |
After reimbursement and/or waiver of expenses by Adviser | | | 1.30 | %(e) |
Ratios of net investment income (loss) to average net assets: | | | | |
Before reimbursement and/or waiver of expenses by Adviser | | | (1.24 | )%(e) |
After reimbursement and/or waiver of expenses by Adviser | | | 2.45 | %(e) |
Portfolio Turnover | | | 5.58 | %(d)(f) |
| | (a) | River Road Dividend All Cap Value Fund II began issuing Class N shares on June 27, 2012. |
| | (b) | The selected per share data was calculated using the weighted average shares outstanding method for the period. |
| | (c) | The total return is calculated using the Net Asset Values used for trading at the close of business at period end. |
| | (f) | Portfolio turnover excludes securities received from processing a subscription-in-kind. |
See accompanying Notes to Financial Statements.
| | |
| |
| ASTON/River Road Dividend All Cap Value Fund II – Class I | | October 31, 2012 |
| |
| Financial Highlights | | |
| | | | |
| | | Period
Ended
10/31/12(a) | |
Net Asset Value, Beginning of Period | | $ | 10.00 | |
| | | | |
Income from Investment Operations: | | | | |
Net investment income | | | 0.10 | (b) |
Net realized and unrealized gain on investments | | | 0.42 | |
| | | | |
Total from investment operations | | | 0.52 | |
| | | | |
Less Distributions: | | | | |
Distributions from and in excess of net investment income | | | (0.07 | ) |
| | | | |
Total distributions | | | (0.07 | ) |
| | | | |
Net increase in net asset value | | | 0.45 | |
| | | | |
Net Asset Value, End of Period | | $ | 10.45 | |
| | | | |
Total Return (c) | | | 5.17 | %(d) |
| |
Ratios/Supplemental Data: | | | | |
Net Assets, End of Period (in 000’s) | | $ | 9,370 | |
Ratios of expenses to average net assets: | | | | |
Before reimbursement and/or waiver of expenses by Adviser | | | 4.74 | %(e) |
After reimbursement and/or waiver of expenses by Adviser | | | 1.05 | %(e) |
Ratios of net investment income (loss) to average net assets: | | | | |
Before reimbursement and/or waiver of expenses by Adviser | | | (0.99 | )%(e) |
After reimbursement and/or waiver of expenses by Adviser | | | 2.70 | %(e) |
Portfolio Turnover | | | 5.58 | %(d)(f) |
| | (a) | River Road Dividend All Cap Value Fund II began issuing Class I shares on June 27, 2012. |
| | (b) | The selected per share data was calculated using the weighted average shares outstanding method for the period. |
| | (c) | The total return is calculated using the Net Asset Values used for trading at the close of business at period end. |
| | (f) | Portfolio turnover excludes securities received from processing a subscription-in-kind. |
See accompanying Notes to Financial Statements.
| | |
| |
| ASTON/Fairpointe Mid Cap Fund – Class N | | October 31, 2012 |
| |
| Financial Highlights | | |
| | | | | | | | | | | | | | | | | | | | |
| | | Year Ended
10/31/12 | | | Year
Ended
10/31/11 | | | Year
Ended
10/31/10 | | | Year
Ended
10/31/09 | | | Year
Ended
10/31/08 | |
Net Asset Value, Beginning of Period | | $ | 29.76 | | | $ | 29.04 | | | $ | 22.73 | | | $ | 17.25 | | | $ | 32.32 | |
| | | | | | | | | | | | | | | | | | | | |
Income from Investment Operations: | | | | | | | | | | | | | | | | | | | | |
Net investment income (loss) | | | 0.16 | | | | 0.06 | (a) | | | 0.01 | | | | 0.09 | | | | 0.05 | |
Net realized and unrealized gain (loss)
on investments | | | 3.13 | | | | 0.82 | | | | 6.35 | | | | 5.82 | | | | (12.93 | ) |
| | | | | | | | | | | | | | | | | | | | |
Total from investment operations | | | 3.29 | | | | 0.88 | | | | 6.36 | | | | 5.91 | | | | (12.88 | ) |
| | | | | | | | | | | | | | | | | | | | |
Less Distributions: | | | | | | | | | | | | | | | | | | | | |
Distributions from and in excess of net
investment income | | | (0.05 | ) | | | (0.08 | ) | | | (0.05 | ) | | | (0.14 | ) | | | — | |
Distributions from net realized gain
on investments | | | (0.21 | ) | | | (0.08 | ) | | | — | | | | (0.29 | ) | | | (2.19 | ) |
| | | | | | | | | | | | | | | | | | | | |
Total distributions | | | (0.26 | ) | | | (0.16 | ) | | | (0.05 | ) | | | (0.43 | ) | | | (2.19 | ) |
| | | | | | | | | | | | | | | | | | | | |
Net increase (decrease) in net asset value . | | | 3.03 | | | | 0.72 | | | | 6.31 | | | | 5.48 | | | | (15.07 | ) |
| | | | | | | | | | | | | | | | | | | | |
Net Asset Value, End of Period | | $ | 32.79 | | | $ | 29.76 | | | $ | 29.04 | | | $ | 22.73 | | | $ | 17.25 | |
| | | | | | | | | | | | | | | | | | | | |
Total Return (b) | | | 11.15 | % | | | 2.98 | % | | | 28.01 | % | | | 35.60 | % | | | (42.50 | )% |
| | | | | |
Ratios/Supplemental Data: | | | | | | | | | | | | | | | | | | | | |
Net Assets, End of Period (in 000’s) | | $ | 1,561,510 | | | $ | 1,502,266 | | | $ | 1,469,354 | | | $ | 842,233 | | | $ | 508,886 | |
Ratios of expenses to average net assets: | | | | | | | | | | | | | | | | | | | | |
Before reimbursement and/or waiver of
expenses by Adviser | | | 1.11 | %(c) | | | 1.14 | %(c) | | | 1.14 | %(c) | | | 1.20 | %(c) | | | 1.16 | %(c) |
After reimbursement and/or waiver of
expenses by Adviser | | | 1.11 | %(c) | | | 1.14 | %(c) | | | 1.14 | %(c) | | | 1.20 | %(c) | | | 1.16 | %(c) |
Ratios of net investment income (loss)
to average net assets: | | | | | | | | | | | | | | | | | | | | |
Before reimbursement and/or waiver of
expenses by Adviser | | | 0.50 | % | | | 0.21 | % | | | — | %(d) | | | 0.46 | % | | | 0.18 | % |
After reimbursement and/or waiver of
expenses by Adviser | | | 0.50 | % | | | 0.21 | % | | | — | %(d) | | | 0.46 | % | | | 0.18 | % |
Portfolio Turnover | | | 28.06 | %(e) | | | 11.20 | % | | | 13.82 | % | | | 17.72 | % | | | 22.58 | % |
| | (a) | The selected per share data was calculated using the weighted average shares outstanding method for the period. |
| | (b) | The total return is calculated using the Net Asset Values used for trading at the close of business at period end. |
| | (c) | Ratios of expenses to average net assets include interest expenses of less than 0.005% for each of the years ended October 31, 2012, October 31, 2011, October 31, 2010, October 31, 2009 and October 31, 2008, which are not included in the contractual expense limitation. The interest expenses are from utilizing the line of credit as discussed in Note H to Financial Statements. |
| | (d) | Represents less than 0.005%. |
| | (e) | Portfolio turnover rate excludes securities delivered from processing a redemption-in-kind. |
See accompanying Notes to Financial Statements.
| | |
| |
| ASTON/Fairpointe Mid Cap Fund – Class I | | October 31, 2012 |
| |
| Financial Highlights | | |
| | | | | | | | | | | | | | | | | | | | |
| | | Year Ended
10/31/12 | | | Year
Ended
10/31/11 | | | Year
Ended
10/31/10 | | | Year
Ended
10/31/09 | | | Year
Ended
10/31/08 | |
Net Asset Value, Beginning of Period | | $ | 30.20 | | | $ | 29.41 | | | $ | 23.00 | | | $ | 17.47 | | | $ | 32.64 | |
| | | | | | | | | | | | | | | | | | | | |
Income from Investment Operations: | | | | | | | | | | | | | | | | | | | | |
Net investment income | | | 0.24 | | | | 0.14 | (a) | | | 0.07 | | | | 0.13 | | | | 0.11 | |
Net realized and unrealized gain (loss)
on investments | | | 3.18 | | | | 0.82 | | | | 6.43 | | | | 5.89 | | | | (13.09 | ) |
| | | | | | | | | | | | | | | | | | | | |
Total from investment operations | | | 3.42 | | | | 0.96 | | | | 6.50 | | | | 6.02 | | | | (12.98 | ) |
| | | | | | | | | | | | | | | | | | | | |
Less Distributions: | | | | | | | | | | | | | | | | | | | | |
Distributions from and in excess of net
investment income | | | (0.13 | ) | | | (0.09 | ) | | | (0.09 | ) | | | (0.20 | ) | | | — | |
Distributions from net realized gain
on investment | | | (0.21 | ) | | | (0.08 | ) | | | — | | | | (0.29 | ) | | | (2.19 | ) |
| | | | | | | | | | | | | | | | | | | | |
Total distributions | | | (0.34 | ) | | | (0.17 | ) | | | (0.09 | ) | | | (0.49 | ) | | | (2.19 | ) |
| | | | | | | | | | | | | | | | | | | | |
Net increase (decrease) in net asset value | | | 3.08 | | | | 0.79 | | | | 6.41 | | | | 5.53 | | | | (15.17 | ) |
| | | | | | | | | | | | | | | | | | | | |
Net Asset Value, End of Period | | $ | 33.28 | | | $ | 30.20 | | | $ | 29.41 | | | $ | 23.00 | | | $ | 17.47 | |
| | | | | | | | | | | | | | | | | | | | |
Total Return (b) | | | 11.46 | % | | | 3.22 | % | | | 28.31 | % | | | 35.97 | % | | | (42.39 | )% |
| | | | | |
Ratios/Supplemental Data: | | | | | | | | | | | | | | | | | | | | |
Net Assets, End of Period (in 000’s) | | $ | 1,464,222 | | | $ | 1,339,223 | | | $ | 499,651 | | | $ | 150,953 | | | $ | 93,176 | |
Ratios of expenses to average net assets: | | | | | | | | | | | | | | | | | | | | |
Before reimbursement and/or waiver of
expenses by Adviser | | | 0.86 | %(c) | | | 0.89 | %(c) | | | 0.89 | %(c) | | | 0.95 | %(c) | | | 0.91 | %(c) |
After reimbursement and/or waiver of
expenses by Adviser | | | 0.86 | %(c) | | | 0.89 | %(c) | | | 0.89 | %(c) | | | 0.95 | %(c) | | | 0.91 | %(c) |
Ratios of net investment income to average
net assets: | | | | | | | | | | | | | | | | | | | | |
Before reimbursement and/or waiver of
expenses by Adviser | | | 0.75 | % | | | 0.46 | % | | | 0.25 | % | | | 0.71 | % | | | 0.43 | % |
After reimbursement and/or waiver of
expenses by Adviser | | | 0.75 | % | | | 0.46 | % | | | 0.25 | % | | | 0.71 | % | | | 0.43 | % |
Portfolio Turnover | | | 28.06 | %(d) | | | 11.20 | % | | | 13.82 | % | | | 17.72 | % | | | 22.58 | % |
| | (a) | The selected per share data was calculated using the weighted average shares outstanding method for the period. |
| | (b) | The total return is calculated using the Net Asset Values used for trading at the close of business at period end. |
| | (c) | Ratios of expenses to average net assets include interest expenses of less than 0.005% for each of the years ended October 31, 2012, October 31, 2011, October 31, 2010, October 31, 2009 and October 31, 2008, which are not included in the contractual expense limitation. The interest expenses are from utilizing the line of credit as discussed in Note H to Financial Statements. |
| | (d) | Portfolio turnover rate excludes securities delivered from processing a redemption-in-kind. |
See accompanying Notes to Financial Statements.
| | |
| |
| ASTON/Montag & Caldwell Mid Cap Growth Fund – Class N | | October 31, 2012 |
| |
| Financial Highlights | | |
| | | | | | | | | | | | | | | | | | | | |
| | | Year
Ended
10/31/12 | | | Year
Ended
10/31/11 | | | Year
Ended
10/31/10 | | | Year
Ended
10/31/09 | | | Period
Ended
10/31/08(a) | |
Net Asset Value, Beginning of Period | | $ | 9.71 | | | $ | 8.51 | | | $ | 6.83 | | | $ | 5.85 | | | $ | 10.00 | |
| | | | | | | | | | | | | | | | | | | | |
Income from Investment Operations: | | | | | | | | | | | | | | | | | | | | |
Net investment loss | | | (0.07 | )(b) | | | (0.07 | ) | | | (0.04 | ) | | | (0.04 | ) | | | (0.05 | ) |
Net realized and unrealized gain (loss)
on investments | | | 0.72 | | | | 1.27 | | | | 1.74 | | | | 1.02 | | | | (4.10 | ) |
| | | | | | | | | | | | | | | | | | | | |
Total from investment operations | | | 0.65 | | | | 1.20 | | | | 1.70 | | | | 0.98 | | | | (4.15 | ) |
| | | | | | | | | | | | | | | | | | | | |
Less Distributions: | | | | | | | | | | | | | | | | | | | | |
Distributions from and in excess of net
investment income | | | — | | | | — | | | | (0.02 | ) | | | — | | | | — | |
| | | | | | | | | | | | | | | | | | | | |
Total distributions | | | — | | | | — | | | | (0.02 | ) | | | — | | | | — | |
| | | | | | | | | | | | | | | | | | | | |
Net increase (decrease) in net asset value | | | 0.65 | | | | 1.20 | | | | 1.68 | | | | 0.98 | | | | (4.15 | ) |
| | | | | | | | | | | | | | | | | | | | |
Net Asset Value, End of Period | | $ | 10.36 | | | $ | 9.71 | | | $ | 8.51 | | | $ | 6.83 | | | $ | 5.85 | |
| | | | | | | | | | | | | | | | | | | | |
Total Return (c) | | | 6.70 | % | | | 14.10 | % | | | 24.85 | % | | | 16.75 | % | | | (41.50 | )%(d) |
| | | | | |
Ratios/Supplemental Data: | | | | | | | | | | | | | | | | | | | | |
Net Assets, End of Period (in 000’s) | | $ | 7,369 | | | $ | 4,507 | | | $ | 3,399 | | | $ | 2,959 | | | $ | 1,815 | |
Ratios of expenses to average net assets: | | | | | | | | | | | | | | | | | | | | |
Before reimbursement and/or waiver of
expenses by Adviser | | | 2.50 | % | | | 3.07 | % | | | 3.55 | % | | | 5.02 | % | | | 5.80 | %(e) |
After reimbursement and/or waiver of
expenses by Adviser | | | 1.25 | %(f) | | | 1.39 | %(f) | | | 1.40 | % | | | 1.40 | % | | | 1.40 | %(e) |
Ratios of net investment loss to average net assets: | | | | | | | | | | | | | | | | | | | | |
Before reimbursement and/or waiver of
expenses by Adviser | | | (1.88 | )% | | | (2.39 | )% | | | (2.75 | )% | | | (4.13 | )% | | | (5.07 | )%(e) |
After reimbursement and/or waiver of
expenses by Adviser | | | (0.63 | )% | | | (0.71 | )% | | | (0.60 | )% | | | (0.51 | )% | | | (0.67 | )%(e) |
Portfolio Turnover | | | 36.60 | % | | | 29.31 | % | | | 31.49 | % | | | 54.37 | % | | | 63.66 | %(d) |
| | (a) | Montag & Caldwell Mid Cap Growth Fund began issuing Class N shares on November 1, 2007. |
| | (b) | The selected per share data was calculated using the weighted average shares outstanding method for the period. |
| | (c) | The total return is calculated using the Net Asset Values used for trading at the close of business at period end. |
| | (f) | For the period November 1, 2010 through September 29, 2011 the Adviser contractually waived management fees and/or reimbursed expenses so that the net expense ratio is no more than 1.40%, excluding interest, taxes, other investment-related costs (such as brokerage commissions), extraordinary expenses and acquired fund fees and expenses. Effective September 30, 2011, the Adviser implemented a voluntary expense limitation of 1.25%. Subsequently on February 29, 2012, the Adviser removed the voluntary expense limitation and replaced it with a contractual expense limitation of 1.25%. |
See accompanying Notes to Financial Statements.
| | |
| |
| ASTON/Veredus Small Cap Growth Fund – Class N (formerly the ASTON/Veredus Aggressive Growth Fund) | | October 31, 2012 |
| |
| Financial Highlights | | |
| | | | | | | | | | | | | | | | | | | | |
| | | Year
Ended
10/31/12 | | | Year
Ended
10/31/11 | | | Year
Ended
10/31/10 | | | Year
Ended
10/31/09 | | | Year
Ended
10/31/08 | |
Net Asset Value, Beginning of Period | | $ | 12.36 | | | $ | 11.80 | | | $ | 8.97 | | | $ | 8.38 | | | $ | 22.42 | |
| | | | | | | | | | | | | | | | | | | | |
Income from Investment Operations: | | | | | | | | | | | | | | | | | | | | |
Net investment loss | | | (0.12 | )(a) | | | (0.14 | )(a) | | | (0.14 | )(a) | | | (0.10 | ) | | | (0.17 | ) |
Net realized and unrealized gain (loss)
on investments | | | 0.79 | | | | 0.70 | | | | 2.97 | | | | 0.74 | | | | (8.31 | ) |
| | | | | | | | | | | | | | | | | | | | |
Total from investment operations | | | 0.67 | | | | 0.56 | | | | 2.83 | | | | 0.64 | | | | (8.48 | ) |
| | | | | | | | | | | | | | | | | | | | |
Less Distributions: | | | | | | | | | | | | | | | | | | | | |
Distributions from net realized gain
on investments | | | — | | | | — | | | | — | | | | (0.05 | ) | | | (5.56 | ) |
| | | | | | | | | | | | | | | | | | | | |
Total distributions | | | — | | | | — | | | | — | | | | (0.05 | ) | | | (5.56 | ) |
| | | | | | | | | | | | | | | | | | | | |
Net increase (decrease) in net asset value . | | | 0.67 | | | | 0.56 | | | | 2.83 | | | | 0.59 | | | | (14.04 | ) |
| | | | | | | | | | | | | | | | | | | | |
Net Asset Value, End of Period | | $ | 13.03 | | | $ | 12.36 | | | $ | 11.80 | | | $ | 8.97 | | | $ | 8.38 | |
| | | | | | | | | | | | | | | | | | | | |
Total Return (b) | | | 5.42 | % | | | 4.75 | % | | | 31.55 | % | | | 7.79 | % | | | (47.87 | )% |
| | | | | |
Ratios/Supplemental Data: | | | | | | | | | | | | | | | | | | | | |
Net Assets, End of Period (in 000’s) | | $ | 21,763 | | | $ | 26,300 | | | $ | 33,594 | | | $ | 32,140 | | | $ | 43,149 | |
Ratios of expenses to average net assets: | | | | | | | | | | | | | | | | | | | | |
Before reimbursement and/or waiver of
expenses by Adviser | | | 1.83 | % | | | 1.65 | %(c) | | | 1.63 | % | | | 1.82 | %(c) | | | 1.55 | %(c) |
After reimbursement and/or waiver of
expenses by Adviser | | | 1.49 | % | | | 1.49 | %(c) | | | 1.49 | % | | | 1.49 | %(c) | | | 1.49 | %(c) |
Ratios of net investment loss to average net assets: | | | | | | | | | | | | | | | | | | | | |
Before reimbursement and/or waiver of
expenses by Adviser | | | (1.32 | )% | | | (1.19 | )% | | | (1.40 | )% | | | (1.48 | )% | | | (1.21 | )% |
After reimbursement and/or waiver of
expenses by Adviser | | | (0.98 | )% | | | (1.03 | )% | | | (1.27 | )% | | | (1.15 | )% | | | (1.15 | )% |
Portfolio Turnover | | | 158.83 | %(d) | | | 197.43 | % | | | 187.83 | % | | | 264.98 | % | | | 166.19 | % |
| | (a) | The selected per share data was calculated using the weighted average shares outstanding method for the period. |
| | (b) | The total return is calculated using the Net Asset Values used for trading at the close of business at period end. |
| | (c) | Ratios of expenses to average net assets include interest expenses of less than 0.005% for each of the years ended October 31, 2011, October 31, 2009 and October 31, 2008, which are not included in the contractual expense limitation. The interest expenses are from utilizing the line of credit as discussed in Note H to Financial Statements. |
| | (d) | Portfolio turnover rate excludes securities delivered from processing a redemption-in-kind. |
See accompanying Notes to Financial Statements.
| | |
| |
| ASTON/Veredus Small Cap Growth Fund – Class I (formerly the ASTON/Veredus Aggressive Growth Fund) | | October 31, 2012 |
| |
| Financial Highlights | | |
| | | | | | | | | | | | | | | | | | | | |
| | | Year
Ended
10/31/12 | | | Year
Ended
10/31/11 | | | Year
Ended
10/31/10 | | | Year
Ended
10/31/09 | | | Year
Ended
10/31/08 | |
| | | | | |
| | | | | |
| | | | | |
Net Asset Value, Beginning of Period | | $ | 12.80 | | | $ | 12.19 | | | $ | 9.25 | | | $ | 8.61 | | | $ | 22.83 | |
| | | | | | | | | | | | | | | | | | | | |
Income from Investment Operations: | | | | | | | | | | | | | | | | | | | | |
Net investment loss | | | (0.09 | )(a) | | | (0.11 | )(a) | | | (0.11 | )(a) | | | (0.08 | ) | | | (0.21 | ) |
Net realized and unrealized gain (loss)
on investments | | | 0.82 | | | | 0.72 | | | | 3.05 | | | | 0.77 | | | | (8.45 | ) |
| | | | | | | | | | | | | | | | | | | | |
Total from investment operations | | | 0.73 | | | | 0.61 | | | | 2.94 | | | | 0.69 | | | | (8.66 | ) |
| | | | | | | | | | | | | | | | | | | | |
Less Distributions: | | | | | | | | | | | | | | | | | | | | |
Distributions from net realized gain
on investments | | | — | | | | — | | | | — | | | | (0.05 | ) | | | (5.56 | ) |
| | | | | | | | | | | | | | | | | | | | |
Total distributions | | | — | | | | — | | | | — | | | | (0.05 | ) | | | (5.56 | ) |
| | | | | | | | | | | | | | | | | | | | |
Net increase (decrease) in net asset value . | | | 0.73 | | | | 0.61 | | | | 2.94 | | | | 0.64 | | | | (14.22 | ) |
| | | | | | | | | | | | | | | | | | | | |
Net Asset Value, End of Period | | $ | 13.53 | | | $ | 12.80 | | | $ | 12.19 | | | $ | 9.25 | | | $ | 8.61 | |
| | | | | | | | | | | | | | | | | | | | |
Total Return (b) | | | 5.62 | % | | | 5.09 | % | | | 31.78 | % | | | 8.16 | % | | | (47.77 | )% |
| | | | | |
Ratios/Supplemental Data: | | | | | | | | | | | | | | | | | | | | |
Net Assets, End of Period (in 000’s) | | $ | 2,400 | | | $ | 16,891 | | | $ | 16,190 | | | $ | 13,356 | | | $ | 16,719 | |
Ratios of expenses to average net assets: | | | | | | | | | | | | | | | | | | | | |
Before reimbursement and/or waiver of
expenses by Adviser | | | 1.58 | % | | | 1.40 | %(c) | | | 1.38 | % | | | 1.57 | %(c) | | | 1.30 | %(c) |
After reimbursement and/or waiver of
expenses by Adviser | | | 1.24 | % | | | 1.24 | %(c) | | | 1.24 | % | | | 1.24 | %(c) | | | 1.24 | %(c) |
Ratios of net investment loss to average net assets: | | | | | | | | | | | | | | | | | | | | |
Before reimbursement and/or waiver of
expenses by Adviser | | | (1.07 | )% | | | (0.94 | )% | | | (1.15 | )% | | | (1.23 | )% | | | (0.96 | )% |
After reimbursement and/or waiver of
expenses by Adviser | | | (0.73 | )% | | | (0.78 | )% | | | (1.02 | )% | | | (0.90 | )% | | | (0.90 | )% |
Portfolio Turnover | | | 158.83 | %(d) | | | 197.43 | % | | | 187.83 | % | | | 264.98 | % | | | 166.19 | % |
| | (a) | The selected per share data was calculated using the weighted average shares outstanding method for the period. |
| | (b) | The total return is calculated using the Net Asset Values used for trading at the close of business at period end. |
| | (c) | Ratios of expenses to average net assets include interest expenses of less than 0.005% for each of the years ended October 31, 2011, October 31, 2009 and October 31, 2008, which are not included in the contractual expense limitation. The interest expenses are from utilizing the line of credit as discussed in Note H to Financial Statements. |
| | (d) | Portfolio turnover rate excludes securities delivered from processing a redemption-in-kind. |
See accompanying Notes to Financial Statements.
| | |
| |
| ASTON Small Cap Growth Fund – Class N (formerly the ASTON/Crosswind Small Cap Growth Fund) | | October 31, 2012 |
| |
| Financial Highlights | | |
| | | | | | | | |
| | | Year
Ended
10/31/12 | | | Period
Ended
10/31/11(a) | |
| | |
| | |
| | |
Net Asset Value, Beginning of Period | | $ | 9.95 | | | $ | 10.00 | |
| | | | | | | | |
Income from Investment Operations: | | | | | | | | |
Net investment loss | | | (0.12 | )(b) | | | (0.04 | ) |
Net realized and unrealized gain (loss) on investments | | | 1.59 | | | | (0.01 | ) |
| | | | | | | | |
Total from investment operations | | | 1.47 | | | | (0.05 | ) |
| | | | | | | | |
Net increase (decrease) in net asset value | | | 1.47 | | | | (0.05 | ) |
| | | | | | | | |
Net Asset Value, End of Period | | $ | 11.42 | | | $ | 9.95 | |
| | | | | | | | |
Total Return (c) | | | 14.77 | % | | | (0.50 | )%(d) |
| | |
Ratios/Supplemental Data: | | | | | | | | |
Net Assets, End of Period (in 000’s) | | $ | 5,659 | | | $ | 5,411 | |
Ratios of expenses to average net assets: | | | | | | | | |
Before reimbursement and/or waiver of expenses by Adviser | | | 2.86 | % | | | 8.27 | %(e) |
After reimbursement and/or waiver of expenses by Adviser | | | 1.35 | % | | | 1.35 | %(e) |
Ratios of net investment loss to average net assets: | | | | | | | | |
Before reimbursement and/or waiver of expenses by Adviser | | | (2.68 | )% | | | (8.14 | )%(e) |
After reimbursement and/or waiver of expenses by Adviser | | | (1.17 | )% | | | (1.21 | )%(e) |
Portfolio Turnover | | | 168.05 | %(f) | | | 205.85 | %(d) |
| | (a) | Small Cap Growth Fund began issuing Class N shares on November 2, 2010. |
| | (b) | The selected per share data was calculated using the weighted average shares outstanding method for the period. |
| | (c) | The total return is calculated using the Net Asset Values used for trading at the close of business at period end. |
| | (f) | Portfolio turnover rate excludes securities delivered from processing a redemption-in-kind. |
See accompanying Notes to Financial Statements.
| | |
| |
| ASTON Small Cap Growth Fund – Class I (formerly the ASTON/Crosswind Small Cap Growth Fund) | | October 31, 2012 |
| |
| Financial Highlights | | |
| | | | | | | | |
| | | Year
Ended
10/31/12 | | | Period
Ended
10/31/11(a) | |
| | |
| | |
| | |
Net Asset Value, Beginning of Period | | $ | 9.97 | | | $ | 12.40 | |
| | | | | | | | |
Income from Investment Operations: | | | | | | | | |
Net investment loss | | | (0.10 | )(b) | | | (0.04 | ) |
Net realized and unrealized gain (loss) on investments | | | 1.59 | | | | (2.39 | ) |
| | | | | | | | |
Total from investment operations | | | 1.49 | | | | (2.43 | ) |
| | | | | | | | |
Net increase (decrease) in net asset value | | | 1.49 | | | | (2.43 | ) |
| | | | | | | | |
Net Asset Value, End of Period | | $ | 11.46 | | | $ | 9.97 | |
| | | | | | | | |
Total Return (c) | | | 14.95 | % | | | (19.60 | )%(d) |
| | |
Ratios/Supplemental Data: | | | | | | | | |
Net Assets, End of Period (in 000’s) | | $ | 755 | | | $ | 2,551 | |
Ratios of expenses to average net assets: | | | | | | | | |
Before reimbursement and/or waiver of expenses by Adviser | | | 2.61 | % | | | 6.25 | %(e) |
After reimbursement and/or waiver of expenses by Adviser | | | 1.10 | % | | | 1.10 | %(e) |
Ratios of net investment loss to average net assets: | | | | | | | | |
Before reimbursement and/or waiver of expenses by Adviser | | | (2.43 | )% | | | (6.11 | )%(e) |
After reimbursement and/or waiver of expenses by Adviser | | | (0.92 | )% | | | (0.96 | )%(e) |
Portfolio Turnover | | | 168.05 | %(f) | | | 205.85 | %(d) |
| | (a) | Small Cap Growth Fund began issuing Class I shares on May 31, 2011. |
| | (b) | The selected per share data was calculated using the weighted average shares outstanding method for the period. |
| | (c) | The total return is calculated using the Net Asset Values used for trading at the close of business at period end. |
| | (f) | Portfolio turnover rate excludes securities delivered from processing a redemption-in-kind. |
See accompanying Notes to Financial Statements.
| | |
| |
| ASTON/Silvercrest Small Cap Fund – Class N | | October 31, 2012 |
| |
| Financial Highlights | | |
| | | | |
| | | Period
Ended
10/31/12(a) | |
| |
| |
| |
Net Asset Value, Beginning of Period | | $ | 10.00 | |
| | | | |
Income from Investment Operations: | | | | |
Net investment income | | | 0.01 | |
Net realized and unrealized gain on investments | | | 0.89 | |
| | | | |
Total from investment operations | | | 0.90 | |
| | | | |
Net increase in net asset value | | | 0.90 | |
| | | | |
Net Asset Value, End of Period | | $ | 10.90 | |
| | | | |
Total Return (b) | | | 9.00 | %(c) |
| |
Ratios/Supplemental Data: | | | | |
Net Assets, End of Period (in 000’s) | | $ | 750 | |
Ratios of expenses to average net assets: | | | | |
Before reimbursement and/or waiver of expenses by Adviser | | | 5.10 | %(c) |
After reimbursement and/or waiver of expenses by Adviser | | | 1.40 | %(d) |
Ratios of net investment income (loss) to average net assets: | | | | |
Before reimbursement and/or waiver of expenses by Adviser | | | (3.51 | )%(d) |
After reimbursement and/or waiver of expenses by Adviser | | | 0.19 | %(d) |
Portfolio Turnover | | | 26.22 | %(c)(e) |
| | (a) | Silvercrest Small Cap Fund began issuing Class N shares on December 23, 2011. |
| | (b) | The total return is calculated using the Net Asset Values used for trading at the close of business at period end. |
| | (e) | Portfolio turnover rate excludes securities delivered from processing a redemption-in-kind. |
See accompanying Notes to Financial Statements.
| | |
| |
| ASTON/Silvercrest Small Cap Fund – Class I | | October 31, 2012 |
| |
| Financial Highlights | | |
| | | | |
| | | Period
Ended
10/31/12(a) | |
| |
| |
| |
Net Asset Value, Beginning of Period | | $ | 10.00 | |
| | | | |
Income from Investment Operations: | | | | |
Net investment income | | | 0.03 | |
Net realized and unrealized gain on investments | | | 0.90 | |
| | | | |
Total from investment operations | | | 0.93 | |
| | | | |
Net increase in net asset value | | | 0.93 | |
| | | | |
Net Asset Value, End of Period | | $ | 10.93 | |
| | | | |
Total Return (b) | | | 9.30 | %(c) |
| |
Ratios/Supplemental Data: | | | | |
Net Assets, End of Period (in 000’s) | | $ | 4,962 | |
Ratios of expenses to average net assets: | | | | |
Before reimbursement and/or waiver of expenses by Adviser | | | 4.85 | %(d) |
After reimbursement and/or waiver of expenses by Adviser | | | 1.15 | %(d) |
Ratios of net investment income (loss) to average net assets: | | | | |
Before reimbursement and/or waiver of expenses by Adviser | | | (3.26 | )%(d) |
After reimbursement and/or waiver of expenses by Adviser | | | 0.44 | %(d) |
Portfolio Turnover | | | 26.22 | %(c)(e) |
| | (a) | Silvercrest Small Cap Fund began issuing Class I shares on December 23, 2011. |
| | (b) | The total return is calculated using the Net Asset Values used for trading at the close of business at period end. |
| | (e) | Portfolio turnover rate excludes securities delivered from processing a redemption-in-kind. |
See accompanying Notes to Financial Statements.
| | |
| |
| ASTON/TAMRO Small Cap Fund – Class N | | October 31, 2012 |
| |
| Financial Highlights | | |
| | | | | | | | | | | | | | | | | | | | |
| | | Year
Ended
10/31/12 | | | Year
Ended
10/31/11 | | | Year
Ended
10/31/10 | | | Year
Ended
10/31/09 | | | Year
Ended
10/31/08 | |
Net Asset Value, Beginning of Period | | $ | 20.57 | | | $ | 19.42 | | | $ | 14.67 | | | $ | 13.64 | | | $ | 20.99 | |
| | | | | | | | | | | | | | | | | | | | |
Income from Investment Operations: | | | | | | | | | | | | | | | | | | | | |
Net investment income (loss) | | | (0.12 | )(a) | | | (0.15 | )(a) | | | (0.08 | )(a) | | | (0.05 | )(a) | | | 0.05 | |
Net realized and unrealized gain (loss)
on investments | | | 2.09 | | | | 1.75 | | | | 4.83 | | | | 1.08 | | | | (6.43 | ) |
| | | | | | | | | | | | | | | | | | | | |
Total from investment operations | | | 1.97 | | | | 1.60 | | | | 4.75 | | | | 1.03 | | | | (6.38 | ) |
| | | | | | | | | | | | | | | | | | | | |
Less Distributions: | | | | | | | | | | | | | | | | | | | | |
Distributions from net realized gain
on investments | | | (2.02 | ) | | | (0.45 | ) | | | — | | | | — | | | | (0.97 | ) |
| | | | | | | | | | | | | | | | | | | | |
Total distributions | | | (2.02 | ) | | | (0.45 | ) | | | — | | | | — | | | | (0.97 | ) |
| | | | | | | | | | | | | | | | | | | | |
Net increase (decrease) in net asset value . | | | (0.05 | ) | | | 1.15 | | | | 4.75 | | | | 1.03 | | | | (7.35 | ) |
| | | | | | | | | | | | | | | | | | | | |
Net Asset Value, End of Period | | $ | 20.52 | | | $ | 20.57 | | | $ | 19.42 | | | $ | 14.67 | | | $ | 13.64 | |
| | | | | | | | | | | | | | | | | | | | |
Total Return (b) | | | 10.70 | % | | | 8.16 | % | | | 32.29 | % | | | 7.63 | % | | | (31.58 | )% |
| | | | | |
Ratios/Supplemental Data: | | | | | | | | | | | | | | | | | | | | |
Net Assets, End of Period (in 000’s) | | $ | 389,125 | | | $ | 375,969 | | | $ | 335,809 | | | $ | 241,524 | | | $ | 159,965 | |
Ratios of expenses to average net assets: | | | | | | | | | | | | | | | | | | | | |
Before reimbursement and/or waiver of
expenses by Adviser | | | 1.28 | %(c) | | | 1.29 | % | | | 1.34 | % | | | 1.37 | % | | | 1.32 | % |
After reimbursement and/or waiver of
expenses by Adviser | | | 1.28 | %(c) | | | 1.29 | % | | | 1.34 | % | | | 1.36 | %(d) | | | 1.30 | % |
Ratios of net investment income (loss)
to average net assets: | | | | | | | | | | | | | | | | | | | | |
Before reimbursement and/or waiver of
expenses by Adviser | | | (0.59 | )% | | | (0.69 | )% | | | (0.49 | )% | | | (0.41 | )% | | | 0.29 | % |
After reimbursement and/or waiver of
expenses by Adviser | | | (0.59 | )% | | | (0.69 | )% | | | (0.49 | )% | | | (0.40 | )% | | | 0.31 | % |
Portfolio Turnover | | | 48.22 | %(e) | | | 47.25 | % | | | 62.13 | % | | | 89.92 | % | | | 66.65 | % |
| | (a) | The selected per share data was calculated using the weighted average shares outstanding method for the period. |
| | (b) | The total return is calculated using the Net Asset Values used for trading at the close of business at period end. |
| | (c) | Ratios of expenses to average net assets include interest expenses of less than 0.005% for the year ended October 31, 2012, which is not included in the contractual expense limitation. The interest expenses are from utilizing the line of credit as discussed in Note H to Financial Statements. |
| | (d) | The Adviser removed the contractual expense limitation of 1.30%, excluding interest, taxes, other investment-related costs (such as brokerage commissions), extraordinary expenses and acquired fund fees and expenses, effective March 1, 2009. |
| | (e) | Portfolio turnover rate excludes securities delivered from processing redemptions-in-kind. |
See accompanying Notes to Financial Statements.
| | |
| |
| ASTON/TAMRO Small Cap Fund – Class I | | October 31, 2012 |
| |
| Financial Highlights | | |
| | | | | | | | | | | | | | | | | | | | |
| | | Year
Ended
10/31/12 | | | Year
Ended
10/31/11 | | | Year
Ended
10/31/10 | | | Year
Ended
10/31/09 | | | Year
Ended
10/31/08 | |
| | | | | | | | | | | | | | | | | | | | |
Net Asset Value, Beginning of Period | | $ | 20.91 | | | $ | 19.69 | | | $ | 14.87 | | | $ | 13.79 | | | $ | 21.16 | |
| | | | | | | | | | | | | | | | | | | | |
Income from Investment Operations: | | | | | | | | | | | | | | | | | | | | |
Net investment income (loss) | | | (0.07 | )(a) | | | (0.09 | )(a) | | | (0.04 | )(a) | | | (0.02 | )(a) | | | 0.02 | |
Net realized and unrealized gain (loss)
on investments | | | 2.14 | | | | 1.76 | | | | 4.87 | | | | 1.12 | | | | (6.42 | ) |
| | | | | | | | | | | | | | | | | | | | |
Total from investment operations | | | 2.07 | | | | 1.67 | | | | 4.83 | | | | 1.10 | | | | (6.40 | ) |
| | | | | | | | | | | | | | | | | | | | |
Less Distributions: | | | | | | | | | | | | | | | | | | | | |
Distributions from and in excess of net
investment income | | | — | | | | — | | | | (0.01 | ) | | | (0.02 | ) | | | — | |
Distributions from net realized gain
on investments | | | (2.02 | ) | | | (0.45 | ) | | | — | | | | — | | | | (0.97 | ) |
| | | | | | | | | | | | | | | | | | | | |
Total distributions | | | (2.02 | ) | | | (0.45 | ) | | | (0.01 | ) | | | (0.02 | ) | | | (0.97 | ) |
| | | | | | | | | | | | | | | | | | | | |
Net increase (decrease) in net asset value . | | | 0.05 | | | | 1.22 | | | | 4.82 | | | | 1.08 | | | | (7.37 | ) |
| | | | | | | | | | | | | | | | | | | | |
Net Asset Value, End of Period | | $ | 20.96 | | | $ | 20.91 | | | $ | 19.69 | | | $ | 14.87 | | | $ | 13.79 | |
| | | | | | | | | | | | | | | | | | | | |
Total Return (b) | | | 10.98 | % | | | 8.40 | % | | | 32.62 | % | | | 7.94 | % | | | (31.42 | )% |
| | | | | |
Ratios/Supplemental Data: | | | | | | | | | | | | | | | | | | | | |
Net Assets, End of Period (in 000’s) | | $ | 635,663 | | | $ | 625,315 | | | $ | 549,627 | | | $ | 515,592 | | | $ | 238,399 | |
Ratios of expenses to average net assets: | | | | | | | | | | | | | | | | | | | | |
Before reimbursement and/or waiver of
expenses by Adviser | | | 1.03 | %(c) | | | 1.04 | % | | | 1.09 | % | | | 1.12 | % | | | 1.07 | % |
After reimbursement and/or waiver of
expenses by Adviser | | | 1.03 | %(c) | | | 1.04 | % | | | 1.09 | % | | | 1.11 | %(d) | | | 1.05 | % |
Ratios of net investment income (loss)
to average net assets: | | | | | | | | | | | | | | | | | | | | |
Before reimbursement and/or waiver of
expenses by Adviser | | | (0.34 | )% | | | (0.44 | )% | | | (0.24 | )% | | | (0.16 | )% | | | 0.54 | % |
After reimbursement and/or waiver of
expenses by Adviser | | | (0.34 | )% | | | (0.44 | )% | | | (0.24 | )% | | | (0.15 | )% | | | 0.56 | % |
Portfolio Turnover | | | 48.22 | %(e) | | | 47.25 | % | | | 62.13 | % | | | 89.92 | % | | | 66.65 | % |
| | (a) | The selected per share data was calculated using the weighted average shares outstanding method for the period. |
| | (b) | The total return is calculated using the Net Asset Values used for trading at the close of business at period end. |
| | (c) | Ratios of expenses to average net assets include interest expenses of less than 0.005% for the year ended October 31, 2012, which is not included in the contractual expense limitation. The interest expenses are from utilizing the line of credit as discussed in Note H to Financial Statements. |
| | (d) | The Adviser removed the contractual expense limitation of 1.05%, excluding interest, taxes, other investment-related costs (such as brokerage commissions), extraordinary expenses and acquired fund fees and expenses, effective March 1, 2009. |
| | (e) | Portfolio turnover rate excludes securities delivered from processing redemptions-in-kind. |
See accompanying Notes to Financial Statements.
| | |
| |
| ASTON/River Road Select Value Fund – Class N | | October 31, 2012 |
| |
| Financial Highlights | | |
| | | | | | | | | | | | | | | | | | | | |
| | | Year
Ended
10/31/12 | | | Year
Ended
10/31/11 | | | Year
Ended
10/31/10 | | | Year
Ended
10/31/09 | | | Year
Ended
10/31/08 | |
| | | | | | | | | | | | | | | | | | | | |
Net Asset Value, Beginning of Period | | $ | 9.54 | | | $ | 9.01 | | | $ | 7.71 | | | $ | 7.13 | | | $ | 10.13 | |
| | | | | | | | | | | | | | | | | | | | |
Income from Investment Operations: | | | | | | | | | | | | | | | | | | | | |
Net investment income (loss) | | | 0.01 | (a) | | | (0.02 | )(a) | | | 0.02 | (a) | | | — | (a)(b) | | | — | (a)(b) |
Net realized and unrealized gain (loss)
on investments | | | 1.01 | | | | 0.66 | | | | 1.28 | | | | 0.59 | | | | (3.00 | ) |
| | | | | | | | | | | | | | | | | | | | |
Total from investment operations | | | 1.02 | | | | 0.64 | | | | 1.30 | | | | 0.59 | | | | (3.00 | ) |
| | | | | | | | | | | | | | | | | | | | |
Less Distributions: | | | | | | | | | | | | | | | | | | | | |
Distributions from net investment income | | | — | | | | (0.03 | ) | | | — | | | | (0.01 | ) | | | — | |
Distributions from net realized gains
on investments | | | (2.06 | ) | | | (0.08 | ) | | | — | | | | — | | | | — | |
| | | | | | | | | | | | | | | | | | | | |
Total distributions | | �� | (2.06 | ) | | | (0.11 | ) | | | — | | | | (0.01 | ) | | | — | |
| | | | | | | | | | | | | | | | | | | | |
Net increase (decrease) in net asset value | | | (1.04 | ) | | | 0.53 | | | | 1.30 | | | | 0.58 | | | | (3.00 | ) |
| | | | | | | | | | | | | | | | | | | | |
Net Asset Value, End of Period | | $ | 8.50 | | | $ | 9.54 | | | $ | 9.01 | | | $ | 7.71 | | | $ | 7.13 | |
| | | | | | | | | | | | | | | | | | | | |
Total Return (c) | | | 12.87 | % | | | 7.12 | % | | | 16.86 | % | | | 8.33 | % | | | (29.62 | )% |
| | | | | |
Ratios/Supplemental Data: | | | | | | | | | | | | | | | | | | | | |
Net Assets, End of Period (in 000’s) | | $ | 6,270 | | | $ | 13,160 | | | $ | 52,522 | | | $ | 41,801 | | | $ | 26,714 | |
Ratios of expenses to average net assets: | | | | | | | | | | | | | | | | | | | | |
Before recoupment and/or waiver of
expenses by Adviser | | | 1.43 | %(d) | | | 1.42 | %(d) | | | 1.41 | %(d) | | | 1.44 | % | | | 1.56 | % |
After recoupment and/or waiver of
expenses by Adviser | | | 1.43 | %(d) | | | 1.42 | %(d) | | | 1.43 | %(d) | | | 1.50 | % | | | 1.50 | % |
Ratios of net investment income (loss)
to average net assets: | | | | | | | | | | | | | | | | | | | | |
Before recoupment and/or waiver of
expenses by Adviser | | | 0.07 | % | | | (0.18 | )% | | | 0.31 | % | | | 0.04 | % | | | (0.08 | )% |
After recoupment and/or waiver of
expenses by Adviser | | | 0.07 | % | | | (0.18 | )% | | | 0.29 | % | | | (0.02 | )% | | | (0.02 | )% |
Portfolio Turnover | | | 38.84 | % | | | 48.22 | % | | | 53.73 | % | | | 44.09 | % | | | 54.93 | % |
| | (a) | The selected per share data was calculated using the weighted average shares outstanding method for the period. |
| | (b) | Represents less than $(0.005) per share. |
| | (c) | The total return is calculated using the Net Asset Values used for trading at the close of business at period end. |
| | (d) | Ratios of expenses to average net assets include interest expenses of less than 0.005% for each of the years ended October 31, 2012, October 31, 2011 and October 31, 2010, which are not included in the contractual expense limitation. The interest expenses are from utilizing the line of credit as discussed in Note H to Financial Statements. |
See accompanying Notes to Financial Statements.
| | |
| |
| ASTON/River Road Select Value Fund – Class I | | October 31, 2012 |
| |
| Financial Highlights | | |
| | | | | | | | | | | | | | | | | | | | |
| | | Year
Ended
10/31/12 | | | Year
Ended
10/31/11 | | | Year
Ended
10/31/10 | | | Year
Ended
10/31/09 | | | Year
Ended
10/31/08 | |
| | | | | | | | | | | | | | | | | | | | |
Net Asset Value, Beginning of Period | | $ | 9.59 | | | $ | 9.04 | | | $ | 7.73 | | | $ | 7.14 | | | $ | 10.13 | |
| | | | | | | | | | | | | | | | | | | | |
Income from Investment Operations: | | | | | | | | | | | | | | | | | | | | |
Net investment income | | | 0.03 | (a) | | | 0.01 | (a) | | | 0.05 | (a) | | | 0.02 | (a) | | | 0.02 | (a) |
Net realized and unrealized gain (loss)
on investments | | | 1.02 | | | | 0.67 | | | | 1.28 | | | | 0.59 | | | | (3.00 | ) |
| | | | | | | | | | | | | | | | | | | | |
Total from investment operations | | | 1.05 | | | | 0.68 | | | | 1.33 | | | | 0.61 | | | | (2.98 | ) |
| | | | | | | | | | | | | | | | | | | | |
Less Distributions: | | | | | | | | | | | | | | | | | | | | |
Distributions from net investment income | | | — | | | | (0.05 | ) | | | (0.02 | ) | | | (0.02 | ) | | | (0.01 | ) |
Distributions from net realized gains
on investments | | | (2.06 | ) | | | (0.08 | ) | | | — | | | | — | | | | — | |
| | | | | | | | | | | | | | | | | | | | |
Total distributions | | | (2.06 | ) | | | (0.13 | ) | | | (0.02 | ) | | | (0.02 | ) | | | (0.01 | ) |
| | | | | | | | | | | | | | | | | | | | |
Net increase (decrease) in net asset value | | | (1.01 | ) | | | 0.55 | | | | 1.31 | | | | 0.59 | | | | (2.99 | ) |
| | | | | | | | | | | | | | | | | | | | |
Net Asset Value, End of Period | | $ | 8.58 | | | $ | 9.59 | | | $ | 9.04 | | | $ | 7.73 | | | $ | 7.14 | |
| | | | | | | | | | | | | | | | | | | | |
Total Return (b) | | | 13.18 | % | | | 7.56 | % | | | 17.19 | % | | | 8.52 | % | | | (29.49 | )% |
| | | | | |
Ratios/Supplemental Data: | | | | | | | | | | | | | | | | | | | | |
Net Assets, End of Period (in 000’s) | | $ | 156,510 | | | $ | 130,527 | | | $ | 163,232 | | | $ | 167,334 | | | $ | 84,002 | |
Ratios of expenses to average net assets: | | | | | | | | | | | | | | | | | | | | |
Before recoupment and/or waiver of
expenses by Adviser | | | 1.18 | %(c) | | | 1.17 | %(c) | | | 1.16 | %(c) | | | 1.19 | % | | | 1.31 | % |
After recoupment and/or waiver of
expenses by Adviser | | | 1.18 | %(c) | | | 1.17 | %(c) | | | 1.18 | %(c) | | | 1.25 | % | | | 1.25 | % |
Ratios of net investment income (loss)
to average net assets: | | | | | | | | | | | | | | | | | | | | |
Before recoupment and/or waiver of
expenses by Adviser | | | 0.32 | % | | | 0.07 | % | | | 0.56 | % | | | 0.29 | % | | | 0.17 | % |
After recoupment and/or waiver of
expenses by Adviser | | | 0.32 | % | | | 0.07 | % | | | 0.54 | % | | | 0.23 | % | | | 0.23 | % |
Portfolio Turnover | | | 38.84 | % | | | 48.22 | % | | | 53.73 | % | | | 44.09 | % | | | 54.93 | % |
| | (a) | The selected per share data was calculated using the weighted average shares outstanding method for the period. |
| | (b) | The total return is calculated using the Net Asset Values used for trading at the close of business at period end. |
| | (c) | Ratios of expenses to average net assets include interest expenses of less than 0.005% for each of the years ended October 31, 2012, October 31, 2011 and October 31, 2010, which are not included in the contractual expense limitation. The interest expenses are from utilizing the line of credit as discussed in Note H to Financial Statements. |
See accompanying Notes to Financial Statements.
| | |
| |
| ASTON/River Road Small Cap Value Fund – Class N | | October 31, 2012 |
| |
| Financial Highlights | | |
| | | | | | | | | | | | | | | | | | | | |
| | | Year
Ended
10/31/12 | | | Year
Ended
10/31/11 | | | Year
Ended
10/31/10 | | | Year
Ended
10/31/09 | | | Year
Ended
10/31/08 | |
| | | | | | | | | | | | | | | | | | | | |
Net Asset Value, Beginning of Period | | $ | 12.20 | | | $ | 11.60 | | | $ | 10.22 | | | $ | 9.30 | | | $ | 14.37 | |
| | | | | | | | | | | | | | | | | | | | |
Income from Investment Operations: | | | | | | | | | | | | | | | | | | | | |
Net investment income (loss) | | | 0.03 | (a) | | | (0.03 | ) | | | 0.03 | | | | 0.01 | | | | 0.01 | (a) |
Net realized and unrealized gain (loss)
on investments | | | 1.33 | | | | 0.67 | | | | 1.36 | | | | 0.92 | | | | (4.54 | ) |
| | | | | | | | | | | | | | | | | | | | |
Total from investment operations | | | 1.36 | | | | 0.64 | | | | 1.39 | | | | 0.93 | | | | (4.53 | ) |
| | | | | | | | | | | | | | | | | | | | |
Less Distributions: | | | | | | | | | | | | | | | | | | | | |
Distributions from and in excess of net
investment income | | | — | | | | (0.04 | ) | | | (0.01 | ) | | | (0.01 | ) | | | — | |
Distributions from net realized gain
on investments | | | — | | | | — | | | | — | | | | — | | | | (0.54 | ) |
| | | | | | | | | | | | | | | | | | | | |
Total distributions | | | — | | | | (0.04 | ) | | | (0.01 | ) | | | (0.01 | ) | | | (0.54 | ) |
| | | | | | | | | | | | | | | | | | | | |
Net increase (decrease) in net asset value | | | 1.36 | | | | 0.60 | | | | 1.38 | | | | 0.92 | | | | (5.07 | ) |
| | | | | | | | | | | | | | | | | | | | |
Net Asset Value, End of Period | | $ | 13.56 | | | $ | 12.20 | | | $ | 11.60 | | | $ | 10.22 | | | $ | 9.30 | |
| | | | | | | | | | | | | | | | | | | | |
Total Return (b) | | | 11.15 | % | | | 5.46 | % | | | 13.60 | % | | | 9.99 | % | | | (32.51 | )% |
| | | | | |
Ratios/Supplemental Data: | | | | | | | | | | | | | | | | | | | | |
Net Assets, End of Period (in 000’s) | | $ | 49,154 | | | $ | 91,347 | | | $ | 213,326 | | | $ | 216,221 | | | $ | 160,245 | |
Ratios of expenses to average net assets: | | | | | | | | | | | | | | | | | | | | |
Before reimbursement and/or waiver of
expenses by Adviser | | | 1.37 | % | | | 1.37 | %(c) | | | 1.39 | %(c) | | | 1.40 | % | | | 1.45 | %(c) |
After reimbursement and/or waiver of
expenses by Adviser | | | 1.37 | % | | | 1.37 | %(c) | | | 1.39 | %(c) | | | 1.40 | %(d) | | | 1.45 | %(c) |
Ratios of net investment income (loss)
to average net assets: | | | | | | | | | | | | | | | | | | | | |
Before reimbursement and/or waiver of
expenses by Adviser | | | 0.22 | % | | | (0.13 | )% | | | 0.27 | % | | | 0.05 | % | | | 0.08 | % |
After reimbursement and/or waiver of
expenses by Adviser | | | 0.22 | % | | | (0.13 | )% | | | 0.27 | % | | | 0.05 | % | | | 0.08 | % |
Portfolio Turnover | | | 26.95 | % | | | 42.29 | % | | | 51.05 | % | | | 35.83 | % | | | 57.32 | % |
| | (a) | The selected per share data was calculated using the weighted average shares outstanding method for the period. |
| | (b) | The total return is calculated using the Net Asset Values used for trading at the close of business at period end. |
| | (c) | Ratios of expenses to average net assets include interest expenses of less than 0.005% for each of the years ended October 31, 2011, October 31, 2010 and October 31, 2008, which are not included in the contractual expense limitation. The interest expenses are from utilizing the line of credit as discussed in Note H to Financial Statements. |
| | (d) | The Adviser removed the contractual expense limitation of 1.50%, excluding interest, taxes, other investment-related costs (such as brokerage commissions), extraordinary expenses and acquired fund fees and expenses, effective March 1, 2009. |
See accompanying Notes to Financial Statements.
| | |
| |
| ASTON/River Road Small Cap Value Fund – Class I | | October 31, 2012 |
| |
| Financial Highlights | | |
| | | | | | | | | | | | | | | | | | | | |
| | | Year
Ended
10/31/12 | | | Year
Ended
10/31/11 | | | Year
Ended
10/31/10 | | | Year
Ended
10/31/09 | | | Year
Ended
10/31/08 | |
| | | | | | | | | | | | | | | | | | | | |
Net Asset Value, Beginning of Period | | $ | 12.22 | | | $ | 11.62 | | | $ | 10.24 | | | $ | 9.32 | | | $ | 14.37 | |
| | | | | | | | | | | | | | | | | | | | |
Income from Investment Operations: | | | | | | | | | | | | | | | | | | | | |
Net investment income | | | 0.06 | (a) | | | 0.01 | | | | 0.06 | | | | 0.03 | | | | 0.04 | (a) |
Net realized and unrealized gain (loss)
on investments | | | 1.34 | | | | 0.65 | | | | 1.35 | | | | 0.92 | | | | (4.54 | ) |
| | | | | | | | | | | | | | | | | | | | |
Total from investment operations | | | 1.40 | | | | 0.66 | | | | 1.41 | | | | 0.95 | | | | (4.50 | ) |
| | | | | | | | | | | | | | | | | | | | |
Less Distributions: | | | | | | | | | | | | | | | | | | | | |
Distributions from and in excess of net
investment income | | | — | | | | (0.06 | ) | | | (0.03 | ) | | | (0.03 | ) | | | (0.01 | ) |
Distributions from net realized gain
on investments | | | — | | | | — | | | | — | | | | — | | | | (0.54 | ) |
| | | | | | | | | | | | | | | | | | | | |
Total distributions | | | — | | | | (0.06 | ) | | | (0.03 | ) | | | (0.03 | ) | | | (0.55 | ) |
| | | | | | | | | | | | | | | | | | | | |
Net increase (decrease) in net asset value | | | 1.40 | | | | 0.60 | | | | 1.38 | | | | 0.92 | | | | (5.05 | ) |
| | | | | | | | | | | | | | | | | | | | |
Net Asset Value, End of Period | | $ | 13.62 | | | $ | 12.22 | | | $ | 11.62 | | | $ | 10.24 | | | $ | 9.32 | |
| | | | | | | | | | | | | | | | | | | | |
Total Return (b) | | | 11.46 | % | | | 5.70 | % | | | 13.80 | % | | | 10.31 | % | | | (32.34 | )% |
| | | | | |
Ratios/Supplemental Data: | | | | | | | | | | | | | | | | | | | | |
Net Assets, End of Period (in 000’s) | | $ | 240,075 | | | $ | 246,141 | | | $ | 255,344 | | | $ | 282,542 | | | $ | 114,666 | |
Ratios of expenses to average net assets: | | | | | | | | | | | | | | | | | | | | |
Before reimbursement and/or waiver of
expenses by Adviser | | | 1.12 | % | | | 1.12 | %(c) | | | 1.14 | %(c) | | | 1.15 | % | | | 1.20 | %(c) |
After reimbursement and/or waiver of
expenses by Adviser | | | 1.12 | % | | | 1.12 | %(c) | | | 1.14 | %(c) | | | 1.15 | %(d) | | | 1.20 | %(c) |
Ratios of net investment income to average
net assets: | | | | | | | | | | | | | | | | | | | | |
Before reimbursement and/or waiver of
expenses by Adviser | | | 0.47 | % | | | 0.12 | % | | | 0.52 | % | | | 0.30 | % | | | 0.33 | % |
After reimbursement and/or waiver of
expenses by Adviser | | | 0.47 | % | | | 0.12 | % | | | 0.52 | % | | | 0.30 | % | | | 0.33 | % |
Portfolio Turnover | | | 26.95 | % | | | 42.29 | % | | | 51.05 | % | | | 35.83 | % | | | 57.32 | % |
| | (a) | The selected per share data was calculated using the weighted average shares outstanding method for the period. |
| | (b) | The total return is calculated using the Net Asset Values used for trading at the close of business at period end. |
| | (c) | Ratios of expenses to average net assets include interest expenses of less than 0.005% for each of the years ended October 31, 2011, October 31, 2010 and October 31, 2008, which are not included in the contractual expense limitation. The interest expenses are from utilizing the line of credit as discussed in Note H to Financial Statements. |
| | (d) | The Adviser removed the contractual expense limitation of 1.25%, excluding interest, taxes, other investment-related costs (such as brokerage commissions), extraordinary expenses and acquired fund fees and expenses, effective March 1, 2009. |
See accompanying Notes to Financial Statements.
| | |
| |
| ASTON/River Road Independent Value Fund – Class N | | October 31, 2012 |
| |
| Financial Highlights | | |
| | | | | | | | |
| | | Year
Ended
10/31/12 | | | Period
Ended
10/31/11(a) | |
Net Asset Value, Beginning of Period | | $ | 10.75 | | | $ | 10.00 | |
| | | | | | | | |
Income from Investment Operations: | | | | | | | | |
Net investment loss | | | (0.09 | )(b) | | | (0.07 | )(b) |
Net realized and unrealized gain on investments | | | 0.88 | | | | 0.82 | |
| | | | | | | | |
Total from investment operations | | | 0.79 | | | | 0.75 | |
| | | | | | | | |
Less Distributions: | | | | | | | | |
Distributions from net realized gain on investments | | | (0.12 | ) | | | — | |
| | | | | | | | |
Total distributions | | | (0.12 | ) | | | — | |
| | | | | | | | |
Net increase in net asset value | | | 0.67 | | | | 0.75 | |
| | | | | | | | |
Net Asset Value, End of Period | | $ | 11.42 | | | $ | 10.75 | |
| | | | | | | | |
Total Return (c) | | | 7.41 | % | | | 7.50 | %(d) |
| | |
Ratios/Supplemental Data: | | | | | | | | |
Net Assets, End of Period (in 000’s) | | $ | 362,416 | | | $ | 306,223 | |
Ratios of expenses to average net assets: | | | | | | | | |
Before reimbursement, waiver, and/or earnings credit of expenses by Adviser | | | 1.44 | %(f) | | | 1.59 | %(e) |
After reimbursement, waiver, and/or earnings credit of expenses by Adviser | | | 1.42 | %(f) | | | 1.42 | %(e) |
Ratios of net investment loss to average net assets: | | | | | | | | |
Before reimbursement, waiver, and/or earnings credit of expenses by Adviser | | | (0.81 | )% | | | (0.98 | )%(e) |
After reimbursement, waiver, and/or earnings credit of expenses by Adviser | | | (0.79 | )% | | | (0.80 | )%(e) |
Portfolio Turnover | | | 141.17 | % | | | 105.69 | %(d) |
| | (a) | River Road Independent Value Fund began issuing Class N shares on December 30, 2010. |
| | (b) | The selected per share data was calculated using the weighted average shares outstanding method for the period. |
| | (c) | The total return is calculated using the Net Asset Values used for trading at the close of business at period end. |
| | (f) | Ratios of expenses to average net assets include Earnings Credits of less than 0.005% for the year ended October 31, 2012, which is not included in the contractual expense limitation. See Note I in the Notes to Financial Statements. |
See accompanying Notes to Financial Statements.
| | |
| |
| ASTON/River Road Independent Value Fund – Class I | | October 31, 2012 |
| |
| Financial Highlights | | |
| | | | | | | | |
| | | Year
Ended
10/31/12 | | | Period
Ended
10/31/11(a) | |
Net Asset Value, Beginning of Period | | $ | 10.75 | | | $ | 10.92 | |
| | | | | | | | |
Income from Investment Operations: | | | | | | | | |
Net investment loss | | | (0.06 | )(b) | | | (0.02 | )(b) |
Net realized and unrealized gain (loss) on investments | | | 0.89 | | | | (0.15 | ) |
| | | | | | | | |
Total from investment operations | | | 0.83 | | | | (0.17 | ) |
| | | | | | | | |
Less Distributions: | | | | | | | | |
Distributions from net realized gain on investments | | | (0.12 | ) | | | — | |
| | | | | | | | |
Total distributions | | | (0.12 | ) | | | — | |
| | | | | | | | |
Net increase (decrease) in net asset value | | | 0.71 | | | | (0.17 | ) |
| | | | | | | | |
Net Asset Value, End of Period | | $ | 11.46 | | | $ | 10.75 | |
| | | | | | | | |
Total Return (c) | | | 7.68 | % | | | (1.47 | )%(d) |
| | |
Ratios/Supplemental Data: | | | | | | | | |
Net Assets, End of Period (in 000’s) | | $ | 338,234 | | | $ | 85,478 | |
Ratios of expenses to average net assets: | | | | | | | | |
Before reimbursement, waiver, and/or earnings credit of expenses by Adviser | | | 1.19 | %(f) | | | 1.34 | %(e) |
After reimbursement, waiver, and/or earnings credit of expenses by Adviser | | | 1.17 | %(f) | | | 1.17 | %(e) |
Ratios of net investment loss to average net assets: | | | | | | | | |
Before reimbursement, waiver, and/or earnings credit of expenses by Adviser | | | (0.56 | )% | | | (0.73 | )%(e) |
After reimbursement, waiver, and/or earnings credit of expenses by Adviser | | | (0.54 | )% | | | (0.55 | )%(e) |
Portfolio Turnover | | | 141.17 | % | | | 105.69 | %(d) |
| | (a) | River Road Independent Value Fund began issuing Class I shares on May 31, 2011. |
| | (b) | The selected per share data was calculated using the weighted average shares outstanding method for the period. |
| | (c) | The total return is calculated using the Net Asset Values used for trading at the close of business at period end. |
| | (f) | Ratios of expenses to average net assets include Earnings Credits of less than 0.005% for the year ended October 31, 2012, which is not included in the contractual expense limitation. See Note I in the Notes to Financial Statements. |
See accompanying Notes to Financial Statements.
| | |
| |
| ASTON/DoubleLine Core Plus Fixed Income Fund – Class N | | October 31, 2012 |
| |
| Financial Highlights | | |
| | | | | | | | |
| | | Year
Ended
10/31/12 | | | Period
Ended
10/31/11(a) | |
Net Asset Value, Beginning of Period | | $ | 10.44 | | | $ | 10.00 | |
| | | | | | | | |
Income from Investment Operations: | | | | | | | | |
Net investment income | | | 0.33 | (b) | | | 0.12 | (b) |
Net realized and unrealized gain on investments | | | 0.72 | | | | 0.41 | |
| | | | | | | | |
Total from investment operations | | | 1.05 | | | | 0.53 | |
| | | | | | | | |
Less Distributions: | | | | | | | | |
Distributions from and in excess of net investment income | | | (0.37 | ) | | | (0.09 | ) |
Distributions from net realized gain on investments | | | (0.02 | ) | | | — | |
| | | | | | | | |
Total distributions | | | (0.39 | ) | | | (0.09 | ) |
| | | | | | | | |
Net increase in net asset value | | | 0.66 | | | | 0.44 | |
| | | | | | | | |
Net Asset Value, End of Period | | $ | 11.10 | | | $ | 10.44 | |
| | | | | | | | |
Total Return (c) | | | 10.25 | % | | | 5.33 | %(d) |
| | |
Ratios/Supplemental Data: | | | | | | | | |
Net Assets, End of Period (in 000’s) | | $ | 71,546 | | | $ | 22,657 | |
Ratios of expenses to average net assets: | | | | | | | | |
Before reimbursement and/or waiver of expenses by Adviser | | | 1.35 | % | | | 3.16 | %(e) |
After reimbursement and/or waiver of expenses by Adviser | | | 0.94 | % | | | 0.94 | %(e) |
Ratios of net investment income to average net assets: | | | | | | | | |
Before reimbursement and/or waiver of expenses by Adviser | | | 2.59 | % | | | 1.63 | %(e) |
After reimbursement and/or waiver of expenses by Adviser | | | 3.01 | % | | | 3.85 | %(e) |
Portfolio Turnover | | | 118.67 | % | | | 38.49 | %(d) |
| | (a) | DoubleLine Core Plus Fixed Income Fund began issuing Class N shares on July 15, 2011. |
| | (b) | The selected per share data was calculated using the weighted average shares outstanding method for the period. |
| | (c) | The total return is calculated using the Net Asset Values used for trading at the close of business at period end. |
See accompanying Notes to Financial Statements.
| | |
| |
| ASTON/DoubleLine Core Plus Fixed Income Fund – Class I | | October 31, 2012 |
| |
| Financial Highlights | | |
| | | | | | | | |
| | | Year
Ended
10/31/12 | | | Period
Ended
10/31/11(a) | |
Net Asset Value, Beginning of Period | | $ | 10.44 | | | $ | 10.00 | |
| | | | | | | | |
Income from Investment Operations: | | | | | | | | |
Net investment income | | | 0.35 | (b) | | | 0.13 | (b) |
Net realized and unrealized gain on investments | | | 0.73 | | | | 0.41 | |
| | | | | | | | |
Total from investment operations | | | 1.08 | | | | 0.54 | |
| | | | | | | | |
Less Distributions: | | | | | | | | |
Distributions from and in excess of net investment income | | | (0.40 | ) | | | (0.10 | ) |
Distributions from net realized gain on investments | | | (0.02 | ) | | | — | |
| | | | | | | | |
Total distributions | | | (0.42 | ) | | | (0.10 | ) |
| | | | | | | | |
Net increase in net asset value | | | 0.66 | | | | 0.44 | |
| | | | | | | | |
Net Asset Value, End of Period | | $11.10 | | | | $ | 10.44 | |
| | | | | | | | |
Total Return (c) | | | 10.52 | % | | | 5.38 | %(d) |
| | |
Ratios/Supplemental Data: | | | | | | | | |
Net Assets, End of Period (in 000’s) | | $ | 105,335 | | | $ | 4,486 | |
Ratios of expenses to average net assets: | | | | | | | | |
Before reimbursement and/or waiver of expenses by Adviser | | | 1.10 | % | | | 2.91 | %(e) |
After reimbursement and/or waiver of expenses by Adviser | | | 0.69 | % | | | 0.69 | %(e) |
Ratios of net investment income to average net assets: | | | | | | | | |
Before reimbursement and/or waiver of expenses by Adviser | | | 2.84 | % | | | 1.88 | %(e) |
After reimbursement and/or waiver of expenses by Adviser | | | 3.26 | % | | | 4.10 | %(e) |
Portfolio Turnover | | | 118.67 | % | | | 38.49 | %(d) |
| | (a) | DoubleLine Core Plus Fixed Income Fund began issuing Class I shares on July 15, 2011. |
| | (b) | The selected per share data was calculated using the weighted average shares outstanding method for the period. |
| | (c) | The total return is calculated using the Net Asset Values used for trading at the close of business at period end. |
See accompanying Notes to Financial Statements.
| | |
| |
| ASTON/TCH Fixed Income Fund – Class N | | October 31, 2012 |
| |
| Financial Highlights | | |
| | | | | | | | | | | | | | | | | | | | |
| | | Year
Ended
10/31/12 | | | Year
Ended
10/31/11 | | | Year
Ended
10/31/10 | | | Year
Ended
10/31/09 | | | Year
Ended
10/31/08 | |
Net Asset Value, Beginning of Period | | $ | 10.59 | | | $ | 10.49 | | | $ | 10.02 | | | $ | 8.60 | | | $ | 9.73 | |
| | | | | | | | | | | | | | | | | | | | |
Income from Investment Operations: | | | | | | | | | | | | | | | | | | | | |
Net investment income | | | 0.45 | (a) | | | 0.47 | (a) | | | 0.50 | (a) | | | 0.49 | (a) | | | 0.47 | |
Net realized and unrealized gain (loss)
on investments | | | 0.56 | | | | 0.10 | | | | 0.47 | | | | 1.44 | | | | (1.10 | ) |
| | | | | | | | | | | | | | | | | | | | |
Total from investment operations | | | 1.01 | | | | 0.57 | | | | 0.97 | | | | 1.93 | | | | (0.63 | ) |
| | | | | | | | | | | | | | | | | | | | |
Less Distributions: | | | | | | | | | | | | | | | | | | | | |
Distributions from and in excess of net
investment income | | | (0.49 | ) | | | (0.47 | ) | | | (0.50 | ) | | | (0.51 | ) | | | (0.50 | ) |
| | | | | | | | | | | | | | | | | | | | |
Total distributions | | | (0.49 | ) | | | (0.47 | ) | | | (0.50 | ) | | | (0.51 | ) | | | (0.50 | ) |
| | | | | | | | | | | | | | | | | | | | |
Net increase (decrease) in net asset value . | | | 0.52 | | | | 0.10 | | | | 0.47 | | | | 1.42 | | | | (1.13 | ) |
| | | | | | | | | | | | | | | | | | | | |
Net Asset Value, End of Period | | $ | 11.11 | | | $ | 10.59 | | | $ | 10.49 | | | $ | 10.02 | | | $ | 8.60 | |
| | | | | | | | | | | | | | | | | | | | |
Total Return (b) | | | 9.74 | % | | | 5.62 | % | | | 9.98 | % | | | 22.99 | % | | | (6.89 | )% |
| | | | | |
Ratios/Supplemental Data: | | | | | | | | | | | | | | | | | | | | |
Net Assets, End of Period (in 000’s) | | $ | 59,772 | | | $ | 62,346 | | | $ | 46,274 | | | $ | 47,008 | | | $ | 42,765 | |
Ratios of expenses to average net assets: | | | | | | | | | | | | | | | | | | | | |
Before reimbursement and/or waiver of
expenses by Adviser | | | 1.02 | % | | | 1.14 | % | | | 0.98 | % | | | 0.96 | % | | | 1.06 | % |
After reimbursement and/or waiver of
expenses by Adviser | | | 0.86 | % | | | 0.88 | %(c) | | | 0.62 | % | | | 0.61 | % | | | 0.65 | %(c) |
Ratios of net investment income to average net assets: | | | | | | | | | | | | | | | | | | | | |
Before reimbursement and/or waiver of
expenses by Adviser | | | 4.03 | % | | | 4.20 | % | | | 4.51 | % | | | 4.93 | % | | | 4.59 | % |
After reimbursement and/or waiver of
expenses by Adviser | | | 4.19 | % | | | 4.46 | % | | | 4.87 | % | | | 5.28 | % | | | 5.00 | % |
Portfolio Turnover | | | 57.43 | % | | | 37.51 | % | | | 23.92 | % | | | 40.81 | % | | | 78.39 | % |
| | (a) | The selected per share data was calculated using the weighted average shares outstanding method for the period. |
| | (b) | The total return is calculated using the Net Asset Values used for trading at the close of business at period end. |
| | (c) | The Adviser’s contractual expense limitation, which affects the net expense ratio, was changed from 0.74% to 0.64% on September 1, 2007. Subsequently, on October 1, 2008, the Adviser’s expense reimbursement level changed from 0.64% to 0.74%. Subsequently, on March 1, 2011, the Adviser’s expense reimbursement level changed from 0.74% to 0.94%. The contractual expense limitation excludes interest, taxes, other investment-related costs (such as brokerage commissions), extraordinary expenses and acquired fund fees and expenses. |
See accompanying Notes to Financial Statements.
| | |
| |
| ASTON/TCH Fixed Income Fund – Class I | | October 31, 2012 |
| |
| Financial Highlights | | |
| | | | | | | | | | | | | | | | | | | | |
| | | Year
Ended
10/31/12 | | | Year
Ended
10/31/11 | | | Year
Ended
10/31/10 | | | Year
Ended
10/31/09 | | | Year
Ended
10/31/08 | |
Net Asset Value, Beginning of Period | | $ | 10.59 | | | $ | 10.49 | | | $ | 10.02 | | | $ | 8.60 | | | $ | 9.73 | |
| | | | | | | | | | | | | | | | | | | | |
Income from Investment Operations: | | | | | | | | | | | | | | | | | | | | |
Net investment income | | | 0.47 | (a) | | | 0.49 | (a) | | | 0.51 | (a) | | | 0.50 | (a) | | | 0.48 | |
Net realized and unrealized gain (loss)
on investments | | | 0.55 | | | | 0.11 | | | | 0.48 | | | | 1.44 | | | | (1.09 | ) |
| | | | | | | | | | | | | | | | | | | | |
Total from investment operations | | | 1.02 | | | | 0.60 | | | | 0.99 | | | | 1.94 | | | | (0.61 | ) |
| | | | | | | | | | | | | | | | | | | | |
Less Distributions: | | | | | | | | | | | | | | | | | | | | |
Distributions from and in excess of net
investment income | | | (0.50 | ) | | | (0.50 | ) | | | (0.52 | ) | | | (0.52 | ) | | | (0.52 | ) |
| | | | | | | | | | | | | | | | | | | | |
Total distributions | | | (0.50 | ) | | | (0.50 | ) | | | (0.52 | ) | | | (0.52 | ) | | | (0.52 | ) |
| | | | | | | | | | | | | | | | | | | | |
Net increase (decrease) in net asset value . | | | 0.52 | | | | 0.10 | | | | 0.47 | | | | 1.42 | | | | (1.13 | ) |
| | | | | | | | | | | | | | | | | | | | |
Net Asset Value, End of Period | | $ | 11.11 | | | $ | 10.59 | | | $ | 10.49 | | | $ | 10.02 | | | $ | 8.60 | |
| | | | | | | | | | | | | | | | | | | | |
Total Return (b) | | | 9.93 | % | | | 5.89 | % | | | 10.11 | % | | | 23.14 | % | | | (6.65 | )% |
| | | | | |
Ratios/Supplemental Data: | | | | | | | | | | | | | | | | | | | | |
Net Assets, End of Period (in 000’s) | | $ | 10,396 | | | $ | 10,423 | | | $ | 14,881 | | | $ | 20,276 | | | $ | 25,891 | |
Ratios of expenses to average net assets: | | | | | | | | | | | | | | | | | | | | |
Before reimbursement and/or waiver of
expenses by Adviser | | | 0.85 | % | | | 0.89 | % | | | 0.85 | % | | | 0.84 | % | | | 0.81 | % |
After reimbursement and/or waiver of
expenses by Adviser | | | 0.69 | % | | | 0.63 | %(c) | | | 0.49 | % | | | 0.49 | % | | | 0.40 | %(c) |
Ratios of net investment income to average net assets: | | | | | | | | | | | | | | | | | | | | |
Before reimbursement and/or waiver of
expenses by Adviser | | | 4.20 | % | | | 4.45 | % | | | 4.64 | % | | | 5.05 | % | | | 4.84 | % |
After reimbursement and/or waiver of
expenses by Adviser | | | 4.36 | % | | | 4.71 | % | | | 5.00 | % | | | 5.40 | % | | | 5.25 | % |
Portfolio Turnover | | | 57.43 | % | | | 37.51 | % | | | 23.92 | % | | | 40.81 | % | | | 78.39 | % |
| | (a) | The selected per share data was calculated using the weighted average shares outstanding method for the period. |
| | (b) | The total return is calculated using the Net Asset Values used for trading at the close of business at period end. |
| | (c) | The Adviser’s contractual expense limitation, which affects the net expense ratio, was changed from 0.49% to 0.39% on September 1, 2007. Subsequently, on October 1, 2008, the Adviser’s expense reimbursement level changed from 0.39% to 0.49%. Subsequently, on March 1, 2011, the Adviser’s expense reimbursement level changed from 0.49% to 0.69%. The contractual expense limitation excludes interest, taxes, other investment-related costs (such as brokerage commissions), extraordinary expenses and acquired fund fees and expenses. |
See accompanying Notes to Financial Statements.
| | |
| |
| ASTON/Lake Partners LASSO Alternatives Fund – Class N | | October 31, 2012 |
| |
| Financial Highlights | | |
| | | | | | | | | | | | |
| | | Year
Ended
10/31/12 | | | Year
Ended
10/31/11 | | | Period
Ended
10/31/10(a) | |
Net Asset Value, Beginning of Period | | $ | 11.94 | | | $ | 11.97 | | | $ | 11.48 | |
| | | | | | | | | | | | |
Income from Investment Operations: | | | | | | | | | | | | |
Net investment income (loss) | | | 0.04 | (b) | | | (0.01 | )(b) | | | 0.04 | (b) |
Net realized and unrealized gain on investments | | | 0.59 | | | | 0.13 | | | | 0.45 | |
| | | | | | | | | | | | |
Total from investment operations | | | 0.63 | | | | 0.12 | | | | 0.49 | |
| | | | | | | | | | | | |
Less Distributions: | | | | | | | | | | | | |
Distributions from and in excess of net investment income | | | (0.18 | ) | | | (0.08 | ) | | | — | |
Distributions from capital gains | | | — | | | | (0.07 | ) | | | — | |
| | | | | | | | | | | | |
Total distributions | | | (0.18 | ) | | | (0.15 | ) | | | — | |
| | | | | | | | | | | | |
Net increase (decrease) in net asset value | | | 0.45 | | | | (0.03 | ) | | | 0.49 | |
| | | | | | | | | | | | |
Net Asset Value, End of Period | | $ | 12.39 | | | $ | 11.94 | | | $ | 11.97 | |
| | | | | | | | | | | | |
Total Return (c) | | | 5.34 | % | | | 0.92 | % | | | 4.27 | %(d) |
| | | |
Ratios/Supplemental Data: | | | | | | | | | | | | |
Net Assets, End of Period (in 000’s) | | $ | 33,719 | | | $ | 17,626 | | | $ | 8,296 | |
Ratios of expenses to average net assets: | | | | | | | | | | | | |
Before reimbursement, waiver, earnings credit and/or recoupment of expenses by Adviser (e) | | | 1.41 | %(g)(i) | | | 1.53 | % | | | 2.19 | %(f) |
After reimbursement, waiver, earnings credit and/or recoupment of expenses by Adviser (e) | | | 1.45 | %(g)(i) | | | 1.45 | % | | | 1.45 | %(f)(h) |
Ratios of net investment income (loss) to average net assets: | | | | | | | | | | | | |
Before reimbursement, waiver, earnings credit and/or recoupment of expenses by Adviser | | | 0.36 | %(g) | | | (0.17 | )% | | | (0.25 | )%(f) |
After reimbursement, waiver, earnings credit and/or recoupment of expenses by Adviser | | | 0.32 | %(g) | | | (0.10 | )% | | | 0.49 | %(f) |
Portfolio Turnover | | | 45.60 | % | | | 79.77 | % | | | 116.68 | % |
| | (a) | Lake Partners LASSO Alternatives Fund began issuing Class N shares on March 2, 2010. |
| | (b) | The selected per share data was calculated using the weighted average shares outstanding method for the period. |
| | (c) | The total return is calculated using the Net Asset Values used for trading at the close of business at period end. |
| | (e) | Does not include expenses of the underlying funds in which the Fund invests. |
| | (g) | Ratios of expenses and net investment income to average net assets include advisory fee waiver of less than 0.005% for the year ended October 31, 2012. |
| | (h) | Effective March 30, 2010, the contractual expense limitation was decreased from 1.60% to 1.45% excluding interest, taxes, other investment-related costs (such as brokerage commissions), extraordinary expenses and acquired fund fees and expenses. |
| | (i) | Ratios of expenses to average net assets includes Earnings Credits of less than 0.005% for the year ended October 31, 2012, which is not included in the contractual expense limitation. See Note I in the Notes to Financial Statements. |
See accompanying Notes to Financial Statements.
| | |
| |
| ASTON/Lake Partners LASSO Alternatives Fund – Class I | | October 31, 2012 |
| |
| Financial Highlights | | |
| | | | | | | | | | | | | | | | |
| | | Year
Ended
10/31/12 | | | Year
Ended
10/31/11 | | | Year
Ended
10/31/10 | | | Period
Ended
10/31/09(a) | |
| | | | | | | | | | | | | | | | |
Net Asset Value, Beginning of Period | | $ | 11.97 | | | $ | 11.98 | | | $ | 11.15 | | | $ | 10.00 | |
| | | | | | | | | | | | | | | | |
Income from Investment Operations: | | | | | | | | | | | | | | | | |
Net investment income (loss) | | | 0.07 | (b) | | | 0.02 | (b) | | | 0.08 | (b) | | | (— | )(c) |
Net realized and unrealized gain on investments | | | 0.59 | | | | 0.13 | | | | 0.89 | | | | 1.15 | |
| | | | | | | | | | | | | | | | |
Total from investment operations | | | 0.66 | | | | 0.15 | | | | 0.97 | | | | 1.15 | |
| | | | | | | | | | | | | | | | |
Less Distributions: | | | | | | | | | | | | | | | | |
Distributions from and in excess of net investment income | | | (0.21 | ) | | | (0.09 | ) | | | (0.07 | ) | | | — | |
Distributions from net realized gain on investments | | | — | | | | (0.07 | ) | | | (0.07 | ) | | | — | |
| | | | | | | | | | | | | | | | |
Total distributions | | | (0.21 | ) | | | (0.16 | ) | | | (0.14 | ) | | | — | |
| | | | | | | | | | | | | | | | |
Net increase (decrease) in net asset value | | | 0.45 | | | | (0.01 | ) | | | 0.83 | | | | 1.15 | |
| | | | | | | | | | | | | | | | |
Net Asset Value, End of Period | | $ | 12.42 | | | $ | 11.97 | | | $ | 11.98 | | | $ | 11.15 | |
| | | | | | | | | | | | | | | | |
Total Return (d) | | | 5.56 | % | | | 1.22 | % | | | 8.74 | % | | | 11.50 | %(e) |
| | | | |
Ratios/Supplemental Data: | | | | | | | | | | | | | | | | |
Net Assets, End of Period (in 000’s) | | $ | 253,343 | | | $ | 189,999 | | | $ | 19,723 | | | $ | 1,845 | |
Ratios of expenses to average net assets: | | | | | | | | | | | | | | | | |
Before reimbursement, waiver and/or recoupment of expenses by Adviser (f) | | | 1.16 | %(h)(i) | | | 1.28 | % | | | 2.32 | % | | | 18.16 | %(g) |
After reimbursement, waiver and/or recoupment of expenses by Adviser (f) | | | 1.20 | %(h)(i) | | | 1.20 | % | | | 1.24 | %(j) | | | 1.35 | %(g) |
Ratios of net investment income (loss) to average net assets: | | | | | | | | | | | | | | | | |
Before reimbursement, waiver and/or recoupment of expenses by Adviser | | | 0.61 | %(h) | | | 0.08 | % | | | (0.41 | )% | | | (16.92 | )%(g) |
After reimbursement, waiver and/or recoupment of expenses by Adviser | | | 0.57 | %(h) | | | 0.15 | % | | | 0.67 | % | | | (0.11 | )%(g) |
Portfolio Turnover | | | 45.60 | % | | | 79.77 | % | | | 116.68 | % | | | 65.93 | %(e) |
| | (a) | Lake Partners LASSO Alternatives Fund began issuing Class I shares on March 31, 2009. |
| | (b) | The selected per share data was calculated using the weighted average shares outstanding method for the period. |
| | (c) | Represents less than $(0.005) per share. |
| | (d) | The total return is calculated using the Net Asset Values used for trading at the close of business at period end. |
| | (f) | Does not include expenses of the underlying funds in which the Fund invests. |
| | (h) | Ratios of expenses and net investment income to average net assets include advisory fee waiver of less than 0.005% for the year ended October 31, 2012. |
| | (i) | Ratios of expenses to average net assets include Earnings Credits of less than 0.005% for the year ended October 31, 2012, which is not included in the contractual expense limitation. See Note I in the Notes to Financial Statements. |
| | (j) | Effective March 30, 2010, the contractual expense limitation was decreased from 1.35% to 1.20% excluding interest, taxes, other investment-related costs (such as brokerage commissions), extraordinary expenses and acquired fund fees and expenses. |
See accompanying Notes to Financial Statements.
| | |
| |
| ASTON Dynamic Allocation Fund – Class N | | October 31, 2012 |
| |
| Financial Highlights | | |
| | | | | | | | | | | | | | | | | | | | |
| | | Year
Ended
10/31/12 | | | Year
Ended
10/31/11 | | | Year
Ended
10/31/10 | | | Year
Ended
10/31/09 | | | Period
Ended
10/31/08(a) | |
| | | | | | | | | | | | | | | | | | | | |
Net Asset Value, Beginning of Period | | $ | 9.54 | | | $ | 9.25 | | | $ | 9.17 | | | $ | 8.24 | | | $ | 10.00 | |
| | | | | | | | | | | | | | | | | | | | |
Income from Investment Operations: | | | | | | | | | | | | | | | | | | | | |
Net investment income (loss) | | | 0.05 | (b) | | | (0.03 | )(b) | | | 0.05 | | | | 0.06 | | | | 0.07 | |
Net realized and unrealized income (loss)
on investments | | | (0.17 | ) | | | 0.66 | | | | 0.66 | | | | 0.99 | (c) | | | (1.76 | ) |
| | | | | | | | | | | | | | | | | | | | |
Total from investment operations | | | (0.12 | ) | | | 0.63 | | | | 0.71 | | | | 1.05 | | | | (1.69 | ) |
| | | | | | | | | | | | | | | | | | | | |
Less Distributions: | | | | | | | | | | | | | | | | | | | | |
Distributions from and in excess of net
investment income | | | (0.02 | ) | | | (0.03 | ) | | | (0.05 | ) | | | (0.12 | ) | | | (0.07 | ) |
Distributions from net realized gains
on investments | | | (0.89 | ) | | | (0.31 | ) | | | (0.58 | ) | | | — | | | | — | |
| | | | | | | | | | | | | | | | | | | | |
Total distributions | | | (0.91 | ) | | | (0.34 | ) | | | (0.63 | ) | | | (0.12 | ) | | | (0.07 | ) |
| | | | | | | | | | | | | | | | | | | | |
Net increase (decrease) in net asset value | | | (1.03 | ) | | | 0.29 | | | | 0.08 | | | | 0.93 | | | | (1.76 | ) |
| | | | | | | | | | | | | | | | | | | | |
Net Asset Value, End of Period | | $ | 8.51 | | | $ | 9.54 | | | $ | 9.25 | | | $ | 9.17 | | | $ | 8.24 | |
| | | | | | | | | | | | | | | | | | | | |
Total Return (d) | | | (1.17 | )% | | | 6.86 | % | | | 7.92 | % | | | 12.98 | % | | | (16.98 | )%(e) |
| | | | | |
Ratios/Supplemental Data: | | | | | | | | | | | | | | | | | | | | |
Net Assets, End of Period (in 000’s) | | $ | 23,736 | | | $ | 44,847 | | | $ | 54,234 | | | $ | 39,191 | | | $ | 6,070 | |
Ratios of expenses to average net assets: | | | | | | | | | | | | | | | | | | | | |
Before reimbursement and/or waiver of
expenses by Adviser (f) | | | 1.55 | % | | | 1.58 | % | | | 1.45 | %(h) | | | 1.69 | % | | | 5.11 | %(g)(h) |
After reimbursement and/or waiver of
expenses by Adviser (f) | | | 1.30 | % | | | 1.30 | % | | | 1.30 | %(h) | | | 1.30 | % | | | 1.31 | %(g)(h) |
Ratios of net investment income (loss)
to average net assets: | | | | | | | | | | | | | | | | | | | | |
Before reimbursement and/or waiver of
expenses by Adviser | | | 0.28 | % | | | (0.63 | )% | | | 0.38 | % | | | 0.39 | % | | | (2.48 | )%(g) |
After reimbursement and/or waiver of
expenses by Adviser | | | 0.53 | % | | | (0.35 | )% | | | 0.53 | % | | | 0.78 | % | | | 1.32 | %(g) |
Portfolio Turnover | | | 445.24 | % | | | 387.35 | % | | | 519.43 | % | | | 365.93 | % | | | 498.68 | %(e) |
| | (a) | Dynamic Allocation Fund began issuing Class N shares on January 9, 2008. |
| | (b) | The selected per share data was calculated using the weighted average shares outstanding method for the period. |
| | (c) | Includes payments by affiliates of less than $0.005 per share. |
| | (d) | The total return is calculated using the Net Asset Values used for trading at the close of business at period end. |
| | (f) | Does not include expenses of the underlying funds in which the Fund invests. |
| | (h) | Ratios of expenses to average net assets include interest expenses of less than 0.005% for the year ended October 31, 2010 and 0.01% for the period ended October 31, 2008, which are not included in the contractual expense limitation. The interest expenses are from utilizing the line of credit as discussed in Note H to Financial Statements. |
See accompanying Notes to Financial Statements.
| | |
| |
| ASTON Dynamic Allocation Fund – Class I | | October 31, 2012 |
| |
| Financial Highlights | | |
| | | | | | | | |
| | | Year
Ended
10/31/12 | | | Period
Ended
10/31/11(a) | |
Net Asset Value, Beginning of Period | | $ | 9.55 | | | $ | 9.28 | |
| | | | | | | | |
Income from Investment Operations: | | | | | | | | |
Net investment income (loss) | | | 0.07 | (b) | | | (0.01 | )(b) |
Net realized and unrealized gain (loss) on investments | | | (0.18 | ) | | | 0.64 | |
| | | | | | | | |
Total from investment operations | | | (0.11 | ) | | | 0.63 | |
| | | | | | | | |
Less Distributions: | | | | | | | | |
Distributions from and in excess of net investment income | | | (0.02 | ) | | | (0.05 | ) |
Distributions from net realized gains on investments | | | (0.89 | ) | | | (0.31 | ) |
| | | | | | | | |
Total distributions | | | (0.91 | ) | | | (0.36 | ) |
| | | | | | | | |
Net increase (decrease) in net asset value | | | (1.02 | ) | | | 0.27 | |
| | | | | | | | |
Net Asset Value, End of Period | | $ | 8.53 | | | $ | 9.55 | |
| | | | | | | | |
Total Return (c) | | | (1.01 | )% | | | 6.89 | (d) |
| | |
Ratios/Supplemental Data: | | | | | | | | |
Net Assets, End of Period (in 000’s) | | $ | 5,777 | | | $ | 4,393 | |
Ratios of expenses to average net assets: | | | | | | | | |
Before reimbursement and/or waiver of expenses by Adviser (e) | | | 1.30 | % | | | 1.33 | %(f) |
After reimbursement and/or waiver of expenses by Adviser (e) | | | 1.05 | % | | | 1.05 | %(f) |
Ratios of net investment income (loss) to average net assets: | | | | | | | | |
Before reimbursement and/or waiver of expenses by Adviser | | | 0.53 | % | | | (0.38 | )%(f) |
After reimbursement and/or waiver of expenses by Adviser | | | 0.78 | % | | | (0.10 | )%(f) |
Portfolio Turnover | | | 445.24 | % | | | 387.35 | % |
| | (a) | Dynamic Allocation Fund began issuing Class I shares on November 1, 2010. |
| | (b) | The selected per share data was calculated using the weighted average shares outstanding method for the period. |
| | (c) | The total return is calculated using the Net Asset Values used for trading at the close of business at period end. |
| | (e) | Does not include expenses of the underlying funds in which the Fund invests. |
See accompanying Notes to Financial Statements.
| | |
| |
| ASTON/Anchor Capital Enhanced Equity Fund – Class N (formerly the ASTON/M.D. Sass Enhanced Equity Fund) | | October 31, 2012 |
| |
| Financial Highlights | | |
| | | | | | | | | | | | | | | | | | | | |
| | | Year
Ended
10/31/12 | | | Year
Ended
10/31/11 | | | Year
Ended
10/31/10 | | | Year
Ended
10/31/09 | | | Period
Ended
10/31/08(a) | |
| | | | | | | | | | | | | | | | | | | | |
Net Asset Value, Beginning of Period | | $ | 9.61 | | | $ | 9.41 | | | $ | 8.57 | | | $ | 8.09 | | | $ | 10.00 | |
| | | | | | | | | | | | | | | | | | | | |
Income from Investment Operations: | | | | | | | | | | | | | | | | | | | | |
Net investment income | | | 0.16 | | | | 0.14 | | | | 0.10 | | | | 0.11 | | | | 0.14 | |
Net realized and unrealized gain (loss)
on investments | | | 0.11 | | | | 0.56 | | | | 0.84 | | | | 1.02 | | | | (1.91 | ) |
| | | | | | | | | | | | | | | | | | | | |
Total from investment operations | | | 0.27 | | | | 0.70 | | | | 0.94 | | | | 1.13 | | | | (1.77 | ) |
| | | | | | | | | | | | | | | | | | | | |
Less Distributions: | | | | | | | | | | | | | | | | | | | | |
Distributions from and in excess of net
investment income | | | (0.16 | ) | | | (0.13 | ) | | | (0.10 | ) | | | (0.13 | ) | | | (0.14 | ) |
Distributions from net realized gain
on investments | | | (1.04 | ) | | | (0.37 | ) | | | — | | | | (0.52 | ) | | | — | |
| | | | | | | | | | | | | | | | | | | | |
Total distributions | | | (1.20 | ) | | | (0.50 | ) | | | (0.10 | ) | | | (0.65 | ) | | | (0.14 | ) |
| | | | | | | | | | | | | | | | | | | | |
Net increase (decrease) in net asset value | | | (0.93 | ) | | | 0.20 | | | | 0.84 | | | | 0.48 | | | | (1.91 | ) |
| | | | | | | | | | | | | | | | | | | | |
Net Asset Value, End of Period | | $ | 8.68 | | | $ | 9.61 | | | $ | 9.41 | | | $ | 8.57 | | | $ | 8.09 | |
| | | | | | | | | | | | | | | | | | | | |
Total Return (b) | | | 3.12 | % | | | 7.69 | % | | | 11.05 | % | | | 15.86 | % | | | (17.91 | )%(c) |
| | | | | |
Ratios/Supplemental Data: | | | | | | | | | | | | | | | | | | | | |
Net Assets, End of Period (in 000’s) | | $ | 106,191 | | | $ | 48,365 | | | $ | 46,423 | | | $ | 22,552 | | | $ | 14,389 | |
Ratios of expenses to average net assets: | | | | | | | | | | | | | | | | | | | | |
Before reimbursement, waiver, earnings credit and/or recoupment of expenses by Adviser | | | 1.22 | %(e)(f) | | | 1.24 | %(e) | | | 1.37 | % | | | 2.11 | % | | | 2.38 | %(d) |
After reimbursement, waiver, earnings credit and/or
recoupment of expenses by Adviser | | | 1.27 | %(e)(f) | | | 1.33 | %(e) | | | 1.40 | % | | | 1.25 | %(g) | | | 1.10 | %(d) |
Ratios of net investment income to average net assets: | | | | | | | | | | | | | | | | | | | | |
Before reimbursement, waiver, earnings credit and/or recoupment of expenses by Adviser | | | 1.82 | % | | | 1.51 | % | | | 1.20 | % | | | 0.55 | % | | | 0.86 | %(d) |
After reimbursement, waiver, earnings credit and/or
recoupment of expenses by Adviser | | | 1.78 | % | | | 1.41 | % | | | 1.17 | % | | | 1.41 | % | | | 2.14 | %(d) |
Portfolio Turnover | | | 56.33 | % | | | 87.37 | % | | | 41.33 | % | | | 51.56 | % | | | 23.68 | %(c) |
| | (a) | Anchor Capital Enhanced Equity Fund began issuing Class N shares on January 14, 2008. |
| | (b) | The total return is calculated using the Net Asset Values used for trading at the close of business at period end. |
| | (e) | Ratios of expenses to average net assets include interest expenses of less than 0.005% for each of the years ended October 31, 2012 and October 31, 2011, which are not included in the contractual expense limitation. The interest expenses are from utilizing the line of credit as discussed in Note H to Financial Statements. |
| | (f) | Ratios of expenses to average net assets include Earnings Credits of less than 0.005% for the year ended October 31, 2012, which is not included in the contractual expense limitation. See Note I in the Notes to Financial Statements. |
| | (g) | Effective June 1, 2009, due to the change in Subadviser, the contractual expense limitation was increased from 1.10% to 1.40% excluding interest, taxes, other investment-related costs (such as brokerage commissions), extraordinary expenses and acquired fund fee’s and expenses. |
See accompanying Notes to Financial Statements.
| | |
| |
| ASTON/Anchor Capital Enhanced Equity Fund – Class I (formerly the ASTON/M.D. Sass Enhanced Equity Fund) | | October 31, 2012 |
| |
| Financial Highlights | | |
| | | | | | | | | | | | |
| | | Year
Ended
10/31/12 | | | Year
Ended
10/31/11 | | | Period
Ended
10/31/10(a) | |
Net Asset Value, Beginning of Period | | $ | 9.62 | | | $ | 9.41 | | | $ | 9.04 | |
| | | | | | | | | | | | |
Income from Investment Operations: | | | | | | | | | | | | |
Net investment income | | | 0.18 | | | | 0.16 | | | | 0.09 | |
Net realized and unrealized gain on investments | | | 0.11 | | | | 0.57 | | | | 0.37 | |
| | | | | | | | | | | | |
Total from investment operations | | | 0.29 | | | | 0.73 | | | | 0.46 | |
| | | | | | | | | | | | |
Less Distributions: | | | | | | | | | | | | |
Distributions from and in excess of net investment income | | | (0.18 | ) | | | (0.15 | ) | | | (0.09 | ) |
Distributions from net realized gain on investments | | | (1.04 | ) | | | (0.37 | ) | | | — | |
| | | | | | | | | | | | |
Total distributions | | | (1.22 | ) | | | (0.52 | ) | | | (0.09 | ) |
| | | | | | | | | | | | |
Net increase (decrease) in net asset value | | | (0.93 | ) | | | 0.21 | | | | 0.37 | |
| | | | | | | | | | | | |
Net Asset Value, End of Period | | $ | 8.69 | | | $ | 9.62 | | | $ | 9.41 | |
| | | | | | | | | | | | |
Total Return (b) | | | 3.46 | % | | | 7.97 | % | | | 5.10 | %(c) |
| | | |
Ratios/Supplemental Data: | | | | | | | | | | | | |
Net Assets, End of Period (in 000’s) | | $ | 71,618 | | | $ | 64,840 | | | $ | 46,140 | |
Ratios of expenses to average net assets: | | | | | | | | | | | | |
Before reimbursement, waiver, earnings credit and/or recoupment of expenses by Adviser | | | 0.97 | %(e)(f) | | | 0.99 | %(e) | | | 1.10 | %(d) |
After reimbursement, waiver, earnings credit and/or recoupment of expenses by Adviser | | | 1.02 | %(e)(f) | | | 1.08 | %(e) | | | 1.15 | %(d) |
Ratios of net investment income to average net assets: | | | | | | | | | | | | |
Before reimbursement, waiver, earnings credit and/or recoupment of expenses by Adviser | | | 2.07 | % | | | 1.76 | % | | | 1.37 | %(d) |
After reimbursement, waiver, earnings credit and/or recoupment of expenses by Adviser | | | 2.03 | % | | | 1.66 | % | | | 1.32 | %(d) |
Portfolio Turnover | | | 56.33 | % | | | 87.37 | % | | | 41.33 | % |
| | (a) | Anchor Capital Enhanced Equity Fund began issuing Class I shares on March 2, 2010. |
| | (b) | The total return is calculated using the Net Asset Values used for trading at the close of business at period end. |
| | (e) | Ratios of expenses to average net assets include interest expenses of less than 0.005% for each of the years ended October 31, 2012 and October 31, 2011, which are not included in the contractual expense limitation. The interest expenses are from utilizing the line of credit as discussed in Note H to Financial Statements. |
| | (f) | Ratios of expenses to average net assets include Earnings Credits of less than 0.005% for the year ended October 31, 2012, which is not included in the contractual expense limitation. See Note I in the Notes to Financial Statements. |
See accompanying Notes to Financial Statements.
| | |
| |
| ASTON/River Road Long-Short Fund – Class N | | October 31, 2012 |
| |
| Financial Highlights | | |
| | | | | | | | |
| | | Year
Ended
10/31/12 | | | Period
Ended
10/31/11(a) | |
Net Asset Value, Beginning of Period | | $ | 9.91 | | | $ | 10.00 | |
| | | | | | | | |
Income from Investment Operations: | | | | | | | | |
Net investment loss | | | (0.18 | ) | | | (0.04 | )(b) |
Net realized and unrealized gain (loss) on investments | | | 1.00 | | | | (0.05 | ) |
| | | | | | | | |
Total from investment operations | | | 0.82 | | | | (0.09 | ) |
| | | | | | | | |
Net increase (decrease) in net asset value | | | 0.82 | | | | (0.09 | ) |
| | | | | | | | |
Net Asset Value, End of Period | | $ | 10.73 | | | $ | 9.91 | |
| | | | | | | | |
Total Return (c) | | | 8.17 | % | | | (0.80 | )%(d) |
| | |
Ratios/Supplemental Data: | | | | | | | | |
Net Assets, End of Period (in 000’s) | | $ | 7,506 | | | $ | 4,594 | |
Ratios of expenses to average net assets: | | | | | | | | |
Before reimbursement and/or waiver of expenses by Adviser including interest and
dividend expense for securities sold short | | | 5.03 | % | | | 8.68 | %(e) |
After reimbursement and/or waiver of expenses by Adviser including interest and
dividend expense for securities sold short | | | 3.11 | % | | | 2.72 | %(e) |
After reimbursement and/or waiver of expenses by Adviser excluding interest and
dividend expense for securities sold short | | | 1.70 | % | | | 1.70 | %(e) |
Ratios of net investment loss to average net assets: | | | | | | | | |
Before reimbursement and/or waiver of expenses by Adviser | | | (3.63 | )% | | | (6.80 | )%(e) |
After reimbursement and/or waiver of expenses by Adviser | | | (1.71 | )% | | | (0.84 | )%(e) |
Portfolio Turnover | | | 277.72 | % | | | 127.32 | %(d) |
| | (a) | River Road Long-Short Fund began issuing Class N shares on May 3, 2011. |
| | (b) | The selected per share data was calculated using the weighted average shares outstanding method for the period. |
| | (c) | The total return is calculated using the Net Asset Values used for trading at the close of business at period end. |
See accompanying Notes to Financial Statements.
| | |
| |
| ASTON/Barings International Fund – Class N | | October 31, 2012 |
| |
| Financial Highlights | | |
| | | | | | | | | | | | |
| | | Year
Ended
10/31/12 | | | Year
Ended
10/31/11 | | | Period
Ended
10/31/10(a) | |
Net Asset Value, Beginning of Period | | $ | 6.81 | | | $ | 7.24 | | | $ | 6.48 | |
| | | | | | | | | | | | |
Income from Investment Operations: | | | | | | | | | | | | |
Net investment income | | | 0.10 | (b) | | | 0.07 | (b) | | | 0.06 | (b) |
Net realized and unrealized gain (loss) on investments | | | 0.17 | | | | (0.37 | ) | | | 0.70 | |
| | | | | | | | | | | | |
Total from investment operations | | | 0.27 | | | | (0.30 | ) | | | 0.76 | |
| | | | | | | | | | | | |
Less Distributions: | | | | | | | | | | | | |
Distributions from and in excess of net investment income | | | (0.04 | ) | | | (0.13 | ) | | | — | |
Distributions from net realized gain on investments | | | (0.17 | ) | | | — | | | | — | |
| | | | | | | | | | | | |
Total distributions | | | (0.21 | ) | | | (0.13 | ) | | | — | |
| | | | | | | | | | | | |
Net increase (decrease) in net asset value | | | 0.06 | | | | (0.43 | ) | | | 0.76 | |
| | | | | | | | | | | | |
Net Asset Value, End of Period | | $ | 6.87 | | | $ | 6.81 | | | $ | 7.24 | |
| | | | | | | | | | | | |
Total Return (c) | | | 4.28 | % | | | (4.22 | )% | | | 11.73 | %(d) |
| | | |
Ratios/Supplemental Data: | | | | | | | | | | | | |
Net Assets, End of Period (in 000’s) | | $ | 421 | | | $ | 393 | | | $ | 184 | |
Ratios of expenses to average net assets: | | | | | | | | | | | | |
Before reimbursement and/or waiver of expenses by Adviser | | | 1.60 | % | | | 1.68 | %(f) | | | 1.72 | %(e) |
After reimbursement and/or waiver of expenses by Adviser | | | 1.40 | % | | | 1.40 | %(f) | | | 1.40 | %(e) |
Ratios of net investment income to average net assets: | | | | | | | | | | | | |
Before reimbursement and/or waiver of expenses by Adviser | | | 1.30 | % | | | 0.76 | %(f) | | | 1.07 | %(e) |
After reimbursement and/or waiver of expenses by Adviser | | | 1.50 | % | | | 1.04 | %(f) | | | 1.39 | %(e) |
Portfolio Turnover | | | 33.48 | % | | | 58.96 | % | | | 65.32 | % |
| | (a) | Barings International Fund began issuing Class N shares on March 2, 2010. |
| | (b) | The selected per share data was calculated using the weighted average shares outstanding method for the period. |
| | (c) | The total return is calculated using the Net Asset Values used for trading at the close of business at period end. |
| | (f) | For the period November 1, 2010 through February 28, 2011, the Adviser voluntarily waived management fees and/or reimbursed expenses at 1.40%. Effective March 1, 2011, the contractual expense limitation was decreased from 1.50% to 1.40% excluding interest, taxes, other investment-related costs (such as brokerage commissions), extraordinary expenses and acquired fund fees and expenses. |
See accompanying Notes to Financial Statements.
| | |
| |
| ASTON/Barings International Fund – Class I | | October 31, 2012 |
| |
| Financial Highlights | | |
| | | | | | | | | | | | | | | | | | | | |
| | | Year
Ended
10/31/12 | | | Year
Ended
10/31/11 | | | Year
Ended
10/31/10 | | | Year
Ended
10/31/09 | | | Period
Ended
10/31/08(a) | |
| | | | | | | | | | | | | | | | | | | | |
Net Asset Value, Beginning of Period | | $ | 6.82 | | | $ | 7.26 | | | $ | 6.44 | | | $ | 5.08 | | | $ | 10.00 | |
| | | | | | | | | | | | | | | | | | | | |
Income from Investment Operations: | | | | | | | | | | | | | | | | | | | | |
Net investment income | | | 0.12 | (b) | | | 0.09 | (b) | | | 0.06 | (b) | | | 0.10 | (b) | | | 0.10 | |
Net realized and unrealized gain (loss)
on investments | | | 0.18 | | | | (0.38 | ) | | | 0.78 | | | | 1.27 | (c) | | | (5.02 | ) |
| | | | | | | | | | | | | | | | | | | | |
Total from investment operations | | | 0.30 | | | | (0.29 | ) | | | 0.84 | | | | 1.37 | | | | (4.92 | ) |
| | | | | | | | | | | | | | | | | | | | |
Less Distributions: | | | | | | | | | | | | | | | | | | | | |
Distributions from and in excess of net
investment income | | | (0.06 | ) | | | (0.15 | ) | | | (0.02 | ) | | | (0.01 | ) | | | — | |
Distributions from net realized gain
on investments | | | (0.17 | ) | | | — | | | | — | | | | — | | | | — | |
| | | | | | | | | | | | | | | | | | | | |
Total distributions | | | (0.23 | ) | | | (0.15 | ) | | | (0.02 | ) | | | (0.01 | ) | | | — | |
| | | | | | | | | | | | | | | | | | | | |
Net increase (decrease) in net asset value | | | 0.07 | | | | (0.44 | ) | | | 0.82 | | | | 1.36 | | | | (4.92 | ) |
| | | | | | | | | | | | | | | | | | | | |
Net Asset Value, End of Period | | $ | 6.89 | | | $ | 6.82 | | | $ | 7.26 | | | $ | 6.44 | | | $ | 5.08 | |
| | | | | | | | | | | | | | | | | | | | |
Total Return (d) | | | 4.72 | % | | | (4.09 | )% | | | 12.89 | % | | | 27.11 | % | | | (49.20 | )%(e) |
| | | | | |
Ratios/Supplemental Data: | | | | | | | | | | | | | | | | | | | | |
Net Assets, End of Period (in 000’s) | | $ | 61,662 | | | $ | 52,390 | | | $ | 47,985 | | | $ | 28,277 | | | $ | 5,517 | |
Ratios of expenses to average net assets: | | | | | | | | | | | | | | | | | | | | |
Before reimbursement and/or waiver of
expenses by Adviser | | | 1.35 | % | | | 1.43 | %(g) | | | 1.47 | % | | | 2.01 | % | | | 3.95 | %(f)(h) |
After reimbursement and/or waiver of
expenses by Adviser | | | 1.15 | % | | | 1.15 | %(g) | | | 1.15 | % | | | 1.15 | % | | | 1.18 | %(f)(h) |
Ratios of net investment income (loss)
to average net assets: | | | | | | | | | | | | | | | | | | | | |
Before reimbursement and/or waiver of
expenses by Adviser | | | 1.55 | % | | | 1.01 | % | | | 0.63 | % | | | 0.80 | % | | | (1.11 | )%(f) |
After reimbursement and/or waiver of
expenses by Adviser | | | 1.75 | % | | | 1.29 | % | | | 0.95 | % | | | 1.66 | % | | | 1.66 | %(f) |
Portfolio Turnover | | | 33.48 | % | | | 58.96 | % | | | 65.32 | % | | | 115.51 | % | | | 121.99 | %(e) |
| | (a) | Barings International Fund began issuing Class I shares on November 1, 2007. |
| | (b) | The selected per share data was calculated using the weighted average shares outstanding method for the period. |
| | (c) | Includes payments by affiliates of less than $0.005 per share. |
| | (d) | The total return is calculated using the Net Asset Values used for trading at the close of business at period end. |
| | (g) | For the period November 1, 2010 through February 28, 2011, the Adviser voluntarily waived management fees and/or reimbursed expenses at 1.15%. Effective March 1, 2011, the contractual expense limitation was decreased from 1.25% to 1.15% excluding interest, taxes, other investment-related costs (such as brokerage commissions), extraordinary expenses and acquired fund fees and expenses. |
| | (h) | Ratios of expenses to average net assets include interest expense of less than 0.01% for the period ended October 31, 2008, which is not included in the contractual or voluntary expense limitations. The interest expense is from utilizing the line of credit as discussed in Note H to Financial Statements. |
See accompanying Notes to Financial Statements.
| | |
| |
| ASTON/Harrison Street Real Estate Fund – Class N | | October 31, 2012 |
| |
| Financial Highlights | | |
| | | | | | | | | | | | | | | | | | | | |
| | | Year
Ended
10/31/12 | | | Year
Ended
10/31/11 | | | Year
Ended
10/31/10 | | | Year
Ended
10/31/09 | | | Year
Ended
10/31/08 | |
| | | | | | | | | | | | | | | | | | | | |
Net Asset Value, Beginning of Period | | $ | 8.97 | | | $ | 8.16 | | | $ | 5.77 | | | $ | 6.08 | | | $ | 15.59 | |
| | | | | | | | | | | | | | | | | | | | |
Income from Investment Operations: | | | | | | | | | | | | | | | | | | | | |
Net investment income | | | 0.15 | (a) | | | 0.15 | (a) | | | 0.14 | (a) | | | 0.15 | (a) | | | 0.07 | (a) |
Net realized and unrealized gain (loss)
on investments | | | 1.44 | | | | 0.79 | | | | 2.36 | | | | (0.28 | ) | | | (5.50 | ) |
| | | | | | | | | | | | | | | | | | | | |
Total from investment operations | | | 1.59 | | | | 0.94 | | | | 2.50 | | | | (0.13 | ) | | | (5.43 | ) |
| | | | | | | | | | | | | | | | | | | | |
Less Distributions: | | | | | | | | | | | | | | | | | | | | |
Distributions from and in excess of net
investment income | | | (0.07 | ) | | | (0.13 | ) | | | (0.11 | ) | | | (0.18 | ) | | | (0.09 | ) |
Distributions from net realized gain
on investments | | | — | | | | — | | | | — | | | | — | | | | (3.99 | ) |
| | | | | | | | | | | | | | | | | | | | |
Total distributions | | | (0.07 | ) | | | (0.13 | ) | | | (0.11 | ) | | | (0.18 | ) | | | (4.08 | ) |
| | | | | | | | | | | | | | | | | | | | |
Net increase (decrease) in net asset value . | | | 1.52 | | | | 0.81 | | | | 2.39 | | | | (0.31 | ) | | | (9.51 | ) |
| | | | | | | | | | | | | | | | | | | | |
Net Asset Value, End of Period | | $ | 10.49 | | | $ | 8.97 | | | $ | 8.16 | | | $ | 5.77 | | | $ | 6.08 | |
| | | | | | | | | | | | | | | | | | | | |
Total Return (b) | | | 17.85 | % | | | 11.66 | % | | | 43.77 | % | | | (1.44 | )% | | | (43.76 | )% |
| | | | | |
Ratios/Supplemental Data: | | | | | | | | | | | | | | | | | | | | |
Net Assets, End of Period (in 000’s) | | $ | 10,381 | | | $ | 6,287 | | | $ | 6,158 | | | $ | 4,011 | | | $ | 6,030 | |
Ratios of expenses to average net assets: | | | | | | | | | | | | | | | | | | | | |
Before reimbursement and/or waiver of
expenses by Adviser | | | 2.36 | % | | | 1.61 | %(c) | | | 1.68 | %(c) | | | 1.94 | % | | | 1.57 | %(c) |
After reimbursement and/or waiver of
expenses by Adviser | | | 1.37 | % | | | 1.29 | %(c) | | | 1.37 | %(c) | | | 1.37 | % | | | 1.37 | %(c) |
Ratios of net investment income to average
net assets: | | | | | | | | | | | | | | | | | | | | |
Before reimbursement and/or waiver of
expenses by Adviser | | | 0.53 | % | | | 1.36 | % | | | 1.65 | % | | | 2.55 | % | | | 0.49 | % |
After reimbursement and/or waiver of
expenses by Adviser | | | 1.52 | % | | | 1.68 | % | | | 1.96 | % | | | 3.12 | % | | | 0.69 | % |
Portfolio Turnover | | | 86.62 | %(d) | | | 143.86 | % | | | 75.30 | % | | | 139.76 | % | | | 85.08 | % |
| | (a) | The selected per share data was calculated using the weighted average shares outstanding method for the period. |
| | (b) | The total return is calculated using the Net Asset Values used for trading at the close of business at period end. |
| | (c) | Ratios of expenses to average net assets include interest expenses of less than 0.005% for each of the years ended October 31, 2011, October 31, 2010 and October 31, 2008, which are not included in the contractual expense limitation. The interest expenses are from utilizing the line of credit as discussed in Note H to Financial Statements. |
| | (d) | Portfolio turnover rate excludes securities delivered from processing a redemption-in-kind. |
See accompanying Notes to Financial Statements.
| | |
| |
| ASTON/Harrison Street Real Estate Fund – Class I | | October 31, 2012 |
| |
| Financial Highlights | | |
| | | | | | | | | | | | | | | | | | | | |
| | | Year
Ended
10/31/12 | | | Year
Ended
10/31/11 | | | Year
Ended
10/31/10 | | | Year
Ended
10/31/09 | | | Year
Ended
10/31/08 | |
| | | | | | | | | | | | | | | | | | | | |
Net Asset Value, Beginning of Period | | $ | 8.92 | | | $ | 8.12 | | | $ | 5.74 | | | $ | 6.08 | | | $ | 15.62 | |
| | | | | | | | | | | | | | | | | | | | |
Income from Investment Operations: | | | | | | | | | | | | | | | | | | | | |
Net investment income | | | 0.15 | (a) | | | 0.16 | (a) | | | 0.16 | (a) | | | 0.16 | (a) | | | 0.09 | (a) |
Net realized and unrealized gain (loss)
on investments | | | 1.46 | | | | 0.79 | | | | 2.34 | | | | (0.28 | ) | | | (5.51 | ) |
| | | | | | | | | | | | | | | | | | | | |
Total from investment operations | | | 1.61 | | | | 0.95 | | | | 2.50 | | | | (0.12 | ) | | | (5.42 | ) |
| | | | | | | | | | | | | | | | | | | | |
Less Distributions: | | | | | | | | | | | | | | | | | | | | |
Distributions from and in excess of net
investment income | | | (0.09 | ) | | | (0.15 | ) | | | (0.12 | ) | | | (0.22 | ) | | | (0.13 | ) |
Distributions from net realized gain
on investments | | | — | | | | — | | | | — | | | | — | | | | (3.99 | ) |
| | | | | | | | | | | | | | | | | | | | |
Total distributions | | | (0.09 | ) | | | (0.15 | ) | | | (0.12 | ) | | | (0.22 | ) | | | (4.12 | ) |
| | | | | | | | | | | | | | | | | | | | |
Net increase (decrease) in net asset value . | | | 1.52 | | | | 0.80 | | | | 2.38 | | | | (0.34 | ) | | | (9.54 | ) |
| | | | | | | | | | | | | | | | | | | | |
Net Asset Value, End of Period | | $ | 10.44 | | | $ | 8.92 | | | $ | 8.12 | | | $ | 5.74 | | | $ | 6.08 | |
| | | | | | | | | | | | | | | | | | | | |
Total Return (b) | | | 18.16 | % | | | 11.82 | % | | | 44.14 | % | | | (1.27 | )% | | | (43.58 | )% |
| | | | | |
Ratios/Supplemental Data: | | | | | | | | | | | | | | | | | | | | |
Net Assets, End of Period (in 000’s) | | $ | 166 | | | $ | 32,925 | | | $ | 29,425 | | | $ | 21,905 | | | $ | 23,411 | |
Ratios of expenses to average net assets: | | | | | | | | | | | | | | | | | | | | |
Before reimbursement and/or waiver of
expenses by Adviser | | | 2.11 | % | | | 1.44 | %(c) | | | 1.43 | %(c) | | | 1.69 | % | | | 1.32 | %(c) |
After reimbursement and/or waiver of
expenses by Adviser | | | 1.12 | % | | | 1.12 | %(c) | | | 1.12 | %(c) | | | 1.12 | % | | | 1.12 | %(c) |
Ratios of net investment income to average net assets: | | | | | | | | | | | | | | | | | | | | |
Before reimbursement and/or waiver of
expenses by Adviser | | | 0.78 | % | | | 1.53 | % | | | 1.90 | % | | | 2.80 | % | | | 0.74 | % |
After reimbursement and/or waiver of
expenses by Adviser | | | 1.77 | % | | | 1.85 | % | | | 2.21 | % | | | 3.37 | % | | | 0.94 | % |
Portfolio Turnover | | | 86.62 | %(d) | | | 143.86 | % | | | 75.30 | % | | | 139.76 | % | | | 85.08 | % |
| | (a) | The selected per share data was calculated using the weighted average shares outstanding method for the period. |
| | (b) | The total return is calculated using the Net Asset Values used for trading at the close of business at period end. |
| | (c) | Ratios of expenses to average net assets include interest expenses of less than 0.005% for each of the years ended October 31, 2011, October 31, 2010 and October 31, 2008, which are not included in the contractual expense limitation. The interest expenses are from utilizing the line of credit as discussed in Note H to Financial Statements. |
| | (d) | Portfolio turnover rate excludes securities delivered from processing a redemption-in-kind. |
See accompanying Notes to Financial Statements.
| | |
| |
| ASTON/Montag & Caldwell Balanced Fund – Class N | | October 31, 2012 |
| |
| Financial Highlights | | |
| | | | | | | | | | | | | | | | | | | | |
| | | Year
Ended
10/31/12 | | | Year
Ended
10/31/11 | | | Year
Ended
10/31/10 | | | Year
Ended
10/31/09 | | | Year
Ended
10/31/08 | |
| | | | | | | | | | | | | | | | | | | | |
Net Asset Value, Beginning of Period | | $ | 20.09 | | | $ | 19.13 | | | $ | 17.73 | | | $ | 15.61 | | | $ | 19.98 | |
| | | | | | | | | | | | | | | | | | | | |
Income from Investment Operations: | | | | | | | | | | | | | | | | | | | | |
Net investment income | | | 0.16 | (a) | | | 0.15 | (a) | | | 0.21 | (a) | | | 0.21 | (a) | | | 0.29 | |
Net realized and unrealized gain (loss)
on investments | | | 1.45 | | | | 1.03 | | | | 1.47 | | | | 2.15 | | | | (4.42 | ) |
| | | | | | | | | | | | | | | | | | | | |
Total from investment operations | | | 1.61 | | | | 1.18 | | | | 1.68 | | | | 2.36 | | | | (4.13 | ) |
| | | | | | | | | | | | | | | | | | | | |
Less Distributions: | | | | | | | | | | | | | | | | | | | | |
Distributions from and in excess of net
investment income | | | (0.24 | ) | | | (0.22 | ) | | | (0.28 | ) | | | (0.24 | ) | | | (0.24 | ) |
| | | | | | | | | | | | | | | | | | | | |
Total distributions | | | (0.24 | ) | | | (0.22 | ) | | | (0.28 | ) | | | (0.24 | ) | | | (0.24 | ) |
| | | | | | | | | | | | | | | | | | | | |
Net increase (decrease) in net asset value. | | | 1.37 | | | | 0.96 | | | | 1.40 | | | | 2.12 | | | | (4.37 | ) |
| | | | | | | | | | | | | | | | | | | | |
Net Asset Value, End of Period | | $ | 21.46 | | | $ | 20.09 | | | $ | 19.13 | | | $ | 17.73 | | | $ | 15.61 | |
| | | | | | | | | | | | | | | | | | | | |
Total Return (b) | | | 8.03 | % | | | 6.20 | % | | | 9.54 | % | | | 15.32 | % | | | (20.87 | )% |
| | | | | |
Ratios/Supplemental Data: | | | | | | | | | | | | | | | | | | | | |
Net Assets, End of Period (in 000’s) | | $ | 31,536 | | | $ | 23,315 | | | $ | 29,194 | | | $ | 14,938 | | | $ | 16,586 | |
Ratios of expenses to average net assets: | | | | | | | | | | | | | | | | | | | | |
Before reimbursement and/or waiver of
expenses by Adviser | | | 1.42 | % | | | 1.57 | %(c) | | | 1.38 | % | | | 1.73 | % | | | 1.74 | % |
After reimbursement and/or waiver of
expenses by Adviser | | | 1.22 | % | | | 1.35 | %(c) | | | 1.13 | % | | | 1.26 | % | | | 1.35 | % |
Ratios of net investment income to average net assets: | | | | | | | | | | | | | | | | | | | | |
Before reimbursement and/or waiver of
expenses by Adviser | | | 0.57 | % | | | 0.53 | % | | | 0.89 | % | | | 0.81 | % | | | 0.74 | % |
After reimbursement and/or waiver of
expenses by Adviser | | | 0.77 | % | | | 0.76 | % | | | 1.15 | % | | | 1.28 | % | | | 1.13 | % |
Portfolio Turnover | | | 35.48 | % | | | 40.31 | % | | | 51.68 | %(d) | | | 38.72 | % | | | 43.65 | % |
| (a) | The selected per share data was calculated using the weighed average shares outstanding method for the period. |
| (b) | The total return is calculated using the Net Asset Values used for trading at the close of business at period end. |
| (c) | Ratios of expenses to average net assets include interest expenses of less than 0.005% for the year ended October 31, 2011, which is not included in the voluntary expense limitation. The interest expenses are from utilizing the line of credit as discussed in Note H to Financial Statements. |
| (d) | Portfolio turnover rate excludes securities received from a reorganization. |
See accompanying Notes to Financial Statements.
| | |
| |
| ASTON/Montag & Caldwell Balanced Fund – Class I | | October 31, 2012 |
| |
| Financial Highlights | | |
| | | | | | | | | | | | | | | | | | | | |
| | | Year
Ended
10/31/12 | | | Year
Ended
10/31/11 | | | Year
Ended
10/31/10 | | | Year
Ended
10/31/09 | | | Year
Ended
10/31/08 | |
| | | | | | | | | | | | | | | | | | | | |
Net Asset Value, Beginning of Period | | $ | 20.05 | | | $ | 19.08 | | | $ | 17.68 | | | $ | 15.57 | | | $ | 19.94 | |
| | | | | | | | | | | | | | | | | | | | |
Income from Investment Operations: | | | | | | | | | | | | | | | | | | | | |
Net investment income | | | 0.19 | (a) | | | 0.20 | (a) | | | 0.22 | (a) | | | 0.23 | (a) | | | 0.27 | |
Net realized and unrealized gain (loss)
on investments | | | 1.44 | | | | 1.04 | | | | 1.46 | | | | 2.16 | | | | (4.35 | ) |
| | | | | | | | | | | | | | | | | | | | |
Total from investment operations | | | 1.63 | | | | 1.24 | | | | 1.68 | | | | 2.39 | | | | (4.08 | ) |
| | | | | | | | | | | | | | | | | | | | |
Less Distributions: | | | | | | | | | | | | | | | | | | | | |
Distributions from and in excess of net
investment income | | | (0.27 | ) | | | (0.27 | ) | | | (0.28 | ) | | | (0.28 | ) | | | (0.29 | ) |
| | | | | | | | | | | | | | | | | | | | |
Total distributions | | | (0.27 | ) | | | (0.27 | ) | | | (0.28 | ) | | | (0.28 | ) | | | (0.29 | ) |
| | | | | | | | | | | | | | | | | | | | |
Net increase (decrease) in net asset value . | | | 1.36 | | | | 0.97 | | | | 1.40 | | | | 2.11 | | | | (4.37 | ) |
| | | | | | | | | | | | | | | | | | | | |
Net Asset Value, End of Period | | $ | 21.41 | | | $ | 20.05 | | | $ | 19.08 | | | $ | 17.68 | | | $ | 15.57 | |
| | | | | | | | | | | | | | | | | | | | |
Total Return (b) | | | 8.14 | % | | | 6.52 | % | | | 9.57 | % | | | 15.53 | % | | | (20.71 | )% |
| | | | | |
Ratios/Supplemental Data: | | | | | | | | | | | | | | | | | | | | |
Net Assets, End of Period (in 000’s) | | $ | 1,930 | | | $ | 1,415 | | | $ | 1,362 | | | $ | 1,149 | | | $ | 919 | |
Ratios of expenses to average net assets: | | | | | | | | | | | | | | | | | | | | |
Before reimbursement and/or waiver of
expenses by Adviser | | | 1.30 | % | | | 1.32 | %(c) | | | 1.35 | % | | | 1.57 | % | | | 1.49 | % |
After reimbursement and/or waiver of
expenses by Adviser | | | 1.10 | % | | | 1.10 | %(c) | | | 1.10 | % | | | 1.10 | % | | | 1.10 | % |
Ratios of net investment income to average net assets: | | | | | | | | | | | | | | | | | | | | |
Before reimbursement and/or waiver of
expenses by Adviser | | | 0.69 | % | | | 0.79 | % | | | 0.92 | % | | | 0.97 | % | | | 0.99 | % |
After reimbursement and/or waiver of
expenses by Adviser | | | 0.89 | % | | | 1.02 | % | | | 1.17 | % | | | 1.44 | % | | | 1.38 | % |
Portfolio Turnover | | | 35.48 | % | | | 40.31 | % | | | 51.68 | %(d) | | | 38.72 | % | | | 43.65 | % |
| (a) | The selected per share data was calculated using the weighted average shares outstanding method for the period. |
| (b) | The total return is calculated using the Net Asset Values used for trading at the close of business at period end. |
| (c) | Ratios of expenses to average net assets include interest expenses of less than 0.01% for the year ended October 31, 2011, which is not included in the voluntary expense limitation. The interest expenses are from utilizing the line of credit as discussed in Note H to Financial Statements. |
| (d) | Portfolio turnover rate includes securities received from a reorganization. |
See accompanying Notes to Financial Statements.
| | |
| |
| | October 31, 2012 |
| |
| Notes to Financial Statements | | |
Note (A) Fund Organization: Aston Funds (the “Trust”) was organized as a Delaware statutory trust under a Declaration of Trust dated September 10, 1993. The Trust is registered under the Investment Company Act of 1940, as amended (the “1940 Act”) as an open-end management investment company with 25 separate portfolios (each a “Fund” and collectively the “Funds”) as of October 31, 2012.
Aston Asset Management, LP (“Aston” or the “Adviser”), the investment adviser and the administrator, manages each Fund by retaining one or more subadvisers (each, a “Subadviser”) to manage each Fund. The following 25 portfolios of the Trust are included in these financial statements:
|
| ASTON/Montag & Caldwell Growth Fund (the “M&C Growth Fund”) |
| ASTON/Veredus Select Growth Fund (the “Veredus Select Growth Fund”) |
ASTON/TAMRO Diversified Equity Fund (the “TAMRO Diversified Equity Fund”) |
ASTON/Herndon Large Cap Value Fund
(the “Herndon Large Cap Value Fund”) |
ASTON/Cornerstone Large Cap Value Fund
(the “Cornerstone Large Cap Value Fund”) |
ASTON/River Road Dividend All Cap Value Fund
(the “River Road Dividend All Cap Value Fund”) |
ASTON/River Road Dividend All Cap Value Fund II
(the “River Road Dividend All Cap Value Fund II”) |
| ASTON/Fairpointe Mid Cap Fund (the “Fairpointe Mid Cap Fund”) |
ASTON/Montag & Caldwell Mid Cap Growth Fund
(the “M&C Mid Cap Growth Fund”) |
| ASTON/Veredus Small Cap Growth Fund, formerly the ASTON/Veredus Aggressive Growth Fund (the “Veredus Small Cap Growth Fund”) |
| ASTON Small Cap Growth Fund, formerly the ASTON/Crosswind Small Cap Growth Fund (the “Small Cap Growth Fund”) |
| ASTON/Silvercrest Small Cap Fund (the “Silvercrest Small Cap Fund”) |
| ASTON/TAMRO Small Cap Fund (the “TAMRO Small Cap Fund”) |
ASTON/River Road Select Value Fund
(the “River Road Select Value Fund”) |
ASTON/River Road Small Cap Value Fund
(the “River Road Small Cap Value Fund”) |
ASTON/River Road Independent Value Fund
(the “River Road Independent Value Fund”) |
ASTON/DoubleLine Core Plus Fixed Income Fund
(the “DoubleLine Core Plus Fixed Income Fund”) |
| ASTON/TCH Fixed Income Fund (the “TCH Fixed Income Fund”) |
ASTON/Lake Partners LASSO Alternatives Fund
(the “Lake Partners LASSO Alternatives Fund”) |
| ASTON Dynamic Allocation Fund (the “Dynamic Allocation Fund”) |
| ASTON/Anchor Capital Enhanced Equity Fund, formerly the ASTON/M.D. Sass Enhanced Equity Fund (the “Anchor Capital Enhanced Equity Fund”) |
| ASTON/River Road Long-Short Fund (the “River Road Long-Short Fund”) |
| ASTON/Barings International Fund (the “Barings International Fund”) |
|
ASTON/Harrison Street Real Estate Fund (the “Harrison Street Real Estate Fund”) |
| ASTON/Montag & Caldwell Balanced Fund (the “M&C Balanced Fund”) |
M&C Growth Fund is authorized to issue three classes of shares (Class N Shares, Class I Shares and Class R Shares). The following funds are each authorized to issue two classes of shares (Class N Shares and Class I Shares): Veredus Select Growth Fund, TAMRO Diversified Equity Fund, Herndon Large Cap Value Fund, Cornerstone Large Cap Value Fund, River Road Dividend All Cap Value Fund, River Road Dividend All Cap Value Fund II, Fairpointe Mid Cap Fund, Veredus Small Cap Growth Fund, Small Cap Growth Fund, Silvercrest Small Cap Fund, TAMRO Small Cap Fund, River Road Select Value Fund, River Road Small Cap Value Fund, River Road Independent Value Fund, DoubleLine Core Plus Fixed Income Fund, TCH Fixed Income Fund, Lake Partners LASSO Alternatives Fund, Dynamic Allocation Fund, Anchor Capital Enhanced Equity Fund, Barings International Fund, Harrison Street Real Estate Fund and M&C Balanced Fund. The following Funds are each authorized to issue one class of shares (Class N Shares): M&C Mid Cap Growth Fund and River Road Long-Short Fund. Each class of shares is substantially the same except that certain classes of shares bear class specific expenses, which include distribution fees. TAMRO Small Cap Fund and River Road Dividend All Cap Value Fund are closed to new investors until further notice.
The investment objectives of the Funds are as follows:
| | |
M&C Growth Fund | | Long-term capital appreciation and, secondarily, current income, by investing primarily in common stocks and convertible securities. |
Veredus Select
Growth Fund | | Capital appreciation. |
TAMRO Diversified Equity Fund | | Long-term capital appreciation. |
Herndon Large
Cap Value Fund | | Long-term capital appreciation. |
Cornerstone Large
Cap Value Fund | | Total return through long-term capital appreciation and current income. |
River Road Dividend All Cap Value Fund | | High current income and, secondarily, long-term capital appreciation. |
River Road Dividend All Cap Value Fund II | | Long-term capital appreciation and high current income. |
Fairpointe Mid
Cap Fund | | Long-term total return through capital apprecia- tion by investing primarily in common and pre- ferred stocks and convertible securities. |
M&C Mid Cap
Growth Fund | | Long-term capital appreciation and secondarily, current income, by investing primarily in common stocks and convertible securities. |
Veredus Small Cap Growth Fund | | Capital appreciation. |
Small Cap Growth
Fund | | Long-term capital appreciation. |
| | |
| |
| | October 31, 2012 |
| |
| Notes to Financial Statements – continued | | |
| | |
Silvercrest Small Cap Fund | | Long-term capital appreciation. |
TAMRO Small Cap Fund | | Long-term capital appreciation. |
River Road Select Value Fund | | Long-term capital appreciation. |
River Road Small Cap Value Fund | | Long-term capital appreciation. |
River Road Independent Value Fund | | Long-term total return. |
DoubleLine Core Plus Fixed Income Fund | | Maximize total return. |
TCH Fixed Income Fund | | High current income consistent with prudent risk of capital. |
Lake Partners LASSO Alternatives Fund | | Long term total return with reduced correlation to the conventional stock and bond markets. |
Dynamic Allocation Fund | | Long-term capital appreciation. |
Anchor Capital Enhanced Equity Fund | | Total return through a combination of a high level of current income and capital appreciation. |
River Road Long- Short Fund | | Absolute return while minimizing volatility over a fund market cycle |
Barings International Fund | | Total return. |
Harrison Street Real Estate Fund | | Total return through a combination of growth and income. |
M&C Balanced Fund | | Long-term total return. |
Note (B) Significant Accounting Policies: The following is a summary of the significant accounting policies consistently followed by each Fund in the preparation of its financial statements. These policies are in conformity with U.S. generally accepted accounting principles (“U.S. GAAP”).
(1) Security Valuation: Equity securities, closed-end funds, exchange traded funds, index options traded on a national securities exchange, and over-the-counter securities listed on the NASDAQ National Market System are valued at the last sale price or the NASDAQ Official Closing Price (“NOCP”), if applicable. If no last sale price or NOCP, if applicable, is reported, the mean of the last bid and asked prices may be used. Fixed income securities, except short-term investments, are valued on the basis of mean prices provided by a pricing service when such prices are believed by the Adviser to reflect the current market value of such securities in accordance with guidelines adopted by the Board of Trustees. The pricing service provider may employ methodologies that utilize actual market transac- tions, broker-dealer supplied valuations, or other electronic data processing techniques. Such techniques generally consider such factors as security prices, yields, maturities, call features, ratings and developments relating to specific securities in arriving at valuations. If accurate market quotations are not available, securities are valued at fair value as determined by the Adviser
in accordance with guidelines adopted by the Board of Trustees. Short-term investments, that is, those with maturities of 60 days or less, are valued at amortized cost, which approximates fair value. Repurchase agreements are valued at cost. Investments in money market funds and other mutual funds are valued at the underlying fund’s net asset value (“NAV”) at the date of valuation. Foreign securities are valued at the last sales price on the primary exchange where the security is traded. Under the Fair Valuation Procedures adopted by the Board of Trustees, the Funds may utilize the services of an independent pricing service to determine fair value prices for foreign securities if certain market events occur.
Certain Funds invest in securities of other investment companies, including exchange traded funds (“ETFs”), open-end funds and closed-end funds. Open-end funds are investment companies that issue new shares continuously and redeem shares daily. Closed-end funds are investment companies that typically issue a fixed number of shares that trade on a securities exchange or over-the-counter. An ETF is an investment company that seeks to track the performance of an index by holding in its portfolio shares of all the companies, or a representative sample of the companies, that are components of a particular index. ETFs are traded on a securities exchange based on their market value. The risks of investment in other investment companies typically reflect the risks of the types of securities in which investment companies invest. Investments in ETFs and closed-end funds are subject to the additional risk that shares of the fund may trade at a premium or discount to their NAV per share. When a Fund invests in another investment company, shareholders of the Fund bear their proportionate share of the other investment company’s fees and expenses, including operating, registration, trustee, licensing and marketing, as well as their share of the Fund’s fees and expenses.
Fair Value Measurements - The inputs and valuation techniques used to measure fair value of the Funds’ net assets are summarized into three levels as described in the hierarchy below:
| | |
•Level 1 – | | unadjusted quoted prices in active markets for identical assets or liabilities |
•Level 2 – | | other significant observable inputs (including quoted prices for similar securities, interest rates, prepayment speeds, credit risk, etc.) |
•Level 3 – | | significant unobservable inputs (including the Funds’ own assumptions in determining the fair value of investments) |
| | |
| |
| | October 31, 2012 |
| |
| Notes to Financial Statements – continued | | |
The inputs or methodology used for valuing securities are not necessarily an indication of the risk associated with investing in those securities. Transfers in and out of the levels are recognized at the market value at the end of the period. The summary of each Fund’s investments that are measured at fair value by Level within the fair value hierarchy as of October 31, 2012 is as follows:
| | | | | | | | | | | | | | | | |
Funds | | Total
Value at
10/31/12 | | | Level 1
Quoted
Prices | | | Level 2
Significant
Observable
Inputs | | | Level 3
Significant
Unobservable
Inputs | |
| | | | | | | | | | | | | | | | |
| M&C Growth Fund | | | | | | | | | | | | | | | | |
| Assets | | | | | | | | | | | | | | | | |
Investments in Securities* | | $ | 4,323,166,924 | | | $ | 4,323,166,924 | | | $ | — | | | $ | — | |
| | | | | | | | | | | | | | | | |
| Veredus Select Growth Fund | | | | | | | | | | | | | | | | |
| Assets | | | | | | | | | | | | | | | | |
Investments in Securities* | | $ | 12,312,897 | | | $ | 12,312,897 | | | $ | — | | | $ | — | |
| | | | | | | | | | | | | | | | |
| TAMRO Diversified Equity Fund | | | | | | | | | | | | | | | | |
| Assets | | | | | | | | | | | | | | | | |
Investments in Securities* | | $ | 22,471,746 | | | $ | 22,471,746 | | | $ | — | | | $ | — | |
| | | | | | | | | | | | | | | | |
| Herndon Large Cap Value Fund | | | | | | | | | | | | | | | | |
| Assets | | | | | | | | | | | | | | | | |
Investments in Securities* | | $ | 55,717,532 | | | $ | 55,717,532 | | | $ | — | | | $ | — | |
| | | | | | | | | | | | | | | | |
| Cornerstone Large Cap Value Fund | | | | | | | | | | | | | | | | |
| Assets | | | | | | | | | | | | | | | | |
Investments in Securities* | | $ | 26,148,348 | | | $ | 26,148,348 | | | $ | — | | | $ | — | |
| | | | | | | | | | | | | | | | |
| River Road Dividend All Cap Value Fund | | | | | | | | | | | | | | | | |
| Assets | | | | | | | | | | | | | | | | |
Investments in Securities* | | $ | 922,557,397 | | | $ | 922,557,397 | | | $ | — | | | $ | — | |
| | | | | | | | | | | | | | | | |
| River Road Dividend All Cap Value Fund II | | | | | | | | | | | | | | | | |
| Assets | | | | | | | | | | | | | | | | |
Investments in Securities* | | $ | 10,294,315 | | | $ | 10,294,315 | | | $ | — | | | $ | — | |
| | | | | | | | | | | | | | | | |
| Fairpointe Mid Cap Fund | | | | | | | | | | | | | | | | |
| Assets | | | | | | | | | | | | | | | | |
Investments in Securities* | | $ | 3,020,741,041 | | | $ | 3,020,741,041 | | | $ | — | | | $ | — | |
| | | | | | | | | | | | | | | | |
| M&C Mid Cap Growth Fund | | | | | | | | | | | | | | | | |
| Assets | | | | | | | | | | | | | | | | |
Investments in Securities* | | $ | 7,390,080 | | | $ | 7,390,080 | | | $ | — | | | $ | — | |
| | | | | | | | | | | | | | | | |
| Veredus Small Cap Growth Fund | | | | | | | | | | | | | | | | |
| Assets | | | | | | | | | | | | | | | | |
Investment in Securities* | | $ | 24,652,246 | | | $ | 24,652,246 | | | $ | — | | | $ | — | |
| | | | | | | | | | | | | | | | |
| Small Cap Growth Fund | | | | | | | | | | | | | | | | |
| Assets | | | | | | | | | | | | | | | | |
Investment in Securities* | | $ | 6,619,173 | | | $ | 6,619,173 | | | $ | — | | | $ | — | |
| | | | | | | | | | | | | | | | |
| Silvercrest Small Cap Fund | | | | | | | | | | | | | | | | |
| Assets | | | | | | | | | | | | | | | | |
Investments in Securities* | | $ | 5,727,334 | | | $ | 5,727,334 | | | $ | — | | | $ | — | |
| | | | | | | | | | | | | | | | |
| TAMRO Small Cap Fund | | | | | | | | | | | | | | | | |
| Assets | | | | | | | | | | | | | | | | |
Common Stocks | | | | | | | | | | | | | | | | |
Consumer Discretionary | | $ | 207,590,101 | | | $ | 188,505,618 | | | $ | 19,084,483 | | | $ | — | |
Consumer Staples | | | 75,005,501 | | | | 75,005,501 | | | | — | | | | — | |
Energy | | | 69,410,875 | | | | 69,410,875 | | | | — | | | | — | |
Financials | | | 216,795,922 | | | | 216,795,922 | | | | — | | | | — | |
Healthcare | | | 127,823,974 | | | | 127,823,974 | | | | — | | | | — | |
Industrials | | | 183,737,861 | | | | 183,737,861 | | | | — | | | | — | |
Information Technology | | | 116,606,824 | | | | 116,606,824 | | | | — | | | | — | |
Utilities | | | 20,350,593 | | | | 20,350,593 | | | | — | | | | — | |
| | | | | | | | | | | | | | | | |
Total Common Stocks | | | 1,017,321,651 | | | | 998,237,168 | | | | 19,084,483 | | | | — | |
| | | | | | | | | | | | | | | | |
Investment Company* | | | 17,606,619 | | | | 17,606,619 | | | | — | | | | — | |
| | | | | | | | | | | | | | | | |
Total | | $ | 1,034,928,270 | | | $ | 1,015,843,787 | | | $ | 19,084,483 | | | $ | — | |
| | | | | | | | | | | | | | | | |
| River Road Select Value Fund | | | | | | | | | | | | | | | | |
| Assets | | | | | | | | | | | | | | | | |
Investments in Securities* | | $ | 163,494,292 | | | $ | 163,494,292 | | | $ | — | | | $ | — | |
| | | | | | | | | | | | | | | | |
| | |
| |
| | October 31, 2012 |
| |
| Notes to Financial Statements – continued | | |
| | | | | | | | | | | | | | | | |
Funds | | Total
Value at
10/31/12 | | | Level 1
Quoted
Prices | | | Level 2
Significant
Observable
Inputs | | | Level 3
Significant
Unobservable
Inputs | |
| | | | | | | | | | | | | | | | |
| River Road Small Cap Value Fund | | | | | | | | | | | | | | | | |
| Assets | | | | | | | | | | | | | | | | |
Common Stocks | | | | | | | | | | | | | | | | |
Consumer Discretionary | | $ | 67,143,208 | | | $ | 60,178,841 | | | $ | 6,964,367 | | | $ | — | |
Consumer Staples | | | 26,093,493 | | | | 26,093,493 | | | | — | | | | — | |
Energy | | | 15,060,021 | | | | 15,060,021 | | | | — | | | | — | |
Financials | | | 39,040,491 | | | | 39,040,491 | | | | — | | | | — | |
Healthcare | | | 31,349,757 | | | | 31,349,757 | | | | — | | | | — | |
Industrials | | | 49,479,216 | | | | 49,479,216 | | | | — | | | | — | |
Information Technology | | | 35,560,986 | | | | 35,560,986 | | | | — | | | | — | |
Materials | | | 3,896,015 | | | | 3,896,015 | | | | — | | | | — | |
Telecommunication Services | | | 2,625,638 | | | | 2,625,638 | | | | — | | | | — | |
Utilities | | | 2,263,143 | | | | 2,263,143 | | | | — | | | | — | |
| | | | | | | | | | | | | | | | |
Total Common Stocks | | | 272,511,968 | | | | 265,547,601 | | | | 6,964,367 | | | | — | |
| | | | | | | | | | | | | | | | |
Investment Company* | | | 16,823,092 | | | | 16,823,092 | | | | — | | | | — | |
| | | | | | | | | | | | | | | | |
Total | | $ | 289,335,060 | | | $ | 282,370,693 | | | $ | 6,964,367 | | | $ | — | |
| | | | | | | | | | | | | | | | |
| River Road Independent Value Fund | | | | | | | | | | | | | | | | |
| Assets | | | | | | | | | | | | | | | | |
Common Stocks | | | | | | | | | | | | | | | | |
Consumer Discretionary | | $ | 43,039,137 | | | $ | 43,039,137 | | | $ | — | | | $ | — | |
Consumer Staples | | | 34,231,684 | | | | 34,231,684 | | | | — | | | | — | |
Energy | | | 57,671,322 | | | | 57,671,322 | | | | — | | | | — | |
Financials | | | 19,624,862 | | | | 19,624,862 | | | | — | | | | — | |
Healthcare | | | 42,782,079 | | | | 42,782,079 | | | | — | | | | — | |
Industrials | | | 32,574,037 | | | | 32,574,037 | | | | — | | | | — | |
Information Technology | | | 72,965,203 | | | | 66,965,504 | | | | 5,999,699 | | | | — | |
Materials | | | 25,318,216 | | | | 25,318,216 | | | | — | | | | — | |
Utilities | | | 15,808,676 | | | | 10,018,716 | | | | 5,789,960 | | | | — | |
| | | | | | | | | | | | | | | | |
Total | | $ | 344,015,216 | | | $ | 332,225,557 | | | $ | 11,789,659 | | | $ | — | |
| | | | | | | | | | | | | | | | |
| DoubleLine Core Plus Fixed Income Fund | | | | | | | | | | | | | | | | |
| Assets | | | | | | | | | | | | | | | | |
U.S. Agency Collateralized Mortgage Obligations | | $ | 22,011,734 | | | $ | — | | | $ | 22,011,734 | | | $ | — | |
U.S. Government Obligations | | | 32,154,989 | | | | — | | | | 32,154,989 | | | | — | |
U.S. Government Mortgage-Backed Securities | | | 13,254,235 | | | | — | | | | 13,254,235 | | | | — | |
Corporate Notes and Bonds | | | 57,783,941 | | | | — | | | | 57,783,941 | | | | — | |
Collateralized Mortgage-Backed Securities | | | 39,301,483 | | | | — | | | | 39,301,483 | | | | — | |
Asset-Backed Securities | | | 1,705,540 | | | | — | | | | 1,705,540 | | | | — | |
Foreign Government Bond | | | 4,749,002 | | | | — | | | | 4,749,002 | | | | — | |
Investment Company* | | | 3,970,786 | | | | 3,970,786 | | | | — | | | | — | |
| | | | | | | | | | | | | | | | |
Total | | $ | 174,931,710 | | | $ | 3,970,786 | | | $ | 170,960,924 | | | $ | — | |
| | | | | | | | | | | | | | | | |
| TCH Fixed Income Fund | | | | | | | | | | | | | | | | |
| Assets | | | | | | | | | | | | | | | | |
Corporate Notes and Bonds | | $ | 45,354,984 | | | $ | — | | | $ | 45,354,984 | | | $ | — | |
U.S. Government and Agency Obligations | | | 19,634,170 | | | | — | | | | 19,634,170 | | | | — | |
Commercial Mortgage-Backed Securities | | | 600,649 | | | | — | | | | 600,649 | | | | — | |
Asset-Backed Securities | | | 1,878,188 | | | | — | | | | 1,878,188 | | | | — | |
Foreign Government Bond | | | 793,620 | | | | — | | | | 793,620 | | | | — | |
Investment Company* | | | 1,121,862 | | | | 1,121,862 | | | | — | | | | — | |
| | | | | | | | | | | | | | | | |
Total | | $ | 69,383,473 | | | $ | 1,121,862 | | | $ | 68,261,611 | | | $ | — | |
| | | | | | | | | | | | | | | | |
| Lake Partners LASSO Alternatives Fund | | | | | | | | | | | | | | | | |
| Assets | | | | | | | | | | | | | | | | |
Investments in Securities* | | $ | 273,862,784 | | | $ | 273,862,784 | | | $ | — | | | $ | — | |
| | | | | | | | | | | | | | | | |
| Dynamic Allocation Fund | | | | | | | | | | | | | | | | |
| Assets | | | | | | | | | | | | | | | | |
Investments in Securities* | | $ | 29,764,845 | | | $ | 29,764,845 | | | $ | — | | | $ | — | |
| | | | | | | | | | | | | | | | |
| | |
| |
| | October 31, 2012 |
| |
| Notes to Financial Statements – continued | | |
| | | | | | | | | | | | | | | | |
Funds | | Total
Value at
10/31/12 | | | Level 1
Quoted
Prices | | | Level 2
Significant
Observable
Inputs | | | Level 3
Significant
Unobservable
Inputs | |
| Anchor Capital Enhanced Equity Fund | | | | | | | | | | | | | | | | |
| Assets | | | | | | | | | | | | | | | | |
Common Stocks* | | $ | 178,432,465 | | | $ | 178,432,465 | | | $ | — | | | $ | — | |
Derivatives | | | | | | | | | | | | | | | | |
Equity Contracts | | | 1,484,700 | | | | 1,484,700 | | | | — | | | | — | |
| | | | | | | | | | | | | | | | |
Total Assets | | | 179,917,165 | | | | 179,917,165 | | | | — | | | | — | |
| | | | | | | | | | | | | | | | |
| Liabilities | | | | | | | | | | | | | | | | |
Derivatives | | | | | | | | | | | | | | | | |
Equity Contracts | | | (5,821,315 | ) | | | (5,821,315 | ) | | | — | | | | — | |
| | | | | | | | | | | | | | | | |
Total Liabilities | | | (5,821,315 | ) | | | (5,821,315 | ) | | | — | | | | — | |
| | | | | | | | | | | | | | | | |
Total | | $ | 174,095,850 | | | $ | 174,095,850 | | | $ | — | | | $ | — | |
| | | | | | | | | | | | | | | | |
| | | | | | | | | | | | | | | | |
| River Road Long-Short Fund | | | | | | | | | | | | | | | | |
| Assets | | | | | | | | | | | | | | | | |
Investments in Securities* | | $ | 7,611,084 | | | $ | 7,611,084 | | | $ | — | | | $ | — | |
| | | | | | | | | | | | | | | | |
Total Assets | | | 7,611,084 | | | | 7,611,084 | | | | — | | | | — | |
| | | | | | | | | | | | | | | | |
| Liabilities | | | | | | | | | | | | | | | | |
Short Sales* | | | (1,458,611 | ) | | | (1,458,611 | ) | | | — | | | | — | |
| | | | | | | | | | | | | | | | |
Total Liabilities | | | (1,458,611 | ) | | | (1,458,611 | ) | | | — | | | | — | |
| | | | | | | | | | | | | | | | |
Total | | $ | 6,152,473 | | | $ | 6,152,473 | | | $ | — | | | $ | — | |
| | | | | | | | | | | | | | | | |
| Barings International Fund | | | | | | | | | | | | | | | | |
| Assets | | | | | | | | | | | | | | | | |
Common Stocks | | | | | | | | | | | | | | | | |
Australia | | $ | 908,234 | | | $ | 908,234 | | | $ | — | | | $ | — | |
Belgium | | | 1,123,273 | | | | 1,123,273 | | | | — | | | | — | |
China | | | 788,988 | | | | 788,988 | | | | — | | | | — | |
Denmark | | | 825,594 | | | | 825,594 | | | | — | | | | — | |
France | | | 3,901,387 | | | | 3,901,387 | | | | — | | | | — | |
Germany | | | 5,112,525 | | | | 5,112,525 | | | | — | | | | — | |
Hong Kong | | | 626,512 | | | | 626,512 | | | | — | | | | — | |
India | | | 244,644 | | | | 244,644 | | | | — | | | | — | |
Israel | | | 1,764,703 | | | | 1,764,703 | | | | — | | | | — | |
Japan | | | 12,661,108 | | | | 12,661,108 | | | | — | | | | — | |
Mexico | | | 2,170,043 | | | | 2,170,043 | | | | — | | | | — | |
Netherlands | | | 2,109,381 | | | | 2,109,381 | | | | — | | | | — | |
Norway | | | 627,179 | | | | 627,179 | | | | — | | | | — | |
Papua New Guinea | | | 800,078 | | | | 800,078 | | | | — | | | | — | |
Russia | | | 676,022 | | | | 676,022 | | | | — | | | | — | |
Singapore | | | 1,903,724 | | | | 1,903,724 | | | | — | | | | — | |
South Korea | | | 2,152,706 | | | | 2,152,706 | | | | — | | | | — | |
Sweden | | | 1,797,898 | | | | 1,797,898 | | | | — | | | | — | |
Switzerland | | | 5,068,000 | | | | 5,068,000 | | | | — | | | | — | |
United Kingdom | | | 15,062,078 | | | | 15,055,029 | | | | — | | | | 7,049 | |
| | | | | | | | | | | | | | | | |
Total Common Stocks | | | 60,324,077 | | | | 60,317,028 | | | | — | | | | 7,049 | |
| | | | | | | | | | | | | | | | |
Investment Company* | | | 1,653,984 | | | | 1,653,984 | | | | — | | | | — | |
| | | | | | | | | | | | | | | | |
Total | | $ | 61,978,061 | | | $ | 61,971,012 | | | $ | — | | | $ | 7,049 | |
| | | | | | | | | | | | | | | | |
| Harrison Street Real Estate Fund | | | | | | | | | | | | | | | | |
| Assets | | | | | | | | | | | | | | | | |
Investments in Securities* | | $ | 10,640,915 | | | $ | 10,640,915 | | | $ | — | | | $ | — | |
| | | | | | | | | | | | | | | | |
| M&C Balanced Fund | | | | | | | | | | | | | | | | |
| Assets | | | | | | | | | | | | | | | | |
Common Stocks* | | $ | 18,302,592 | | | $ | 18,302,592 | | | $ | — | | | $ | — | |
Corporate Notes and Bonds | | | 7,759,409 | | | | — | | | | 7,759,409 | | | | — | |
U.S. Government and Agency Obligations | | | 5,127,104 | | | | — | | | | 5,127,104 | | | | — | |
Investment Company* | | | 2,139,288 | | | | 2,139,288 | | | | — | | | | — | |
| | | | | | | | | | | | | | | | |
Total | | $ | 33,328,393 | | | $ | 20,441,880 | | | $ | 12,886,513 | | | $ | — | |
| | | | | | | | | | | | | | | | |
| * | | All Common Stocks and Investment Companies are Level 1. Please refer to the Schedule of Investments for industry, sector or country breakout. |
| | |
| |
| | October 31, 2012 |
| |
| Notes to Financial Statements – continued | | |
At the end of each calendar quarter, management evaluates the Level 2 and 3 assets and liabilities for changes in liquidity, including but not limited to: whether a broker is willing to execute at the quoted price, the depth and consistency of prices from third party services, and the existence of contemporaneous, observable trades in the market. Additionally, management evaluates the Level 1 and 2 assets and liabilities on a quarterly basis for changes in listings or delistings on national exchanges. Due to the inherent uncertainty of determining the fair value of investments that do not have a readily available market value, the fair value of the Funds’ investments may fluctuate from period to period. Additionally, the fair value of investments may differ significantly from the values that would have been used had a ready market existed for such investments and may differ materially from the values the Funds may ultimately realize. Further, such investments may be subject to legal and other restrictions on resale or otherwise less liquid than publicly-traded securities.
Barings International Fund may utilize an external pricing service to fair value certain foreign securities if certain market events occur. Such fair valuations are categorized as Level 2 in the hierarchy. Certain market events were not deemed to have occurred at October 31, 2012, and therefore, the Barings International Fund did not utilize the external pricing service model adjustments. As a result, certain securities that were held in this Fund at October 31, 2012 and since the beginning of the year, were transferred from Level 2 to Level 1.
Certain securities that were held at October 31, 2012 and since the beginning of the year in the TAMRO Small Cap Fund, the River Road Small Cap Value Fund and the River Road Independent Value Fund had changes in liquidity assessments which resulted in a transfer between levels.
| | | | | | | | |
Funds | | Transfer from
Level 1 to Level 2 | | | Transfer from
Level 2 to Level 1 | |
| TAMRO Small Cap Fund | | $ | 19,084,483 | | | $ | — | |
| River Road Small Cap Value Fund | | | 1,471,594 | | | | 9,560,119 | |
| River Road Independent Value Fund | | | — | | | | 3,638,499 | |
| Barings International Fund | | | — | | | | 41,365,365 | |
Level 3 holdings were valued using internal valuation techniques which took into consideration factors including previous experience with similar securities of the same issuer, conversion ratio and security terms.
The following is a reconciliation of Level 3 holdings for which significant unobservable inputs were used in determining fair value as of October 31, 2012:
| | | | |
| Barings International Fund | | | Common Stocks | |
| | | | |
Fair Value, beginning of period | | $ | 9,447 | |
Purchases | | | 7,002 | |
Sales | | | (9,094 | ) |
Net realized gains | | | 3,219 | |
Change in unrealized appreciation (depreciation) | | | (3,525 | ) |
| | | | |
Fair Value, end of period | | $ | 7,049 | |
| | | | |
Change in net unrealized appreciation (depreciation)
on Level 3 holdings held at end of period | | $ | 47 | |
| | | | |
(2) Repurchase Agreements: Each Fund may enter into repurchase agreements with financial institutions deemed to be creditworthy by the Fund’s Adviser or Subadviser, subject to the seller’s agreement to repurchase and the Fund’s agreement to resell such securities at a mutually agreed upon price. Securities purchased subject to repurchase agreements are deposited with the Fund’s custodian and, pursuant to the terms of the repurchase agreement, must have an aggregate market value greater than or equal to the repurchase price plus accrued interest at all times. If the value of the underlying securities falls below the value of the repurchase price plus accrued interest, the Fund will require the seller to deposit additional collateral by the next business day. If the request for additional collateral is not met, or the seller defaults on its repurchase obligation, the Fund has the right to sell the underlying securities at market value and may claim any resulting loss against the seller. As of and during the year ended October 31, 2012, the Funds did not own any repurchase agreements.
(3) When Issued/Delayed Delivery Securities: Each Fund may purchase and sell securities on a “when issued” or “delayed delivery” basis, with settlement to occur at a later date. The value of the security so purchased is subject to market fluctuations during this period. The Funds segregate assets having an aggregate value at least equal to the amount of when issued or delayed delivery purchase commitments until payment is made. During the year ended October 31, 2012, the DoubleLine Core Plus Fixed Income Fund and the TCH Fixed Income Fund owned delayed delivery securities. At October 31, 2012, only the DoubleLine Core Plus Fixed Income Fund owned delayed delivery securities.
(4) Mortgage-Backed Securities: M&C Balanced Fund, DoubleLine Core Plus Fixed Income Fund and TCH Fixed Income Fund may invest in mortgage-backed securities (“MBS”), representing interests in pools of mortgage loans. These securities provide shareholders with payments consisting of both principal and interest as the mortgages in the underlying mortgage pools are paid. The timely payment of principal and interest on MBS issued or guaranteed by Ginnie Mae (formerly known as the Government National Mortgage Association) is backed by Ginnie Mae and the full faith and credit of the U.S. government. MBS issued by U.S. government agencies or instrumentalities other than Ginnie Mae are not “full faith and credit” obligations. Certain obligations, such as those issued by the Federal Home Loan Banks, Fannie Mae (formerly known as the Federal National Mortgage Association) and Freddie Mac (formerly known as the Federal Home Loan Mortgage Corporation) are supported only by the credit of the issuer. MBS issued by private issuers are not
| | |
| |
| | October 31, 2012 |
| |
| Notes to Financial Statements – continued | | |
government securities and are not directly guaranteed by any government agency. They are secured by the underlying collateral of the private issuer. Yields on privately issued MBS tend to be higher than those of government-backed issues. However, risk of loss due to default and sensitivity to interest rate fluctuations are also higher. M&C Balanced Fund, DoubleLine Core Plus Fixed Income Fund and TCH Fixed Income Fund may also invest in collateralized mortgage obligations (“CMOs”) and real estate mortgage investment conduits (“REMICs”). A CMO is a bond that is collateralized by a pool of MBS, and a REMIC is similar in form to a CMO. These MBS pools are divided into classes with each class having its own characteristics. The different classes are retired in sequence as the underlying mortgages are repaid.
(5) Securities Sold Short: The River Road Long-Short Fund utilizes short sales as part of its overall portfolio management strategy. A short sale involves the sale of a security that is borrowed from a broker or other institution. A gain, limited to the price at which the Fund sold the security short, or a loss, unlimited in size, will be recognized upon closing a short sale. Short sales expose the Fund to the risk that it will be required to acquire, convert or exchange securities to replace the borrowed securities at a time when the securities sold short have appreciated in value, thus resulting in a loss to the Fund. The Fund making a short sale must segregate liquid assets, or otherwise cover its position in a permissible manner. The liquidity of the assets is determined by the Subadviser, in accordance with procedures established by the Board of Trustees. Cash segregated for short sales is shown in the Statement of Assets and Liabilities as cash held as collateral. Security positions segregated for short sales are included in the total investments line item on the Statement of Assets and Liabilities.
(6) Options Contracts: In the normal course of pursuing its investment objectives, certain Funds are subject to price volatility risk. Certain Funds may write and/or purchase call and put options on securities for hedging purposes, to seek capital appreciation, to mitigate risk and/or to increase exposure. Writing put options or purchasing call options tends to increase a Fund’s exposure to the underlying instrument. Writing call options or purchasing put options tends to decrease a Fund’s exposure to the underlying instrument. When a Fund writes or purchases a call or put option, an amount equal to the premium received or paid by the Fund is included in a Fund’s Statement of Assets and Liabilities as a liability or an investment and subsequently adjusted to the current market value based on the quoted daily settlement price of the option written or purchased. Premiums received or paid from writing or purchasing options, which expire unexercised, are treated by a Fund on the expiration date as realized gains or losses. The difference between the premium and the amount paid or received on a closing purchase or sale transaction, including brokerage commissions, is also treated as a realized gain or loss. If an option is exercised, the premium paid or received is added to the cost of the purchase or proceeds from the sale in determining whether the Fund has realized a gain or loss on investment transactions. If the Fund writes a covered call option, the Fund forgoes, in exchange for the premium, the opportunity to profit during the option period
from an increase in the market value of the underlying security above the exercise price. If the Fund writes a put option, it accepts the risk of a decline in the market value of the underlying security below the exercise price. There is the risk a Fund may not be able to enter into a closing transaction because of an illiquid market. The risk associated with purchasing put and call options is limited to the premium paid. Options were traded during the period in the TAMRO Diversified Equity Fund and Anchor Capital Enhanced Equity Fund. At October 31, 2012, TAMRO Diversified Equity did not hold any open options contracts. See the Schedule of Investments for open options contracts held by Anchor Capital Enhanced Equity Fund at October 31, 2012. For the year ended October 31, 2012, the average* volume of derivative activities are as follows:
| | | | | | | | |
Funds | | Purchased
Options
(Cost) | | | Written
Options
(Premiums Received) | |
| TAMRO Diversified Equity Fund | | $ | 120,858 | | | $ | — | |
| Anchor Capital Enhanced Equity Fund | | | 1,722,579 | | | | 3,283,110 | |
| * | estimate based on quarter-end holdings |
(7) Forward Foreign Currency Contracts: In the normal course of pursuing their investment objectives, certain Funds are subject to foreign investment and currency risk. Certain Funds may enter into forward foreign currency contracts (“forward contracts”) for purposes of hedging, duration management, as a substitute for securities, to increase returns, for currency hedging or risk management, or to otherwise help achieve a Fund’s investment goal. These contracts are marked-to-market daily at the applicable translation rates. A Fund records realized gains or losses at the time the forward contract is closed. A forward contract is extinguished through a closing transaction or upon delivery of the currency or entering an offsetting contract. Risks may arise upon entering these contracts from the potential inability of a counterparty to meet the terms of their contracts and from unanticipated movements in the value of a foreign currency relative to the U.S. dollar or other currencies. During the year ended October 31, 2012, the Funds did not enter into any forward foreign currency contracts.
(8) Disclosures about Derivative Instruments: The following is a table summarizing the fair value of derivatives held at October 31, 2012, by primary risk exposure:
| | | | | | | | |
| | | Asset Derivative
Investments Value | | | Liability Derivative
Investments Value | |
Fund | | Equity
Contracts (a) | | | Equity
Contracts(a) | |
| | | | | | | | |
| Anchor Capital Enhanced Equity Fund | | $ | 1,484,700 | | | $ | (5,821,315 | ) |
| (a) | Statement of Assets and Liabilities location: Total investments at value for purchased options and call options written, at value for written options. |
| | |
| |
| | October 31, 2012 |
| |
| Notes to Financial Statements – continued | | |
The effect of derivative instruments on the Statement of Operations for the year ended October 31, 2012:
| | | | | | | | |
| | | Amount of
Realized Gain (Loss)
on Derivatives | | | Change in Unrealized
Appreciation
(Depreciation)
on Derivatives | |
Fund | | Equity
Contracts(a) | | | Equity
Contracts(b) | |
| TAMRO Diversified Equity Fund | | $ | (204,029 | ) | | $ | 149,516 | |
| Anchor Capital Enhanced Equity Fund | | | (3,441,738 | ) | | | (1,752,435 | ) |
| (a) | Statement of Operations location: Net realized gain (loss) on purchased options and net realized gain (loss) on written option transactions. |
| (b) | Statement of Operations location: Net change in unrealized appreciation (depreciation) on pur- chased options and net change in unrealized appreciation (depreciation) on written options transactions. |
(9) Investment Income and Securities Transactions: Dividend income is recorded on the ex-dividend date, except for certain dividends from foreign securities where the ex-dividend date may have passed, which are recorded as soon as a Fund is informed of the ex-dividend date. Interest income is accrued daily. Dividend income and interest income are recorded on the Statement of Operations as investment income. Premiums and discounts are amortized or accreted on an effective yield method on fixed income securities. The Funds may be subject to foreign taxes on income, gains on investments or currency repatriation, a portion of which may be recoverable. The Funds will accrue such taxes and reclaims as applicable, based upon their current interpretation of tax rules and regulations that exist in the markets in which the Funds invest. Securities are accounted for on a
trade date basis. The cost of securities sold is determined using the identified cost method for the Fairpointe Mid Cap Fund and first in first out (“FIFO”) method for all other Funds.
(10) Foreign Currency: Foreign currencies, investments and other assets and liabilities are translated into U.S. dollars at the exchange rates at the close of the regular trading session on the New York Stock Exchange. Fluctuations in the value of the foreign currencies and other assets and liabilities resulting from changes in exchange rates are recorded as unrealized foreign currency gains (losses). Realized gains (losses) and unrealized appreciation (depreciation) on investment securities and income and expenses are translated on the respective dates of such transactions. The effects of changes in foreign currency exchange rates on investments in securities are segregated on the Statement of Operations from the effects of changes on market prices of those securities, and are included with the net realized and change in unrealized gain or loss on investment securities.
(11) Federal Income Taxes: The Funds have elected to be treated as “regulated investment companies” under Subchapter M of the Internal Revenue Code of 1986, as amended, and to distribute substantially all of their respective net taxable income. Accordingly, no provisions for federal income taxes have been made in the accompanying financial statements. The Funds intend to utilize provisions of the federal income tax laws, which allow them to carry a realized capital loss forward for eight years following the year of the loss and offset such losses against any future realized capital gains.
At October 31, 2012, the following Funds had available realized capital loss carryforwards to offset future net capital gains through the fiscal year ended:
| | | | | | | | | | | | | | | | | | | | | | | | | | | | | | | | |
| | | Capital Loss Carryforwards: | |
Fund | | 2014 | | | 2016 | | | 2017 | | | 2018 | | | 2019 | | | No Expiration
Short Term* | | | No Expiration
Long Term* | | | Total | |
| | | | | | | | | | | | | | | | | | | | | | | | | | | | | | | | |
| M&C Growth Fund | | $ | — | | | $ | — | | | $ | 12,098,064 | ** | | $ | — | | | $ | — | | | $ | — | | | $ | — | | | $ | 12,098,064 | |
| Veredus Select Growth Fund | | | — | | | | — | | | | 17,856,176 | | | | — | | | | — | | | | — | | | | — | | | | 17,856,176 | |
| Cornerstone Large Cap Value Fund | | | — | | | | — | | | | 21,265,288 | | | | 6,819,813 | | | | — | | | | — | | | | — | | | | 28,085,101 | |
| Veredus Small Cap Growth Fund | | | — | | | | 2,506,635 | | | | 16,347,889 | | | | — | | | | — | | | | — | | | | — | | | | 18,854,524 | |
| TCH Fixed Income Fund | | | 2,331,750 | | | | 2,654,917 | | | | 1,270,780 | | | | — | | | | — | | | | — | | | | — | | | | 6,257,447 | |
| Lake Partners LASSO Alternatives Fund | | | — | | | | — | | | | — | | | | — | | | | 4,140,503 | | | | 729,638 | | | | — | | | | 4,870,141 | |
| Dynamic Allocation Fund | | | — | | | | — | | | | — | | | | — | | | | — | | | | 749,106 | | | | — | | | | 749,106 | |
| Harrison Street Real Estate Fund | | | — | | | | 1,949,371 | | | | 11,228,100 | | | | — | | | | — | | | | — | | | | — | | | | 13,177,471 | |
| M&C Balanced Fund | | | — | | | | — | | | | 1,726,376 | ** | | | — | | | | — | | | | — | | | | — | | | | 1,726,376 | |
| * | On December 22, 2010, the Regulated Investment Company Modernization Act of 2010 (the “Modernization Act”) was signed into law. Under the Modernization Act the Funds will be permitted to carry forward capital losses incurred for an unlimited period. However, any losses incurred during those future taxable years will be required to be utilized prior to the losses incurred in pre-enactment taxable years. As a result of this ordering rule, pre-enactment capital loss carryforwards may be more likely to expire unused. Additionally, post enactment capital losses that are carried forward will retain their character as either short-term or long-term capital losses rather than being considered all short term as under previous law. |
| ** | These capital loss carryforward amounts were acquired in the reorganizations of the Growth Fund into the M&C Growth Fund and the Balanced Fund into the M&C Balanced Fund on March 29, 2010. The Funds’ ability to utilize the capital loss carryforwards is limited under Internal Revenue Service regulations. |
| | |
| |
| | October 31, 2012 |
| |
| Notes to Financial Statements – continued | | |
For the year ended October 31, 2012, the following Funds utilized capital losses as follows:
| | | | | | | | | | | | | | | | | | | | |
| | | Utilized Capital Losses (with Expiration Year) | |
Fund | | 2014 | | | 2016 | | | 2017 | | | 2018 | | | 2019 | |
| | | | | | | | | | | | | | | | | | | | |
| M&C Growth Fund | | $ | — | | | $ | — | | | $ | 3,189,231 | | | $ | — | | | $ | — | |
| Veredus Select Growth Fund | | | — | | | | 1,093,781 | | | | 766,189 | | | | — | | | | — | |
| Cornerstone Large Cap Value Fund | | | — | | | | — | | | | 1,198,312 | | | | — | | | | — | |
| M&C Mid Cap Growth Fund | | | — | | | | — | | | | 327,840 | | | | — | | | | — | |
| Veredus Small Cap Growth Fund | | | — | | | | 1,721,390 | | | | — | | | | — | | | | — | |
| Small Cap Growth Fund | | | — | | | | — | | | | — | | | | — | | | | 59,470 | |
| River Road Small Cap Value Fund | | | — | | | | — | | | | 11,636,083 | | | | — | | | | — | |
| TCH Fixed Income Fund | | | 1,367,065 | | | | — | | | | — | | | | — | | | | — | |
| River Road Long-Short Fund | | | — | | | | — | | | | — | | | | — | | | | 100,223 | |
| Harrison Street Real Estate Fund | | | — | | | | 1,146,586 | | | | — | | | | — | | | | — | |
| M&C Balanced Fund | | | — | | | | 318,991 | | | | 1,000,496 | | | | — | | | | — | |
Under current laws, certain capital losses realized after October 31 may be deferred (and certain ordinary losses after January 1st may be deferred) and treated as occurring on the first day of the following fiscal year. For the fiscal year ended October 31, 2012, the Funds elected to defer the following losses incurred from January 1, 2012 through October 31, 2012:
| | | | | | | | | | | | |
| | | Long-Term
Realized
Capital Losses | | | Short-Term
Realized
Capital Losses | | | Ordinary
Losses | |
| | | | | | | | | | | | |
| M&C Mid Cap Growth Fund | | $ | — | | | $ | — | | | $ | 37,681 | |
| Veredus Small Cap Growth Fund | | | — | | | | — | | | | 167,640 | |
Management has analyzed the Funds’ tax positions for all open tax years (current and prior three tax years), as well as potential exposure to foreign capital gains withholding taxes, and has concluded that no provision for federal, state, or international income tax is required in the Funds’ financial statements. The Funds’ federal income and excise tax returns for tax years for which the applicable statutes of limitations have not expired are subject to examination by the Internal Revenue Service.
(12) Multi-Class Operations: Each class offered by a Fund that is authorized to offer multiple classes of shares has equal rights as to the Fund’s net assets.
Income, fund and trust level expenses and realized and unrealized capital gains and losses, if any, are allocated to each class of shares based on the relative net assets of each class. Class specific expenses (distribution expenses) are allocated to each class.
(13) Offering Costs: Certain costs were incurred in connection with the offering of the following Funds as disclosed in the table below. The costs associated have been capitalized and are being amortized on a straight-line basis over twelve months based on the commencement date of the Funds, stated below.
| | | | | | | | |
Fund | | Commencement Date | | | Original
Offering Costs | |
| River Road Independent Value Fund | | | December 30, 2010 | | | $ | 53,931 | |
| River Road Long-Short Fund | | | May 4, 2011 | | | | 70,782 | |
| DoubleLine Core Plus Fixed Income Fund | | | July 18, 2011 | | | | 246,370 | |
| Silvercrest Small Cap Fund | | | December 27, 2011 | | | | 63,821 | |
| River Road Dividend All Cap Value Fund II | | | June 27, 2012 | | | | 57,711 | |
(14) Use of Estimates: The preparation of financial statements in conformity with U.S. GAAP requires management to make estimates and assumptions that affect the reported amounts of assets and liabilities and disclosure of contingent assets and liabilities at the date of the financial statements and the reported amounts of revenues and expenses during the reporting period. Actual results could differ from those estimates.
(15) Commitments and Contingencies: In the normal course of business, the Trust enters into contracts on behalf of the Funds that contain a variety of provisions for general indemnifications. Each Fund’s maximum exposure under these arrangements is unknown, as this would involve future claims that may be made against each Fund that are not known at this time. However, based on experience, the Funds believe the risk of loss is remote.
(16) Recent Accounting Pronouncement: In December 2011, FASB issued ASU No. 2011-11, Disclosures about Offsetting Assets and Liabilities. ASU 2011-11 requires disclosures to make financial statements that are prepared under U.S. GAAP more comparable to those prepared under IFRS. The new disclosure requirements mandate that entities disclose both gross and net information about instruments and transactions eligible for offset in the Statement of Assets and Liabilities as well as instruments and transactions subject to an agreement similar to a master netting arrangement. In addition, ASU 2011-11 requires disclosure of collateral received and posted in connection with master netting agreements or similar arrangements. New disclosures are required for annual reporting periods beginning on or after January 1, 2013, and interim periods within those annual periods. Management is evaluating the impact of ASU 2011-11 on the financial statements and disclosures.
Note (C) Dividends from Net Investment Income and Distributions of Capital Gains: Dividends and distributions to shareholders are recorded on the ex-dividend date. River Road Dividend All Cap Value Fund, River Road Dividend All Cap Value Fund II, DoubleLine Core Plus Fixed Income Fund and TCH Fixed Income Fund distribute dividends from net investment income to shareholders monthly and net realized gains from investment transactions, if any, are generally distributed annually, usually in December.
| | |
| |
| | October 31, 2012 |
| |
| Notes to Financial Statements – continued | | |
Anchor Capital Enhanced Equity Fund and M&C Balanced Fund distribute dividends from net investment income to shareholders quarterly and net realized gains from investment transactions, if any, are generally distributed annually, usually in December.
The following Funds distribute dividends from net investment income to shareholders annually and net realized gains from investment transactions, if any, are generally distributed annually, usually in December: M&C Growth Fund, Veredus Select Growth Fund, TAMRO Diversified Equity Fund, Herndon Large Cap Value Fund, Cornerstone Large Cap Value Fund, Fairpointe Mid Cap Fund, M&C Mid Cap Growth Fund, Veredus Small Cap Growth Fund, Small Cap Growth Fund, Silvercrest Small Cap Fund, TAMRO Small Cap Fund, River Road Select Value Fund, River Road Small Cap Value Fund, River Road Independent Value Fund, Lake Partners LASSO Alternatives Fund, Dynamic Allocation Fund, River Road Long-Short Fund, Barings International Fund and Harrison Street Real Estate Fund.
Dividends and distributions are automatically reinvested in additional Fund shares on ex-date at that day’s ending NAV for the respective Fund for those shareholders who have elected the reinvestment option.
Differences in dividends per share between classes of the following Funds are due to different class expenses: M&C Growth Fund, Veredus Select Growth Fund, TAMRO Diversified Equity Fund, Herndon Large Cap Value Fund, Cornerstone Large Cap Value Fund, River Road Dividend All Cap Value Fund, River
Road Dividend All Cap Value Fund II, Fairpointe Mid Cap Fund, Veredus Small Cap Growth Fund, Small Cap Growth Fund, Silvercrest Small Cap Fund, TAMRO Small Cap Fund, River Road Select Value Fund, River Road Small Cap Value Fund, River Road Independent Value Fund, DoubleLine Core Plus Fixed Income Fund, TCH Fixed Income Fund, Lake Partners LASSO Alternatives Fund, Dynamic Allocation Fund, Anchor Capital Enhanced Equity Fund, Barings International Fund, Harrison Street Real Estate Fund and M&C Balanced Fund.
Net investment income and realized gains and losses for federal income tax purposes may differ from those reported on the financial statements because of temporary and permanent book and tax basis differences. Permanent differences, such as net operating losses, disallowed expenses, premium reversals, reclass of short-term gain to ordinary income, capitalized dividends on short sales, in-kind distribution for redemptions, paydown reclass, reversal of prior year writeoff of capital loss carryovers, redesignation of dividends paid, partnership reclasses and adjustment for Real Estate Investment Trusts, are reclassified among capital accounts in the financial statements to reflect their character. Temporary differences, such as deferrals on losses relating to wash sales transactions, amortization of offering costs, premium amortization, current year dividends payable, passive foreign investment company adjustments and capital loss carryovers, arise when income, expenses, gains or losses are recognized in different periods for financial statement and tax purposes; these differences will reverse at some time in the future.
Permanent differences between book and tax basis reporting for the 2012 fiscal year have been identified and appropriately reclassified as indicated below. These reclassifications have no impact on net assets.
| | | | | | | | | | | | |
| | | Accumulated
Undistributed Net
Investment Income | | | Accumulated Net
Realized Gain (Loss) | | | Paid in Capital | |
| | | | | | | | | | | | |
| | | | | | | | | | | | |
| Herndon Large Cap Value Fund | | $ | (38 | ) | | $ | 38 | | | $ | — | |
| Cornerstone Large Cap Value Fund | | | — | | | | (49,006 | ) | | | 49,006 | |
| River Road Dividend All Cap Value Fund | | | (25,898 | ) | | | 25,898 | | | | — | |
| River Road Dividend All Cap Value Fund II | | | 7,623 | | | | — | | | | (7,623 | ) |
| Fairpointe Mid Cap Fund | | | — | | | | (2,483,994 | ) | | | 2,483,994 | |
| M&C Mid Cap Growth Fund | | | 1,327 | | | | 70 | | | | (1,397 | ) |
| Veredus Small Cap Growth Fund | | | 98,008 | | | | (1,344,110 | ) | | | 1,246,102 | |
| Small Cap Growth Fund | | | 89,264 | | | | (201,624 | ) | | | 112,360 | |
| Silvercrest Small Cap Fund | | | 19,607 | | | | (211,647 | ) | | | 192,040 | |
| TAMRO Small Cap Fund | | | 4,509,026 | | | | (7,354,201 | ) | | | 2,845,175 | |
| River Road Select Value Fund | | | 5,979 | | | | (5,979 | ) | | | — | |
| River Road Small Cap Value Fund | | | 35,980 | | | | (607,449 | ) | | | 571,469 | |
| River Road Independent Value Fund | | | 4,000,446 | | | | (3,999,126 | ) | | | (1,320 | ) |
| DoubleLine Core Plus Fixed Income Fund | | | 2,922 | | | | 48,919 | | | | (51,841 | ) |
| TCH Fixed Income Fund | | | 200,833 | | | | (174,399 | ) | | | (26,434 | ) |
| Lake Partners LASSO Alternatives Fund | | | 3,028,378 | | | | (3,028,378 | ) | | | — | |
| Dynamic Allocation Fund | | | (6,083 | ) | | | 6,083 | | | | — | |
| River Road Long-Short Fund | | | 77,015 | | | | (77,015 | ) | | | — | |
| Barings International Fund | | | (30,003 | ) | | | 30,003 | | | | — | |
| Harrison Street Real Estate Fund | | | (149,507 | ) | | | 560,884 | | | | (411,377 | ) |
| M&C Balanced Fund | | | 63,937 | | | | (63,937 | ) | | | — | |
| | |
| |
| | October 31, 2012 |
| |
| Notes to Financial Statements – continued | | |
Distributions from net realized gains for book purposes may include short-term capital gains, which are classified as ordinary income for tax purposes.
The tax character of distributions paid during the fiscal years ended 2012 and 2011 was as follows:
| | | | | | | | | | | | | | | | |
| | | Distributions Paid in 2012 | | | Distributions Paid in 2011 | |
| | | Ordinary Income | | | Long-Term
Capital Gains | | | Ordinary Income | | | Long-Term
Capital Gains | |
| | | | | | | | | | | | | | | | |
| | | | | | | | | | | | | | | | |
| M&C Growth Fund | | $ | 22,081,432 | | | $ | 257,690,139 | | | $ | 20,834,824 | | | $ | 5,383,920 | |
| Veredus Select Growth Fund | | | 27,060 | | | | — | | | | — | | | | — | |
| TAMRO Diversified Equity Fund | | | — | | | | 473,355 | | | | — | | | | — | |
| Herndon Large Cap Value Fund | | | 1,044,862 | | | | 124,149 | | | | 13,657 | | | | — | |
| Cornerstone Large Cap Value Fund | | | 110,939 | | | | — | | | | 1,807,144 | | | | — | |
| River Road Dividend All Cap Value Fund | | | 22,890,654 | | | | 4,651,009 | | | | 10,476,590 | | | | 118,593 | |
| River Road Dividend All Cap Value Fund II | | | 42,004 | | | | — | | | | — | | | | — | |
| Fairpointe Mid Cap Fund | | | 8,163,228 | | | | 18,767,770 | | | | 6,035,391 | | | | 5,436,739 | |
| TAMRO Small Cap Fund | | | — | | | | 97,192,931 | | | | — | | | | 19,802,159 | |
| River Road Select Value Fund | | | 1,196,413 | | | | 28,132,801 | | | | 1,134,027 | | | | 1,959,747 | |
| River Road Small Cap Value Fund | | | — | | | | — | | | | 2,048,490 | | | | — | |
| River Road Independent Value Fund | | | 5,597,522 | | | | 100,643 | | | | — | | | | — | |
| DoubleLine Core Plus Fixed Income Fund | | | 3,389,167 | | | | — | | | | 190,808 | | | | — | |
| TCH Fixed Income Fund | | | 3,234,814 | | | | — | | | | 2,810,584 | | | | — | |
| Lake Partners LASSO Alternatives Fund | | | 3,680,936 | | | | — | | | | 454,894 | | | | 448 | |
| Dynamic Allocation Fund | | | 3,933,878 | | | | 797,701 | | | | 1,619,896 | | | | 272,869 | |
| Anchor Capital Enhanced Equity Fund | | | 12,244,228 | | | | 2,409,141 | | | | 5,872,771 | | | | — | |
| Barings International Fund | | | 509,770 | | | | 1,380,720 | | | | 1,019,611 | | | | — | |
| Harrison Street Real Estate Fund | | | 47,575 | | | | — | | | | 627,254 | | | | — | |
| M&C Balanced Fund | | | 331,475 | | | | — | | | | 312,292 | | | | — | |
As of October 31, 2012, the most recent tax year end, the components of distributable earnings on a tax basis were as follows:
| | | | | | | | | | | | | | | | | | | | |
| | | Accumulated
Capital and
Other Losses | | | Undistributed
Ordinary Income | | | Undistributed
Long-Term Gain | | | Unrealized
Appreciation
(Depreciation) | | | Total | |
| | | | | | | | | | | | | | | | | | | | |
| M&C Growth Fund | | $ | (12,098,064 | ) | | $ | 33,942,232 | | | $ | 275,099,058 | | | $ | 459,648,376 | | | $ | 756,591,602 | |
| Veredus Select Growth Fund | | | (17,856,176 | ) | | | 174,730 | | | | — | | | | 831,025 | | | | (16,850,421 | ) |
| TAMRO Diversified Equity Fund | | | — | | | | 830 | | | | 25,756 | | | | 4,240,679 | | | | 4,267,265 | |
| Herndon Large Cap Value Fund | | | — | | | | 1,678,137 | | | | 4,508 | | | | 412,721 | | | | 2,095,366 | |
| Cornerstone Large Cap Value Fund | | | (28,085,101 | ) | | | 130,056 | | | | — | | | | 1,399,087 | | | | (26,555,958 | ) |
| River Road Dividend All Cap Value Fund | | | — | | | | 8,345,565 | | | | 26,559,658 | | | | 92,343,115 | | | | 127,248,338 | |
| River Road Dividend All Cap Value Fund II | | | — | | | | 18,055 | | | | — | | | | (48,603 | ) | | | (30,548 | ) |
| Fairpointe Mid Cap Fund | | | — | | | | 13,547,048 | | | | 66,049,888 | | | | 485,270,647 | | | | 564,867,583 | |
| M&C Mid Cap Growth Fund | | | (37,681 | ) | | | — | | | | 92,379 | | | | 848,955 | | | | 903,653 | |
| Veredus Small Cap Growth Fund | | | (19,022,164 | ) | | | — | | | | — | | | | 1,916,011 | | | | (17,106,153 | ) |
| Small Cap Growth Fund | | | — | | | | 389,762 | | | | 47,265 | | | | 334,113 | | | | 771,140 | |
| Silvercrest Small Cap Fund | | | — | | | | 68,147 | | | | 649 | | | | 103,316 | | | | 172,112 | |
| TAMRO Small Cap Fund | | | — | | | | 18,818,417 | | | | 74,805,986 | | | | 188,601,423 | | | | 282,225,826 | |
| River Road Select Value Fund | | | — | | | | 1,038,194 | | | | 8,698,768 | | | | 20,831,044 | | | | 30,568,006 | |
| River Road Small Cap Value Fund | | | — | | | | 1,328,652 | | | | 9,066,096 | | | | 65,718,103 | | | | 76,112,851 | |
| River Road Independent Value Fund | | | — | | | | 38,493,742 | | | | — | | | | 2,446,974 | | | | 40,940,716 | |
| DoubleLine Core Plus Fixed Income Fund | | | — | | | | 1,274,175 | | | | 22,764 | | | | 4,714,088 | | | | 6,011,027 | |
| TCH Fixed Income Fund | | | (6,257,447 | ) | | | 47,411 | | | | — | | | | 7,374,593 | | | | 1,164,557 | |
| Lake Partners LASSO Alternatives Fund | | | (4,870,141 | ) | | | 781,026 | | | | — | | | | 7,800,212 | | | | 3,711,097 | |
| Dynamic Allocation Fund | | | (749,106 | ) | | | 121,022 | | | | — | | | | 168,467 | | | | (459,617 | ) |
| Anchor Capital Enhanced Equity Fund | | | — | | | | 2,487,451 | | | | 556,618 | | | | (8,640,364 | ) | | | (5,596,295 | ) |
| River Road Long-Short Fund | | | — | | | | 406,152 | | | | 21,693 | | | | (6 | ) | | | 427,839 | |
| Barings International Fund | | | — | | | | 1,201,598 | | | | 549,691 | | | | 790,834 | | | | 2,542,123 | |
| Harrison Street Real Estate Fund | | | (13,177,471 | ) | | | 125,494 | | | | — | | | | 447,305 | | | | (12,604,672 | ) |
| M&C Balanced Fund | | | (1,726,376 | ) | | | 33,019 | | | | — | | | | 2,601,553 | | | | 908,196 | |
| | |
| |
| | October 31, 2012 |
| |
| Notes to Financial Statements – continued | | |
Note (D) Shares of Beneficial Interest: Each Fund is authorized to issue an unlimited number of shares of beneficial interest with no par value. Share transactions of the Funds were as follows:
Year Ended October 31, 2012
| | | | | | | | | | | | | | | | |
Class N | | Sold | | | Proceeds From
Reinvestment
of Distributions | | | Redeemed | | | Net Increase
(Decrease) in
Shares Outstanding | |
| M&C Growth Fund | | | 18,041,363 | | | | 5,664,499 | | | | (16,394,064 | ) | | | 7,311,798 | |
| Veredus Select Growth Fund | | | 49,925 | | | | — | | | | (1,016,765 | ) | | | (966,840 | ) |
| TAMRO Diversified Equity Fund | | | 210,627 | | | | 38,289 | | | | (597,734 | ) | | | (348,818 | ) |
| Herndon Large Cap Value Fund | | | 1,664,603 | | | | 39,719 | | | | (466,689 | ) | | | 1,237,633 | |
| Cornerstone Large Cap Value Fund | | | 574,279 | | | | 10,721 | | | | (1,126,860 | ) | | | (541,860 | ) |
| River Road Dividend All Cap Value Fund | | | 10,262,549 | | | | 985,104 | | | | (10,485,646 | ) | | | 762,007 | |
| River Road Dividend All Cap Value Fund II (a) | | | 100,138 | | | | 373 | | | | (40 | ) | | | 100,471 | |
| Fairpointe Mid Cap Fund | | | 13,920,692 | | | | 417,341 | | | | (17,204,213 | ) | | | (2,866,180 | ) |
| M&C Mid Cap Growth Fund | | | 296,901 | | | | — | | | | (49,540 | ) | | | 247,361 | |
| Veredus Small Cap Growth Fund | | | 69,893 | | | | — | | | | (527,804 | ) | | | (457,911 | ) |
| Small Cap Growth Fund | | | 94,914 | | | | — | | | | (143,050 | ) | | | (48,136 | ) |
| Silvercrest Small Cap Fund (b) | | | 69,067 | | | | — | | | | (306 | ) | | | 68,761 | |
| TAMRO Small Cap Fund | | | 4,990,377 | | | | 1,982,107 | | | | (6,291,677 | ) | | | 680,807 | |
| River Road Select Value Fund | | | 248,746 | | | | 332,250 | | | | (1,222,289 | ) | | | (641,293 | ) |
| River Road Small Cap Value Fund | | | 862,257 | | | | — | | | | (4,725,116 | ) | | | (3,862,859 | ) |
| River Road Independent Value Fund | | | 18,469,468 | | | | 339,193 | | | | (15,564,710 | ) | | | 3,243,951 | |
| DoubleLine Core Plus Fixed Income Fund | | | 6,542,470 | | | | 124,012 | | | | (2,391,890 | ) | | | 4,274,592 | |
| TCH Fixed Income Fund | | | 1,111,218 | | | | 245,495 | �� | | | (1,865,034 | ) | | | (508,321 | ) |
| Lake Partners LASSO Alternatives Fund | | | 1,713,847 | | | | 21,588 | | | | (489,123 | ) | | | 1,246,312 | |
| Dynamic Allocation Fund | | | 817,323 | | | | 508,991 | | | | (3,236,169 | ) | | | (1,909,855 | ) |
| Anchor Capital Enhanced Equity Fund | | | 10,363,817 | | | | 763,094 | | | | (3,930,442 | ) | | | 7,196,469 | |
| River Road Long-Short Fund | | | 290,834 | | | | — | | | | (54,850 | ) | | | 235,984 | |
| Barings International Fund | | | 1,673 | | | | 1,945 | | | | (43 | ) | | | 3,575 | |
| Harrison Street Real Estate Fund | | | 621,290 | | | | 4,957 | | | | (337,947 | ) | | | 288,300 | |
| M&C Balanced Fund | | | 584,267 | | | | 14,308 | | | | (289,262 | ) | | | 309,313 | |
| (a) | River Road Dividend All Cap Value Fund II began issuing Class N Shares on June 27, 2012. |
| (b) | Silvercrest Small Cap Fund began issuing Class N Shares on December 23, 2011. |
| | | | | | | | | | | | | | | | |
Class I | | Sold | | | Proceeds From
Reinvestment
of Distributions | | | Redeemed | | | Net Increase
(Decrease) in
Shares Outstanding | |
| M&C Growth Fund | | | 43,042,995 | | | | 4,364,756 | | | | (23,294,443 | ) | | | 24,113,308 | |
| Veredus Select Growth Fund | | | 223,629 | | | | 2,609 | | | | (5,547,826 | ) | | | (5,321,588 | ) |
| TAMRO Diversified Equity Fund (a) | | | 44,338 | | | | — | | | | (2,319 | ) | | | 42,019 | |
| Herndon Large Cap Value Fund | | | 2,306,966 | | | | 73,629 | | | | (485,691 | ) | | | 1,894,904 | |
| Cornerstone Large Cap Value Fund | | | 485,538 | | | | 58 | | | | (10,500 | ) | | | 475,096 | |
| River Road Dividend All Cap Value Fund | | | 24,480,603 | | | | 1,049,359 | | | | (5,161,671 | ) | | | 20,368,291 | |
| River Road Dividend All Cap Value Fund II (b) | | | 894,279 | | | | 3,478 | | | | (952 | ) | | | 896,805 | |
| Fairpointe Mid Cap Fund (c) | | | 20,254,334 | | | | 327,743 | | | | (20,929,526 | ) | | | (347,449 | ) |
| Veredus Small Cap Growth Fund (d) | | | 27,307 | | | | — | | | | (1,169,094 | ) | | | (1,141,787 | ) |
| Small Cap Growth Fund (e) | | | 25,824 | | | | — | | | | (215,934 | ) | | | (190,110 | ) |
| Silvercrest Small Cap Fund (f) (g) | | | 694,135 | | | | — | | | | (240,046 | ) | | | 454,089 | |
| TAMRO Small Cap Fund (h) | | | 7,501,659 | | | | 2,242,345 | | | | (9,314,452 | ) | | | 429,552 | |
| River Road Select Value Fund | | | 6,030,361 | | | | 2,982,288 | | | | (4,372,992 | ) | | | 4,639,657 | |
| River Road Small Cap Value Fund | | | 3,570,354 | | | | — | | | | (6,081,336 | ) | | | (2,510,982 | ) |
| River Road Independent Value Fund | | | 25,305,662 | | | | 189,732 | | | | (3,918,323 | ) | | | 21,577,071 | |
| DoubleLine Core Plus Fixed Income Fund | | | 9,567,318 | | | | 177,202 | | | | (684,564 | ) | | | 9,059,956 | |
| TCH Fixed Income Fund | | | 308,748 | | | | 35,661 | | | | (393,122 | ) | | | (48,713 | ) |
| Lake Partners LASSO Alternatives Fund | | | 8,580,923 | | | | 148,112 | | | | (4,201,794 | ) | | | 4,527,241 | |
| Dynamic Allocation Fund | | | 252,489 | | | | 52,099 | | | | (87,664 | ) | | | 216,924 | |
| Anchor Capital Enhanced Equity Fund | | | 4,796,811 | | | | 678,182 | | | | (3,978,006 | ) | | | 1,496,987 | |
| Barings International Fund | | | 2,684,137 | | | | 187,976 | | | | (1,593,922 | ) | | | 1,278,191 | |
| Harrison Street Real Estate Fund (i) | | | 20,224 | | | | 61 | | | | (3,696,962 | ) | | | (3,676,677 | ) |
| M&C Balanced Fund | | | 30,540 | | | | 428 | | | | (11,383 | ) | | | 19,585 | |
| (a) | TAMRO Diversified Equity Fund began issuing Class I Shares on March 1, 2012. |
| (b) | River Road Dividend All Cap Value Fund II began issuing Class I Shares on June 27, 2012. |
| | |
| |
| | October 31, 2012 |
| |
| Notes to Financial Statements – continued | | |
| (c) | Fairpointe Mid Cap Fund had a redemption-in-kind on January 13, 2012, which resulted in a redemption out of the Fund of $38,722,763. The redemption was comprised of securities and cash in the amounts of $38,179,960 and $542,803, respectively. |
| (d) | Veredus Small Cap Growth Fund had a redemption-in-kind on December 2, 2011, which resulted in a redemption out of the Fund of $13,436,583. The redemption was comprised of securities and cash in the amounts of $13,225,479 and $211,104, respectively. |
| (e) | Small Cap Growth Fund had a redemption-in-kind on September 25, 2012, which resulted in a redemption out of the Fund of $2,554,395. The redemption was comprised of securities and cash in the amounts of $2,419,213 and $135,182, respectively. |
| (f) | Silvercrest Small Cap Fund began issuing Class I Shares on December 23, 2011. |
| (g) | Silvercrest Small Cap Fund had a redemption-in-kind on April 26, 2012, which resulted in a redemption out of the Fund of $2,608,977. The redemption was comprised of securities and cash in the amounts of $2,579,146 and $29,831, respectively. |
| (h) | TAMRO Small Cap Fund had redemptions-in-kind on May 1, 2012 and June 27, 2012, which resulted in redemptions out of the Fund of $40,667,980 and $7,010,475, respectively. The redemption was comprised of securities and cash in the amounts of $39,335,174 and $6,762,586, respectively and $1,332,806 and $247,889, respectively. |
| (i) | Harrison Street Real Estate Fund had a redemption-in-kind on December 2, 2011, which resulted in a redemption out of the Fund of $31,399,368. The redemption was comprised of securities and cash in the amounts of $30,913,574 and $485,794, respectively. |
| | | | | | | | | | | | | | | | |
Class R | | Sold | | | Proceeds From
Reinvestment of
Distributions | | | Redeemed | | | Net
Decrease in
Shares Outstanding | |
| M&C Growth Fund | | | 100,372 | | | | 23,324 | | | | (127,056 | ) | | | (3,360 | ) |
Year Ended October 31, 2011
| | | | | | | | | | | | | | | | |
Class N | | Sold | | | Shares Issued From
Reinvestment of
Distributions | | | Redeemed | | | Net Increase
(Decrease) in
Shares Outstanding | |
| M&C Growth Fund | | | 27,529,579 | | | | 436,304 | | | | (25,563,135 | ) | | | 2,402,748 | |
| Veredus Select Growth Fund | | | 600,195 | | | | — | | | | (2,424,886 | ) | | | (1,824,691 | ) |
| TAMRO Diversified Equity Fund | | | 1,047,491 | | | | — | | | | (398,182 | ) | | | 649,309 | |
| Herndon Large Cap Value Fund | | | 1,302,936 | | | | 1,239 | | | | (907,748 | ) | | | 396,427 | |
| Cornerstone Large Cap Value Fund | | | 938,206 | | | | 26,444 | | | | (683,845 | ) | | | 280,805 | |
| River Road Dividend All Cap Value Fund | | | 19,428,483 | | | | 401,663 | | | | (4,872,469 | ) | | | 14,957,677 | |
| Fairpointe Mid Cap Fund | | | 23,004,145 | | | | 239,794 | | | | (23,365,775 | ) | | | (121,836 | ) |
| M&C Mid Cap Growth Fund | | | 79,385 | | | | — | | | | (14,651 | ) | | | 64,734 | |
| Veredus Small Cap Growth Fund | | | 261,170 | | | | — | | | | (980,739 | ) | | | (719,569 | ) |
| Small Cap Growth Fund (a) | | | 622,572 | | | | — | | | | (78,915 | ) | | | 543,657 | |
| TAMRO Small Cap Fund | | | 6,465,730 | | | | 349,541 | | | | (5,826,262 | ) | | | 989,009 | |
| River Road Select Value Fund | | | 940,625 | | | | 64,739 | | | | (5,458,457 | ) | | | (4,453,093 | ) |
| River Road Small Cap Value Fund | | | 3,083,624 | | | | 49,890 | | | | (14,038,695 | ) | | | (10,905,181 | ) |
| River Road Independent Value Fund (b) | | | 34,714,694 | | | | — | | | | (6,220,324 | ) | | | 28,494,370 | |
| DoubleLine Core Plus Fixed Income Fund (c) | | | 2,304,445 | | | | 13,647 | | | | (147,028 | ) | | | 2,171,064 | |
| TCH Fixed Income Fund | | | 2,519,080 | | | | 199,342 | | | | (1,241,865 | ) | | | 1,476,557 | |
| Lake Partners LASSO Alternatives Fund | | | 1,059,998 | | | | 9,203 | | | | (286,539 | ) | | | 782,662 | |
| Dynamic Allocation Fund | | | 2,015,362 | | | | 199,385 | | | | (3,376,730 | ) | | | (1,161,983 | ) |
| Anchor Capital Enhanced Equity Fund | | | 2,823,656 | | | | 274,141 | | | | (2,998,639 | ) | | | 99,158 | |
| River Road Long-Short Fund (d) | | | 463,827 | | | | — | | | | (106 | ) | | | 463,721 | |
| Barings International Fund | | | 41,175 | | | | 470 | | | | (9,259 | ) | | | 32,386 | |
| Harrison Street Real Estate Fund | | | 334,601 | | | | 11,310 | | | | (399,317 | ) | | | (53,406 | ) |
| M&C Balanced Fund | | | 83,389 | | | | 13,236 | | | | (462,762 | ) | | | (366,137 | ) |
| (a) | Small Cap Growth Fund began issuing Class N Shares on November 2, 2010. |
| (b) | River Road Independent Value Fund began issuing Class N Shares on December 30, 2010. |
| (c) | DoubleLine Core Plus Fixed Income Fund began issuing Class N Shares on July 15, 2011. |
| (d) | River Road Long-Short Fund began issuing Class N Shares on May 3, 2011. |
| | | | | | | | | | | | | | | | |
Class I | | Sold | | | Shares Issued From
Reinvestment of
Distributions | | | Redeemed | | | Net Increase
(Decrease) in
Shares Outstanding | |
| M&C Growth Fund | | | 25,367,654 | | | | 492,955 | | | | (21,812,016 | ) | | | 4,048,593 | |
| Veredus Select Growth Fund | | | 1,022,514 | | | | — | | | | (965,498 | ) | | | 57,016 | |
| Herndon Large Cap Value Fund (a) | | | 1,048,685 | | | | — | | | | — | | | | 1,048,685 | |
| Cornerstone Large Cap Value Fund (b) | | | 41 | | | | 99,223 | | | | (22,281,046 | ) | | | (22,181,782 | ) |
| River Road Dividend All Cap Value Fund | | | 18,128,321 | | | | 370,706 | | | | (2,092,580 | ) | | | 16,406,447 | |
| Fairpointe Mid Cap Fund | | | 39,262,459 | | | | 90,932 | | | | (12,005,364 | ) | | | 27,348,027 | |
| Veredus Small Cap Growth Fund | | | 23,685 | | | | — | | | | (32,239 | ) | | | (8,554 | ) |
| Small Cap Growth Fund | | | 255,934 | | | | — | | | | — | | | | 255,934 | |
| TAMRO Small Cap Fund | | | 9,479,673 | | | | 402,302 | | | | (7,890,124 | ) | | | 1,991,851 | |
| River Road Select Value Fund | | | 4,193,249 | | | | 214,802 | | | | (8,853,662 | ) | | | (4,445,611 | ) |
| River Road Small Cap Value Fund | | | 4,141,086 | | | | 107,904 | | | | (6,084,595 | ) | | | (1,835,605 | ) |
| River Road Independent Value Fund (c) | | | 8,308,048 | | | | — | | | | (359,185 | ) | | | 7,948,863 | |
| DoubleLine Core Plus Fixed Income Fund (d) | | | 523,751 | | | | 4,051 | | | | (98,141 | ) | | | 429,661 | |
| | |
| |
| | October 31, 2012 |
| |
| Notes to Financial Statements – continued | | |
| | | | | | | | | | | | | | | | |
Class I | | Sold | | | Shares Issued From
Reinvestment of
Distributions | | | Redeemed | | | Net Increase
(Decrease) in
Shares Outstanding | |
| TCH Fixed Income Fund | | | 347,836 | | | | 45,383 | | | | (827,447 | ) | | | (434,228 | ) |
| Lake Partners LASSO Alternatives Fund | | | 16,212,425 | | | | 25,742 | | | | (2,014,816 | ) | | | 14,223,351 | |
| Dynamic Allocation Fund (e) | | | 734,609 | | | | 715 | | | | (275,213 | ) | | | 460,111 | |
| Anchor Capital Enhanced Equity Fund | | | 2,722,359 | | | | 287,142 | | | | (1,167,597 | ) | | | 1,841,904 | |
| Harrison Street Real Estate Fund | | | 3,825 | | | | 64,984 | | | | (1,747 | ) | | | 67,062 | |
| Barings International Fund | | | 2,212,819 | | | | 113,069 | | | | (1,257,377 | ) | | | 1,068,511 | |
| M&C Balanced Fund | | | 236,989 | | | | 1,686 | | | | (239,470 | ) | | | (795 | ) |
| (a) | Herndon Large Cap Value Fund began issuing Class I Shares on March 1, 2011. |
| (b) | Cornerstone Large Cap Value Fund had a redemption-in-kind on March 18, 2011, which resulted in a redemption out of the Fund of $222,180,158. The redemption was comprised of securities and cash in the amounts of $218,362,400 and $3,817,758, respectively. |
| (c) | River Road Independent Value Fund began issuing Class I Shares on May 31, 2011. |
| (d) | DoubleLine Core Plus Fixed Income Fund began issuing Class I Shares on July 15, 2011. |
| (e) | Dynamic Allocation Fund began issuing Class I Shares on November 1, 2010. |
| | | | | | | | | | | | | | | | |
Class R | | Sold | | | Shares Issued From
Reinvestment
of Distributions | | | Redeemed | | | Net Increase in
Shares Outstanding | |
| M&C Growth Fund | | | 231,098 | | | | 883 | | | | (199,315 | ) | | | 32,666 | |
Note (E) Investment Transactions: Aggregate purchases and proceeds from sales and maturities of investment securities (other than short-term investments) for the year ended October 31, 2012 were as follows:
| | | | | | | | | | | | | | | | |
| | | Aggregate Purchases | | | Proceeds from Sales | |
| | | U.S. Government | | | Other | | | U.S. Government | | | Other | |
| | | | | | | | | | | | | | | | |
| M&C Growth Fund | | $ | — | | | $ | 1,972,776,769 | | | $ | — | | | $ | 1,651,965,719 | |
| Veredus Select Growth Fund | | | — | | | | 86,063,915 | | | | — | | | | 152,482,104 | |
| TAMRO Diversified Equity Fund | | | — | | | | 11,512,336 | | | | — | | | | 15,154,644 | |
| Herndon Large Cap Value Fund | | | — | | | | 64,334,427 | | | | — | | | | 30,376,108 | |
| Cornerstone Large Cap Value Fund | | | — | | | | 14,410,279 | | | | — | | | | 14,663,999 | |
| River Road Dividend All Cap Value Fund | | | — | | | | 435,843,737 | | | | — | | | | 220,734,933 | |
| River Road Dividend All cap Value Fund II (a) | | | — | | | | 9,292,035 | | | | — | | | | 258,302 | |
| Fairpointe Mid Cap Fund (b) | | | — | | | | 808,523,795 | | | | — | | | | 858,643,069 | |
| M&C Mid Cap Growth Fund | | | — | | | | 4,395,164 | | | | — | | | | 2,153,729 | |
| Veredus Small Cap Growth Fund (c) | | | — | | | | 44,891,321 | | | | — | | | | 50,745,538 | |
| Small Cap Growth Fund (d) | | | — | | | | 12,988,573 | | | | — | | | | 13,341,662 | |
| Silvercrest Small Cap Fund (e) | | | — | | | | 8,983,916 | | | | — | | | | 1,169,680 | |
| TAMRO Small Cap Fund (f) | | | — | | | | 487,439,513 | | | | — | | | | 525,841,529 | |
| River Road Select Value Fund | | | — | | | | 55,429,185 | | | | — | | | | 56,846,863 | |
| River Road Small Cap Value Fund | | | — | | | | 78,856,625 | | | | — | | | | 165,223,867 | |
| River Road Independent Value Fund | | | — | | | | 507,859,647 | | | | — | | | | 411,506,172 | |
| DoubleLine Core Plus Fixed Income Fund | | | 127,026,252 | | | | 111,468,591 | | | | 74,878,485 | | | | 29,863,881 | |
| TCH Fixed Income Fund | | | 4,722,161 | | | | 34,513,695 | | | | 7,968,677 | | | | 39,189,498 | |
| Lake Partners LASSO Alternatives Fund | | | — | | | | 181,324,973 | | | | — | | | | 108,604,194 | |
| Dynamic Allocation Fund. | | | — | | | | 155,318,453 | | | | — | | | | 169,160,674 | |
| Anchor Capital Enhanced Equity Fund | | | — | | | | 142,591,937 | | | | — | | | | 81,577,001 | |
| River Road Long-Short Fund | | | — | | | | 13,832,153 | | | | — | | | | 12,409,676 | |
| Barings International Fund | | | — | | | | 26,502,151 | | | | — | | | | 19,396,806 | |
| Harrison Street Real Estate Fund (g) | | | — | | | | 14,526,721 | | | | — | | | | 11,107,020 | |
| M&C Balanced Fund | | | 2,629,899 | | | | 13,230,936 | | | | 753,780 | | | | 8,915,745 | |
| (a) | River Road Dividend All Cap Value Fund II had a subscription-in-kind on June 26, 2012, which resulted in transactions into the Fund of $982,592 and is excluded from the aggregate purchases above. The subscription was comprised of securities, cash and dividends accrued in the amounts of $932,272, $47,924 and $2,396, respectively. |
| (b) | Fairpointe Mid Cap Fund had a redemption-in-kind on January 13, 2012, which resulted in a redemption out of the Fund of $38,722,763 and is excluded from the proceeds from sales above. The redemp- tion was comprised of securities and cash in the amount of $38,179,960 and $542,803, respectively. |
| (c) | Veredus Small Cap Growth Fund had a redemption-in-kind on December 2, 2011, which resulted in a redemption out of the Fund of $13,436,583 and is excluded from proceeds from sales above. The redemption was comprised of securities and cash in the amounts of $13,225,479 and $211,104, respectively. |
| (d) | Small Cap Growth Fund had a redemption-in-kind on September 25, 2012, which resulted in a redemption out of the Fund of $2,554,395 and is excluded from the proceeds from sales above. The redemption was comprised of securities and cash in the amounts of $2,419,213 and $135,182, respectively. |
| (e) | Silvercrest Small Cap Fund had a redemption-in-kind on April 26, 2012, which resulted in a redemption out of the Fund of $2,608,977 and is excluded from the proceeds from sales above. The redemption was comprised of securities and cash in the amount of $2,579,146 and $29,831, respectively. |
| (f) | TAMRO Small Cap Fund had redemptions-in-kind on May 1, 2012 and June 27, 2012, which resulted in redemptions out of the Fund of $40,667,980 and $7,010,475, respectively and is excluded from the proceeds from sales above. The redemption was comprised of securities and cash in the amounts of $39,335,174 and $6,762,586, respectively and 1,332,806 and $247,889, respectively. |
| | |
| |
| | October 31, 2012 |
| |
| Notes to Financial Statements – continued | | |
| (g) | Harrison Street Real Estate Fund had a redemption-in-kind on December 2, 2011, which resulted in a redemption out of the Fund of $31,399,368 and is excluded from proceeds from sales above. The redemption was comprised of securities and cash in the amounts of $30,913,574 and $485,794, respectively. |
Note (F) Redemption Fees: In accordance with the prospectus, certain Funds assessed a 2% redemption fee on Fund share redemptions and exchanges within specified time periods, as indicated in the following table for the year ended October 31, 2012 and included in the Cost of Shares redeemed on the Statements of Changes in Net Assets:
| | | | | | |
Fund Name | | Time Period | | Amount | |
| Barings International Fund | | 2% Within 90 Days | | $ | 5,830 | |
| Harrison Street Real Estate Fund | | 2% Within 90 Days | | | 7,183 | |
Note (G) Advisory, Administration, Distribution Services and Trustee Agreements:
Advisory. Aston serves as investment adviser and administrator to the Funds. Under the terms of the investment advisory agreement for the Funds (the “Investment Advisory Agreement”), fees are accrued daily and paid monthly, based on specific annual rates of average daily net assets. The factors considered by the Board of Trustees in approving the current Investment Advisory Agreement are included in the Funds’ annual or semi-annual report to shareholders covering the period during which the approval occurred.
Certain Funds have an expense limitation agreement with the Adviser, which caps annual ordinary operating expenses for Class N and Class I shareholders at certain specified annual rates of average daily net assets (the “Expense Limitation Agreements”). There are no contractual expense limitations for Class R shareholders.
The Expense Limitation Agreements are effective through February 28, 2013, except as noted below. The advisory rates and contractual expense limitations for the year ended October 31, 2012 were as follows:
| | | | | | |
| | | | | Contractual Expense Limitations |
Fund Name | | Advisory Fees | | Class N | | Class I |
| M&C Growth Fund | | 0.80% on first $800,000,000 | | | | |
| | 0.60% over $800,000,000 | | N/A | | N/A |
| Veredus Select Growth Fund | | 0.80% | | 1.30% | | 1.05% |
| TAMRO Diversified Equity Fund (a) | | 0.80% | | 1.20% | | 0.95% |
| Herndon Large Cap Value Fund | | 0.80% | | 1.30%(b) | | 1.05%(b) |
| Cornerstone Large Cap Value Fund (c) | | 0.80% | | 1.30% | | 1.05% |
| River Road Dividend All Cap Value Fund | | 0.70% | | 1.30% | | 1.05% |
| River Road Dividend All Cap Value Fund II (d) | | 0.70% | | 1.30%(b) | | 1.05%(b) |
| Fairpointe Mid Cap Fund | | 0.80% on first $100,000,000 | | | | |
| | 0.75% next $300,000,000 | | | | |
| | 0.70% over $400,000,000 | | N/A | | N/A |
| M&C Mid Cap Growth Fund (e) | | 0.85% | | 1.25%(b) | | N/A |
| Veredus Small Cap Growth Fund | | 1.00% | | 1.49% | | 1.24% |
| Small Cap Growth Fund | | 1.00% | | 1.35%(b) | | 1.10%(b) |
| Silvercrest Small Cap Growth (f) | | 1.00% | | 1.40%(b) | | 1.15%(b) |
| TAMRO Small Cap Fund | | 0.90% | | N/A | | N/A |
| River Road Select Value Fund | | 1.00% | | 1.50%(b) | | 1.25%(b) |
| River Road Small Cap Value Fund | | 0.90% | | N/A | | N/A |
| River Road Independent Value Fund | | 1.00% | | 1.42%(b) | | 1.17%(b) |
| DoubleLine Core Plus Fixed Income Fund | | 0.55% | | 0.94%(b) | | 0.69%(b) |
| TCH Fixed Income Fund | | 0.55% | | 0.94% | | 0.69% |
| Lake Partners LASSO Alternatives Fund | | 1.00% | | 1.45%(b) | | 1.20%(b) |
| Dynamic Allocation Fund | | 0.80% | | 1.30%(b) | | 1.05%(b) |
| Anchor Capital Enhanced Equity Fund | | 0.70% | | 1.40%(b) | | 1.15%(b) |
| River Road Long-Short Fund | | 1.20% | | 1.70%(b) | | N/A |
| Barings International Fund | | 1.00% | | 1.40%(b) | | 1.15%(b) |
| Harrison Street Real Estate Fund | | 1.00% | | 1.37% | | 1.12% |
| M&C Balanced Fund | | 0.75% | | 1.35% | | 1.10% |
| (a) | TAMRO Diversified Equity Fund began issuing Class I Shares on March 1, 2012. |
| (b) | Pursuant to a contractual expense reimbursement agreement between the Adviser and the Fund, from commencement of operations through the completion of the first three full fiscal years for a period up to three years from the fiscal year end during which such amount was waived or reduced, the Adviser is entitled to be reimbursed by the Fund for previously waived fees and reimbursed expenses to the extent that the Fund’s expense ratio (not including interest, taxes, brokerage commissions, other investment related costs, extraordinary expenses and acquired fund fees and expenses,) remains below the operating expense cap after such reimbursement. |
| (c) | Effective February 29, 2012, the voluntary expense limitation for the Cornerstone Large Cap Value Fund was replaced with a contractual expense limitation of 1.30% for Class N and 1.05% for Class I. |
| (d) | River Road Dividend All Cap Value Fund II began issuing Class N and Class I Shares on June 27, 2012. |
| (e) | Effective February 29, 2012, the voluntary expense limitation for the M&C Mid Cap Growth Fund was removed and replaced with a contractual expense limitation of 1.25%. |
| (f) | Silvercrest Small Cap Growth Fund began issuing Class N and Class I Shares on December 23, 2011. |
| | |
| |
| | October 31, 2012 |
| |
| Notes to Financial Statements – continued | | |
Pursuant to a contractual expense reimbursement agreement between the Adviser and the following Funds, from commencement of operations through the completion of the first three full fiscal years for a period of up to three years from the fiscal year end during which such amount was waived or reduced of each of the Herndon Large Cap Value Fund-Classes N and I, River Road Dividend All Cap Value Fund II-Classes N and I, M&C Mid Cap Growth Fund-Class N, Small Cap Growth Fund-Classes N and I, Silvercrest Small Cap Fund-Classes N and I, River Road Select Value Fund-Classes N and I, River Road Independent Value Fund-Classes N and I, DoubleLine Core Plus Fixed Income Fund-Classes N and I, Lake Partners LASSO Alternatives Fund-Classes N and I, Dynamic Allocation Fund-Classes N and I, Anchor Capital Enhanced Equity Fund-Classes N and I, River Road Long-Short Fund Class N and Barings International Fund-Classes N and I, the Adviser is entitled to be reimbursed by each Fund for previously waived fees and reimbursed expenses to the extent that each Fund’s expense ratio (not including interest, taxes, brokerage commissions, other investment related costs, extraordinary expenses and acquired fund fees and expenses) remains below the operating expense cap after such reimbursement.
The cumulative reimbursement amounts as of October 31, 2012 that are entitled to be reimbursed for each Fund are as follows:
| | | | | | | | | | | | |
| | | | | | Expiration | | | | |
| | | 2013 | | | 2014 | | | 2015 | |
| Herndon Large Cap Value Fund | | | 74,284 | | | | 129,816 | | | | 42,793 | |
| River Road Dividend All Cap Value Fund II (1) | | | N/A | | | | N/A | | | | 59,860 | |
| Montag & Caldwell Mid Cap Growth Fund | | | 67,970 | | | | 72,010 | | | | N/A | |
| Small Cap Growth Fund | | | N/A | | | | 190,704 | | | | 123,269 | |
| Silvercrest Small Cap Fund (1) | | | N/A | | | | N/A | | | | 147,166 | |
| River Road Select Value Fund | | | — | | | | N/A | | | | N/A | |
| River Road Independent Value Fund | | | N/A | | | | 244,471 | | | | 143,528 | |
| DoubleLine Core Plus Fixed Income Fund | | | N/A | | | | 105,633 | | | | 389,195 | |
| Lake Partners LASSO Alternatives Fund | | | 135,895 | | | | 87,814 | | | | N/A | |
| Dynamic Allocation Fund | | | 74,415 | | | | 138,681 | | | | N/A | |
| Anchor Capital Enhanced Equity Fund | | | — | | | | — | | | | N/A | |
| River Road Long-Short Fund | | | N/A | | | | 97,108 | | | | 110,750 | |
| Barings International Fund | | | 134,828 | | | | 147,896 | | | | N/A | |
| | | | | | | | | | | | |
| Total | | $ | 487,392 | | | $ | 1,214,133 | | | $ | 1,016,561 | |
| | | | | | | | | | | | |
| (1) | The Fund commenced operations in the current fiscal year. |
For the year ended October 31, 2012, the Adviser was reimbursed $88,544 by the Lake Partners LASSO Alternatives Fund and $61,190 by the Anchor Capital Enhanced Equity Fund for recoupment of prior year fee waivers. No other Fund in the above table reimbursed the Adviser for the period.
The Adviser manages each Fund by retaining one or more Sub-advisers to manage each Fund as follows:
| | |
Fund | | Subadviser |
M&C Growth Fund | | Montag & Caldwell, LLC |
Veredus Select Growth Fund | | Todd-Veredus Asset Management LLC |
TAMRO Diversified Equity Fund | | TAMRO Capital Partners LLC |
Herndon Large Cap Value Fund | | Herndon Capital Management, LLC |
Cornerstone Large Cap Value Fund | | Cornerstone Investment Partners, LLC |
River Road Dividend All Cap Value Fund | | River Road Asset Management, LLC |
River Road Dividend All Cap Value Fund II | | River Road Asset Management, LLC |
| | |
Fund | | Subadviser |
Fairpointe Mid Cap Fund | | Fairpointe Capital LLC |
M&C Mid Cap Growth Fund | | Montag & Caldwell, LLC |
Veredus Small Cap Growth Fund | | Todd-Veredus Asset Management LLC |
Small Cap Growth Fund | | Lee Munder Capital Group, LLC(1) |
Silvercrest Small Cap Fund | | Silvercrest Asset Management Group, LLC |
TAMRO Small Cap Fund | | TAMRO Capital Partners LLC |
River Road Select Value Fund | | River Road Asset Management, LLC |
River Road Small Cap Value Fund | | River Road Asset Management, LLC |
River Road Independent Value Fund | | River Road Asset Management, LLC |
DoubleLine Core Plus Fixed Income Fund | | DoubleLine Capital LP |
TCH Fixed Income Fund | | Taplin, Canida & Habacht, LLC |
Lake Partners LASSO Alternatives Fund | | Lake Partners, Inc. |
Dynamic Allocation Fund | | Smart Portfolios, LLC |
Anchor Capital Enhanced Equity Fund | | Anchor Capital Advisors LLC(2) |
River Road Long-Short Fund | | River Road Asset Management, LLC |
Barings International Fund | | Baring International Investment Limited |
Harrison Street Real Estate Fund | | Harrison Street Securities, LLC |
M&C Balanced Fund | | Montag & Caldwell, LLC |
| (1) | Effective as of February 17, 2012, Lee Munder Capital Group, LLC became the Subadviser to the Fund. Prior to February 17, 2012, Crosswind Investments, LLC was the Subadviser. |
| (2) | Effective June 29, 2012, Anchor Capital Advisors LLC became the Subadviser to the Fund. Prior to June 29, 2012, M.D. Sass Investors Services, Inc. was the Subadviser. |
Subadvisory fees are paid monthly by Aston. The factors considered by the Board of Trustees in approving the current sub-investment advisory agreements for the Funds (each a “Sub-Investment Advisory Agreement”) are included in the additional information section of the Funds’ annual or semi-annual report to shareholders covering the period in which such approval occurred.
Administration. Under the terms of the administration agreement between the Funds and Aston, the Funds’ administrator (the “Administration Agreement”), administration fees are accrued daily and paid monthly, based on a specified percentage of average daily net assets of the Trust, and base fees are fixed at an annual rate of $12,000 per Fund. The fee is allocated to each Fund based on the relative net assets of the Trust. Administration expenses also include pricing agent fees and compliance related expenses. Effective July 1, 2012, the administration fee arrangement is as follows:
| | |
Administration Fees at Trust Level | | Annual Rate |
| |
| First $7.4 billion | | 0.0437% |
| Over $7.4 billion | | 0.0412% |
Prior to July 1, 2012, the administration fee arrangement was as follows:
| | |
Administration Fees
at Trust Level | | Annual Rate |
| First $7.4 billion | | 0.0490% |
| Over $7.4 billion | | 0.0465% |
BNY Mellon Investment Servicing (US) Inc. (“BNY Mellon”) provides certain administrative services to the Funds pursuant to
| | |
| |
| | October 31, 2012 |
| |
| Notes to Financial Statements – continued | | |
a Sub-administration and Accounting Services Agreement between Aston and BNY Mellon (the “Sub-Administration Agreement”). Effective July 1, 2012, under the terms of the Sub-Administration Agreement, sub-administration fees and tax services fees, which are paid by Aston, are accrued daily and paid monthly, at a rate of 0.0142% and 0.0025%, respectively of average daily net assets of the Trust and a base fee at an annual rate of $12,000 per Fund.
Prior to July 1, 2012, the sub-administration fees were 0.022% of average daily net assets. BNY Mellon did not provide tax services prior to July 1, 2012.
Distribution Services. On March 31, 2012, BNY Mellon Distributors LLC Inc. was sold to Foreside Funds Distributors LLC. Upon the closing of the transaction, BNY Mellon Distributors LLC became an indirect, wholly owned subsidiary of Foreside Financial Group, LLC and was renamed Foreside Funds Distributors LLC (the “Distributor”) effective April 1, 2012. The Distributor serves as principal underwriter and distributor of the Fund’s shares. Pursuant to Rule 12b-1 distribution and service plans (the “Plans”) adopted by the Funds, with respect to Class N shares and Class R shares, the Funds pay certain expenses associated with the distribution of their shares. Under the Plans, each Fund may pay actual expenses not exceeding, on an annual basis, 0.25% of each participating Fund’s Class N average daily net assets and 0.50% of each participating Fund’s Class R average daily net assets. The Class I shares do not have Rule 12b-1 plans. Effective January 1, 2012 the TCH Fixed Income Fund and M&C Balanced Fund reduced their 12b-1 fees to 0.10% and 0.15%, respectively.
Trustees. The Trustees of the Trust who are not affiliated with the Adviser or Subadviser receive an annual retainer and per meeting fees and are reimbursed for out-of-pocket expenses for each meeting of the Board of Trustees they attend. The Chairman of the Board and Committee Chairs receive an additional retainer. No officer or employee of the Adviser, Subadvisers or their affiliates receives any compensation from the Funds for acting as a Trustee of the Trust. The officers of the Trust receive no compensation directly from the Funds for performing the duties of their offices, except that the Funds compensate the Administrator for providing an officer to serve as the Funds’ Chief Compliance Officer. The aggregate remuneration paid to the Trustees during the year ended October 31, 2012 was $704,750.
Note (H) Credit Agreement: Effective July 6, 2010 and as amended August 31, 2012, the Trust entered into a Credit Agreement with The Bank of New York Mellon which provides the Trust with a revolving line of credit facility up to $50 million. The facility is shared by each series of the Trust and is available for temporary, emergency purposes including liquidity needs in meeting redemptions. The interest rate on outstanding Alternate Base Rate Loans is equivalent to the greater of the Prime Rate plus 1.25% or 0.50% plus the Federal Funds Effective Rate plus 1.25%, as applicable. The interest rate on outstanding Overnight Loans is equivalent to the greater of the Federal Funds Effective Rate plus 1.25% or the One
Month LIBOR Rate plus 1.25%, as applicable. The Trust pays a commitment fee on the unutilized commitment amount of 0.12% per annum. For the Funds that utilized the line of credit during the year ended October 31, 2012, the average daily loan balance outstanding on the days where borrowings existed, the weighted average interest rate and the interest expense, which is included on the Statement of Operations, allocated to each Fund for the use of the line of credit were as follows:
| | | | | | | | | | | | |
| | | Weighted Average Interest Rate on Days When Borrowings Existed | | | Average Daily Loan Balance on Days When Borrowings Existed | | | Interest Expense | |
| | | |
| | | |
| | | |
| | | |
| Veredus Select Growth Fund | | | 1.65 | % | | $ | 1,539,700 | | | $ | 71 | |
| TAMRO Diversified Equity Fund | | | 1.64 | % | | | 270,343 | | | | 86 | |
| Fairpointe Mid Cap Fund | | | 1.64 | % | | | 24,387,327 | | | | 12,242 | |
| TAMRO Small Cap Fund | | | 1.65 | % | | | 10,549,933 | | | | 2,905 | |
| River Road Select Value Fund | | | 1.65 | % | | | 37,000 | | | | 2 | |
| Anchor Capital Enhanced Equity Fund | | | 1.65 | % | | | 2,504,567 | | | | 690 | |
Note (I) Fully FDIC-insured Uninvested Deposit Balance Program: Effective July 3, 2012, the Trust entered into a program under which cash that is currently held in custody and trust accounts by The Bank of New York Mellon (the “Bank”), as custodian for the Trust, is held in non-interest bearing transaction accounts at the Bank that are fully covered by the FDIC. River Road Independent Value Fund, Lake Partners LASSO Alternatives Fund and Anchor Capital Enhanced Equity Fund will accrue an Earnings Credit to offset the Fund’s custody and transfer agency fees (including overdraft charges) based on the Earnings Credit Rate. The Earnings Credit Rate is 8 basis points, on positive balances. The term of this agreement is June 1, 2012 through December 31, 2012. The Earnings Credit Rate may be changed by the Bank from time to time. For the year ended October 31, 2012, the Funds’ accrued Earnings Credits are as follows:
| | | | |
Fund | | 2012 Earnings
Credit to Custody
and Transfer
Agency Fees | |
| River Road Independent Value Fund | | $ | 23,757 | |
| Lake Partners LASSO Alternatives Fund | | | 2,453 | |
| Anchor Capital Enhanced Equity Fund | | | 1,467 | |
Note (J) ReFlow Fund LLC: The Veredus Small Cap Growth Fund may participate in the ReFlow Fund LLC program (“ReFlow”), which is designed to provide an alternative liquidity source for mutual funds experiencing redemptions of their shares. In order to pay cash to shareholders who redeem their shares on a given day, a mutual fund typically must hold cash in its portfolio, liquidate portfolio securities, or borrow money, all of which impose certain costs on the fund. ReFlow provides participating mutual funds with another source of cash by standing ready to purchase shares from a fund equal to the amount of the fund’s net redemptions on a given day. ReFlow then generally redeems those shares when the fund experiences net sales or when the shares have been outstanding for the holding limit of 28 days, whichever comes first. In return for this service, the Veredus Small Cap Growth Fund will pay a fee to ReFlow at a rate determined by a daily auction with other participating mutual funds.
| | |
| |
| | October 31, 2012 |
| |
| Notes to Financial Statements – continued | | |
The costs to the Veredus Small Cap Growth Fund for participating in ReFlow are expected to be influenced by and comparable to the cost of other sources of liquidity, such as the Fund’s short-term lending arrangements or the costs of selling portfolio securities to meet redemptions. ReFlow will be prohibited from acquiring more than 3% of the outstanding voting securities of the Fund.
As of October 31, 2012, the Veredus Small Cap Growth Fund had not utilized ReFlow.
Note (K) Liquidations: ASTON/Cardinal Mid Cap Value Fund and ASTON/Neptune International Fund were terminated and liquidated on October 26, 2012.
Note (L) Significant Concentrations: Certain Funds may invest a significant percentage of their assets in securities of foreign issuers. These investments may involve certain considerations and risks not typically associated with investments in the United States as a result of, among other factors, the possibility of future political and economic developments and the level of governmental supervision and regulation of securities markets in the respective countries. Some countries in which the Funds invest may require government approval for repatriation of investment income, capital or the proceeds for sales of securities by foreign investors. In addition, if there is deterioration in a country’s balance of payments or for other reasons, a country may impose temporary restrictions on foreign capital remittances abroad. In addition, changes in currency exchange rates will affect the value of investments denominated in a foreign currency, as well as investment income derived from those securities.
Note (M) Subsequent Events: Management has evaluated the impact of all subsequent events on the Funds through the date the financial statements were issued, and has determined that there were no subsequent events requiring recognition or disclosure in the financial statements, except as follows.
At meetings held on December 13, 2012 and December 20, 2012, the Board of Trustees of the Trust determined to terminate and liquidate the ASTON/Veredus Select Growth Fund and ASTON Dynamic Allocation Fund, respectively. The estimated liquidation date for both Funds is on or about January 30, 2013.
At a meeting held on December 13, 2012, the Board of Trustees of the Trust approved the appointment of Lee Munder Capital Group, LLC as subadviser to ASTON/Veredus Small Cap Growth Fund and a name change for ASTON/Veredus Small Cap Growth Fund to ASTON Small Cap Fund, effective January 31, 2013. At the same meeting, the Board of Trustees of the Trust approved the merger of ASTON/Veredus Small Cap Growth Fund with and into ASTON Small Cap Growth Fund, each a series of the Trust, subject to the approval of shareholders of the ASTON/Veredus Small Cap Growth Fund (the “Merger”). If approved by the shareholders of the ASTON/Veredus Small Cap Growth Fund, the Merger will occur as soon as practicable after shareholder approval is obtained, likely on or about March 31, 2013.
| | |
| |
| | |
| |
| Report of Independent Registered Public Accounting Firm | | |
To the Shareholders and Board of Trustees of
Aston Funds
We have audited the accompanying statements of assets and liabilities, including the schedules of investments, of Aston Funds (the “Trust”) (comprising, respectively, ASTON/Montag & Caldwell Growth Fund, ASTON/Veredus Select Growth Fund, ASTON/TAMRO Diversified Equity Fund, ASTON/Herndon Large Cap Value Fund, ASTON/Cornerstone Large Cap Value Fund, ASTON/River Road Dividend All Cap Value Fund, ASTON/River Road Dividend All Cap Value Fund II, ASTON/Fairpointe Mid Cap Fund, ASTON/Montag & Caldwell Mid Cap Growth Fund, ASTON/Veredus Small Cap Growth Fund (formerly, ASTON/Veredus Aggressive Growth Fund), ASTON Small Cap Growth Fund (formerly, ASTON/Crosswind Small Cap Growth Fund), ASTON/Silvercrest Small Cap Fund, ASTON/TAMRO Small Cap Fund, ASTON/River Road Select Value Fund, ASTON/River Road Small Cap Value Fund, ASTON/River Road Independent Value Fund, ASTON/DoubleLine Core Plus Fixed Income Fund, ASTON/TCH Fixed Income Fund, ASTON/Lake Partners LASSO Alternatives Fund, ASTON Dynamic Allocation Fund, ASTON/Anchor Capital Enhanced Equity Fund (formerly, ASTON/M.D. Sass Enhanced Equity Fund), ASTON/River Road Long-Short Fund, ASTON/Barings International Fund, ASTON/Harrison Street Real Estate Fund, and ASTON/Montag & Caldwell Balanced Fund, (the “Funds”)) as of October 31, 2012, and the related statements of operations, statements of changes in net assets, and financial highlights for the periods indicated therein. These financial statements and financial highlights are the responsibility of the Trust’s management. Our responsibility is to express an opinion on these financial statements and financial highlights based on our audits.
We conducted our audits in accordance with the standards of the Public Company Accounting Oversight Board (United States). Those standards require that we plan and perform the audits to obtain reasonable assurance about whether the financial statements and financial highlights are free of material misstatement. We were not engaged to perform an audit of the Trust’s internal control over financial reporting. Our audits included consideration of internal control over financial reporting as a basis for designing audit procedures that are appropriate in the circumstances, but not for the purpose of expressing an opinion on the effectiveness of the Trust’s internal control over financial reporting. Accordingly, we express no such opinion. An audit also includes examining, on a test basis, evidence supporting the amounts and disclosures in the financial statements and financial highlights, assessing the accounting principles used and significant estimates made by management, and evaluating the overall financial statement presentation. Our procedures included confirmation of securities owned as of October 31, 2012, by correspondence with the custodian and brokers or by other appropriate auditing procedures where replies from brokers were not received. We believe that our audits provide a reasonable basis for our opinion.
In our opinion, the financial statements and financial highlights referred to above present fairly, in all material respects, the financial position of each of the respective portfolios constituting the Aston Funds at October 31, 2012, and the results of their operations, the changes in their net assets, and the financial highlights for the periods indicated therein, in conformity with U.S. generally accepted accounting principles.

Chicago, Illinois
December 20, 2012
| | |
| |
| | October 31, 2012 |
| |
| Additional Information (unaudited) | | |
Form N-Q: The Trust files complete schedules of portfolio holdings for the Funds with the Securities and Exchange Commission (the “SEC”) for the Trust’s first and third quarters of each fiscal year on Form N-Q. The Trust’s Form N-Q are available on the SEC’s website at www.sec.gov and are available for review and copying at the SEC’s Public Reference Room in Washington, DC. Information on the operations of the Public Reference Room may be obtained by calling the SEC at 202-942-8090.
Proxy Voting: Aston Funds’ Proxy Voting Policies and Procedures, used to determine how to vote proxies relating to portfolio securities, are included in the Trust’s Statement of Additional Information, which is available (i) upon request, without charge, by calling 800-992-8151; (ii) on Aston Funds’ website at www. astonfunds.com; and (iii) on the SEC’s website at www. sec.gov. Aston Funds’ Proxy Voting Record for the most recent twelve-month period ended June 30 is available without charge (i) on the Funds’ website at www.astonfunds.com; and (ii) on the SEC’s website at www.sec.gov.
Tax Information: In accordance with Federal tax law, the following Funds hereby make the designations indicated below regarding their fiscal year ended October 31, 2012:
The following are the estimated percentages of the income dividends qualifying for the dividends received deduction available to corporations:
| | | | |
Fund | | Percentage | |
| M&C Growth Fund | | | 100.00 | % |
| Veredus Select Growth Fund | | | 100.00 | % |
| Herndon Large Cap Value Fund | | | 24.32 | % |
| Cornerstone Large Cap Value Fund | | | 100.00 | % |
| River Road Dividend All Cap Value Fund | | | 78.94 | % |
| River Road Dividend All Cap Value Fund II | | | 75.31 | % |
| Fairpointe Mid Cap Fund | | | 100.00 | % |
| River Road Select Value Fund | | | 100.00 | % |
| River Road Independent Value Fund | | | 15.43 | % |
| Lake Partners LASSO Alternatives Fund | | | 24.66 | % |
| Dynamic Allocation Fund | | | 14.20 | % |
| Anchor Capital Enhanced Equity Fund | | | 17.65 | % |
| Barings International Fund | | | 4.76 | % |
| Harrison Street Real Estate Fund | | | 29.07 | % |
| M&C Balanced Fund | | | 82.34 | % |
Each Fund designates 100%, or if subsequently different, of ordinary income dividends (“QDI”) to qualify for the lower tax rates applicable to individual shareholders; and 100%, or if subsequently different, of ordinary income dividends to qualify for the dividends received deduction (“DRD”) for corporate shareholders. The actual percentage of QDI and DRD for the calendar year will be designated in year-end tax statements.
For the fiscal year ended October 31, 2012, certain dividends may be subject to a maximum tax rate of 15%, as qualified dividend income (“QDI”) under the Jobs and Growth Tax Relief Reconciliation Act of 2003. For individual shareholders, a percentage of their ordinary income dividends (dividend income plus short-term gains, if any) may qualify for a maximum tax rate of
15%. Complete information is computed and reported in conjunction with your Form 1099-DIV.
| | | | |
Fund | | Percentage | |
| M&C Growth Fund | | | 100.00 | % |
| Veredus Select Growth Fund | | | 100.00 | % |
| Herndon Large Cap Value Fund | | | 21.89 | % |
| Cornerstone Large Cap Value Fund | | | 100.00 | % |
| River Road Dividend All Cap Value Fund | | | 85.79 | % |
| River Road Dividend All Cap Value Fund II | | | 62.58 | % |
| Fairpointe Mid Cap Fund | | | 100.00 | % |
| River Road Select Value Fund | | | 100.00 | % |
| River Road Independent Value Fund | | | 14.56 | % |
| Lake Partners LASSO Alternatives Fund | | | 32.38 | % |
| Dynamic Allocation Fund | | | 100.00 | % |
| Anchor Capital Enhanced Equity Fund | | | 2.63 | % |
| Barings International Fund | | | 100.00 | % |
| Harrison Street Real Estate Fund | | | 29.07 | % |
| M&C Balanced Fund | | | 88.27 | % |
Shareholders should not use the above tax information to prepare their tax returns. The information will be included with your Form 1099-DIV which will be sent to you separately in January 2013.
FACTORS CONSIDERED BY THE BOARD OF TRUSTEES IN APPROVING THE INVESTMENT ADVISORY AGREEMENT FOR ASTON/RIVER ROAD DIVIDEND ALL CAP VALUE FUND II
At an in-person meeting on June 21, 2012, the Board of Trustees (the “Board”) of Aston Funds (the “Trust”), including the trustees who are not “interested persons” as defined in Section 2(a)(9) of the Investment Company Act of 1940, as amended (the “Independent Trustees”), determined that the terms of the Investment Advisory Agreement with Aston Asset Management, LP (“Aston”) with respect to the ASTON/River Road Dividend All Cap Value Fund II (the “New Fund”) are fair and reasonable and approved the Investment Advisory Agreement for the New Fund as being in the best interests of the New Fund. In making such determinations, the Board, including the Independent Trustees, considered materials received and discussions held with respect to the approval of the Investment Advisory Agreement at the June meeting and prior meetings. The Independent Trustees met separately from the “interested” Trustees of the Trust and any officers of Aston or its affiliates to consider approval of the Investment Advisory Agreement with respect to the New Fund and were assisted by independent legal counsel in their deliberations.
In evaluating the Investment Advisory Agreement on behalf of the New Fund, the Board reviewed information regarding: (1) the nature, quality and extent of the services to be provided to the New Fund; (2) the advisory fees to be charged and estimated total expense ratio of the New Fund compared to a peer group of funds; (3) fee waivers or expenses to be reimbursed by the investment adviser and/or subadviser; and (4) potential benefits to be received by Aston or its affiliates from Aston’s relationship with the New Fund. In considering the Investment Advisory Agreement on behalf of the New Fund, the Board,
| | |
| |
| | October 31, 2012 |
| |
| Additional Information (unaudited) – continued | | |
including the Independent Trustees, did not identify any single factor or group of factors as all-important or controlling, but considered all factors together. The following summary does not detail all the matters considered.
Nature, Quality and Extent of Services. The Board considered the nature, quality and extent of services provided by Aston, including advisory services and administrative services. The Board considered that Aston is a manager-of-managers, and that in its role as adviser to the New Fund it intends to delegate the day-to-day investment responsibility for managing the New Fund to a subadviser. Accordingly, the Board considered Aston’s capabilities and processes with respect to the selection and monitoring of subadvisers on an ongoing basis, as well as information regarding the composition, experience and role of its Investment Committee. In this regard, the Board noted the responsibilities and experience of Aston personnel, the resources made available to such personnel, the ability of Aston to attract and retain high quality personnel and the organizational depth and stability of Aston.
In addition to advisory services, the Board considered the quality of other services provided by Aston including oversight of service providers, regulatory administration and Board support, fund administration and operational support, compliance services, shareholder servicing and platform management, and distribution and marketing related services. The Board also considered the nature and quantity of services provided by Aston with respect to other series of the Trust. On the basis of this evaluation, the Board concluded that the nature, quality and extent of services to be provided by Aston are expected to be satisfactory.
Fees and Expenses. The Board considered the New Fund’s proposed management fee rate and total net expense ratio after contractual expense reimbursements and fee waivers. As a part of this analysis, the Board compared the proposed advisory fees and total net expenses to those of a relevant peer group for the New Fund. The Board concluded that the proposed advisory fees were reasonable and appropriate in light of the nature, quality and extent of services to be provided by Aston.
Costs and Profitability. With respect to the costs of services to be provided and profits expected to be realized by Aston, the Board considered the resources involved in managing the New Fund in light of Aston’s business model as well as fee waivers or expenses to be reimbursed under an Expense Reimbursement Agreement with Aston. The Board noted that, with respect to the New Fund, Aston and the subadviser each generally will bear 50% of any fee waivers or expense reimbursements. Because the New Fund has not yet commenced operations, profitability information was not available. However, based upon projected asset size and the impact of fee waivers or expenses to be reimbursed by the investment adviser, the Board concluded that profitability was not expected to be unreasonable.
Economies of Scale. The Board considered the extent to which economies of scale would be realized as the New Fund grows. The Board considered the potential asset size of the New Fund,
as well as the terms of the Expense Reimbursement Agreement, and concluded that at this time the potential for economies of scale are limited.
Other Benefits to the Investment Adviser. The Board considered the nature and amount of fees to be paid by the New Fund for services to be provided by Aston for administration services. The Board noted that Aston currently does not intend to manage any of the Aston Funds directly, and therefore, will not benefit from the use of “soft” commission dollars to pay for research and brokerage services. The Board concluded that any other benefits to be received by the Adviser from its relationship with the New Fund was not expected to be unreasonable.
Conclusion. Based upon its evaluation of all material factors and assisted by the advice of independent legal counsel, the Board, including all of the Independent Trustees, concluded that the terms of the Investment Advisory Agreement for the New Fund, including the proposed advisory fee, were fair and reasonable, and that the Investment Advisory Agreement on behalf of the New Fund should be approved.
FACTORS CONSIDERED BY THE BOARD OF TRUSTEES IN APPROVING THE SUB-INVESTMENT ADVISORY AGREEMENT FOR ASTON/RIVER ROAD DIVIDEND ALL CAP VALUE FUND II
The Board of Trustees (the “Board”) of Aston Funds (the “Trust”), including the trustees who are not “interested persons” as defined in Section 2(a)(9) of the Investment Company Act of 1940, as amended (the “Independent Trustees”), considered the approval of a Sub-Investment Advisory Agreement (the “Sub-Investment Advisory Agreement”) between Aston Asset Management, LP (“Aston”) and River Road Asset Management, LLC (“River Road”) with respect to the ASTON/River Road Dividend All Cap Value Fund II (the “New Fund”), at an in-person meeting on June 21, 2012. The Board considered information provided and discussions held at the June meeting and at prior meetings.
The Independent Trustees met separately from the “interested” Trustees of the Trust and any officers of Aston, River Road or their affiliates to consider approval of the Sub-Investment Advisory Agreement and were assisted by independent legal counsel in their deliberations. Among the matters considered by the Board, including the Independent Trustees, in connection with its approval of the Sub-Investment Advisory Agreement were the following:
Nature, Quality and Extent of Services. The Board considered the nature, quality and extent of services expected to be provided under the Sub-Investment Advisory Agreement. The Board considered the reputation, qualifications and background of River Road and its operational and compliance infrastructure. The Board also considered information provided regarding River Road’s investment approach, the experience and skills of senior management and investment personnel of River Road, the resources made available to such personnel, the ability of River Road to attract and retain high-quality personnel, and the
| | |
| |
| | October 31, 2012 |
| |
| Additional Information (unaudited) – continued | | |
organizational depth of River Road. The Board also considered the nature and quality of services provided by River Road with respect to other series of the Trust. On the basis of this evaluation, the Board concluded that the nature, quality and extent of services to be provided by River Road are expected to be satisfactory.
Fees, Profitability and Economies of Scale. The Board considered the subadvisory fee rate under the Sub-Investment Advisory Agreement as well as the overall management fee structure of the New Fund, noting that the subadvisory fee rate is fifty percent (50%) of management fees, fee waivers and expense reimbursements incurred by Aston and, depending on the asset size of the Fund, less certain third party payments. The Board considered that the subadvisory fee rate was negotiated at arm’s length between Aston and River Road, an unaffiliated third party, and that Aston would compensate River Road from the fees it receives from the Fund. As part of its review of the investment advisory agreement with Aston, the Board considered whether there will be economies of scale with respect to the overall fee structure of the New Fund and whether the New Fund will benefit from any economies of scale. The Board determined that profitability information with respect to River Road was not material to its considerations in light of the fee model used by Aston and the unaffiliated status of River Road. The Board concluded that the proposed subadvisory fee rate was reasonable in light of the nature, quality and extent of services to be provided and that economies of scale were limited at this time.
Other Benefits to the Subadviser. The Board also considered the character and amount of other incidental benefits expected to be received by River Road and its affiliates. The Board considered potential benefits to River Road from the use of “soft dollars” to pay for research services generated by parties other than the executing broker-dealer. The Board concluded that the subadvisory fees were reasonable taking into account any other benefits expected to be received by River Road from its relationship with the New Fund.
Conclusion. Based on all of the information considered and the conclusions reached, the Board determined that the terms of the Sub-Investment Advisory Agreement are fair and reasonable, and that the approval of the Sub-Investment Advisory Agreement is in the best interests of the New Fund. No single factor was determinative in the Board’s analysis.
FACTORS CONSIDERED BY THE BOARD OF TRUSTEES IN APPROVING THE SUB-INVESTMENT ADVISORY AGREEMENT FOR ASTON/ANCHOR CAPITAL ENHANCED EQUITY FUND
The Board of Trustees (the “Board”) of Aston Funds (the “Trust”), including the trustees who are not “interested persons” as defined in Section 2(a)(9) of the Investment Company Act of 1940, as amended (the “Independent Trustees”), considered the approval of a Sub-Investment Advisory Agreement (the “Sub-Investment Advisory Agreement”) between Aston Asset Management, LP (“Aston”) and Anchor Capital Advisors LLC (“Anchor Capital”) with respect to the ASTON/Anchor Capital Enhanced Equity Fund
(formerly, ASTON/M.D. Sass Enhanced Equity Fund) (the “Fund”), at an in-person meeting on June 21, 2012. The Board considered information provided and discussions held at the June 21, 2012 meeting.
The Independent Trustees met separately from the “interested” Trustees of the Trust and any officers of Aston, Anchor Capital or their affiliates to consider approval of the Sub-Investment Advisory Agreement and were assisted by independent legal counsel in their deliberations. Among the matters considered by the Board, including the Independent Trustees, in connection with its approval of the Sub-Investment Advisory Agreement were the following:
Nature, Quality and Extent of Services. The Board considered the nature, quality and extent of services expected to be provided under the Sub-Investment Advisory Agreement. The Board considered the reputation, qualifications and background of Anchor Capital and its operational and compliance infrastructure. The Board also considered information provided regarding the experience and skills of senior management and investment personnel of Anchor Capital, the resources made available to such personnel, the ability of Anchor Capital to attract and retain high-quality personnel, and the organizational depth of Anchor Capital. The Board considered that Mr. Ronald Altman, the portfolio manager of the Fund since its inception, would continue to manage the Fund at Anchor Capital, and that the investment objective and principal strategies of the Fund would not change. On the basis of this evaluation, the Board concluded that the nature, quality and extent of services to be provided by Anchor Capital are expected to be satisfactory.
Fees, Profitability and Economies of Scale. The Board considered the subadvisory fee rate under the Sub-Investment Advisory Agreement as well as the overall management fee structure of the Fund, noting that the subadvisory fee rate is fifty percent (50%) of management fees less certain third party payments, fee waivers and expense reimbursements incurred by Aston. The Board considered that the subadvisory fee rate was negotiated at arm’s length between Aston and Anchor Capital, an unaffiliated third party, and that Aston would compensate Anchor Capital from the fees it receives from the Fund. As part of its review of the investment advisory agreement with Aston during the annual contract renewal process, the Board had considered whether there would be economies of scale with respect to the overall fee structure of the Fund and whether the Fund would benefit from any economies of scale.
The Board also considered information provided by Anchor Capital with respect to fees charged to other clients. The Board considered that the fee rates charged to the Fund and other clients vary because of the additional regulatory and compliance requirements, among other things, associated with registered investment companies such as the Fund and other differences in the products and services provided, including differences in fee structures. The Board determined that profitability information with respect to the Anchor Capital was not material to its considerations in light of the fee model used by Aston and
| | |
| |
| | October 31, 2012 |
| |
| Additional Information (unaudited) – continued | | |
the unaffiliated status of Anchor Capital. The Board concluded that the proposed subadvisory fee rate was reasonable in light of the nature, quality and extent of services to be provided and that economies of scale were limited at this time.
Other Benefits to the Subadviser. The Board also considered the character and amount of other incidental benefits expected to be received by Anchor Capital as a result of its association with the Fund. The Board considered potential benefits to Anchor Capital from the use of “soft dollars” to pay for research services generated by parties other than the executing broker-dealer. The Board concluded that the subadvisory fees were reasonable taking into account any other benefits expected to be received by Anchor Capital from its relationship with the Fund.
Conclusion. Based on all of the information considered and the conclusions reached, the Board determined that the terms of the Sub-Investment Advisory Agreement are fair and reasonable, and that the approval of the Sub-Investment Advisory Agreement is in the best interests of the Fund. No single factor was determinative in the Board’s analysis.
FACTORS CONSIDERED BY THE BOARD OF TRUSTEES IN APPROVING THE CONTINUATION OF THE EXISTING SUB-INVESTMENT ADVISORY AGREEMENT FOR ASTON/CORNERSTONE LARGE CAP VALUE FUND
The Board of Trustees (the “Board”) of Aston Funds (the “Trust”), including the trustees who are not “interested persons” as defined in Section 2(a)(9) of the Investment Company Act of 1940, as amended (the “Independent Trustees”), considered the approval of the continuation of the Sub-Investment Advisory Agreement (the “Sub-Investment Advisory Agreement”) between Aston Asset Management, LP (“Aston”) and Cornerstone Investment Partners, LLC (“Cornerstone”) with respect to the ASTON/Cornerstone Large Cap Value Fund (the “Fund”), at an in-person meeting on September 20, 2012.
The Board considered information provided and discussions held at the September 20, 2012 meeting regarding certain anticipated ownership changes of Cornerstone, resulting from the retirement of the original founders (the “Transaction”). The Board considered that the Transaction may be deemed to result in an assignment of the Sub-Investment Advisory Agreement which would result in its automatic termination.
The Independent Trustees met separately from the “interested” Trustees of the Trust and any officers of Aston, Cornerstone or their affiliates to consider the approval of the continuation of the Sub-Investment Advisory Agreement and were assisted by independent legal counsel in their deliberations.
In determining whether to approve the continuation of the Sub-Investment Advisory Agreement, the Board noted that at its June 23, 2011 meeting, it had determined to approve the Sub-Investment Advisory Agreement. The Board also noted that, at its
September 15, 2011 meeting, it had determined to approve the continuation of the Sub-Investment Advisory Agreement (as a result of similar ownership changes in anticipation of the retirement of the founders) on the same terms, including the fees payable to Cornerstone. The Board noted that, with respect to the Sub-Investment Advisory Agreement, it had considered: (i) the nature, extent and quality of services to be provided; (ii) the sub-advisory fee rate and overall fee structure of the Fund; and (iii) other potential benefits to be received by Cornerstone. The Board considered that at its June 23, 2011 meeting, it had determined that the terms of the Sub-Investment Advisory Agreement were fair and reasonable and that the approval of the Sub-Investment Advisory Agreement was in the best interests of the Fund.
The Board also considered whether the Transaction would result in any change in personnel of Cornerstone and whether it would impact the nature, extent or quality of services provided to the Fund. Based on the information provided by Cornerstone, it was noted that the Transaction would not impact the nature, extent or quality of services provided by Cornerstone and that the Fund’s current portfolio management team would not change as a result.
Conclusion. Based on all of the information considered and the conclusions reached, the Board determined that the terms of the Sub-Investment Advisory Agreement were fair and reasonable, and that the approval of the continuation of the Sub-Investment Advisory Agreement was in the best interests of the Fund. No single factor was determinative in the Board’s analysis.
Disclosure of Fund Expenses: We believe it is important for you to understand the impact of fees regarding your investment. All mutual funds have operating expenses. As a shareholder of a mutual fund, you incur ongoing costs, which include costs for portfolio management, administrative services, and shareholder reports (like this one), among others. Operating expenses, which are deducted from a fund’s gross income, directly reduce the investment return of the fund. A fund’s expenses are expressed as a percentage of its average daily net assets. This figure is known as the expense ratio. The following examples are intended to help you understand the ongoing fees (in dollars) of investing in your Fund and to compare these costs with those of other mutual funds. The examples are based on an investment of $1,000 made at the beginning of the period shown and held for the entire period.
This table illustrates each Fund’s costs in two ways:
Actual Fund Return: This section helps you to estimate the actual expenses, after any applicable fee waivers, that you paid over the period. The “Ending Account Value” shown is derived from the Fund’s actual return for the past six-month period, the “Expense Ratio” column shows the period’s annualized expense
| | |
| |
| | October 31, 2012 |
| |
| Additional Information (unaudited) – continued | | |
ratio, and the “Expenses Paid During Period” column shows the dollar amount that would have been paid by an investor who started with $1,000 in the Fund at the beginning of the period. You may use the information here, together with your account value, to estimate the expenses that you paid over the period. To do so, simply divide your account value by $1,000 (for example, an $8,600 account value divided by $1,000 = 8.6), then multiply the result by the number given for your Fund in the first line under the heading entitled “Expenses Paid During Period.”
Hypothetical 5% Return: This section is intended to help you compare your Fund’s costs with those of other mutual funds. It assumes that the Fund had an annual return of 5% before expenses, but that the expense ratio is unchanged. In this case, because the return used is not the Fund’s actual return, the results do not apply to your investment. This example is useful in making comparisons to other mutual funds because the SEC requires all mutual funds to calculate expenses based on an assumed 5% annual return. You can assess your Fund’s costs by comparing this hypothetical example with the hypothetical examples that appear in shareholder reports of other funds.
Please note that the expenses shown in the table are meant to highlight and help you compare your ongoing costs only and do not reflect any transactional costs such as sales charges (loads) and redemption fees, which are described in the prospectus. If these costs were applied to your account, your costs would be higher.
| | | | | | | | | | | | | | | | |
| | | Beginning
Account
Value
5/1/12 | | | Ending
Account
Value
10/31/12 | | | Expense
Ratio(1) | | | Expenses
Paid During
Period(2) | |
| M&C Growth Fund | | | | | | | | | | | | | | | | |
Actual Fund Return | | | | | | | | | | | | | | | | |
Class N | | | $1,000 | | | | $1,001.20 | | | | 1.05% | | | | $5.28 | |
Class I | | | 1,000 | | | | 1,002.00 | | | | 0.80% | | | | 4.03 | |
Class R | | | 1,000 | | | | 999.60 | | | | 1.30% | | | | 6.53 | |
Hypothetical 5% Return | | | | | | | | | | | | | | | | |
Class N | | | $1,000 | | | | $1,019.86 | | | | 1.05% | | | | $5.33 | |
Class I | | | 1,000 | | | | 1,021.11 | | | | 0.80% | | | | 4.06 | |
Class R | | | 1,000 | | | | 1,018.60 | | | | 1.30% | | | | 6.60 | |
| Veredus Select Growth Fund | | | | | | | | | | | | | | | | |
Actual Fund Return | | | | | | | | | | | | | | | | |
Class N | | | $1,000 | | | | $981.40 | | | | 1.30% | | | | $6.47 | |
Class I | | | 1,000 | | | | 983.40 | | | | 1.05% | | | | 5.23 | |
Hypothetical 5% Return | | | | | | | | | | | | | | | | |
Class N | | | $1,000 | | | | $1,018.60 | | | | 1.30% | | | | $6.60 | |
Class I | | | 1,000 | | | | 1,019.86 | | | | 1.05% | | | | 5.33 | |
| TAMRO Diversified Equity Fund | | | | | | | | | | | | | |
Actual Fund Return | | | | | | | | | | | | | | | | |
Class N | | | $1,000 | | | | $1,006.00 | | | | 1.20% | | | | $6.05 | |
Class I | | | 1,000 | | | | 1,007.40 | | | | 0.95% | | | | 4.79 | |
Hypothetical 5% Return | | | | | | | | | | | | | | | | |
Class N | | | $1,000 | | | | $1,019.10 | | | | 1.20% | | | | $6.09 | |
Class I | | | 1,000 | | | | 1,020.36 | | | | 0.95% | | | | 4.82 | |
| Herndon Large Cap Value Fund | | | | | | | | | | | | | |
Actual Fund Return | | | | | | | | | | | | | | | | |
Class N | | | $1,000 | | | | $988.20 | | | | 1.30% | | | | $6.50 | |
Class I | | | 1,000 | | | | 989.00 | | | | 1.05% | | | | 5.25 | |
Hypothetical 5% Return | | | | | | | | | | | | | | | | |
Class N | | | $1,000 | | | | $1,018.60 | | | | 1.30% | | | | $6.60 | |
Class I | | | 1,000 | | | | 1,019.86 | | | | 1.05% | | | | 5.33 | |
| | | | | | | | | | | | | | | | |
| | | Beginning
Account
Value
5/1/12 | | | Ending
Account
Value
10/31/12 | | | Expense
Ratio(1) | | | Expenses
Paid During
Period(2) | |
| Cornerstone Large Cap Value Fund | | | | | | | | | | | | | |
Actual Fund Return | | | | | | | | | | | | | | | | |
Class N | | | $1,000 | | | | $1,011.90 | | | | 1.30% | | | | $6.57 | |
Class I | | | 1,000 | | | | 1,013.70 | | | | 1.05% | | | | 5.31 | |
Hypothetical 5% Return | | | | | | | | | | | | | | | | |
Class N | | | $1,000 | | | | $1,018.60 | | | | 1.30% | | | | $6.60 | |
Class I | | | 1,000 | | | | 1,019.86 | | | | 1.05% | | | | 5.33 | |
| River Road Dividend All Cap Value Fund | | | | | | | | | | | | | |
Actual Fund Return | | | | | | | | | | | | | | | | |
Class N | | | $1,000 | | | | $1,037.50 | | | | 1.13% | | | | $5.79 | |
Class I | | | 1,000 | | | | 1,038.90 | | | | 0.88% | | | | 4.51 | |
Hypothetical 5% Return | | | | | | | | | | | | | | | | |
Class N | | | $1,000 | | | | $1,019.46 | | | | 1.13% | | | | $5.74 | |
Class I | | | 1,000 | | | | 1,020.71 | | | | 0.88% | | | | 4.47 | |
| River Road Dividend All Cap Value Fund II(3) | | | | | | | | | |
Actual Fund Return | | | | | | | | | | | | | | | | |
Class N | | | $1,000 | | | | $1,050.90 | | | | 1.30% | | | | $4.63 | |
Class I | | | 1,000 | | | | 1,051.70 | | | | 1.05% | | | | 3.74 | |
Hypothetical 5% Return | | | | | | | | | | | | | | | | |
Class N | | | $1,000 | | | | $1,018.60 | | | | 1.30% | | | | $6.60 | |
Class I | | | 1,000 | | | | 1,019.86 | | | | 1.05% | | | | 5.33 | |
| Fairpointe Mid Cap Fund | | | | | | | | | | | | | |
Actual Fund Return | | | | | | | | | | | | | | | | |
Class N | | | $1,000 | | | | $1,020.60 | | | | 1.10% | | | | $5.59 | |
Class I | | | 1,000 | | | | 1,021.80 | | | | 0.85% | | | | 4.32 | |
Hypothetical 5% Return | | | | | | | | | | | | | | | | |
Class N | | | $1,000 | | | | $1,019.61 | | | | 1.10% | | | | $5.58 | |
Class I | | | 1,000 | | | | 1,020.86 | | | | 0.85% | | | | 4.32 | |
| M&C Mid Cap Growth Fund | | | | | | | | | | | | | |
Actual Fund Return | | | | | | | | | | | | | | | | |
Class N | | | $1,000 | | | | $959.30 | | | | 1.25% | | | | $6.16 | |
Hypothetical 5% Return | | | | | | | | | | | | | | | | |
Class N | | | $1,000 | | | | $1,018.85 | | | | 1.25% | | | | $6.34 | |
| Veredus Small Cap Growth Fund | | | | | | | | | | | | | |
Actual Fund Return | | | | | | | | | | | | | | | | |
Class N | | | $1,000 | | | | $984.10 | | | | 1.49% | | | | $7.43 | |
Class I | | | 1,000 | | | | 985.40 | | | | 1.24% | | | | 6.19 | |
Hypothetical 5% Return | | | | | | | | | | | | | | | | |
Class N | | | $1,000 | | | | $1,017.65 | | | | 1.49% | | | | $7.56 | |
Class I | | | 1,000 | | | | 1,018.90 | | | | 1.24% | | | | 6.29 | |
| Small Cap Growth Fund | | | | | | | | | | | | | |
Actual Fund Return | | | | | | | | | | | | | | | | |
Class N | | | $1,000 | | | | $1,027.00 | | | | 1.35% | | | | $6.88 | |
Class I | | | 1,000 | | | | 1,027.80 | | | | 1.10% | | | | 5.61 | |
Hypothetical 5% Return | | | | | | | | | | | | | | | | |
Class N | | | $1,000 | | | | $1,018.35 | | | | 1.35% | | | | $6.85 | |
Class I | | | 1,000 | | | | 1,019.61 | | | | 1.10% | | | | 5.58 | |
| Silvercrest Small Cap Fund | | | | | | | | | | | | | |
Actual Fund Return | | | | | | | | | | | | | | | | |
Class N | | | $1,000 | | | | $990.00 | | | | 1.40% | | | | $7.00 | |
Class I | | | 1,000 | | | | 991.80 | | | | 1.15% | | | | 5.76 | |
Hypothetical 5% Return | | | | | | | | | | | | | | | | |
Class N | | | $1,000 | | | | $1,018.10 | | | | 1.40% | | | | $7.10 | |
Class I | | | 1,000 | | | | 1,019.36 | | | | 1.15% | | | | 5.84 | |
| TAMRO Small Cap Fund | | | | | | | | | | | | | |
Actual Fund Return | | | | | | | | | | | | | | | | |
Class N | | | $1,000 | | | | $1,000.00 | | | | 1.28% | | | | $6.43 | |
Class I | | | 1,000 | | | | 1,001.00 | | | | 1.03% | | | | 5.18 | |
Hypothetical 5% Return | | | | | | | | | | | | | | | | |
Class N | | | $1,000 | | | | $1,018.70 | | | | 1.28% | | | | $6.50 | |
Class I | | | 1,000 | | | | 1,019.96 | | | | 1.03% | | | | 5.23 | |
| | |
| |
| | October 31, 2012 |
| |
| Additional Information (unaudited) – continued | | |
| | | | | | | | | | | | | | | | |
| | | Beginning
Account
Value
5/1/12 | | | Ending
Account
Value
10/31/12 | | | Expense
Ratio(1) | | | Expenses
Paid During
Period(2) | |
| River Road Select Value Fund | | | | | | | | | | | | | |
Actual Fund Return | | | | | | | | | | | | | | | | |
Class N | | | $1,000 | | | | $1,026.60 | | | | 1.41% | | | | $7.18 | |
Class I | | | 1,000 | | | | 1,027.50 | | | | 1.16% | | | | 5.91 | |
Hypothetical 5% Return | | | | | | | | | | | | | | | | |
Class N | | | $1,000 | | | | $1,018.05 | | | | 1.41% | | �� | | $7.15 | |
Class I | | | 1,000 | | | | 1,019.30 | | | | 1.16% | | | | 5.89 | |
| River Road Small Cap Value Fund | | | | | | | | | | | | | |
Actual Fund Return | | | | | | | | | | | | | | | | |
Class N | | | $1,000 | | | | $1,019.60 | | | | 1.35% | | | | $6.85 | |
Class I | | | 1,000 | | | | 1,021.00 | | | | 1.10% | | | | 5.59 | |
Hypothetical 5% Return | | | | | | | | | | | | | | | | |
Class N | | | $1,000 | | | | $1,018.35 | | | | 1.35% | | | | $6.85 | |
Class I | | | 1,000 | | | | 1,019.61 | | | | 1.10% | | | | 5.58 | |
| River Road Independent Value Fund(4) | | | | | | | | | | | | | |
Actual Fund Return | | | | | | | | | | | | | | | | |
Class N | | | $1,000 | | | | $1,049.60 | | | | 1.42% | | | | $7.32 | |
Class I | | | 1,000 | | | | 1,050.40 | | | | 1.17% | | | | 6.03 | |
Hypothetical 5% Return | | | | | | | | | | | | | | | | |
Class N | | | $1,000 | | | | $1,018.00 | | | | 1.42% | | | | $7.20 | |
Class I | | | 1,000 | | | | 1,019.25 | | | | 1.17% | | | | 5.94 | |
| DoubleLine Core Plus Fixed Income Fund | | | | | | | | | | | | | |
Actual Fund Return | | | | | | | | | | | | | | | | |
Class N | | | $1,000 | | | | $1,046.60 | | | | 0.94% | | | | $4.84 | |
Class I | | | 1,000 | | | | 1,047.80 | | | | 0.69% | | | | 3.55 | |
Hypothetical 5% Return | | | | | | | | | | | | | | | | |
Class N | | | $1,000 | | | | $1,020.41 | | | | 0.94% | | | | $4.77 | |
Class I | | | 1,000 | | | | 1,021.67 | | | | 0.69% | | | | 3.51 | |
| TCH Fixed Income Fund | | | | | | | | | | | | | |
Actual Fund Return | | | | | | | | | | | | | | | | |
Class N | | | $1,000 | | | | $1,057.90 | | | | 0.84% | | | | $4.35 | |
Class I | | | 1,000 | | | | 1,057.60 | | | | 0.69% | | | | 3.57 | |
Hypothetical 5% Return | | | | | | | | | | | | | | | | |
Class N | | | $1,000 | | | | $1,020.91 | | | | 0.84% | | | | $4.27 | |
Class I | | | 1,000 | | | | 1,021.67 | | | | 0.69% | | | | 3.51 | |
| Lake Partners LASSO Alternatives Fund(4) | | | | | | | | | | | | | |
Actual Fund Return | | | | | | | | | | | | | | | | |
Class N | | | $1,000 | | | | $1,005.70 | | | | 1.45% | | | | $7.31 | |
Class I | | | 1,000 | | | | 1,006.50 | | | | 1.20% | | | | 6.05 | |
Hypothetical 5% Return | | | | | | | | | | | | | | | | |
Class N | | | $1,000 | | | | $1,017.85 | | | | 1.45% | | | | $7.35 | |
Class I | | | 1,000 | | | | 1,019.10 | | | | 1.20% | | | | 6.09 | |
| Dynamic Allocation Fund | | | | | | | | | | | | | |
Actual Fund Return | | | | | | | | | | | | | | | | |
Class N | | | $1,000 | | | | $1,011.90 | | | | 1.30% | | | | $6.57 | |
Class I | | | 1,000 | | | | 1,013.10 | | | | 1.05% | | | | 5.31 | |
Hypothetical 5% Return | | | | | | | | | | | | | | | | |
Class N | | | $1,000 | | | | $1,018.60 | | | | 1.30% | | | | $6.60 | |
Class I | | | 1,000 | | | | 1,019.86 | | | | 1.05% | | | | 5.33 | |
| Anchor Capital Enhanced Equity Fund(4) | | | | | | | | | | | | | |
Actual Fund Return | | | | | | | | | | | | | | | | |
Class N | | | $1,000 | | | | $985.70 | | | | 1.24% | | | | $6.19 | |
Class I | | | 1,000 | | | | 986.90 | | | | 0.99% | | | | 4.94 | |
Hypothetical 5% Return | | | | | | | | | | | | | | | | |
Class N | | | $1,000 | | | | $1,018.90 | | | | 1.24% | | | | $6.29 | |
Class I | | | 1,000 | | | | 1,020.16 | | | | 0.99% | | | | 5.03 | |
| River Road Long-Short Fund(5) | | | | | | | | | | | | | |
Actual Fund Return | | | | | | | | | | | | | | | | |
Class N | | | $1,000 | | | | $1,029.80 | | | | 1.70% | | | | $8.67 | |
Hypothetical 5% Return | | | | | | | | | | | | | | | | |
Class N | | | $1,000 | | | | $1,016.59 | | | | 1.70% | | | | $8.62 | |
| | | | | | | | | | | | | | | | |
| | | Beginning
Account
Value
5/1/12 | | | Ending
Account
Value
10/31/12 | | | Expense
Ratio(1) | | | Expenses
Paid During
Period(2) | |
| Barings International Fund | | | | | | | | | | | | | |
Actual Fund Return | | | | | | | | | | | | | | | | |
Class N | | | $1,000 | | | | $991.30 | | | | 1.40% | | | | $7.01 | |
Class I | | | 1,000 | | | | 994.20 | | | | 1.15% | | | | 5.76 | |
Hypothetical 5% Return | | | | | | | | | | | | | | | | |
Class N | | | $1,000 | | | | $1,018.10 | | | | 1.40% | | | | $7.10 | |
Class I | | | 1,000 | | | | 1,019.36 | | | | 1.15% | | | | 5.84 | |
| Harrison Street Real Estate Fund | | | | | | | | | | | | | |
Actual Fund Return | | | | | | | | | | | | | | | | |
Class N | | | $1,000 | | | | $1,021.40 | | | | 1.37% | | | | $6.96 | |
Class I | | | 1,000 | | | | 1,022.50 | | | | 1.12% | | | | 5.69 | |
Hypothetical 5% Return | | | | | | | | | | | | | | | | |
Class N | | | $1,000 | | | | $1,018.25 | | | | 1.37% | | | | $6.95 | |
Class I | | | 1,000 | | | | 1,019.51 | | | | 1.12% | | | | 5.69 | |
| M&C Balanced Fund | | | | | | | | | | | | | |
Actual Fund Return | | | | | | | | | | | | | | | | |
Class N | | | $1,000 | | | | $1,007.30 | | | | 1.20% | | | | $6.05 | |
Class I | | | 1,000 | | | | 1,007.80 | | | | 1.10% | | | | 5.55 | |
Hypothetical 5% Return | | | | | | | | | | | | | | | | |
Class N | | | $1,000 | | | | $1,019.10 | | | | 1.20% | | | | $6.09 | |
Class I | | | 1,000 | | | | 1,019.61 | | | | 1.10% | | | | 5.58 | |
| (1) | Annualized, based on the Fund’s most recent fiscal half-year expenses. |
| (2) | Expenses are equal to the Fund’s annualized expense ratio multiplied by the average account value over the period, multiplied by the number of days in the most recent fiscal half-year (184) or partial year, if applicable, for the actual return and multiplied by the most recent fiscal half-year for the hypothetical 5% return, then divided by 366. Expense ratios do not include interest expense, if applicable. |
| (3) | River Road Dividend All Cap Value Fund II began issuing shares on June 27, 2012. |
| (4) | Earnings Credit did not affect the six months expense ratio for the six months ended October 31, 2012. |
| (5) | Excludes interest expense and dividends on short positions. If included, your annualized expenses ratio is 2.64% and your actual and hypothetical expenses paid during the period are $13.47 and $13.35, respectively. |
| | |
| |
| | October 31, 2012 |
| |
| Additional Information (unaudited) – continued | | |
TRUSTEES AND OFFICERS OF THE TRUST
Under Delaware law, the business and affairs of the Trust are managed under the direction of the Board of Trustees. Information pertaining to the Trustees and Executive Officers of the Trust is set forth below. The term “officer” means the president, vice president, secretary, treasurer, controller or any other officer who performs a policy making function.
| | | | | | | | | | | | |
Name, Address, Age and Position(s) with Trust | | Term of Office 1 and Length of Time Served | | Principal Occupation(s) During Past Five Years | | Number of Portfolios in Fund Complex 2
Overseen by Trustee | | | Other Trusteeships/ Directorships Held by Trustee During Past Five Years | | Experience, Qualifications, Attributes, Skills for Board Membership |
| | | | |
| INDEPENDENT TRUSTEES | | | | | | | | | | |
William E. Chapman, II c/o Aston Funds 120 N. LaSalle Street Chicago, IL 60602 Age: 71 Trustee; Independent Chairman | | Since 2010 | | President and Owner, Longboat Retirement Planning Solutions (1998-present); Trustee of Bowdoin College (2002-present); Hewitt Associates, LLC (part time) (provider of Retirement and Investment Education Seminars) (resigned Nov. 2009) | | | 25 | | | Director of Harding, Loevner Funds, Inc. (6 portfolios); Trustee of Third Avenue Trust (5 portfolios); Trustee of Third Avenue Variable Trust (1 portfolio); Trustee of The Managers Funds, Managers AMG Funds, Managers Trust I and Managers Trust II (39 portfolios) | | Significant board experience; significant executive experience with several financial services firms; service as Independent Chairman of the Board. |
| | | | | |
Edward J. Kaier c/o Aston Funds 120 N. LaSalle Street Chicago, IL 60602 Age: 67 Trustee | | Since 2010 | | Attorney at Law and Partner, Teeters Harvey Gilboy & Kaier LLP (2007-present); Attorney at Law and Partner, Hepburn Willcox Hamilton & Putnam, LLP (1977-2007) | | | 25 | | | Trustee of Third Avenue Trust (5 portfolios); Trustee of Third Avenue Variable Trust (1 portfolio); Trustee of The Managers Funds, Managers AMG Funds, Managers Trust I and Managers Trust II (39 portfolios) | | Significant board experience; practicing attorney. |
| | | | | |
Gregory T. Mutz c/o Aston Funds 120 N. LaSalle Street Chicago, IL 60602 Age: 67 Trustee | | Since 1993 | | Chairman and CEO of AMLI Residential Properties Trust (a Multifamily REIT), a successor company to AMLI Realty Co. (2004-present); Vice Chairman of UICI (NYSE: UCI) (an insurance holding company) (2003-2004) | | | 25 | | | Member of Board of Genesis Financial Solutions (a privately-held company based in Portland, Oregon providing debt recovery, consumer lending and credit card services) (2005-present); a member of the Board of WAN S.A., a residential real estate company headquartered in Warsaw, Poland (2008-present); a member of the Board of Suknip International Limited, a residential real estate company headquartered in St. Petersburg, Russia (2008- present); Formerly, Director of Alico, Inc. (NASDAQ: ALCO) (agribusiness) (2005-2009) | | Significant board experience; previous service as lead independent trustee; significant executive experience with several financial services firms. |
| | |
| |
| | October 31, 2012 |
| |
| Additional Information (unaudited) – continued | | |
| | | | | | | | | | | | |
Name, Address, Age and Position(s) with Trust | | Term of Office 1 and Length of Time Served | | Principal Occupation(s) During Past Five Years | | Number of Portfolios in Fund Complex 2
Overseen by Trustee | | | Other Trusteeships/ Directorships Held by Trustee During Past Five Years | | Experience, Qualifications, Attributes, Skills for Board Membership |
| | | | |
| INDEPENDENT TRUSTEES Continued) | | | | | | | | | | |
Steven J. Paggioli c/o Aston Funds 120 N. LaSalle Street Chicago, IL 60602 Age: 62 Trustee | | Since 2010 | | Independent Consultant (2002-present); formerly Executive Vice President and Director, The Wadsworth Group (1986-2001); Executive Vice President, Secretary and Director, Investment Company Administration, LLC (1990- 2001); Vice President, Secretary and Director, First Fund Distributors, Inc. (1991- 2001) | | | 25 | | | Trustee, Professionally Managed Portfolios (43 portfolios); Advisory Board Member, Sustainable Growth Advisors, LP; Independent Director, Chase Investment Counsel; Trustee of The Managers Funds, Managers AMG Funds, Managers Trust I and Managers Trust II (39 portfolios) | | Significant board experience; significant executive experience with several financial services firms; former service with financial service regulator. |
| | | | | |
Eric Rakowski c/o Aston Funds 120 N. LaSalle Street Chicago, IL 60602 Age: 54 Trustee | | Since 2010 | | Professor, University of California at Berkeley School of Law (1990-present) | | | 25 | | | Director of Harding, Loevner Funds, Inc. (6 portfolios); Trustee of Third Avenue Trust (5 portfolios); Trustee of Third Avenue Variable Trust (1 portfolio); Trustee of The Managers Funds, Managers AMG Funds, Managers Trust I and Managers Trust II (39 portfolios) | | Significant board experience; former practicing attorney; currently, professor of law. |
| | | | | |
Robert B. Scherer c/o Aston Funds 120 N. LaSalle Street Chicago, IL 60602 Age: 71 Trustee | | Since 1999 | | President of The Rockridge Group, Ltd. (title insurance industry consulting services) (1994-present) | | | 25 | | | Director, Title Reinsurance Company (insurance for title agents) (1998- present) | | Significant board experience; continuing service as Chair of the Audit Committee; significant executive experience as chief financial officer of insurance and financial services firm. |
| | |
| |
| | October 31, 2012 |
| |
| Additional Information (unaudited) – continued | | |
| | | | | | | | | | | | |
Name, Address, Age and Position(s) with Trust | | Term of Office 1 and Length of Time Served | | Principal Occupation(s) During Past Five Years | | Number of Portfolios in Fund Complex 2
Overseen by Trustee | | | Other Trusteeships/ Directorships Held by Trustee During Past Five Years | | Experience, Qualifications, Attributes, Skills for Board Membership |
| | | | |
| INDEPENDENT TRUSTEES (continued) | | | | | | | | | | |
Thomas R. Schneeweis c/o Aston Funds 120 N. LaSalle Street Chicago, IL 60602 Age: 71 Trustee | | Since 2010 | | Professor of Finance, University of Massachusetts (1977-present); Director, CISDM at the University of Massachusetts, (1996-present); President, TRS Associates (1982-present); President, Alternative Investment Analytics, LLC (formerly Schneeweis Partners, LLC) (2001-present); Partner, White Bear Partners, LLC (2007-2010); Partner, S Capital Management, LLC (2007-present); Partner, Northampton Capital Management, LLC (2004-2010) | | | 25 | | | Trustee of The Managers Funds, Managers AMG Funds, Managers Trust I and Managers Trust II (39 portfolios) | | Significant board experience; currently professor of finance; significant executive experience with several investment partnerships. |
| | | | |
| INTERESTED TRUSTEES | | | | | | | | | | |
Stuart D. Bilton, CFA3 c/o Aston Funds 120 N. LaSalle Street Chicago, IL 60602 Age: 66 Trustee; Chief Executive Officer | | Trustee since 1993; Chief Executive Officer since 2010 | | Chief Executive Officer, Aston Asset Management, LP (2006-present); Chairman, Aston Funds (1993-2010); Vice Chairman of ABN AMRO Asset Management Holdings, Inc. (2003-2006); President and Chief Executive Officer of ABN AMRO Asset Management Holdings, Inc. (2001-2003); President of Alleghany Asset Management, Inc. (1996-2001) (purchased by ABN AMRO in February 2001) | | | 25 | | | Director, Baldwin & Lyons, Inc. (property and casualty insurance firm) (1987-present); Director, Highbury Financial Inc. (2009- 2010) | | Significant board experience; significant executive experience with several financial services firms; former Chairman of the Board. |
| | | | | |
Jeffrey S. Murphy3 c/o Aston Funds 120 N. LaSalle Street Chicago, IL 60602 Age: 46 Trustee | | Since 2010 | | Senior Vice President, Affiliated Managers Group, Inc. (2007-present); Vice President, Affiliated Managers Group, Inc. (1995-2007) | | | 25 | | | N/A | | Significant financial industry experience; significant executive experience with several financial services firms. |
| | |
| |
| | October 31, 2012 |
| |
| Additional Information (unaudited) – continued | | |
| | | | | | | | | | | | |
Name, Address, Age and Position(s) with Trust | | Term of Office 1 and Length of Time Served | | Principal Occupation(s) During Past Five Years | | Number of Portfolios in Fund Complex 2 Overseen by Trustee | | | Other Trusteeships/ Directorships Held by Trustee During Past Five Years | | Experience, Qualifications, Attributes, Skills for Board Membership |
| | | | |
| OFFICER(S) WHO ARE NOT TRUSTEES | | | | | | | | | | |
Kenneth C. Anderson c/o Aston Funds 120 N. LaSalle Street Chicago, IL 60602 Age: 48 President | | Since 1993 | | President, Aston Asset Management, LP (2006-present); Director, Highbury Financial Inc. (2009-2010); President and Chief Executive Officer of ABN AMRO Investment Fund Services, Inc. (formerly known as Alleghany Investment Services, Inc.) (1995-2006); Executive Vice President of ABN AMRO Asset Management (USA) LLC (2001-2005); Director, ABN AMRO Trust Services Company (2001-2005); Director, TAMRO Capital Partners LLC and Veredus Asset Management LLC (2001-2006); CPA | | | N/A | | | N/A | | N/A |
| | | | | |
Gerald F. Dillenburg c/o Aston Funds 120 N. LaSalle Street Chicago, IL 60602 Age: 46 Senior Vice President and Secretary, Chief Operating Officer and Chief Compliance Officer | | Since 1996 | | Chief Compliance Officer and Chief Operating Officer, Aston Asset Management, LP (2006-present); Chief Financial Officer, Aston Asset Management, LP (2006- 2010); Senior Managing Director (“SMD”) of ABN AMRO Investment Fund Services, Inc. (formerly known as Alleghany Investment Services, Inc.) (1996-2006); SMD of ABN AMRO Asset Management Holdings, Inc. and ABN AMRO Asset Management, Inc. (formerly known as Chicago Capital Management, Inc.) (2001- 2006); CPA | | | N/A | | | N/A | | N/A |
| | | | | |
Laura M. Curylo c/o Aston Funds 120 N. LaSalle Street Chicago, IL 60602 Age: 44 Treasurer and Chief Financial Officer | | Since 2010 | | Chief Financial Officer, Aston Asset Management, LP (2010-present); Vice President and Controller, Aston Asset Management, LP (2006-present); Vice President, ABN AMRO Investment Fund Services, Inc. (formerly known as Alleghany Investment Services, Inc.) (1997-2006); CPA | | | N/A | | | N/A | | N/A |
| | |
| |
| | October 31, 2012 |
| |
| Additional Information (unaudited) – continued | | |
| | | | | | | | | | | | |
Name, Address, Age and Position(s) with Trust | | Term of Office 1 and Length of Time Served | | Principal Occupation(s) During Past Five Years | | Number of Portfolios in Fund Complex 2 Overseen by Trustee | | | Other Trusteeships/ Directorships Held by Trustee During Past Five Years | | Experience, Qualifications, Attributes, Skills for Board Membership |
| | | | |
| OFFICER(S) WHO ARE NOT TRUSTEES (continued) | | | | | | | | | | |
Christine C. Carsman c/o Aston Funds 120 N. LaSalle Street Chicago, IL 60602 Age: 59 Chief Legal Officer | | Since 2010 | | Senior Vice President (2007- present), Deputy General Counsel (2011-present), and Chief Regulatory Counsel (2004-present), Vice President (2004-2007), Affiliated Managers Group, Inc.; Trustee, Managers AMG Funds, The Managers Funds, Managers Trust I and Managers Trust II (2011-present); Senior Counsel, Vice President and Director of Operational Risk Management and Compliance, Wellington Management Company, LLP (1995-2004). | | | N/A | | | N/A | | N/A |
| 1 | | A Trustee serves for an indefinite term until the earliest of: (i) removal by two-thirds of the Board or shareholders, (ii) resignation, death or incapacity, (iii) the election and qualification of his successor, in accordance with the By-Laws of the Trust or (iv) the last day of the fiscal year in which he attains the age of 75 years. Officers serve for an indefinite term until the earliest of: (i) removal by the Board, (ii) resignation, death or incapacity, or (iii) the election and qualification of their successors, in accordance with the By-Laws of the Trust. |
| 2 | | The term Fund Complex includes all series of Aston Funds. |
| 3 | | “Interested person” of the Trust as defined in the 1940 Act. Mr. Bilton is considered an “interested person” because of his affiliation with Aston Asset Management, LP which acts as the Funds’ investment adviser. Mr. Murphy is considered an “interested person” because of his affiliations with Affiliated Managers Group, Inc., the ultimate parent of the investment adviser, and related entities. |
Aston Funds
ADVISER
Aston Asset Management, LP
120 N. LaSalle Street, 25th Floor
Chicago, IL 60602
SUB-ADVISERS
Anchor Capital Advisors LLC
One Post Office Square, Suite 3850
Boston, MA 02109
Baring International Investment Limited
155 Bishopsgate
London, EC2M 3XY UK
Cornerstone Investment Partners, LLC
Phipps Tower
3438 Peachtree Road NE, Suite 900
Atlanta, GA 30326
DoubleLine Capital LP
333 South Grand Avenue, Suite 1800
Los Angeles, CA 90071
Fairpointe Capital LLC
One North Franklin, Suite 3300
Chicago, IL 60606
Harrison Street Securities LLC
71 South Wacker Drive, Suite 3575
Chicago, IL 60606
Herndon Capital Management, LLC
191 Peachtree Street, NE, Suite 2500
Atlanta, GA 30303
Lake Partners, Inc.
4 High Ridge Park, Suite 300
Stamford, CT 06905
Lee Munder Capital Group, LLC
200 Clarendon Street, 28th Floor
Boston, MA 02116
SUBADVISERS - continued
Montag & Caldwell, LLC
3455 Peachtree Road NE, Suite 1200
Atlanta, GA 30326
River Road Asset Management, LLC
Meidinger Tower, Suite 1600
462 South Fourth Street
Louisville, KY 40202
Silvercrest Asset Management Group LLC
1330 Avenue of the Americas, 38th Floor
New York, NY 10019
Smart Portfolios, LLC
17865 Ballinger Way NE
Seattle, WA 98155
TAMRO Capital Partners LLC
1701 Duke St., Suite 250
Alexandria, VA 22314
Taplin, Canida & Habacht LLC
1001 Brickell Bay Drive, Suite 2100
Miami, FL 33131
Todd-Veredus Asset Management LLC
National City Tower
101 South Fifth Street, Suite 3100
Louisville, KY 40202
SHAREHOLDER SERVICES
Aston Funds
P.O. Box 9765
Providence, RI 02940
DISTRIBUTOR
Foreside Funds Distributors LLC
400 Berwyn Park
899 Cassatt Road
Berwyn, PA 19312
OFFICERS
Stuart D. Bilton, Chief Executive Officer
Kenneth C. Anderson, President
Gerald F. Dillenburg, Senior Vice President and Secretary, Chief Operating Officer and Chief Compliance Officer
Christine C. Carsman, Chief Legal Officer
Laura M. Curylo, Treasurer and Chief Financial Officer
Juli A. Braun, Assistant Treasurer
James A. Dimmick, Assistant Secretary
Marc J. Peirce, Assistant Secretary
Diana R. Podgorny, Assistant Secretary
CUSTODIAN
The Bank of New York Mellon
One Wall Street
New York, New York 10286
LEGAL COUNSEL
Vedder Price P.C.
222 N. LaSalle Street
Chicago, IL 60601
INDEPENDENT REGISTERED PUBLIC ACCOUNTING FIRM
Ernst & Young LLP
155 N. Wacker Drive
Chicago, IL 60606
THE STATEMENT OF ADDITIONAL INFORMATION INCLUDES ADDITIONAL INFORMATION ABOUT FUND TRUSTEES AND IS AVAILABLE UPON REQUEST WITHOUT CHARGE BY CALLING 800-992-8151.
Guide to Shareholder Benefits
We’re delighted to offer all Aston Funds shareholders a variety of services and convenient options. To receive more information about any of these benefits, simply call an Investor Services Associate Monday through Friday, 9 a.m. – 7 p.m. Eastern Time.
THE EASY WAY TO ADD TO YOUR ACCOUNT: START AN AUTOMATIC INVESTMENT PLAN
For Class N shareholders, systematic investing is an easy, effortless way to help reach any investment goal. Just choose a fixed amount, and we’ll automatically deduct it from your checking or savings account on a regular schedule and invest it in your Aston Funds account. Periodic investment plans involve continuous investments in securities regardless of price. You should consider your financial ability to continue to purchase shares through periods of both high and low price levels. This plan does not assure a profit and does not protect against loss in declining markets.
COMPOUND YOUR EARNINGS WITH AUTOMATIC DIVIDEND REINVESTMENT
By automatically reinvesting dividends into your Fund account, profits have the opportunity to mount. Monthly and quarterly dividends and annual capital gain distributions are reinvested at no charge.
ACCESS INFORMATION AND MAKE TRANSACTIONS ONLINE AT OUR WEBSITE
You can open a new account, access account balances, view statements, obtain fund information, and make transactions online 24 hours a day, 7 days a week.
| | |
| | www.astonfunds.com |
| |
| | Our Automated Shareholder Services Line Is at Your Service 24 Hours a Day |
| | 800-992-8151 |
Investor Services
Associates are available to assist you Monday – Friday 9 a.m. to 7 p.m., Eastern Time. Or, call any time, day or night, for automated account information to make exchanges or check fund performance.

Aston Funds
P.O. Box 9765
Providence, RI 02940
PART C
OTHER INFORMATION
Item 15. Indemnification
Section 10.2 of the Registrant’s Trust Instrument provides as follows:
10.2 Indemnification. The Trust shall indemnify each of its Trustees against all liabilities and expenses (including amounts paid in satisfaction of judgments, in compromise, as fines and penalties, and as counsel fees) reasonably incurred by him in connection with the defense or disposition of any action, suit or other proceeding, whether civil or criminal, in which he may be involved or with which he may be threatened, while as a Trustee or thereafter, by reason of his being or having been such a Trustee except with respect to any matter as to which he shall have been adjudicated to have acted in bad faith, willful misfeasance, gross negligence or reckless disregard of his duties, provided that as to any matter disposed of by a compromise payment by such person, pursuant to a consent decree or otherwise, no indemnification either for said payment or for any other expenses shall be provided unless the Trust shall have received a written opinion from independent legal counsel approved by the Trustees to the effect that if either the matter of willful misfeasance, gross negligence or reckless disregard of duty, or the matter of bad faith had been adjudicated, it would in the opinion of such counsel have been adjudicated in favor of such person. The rights accruing to any person under these provisions shall not exclude any other right to which he may be lawfully entitled, provided that no person may satisfy any right of indemnity or reimbursement hereunder except out of the property of the Trust. The Trustees may make advance payments in connection with the indemnification under this Section 10.2, provided that the indemnified person shall have given a written undertaking to reimburse the Trust in the event it is subsequently determined that he is not entitled to such indemnification.
The Trust shall indemnify officers, and shall have the power to indemnify representatives and employees of the Trust, to the same extent that Trustees are entitled to indemnification pursuant to this Section 10.2.
Insofar as indemnification for liability arising under the 1933 Act may be permitted to trustees, officers and controlling persons of Registrant pursuant to the foregoing provisions, or otherwise, Registrant has been advised that in the opinion of the SEC such indemnification is against public policy as expressed in that Act and is, therefore, unenforceable. In the event that a claim for indemnification against such liabilities (other than the payment by Registrant of expenses incurred or paid by a trustee, officer or controlling person of Registrant in the successful defense of any action, suit or proceeding) is asserted by such trustee, officer or controlling person in connection with the securities being registered, Registrant will, unless in the opinion of its counsel the matter has been settled by controlling precedent, submit to a court of appropriate jurisdiction the question whether such indemnification by it is against public policy as expressed in that Act and will be governed by the final adjudication of such issue.
C-1
Section 10.3 of the Registrant’s Trust Instrument, also provides for the indemnification of shareholders of the Registrant. Section 10.3 states as follows:
10.3 Shareholders. In case any Shareholder or former Shareholder of any Series shall be held to be personally liable solely by reason of his being or having been a shareholder of such Series and not because of his acts or omissions or for some other reason, the Shareholder or former Shareholder (or his heirs, executors, administrators or other legal representatives or, in the case of a corporation or other entity, its corporate or other general successor) shall be entitled out of the assets belonging to the applicable Series to be held harmless from and indemnified against all loss and expense arising from such liability. The Trust, on behalf of the affected Series, shall, upon request by the Shareholder, assume the defense of any claim made against the Shareholder for any act or obligation of the Series and satisfy any judgment thereon from the assets of the Series.
In addition, the Registrant currently has a trustees’ and officers’ liability policy covering certain types of errors and omissions.
Item 16. Exhibits
| | | | |
| (1) | | a) Trust Instrument dated September 10, 1993 is incorporated herein by reference to Post-Effective Amendment No. 8 filed on Form N-1A as filed on April 16, 1996. | | |
| | b) State of Delaware Certificate of Amendment to Certificate of Trust dated February 25, 1998 is incorporated herein by reference to Exhibit (a)(2) to Post-Effective Amendment No. 33 filed on Form N-1A as filed on September 21, 2001. | | |
| | c) State of Delaware Certificate of Amendment to Certificate of Trust dated September 10, 2001 is incorporated herein by reference to Exhibit (a)(3) to Post-Effective Amendment No. 33 filed on Form N-1A as filed on September 21, 2001. | | |
| | d) State of Delaware Certificate of Amendment to Certificate of Trust dated November 29, 2006 is incorporated herein by reference to Exhibit (a)(4) to Post-Effective Amendment No. 74 filed on Form N-1A as filed on November 30, 2006. | | |
| | |
| (2) | | Amended and Restated By-Laws dated July 8, 2010 are incorporated herein by reference to Exhibit (b)(4) to Post-Effective Amendment No. 116 filed on Form N-1A as filed on October 20, 2010. | | |
| | |
| (3) | | Not applicable. | | |
| | |
| (4) | | Form of Agreement and Plan of Reorganization is filed herein as Appendix A to Part A of this Registration Statement. | | |
| | |
| (5) | | Not applicable. | | |
C-2
| | | | |
| (6) | | a) Investment Advisory Agreement dated April 15, 2010 between the Trust and Aston Asset Management, LP is incorporated herein by reference to Exhibit (d)(1) to Post-Effective Amendment No. 112 filed on Form N-1A as filed on August 30, 2010. | | |
| | |
| | b) Revised Schedules A and B to the Investment Advisory Agreement between the Trust and Aston Asset Management, LP is incorporated herein by reference to Exhibit (d)(2) to Post-Effective Amendment No. 146 filed on Form N-1A as filed on February 28, 2013. | | |
| | |
| | c) Sub-Investment Advisory Agreement dated February 17, 2012 between Aston Asset Management, LP and Lee Munder Capital Group, LLC is incorporated herein by reference to Exhibit (d)(22) to Post-Effective Amendment No. 139 filed on Form N-1A as filed on February 29, 2012. | | |
| | |
| | d) Revised Schedule A to the Sub-Investment Advisory Agreement between Aston Asset Management, LP and Lee Munder Capital Group, LLC is incorporated by reference to Exhibit (d)(18) to Post-Effective Amendment No. 146 filed on Form N-1A as filed on February 28, 2013. | | |
| | |
| (7) | | a) Distribution Agreement between ABN AMRO Funds (currently known as Aston Funds) and ABN AMRO Distribution Services (USA), Inc. is incorporated herein by reference to Exhibit (e)(1) to Post-Effective Amendment No. 36 filed on Form N-1A filed on December 28, 2001. | | |
| | |
| | b) Amended Schedule A to the Distribution Agreement between ABN AMRO Funds (currently known as Aston Funds) and ABN AMRO Distribution Services (USA), Inc. is incorporated herein by reference to Exhibit (e)(2) to Post-Effective Amendment No. 36 filed on Form N-1A filed on December 28, 2001. | | |
| | |
| | c) Amendment No. 1 to Distribution Services Agreement is incorporated herein by reference to Exhibit (e)(3) to Post-Effective Amendment No. 47 filed on Form N-1A filed on February 28, 2003. | | |
| | |
| | d) Amendment No. 2 to Distribution Services Agreement is incorporated herein by reference to Exhibit (e)(4) to Post-Effective Amendment No. 47 filed on Form N-1A filed on February 28, 2003. | | |
| | |
| | e) Amendment No. 3 to Distribution Services Agreement is incorporated herein by reference to Exhibit (e)(5) to Post-Effective Amendment No. 47 filed on Form N-1A filed on February 28, 2003. | | |
| | |
| | f) Distribution Agreement between Aston Funds and BNY Mellon Distributors, Inc. (currently known as Foreside Funds Distributors, LLC) is incorporated herein by reference to Exhibit (e)(7) to Post-Effective Amendment No. 111 filed on Form N-1A as filed on August 6, 2010. | | |
C-3
| | | | |
| | g) Distribution Agreement between Aston Funds and Foreside Funds Distributors, LLC is incorporated herein by reference to Exhibit (e)(7) to Post-Effective Amendment No. 144 filed on Form N-1A as filed on December 28, 2012. | | |
| | |
| | h) Revised Schedule A to the Distribution Agreement is incorporated herein by reference to Exhibit (e)(7) to Post-Effective Amendment No. 144 filed on Form N-1A as filed on December 28, 2012. | | |
| | |
| | i) Form of Selling/Services Agreement for Aston Funds is incorporated herein by reference to Exhibit (e)(8) to Post-Effective Amendment No. 108 filed on Form N-1A as filed on February 26, 2010. | | |
| | |
| | j) ABN AMRO Assignment Agreement is incorporated herein by reference to Exhibit (e)(9) to Post-Effective Amendment No. 74 Filed on Form N-1A as filed on November 30, 2006. | | |
| | |
| | k) Mutual Fund Service Agent Agreement for Wrap Processing is incorporated herein by reference to Exhibit (e)(13) to Post-Effective Amendment No. 84 filed on Form N-1A as filed on July 31, 2007. | | |
| | |
| (8) | | Not applicable. | | |
| | |
| (9) | | a) Custodian Services Agreement dated May 5, 2003 by and between PFPC Trust Company and ABN AMRO Funds (currently known as Aston Funds) is incorporated herein by reference to Exhibit (g)(9) to Post-Effective Amendment No. 49 filed on Form N-1A as filed on June 30, 2003. | | |
| | |
| | b) Amendment to the Custodian Services Agreement is incorporated herein by reference to Exhibit (g)(2) to Post-Effective Amendment No. 58 filed on Form N-1A as filed on June 23, 2005. | | |
| | |
| | c) Revised Exhibit A to the Custodian Services Agreement is incorporated herein by reference to Exhibit (g)(3) to Post-Effective Amendment No. 144 filed on Form N-1A as filed on December 28, 2012. | | |
| | |
| | d) Russian Addendum to the Custodian Services Agreement for Aston/Barings International Fund is incorporated herein by reference to Exhibit (g)(4) to Post-Effective Amendment No. 102 filed on Form N-1A as filed on February 27, 2009. | | |
| | |
| | e) Amendment to the Custodian Services Agreement dated December 18, 2009 is incorporated herein by reference to Exhibit (g)(6) to Post-Effective Amendment No. 108 filed on Form N-1A as filed on February 26, 2010. | | |
C-4
| | | | |
| | f) Letter Agreement between Aston Funds and The Bank of New York Mellon appointing The Bank of New York Mellon as Foreign Custody Manager is incorporated herein by reference to Exhibit (g)(7) to Post-Effective Amendment No. 139 filed on Form N-1A as filed on February 29, 2012. | | |
| | |
| | g) Amendment to Custodian Services Agreement dated July 1, 2012 is incorporated herein by reference to Exhibit (g)(7) to Post-Effective Amendment No. 144 filed on Form N-1A as filed on December 28, 2012. | | |
| | |
| (10) | | a) Distribution and Services Plan pursuant to Rule 12b-1 is incorporated herein by reference to Exhibit (m)(1) to Post-Effective Amendment No. 33 filed on Form N-1A as filed on September 21, 2001. | | |
| | |
| | b) Amended Schedule A to Distribution and Services Plan pursuant to Rule 12b-1 is incorporated herein by reference to Exhibit (m)(2) to Post-Effective Amendment No. 36 filed on Form N-1A as filed on December 28, 2001. | | |
| | |
| | c) Distribution and Services Plan dated June 21, 2001, and amended December 20, 2001 and March 21, 2002, pursuant to Rule 12b-1 is incorporated herein by reference to Exhibit (m)(3) to Post-Effective Amendment No. 43 filed on Form N-1A as filed on July 3, 2002. | | |
| | |
| | d) Revised Schedule A to Distribution and Services Plan pursuant to Rule 12b-1 is incorporated by reference to Exhibit (m)(4) to Post-Effective Amendment No. 142 as filed on June 22, 2012. | | |
| | |
| | e) Distribution and Services Plan dated June 20, 2002, pursuant to Rule 12b-1 is incorporated herein by reference to Exhibit (m)(4) to Post-Effective Amendment No. 43 filed on Form N-1A as filed on July 3, 2002. | | |
| | |
| | f) Amended and Restated Distribution and Services Plan pursuant to Rule 12b-1 is incorporated herein by reference to Exhibit (m)(2) to Post-Effective Amendment No. 33 filed on Form N-1A as filed on September 21, 2001. | | |
| | |
| | g) Amended and Restated Distribution and Services Plan pursuant to Rule 12b-1 is incorporated herein by reference to Exhibit (m)(10) to Post-Effective Amendment No. 45 filed on Form N-1A as filed on October 28, 2002. | | |
C-5
| | | | |
| | h) Revised Schedule A to Amended and Restated Distribution and Services Plan pursuant to Rule 12b-1 is incorporated herein by reference to Exhibit (m)(8) to Post-Effective Amendment No. 144 filed on Form N-1A as filed on December 28, 2012. | | |
| | |
| | i) Revised Schedule A to Amended and Restated Distribution and Services Plan pursuant to Rule 12b-1 is incorporated herein by reference to Exhibit (m)(9) to Post-Effective Amendment No. 144 filed on Form N-1A as filed on December 28, 2012. | | |
| | |
| | j) Amended and Restated Multiple Class Plan pursuant to Rule 18f-3 is incorporated herein by reference to Exhibit (n)(7) to Post-Effective Amendment No. 133 filed on Form N-1A as filed on July 13, 2011. | | |
| | |
| (11) | | Opinion of Vedder Price P.C. is filed herewith | | |
| | |
| (12) | | Form of Tax Opinion of Vedder Price P.C. is filed herewith | | |
| | |
| (13) | | a) Transfer Agency Services Agreement between Alleghany Funds (currently known as Aston Funds) and PFPC Inc. (currently known as BNY Mellon Investment Servicing (US) Inc.), dated April 1, 2000, is incorporated herein by reference to Exhibit (h)(1) to Post-Effective Amendment No. 22 filed on Form N-1A as filed on June 30, 2000. | | |
| | b) Amendment No. 1 to the Transfer Agency Services Agreement is incorporated herein by reference to Exhibit (h)(2) to Post-Effective Amendment No. 22 filed on Form N-1A as filed on June 30, 2000. | | |
| | c) Amendment No. 2 to the Transfer Agency Services Agreement is incorporated herein by reference to Post-Effective Amendment No. 26 filed on Form N-1A as filed on March 1, 2001. | | |
| | d) Amendment No. 3 to the Transfer Agency Services Agreement is incorporated herein by reference to Exhibit (h)(4) to Post-Effective Amendment No. 51 filed on Form N-1A as filed on February 27, 2004. | | |
| | e) Amendment No. 4 to the Transfer Agency Services Agreement is incorporated herein by reference to Exhibit (h)(5) to Post-Effective Amendment No. 51 filed on Form N-1A as filed on February 27, 2004. | | |
| | f) Amendment No. 5 to the Transfer Agency Services Agreement is incorporated herein by reference to Exhibit (h)(6) to Post-Effective Amendment No. 51 filed on Form N-1A as filed on February 27, 2004. | | |
| | g) Amendment No. 6 to the Transfer Agency Services Agreement is incorporated herein by reference to Exhibit (h)(7) to Post-Effective Amendment No. 51 filed on Form N-1A as filed on February 27, 2004. | | |
| | h) Compliance Support Services Amendment to Transfer Agency Services Agreement is incorporated herein by reference as Exhibit (h)(9) to Post-Effective Amendment No. 55 filed on Form N-1A as filed on December 29, 2004. | | |
C-6
| | | | |
| | i) Anti-Money Laundering and Privacy Amendment to the Transfer Agency Services Agreement is incorporated herein by reference to Exhibit (h)(9) to Post-Effective Amendment No. 56 filed on Form N-1A as filed on February 25, 2005. | | |
| | j) Customer Identification Services Amendment to Transfer Agency Services Agreement is incorporated herein by reference to Exhibit (h)(10) to Post-Effective Amendment No. 56 filed on Form N-1A as filed on February 25, 2005. k) Amendment to the Transfer Agency Services Agreement is incorporated herein by reference to Exhibit (h)(12) to Post-Effective Amendment No. 58 filed on Form N-1A as filed on June 23, 2005. l) Section 312 Foreign Financial Institution Amendment to the Transfer Agency Services Agreement is incorporated herein by reference to Exhibit (h)(15) to Post-Effective Amendment No. 76 filed on Form N-1A as filed on December 22, 2006. m) Revised Exhibit A to the Transfer Agency Services Agreement is incorporated herein by reference to Exhibit (h)(13) to Post-Effective Amendment No. 144 filed on Form N-1A as filed on December 28, 2012. n) Amendment to the Transfer Agency Services Agreement dated December 18, 2009 is incorporated herein by reference to Exhibit (h)(14) to Post-Effective Amendment No. 108 filed on Form N-1A as filed on February 26, 2010. o) Amendment to Transfer Agency Services Agreement Regarding Red Flag Services is incorporated herein by reference to Exhibit (h)(15) to Post-Effective Amendment No. 106 filed on Form N-1A as filed on December 30, 2009. p) Amendment to Transfer Agency Services Agreement dated July 1, 2012 is incorporated herein by reference to Exhibit (h)(16) to Post-Effective Amendment No. 144 filed on Form N-1A as filed on December 28, 2012. q) Administration Agreement between Alleghany Funds (currently known as Aston Funds) and Alleghany Investment Services, Inc. dated June 7, 1999, is incorporated herein by reference to Exhibit (h) to Post-Effective Amendment No. 17 filed on Form N-1A as filed on June 28, 1999. r) Amendment No. 1 to the Administration Agreement is incorporated herein by reference to Exhibit (h)(3) to Post-Effective Amendment No. 22 filed on Form N-1A as filed on June 30, 2000. s) Amendment No. 2 to the Administration Agreement is incorporated herein by reference to Exhibit (h) to Post-Effective Amendment No. 24 filed on Form N-1A as filed on December 29, 2000. t) Amendment No. 3 to the Administration Agreement is incorporated herein by reference to Exhibit (h)(9) to Post-Effective Amendment No. 36 filed on Form N-1A as filed on December 28, 2001. | | |
C-7
| | | | |
| | u) Amendment No. 4 to the Administration Agreement is incorporated herein by reference to Exhibit (h)(10) to Post-Effective Amendment No. 36 filed on Form N-1A as filed on December 28, 2001. | | |
| | v) Amendment No. 5 to the Administration Agreement is incorporated herein by reference to Exhibit (h)(13) to Post-Effective Amendment No. 47 filed on Form N-1A as filed on February 28, 2003. w) Amendment No. 6 to the Administration Agreement is incorporated herein by reference to Exhibit (h)(14) to Post-Effective Amendment No. 47 filed on Form N-1A as filed on February 28, 2003. x) Amendment No. 7 to the Administration Agreement is incorporated herein by reference to Exhibit (h)(15) to Post-Effective Amendment No. 47 filed on Form N-1A as filed on February 28, 2003. y) Amendment No. 8 to the Administration Agreement is incorporated herein by reference to Exhibit (h)(19) to Post-Effective Amendment No. 50 filed on Form N-1A as filed on December 30, 2003. z) Amendment No. 9 to the Administration Agreement is incorporated herein by reference to Exhibit (h)(20) to Post-Effective Amendment No. 51 filed on Form N-1A as filed on February 27, 2004. aa) Amendment No. 10 to the Administration Agreement is incorporated herein by reference to Exhibit (h)(24) to Post-Effective Amendment No. 58 filed on Form N-1A as filed on June 23, 2005. bb) Amendment No. 11 to the Administration Agreement is incorporated herein by reference to Exhibit (h)(28) to Post-Effective Amendment No. 144 filed on Form N-1A as filed on December 28, 2012. cc) Revised Schedule C to the Administration Agreement is incorporated herein by reference to Exhibit (h)(27) to Post-Effective Amendment No. 142 filed on Form N-1A as filed on June 22, 2012. dd) Sub-Administration and Accounting Services Agreement between Alleghany Investment Services Inc. and PFPC Inc. (currently known as BNY Mellon Investment Servicing (US) Inc.), dated April 1, 2000, is incorporated herein by reference to Exhibit (h)(4) to Post-Effective Amendment No. 22 filed on Form N-1A as filed on June 30, 2000. ee) Amendment No. 1 to the Sub-Administration and Accounting Services Agreement is incorporated herein by reference to Exhibit (h)(5) to Post-Effective Amendment No. 22 filed on Form N-1A as filed on June 30, 2000. ff) Amendment No. 2 to the Sub-Administration and Accounting Services Agreement is incorporated herein by reference to Post-Effective Amendment No. 26 filed on Form N-1A as filed on March 1, 2001. gg) Amendment No. 3 to the Sub-Administration and Accounting Services Agreement is incorporated herein by reference to Exhibit (h)(24) to Post-Effective Amendment No. 56 filed on Form N-1A as filed on February 25, 2005. | | |
C-8
| | | | |
| | hh) Amendment No. 4 to the Sub-Administration and Accounting Services Agreement is incorporated herein by reference to Exhibit (h)(25) to Post-Effective Amendment No. 56 filed on Form N-1A as filed on February 25, 2005. | | |
| | ii) Amendment No. 5 to the Sub-Administration and Accounting Services Agreement is incorporated herein by reference to Exhibit (h)(26) to Post-Effective Amendment No. 56 filed on Form N-1A as filed on February 25, 2005. | | |
| | jj) Amendment No. 6 to the Sub-Administration and Accounting Services Agreement is incorporated herein by reference to Exhibit (h)(27) to Post-Effective Amendment No. 56 filed on Form N-1A as filed on February 25, 2005. | | |
| | kk) Amendment to Sub-Administration and Accounting Services Agreement is incorporated herein by reference to Exhibit (h)(29) to Post-Effective Amendment No. 56 filed on Form N-1A as filed on February 25, 2005. | | |
| | ll) Amendment to the Sub-Administration and Accounting Services Agreement is incorporated herein by reference to Exhibit (h)(35) to Post-Effective Amendment No. 58 filed on Form N-1A as filed on June 23, 2005. | | |
| | mm) Amendment to the Sub-Administration and Accounting Services Agreement is incorporated herein by reference to Exhibit (h)(35) to Post-Effective Amendment No. 102 filed on Form N-1A as filed on February 27, 2009. | | |
| | nn) Amendment to the Sub-Administration and Accounting Services Agreement is incorporated herein by reference to Exhibit (h)(36) to Post-Effective Amendment No. 104 filed on Form N-1A as filed on October 5, 2009. | | |
| | oo) Revised Schedule B to the Sub-Administration and Accounting Services Agreement is incorporated herein by reference to Exhibit (h)(36) to Post-Effective Amendment No. 97 filed on Form N-1A as filed on February 28, 2008. | | |
| | pp) Revised Exhibit A to the Sub-Administration and Accounting Services Agreement is incorporated herein by reference to Exhibit (h)(13) to Post-Effective Amendment No. 144 filed on Form N-1A as filed on December 28, 2012. | | |
| | qq) Amendment to the Sub-Administration and Accounting Services Agreement is incorporated herein by reference to Exhibit (h)(41) to Post-Effective Amendment No. 108 filed on Form N-1A as filed on February 26, 2010. | | |
| | rr) Amendment to the Sub-Administration and Accounting Services Agreement dated July 1, 2012 is incorporated herein by reference to Exhibit (d)(21) to Post-Effective Amendment No. 144 filed on Form N-1A as filed on December 28, 2012. | | |
| | |
| (l4) | | Consent of Independent Auditor is filed herewith. | | |
| | |
| (15) | | Not applicable. | | |
C-9
| | | | |
| (16) | | Power of Attorney dated January 22, 2013 is incorporated herein by reference to Exhibit (16) to Registrant’s initial registration statement on Form N-14 as filed on January 30, 2013. | | |
| | |
| (17) | | Form of Proxy is filed herein and appears following the Proxy Statement/Prospectus included in this Registration Statement. | | |
Item 17. Undertakings
(1) The undersigned Registrant agrees that prior to any public reoffering of the securities registered through the use of a prospectus which is a part of this registration statement by any person or party who is deemed to be an underwriter within the meaning of Rule 145(c) of the Securities Act of 1933, the reoffering prospectus will contain the information called for by the applicable registration form for reofferings by persons who may be deemed underwriters, in addition to the information called for by the other items of the applicable form.
(2) The undersigned Registrant agrees that every prospectus that is filed under paragraph (1) above will be filed as a part of an amendment filed on Form N-1A and will not be used until the amendment is effective, and that, in determining any liability under the Securities Act of 1933 Act, each post-effective amendment shall be deemed to be a new registration statement for the securities offered therein, and the offering of the securities at that time shall be deemed to be the initial bona fide offering of them.
C-10
SIGNATURES
As required by the Securities Act of 1933, this registration statement has been signed on behalf of the registrant, in the City of Chicago, the State of Illinois, on the 4th day of March, 2013.
| | |
| ASTON FUNDS |
| |
| By: | | /s/ Stuart D. Bilton |
| | Stuart D. Bilton |
| | Chief Executive Officer |
As required by the Securities Act of 1933, this registration statement has been signed by the following persons in the capacities and on the dates indicated:
| | | | | | |
Signature | | | | Capacity | | Date |
| | | |
/s/ Stuart D. Bilton* Stuart D. Bilton | | | | Trustee | | |
| | | |
/s/ William E. Chapman, II* William E. Chapman, II | | | | Independent Chairman, Trustee | | |
| | | |
/s/ Edward J. Kaier* Edward J. Kaier | | | | Trustee | | |
| | | |
/s/ Jeffrey S. Murphy* Jeffrey S. Murphy | | | | Trustee | | |
| | | |
/s/ Gregory T. Mutz* Gregory T. Mutz | | | | Trustee | | |
| | | |
/s/ Steven J. Paggioli* Steven J. Paggioli | | | | Trustee | | |
| | | |
/s/ Eric P. Rakowski* Eric P. Rakowski | | | | Trustee | | |
| | | |
/s/ Robert B. Scherer* Robert B. Scherer | | | | Trustee | | |
| | | |
/s/ Thomas R. Schneeweis* Thomas R. Schneeweis | | | | Trustee | | |
| | | | | | |
Signature | | | | Capacity | | Date |
| | | |
/s/ Stuart D. Bilton Stuart D. Bilton | | | | Chief Executive Officer | | March 4, 2013 |
| | | |
/s/ Laura M. Curylo Laura M. Curylo | | | | Chief Financial Officer and Treasurer | | March 4, 2013 |
| | | |
/s/ Laura M. Curylo Laura M. Curylo | | | | Attorney-in-fact | | March 4, 2013 |
* Signed by Laura M. Curylo pursuant to a Power of Attorney previously filed as Exhibit 16 to Registrant’s registration statement on Form N-14 filed on January 30, 2013.
EXHIBIT INDEX
| | |
Exhibit No. | | Name of Exhibit |
| |
| 11 | | Opinion of Vedder Price P.C. |
| |
| 12 | | Form of Tax opinion of Vedder Price P.C. |
| |
| 14 | | Consent of Independent Auditor |