| UNITED STATES | OMB APPROVAL |
| SECURITIES AND EXCHANGE OMMISSION | OMB Number: 3235-00595 |
| Washington, D.C. 20549 | Expires: February 28, 2006 |
| SCHEDULE 14A | Estimated average burden hours per response......... 12.75 |
Proxy Statement Pursuant to Section 14(a) of the Securities
Exchange Act of 1934 (Amendment No. )
| Filed by the Registrant x | |
| Filed by a Party other than the Registrant o | |
| Check the appropriate box: | |
| o | Preliminary Proxy Statement |
| o | Confidential, for Use of the Commission Only (as permitted by Rule 14a-6(e)(2)) |
| x | Definitive Proxy Statement |
| o | Definitive Additional Materials |
| o | Soliciting Material Pursuant to Rule §240.14a-12 |
JDS UNIPHASE CORPORATION
(Name of Registrant as Specified In Its Charter)
(Name of Registrant as Specified In Its Charter)
(Name of Person(s) Filing Proxy Statement, if other than the Registrant)
Payment of Filing Fee (Check the appropriate box):
| x | No fee required. | |
| o | Fee computed on table below per Exchange Act Rules 14a-6(i)(1) and 0-11. | |
| 1. | Title of each class of securities to which transaction applies: | |
| 2. | Aggregate number of securities to which transaction applies: | |
| 3. | Per unit price or other underlying value of transaction computed pursuant to Exchange Act Rule 0-11 (set forth the amount on which the filing fee is calculated and state how it was determined): | |
| 4. | Proposed maximum aggregate value of transaction: | |
| 5. | Total fee paid: | |
| SEC 1913 (03-04) Persons who are to respond to the Collection of information contained in this form are not required to respond unless the form displays a currently valid OMB cotrol number. | ||
| o | Fee paid previously with preliminary materials. | |
| o | Check box if any part of the fee is offset as provided by Exchange Act Rule 0-11(a)(2) and identify the filing for which the offsetting fee was paid previously. Identify the previous filing by registration statement number, or the Form or Schedule and the date of its filing. | |
| 1. | Amount Previously Paid: | |
| 2. | Form, Schedule or Registration Statement No.: | |
| 3. | Filing Party: | |
| 4. | Date Filed: | |

JDS UNIPHASE CORPORATION
1768 Automation Parkway
San Jose, California 95131
(408) 546-5000
Notice of Annual Meeting of Stockholders
and Proxy Statement
Letter to Stockholders
2004 Annual Report
| YOUR VOTE IS IMPORTANT. WHETHER OR NOT YOU PLAN TO ATTEND THE MEETING, PLEASE COMPLETE, SIGN, DATE AND RETURN THE ACCOMPANYING PROXY CARD IN THE ENCLOSED POSTAGE-PAID ENVELOPE OR VOTE TELEPHONE OR ELECTRONICALLY VIA THE INTERNET. |
CONSIDERING REGISTERING ELECTRONICALLY FOR STOCKHOLDER MATERIALS?
It costs JDS Uniphase a significant sum each year to print and distribute this Proxy Statement and Annual Report to our stockholders.
You can help us reduce costs—and directly impact our bottom line—by registering to receive your stockholder materials electronically. To register on-line see Page 4 of the following Proxy Statement or call the Investor Relations hotline at 408-546-4445 for assistance.
JDS UNIPHASE CORPORATION
1768 Automation Parkway
San Jose, California 95131
(408) 546-5000
October 1, 2004
Dear Stockholder:
I am pleased to invite you to attend JDS Uniphase Corporation’s 2004 annual meeting of stockholders (the “Annual Meeting”), which will be held at our corporate offices located at 1768 Automation Parkway, San Jose, California 95131, on November 16, 2004 at 8:30 a.m., Pacific Standard Time.
If you are unable to attend the Annual Meeting in person, you may listen to a live audio webcast on our website at www.jdsu.com under “Investor Relations”.
Details of the business to be conducted at the Annual Meeting are given in the attached notice of annual meeting of stockholders and proxy statement. In order to reduce costs, we have also included our fiscal 2004 annual report as part of this document.
Your vote is important. Whether or not you plan to attend the Annual Meeting, please complete, sign, date and promptly return the accompanying proxy in the enclosed postage-prepaid envelope. You may also vote via telephone or Internet, as outlined on the enclosed proxy card. If you vote via the Internet, you can elect to access future proxy statements and annual reports on our website.
Your Board of Directors recommends that you vote in favor of the two proposals outlined in the proxy statement.
On behalf of the Board of Directors, I would like to express our appreciation for your continued support and interest in JDS Uniphase Corporation. We look forward to seeing you at the Annual Meeting.
Sincerely,

Kevin J. Kennedy, Ph.D.
Chief Executive Officer
Chief Executive Officer
JDS UNIPHASE CORPORATION
NOTICE OF ANNUAL MEETING OF STOCKHOLDERS
TO BE HELD ON NOVEMBER 16, 2004
TIME | 8:30 a.m., Pacific Standard Time, on November 16, 2004 | ||
LOCATION | JDS Uniphase Corporation 1768 Automation Parkway San Jose, California 95131 (408)546-5000 | ||
PROPOSALS | 1. | To elect three Class I directors to serve until the 2007 annual meeting of stockholders and until their successors are elected and qualified. | |
| 2. | To ratify the appointment of Ernst & Young LLP as JDS Uniphase Corporation’s Independent Registered Accounting Firm for the fiscal year ending June 30, 2005. | ||
| 3. | To consider such other business as may properly come before the annual meeting and any adjournment or postponement thereof. | ||
| These items of business are more fully described in the proxy statement which is attached and made a part hereof. | |||
RECORD DATE | You are entitled to vote at the 2004 annual meeting of stockholders (the “Annual Meeting”) and any adjournment or postponement thereof if you were a stockholder at the close of business on September 15, 2004. | ||
VOTING | Your vote is important. Whether or not you expect to attend the Annual Meeting, you are urged to vote promptly to ensure your representation and the presence of a quorum at the Annual Meeting. You may vote your shares by using the Internet or the telephone. Instructions for using these services are set forth on the enclosed proxy card. You may also vote your shares by marking, signing, dating and returning the proxy card in the enclosed postage-prepaid envelope. If you send in your proxy card and then decide to attend the Annual Meeting to vote your shares in person, you may still do so. Your proxy is revocable in accordance with the procedures set forth in the proxy statement. | ||
By Order of the Board of Directors,
Kevin J. Kennedy, Ph.D.
Chief Executive Officer
Chief Executive Officer
San Jose, California
October 1, 2004
JDS UNIPHASE CORPORATION
1768 Automation Parkway
San Jose, California 95131
(408) 546-5000
____________________
PROXY STATEMENT
____________________
GENERAL INFORMATION
Why am I receiving these proxy materials?
The Board of Directors (the “Board”) of JDS Uniphase Corporation, a Delaware corporation (the “Company”), is furnishing these proxy materials to you in connection with the Company’s 2004 annual meeting of stockholders (the “Annual Meeting”). The Annual Meeting will be held at the Company’s corporate offices located at 1768 Automation Parkway, San Jose, California 95131, on November 16, 2004 at 8:30 a.m., Pacific Standard Time. You are invited to attend the Annual Meeting and are entitled and requested to vote on the proposals outlined in this proxy statement (“Proxy Statement”).
What proposals will be voted on at the Annual Meeting?
There are two proposals scheduled to be voted on at the Annual Meeting:
| 1. | To elect three Class I directors to serve until the 2007 annual meeting of stockholders and until their successors are elected and qualified; |
| 2. | To ratify the appointment of Ernst & Young LLP as the Company’s Independent Registered Public Accounting Firm (hereinafter referred to as “independent auditors”) for the fiscal year ending June 30, 2005; and |
| 3. | To consider such other business as may properly come before the Annual Meeting and any adjournment or postponement thereof. |
As to any other business which may properly come before the Annual Meeting, the persons named on the enclosed proxy card will vote according to their best judgment. We do not know now of any other matters to be presented or acted upon at the Annual Meeting.
What are the recommendations of the Company’s Board of Directors?
The Board recommends that you vote “FOR” the election of the three Class I directors and “FOR” the ratification of the appointment of Ernst & Young LLP as the Company’s independent auditors for the fiscal year ending June 30, 2005.
What is the record date and what does it mean?
The record date for the Annual Meeting is September 15, 2004. The record date is established by the Board of Directors as required by Delaware law. Holders of shares of the Company’s common stock and holders of exchangeable shares of JDS Uniphase Canada Ltd., a subsidiary of the Company, at the close of business on the record date are entitled to receive notice of the Annual Meeting and to vote at the Annual Meeting and any adjournments or postponements thereof.
What shares can I vote?
Each stockholder of the Company’s common stock, par value $.001 per share (“Common Stock”), is entitled to one vote for each share of Common Stock owned as of the record date, and CIBC Mellon Trust
Company (the “Trustee”), the holder of the Company’s special voting share (“Special Voting Share”), is entitled to one vote for each exchangeable share of JDS Uniphase Canada Ltd., a subsidiary of the Company (“Exchangeable Shares”), outstanding as of the record date (other than Exchangeable Shares owned by the Company and its affiliates). Holders of Common Stock and the Special Voting Share are collectively referred to as “Stockholders.” Votes cast with respect to Exchangeable Shares will be voted through the Special Voting Share by the Trustee as directed by the holders of Exchangeable Shares, except votes cast with respect to Exchangeable Shares whose holders request to vote directly in person as proxy for the Trustee at the Annual Meeting.
At the record date, 1,381,318,328 shares of Common Stock were issued and outstanding, one share of the Company’s Special Voting Share was issued and outstanding, and 62,203,721 Exchangeable Shares were issued and outstanding (excluding Exchangeable Shares owned by the Company and its affiliates which are not voted). Each Exchangeable Share is exchangeable at any time, at the option of its holder, for one share of the Company’s Common Stock.
What is the voting requirement to approve each of the proposals?
For Proposal 1, election of directors, the three candidates receiving the greatest number of affirmative votes of the votes attached to shares of Common Stock and the Special Voting Share will be elected, provided a quorum is present and voting. Proposal 2 will require the affirmative vote of a majority of the votes attached to shares of Common Stock and the Special Voting Share, voting together as a single class, present or represented by proxy and entitled to vote at the Annual Meeting.
All shares of Common Stock and the Special Voting Share represented by valid proxies will be voted in accordance with the instructions contained therein. Votes with respect to Exchangeable Shares represented by valid voting instructions received by the Trustee will be cast by the Trustee in accordance with those instructions. In the absence of instructions, proxies from holders of Common Stock will be voted FOR Proposals 1 and 2. If no instructions are received by the Trustee from a holder of Exchangeable Shares, the votes to which such holder is entitled will not be exercised.
How do I vote my shares?
If you are a common stockholder of record, you can either attend the Annual Meeting and vote in person or give a proxy to be voted at the Annual Meeting:
| • | by mailing the enclosed proxy card; |
| • | over the telephone by calling a toll-free number; or |
| • | electronically, using the Internet. |
The Internet and telephone voting procedures have been set up for your convenience and are designed to authenticate stockholders’ identities, to allow stockholders to provide their voting instructions, and to confirm that their instructions have been recorded properly. The Company believes the procedures which have been put in place are consistent with the requirements of applicable law. Specific instructions for stockholders of record who wish to use the Internet or telephone voting procedures are set forth on the enclosed proxy card.
If you are a record holder of Exchangeable Shares, you can either attend the Annual Meeting and vote in person or give a proxy to be voted at the Annual Meeting:
| • | by mailing the enclosed voting instruction card to the Trustee. |
If a holder of Exchangeable Shares does not provide the Trustee with voting instructions, your Exchangeable Shares will not be voted.
Who will tabulate the votes?
An automated system administered by ADP Investor Communication Services (“ADP”) will tabulate votes cast by proxy at the Annual Meeting and a representative of the Company will tabulate votes cast in person at the Annual Meeting.
2
Is my vote confidential?
Proxy instructions, ballots and voting tabulations that identify individual Stockholders are handled in a manner that protects your voting privacy. Your vote will not be disclosed either within the Company or to third parties, except (i) as necessary to meet applicable legal requirements, (ii) to allow for the tabulation and/or certification of the vote, or (iii) to facilitate a successful proxy solicitation by the Board of Directors. Occasionally, Stockholders provide written comments on their proxy cards which are then forwarded to the Company’s management.
What are the quorum and voting requirements?
The presence, in person or by proxy, of the holders of a majority of the shares of the Company’s Common Stock and Exchangeable Shares entitled to vote is necessary to constitute a quorum at the Annual Meeting. Under the General Corporation Law of the State of Delaware, an abstaining vote and a broker “non-vote” are counted as present and are, therefore, included for purposes of determining whether a quorum of shares is present at the Annual Meeting. Broker “non-votes” are not included in the tabulation of the voting results on the election of directors or issues requiring approval of a majority of the shares present or represented by proxy and entitled to vote at the Annual Meeting and, therefore, do not have an effect on Proposals 1 and 2. A broker “non-vote” occurs when a nominee holding shares for a beneficial owner does not vote on a particular proposal because the nominee does not have the discretionary voting instructions with respect to that item and has not received instructions from the beneficial owner. Under the rules that govern brokers who are voting with respect to shares held by them as nominee, brokers have the discretion to vote such shares on routine matters, but not on non-routine matters. Routine matters include, among others, the election of directors and ratification of auditors. Non-routine matters include, among others, amendments to stock option plans. For the purpose of determining whether the stockholders have approved matters other than the election of directors, abstentions are treated as shares present or represented and voting, so abstentions have the same effect as negative votes. Shares held by brokers who do not have discretionary authority to vote on a particular matter and have not received voting instructions from their customers are not counted or deemed to be present or represented for purposes of determining whether Stockholders have approved that matter.
With respect to Proposal 1, a plurality of the votes duly cast is required for the election of directors (i.e., the nominees receiving the greatest number of votes will be elected). Abstentions are not counted for purposes of the election of directors.
With respect to Proposal 2 and any other matters (other than the election of directors) on which Stockholders of the Company are entitled to vote, the affirmative vote of the holders of a majority of the Stockholders’ shares present in person or represented by proxy and entitled to vote, is required. For the purpose of determining whether the Stockholders have approved matters, other than the election of directors, abstentions are treated as shares present or represented and voting, so abstaining has the same effect as a negative vote.
Can I change my vote after submitting my proxy?
You may revoke your proxy at any time before the final vote at the Annual Meeting. You may do so by one of the following four ways:
| • | submitting another proxy card bearing a later date; |
| • | sending a written notice of revocation to the Company’s Corporate Secretary at 1768 Automation Parkway, San Jose, California, 95131; |
| • | submitting new voting instructions via telephone or the Internet; or |
| • | attending AND voting in person at the Annual Meeting. |
If you hold Exchangeable Shares and you wish to direct the Trustee to change the vote attached to the Special Voting Share on your behalf, you should follow carefully the instructions provided by the Trustee, which accompany this Proxy Statement. The procedure for instructing the Trustee differs in certain respects from the
3
procedure for delivering a proxy, including the place for depositing the instructions and the manner for revoking the proxy.
Who is paying for this proxy solicitation?
This Proxy Statement and the accompanying proxy were first sent by mail to common stockholders, the Trustee for the Special Voting Share, and holders of Exchangeable Shares on or about October 1, 2004. The Company will bear the cost of soliciting proxies, including preparation, assembly, printing and mailing of the Proxy Statement. In addition, the Company will reimburse brokerage firms and other persons representing beneficial owners of shares for their expenses in forwarding solicitation materials to such beneficial owners. Proxies may be solicited by certain of the Company’s directors, officers and regular employees, without additional compensation, either personally, by telephone, facsimile, or telegram.
How can I find out the voting results?
The Company will announce the preliminary results at the Annual Meeting and publish the final results in the Company’s Quarterly Report on Form 10-Q for the second quarter of fiscal 2005.
How do I receive electronic access to proxy materials for the current and future annual meetings?
Stockholders who elected to receive the Proxy Statement and Annual Report over the Internet will be receiving an e-mail on or about October 1, 2004 with information on how to access stockholder information and instructions for voting over the Internet. Stockholders of record may vote via the Internet until 11:59 p.m. Eastern Time, November 15, 2004.
If your shares are registered in the name of a brokerage firm and you have not elected to receive your Proxy Statement and Annual Report over the Internet, you still may be eligible to vote your shares electronically over the Internet. A large number of brokerage firms are participating in the ADP online program, which provides eligible Stockholders who receive a paper copy of this Proxy Statement the opportunity to vote via the Internet. If your brokerage firm is participating in ADP’s program, your proxy card will provide instructions. If your proxy card does not reference Internet information, please complete and return the proxy card in the postage-paid envelope provided.
Stockholders can elect to view future proxy statements and annual reports over the Internet instead of receiving paper copies, which results in cost savings for the Company. If you are a stockholder of record and would like to receive future stockholder materials electronically, you can elect this option by following the instructions provided when you vote your proxy over the Internet atwww.ProxyVote.com.
If you chose to view future proxy statements and annual reports over the Internet, you will receive an e-mail notification next year with instructions containing the Internet address of those materials. Your choice to view future proxy statements and annual reports over the Internet will remain in effect until you contact either your broker or the Company to rescind your instructions. You do not have to elect Internet access each year.
If you elected to receive this Proxy Statement electronically over the Internet and would now like to receive a paper copy of this Proxy Statement so that you may submit a paper proxy in lieu of an electronic proxy, you should contact your broker or the Company.
How can I avoid having duplicate copies of the proxy statements sent to my household?
Some brokers and other nominee record holders may be participating in the practice of “householding” proxy statements and annual reports, which results in cost savings for the Company. The practice of “householding” means that only one copy of the proxy statement and annual report will be sent to multiple Stockholders in a Stockholder’s household. The Company will promptly deliver a separate copy of either
4
document to any Stockholder who contacts the Company’s investor relations department at (408) 546-5000 requesting such copies. If a Stockholder is receiving multiple copies of the proxy statement and annual report at the Stockholder’s household and would like to receive a single copy of those documents for a Stockholder’s household in the future, Stockholders should contact their broker, other nominee record holder, or the Company’s investor relations department to request mailing of a single copy of the proxy statement and annual report.
When are stockholder proposals due for next year’s annual meeting?
In order for stockholder proposals to be considered properly brought before an annual meeting by a stockholder, the stockholder must have given timely notice in writing to the Secretary of the Company. To be timely for the 2005 annual meeting of stockholders (the “2005 Annual Meeting”), a stockholder’s notice must be received by the Company at its principal executive offices not less than 30 days nor more than 60 days prior to the 2005 Annual Meeting; provided however that in the event less than 40 days notice or prior public disclosure of the date of the meeting is made or given to the stockholders, notice by the stockholder to be on time must be received not later than the close of business on the tenth day following the day on which notice of the 2005 Annual Meeting was mailed or public disclosure was made. A stockholder’s notice to the Secretary must set forth as to each matter the stockholder proposes to bring before the 2005 Annual Meeting: (i) a brief description of the business desired to be brought before the 2005 Annual Meeting and the reasons for conducting such business at the 2005 Annual Meeting; (ii) the name and record address of the stockholder proposing such business; (iii) the class and number of shares of the Company which are beneficially owned by the stockholder; and (iv) any material interest of the stockholder in such business.
Subject to applicable laws and regulations, the Company has discretion over what stockholder proposals will be included in the agenda for next year’s annual meeting and/or in the related proxy materials. Subject to applicable laws and regulations, the Company will also have discretionary authority to vote all shares for which it has proxies in opposition to a matter if the Company’s fails to receive notice of a stockholder proposal for next year’s annual meeting by August 17, 2005. Stockholder proposals submitted pursuant to Rule 14a-8 under the Securities Exchange Act of 1934, as amended, and intended to be presented at the Company’s 2005 Annual Meeting must be received by the Company not later than June 3, 2005 in order to be considered for inclusion in the Company’s proxy materials.
5
PROPOSAL 1
ELECTION OF DIRECTORS
The Board is divided into three classes as nearly equal in number as possible. The members of each class of directors serve staggered three-year terms. Currently, the Board is composed of the following seven members:
| Class | Directors | Term Expiration | ||
|---|---|---|---|---|
| I | Bruce D. Day, Martin A. Kaplan and Kevin J. Kennedy, Ph.D. | 2004 Annual Meeting of Stockholders | ||
| II | Robert E. Enos and Peter A. Guglielmi | 2006 Annual Meeting of Stockholders | ||
| III | Richard T. Liebhaber and Casimir S. Skrzypczak | 2005 Annual Meeting of Stockholders |
The Corporate Governance Committee of the Board of Directors has recommended, and the Board of Directors has nominated, the three nominees named below for election as Class I directors of the Company, each to serve a three-year term until the 2007 annual meeting of stockholders and until a qualified successor is elected and qualified or until the director’s earlier resignation or removal. Each of the nominees has consented, if elected as a Class I director of the Company, to serve until his term expires. The Board of Directors has no reason to believe each of the nominees will not serve if elected, but if either one of them should become unavailable to serve as a director, and if the Board designates a substitute nominee, the persons named as proxies will vote for the substitute nominee designated by the Board.
Jozef Straus, Ph.D. resigned as a director of the Company effective as of July 6, 2004. The Board amended the bylaws of the Company to reduce the authorized number of directors of the Company to seven directors effective upon Dr. Straus’ resignation.
Class I Nominees for Three-Year Terms That Will Expire in 2007
Bruce D. Day Age 48 | Mr. Day became a member of the Company’s Board of Directors in July 1999 upon the closing of the merger with JDS FITEL Inc. (“JDS FITEL”) and served as a member of the JDS FITEL Board of Directors from 1996 until July 1999. Since 1991, Mr. Day has been Vice President, Corporate Development of Rogers Communications Inc. and is principally involved in mergers, acquisitions, divestitures, taxation and pensions for Rogers Communications Inc. and its subsidiaries. | |
Martin A. Kaplan Age 67 | Mr. Kaplan has been a member of the Company’s Board of Directors since May 1998. Mr. Kaplan has served as the Chairman of the Board since May 2000. From May 1995 until his retirement in May 2000, Mr. Kaplan was Executive Vice President of Pacific Telesis and was responsible for coordinating integration plans following the merger of SBC Communications, Inc. and Pacific Telesis Group. From 1993 to 1995, he was Chief Technology, Quality and Re-Engineering Officer for Pacific Bell. Mr. Kaplan also is a director of Tekelec, Superconductor Technologies and Redback Networks. | |
Kevin J. Kennedy, Ph.D. Age 48 | Dr. Kennedy became a member of the Company’s Board in November 2001, and upon the retirement of Dr. Jozef Straus, became Chief Executive Officer of the Company on September 1, 2003. From August 2001 to September 2003, Dr. Kennedy was the Chief Operating Officer of Openwave Systems, Inc. Prior to joining Openwave Systems Inc. Dr. Kennedy served seven years at Cisco Systems, Inc., most recently as Senior Vice President of the Service Provider Line of Business and Software Technologies Division, and 17 years at Bell Laboratories. Dr. Kennedy is a director of Quantum Corporation, Rambus Corporation, Openwave Systems, Inc., and Freescale Semiconductor, Inc. |
6
THE BOARD RECOMMENDS A VOTEFOR THE ELECTION
TO THE BOARD OF EACH OF THE NOMINEES NAMED ABOVE
The Company’s directors listed below will continue in office for the remainder of their terms or earlier in accordance with the Company’s bylaws. Information regarding the business experience of each such director is provided below.
Class II Directors Whose Terms Will Expire in 2006
Robert E. Enos Age 65 | Mr. Enos became a member of the Company’s Board in July 1999 upon the closing of the merger with JDS FITEL and was previously a member of the JDS FITEL Board of Directors from 1996 until July 1999. Mr. Enos was the Vice President, Product Line Management, Cable Group and the Vice President, Transmission Network Division of Northern Telecom Limited from 1992 to 1994 and from 1989 to 1992, respectively. Mr. Enos retired from Northern Telecom Limited in 1994. | |
Peter A. Guglielmi Age 60 | Mr. Gulielmi has been a member of the Company’s Board since May 1998. Mr. Guglielmi retired as Executive Vice President of Tellabs, Inc. in 2000, where he served as its Chief Financial Officer since 1988. From 1993 to 1997, he was also President of Tellabs International, Inc. Prior to joining Tellabs, Mr. Guglielmi was Vice President of Finance and Treasurer of Paradyne Corporation for five years. |
Class III Directors Whose Terms Will Expire in 2005
Richard T. Liebhaber Age 69 | Mr. Liebhaber became a member of the Company’s Board in November 2001. Mr. Liebhaber retired as Executive Vice President and Chief Technology Officer of MCI Communications, Inc. (“MCI”) in 1995. Prior to joining MCI in 1985, Mr. Liebhaber was IBM’s director of Business Policy and Development after serving in engineering, manufacturing, product test, service and marketing positions. Mr. Liebhaber is also a director of ECI Telecom Ltd., ILOG S.A. and Avici Systems, Inc. | |
Casimir S. Skrzypczak Age 63 | Mr. Skrzypczak has been a member of the Company’s Board of Directors since July 1997. Since July 2001, Mr. Skrzypczak has been a general partner in Global Asset Capital Investment. From October 1999 to July 2001, Mr. Skrzypczak was Senior Vice President at Cisco Systems, Inc. Mr. Skrzypczak served as Corporate Vice President and Group President of Professional Services at Telcordia Technologies, Inc. from July 1997 to October 1999. Earlier, Mr. Skrzypczak was President, NYNEX Science & Technology and Vice President, Network & Technology Planning for NYNEX. Mr. Skrzypczak has served as a trustee of Polytechnic University since 1987 and is chairman of its Education Committee. Mr. Skrzypczak also serves as a director of Sirenza Microdevices Inc., ECI Telecom Ltd. and Webex Communications, Inc. |
7
Board Committees and Meetings
During fiscal 20041, the Board held eight meetings. The Board has four committees: Audit Committee, Compensation Committee, Corporate Governance Committee, and Corporate Development Committee. The members of the committees during fiscal 2004 are identified in the following table:
| Director | Audit | Compensation | Corporate Development | Governance | |||
|---|---|---|---|---|---|---|---|
| Bruce D. Day | Chair | X | |||||
| Robert E. Enos | X | Chair | |||||
| Peter A. Guglielmi | X | X | |||||
| Martin A. Kaplan | X | X | X | ||||
Kevin J. Kennedy2 | X | ||||||
| Richard T. Liebhaber | X | Chair | X | ||||
| Casimir S. Skrzypczak | X | Chair | X |
No director attended fewer than 75% of all Board meetings and committees on which he served after becoming a member of the Board of Directors. The Company encourages, but does not require, its Board members to attend the annual stockholders meeting. One of the Company’s directors, Martin A. Kaplan, chairman of the board, attended the 2003 annual meeting of stockholders.
The Audit Committee met seven times in fiscal 2004. The Audit Committee is responsible for assisting the full Board of Directors in fulfilling its oversight responsibilities relative to the Company’s financial statements, financial reporting practices, systems of internal accounting and financial controls, the internal audit function, annual independent audits of the Company’s financial statements, and such legal and ethics programs as may established from time to time by the Board. The Audit Committee is empowered to investigate any matter brought to its attention with full access to all books, records, facilities, and personnel of the Company and may retain external consultants at its sole discretion. In addition, the Audit Committee considers whether the Company’s independent auditors’ provision of non-audit services is compatible with maintaining the independence of the independent auditors. The Board has determined that all members of the Audit Committee are “independent” as that term is defined in Rule 4200 of the Marketplace Rules of the Nasdaq Stock Market, Inc. The Board has further determined that Bruce D. Day and Peter A. Guglielmi are “audit committee financial expert(s)” as defined by Item 401(h) of Regulation S-K of the Securities Exchange Act of 1934, as amended (the “Exchange Act”) and are independent as defined by Item 7(d)(3)(iv) of Schedule 14A of the Exchange Act. A copy of the Audit Committee charter, as amended to date, was attached as Appendix A to the Company’s 2003 proxy statement. A copy of the Audit Committee charter can also be viewed at the Company’s website onwww.jdsu.com.
The Compensation Committee met six times in fiscal 2004. The Compensation Committee of the Board of Directors is responsible for insuring that the Company adopts and maintains responsible and responsive compensation programs for its employees, officers and directors consistent with the long-range interests of stockholders. The Compensation Committee is also responsible for administering certain other compensation programs for such individuals, subject in each instance to approval by the full Board. The Compensation Committee also has the exclusive responsibility for the administration of the Company’s employee stock
| 1 | In fiscal 2001, the Company changed its year-end from a fiscal year ending on June 30 to a 52-week fiscal year ending on the Saturday closest to June 30. The Company’s fiscal 2004 year ended on July 3, 2004, whereas fiscal 2003 and 2002 ended on June 28, 2003 and June 29, 2002, respectively. For comparative presentation purposes, all accompanying tables and notes have been shown as ended on June 30. |
| 2 | Effective September 1, 2003, Dr. Kennedy resigned as a member of the Compensation Committee and as chair for the Corporate Development Committee. Dr. Kennedy will continue as a member of the Corporate Development Committee. |
8
purchase plans and equity incentive plans. The Compensation Committee chairman reports on the Compensation Committee’s actions and recommendations at Board meetings. In addition, the Compensation Committee has the authority to engage the services of outside advisors, experts and others to provide assistance as needed. All members of the Compensation Committee are “independent” as that term is defined in Rule 4200 of the Marketplace Rules of the Nasdaq Stock Market, Inc. A copy of the Compensation Committee charter can be viewed at the Company’s website onwww.jdsu.com.
The Corporate Development Committee met six times in fiscal 2004. The Corporate Development Committee oversees the Company’s strategic acquisition and investment activities. The Corporate Development Committee reviews and approves strategic transactions for which approval of the full Board of Directors is not required and makes recommendations to the Board of Directors regarding those transactions for which the consideration of the full Board of Directors is appropriate. A copy of the Corporate Development Committee charter can be viewed at the Company’s website onwww.jdsu.com.
The Corporate Governance Committee met four times in fiscal 2004. The Corporate Governance Committee, which serves as the Company’s nominating committee, reviews current trends and practices in corporate governance and recommends to the Board of Directors the adoption of programs pertinent to the Company. As provided in the charter of the Corporate Governance Committee, nominations for director may be made by the Corporate Governance Committee or by a stockholder of record entitled to vote. The Corporate Governance Committee will consider and make recommendations to the Board of Directors regarding any stockholder recommendations for candidates to serve on the Board of Directors. Stockholders wishing to recommend candidates for consideration by the Corporate Governance Committee may do so by writing to the Company’s Investor Relations Department-Attention Corporate Governance Committee at 1768 Automation Parkway, San Jose, California 95131 providing the candidate’s name, biographical data and qualifications, a document indicating the candidate’s willingness to act if elected, and evidence of the nominating stockholder’s ownership of Company’s stock at least 120 days prior to the next annual meeting to assure time for meaningful consideration by the Corporate Governance Committee. There are no differences in the manner in which the Corporate Governance Committee evaluates nominees for director based on whether the nominee is recommended by a stockholder. The Company does not pay any third party to identify or assist in identifying or evaluating potential nominees. All members of the Corporate Governance Committee are “independent” as that term is defined in Rule 4200 of the Marketplace Rules of the Nasdaq Stock Market, Inc.
In reviewing potential candidates for the Board, the Corporate Governance Committee considers the individual’s experience in the Company’s industry, the general business or other experience of the candidate, the needs of the Company for an additional or replacement director, the personality of the candidate, the candidate’s interest in the business of the Company, as well as numerous other subjective criteria. Of greatest importance is the individual’s integrity, willingness to get involved and ability to bring to the Company experience and knowledge in areas that are most beneficial to the Company. The Board intends to continue to evaluate candidates for election to the Board on the basis of the foregoing criteria. A detailed description of the criteria used by the Corporate Governance Committee in evaluating potential candidates may be found in the charter of the Corporate Governance Committee which is posted on the Company’s website.
The Corporate Governance Committee operates under a written charter setting forth the functions and responsibilities of the committee. A copy of the charter can be viewed at the Company’s website onwww.jdsu.com.
Communication between Stockholders and Directors
The Company’s Board of Directors currently does not have a formal process for stockholders to send communications to the Board of Directors. Nevertheless, every effort has been made to ensure that the views of stockholders are heard by the Board or individual directors, as applicable, and that appropriate responses are provided to stockholders on a timely basis. The Board of Directors does not recommend that formal communication procedures be adopted at this time because it believes that informal communications are
9
sufficient to communicate questions, comments and observations that could be useful to the Board. However, stockholders wishing to formally communicate with the Board of Directors may send communications directly to the Chairman of the Board, c/o JDS Uniphase Corporation, 1768 Automation Parkway, San Jose, California 95131.
Director Compensation
Each non-employee director of the Company, except the Chairman, receives an annual cash retainer of $48,000 which is paid in monthly installments of $4,000. Additionally, each non-employee director receives a grant of Common Stock having a value on the date of grant of $40,000, net of applicable taxes at the discretion of each non-employee director. Such shares of Common Stock are subject to a restricted stock purchase agreement which provides for vesting over a three year period. Each non-employee director, except the Chairman, receives $1,500 for each meeting of the Board of Directors attended. In addition, each non-employee director serving on a committee of the Board receives an annual cash retainer of $7,500 and each non-employee director serving as a committee chair receives an additional cash retainer of $6,000. Each non-employee director serving on a committee of the Board also receives a stipend of $500 per committee meeting attended.
Mr. Kaplan, who serves as Chairman of the Board, receives an additional annual cash retainer of $80,000 as compensation for his services which is paid in quarterly installments of $20,000. In addition, Mr. Kaplan receives $3,000 for each meeting of the Board of Directors attended.
Additionally, immediately after each annual meeting of stockholders, each individual who is continuing to serve as a non-employee director is granted options to purchase 10,000 shares of the Company’s Common Stock, except the Chairman, who is granted options to purchase 60,000 shares of the Company’s Common Stock. Such options have an exercise price equal to 100% of the fair market value of the Company’s Common Stock on the date of grant, vest monthly over twelve months and terminate eight years from the date of grant. In its discretion, the Company’s Board may make grants of additional options to non-employee directors. No such additional grants were issued in fiscal year 2004. In addition, all non-employee directors who are serving as chair of one of the committees of the Board receive an annual option grant of 3,000 shares of the Company’s Common Stock upon their initial appointment as chair and an automatic option grant of 3,000 shares of the Company’s Common Stock after each annual meeting of stockholders if the non-employee director continues as chair for the ensuing year. Such options granted to non-employee directors serving as a chair have an exercise price equal to 100% of the fair market value of the Company’s Common Stock on the date of grant and vest over twelve months, with vesting to cease if the non-employee director no longer continues to serve as chair. Upon retirement of a non-employee director, all unvested options and restricted shares of the Company’s Common Stock will automatically become fully vested, and the exercise period for such options would be extended to expire on the expiration date of such options, which is eight years from the date of grant.
Directors who are also employed by the Company do not receive any compensation for their services as directors. All directors are reimbursed for expenses incurred in connection with attending Board and committee meetings.
Relationships Among Directors or Executive Officers
There are no family relationships among any of the Company’s directors or executive officers.
Certain Relationships and Related Transactions
In fiscal 2004, Bruce D. Day, Robert E. Enos, Peter A. Guglielmi, Martin A. Kaplan, Richard T. Liebhaber and Casimir S. Skrzypczak were each granted options to purchase 10,000 shares of the Company’s Common Stock at a price of $3.52 per share. In addition, Bruce D. Day, Robert E. Enos, and Casimir S. Skrzypczak, as committee chairs, were each granted options to purchase 3,000 shares of the Company’s Common Stock at a price of $3.52 per share, and Mr. Liebhaber was granted a further option to purchase 3,000 shares of the
10
Company’s Common Stock at a price of $3.52 per share upon his assuming the chair of the Corporate Development Committee.
In fiscal year 2004, Bruce D. Day, Robert E. Enos, Peter A. Guglielmi, Martin A. Kaplan, Robert T. Liebhaber and Casimir S. Skrzypczak each received a grant of 11,363 shares of restricted Common Stock at a purchase price of $3.52 per share.
The Company has entered into employment and change of control agreements with certain of its Named Executive Officers (as defined below), Kevin J. Kennedy, Ph.D., Jozef Straus, Ph.D., Ronald C. Foster, Mark S. Sobey, Ph.D., Stan Lumish, Ph.D. and Joseph C. Zils (see “Employment Contracts, Termination of Employment and Change in Control Arrangements” below).
The Company has entered into indemnification agreements with Kevin J. Kennedy, Ph.D. and Richard T. Liebhaber. The indemnity agreements provide, among other things, that the Company will indemnify Dr. Kennedy and Mr. Liebhaber, under the circumstances and to the extent provided therein, for expenses, damages, judgments, fines and settlements each may be required to pay in actions or proceedings which either of them may be made a party by reason of their positions as a director or other agent of the Company, and otherwise to the fullest extent permitted under Delaware law and the Company’s bylaws.
Compensation Committee Interlocks and Insider Participation
No interlocking relationship exists between any member of the Company’s Board or Compensation Committee and any member of the board of directors or compensation committee of any other companies, nor has such interlocking relationship existed in the past.
Executive Officers
The following sets forth certain information regarding the Company’s executive officers:
| Executive Officer | Age | Position | ||
|---|---|---|---|---|
| Kevin J. Kennedy, Ph.D. | 48 | Co-Chairman and Chief Executive Officer | ||
| Ronald C. Foster | 54 | Executive Vice President and Chief Financial Officer | ||
| Roy Bie | 47 | Vice President, Flex Products | ||
| George C. Christensen | 49 | Senior Vice President, Lasers, Optics and Displays | ||
| Christopher S. Dewees | 40 | Senior Vice President and General Counsel | ||
| David Gudmundson | 43 | Senior Vice President, Business Development and Corporate Marketing | ||
| Stan Lumish, Ph.D. | 48 | Senior Vice President and Chief Technology Officer | ||
| Mark S. Sobey, Ph.D. | 44 | Senior Vice President, Sales | ||
| Debora Shoquist | 50 | Senior Vice President, Operations | ||
| Thomas Znotins, Ph.D. | 50 | Vice President, Subsystems |
Kevin J. Kennedy, Ph.D. became a member of the Company’s Board in November 2001, and upon the retirement of Dr. Jozef Straus, became Chief Executive Officer of the Company on September 1, 2003. From August 2001 to September 2003, Dr. Kennedy was the Chief Operating Officer of Openwave Systems, Inc. Prior to joining Openwave Systems Inc. Dr. Kennedy served seven years at Cisco Systems, Inc., most recently as Senior Vice President of the Service Provider Line of Business and Software Technologies Division, and 17 years at Bell Laboratories. Dr. Kennedy is a director of Quantum Corporation, Rambus Corporation, Openwave Systems, Inc., and Freescale Semiconductor, Inc.
Ronald C. Foster joined the Company in February 2003 as Executive Vice President and Chief Financial Officer. Before joining the Company Mr. Foster was Chief Financial Officer of Novell Corporation from July 2001 until February 2003, prior to which he served as Novell Corporation’s Vice President of Finance from November 1998 until his promotion to Chief Financial Officer. Mr. Foster served as Group Controller and then Vice President, Operations Controller with Applied Materials Corporation from 1996 to 1998, and was
11
employed as Vice President of Operations at Egghead Software Corporation from 1995 until 1996. Mr. Foster held various finance positions with Hewlett Packard Corporation (“HP”) from 1985 until 1995, culminating in his service as Group Controller for HP’s Computer Manufacturing and Distribution Group. Prior to HP, Mr. Foster held various finance and operations related positions in the forest products industry. Mr. Foster also serves as a director of Micron Technology, Inc. Mr. Foster holds an M.B.A. degree from the University of Chicago and a B.A. in Economics from Whitman College.
Roy Bie has led the Company’s Flex Products group since May 2000. From December 1996 to April 2000, Mr. Bie served as Vice President of Operations for Flex Products, and from 1993 through 1996, he served as Flex Product’s Director of Operations. Prior to joining the Company, Mr. Bie held operational and management leadership positions with Xicor, Inc. (now part of Intersil Corporation), Material Progress (now part of Komag, Inc.), Mag-Media (purchased by Polaroid Corporation) and began his career at National Semiconductor.
George C. Christensen has served as Senior Vice President, Laser, Optics and Displays since April 2004. Prior to joining the Company, Mr. Christensen served over eight years in executive positions at Cisco Systems, Inc. (“Cisco), including Vice President and General Manager of the VoIP Gateway and Dial Business Unit, Senior Engineering Director and Site Executive of the DSL Business Unit, and Director of Marketing in the Security and Systems Software Division of the Access Business Unit. Prior to his service at Cisco, Mr. Christensen held technical management positions while at ISICAD, Inc., Conveyant Systems, Inc., CXC, and Burroughs Corp., and was a member of the board of directors at Indicast, Inc.
Christopher S. Dewees has served as the Company’s Senior Vice President and General Counsel since July 2003. From February 2003 until July 2003, Mr. Dewees served as Vice President and General Counsel, prior to which he was Acting General Counsel from October 2002 until February 2003. Mr. Dewees joined the Company’s Legal Department in October 1999. Prior to October 1999, Mr. Dewees was employed at Morrison & Foerster LLP, where he represented the Company, and other Silicon Valley public and private companies. Mr. Dewees earned his A.B. degree from Dartmouth College in 1986, and his J.D. degree from Northwestern University in 1989.
David Gudmundson has served as Senior Vice President, Business Development and Corporate Marketing since June 2004. From April 2004 to June 2004 Mr. Gudmundson was Vice President, Business Development and Corporate Marketing, and commenced his service with the Company in December 2003 as Vice President, Business Development. From May 1991 to August 2003, Mr. Gudmundson held a series of increasingly senior leadership roles at Cisco, culminating in his service as Vice President and General Manager responsible for Cisco’s security server, DSL, and edge routing business units. Prior to Cisco, Mr. Gudmundson held various hardware and software development and systems engineering positions at ArgoSystems, Inc. (now part of Boeing Company Inc.) and ESL Incorporated (now part of TRW). Mr. Gudmundson holds a B.S.E.E. degree from University of Missouri-Rolla and an MBA degree from San Jose State University.
Stan Lumish, Ph.D. has served as the Company’s Senior Vice President and Chief Technology Officer since July 2003. From July 2002 until June 2003, Dr. Lumish served as the President of the Company’s Optical Layer Group. Dr. Lumish joined the Company in February 2000 as Vice President, Network Product Applications, and was subsequently appointed Group Vice President, R&D of the Transmission Subsystems Group, and General Manager of the Optical Networks Research group. Prior to joining the Company, Dr. Lumish held management positions with Lucent Technologies Inc., where he received the Bell Labs Fellow award.
Mark S. Sobey, Ph.D. has served as the Company’s Senior Vice President, Sales since April, 2004. From May 2002 to April 2004, Dr. Sobey served as Senior Vice President, Global Sales and Marketing. From January 2001 to May 2002, Dr. Sobey was Vice President of Sales, North America. Dr. Sobey was Director of Sales, North America from July 2000 to January 2001, and from December 1999 to June 2000, Dr. Sobey was Director of Sales, North America with E-TEK Dynamics, Inc. Prior to E-TEK Dynamics, Inc., Dr. Sobey was Vice President/General Manager with Spectra-Physic, Inc.
12
Debora Shoquist joined the Company in March 2004 as Senior Vice President, Operations. Prior to joining the Company, Ms. Shoquist served as Senior Vice President and General Manager of the Electro-Optics Group at Coherent, Inc. From 1991 to 2001 Ms. Shoquist held several roles at Quantum Corporation, including service as President and General Manager of the Personal Computing Storage Division and Executive Vice President of Hard Disk Drive Operations. From 1981 to 1991 Ms. Shoquist served in various engineering, production, and manufacturing roles at Hewlett Packard Corporation.
Thomas Znotins, Ph.D.joined the Company in September 1999 and serves as Senior Vice President, Subsystems. Prior to his current role, Dr. Znotins led the Company’s instrumentation business. From 1984 to 1999 Dr. Znotins held a series of senior positions in marketing, business development research and design at Lumonics, Inc. (now GSI Lumonics, Inc.), culminating in his service as General Manager of Lumonics’ Kanata, Canada facility. Dr. Znotins holds a Ph.D. in laser physics from McMaster University and completed the Executive Development Program at Northeastern University in 1989.
13
PROPOSAL 2
RATIFICATION OF INDEPENDENT AUDITORS
Ernst & Young LLP has served as the Company’s independent auditors since 1987 and has been appointed by the Board to continue as the Company’s independent auditors for the Company’s fiscal year ending June 30, 2005. Although the Company is not required to seek stockholder approval of its selection of independent auditors, the Board believes it to be sound corporate governance to do so. If the appointment is not ratified, the board will investigate the reasons for stockholder rejection and will reconsider its selection of independent auditors.
A representative of Ernst & Young LLP is expected to be present at the Annual Meeting. The representative will have an opportunity to make a statement and to respond to appropriate questions.
Audit and Non-Audit Fees
The following table presents fees for professional audit services rendered by Ernst & Young LLP for the audit of the Company’s annual financial statements for the years ended June 30, 2004 and June 30, 2003 and fees billed for other services rendered by Ernst & Young LLP during those periods.
| Fiscal 2004 | Fiscal 2003 | |||||
|---|---|---|---|---|---|---|
Audit Fees(1) | $ | 3,498,244 | $ | 2,460,000 | ||
Audit-Related Fees(2) | 186,703 | 510,000 | ||||
Tax Fees(3) | 743,091 | 1,350,000 | ||||
All Other Fees(4) | 17,129 | — | ||||
| Total | $ | 4,445,167 | $ | 4,320,000 | ||
| (1) | Audit Fees related to professional services rendered in connection with the audit of the Company’s annual financial statements, quarterly review of financial statements included in the Company’s Forms 10-Q, and audit services provided in connection with other statutory and regulatory filings. |
| (2) | Audit-Related Fees include professional services related to the audit of the Company’s financial statements and consultation on accounting standards or transactions. |
| (3) | Tax Fees include $587,737 for professional services rendered in connection with tax compliance and preparation relating to the Company’s expatriate program, tax audits and international tax compliance; and $155,354 for tax consulting and planning services. |
| (4) | All Other Fees include $4,225 of certain secretarial and directorship services that were not pre-approved by the Audit Committee. |
In making its recommendation to ratify the appointment of Ernst & Young LLP as the Company’s independent auditors for the fiscal year ending June 30, 2005, the Audit Committee has considered whether services other than audit and audit-related services provided by Ernst & Young LLP are compatible with maintaining the independence of Ernst & Young LLP.
Audit Committee Pre-Approval of Audit and Permissible Non-Audit Services of Independent Auditors
The Audit Committee pre-approves all audit and permissible non-audit services provided by the independent auditors. These services may include audit services, audit-related services, tax services and other services. The Audit Committee has adopted a policy for the pre-approval of services provided by the independent auditors. Under the policy, pre-approval is generally provided for up to one year and any pre-approval is detailed as to the particular service or category of services and is subject to a specific budget. In addition, the Audit Committee may also pre-approve particular services on a case-by-case basis. For each proposed service, the independent auditors are required to provide detailed back-up documentation at the time of approval.
14
The Audit Committee pre-approved 100% of the audit fees, 100% of the audit-related fees, 100% of the tax fees, and 75% of all other fees for fiscal 2004. In total, the Audit Committee pre-approved 99.9% of the total fees for fiscal 2004. 100% of the fiscal 2003 fees were pre-approved by the Audit Committee.
THE BOARD RECOMMENDS A VOTEFOR THE RATIFICATION
OF THE APPOINTMENT OF ERNST & YOUNG LLP
AS THE COMPANY’S INDEPENDENT AUDITORS
FOR THE YEAR ENDING JUNE 30, 2005
15
SECURITY OWNERSHIP OF CERTAIN BENEFICIAL OWNERS AND MANAGEMENT
The following table sets forth certain information known to the Company with respect to the beneficial ownership as of August 15, 2004, by (i) all persons who are beneficial owners of five percent (5%) or more of the Company’s Common Stock including Exchangeable Shares, (ii) each director and nominee, (iii) the Named Executive Officers (as defined in the “Compensation of Executive Officers” section below), and (iv) all current directors and executive officers as a group.
As of August 15, 2004, 1,381,055,972 shares of the Company’s Common Stock were outstanding, and 62,208,177 Exchangeable Shares were outstanding. As of August 15, 2004, no person beneficially owned more than five percent (5%) or more of the Company’s Common Stock including Exchangeable Shares. The amounts and percentages of Common Stock beneficially owned are reported on the basis of regulations of the Securities and Exchange Commission (“SEC”) governing the determination of beneficial ownership of securities. Under the SEC rules, a person is deemed to be a “beneficial owner” of a security if that person has or shares “voting power,” which includes the power to vote or to direct the voting of such security, or “investment power,” which includes the power to dispose of or to direct the disposition of such security. A person is also deemed to be a beneficial owner of any securities of which that person has a right to acquire beneficial ownership within 60 days. Under these rules, more than one person may be deemed a beneficial owner of securities as to which such person has no economic interest.
| Number of Shares Beneficially Owned | |||||||
|---|---|---|---|---|---|---|---|
| Name | Number | Percentage | |||||
Directors and Named Executive Officers | |||||||
Jozef Straus, Ph.D.(1) | 11,429,167 | * | |||||
Joseph C. Zils(2) | 987,976 | * | |||||
Donald E. Bossi, Ph.D(3) | 858,112 | * | |||||
Stan Lumish, Ph.D(4) | 669,758 | * | |||||
Kevin J. Kennedy, Ph.D.(5) | 631,388 | * | |||||
Martin A. Kaplan(6) | 561,989 | * | |||||
Robert E. Enos(7) | 537,683 | * | |||||
Mark S. Sobey, Ph.D(8) | 510,387 | * | |||||
Bruce D. Day(9) | 470,539 | * | |||||
Casmir S. Skrzypczak(10) | 335,778 | * | |||||
Peter A. Guglielmi(11) | 316,029 | * | |||||
Ronald C. Foster(12) | 262,500 | * | |||||
Richard T. Liebhaber(13) | 84,417 | * | |||||
All directors and executive officers as a group (19 persons)(14) | 18,676,446 | 1.3 | % | ||||
| * | Less than 1%. |
| (1) | Includes 11,426,077 shares subject to stock options currently exercisable or exercisable within 60 days of August 15, 2004. |
| (2) | Includes 956,816 shares subject to stock options currently exercisable or exercisable within 60 days of August 15, 2004. |
| (3) | Includes (i) 805,184 shares subject to stock options currently exercisable or exercisable within 60 days of August 15, 2004, and (ii) 20,000 shares subject to further vesting restrictions. |
| (4) | Includes 669,139 shares subject to stock options currently exercisable or exercisable within 60 days of August 15, 2004. |
| (5) | Includes 551,888 shares subject to stock options currently exercisable or exercisable within 60 days of August 15, 2004. |
16
| (6) | Includes (i) 539,166 shares subject to stock options currently exercisable or exercisable within 60 days of August 15, 2004, (ii) 11,363 shares subject to further vesting restrictions, (iii) 1,600 shares held by Mr. Kaplan’s children, and (iv) 260 shares held by Mr. Kaplan’s spouse. |
| (7) | Includes (i) 438,940 shares subject to stock options currently exercisable or exercisable within 60 days of August 15, 2004, (ii) 12,000 shares issuable upon exchange of the Exchangeable Shares of JDS Uniphase Canada Ltd., and (iii) 11,363 shares subject to further vesting restrictions. |
| (8) | Includes (i) 490,000 shares subject to stock options currently exercisable or exercisable within 60 days of August 15, 2004, and (ii) 20,000 shares subject to further vesting restrictions. |
| (9) | Includes (i) 438,940 shares subject to stock options currently exercisable or exercisable within 60 days of August 15, 2004, (ii) 12,200 shares issuable upon exchange of the Exchangeable Shares of JDS Uniphase Canada Ltd., and (iii) 11,363 shares subject to further vesting restrictions. |
| (10) | Includes (i) 327,916 shares subject to stock options currently exercisable or exercisable within 60 days of August 15, 2004, and (ii) 11,363 shares subject to further vesting restrictions. |
| (11) | Includes 281,166 shares subject to stock options currently exercisable or exercisable within 60 days of August 15, 2004, and (ii) 11,363 shares subject to further vesting restrictions. |
| (12) | Includes 262,500 shares subject to stock options currently exercisable or exercisable within 60 days of August 15, 2004. |
| (13) | Includes (i) 11,363 shares subject to further vesting restrictions held by Liebhaber & Associates, Inc., of which Mr. Liebhaber is President and Director, and (ii) 60,804 shares subject to stock options currently exercisable or exercisable within 60 days of August 15, 2004. |
| (14) | Includes (i) 18,162,060 shares subject to stock options currently exercisable or exercisable within 60 days of August 15, 2004, (ii) 138,178 shares subject to further vesting restrictions, (iii) 24,200 shares issuable upon exchange of the Exchangeable Shares of JDS Uniphase Canada Ltd., and (iv) indirect holdings attributable to executive officers in the amount of 1,860 shares. |
17
EXECUTIVE COMPENSATION
Summary Compensation Table
The following table sets forth certain information concerning compensation of (i) each person that served as the Chief Executive Officer of the Company during the fiscal year ended June 30, 2004, (ii) the four other most highly compensated Executive Officers of the Company whose aggregate cash compensation exceeded $100,000 during the fiscal year ended June 30, 2004, and (iii) up to two former executive officers of the Company who would have been one of the Company’s four most highly compensated officers had such officer been serving as such at the end of the Company’s fiscal year ending June 30, 2004 (collectively, the “Named Executive Officers”):
| Annual Compensation | Long-Term Compensation | All Other Compensation ($)(4) | ||||||||||||||
|---|---|---|---|---|---|---|---|---|---|---|---|---|---|---|---|---|
| Name and Principal Position | Fiscal Year(1) | Salary($)(2) | Bonus and Commission($)(3) | Restricted Stock Awards | Securities Underlying Options(#) | |||||||||||
Kevin J. Kennedy, Ph.D.(5) | 2004 | $403,846 | — | — | 3,000,000 | $870,096 | (6) | |||||||||
| Chief Executive Officer | ||||||||||||||||
Jozef Straus, Ph.D.(7) | 2004 | 548,503 | (US) | $44,748 | (US) | — | 750,000 | |||||||||
| Founder Emeritus and | 734,994 | (CDN) | 59,962 | (CDN) | — | — | — | |||||||||
| Advisor to the Chief | 2003 | 544,440 | (US) | — | 750,000 | 4,812 | (US) | |||||||||
| Executive Officer | 734,994 | (CDN) | 6,502 | (CDN) | ||||||||||||
| 2002 | 505,763 | (US) | — | — | 1,400,000 | 4,591 | (US) | |||||||||
| 743,471 | (CDN) | — | 6,750 | (CDN) | ||||||||||||
Ronald C. Foster(8) | 2004 | 356,730 | 5,321 | — | 680,000 | 5,166 | ||||||||||
| Executive Vice President and | 2003 | 114,423 | — | — | 500,000 | 33,781 | (9) | |||||||||
| Chief Financial Officer | ||||||||||||||||
| Mark S. Sobey, Ph.D. | 2004 | 246,654 | 31,009 | 97,800 | (10) | 450,000 | 1,500 | |||||||||
| Senior Vice President, Sales | 2003 | 242,000 | — | — | 150,000 | 3,600 | ||||||||||
| 2002 | 207,293 | — | — | 140,000 | 3,400 | |||||||||||
Joseph C. Zils(11) | 2004 | 282,423 | 37,419 | — | 150,000 | 1,500 | ||||||||||
| Vice President and Corporate Advisor | 2003 | 274,234 | — | — | 275,000 | 3,600 | ||||||||||
| 2002 | 245,192 | 25,010 | — | 297,000 | 3,400 | |||||||||||
Donald E. Bossi, Ph.D.(12) | 2004 | 254,808 | 7,122 | 97,800 | (10) | 450,000 | 1,918 | |||||||||
| Senior Vice President, | 2003 | 245,195 | — | — | 250,000 | 3,600 | ||||||||||
| Transmission Products | 2002 | 223,629 | — | — | 225,000 | 3,706 | ||||||||||
| Stan Lumish, Ph.D. | 2004 | 228,107 | 7,039 | — | 275,000 | 1,219 | ||||||||||
| Senior Vice President and | 2003 | 242,308 | — | — | 225,000 | 3,077 | ||||||||||
| Chief Technology Officer | 2002 | 204,230 | — | — | 155,000 | 3,069 | ||||||||||
| (1) | Compensation reported for fiscal years ending June 30, 2004, 2003 and 2002. |
| (2) | The compensation information for Dr. Straus for the fiscal year ending June 30, 2004 has been converted from Canadian dollars to U.S. dollars based upon an average foreign exchange rate which was CDN $1.34 = U.S. $1.00. This currency conversion causes Dr. Straus’ reported salary to fluctuate from year-to-year because of the conversion of Canadian dollars to U.S. dollars. |
| (3) | Bonus and commission include amounts in the year earned, rather than in the year in which such bonus amount was paid or is to be paid. |
18
| (4) | Represents contributions made by the Company to (i) Mr. Foster, Mr. Zils, Dr. Bossi, and Dr. Lumish under its 401(k) plan, and (ii) Dr. Straus under the Company’s group retirement savings plan for Canadian employees. |
| (5) | Dr. Kennedy joined the Company as an employee on September 1, 2003. |
| (6) | Represents new hire bonus of $500,000 and stock purchase bonus of $370,096. |
| (7) | Dr. Straus resigned from his position as Co-Chairman and Chief Executive Officer effective September 1, 2003. |
| (8) | Mr. Foster joined the Company in February 2003. |
| (9) | Represents new hire bonus of $30,000. |
| (10) | Reflects the dollar value of awards of 20,000 shares of restricted common stock, calculated by multiplying the closing market price of the Company’s Common Stock on the date of grant ($4.89) by the number of shares of restricted common stock awarded. Restricted common stock awards generally become fully vested on the fifth year anniversary of the date of grant, subject to acceleration upon the achievement of certain specified Company performance targets. |
| (11) | Effective April 4, 2004, Mr. Zils ceased being an executive officer of the Company. |
| (12) | Dr. Bossi ceased being an executive officer of the Company on September 4, 2004. |
Employment Contracts, Termination of Employment and Change in Control Arrangements
The Company and Kevin J. Kennedy, Ph.D. are parties to an employment agreement dated August 18, 2003 (the “Kennedy Agreement”). The term of the Kennedy Agreement commenced on September 1, 2003 and expires on August 31, 2007, unless sooner terminated pursuant to the terms of the Kennedy Agreement. Dr. Kennedy’s current annual base salary under the Kennedy Agreement is $500,000, subject to adjustment from time to time by the Company, and subject to increase to $575,000 upon the first anniversary of Dr. Kennedy’s employment. In addition, Dr. Kennedy is eligible to earn an annual bonus with a target bonus of 100% of his annual base salary and a maximum bonus of up to 200% of his base salary, based upon achievement of objectives determined by the Company from time to time. No bonus was paid for fiscal 2004. The Kennedy Agreement provided for, and Dr. Kennedy received, a one-time new hire bonus of $500,000 and a one-time stock purchase bonus of $250,000 (grossed up for applicable deductions and withholdings) to purchase shares of the Company’s Common Stock. Such shares of Common Stock are subject to a restricted stock agreement which provides for full vesting after six months of employment as Chief Executive Officer of the Company. Dr. Kennedy further received, pursuant to the Kennedy Agreement, an option to purchase 2,000,000 shares of the Company’s Common Stock at an exercise price equal to the fair market value at the date of grant and, subject to achieving certain performance goals determined by the Board, Dr. Kennedy will receive options to purchase a minimum of 1,500,000 shares of the Company’s Common Stock over the 18 month period following his commencement of service as Chief Executive Officer, 1,000,000 of which shares will be granted within 12 months of Dr. Kennedy’s commencement of employment. The Kennedy Agreement also provides for 24 months medical insurance coverage upon termination of the Kennedy Agreement. Further, in the event the Kennedy Agreement is terminated (i) by the Company without cause (as that term is defined in the Kennedy Agreement); (ii) as a result of the death or disability of Dr. Kennedy; or (iii) by Dr. Kennedy for good reason (as that term is defined in the Kennedy Agreement), Dr. Kennedy shall receive (a) payment of severance in the amount of three years’ salary and three years’ bonus based upon previous bonuses paid to Dr. Kennedy if employment is terminated prior to the second anniversary of the Kennedy Agreement, or if termination follows a change of control of the Company, (b) payment of severance in the amount of two years’ salary and two years’ bonus based upon previous bonuses paid to Dr. Kennedy if employment is terminated after the second anniversary of the Kennedy Agreement, and (c) partial acceleration of vesting of Dr. Kennedy’s options. If termination of employment occurs prior to the completion of two or three years of employment, the bonus portion of the severance payment will be calculated in accordance with the terms of the Kennedy Agreement. Effective June 16, 2004 the Kennedy Agreement was amended (“the Kennedy Amendment”) to provide that, notwithstanding the terms of the Kennedy Agreement and notwithstanding achievement of certain personal performance milestones previously determined by the Board of Directors, any bonus payment otherwise due
19
for fiscal year 2004 pursuant to the Kennedy Agreement will not be considered earned and payable until the sooner of (y) achievement by the Company of certain financial performance objectives, or (z) the termination of Dr. Kennedy’s employment. Effective August 4, 2004 the Kennedy Agreement was further amended (“the Second Kennedy Amendment”) to provide that, notwithstanding the terms of the Kennedy Agreement, Dr. Kennedy’s base annual salary shall remain at $500,000 until such time as the Company achieves certain financial milestones, at which time Dr. Kennedy’s base annual salary shall be increased to $575,000 retroactive to September 1, 2004.
The Company and Dr. Straus entered into a Transition and Retirement Agreement dated August 20, 2003 (the “Transition Agreement”) pursuant to which and effective September 1, 2003 (i) Dr. Straus retired from his position as the Company’s Chief Executive Officer and assumed a new role as Founder Emeritus and Advisor to the Chief Executive Officer, and (ii) resigned from his position as Co-Chairman of the Board of Directors (but remained a member of the Board). During the term of the Transition Agreement, Dr. Straus will continue to receive his regular salary and will remain eligible for a target bonus. The Transition Agreement also provides that upon the latter of (i) the termination of Dr. Straus’ employment, or (ii) the termination of Dr. Straus’ service as a member of the Company’s Board of Directors, Dr. Straus’ then vested stock options shall remain exercisable for the full remaining portion of their terms, which is eight years from the date of grant. Dr. Straus resigned from the Board of Directors of the Company effective July 6, 2004.
The Company and Ronald C. Foster are parties to an employment agreement dated January 30, 2003 (the “Foster Agreement”). The term of the Foster Agreement commenced on February 17, 2003 and expires on July 31, 2007, unless sooner terminated pursuant to the terms of the Foster Agreement. Mr. Foster’s current annual base salary under the Foster Agreement is $350,000, subject to adjustment from time to time by the Company. In addition, Mr. Foster is eligible to earn an annual bonus with a target bonus of 60% of his annual base salary and a maximum bonus of up to 200% of his base salary, based upon achievement of objectives determined by the Company from time to time. No bonus was paid for fiscal 2004. The Foster Agreement provided for, and Mr. Foster received, a one-time new hire bonus of $30,000. Mr. Foster further received, pursuant to the Foster Agreement, an option to purchase 500,000 shares of the Company’s Common Stock at an exercise price equal to the fair market value at the date of grant. Such options become fully vested four years from the date of grant. The Foster Agreement also provides for 24 months medical insurance coverage upon termination of the Foster Agreement. Further, in the event the Foster Agreement is terminated (i) by the Company without cause (as that term is defined in the Foster Agreement); (ii) as a result of the death or disability of Mr. Foster; or (iii) by Mr. Foster for good reason (as that term is defined in the Foster Agreement), Mr. Foster shall receive (a) payment of severance in the amount of two years’ salary and two years’ bonus based upon previous bonuses paid to Mr. Foster if employment is terminated prior to the second anniversary of the Foster Agreement, or if termination follows a change of control of the Company, (b) payment of severance in the amount of three years’ salary and three years’ bonus based upon previous bonuses paid to Mr. Foster if employment is terminated after the second anniversary of the Foster Agreement, and (c) partial acceleration of vesting of Mr. Foster’s options. If termination of employment occurs prior to the completion of two or three years of employment, the bonus portion of the severance payment will be calculated in accordance with the terms of the Foster Agreement.
The Company and Mark S. Sobey, Ph.D. are parties to a change of control agreement dated August 4, 2004 (the “Sobey Change of Control Agreement”). The term of the Sobey Change of Control Agreement expires on August 4, 2006 unless sooner terminated pursuant to the terms of the Sobey Change of Control Agreement. On August 4, 2006 and at the end of each two-year period thereafter, the term will automatically be extended for an additional two-year period, provided Dr. Sobey’s most recent performance rating meets expectations. Dr. Sobey’s current base salary is $255,000, subject to adjustment from time to time by the Company. In addition, Dr. Sobey is eligible to earn an annual bonus with a target bonus of 50% of his annual base salary and a maximum bonus of up to 200% of his target bonus. The Sobey Change of Control Agreement provides for payment of severance in the amount of six months’ salary and partial acceleration of vesting of Dr. Sobey’s previously granted equity incentive awards if prior to the expiration of the term and within six months following a change of control (as that term is defined in the Sobey Change of Control Agreement), his employment is
20
terminated by the Company other than for cause (as that term is defined in the Sobey Change of Control Agreement) or by him for good reason (as that term is defined in the Sobey Change of Control Agreement), conditioned upon Dr. Sobey executing and delivering to the Company a release of claims reasonably acceptable to the Company. Prior to a change of control, the Company or Dr. Sobey may terminate the Sobey Change of Control Agreement for convenience upon delivery of a written notice to the other.
The Company and Joseph C. Zils are parties to an employment agreement dated December 1, 2001 (the “Zils Agreement”). The term of the Zils Agreement expires on November 9, 2005, unless sooner terminated pursuant to the terms of the Zils Agreement. Mr. Zils’ current annual base salary under the Zils Agreement is $274,234, subject to adjustment from time to time by the Company. In addition, Mr. Zils is eligible to earn an annual bonus in an amount up to 50% of his annual base salary, based upon achievement of objectives determined by the Company from time to time. However, no bonus was paid for fiscal 2004. The Zils Agreement also provides for payment of severance in the amount of $1,090,702.38 and acceleration of vesting of stock options granted to Mr. Zils’ in December 2001 in the event the Zils Agreement is terminated (i) by the Company without cause (as that term is defined in the Zils Agreement); (ii) as a result of the death or disability of Mr. Zils; or (iii) by Mr. Zils for good reason (as that term is defined in the Zils Agreement). Effective as of April 4, 2004, Mr. Zils ceased being an executive officer of the Company, and the Zils Agreement was terminated as of that date.
The Company and Stan Lumish, Ph.D. are parties to a change of control agreement dated August 4, 2004 (the “Lumish Change of Control Agreement”). The term of the Lumish Change of Control Agreement expires on August 4, 2006 unless sooner terminated pursuant to the terms of the Lumish Change of Control Agreement. On August 4, 2006 and at the end of each two-year period thereafter, the term will automatically be extended for an additional two-year period, provided Dr. Lumish’s most recent performance rating meets expectations. Dr. Lumish’s current base salary is $220,000, subject to adjustment from time to time by the Company. In addition, Dr. Lumish is eligible to earn an annual bonus with a target bonus of 50% of his annual base salary and a maximum bonus of up to 200% of his target bonus. The Lumish Change of Control Agreement provides for payment of severance in the amount of six months’ salary and partial acceleration of vesting of Dr. Lumish’s previously granted equity incentive awards if prior to the expiration of the term and within six months following a change of control (as that term is defined in the Lumish Change of Control Agreement), his employment is terminated by the Company other than for cause (as that term is defined in the Lumish Change of Control Agreement) or by him for good reason (as that term is defined in the Lumish Change of Control Agreement), conditioned upon Dr. Lumish executing and delivering to the Company a release of claims reasonably acceptable to the Company. Prior to a change of control, the Company or Dr. Lumish may terminate the Lumish Change of Control Agreement for convenience upon delivery of a written notice to the other.
21
Stock Option Grants in Last Fiscal Year
The following table set forth information regarding stock options granted to the Named Executive Officers for the fiscal year ended June 30, 2004:
| Individual Grants | ||||||||||||
|---|---|---|---|---|---|---|---|---|---|---|---|---|
| Number of Securities Underlying Options Granted(1) | % of Total Options Granted to Employees in Fiscal 2004(2) | Exercise Price per Share(3) | Expiration Date | Potential Realizable Value at Assumed Annual Rate of Stock Price Appreciation for Option Term(4)(5) | ||||||||
| Name | 5% | 10% | ||||||||||
| Kevin J. Kennedy, Ph.D. | 2,000,000 | 4.01% | $3.45 | 08/31/11 | $3,294,443 | $7,890,763 | ||||||
| 1,000,000 | 2.01% | 4.35 | 03/21/14 | 2,214,445 | 6,102,782 | |||||||
| Jozef Straus, Ph.D. | 750,000 | 1.51% | 2.95 | 07/29/11 | 1,000,966 | 2,449,806 | ||||||
| Ronald C. Foster | 300,000 | 0.60% | 2.95 | 07/29/11 | 400,386 | 979,922 | ||||||
| 380,000 | 0.76% | 4.35 | 03/21/14 | 841,489 | 2,319,057 | |||||||
| Mark S. Sobey, Ph.D. | 150,000 | 0.30% | 2.95 | 07/29/11 | 200,193 | 489,961 | ||||||
| 300,000 | 0.60% | 4.35 | 03/11/14 | 815,821 | 2,072,053 | |||||||
| Joseph C. Zils | 150,000 | 0.30% | 2.95 | 07/29/11 | 200,193 | 489,961 | ||||||
| Donald E. Bossi. Ph.D. | 150,000 | 0.30% | 2.95 | 07/29/11 | 200,193 | 489,961 | ||||||
| 300,000 | 0.60% | 4.35 | 03/11/14 | 815,821 | 2,072,053 | |||||||
| Stan Lumish, Ph.D. | 125,000 | 0.25% | 2.95 | 07/29/11 | 166,828 | 408,301 | ||||||
| 150,000 | 0.30% | 4.35 | 03/11/14 | 407,910 | 1,036,02 | |||||||
| (1) | Except in the event of a change in control of the Company, options granted become exercisable at the rate of 25% of the shares subject thereto one year from the grant date and as to approximately 6.25% of the shares subject to the option at the end of each three-month period thereafter such that the option is fully exercisable four years from the grant date. |
| (2) | Based on a total of 49,829,040 options granted to the Company’s employees in fiscal 2004, including the Named Executive Officers. |
| (3) | The exercise price per share of options granted represented the fair market value of the underlying shares of Common Stock on the date the options were granted. |
| (4) | The potential realizable is calculated based upon the term of the option at its time of grant. It is calculated assuming that the stock price on the date of grant appreciates at the indicated annual rate, compounded annually for the entire term of the option, and that the option is exercised and sold on the last day of its term for the appreciated stock price. |
| (5) | Stock price appreciation of 5% and 10% is assumed pursuant to the rules promulgated by the SEC and does not represent the Company’s prediction of the future stock price performance. |
22
Aggregated Stock Option Exercises in Last Fiscal Year and Fiscal Year-End Option Values
The following table sets forth certain information with respect to stock options exercised by the Named Executive Officers during fiscal 2004, including the shares acquired on exercise and the aggregate value of gains on the date of exercise. In addition, the table sets forth the number of underlying stock options as of June 30, 2004 and the value of “in-the-money” stock options, which represents the difference between the exercise price of a stock option and the market price of the shares subject to such option:
| Shares Acquired on Exercise | Value Realized(1) | Number of Securities Underlying Unexercised Options at June 30, 2004 | Value of Unexercised In-the-Money Options at June 30, 2004(2) | |||||||||||
|---|---|---|---|---|---|---|---|---|---|---|---|---|---|---|
| Name | Exercisable | Unexercisable | Exercisable | Unexercisable | ||||||||||
| Kevin J. Kennedy, Ph.D. | 0 | $0 | 47,444 | 3,005,556 | $ | 16,887 | $200,000 | |||||||
| Jozef Straus, Ph.D. | 0 | $0 | 11,085,452 | 1,862,500 | 67,500 | 562,500 | ||||||||
| Ronald C. Foster | 0 | $0 | 156,250 | 1,023,750 | 115,625 | 434,375 | ||||||||
| Mark S. Sobey, Ph.D. | 0 | $0 | 422,500 | 632,500 | 45,000 | 165,000 | ||||||||
| Joseph C. Zils | 0 | $0 | 871,691 | 483,251 | 86,156 | 229,344 | ||||||||
| Donald E. Bossi, Ph.D. | 0 | $0 | 723,919 | 735,651 | 83,811 | 218,687 | ||||||||
| Stan Lumish, Ph.D. | 0 | $0 | 597,499 | 523,751 | 74,812 | 191,187 | ||||||||
| (1) | The value realized upon the exercise of stock options represents the positive spread between the exercise price of stock options and the fair market value of the shares subject to such options on the exercise date. |
| (2) | The value of “in-the-money” stock options represents the positive spread between the exercise price of stock options and the fair market value of the shares subject to such options on July 3, 2004, which was $3.55 per share. |
23
EQUITY COMPENSATION PLANS
The following table sets forth information about shares of the Company’s Common Stock and Exchangeable Shares that may be issued under the Company’s equity compensation plans, including compensation plans that were approved by the Company’s Stockholders as well as compensation plans that were not approved by the Company’s Stockholders. Information in the table is as of June 30, 2004.
| Plan Category | Number of securities to be issued upon exercise of outstanding options, warrants and rights (a) | Weighted-average exercise price of outstanding options, warrants and rights (b) | Number of securities remaining available for future issuance under equity compensation plans (excluding securities reflected in column (a)) (c) | |||||||||
|---|---|---|---|---|---|---|---|---|---|---|---|---|
Equity compensation plans approved by security holders(1)(2) | 29,767,096 | 4.24 | 143,548,159 | |||||||||
Equity compensation plans not approved by security holders(3) | 94,235,533 | 15.15 | 10,671,689 | |||||||||
| Total/Weighted Ave./Total | 124,002,629 | 12.53 | 154,219,848 | |||||||||
| (1) | Represents shares of the Company’s Common Stock issuable upon exercise of options and restricted stock units outstanding under the following equity compensation plan: 2003 Equity Incentive Plan. |
| (2) | Represents shares of the Company’s Common Stock authorized for future issuance under the following equity compensation plan: Amended and Restated 1998 Employee Stock Purchase Plan. |
| (3) | Represents shares of the Company’s Common Stock issuable upon exercise of options outstanding or authorized for future issuance under the following equity compensation plans: Amended and Restated 1993 Flexible Stock Incentive Plan, 1996 Non-Qualified Stock Option Plan, and Amended and Restated 1999 Canadian Employee Stock Purchase Plan. |
| (4) | As of June 30, 2004, options and rights to purchase an aggregate of 20,595,299 shares of the Company’s Common Stock at a weighted average exercise price of $31.14 were outstanding under the following equity compensation plans, which options and rights were assumed in connection with the following merger and acquisition transactions: Uniphase Telecommunications, Inc. 1995 Flexible Stock Incentive Plan; JDS FITEL 1994 and 1996 Stock Option Plans; Broadband Communications Products, Inc. 1992 Key Employee Incentive Stock Option Plan; EPITAXX, Inc. Amended and Restated 1996 Employee, Director and Consultant Stock Option Plan; Optical Coating Laboratory, Inc. 1993, 1995, 1996, 1998 and 1999 Incentive Compensation Plans; Cronos Integrated Microsystems, Inc. 1999 Stock Plan; E-TEK Dynamics, Inc. 1997 Equity Incentive Plan, and 1998 Stock Plan; Optical Process Automation, Inc. 2000 Stock Option and Incentive Plan, 2000 Series B Preferred Stock Option Plan; SDL, Inc. 1995 Stock Option Plan; 1992 SDL-Spectra Diode Stock Option Plan; and Epion Corporation 1996 Stock Option Plan. No further grants or awards will be made under the assumed equity compensation plans, and the options outstanding under the assumed plans are not reflected in the table above. |
The following are descriptions of the material features of the Company’s equity compensation plans that were not approved by the Company’s Stockholders:
Amended and Restated 1993 Flexible Stock Incentive Plan
The Amended and Restated 1993 Flexible Stock Incentive Plan (the “1993 Plan”) was adopted by the Board of Directors in August 1993 and was approved by the Company’s stockholders in October 1993. Amendments and restatements of the 1993 Plan were adopted by the Board of Directors and approved by the
24
Company’s Stockholders in both 1995 and 1996. The 1993 Plan has subsequently been amended and restated by the Board of Directors without approval of the Company’s Stockholders.
On July 30, 2003 the Board of Directors adopted a resolution to terminate the 1993 Plan effective upon Stockholder approval of the 2003 Equity Incentive Plan. The 2003 Equity Incentive Plan was approved by the Company’s Stockholders on November 6, 2003. No new awards will be issued under the 1993 Plan.
The Company established subplans under the 1993 Plan for employees in the United Kingdom and France. Each subplan is subject to and incorporates the terms and conditions of the 1993 Plan, and provides further administrative rules in order to take advantage of certain employee- and Company-favorable tax laws in these jurisdictions. As a result of the approval by the Company’s Stockholders of the 2003 Equity Incentive Plan, no new awards will be issued under these subplans.
1996 Non-Qualified Stock Option Plan
The Board of Directors adopted the 1996 Non-Qualified Stock Option Plan (the “1996 Plan”) in November 1996. The 1996 Plan is administered by the Compensation Committee. Pursuant to the 1996 Plan, the Compensation Committee may grant non-qualified stock options only to employees, independent contractors and consultants of the Company or any parent or subsidiary corporation of the Company. Only non-qualified stock options may be issued under the 1996 Plan. Stock options may not be granted to officers and directors of the Company. The 1996 Plan will continue in effect until terminated by the Board of Directors. The Company last granted stock options under the 1996 Plan on April 17, 1998. The Company presently does not intend to grant any additional options under the 1996 Plan.
An aggregate of 19,136,000 shares has been reserved for the grant of stock options under the 1996 Plan. Shares underlying awards that are forfeited or canceled are not counted as having been issued under the 1996 Plan. Stock options issued under the 1996 Plan must have an exercise price of not less than 85% of the fair market value of the Company’s Common Stock on the date of grant of the option. Options are generally non-transferable. The term of all options granted under the Plan shall not exceed eight years from the date of grant.
Amended and Restated 1999 Canadian Employee Stock Purchase Plan
The Amended and Restated 1999 Canadian Employee Stock Purchase Plan (the “Canadian ESPP”) was adopted by the Board of Directors in August 1999 and is administered by the Board of Directors. An aggregate of 10,000,000 shares of Common Stock has been reserved for issuance under the Canadian ESPP. Only employees of JDS Uniphase Inc. (which generally includes all Company employees in Ottawa) and corporate affiliates of the Company as designated by the Board of Directors are eligible to participate in the Canadian ESPP. The Canadian ESPP is not intended to qualify as an “Employee Stock Purchase Plan” under Section 423 of the Internal Revenue Code of 1986, as amended (the “Code”).
The terms of the Canadian ESPP provide that shares of the Company’s Common Stock are offered for purchase through a series of successive or overlapping purchase periods (the “Purchase Periods”), each of a duration (not to exceed twenty-four months) as determined by the Board of Directors. Participants enrolled in a Purchase Period are granted a purchase right which entitles the participating employee to specify a level of payroll deduction between 1% and 10% of compensation to be in effect on each pay day during the Purchase Period, and the accumulated payroll deductions are applied to the purchase of the shares when the purchase right is exercised. No rights or accumulated payroll deductions of a participant under the Canadian ESPP may be transferred (other than by will or by the laws of descent and distribution).
Outstanding purchase rights are automatically exercised on successive quarterly or semi-annual purchase dates as determined by the Board of Directors. The purchase right is exercised by applying the accumulated payroll deductions to the purchase of whole shares on each quarterly or semi-annual purchase date. The purchase price per share is the lesser of (i) 85% of the fair market value per share on the date the Purchase Period begins or (ii) 85% of the fair market value per share on the date the purchase right is exercised. The
25
Canadian ESPP limits purchase rights to a maximum of (i) $25,000 worth of stock (determined at the fair market value of the shares at the time the purchase right is granted) in any calendar year, and (ii) 20,000 shares in any Purchase Period.
The Board of Directors amended the Canadian ESPP on July 31, 2002 to provide that no new Purchase Periods shall commence under the Canadian ESPP on or after August 1, 2002, except as otherwise determined by the Board of Directors. Although the Canadian ESPP will not terminate by its terms until July 1, 2009, all Purchase Periods under the Canadian ESPP were terminated on July 31, 2002. The Company has since integrated former participants in the Canadian ESPP into the Company’s Stockholder approved Amended and Restated 1998 Employee Stock Purchase Plan and it is the Company’s present intention to utilize for future purchase periods only this single Stockholder approved employee stock purchase plan for the benefit of all eligible employees of the Company and its corporate affiliates.
REPORT OF COMPENSATION COMMITTEE
The information contained in the following report shall not be deemed to be “soliciting material” or to be “filed” with the Securities and Exchange Commission, nor shall such information be incorporated by reference into any future filing under the Securities Act of 1933, as amended, or the 1934 Securities Exchange Act, as amended, except to the extent that the Company specifically incorporates it by reference in such filing.
The Compensation Committee of the Board of Directors is responsible for insuring that the Company adopts and maintains responsible and responsive compensation programs for its employees, officers and directors consistent with the long-range interests of stockholders. In furtherance of this task, the Compensation Committee has the obligation to ensure that (a) the Company’s compensation policies (including its wage and salary levels, equity programs, and health and benefit plans) are competitive and designed to attract and retain the most qualified employees, officers and directors, (b) all components of compensation (including wage and salary levels, equity programs, and health and benefit plans) are aligned to actual performance and results, and (c) the Company properly and fully performs all of its public disclosure obligations with respect to its compensation programs and director and executive officer compensation. The Compensation Committee is also responsible for administering certain other compensation programs for such individuals, subject in each instance to approval by the full Board. The Compensation Committee also has the exclusive responsibility for the administration of the Company’s employee stock purchase plans and equity incentive plans. The Compensation Committee chairman reports on Compensation Committee’s actions and recommendations at Board meetings. The Company’s Compensation and Benefits Group within the company’s Human Resources department supports the work of the Compensation Committee and in some cases acts pursuant to delegated authority to fulfill various functions in administering the Company’s compensation programs. In addition, the Compensation Committee has the authority to engage the services of outside advisors, experts and others to provide assistance as needed. The Compensation Committee is composed solely of non-employee directors, as such term is defined in Rule 16b-3 under the Securities and Exchange Act of 1934, as amended, each of whom must at all times meet all other applicable federal securities and NASDAQ listing requirements to qualify as an independent director.
The fundamental policy of the Compensation Committee is to provide the Company’s chief executive officer and other executive officers with competitive compensation opportunities based upon their contribution to the financial success of the Company and their personal performance. It is the Compensation Committee’s objective to have a substantial portion of each executive officer’s compensation contingent upon the Company’s performance as well as upon his or her own level of performance. Accordingly, the compensation package for the chief executive officer and other executive officers is comprised of three elements: (i) base salary which reflects individual performance and is designed primarily to be competitive with salary levels in the industry, (ii) annual variable performance awards payable in cash and tied to the Company’s achievement of financial performance targets, and (iii) long-term stock-based incentive awards which strengthen the mutuality of interests between the executive officers and the Company’s stockholders. As an executive officer’s level of responsibility increases, it is the intent of the Compensation Committee to have a greater portion of his or her
26
total compensation be dependent upon Company performance and stock price appreciation rather than base salary.
Several of the more important factors which the Compensation Committee considered in establishing the components of each executive officer’s compensation package for the 2004 fiscal year are summarized below. Additional factors were also taken into account, and the Compensation Committee may in its discretion apply entirely different factors, particularly different measures of financial performance, in setting executive compensation for future fiscal years.
Base Salary. The base salary for each executive officer is determined on the basis of the following factors: experience, personal performance, the average salary levels in effect for comparable positions within and without the industry and internal comparability considerations. The weight given to each of these factors differs from individual to individual, as the Compensation Committee deems appropriate. In selecting comparable companies for the purposes of maintaining competitive compensation, the Compensation Committee considers many factors including geographic location, growth rate, annual revenue and profitability, and market capitalization. The Compensation Committee also considers companies outside the industry which may compete with the Company in recruiting executive talent.
Annual Incentive Compensation. Annual bonuses are earned by each executive officer primarily on the basis of the Company’s achievement of certain corporate financial performance goals established for each fiscal year. For fiscal 2004, the criteria for determination of payment of bonuses was based on the following factors: (i) the Company’s consolidated operating profit performance net of certain non-recurring adjustments, relative to the target established by the Compensation Committee, and (ii) the revenue and operating profit performance of the respective division or subsidiary relative to the targets established by the Compensation Committee. Actual bonuses, if any, earned in fiscal 2004 by each of the current executive officers named in the Summary Compensation Table is indicated in the Bonus and Commission column.
Deferred Compensation Plan. The Company maintains a deferred compensation plan, pursuant to which certain members of management (including the executive officers) may elect to defer a portion of his or her annual compensation. The participants’ funds are invested among various funds designated by the plan administrator and currently may not be invested in the Company’s Common Stock or other Company securities. Upon the death or retirement of a participant, the funds attributable to the participant (including any earnings on contributions) are distributed to the participant or the participant’s beneficiary in a lump sum or in annual installments over a period not to exceed fifteen years.
Long-Term Compensation. Long-term incentives are provided through stock option, restricted stock, and/or restricted stock unit grants. The Compensation Committee believes that stock-based compensation aligns the interests of employees and long-term stockholders and form an important element of the Company’s compensation practices by providing each executive officer with a significant incentive to manage the Company from the perspective of an owner with an equity stake in the business. The Compensation Committee approves the equity grants to the executive officers based on a variety of factors, including the individual performance of the executive officer, an assessment of the value of the individual’s services to the Company, the awards given to other executives, and the desire to keep the Company’s overall compensation competitive. Additionally, the Compensation Committee generally grants equity awards to executive officers upon commencement of their employment with the Company, with the level of award based on factors similar to those considered in connection with annual awards to existing executive officers. The number of shares of Common Stock subject to each grant is set at a level intended to create a meaningful opportunity for stock ownership based on the executive officer’s current position with the Company, the base salary associated with that position, the average size of comparable awards made to executive officers in similar positions within the industry, the executive officer’s potential for increased responsibility and promotion over the grant term, and the executive officer’s personal performance in recent periods. The Compensation Committee also takes into account the number of vested and unvested options and other equity incentives held by the executive officer in order to maintain an appropriate level of equity incentive for that executive officer. The Compensation Committee does not adhere to any specific guidelines as to the relative equity incentive holdings of the
27
Company’s executive officers. The equity incentive awards granted in fiscal 2004 to each of the current executive officers named in the Summary Compensation Table is indicated in the Long-Term Compensation Awards column.
When awarded, stock options are granted at a fixed price per share (not lower than the market price on the grant date) and have a term not to exceed eight years. Stock options generally become exercisable at the rate of 25% of the shares subject thereto one year from the grant date and as to approximately 6.25% of the shares subject to the option at the end of each three-month period thereafter such that the option is fully exercisable four years from the grant date, contingent upon the executive officer’s continued employment with the Company. Accordingly, the option will provide the maximum return to the executive officer only if the executive officer remains employed by the Company for the four-year vesting period, and then only if the market price of the underlying shares of Common Stock appreciates over the option term. Similarly, restricted stock units and shares of restricted stock are granted with transfer and reconveyance restrictions or conversion privileges related to the passage of time, the occurrence of one or more events, and/or the satisfaction of performance or financial criteria or other conditions. The restricted stock or restricted stock unit grant will provide a return to the executive officer only if the executive officer remains employed by the Company during a specified period, and the date of vesting of the grant may be determined based upon the achievement of specified stockholder-aligned performance criteria.
Compensation of the Chief Executive Officer. The compensation of the Chief Executive Officer is reviewed annually on the same basis as discussed above for all executive officers. Dr. Kennedy’s base salary for fiscal 2004 was $500,000. The Compensation Committee recommended, and the Board of Directors approved, Dr. Kennedy’s base salary and initial stock option grant in part by comparing the base salaries of chief executive officers at other companies. Dr. Kennedy’s base salary was set at the approximate median of the base salary range for chief executive officers of comparative companies chosen based upon geographic location, annual revenue and profitability, market capitalization and those which may compete with the Company in recruiting executive talent. Based on the Compensation Committee’s criteria described above and in accordance with the terms of Dr. Kennedy’s employment agreement, in fiscal 2004 Dr. Kennedy was awarded options to purchase 2,000,000 shares of Common Stock at a purchase price of $3.45 per share and options to purchase 1,000,000 shares of Common Stock at a purchase price of $4.35 per share. Dr. Kennedy’s base annual salary is to remain at $500,000 until such time as the Company achieves certain financial milestones, at which time Dr. Kennedy’s base annual salary will be increased to $575,000 retroactive to September 1, 2004. Additionally, the Compensation Committee recommended, and the Board of Directors and Dr. Kennedy have approved, an amendment to the Kennedy Agreement to provide that, notwithstanding achievement of certain personal performance milestones previously determined by the Board of Directors, any bonus payment otherwise due for fiscal year 2004 pursuant to the Kennedy Agreement will not be considered earned and payable until the sooner of (a) achievement by the Company of certain financial performance objectives, or (b) the termination of Dr. Kennedy’s employment.
The Company is required to disclose its policy regarding qualifying executive compensation for deductibility under Section 162(m) of the Code which provides that, for purposes of the regular income tax and the alternative minimum tax, the otherwise allowable deduction for compensation paid or accrued with respect to a covered employee of a publicly-held corporation is limited to no more than $1 million per year. The cash compensation paid to the Company’s executive officers for fiscal 2004 did not exceed the $1 million limit per officer. The Company’s 1993 Plan and 2003 Equity Incentive Plan (the “2003 Plan”) are structured so that any compensation deemed paid to an executive officer when he or she exercises an outstanding option under the 1993 Plan or 2003 Plan, with an exercise price equal to the fair market value of the option shares on the grant date, will qualify as performance-based compensation which will not be subject to the $1 million limitation. In addition, other stock based awards issued under the 2003 Plan may be exempt from the $1 million limitation if such awards are subject to performance criteria and administered in accordance with Section 162(m) of the Code. The Company has discretion to issue other stock based awards which are intended to be exempt from the $1 million limitation as well as other stock based awards that are not intended to be exempt
28
from the $1 million limitation. The Board has required that at least two thirds of all awards to covered employees under the 2003 Plan contain criteria under which the vesting of such awards is tied to achievement of specified performance milestones.
COMPENSATION COMMITTEE
Peter A. Guglielmi
Martin A. Kaplan
Casimir S. Skrzypczak
Kevin J. Kennedy, Ph.D.1
Martin A. Kaplan
Casimir S. Skrzypczak
Kevin J. Kennedy, Ph.D.1
| 1 | Dr. Kennedy resigned as a member of the Compensation Committee on September 1, 2003. |
29
REPORT OF THE AUDIT COMMITTEE
The information contained in the following report shall not be deemed to be “soliciting material” or to be “filed” with the Securities and Exchange Commission, nor shall such information be incorporated by reference into any future filing under the Securities Act of 1933, as amended, or the 1934 Securities Exchange Act, as amended, except to the extent that the Company specifically incorporates it by reference in such filing.
The Audit Committee of the Board of Directors is responsible for assisting the full Board of Directors in fulfilling its oversight responsibilities relative to the Company’s financial statements, financial reporting practices, systems of internal accounting and financial controls, the internal audit function, annual independent audits of the Company’s financial statements, and such legal and ethics programs as may established from time to time by the Board. The Audit Committee is empowered to investigate any matter brought to its attention with full access to all books, records, facilities, and personnel of the Company and may retain external consultants at its sole discretion. The Audit Committee is composed solely of non-employee directors, as such term is defined in Rule 16b-3 under the Securities and Exchange Act of 1934, as amended, all of whom shall satisfy the independence, financial literacy and experience requirements of Section 10A of the Securities Exchange Act of 1934, as amended, the Sarbanes-Oxley Act of 2002, rules applicable to NASDAQ-listed issuers, and any other regulatory requirements. All members of the Committee are required to have a working knowledge of basic finance and accounting, and at all times at least one member of the Committee qualifies as a “financial expert” as defined by the Sarbanes-Oxley Act of 2002.
The following is the Report of the Audit Committee with respect to the Company’s audited financial statements for the fiscal year ended June 30, 2004, which includes the consolidated balance sheets of the Company as of June 30, 2004 and 2003, and the related consolidated statements of operations, stockholders’ equity (deficit) and cash flows for each of the three years in the period ended June 30, 2004, and the notes thereto.
Review with Management
The Audit Committee has reviewed and discussed the Company’s audited financial statements with management.
Review and Discussions with Independent Auditors
The Audit Committee has discussed with Ernst & Young LLP, the Company’s independent auditors, the matters required to be discussed by SAS 61 (Codification of Statements on Accounting Standards) which includes, among other items, matters related to the conduct of the audit of the Company’s financial statements.
The Audit Committee has also received written disclosures and the letter from Ernst & Young LLP required by Independence Standards Board Standard No. 1 (which relates to the auditors’ independence from the Company and its related entities) and has discussed with Ernst & Young LLP its independence from the Company.
The Company has been made aware that affiliates of its Independent Registered Public Accounting Firm, Ernst & Young LLP (“Ernst & Young”), in Mauritius, Barbados, and Singapore performed certain secretarial and directorship services that raise issues under the auditor independence rules. These services are not permitted under the auditor independence rules. The Company, its Audit Committee and Ernst & Young have considered the impact the providing of these services may have had on Ernst & Young’s independence with respect to the Company and concluded there has been no impairment of Ernst & Young’s independence. The services were administrative in nature and the associated fees over the period the services were provided (fiscal year 2001 through 2004) aggregated approximately $71,000. The services have either been discontinued or are in the process of being discontinued.
30
Conclusion
Based on the review and discussions referred to above, the Audit Committee recommended to the Company’s Board that the Company’s audited financial statements be included in the Company’s Annual Report on Form 10-K for the fiscal year ended June 30, 2004.
AUDIT COMMITTEE
Bruce D. Day
Peter A. Guglielmi
Richard T. Liebhaber
Casimir S. Skrzypczak
Peter A. Guglielmi
Richard T. Liebhaber
Casimir S. Skrzypczak
31
STOCK PERFORMANCE GRAPH
The information contained in the following graph shall not be deemed to be “soliciting material” or to be “filed” with the Securities and Exchange Commission, nor shall such information be incorporated by reference into any future filing under the Securities Act of 1933, as amended, or the 1934 Securities Exchange Act, as amended, except to the extent that the Company specifically incorporates it by reference in such filing.
The following graph and table set forth the Company’s total cumulative stockholder return of an investment of $100 on June 1999 and ending June 30, 2004 in: (i) the Company’s Common Stock, (ii) the S&P 500 Index, (iii) the Nasdaq Stock Market (U.S.) Index and, (iv) the Nasdaq Telecommunications Index. Total return assumes reinvestment of dividends. Historical stock price performance is not necessarily indicative of future stock price performance.
COMPARISON OF 5 YEAR CUMULATIVE TOTAL RETURN*
AMONG JDS UNIPHASE CORPORATION
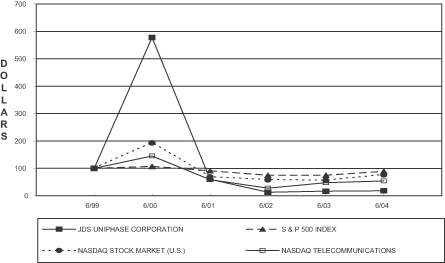
*$100 invested on 6/30/99 in stock or index-including reinvestment of dividends. Fiscal year ending June 30.
| June 30, | ||||||||||||
|---|---|---|---|---|---|---|---|---|---|---|---|---|
| 1999 | 2000 | 2001 | 2002 | 2003 | 2004 | |||||||
| JDS Uniphase Corporation | $100 | $578 | $60 | $12 | $17 | $18 | ||||||
| S&P 500 Index | 100 | 107 | 91 | 75 | 75 | 89 | ||||||
| Nasdaq Stock Market (U.S.) | 100 | 192 | 69 | 58 | 56 | 76 | ||||||
| Nasdaq Telecommunications Index | 100 | 146 | 58 | 28 | 48 | 54 | ||||||
32
CODE OF BUSINESS CONDUCT
The Board of Directors has adopted a Code of Business Conduct applicable to all directors, officers and employees of the Company as required by applicable securities laws, rules of the SEC, and the listing standards of The Nasdaq Stock Market, Inc. The Company will post on its website any amendments to, or waivers from, any provision of its Code of Business Conduct. The Company’s Code of Business Conduct is posted on the Company’s Internet website at www.jdsu.com.
BENEFICIAL OWNERSHIP REPORTING COMPLIANCE
Section 16(a) of the Securities Exchange Act of 1934, as amended, requires the Company’s directors, executive officers and any persons who directly or indirectly hold more than 10 percent of the Company’s Common Stock (“Reporting Persons”) to file reports of ownership and changes in ownership with the SEC. Reporting Persons are required by SEC regulations to furnish the Company with copies of all Section 16(a) forms they file.
Based solely on its review of the copies of such forms received and written representations from certain Reporting Persons that no such forms were required, the Company believes that during fiscal 2004, all Reporting Persons complied with the applicable filing requirements on a timely basis, except for a Form 4 filing on behalf of Jo Major reporting an open market sale which was inadvertently filed late.
OTHER MATTERS
The Company knows of no other matters that will be presented for consideration at the Annual Meeting. If any other matters properly come before the Annual Meeting, it is intended that proxies in the enclosed form will be voted in respect thereof in accordance with the judgments of the persons voting the proxies.
ANNUAL REPORT ON FORM 10-K AND ANNUAL REPORT TO STOCKHOLDERS
UPON WRITTEN REQUEST TO THE CORPORATE SECRETARY, JDS UNIPHASE CORPORATION, 1768 AUTOMATION PARKWAY, SAN JOSE, CALIFORNIA 95131, THE COMPANY WILL PROVIDE WITHOUT CHARGE TO EACH PERSON SOLICITED A COPY OF THE FISCAL 2004 REPORT, INCLUDING FINANCIAL STATEMENTS AND FINANCIAL STATEMENT SCHEDULES FILED THEREWITH.
By Order of the Board of Directors,
Kevin J. Kennedy, Ph.D.
Chief Executive Officer
Chief Executive Officer
October 1, 2004
San Jose, California
33
APPENDIX A
2004 ANNUAL REPORT
| ||
| JDS Uniphase Corporation 1768 Automation Parkway San Jose, CA 95131 USA Tel 408 546-5000 Fax 408 546-4300 www.jdsu.com | ||
October 1, 2004
Dear Shareholder,
Fiscal 2004 was a year of transition for JDS Uniphase. Overall, the team made considerable progress, establishing JDS Uniphase as a stronger company. Of particular note:
| · | we initiated a number of practices to improve corporate governance: separating the roles of Chairman and Chief Executive Officer, consolidating into one headquarters, revising our compensation practices to better align employee and shareholder interests, and imposing limitations on equity awards to the top five executives; |
| · | we renewed our commitment to our customers and, by linking compensation to customer satisfaction and product quality, began to drive that commitment firmly into our company culture. In addition, for the first time, we established a critical accounts team dedicated to the delivery of customer satisfaction, acting as a triage function similar to what is found in an emergency room. Through these efforts, our customer satisfaction has already improved in-line with our internal goals; |
| · | we progressed in our evolution to more highly integrated products in both our communications and our commercial and consumer businesses; |
| · | our investment in high growth markets continues to enable new achievements in our display business, including traction in customer orders for our leading digital light engines for large screen, high definition televisions; |
| · | our most highly integrated communications offerings to date, agile networking devices and OEM development circuit packs, gained traction and are positioned to accelerate in fiscal 2005; and |
| · | we made important changes to the company’s leadership, welcoming several accomplished executives to the management team. Though their tenure with the company has been short, our new Vice President of Operations, Vice President of Corporate Development and Marketing, and others have already implemented significant operational, structural, and strategic improvements throughout the company. These hires were crucial in enabling the company to centralize its key operational functions for improved operational focus. |
Fiscal 2004 Results
Twelve months ago, as we moved through the first quarter of fiscal 2004, revenue was on a downward trend. In contrast, by the end of fiscal 2004, we had stabilized the company and experienced three consecutive quarters of revenue growth. As we exited the fiscal year, we delivered our strongest book-to-bill since the first quarter of fiscal 2001.
We achieved solid improvements to our business model. Despite a 6% decline in net revenues year over year, improved operational execution and tighter cost control resulted in a marked improvement to our bottom line, with GAAP earnings per share improving from a loss of $(0.66) in fiscal 2003, to a loss of $(0.08) in fiscal 2004.
GAAP gross margin (net revenues less cost of goods sold) improved from 8% in fiscal 2003, to 23% in fiscal 2004.
GAAP operating expenses (total research and development, sales, general and administrative expenses) decreased from 141% of net revenues in fiscal 2003 to 51% of net revenues in fiscal 2004.
As a result of these significant improvements, we enter fiscal 2005 cautiously optimistic, far from complacent, and singularly driven to achieve profitability.
Our first profitability-related objective is the achievement of non-GAAP EBITDA (non-GAAP earnings from operations before interest, taxes, depreciation and amortization) breakeven. Rest assured that this is the primary performance objective for every executive on the JDS Uniphase team, with compensation programs tied to this result.
We remain committed to improving gross margin. In the near to mid term, we need to complete our manufacturing rationalization programs, and see continued growth in our newer product offerings before we can stabilize at higher levels.
Let me outline why I believe that these profitability objectives are achievable.
Strategy
First, the Board of Directors and the executive team are aligned behind a clearly defined strategy to deliver JDS Uniphase to profitability. Important components of this strategy include:
| · | establishing closer and more sustainable partnerships with our customers through a more highly integrated product offering. In short, we would like to move to a model where we are supplying assembled sub-systems, rather than individual components, to more of our customers: for example, circuit packs rather than components in our communications business, and light engines rather than components in our commercial and consumer business. We believe that, over time, these products will provide improved time to revenue for our portfolio of investments while delivering higher gross margins; |
| · | introducing innovative, new products that bring improved gross margins; |
| · | driving continued operational improvements through a relentless focus on achieving excellence in our manufacturing processes, customer interactions, and research and design processes; |
| · | reducing manufacturing costs through the expansion of our partnerships with contract manufacturers, the restructure of assets where appropriate, and the transition of internal product manufacturing to lower cost locations; |
| · | continuing to expand sales outside of North America in order to enlarge our revenue opportunity and disperse risk over a global market; |
| · | leveraging our optical technology leadership into adjacent markets offering expanded market opportunities and improved time to revenue; and |
| · | executing on carefully selected, digestible acquisitions and surgical divestitures designed to fortify and enhance our position as a market leader, expand our addressable market, and take advantage of opportunities to improve our profitability. Recent acquisitions, such as E2O Communications, strengthening our datacom presence, and Advanced Digital Optics, fortifying our display business, have demonstrated our capacity to successfully integrate complimentary technologies into the JDS Uniphase family. |
Growth Drivers
Second, we believe that JDS Uniphase will benefit from the following growth drivers in fiscal 2005 and beyond:
Communications
| · | growing demand for broadband, driven by consumer demand for higher quality, faster, and integrated content (internet, voice, music, pictures, etc.); |
| · | service provider investment in new and upgraded networks to support demand for bandwidth-intensive services; |
| · | growth of outsourcing by telecom original equipment manufacturers (OEMs); and |
| · | strong competition between the major service provider segments, cable, telephone carrier, satellite and wireless, to provide “triple play” (voice, video and data) content service to consumers over broadband networks. |
Commercial and Consumer
| · | demand for improved visual display experiences driving growth of large screen, high definition televisions. JDS Uniphase is a leading supplier of optical components used in projection displays and is gaining traction as supplier of light engines for rear projection displays; and |
| · | global explosion of counterfeit merchandise leading to growing investment in brand protection initiatives. JDS Uniphase’s security pigments already protect more than 90 currencies around the world, and our proprietary color-shifting technology protects a number of leading pharmaceutical brands. |
Building Tomorrow’s JDS Uniphase
During fiscal 2004, we laid the foundation for improved performance in fiscal 2005 and beyond. We stabilized the company, strengthened our team, and established a clear strategy for growth. In such a period of transition, it is of credit to our employees that we have been able to grow revenues while continuing to reduce costs. I would like to thank our team for their continued commitment and hard work.
We realize that we have much more work to do on our operating leverage. Throughout fiscal 2005 we will continue our ambitious program of manufacturing rationalization, cost control, and improved operational execution to drive profitability improvements.
I look forward to reporting our progress in the coming quarters, and thank you for your continued support of JDS Uniphase.
Sincerely yours,
Kevin Kennedy
UNITED STATES
SECURITIES AND EXCHANGE COMMISSION
Washington, D.C. 20549
____________________
FORM 10-K
For Annual and Transition Reports Pursuant to Section 13 or 15(d) of the Securities Exchange Act of 1934
(Mark One)
[X] | ANNUAL REPORT PURSUANT TO SECTION 13 OR 15(d) OF THE SECURITIES EXCHANGE ACT OF 1934 FOR THE FISCAL YEAR ENDED JUNE 30, 2004* |
or
[ ] | TRANSITION REPORT PURSUANT TO SECTION 13 OR 15(d) OF THE SECURITIES EXCHANGE ACT OF 1934 FOR THE TRANSITION PERIOD FROM TO . |
Commission File Number: 0-22874
______________________
JDS UNIPHASE CORPORATION
(Exact name of Registrant as specified in its charter)
Delaware (State or other jurisdiction of incorporation or organization) | 94-2579683 (I.R.S. Employer Identification No. | ||
1768 Automation Parkway, San Jose, California (Address of principal executive offices) | 95131 (Zip code) | ||
Registrant’s telephone number, including area code:
(408) 546-5000
Securities registered pursuant to Section 12(b) of the Act:
None
Securities registered pursuant to Section 12(g) of the Act:
Common stock, par value of $.001 per share
(Title of class)
____________________
Indicate by check mark whether the Registrant (1) has filed all reports required to be filed by Section 13 or 15(d) of the Securities Exchange Act of 1934 during the preceding 12 months (or for such shorter period that the Registrant was required to file such reports), and (2) has been subject to such filing requirements for the past 90 days. Yes [X] No [ ]
Indicate by check mark if disclosure of delinquent filers pursuant to Item 405 of Regulation S-K is not contained herein, and will not be contained to the best of the Registrant’s knowledge, in definitive proxy or information statements incorporated by reference in Part III of this Form 10-K or any amendment to this Form 10-K. [X]
Indicate by check mark whether the registrant is an accelerated filer (as defined in Exchange Act Rule 12b-2).
Yes [X] No [ ]
Yes [X] No [ ]
As of January 3, 2004, the aggregate market value of the voting stock held by non-affiliates of the Registrant was approximately $5.4 billion, based upon the closing sale prices of the common stock and exchangeable shares as reported on the Nasdaq National Market and the Toronto Stock Exchange, respectively. Shares of common stock and exchangeable shares held by executive officers and directors have been excluded from this calculation because such persons may be deemed to be affiliates. This determination of affiliate status is not necessarily a conclusive determination for other purposes.
As of August 13, 2004, the Registrant had 1,443,264,161 shares of common stock outstanding, including 62,208,177 exchangeable shares.
DOCUMENTS INCORPORATED BY REFERENCE
Certain information required in Part III of this Annual Report on Form 10-K is incorporated by reference to the Registrant’s definitive Proxy Statement in connection with the 2004 Annual Meeting of Stockholders to be filed with the Securities and Exchange Commission pursuant to Regulation 14A not later than 120 days after the end of the fiscal year.
__________
| * | Our fiscal year ended formally on July 3, 2004. For more information see Note 1 to Consolidated Financial Statements for information regarding Registrant’s fiscal year. |
A-2
TABLE OF CONTENTS
| PART I | ||||
| ITEM 1. | BUSINESS | A-5 | ||
| ITEM 2. | PROPERTIES | A-30 | ||
| ITEM 3. | LEGAL PROCEEDINGS | A-31 | ||
| ITEM 4. | SUBMISSION OF MATTERS TO A VOTE OF SECURITY HOLDERS | A-32 | ||
| PART II | ||||
| ITEM 5. | MARKET FOR REGISTRANT’S COMMON EQUITY AND RELATED STOCKHOLDER MATTERS AND ISSUER PURCHASES OF EQUITY SECURITIES | A-33 | ||
| ITEM 6. | SELECTED FINANCIAL DATA | A-34 | ||
| ITEM 7. | MANAGEMENT’S DISCUSSION AND ANALYSIS OF FINANCIAL CONDITION AND RESULTS OF OPERATIONS | A-35 | ||
| ITEM 7A. | QUANTITATIVE AND QUALITATIVE DISCLOSURES ABOUT MARKET RISK | A-56 | ||
| ITEM 8. | FINANCIAL STATEMENTS AND SUPPLEMENTARY DATA | A-58 | ||
| ITEM 9. | CHANGES IN AND DISAGREEMENTS WITH ACCOUNTANTS ON ACCOUNTING AND FINANCIAL DISCLOSURE | A-114 | ||
| ITEM 9A. | CONTROLS AND PROCEDURES | A-114 | ||
| PART III | ||||
| ITEM 10. | DIRECTORS AND EXECUTIVE OFFICERS OF THE REGISTRANT | A-114 | ||
| ITEM 11. | EXECUTIVE COMPENSATION | A-114 | ||
| ITEM 12. | SECURITY OWNERSHIP OF CERTAIN BENEFICIAL OWNERS AND MANAGEMENT AND RELATED STOCKHOLDER MATTERS | A-114 | ||
| ITEM 13. | CERTAIN RELATIONSHIPS AND RELATED TRANSACTIONS | A-114 | ||
| PART IV | ||||
| ITEM 14. | PRINCIPAL ACCOUNTANT FEES AND SERVICES | A-115 | ||
| ITEM 15. | EXHIBITS, FINANCIAL STATEMENT SCHEDULES, AND REPORTS ON FORM 8-K: | A-115 | ||
| SIGNATURES | ||||
| Exhibit Index | A-121 | |||
| EXHIBIT 3.5 | ||||
| EXHIBIT 10.18 | ||||
| EXHIBIT 10.19 | ||||
| EXHIBIT 10.20 | ||||
| EXHIBIT 10.21 | ||||
| EXHIBIT 10.22 | ||||
| EXHIBIT 10.23 | ||||
| EXHIBIT 10.24 | ||||
| EXHIBIT 10.25 | ||||
| EXHIBIT 10.26 | ||||
| EXHIBIT 21.1 | ||||
| EXHIBIT 23.1 | ||||
| EXHIBIT 31.1 | A-124 | |||
| EXHIBIT 31.2 | A-125 | |||
| EXHIBIT 32.1 | A-126 | |||
| EXHIBIT 32.2 | A-127 |
A-3
FORWARD-LOOKING STATEMENTS
Statements contained in this Annual Report on Form 10-K which are not historical facts are forward-looking statements within the meaning of Section 21E of the Securities Exchange Act of 1934, as amended. A forward-looking statement may contain words such as “anticipate that,” “believes,” “can impact,” “continue to,” “estimates,” “expects to,” “hopes,” “intends,” “plans,” “to be,” “will be,” “will continue to be,” “continuing,” “ongoing,” or similar words. These forward-looking statements include, among others, all italicized portions of this Report and the entire “Strategy” section under Item 1. Business.
Management cautions that forward-looking statements are subject to risks and uncertainties that could cause our actual results to differ materially from those projected in such forward-looking statements. These forward-looking statements involve risks and uncertainties that could cause actual results to differ materially from those projected, including, without limitation, the following: (i) due to, among other things, the Company’s limited visibility, the Company’s ability to perceive or predict market trends (including, among other things, any stabilization recovery or growth thereof) is limited and uncertain; (ii) the Company’s ongoing integration, cost reduction, reorganization and restructuring efforts may not be successful in achieving their expected cost reductions and other benefits, may be insufficient to align the Company’s operations with customer demand and the changes affecting its industry, or may be more costly, or may be more extensive than currently anticipated; (iii) the Company’s ability to predict financial performance for future periods continues to be difficult; and (iv) ongoing efforts to improve our execution and design and introduce products that meet customers’ future need and to manufacture such products at competitive costs may not be successful. Further, our future business, financial condition and results of operations could differ materially from those anticipated by such forward-looking statements and are subject to risks and uncertainties including the risks set forth above and the “Risk Factors” set forth in this Annual Report on Form 10-K. Moreover, neither we assume nor any other person assumes responsibility for the accuracy and completeness of the forward-looking statements. Forward-looking statements are made only as of the date of this Report and subsequent facts or circumstances may contradict, obviate, undermine or otherwise fail to support or substantiate such statements. We are under no duty to update any of the forward-looking statements after the date of this Annual Report on Form 10-K to conform such statements to actual results or to changes in our expectations.
A-4
PART I
ITEM 1. BUSINESS
General
We believe JDS Uniphase is a worldwide leader and pioneer of optical products that enable dramatic improvements in the way we communicate, detect, present and experience information. Our products are used in communications, commercial and consumer applications, including optical networks, entertainment, brand protection and defense.
Our communications products, which include components, modules and subsystems, are used by communications equipment providers for telecommunications, data communications, and cable television networks. These products enable the transmission of video, audio and text data over high-capacity fiberoptic cables. Although ultimately highly complex, these systems perform three basic functions: transmitting, routing (switching) and receiving information, in this case, information encoded on light signals. These products include transmitters, receivers, amplifiers, dispersion compensators, multiplexers and demultiplexers, add/drop modules, switches, optical performance monitors and couplers, splitters and circulators. We also provide test and measurement equipment used to assess performance of optical components in manufacturing, research and development, system development and network maintenance.
The communications industry is undergoing a transformation from audio to visual media for the presentation, analysis and consumption of information used in business, education and entertainment. At the same time, the storage and distribution of content (in the form of high-data audio and video, including emerging digital cinema and HDTV, and multi-player games) are similarly transforming from traditional CDs, floppy discs, DVDs and other physical storage and related distribution methods to digital files transmitted over communications networks and stored on large-capacity servers and hard drives. These transformations require the support of higher capacity networks. Traffic generated over broadband access networks already accounts for the majority of data traffic, and continues to grow at a very high rate. As greater bandwidth capability is delivered closer to the end user, we expect consumers to increasingly demand and obtain higher content, real-time, interactive visual and audio experiences. We believe that we are well positioned to continue to lead in these industries due to our unique expertise in the application of light to innovative optical solutions, enabling new business opportunities for our original equipment manufacturer (OEM) customers worldwide.
Many of the forces driving demand for high-bandwidth communications networks (such as the emergence of high-data digital audio, video and gaming) are similarly transforming the consumer and commercial electronics industries from traditional analog cathode ray tube (CRT), smaller screen displays, to large, flat panel and projection digital mircrodisplays, as consumers and businesses are increasingly demanding the improved visual experiences offered by the new high-data content. Our commercial and consumer segment provides optics and display products (including components and subsystems used in front and rear projection displays) to serve these markets. This segment also provides lasers, coated optics and assemblies for defense, aerospace, instrumentation, biomedical and other applications. For example, we provide lasers for biotechnology, remote sensing, semiconductor, material processing, graphics and imaging and other applications. We also provide document authentication, brand protection and product differentiation solutions for a range of public and private sector markets. The products we provide for these applications control, enhance and modify the behavior of light utilizing its reflection, absorption and transmission properties to achieve specific effects such as high reflectivity, anti-glare and spectral filtering. Specific product applications include computer monitors and flat panel displays, projection systems, photocopiers, facsimile machines, scanners, security products and decorative surface treatments.
The Company was incorporated in California in May 1979 and reincorporated in Delaware in October 1993. The Company is the product of several significant mergers and acquisitions, including, among others, the combination of Uniphase Corporation and JDS FITEL Inc. to form JDS Uniphase Corporation on June 30, 1999, and the subsequent acquisitions of Optical Coating Laboratory, Inc. (“OCLI”) on February 4, 2000, E-TEK Dynamics, Inc. (“E-TEK”) on June 30, 2000 and SDL, Inc. (“SDL”) on February 13, 2001.
Our Internet address is www.jdsu.com. We post all Securities and Exchange Commission (SEC) filings on our website at www.jdsu.com/investors as soon as reasonably practicable after they are electronically filed or furnished
A-5
to the SEC. All such filings on our Investor Relations web site are available free of charge. The SEC maintains an Internet site at www.sec.gov that contains reports, proxy and information statements, and other information regarding issuers that file electronically with the SEC.
Industry Environment
The Company offers innovative products, categorized into two segments, “Communications” and “Commercial and Consumer.” Collectively, these products serve the communications, display, commercial lasers, product and document security and product differentiation markets.
Communications
Among the driving factors in the communications industry is the strong competitive dynamic between telecommunications, cable television, satellite and wireless service providers. Each of these provider types is vying for share of the market for the expected convergence of voice, text and video content. That is, while text, voice and video content are each currently generally delivered over disparate networks, expectations are that all digitized information (text, voice and video) will be delivered from single sources over a consolidated network architecture. Consequently, while service providers typically offer diversified services to both consumers and business markets, many are rapidly investing to deploy converged multi-service networks capable of delivering “triple-play services”, i.e. integrated voice, video and entertainment services. Potential benefits for service providers include increased Average Revenue per User (ARPU) and reduced customer turnover rates, thus increasing both profitability and long-term competitive advantage. This competitive trend is predominantly relevant in markets where government action has led to deregulation of the communications industry, in particular in North America, the European Union, and several countries in both Asia and South America.
Competition between service providers and the need to provide increasing types of services, including a larger percentage of video-based content including news, movies, and gaming is generating strong growth in demand for network capacity and bandwidth rates which in turn drives demand for many types of networking, access and transport systems.
Within the Enterprise market, growing demand for broadband is driven by demand for intra-company (LAN or local area network) and inter-company (WAN or wide area network) information. In addition, many companies are embracing new productivity-enhancing applications, such as Voice over Internet Protocol (VoIP), which replaces traditional fixed circuit, point-to-point voice communications with packet-based network routed calls, and universal messaging systems that require greater bandwidth capability and data storage requirements.
Growing demand for network capacity and bandwidth is expected to result in greater adoption of optical communications products across all segments including: Long Haul, Metro (core and access), Cable TV (CATV), Submarine, Fiber to the Premises (FTTP) in the Telecom sector and LAN, SAN or storage area networks and WAN for the Storage or Enterprise market. While it is too early to predict the outcome of recent industry developments concerning potential FTTP and when or if these developments will impact our business, we do expect that any deployment of fiber closer to the end user will result in increased demand on the metro and long-haul infrastructures into which these new deployments would feed. In general, all implementations move fiber closer to the consumer, displacing copper infrastructure and increasing the availability of wider bandwidth services. We believe that JDS Uniphase, with one of the broadest communications product portfolios in the industry, is poised to capitalize on these developments.
We do remain cautious, however, in attempting to forecast the future. Visibility remains extremely limited, and we cannot provide any assurance as to the timing or scale of any new optical network deployments or sustained industry recovery, in general.
Commercial and Consumer
Our Commercial and Consumer group offers innovative products for application in the following industries:
A-6
Entertainment
We participate in several markets in the entertainment industry that are undergoing a significant evolution driven by:
| • | The emergence of High-Definition content, rapid adoption of DVDs and on-line gaming, and increased use of digital distribution of films and video — Consumers have quickly come to appreciate the impact that higher resolution formats have on the entertainment experience. Among other things, content providers and both satellite and cable television service providers are rapidly increasing supply of high-definition (HD) material that can provide up to 5 times higher resolution than traditional formats. |
| • | Regulations for broadcast and reception for digital TV content — As of July 1, 2004, television manufacturers are mandated by the U.S. Federal Communications Commission to integrate 50% of ATSC (Advanced Television System Committee) standards for digital tuning into all sets measuring 36 inches and larger, and 100 percent of those a year later. Next year, the mandate extends to 50% of sets measuring 25 inches through 35 inches, growing to 100% in 2006. And by July 1, 2007, all sets and video devices that normally carry analog tuning are required to integrate terrestrial ATSC tuning. |
Furthermore, the U.S. Federal Communications Commission has mandated that the nation’s 1,600 television stations transition from analog transmissions to digital signals by the end of 2006, as long as at least 85 percent of households are able to receive those signals.
While we caution that compliance with these regulations has not been universal and, moreover, all or portions of these regulations may be modified, delayed or suspended prior to implementation and enforcement, we do expect that digital broadcasting will increase and, ultimately, replace analog broadcasting.
| • | Migration from scheduled to on-demand content delivery — television programming is undergoing a transformation from scheduled programming, tightly managed by the content providers, to on-demand consumption, driven by consumer demand for greater flexibility as to when and where content is experienced. This in turn, is expected to drive further growth of consumed content. |
The above factors are contributing to the growth of HDTV sets which in turn increasingly rely on microdisplay based solutions such as Liquid Crystal (LCD), Texas Instruments’ Digital Light Processing (DLP™ ) and Liquid-Crystal-on-Silicon (LCoS) technologies as well as plasma technologies to provide the required high resolution solutions needed to display HD images, at cost and form factor points necessary to address the broadest possible market.
As a result of advances in microdisplay technology, consumers can now enjoy very high image quality in large screen formats at an increasingly affordable cost, and demand for rear projection televisions (RPTVs) has fueled a multi-billion dollar market. In calendar 2004, sales of microdisplay-based RPTVs are expected to exceed $4 billion and to surpass sales of the older generation, Cathode-Ray-Tube (CRT) technology models as early as in calendar 2005.
We provide high-quality and high performance component and subsystem level products to Texas Instruments as well as to other OEMs in the RPTV market, and believe we are therefore well positioned to benefit from these trends.
Commercial and Defense
We offer laser and light management solutions for applications in commercial and defense markets including biotechnology, biohazard detection, graphics and imaging, semiconductor and material processing. Technology demands and trends shaping the adoption of high- performance optical solutions include:
| • | analysis of anomalies in human genome sequencing to discover cures to genetic diseases; |
| • | growth in the semiconductor market; |
| • | need for lasers and instrumentation that offer innovative, non-invasive, effective measurement and analysis for biomedical and healthcare; and |
| • | remote sensing in environmental, including bio hazard detection, applications growth. |
A-7
These trends are generating increasing demands for commercial laser products. Market growth is further stimulated by the continuous reductions in sizes and power driven by adoption of solid state technology. We believe that, as a leading provider of commercial laser and other supporting technologies, we are poised to benefit from the rapid development of these industry trends.
Consumer
Brand owners are increasingly concerned with the loss of revenues to counterfeit products. Revenue lost to counterfeit products is currently estimated near $500 billion annually, and growing. Additional effects include risk to consumer health and safety, corporate liability issues, devaluation of brand image and weakening of brand loyalty. Products likely to be subject to counterfeit include pharmaceuticals, apparel, automotive parts, consumer electronic products, electronic media, and currency.
Multiple factors are contributing to the rapidly growing counterfeit market including, among others, the broad adoption of the Internet, ready availability of low-cost, very high-quality printers, the elimination of international trade barriers and an increasingly mobile global society.
Many corporate brand owners are now taking protective measures, developing both covert and overt packaging strategies that provide consumers and/or their inspection personnel with the ability to quickly determine product authenticity, for instance, by detecting a color-shifting pattern on the package itself.
Our optical technology already protects more than 90 currencies worldwide, is now being introduced by leading pharmaceutical companies and is being evaluated by other companies, to protect some of their most important brands. We believe that, as a leader in the design and manufacture of color-shifting technology for decorative, document and brand authentication solutions, we are poised to continue extending our industry impact and to broaden our reach to new areas.
Restructuring Programs
In December 2003, we announced the completion of our Global Realignment Program which began in April 2001. That program focused on large-scale site and employee reductions. We expect to continue to take advantage of opportunities to further reduce costs through targeted, customer-driven, restructuring events.
In the future we expect our restructuring efforts to be focused principally on:
Reducing the company’s footprint and rationalizing the manufacture of our products based on core competencies, cost efficiency and alternative manufacturers, where appropriate. Among other things, we expect to continue strengthening our partnerships with contract manufacturers primarily for our telecommunications, data communications, lasers and display products. Furthermore, we expect to increasingly centralize in-house manufacturing to our lower-cost facility in Shenzhen, China. We may not be successful in our manufacturing strategy. There are many risks to be addressed, as more particularly described in the “Risk Factors” section below.
| • | We have consolidated manufacturing, research and development, sales and administrative facilities through building and site closures. As of June 30, 2004, 29 sites and buildings in North America, Europe and Asia-Pacific have been closed. The process involves consolidating product lines, standardizing on global product designs, and transferring manufacturing to fewer locations. The 29 sites closed were as follows: | ||
| North America: | Asheville, North Carolina; Columbus, Ohio; Eatontown, New Jersey; Freehold, New Jersey; Gloucester, Massachusetts; Horsham, Pennsylvania; Manteca, California; Ottawa, Ontario (two sites); Piscataway, New Jersey; Raleigh, North Carolina; Richardson, Texas; Rochester, New York; San Jose, California (two sites); Toronto, Ontario; Victoria, British Columbia. | ||
| Europe | Arnhem, Netherlands; Bracknell, United Kingdom; Eindhoven, Netherlands; Hillend, United Kingdom; Oxford, United Kingdom; Plymouth, United Kingdom; Torquay, United Kingdom; Waghaeusel-Kirrlach, Germany; Witham, United Kingdom. | ||
| Asia-Pacific: | Shunde, China; Sydney, Australia; Taipei, Taiwan. | ||
A-8
| • | We have centralized many administrative functions such as information technology, human resources and finance to take advantage of synergies, economies of scale and common processes and controls. |
Our results of operations and financial condition were significantly affected by charges related to our restructuring activities, the write-downs of inventories, and the impairment of our investments and long-lived assets during fiscal 2004, 2003 and 2002.
Please refer to Management’s Discussion and Analysis of Financial Condition and Results of Operations under Item 7 and Notes to the Consolidated Financial Statements under Item 8 of this Annual Report on Form 10-K for further discussion on these charges.
Acquisitions
As part of JDS Uniphase’s strategy, we are committed to the ongoing evaluation of strategic opportunities and, where appropriate, to the acquisition of additional products, technologies or businesses that are complementary to, or broaden the markets for our products. During fiscal 2004, we acquired:
| • | E2O Communications, Inc.; and |
| • | the optical communication business from Ditech Communications, Inc. |
Acquisition of E2O Communications
We acquired E2O Communications for approximately $60 million in cash. E2O develops and manufactures optical transceivers to support Fast Ethernet, Gigabit Ethernet, 10 Gigabit Ethernet, 1X-4X Fibre Channel, 10 Gigabit Fibre Channel, ESCON, ATM and SONET. E2O is a supplier to major datacom customers, including seven that are additive to JDS Uniphase’s customer base.
Acquisition of the optical business of Ditech Communications
We paid approximately $1.4 million in cash for the optical business of Ditech Communications, which included specific product lines from Altamar, the optical portion of Ditech. We acquired an amplifier product line that offers a full range of integrated solutions including optics, electronics and software. We also acquired their product line of transponder subsystems that are rack-mountable and ready for installation into a system. These product lines complement our own and are in line with our strategic direction toward providing higher levels of integration, in particular, the integration of modules, electronics and software to provide subsystems.
Please refer to “Note 17. Mergers and Acquisitions” of Notes to Consolidated Financial Statements under Item 8 of this Annual Report on Form 10-K for further discussion of these acquisitions
Operating Segments and Products
We operate in two principal segments through which we develop and manufacture our products: (i) Communication Products, which accounted for approximately 50% of our net revenue in fiscal 2004, and (ii) Commercial and Consumer Products — formerly the Thin Film Products Group, which accounted for approximately 50% of our net revenue in fiscal 2004. The revenue included under Commercial and Consumer Products includes the products addressing both the Entertainment and Defense industries.
Please refer to “Note 18. Operating Segments and Geographic Information” of Notes to Consolidated Financial Statements under Item 8 of this Annual Report on Form 10-K for further discussion of our operating segments.
Through our two segments, we serve customers in the communications, entertainment, consumer, commercial and defense industries.
In the communications industry, we provide optical products and solutions to the telecommunications market, including submarine, long haul, metro, access and cross connect applications. We also serve the data communications market, including SAN, LAN, and Ethernet WAN applications, as well as the cable television market.
A-9
In the commercial and defense industries, we provide laser and optics products that are used in biotechnology, material processing, semiconductor, graphics and imaging, aerospace and defense applications.
In the consumer industry, we provide optical solutions using light interference for document and currency authentication as well as for product authentication and brand protection. We also provide decorative coatings using light interference that provide product differentiation.
In the entertainment industry, we provide light engines, coated optics and assemblies for displays for front and rear projection televisions. We also provide coated optics for entertainment lighting.
Communications Products:
Our communications products include a broad range of components, modules and subsystems better enabling our customers to satisfy all of their requirements through “one-stop” shopping at a single supplier. We also leverage our broad-based component portfolio to provide higher levels of integration in modules and subsystems to create value-added solutions for our customers. The breadth of our communications product offering is described below.
Source Lasers: At the front end of the network, a source laser provides the initial signal that is transmitted over the network. A single source laser is required for each channel in a wavelength division multiplexing (WDM) system. We provide continuous wave lasers for external modulation as well as directly modulated lasers for a variety of telecom and cable television systems. In addition to fixed wavelength lasers, we also provide tunable lasers that can be adjusted to any frequency over a range of wavelengths, and this year introduced Tunable Laser Modulator (the TLM series), the industry’s first integrated laser-modulator tunable over the entire C-band of wavelengths.
Photodetectors and Receivers: Photodetectors and receivers detect the optical signals and convert them back into electronic signals. Photodetectors, when co-packaged with an electronic preamplifier, are referred to as receivers. Receivers are used in WDM products for each channel at both ends of the fiberoptic link. Photodetectors are also used throughout a network to monitor a variety of characteristics including power levels and channel count. We expanded our broad offering of receivers this year to include a 10 Gb/s avalanche photodiode (APD) receiver that offers high dynamic range through the integration of a variable optical attenuator and a very small form factor, multi-source agreement (MSA) compliant, micro APD receiver.
Modulators: Modulators turn light on and off external to the source laser to encode the information being sent through the network. External modulation can be achieved either by using a separate discrete modulator or by monolithically integrating a laser and modulator. We supply both types of modulators. The highest performance is obtained using lithium niobate technology, which was used in the integrated tunable laser/modulator described in Source Lasers, above.
Wavelength Lockers: We supply wavelength lockers that are used to stabilize the wavelength of lasers used in dense WDM transmission systems. These lockers ensure that, over the lifetime of the system, the wavelength of a source laser does not drift to interfere with an adjacent wavelength channel. The locker operates by filtering and detecting a small amount of the source-laser light and providing a stabilizing feedback signal to the laser.
Transmitters: We manufacture transmitters that combine source lasers, modulators, wavelength lockers and electronic drivers so that the optical signal is created and encoded in a single package.
Transceivers: Transceivers combine transmitters with receivers so that signals can be generated and encoded, and received and detected in a single package. These modules are installed at both ends of a system. We supply transceivers in various form factors and specifications to both the data communications and telecommunications markets, now including the new 4.25 Gigabit per second (Gb/s) Fibre Channel and Ethernet transceivers small form factor pluggable (SFP) and the new 10 Gb/s XFP 850 nm small form factor, pluggable, datacom transceivers.
Transponders: Transponders are transceivers that include electrical multiplexing and demultiplexing functions. They include signal receivers or transmitters that respond to or send signals. Transponders are often used as input interfaces between the optical and electrical signals for WDM systems. We offer transponders for a wide range of data rates and link distances, and introduced this year a family of small form factor, 300-pin, 10 Gb/s microprocessor-controlled transponders for SONET/SDH or Ethernet applications in access, metro and core networks fiber up to 100 km.
A-10
Cable Television Transmitters and Amplifiers: In cable television networks we supply externally modulated transmitters and amplifiers for trunk-line applications, directly modulated transmitters for the distribution portion of cable television networks, return-path lasers for interactive communications and transmitters providing both analog and digital signals to the recipient. We expanded our product line this year with xEMT 2100, a 1550 nanometer (nm) externally modulated transmitter designed for CATV and fiber to the premises (FTTP) original equipment manufacturers and system integrators.
Amplifiers: We supply Erbium-doped fiber amplifier (EDFA) optical amplifiers and Raman amplification pump modules. These products cover a wide range of functionality and are designed to boost optical signals without reconversion to electrical signals and permit an optical signal to travel a greater distance between electronic terminals and regenerators. Technology advances enable smaller, more efficient designs, and we introduced the OA450, a compact and economical option for pre-amplifier or booster amplification in either single channel or dense wavelength division multiplexing (DWDM) in metro, long haul, or ultra long haul networks.
Pump Lasers: Pump lasers are used in optical amplifiers within networks to regenerate the light signal that naturally suffers loss over distance within the network. Optical amplifiers each contain from one to six pump lasers depending on amplifier performance requirements. We supply 980-nanometer and 1480-nanometer pump lasers. These pumps are used to energize the erbium-doped fiber that comprises the amplifier. We also supply 14xx-nm (wavelength tailored) pump lasers that are utilized in Raman modules.
Add-Drop Multiplexers: We supply add-drop multiplexers that allow systems to add and drop optical wavelengths without reconversion to an electrical signal. For example, a system operating from San Francisco to New York can drop one wavelength in Chicago and add another allowing for greater network flexibility. The modules include multiple components such as switches, wavelength mutiplexers/demultiplexers, and attenuators.
WDM Couplers, Filters, Isolators and Circulators: Wavelength division multiplexer couplers are used to split and combine signals of different wavelengths in an optical network. We supply WDM demultiplexers and access/bi-directional couplers. These products are based on thin-film filters, arrayed waveguide gratings, fused fiber couplers, microlenses and /or special optical materials. Isolator products are used to allow light signals in a network to propagate in one direction within a network, but prevent that signal from returning in the opposite direction. Circulators also allow light in a system to flow in only one direction, but have multiple ports and use these multiple ports to perform a routing function within the network. We supply various types of isolators and circulators including tunable narrow-bandpass filters that are wavelength-tunable by voltage control.
Switches and Attenuators: Optical switches are used to route and switch signals to different destinations within networks. Attenuators are used to adjust the power of the optical signal to be compatible with the optical receivers within a network system. We supply both discrete devices and modules, including dynamically reconfigurable modules, containing a number of these components.
Optical Channel Monitors (OCM): We introduced this year the OCM, a 100 GHz spaced optical channel monitor that allows system developers to check performance continuously in real-time. The OCM integrates all the functions needed to cost-effectively monitor wavelength, power and, if desired, Optical Signal to Noise Ratio (OSNR) performance in complex networks in the C- and L-band wavelength ranges.
Telecommunications Specialty Modules: We supply a number of specialty products for multi-gigabit fiberoptic systems.
Instrumentation: Test instruments are used for testing and measuring optical components. Many of the test instruments were originally developed for evaluating our own optical components during design and production. We pioneered the development of swept wavelength systems, which are faster and allow more measurements over smaller wavelength ranges than previous methods. Our Multiple Application Platform (MAP), the next generation platform for our line of fiberoptic test and measurement instrumentation includes a flexible, modular test instrument, in a direct modulated CATV transmitter module and a ribbon fiber power meter that can test cables with up to 72 fibers.
WaveReady Products: WaveReady Products are a family of plug-and-play products for metro edge and access applications including amplification, reach extension, fiber relief, protection switching, and optical demarcation.
A-11
They offer a low cost alternative for enabling DWDM and CWDM networking and new wavelength services such as Ethernet and SAN. Hardware and software products new this year to the WaveReady™ network edge access product line include the WSH-540LX and WSH-550SX DWDM optical regenerators for converting 1360 nm to 15xx DWDM wavelengths, The WaveReady 2010 Gigabit Ethernet extender that increases maximum interconnect distance to 67 miles, the WaveReady 3100 rack-mount platform and the WaveReady Node Manager, an intuitive graphical interface for use with the communications module to provide fault and status management functions.
Subsystems: In addition to the components and modules listed above, we provide higher levels of integration by providing subsystem level products. Our circuit packs, which include optics and electronics integrated on to a circuit board and or otherwise packaged with an interface and increasing levels of embedded software intelligence plug into a telecommunication system. We provide amplifier, transponder, switching and other circuit pack subsystems.
Commercial and Consumer Products:
Our Commercial and Consumer Products represent the company’s center of excellence for thin film coating, optical assembly, bulk optics and laser technologies. Optical thin film coatings are microscopic layers of materials, such as silicon and magnesium fluoride, applied to the surface of a substrate, such as glass, plastic or metal, to alter its optical properties. Thin film coatings work by controlling, enhancing or modifying the behavior of light to produce specific effects such as reflection, refraction, absorption, abrasion resistance, anti-glare and electrical conductivity. This control is achieved as a result of the optical properties, number of layers and thickness of the thin film coatings in relation to wavelengths of light. The ability to control the behavior of light using thin film coatings plays a critical role in many industries and products.
The Commercial and Consumer Products Group has direct responsibility for leveraging its technologies into the following markets.
Entertainment:
In the display market, we manufacture and sell products for use in both home and business display systems. These products include front surface mirrors, color wheels, packaging lids for DLP™ (Digital Light Processor, a microdisplay technology developed by Texas Instruments) imagers, and other coated optics and assemblies.
In our fiscal year 2004, we introduced the UltreX and DefiniTV light engines for the fast growing large screen, high-definition television market. In a projection display, a signal enters, is decoded and a color image created. This image must then be enlarged hundreds of times and projected on a screen without distortion to the image or colors, so that it is still clear, sharp and vivid. The light engine is a highly integrated assembly of optics that is used in a rear projection television to reflect and magnify the image while managing color, maintaining contrast, minimizing losses and distortion. We offer light engines for both Liquid-Crystal-on-Silicon (LCOS) and DLP technologies.
Our UltreX light engine is designed for use with LCOS microdisplay technology in large-screen, rear projection televisions. UltreX is an optics assembly that enlarges and manages light to produce a vivid and accurate image for large-screen and high definition applications.
The DefiniTV light engine is designed for use with DLP™ imagers, a microdisplay technology developed by Texas Instruments. DefiniTV is an optics assembly that enlarges and manages light to produce a vivid and accurate image for large-screen and high definition applications.
Optics:
The aerospace and medical/environmental instrumentation markets require sophisticated, custom, high-precision coated products and optical components that selectively absorb, transmit or reflect light in order to meet the specific performance requirements of advanced systems. Our products include infrared filters, beam splitters and optical sensors for aerospace applications, optical filters for medical instruments and solar cell covers for satellites. Our products in the office automation market include photoreceptors and front surface mirrors for photocopiers, document scanners, overhead projectors, facsimile machines and printers.
A-12
Entertainment Lighting: We provide entertainment lighting filters, which are used to create dramatic lighting effects and project rich, saturated color in intelligent lighting systems for concerts, discotheques, stages, and studios.
Infrared Products: We provide multi-cavity and linear variable infrared filters on a variety of substrates for a variety of applications including gas monitoring and analysis, thermal imaging, smart munitions, fire detection, spectroscopy, and pollution monitoring.
Solar Products: We believe we are a world leader in solar cell cover glass and thermal control mirror technology. One or more of our solar products can be found on all U.S. manned spacecraft, on most U.S. satellites, and on many international satellites.
Crystals, Prisms, and Custom Optics: We offer a wide array of crystals, precision optics, and crystal assembly for Solid State Diode Pumped (DPSS) laser systems that are used in analytical instruments, DPSS lasers, DVD optical pickup heads, and high power lasers.
Document Authentication and Brand Protection
Light interference pigments create unique color shifting characteristics utilized in security products and decorative surface treatments. Our security products use light interface pigments, which allow ink to exhibit different colors from different viewing angles. The pigments are used to inhibit counterfeiting of currencies and other valuable documents. We also provide products incorporating proprietary interference technologies to provide brand authentication and security to protect against counterfeits. Applications include pharmaceuticals, as well as premium brand apparel, electronics, computer and other consumer goods. We offer these products in a wide range of flexible solutions by incorporating them into labels and packaging. This year we expanded our SecureShift® product line with the introduction of MetaSwitch, an effective alternative to holograms, that provides an easily recognizable, secure method of product authentication.
Product Differentiation
We have a line of decorative products that utilize similar manufacturing processes as our security products, but are designed to have certain color characteristics that make it attractive for applications in paints, cosmetics and plastics. The pigments create a durable color shifting finish for automotive, consumer electronics and other applications.
Laser Products:
Our portfolio of laser products includes components and subsystems used in a wide variety of OEM applications. Our broad range of products, including industrial laser diodes, industrial fiber lasers, marking systems, helium-neon (HeNe) gas lasers, air-cooled argon gas lasers, and continuous wave and pulsed diode-pumped solid-state lasers, allow us to meet the needs of our customers in markets and applications such as: Biotechnology, materials processing, semiconductor, graphics and imaging, remote sensing/ranging and laser marking.
Industrial Laser Diodes: We have leveraged our telecom expertise into a family of industrial laser diode products, including components, plug and play modules and fiber-coupled devices. These laser diodes address a wide variety of applications including laser pumping, thermal exposure, illumination, ophthalmology, image recording, printing, material processing, optical storage, and spectral analysis.
Argon Ion Lasers: We believe we are a leading manufacturer of air-cooled argon ion lasers. Argon lasers are very stable and reliable over the entire range of operating currents and temperatures, making them well suited for complex, high-resolution OEM applications such as flow cytometry, DNA sequencing, graphics and imaging, and semiconductor inspection.
Helium-Neon Lasers: We offer helium-neon lasers in the red, green, yellow, and orange wavelengths. These products provide high output power with low noise, offering excellent beam pointing and amplitude stability, and instant start-up. These lasers are used in various applications including bar code scanning, flow cytometry, metrology, photo processing, and alignment.
A-13
Diode-Pumped Solid-State Lasers: With high output power, excellent beam quality, low noise, exceptional reliability, and very small packaging, our continuous wave and pulsed diode-pumped solid-state lasers are ideal for use in biotechnology instrumentation, material processing, graphics and imaging, semiconductor manufacturing, and laser induced fluorescence applications.
Fiber Lasers: Fiber lasers are compact in size, require simple wall-socket power, and are air-cooled, making them easy to integrate into a system. The nominal output wavelength of one micron makes them ideal for precision machining applications such as marking, bending and cutting, and selective soldering. New this year is the 6390-L3 Commercial Laser, designed for laser manufacturers developing fiber and disk lasers for applications as diverse as auto body welding and semiconductor marking.
Although these markets and applications comprise the principal portion of our laser products business, we continue to develop our technology and evaluate the potential to provide solutions in additional applications and in new markets.
Competitive Environment
In our communications markets we compete against numerous fiberoptic component, module, subsystem and instrumentation manufacturers, including independent merchant suppliers and business units within vertically integrated equipment manufacturers, some of whom are also our customers. A partial list of these competitors includes: Agilent Technologies (“Agilent”), Avanex, Bookham Technology, Finisar, Fujitsu, Furukawa Electric, Oplink Communications, and Sumitomo Electric. In addition to these established companies, we also face competition from other companies and from emerging start-ups. While each of our product families has multiple competitors, we believe that we have the broadest range of products and technologies available in the industry. We also believe that this range of products and technology positions us well as the industry continues to move towards module and subsystem level products.
In our commercial and consumer markets, we strive to be a principal supplier to most of our key customers. In our consumer markets, we face competition from providers of special effect pigments, including BASF and Merck KGaA. In our entertainment markets, we face competition from Japanese coating companies such as Nidek, Toppan and Tore, and display component companies such as Viratec, Nitto Optical, Asahi, Nikon and Fuji Photo-Optical. In our commercial and defense markets we compete with optics companies such as Deposition Sciences, Barr Associates, and Sonoma Photonics. We also compete with laser companies such as Coherent, Melles Griot and the Spectra-Physics division of Newport.
Strategy
Our objective is to continue to be a leading supplier of fiberoptic components, modules and subsystems for all markets and industries we serve — in particular, we plan to pursue the following product strategies:
Communications
Help accelerate our customers’ profitability and time-to-revenue via enhanced vertically integrated optical platforms, such as modules and circuit packs that leverage the broad optical components we also sell directly to OEMs
Commercial & Defense
Exploit transitions from gas to solid-state to enable new generation of applications, by making laser-based solutions accessible in the bio-medical, graphical, remote sensing and material processing markets
A-14
Consumer
Uniquely differentiate and effectively protect valuable brands via a secure, flexible and aesthetically innovative optical platform. Within our entertainment sub-segment, deliver the highest quality entertainment experience with best in class integrated light engines, which provide high-contrast and high-brightness for the fast growing microdisplay-based HD RPTV market.
In support of these product strategies, we are pursuing a corporate strategy that we believe will best position us for future opportunities in all the markets we serve. The key elements of our corporate strategy include:
| • | Customer-driven execution. We are committed to working closely with our customers from initial product design through to manufacturing and delivery. We strive to engage with our customers at the early stages of development to provide them with their entire component, module or subsystem needs. Ensuring that our sales, customer support, product marketing and development efforts are organized and executed to maximize effectiveness in our customer interactions continues to be a fundamental aspect of our strategy. |
| • | Maintaining technology leadership. We believe that our technology and product leadership is an important competitive advantage. Driven by current and anticipated demand, we will continue to invest in new technologies and products that offer our customers increased efficiency, higher performance, improved functionality, and/or higher levels of integration. |
| • | Vertical Integration. In response to cost saving initiatives, enterprises are increasingly focusing on core competences and choosing to outsource manufacturing that was previously performed in-house. As a result of these two trends, a growing number of our customers are demanding more highly integrated products across our markets, for example, integrated circuit packs rather than individual components in the communications business, and integrated light engines for large-screen televisions rather than individual components in the consumer business. Higher levels of integration offer the opportunity for higher revenues, and improved margins over time. |
| • | Structuring our manufacturing capabilities for increased efficiency and quality improvement. Between 2001 and 2004, we consolidated 41 manufacturing locations to 14, inclusive of our mergers and acquisitions activity during the period. We remain committed to streamlining our manufacturing operations and reducing costs by using lower-cost contract manufacturers where appropriate, and by situating our factories in lower-cost locations capable of consistently meeting our customers’ quality and performance requirements. For example, we are moving the manufacture of many of our established communications products to our facility in Shenzhen, China. |
| • | Pursuing complementary strategic relationships. Complementary and digestible acquisitions can expand our addressable markets and strengthen our competitive position. As part of our growth strategy, we continue to critically assess opportunities to develop strategic relationships, including acquisitions and investments, with other businesses. |
| • | Developing our people. Our management and employees have formed a culture of innovation, passion, adaptability and resilience that has proven its strength through extreme changes in the market. We are focused on retaining key contributors, developing our people and nurturing this level of commitment. |
Although we expect to be successful in implementing our strategy, there are many internal and external factors that could impact our ability to meet any or all of our objectives. Some of these factors are discussed under “Risk Factors” below.
Sales and Marketing
We market our products primarily to original equipment manufacturers, distributors and strategic partners in North America, Europe and Asia-Pacific. Our sales organizations communicate directly with customers’ engineering, manufacturing and purchasing personnel in determining the design, performance and cost specifications for customer product requirements. Our customers for fiberoptic communications solutions include Agilent, Alcatel, Ciena, Cisco Systems, Hewlett-Packard, Huawei, IBM, Lucent, Nortel, SBC Communications and
A-15
Scientific-Atlanta. Our customers in our commercial and consumer markets include Agilent, Applied Biosystems, Eastman Kodak, Hitachi, KLA Tencor, Mitsubishi, SICPA, Sony, Texas Instruments and Toshiba.
During fiscal 2004 and 2002, no customer accounted for more than 10% of net revenue. During fiscal 2003, Texas Instruments accounted for 12% of net revenue.
We believe that a high level of customer support is necessary to develop and maintain long-term relationships with our customers. Each relationship begins at the design-in phase and is maintained as customer needs change and evolve. We provide direct service and support to our customers through our offices in North America, Asia and Europe. We have aligned our sales organization in the communications business to offer customers a single point of contact for all of their product requirements, and created centers of excellence to streamline customer interactions with product line managers. We are also continuing to consolidate administrative functions to provide improved customer service and reduce our costs.
Research and Development
During fiscal 2004, 2003, and 2002, we incurred research and development expenses of $99.5 million, $153.7 million, and $254.8 million, respectively. Our total number of employees engaged in research and development has decreased to 647 as of June 30, 2004, compared to 674 at June 30, 2003 and 1,240 as of June 30, 2002.
We devote substantial resources to research and development in order to develop new and enhanced component, module and subsystem, products to serve our communications, display, document and product security, medical/environmental instrumentation and laser markets. Once the design of a product is complete, our engineering efforts shift to enhancing both the performance of that product and our ability to manufacture it at high volumes and at lower cost.
For the communications marketplace, we are increasing our focus on the most promising markets while maintaining our capability to provide products throughout the network. We are increasing our emphasis on the next generation optical components and modules, such as reconfigurable optical add drop multiplexers (ROADMs), tunable devices, FTTP products and intelligent modules, needed for long-haul, metro, access, local area network, storage area network, and enterprise markets. We are also responding to our customers’ requests for higher levels of integration, including the integration of optics, electronics and software in our modules, subsystems and circuit packs.
In our Commercial and Consumer markets, our research and development efforts concentrate on developing more innovative solutions such as economical and commercially suitable light interference pigments, color separation filters and various components for optical systems, and components, modules and assemblies to serve the display and instrumentation markets. Among other things, we are currently devoting substantial research and development resources to our light engine and other display products, as well as to solid-state lasers and improved processes and manufacturing equipment.
Manufacturing
The following table sets forth our manufacturing locations and the primary products manufactured at each location as of June 30, 2004. Manufacturing facilities and products manufactured by our contract-manufacturing partners (located in San Jose, Texas, Mexico, Thailand and Singapore) are not included in the table below:
A-16
| Location | Products | |
|---|---|---|
NORTH AMERICA: | ||
| Canada: | ||
| Ottawa | Wavelength blockers, equalizers, waveguide modules, dispersion compensation modules, custom modules, circuit packs, optical performance monitors and instrumentation and control products | |
| United States: | ||
| Commerce, CA | Packaging labels for both security and non-security applications | |
| Melbourne, FL | Transceivers and transponders | |
| Mountain Lakes, NJ | Precision glass manufacturing | |
| Rochester, MN | Optical transceivers | |
| San Jose, CA | High power pump lasers, source lasers, and waveguides | |
| Santa Rosa, CA | Optical display and projection products, light interference pigments for security and decorative applications, gas and solid state lasers, laser subsystems and thin film filters, | |
| Ewing, NJ | Photodetectors, receiver products, erbium doped fiber amplifiers (EDFA), optical amplifiers and source lasers | |
| Bloomfield, CT | Lithium niobate modulators, wavelength lockers and electronic drivers for telecommunications | |
REST OF WORLD: | ||
| China: | ||
| Beijing | Light interference pigments for security applications | |
| Fuzhou | Neodymium-doped yttrium vanadate (YVO4), display components and specialty optics | |
| Shenzhen | Variety of standard optical components and modules | |
| Singapore | Transceivers | |
| Indonesia | Transceivers |
Sources and Availability of Raw Materials
Our intention is to establish at least two sources of supply for materials whenever possible, although we do have some sole source supply arrangements. The loss or interruption of such arrangements could have an impact on our ability to deliver certain products on a timely basis.
Patents and Proprietary Rights
Intellectual property rights that apply to our various products include patents, trade secrets and trademarks. Because of the rapidly changing technology and a broad distribution of patents in our industry, we do not rely primarily on intellectual property rights to protect or establish our market position. We do not intend to broadly license our intellectual property rights unless we can obtain adequate consideration or enter into acceptable patent cross-license agreements. As of June 30, 2004, we held 947 U.S. patents and 373 foreign patents.
Backlog
Backlog consists of written purchase orders for products for which we have assigned shipment dates within the following 12 months. As of June 30, 2004, our backlog was approximately $147.0 million as compared to $90.5 million at June 30, 2003. Orders in backlog are firm, but are subject to customers’ cancellation or rescheduling. Because of possible changes in product delivery schedules and cancellation of product orders, and because our sales
A-17
will often reflect orders shipped in the same quarter in which they are received, our backlog at any particular date is not necessarily indicative of actual revenue or the level of orders for any succeeding period.
Employees
We had 6,041 employees as of June 30, 2004, as compared to 5,489 and 9,222 as of June 30, 2003 and June 30, 2002, respectively. Our workforce as of June 30, 2004 included 4,578 employees in manufacturing, 647 employees in research and development, 492 employees in general and administrative functions (including information technology, finance and human resources), and 324 employees in sales and marketing.
Our employees are not represented by any collective bargaining organization except for our operations in France and Germany. We have never experienced a work stoppage, slowdown or strike. Notwithstanding the current economic slowdown, we consider our employee relations generally to be good.
Similar to other technology companies, particularly those located in Silicon Valley, we rely upon our ability to use stock options and other forms of equity-based compensation as key components of our executive and employee compensation structure. Historically, these components have been critical to our ability to retain important personnel and offer competitive compensation packages. Without these components, we would be required to significantly increase cash compensation levels (or develop alternative compensation structures) in order to retain our key employees, particularly as and when an industry recovery returns. Recent proposals to modify accounting rules relating to the expensing of equity compensation may require us to substantially reduce, or even eliminate, all or portions of our equity compensation programs.
Risk Factors
We have continuing concerns regarding the manufacture, quality and distribution of our products. These concerns are heightened as our markets stabilize and our volumes and new product offerings increase.
Our success depends upon our ability to deliver high quality products on time to our customers at acceptable cost. As a technology company, we constantly encounter quality, volume and cost concerns. Currently, a confluence of factors is exacerbating our concerns:
| • | Our continuing cost reduction programs, which include site consolidations, product transfers (internally and to contract manufacturers) and employee reductions, require the re-establishment and re-qualification of complex manufacturing lines, as well as modifications to systems, planning and operational infrastructure. During this process, we have experienced, and continue to experience, additional costs, and delays in re-establishing volume production levels, supply chain interruptions, planning difficulties and systems integration problems. |
| • | Recent increases in demand for our products, in the midst of our cost reduction programs, have strained our execution abilities as well as those of our suppliers, as we are experiencing capacity, workforce and materials constraints, enhanced by concerns associated with product and operational transfers. |
| • | Recently, we have commenced a series of new product programs and introductions, particularly in our circuit pack, communications and display components, light engine and commercial laser businesses, which due to the untested and untried nature of the relevant products and their manufacture and their increased complexity, exposes us to product quality risk, internally and with our materials suppliers. Among other things, one of our light engine customers recently announced delays in its display program due in part to yield, quality and volume problems with our light engine. While we are working diligently to resolve these problems, we cannot predict when all of these concerns will be resolved or the impact of these concerns on our customers and our light engine program. |
These factors have caused considerable strain on our execution capabilities and our customer relations. Currently, we are (a) having difficulty responding to customer delivery expectations for some of our products, (b) unable to fulfill customer demand for some of our products, (c) experiencing yield and quality problems, particularly with some of our new products and high-volume products, and (d) expending additional funds and other resources
A-18
to respond to these execution challenges. We are currently losing additional revenue opportunities due to these concerns. We are also, in the short-term, diverting resources from research and development and other functions to assist with resolving these matters. If we do not improve our performance in all of these areas, our operating results will be harmed, the commercial viability of new products may be challenged and our customers may choose to reduce their purchases of our products and purchase additional products from our competitors.
If our customers do not qualify our manufacturing lines for volume shipments, our operating results could suffer
Customers will not purchase certain of our products, other than limited numbers of evaluation units, prior to qualification of the manufacturing lines for the products. This concern is particularly relevant to us as we continue to take advantage of opportunities to further reduce costs through targeted, customer-driven, restructuring events, which will involve the relocation of certain of our manufacturing internally and to external manufacturers. Each new (including relocated) manufacturing line must undergo rigorous qualification testing with our customers. The qualification process can be lengthy and is expensive, with no guarantee that any particular product qualification process will lead to profitable product sales. The qualification process determines whether the manufacturing line achieves the customers’ quality, performance and reliability standards. Our expectations as to the time periods required to qualify a product line and ship products in volumes to customers may be erroneous. Delays in qualification can cause a long-term supply program to be cancelled. These delays will also impair the expected timing, and may impair the expected amount, of sales of the affected products. Nevertheless, we may, in fact, experience delays in obtaining qualification of our manufacturing lines and, as a consequence, our operating results and customer relationships would be harmed.
We could incur significant costs to correct defective products
Our products are rigorously tested for quality both by our customers and us. Nevertheless, our products do, and may continue to, fail to meet customer expectations from time-to-time. Also, not all defects are immediately detectible.
Customers’ testing procedures are limited to evaluating our products under likely and foreseeable failure scenarios. For various reasons (including, among others, the occurrence of performance problems that are unforeseeable in testing or that are detected only when products are fully deployed and operated under peak stress conditions), our products may fail to perform as expected long after customer acceptance. Failures could result from faulty design or problems in manufacturing. In either case, we could incur significant costs to repair and/or replace defective products under warranty, particularly when such failures occur in installed systems. We have experienced such failures in the past and remain exposed to such failures, as our products are widely deployed throughout the world in multiple demanding environments and applications. In some cases, product redesigns or additional capital equipment may be required to correct a defect. We have in the past increased our warranty reserves and have incurred significant expenses relating to certain communications products. Any significant product failure could result in lost future sales of the affected product and other products, as well as severe customer relations’ problems, litigation and damage to our reputation.
If our contract manufacturers fail to deliver quality products at reasonable prices and on a timely basis, our results of operations and financial conditions could be harmed
We are increasing our use of contract manufacturers as an alternative to internal manufacturing. If these contract manufacturers do not fulfill their obligations to us, or if we do not properly manage these relationships and the transition of production to these contract manufacturers, our existing customer relationships will suffer. In addition, by undertaking these activities, we run the risk that the reputation and competitiveness of our products and services may deteriorate as a result of the reduction of our control over quality and delivery schedules. We also may experience supply interruptions, cost escalations and competitive disadvantages if our contract manufacturers fail to develop, implement or maintain manufacturing methods appropriate for our products and customers. In this regard, we have experienced, and continue to experience, difficulties (such as delays, interruptions and quality problems) associated with products we have transferred to contract manufacturers. These may continue, resulting in, among other things, lost revenue opportunities, customer dissatisfaction and additional costs.
A-19
We must improve our cost structure to achieve long-term profitability
Although we have made progress in reducing the magnitude of our losses in recent quarters, we are not yet profitable. High overhead and materials costs, product transfer and reorganization expenses and new product (start-up) costs have contributed to our high expense structure, while competitive forces (increasingly from Asia-based competitors) and a highly concentrated customer base for many of our products continue to pressure pricing. In addition, our telecommunications business, which has historically featured discrete, highly customized products (with concomitant higher profit margins), is moving to increased standardization and commoditization (with correspondingly lower profit margins). Taken together, these factors are limiting our profitability.Among other things, we believe that customer base concentration, product standardization and commoditization and international competition (particularly from Asia) represent fundamental changes to our industries and that these factors, among others, will create continuing pricing constraints.
In response to these concerns we are working vigorously to reduce our cost structure and have seen significant progress. Nevertheless, major actions remain, including elimination of duplicative operations or infrastructure, transferring manufacturing and product lines to more optimal internal locations or, in many cases, to independent contract manufacturers, disposing of unnecessary assets, centralizing functions, improving our governance and systems, and, as necessary, streamlining our employee base. These measures (including, among other things, the measures taken under our restructuring programs) may be disruptive, more costly or extensive than expected, may be insufficient to align our operations with customer demand and the changes affecting our industry, and, ultimately, unsuccessful in creating profit margins sufficient to sustain our business and growth strategy.
If our new product offerings fail in the market, our business will suffer
We are a technology company. Our success or failure depends, in large part, upon our ability to continuously and successfully introduce and market new products and technologies meeting or exceeding our customer’s expectations. Accordingly, we intend to continue to develop new product lines and improve the business for existing ones. However, we have considerably reduced our research and development spending from historic levels and some of our competitors now spend considerably higher percentages of their revenues on research and development than do we. If we fail to develop and sustain a robust, commercially viable product pipeline our business will suffer.
In recent periods, we have increased our focus on new products, particularly in our circuit pack and display businesses. Our current growth strategy emphasizes both of these businesses. Nevertheless, several of the key relevant products are untried and untested and have not yet demonstrated long-term commercial viability. Current challenges include establishing sustainable pricing and cost models, predictable and acceptable quality and yields, and adequate and reliable supply chains, as well as demonstrating our (and our suppliers’) ability to scale and provide adequate facilities, personnel and other resources. Nonetheless, if we fail to successfully develop and commercialize some or all of these new products, our business could suffer.
Stability concerns affecting many of our key suppliers could impair the quality, cost or availability of many of our important products, harming our revenue, profitability and customer relations
We have numerous materials suppliers for our products and, frequently, many of our important products rely on single-source suppliers for critical materials. These products include several of our advanced components, modules and subsystem products across our businesses. Many of our important suppliers are small companies facing financial stability, quality, yield, scale or delivery concerns. Some of these companies may be acquired, undergo material reorganizations or become insolvent. Others are larger companies with limited dependency upon our business, resulting in unfavorable pricing, quantity or delivery terms. The recent signs of market stability in our business have exacerbated these concerns as we increase our purchasing to meet our customers’ demands. We are currently undertaking programs to ensure the long-term strength of our supply chain.Nevertheless, we are experiencing, and expect for the foreseeable future to continue to experience, strain on our supply chain and periodic supplier problems. We have incurred,and expect for the foreseeable future to continue to incur, costs to address these problems. In addition, these problems have impacted, andwe expect for the foreseeable future will continue
A-20
to impact, our ability to meet customer expectations. If we do not identify and implement long-term solutions to our supply chain concerns, our customer relationships and business will materially suffer.
Recent signs of market stability are not necessarily indicative of long-term growth
The recent economic downturn has had and will likely continue to have long-term implications for our markets.
Among other things, while our direct telecommunications customer base has remained largely intact, their customer base, the service providers, has been significantly reduced due to significant industry consolidations and the elimination of most of the competitive local exchange carriers. Notwithstanding recent signs of market stability and generally increasing demand for our products, average selling prices continue to decline and revenue and profitability targets and projections are subject to uncertainty and variability. While we are encouraged by recent developments, our visibility remains limited and we remain cautious and cannot predict the long-term prospects for our industries, or our business, operations or financial condition, at this time.
The communications equipment industry has extremely long product development cycles requiring us to incur product development costs without assurances of an acceptable investment return
The telecommunications industry is a capital-intensive industry similar, in many respects, to any other infrastructure development industry. Large volumes of equipment and support structures are installed over vast areas, with considerable expenditures of funds and other resources, with long investment return period expectations. Moreover, reliability requirements are intense. Consequently, there is significant resistance to network redesigns and upgrades. Consequently, redesigns and upgrades of installed systems are undertaken only as required in response to user demand and competitive pressures and generally only after the applicable carrier has received sufficient return on its considerable investment. At the component supplier level this reality creates considerable, typically multi-year, gaps between the commencement of new product development and volume purchases. Accordingly, we and our competitors often incur significant research and development and sales and marketing costs for products that, at a minimum, will be purchased by our customers long after much of the cost is incurred (very long “time to cash”) and, at a maximum, may never be purchased due to changes in industry or customer requirements in the interim.
Our success depends on sustained recovery and long-term growth in our markets
If the Internet does not continue to grow as expected, our communications business will suffer.
Our future success as a manufacturer of optical components, modules and subsystems ultimately depends on the continued growth of the communications industry and, in particular, the growth of the Internet as a global communications system. As part of that growth, we are relying on increasing demand for high-content voice, video, text and other data delivered over high-speed connections (i.e., high bandwidth communications). As Internet usage and bandwidth demand increase, so does the need for advanced optical networks to provide the required bandwidth. Without Internet and bandwidth growth, the need for our advanced communications products, and hence our future growth as a manufacturer of these products, is jeopardized. Currently, while increasing demand for Internet access and for broadband access, in particular, is apparent, growth is limited by several factors, including, among others, an uncertain regulatory environment, reluctance from content providers to supply video and audio content over the communications infrastructure, and uncertainty regarding sustainable business models as multiple industries (cable, traditional telecommunications, wireless, satellite, etc.) offer non-complimentary and competing content delivery solutions. Ultimately, should long-term expectations for Internet growth and bandwidth demand not be realized or support a sustainable business model, our business would be significantly harmed.
A-21
We are increasingly depending on stability and growth in non-communications markets.
Our Communications and Commercial and Consumer products segments each currently represent about fifty percent (50%) of our total revenue. Our strategy emphasizes the growth opportunities in both segments, as we seek to expand our markets and customer base, increase the level of integration of our products, and improve time to revenue. In furtherance of this strategy, we are engaged in or exploring several new product opportunities in our Commercial and Consumer segment, particularly in our display business, as well as expanding the opportunities for our current products in this segment. Consequently, we are increasingly dependent upon growth markets outside of communications for our overall growth and success. Failures in these markets or our execution of programs related to the same will significantly harm our business.
Our business and financial condition could be harmed by our long-term growth strategy
Notwithstanding the recent decline, our businesses have historically grown, at times rapidly, and we have grown accordingly.We have made, and expect in the future to make, significant investments to enable our future growth through, among other things, internal expansion programs, product development, acquisitions and other strategic relationships. We may grow our business through business combinations or other acquisitions of businesses, products or technologies. We continually evaluate and explore strategic opportunities as they arise, including business combinations, strategic partnerships, capital investments and the purchase, licensing or sale of assets. Acquisitions may require significant capital infusions, typically entail many risks and could result in difficulties in assimilating and integrating the operations, personnel, technologies, products and information systems of acquired companies. If we fail to manage or anticipate our future growth effectively, particularly during periods of industry uncertainty, our business will suffer. Through our cost reductions measures we are balancing the need to consolidate our operations with the need to preserve our ability to grow and scale our operations as our markets stabilize and recover. If we fail to achieve this balance, our business will suffer to the extent our resources and operations are insufficient to respond to a return to growth.
Our financial results could be affected by potential changes in the accounting rules governing the recognition of stock-based compensation expense
We measure compensation expense for our employee stock compensation plans under the intrinsic value method of accounting prescribed by APB Opinion No. 25, “Accounting for Stock Issued to Employees.” Under this method, we recognized compensation charges related to stock compensation plans of $2.0 million, $50.9 million, and $124.9 million in fiscal 2004, 2003 and 2002, respectively. In accordance with SFAS No. 123, “Accounting for Stock-Based Compensation,” we provide disclosures of our operating results as if we had applied the fair value method of accounting (pro-forma basis). Beginning in the third quarter of fiscal 2003, we provide such disclosures in our Quarterly Reports on Form 10-Q in accordance with SFAS No. 148, “Accounting for Stock-Based Compensation—Transition and Disclosure.” Had we accounted for our compensation expense under the fair value method of accounting prescribed by SFAS No. 123, the charges would have been significantly higher than the intrinsic value method used by us, totaling $300.0 million, $685.2 million, and $688.9 million in fiscal 2004, 2003 and 2002, respectively. Currently, the Financial Accounting Standards Board (“FASB”) is considering changes to accounting rules concerning the recognition of stock option compensation expense. If these proposals are implemented, we and other companies may be required to measure compensation expense using the fair value method, which would adversely affect our results of operations by increasing our losses by the additional amount of such stock option charges.
Our sales are dependent upon a few key customers
A few large customers account for most of our sales. During fiscal 2004 and 2002, no customer accounted for 10% of our total net revenue. During fiscal 2003, Texas Instruments accounted for 12% of our total net revenue.We expect that, for the foreseeable future, sales to a limited number of customers will continue to account, alone
A-22
or in the aggregate, for a high percentage of our total net revenues. Dependence on a limited number of customers exposes us to the risk that order reductions from any one customer can have a material adverse effect on periodic revenue.
One of our products is dependent upon a single customer for a majority of sales.
We have a strategic alliance with SICPA, our principal customer for our light interference pigments which are used to, among other things, provide security features in currency. Under a license and supply agreement, we rely exclusively on SICPA to market and sell to this market worldwide. The agreement requires SICPA to purchase minimum quantities of these pigments over the term of the agreement. If SICPA fails to purchase these quantities, as and when required by the agreement, for any reason, our business and operating results (including, among other things, our revenue and gross margin) will be harmed, at least in the short-term. In the long-term, we may be unable to find a substitute marketing and sales partner or develop these capabilities ourselves.
Any failure to remain competitive would harm our operating results
The markets in which we sell our products are highly competitive and characterized by rapidly changing and converging technologies. We face intense competition from established domestic and international competitors and the threat of future competition from new and emerging companies in all aspects of our business. Much of our current competition comes from large, diversified Asian corporations, and emerging, largely Chinese optical companies. These competitors have considerable optical expertise, and often very low cost structures.We expect Asian, and particularly Chinese, competition to increase. To remain competitive in both the current and future business climates, we believe we must maintain a substantial commitment to research and development, and significantly improve our cost structure. Our efforts to remain competitive may be unsuccessful.
If we fail to attract and retain key personnel, our business could suffer.
Our future depends, in part, on our ability to attract and retain key personnel. We may not be able to hire and retain such personnel at compensation levels consistent with our existing compensation and salary structure. Our future also depends on the continued contributions of our executive management team and other key management and technical personnel, each of whom would be difficult to replace. The loss of services of these or other executive officers or key personnel or the inability to continue to attract qualified personnel could have a material adverse effect on our business.
Similar to other technology companies, particularly those located in Silicon Valley, we rely upon our ability to use stock options and other forms of equity-based compensation as key components of our executive and employee compensation structure. Historically, these components have been critical to our ability to retain important personnel and offer competitive compensation packages. Without these components, we would be required to significantly increase cash compensation levels (or develop alternative compensation structures) in order to retain our key employees, particularly as and when an industry recovery returns. Recent proposals to modify accounting rules relating to the expensing of equity compensation may cause us to substantially reduce, or even eliminate, all or portions of our equity compensation programs.
Certain of our non-telecommunications products are subject to governmental and industry regulations, certifications and approvals.
The commercialization of certain of the products we design, manufacture and distribute through our Commercial and Consumer product segment may be delayed or made more costly due to required government and industry approval processes. Development of applications for our light interference pigment products may require significant testing that could delay our sales. For example, certain uses in cosmetics may be regulated by the Food and Drug Administration, which has extensive and lengthy approval processes. Durability testing by the automobile industry of our pigments used with automotive paints can take up to three years. If we change a product for any reason including technological changes or changes in the manufacturing process, prior approvals or certifications may be invalid and we may need to go through the approval process again. If we are unable to obtain these or other government or industry certifications in a timely manner, or at all, our operating results could be adversely affected.
A-23
We face risks related to our international operations and revenue
Our customers are located throughout the world. In addition, we have significant offshore operations, including manufacturing, sales and customer support operations. Our operations outside North America include facilities primarily in Asia-Pacific.
Our international presence exposes us to certain risks, including the following:
| • | our ability to comply with the customs, import/export and other trade compliance regulations of the countries in which we do business, together with any unexpected changes in such regulations; |
| • | difficulties in establishing and enforcing our intellectual property rights; |
| • | tariffs and other trade barriers; |
| • | political, legal and economic instability in foreign markets, particularly in those markets in which we maintain manufacturing and research facilities; |
| • | difficulties in staffing and management; |
| • | language and cultural barriers; |
| • | seasonal reductions in business activities in the countries where our international customers are located; |
| • | integration of foreign operations; |
| • | longer payment cycles; |
| • | greater difficulty in accounts receivable collection; |
| • | currency fluctuations; and |
| • | potential adverse tax consequences. |
Net revenue from customers outside North America accounted for 36%, 30% and 26% of our total net revenue in fiscal 2004, 2003 and 2002, respectively.We expect that revenue from customers outside North America will continue to account for a significant portion of our total net revenue. Lower sales levels that typically occur during the summer months in Europe and some other overseas markets may materially and adversely affect our business. In addition, sales of many of our customers depend on international sales and consequently further expose us to the risks associated with such international sales.
The international dimensions of our operations and sales subject us to a myriad of domestic and foreign trade regulatory requirements. As part of our ongoing integration program, we are evaluating our current trade compliance practices and implementing improvements, where necessary. Among other things, we are auditing our product export classification and customs procedures and are installing trade information and compliance systems using our global enterprise software platforms.We do not currently expect the costs of such evaluation or the implementation of any resulting improvements to have a material adverse effect on our operating results or business. However, our evaluation and related implementation are not yet complete and, accordingly, the costs could be greater than expected and such costs and the legal consequences of any failure to comply with applicable regulations could affect our business and operating results.
We are increasing manufacturing operations in China, which expose us to risks inherent in doing business in China
As a result of our efforts to reduce costs, we have increased our manufacturing operations in China and those operations are subject to greater political, legal and economic risks than those faced by our other operations. In particular, the political, legal and economic climate in China (both at national and regional levels) is extremely fluid and unpredictable. Among other things, the legal system in China (both at the national and regional levels) remains highly underdeveloped and subject to change, with little or no prior notice, for political or other reasons. Our ability to operate in China may be adversely affected by changes in Chinese laws and regulations, such as those
A-24
relating to taxation, import and export tariffs, environmental regulations, land use rights, intellectual property and other matters. Moreover, the enforceability of applicable existing Chinese laws and regulations is uncertain. These concerns are exacerbated for foreign businesses, such as ours, operating in China. Our business could be materially harmed by any changes to the political, legal or economic climate in China or the inability to enforce applicable Chinese laws and regulations.
Currently, we operate manufacturing facilities located in Shenzhen, Fuzhou and Beijing, China. As part of our efforts to reduce costs, we continue to increase the scope and extent of our manufacturing operations in our Shenzhen facilities.Accordingly, we expect that our ability to operate successfully in China will become increasingly important to our overall success. As we continue to consolidate our manufacturing operations, we will incur additional costs to transfer product lines to the facilities located in China, which could have a material adverse impact on our operating results and financial condition.
We intend to export the majority of the products manufactured at our facilities in China. Accordingly, upon application to and approval by the relevant governmental authorities, we will not be subject to certain Chinese taxes and are exempt from customs duty assessment on imported components or materials when the finished products are exported from China. We are however required to pay income taxes in China, subject to certain tax relief. As the Chinese trade regulations are in a state of flux, we may become subject to other forms of taxation and duty assessments in China or may be required to pay for export license fees in the future. In the event that we become subject to any new Chinese forms of taxation, our results of operations could be materially and adversely affected.
We may incur unanticipated costs and liabilities, including costs under environmental laws and regulations.
Our operations use certain substances and generate certain wastes that are regulated or may be deemed hazardous under environmental laws. Some of these laws impose liability for cleanup costs and damages relating to releases of hazardous substances into the environment. Such laws may become more stringent in the future. In the past, costs and liabilities arising under such laws have not been material; however, we cannot assure you that such matters will not be material to us in the future.
Our business and operations would suffer in the event of a failure of our information technology infrastructure
We rely upon the capacity, reliability and security of our information technology hardware and software infrastructure and our ability to expand and update this infrastructure in response to our changing needs. We are constantly updating our information technology infrastructure. Among other things, we have entered into an agreement with Oracle to provide and maintain our global ERP infrastructure on an outsourced basis. Any failure to manage, expand and update our information technology infrastructure or any failure in the operation of this infrastructure could harm our business.
Despite our implementation of security measures, our systems are vulnerable to damages from computer viruses, natural disasters, unauthorized access and other similar disruptions. Any system failure, accident or security breach could result in disruptions to our operations. To the extent that any disruptions or security breach results in a loss or damage to our data, or inappropriate disclosure of confidential information, it could harm our business. In addition, we may be required to spend additional costs and other resources to protect us against damages caused by these disruptions or security breaches in the future.
A-25
If we have insufficient proprietary rights or if we fail to protect those we have, our business would be materially harmed
We may not obtain the intellectual property rights we require.
Others, including academic institutions, our competitors and other large technology-based companies, hold numerous patents in the industries in which we operate. Some of these patents may purport to cover our products. In response, we may seek to acquire license rights to these or other patents or other intellectual property to the extent necessary to ensure we possess sufficient intellectual property rights for the conduct of our business. Unless we are able to obtain such licenses on commercially reasonable terms, patents or other intellectual property held by others could inhibit our development of new products, impede the sale of some of our current products, or substantially increase the cost to provide these products to our customers. While in the past, licenses generally have been available to us where third-party technology was necessary or useful for the development or production of our products, in the future licenses to third-party technology may not be available on commercially reasonable terms, if at all. Generally, a license, if granted, includes payments by us of up-front fees, ongoing royalties or a combination of both. Such royalty or other terms could have a significant adverse impact on our operating results. We are a licensee of a number of third-party technologies and intellectual property rights and are required to pay royalties to these third-party licensors on some of our telecommunications products and laser subsystems.
Our products may be subject to claims that they infringe the intellectual property rights of others.
The industry in which we operate experiences periodic claims of patent infringement or other intellectual property rights. We have received in the past and, from time to time, may in the future receive notices from third parties claiming that our products infringe upon third-party proprietary rights. One consequence of the recent economic downturn is that many companies have turned to their intellectual property portfolios as an alternative revenue source. This is particularly true of companies which no longer compete with us. Many of these companies have larger, more established intellectual property portfolios than ours. Typical for a growth-oriented technology company, at any one time we generally have various pending claims from third parties that one or more of our products or operations infringe or misappropriate their intellectual property rights or that one or more of our patents is invalid. For example, we have pending litigation with Litton Systems, Inc. and the Board of Trustees of the Leland Stanford, Jr. University involving claims for damages in connection with the alleged past infringement by our optical amplifiers of a now expired U.S. patent. We will continue to respond to other claims in the course of our business operations. In the past the settlement and disposition of these disputes has not had a material adverse impact on our business or financial condition, however this may not be the case in the future. Further, the litigation or settlement of these matters, regardless of the merit of the claims, could result in significant expense to us and divert the efforts of our technical and management personnel, whether or not we are successful. If we are unsuccessful, we could be required to expend significant resources to develop non-infringing technology or to obtain licenses to the technology that is the subject of the litigation. We may not be successful in such development or such licenses may not be available on terms acceptable to us, if at all. Without such a license, we could be enjoined from future sales of the infringing product or products.
Our intellectual property rights may not be adequately protected.
Our future depends in part upon our intellectual property, including trade secrets, know-how and continuing technological innovation. We currently hold numerous U.S. patents on products or processes and corresponding foreign patents and have applications for some patents currently pending. The steps taken by us to protect our intellectual property may not adequately prevent misappropriation or ensure that others will not develop competitive technologies or products. Other companies may be investigating or developing other technologies that are similar to our own. It is possible that patents may not be issued from any application pending or filed by us and, if patents do issue, the claims allowed may not be sufficiently broad to deter or prohibit others from marketing similar products. Any patents issued to us may be challenged, invalidated or circumvented. Further, the rights under our patents may not provide a competitive advantage to us. In addition, the laws of some territories in which our products
A-26
are or may be developed, manufactured or sold, including Europe, Asia-Pacific or Latin America, may not protect our products and intellectual property rights to the same extent as the laws of the United States.
We face certain litigation risks that could harm our business
We have had numerous lawsuits filed against us asserting various claims, including securities and ERISA class actions and stockholder derivative actions. The results of complex legal proceedings are difficult to predict. Moreover, many of the complaints filed against us do not specify the amount of damages that plaintiffs seek and we therefore are unable to estimate the possible range of damages that might be incurred should these lawsuits be resolved against us. While we are unable to estimate the potential damages arising from such lawsuits, certain of them assert types of claims that, if resolved against us, could give rise to substantial damages. Thus, an unfavorable outcome or settlement of one or more of these lawsuits could have a material adverse effect on our financial position, liquidity and results of operations. Even if these lawsuits are not resolved against us, the uncertainty and expense associated with unresolved lawsuits could seriously harm our business, financial condition and reputation. Litigation can be costly, time-consuming and disruptive to normal business operations. The costs of defending these lawsuits, particularly the securities class actions and stockholder derivative actions, have been significant, will continue to be costly and may not be covered by our insurance policies. The defense of these lawsuits could also result in continued diversion of our management’s time and attention away from business operations, which could harm our business.
Recently enacted and proposed regulatory changes will cause us to incur increased costs
Recently enacted and proposed changes in the laws and regulations affecting public companies, including the provisions of the Sarbanes-Oxley Act of 2002, will increase our expenses as we evaluate the implications of new rules and devote resources to respond to the new requirements.In particular, we expect to incur additional SG&A expense as we implement Section 404 of the Sarbanes-Oxley Act, which requires management to report on, and our Independent Registered Public Accounting Firm to attest to, our internal controls. The compliance of these new rules could also result in continued diversion of management’s time and attention, which could prove to be disruptive to normal business operations. Further, the impact of these events could also make it more difficult for us to attract and retain qualified persons to serve on our board of directors or as executive officers, which could harm our business.
We are currently performing the system and process evaluation required to ensure compliance as of June 30, 2005 with the management certification and auditor attestation requirements of Section 404 of the Sarbanes Oxley Act. While we currently anticipate that we will timely complete all such actions, we cannot at this time provide absolute assurance that all such actions will timely be completed, although possible consequences of failure include, sanction or investigation by regulatory authorities, such as the Securities Exchange Commission or the Nasdaq National Market, and inability to timely file our Annual Report on Form 10-K for fiscal 2005. Any such action could harm our stock price.
If we fail to manage our exposure to worldwide financial and securities markets successfully, our operating results could suffer
We are exposed to financial market risks, including changes in interest rates, foreign currency exchange rates and marketable equity security prices. We often utilize derivative financial instruments to mitigate these risks. We do not use derivative financial instruments for speculative or trading purposes. The primary objective of most of our investment activities is to preserve principal while at the same time maximizing yields without significantly increasing risk. To achieve this objective, a majority of our marketable investments are floating rate and municipal bonds, auction instruments and money market instruments denominated in U.S. dollars. When we acquire assets denominated in foreign currencies, we usually mitigate currency risks associated with these exposures with forward currency contracts. A substantial portion of our sales, expense and capital purchasing activities are transacted in U.S. dollars. However, some of these activities are conducted in other currencies, primarily Canadian and European currencies. To protect against reductions in value and the volatility of future cash flows caused by changes in foreign exchange rates, we may enter into foreign currency forward contracts. The contracts reduce, but do not always entirely eliminate, the impact of foreign currency exchange rate movements. Actual results on our financial position may differ materially.
A-27
We also hold investments in other public and private companies, including, among others, Nortel Networks, Adept and ADVA, and have limited funds invested in private venture funds. All three companies have experienced severe stock price declines during the recent economic downturn, which have greatly reduced the value of our investments, and we have written down the value of these investments as the decline in fair value was deemed to be other-than-temporary.In addition to our investments in public companies, we have in the past and expect to continue to make investments in privately held companies as well as venture capital investments for strategic and commercial purposes. For example, we had a commitment to provide additional funding of up to $16.0 million to certain venture capital investment partnerships as of June 30, 2004. In recent months some of the private companies in which we held investments have ceased doing business and have either liquidated or are in bankruptcy proceedings. If the carrying value of our investments exceeds the fair value and the decline in fair value is deemed to be other-than-temporary, we will be required to write down the value of the investments, which could materially harm our results of operations or financial condition.
We recently sold $475.0 million of senior convertible notes, which significantly increased our leverage, and may cause our reported earnings per share to be more volatile because of the conversion contingency features of these notes.
On October 31, 2003 we issued $475.0 million of indebtedness in the form of senior convertible notes. The issuance of these notes substantially increased our principal payment obligations and we may not have enough cash to repay the notes when due. By incurring new indebtedness, the related risks that we now face could intensify. The degree to which we are leveraged could materially and adversely affect our ability to successfully obtain financing for working capital, acquisitions or other purposes and could make us more vulnerable to industry downturns and competitive pressures.
In addition, the holders of those notes are entitled to convert those notes into shares of our common stock under certain circumstances. Unless a conversion contingency is met, the shares of our common stock underlying the notes are not currently included in the calculation of our basic or diluted earnings per share. When this contingency is met, diluted earnings per share may, depending on the relationship between the interest on the notes and the earnings per share of our common stock, be expected to decrease as a result of the inclusion of the underlying shares in the diluted earnings per share calculation.
The FASB’s Emerging Issues Task Force (“EITF”) reached the tentative conclusion in EITF Issue No. 04-8, “The Effect of Contingently Convertible Debt on Diluted Earnings Per Share” that contingently convertible debt instruments should be included in diluted earnings per share computation regardless of whether the contingency has been met. The consensus reached by the Task Force is effective for reporting periods ending after December 15, 2004.
Under the tentative conclusion reached by the EITF, we would include the 96.2 million contingently convertible shares in our calculation of diluted earnings per share. If the debt had been outstanding for the full fiscal year, it would have increased the number of shares used for calculating diluted earnings per share by approximately 7%.
Our rights plan and our ability to issue additional preferred stock could harm the rights of our common stockholders
In February 2003, we amended and restated our Stockholder Rights Agreement and currently each share of our outstanding common stock is associated with one right. Each right entitles stockholders to purchase 1/100,000 share of our Series B Preferred Stock at an exercise price of $21.0.
The rights only become exercisable in certain limited circumstances following the tenth day after a person or group announces acquisition of or tender offers for 15% or more of our common stock. For a limited period of time following the announcement of any such acquisition or offer, the rights are redeemable by us at a price of $0.01 per right. If the rights are not redeemed, each right will then entitle the holder to purchase common stock having the value of twice the then-current exercise price. For a limited period of time after the exercisability of the rights, each right, at the discretion of our Board of Directors, may be exchanged for either 1/100,000 share of Series B Preferred Stock or one share of common stock per right. The rights expire on June 22, 2013.
Our Board of Directors has the authority to issue up to 499,999 shares of undesignated preferred stock and to determine the powers, preferences and rights and the qualifications, limitations or restrictions granted to or
A-28
imposed upon any wholly unissued shares of undesignated preferred stock and to fix the number of shares constituting any series and the designation of such series, without the consent of our stockholders. The preferred stock could be issued with voting, liquidation, dividend and other rights superior to those of the holders of common stock.
The issuance of Series B Preferred Stock or any preferred stock subsequently issued by our Board of Directors, under some circumstances, could have the effect of delaying, deferring or preventing a change in control.
Some provisions contained in the rights plan, and in the equivalent rights plan that our subsidiary, JDS Uniphase Canada Ltd., has adopted with respect to our exchangeable shares, may have the effect of discouraging a third party from making an acquisition proposal for us and may thereby inhibit a change in control. For example, such provisions may deter tender offers for shares of common stock or exchangeable shares, which offers may be attractive to stockholders, or deter purchases of large blocks of common stock or exchangeable shares, thereby limiting the opportunity for stockholders to receive a premium for their shares of common stock or exchangeable shares over the then-prevailing market prices.
Some anti-takeover provisions contained in our charter and under Delaware laws could hinder a takeover attempt
We are subject to the provisions of Section 203 of the Delaware General Corporation Law prohibiting, under some circumstances, publicly-held Delaware corporations from engaging in business combinations with some stockholders for a specified period of time without the approval of the holders of substantially all of our outstanding voting stock. Such provisions could delay or impede the removal of incumbent directors and could make more difficult a merger, tender offer or proxy contest involving us, even if such events could be beneficial, in the short-term, to the interests of the stockholders. In addition, such provisions could limit the price that some investors might be willing to pay in the future for shares of our common stock. Our certificate of incorporation and bylaws contain provisions relating to the limitations of liability and indemnification of our directors and officers, dividing our board of directors into three classes of directors serving three-year terms and providing that our stockholders can take action only at a duly called annual or special meeting of stockholders. These provisions also may have the effect of deterring hostile takeovers or delaying changes in control or management of us.
A-29
ITEM 2. PROPERTIES
Our principal offices are located in San Jose, California, United States. The table below summarizes the properties that we owned and leased as of June 30, 2004:
| Leased Properties: | ||||||
| Location | Square footage | Location | Square footage | |||
NORTH AMERICA: | EUROPE: | |||||
| Canada: | Italy: | |||||
| Ottawa(1) | 139,580 | Monza | 1,000 | |||
| United States: | France: | |||||
| Allentown, PA | 11,274 | Les Ulis | 3,800 | |||
| Bloomfield, CT | 60,000 | Grenoble | 10,226 | |||
| Calabasas, CA | 12,238 | Germany | ||||
| Camarillo, CA (1) | 23,046 | Eching | 8,712 | |||
| Commerce, CA | 27,136 | Netherlands: | ||||
| Ewing Township, NJ | 132,300 | Eindhoven (1) | 137,094 | |||
| Horsham, PA(1) | 126,500 | |||||
| Milpitas, CA | 69,702 | REST OF WORLD: | ||||
| Mountain Lakes, NJ | 20,000 | China: | ||||
| Nashua, NH (1) | 2,611 | Beijing | 75,347 | |||
| Norwood, MA (1) | 20,800 | Fuzhou | 224,656 | |||
| Parsippany, NJ | 2,000 | Hong Kong | 770 | |||
| Piscataway, NJ(1) | 132,650 | Shenzhen | 419,395 | |||
| San Jose, CA | 396,922 | Japan: | ||||
| Santa Clara, CA(1) | 46,338 | Tokyo | 859 | |||
| Santa Rosa, CA | 71,339 | Taiwan | ||||
| Windsor, CT(1) | 165,000 | Taipai | 3,960 | |||
| Indonesia | ||||||
| Bintin | 23,682 | |||||
| Singapore | 16,777 | |||||
Total leased square footage: | 2,385,714 | |||||
| Owned Properties: | ||||||
| Location | Square footage | Location | Square footage | |||
NORTH AMERICA: | EUROPE: | |||||
| Canada: | United Kingdom: | |||||
| Ottawa (2) | 948,900 | Plymouth(1) | 114,473 | |||
| United States: | ||||||
| Bloomfield, CT | 24,000 | REST OF WORLD: | ||||
| Columbus, OH(1) | 50,000 | China: | ||||
| Rochester, MN | 40,500 | Fuzhou | 152,360 | |||
| Santa Rosa, CA | 659,017 | |||||
| Raleigh, NC (1) | 178,000 | |||||
| Melbourne, FL | 105,000 | |||||
Total owned square footage: | 2,272,250 | |||||
Total leased and owned square footage: | 4,657,964 |
| (1) | Operations have ceased at these properties, and we are in the process of vacating additional properties as part of our Global Realignment Program. |
| (2) | This property is actively being marketed and has been classified in our financial statements as “held for sale.” See “Note 13. Reduction of Other Long-Lived Assets” of the Notes to Consolidated Financial Statements |
A-30
As part of our Global Realignment Program, we have completed and approved restructuring plans to close sites, vacate buildings at closed sites as well as at continuing operations and consolidate excess facilities worldwide. Of the total leased and owned square footage as of June 30, 2004, approximately 2.3 million square feet were related to properties included in our Global Realignment Program, and other properties identified as surplus to our needs.
Please see the description of our manufacturing sites under the heading “Manufacturing” in Item 1.
ITEM 3. LEGAL PROCEEDINGS
Pending Litigation
The Securities Class Actions:
As discussed in our previous SEC filings, litigation under the federal securities laws has been pending against the Company and certain former and current officers and directors since March 27, 2002. On June 4, 2004, the court heard Defendants’ motions to dismiss the second amended complaint in In re JDS Uniphase Corporation Securities Litigation, C-02-1486 (N.D. Cal.). The court has not issued a ruling on the motions yet.
No activity has occurred in Zelman v. JDS Uniphase Corp., No. C-02-4656 (N.D. Cal.), a related securities case, since our filing on Form 10-Q for the third quarter of fiscal 2004.
The Derivative Actions:
As described in our previous SEC filings, derivative actions purporting to be brought on the Company’s behalf have been filed in state and federal courts against several of our current and former officers and directors based on the same events alleged in the securities litigation. On June 4, 2004, the court heard Defendants’ motion to dismiss the complaint in Corwin v. Kaplan, No. C-02-2020 (N.D. Cal.). The court has not issued a ruling on Defendants’ motion yet. No trial date has been set in the Corwin action.
A stay remains in place in the California state derivative action, In re JDS Uniphase Corporation Derivative Litigation, Master File No. CV806911 (Santa Clara Super. Ct.). A status conference is scheduled for October 19, 2004. No trial date has been set in this action.
No activity has occurred in Cromas v. Straus, Civil Action No. 19580 (Del. Ch. Ct.), the Delaware derivative action, since the filing of JDSU’s Form 10-Q for the third quarter of 2004. The OCLI and SDL Shareholder Actions:
As described in our previous SEC filings, plaintiffs purporting to represent the former shareholders of OCLI and SDL have filed suit against the former directors of those companies, asserting that they breached their fiduciary duties in connection with the events alleged in the securities litigation against the Company. No activity has occurred in these actions since the filing of JDSU’s Form 10-Q for the third quarter of 2004.
The ERISA Actions:
As described in our previous SEC filings, actions have been filed in the District Court for the Northern District of California against the Company and certain of its former and current officers and directors on behalf of a purported class of participants in the Company’s 401(k) Plan. Defendants completed a voluntary production of documents on July 19, 2004. Plaintiffs filed a consolidated complaint on September 2, 2004, and Defendants’ response to the consolidated complaint is due by November 1, 2004. Although Plaintiffs have propounded a request for documents, Defendants have not produced documents beyond those produced in connection with their voluntary production of documents. No trial date has been set.
The Shareholder Inspection Demands
Plaintiffs in the federal and California derivative actions have propounded inspection demands to JDSU pursuant to Delaware and California state law. These inspection demands purport to seek the production of certain JDSU documents for the purpose of investigating alleged misconduct by JDSU officers and directors.
A-31
On April 27, 2004, the plaintiff in the federal derivative action propounded an inspection demand to JDSU purportedly pursuant to Section 220 of the Delaware Code. The parties have reached agreement as to the scope and confidentiality of documents to be produced in response to this inspection demand.
On December 23, 2003, one of the lead plaintiffs in the California derivative action filed a Petition for Writ of Mandate to Compel Inspection and Copying of Books and Records of JDS Uniphase Corporation. That action is captionedCoykendall v. JDS Uniphase Corporation, Case No. 103 CV 011518 (Santa Clara Super. Ct.). On February 3, 2004, JDSU filed a demurrer to the Petition. Also on February 3, 2004, JDSU moved for a protective order pursuant to Section 1603 of the California Corporations Code. On March 16, 2004, the Court overruled JDSU’s demurrer. The Court also denied the motion for protective order without prejudice. JDSU answered the Petition on April 13, 2004. On April 15, 2004, Petitioner propounded Form Interrogatories and a Request for Production of Documents to JDSU. The Company responded to Petitioner’s discovery on May 14, 2004. A discovery conference is scheduled for September 14, 2004. The parties have not reached agreement yet as to the scope of documents to be produced, if any.
The Company believes that the factual allegations and circumstances underlying these securities class actions, derivative actions, the OCLI and SDL class actions, and the ERISA class actions are without merit. The expense of defending these lawsuits has been costly, will continue to be costly, and could be quite significant and may not be covered by our insurance policies. The defense of these lawsuits could also result in continued diversion of our management’s time and attention away from business operations which could prove to be time consuming and disruptive to normal business operations. An unfavorable outcome or settlement of this litigation could have a material adverse effect on the Company’s financial position, liquidity or results of operations.
We are a party to other litigation matters and claims, which are normal in the course of operations.While the results of such litigation matters and claims cannot be predicted with certainty, we believe that their final outcome will not have a material adverse impact on our financial position, liquidity, or results of operations.
ITEM 4. SUBMISSION OF MATTERS TO A VOTE OF SECURITY HOLDERS
None.
A-32
PART II
| ITEM 5. | MARKET FOR REGISTRANT’S COMMON EQUITY AND RELATED STOCKHOLDER MATTERS AND ISSUER PURCHASES OF EQUITY SECURITIES |
Our common stock is traded on the NASDAQ Stock Market under the symbol “JDSU” and our exchangeable shares of JDS Uniphase Canada Ltd. are traded on the Toronto Stock Exchange under the symbol “JDU.” Holders of exchangeable shares may tender their holdings for common stock on a one-for-one basis at any time. As of August 13th, 2004, we had 1,443,264,161 shares of common stock outstanding, including 62,208,177 exchangeable shares. The closing price on August 13th, 2004 was $2.97 for the common stock and Canadian $3.93 for the exchangeable shares. The following table summarizes the high and low closing sales prices for our common stock as reported on the NASDAQ Stock Market during fiscal 2004 and 2003:
| High | Low | |||||||||
|---|---|---|---|---|---|---|---|---|---|---|
Fiscal 2004: | ||||||||||
| Fourth Quarter | $ | 4.48 | $ | 2.98 | ||||||
| Third Quarter | 5.73 | 3.88 | ||||||||
| Second Quarter | 4.02 | 3.13 | ||||||||
| First Quarter | 4.20 | 2.85 | ||||||||
Fiscal 2003: | ||||||||||
| Fourth Quarter | $ | 4.28 | $ | 2.86 | ||||||
| Third Quarter | 3.28 | 2.53 | ||||||||
| Second Quarter | 3.41 | 1.62 | ||||||||
| First Quarter | 3.84 | 1.87 | ||||||||
As of August 13th, 2004, we had 8,770 holders of record of our common stock and exchangeable shares. We have not paid cash dividends on our common stock and do not anticipate paying cash dividends in the foreseeable future.
A-33
ITEM 6. SELECTED FINANCIAL DATA
The following tables present selected financial information for each of the last five fiscal years (in millions, except per share data):
| Years Ended June 30, | ||||||||||||||||||||
|---|---|---|---|---|---|---|---|---|---|---|---|---|---|---|---|---|---|---|---|---|
| 2004 | 2003 (6) | 2002 (1) | 2001 (2)(3) | 2000 (4) | ||||||||||||||||
Consolidated Statement of Operations Data: | ||||||||||||||||||||
| Net revenue | $ | 635.9 | $ | 675.9 | $ | 1,098.2 | $ | 3,232.8 | $ | 1,430.4 | ||||||||||
| Amortization of goodwill and other intangibles | 16.0 | 19.8 | 1,308.7 | 5,387.0 | 896.9 | |||||||||||||||
| Acquired in-process research and development | 2.6 | 0.4 | 25.3 | 393.2 | �� | 360.7 | ||||||||||||||
| Reduction of goodwill and other long-lived assets | 51.8 | 393.6 | 5,979.4 | 50,085.0 | — | |||||||||||||||
| Restructuring charges | 11.5 | 121.3 | 260.0 | 264.3 | — | |||||||||||||||
| Loss from operations | (180.3 | ) | (900.7 | ) | (8,284.0 | ) | (56,347.4 | ) | (865.1 | ) | ||||||||||
| Net loss | (115.5 | ) | (933.8 | ) | (8,738.3 | ) | (56,121.9 | ) | (904.7 | ) | ||||||||||
| Net loss per share-basic and diluted | $ | (0.08 | ) | $ | (0.66 | ) | $ | (6.50 | ) | $ | (51.40 | ) | $ | (1.27 | ) | |||||
| June 30, | ||||||||||||||||||||
| 2004 | 2003 | 2002 (1) | 2001 (2)(3) | 2000 (4)(5) | ||||||||||||||||
Consolidated Balance Sheet Data: | ||||||||||||||||||||
| Working capital | $ | 1,515.7 | $ | 1,091.8 | $ | 1,374.8 | $ | 2,187.8 | $ | 1,325.7 | ||||||||||
| Total assets | 2,421.5 | 2,137.8 | 3,004.5 | 12,245.4 | 26,389.1 | |||||||||||||||
| Long-term obligations | 473.1 | 16.3 | 8.9 | 18.0 | 61.2 | |||||||||||||||
| Total stockholders’ equity | $ | 1,571.1 | $ | 1,671.1 | $ | 2,471.4 | $ | 10,706.5 | $ | 24,778.6 | ||||||||||
| (1) | We acquired IBM’s optical transceiver business on December 28, 2001 in a transaction accounted for as a purchase. The Consolidated Statement of Operations for fiscal 2002 included the results of operations of the optical transceiver business subsequent to December 28, 2001 and the Consolidated Balance Sheet as of June 30, 2002 included the financial position of the optical transceiver business. |
| (2) | We acquired SDL on February 13, 2001 in a transaction accounted for as a purchase. The Consolidated Statement of Operations for fiscal 2001 included the results of operations of SDL subsequent to February 13, 2001 and the Consolidated Balance Sheet as of June 30, 2001 included the financial position of SDL. |
| (3) | On February 13, 2001, we completed the sale of our Zurich, Switzerland subsidiary to Nortel for 65.7 million shares of Nortel common stock valued at $1,953.3 million. After adjusting for the net costs of the assets sold and for the expenses associated with the divestiture, we realized a gain of $1,770.2 million from the transaction. We subsequently sold 41.0 million shares of Nortel common stock for total proceeds of $659.2 million, resulting in a realized loss of $559.1 million during fiscal 2001. |
| (4) | We acquired OCLI on February 4, 2000 in a transaction accounted for as a purchase. The Consolidated Statement of Operations for fiscal 2000 included the results of operations of OCLI subsequent to February 4, 2000 and the Consolidated Balance Sheet as of June 30, 2000 included the financial position of OCLI. |
| (5) | We acquired E-TEK on June 30, 2000 in a transaction accounted for as a purchase. The Consolidated Balance Sheet as of June 30, 2000 included the financial position of E-TEK. |
| (6) | Commencing July 1, 2002, in accordance with SFAS 142, we no longer amortize goodwill, but test for impairment of goodwill on an annual basis and at any other time if events occur or circumstances indicate that the carrying amount of goodwill may not be recoverable. Fiscal years 2002, 2001 and 2000 include goodwill amortization as a component of the expense for amortization of goodwill and other intangibles. |
A-34
| ITEM 7. | MANAGEMENT’S DISCUSSION AND ANALYSIS OF FINANCIAL CONDITION AND RESULTS OF OPERATIONS |
Adjustments to Previously Announced FY 2004 Fourth-Quarter and Annual Results
On July 28, 2004, we issued a press release announcing our fourth-quarter and annual results for the year ended June 30, 2004. In the press release, we reported an income tax benefit of $13.2 million in the Condensed Consolidated Statement of Operations for the year ended June 30, 2004. Subsequent to July 28, 2004, we settled a government tax audit. As a result of this settlement, we increased our tax benefit and reduced our income taxes payable by $2.6 million as of June 30, 2004. In this Annual Report on Form 10-K, we report the increase in the income tax benefit of $2.6 million in the Consolidated Statement of Operations for the year ended June 30, 2004.
The following table presents a reconciliation of the net loss and net loss per share reported in our press release on July 28, 2004 to the amounts reported in this Annual Report on Form 10-K (in millions, except per share data):
| Three Months Ended June 30, 2004 | Year Ended June 30, 2004 | |||||||||
|---|---|---|---|---|---|---|---|---|---|---|
| Net loss announced on July 28, 2004 | $ | (24.3 | ) | $ | (118.1 | ) | ||||
| Adjustment: | ||||||||||
| Reduction of income taxes payable liability | 2.6 | 2.6 | ||||||||
| Reported net loss in Annual Report on Form 10-K | $ | (21.7 | ) | $ | (115.5 | ) | ||||
| Net loss per share announced on July 28, 2004 — basic and diluted | $ | (0.02 | ) | $ | (0.08 | ) | ||||
| Reported net loss per share in Annual Report on Form 10-K — basic and diluted | $ | (0.02 | ) | $ | (0.08 | ) | ||||
Our Industries and Developments
We believe we are a worldwide leader in optical technology. We design and manufacture products for fiberoptic communications, as well as for markets where our core optics technologies provide innovative solutions for industrial, commercial and consumer applications. Our fiberoptic components and modules are deployed by system manufacturers for the telecommunications, data communications and cable television industries. We also offer products for display, security, medical/environmental instrumentation, decorative and aerospace and defense applications. We currently employ approximately 6,000 employees at 14 locations, principally located in North America, the People’s Republic of China and France
Our Communications Group markets consist generally of:
| • | Enterprise and storage equipment providers such as Cisco, Sun Microsystems and Hewlett-Packard. |
| • | The telecommunications carriers: the regional Bell companies, or “RBOCS”; the long distance carriers, such as AT&T and MCI; international counterparts, such as British Telecom and Deutsche Telecom; and, to a growing extent, emerging carriers in the rest of the world. |
| • | System and equipment providers to the communications network carriers: principally Nortel, Lucent, Alcatel, Ciena, and Cisco |
| • | Cable service providers such as Comcast and Time Warner. |
| • | System and equipment providers to the cable service providers, such as Scientific Atlanta. |
We supply a broad portfolio of optical components, modules and subsystems to the equipment and system providers in each of these segments.
Our Commercial and Consumer Products Group markets consist generally of:
| • | Display products, with customers such as Texas Instruments, optical components and modules and front surface mirrors used in rear projection and plasma displays. |
A-35
| • | Custom Optics: medical/environmental instrumentation, high precision coated products, optical sensors for aerospace and defense applications and optical filters for medical instruments. |
| • | Light Interference Pigment products, with customers such as SICPA, color shifting utilized in security products and decorative surface treatments. Pigments are used in security products to inhibit counterfeiting of currencies and other valuable documents. |
| • | Lasers: lasers subsystems are used in biotechnology, graphic arts and imaging, semiconductor processing, material processing and other laser based applications and markets. |
Overall, our communications markets are notable for, among other things, their high concentration of customers at each level of the industry, as well their extremely long design cycles. One consequence of a highly concentrated customer base is systemic pricing pressure at each level of the industry. Large capital investment requirements, long return on investment periods, uncertain business models and complex and shifting regulatory hurdles, among other things, currently combine to limit opportunities for new carriers to emerge.Thus, we expect that high customer concentration and its attendant pricing pressure and other effects on our communications markets will remain for the foreseeable future. Long design cycles mean that considerable resources must be spent to design and develop new products with limited visibility relative to the ultimate market opportunity for the products (pricing and volumes) or the timing thereof.
As the supplier of components and modules to this industry, we feel the effects most acutely, as system designs must first be initiated at the carrier level, communicated to the systems provider and then communicated to us and our competitors. During system design periods, shifts in economic, industry, customer or consumer conditions could and often do cause redesigns, delays or even cancellations to occur with their concomitant costs to those involved. Communications industry design cycles are often devastating for companies without the financial and infrastructural resources to sustain the long periods between project initiation and revenue realization. Our Commercial and Consumer Products Group, while more diverse, shares some of the customer concentration and design cycle attributes of our communications markets. We are working aggressively to expand our distribution channels for several of our core competencies in these areas to, among other things, reduce our exposure to customer concentration and long design cycles across our company.
Recent Accounting Pronouncements
EITF No. 03-1:
In March 2004, the Financial Accounting Standards Board (FASB) approved the consensus reached on the Emerging Issues Task Force (EITF) Issue No. 03-1, “The Meaning of Other-Than-Temporary Impairment and Its Application to Certain Investments” (“EITF 03-1”). The objective of this Issue is to provide guidance for identifying impaired investments. EITF 03-1 also provides new disclosure requirements for investments that are deemed to be temporarily impaired. The accounting provisions of EITF 03-1 are effective for all reporting periods beginning after June 15, 2004, while the disclosure requirements are effective only for annual periods ending after June 15, 2004. The company has evaluated the impact of the adoption of EITF 03-1 and does not believe the impact is significant to the company’s overall results of operations or financial position.
SFAS No. 150:
In May 2003, the “FASB” issued Statement of Financial Accounting Standards “SFAS” No. 150, “Accounting for Certain Financial Instruments with Characteristics of Both Liabilities and Equity.” (“SFAS 150”). SFAS No. 150 changes the statement of financial position classification of certain financial instruments from either an equity or mezzanine presentation to liabilities and requires an issuer of those financial instruments to recognize changes in fair value or redemption amount, as applicable, in earnings. SFAS No. 150 also requires that certain obligations that could be settled by issuance of an entity’s equity but lack other characteristics of equity be reported as liabilities even though the obligation does not meet the definition of liabilities in Concepts Statement No. 6. SFAS No. 150 is effective for financial instruments entered into or modified after May 31, 2003, and otherwise is effective for periods beginning after June 15, 2003. The adoption of SFAS No. 150 did not have a material effect on our consolidated financial position, results of operations or cash flows.
A-36
FASB Interpretation No. 46R:
In December 2003, the FASB issued revised Interpretation No. 46 (“FIN 46R”), “Consolidation of Variable Interest Entities, an Interpretation of ARB No. 51,” which was originally issued in January 2003, resulting in multiple effective dates based on the nature as well as the creation date of the variable interest entity (“VIE”) FIN 46R requires an investor who absorbs the majority of the expected losses, receives a majority of its expected returns, or both, (primary beneficiary) of a VIE to consolidate the assets, liabilities and results of operations of the entity. A VIE is an entity in which the equity investors do not have a controlling interest or the equity investment at risk is insufficient to finance the entity’s activities without receiving additional subordinated financial support from other parties. FIN 46R, as amended, was applicable for public companies that have interests in VIEs or potential variable entities commonly referred to as special-purpose entities (“SPE’s”) for periods ending after December 15, 2003. Application by public entities for all other types of entities is required in financial statements for periods ending after March 15, 2004. Interests held in VIE’s created after January 31, 2003 are subject to the provisions of FIN 46R from the date of the Company’s initial involvement with that entity.
During the first quarter of fiscal 2004, the Company adopted the provisions of FIN 46R with respect to a master lease agreement with a special purpose entity (the “Lessor”) pertaining to two properties for facilities located in Melbourne, Florida and Raleigh, North Carolina. The Company exercised its option to purchase these properties on September 16, 2003, and paid the Lessor $44.7 million in cash. See “Note 2. Recent Accounting Pronouncements” and “Note 13. Reduction of Other Long-Lived Assets” of our Notes to Consolidated Financial Statements. No other variable interests required consolidation of the related VIE’s nor were they material to the Company’s financial position.
The Company has reviewed its cost and equity method investments and other variable interests to determine whether those entities are variable interest entities and, if so, if the Company is the primary beneficiary of any of its investee companies. At June 30, 2004, the Company had 21 cost and equity method investments primarily in privately held companies and venture funds that have the potential to provide strategic technologies and relationships to the Company’s businesses. The Company has determined that its equity investments, which are not material to the Company’s financial position, do not require consolidation as they are either not variable interest entities or in the event that they are variable interest entities, the Company is not considered to be the primary beneficiary. The Company’s maximum exposure to loss for these investments at June 30, 2004 is limited to the aggregate of the carrying amount of its investment of $32.6 million in such entities and its minimum funding commitments of $16.0 million.
Critical Accounting Policies
The preparation of our consolidated financial statements in conformity with accounting principles generally accepted in the United States requires us to make estimates and judgments that affect the reported amounts of assets and liabilities, net revenue and expenses, and the related disclosures. We base our estimates on historical experience, our knowledge of economic and market factors and various other assumptions that we believe to be reasonable under the circumstances. Estimates and judgments used in the preparation of our financial statements are, by their nature, uncertain and unpredictable, and depend upon, among other things, many factors outside of our control, such as demand for our products and economic conditions. This uncertainty and unpredictability are heightened during periods of economic uncertainty, such as the present. Accordingly, our estimates and judgments may prove to be incorrect and actual results may differ, perhaps significantly, from these estimates under different estimates, assumptions or conditions. We believe the following critical accounting policies are affected by significant estimates, assumptions and judgments used in the preparation of our consolidated financial statements.
Revenue Recognition:
We recognize revenue when persuasive evidence of a final agreement exists, delivery has occurred, the selling price is fixed or determinable and collectibility is reasonably assured. Revenue recognition on the shipment of evaluation units is deferred until customer acceptance. Revenue from sales to distributors with rights of return, price
A-37
protection or stock rotation is not recognized until the products are sold through to end customers. Generally, revenue associated with contract cancellation payments from customers is not recognized until we receive payment for such charges.
We record provisions against our gross revenue for estimated product returns and allowances in the period when the related revenue is recorded. These estimates are based on factors that include, but are not limited to, historical sales returns, analyses of credit activities, current economic trends and changes in our customers’ demand. Should our actual product returns and allowances exceed our estimates, additional provisions against our revenue would result.
Allowances for Doubtful Accounts:
We perform credit evaluations of our customers’ financial condition. We maintain allowances for doubtful accounts for estimated losses resulting from the inability or unwillingness of our customers to make required payments. We record our bad debt expenses as selling, general and administrative expenses. When we become aware that a specific customer is unable to meet its financial obligations to us, for example, as a result of bankruptcy or deterioration in the customer’s operating results or financial position, we record a specific allowance to reflect the level of credit risk in the customer’s outstanding receivable balance. In addition, we record additional allowances based on certain percentages of our aged receivable balances. These percentages are determined by a variety of factors including, but not limited to, current economic trends, historical payment and bad debt write-off experience. We are not able to predict changes in the financial condition of our customers, and if circumstances related to our customers deteriorate, our estimates of the recoverability of our trade receivables could be materially affected and we may be required to record additional allowances. Alternatively, if we provide more allowances than we need, we may reverse a portion of such provisions in future periods based on our actual collection experience.
Investments:
We hold equity interests in both publicly traded and privately held companies. When the carrying value of an investment exceeds its fair value and the decline in value is deemed to be other-than-temporary, we write down the value of the investment and establish a new cost basis. Fair values for investments in public companies are determined using quoted market prices. Fair values for investments in privately held companies are estimated based upon one or more of the following: assessment of the investees’ historical and forecasted financial condition, operating results and cash flows, the values of recent rounds of financing, or quoted market prices of comparable public companies. We regularly evaluate our investments based on criteria that include, but not limited to, the duration and extent to which the fair value has been less than the carrying value, the current economic environment and the duration of any market decline, and the financial health and business outlook of the investees. We generally believe an other-than-temporary decline occurs when the fair value of an investment is below the carrying value for two full consecutive quarters. Future adverse changes in these or other factors could result in an other-than-temporary decline in the value of our investments, thereby requiring us to write down such investments. Our ability to liquidate our investment positions in privately held companies will be affected to a significant degree by the lack of an actively traded market, and we may not be able to dispose of these investments in a timely manner.
Inventory Valuation:
We regularly assess the valuation of our inventories and write down those inventories which are obsolete or in excess of our forecasted usage to their estimated realizable value. Our estimates of realizable value are based upon our analyses and assumptions including, but not limited to, forecasted sales levels by product, expected product lifecycle, product development plans and future demand requirements. We typically use a six to twelve month rolling forecast based on factors including, but not limited to, our production cycle, anticipated product orders, marketing forecasts, backlog, shipment activities and inventories held at our customers. If market conditions are less favorable than our forecasts or actual demand from our customers is lower than our estimates, we may be required to record additional inventory write-downs. If demand is higher than expected, we may sell our inventories that had previously been written down.
A-38
Goodwill Valuation:
We test goodwill for possible impairment on an annual basis and at any other time if events occur or circumstances indicate that the carrying amount of goodwill may not be recoverable. Circumstances that could trigger an impairment test include but are not limited to: a significant adverse change in the business climate or legal factors; an adverse action or assessment by a regulator; unanticipated competition; loss of key personnel; the likelihood that a reporting unit or significant portion of a reporting unit will be sold or otherwise disposed; results of testing for recoverability of a significant asset group within a reporting unit; and recognition of a goodwill impairment loss in the financial statements of a subsidiary that is a component of a reporting unit.
The determination as to whether a write down of goodwill is necessary involves significant judgment based on the short-term and long-term projections of the future performance of the reporting unit to which the goodwill is attributed. The assumptions supporting the estimated future cash flows of the reporting unit, including the discount rate used and estimated terminal value reflect our best estimates.
Long-lived asset valuation (property, plant and equipment and intangible assets):
Long-lived assets held and used
We test long-lived assets or asset groups for recoverability when events or changes in circumstances indicate that their carrying amount may not be recoverable. Circumstances which could trigger a review include, but are not limited to: significant decreases in the market price of the asset; significant adverse changes in the business climate or legal factors; accumulation of costs significantly in excess of the amount originally expected for the acquisition or construction of the asset; current period cash flow or operating losses combined with a history of losses or a forecast of continuing losses associated with the use of the asset; and current expectation that the asset will more likely than not be sold or disposed of significantly before the end of its estimated useful life.
Recoverability is assessed based on the carrying amount of the asset and its fair value which is generally determined based on the sum of the undiscounted cash flows expected to result from the use and the eventual disposal of the asset, as well as specific appraisal in certain instances. An impairment loss is recognized when the carrying amount is not recoverable and exceeds fair value.
Long-lived assets held for sale
We classify long-lived assets as held for sale when certain criteria are met, which include: management commitment to a plan to sell the assets; the availability of the assets for immediate sale in their present condition; whether an active program to locate buyers and other actions to sell the assets has been initiated; whether the sale of the assets is probable and their transfer is expected to qualify for recognition as a completed sale within one year; whether the assets are being marketed at reasonable prices in relation to their fair value; and how unlikely it is that significant changes will be made to the plan to sell the assets. Long-lived assets held for sale are included in other current assets.
We measure long-lived assets to be disposed of by sale at the lower of carrying amount or fair value less cost to sell. Fair value is determined using quoted market prices or the anticipated cash flows discounted at a rate commensurate with the risk involved.
Deferred Taxes:
We regularly assess the likelihood that our deferred tax assets will be realized from recoverable income taxes or recovered from future taxable income, and we record a valuation allowance to reduce our deferred tax assets to the amount that we believe to be more likely than not realizable. Due to the uncertain economic conditions in our industry, we determined in fiscal year 2002 that we should increase our valuation allowance for deferred tax assets to reduce our net deferred tax assets to an amount representing income taxes recoverable from prior years. All recoverable income taxes are recorded as refundable income taxes, and we record deferred tax assets only to the extent of deferred tax liabilities.
A-39
Warranty Accrual:
We provide reserves for the estimated costs of product warranties at the time revenue is recognized. We estimate the costs of our warranty obligations based on our historical experience of known product failure rates, use of materials to repair or replace defective products and service delivery costs incurred in correcting product failures. In addition, from time to time, specific warranty accruals may be made if unforeseen technical problems arise. Should our actual experience relative to these factors differ from our estimates, we may be required to record additional warranty reserves. Alternatively, if we provide more reserves than we need, we may reverse a portion of such provisions in future periods.
Restructuring Accrual:
During fiscal 2004, 2003 and 2002, we developed formalized plans for restructuring our businesses and recorded significant charges in connection with our Global Realignment Program. In connection with these plans, we have recorded estimated expenses for severance and outplacement costs, lease cancellations, asset write-offs and other restructuring costs. In accordance with SFAS 146, generally costs associated with restructuring activities initiated after December 31, 2002 have been recognized when they are incurred rather than at the date of a commitment to an exit or disposal plan. However, in the case of leases, the expense is estimated and accrued when the property is vacated. Given the significance of, and the timing of the execution of such activities, this process is complex and involves periodic reassessments of estimates made at the time the original decisions were made, including evaluating real estate market conditions for expected vacancy periods and sub-lease rents. We continually evaluate the adequacy of the remaining liabilities under our restructuring initiatives.Although we believe that these estimates accurately reflect the costs of our restructuring plans, actual results may differ, thereby requiring us to record additional provisions or reverse a portion of such provisions.
A-40
Results of Operations
The following table sets forth the components of our Consolidated Statements of Operations as a percentage of net revenue:
| Years Ended June 30, | |||||||||
|---|---|---|---|---|---|---|---|---|---|
| 2004 | 2003 | 2002 | |||||||
| Net revenue | 100.0 | % | 100.0 | % | 100.0 | % | |||
| Cost of sales | 77.1 | 91.8 | 106.6 | ||||||
| Gross profit (loss) | 22.9 | 8.2 | (6.6 | ) | |||||
| Operating expenses: | |||||||||
| Research and development | 15.7 | 22.7 | 23.2 | ||||||
| Selling, general and administrative | 22.8 | 39.5 | 34.8 | ||||||
| Amortization of goodwill | — | — | 85.4 | ||||||
| Amortization of other intangibles | 2.5 | 2.9 | 33.8 | ||||||
| Acquired in-process research and development | 0.4 | 0.1 | 2.3 | ||||||
| Reduction of goodwill | — | 33.5 | 397.1 | ||||||
| Reduction of other long-lived assets | 8.1 | 24.9 | 147.4 | ||||||
| Restructuring charges | 1.8 | 17.9 | 23.7 | ||||||
| Total operating expenses | 51.3 | 141.5 | 747.7 | ||||||
| Loss from operations | (28.4 | ) | (133.3 | ) | (754.3 | ) | |||
| Interest and other income, net | 3.6 | 4.8 | 4.4 | ||||||
| Gain (loss) on sale of subsidiaries’ assets | — | (0.3 | ) | — | |||||
| Gain on sale of investments | 6.5 | 0.6 | 1.4 | ||||||
| Reduction in fair value of investments | (0.6 | ) | (6.7 | ) | (20.6 | ) | |||
| Loss on equity method investments | (1.3 | ) | (1.3 | ) | (5.0 | ) | |||
| Loss before income taxes and cumulative effect of an accounting change | (20.2 | ) | (136.2 | ) | (774.1 | ) | |||
| Income tax expense (benefit) | (2.5 | ) | 2.0 | 21.6 | |||||
| Loss before cumulative effect of an accounting change | (17.7 | ) | (138.2 | ) | (795.7 | ) | |||
| Cumulative effect of an accounting change | (0.5 | ) | — | — | |||||
| Net loss | (18.2 | )% | (138.2 | )% | (795.7 | )% | |||
Results of Operations
| 2004 | 2003 | Change* | Percentage Change | 2003 | 2002 | Change** | Percentage Change | |||||||||
|---|---|---|---|---|---|---|---|---|---|---|---|---|---|---|---|---|
| Net revenue | $635.9 | $675.9 | $(40.0) | (6)% | $675.9 | $1,098.2 | $(422.3) | (38)% |
| * | Primary reasons for change. The decline in net revenue reflects a decrease in cancellation revenue from $32.3 million in fiscal 2003 to $0.4 million in fiscal 2004, primarily in our Communications Products revenue, continued lower demand for our communications products and lower average selling prices for these products. We also experienced a decline in our Commercial and Consumer Products revenue, primarily due to declines in our display revenue. Results include the inclusion of approximately $3.5 million in revenue from E2O Communications, Inc as of its acquisition date of May 17, 2004. The Company’s revenue is split evenly between the Communications Products and Commercial and Consumer Products segments. |
| ** | Primary reasons for change: The decline in net revenue was due primarily to the downturn in the telecommunications industry which resulted in a decrease in network deployment and capital spending by telecommunications carriers, which in turn caused our customers to reduce their inventory levels, and hence, their need for our products. Additionally, we had a decrease in cancellation revenue from $44.9 million in fiscal 2002 to $32.3 million in fiscal 2003, lower demand for our communications products and lower average selling prices for these products. The decline in our communications revenue in 2003 was partially offset by the |
A-41
increase in revenue of our Commercial and Consumer Products Group, primarily in display and security markets and the inclusion of revenue from L.A. Label and OptronX as of their acquisition dates of January 21, 2003 and September 18, 2002, respectively.
Notes:
| • | Net revenue included cancellation revenue of $0.4 million, $32.3 million and $44.9 million during fiscal years 2004, 2003 and 2002. |
| • | Net revenue from our Communications Product Group accounted for 50% of our net revenue during fiscal 2004 as compared to 49% during fiscal 2003 and 72% during fiscal 2002. |
| • | Net revenue from our Commercial and Consumer Products Group accounted for 50% of our net revenue during fiscal 2004 as compared to 51% during fiscal 2003 and 28% during fiscal 2002.We expect our Commercial and Consumer Products Group net revenue to continue to account for a major portion of our total net revenue. |
| • | For fiscal 2004 and 2002, no customers accounted for 10% or more of our net revenue. Texas Instruments accounted for 12% of total net revenue for 2003. |
| • | Net revenue from customers outside North America represented 36%, 30% and 26% of total net revenue in 2004, 2003 and 2002, respectively.We expect revenue from international customers to continue to be an important part of our overall revenue and an increasing focus for revenue growth. |
| • | Please refer to the “Operating Segment Information” section below for further discussions with respect to net revenue and operating results for each of our operating segments. |
Comment and analysis:
Net revenue of $635.9 million in fiscal 2004 represents a decrease of $40.0 million, or 6%, from net revenue of $675.9 million in fiscal 2003. While we have seen quarter over quarter improvement in revenue for three consecutive quarters during fiscal 2004, revenue is still below historic levels.We are seeing signs of stability and growth in demand for our products in both our communication and commercial and consumer products markets, particularly evidenced by sequential quarterly revenue increases. Looking forward, we believe we must improve our delivery and quality performance in order to achieve continued growth. Based on this data, we believe that improvements in our execution will be a more significant contributor to our near term revenue growth than changes in market conditions. Over the last several quarters, we have encountered multiple and systemic execution challenges principally related to new product introductions, as well as to factory and product transitions initiated as part of our restructuring programs. These challenges, which include product delivery timetable uncertainty, supply chain constraints, protracted lead times, yield and quality problems, and systems strain, may lead to customer dissatisfaction and lost revenue opportunities. Improving our overall execution will be a major priority for the foreseeable future. If we do not improve our execution, including our lead times, volumes, yield and product quality, our operating results will suffer and we may experience customer defections.
Gross Margin:
| 2004 | 2003 | Change* | Percentage Change | 2003 | 2002 | Change** | Percentage Change | |||||||||||||||||
|---|---|---|---|---|---|---|---|---|---|---|---|---|---|---|---|---|---|---|---|---|---|---|---|---|
| Gross margin | $ | 145.8 | $ | 55.4 | $90.4 | 163% | $ | 55.4 | $ | (72.9 | ) | $128.3 | 176% | |||||||||||
| Percentage of net revenue | 22.9 | % | 8.2 | % | 8.2 | % | (6.6 | )% | ||||||||||||||||
| * | Primary reasons for change: Improvements in gross margin were due to (i) a decline in personnel-related expenses of approximately $64.3 million as a result of workforce reductions, site closures, product transfers to both lower cost locations and contract manufacturers; (ii) 29.8 million of write-downs of excess and obsolete inventories, as compared to $60.1 million in the prior year; (iii) a decline in depreciation of $19.5 million in the current fiscal year as compared to the prior year due to the write-downs of property, plant and equipment |
A-42
as a result of our impairment reviews and the removal and disposal of property, plant and equipment under our restructuring programs; (iv) a reduction in acquisition related stock compensation charges of $17.2 million; (v) a reduction in facilities and occupancy related costs of approximately $16.7 million; (vi) a reduction in royalty expense of $11.4 million; and (vii) reclassification to R&D of $4.5 million of expenses, previously included in cost of goods sold to better reflect the activities being performed. These favorable impacts to gross margin were partially offset by the following: (i) a decrease in the consumption of previously reserved excess or obsolete inventory of $23.3 million from $67.4 million in 2003 to $44.1 million in 2004; (ii) contract cancellation revenue of $0.4 million in the current year, compared to $32.3 million in the prior-year; and (iii) continued decline in average selling prices of our products resulting from continuing pricing pressures from our customers.
| ** | Primary reasons for change: Improvements in gross margin were due to (i) a decline in depreciation of $277.2 million in fiscal 2003 as compared to fiscal 2002 due to the write-downs of property, plant and equipment as a result of our impairment reviews and the removal and disposal of property, plant and equipment under our restructuring programs; (ii) a decline in personnel-related expenses of $80.9 million as a result of workforce reductions, site closures, product transfers to both lower cost locations and contract manufacturers and other cost cutting measures implemented under our Global Realignment Program; (iii) $60.1 million of write-downs of excess and obsolete inventories during 2003, as compared to $203.9 million in the prior year; (iii) a reduction in acquisition related stock compensation charges of $23.9 million; and (iv) a decrease in warranty expense of $36.3 million as compared to the prior-year period, primarily the result of lower warranty requirements on certain products. These favorable impacts to gross margin were partially offset by the following: (i) $32.3 million in contract cancellation revenue during fiscal 2003 compared to $44.9 million in the prior year; (ii) $18.4 million of royalty expense in connection with a new patent license in fiscal 2003; and (iii) continued decline in average selling prices of our products. |
Comment and analysis:
Gross margin as a percentage of net revenue for fiscal 2004 was approximately 23%, which is a 15-point improvement from the previous year. Gross margin for fiscal 2003 was approximately 8%, which is also a 15-point improvement from fiscal 2002. While average selling price declines and execution-related costs continued to strain revenue associated with volume increases and restrict further improvements to our gross margin, the Company’s focus on controlling costs has resulted in improvements to our gross margin.We believe pricing pressure will continue and may be indicative of fundamental changes in our communications industries resulting from, among other things, increased product commoditization and industry consolidation. Looking ahead, we expect this strain to moderate somewhat, as we believe that our lead-time and execution improvement programs should in general help stabilize pricing and we expect to see favorable inventory recoveries in future quarters. We also plan to continue our cost reduction programs which will focus on site consolidation, product transfers to low cost manufacturing locations internally and externally and employee reductions. This will require re-qualification of complex manufacturing processes and additional costs over the short term. Additionally, we have recently introduced a number of new products and programs which due to the untested nature of the products and the potential for complexity may continue to incur relatively higher startup costs and increased yield and product quality risk. These issues have negatively impacted and could continue to negatively impact our gross margin. We expect gross margin pressures to remain for the foreseeable future, and we are focused on actions designed to optimize our cost structure and improve our gross margins.
Research and Development (R&D):
| 2004 | 2003 | Change* | Percentage Change | 2003 | 2002 | Change** | Percentage Change | |||||||||||||||||
|---|---|---|---|---|---|---|---|---|---|---|---|---|---|---|---|---|---|---|---|---|---|---|---|---|
| R&D | $ | 99.5 | $ | 153.7 | $(54.2) | (35)% | $ | 153.7 | $ | 254.8 | $(101.1) | (40)% | ||||||||||||
| Percentage of net revenue | 16 | % | 23 | % | 23 | % | 23 | % | ||||||||||||||||
| * | Primary reasons for change: The decline was attributable to (i) a decline in R&D materials of $24.2 million due primarily to the consolidation of the number of sites performing R&D; (ii) a decline in personnel-related |
A-43
expenses of approximately $10.5 million as a result of workforce reductions, site closures and other cost cutting measures; (iii) a decline in acquisition related stock compensation charges of $10.4 million; (iv) a decline of approximately $5.6 million for facilities and occupancy related expenses due to the write-downs of property, plant and equipment as a result of our quarterly impairment reviews, site consolidations and the removal and disposal of property, plant and equipment; and (v) a decline of $1.6 million of charges other than restructuring associated with the Global Realignment Program. These decreases were offset in part by a reclassification to research and development of $4.5 million of expense, previously included in cost of goods sold, to better reflect the activities being performed.
| ** | Primary reasons for change: The decrease was primarily due to the cost savings resulting from our Global Realignment Program, which included the elimination of certain product development programs, including (i) workforce reductions resulting in savings of approximately $34.6 million; (ii) a decline in acquisition related stock compensation charges of $20.9 million; (iii) a decline in indirect materials expense of $11.9 million; (iv) a reduction in facilities and occupancy related costs of approximately $11.4 million; and (v) a decline of $5.5 million of charges other than restructuring associated with the Global Realignment Program. |
Comment and analysis:
During fiscal 2004 we continued to reduce our overall research and development costs. However, we believe that investment in R&D is critical to attaining our strategic objectives. Historically we have devoted significant engineering resources to assist with production, quality and delivery challenges, which has had some negative impact on our new product development activities. Despite our continued efforts to reduce expenses, there can be no assurance that our R&D expenses will continue to decline in future quarters, or that such expenditures will be successful or that improved processes or commercial products, at acceptable volumes and pricing, will result from our investment in R&D.
Selling, General and Administrative Expense (SG&A):
| 2004 | 2003 | Change* | Percentage Change | 2003 | 2002 | Change** | Percentage Change | |||||||||||||||||
|---|---|---|---|---|---|---|---|---|---|---|---|---|---|---|---|---|---|---|---|---|---|---|---|---|
| SG&A | $ | 144.7 | $ | 267.3 | $(122.6) | (46)% | $ | 267.3 | $ | 382.9 | $(115.6) | (30)% | ||||||||||||
| Percentage of net revenue | 23 | % | 40 | % | 40 | % | 35 | % | ||||||||||||||||
| * | Primary reasons for change: The decrease was primarily due to: (i) a decline of $42.8 million of charges other than restructuring associated with our Global Realignment Program; (ii) a reduction in facility and occupancy related costs of approximately $33.4 million due to the write-downs of property, plant and equipment as a result of our quarterly impairment reviews, site consolidations and the removal and disposal of property, plant and equipment; (iii) a decline in acquisition related stock compensation charges of $21.4 million; and (iv) a decline in personnel-related expenses of approximately $19.9 million resulting from workforce reductions, site closures and other cost cutting measures implemented. These expense reductions were offset in part by increases in Sarbanes-Oxley compliance costs. |
| ** | Primary reasons for change: The decrease was primarily due to: (i) a reduction in facility and occupancy related costs of $70.5 million due to the write-downs of property, plant and equipment as a result of our quarterly impairment reviews, site consolidations and the removal and disposal of property, plant and equipment under the Global Realignment Program; (ii) a decline in acquisition related stock compensation charges of $29.1 million; (iii) a decline in personnel-related expenses of approximately $28.2 million as a result of workforce reductions, site closures and other cost cutting measures implemented under our Global Realignment Program; and (iv) a decline of $4.7 million of charges other than restructuring associated with our Global Realignment Program. |
A-44
Comment and analysis:
We are continuing our focus on reducing SG&A expense as part of our overall cost reduction program. Our SG&A levels are a result, to a major extent, of our historic levels of operations, related complexity and the continuing costs required to resolve disputes such as our shareholder litigation, employment issues, facility closures and other matters attributable to the extent and scope of our historic organization and operations. While we expect these costs to diminish over time, we anticipate that non-recurring, non-core expenses related to these matters will be incurred periodically for the foreseeable future, none of which is expected to have a material adverse impact on our financial condition, but many of which could impact our profitability expectations for any particular quarter. In March 2001, we employed approximately 29,000 persons at 41 sites. As of June 30, 2004, we employed approximately 6,000 persons, at 14 sites. As we have reduced the number of our locations, we have made significant progress in reducing our SG&A expense. However, additional effort remains to align our SG&A levels to our current and expected operations, which alignment will be crucial to our recovery and we may not be successful in this effort.Also, we expect to continue to incur additional significant SG&A expenses as we implement the requirements of the Sarbanes-Oxley Act of 2002, in particular, Section 404 thereof, and continue to invest in personnel strategic to our business and as we integrate our recently announced acquisitions. There can be no assurance that our SG&A expense will continue to decline in the future or that, more importantly, we will develop a cost structure (including our SG&A expense), which will lead to profitability under current and expected revenue levels.
Amortization of Purchased Intangibles:
| 2004 | 2003 | Change* | Percentage Change | 2003 | 2002 | Change** | Percentage Change | |||||||||||||||||||||||||
|---|---|---|---|---|---|---|---|---|---|---|---|---|---|---|---|---|---|---|---|---|---|---|---|---|---|---|---|---|---|---|---|---|
| Purchased Intangibles | $ | 16.0 | $ | 19.8 | $ | (3.8 | ) | (19 | )% | $ | 19.8 | $ | 371.2 | $ | (351.4 | ) | (95 | )% | ||||||||||||||
| * | Primary reasons for change: The decrease for fiscal 2004 as compared to fiscal 2003, and for fiscal 2003 as compared to 2002, were primarily due to the write-downs of the carrying amount of purchased intangibles as a result of impairment charges recorded in fiscal 2001 through fiscal 2003. Please refer to the “Reduction of Other Long-Lived Assets” section below for further discussion of the impairment charges related to our purchased intangibles. |
Acquired In-Process Research and Development:
In fiscal 2004, we recorded charges of $2.6 million for acquired in-process research and development (“IPR&D”) in connection with our acquisition of E2O. In fiscal 2003, we recorded $0.4 million for acquired IPR&D in connection with our acquisition of OptronX. In fiscal 2002, we recorded charges of $25.3 million resulting from our acquisition of IBM’s optical transceiver business ($22.1 million) and Scion ($3.2 million). These amounts were expensed on the acquisition dates because the acquired technology had not yet reached technological feasibility and had no future alternative uses. There can be no assurance that acquisition of businesses, products or technologies by us in the future will not result in substantial charges for acquired IPR&D.
Reduction of Goodwill:
| 2004 | 2003 | Change | Percentage Change | 2003 | 2002 | Change | Percentage Change | |||||||||||||||||||||||||
|---|---|---|---|---|---|---|---|---|---|---|---|---|---|---|---|---|---|---|---|---|---|---|---|---|---|---|---|---|---|---|---|---|
| Reduction of Goodwill | $ | — | $ | 225.7 | $ | (225.7 | ) | (100 | )% | $ | 225.7 | $ | 4,360.8 | $ | (4,135.1 | ) | (95 | )% | ||||||||||||||
Comment and analysis:
During fiscal 2004, we recorded no impairment charges. As part of our quarterly review of financial results, we determine if there are indicators that the carrying value of our goodwill may not be recoverable. We test for impairment of goodwill on an annual basis and at any other time if events occur or circumstances indicate that the
A-45
carrying amount of goodwill may not be recoverable (see “Note 12. Reduction of Goodwill” of our Notes to Consolidated Financial Statements). We did not identify any impairment indicators during fiscal 2004.
In fiscal 2003, we recorded $225.7 million of impairment charges as compared to $4,360.8 in fiscal 2002.
Fiscal 2003:
As part of our quarterly review of financial results in the first quarter of fiscal 2003, we noted indicators that the carrying value of our long-term assets including goodwill may not be recoverable and performed an additional impairment review.
Under the first step of the SFAS No. 142 analysis, the fair value of the reporting units was determined. Based on that analysis, we determined that the carrying amount of the reporting units within the Communications Products Group exceeded their fair value. We were required to perform the second step analysis to determine the amount of the impairment loss. We recorded an estimated impairment charge of $224.4 million to reduce the carrying value of our goodwill in the first quarter of fiscal 2003, and an additional impairment charge of $1.3 million in the second quarter of fiscal 2003, bringing the total Reduction of Goodwill in fiscal 2003 to $225.7 million.
The following table summarizes the impairment charges recorded during fiscal 2003 (in millions):
| Reporting Units (1) | |
|---|---|
| Communications Products Group: | |
| Components Products Group | $ 54.6 |
| Subsystem Products Group | 28.7 |
| Transmission Products Group | 142.4 |
| Total | $225.7 |
| (1) | During the first quarter of fiscal 2004, the names of certain reporting units were changed. The table above reflects the current names for these reporting units. |
Fiscal 2002 Charges:
As a result of restructuring activities in fiscal 2002, we restructured our businesses and realigned our operations to focus on certain markets and core opportunities. In the process, we abandoned certain redundant products and product platforms and reduced our workforce that had been valued in previous acquisitions. In accordance with SFAS No. 121, we wrote down the related intangible assets to their fair value, which was determined to be $0, and recorded total charges of $31.2 million related to goodwill.
As part of our quarterly reviews of financial results, we noted indicators in the second, third and fourth quarters of fiscal 2002 that the carrying value of our goodwill may not be recoverable and performed an impairment review. The impairment review was performed pursuant to SFAS No. 121 because of the prolonged economic downturn affecting our operations and revenue forecasts. Our projected future revenue and cash flows for certain of our asset groupings were revised downward in the second, third and fourth quarters of fiscal 2002. Therefore, we recorded charges to reduce goodwill based on the amounts by which the carrying amounts of these assets exceeded their fair value. Fair value was determined based on discounted future cash flows for the operating entities that had separately identifiable cash flows.
The following table summarizes the write-downs of goodwill for the second quarter of fiscal 2002 (in millions):
| Acquired Entities | Reductions of Goodwill | Long-Term Annual Growth Rate | ||||
|---|---|---|---|---|---|---|
| OCLI | $ | 514.1 | 5%–60 | % | ||
| SDL | 751.0 | 15%–60 | % | |||
| Total | $ | 1,265.1 | ||||
We assumed a cash flow period of 5 years, a discount rate of 14%, and terminal growth rates of 5% to 7%. The long-term annual growth rates are higher in the early years of the 5-year cash flow period, representing our estimated growth in the period of industry recovery, and a reduced growth rate in the later years.
A-46
The following table summarizes the write-downs of goodwill for the third quarter of fiscal 2002 (in millions):
| Acquired Entities | Reductions of Goodwill | Long-Term Annual Growth Rate | |||||||
|---|---|---|---|---|---|---|---|---|---|
| E-TEK | $ | 697.5 | 30%–35 | % | |||||
| JDS FITEL | 1,184.7 | 30%–42 | % | ||||||
| OCLI | 20.3 | 4%–13 | % | ||||||
| SDL | 762.5 | 27%–50 | % | ||||||
| Other | 206.5 | 7%–45 | % | ||||||
| Total | $ | 2,871.5 | |||||||
We assumed a cash flow period of 5 years, a discount rate of 14%, and terminal growth rates of 5% to 7%. The long-term annual growth rates are higher in the early years of the 5-year cash flow period, representing our estimated growth in the period of industry recovery, and a reduced growth rate in the later years.
The following table summarizes the write-downs of goodwill for the fourth quarter of fiscal 2002 (in millions):
| Acquired Entities | Reductions of Goodwill | Long-Term Annual Growth Rate | |||||||
|---|---|---|---|---|---|---|---|---|---|
| Epitaxx | $ | 130.8 | 25%–40 | % | |||||
| SDL | 43.5 | 15%–50 | % | ||||||
| UNL | 18.7 | 25%–50 | % | ||||||
| Total | $ | 193.0 | |||||||
We assumed a cash flow period of 5 years, a discount rate of 14%, and terminal growth rates of 7%. The long-term annual growth rates are higher in the early years of the 5-year cash flow period, representing our estimated growth in the period of industry recovery, and a reduced growth rate in the later years.
Reduction of Other Long-Lived Assets:
| 2004 | 2003 | Change | 2003 | 2002 | Change | ||||||||||||||||
|---|---|---|---|---|---|---|---|---|---|---|---|---|---|---|---|---|---|---|---|---|---|
| Assets held and used: | |||||||||||||||||||||
| Purchased intangibles (other than goodwill) | $ | — | $ | 68.6 | $ | (68.6 | ) | $ | 68.6 | $ | 1,243.1 | $ | (1,174.5 | ) | |||||||
| Property, plant, equipment and other | 16.4 | 79.1 | (62.7 | ) | 79.1 | 375.5 | (296.4 | ) | |||||||||||||
| Assets held for sale: | |||||||||||||||||||||
| Property, plant and equipment | 35.4 | 20.2 | 15.2 | 20.2 | — | 20.2 | |||||||||||||||
| Total reductions of other long-lived assets | $ | 51.8 | $ | 167.9 | $ | (116.1 | ) | $ | 167.9 | $ | 1,618.6 | $ | (1,450.7 | ) | |||||||
Comment and analysis:
Fiscal 2004 Charges:
Assets Held and Used:
During fiscal 2004, in accordance with SFAS No. 144, the Company reduced to the estimated realizable value, the value of certain manufacturing equipment by $7.7 million, and other assets by $3.7 million. In addition, as a result of the adoption of FIN 46R with respect to two properties under a synthetic lease agreement, the Company recognized a $5.0 million impairment charge related to its Melbourne, Florida property.
Assets Held for Sale:
During fiscal 2004, the Company classified certain properties as assets held for sale, primarily the Company’s Ottawa campus. In accordance with SFAS 144, the Company recorded total impairment charges of $35.4 million, representing the amount by which the carrying value of the properties exceeded estimated fair value less cost to sell.
A-47
Fiscal 2003 Charges:
Assets Held and Used:
The Company noted indicators during the first quarter of fiscal 2003 that the carrying value of its long-lived assets, including purchased intangibles recorded in connection with its various acquisitions and property, plant and equipment, may not be recoverable and performed an impairment review. The impairment review was performed pursuant to SFAS No. 144 because of the prolonged economic downturn affecting the Company’s operations and revenue forecasts. The Company’s projected future revenue and cash flows for certain of the Company’s asset groupings were revised downward in the first quarter of fiscal 2003. Therefore, the Company evaluated the recoverability of its long-lived assets and recorded impairment charges based on the amounts by which the carrying amounts of these assets exceeded their fair value. For purchased intangibles, fair value was determined based on discounted future cash flows for the operating entities that had separately identifiable cash flows. For tangible fixed assets, the Company valued these assets that were subject to impairment using specific appraisals.
The following table summarizes the write-downs of purchased intangibles and property, plant and equipment by acquisition for the first quarter of fiscal 2003 (in millions):
| Acquired Entities | Purchased Intangibles | Property, Plant and Equipment | ||||
|---|---|---|---|---|---|---|
| Datacom | $ | 39.1 | $ | 15.6 | ||
| Epitaxx | 19.9 | 26.3 | ||||
| SDL | — | 24.3 | ||||
| Scion | 8.9 | 12.9 | ||||
| Other | 0.7 | — | ||||
| Total | $ | 68.6 | $ | 79.1 | ||
During the rest of fiscal 2003, the Company noted no impairment indicators in connection with its long-lived assets held and used, and accordingly, a test of recoverability of its long-lived assets was not required for these periods.
Assets Held for Sale:
During the third quarter and fourth quarter of fiscal 2003, the Company classified certain property, plant and equipment intended to be disposed of within a twelve month period as assets held for sale. In accordance with SFAS No. 144, we recorded an impairment charge of $13.3 million, representing the amount by which their carrying value exceeds fair value less cost to sell. During the first quarter of fiscal 2003, we classified certain property and equipment as assets held for sale in connection with the sales of our SIFAM and Cronos subsidiaries and recorded total impairment charges of $6.9 million.
Fiscal 2002 Charges:
As a result of the Phase 2 restructuring activities in the first quarter of fiscal 2002, we restructured our businesses and realigned our operations to focus on certain markets and core opportunities. In the process, we abandoned certain redundant products and product platforms and reduced our workforce that had been valued in previous acquisitions. In accordance with SFAS No. 121, we wrote down the related intangible assets to their fair value, which was deemed to be $0, and recorded total charges of $10.8 million related to purchased intangibles other than goodwill.
As part of our quarterly reviews of financial results, we noted indicators in the second, third and fourth quarters of fiscal 2002 that the carrying value of our long-lived assets, including significant amounts of purchased intangibles recorded in connection with its various acquisitions, may not be recoverable and performed an impairment review. The impairment review was performed pursuant to SFAS No. 121 because of the prolonged economic downturn affecting our operations and revenue forecasts. As a result of the prolonged economic downturn, our projected future revenue and cash flows for certain of our asset groupings were revised downward in the second, third and fourth
A-48
quarters of fiscal 2002. Therefore, we recorded charges to reduce our long-lived assets based on the amounts by which the carrying amounts of these assets exceeded their fair value. Fair value was determined based on discounted future cash flows for the operating entities that had separately identifiable cash flows.
The following table summarizes the write-downs of our long-lived assets, consisting of purchased intangibles and property, plant and equipment, for each quarter of fiscal 2002 (in millions):
| Acquired Entities or Source | Purchased Intangibles | Property, Plant and Equipment | Long-Term Annual Growth Rate | |||||||||||
|---|---|---|---|---|---|---|---|---|---|---|---|---|---|---|
| First Quarter 2002 | ||||||||||||||
| Phase 2 Restructuring | $ | 10.8 | $ | — | N/A | |||||||||
| Second Quarter 2002 | ||||||||||||||
| SDL | $ | 2.5 | $ | — | 15%–60 | % | ||||||||
| Third Quarter 2002 | ||||||||||||||
| E-TEK | $ | 224.1 | $ | 1.1 | 30%–35 | % | ||||||||
| JDS FITEL | 233.9 | — | 30%–42 | % | ||||||||||
| OCLI | 210.7 | 67.2 | 4%–13 | % | ||||||||||
| SDL | 247.6 | 10.4 | 27%–50 | % | ||||||||||
| Other | 9.0 | 8.6 | 7%–45 | % | ||||||||||
| Total | $ | 925.3 | $ | 87.3 | ||||||||||
| Fourth Quarter 2002 | ||||||||||||||
| E-TEK | $ | — | $ | 63.2 | 22%–45 | % | ||||||||
| JDS FITEL | 132.5 | 90.7 | 17 | % | ||||||||||
| SDL | 165.2 | 61.7 | 15%–50 | % | ||||||||||
| Other | 6.8 | 72.6 | 7%–50 | % | ||||||||||
| Total | $ | 304.5 | $ | 288.2 | ||||||||||
| Total 2002 | $ | 1,243.1 | $ | 375.5 | ||||||||||
We assumed a cash flow period of 1 to 5 years, a discount rate of 14%, and terminal growth rates of 5% to 7%, with the exception of the fourth quarter, which used a terminal growth rate of 7%. The long-term annual growth rates are higher in the early years of the 5-year cash flow period, representing our estimated growth in the period of industry recovery, and a reduced growth rate in the later years.
Restructuring and Other Related Charges:
| 2004 | 2003 | Change | Percentage Change | 2003 | 2002 | Change | Percentage Change | |||||||||||||||||||||||||
|---|---|---|---|---|---|---|---|---|---|---|---|---|---|---|---|---|---|---|---|---|---|---|---|---|---|---|---|---|---|---|---|---|
| Restructuring charges | $ | 11.5 | $ | 121.3 | $ | (109.8 | ) | (91 | )% | $ | 121.3 | $ | 260.0 | $ | (138.7 | ) | (53 | )% | ||||||||||||||
Comment and analysis:
In the third and fourth quarters of fiscal 2004 we initiated two restructuring activities and in December 2003 we announced the completion of our Global Realignment Program, which began in April 2001. These activities were in response to the economic downturn and continued realignment of our business toward customer driven productivity. Since April 2001, we have recorded total restructuring charges of $657.1 million (of which $11.5 million, $121.3 million and $260.0 million were recorded in fiscal 2004, 2003 and 2002, respectively). In addition, we incurred charges other than restructuring of $481.7 million related to the Global Realignment Program (of which $6.8 million, $55.7 million and $182.7 million were recorded in fiscal 2004, 2003 and 2002, respectively). Please refer to “Note 14. Restructuring and Global Realignment” of our Notes to Consolidated Financial Statements for a detailed discussion on these charges associated with our Restructuring Programs.
We are consolidating and reducing our manufacturing, research and development, sales and administrative facilities in North America, Europe and Asia-Pacific. To date, we have closed 29 sites and buildings. Based on the
A-49
decisions made through the end of fiscal 2004, we expect to reduce our total workforce by approximately 20,050 employees. As of June 30, 2004, 19,949 employees have been terminated.
The net obligation as of June 30, 2004, related to the Company’s total restructuring obligations of approximately $84 million are net of sublease income or lease settlement estimates of approximately $25 million. If adverse macroeconomic conditions continue, particularly as they pertain to the commercial real estate market, or if, for any reason, tenants under subleases fail to perform their obligations, the Company may be required to reduce estimated future sublease income and adjust the estimated amounts of future settlement agreements, and accordingly, increase estimated cost to exit certain facilities. Amounts related to the lease expense, net of anticipated sublease proceeds, will be paid over the respective lease terms through fiscal 2016.
In the future, we expect to see further opportunities for restructuring activities including elimination of duplicative operations or infrastructure, transferring manufacturing and product lines to more optimal internal locations or, in many cases, to independent contract manufacturers, disposing of unnecessary assets, centralizing functions, improving our governance and systems, and, as necessary, streamlining our employee base.
The Global Realignment Program is substantially complete. Looking forward, as we move from a set program of restructuring toward targeted customer-driven productivity improvements, we expect to see opportunities to further reduce costs.
Interest and Other Income, Net:
| 2004 | 2003 | Change* | Percentage Change | 2003 | 2002 | Change** | Percentage Change | |||||||||||||||||||||||||||
|---|---|---|---|---|---|---|---|---|---|---|---|---|---|---|---|---|---|---|---|---|---|---|---|---|---|---|---|---|---|---|---|---|---|---|
| Interest and other income, net | $ | 22.7 | $ | 32.5 | $ | (9.8 | ) | (30 | )% | $ | 32.5 | $ | 48.3 | $ | (15.8 | ) | (33 | )% | ||||||||||||||||
| * | Primary reasons for change: The decrease in fiscal 2004 as compared to fiscal 2003 is primarily attributable to lower interest rates on invested cash balances and reduced gains on the disposal of certain assets. Going forward, amortization of the cost incurred for the issuance of the Company’s Convertible Debt will reduce net interest income by approximately $2.5 million per fiscal year. |
| ** | Primary reasons for change: The decrease in fiscal 2003 from the prior-year was primarily attributable to the decline in interest income as a result of lower average daily cash and investment balances and lower interest rates. |
Gain (Loss) on Sale of Subsidiaries’ Assets:
| 2004 | 2003 | Change* | Percentage Change | 2003 | 2002 | Change** | Percentage Change | |||||||||||||||||||||||||||
|---|---|---|---|---|---|---|---|---|---|---|---|---|---|---|---|---|---|---|---|---|---|---|---|---|---|---|---|---|---|---|---|---|---|---|
| Gain (Loss) on sale of subsidiaries’ assets | $ | — | $ | (2.2 | ) | $ | 2.2 | 100 | % | $ | (2.2 | ) | $ | 0.1 | $ | (2.3 | ) | (2300 | )% | |||||||||||||||
| * | Primary reasons for change: In fiscal 2003, we completed the sale of all or significantly all of the assets of three subsidiaries located in Billerica, Massachusetts, Raleigh, North Carolina and Torquay, United Kingdom, and recognized a net loss of $2.2 million from the transactions. |
| ** | Primary reasons for change: In fiscal 2002, we sold 80.1% of our ownership in Iridian to IST Holdings for $1.1 million in cash, and retained the remaining 19.9%. After adjusting for the net costs of the assets sold and the expenses associated with the divestiture, we realized a gain of $0.1 million from the transaction. |
Gain on Sale of Investments
| 2004 | 2003 | Change* | 2003 | 2002 | Change* | |||||||||||||
|---|---|---|---|---|---|---|---|---|---|---|---|---|---|---|---|---|---|---|
| Gain on sale of Investments: | $ | 41.2 | $ | 4 | . | $ | 37.2 | $ | 4.0 | $ | 15.0 | $ | (11.0 | ) | ||||
| * | Primary reasons for change: The gain in fiscal 2004 is primarily the result of the sale of marketable public securities, primarily Nortel common stock shares received in the sale of our Zurich facility to Nortel in fiscal |
A-50
2001. The fair value of our marketable securities at June 30, 2004 is approximately $70.9 million. In fiscal 2003 and 2002, we recognized total gains of $4.0 million and $15.0 million, respectively, primarily from sales of certain non-marketable equity securities and fixed income securities.
Reduction in Fair Value of Investments:
| 2004 | 2003 | Change* | 2003 | 2002 | Change** | |||||||||||||||||||||
|---|---|---|---|---|---|---|---|---|---|---|---|---|---|---|---|---|---|---|---|---|---|---|---|---|---|---|
| Reduction in fair value of investments | $ | (3.8 | ) | $ | (45.4 | ) | $ | 41.6 | $ | (45.4 | ) | $ | (225.8 | ) | $ | 180.4 | ||||||||||
| * | Primary reasons for change: We periodically review our investments for impairment. When the carrying value of an investment exceeds the fair value and the decline in fair value is deemed to be other-than-temporary, we write down the value of the investment to its fair value. The write-downs in fiscal 2004 consisted of $3.8 million related to the decline in fair value of various non-marketable equity securities. The write-downs in fiscal 2003 consisted of $25.0 million related to the decline in fair value of our investment in Adept and $20.4 million related to other non-marketable equity securities. The write-downs in fiscal 2002 consisted of $187.3 million related to our investment in Nortel common stock, $9.6 million related to other available-for-sale investments and $28.9 million related to non-marketable equity securities. |
Comment and analysis:
Should the fair value of our investments decline in the future, we may be required to record additional charges if the decline is determined to be other-than-temporary. The carrying amount of the Company’s investments is $32.6 million and its minimum funding commitments are $16.0 million.
Loss on Equity Method Investments:
| 2004 | 2003 | Change* | 2003 | 2002 | Change** | |||||||||||||||||||||
|---|---|---|---|---|---|---|---|---|---|---|---|---|---|---|---|---|---|---|---|---|---|---|---|---|---|---|
| Loss on equity method investments | $ | (8.2 | ) | $ | (8.5 | ) | $ | 0.3 | $ | (8.5 | ) | $ | (54.6 | ) | $ | 46.1 | ||||||||||
| * | Primary reasons for change: Charges in fiscal 2004 and fiscal 2003 consisted primarily of our pro rata share of the net losses on our equity method investments. Charges in fiscal 2002 included: (i) $40.0 million related to our pro rata share of net losses in ADVA and other equity method investments; (ii) $13.9 million related to a charge to write down the carrying value of our investment in ADVA due to an other-than-temporary decline in its market value; and (iii) $0.7 million of amortization expense in fiscal 2002 related to the difference between the cost of the investment and the underlying equity in the net assets of ADVA. |
Comment and analysis:
We recorded losses on our equity method investments representing our pro-rata share of net losses. Our equity investments include four venture capital funds and direct investments.
Income Tax Expense (Benefit):
| 2004 | 2003 | Change | 2003 | 2002 | Change | |||||||||||||||||||||
|---|---|---|---|---|---|---|---|---|---|---|---|---|---|---|---|---|---|---|---|---|---|---|---|---|---|---|
| Income tax expense (benefit) | $ | (15.8 | ) | $ | 13.5 | $ | (29.3 | ) | $ | 13.5 | $ | 237.3 | $ | (223.8 | ) | |||||||||||
Comment and analysis:
Fiscal 2004 Tax Benefit:
We recorded an income tax benefit of $15.8 million for fiscal 2004. The expected tax benefit derived by applying the federal statutory rate to our loss before income taxes for fiscal 2004 differed from the income tax benefit recorded primarily due to the net tax effects of non-deductible acquisition-related charges, increases in our valuation allowance for deferred tax assets, tax benefits realized from the reversal of previously accrued taxes and tax benefits
A-51
arising from foreign earnings of one of our Far East subsidiaries operating under a tax holiday that are invested indefinitely offshore. Included in the fiscal 2004 tax benefit of $15.8 million is $7.8 million of tax benefit arising from the net tax effect of sales of certain marketable public securities and tax benefits arising from deferred tax assets recorded for fiscal 2004 operating losses that were not subject to a valuation allowance due to appreciation in the carrying value of certain marketable public securities designated as available-for-sale investments. Also included in the 2004 tax benefit is $5.0 million related to the carryback of tax net operating losses from fiscal 2002 to offset prior year taxes paid by certain acquired subsidiaries.
During the fourth quarter of fiscal 2004, the Company recorded a $2.0 million tax benefit as a result of obtaining a tax clearance certificate in connection with the liquidation of one of the Company’s foreign subsidiaries. In August 2004, the Company recorded a $2.6 million tax benefit as of June 30, 2004 to reflect a reduction in previously estimated foreign tax liabilities as a result of the Company’s resolution of certain foreign tax audit issues with foreign taxing authorities. The $2.6 million benefit is reflected in the Company’s consolidated balance sheet as of June 30, 2004 under the caption “Income taxes payable” and in the consolidated statement of operations for the year ended June 30, 2004 under the caption “Income tax expense (benefit).”
The Company is currently subject to various federal, state and foreign audits by taxing authorities. The Company believes that adequate amounts have been provided for any adjustments that may result from these examinations.
Fluctuations in the value of our available-for-sale marketable public securities will create volatility in the amount of income tax expense (benefit) we record in future periods.
Due to the continued economic uncertainty in the industry, management has determined that it is more likely than not that the Company’s net deferred tax assets will not be realized and the Company has recorded deferred tax assets as of June 30, 2004 only to the extent of deferred tax liabilities.
Fiscal 2003 Tax Expense:
We recorded an income tax expense of $13.5 million in fiscal 2003. The expected tax benefit derived by applying the federal statutory rate to our loss before income taxes for fiscal 2003 differed from the income tax expense recorded primarily due to the net tax effects of non-deductible acquisition-related charges and increases in our valuation allowance for deferred tax assets. The $13.5 million tax expense we recorded in fiscal 2003 includes $18.0 million of tax expense related to the prior financial reporting period ended June 30, 2002 and resulted from an increase in the Company’s valuation allowance for deferred tax assets. During the fiscal year ended 2003, Canadian tax authorities completed a review of the Company’s pending claims for refunds of prior year income taxes. As a result of this review, certain matters related to carryback periods and minimum taxes were identified that caused the Company to conclude that it had recorded $18.0 million of net deferred tax assets in excess of income taxes actually recoverable from prior years and, therefore, necessitated the recording of an additional valuation allowance for deferred tax assets. The $18.0 million amount recorded in fiscal year 2003 was not material to the period in which it should have been recorded nor material to the consolidated results of operations for the year ended June 30, 2003.
Included in the fiscal 2003 income tax expense of $13.5 million is a $7.0 million tax benefit recorded as a result of appreciation in the carrying value of available-for-sale marketable public securities that reduced by $7.0 million the amount of valuation allowance for deferred tax assets recorded in connection with our loss from continuing operations.
Fiscal 2002 Tax Expense:
We recorded an income tax expense of $237.3 million in fiscal 2002. The expected tax benefit derived by applying the federal statutory rate to our loss before income taxes for fiscal 2002 differed from the income tax expense recorded primarily due to the net tax effects of non-deductible acquisition-related charges and increases in our valuation allowance for deferred tax assets and reductions in deferred tax assets recorded in prior years attributable to assumed employee stock options that were cancelled or exercised when the share value on the option exercise dates was less than the value recorded for purchase accounting purposes.
A-52
Operating Segment Information:
Communications Product Group:
| 2004 | 2003 | Change* | Percentage Change | 2003 | 2002 | Change** | Percentage Change | |||||||||||||||||||||||||||
|---|---|---|---|---|---|---|---|---|---|---|---|---|---|---|---|---|---|---|---|---|---|---|---|---|---|---|---|---|---|---|---|---|---|---|
| Net Revenue | $ | 317.4 | $ | 333.0 | $ | (15.6 | ) | (5 | )% | $ | 333.0 | $ | 795.9 | $ | (462.9 | ) | (58 | )% | ||||||||||||||||
| Operating (loss) | $ | (43.4 | ) | $ | (167.4 | ) | $ | 124.0 | 74 | % | $ | (167.4 | ) | $ | (284.1 | ) | $ | 116.7 | 41 | % | ||||||||||||||
| * | Primary reasons for change: The decrease in Communication Products Group net revenue for fiscal 2004 as compared to fiscal 2003 reflects a drop in customer cancellation revenue. It is also due to lower demand for our communications products and lower average selling prices caused by the slowdown in our industry, which resulted in a decrease in network deployment and capital spending by telecommunications carriers. The improvement in Communication Product Group Operating loss was primarily a function of improved gross margins and reduced operating expenses, as a result of workforce reductions, a reduction in facilities and occupancy related costs, site closures and other cost cutting measures implemented under our Global Realignment Program, as discussed in our analysis of changes in gross margin and selling, general and administrative costs. |
| ** | Primary reasons for change: The decrease in Communication Products Group net revenue for fiscal 2003 as compared to fiscal 2002 was primarily due to lower demand for our communications products and lower average selling prices caused by the slowdown in our industry, which resulted in a decrease in network deployment and capital spending by telecommunications carriers. The improvement in the operating loss was primarily due to improved gross margins and reduced operating expenses primarily related to cost reductions identified under the Global Realignment Program. |
Commercial and Consumer Products Group:
| 2004 | 2003 | Change* | Percentage Change | 2003 | 2002 | Change* | Percentage Change | |||||||||||||||||||||||||||
|---|---|---|---|---|---|---|---|---|---|---|---|---|---|---|---|---|---|---|---|---|---|---|---|---|---|---|---|---|---|---|---|---|---|---|
| Net Revenue | $ | 318.5 | $ | 342.9 | $ | (24.4 | ) | (7 | )% | $ | 342.9 | $ | 302.3 | $ | 40.6 | 13 | % | |||||||||||||||||
| Operating income | $ | 54.8 | $ | 54.8 | $ | — | — | $ | 54.8 | $ | 34.5 | $ | 20.3 | 59 | % | |||||||||||||||||||
| * | Primary reasons for change:The decline in our Commercial and Consumer Products revenue for fiscal 2004 as compared to fiscal 2003 was primarily due to declines in our display revenue and optically variable pigments. The increase in our net revenue for 2003 as compared to fiscal 2002 was primarily attributable to higher demand for our products for display and security markets. The improvement in Commercial and Consumer Products Group Operating Income for fiscal 2003 as compared to fiscal 2002 was primarily a function of improved gross margins and reduced operating expenses primarily related to reductions identified under the Global Realignment Program. |
Liquidity and Capital Resources
We had a combined balance of cash, cash equivalents and short-term investments of $1,548.7 million at June 30, 2004, an increase of $314.6 million from June 30, 2003 primarily due to the debt offering. Our total debt outstanding, including capital lease obligations, was $470.4 million at June 30, 2004.
Operating activities used $135.2 million in cash during fiscal 2004, primarily resulting from: (i) our net loss adjusted for non-cash items including non-cash tax benefit associated with unrealized gains on publicly traded securities, depreciation and amortization, stock-based compensation expense, cumulative effect of an accounting change, reductions of goodwill and other long-lived assets, gains and losses on our investments; and (ii) decrease of current liabilities of $72.5 million, partially resulting from payments of obligation previously accrued under the Global Realignment Program of $49.9 million, the utilization and settlement of warranty obligations of $36.0
A-53
million and the reduction of other current liabilities of $11.5 million due to settlement and payment of obligations; and (iii) increases in accounts receivable due to quarterly revenue growth; and in inventory due to expected growth;. These items were partially offset by tax refunds received of approximately $44 million.
Accounts receivable were higher in fiscal 2004 primarily due to sequential quarterly increases in sales during the year. Days sales outstanding in accounts receivable was 59 days at June 30, 2004 as compared to 55 days at June 30, 2003, primarily reflecting an increase in shipments near the end of the period. Inventory levels were higher at June 30, 2004 primarily due to increased purchases required to meet customer demand.
Cash used by investing activities was approximately $259.1 million during 2004, primarily due to purchases of available for sale investments in the net amount of $186.3 million resulting from proceeds of debt financing offset by operational use; purchases of property, plant and equipment, including the purchase of properties formerly under a synthetic lease agreement for $44.7 million and acquisition of businesses as discussed in “Note 17. Mergers and Acquisitions” of our Notes to Consolidated Financial Statements. Partially offsetting this use of cash were proceeds of $36.0 million primarily related to the sale of a facility in Taiwan and the sale of our corporate airplane.
Our financing activities provided cash of $481.1 million, resulting primarily from the issuance of $475.0 million in Zero Coupon Senior Convertible Notes. As of June 30, 2004, the Company had six standby letter of credit facilities totaling $9.4 million. See “Note 7. Convertible Debt and Letters of Credit” of our Notes to Consolidated Financial Statements for additional information regarding the issuance and terms of the convertible notes and available lines of credit.
Our investments of surplus cash are made in accordance with an investment policy approved by our Board of Directors. In general, our investment policy requires that securities purchased and held be rated SP-1/MIG-1, A/A2 or better. No securities may have an effective maturity that exceeds 36 months, and the average duration of our investment portfolio may not exceed 18 months. At any time, no more than 10% of the investment portfolio may be concentrated in a single issuer other than the U.S. or Canadian government. The Company’s investments in debt securities and marketable equity securities are classified as available-for-sale investments or trading assets and are recorded at fair value. The cost of securities sold is based on the specific identification method. Unrealized gains and losses on available-for-sale investments are reported as a separate component of stockholders’ equity.
Financial Commitments:
Our investment portfolio includes minority investments in certain privately held companies. As of June 30, 2004, we had a commitment to provide additional funding of up to a maximum of $16.0 million to certain venture capital investment partnerships.
Contractual Obligations
The following summarizes our contractual obligations and off balance sheet arrangements at June 30, 2004, and the effect such obligations are expected to have on our liquidity and cash flow over the next five years (in millions).
| Total | Less than 1 year | 1–3 years | 3–5 years | More than 5 years | ||||||||||||||||||
|---|---|---|---|---|---|---|---|---|---|---|---|---|---|---|---|---|---|---|---|---|---|---|
| Zero Coupon Senior Convertible Notes | $ | 475.0 | $ | — | $ | — | $ | — | $ | 475.0 | ||||||||||||
| Purchase obligations | 181.6 | 181.6 | — | — | — | |||||||||||||||||
| Operating lease obligations | 128.2 | 29.8 | 53.0 | 26.7 | 18.7 | |||||||||||||||||
| Royalty obligations | 14.0 | 3.0 | 8.8 | 2.2 | — | |||||||||||||||||
| Capital lease obligations | 5.7 | 0.8 | 1.5 | 2.6 | 0.8 | |||||||||||||||||
| Other long-term liabilities | 4.0 | 0.2 | 0.6 | 0.4 | 2.8 | |||||||||||||||||
| Total | $ | 808.5 | $ | 215.4 | $ | 63.9 | $ | 31.9 | $ | 497.3 | ||||||||||||
As of June 30, 2004, operating lease obligations of $76.6 million in connection with our restructuring program were accrued in our Consolidated Balance Sheet.
Purchase obligations represent all open purchase orders as of June 30, 2004.
A-54
Off-Balance Sheet Arrangements:
We do not have any off-balance sheet arrangements, as such term is defined in rules promulgated by the Securities and Exchange Commission, that have or are reasonably likely to have a current or future effect on our financial condition, changes in financial condition, revenues or expenses, results of operations, liquidity, capital expenditures or capital resources that are material to investors.
We expect to use approximately $120.0 to $140.0 million in cash in fiscal 2005, exclusive of amounts required relating to our acquisition and investment activities during the fiscal year. We believe that our existing cash balances and investments will be sufficient to meet our liquidity and capital spending requirements at least through the next 12 months. However, possible investments in or acquisitions of complementary businesses, products or technologies may require the use of additional cash or financing prior to such time.We have in recent periods consumed, and we expect to continue to consume, portions of our cash reserves to fund our operations. The amounts consumed to date, together with the amounts currently anticipated to be spent, are not expected to materially impair our financial condition. However, we may need to expend additional, currently unanticipated, cash reserves to fund our operations. Our liquidity could be negatively affected by a decline in demand for our products, which are subject to rapid technological changes, or a reduction of capital expenditures by telecommunications carriers.
Employee Stock Options
Stock Option Program Description:
Our stock option program is a broad-based, long-term retention program that is intended to attract and retain employees and align stockholder and employee interests. As of June 30, 2004, we have available for issuance 112.9 million shares of common stock underlying options for grant primarily under the Company’s 2003 Equity Incentive Plan. The exercise price is generally equal to the fair value of the underlying stock at the date of grant. Options generally become exercisable over a four-year period and, if not exercised, expire from five to ten years. Substantially all of our employees participate in our stock option program.
The Company accounts for stock-based compensation in accordance with Accounting Principles Board (“APB”) Opinion No. 25, “Accounting for Stock Issued to Employees,” as interpreted by Financial Accounting Standards Board Interpretation No. 44 (“FIN No. 44”), “Accounting for Certain Transactions Involving Stock Compensation.” The Company records and amortizes, over the related vesting periods on a straight-line basis, deferred compensation representing the difference between the price per share of stock issued or the exercise price of stock options granted and the fair value of the Company’s common stock at the time of issuance or grant. Stock compensation costs are immediately recognized to the extent the exercise price is below the fair value on the date of grant and no future vesting criteria exist. Please refer to “Note 10. Stockholders’ Equity” of our Notes to Consolidated Financial Statements for a detailed discussion on this program.
Status of Acquired In-Process Research and Development Projects
We periodically review the stage of completion and likelihood of success of each of the IPR&D projects. The nature of the efforts required to develop the IPR&D projects into commercially viable products principally relates to the completion of all planning, designing, prototyping, verification and testing activities that are necessary to establish that the products can be produced to meet their design specifications, including functions, features and technical performance requirements. The current status of the IPR&D projects for our significant acquisitions during fiscal 2004, 2003 and 2002 is as follows:
E2O:
E2O was in the process of developing a vertical-cavity surface-emitting laser (VSCEL) Shortwave laser as of the date of acquisition. From the date of acquisition through the end of the fiscal year, approximately $0.2 million was spent on research and development for the continued development of VSCEL product. The Company estimates
A-55
that $0.5 million of additional research and development costs will be incurred prior to its estimated completion in calender 2006.
Scion:
The products under development at the time of acquisition were comprised of advanced integrated waveguide devices. We have incurred post-acquisition costs of $3.9 million to date and estimate that an additional investment of approximately $0.7 million in research and development over the next 9 months will be required to complete the IPR&D projects.The differences between the actual outcome noted above and the assumptions used in the original valuation of the technology are not expected to have a significant impact on our results of operations and financial position.
ITEM 7A. QUANTITATIVE AND QUALITATIVE DISCLOSURES ABOUT MARKET RISK
Investments
We maintain an investment portfolio in a variety of financial instruments, including fixed and floating rate bonds, municipal bonds, auction instruments, money market instruments, corporate bonds and agency bonds. Part of our investment portfolio also includes minority equity investments in several publicly-traded companies, the values of which are subject to market price volatility. These investments are generally classified as available-for-sale and, consequently, are recorded on our balance sheets at fair value with unrealized gains or losses reported as a separate component of stockholders’ equity.
Investments in both fixed-rate and floating-rate interest earning instruments carry a degree of interest rate risk. The fair market values of our fixed-rate securities decline if interest rates rise, while floating-rate securities may produce less income than expected if interest rates fall. Due in part to these factors, our future investment income may be less than expectations because of changes in interest rates or we may suffer losses in principal if forced to sell securities that have experienced a decline in market value because of changes in interest rates.
The following tables present the hypothetical changes in fair value in the financial instruments held at June 30, 2004 and June 30, 2003 that are sensitive to changes in interest rates. These instruments are not leveraged or hedged and are held for purposes other than trading. The modeling technique used measures the change in fair values arising from selected potential changes in interest rates. Market changes reflect immediate hypothetical parallel shifts in the yield curve of plus or minus 50 basis points (“BPS”), 100 BPS, and 150 BPS over a 12-month horizon. Due to the level of interest rates, a decrease of 150 BPS at June 30, 2003 was not relevant. Beginning fair values represent the principal plus accrued interest and dividends at June 30, 2004 and June 30, 2003. The following tables estimate the fair value of the portfolio at a 12-month horizon (in millions):
| Valuation of Securities Given an Interest Rate Decrease of “X” BPS | Fair Value as of June 30, 2004 | Valuation of Securities Given an Interest Rate Increase of “X” BPS | |||||||||||||||||||||||||||||
|---|---|---|---|---|---|---|---|---|---|---|---|---|---|---|---|---|---|---|---|---|---|---|---|---|---|---|---|---|---|---|---|
| 150 BPS | 100 BPS | 50 BPS | 50 BPS | 100 BPS | 150 BPS | ||||||||||||||||||||||||||
| U.S. Treasuries and Agencies notes and bonds | $ | 743 | $ | 739 | $ | 735 | $ | 730 | $ | 726 | $ | 722 | $ | 718 | |||||||||||||||||
| Sovereign, multilateral, state, county and municipal government notes and bonds | 51 | 51 | 50 | 50 | 50 | 50 | 50 | ||||||||||||||||||||||||
| Asset-backed and auction rate securities | 104 | 103 | 103 | 103 | 103 | 103 | 102 | ||||||||||||||||||||||||
| Corporate bonds and commercial paper | 431 | 429 | 428 | 426 | 424 | 422 | 420 | ||||||||||||||||||||||||
| Money market funds | 75 | 75 | 75 | 75 | 75 | 75 | 75 | ||||||||||||||||||||||||
| Total | $ | 1,404 | $ | 1,397 | $ | 1,391 | $ | 1,384 | $ | 1,378 | $ | 1,372 | $ | 1,365 | |||||||||||||||||
A-56
| Valuation of Securities Given an Interest Rate Decrease of “X” BPS | Fair Value as of June 30, 2003 | Valuation of Securities Given an Interest Rate Increase of “X” BPS | |||||||||||||||||||||||||||||
|---|---|---|---|---|---|---|---|---|---|---|---|---|---|---|---|---|---|---|---|---|---|---|---|---|---|---|---|---|---|---|---|
| 100 BPS | 50 BPS | 50 BPS | 100 BPS | 150 BPS | |||||||||||||||||||||||||||
| U.S. Treasuries and agencies notes | $ | 513 | $ | 511 | $ | 510 | $ | 508 | $ | 505 | $ | 503 | |||||||||||||||||||
| State, municipal and county government notes and bonds | 37 | 37 | 36 | 36 | 36 | 36 | |||||||||||||||||||||||||
| Corporate bonds and commercial paper | 389 | 388 | 387 | 386 | 385 | 384 | |||||||||||||||||||||||||
| Money market funds | 73 | 73 | 73 | 73 | 73 | 73 | |||||||||||||||||||||||||
| Total | $ | 1,012 | $ | 1,009 | $ | 1,006 | $ | 1,003 | $ | 999 | $ | 996 | |||||||||||||||||||
The following analyses present the hypothetical changes in fair values of equity investments in publicly-traded companies that are sensitive to changes in global equity markets. These equity securities are held for purposes other than trading. The modeling technique used measures the hypothetical change in fair values arising from selected hypothetical changes in each stock’s price. Stock price fluctuations of plus or minus 15%, 35% and 50% were selected. The following tables estimate the fair value of the publicly-traded corporate equities at a 12-month horizon (in millions):
| Valuation of Securities Given “X%” Decrease in Each Stock’s Price | Fair Value as of June 30, 2004 | Valuation of Securities Given an “X%” Increase in Each Stock’s Price | |||||||||||||||||||||||||||||
|---|---|---|---|---|---|---|---|---|---|---|---|---|---|---|---|---|---|---|---|---|---|---|---|---|---|---|---|---|---|---|---|
| 50% | 35% | 15% | 15% | 35% | 50% | ||||||||||||||||||||||||||
| Corporate equities | $ | 36 | $ | 46 | $ | 60 | $ | 71 | $ | 82 | $ | 96 | $ | 107 | |||||||||||||||||
| Valuation of Securities Given “X%” Decrease in Each Stock’s Price | Fair Value as of June 30, 2003 | Valuation of Securities Given an “X%” Increase in Each Stock’s Price | |||||||||||||||||||||||||||||
|---|---|---|---|---|---|---|---|---|---|---|---|---|---|---|---|---|---|---|---|---|---|---|---|---|---|---|---|---|---|---|---|
| 50% | 35% | 15% | 15% | 35% | 50% | ||||||||||||||||||||||||||
| Corporate equities | $ | 37 | $ | 48 | $ | 63 | $ | 74 | $ | 85 | $ | 100 | $ | 111 | |||||||||||||||||
Foreign Exchange Forward Contracts
Our international business is subject to normal international business risks including, but not limited to, differing economic conditions, changes in political climate, differing tax structures, other regulations and restrictions, and foreign exchange rate volatility. Accordingly, our future results could be materially adversely affected by changes in these or other factors.
We generate a portion of our revenue from sales to customers located outside the United States and from sales by our foreign subsidiaries to U.S. customers. International sales are typically denominated in either U.S dollars or the local currency of each country. Our foreign subsidiaries incur most of their expenses in the local currency, and therefore, they use the local currency as their functional currency.
We enter into foreign exchange forward contracts on behalf of our Canadian, European and Asian subsidiaries. These forward contracts offset the impact of U.S. dollar currency fluctuations on certain assets and liabilities.
The foreign exchange forward contracts we enter into generally have original maturities less than 40 days. We do not enter into foreign exchange forward contracts for trading purposes. We do not expect gains or losses on these contracts to have a material impact on our financial results. At June 30, 2004, the face value of these foreign exchange forward contracts was $35.5 million.
A-57
ITEM 8. FINANCIAL STATEMENTS AND SUPPLEMENTARY DATA
REPORT OF INDEPENDENT REGISTERED PUBLIC ACCOUNTING FIRM
The Board of Directors and Stockholders of JDS Uniphase Corporation
We have audited the accompanying consolidated balance sheets of JDS Uniphase Corporation as of June 30, 2004 and 2003, and the related consolidated statements of operations, stockholders’ equity, and cash flows for each of the three years in the period ended June 30, 2004. Our audits also included the financial statement schedule listed in the index at Item 15(a)2. These financial statements and schedule are the responsibility of the Company’s management. Our responsibility is to express an opinion on these financial statements and schedule based on our audits.
We conducted our audits in accordance with the standards of the Public Company Accounting Oversight Board (United States). Those standards require that we plan and perform the audits to obtain reasonable assurance about whether the financial statements are free of material misstatement. An audit includes examining, on a test basis, evidence supporting the amounts and disclosures in the financial statements. An audit also includes assessing the accounting principles used and significant estimates made by management, as well as evaluating the overall financial statement presentation. We believe that our audits provide a reasonable basis for our opinion.
In our opinion, the financial statements referred to above present fairly, in all material respects, the consolidated financial position of JDS Uniphase Corporation as of June 30, 2004 and 2003, and the consolidated results of its operations and its cash flows for each of the three years in the period ended June 30, 2004, in conformity with U.S. generally accepted accounting principles. Also, in our opinion, the related financial statement schedule, when considered in relation to the basic financial statements taken as a whole, presents fairly in all material respects the information set forth therein.
As discussed in Note 1 to the accompanying consolidated financial statements, in 2003, JDS Uniphase Corporation changed its method of accounting for goodwill and intangible assets.
/s/ ERNST & YOUNG LLP
San Jose, California
July 30, 2004,
except for the seventh paragraph of Note 15, as to which the date is
September 2, 2004
A-58
JDS UNIPHASE CORPORATION
CONSOLIDATED STATEMENTS OF OPERATIONS
(in millions, except per share data)
| Years Ended June 30, | |||||||||||||||
|---|---|---|---|---|---|---|---|---|---|---|---|---|---|---|---|
| 2004 | 2003 | 2002 | |||||||||||||
| Net revenue | $ | 635.9 | $ | 675.9 | $ | 1,098.2 | |||||||||
| Cost of sales | 490.1 | 620.5 | 1,171.1 | ||||||||||||
| Gross profit (loss) | 145.8 | 55.4 | (72.9 | ) | |||||||||||
| Operating expenses: | |||||||||||||||
| Research and development | 99.5 | 153.7 | 254.8 | ||||||||||||
| Selling, general and administrative | 144.7 | 267.3 | 382.9 | ||||||||||||
| Amortization of goodwill | — | — | 937.5 | ||||||||||||
| Amortization of other intangibles | 16.0 | 19.8 | 371.2 | ||||||||||||
| Acquired in-process research and development | 2.6 | 0.4 | 25.3 | ||||||||||||
| Reduction of goodwill | — | 225.7 | 4,360.8 | ||||||||||||
| Reduction of other long-lived assets | 51.8 | 167.9 | 1,618.6 | ||||||||||||
| Restructuring charges | 11.5 | 121.3 | 260.0 | ||||||||||||
| Total operating expenses | 326.1 | 956.1 | 8,211.1 | ||||||||||||
| Loss from operations | (180.3 | ) | (900.7 | ) | (8,284.0 | ) | |||||||||
| Interest and other income, net | 22.7 | 32.5 | 48.3 | ||||||||||||
| Gain (loss) on sale of subsidiaries’ net assets | — | (2.2 | ) | 0.1 | |||||||||||
| Gain on sale of investments | 41.2 | 4.0 | 15.0 | ||||||||||||
| Reduction in fair value of investments | (3.8 | ) | (45.4 | ) | (225.8 | ) | |||||||||
| Loss on equity method investments | (8.2 | ) | (8.5 | ) | (54.6 | ) | |||||||||
| Loss before income taxes and cumulative effect of an accounting change | (128.4 | ) | (920.3 | ) | (8,501.0 | ) | |||||||||
| Income tax expense (benefit) | (15.8 | ) | 13.5 | 237.3 | |||||||||||
| Loss before cumulative effect of an accounting change | (112.6 | ) | (933.8 | ) | (8,738.3 | ) | |||||||||
| Cumulative effect of an accounting change | (2.9 | ) | — | — | |||||||||||
| Net loss | $ | (115.5 | ) | $ | (933.8 | ) | $ | (8,738.3 | ) | ||||||
| Net loss per share — basic and diluted | $ | (0.08 | ) | $ | (0.66 | ) | $ | (6.50 | ) | ||||||
| Shares used in per sharecalculation — basic and diluted | 1,436.7 | 1,419.7 | 1,344.3 | ||||||||||||
See accompanying notes to consolidated financial statements.
A-59
JDS UNIPHASE CORPORATION
CONSOLIDATED BALANCE SHEETS
(in millions, except share and par value data)
| June 30, 2004 | June 30, 2003 | |||||||||
|---|---|---|---|---|---|---|---|---|---|---|
ASSETS | ||||||||||
| Current assets: | ||||||||||
| Cash and cash equivalents | $ | 327.5 | $ | 241.9 | ||||||
| Short-term investments | 1,221.2 | 992.2 | ||||||||
| Accounts receivable, less allowances of $11.8 at June 30, 2004 and $22.7 at June 30, 2003 | 112.7 | 97.5 | ||||||||
| Inventories | 125.0 | 84.1 | ||||||||
| Refundable income taxes | 5.8 | 39.0 | ||||||||
| Deferred income taxes | 14.3 | 9.3 | ||||||||
| Other current assets | 59.5 | 50.6 | ||||||||
| Total current assets | 1,866.0 | 1,514.6 | ||||||||
| Property, plant and equipment, net | 195.6 | 283.4 | ||||||||
| Deferred income taxes | 27.0 | 27.6 | ||||||||
| Goodwill | 204.8 | 166.2 | ||||||||
| Other intangibles, net | 81.4 | 88.2 | ||||||||
| Long-term investments | 42.4 | 47.5 | ||||||||
| Other assets | 4.3 | 10.3 | ||||||||
| Total assets | $ | 2,421.5 | $ | 2,137.8 | ||||||
LIABILITIES AND STOCKHOLDERS’ EQUITY | ||||||||||
| Current liabilities: | ||||||||||
| Accounts payable | $ | 74.1 | $ | 48.6 | ||||||
| Accrued payroll and related expenses | 38.4 | 47.2 | ||||||||
| Income taxes payable | 33.5 | 39.0 | ||||||||
| Deferred income taxes | 14.3 | 9.3 | ||||||||
| Restructuring accrual | 84.2 | 134.1 | ||||||||
| Warranty accrual | 25.1 | 52.4 | ||||||||
| Other current liabilities | 80.7 | 92.2 | ||||||||
| Total current liabilities | 350.3 | 422.8 | ||||||||
| Deferred income taxes | 27.0 | 27.6 | ||||||||
| Long-term debt | 464.7 | — | ||||||||
| Other non-current liabilities | 8.4 | 16.3 | ||||||||
| Commitments and contingencies | ||||||||||
| Stockholders’ equity: | ||||||||||
| Preferred Stock, $0.001 par value: | ||||||||||
| Authorized shares: 1,000,000 | ||||||||||
| Series A: 0 shares issued and outstanding at June 30, 2004 and June 30, 2003, respectively | — | — | ||||||||
| Series B: 100,000 shares authorized; 0 shares issued and outstanding at June 30, 2004 and 2003, respectively | — | — | ||||||||
| Special voting share: 1 share authorized, issued and outstanding | — | — | ||||||||
| Common Stock, $0.001 par value: | ||||||||||
| Authorized shares: 3,000,000,000 | �� | |||||||||
| Issued and outstanding shares: | ||||||||||
| 1,440,404,236 at June 30, 2004 and 1,431,324,217 at June 30, 2003 | 1.4 | 1.4 | ||||||||
| Additional paid-in capital | 68,577.9 | 68,557.3 | ||||||||
| Deferred compensation | (0.8 | ) | (1.7 | ) | ||||||
| Accumulated deficit | (67,012.0 | ) | (66,896.5 | ) | ||||||
| Accumulated other comprehensive income | 4.6 | 10.6 | ||||||||
| Total stockholders’ equity | 1,571.1 | 1,671.1 | ||||||||
| Total liabilities and stockholders’ equity | $ | 2,421.5 | $ | 2,137.8 | ||||||
See accompanying notes to consolidated financial statements.
A-60
JDS UNIPHASE CORPORATION
CONSOLIDATED STATEMENTS OF CASH FLOWS
(in millions)
| Years Ended June 30, | |||||||||||||||
|---|---|---|---|---|---|---|---|---|---|---|---|---|---|---|---|
| 2004 | 2003 | 2002 | |||||||||||||
OPERATING ACTIVITIES: | |||||||||||||||
| Net loss | $ | (115.5 | ) | $ | (933.8 | ) | $ | (8,738.3 | ) | ||||||
| Adjustments to reconcile net loss to net cash provided by (used in) operating activities: | |||||||||||||||
| Depreciation expense | 39.9 | 59.4 | 336.6 | ||||||||||||
| Amortization expense | 16.0 | 19.8 | 1,308.7 | ||||||||||||
| Amortization of deferred compensation and other stock-based compensation expense | 1.8 | 50.9 | 124.9 | ||||||||||||
| Non-cash tax benefit associated with unrealized gain on marketable securities | (7.8 | ) | — | — | |||||||||||
| Acquired in-process research and development | 2.6 | 0.4 | 25.3 | ||||||||||||
| Reduction of goodwill and other long-lived assets | 51.8 | 393.6 | 5,979.4 | ||||||||||||
| (Gain) loss on sale of subsidiaries’ assets | — | 2.2 | (0.1 | ) | |||||||||||
| (Gain) on sale of investments | (37.7 | ) | (4.0 | ) | (15.0 | ) | |||||||||
| Reduction in fair value of investments | 3.8 | 45.4 | 225.8 | ||||||||||||
| Loss on equity method investments | 8.2 | 8.5 | 54.6 | ||||||||||||
| Loss on disposal of property and equipment | 2.0 | 1.9 | 19.5 | ||||||||||||
| Non-cash restructuring charges | 9.4 | 42.4 | 148.3 | ||||||||||||
| Tax benefit on non-qualified stock options | — | — | 23.0 | ||||||||||||
| Change in deferred income taxes, net | — | 61.1 | 340.8 | ||||||||||||
| Accretion on discount of long-term debt | 0.8 | — | — | ||||||||||||
| Cumulative effect of change in accounting principle | 2.9 | — | — | ||||||||||||
| Changes in operating assets and liabilities: | |||||||||||||||
| Accounts receivable | (12.0 | ) | 39.5 | 343.7 | |||||||||||
| Inventories | (34.2 | ) | 21.1 | 194.3 | |||||||||||
| Other current assets | 3.6 | 38.4 | (9.3 | ) | |||||||||||
| Accounts payable | 10.2 | — | — | ||||||||||||
| Income taxes payable | 27.9 | 2.1 | 0.7 | ||||||||||||
| Accrued payroll and related expenses | (8.8 | ) | — | — | |||||||||||
| Other liabilities | (100.1 | ) | (68.9 | ) | (277.2 | ) | |||||||||
| Net cash provided by (used in) operating activities | (135.2 | ) | (220.0 | ) | 85.7 | ||||||||||
INVESTING ACTIVITIES: | |||||||||||||||
| Purchases of available-for-sale investments | (3,963.3 | ) | (2,592.8 | ) | (3,971.4 | ) | |||||||||
| Purchases of other investments | (7.5 | ) | (1.5 | ) | (46.8 | ) | |||||||||
| Sales of available-for-sale investments | 3,777.0 | 2,679.6 | 3,798.5 | ||||||||||||
| Sales of other investments | 2.2 | — | 38.0 | ||||||||||||
| Acquisitions of businesses, net of cash acquired | (37.1 | ) | (34.4 | ) | (176.9 | ) | |||||||||
| Purchases of property, plant and equipment and licenses | (66.4 | ) | (47.2 | ) | (132.5 | ) | |||||||||
| Proceeds from sale of property, plant and equipment | 36.0 | 28.4 | 9.8 | ||||||||||||
| Other investing activities, net | — | 1.6 | 8.6 | ||||||||||||
| Net cash provided by (used in) investing activities | (259.1 | ) | 33.7 | (472.7 | ) | ||||||||||
FINANCING ACTIVITIES: | |||||||||||||||
| Repayment of debt acquired | (0.2 | ) | (0.8 | ) | (32.8 | ) | |||||||||
| Proceeds from issuance of debt | 462.7 | — | — | ||||||||||||
| Proceeds from issuance of common stock other than in a public offering | 18.8 | 21.4 | 65.1 | ||||||||||||
| Net cash provided by financing activities | 481.3 | 20.6 | 32.3 | ||||||||||||
| Effect of exchange rates on cash and cash equivalents | (1.4 | ) | (4.8 | ) | 4.3 | ||||||||||
| Increase (decrease) in cash and cash equivalents | 85.6 | (170.5 | ) | (350.4 | ) | ||||||||||
| Cash and cash equivalents at beginning of period | 241.9 | 412.4 | 762.8 | ||||||||||||
| Cash and cash equivalents at end of period | $ | 327.5 | $ | 241.9 | $ | 412.4 | |||||||||
| Supplemental disclosure of cash flow information: | |||||||||||||||
| Cash paid for interest | $ | 2.1 | $ | 1.2 | $ | 1.9 | |||||||||
| Cash paid for taxes | 7.0 | 8.0 | 20.3 | ||||||||||||
| Cash received for tax refunds | 43.5 | 83.1 | 121.8 | ||||||||||||
| Non-cash transactions: | |||||||||||||||
| Proceeds from sale of subsidiaries net assets | $ | — | $ | 8.5 | $ | — | |||||||||
| Common stock issued in connection with acquisitions | — | 30.0 | 274.2 | ||||||||||||
| Common stock issued in connection with litigation settlement | — | — | 2.3 | ||||||||||||
| Common stock to be issued in connection with the acquisition of UNL | — | — | 20.9 | ||||||||||||
| Common stock issued in connection with the acquisition of UNL | — | 111.7 | — | ||||||||||||
See accompanying notes to consolidated financial statements.
A-61
JDS UNIPHASE CORPORATION
CONSOLIDATED STATEMENTS OF STOCKHOLDERS’ EQUITY
(in millions)
| Preferred Stock | Common Stock | Common Stock to be Issued | Additional Paid-In Capital | Deferred Compensation | Accumulated Deficit | Accumulated Other Comprehensive Loss | Total | |||||||||||||||||||||||||||||||||
|---|---|---|---|---|---|---|---|---|---|---|---|---|---|---|---|---|---|---|---|---|---|---|---|---|---|---|---|---|---|---|---|---|---|---|---|---|---|---|---|---|
| Shares | Amount | Shares | Amount | |||||||||||||||||||||||||||||||||||||
Balance at June 30, 2001 | 0.1 | $ | — | 1,318.3 | $ | 1.3 | $ | 90.8 | $ | 68,046.8 | $ | (183.6 | ) | $ | (57,224.4 | ) | $ | (24.4 | ) | $ | 10,706.5 | |||||||||||||||||||
| Shares issued under employee stock plans and related tax benefits | — | — | 15.9 | — | — | 85.9 | — | — | — | 85.9 | ||||||||||||||||||||||||||||||
| Common stock issued in connection with: | ||||||||||||||||||||||||||||||||||||||||
| Acquisitions, net of issuance costs | — | — | 36.0 | 0.1 | — | 274.2 | — | — | — | 274.3 | ||||||||||||||||||||||||||||||
| Litigation settlement | — | — | 0.3 | — | — | 2.3 | — | — | — | 2.3 | ||||||||||||||||||||||||||||||
| Common stock to be issued | — | — | — | — | 20.9 | — | — | — | — | 20.9 | ||||||||||||||||||||||||||||||
| Payments on stockholders’ note receivable | — | — | — | — | — | 1.8 | — | — | — | 1.8 | ||||||||||||||||||||||||||||||
| Deferred stock-based compensation related to acquisition | — | — | — | — | — | — | (0.5 | ) | — | — | (0.5 | ) | ||||||||||||||||||||||||||||
| Amortization of deferred compensation | — | — | — | — | — | — | 117.9 | — | — | 117.9 | ||||||||||||||||||||||||||||||
| Reversal of deferred compensation | — | — | — | — | — | (12.0 | ) | 12.0 | — | — | — | |||||||||||||||||||||||||||||
| Net loss | — | — | — | — | — | — | — | (8,738.3 | ) | — | (8,738.3 | ) | ||||||||||||||||||||||||||||
| Change in net unrealized gains on available-for-sale investments | — | — | — | — | — | — | — | — | (2.5 | ) | (2.5 | ) | ||||||||||||||||||||||||||||
| Foreign currency translation adjustment | — | — | — | — | — | — | — | — | 3.1 | 3.1 | ||||||||||||||||||||||||||||||
| Comprehensive loss | — | — | — | — | — | — | — | — | — | (8,737.7 | ) | |||||||||||||||||||||||||||||
Balance at June 30, 2002 | 0.1 | — | 1,370.5 | 1.4 | 111.7 | 68,399.0 | (54.2 | ) | (65,962.7 | ) | (23.8 | ) | 2,471.4 | |||||||||||||||||||||||||||
| Shares issued under employee stock plans and related tax benefits | — | — | 11.9 | — | — | 21.1 | — | — | — | 21.1 | ||||||||||||||||||||||||||||||
| Common stock issued in connection with acquisitions, net of issuance costs | (0.1 | ) | — | 48.9 | — | (111.7 | ) | 141.7 | — | — | — | 30.0 | ||||||||||||||||||||||||||||
| Payments on stockholders’ note receivable | — | — | — | — | — | 0.2 | — | — | — | 0.2 | ||||||||||||||||||||||||||||||
| Deferred stock-based compensation related to acquisition | — | — | — | — | — | — | (0.1 | ) | — | — | (0.1 | ) | ||||||||||||||||||||||||||||
| Amortization of deferred compensation | — | — | — | — | — | — | 47.9 | — | — | 47.9 | ||||||||||||||||||||||||||||||
| Reversal of deferred compensation | — | — | — | — | — | (4.7 | ) | 4.7 | — | — | — | |||||||||||||||||||||||||||||
| Net loss | — | — | — | — | — | — | — | (933.8 | ) | — | (933.8 | ) | ||||||||||||||||||||||||||||
| Change in net unrealized gains on available-for-sale investments | — | — | — | — | — | — | — | — | 25.9 | 25.9 | ||||||||||||||||||||||||||||||
| Foreign currency translation adjustment | — | — | — | — | — | — | — | — | 8.5 | 8.5 | ||||||||||||||||||||||||||||||
| Comprehensive loss | — | — | — | — | — | — | — | — | — | (899.4 | ) | |||||||||||||||||||||||||||||
Balance at June 30, 2003 | — | — | 1,431.3 | 1.4 | — | 68,557.3 | (1.7 | ) | (66,896.5 | ) | 10.6 | 1,671.1 | ||||||||||||||||||||||||||||
| Shares issued under employee stock plans and related tax benefits | — | — | 8.9 | — | — | 19.7 | — | — | — | 19.7 | ||||||||||||||||||||||||||||||
| Restricted stock compensation | — | — | 0.2 | — | — | 0.9 | (0.7 | ) | — | — | 0.2 | |||||||||||||||||||||||||||||
| Amortization of deferred compensation | — | — | — | — | — | — | 1.6 | — | — | 1.6 | ||||||||||||||||||||||||||||||
| Net loss | — | — | — | — | — | — | — | (115.5 | ) | — | (115.5 | ) | ||||||||||||||||||||||||||||
| Change in net unrealized gains on available-for-sale investments | — | — | — | — | — | — | — | — | (8.3 | ) | (8.3 | ) | ||||||||||||||||||||||||||||
| Foreign currency translation adjustment | — | — | — | — | — | — | — | — | 2.3 | 2.3 | ||||||||||||||||||||||||||||||
| Comprehensive loss | — | — | — | — | — | — | — | — | — | (121.5 | ) | |||||||||||||||||||||||||||||
Balance at June 30, 2004 | — | $ | — | 1,440.4 | $ | 1.4 | $ | — | $ | 68,577.9 | $ | (0.8 | ) | $ | (67,012.0 | ) | $ | 4.6 | $ | 1,571.1 | ||||||||||||||||||||
See accompanying notes to consolidated financial statements.
A-62
JDS UNIPHASE CORPORATION
NOTES TO CONSOLIDATED FINANCIAL STATEMENTS
Note 1. Description of Business and Summary of Significant Accounting Policies
Description of Business:
JDS Uniphase Corporation (the “Company”) is a worldwide leader in optical technology. The Company designs and manufactures products for fiberoptic communications, as well as for markets where its core optics technologies provide innovative solutions for industrial, commercial and consumer applications. The Company’s fiberoptic components and modules are deployed by system manufacturers for the telecommunications, data communications, cable television and entertainment industries. The Company also offers products for display, security, medical/environmental instrumentation, decorative, and aerospace and defense applications.
Fiscal Years:
The Company utilizes a 52-53 week fiscal year ending on the Saturday closest to June 30.
The Company’s fiscal 2004 ended on July 3, 2004 and was a 53 week year, whereas fiscal 2003 and 2002 ended on June 28, 2003 and June 29, 2002, respectively and were 52 week years. For comparative presentation purposes, all accompanying consolidated financial statements and notes thereto have been shown as ending on June 30.
Principles of Consolidation:
The consolidated financial statements have been prepared in accordance with accounting principles generally accepted in the United States and include the Company and its wholly-owned subsidiaries. All inter-company accounts and transactions have been eliminated.
Reclassifications:
The following amounts reported in prior years have been reclassified to conform to the current year presentation:
“Note 18. Operating Segment and Geographic Information” — Beginning in fiscal 2004, the Company stopped allocating Global Realignment charges to its segments. In addition, the Company began allocating corporate sales and marketing expenses to the Communications Group. All prior-period amounts have been restated for comparative purposes.
Use of Estimates:
The preparation of the Company’s consolidated financial statements in conformity with U.S. generally accepted accounting principles, requires management to make estimates and assumptions that affect the reported amount of assets and liabilities at the date of the financial statements and the reported amount of net revenue and expenses during the period. The Company bases estimates on historical experience and on various assumptions about the future that are believed to be reasonable based on available information. The Company’s reported financial position or results of operations may be materially different under different conditions or when using different estimates and assumptions, particularly with respect to significant accounting policies, which are discussed below. In the event that estimates or assumption prove to differ from actual results, adjustments are made in subsequent periods to reflect more current information.
Cash and Cash Equivalents:
The Company considers treasury bills, commercial paper and money market instruments and funds with original maturities of 90 days or less at the time of purchase to be cash equivalents.
A-63
JDS UNIPHASE CORPORATION
NOTES TO CONSOLIDATED FINANCIAL STATEMENTS — (Continued)
Investments:
The Company’s investments in debt securities and marketable equity securities are classified as available-for-sale investments or trading assets and are recorded at fair value. The cost of securities sold is based on the specific identification method. Unrealized gains and losses on available-for-sale investments, net of tax, are reported as a separate component of stockholders’ equity. Gains or losses on trading assets resulting from changes in fair value are recognized currently in earnings. The Company also has certain minority investments in privately held companies. These investments are generally carried at cost and are classified as long-term investments.
The Company accounts for investments in joint ventures, limited liability partnerships and other investments in 50% or less owned companies over which it has the ability to exercise significant influence using the equity method of accounting. The Company accounts for the increase or decrease of its proportionate share of net book value in equity basis investments from the investees’ issuance of stock at a price above or below the net book value per share as a change to the investees’ additional paid-in capital. Due to the limited availability of timely data, the Company records the adjustments to its equity basis investments in the quarter subsequent to the issued financial statements.
The Company periodically reviews these investments for impairment. In the event the carrying value of an investment exceeds its fair value and the decline in fair value is determined to be other-than-temporary, the Company writes down the value of the investment to its fair value. The Company generally believes an other-than-temporary decline occurs when the fair value of an investment is below the carrying value for two full consecutive quarters.
Fair Value of Financial Instruments:
The carrying amounts of certain of the Company’s financial instruments, including cash and cash equivalents, accounts receivable, accounts payable, accrued compensation and other accrued liabilities, approximate fair value because of their short maturities. Fair value for investments in public companies is determined using quoted market prices for those securities. Fair value for investments in privately held companies is estimated based upon one or more of the following: assessment of the investees’ historical and forecasted financial condition, operating results and cash flows, the values of recent rounds of financing, or quoted market prices of comparable public companies.
Accounts receivable:
The Company recognizes allowances for doubtful accounts to ensure accounts receivable are not overstated due to the inability or unwillingness of its customers to make required payments. In addition, bad debt reserves are maintained for all customers based on certain percentages of aged receivable. If circumstances related to customers change, estimates of the recoverability of receivables would be adjusted. The Company classifies bad debt expenses as selling, general and administrative expenses.
Inventories:
Inventories are stated at the lower of cost or market. Cost is computed using standard cost, which approximates actual cost on a first-in, first-out basis.
Property, Plant and Equipment:
Property, plant and equipment is stated at cost. Depreciation is computed by the straight-line method over the following estimated useful lives of the assets: 5 to 40 years for building and improvements, 2 to 10 years for machinery and equipment, and 2 to 5 years for furniture, fixtures and office equipment. Leasehold improvements are amortized by the straight-line method over the shorter of the estimated useful lives of the assets or the term of the lease.
The Company capitalized certain costs related to the purchase and implementation of its Enterprise Resource Planning (“ERP”) software. During fiscal 2002, the Company changed its policy on the amortization period of the
A-64
JDS UNIPHASE CORPORATION
NOTES TO CONSOLIDATED FINANCIAL STATEMENTS — (Continued)
capitalized costs from 5 years to 7 years to reflect the change in expected useful lives of such assets. The change in the amortization period resulted in a decrease in depreciation expense of approximately $1.6 million during both fiscal 2004 and fiscal 2003.
Goodwill:
Goodwill represents the excess of the purchase price of an acquired enterprise or assets over the fair value of the identifiable assets acquired and liabilities assumed. Commencing July 1, 2002, the Company no longer amortizes goodwill, but tests for impairment of goodwill on an annual basis and at any other time if events occur or circumstances indicate that the carrying amount of goodwill may not be recoverable (see “Note 12. Reduction of Goodwill”).
Circumstances that could trigger an impairment test include but are not limited to: a significant adverse change in the business climate or legal factors; an adverse action or assessment by a regulator; unanticipated competition; loss of key personnel; the likelihood that a reporting unit or significant portion of a reporting unit will be sold or otherwise disposed; results of testing for recoverability of a significant asset group within a reporting unit; and recognition of a goodwill impairment loss in the financial statements of a subsidiary that is a component of a reporting unit.
If the carrying amount of the reporting unit goodwill exceeds the implied fair value of that goodwill, an impairment loss is recorded in net income (loss). Measurement of the fair value of a reporting unit is based on one or more of the following fair value measures including: amounts at which the unit as a whole could be bought or sold in a current transaction between willing parties; using present value techniques of estimated future cash flows; or using valuation techniques based on multiples of earnings or revenue, or a similar performance measure.
Other Intangible Assets:
Other intangible assets consist primarily of intellectual property acquired and purchased intangible assets. Purchased intangible assets primarily include existing and core technology, trademarks and trade names, and customer base. Other intangible assets are amortized using the straight-line method over estimated useful lives ranging from 1 to 15 years.
Impairment or disposal of long-lived assets (plant and equipment and intangible assets):
Long-lived assets held and used:
The Company tests long-lived assets or asset groups for recoverability when events or changes in circumstances indicate that their carrying amount may not be recoverable. Circumstances which could trigger a review include, but are not limited to: significant decreases in the market price of the asset; significant adverse changes in the business climate or legal factors; accumulation of costs significantly in excess of the amount originally expected for the acquisition or construction of the asset; current period cash flow or operating losses combined with a history of losses or a forecast of continuing losses associated with the use of the asset; and current expectation that the asset will more likely than not be sold or disposed significantly before the end of its estimated useful life (see “Note 13. Reduction of Other Long-Lived Assets”).
Recoverability is assessed based on the carrying amount of the asset and its fair value which is generally determined based on the sum of the undiscounted cash flows expected to result from the use and the eventual disposal of the asset, as well as specific appraisal in certain instances. An impairment loss is recognized when the carrying amount is not recoverable and exceeds fair value.
A-65
JDS UNIPHASE CORPORATION
NOTES TO CONSOLIDATED FINANCIAL STATEMENTS — (Continued)
Long-lived assets held for sale:
Long-lived assets are classified as held for sale when certain criteria are met, which include: management commitment to a plan to sell the assets; the availability of the assets for immediate sale in their present condition; an active program to locate buyers and other actions to sell the assets has been initiated; whether the sale of the assets is probable and their transfer is expected to qualify for recognition as a completed sale within one year; whether the assets are being marketed at reasonable prices in relation to their fair value; and how unlikely it is that significant changes will be made to the plan to sell the assets (see “Note 13. Reduction of Other Long-Lived Assets”).
The Company measures long-lived assets to be disposed of by sale at the lower of carrying amount and fair value less cost to sell. Fair value is determined using quoted market prices or the anticipated cash flows discounted at a rate commensurate with the risk involved.
Post-employment Benefits:
Post-employment benefits accrued for workforce reductions related to restructuring activities initiated after December 31, 2002 are accounted for under Statement of Financial Accounting Standards (SFAS) No.112, “Employer’s Accounting for Post-employment Benefits.” A liability for post-employment benefits is recorded when payment is probable, the amount is reasonably estimable, and the obligation relates to rights that have vested or accumulated.
Concentration of Credit and Other Risks and Allowance for Doubtful Accounts:
Financial instruments that potentially subject the Company to concentrations of credit risk consist primarily of cash equivalents, short-term investments and trade receivables. The Company places its cash equivalents and short-term investments with high credit-quality financial institutions. The Company invests its excess cash primarily in money market funds, agency bonds, corporate bonds, auction instruments and municipal bonds. The Company has established guidelines relative to credit ratings, diversification and maturities that seek to maintain safety and liquidity.
The Company performs credit evaluations of its customers’ financial condition and generally does not require collateral from its customers. These evaluations require significant judgment and are based on a variety of factors including, but not limited to, current economic trends, historical payment and bad debt write-off experience.
The Company maintains an allowance for doubtful accounts for estimated losses resulting from the inability or unwillingness of its customers to make required payments. When the Company becomes aware that a specific customer is unable or unwilling to meet its financial obligations, the Company records a specific allowance to reflect the level of credit risk in the customer’s outstanding receivable balance. In addition, the Company records additional allowances based on certain percentages of aged receivable balances. The Company classifies bad debt expenses as selling, general and administrative expenses.
The Company is not able to predict changes in the financial stability of its customers. Any material change in the financial status of any one or a group of customers could have a material adverse effect on the Company’s results of operations and financial condition. Although such losses have been within management’s expectations to date, there can be no assurance that such allowances will continue to be adequate. At June 30, 2004 and 2003, SICPA accounted for 12% of the Company’s gross accounts receivable.
The Company depends on a limited number of contract manufacturers, and subcontractors, and suppliers for raw materials, packages and standard components. The Company generally purchases these single or limited source products through standard purchase orders or one-year supply agreements and has no long-term guaranteed supply agreements with such suppliers. While the Company seeks to maintain a sufficient safety stock of such products and also endeavors to maintain ongoing communications with its suppliers to guard against interruptions or cessation of supply, the Company’s business and results of operations could be adversely affected by a stoppage or delay
A-66
JDS UNIPHASE CORPORATION
NOTES TO CONSOLIDATED FINANCIAL STATEMENTS — (Continued)
of supply, substitution of more expensive or less reliable products, receipt of defective parts or contaminated materials, an increase in the price of such supplies, or the Company’s inability to obtain reduced pricing from its suppliers in response to competitive pressures.
The Company generally uses a rolling six or twelve month forecast based on anticipated product orders, customer forecasts, product order history and backlog to determine its material requirements. Lead times for the parts and components that the Company orders vary significantly and depend on factors such as the specific supplier, contract terms and demand for a component at a given time. If actual orders do not match our forecasts, the Company may have excess or shortfalls of some materials and components as well as excess inventory purchase commitments. The Company could experience reduced or delayed product shipments or incur additional inventory write-downs and cancellation charges or penalties, which would increase costs and could have a material adverse impact on the Company’s results of operations.
Foreign Currency Translation and Exchange Contracts:
The Company recognizes all derivatives on the balance sheets at fair value. Derivatives that are not hedges are adjusted to fair value through income. If the derivative is a hedge, depending on the nature of the hedge, changes in the fair value of the derivatives will either be offset against the change in fair value of the hedged assets, liabilities or firm commitments through earnings, or recognized in other comprehensive income until the hedged item is recognized in earnings. The change in a derivative’s fair value related to the ineffective portion of a hedge, if any, will be immediately recognized in earnings.
The Company’s objectives and strategies for holding derivatives are to minimize the transaction and translation risks associated with non-functional currency transactions. The Company does not use derivatives for trading purposes.
The Company conducts its business and sells its products directly to customers primarily in North America, Europe and Asia. In the normal course of business, the Company’s financial position is routinely subject to market risks associated with foreign currency rate fluctuations due to balance sheet positions in other local foreign currencies. The Company’s policy is to ensure that business exposures to foreign exchange risks are identified measured and minimized using foreign currency forward contracts to reduce such risks. The foreign currency forward contracts generally expire within 40 days. The change in fair value of these foreign currency forward contracts is recorded as income/loss in the Company’s Consolidated Statements of Operations as a component of interest and other income (net). At June 30, 2004, the face value of these foreign currency forward contracts was $35.5 million and the change in fair value of such contracts was not material to the Company’s financial statements.
Revenue Recognition:
The Company recognizes revenue when persuasive evidence of a final agreement exists, delivery has occurred, the selling price is fixed or determinable and collectibility is reasonably assured. Revenue recognition on the shipment of evaluation units is deferred until customer acceptance. Revenue from sales to distributors with rights of return, price protection or stock rotation is not recognized until the products are sold through to end customers. Generally, revenue associated with contract cancellation payments from customers is not recognized until the Company receives payment for such charges. The Company records provisions against its gross revenue for estimated product returns and allowances in the period when the related revenue is recorded.
Shipping and Handling Costs:
The Company records costs related to shipping and handling in cost of sales for all periods presented.
Advertising Expense:
The Company expenses advertising costs as incurred. Advertising costs totaled $0.8 million in fiscal 2004, $1.0 million in fiscal 2003, and $1.4 million in fiscal 2002.
A-67
JDS UNIPHASE CORPORATION
NOTES TO CONSOLIDATED FINANCIAL STATEMENTS — (Continued)
Stock-Based Compensation:
The Company accounts for stock-based compensation in accordance with Accounting Principles Board (“APB”) Opinion No. 25, “Accounting for Stock Issued to Employees,” as interpreted by Financial Accounting Standards Board Interpretation (FIN) No. 44 (“FIN No. 44”), “Accounting for Certain Transactions Involving Stock Compensation.” The Company records and amortizes, over the related vesting periods on a straight-line basis, deferred compensation representing the difference between the price per share of stock issued or the exercise price of stock options granted and the fair value of the Company’s common stock at the time of issuance or grant. Stock compensation costs are immediately recognized to the extent the exercise price is below the fair value on the date of grant and no future vesting criteria exist.
The following table illustrates the effect on net income and earnings per share if the Company had applied the fair value recognition provisions of SFAS No. 123, “Accounting for Stock-Based Compensation,” as amended, to options granted under the stock option plans and rights to acquire stock granted under the Company’s 2003 Equity Incentive Plan (see “Note 10. Stockholders’ Equity”). For purposes of pro forma disclosures, the estimated fair value of the options is amortized over the options’ vesting period. The Company’s pro forma information was as follows (in millions, except per share data):
| Years Ended June 30, | |||||||||||||||
|---|---|---|---|---|---|---|---|---|---|---|---|---|---|---|---|
| 2004 | 2003 | 2002 | |||||||||||||
| Reported net loss | $ | (115.5 | ) | $ | (933.8 | ) | $ | (8,738.3 | ) | ||||||
| Add Stock-based compensation expense included in reported net loss, net of tax | 1.8 | 50.9 | 124.9 | ||||||||||||
| Less Pro forma stock-based compensation expense determined under the fair value based method, net of tax | (300.0 | ) | (685.2 | ) | (688.9 | ) | |||||||||
| Pro forma net loss | $ | (413.7 | ) | $ | (1,568.1 | ) | $ | (9,302.3 | ) | ||||||
| Reported net loss per share — basic and diluted | $ | (0.08 | ) | $ | (0.66 | ) | $ | (6.50 | ) | ||||||
| Pro forma net loss per share — basic and diluted | $ | (0.29 | ) | $ | (1.10 | ) | $ | (6.92 | ) | ||||||
Please refer to “Note 10. Stockholders’ Equity” for additional information on the assumptions used in the option pricing model.
Comprehensive Income (Loss):
The Company’s accumulated other comprehensive income (loss) consists of the accumulated net unrealized gains or losses on available-for-sale investments and foreign currency translation adjustments. At June 30, 2004 and 2003, the Company had a balance of net unrealized gains of $21.0 million and $29.2 million, respectively, on available-for-sale investments. Additionally, at June 30, 2004 and June 30, 2003, the Company had $16.4 million and $18.6 million, respectively, of foreign currency translation losses.
The components of comprehensive loss were as follows (in millions):
| Years Ended June 30, | |||||||||||||||
|---|---|---|---|---|---|---|---|---|---|---|---|---|---|---|---|
| 2004 | 2003 | 2002 | |||||||||||||
| Net loss | $ | (115.5 | ) | $ | (933.8 | ) | $ | (8,738.3 | ) | ||||||
| Other comprehensive income: | |||||||||||||||
| Net change in cumulative translation adjustment | 2.3 | 8.5 | 3.1 | ||||||||||||
| Net change in unrealized gains (losses) on investments, net of taxes of $7.8, $6.9 and $2.2 in fiscal 2004, 2003 and 2002, respectively | (8.3 | ) | 25.9 | (2.5 | ) | ||||||||||
| Net change in other comprehensive income | (6.0 | ) | 34.4 | 0.6 | |||||||||||
| Comprehensive loss | $ | (121.5 | ) | $ | (899.4 | ) | $ | (8,737.7 | ) | ||||||
A-68
JDS UNIPHASE CORPORATION
NOTES TO CONSOLIDATED FINANCIAL STATEMENTS — (Continued)
Cumulative Effect of an Accounting Change:
During the first quarter of fiscal 2004, the Company adopted FIN 46R, “Consolidation of Variable Interest Entities an Interpretation of ARB No. 51,” with respect to a synthetic lease agreement pertaining to two separate properties. The arrangement was a variable interest entity as defined under FIN 46R and the Company was the primary beneficiary.
As a result, the Company recognized a non-cash accounting change adjustment of $2.9 million, reflecting cumulative depreciation on the two properties from the inception of the lease until the assets were purchased by the Company on September 16, 2003, as a cumulative effect of an accounting change in the accompanying Consolidated Statements of Operations.
Net Loss Per Share:
As the Company incurred net losses in fiscal 2004, 2003 and 2002, the effect of dilutive securities totaling 8.5 million, 4.3 million and 48.5 million equivalent shares, respectively, has been excluded from the diluted net loss per share computation as it was antidilutive.
The following table sets forth the computation of basic and diluted net loss per share (in millions, except per share data):
| Years Ended June 30, | |||||||||||||||
|---|---|---|---|---|---|---|---|---|---|---|---|---|---|---|---|
| 2004 | 2003 | 2002 | |||||||||||||
| Numerator: | |||||||||||||||
| Net loss | $ | (115.5 | ) | $ | (933.8 | ) | $ | (8,738.3 | ) | ||||||
| Denominator: | |||||||||||||||
| Weighted-average number of common shares outstanding | 1,436.7 | 1,419.7 | 1,344.3 | ||||||||||||
| Net loss per share — basic and diluted | $ | (0.08 | ) | $ | (0.66 | ) | $ | (6.50 | ) | ||||||
Note 2. Recent Accounting Pronouncements
EITF No. 03-1
In March 2004, the Financial Accounting Standards Board (FASB) approved the consensus reached on the Emerging Issues Task Force (EITF) Issue No. 03-1, “The Meaning of Other-Than-Temporary Impairment and Its Application to Certain Investments.” The objective of this Issue is to provide guidance for identifying impaired investments. EITF 03-1 also provides new disclosure requirements for investments that are deemed to be temporarily impaired. The accounting provisions of EITF 03-1 are effective for all reporting periods beginning after June 15, 2004, while the disclosure requirements are effective only for annual periods ending after June 15, 2004. The Company has evaluated the impact of the adoption of EITF 03-1 and does not believe the impact is significant to the company’s overall results of operations or financial position.
SFAS No. 150:
In May 2003, the FASB issued SFAS No. 150, “Accounting for Certain Financial Instruments with Characteristics of Both Liabilities and Equity.” SFAS No. 150 requires companies to classify and measure certain financial instruments with characteristics of both liabilities and equity. It requires that an issuer classify a financial instrument that requires a transfer of assets and that meets the definition of liabilities in Concepts Statement 6 and other recognition criteria in SFAS No. 5, “Recognition and Measurement in Financial Statements of Business Enterprises,” be reported as a liability. SFAS No. 150 also requires that certain obligations that could be settled by issuance of an entity’s equity but lack other characteristics of equity be reported as liabilities even though the
A-69
JDS UNIPHASE CORPORATION
NOTES TO CONSOLIDATED FINANCIAL STATEMENTS — (Continued)
obligation does not meet the definition of liabilities in Concepts Statement No. 6. SFAS No. 150 is effective for financial instruments entered into or modified after May 31, 2003, and otherwise is effective for periods beginning after June 15, 2003. The adoption of SFAS No. 150 did not have a material effect on our consolidated financial position, results of operations or cash flows.
SFAS No. 142:
In July 2001, the FASB issued SFAS No. 142, “Goodwill and Other Intangible Assets,” under which goodwill and other purchased intangibles with indefinite useful lives are no longer amortized but are reviewed for impairment annually, or more frequently if certain events or changes in circumstances indicate that the carrying value may not be recoverable. Purchased intangibles with finite useful lives continue to be amortized over their useful lives and are reviewed for impairment in accordance with SFAS No. 144, “Accounting for the Impairment or Disposal of Long-Lived Assets.”
The Company adopted SFAS No. 142 on July 1, 2002. In conjunction with the implementation of SFAS No. 142, the Company completed the transitional impairment review related to the carrying value of goodwill as of July 1, 2002 and determined that there was no impairment beyond amounts previously recorded as of that date.
A reconciliation of the reported net loss and net loss per share to the amounts adjusted for the exclusion of amortization of: (i) goodwill from acquisitions; (ii) equity method goodwill related to ADVA (see “Note 3. Balance Sheet Details”); and (iii) assembled workforce, net of the related tax effect, was as follows (in millions, except per share data):
| Years Ended June 30, | |||||||||||||||
|---|---|---|---|---|---|---|---|---|---|---|---|---|---|---|---|
| 2004 | 2003 | 2002 | |||||||||||||
| Reported net loss | $ | (115.5 | ) | $ | (933.8 | ) | $ | (8,738.3 | ) | ||||||
| Add back: | |||||||||||||||
| Amortization of: | |||||||||||||||
| Goodwill from acquisitions | — | — | 937.5 | ||||||||||||
| Equity method goodwill related to ADVA | — | — | 0.7 | ||||||||||||
| Assembled workforce | — | — | 12.5 | ||||||||||||
| Income tax expense | — | — | (32.1 | ) | |||||||||||
| Adjusted net loss | $ | (115.5 | ) | $ | (933.8 | ) | $ | (7,819.7 | ) | ||||||
| Reported net loss per share — basic and diluted | $ | (0.08 | ) | $ | (0.66 | ) | $ | (6.50 | ) | ||||||
| Adjusted net loss per share — basic and diluted | $ | (0.08 | ) | $ | (0.66 | ) | $ | (5.82 | ) | ||||||
FASB Interpretation No. 46R:
In December 2003, the FASB issued revised Interpretation No. 46 (“FIN 46R”), “Consolidation of Variable Interest Entities, an Interpretation of ARB No. 51,” which was originally issued in January 2003. FIN 46R requires an investor who absorbs the majority of the expected losses, receives a majority of its expected returns, or both, (primary beneficiary) of a variable interest entity (“VIE”) to consolidate the assets, liabilities and results of operations of the entity. A variable interest entity is an entity in which the equity investors do not have a controlling interest or the equity investment at risk is insufficient to finance the entity’s activities without receiving additional subordinated financial support from other parties. FIN 46R, as amended, was applicable for public companies that have interests in VIEs or potential variable entities commonly referred to as special-purpose entities (“SPE’s”) for periods ending after December 15, 2003. Application by public entities for all other types of entities is required in financial statements for periods ending after March 15, 2004. Interests held in VIE’s created after January 31, 2003 are subject to the provisions of FIN 46R from the date of the Company’s initial involvement with that entity.
During the first quarter of fiscal 2004, the Company adopted the provisions of FIN 46R with respect to a master lease agreement with a special purpose entity (the “Lessor”) pertaining to two properties for facilities located in
A-70
JDS UNIPHASE CORPORATION
NOTES TO CONSOLIDATED FINANCIAL STATEMENTS — (Continued)
Melbourne, Florida and Raleigh, North Carolina. The Company exercised its option to purchase these properties on September 16, 2003, and paid the Lessor $44.7 million in cash. Prior to purchasing the properties, in connection with the Company’s restructuring activities, the Company had recorded impairment charges of $15.5 million related to the Raleigh, North Carolina properties. In addition, the Company accrued an impairment loss of $6.9 million related to the Melbourne, Florida properties, which the Company was amortizing over the original term of the lease. As a result of the purchase of the properties and in conjunction with the adoption of FIN 46R, the Company recognized $44.7 million of additions to property, plant and equipment, reduced by the $15.5 million impairment charge and recognized the remaining accrued impairment loss of $5.0 million (see “Note 13. Reduction of Other Long-Lived Assets”) as a deferred impairment charge and a non-cash cumulative effect of an accounting change adjustment of $2.9 million (see “Note 1. Description of Business and Summary of Significant Accounting Policies”). No other variable interests required consolidation of the related VIE’s nor were they material to the Company’s financial position.
The Company has reviewed its cost and equity method investments and other variable interests to determine whether those entities are variable interest entities and, if so, if the Company is the primary beneficiary of any of its investee companies. At June 30, 2004, the Company had 21 cost and equity method investments primarily in privately held companies and venture funds that have the potential to provide strategic technologies and relationships to the Company’s businesses. The Company has determined that its equity investments, which are not material to the Company’s financial position, do not require consolidation as they are either not variable interest entities or in the event that they are variable interest entities, the Company is not considered to be the primary beneficiary. The Company’s maximum exposure to loss for these investments at June 30, 2004 is limited to the carrying amount of its investment of $32.6 million in such entities and its minimum funding commitments of $16.0 million.
Note 3. Balance Sheet Details
Inventories:
The components of inventories were as follows (in millions):
| June 30, | |||||||||||
|---|---|---|---|---|---|---|---|---|---|---|---|
| 2004 | 2003 | ||||||||||
| Finished goods | $ | 23.3 | $ | 22.9 | |||||||
| Work in process | 41.6 | 32.8 | |||||||||
| Raw materials and purchased parts | 60.1 | 28.4 | |||||||||
| Total inventories | $ | 125.0 | $ | 84.1 | |||||||
During fiscal 2004, 2003 and 2002, the Company recorded write-downs of inventories of $29.8 million, $60.1 million and $203.9 million, respectively, and losses on purchase commitments of $0, $7.4 million and $15.1 million, respectively.
A-71
JDS UNIPHASE CORPORATION
NOTES TO CONSOLIDATED FINANCIAL STATEMENTS — (Continued)
Property, Plant and Equipment, Net:
The components of property, plant and equipment were as follows (in millions):
| June 30, | |||||||||||
|---|---|---|---|---|---|---|---|---|---|---|---|
| 2004 | 2003 | ||||||||||
| Land | $ | 20.4 | $ | 21.4 | |||||||
| Buildings and improvements | 27.4 | 92.8 | |||||||||
| Machinery and equipment | 213.8 | 247.2 | |||||||||
| Furniture, fixtures, software and office equipment | 71.5 | 85.1 | |||||||||
| Leasehold improvements | 46.3 | 31.3 | |||||||||
| Construction in progress | 19.6 | 37.5 | |||||||||
| 399.0 | 515.3 | ||||||||||
| Less: accumulated depreciation | (203.4 | ) | (231.9 | ) | |||||||
| Total property, plant and equipment, net | $ | 195.6 | $ | 283.4 | |||||||
During fiscal 2004, 2003, and 2002, the Company recorded $51.8 million, $99.3 million and $375.5 million respectively, of reductions in the carrying value of property, plant and equipment as a result of impairment analyses performed in accordance with SFAS No. 144, “Accounting for the Impairment or Disposal of Long-Lived Assets” for fiscal 2004 and 2003, and in accordance with SFAS No. 121, “Accounting for the Impairment of Long-Lived Assets and for Long-Lived Assets to be Disposed of” for fiscal 2002 (see “Note 13. Reduction of Other Long-Lived Assets”), excluding asset write-downs associated with the Global Realignment Program.
Other Current Liabilities:
The components of other current liabilities were as follows (in millions):
| June 30, | |||||||||||
|---|---|---|---|---|---|---|---|---|---|---|---|
| 2004 | 2003 | ||||||||||
| Deferred revenue | $ | 10.2 | $ | 17.2 | |||||||
| Deferred compensation plan | 7.2 | — | |||||||||
| Accrued expenses | 56.5 | 59.5 | |||||||||
| Losses on purchase commitments | — | 8.7 | |||||||||
| Other | 6.8 | 6.8 | |||||||||
| Total other current liabilities | $ | 80.7 | $ | 92.2 | |||||||
Note 4. Investments
Available-For-Sale Investments:
The Company’s investments in debt securities and marketable equity securities were primarily classified as available-for-sale investments.
A-72
JDS UNIPHASE CORPORATION
NOTES TO CONSOLIDATED FINANCIAL STATEMENTS — (Continued)
At June 30, 2004, the Company’s available-for-sale investments were as follows (in millions):
| Amortized Cost | Gross Unrealized Gains | Gross Unrealized Losses | Estimated Fair Value | |||||||||||||||
|---|---|---|---|---|---|---|---|---|---|---|---|---|---|---|---|---|---|---|
| Debt investments: | ||||||||||||||||||
| U.S. Treasuries & Agencies | $ | 738.0 | $ | 0.1 | $ | (4.3 | ) | $ | 733.8 | |||||||||
| Municipal bonds & sovereign debt instruments | 50.9 | — | (0.3 | ) | 50.6 | |||||||||||||
| Auction instruments | 64.5 | — | — | 64.5 | ||||||||||||||
| Asset-backed securities | 38.9 | — | (0.2 | ) | 38.7 | |||||||||||||
| Corporate bonds | 431.8 | 0.2 | (2.0 | ) | 430.0 | |||||||||||||
| Total debt investments | 1,324.1 | 0.3 | (6.8 | ) | 1,317.6 | |||||||||||||
| Money market instruments and funds | 78.8 | — | — | 78.8 | ||||||||||||||
| Marketable equity investments | 26.4 | 45.0 | (0.5 | ) | 70.9 | |||||||||||||
| Total available-for-sale investments | $ | 1,429.3 | $ | 45.3 | $ | (7.3 | ) | $ | 1,467.3 | |||||||||
Of the total estimated fair value, $253.3 million was classified as cash equivalents and $1,214.0 million was classified as short-term investments in the Company’s Consolidated Balance Sheet.
An additional $7.2 million of short-term investments representing assets of a deferred compensation plan are classified as trading securities.
At June 30, 2004, the Company’s short-term investments classified as trading assets were as follows (in millions):
| Amortized Cost | Gross Unrealized Gains | Gross Unrealized Losses | Estimated Fair Value | |||||||||||||||
|---|---|---|---|---|---|---|---|---|---|---|---|---|---|---|---|---|---|---|
| Debt investments: | ||||||||||||||||||
| U.S. Treasuries & Agencies | $ | 0.2 | $ | 0.0 | $ | — | $ | 0.2 | ||||||||||
| Total debt investments | 0.2 | 0.0 | — | 0.2 | ||||||||||||||
| Money market instruments and funds | 0.6 | 0.0 | — | 0.6 | ||||||||||||||
| Marketable equity investments | 5.7 | 0.7 | — | 6.4 | ||||||||||||||
| Total trading assets classified as short-term investments | $ | 6.5 | $ | 0.7 | $ | — | $ | 7.2 | ||||||||||
At June 30, 2003, the Company’s available-for-sale investments were as follows (in millions):
| Amortized Cost | Gross Unrealized Gains | Gross Unrealized Losses | Estimated Fair Value | |||||||||||||||
|---|---|---|---|---|---|---|---|---|---|---|---|---|---|---|---|---|---|---|
| Debt investments: | ||||||||||||||||||
| Floating rate bonds | $ | 43.4 | $ | — | $ | — | $ | 43.4 | ||||||||||
| Municipal bonds & sovereign debt instruments | 36.0 | 0.4 | — | 36.4 | ||||||||||||||
| Auction instruments | 160.3 | — | — | 160.3 | ||||||||||||||
| Corporate bonds | 175.2 | 3.2 | — | 178.4 | ||||||||||||||
| Agency bonds | 497.4 | 2.3 | (0.1 | ) | 499.6 | |||||||||||||
| Total debt investments | 912.3 | 5.9 | (0.1 | ) | 918.1 | |||||||||||||
| Money market instruments and funds | 87.7 | — | — | 87.7 | ||||||||||||||
| Marketable equity investments | 41.4 | 33.0 | (0.2 | ) | 74.2 | |||||||||||||
| Total available-for-sale investments | $ | 1,041.4 | $ | 38.9 | $ | (0.3 | ) | $ | 1,080.0 | |||||||||
Of the total estimated fair value, $87.8 million was classified as cash equivalents and $992.2 million was classified as short-term investments in the Company’s Consolidated Balance Sheet.
A-73
JDS UNIPHASE CORPORATION
NOTES TO CONSOLIDATED FINANCIAL STATEMENTS — (Continued)
At June 30, 2004, contractual maturities of the Company’s debt investments were as follows (in millions):
| Amortized Cost | Estimated Fair Value | |||||||||
|---|---|---|---|---|---|---|---|---|---|---|
| Amounts maturing in less than 1 year | $ | 344.3 | $ | 344.3 | ||||||
| Amounts maturing in 1–3 years | 971.5 | 965.0 | ||||||||
| Total debt investments | $ | 1,315.8 | $ | 1,309.3 | ||||||
The Company’s marketable equity investments consisted primarily of shares of Nortel common stock. During fiscal 2001, the Company completed the sale of its Zurich, Switzerland subsidiary to Nortel for 65.7 million shares of Nortel common stock. During fiscal 2004, the Company sold 10.3 million shares of Nortel common stock for total proceeds of $53.7 million resulting in a realized gain of $38.8 million. No shares were sold during fiscal 2003. As of June 30, 2004, the Company held 14.4 million shares of Nortel common stock with fair value of $65.6 million. As of June 30, 2003, the Company held 24.7 million shares with a fair value of $67.4 million.
Long-Term Investments:
The components of the Company’s long-term investment were as follows (in millions):
| June 30, | |||||||||||
|---|---|---|---|---|---|---|---|---|---|---|---|
| 2004 | 2003 | ||||||||||
| Non-marketable cost method investments | $ | 16.5 | $ | 18.9 | |||||||
| Non-marketable equity method investments | 16.1 | 17.5 | |||||||||
| Marketable securities | 9.8 | 11.1 | |||||||||
| Total long-term investments | $ | 42.4 | $ | 47.5 | |||||||
The Company’s long-term investments described as marketable securities consist primarily of restricted cash investments held as security for the Company’s workers compensation liabilities and for a leased building in Shenzhen, China.
Reductions in Fair Value of Investments:
The Company regularly evaluates the carrying value of its investments. When the carrying value of an investment exceeds the fair value and the decline in fair value is deemed to be other-than-temporary, the Company writes down the value of the investment to its fair value. The Company has the intent and ability to hold investments to maturity when a decline in fair value is deemed not to be other-than-temporary. During fiscal 2004, 2003 and 2002, the Company recorded $3.8 million, $45.4 million and $225.8 million, respectively, of other-than-temporary reductions in fair value of the Company’s available-for-sale and non-marketable equity investments. Details of the other-than-temporary reductions were as follows (in millions):
| Years Ended June 30, | |||||||||||||||
|---|---|---|---|---|---|---|---|---|---|---|---|---|---|---|---|
| 2004 | 2003 | 2002 | |||||||||||||
| Available-for-sale investments: | |||||||||||||||
| Nortel common stock | $ | — | $ | — | $ | 187.3 | |||||||||
| Other | 0.4 | — | 9.6 | ||||||||||||
| Non-marketable equity investments: | |||||||||||||||
| Adept Technology (“Adept”) | — | 25.0 | — | ||||||||||||
| Other | 3.4 | 20.4 | 28.9 | ||||||||||||
| Total reductions in fair value of investments | $ | 3.8 | $ | 45.4 | $ | 225.8 | |||||||||
During fiscal 2002, the Company entered into an automation development alliance agreement with Adept (see “Note 16. Related Party Transacations”). In connection with this alliance, the Company invested $25.0 million in Adept’s convertible preferred stock. During fiscal 2003, the Company determined that the decline in fair value of its Adept investment was other-than-temporary and wrote the investment down to zero.
A-74
JDS UNIPHASE CORPORATION
NOTES TO CONSOLIDATED FINANCIAL STATEMENTS — (Continued)
As of June 30, 2004, the Company had a 27% ownership in ADVA, a publicly traded German company that develops and manufactures fiberoptic components and products. During fiscal 2004, 2003 and 2002, under the equity method, the Company recorded $0, $0 and $26.5 million, respectively, as its pro rata share of ADVA’s net losses. During the second quarter of fiscal 2002, the Company reduced the carrying amount of its investment in ADVA to $0. The Company has no commitment to provide additional funding therefore no further pro rata share of ADVA’s net loss has been recorded. Should ADVA report net income in future periods, the Company will resume applying the equity method after its pro rata share of ADVA’s net income exceeds its pro rata share of ADVA’s net loss during the periods the equity method was suspended.
Should the fair value of the Company’s investments continue to decline in future periods, the Company may be required to record additional charges if the decline is determined to be other-than-temporary.
Note 5. Goodwill
The following table presents the changes in goodwill allocated to the reportable segments (in millions):
| Communications Products Group | Commercial and Consumer Products Group(1) | Total | ||||||||||||
|---|---|---|---|---|---|---|---|---|---|---|---|---|---|---|
| Balance as of June 30, 2001 | $ | 4,680.2 | $ | 650.4 | $ | 5,330.6 | ||||||||
| Amortization | (871.3 | ) | (66.2 | ) | (937.5 | ) | ||||||||
| Acquisitions (see Note 17): | ||||||||||||||
| Scion | 21.9 | — | 21.9 | |||||||||||
| Datacom | 214.9 | — | 214.9 | |||||||||||
| SFAS No. 121 impairment charges (see Note 12) | (3,780.8 | ) | (580.0 | ) | (4,360.8 | ) | ||||||||
| Purchase price adjustment related to the achievement of milestones | 26.9 | 36.2 | 63.1 | |||||||||||
| Balance as of June 30, 2002 | $ | 291.8 | $ | 40.4 | $ | 332.2 | ||||||||
| Assembled workforce reclassified as goodwill | 8.6 | 2.2 | 10.8 | |||||||||||
| Acquisitions (see Note 17): | ||||||||||||||
| OptronX’s transceiver/transponder unit | 5.1 | — | 5.1 | |||||||||||
| Datacom | (2.7 | ) | — | (2.7 | ) | |||||||||
| LAL | — | 7.1 | 7.1 | |||||||||||
| TriQuint’s pump laser business | 4.6 | — | 4.6 | |||||||||||
| SFAS No. 142 impairment charges (see Note 12) | (225.7 | ) | — | (225.7 | ) | |||||||||
| Tax adjustment related to SDL and Fitel acquisitions (see Note 15) | 5.5 | — | 5.5 | |||||||||||
| Purchase price adjustment related to the achievement of milestones | — | 29.3 | 29.3 | |||||||||||
| Balance as of June 30, 2003 | $ | 87.2 | $ | 79.0 | $ | 166.2 | ||||||||
| Acquisitions (see Note 17): | ||||||||||||||
| TriQuint | 0.1 | — | 0.1 | |||||||||||
| Ditech | 0.9 | — | 0.9 | |||||||||||
| E2O | 36.2 | — | 36.2 | |||||||||||
| Tax adjustment related to OCLI acquisition (see Note 15) | — | 0.3 | 0.3 | |||||||||||
| Tax adjustment related to Fitel acquisition (see Note 15) | 1.1 | — | 1.1 | |||||||||||
| Balance as of June 30, 2004 | $ | 125.5 | $ | 79.3 | $ | 204.8 | ||||||||
| (1) | The Commercial and Consumer Products Group was formerly named the Thin Film Products Group. |
A-75
JDS UNIPHASE CORPORATION
NOTES TO CONSOLIDATED FINANCIAL STATEMENTS — (Continued)
Purchase price adjustment related to the achievement of milestones:
On July 16, 2003, the Company completed the acquisition of a portion of the optical communications business of Ditech Communications (“Ditech”). The Company believes that the acquisition adds to its abilities to integrate optics, electronics and software in subsystems for optical equipment manufacturers. Under the terms of the agreement, the Company will pay Ditech $1.6 million in cash, of which $1.4 million was paid at closing. The Company’s maximum obligation is $4.9 million, of which $0.9 million is based on the level of inventory purchased from Ditech that is sold by the Company, and $4.0 million is contingent upon the revenue generated by the acquired business through June 30, 2005. Settlement of any outstanding matters under the terms of the acquisition will be completed during fiscal 2005. At June 30, 2004, the Company has paid $0.5 million as a result of revenue generated through that date. Additional payments related to inventory will be recorded to cost of sales at the time product is sold, while contingent payments based on revenue will be accounted for as goodwill.
In September 2000, the Company acquired Epion Corporation (“Epion”). The purchase agreement provides for the issuance of additional shares of the Company’s common stock subject to the completion of certain milestones. During fiscal 2002, Epion achieved a milestone that resulted in the Company issuing 6.6 million shares of the Company’s common stock valued at $30.0 million, of which $27.0 million was recorded as goodwill, $2.5 million was recorded as stock-based compensation expense, and $0.5 million was recorded as deferred compensation related to unvested options. During fiscal 2003, Epion achieved a milestone that resulted in the Company issuing 9.7 million shares of the Company’s common stock valued at $30.0 million, of which $27.0 million was recorded as goodwill, $2.9 million was recorded as stock-based compensation expense, and $0.1 million was recorded as deferred compensation related to unvested options.
During fiscal 2002, Optical Process Automation Corp. (“OPA”) reached several milestones and the Company removed the provisions of the remaining milestones that resulted in the Company issuing 2.2 million shares of the Company’s common stock valued at $11.9 million, of which $6.2 million was recorded as goodwill, $1.2 million was recorded as a decrease to other current liabilities (as this amount was previously accrued in fiscal 2001) and $4.5 million was recorded as expenses related to the removal of the milestone provisions.
During fiscal 2002, the Company recorded $20.8 million of additional goodwill related to the acquisition of UNL in fiscal 1998, in final settlement of its obligation related to UNL shipments for a four-year earn-out period.
In addition, during fiscal 2003 and 2002, the Company issued payments of $2.3 million and $9.1 million, respectively, in connection with milestones achieved by another acquired entity. The Company recorded the entire payments as goodwill.
Note 6. Other Intangibles
The following tables present details of the Company’s other intangibles (in millions):
| As of June 30, 2004: | Gross Carrying Amount | Accumulated Amortization | Net | |||||||||||
|---|---|---|---|---|---|---|---|---|---|---|---|---|---|---|
| Developed technology | $ | 114.0 | $ | (52.9 | ) | $ | 61.1 | |||||||
| Other | 41.3 | (21.0 | ) | 20.3 | ||||||||||
| Total intangibles | $ | 155.3 | $ | (73.9 | ) | $ | 81.4 | |||||||
| As of June 30, 2003: | Gross Carrying Amount | Accumulated Amortization | Net | |||||||||||
|---|---|---|---|---|---|---|---|---|---|---|---|---|---|---|
| Developed technology | $ | 107.7 | $ | (43.0 | ) | $ | 64.7 | |||||||
| Other | 37.8 | (14.3 | ) | 23.5 | ||||||||||
| Total intangibles | $ | 145.5 | $ | (57.3 | ) | $ | 88.2 | |||||||
A-76
JDS UNIPHASE CORPORATION
NOTES TO CONSOLIDATED FINANCIAL STATEMENTS — (Continued)
During fiscal 2004, 2003 and 2002, the Company recorded $16.0 million, $19.8 million, and $371.2 million, respectively, of amortization of other intangibles. During fiscal 2004, 2003 and 2002, the Company recorded $0, $68.6 million and $1,243.1 million, respectively, of reductions in the carrying value of other intangibles as a result of impairment analyses performed in accordance with SFAS 144 and SFAS No. 121 (see “Note 13. Reduction of Other Long-Lived Assets”).
Based on the carrying amount of other intangibles as of June 30, 2004, and assuming no future impairment of the underlying assets, the estimated future amortization is as follows (in millions):
| Years Ended June 30, | ||||||
|---|---|---|---|---|---|---|
| 2005 | $ | 17.2 | ||||
| 2006 | 15.6 | |||||
| 2007 | 12.4 | |||||
| 2008 | 7.8 | |||||
| 2009 | 5.5 | |||||
| Thereafter | 22.9 | |||||
| Total amortization | $ | 81.4 |
Note 7. Convertible Debt and Letters of Credit
On October 31, 2003, the Company completed the sale of $475.0 million aggregate principal amount of Zero Coupon Senior Convertible Notes due in 2010. The notes were issued for cash consideration in a private placement to the initial purchasers, Morgan Stanley & Co. Incorporated, Goldman Sachs & Co., and CIBC World Markets Corp. The initial purchasers resold the notes to qualified institutional investors in accordance with Rule 144A under the Securities Act of 1933, as amended. Proceeds from the notes amounted to $462.3 million after issuance costs. The notes do not bear interest and are convertible into the Company’s common stock at a conversion price of $4.94 per share. Each $1,000 principal amount is initially convertible into 202.4291 shares of the Company’s common stock upon the satisfaction of certain conditions. Therefore, the notes are convertible in the aggregate into approximately 96.2 million shares of common stock. The Company has the right to redeem the notes beginning November 15, 2008. Holders of the notes may require the Company to repurchase the notes on November 15, 2008. In addition, under certain circumstances holders may require the Company to convert the notes into shares of the Company’s common stock, if the closing sale price of our common stock exceeds 110% of the conversion price for at least 20 trading days in the 30 consecutive trading days ending on the last trading day of the preceding fiscal quarter. Conditions required to trigger this conversion right have not occurred.
The Company filed a registration statement with the SEC on November 14, 2003 and amended the registration statement on December 12, 2003, with respect to the resale of the Notes and the common stock issuable upon the conversion of the Notes. The registration statement was declared effective by the SEC on December 12, 2003. The costs incurred in connection with the convertible notes are being amortized to interest expense over 5 years.
As of June 30, 2004, the Company had six standby letter of credit facilities totaling $9.4 million.
Note 8. Commitments and Contingencies
Operating Leases:
During the first quarter of fiscal 2004, the Company adopted the provisions of FIN 46R with respect to a master lease agreement with a special purpose entity (the “Lessor”) pertaining to two properties for facilities located in Melbourne, Florida and Raleigh, North Carolina. The Company exercised its option to purchase these properties on September 16, 2003, and paid the Lessor $44.7 million in cash. Prior to purchasing the properties, in connection with the Company’s restructuring activities, the Company had recorded impairment charges of $15.5 million related to the Raleigh, North Carolina properties. In addition, the Company accrued an impairment loss of $6.9 million
A-77
JDS UNIPHASE CORPORATION
NOTES TO CONSOLIDATED FINANCIAL STATEMENTS — (Continued)
related to the Melbourne, Florida properties, which the Company was amortizing over the original term of the lease. As a result of the purchase of the properties and in conjunction with the adoption of FIN 46R, the Company recognized $44.7 million of additions to property, plant and equipment, reduced by the $15.5 million impairment charge and recognized the remaining accrued impairment loss of $5.0 million (see “Note 13. Reduction of Other Long-Lived Assets”) as a deferred impairment charge and a non-cash cumulative effect of an accounting change adjustment of $2.9 million (see “Note 1. Description of Business and Summary of Significant Accounting Policies”).
The Company leases other facilities under operating lease agreements that expire at various dates through fiscal 2018. As of June 30, 2004, future annual minimum lease payments under non-cancelable operating leases were as follows (in millions):
| Years Ended June 30, | ||||||
|---|---|---|---|---|---|---|
| 2005 | $ | 29.8 | ||||
| 2006 | 27.4 | |||||
| 2007 | 25.6 | |||||
| 2008 | 15.8 | |||||
| 2009 | 10.9 | |||||
| Thereafter | 18.7 | |||||
| Total minimum lease payments | $ | 128.2 |
Included in the future minimum lease payments table above are $76.6 million related to lease commitments in connection with the Company’s Global Realignment Program (see “Note 14. Restructuring and Global Realignment”).
The aggregate future minimum rentals to be received under non-cancelable subleases totaled $7.6 million as of June 30, 2004. Rental expense was $12.7 million in fiscal 2004, $27.8 million in fiscal 2003, and $37.5 million in fiscal 2002.
Capital Leases:
As of June 30, 2004, the Company had one building lease in Beijing, China that was classified as a capital lease in accordance with SFAS No. 13, “Accounting for Leases.” As of June 30, 2004, the gross carrying amount of the building was $6.8 million and total accumulated amortization expense was $1.5 million. Amortization expense related to the building was included as part of the Company’s total depreciation expense.
The following table presents the future minimum lease payments under the capital leases together with the present value of the minimum lease payments as of June 30, 2004:
| Years Ended June 30, | ||||||
|---|---|---|---|---|---|---|
| 2005 | $ | 0.8 | ||||
| 2006 | 0.8 | |||||
| 2007 | 0.8 | |||||
| 2008 | 0.9 | |||||
| 2009 | 0.9 | |||||
| Thereafter | 1.5 | |||||
| Total minimum lease payments | 5.7 | |||||
| Less: amount representing interest | (0.8 | ) | ||||
| Present value of minimum lease payments | $ | 4.9 |
The building lease bears an interest rate of 4.6%.
A-78
JDS UNIPHASE CORPORATION
NOTES TO CONSOLIDATED FINANCIAL STATEMENTS — (Continued)
Note 9. Legal Proceedings
The Securities Class Actions:
Beginning on March 27, 2002, the first of numerous federal securities class actions was filed against the Company and several of its current and former officers and directors. On July 26, 2002, the Northern District of California consolidated all the securities actions then filed in or transferred to that court under the titleIn re JDS Uniphase Corporation Securities Litigation, Master File No. C-02-1486 CW, and appointed the Connecticut Retirement Plans and Trust Funds as Lead Plaintiff.
An amended consolidated complaint was filed on October 11, 2002. It purported to be brought on behalf of a class consisting of those who acquired the Company’s securities from July 27, 1999 through July 26, 2001, as well as on behalf of subclasses consisting of those who acquired the Company’s common stock pursuant to its acquisitions of OCLI, E-TEK, and SDL. The complaint sought unspecified damages and alleged various violations of the federal securities laws, specifically Sections 10(b), 14(a), 20(a), and 20A of the Securities Exchange Act of 1934 and Sections 11, 12(a)(2), and 15 of the Securities Act of 1933. It also named one of the Company’s stockholders as a defendant. On November 3, 2003, the Court issued an opinion dismissing the 1934 Act claims with leave to amend and denying the motion to dismiss the 1933 Act claims.
On January 9, 2004, plaintiffs filed a second amended complaint. It purports to be brought on behalf of a class consisting of those who acquired the Company’s securities from October 28, 1999, through July 26, 2001, as well as on behalf of subclasses consisting of those who acquired the Company’s common stock pursuant to its acquisitions of OCLI, E-TEK, and SDL. The complaint seeks unspecified damages and alleges various violations of the federal securities laws, specifically Sections 10(b), 14(a), 20(a), and 20A of the Securities Exchange Act of 1934 and Sections 11, 12(a)(2), and 15 of the Securities Act of 1933. On June 4, 2004, the Court held a hearing on Defendants’ motions to dismiss. The Court has not yet issued a ruling on the motions.
On July 26, 2002, a securities class action captionedZelman v. JDS Uniphase Corp., No. 02-CV-6002, was filed in the District Court for the Southern District of New York. The complaint, brought by a stockholder purporting to represent a class of purchasers of certain GOALS debt securities issued by an investment bank during the period from March 6, 2001 through September 26, 2001, named the Company, one of its stockholders, and several of its current and former officers and directors as defendants and alleged violations of the federal securities laws, specifically Sections 10(b) and 20(a) of the Securities Exchange Act of 1934, and Rule 10b-5. The action was transferred to the Northern District of California on September 11, 2002, and assigned a Northern District case number, No. C-02-4656 MJJ. On October 31, 2002, the district court related the action toIn re JDS Uniphase Corporation Securities Litigation, but did not consolidate the two actions. On January 7, 2003, the Court appointed Shirley Zelman lead plaintiff. The plaintiff has agreed that JDSU need not respond to the complaint at this time. No other activity has occurred in this action. No trial date has been set.
The Derivative Actions:
Eleven derivative actions purporting to be brought on the Company’s behalf have been filed in state and federal courts against several of its current and former officers and directors. Some of these actions also named its Independent Registered Public Accounting Firm, Ernst & Young LLP, as a defendant. All were based on the same factual allegations and circumstances as the purported securities class actions and alleged state law claims for breach of fiduciary duty, misappropriation of confidential information, waste of corporate assets, contribution and indemnification, insider trading, abuse of control, gross mismanagement and unjust enrichment. The actions seek unspecified damages. Several of the actions have been consolidated, resulting in the following surviving actions:In re JDS Uniphase Corporation Derivative Litigation, Master File No. CV806911, filed April 11, 2002, in California Superior Court for the County of Santa Clara;Corwin v. Kaplan, No. C-02-2020 CW, filed April 24, 2002, in the District Court for the Northern District of California; andCromas v. Straus, Civil Action No. 19580, filed April 25, 2002, in the Delaware Court of Chancery for New Castle County.
A-79
JDS UNIPHASE CORPORATION
NOTES TO CONSOLIDATED FINANCIAL STATEMENTS — (Continued)
InIn re JDS Uniphase Corporation Derivative Litigation, plaintiffs filed a consolidated amended derivative complaint on March 13, 2003. That complaint asserted claims for breach of fiduciary duty, waste of corporate assets, abuse of control, gross mismanagement, unjust enrichment, and constructive fraud against JDSU and certain of its current and former officers and directors. The complaint also asserted claims for violation of California Corporations Code Sections 25402 and 25502.5 against defendants who sold JDSU stock and asserts claims for breach of contract, professional negligence, and negligent misrepresentation against JDSU’s Independent Registered Public Accounting Firm, Ernst & Young LLP. On June 10, 2003, the Court stayed the action pending resolution of the federal actions. On March 4, 2004, the Court denied Plaintiffs’ motion to lift the stay. A status conference is scheduled for October 19, 2004. No trial date has been set.
In theCorwin case, the Company moved to dismiss on December 13, 2002. On November 3, 2003, the Court issued an opinion dismissing the complaint with leave to amend. On January 16, 2004, plaintiffs filed a first amended complaint in the federal derivative action. It asserts state law claims for breach of fiduciary duty, misappropriation of confidential information, waste of corporate assets, indemnification, and insider trading. Defendants’ motion to dismiss was heard by the court on June 4, 2004. The court has not yet issued a ruling on Defendants’ motion. No trial date has been set.
In theCromas case, no proceedings have occurred to date. No trial date has been set.
The OCLI and SDL Shareholder Actions:
On February 3, 2003, an action captionedPang v. Dwight, No. 02-231989, was filed in California Superior Court for the County of Sonoma. The complaint purports to be brought on behalf of a class of former shareholders of OCLI who exchanged their OCLI shares for JDSU shares when JDSU acquired OCLI. The complaint names the former directors of OCLI as defendants and asserts causes of action for breach of fiduciary duty and breach of the duty of candor. The action seeks unspecified damages. As discussed below, the petitions to coordinate this action with the SDL Actions andIn re JDS Uniphase Corporation Derivative Litigation were denied. On November 14, 2003, Defendants demurred to the complaint. At a February 5, 2004 hearing, the Court stated that it would overrule the demurrer to the complaint. On February 24, 2004, Defendants answered the complaint. No trial date has been scheduled.
Three actions have been filed in California Superior Court for the County of Santa Clara by stockholders purporting to represent a class of former shareholders of SDL who exchanged their SDL shares for JDSU shares when JDSU acquired SDL. The complaints name the former directors of SDL as defendants, assert causes of action for breach of fiduciary duty and breach of the duty of disclosure, and seek unspecified damages. These action include:Cook v Scifres, No. CV814824, filed February 18, 2003,Anish v. Scifres, No. CV815738, filed March 24, 2003, andVajdos v. Scifres, No. CV816087, filed April 7, 2003. On April 4, 2003, the plaintiff inCook moved to consolidate the actions and to appoint the law firm of Milberg Weiss as lead counsel for plaintiffs. On May 5, 2003, the defendants in theCook action petitioned the Judicial Council to coordinate the SDL actions with the OCLI action in Santa Clara County Superior Court. On June 30, 2003, defendants in theCook action petitioned to coordinate the other SDL actions and the OCLI action withIn re JDS Uniphase Corporation Derivative Litigation.
On August 19, 2003, the Court held a hearing on the motion to consolidate and for appointment of lead counsel and the petitions to coordinate. The Court granted the motion to consolidate the SDL Actions with each other and appointed the law firms of Milberg Weiss and Stull, Stull & Brody as lead counsel. The Court denied the petitions to coordinate the SDL Actions with the OCLI Shareholder Action or withIn re JDS Uniphase Corporation Derivative Litigation. On December 19, 2003, Defendants filed a motion to stay discovery and filed a demurrer to the complaint. At a February 10, 2004 hearing on the motions, the Court indicated that it would sustain the demurrer with leave to amend, but would deny the motion to stay discovery.
On March 15, 2004, the Court approved the parties’ stipulation to a limited stay of discovery pending a determination by the Northern District whether the federal securities action against JDSU may proceed. A status conference is scheduled for October 19, 2004.
A-80
JDS UNIPHASE CORPORATION
NOTES TO CONSOLIDATED FINANCIAL STATEMENTS — (Continued)
The ERISA Actions:
Two actions have been filed in the District Court for the Northern District of California against the Company and certain of its former and current officers and directors on behalf of a purported class of participants in the Company’s 401(k) Plan. The complaints allege that Defendants violated the Employee Retirement Income Security Act by breaching their fiduciary duties to the Plan and its participants. The actions seek an unspecified amount of damages, restitution, a constructive trust, and other equitable remedies. These actions arePettit v. JDS Uniphase Corporation, Case No. C 03 4743, filed October 22, 2003, which alleges a purported class period of February 4, 2000 to the present, andHodges-Toby v. JDS Uniphase Corporation, Case No. C-03-4907, filed November 3, 2003, which alleges a class period of July 27, 1999 to the present. The plaintiff inPettit filed a notice of related case stating his view that the action is related toIn re JDS Uniphase Corporation Securities Litigation, N.D. Cal. Master File No. C-02-1486 CW.
On December 17, 2003, the Court related the ERISA actions toIn re JDS Uniphase Corporation Securities Litigation, N.D. Cal. Master File No. C-02-1486 CW. On December 29, 2003, the Court consolidated the ERISA actions asIn re JDS Uniphase Corporation ERISA Litigation, Master File No. C-03-4743 CW. Defendants completed a voluntary production of documents on July 19, 2004. Plaintiffs filed a consolidated complaint on September 2, 2004. In addition to the defendants named in the original complaints, the consolidated complaint names certain other current and former JDSU employees as defendants, including current and former members of the Company’s Benefits Committee. Like the original complaints, the consolidated complaint alleges that Defendants violated the Employee Retirement Income Security Act by breaching their fiduciary duties to the Plan and its participants. The consolidated complaint seeks an unspecified amount of damages, attorney fees and expenses, taxable costs and interest, and injunctive and other equitable relief. Defendants’ response to the consolidated complaint is due by November 1, 2004. Although Plaintiffs have propounded a request for documents, Defendants have not produced documents beyond those produced in connection with their voluntary production of documents. No trial date has been set.
The Shareholder Inspection Demands:
Plaintiffs in the federal and California derivative actions have propounded inspection demands to JDSU pursuant to Delaware and California state law. These inspection demands purport to seek the production of certain JDSU documents for the purpose of investigating alleged misconduct by JDSU officers and directors.
On April 27, 2004, the plaintiff in the federal derivative action propounded an inspection demand to JDSU purportedly pursuant to Section 220 of the Delaware Code. The parties have reached agreement as to the scope and confidentiality of documents to be produced in response to this inspection demand.
On December 23, 2003, one of the lead plaintiffs in the California derivative action filed a Petition for Writ of Mandate to Compel Inspection and Copying of Books and Records of JDS Uniphase Corporation. That action is captionedCoykendall v. JDS Uniphase Corporation, Case No. 103 CV 011518 (Santa Clara Super. Ct.). On February 3, 2004, JDSU filed a demurrer to the Petition. Also on February 3, 2004, JDSU moved for a protective order pursuant to Section 1603 of the California Corporations Code. On March 16, 2004, the Court overruled JDSU’s demurrer. The Court also denied the motion for protective order without prejudice. JDSU answered the Petition on April 13, 2004. On April 15, 2004, Petitioner propounded Form Interrogatories and a Request for Production of Documents to JDSU. The Company responded to Petitioner’s discovery on May 14, 2004. The parties have not reached agreement yet as to the scope of documents to be produced, if any.
The Company believes that the factual allegations and circumstances underlying these securities class actions, derivative actions, the OCLI and SDL class actions, and the ERISA class actions are without merit. The expense of defending these lawsuits has been costly, will continue to be costly, and could be quite significant and may not be covered by our insurance policies. The defense of these lawsuits could also result in continued diversion of our management’s time and attention away from business operations which could prove to be time consuming and
A-81
JDS UNIPHASE CORPORATION
NOTES TO CONSOLIDATED FINANCIAL STATEMENTS — (Continued)
disruptive to normal business operations. An unfavorable outcome or settlement of this litigation could have a material adverse effect on the Company’s financial position, liquidity or results of operations.
The Company is a party to other litigation matters and claims, which are normal in the course of its operations. While the results of such litigation matters and claims cannot be predicted with certainty, the Company believes that their final outcome will not have a material adverse impact on its financial position, liquidity, or results of operations.
Note 10. Stockholders’ Equity
Preferred Stock:
In connection with the acquisition of UNL in fiscal 1998, the Company issued 0.1 million shares of non-voting, non-cumulative Series A Preferred Stock to Koninklijke Philips Electronics N.V. (“Philips”) with a par value of $0.001 per share. The shares of Series A Preferred Stock were convertible into shares of the Company’s common stock using an agreed-upon formula based on the cumulative level of shipments of certain products by UNL during the four-year earn-out period ending June 30, 2002 and the average price of the Company’s common stock for the 20 trading days prior to June 30, 2002. During the fourth quarter of fiscal 2001, UNL achieved the cumulative unit shipments of these products that required the Company to issue $111.7 million of the Company’s common stock to Philips at the end of the four-year earn-out period. Using an average price of $2.85 per share, the Company issued 39.2 million shares of its common stock to Philips in connection with the conversion of the 0.1 million shares of Series A Preferred Stock on July 1, 2002.
In February 2003, the Company amended and restated its Stockholder Rights Agreement and currently each share of the Company’s outstanding common stock is associated with one right. Each right entitles stockholders to purchase 1/100,000 share of the Company’s Series B Preferred Stock at an exercise price of $21.0. The rights only become exercisable in certain limited circumstances following the tenth day after a person or group announces acquisition of or tender offers for 15% or more of the Company’s common stock. For a limited period of time following the announcement of any such acquisition or offer, the rights are redeemable by the Company at a price of $0.01 per right. If the rights are not redeemed, each right will then entitle the holder to purchase common stock having the value of twice the then-current exercise price. For a limited period of time after the exercisability of the rights, each right, at the discretion of the Company’s Board of Directors, may be exchanged for either 1/100,000 share of Series B Preferred Stock or one share of common stock per right. The rights expire on June 22, 2013.
The Company’s Board of Directors has the authority to issue up to 499,999 shares of undesignated preferred stock and to determine the powers, preferences and rights and the qualifications, limitations or restrictions granted to or imposed upon any wholly unissued shares of undesignated preferred stock and to fix the number of shares constituting any series and the designation of such series, without the consent of the Company’s stockholders. The preferred stock could be issued with voting, liquidation, dividend and other rights superior to those of the holders of common stock. The issuance of Series B Preferred Stock or any preferred stock subsequently issued by the Company’s Board of Directors, under some circumstances, could have the effect of delaying, deferring or preventing a change in control.
Exchangeable Shares of JDS Uniphase Canada Ltd.:
On June 30, 1999, in connection with the merger with JDS FITEL, JDS Uniphase Canada Ltd., a subsidiary of the Company, adopted an Exchangeable Share Rights Plan (the “Exchangeable Rights Plan”) substantially equivalent to the Company’s Rights Agreement. Under the Exchangeable Rights Plan, each exchangeable share issued has an associated right (an “Exchangeable Share Right”) entitling the holder of such Exchangeable Share Right to acquire additional exchangeable shares on terms and conditions substantially the same as the terms and conditions upon which a holder of shares of common stock is entitled to acquire either 1/1000 share of the Company’s Series B Preferred Stock or, in certain circumstances, shares of common stock under the Company’s
A-82
JDS UNIPHASE CORPORATION
NOTES TO CONSOLIDATED FINANCIAL STATEMENTS — (Continued)
Rights Agreement. The definitions of beneficial ownership, the calculation of percentage ownership and the number of shares outstanding and related provisions of the Company’s Rights Agreement and the Exchangeable Rights Plan apply, as appropriate, to shares of common stock and exchangeable shares as though they were the same security. The Exchangeable Share Rights are intended to have characteristics essentially equivalent in economic effect to the Rights granted under the Company’s Rights Agreement. The Company has the right to force conversion of the exchangeable shares in fiscal 2014.
Stock Option Plans:
On November 6, 2003, the Company’s stockholders approved the Company’s 2003 Equity Incentive Plan (the “2003 Plan”). Pursuant to Section 3(a) of the 2003 Plan, and in accordance with the registration requirements of the Securities Act of 1933, as amended, the Company registered 140.0 million shares, which have been reserved for issuance under the 2003 Plan. Further, as a result of receiving stockholder approval of the 2003 Plan, (i) the Company’s right to issue options under the Company’s 1993 Amended and Restated Flexible Stock Incentive Plan (the “1993 Plan”) immediately ceased effective November 6, 2003, and (ii) all shares of the Company’s common stock previously reserved for issuance under the 1993 Plan and not associated with any then outstanding grants ceased to be available for issuance effective as of such date. The stockholders’ action did not affect any of the options granted under the 1993 Plan prior to November 6, 2003 and currently outstanding, all of which remain exercisable in accordance with their terms.
As of June 30, 2004, the Company has reserved 257.4 million shares of common stock for future issuance to employees and directors under the 2003 Plan, the 1996 Non-qualified Stock Option Plan and other various plans the Company assumed as a result of acquisitions. Available for grant as of June 30, 2004 were 112.9 million shares of common stock. Substantially all of our employees participate in our equity incentive programs. The exercise price for stock options is generally equal to fair value of the underlying stock at the date of grant. Options generally become exercisable over a four-year period and, if not exercised, expire from five to ten years from the date of grant. Restricted stock and restricted stock units granted under the 2003 Plan to a limited number of employees generally vest over three to five years. Certain such grants of restricted stock and restricted stock units are subject to accelerated vesting in the event of achievement of specified Company financial performance targets.
A-83
JDS UNIPHASE CORPORATION
NOTES TO CONSOLIDATED FINANCIAL STATEMENTS — (Continued)
The following table summarizes the Company’s equity incentive activity through June 30, 2004 (in thousands, except weighted-average exercise price):
| Options Outstanding | |||||||||||||||
|---|---|---|---|---|---|---|---|---|---|---|---|---|---|---|---|
| Shares Available For Grant | Number Of Shares | Weighted-Average Exercise Price | |||||||||||||
Balance as of June 30, 2001 | 24,147 | 171,559 | $ | 33.02 | |||||||||||
| Increase in authorized shares | 50,326 | — | — | ||||||||||||
| Granted | (46,025 | ) | 46,025 | 6.14 | |||||||||||
| Canceled | 30,551 | (40,531 | ) | 35.65 | |||||||||||
| Exercised | — | (11,928 | ) | 3.08 | |||||||||||
| Expired | 8,607 | (12,551 | ) | 38.17 | |||||||||||
Balance as of June 30, 2002 | 67,606 | 152,574 | 26.11 | ||||||||||||
| Increase in authorized shares | 7,226 | — | — | ||||||||||||
| Granted | (26,108 | ) | 26,108 | 2.63 | |||||||||||
| Canceled | 26,033 | (30,734 | ) | 21.91 | |||||||||||
| Exercised | — | (4,081 | ) | 1.39 | |||||||||||
| Expired | 8,688 | (23,603 | ) | 35.34 | |||||||||||
Balance as of June 30, 2003 | 83,445 | 120,264 | 21.12 | ||||||||||||
| Increase in authorized shares | 140,000 | — | — | ||||||||||||
| Granted | (49,901 | ) | 49,901 | 3.77 | |||||||||||
| Restricted stock granted | �� | (238 | ) | — | — | ||||||||||
| Canceled | 9,766 | (10,227 | ) | 9.52 | |||||||||||
| Exercised | — | (3,206 | ) | 2.47 | |||||||||||
| Expired | (70,191 | ) | (12,154 | ) | 35.19 | ||||||||||
Balance as of June 30, 2004 | 112,881 | 144,578 | 15.18 | ||||||||||||
Options exercisable as of: | |||||||||||||||
| June 30, 2002 | 64,412 | $ | 29.34 | ||||||||||||
| June 30, 2003 | 70,060 | 27.24 | |||||||||||||
| June 30, 2004 | 75,588 | 24.32 | |||||||||||||
A-84
JDS UNIPHASE CORPORATION
NOTES TO CONSOLIDATED FINANCIAL STATEMENTS — (Continued)
The following table summarizes information about options outstanding as of June 30, 2004 (shares in thousands):
| Options Outstanding | Options Exercisable | |||||||||||||||||
|---|---|---|---|---|---|---|---|---|---|---|---|---|---|---|---|---|---|---|
| Range of Exercise Prices | Number Outstanding | Weighted-Average Remaining Contractual Life (in years) | Weighted-Average Exercise Price | Number Exercisable | Weighted-Average Exercise Price | |||||||||||||
| $ 0.00– 0.00 | 18 | 6.0 | $ | 0.00 | 18 | $ | 0.00 | |||||||||||
| 0.04– 0.04 | 51 | 6.1 | 0.04 | 51 | 0.04 | |||||||||||||
| 0.34– 0.35 | 85 | 0.4 | 0.34 | 85 | 0.34 | |||||||||||||
| 0.60– 0.86 | 1,929 | 2.1 | 0.78 | 1,929 | 0.78 | |||||||||||||
| 0.95– 1.39 | 1,041 | 3.1 | 1.18 | 1,041 | 1.18 | |||||||||||||
| 1.45– 2.14 | 2,814 | 5.0 | 1.91 | 2,785 | 1.91 | |||||||||||||
| 2.18– 3.27 | 32,271 | 6.8 | 2.86 | 5,840 | 2.75 | |||||||||||||
| 3.28– 4.88 | 44,988 | 8.1 | 4.12 | 9,189 | 3.90 | |||||||||||||
| 4.93– 7.37 | 6,184 | 3.4 | 6.50 | 5,818 | 6.57 | |||||||||||||
| 7.50– 11.19 | 9,992 | 5.1 | 8.92 | 6,873 | 8.97 | |||||||||||||
| 11.29– 16.93 | 10,113 | 4.0 | 14.98 | 8,233 | 15.10 | |||||||||||||
| 16.94– 24.63 | 16,772 | 3.2 | 20.74 | 16,369 | 20.78 | |||||||||||||
| 25.63– 35.81 | 3,953 | 5.0 | 29.24 | 3,913 | 29.20 | |||||||||||||
| 38.50– 57.31 | 3,143 | 4.8 | 49.79 | 2,971 | 49.97 | |||||||||||||
| 58.56– 87.63 | 5,790 | 5.5 | 69.66 | 5,177 | 69.66 | |||||||||||||
| 88.00–131.81 | 5,343 | 4.0 | 110.88 | 5,205 | 110.99 | |||||||||||||
| 132.31–146.53 | 91 | 2.4 | 137.72 | 91 | 137.72 | |||||||||||||
| 144,578 | 75,588 | |||||||||||||||||
Employee Stock Purchase Plans:
In June 1998, the Company adopted the JDS Uniphase Corporation 1998 Employee Stock Purchase Plan, as amended (the “98 Purchase Plan”). The 98 Purchase Plan, effective August 1, 1998, provides eligible employees with the opportunity to acquire an ownership interest in the Company through participation in a program of periodic payroll deductions applied at specific intervals to the purchase of the Company’s common stock. The 98 Purchase Plan is structured as a qualified employee stock purchase plan under Section 423 of the Internal Revenue Code of 1986. However, the 98 Purchase Plan is not intended to be a qualified pension, profit sharing or stock bonus plan under Section 401(a) of the Internal Revenue Code of 1986 and is not subject to the provisions of the Employee Retirement Income Security Act of 1974. The 98 Purchase Plan will terminate upon the earlier of August 1, 2008 or the date on which all shares available for issuance have been sold. Under the 98 Purchase Plan, 5.9 million, 6.7 million and 2.6 million shares were issued during fiscal 2004, 2003 and 2002, respectively, with weighted-average prices of $1.95, $2.02 and $6.74 per share, respectively. Of the 50.0 million shares authorized to be issued under the 98 Purchase Plan, 33.5 million shares remained available for issuance as of June 30, 2004.
In November 1999, the Company adopted the JDS Uniphase Corporation 1999 Canadian Employee Stock Purchase Plan, as amended (the “Canadian Plan”). The Canadian Plan has similar provisions to the 98 Purchase Plan. Under the Canadian Plan, 0.9 million and 1.0 million shares were issued during fiscal 2003 and 2002, respectively, with weighted-average prices of $2.15 and $7.01 per share, respectively. Beginning in fiscal 2004, the Company terminated all enrollments in the Canadian Plan, and all employees formerly participating were enrolled in the 98 Purchase Plan. The Company presently does not anticipate any new enrollments in the Canadian Plan.
A-85
JDS UNIPHASE CORPORATION
NOTES TO CONSOLIDATED FINANCIAL STATEMENTS — (Continued)
Stock-Based Compensation:
In connection with certain of the Company’s acquisitions, outstanding stock options held by the employees of the acquired companies became exercisable, according to their terms, for the Company’s common stock effective at the acquisition date. These options did not reduce the shares available for grant under any of the Company’s other option plans. For acquisitions accounted for as purchases, the fair value of these options was included as part of the purchase price. The deferred compensation expense calculation and future amortization is based on the vesting schedule of the awards. Amortization of the deferred stock-based compensation was $1.6 million, $47.9 million and $117.9 million in fiscal 2004, 2003 and 2002, respectively.
During fiscal 2003, in connection with the severance agreements of former executives, the Company extended the exercise period for options to purchase 11.0 million shares at prices ranging from $0.70 to $112.63. No compensation expense was recorded on these options as the fair market value of the options at the time of extension was below the exercise price.
In accordance with SFAS No. 123, “Accounting for Stock-Based Compensation,” the Company is required to present pro forma information regarding its net loss and net loss per share as if the Company had accounted for its employee stock options (including shares issued under the employee stock purchase plans, collectively the “options”), granted subsequent to June 30, 1995 using the fair value method of accounting. The fair value of the options granted in fiscal 2004, 2003, and 2002 has been estimated at the date of grant using the Black-Scholes option pricing model with the following weighted-average assumptions:
| Employee Stock Option Plans | Employee Stock Purchase Plans | ||||||||||||||||||||||||||
|---|---|---|---|---|---|---|---|---|---|---|---|---|---|---|---|---|---|---|---|---|---|---|---|---|---|---|---|
| FY 2004 | FY 2003 | FY 2002 | FY 2004 | FY 2003 | FY 2002 | ||||||||||||||||||||||
| Expected life (in years) | 5.00 | 5.00 | 5.00 | 0.50 | 0.50 | 0.50 | |||||||||||||||||||||
| Volatility | 0.73 | 0.80 | 0.79 | 0.46 | 0.79 | 0.79 | |||||||||||||||||||||
| Risk-free interest rate. | 3.00 | % | 3.07 | % | 4.30 | % | 2.10 | % | 1.69 | % | 2.72 | % | |||||||||||||||
| Dividend yield | 0.00 | % | 0.00 | % | 0.00 | % | 0.00 | % | 0.00 | % | 0.00 | % | |||||||||||||||
The Black-Scholes option pricing model was developed for use in estimating the fair value of traded options that have no vesting restrictions and are fully transferable. In addition, option valuation models such as the Black-Scholes option pricing model require the input of highly subjective assumptions, including the expected stock price volatility. Because the Company’s options have characteristics significantly different from those of traded options, and because changes in the subjective input assumptions can materially affect the fair value estimate, in the opinion of management, the existing models do not necessarily provide a reliable single measure of the fair value of its options.
The weighted-average fair value of employee stock options granted during fiscal 2004, 2003 and 2002 was $2.40, $1.87 and $4.13 per share, respectively. The weighted-average exercise price of employee stock options granted during fiscal 2004, 2003 and 2002 was $3.77, $2.63 and $6.14 per share, respectively. The weighted-average fair value of shares granted under the employee stock purchase plans during fiscal 2004, 2003 and 2002 was $0.85, $0.88 and $2.95 per share, respectively.
Note 11. Employee Benefit Plans
The Company sponsors the JDS Uniphase Corporation Employee 401(k) Retirement Plan (the “401(k) Plan”), a Defined Contribution Plan under ERISA, which provides retirement benefits for its eligible employees through tax deferred salary deductions. The 401(k) Plan allows employees to contribute up to 20% of their annual compensation, with such contributions limited to $13,000 in calendar year 2004 as set by the Internal Revenue Service.
Prior to January 1, 2004, the 401(k) Plan provided for a 100% match of employees’ contributions up to the first 3% of annual compensation and a 50% match on the next 2% of compensation, subject to a maximum matching
A-86
JDS UNIPHASE CORPORATION
NOTES TO CONSOLIDATED FINANCIAL STATEMENTS — (Continued)
contribution of $3,600 per employee in calendar year 2003. Effective January 1, 2004, the Plan provides for employer matching contributions to all participants who make elective contributions in an amount equal to 25% of the employee’s elective contribution for the first 6.0% of eligible compensation contributed, up to a maximum of $1,500 per year.
Prior to September 2003, employees had the option to invest the Company’s matching contributions in the Company’s common stock and were allowed to sell their shares without restrictions, subject to the Company’s insider trading policies. Effective September 30, 2003, the Plan was amended such that investments in Company common stock are no longer allowed. Investments currently held in the Company common stock will be divested and reinvested in other funds no later than September 30, 2006 at the direction of the individual participants, or, if no direction is received, by the Plan administrator. All matching contributions are made in cash and vest immediately. The Company’s matching contributions to the 401(k) Plan were $3.4 million in fiscal 2004, $7.0 million in fiscal 2003 and $9.5 million in fiscal 2002.
The Company also provides a non-qualified retirement plan for the benefit of certain eligible employees in the U.S. This plan is designed to permit employee deferral of a portion of salaries in excess of certain tax limits and deferral of bonuses. This plan’s assets are designated as trading assets in the Company’s balance sheet (see “Note 4. Investments”).
Note 12. Reduction of Goodwill
During fiscal 2004, the Company recorded no impairment charges and in fiscal 2003 the Company recorded $225.7 million in accordance with SFAS No. 142, “Goodwill and Other Intangible Assets”. During fiscal 2002, the Company recorded $4,360.8 million of impairment charges in accordance with SFAS No. 121.
Fiscal 2003 Charges:
On July 1, 2002, the Company adopted SFAS No. 142, under which goodwill is reviewed for impairment annually, or more frequently if certain events or changes in circumstances indicate that the carrying value may not be recoverable. In addition, the Company was required to and performed a transitional impairment review related to the carrying value of goodwill as of July 1, 2002 and determined that there was no impairment beyond amounts previously recorded as of that date.
As part of its quarterly review of financial results in the first quarter of fiscal 2003, the Company noted indicators that the carrying value of its goodwill may not be recoverable and performed an additional impairment review. The impairment review was performed because of the prolonged economic downturn affecting the Company’s operations and revenue forecasts. The Company evaluated the recoverability of its goodwill in accordance with SFAS No. 142 during the first quarter of fiscal 2003. The Company did not identify any impairment indicators during the remainder of fiscal 2003.
Under the first step of the interim SFAS No. 142 analysis, the fair value of the reporting units was determined based on a combination of the income approach, which estimates the fair value based on the future discounted cash flows, and the market approach, which estimates the fair value based on comparable market prices. Under the income approach, the Company assumed a cash flow period of 5 years, long-term annual growth rates of 9% to 33%, a discount rate of 12.5% and terminal value growth rates of 5% to 7%. Based on the first step analysis, the Company determined that the carrying amount of three reporting units within the Communications Products Group was in excess of their fair value. As such, the Company was required to perform the second step analysis on the three reporting units that have failed the first step test to determine the amount of the impairment loss. As of the filing of the Quarterly Report on Form 10-Q for the first quarter of fiscal 2003, the Company had not completed the second step analysis due to the complexities involved in determining the implied fair value of the goodwill of each reporting unit. However, the Company determined that an impairment loss was probable and could be reasonably estimated. Therefore, as permitted by SFAS No. 142, the Company recorded an estimated impairment charge of $224.4 million to reduce the carrying value of its goodwill in the first quarter of fiscal 2003.
A-87
JDS UNIPHASE CORPORATION
NOTES TO CONSOLIDATED FINANCIAL STATEMENTS — (Continued)
During the second quarter of fiscal 2003, the Company completed the second step analysis in connection with the impairment review for the first quarter of fiscal 2003 and recorded an additional impairment charge of $1.3 million, as the actual impairment charge was determined to be higher than the estimated charge recorded in the first quarter of fiscal 2003.
During the fourth quarter of fiscal 2003, the Company completed the annual impairment review related to the carrying value of goodwill as of June 30, 2003 and determined that there was no impairment beyond amounts previously recorded as of that date.
The following table summarizes the impairment charges recorded during fiscal 2003 within the Communications Products Group (in millions):
| Reporting Units (1) | ||||||
|---|---|---|---|---|---|---|
| Communications Products Group: | ||||||
| Components Products Group | $ | 54.6 | ||||
| Subsystem Products Group | 28.7 | |||||
| Transmission Products Group | 142.4 | |||||
| Total | $ | 225.7 |
| (1) | During the first quarter of fiscal 2004, the names of certain reporting units were changed. The table reflects the current names for these reporting units. |
Fiscal 2002 Charges:
As a result of the Phase 2 restructuring activities in the first quarter of fiscal 2002 (see “Note 14. Restructuring and Global Realignment”), the Company abandoned certain redundant products and product platforms and reduced its workforce that had been valued in previous acquisitions. In accordance with SFAS No. 121, the Company wrote down the related intangible assets to their fair value, which was determined to be $0, and recorded total charges of $31.2 million related to goodwill.
As part of its quarterly reviews of financial results, the Company noted indicators in the second, third and fourth quarters of fiscal 2002 that the carrying value of its goodwill may not be recoverable and performed an impairment review. The impairment review was performed pursuant to SFAS No. 121. As a result of the prolonged economic downturn, the Company’s projected future revenue and cash flows for certain of the Company’s asset groupings were revised downward in the second, third and fourth quarters of fiscal 2002. Therefore, the Company recorded charges to reduce goodwill based on the amounts by which the carrying amounts of these assets exceeded their fair value. Fair value was determined based on discounted future cash flows for the operating entities that had separately identifiable cash flows.
The following table summarizes the write-downs of goodwill for the second quarter of fiscal 2002 (in millions):
| Acquired Entities | Reductions of Goodwill | Long-Term Annual Growth Rate | ||||||||
|---|---|---|---|---|---|---|---|---|---|---|
| OCLI | $ | 514.1 | 5%–60 | % | ||||||
| SDL | 751.0 | 15%–60 | % | |||||||
| Total | $ | 1,265.1 | ||||||||
The Company assumed a cash flow period of 5 years, a discount rate of 14%, and terminal growth rates of 5% to 7%. The long-term annual growth rates are higher in the early years of the 5-year cash flow period, representing the Company’s estimated growth in the period of industry recovery, and a reduced growth rate in the later years.
A-88
JDS UNIPHASE CORPORATION
NOTES TO CONSOLIDATED FINANCIAL STATEMENTS — (Continued)
The following table summarizes the write-downs of goodwill for the third quarter of fiscal 2002 (in millions):
| Acquired Entities | Reductions of Goodwill | Long-Term Annual Growth Rate | ||||||||
|---|---|---|---|---|---|---|---|---|---|---|
| E-TEK | $ | 697.5 | 30%–35 | % | ||||||
| JDS FITEL | 1,184.7 | 30%–42 | % | |||||||
| OCLI | 20.3 | 4%–13 | % | |||||||
| SDL | 762.5 | 27%–50 | % | |||||||
| Other | 206.5 | 7%–45 | % | |||||||
| Total | $ | 2,871.5 | ||||||||
The Company assumed a cash flow period of 5 years, a discount rate of 14%, and terminal growth rates of 5% to 7%. The long-term annual growth rates are higher in the early years of the 5-year cash flow period, representing the Company’s estimated growth in the period of industry recovery, and a reduced growth rate in the later years.
The following table summarizes the write-downs of goodwill for the fourth quarter of fiscal 2002 (in millions):
| Acquired Entities | Reductions of Goodwill | Long-Term Annual Growth Rate | ||||||||
|---|---|---|---|---|---|---|---|---|---|---|
| Epitaxx | $ | 130.8 | 25%–40 | % | ||||||
| SDL | 43.5 | 15%–50 | % | |||||||
| UNL | 18.7 | 25%–50 | % | |||||||
| Total | $ | 193.0 | ||||||||
The Company assumed a cash flow period of 5 years, a discount rate of 14%, and terminal growth rates of 7%. The long-term annual growth rates are higher in the early years of the 5-year cash flow period, representing the Company’s estimated growth in the period of industry recovery, and a reduced growth rate in the later years.
Note 13. Reduction of Other Long-Lived Assets
During fiscal 2004 and 2003, the Company recorded $51.8 million and $167.9 million, respectively, of reductions in the carrying value of its long-lived assets in accordance with SFAS No. 144. During fiscal 2002, the Company recorded $1,618.6 million of reductions in the carrying value of its long-lived assets in accordance with SFAS No. 121. These charges excluded asset write-downs associated with the restructuring actions (see “Note 14. Restructuring and Global Realignment”). The following table summarizes the components of the reductions of other long-lived assets (in millions):
| Years Ended June 30, | |||||||||||||||
|---|---|---|---|---|---|---|---|---|---|---|---|---|---|---|---|
| 2004 | 2003 | 2002 | |||||||||||||
| Assets held and used: | |||||||||||||||
| Purchased intangibles (other than goodwill) | $ | — | $ | 68.6 | $ | 1,243.1 | |||||||||
| Property, plant and equipment | 16.4 | 79.1 | 375.5 | ||||||||||||
| Assets held for sale: | |||||||||||||||
| Property, plant and equipment | 35.4 | 20.2 | — | ||||||||||||
| Total reductions of other long-lived assets | $ | 51.8 | $ | 167.9 | $ | 1,618.6 | |||||||||
Fiscal 2004 Charges:
Assets Held and Used:
During fiscal 2004, as a result of the adoption of FIN 46R with respect to two properties under a synthetic lease agreement, the Company recognized a $5.0 million deferred impairment charge related to the Melbourne,
A-89
JDS UNIPHASE CORPORATION
NOTES TO CONSOLIDATED FINANCIAL STATEMENTS — (Continued)
Florida property, which was originally being amortized over the term of the lease. In accordance with SFAS No. 144, the Company also reduced to estimated realizable value, the value of certain manufacturing equipment by $7.7 million, and other assets by $3.7 million. The Company noted no indicators of impairment during fiscal 2004 related to the Company’s remaining long-lived assets, including purchased intangibles.
Assets Held for Sale:
During fiscal 2004, the Company consolidated its corporate headquarters to San Jose, California. In light of the decision to consolidate the corporate headquarters, the Company determined that it did not need to continue to operate a corporate campus in Ottawa, Canada. The Ottawa corporate campus was classified as held for sale, and the Company adjusted the carrying value of the property. The Company also adjusted the carrying value of certain other assets previously classified as held for sale. In accordance with SFAS 144, the Company recorded total impairment charges of $35.4 million for fiscal 2004, primarily related to the Ottawa facility, representing the amount by which the carrying value of the assets exceeded fair value less cost to sell.
Fiscal 2003 Charges:
Assets Held and Used:
The Company noted indicators during the first quarter of fiscal 2003 that the carrying value of its long-lived assets, including purchased intangibles recorded in connection with its various acquisitions and property, plant and equipment, may not be recoverable and performed an impairment review. The impairment review was performed pursuant to SFAS No. 144. As a result of the prolonged economic downturn, the Company’s projected future revenue and cash flows for certain of the Company’s asset groupings were revised downward in the first quarter of fiscal 2003. Therefore, the Company evaluated the recoverability of its long-lived assets and recorded impairment charges based on the amounts by which the carrying amounts of these assets exceeded their fair value. For purchased intangibles, fair value was determined based on discounted future cash flows for the operating entities that had separately identifiable cash flows. For tangible fixed assets, the Company valued these assets that were subject to impairment using specific appraisals.
The following table summarizes the write-downs of purchased intangibles and property, plant and equipment by acquisition for the first quarter of fiscal 2003 (in millions):
| Acquired Entity | Purchased Intangibles | Property, Plant and Equipment | ||||||||
|---|---|---|---|---|---|---|---|---|---|---|
| Datacom | $ | 39.1 | $ | 15.6 | ||||||
| Epitaxx | 19.9 | 26.3 | ||||||||
| SDL | — | 24.3 | ||||||||
| Scion | 8.9 | 12.9 | ||||||||
| Other | 0.7 | — | ||||||||
| Total | $ | 68.6 | $ | 79.1 | ||||||
During the remainder of fiscal 2003, the Company noted no impairment indicators in connection with its long-lived assets held and used, and accordingly, a test of recoverability of its long-lived assets was not required.
Assets Held for Sale:
During the third and fourth quarter of fiscal 2003, the Company classified certain property, plant and equipment intended to be disposed of within a twelve-month period as assets held for sale. In accordance with SFAS No. 144, the Company recorded an impairment charge of $13.3 million, representing the amount by which their carrying value exceeds fair value less cost to sell. During the first quarter of fiscal 2003, the Company classified certain property
A-90
JDS UNIPHASE CORPORATION
NOTES TO CONSOLIDATED FINANCIAL STATEMENTS — (Continued)
and equipment as assets held for sale in connection with the sales of its SIFAM and Cronos subsidiaries (see “Note 18. Operating Segments and Geographic Information”) and recorded total impairment charges of $6.9 million.
Fiscal 2002 Charges:
As a result of the Phase 2 restructuring activities in the first quarter of fiscal 2002 (see “Note 14. Restructuring and Global Realignment”), the Company abandoned certain redundant products and product platforms and reduced its workforce that had been valued in previous acquisitions. In accordance with SFAS No. 121, the Company wrote down the related intangible assets to their fair value, which was determined to be $0, and recorded total charges of $10.8 million related to purchased intangibles other than goodwill.
As part of its quarterly reviews of financial results, the Company noted indicators in the second, third and fourth quarters of fiscal 2002 that the carrying value of its long-lived assets, including significant amounts of purchased intangibles recorded in connection with its various acquisitions, may not be recoverable and performed an impairment review. The impairment review was performed pursuant to SFAS No. 121. As a result of the prolonged economic downturn, the Company’s projected future revenue and cash flows for certain of the Company’s asset groupings were revised downward in the second, third and fourth quarters of fiscal 2002. Therefore, the Company recorded charges to reduce its long-lived assets based on the amounts by which the carrying amounts of these assets exceeded their fair value. Fair value was determined based on discounted future cash flows for the operating entities that had separately identifiable cash flows.
The following table summarizes the write-downs of its long-lived assets, consisting of purchased intangibles, for the second quarter of fiscal 2002 (in millions):
| Acquired Entity | Purchased Intangibles | Long-Term Annual Growth Rate | ||||||||
|---|---|---|---|---|---|---|---|---|---|---|
| SDL | $ | 2.5 | 15%–60 | % | ||||||
The Company assumed a cash flow period of 5 years, a discount rate of 14%, and terminal growth rates of 5% to 7%. The long-term annual growth rates are higher in the early years of the 5-year cash flow period, representing the Company’s estimated growth in the period of industry recovery, and a reduced growth rate in the later years.
The following table summarizes the write-downs of its long-lived assets, consisting of purchased intangibles and property, plant and equipment, for the third quarter of fiscal 2002 (in millions):
| Acquired Entities | Purchased Intangibles | Property, Plant and Equipment | Long-Term Annual Growth Rate | |||||||||||
|---|---|---|---|---|---|---|---|---|---|---|---|---|---|---|
| E-TEK | $ | 224.1 | $ | 1.1 | 30%–35 | % | ||||||||
| JDS FITEL | 233.9 | — | 30%–42 | % | ||||||||||
| OCLI | 210.7 | 67.2 | 4%–13 | % | ||||||||||
| SDL | 247.6 | 10.4 | 27%–50 | % | ||||||||||
| Other | 9.0 | 8.6 | 7%–45 | % | ||||||||||
| Total | $ | 925.3 | $ | 87.3 | ||||||||||
The Company assumed a cash flow period of 5 years, a discount rate of 14%, and terminal growth rates of 5% to 7%. The long-term annual growth rates are higher in the early years of the 5-year cash flow period, representing our estimated growth in the period of industry recovery, and a reduced growth rate in the later years.
A-91
JDS UNIPHASE CORPORATION
NOTES TO CONSOLIDATED FINANCIAL STATEMENTS — (Continued)
The following table summarizes the write-downs of its long-lived assets, consisting of purchased intangibles and property, plant and equipment, for the fourth quarter of fiscal 2002 (in millions):
| Acquired Entities | Purchased Intangibles | Property, Plant and Equipment | Long-Term Annual Growth Rate | |||||||||||
|---|---|---|---|---|---|---|---|---|---|---|---|---|---|---|
| E-TEK | $ | — | $ | 63.2 | 22%–45 | % | ||||||||
| JDS FITEL | 132.5 | 90.7 | 17 | % | ||||||||||
| SDL | 165.2 | 61.7 | 15%–50 | % | ||||||||||
| Other | 6.8 | 72.6 | 7%–50 | % | ||||||||||
| Total | $ | 304.5 | $ | 288.2 | ||||||||||
The Company assumed a cash flow period of 1–5 years, a discount rate of 14%, and terminal growth rate of 7%. The long-term annual growth rates are higher in the early years of the 5-year cash flow period, representing our estimated growth in the period of industry recovery, and a reduced growth rate in the later years.
Note 14. Restructuring and Global Realignment
Overview:
During the second quarter of fiscal 2004, we announced the completion of the Global Realignment Program (GRP), which began in April 2001. That program focused on large-scale site and employee reductions. The Company will continue to take advantage of opportunities to further reduce costs through targeted, customer-driven, restructuring events, intended to reduce the Company’s footprint and rationalizing the manufacture of our products based on core competencies and cost efficiencies. Restructure activities entered into through the second quarter of 2004 are described under the GRP, while activities beginning in the third quarter of fiscal 2004 are described under Restructuring Actions.
Fiscal 2004 Restructuring Actions:
During the third and fourth quarters of 2004, the Company terminated or notified for termination approximately 30 employees at its manufacturing operation in Atsugi, Japan, eliminating technology and manufacturing from its Japan operation. In a separate transaction, the Company sold certain assets of the Atsugi operation and recorded a nominal loss. The Company also initiated the consolidation and reorganization of the Subsystem Products Group into a functionally aligned structure, terminating or notifying for termination approximately 30 employees. This facilitated a product alignment from modules through circuit packs and customer driven systems.
The Company also terminated or notified for termination approximately 75 employees. This restructuring primarily relates to the consolidation of employee functions by eliminating layers of management and creating workflow efficiencies. This restructure will streamline operations while improving the Company’s infrastructure and quality standards.
The Company’s fiscal 2004 restructurings resulted in restructuring charges of $5.6 million primarily related to severance and fringe benefits. Employee reductions during the third quarter restructuring were approximately 30 in North America and 30 in Asia-Pacific, of which 40 were engaged in manufacturing, 15 in research and development and 5 in selling, general and administration functions. Fourth quarter employee reductions were all in North America and totaled approximately 75, of which 55 were in manufacturing and 20 in selling, general and administrative functions. As of June 30, 2004, 58 and 35 employees have been terminated relating the third quarter and fourth quarter restructures respectively. The remaining severance and benefit payments resulting from the fiscal 2004 restructuring activities are scheduled to be paid through the first quarter of fiscal 2006.
A-92
JDS UNIPHASE CORPORATION
NOTES TO CONSOLIDATED FINANCIAL STATEMENTS — (Continued)
Global Realignment Program:
In April 2001, the Company initiated the GRP, under which it began restructuring its business in response to the economic downturn. From April 2001, through the end of the second quarter of fiscal 2004, the Company implemented nine phases of restructuring activities under the GRP and recorded total restructuring charges of $651.5 million. In addition, the Company incurred charges other than restructuring of $481.7 million related to the GRP. Restructuring activities initiated prior to December 31, 2002 were recorded in accordance with EITF No. 94-3, and restructuring activities initiated after December 31, 2002 were recorded in accordance with SFAS No. 146 “Accounting for Costs Associated with Exit or Disposal Activities” and SFAS No. 112, “Employers’ Accounting for Post Employment Benefits.”
Under the GRP, the Company has consolidated and reduced its manufacturing, research and development, sales and administrative facilities in North America, Europe and Asia-Pacific. The total number of sites and buildings closed or scheduled for closure is 29, all of which are related to various phases of restructuring. Based on the decisions made through the end of the second quarter of fiscal 2004, the Company expects to have reduced its total workforce by approximately 19,900 employees upon the completion of the GRP. Of the total, 19,150 relate to restructuring activities and 750 relate to other decisions made under the GRP. As of June 30, 2004, 19,856 employees have been terminated.
Workforce Reduction:
The Company recorded initial restructure charges totaling $228.6 million primarily related to severance and fringe benefits associated with the reduction of approximately 19,150 employees, which includes non-cash severance charges of $12.3 million, of which $11.1 million related to the modification of a former executive’s stock options and $1.2 million to disputed severance. The Company has recorded decreases of $13.3 million, to the accrual balance. The decreases are due to actual payments for such charges being lower than original estimated expenses.
Approximately 16,200 employees were engaged in manufacturing, 1,350 in research and development, and 1,600 in selling, general and administrative functions. Approximately 16,400 employees were located in North America, 1,700 in Europe, and 1,050 in Asia-Pacific. The Company has substantially completed its Phase one through four and six through nine workforce reductions. The remaining accrual balance reflects severance and benefit payments scheduled to be paid, primarily under Phase five, through fiscal 2005, for employees that have been notified that they will be terminated, as well as future payments for employees that have already been terminated, as required under local laws.
Facilities and Equipment and Lease Costs:
In connection with the restructuring activities, management approved and committed the Company to plans to close 29 sites, vacate buildings at the closed sites as well as at other continuing operations, and reduce its workforce by approximately 19,150 employees. These sites were located in Arnhem, Netherlands; Asheville, North Carolina; Bracknell, United Kingdom; Columbus, Ohio; Eatontown, New Jersey; Eindhoven, Netherlands; Freehold, New Jersey; Gloucester, Massachusetts; Hillend, United Kingdom; Horsham, Pennsylvania; Manteca, California; two sites in Ottawa, Ontario; Oxford, United Kingdom; Piscataway, New Jersey; Plymouth, United Kingdom; Raleigh, North Carolina; Richardson, Texas; Rochester, New York; two sites in San Jose, California; Shunde, China; Sydney, Australia; Taipei, Taiwan; Toronto, Ontario; Torquay, United Kingdom; Victoria, British Columbia; Waghaeusel-Kirrlach, Germany; and Witham, United Kingdom. One of the San Jose, California sites is related to the E-TEK operations, which were relocated to the Company’s other sites located in West Trenton, New Jersey and Shenzhen, China. The Company’s San Jose headquarters continues to occupy a portion of the E-TEK site.
Property and equipment that were disposed of or removed from operations resulted in initial charges totaling $274.4 million. The property and equipment write-downs consisted primarily of owned buildings, leasehold
A-93
JDS UNIPHASE CORPORATION
NOTES TO CONSOLIDATED FINANCIAL STATEMENTS — (Continued)
improvements, computer equipment and related software, production and engineering equipment, and office equipment, furniture and fixtures. Through fiscal 2004, the Company recorded total adjustments of $11.4 million, primarily due to additional declines in the fair market value of owned buildings held for disposal. In addition, the Company received $8.4 million of cash proceeds in excess of the estimated salvage value of certain restructured assets sold through fiscal 2004.
The Company incurred initial charges totaling $156.0 million for exiting and terminating leases based on assumptions and related estimates that it deemed appropriate for the economic environment that existed at the time these estimates were made. Initial charges were accrued for phases one though five and seven through nine. The Company estimated the cost of exiting and terminating the facility leases based on the contractual terms of the agreements and real estate market conditions. However, due to the continued deterioration of the commercial real estate market, primarily in the U.S., and the final settlement of certain lease obligations, the Company made appropriate adjustments to the initial restructuring charges recorded for all the phases. The Company’s accrued lease liability for all plans of $76.6 million at June 30, 2004, was net of $24.9 million of estimated sublease income to be generated from sublease contracts not yet negotiated and estimated savings on settlement of future lease terminations.
The following table summarizes the various restructuring plans (in millions):
| Workforce Reduction | Facilities and Equipment | Lease Costs | Total | |||||||||||||
|---|---|---|---|---|---|---|---|---|---|---|---|---|---|---|---|---|
| Accrual balance as of June 30, 2001 | $ | 43.1 | $ | — | $ | 62.1 | $ | 105.2 | ||||||||
| Restructuring charges — GRP | 82.5 | 151.7 | 50.8 | 285.0 | ||||||||||||
| Cash payments | (90.5 | ) | — | (30.6 | ) | (121.1 | ) | |||||||||
| Adjustments | (15.5 | ) | 2.2 | (6.1 | ) | (19.4 | ) | |||||||||
| Cash proceeds in excess of salvage value | — | (5.6 | ) | — | (5.6 | ) | ||||||||||
| Non-cash charges | — | (148.3 | ) | — | (148.3 | ) | ||||||||||
| Accrual balance as of June 30, 2002 | 19.6 | — | 76.2 | 95.8 | ||||||||||||
| Restructuring charges — GRP | 64.5 | 0.5 | 39.9 | 104.9 | ||||||||||||
| Cash payments | (60.1 | ) | — | (20.8 | ) | (80.9 | ) | |||||||||
| Adjustments | 2.6 | 9.2 | 13.0 | 24.8 | ||||||||||||
| Cash proceeds in excess of salvage value | — | (2.8 | ) | — | (2.8 | ) | ||||||||||
| Non-cash charges | (1.2 | ) | (6.9 | ) | 0.4 | (7.7 | ) | |||||||||
| Accrual balance as of June 30, 2003 | 25.4 | — | 108.7 | 134.1 | ||||||||||||
| Restructuring charges — GRP | 2.5 | — | 2.3 | 4.8 | ||||||||||||
| Cash payments | (24.0 | ) | — | (19.2 | ) | (43.2 | ) | |||||||||
| Adjustments | (0.4 | ) | — | (15.2 | ) | (15.6 | ) | |||||||||
| Restructuring charges — Q3’04–Q4’04 | 5.6 | — | — | 5.6 | ||||||||||||
| Cash payments | (1.5 | ) | — | — | (1.5 | ) | ||||||||||
| Accrual balance as of June 30, 2004 | $ | 7.6 | $ | — | $ | 76.6 | $ | 84.2 | ||||||||
A-94
JDS UNIPHASE CORPORATION
NOTES TO CONSOLIDATED FINANCIAL STATEMENTS — (Continued)
Charges Other Than Restructuring:
In addition to the charges recorded in connection with the restructuring activities, the Company has incurred total other charges of $481.7 million since inception related to the GRP. Details of these charges for the fiscal years 2004, 2003 and 2002 were as follows (in millions):
| Years Ended June 30, | |||||||||||||||
|---|---|---|---|---|---|---|---|---|---|---|---|---|---|---|---|
| 2004 | 2003 | 2002 | |||||||||||||
| Property and equipment | $ | 1.9 | $ | 36.3 | $ | 164.7 | |||||||||
| Purchase commitments and other obligations | 1.6 | (2.5 | ) | (7.4 | ) | ||||||||||
| Workforce-related charges | 1.8 | 14.7 | 12.3 | ||||||||||||
| Lease costs | (0.8 | ) | 5.5 | 6.4 | |||||||||||
| Moving and other costs | 2.3 | 1.7 | 6.7 | ||||||||||||
| Total other charges | $ | 6.8 | $ | 55.7 | $ | 182.7 | |||||||||
Through fiscal 2004, the Company has incurred total charges related to property and equipment of $209.3 million. During the fiscal years ended 2004, 2003 and 2002, the Company recorded $1.9 million, $36.3 million and $164.7 million, respectively, of additional depreciation from changes in the estimated useful life and the write-downs of certain property and equipment that were identified for disposal but remained in use until the date of disposal. Total amounts recorded were net of cash proceeds of $0.7 million, $3.2 million and $3.8 million, received in 2004, 2003 and 2002 respectively.
Through fiscal 2004, the Company has incurred total workforce-related charges of $29.0 million, which included retention bonuses, employee relocations costs and in fiscal 2002, payments for severance and fringe benefits that were not associated with a formal plan of termination. The reduction of approximately 750 employees, in fiscal 2002, which consisted of approximately 600 in manufacturing, 50 in research and development, and 100 in selling, general and administrative functions. Approximately 150 employees were located in North America, 100 in Europe and 500 in Asia-Pacific. All 750 employees have been terminated and severance and benefit payments related to these employees have been paid in full.
Through fiscal 2004, the Company has incurred total lease costs of $11.1 million. During fiscal 2004 the Company adjusted lease expenses by ($0.8) million, primarily to reflect refinements of estimated net costs on building costs not required for ongoing operations. During fiscal 2003, the Company recorded additional lease charges of $5.5 million due primarily to the loss of a sub-tenant in a building in San Jose, California. During fiscal 2002, the Company announced the closure of one site at Piscataway, New Jersey. Lease costs of $6.4 million were primarily related to exiting and terminating building leases at this site. The Company estimated the cost of exiting and terminating the facility lease based on the contractual terms of the agreement and the real estate market conditions. The Company anticipates that it will take approximately 12 months to sublease the vacated property. Amounts related to the lease expense, net of anticipated sublease proceeds of $1.1 million, will be paid over the respective lease terms through fiscal 2011.
Through fiscal 2004, the Company has incurred total moving and other costs of $11.5 million. During the fiscal years ended 2004, 2003 and 2002, the Company incurred moving, purchase and other commitments and other costs of $2.3 million, $1.7 million and $6.7 million, respectively, related to relocation of certain facilities and equipment from buildings of which the Company has disposed of or plans to dispose.
A-95
JDS UNIPHASE CORPORATION
NOTES TO CONSOLIDATED FINANCIAL STATEMENTS — (Continued)
Charges other than restructuring were recorded in the Company’s Consolidated Statements of Operations as follows (in millions):
| Years Ended June 30, | |||||||||||||||
|---|---|---|---|---|---|---|---|---|---|---|---|---|---|---|---|
| 2004 | 2003 | 2002 | |||||||||||||
| Cost of sales | $ | 3.3 | $ | 7.7 | $ | 124.6 | |||||||||
| Research and development | 1.1 | 2.7 | 8.2 | ||||||||||||
| Selling, general and administrative | 2.4 | 45.3 | 49.9 | ||||||||||||
| Total other charges | $ | 6.8 | $ | 55.7 | $ | 182.7 | |||||||||
As of June 30, 2004, the accrual balance related to these charges was $5.3 million, consisting primarily of purchase and lease commitments. The accrual balance is included in “Other current liabilities” in the Company’s Consolidated Balance Sheet.
Recommissioning of Assets:
As the Company continued to execute its restructuring plans to realign its operations and consolidate the facilities, the Company recommissioned certain property and equipment during the fourth quarter of fiscal 2002 with a carrying value of $0 that had previously been removed from operations and fully depreciated or written down under the GRP. These assets were placed back into service due to the following reasons: (i) unanticipated changes in the industry and customer demand for certain product lines, (ii) impact of unforeseen warranty obligations, and (iii) changes in initial estimates. The total net book value of the recommissioned property and equipment at the time of the write-downs was $27.7 million, of which $15.9 million was related to the Communications Products Group, $10.7 million was related to the Commercial and Consumer Products Group and $1.1 million was related to the “All Other” category for segment reporting purposes (see “Note 18. Operating Segments and Geographic Information”). Based on the dates these assets were placed back into service and taking into consideration the potential impact of the impairment loss on these assets, the Company would have incurred additional depreciation expense of approximately $3.4 million, $4.2 million and $1.5 million for fiscal years ended 2004, 2003 and 2002, respectively.
Note 15. Income Taxes
The Company’s income tax expense (benefit) consisted of the following (in millions):
| Years Ended June 30, | |||||||||||||||
|---|---|---|---|---|---|---|---|---|---|---|---|---|---|---|---|
| 2004 | 2003 | 2002 | |||||||||||||
| Federal: | |||||||||||||||
| Current | $ | (5.0 | ) | $ | 0.0 | $ | (35.8 | ) | |||||||
| Deferred | (6.8 | ) | (6.1 | ) | 462.8 | ||||||||||
| (11.8 | ) | (6.1 | ) | 427.0 | |||||||||||
| State: | |||||||||||||||
| Current | 0.0 | — | — | ||||||||||||
| Deferred | (1.0 | ) | (0.9 | ) | 65.9 | ||||||||||
| (1.0 | ) | (0.9 | ) | 65.9 | |||||||||||
| Foreign: | |||||||||||||||
| Current | (3.0 | ) | (47.5 | ) | (68.0 | ) | |||||||||
| Deferred | — | 68.0 | (187.6 | ) | |||||||||||
| (3.0 | ) | 20.5 | (255.6 | ) | |||||||||||
| Total income tax expense (benefit) | $ | (15.8 | ) | $ | 13.5 | $ | 237.3 | ||||||||
A-96
JDS UNIPHASE CORPORATION
NOTES TO CONSOLIDATED FINANCIAL STATEMENTS — (Continued)
The tax benefit associated with exercises of stock options for the fiscal year ended June 30, 2004 was $0.8 million. There was no tax benefit associated with exercise of stock options for the fiscal year ended June 30, 2003. The tax benefit associated with exercises of stock options resulted in tax refunds of $23.0 million in fiscal year ended June 30, 2002 and was credited to additional paid-in capital.
The Company’s loss before income taxes and cumulative effect of accounting change consisted of the following (in millions):
| Years Ended June, | |||||||||||||||
|---|---|---|---|---|---|---|---|---|---|---|---|---|---|---|---|
| 2004 | 2003 | 2002 | |||||||||||||
| Domestic | $ | (70.7 | ) | $ | (703.0 | ) | $ | (8,099.4 | ) | ||||||
| Foreign | (57.7 | ) | (217.3 | ) | (401.6 | ) | |||||||||
| Loss before income taxes and effect of an accounting change | $ | (128.4 | ) | $ | (920.3 | ) | $ | (8,501.0 | ) | ||||||
The Company’s manufacturing operations in Beijing, China, operate under a tax holiday that is effective from January 1, 2003 to December 31, 2004, subject to certain conditions. The net impact of the tax holiday was to increase the Company’s net loss in fiscal 2004 by approximately $3.2 million.
Cumulative undistributed earnings of the Company’s foreign subsidiaries for which no U.S. income taxes have been provided aggregated approximately $12.0 million at June 30, 2004. These earnings are considered to be indefinitely invested in non-U.S. operations. The Company estimates that less than $0.4 million of additional taxes would have to be provided if these earnings were repatriated back to the U.S.
A reconciliation of the Company’s income tax expense (benefit) at the federal statutory rate to the income tax expense (benefit) at the effective tax rate is as follows (in millions):
| Years Ended June 30, | |||||||||||||||
|---|---|---|---|---|---|---|---|---|---|---|---|---|---|---|---|
| 2004 | 2003 | 2002 | |||||||||||||
| Income tax expense (benefit) computed at federal statutory rate | $ | (44.9 | ) | $ | (322.1 | ) | $ | (2,975.3 | ) | ||||||
| State taxes, net of federal benefit | — | — | 42.8 | ||||||||||||
| Foreign earnings | (3.3 | ) | — | — | |||||||||||
| Reduction of goodwill | — | 79.0 | 1,442.9 | ||||||||||||
| Non-deductible amortization | 3.6 | 3.8 | 428.3 | ||||||||||||
| Valuation allowance | 31.9 | 250.8 | 1,315.4 | ||||||||||||
| Years Ended June 30, | |||||||||||||||
|---|---|---|---|---|---|---|---|---|---|---|---|---|---|---|---|
| 2004 | 2003 | 2002 | |||||||||||||
| Tax exempt income | — | — | (9.1 | ) | |||||||||||
| Reversal of previously accrued taxes | (4.6 | ) | — | — | |||||||||||
| Other | 1.5 | 2.0 | (7.7 | ) | |||||||||||
| Income tax expense (benefit) | $ | (15.8 | ) | $ | 13.5 | $ | 237.3 | ||||||||
A-97
JDS UNIPHASE CORPORATION
NOTES TO CONSOLIDATED FINANCIAL STATEMENTS — (Continued)
The components of the Company’s net deferred taxes consisted of the following (in millions):
| June 30, | |||||||||||
|---|---|---|---|---|---|---|---|---|---|---|---|
| 2004 | 2003 | ||||||||||
| Gross deferred tax assets: | |||||||||||
| Tax credit carryforwards | $ | 97.6 | $ | 69.2 | |||||||
| Net operating loss carryforwards | 1,644.3 | 1,539.4 | |||||||||
| Inventories | 92.6 | 111.3 | |||||||||
| Accruals and reserves | 54.5 | 92.4 | |||||||||
| Other | 86.9 | 137.8 | |||||||||
| Acquisition-related items | 515.9 | 576.3 | |||||||||
| Gross deferred tax assets | 2,491.8 | 2,526.4 | |||||||||
| Valuation allowance | (2,450.5 | ) | (2,489.5 | ) | |||||||
| Deferred tax assets | 41.3 | 36.9 | |||||||||
| Deferred tax liabilities: | |||||||||||
| Acquisition related items | (27.0 | ) | (27.6 | ) | |||||||
| Investment holdings | (14.3 | ) | (9.3 | ) | |||||||
| Deferred tax liabilities | (41.3 | ) | (36.9 | ) | |||||||
| Total net deferred tax assets | $ | 0 | $ | 0 | |||||||
The valuation allowance decreased by $39.0 million in fiscal 2004, increased by $219.2 million in fiscal 2003 and $1,274.3 million in fiscal 2002. Decreases in the valuation allowance in fiscal 2004 were due to the net effects of write-offs of deferred tax assets recorded in prior business combinations relating to assumed employee stock options that either expired unexercised or were exercised during the year when the market value of the underlying stock was less than the previously recorded value and decreases in inventory and other reserves and increased for losses incurred. Increases in the valuation allowance for domestic deferred tax assets recorded in fiscal 2003 and 2002 were due to reductions in the Company’s forecasts of future domestic taxable income and the elimination of deferred tax liabilities recorded in prior business combinations. Due to the continued economic uncertainty in the industry, the Company has recorded deferred tax assets as of June 30, 2004 only to the extent of deferred tax liabilities.
Approximately $477.6 million of the valuation allowance as of June 30, 2004 was attributable to stock option deductions, the benefit of which will be credited to paid-in capital when and if realized. Approximately $52.2 million of the valuation allowance as of June 30, 2004 was attributable to deferred tax assets that when realized, will first reduce unamortized goodwill, the other non-current intangible assets of acquired subsidiaries, and then income tax expense.
During fiscal 2004, the Company settled certain foreign and domestic tax examinations relating to pre-acquisition periods of acquired subsidiaries. Approximately $1.4 million was recorded as an increase to goodwill in connection with the settlements. The Company is currently subject to various federal, state and foreign audits by taxing authorities. The Company believes that adequate amounts have been provided for any adjustments that may result from these examinations.
During the fourth quarter of fiscal 2004, the Company recorded a $2.0 million tax benefit as a result of obtaining a tax clearance certificate in connection with the liquidation of one of the Company’s foreign subsidiaries. In August 2004, the Company recorded a $2.6 million tax benefit as of June 30, 2004 to reflect a reduction in previously estimated foreign tax liabilities as a result of the Company’s resolution of certain foreign tax audit issues with foreign taxing authorities. The $2.6 million benefit is reflected in the Company’s consolidated balance sheet as of June 30, 2004 under the caption “Income taxes payable” and in the consolidated statement of operations for the year ended June 30, 2004 under the caption “Income tax expense (benefit).”
Included in the $13.5 million provision for income taxes recorded for fiscal year 2003 was an $18.0 million expense related to the prior financial reporting period ended June 30, 2002 that resulted from an increase in the
A-98
JDS UNIPHASE CORPORATION
NOTES TO CONSOLIDATED FINANCIAL STATEMENTS — (Continued)
Company’s valuation allowance for deferred tax assets. During the year ended 2003, Canadian tax authorities completed a review of the Company’s pending claims for refunds of prior year income taxes. As a result of this review, certain matters related to carryback periods and minimum taxes were identified that caused the Company to conclude that it had recorded $18.0 million of net deferred tax assets in excess of income taxes actually recoverable from prior years and, therefore, necessitated the recording of an additional valuation allowance for deferred tax assets. As of June 30, 2002, management concluded that due to the existing economic environment, the Company should not record net deferred tax assets in excess of recoverable income taxes. The $18.0 million amount recorded in fiscal year 2003 was not material to the period in which it should have been recorded nor material to the consolidated results of operations for the year ended June 30, 2003. The impact on the net loss for the year ended June 30, 2002 would have been an increase of $18.0 million, and the basic and diluted net loss per share would have increased by $0.01 and the Company would have restated the consolidated balance sheet as of June 30, 2002 by reducing the net deferred income tax assets by $18.0 million. Net loss for the year ended June 30, 2003 would have decreased by $18.0 million, and the basic and diluted net loss per share would have decreased by $0.01.
As of June 30, 2004, the Company had federal, state and foreign net operating loss carryforwards of $4,073.4 million, $2,265.9 million and $286.7 million, respectively, and federal, state and foreign research and other tax credit carryforwards of $41.8 million, $29.4 million and $36.6 million, respectively. The net operating loss and tax credit carryforwards will expire at various dates beginning in fiscal 2005 through 2024, if not utilized.
Note 16. Related Party Transactions
Adept:
On October 22, 2001, the Company entered into an automation development alliance agreement with Adept for optical component and module manufacturing processes. Under the agreement, Adept agreed to pay the Company up to $5.0 million for certain research and development activities. In connection with this alliance, the Company invested $25.0 million in Adept’s convertible preferred stock (during fiscal 2004 this investment was converted into common stock) and the investment was accounted for under the cost method. During fiscal 2003, the Company determined that the decline in fair value of its Adept investment was other-than-temporary and wrote the investment down to zero.
During the second quarter of fiscal 2003, the Company and Adept mutually terminated the automation development alliance agreement. As a result of the termination, Adept issued a promissory note of $1.0 million to pay off its outstanding obligation of the same amount to the Company. Adept paid the promissory note during the second quarter of fiscal 2004.
Innovance Networks:
As of June 30, 2004, Innovance Networks (“Innovance”), a privately held company which was a significant customer of the Company in prior years but not in fiscal 2004, declared bankruptcy. As of June 30, 2004 the Company’s investment in Innovance is valued at $0.
Fabrinet:
As of June 30, 2004, Fabrinet a privately held contract manufacturing company in which the Company has a long-term investment, was a significant customer of the Company. As of June 30, 2004 the Company’s investment in Fabrinet is $2.0 million.
A-99
JDS UNIPHASE CORPORATION
NOTES TO CONSOLIDATED FINANCIAL STATEMENTS — (Continued)
BaySpec:
As of June 30, 2004, BaySpec, a privately held OEM fiber-optics company in which the Company has a long-term investment, was a supplier of the Company. As of June 30, 2004 the Company’s investment in Bayspec is $1.7 million.
Sifam Fibre Optics:
As of June 30, 2004, Sifam Fibre Optics (“Sifam”), a privately held company in which the Company has a long-term investment was a supplier of the Company. As of June 30, 2004 the Company’s investment in Sifam is $0.9 million.
Transactions and balances with Adept, Innovance, Fabrinet, BaySpec and Sifam were as follows (in millions):
| Years Ended June 30, | |||||||||||||||
|---|---|---|---|---|---|---|---|---|---|---|---|---|---|---|---|
| 2004 | 2003 | 2002 | |||||||||||||
| Net revenue: | |||||||||||||||
| Adept | $ | — | $ | — | $ | 3.0 | |||||||||
| Innovance | — | 1.8 | 13.6 | ||||||||||||
| Fabrinet | 5.8 | — | 0.3 | ||||||||||||
| BaySpec | — | — | — | ||||||||||||
| Sifam | — | — | — | ||||||||||||
| Net purchases: | |||||||||||||||
| Adept | $ | — | $ | — | $ | — | |||||||||
| Innovance | — | — | — | ||||||||||||
| Fabrinet | 31.1 | 1.8 | 3.2 | ||||||||||||
| BaySpec | 1.4 | — | — | ||||||||||||
| Sifam | 3.7 | 1.1 | 1.0 | ||||||||||||
| June 30, | |||||||||||
|---|---|---|---|---|---|---|---|---|---|---|---|
| 2004 | 2003 | ||||||||||
| Accounts Receivable: | |||||||||||
| Adept | $ | — | $ | 1.0 | |||||||
| Innovance | — | 0.3 | |||||||||
| Fabrinet | 0.9 | — | |||||||||
| BaySpec | — | — | |||||||||
| Sifam | — | — | |||||||||
| Accounts Payable: | |||||||||||
| Adept | $ | — | $ | — | |||||||
| Innovance | — | — | |||||||||
| Fabrinet | 2.3 | 1.4 | |||||||||
| BaySpec | 1.2 | — | |||||||||
| Sifam | 0.3 | 0.4 | |||||||||
Note 17. Mergers and Acquisitions
E2O Communications:
On May 17, 2004, the Company purchased E2O Communications Incorporated (“E2O”), a manufacturer of high-performance fiber optic components and modules for the computer storage, internetworking and communication markets. The Company believes the acquisition will extend its product portfolio and customer base in the optical transceiver market. The acquired business has been included in our Communications Product Group operating segment. Under the terms of the acquisition, the Company will pay the shareholders of E2O $60.0 million in cash, and as of June 30, 2004 the Company had incurred $0.2 million of transaction related costs. Of the $60.2 million purchase price, $9.2 million remains to be paid to the shareholders and is accrued within other liabilities. The $9.2 million includes $5.5 million of retained consideration for any future liabilities the Company may incur resulting from any breach of general representations or warranties made by the former shareholders of E2O and $3.7 million awaiting exchange pending the receipt of shares from various shareholders. Pro forma results of operations have not been presented because the effect of the acquisition was not material.
A-100
JDS UNIPHASE CORPORATION
NOTES TO CONSOLIDATED FINANCIAL STATEMENTS — (Continued)
Allocation of the purchase price was as follows (in millions):
| Net tangible assets acquired | $ | 12.5 | ||||
| Intangible assets acquired | ||||||
| Existing technology | 6.2 | |||||
| Customer relationships | 2.3 | |||||
| Supply agreements | 0.4 | |||||
| In-process research and development | 2.6 | |||||
| Goodwill | 36.2 | |||||
| Total purchase price | $ | 60.2 |
The acquired intangible assets are being amortized over their estimated useful lives, which are presented in the table below:
| Existing technology | 5 years | |||||
| Customer relationships | 3 years | |||||
| Supply agreements | 3 years | |||||
| On an aggregate basis. | 4 years | |||||
The acquisition was accounted for as a purchase in accordance with SFAS No. 141, and accordingly, the tangible assets acquired were recorded at their fair value at the date of acquisition. The results of operations of E2O have been included in the Company’s financial statements subsequent to the date of acquisition. Pro forma results of operations have not been presented because the effect of the acquisition was not material.
The following table summarizes the components of the tangible assets acquired:
| Inventories | $ | 5.4 | ||||
| Property and equipment | 8.9 | |||||
| Net acquired other assets and liabilities. | (1.8 | ) | ||||
| $ | 12.5 |
A portion of the purchase prices has been allocated to existing technology and in-process research and development (“IPR&D”). These were identified and valued through an analysis of data provided by E2O concerning developmental products, their stage of development, the time and resources needed to complete them, if applicable, target markets, their expected income generating ability and associated risks. The Income Approach, which is based on the premise that the value of an asset is the present value of its future earning capacity that is available for distribution to the subject investors in the asset.
Developmental projects that had not reached technological feasibility and had no future alternative uses were classified as IPR&D and expensed in the fourth quarter of fiscal 2004. The nature of the efforts required to develop the IPR&D into commercially viable products principally relates to the completion of all planning, designing, prototyping, verification and testing activities that are necessary to establish that the products can be produced to meet their design specifications, including functions, features and technical performance requirements.
The estimates used in valuing IPR&D were based upon assumptions believed to be reasonable but which are inherently uncertain and unpredictable. Assumptions may be incomplete or inaccurate, and no assurance can be given that unanticipated events and circumstances will not occur. Accordingly, actual results may vary from the projected results.
The rates utilized to discount the net cash flows to their present value are based on E2O’s estimated weighted average cost of capital. Given the nature of the risks associated with the difficulties and uncertainties in completing each project and thereby achieving technological feasibility, anticipated market acceptance and penetration, market growth rates and risks related to the impact of potential changes in future target markets, a discount rate of 19% and 22% were deemed appropriate for the existing technology and IPR&D, respectively.
A-101
JDS UNIPHASE CORPORATION
NOTES TO CONSOLIDATED FINANCIAL STATEMENTS — (Continued)
The acquired existing technology, which is comprised of products that are already technologically feasible, includes small form factor transceivers, gigabit interface converters, and the positive-intrinsic-negative (“PIN”) portion of optical receivers. The acquired existing technology represents the optical transceiver business’ trade secrets and patents developed through years of experience in design, package and manufacture of optical transceiver products for the storage area networks and local area networks.
Goodwill, which represents the excess of the purchase price over the fair value of tangible and identified intangible assets acquired, is not being amortized but will be reviewed annually for impairment, or more frequently if impairment indicators arise, in accordance with SFAS No. 142. Goodwill has been assigned to the Transmissions Products Group within the Communications segment and is not expected to be deductible for tax purposes under Internal Revenue Code 197.
Ditech Communications:
On July 16, 2003, the Company completed the acquisition of a component of the optical communications business of Ditech Communications (“Ditech”). The Company believes that the acquisition adds to its abilities to integrate optics, electronics and software in subsystems for optical equipment manufacturers. Under the terms of the agreement, the Company paid Ditech $1.4 million in cash at closing.
The Company’s maximum obligation is $4.9 million, of which $0.9 million is based on the level of inventory purchased from Ditech that is sold by the Company, and $4.0 million is contingent upon the revenue generated by the acquired business through June 30, 2005. At June 30, 2004, the Company has paid approximately $0.5 million, related to revenue levels attained through that date. Contingent payments based on revenue will be accounted for as goodwill. Settlement of any outstanding issues under the terms of the acquisition will be completed during fiscal 2005. Direct transaction costs incurred in connection with the acquisition were immaterial.
The purchase price allocation was as follows (in millions):
| Net tangible assets acquired | $ | 1.5 | ||||
| Intangible assets acquired: Existing technology | 0.1 | |||||
| Total purchase price | $ | 1.6 |
Existing technology is being amortized over its estimated useful life of three years.
The acquisition was accounted for as a purchase transaction under SFAS No. 141, and accordingly, the tangible assets acquired were recorded at their fair value at the date of the acquisition. The results of operations of Ditech have been included in the Company’s financial statements subsequent to the date of acquisition. Pro forma results of operations have not been presented because the effect of the acquisition was not material.
The following table summarizes the components of the net tangible assets acquired (in millions):
| Inventories | $ | 1.0 | ||||
| Property and equipment | 0.5 | |||||
| Net tangible assets acquired | $ | 1.5 |
TriQuint:
On May 6, 2003, the Company acquired the undersea pump laser assets from TriQuint Semiconductor, Inc (“TriQuint) for $6.6 million in cash. The acquisition was consistent with the Company’s strategy to provide higher levels of integration in its pump lasers, and helps position the Company to be a leading supplier of submarine pump modules. Direct transaction costs incurred in connection with the acquisition were immaterial.
A-102
JDS UNIPHASE CORPORATION
NOTES TO CONSOLIDATED FINANCIAL STATEMENTS — (Continued)
The purchase price allocation was as follows (in millions):
| Net tangible assets acquired | $ | 1.0 | ||||
| Intangible assets acquired: | ||||||
| Developed Technology | 1.0 | |||||
| Goodwill | 4.6 | |||||
| Total purchase price | $ | 6.6 |
The developed technology is being amortized over its estimated useful life of four years.
The acquisition was accounted for as a purchase transaction under SFAS No. 141, and accordingly, the tangible assets acquired were recorded at their fair value at the date of the acquisition. The results of operations of TriQuint have been included in the Company’s financial statements subsequent to the date of acquisition. Pro forma results of operations have not been presented because the effect of the acquisition was not material.
The following table summarizes the components of the net tangible assets acquired (in millions):
| Inventories | $ | 0.4 | ||||
| Property, plant and equipment | 0.6 | |||||
| Total assets acquired | 1.0 | |||||
| Net tangible assets acquired. | $ | 1.0 |
Goodwill of $4.6 million has been assigned to the Communication Products Group and is expected to be deductible for tax purposes under Internal Revenue Code 197.
L.A. Label:
On January 21, 2003, the Company acquired L.A. Label Corporation (“LAL”), a supplier of pressure-sensitive labels for a variety of industrial and commercial applications. The Company believes that the acquisition will expand its capability to provide integrated optical technology solutions for product security and brand authentication markets. The consideration consisted of $19.4 million in cash, of which $17.4 million has been paid to the former shareholders of LAL. At the time of the acquisition, the Company retained $2.0 million of the cash consideration for any liabilities the Company may have incurred resulting from any breach of general representations or warranties made by the former shareholders of LAL. The retained amount was paid to the former shareholders of LAL in July 2004. Direct transaction costs incurred in connection with the acquisition were immaterial.
The purchase price allocation was as follows (in millions):
| Net tangible assets acquired | $ | 4.5 | ||||
| Intangible assets acquired: | ||||||
| Customer relationships | 4.4 | |||||
| Trademark/tradename | 2.9 | |||||
| Internal use software | 0.5 | |||||
| Goodwill | 7.1 | |||||
| Total purchase price | $ | 19.4 |
Intangible assets are being amortized over their estimated useful lives of five years for customers relationship, ten years for trademark / tradename, and five years for internal use software.
A-103
JDS UNIPHASE CORPORATION
NOTES TO CONSOLIDATED FINANCIAL STATEMENTS — (Continued)
The acquisition was accounted for as a purchase transaction under SFAS No. 141, and accordingly, the tangible assets acquired and liabilities assumed were recorded at their fair value at the date of the acquisition. The results of operations of LAL have been included in the Company’s financial statements subsequent to the date of acquisition. Pro forma results of operations have not been presented because the effect of the acquisition was not material.
The following table summarizes the components of the net tangible assets acquired (in millions):
| Cash and cash equivalents | $ | 0.8 | ||||
| Accounts receivables and prepaid expenses | 1.8 | |||||
| Inventories | 0.5 | |||||
| Property, plant and equipment | 2.2 | |||||
| Other assets | 0.1 | |||||
| Total assets acquired | $ | 5.4 | ||||
| Accounts payable | (0.3 | ) | ||||
| Long-term debt | (0.2 | ) | ||||
| Other liabilities | (0.4 | ) | ||||
| Total liabilities assumed | (0.9 | ) | ||||
| Net tangible assets acquired | $ | 4.5 |
Goodwill of $7.1 million has been assigned to the Commercial and Consumer Products Group and is not expected to be deductible for tax purposes under Internal Revenue Code 197.
OptronX:
On September 18, 2002, the Company completed the acquisition of the transceiver/transponder business unit of OptronX. The Company believes that the acquisition will extend its transmission product line in metro and short-reach applications. The Company paid OptronX $6.2 million in cash. Direct transaction costs incurred in connection with the acquisition were immaterial.
The final purchase price allocation was as follows (in millions):
| Net tangible liabilities assumed | $ | (0.3 | ) | |||
| Intangible assets acquired: | ||||||
| Existing technology | 1.0 | |||||
| In-process research and development | 0.4 | |||||
| Goodwill | 5.1 | |||||
| Total purchase price | $ | 6.2 |
Existing technology is being amortized over its estimated useful lives of three years.
A-104
JDS UNIPHASE CORPORATION
NOTES TO CONSOLIDATED FINANCIAL STATEMENTS — (Continued)
The acquisition was accounted for as a purchase transaction in accordance with SFAS No. 141, and accordingly, the assets acquired and liabilities assumed were recorded at their estimated fair value at the date of the acquisition. The results of operations of the transceiver/transponder unit have been included in the Company’s financial statements subsequent to the date of acquisition. Pro forma results of operations have not been presented because the effect of the acquisition was not material.
The following table summarizes the components of the net tangible liabilities assumed (in millions):
| Accounts receivable | $ | 0.2 | ||||
| Inventories | 0.8 | |||||
| Property and equipment | 2.7 | |||||
| Total assets acquired | 3.7 | |||||
| Accounts payable | (0.8 | ) | ||||
| Loan payable | (2.5 | ) | ||||
| Other | (0.7 | ) | ||||
| Total liabilities assumed | (4.0 | ) | ||||
| Net tangible liabilities assumed | $ | (0.3 | ) |
A portion of the purchase price has been allocated to existing technology and acquired in-process research and development (“IPR&D”). They were identified and valued through analysis of data provided by OptronX concerning developmental products, their stage of development, the time and resources needed to complete them, their expected income generating ability, target markets and associated risks. The Income Approach was the primary technique used in valuing the existing technology. The discount rate used was 20%.
Those developmental projects that had not reached technological feasibility and had no future alternative uses were classified as IPR&D and expensed in the first quarter of fiscal 2003. The nature of the efforts required to develop the IPR&D into commercially viable products principally relates to the completion of all planning, designing, prototyping, verification and testing activities that are necessary to establish that the products can be produced to meet their design specifications, including functions, features and technical performance requirements.
Goodwill of $5.1 million has been assigned to the Communications Products Group and is expected to be deductible for tax purposes under Internal Revenue Code 197.
Scion:
On April 26, 2002, the Company acquired Scion, a provider of application-specific photonic solutions based on planar lightwave circuit manufacturing. The Company was a minority shareholder of Scion with an investment of $5.0 million, or approximately 6% ownership, prior to the acquisition. The consideration consisted of an additional $45.4 million in cash to complete the acquisition. The Company also incurred an estimated $0.1 million in direct transaction costs.
The total purchase price of the acquisition is summarized as follows (in millions):
| Cash consideration | $ | 50.4 | ||||
| Transaction costs | 0.1 | |||||
| Total purchase price | $ | 50.5 |
A-105
JDS UNIPHASE CORPORATION
NOTES TO CONSOLIDATED FINANCIAL STATEMENTS — (Continued)
The allocation of the total purchase price was as follows (in millions):
| Net tangible assets acquired | $ | 14.6 | ||||
| Intangible assets acquired: | ||||||
| Existing technology | 7.6 | |||||
| Core technology | 3.2 | |||||
| In-process research and development | 3.2 | |||||
| Goodwill | 21.9 | |||||
| Total purchase price | $ | 50.5 |
The weighted-average useful lives of the acquired intangible assets were 3 years.
The acquisition was accounted for as a purchase transaction under SFAS No. 141, and accordingly, the tangible assets acquired and liabilities assumed were recorded at their fair value at the date of the acquisition. The results of operations of Scion have been included in the Company’s financial statements subsequent to the date of acquisition. Pro forma results of operations have not been presented because the effect of the acquisition was not material.
The following table summarizes the components of the net tangible assets acquired (in millions):
| Cash | $ | 0.5 | ||||
| Inventories | 2.0 | |||||
| Other current assets | 0.9 | |||||
| Property and equipment | 15.9 | |||||
| Other assets | 0.3 | |||||
| Total tangible assets acquired | 19.6 | |||||
| Current liabilities: | ||||||
| Accrued site closure costs | (2.7 | ) | ||||
| Other | (2.3 | ) | ||||
| Net tangible assets acquired | $ | 14.6 |
The tangible assets included an adjustment of $0.2 million to write up inventories and an adjustment of $1.9 million to write down property and equipment to their respective fair values.
A portion of the purchase price has been allocated to existing technology, core technology and acquired in-process research and development (“IPR&D”). These intangible assets were identified and valued through analysis of data provided by Scion concerning developmental products, their stage of development, the time and resources needed to complete them, if applicable, their expected income generating ability, target markets and associated risks. The Income Approach, which includes an analysis of the markets, cash flows and risks associated with achieving such cash flows, was the primary technique utilized in the valuation.
Those developmental projects that had not reached technological feasibility and had no future alternative uses were classified as IPR&D and expensed in the fourth quarter of fiscal 2002. The nature of the efforts required to develop the IPR&D into commercially viable products principally relates to the completion of all planning, designing, prototyping, verification and testing activities that are necessary to establish that the products can be produced to meet their design specifications, including functions, features and technical performance requirements.
The estimates used in valuing IPR&D were based upon assumptions believed to be reasonable but which are inherently uncertain and unpredictable. Assumptions may be incomplete or inaccurate, and no assurance can be given that unanticipated events and circumstances will not occur. Accordingly, actual results may vary from the projected results.
The rates utilized to discount the net cash flows to their present value were based on Scion’s weighted average cost of capital. Given the nature of the risks associated with the difficulties and uncertainties in completing each
A-106
JDS UNIPHASE CORPORATION
NOTES TO CONSOLIDATED FINANCIAL STATEMENTS — (Continued)
project and thereby achieving technological feasibility, anticipated market acceptance and penetration, market growth rates and risks related to the impact of potential changes in future target markets, discount rates of 25%, 31% and 40% were determined to be appropriate for existing technology, core technology and IPR&D, respectively.
The acquired existing technology, which is comprised of products that are already technologically feasible, includes arrayed waveguide grating devices, variable optical attenuator arrays and other advanced integrated devices.
Goodwill has been assigned to the Communications Products Group operating segment and is not expected to be deductible for tax purposes over 15 years under Internal Revenue Code 197.
IBM’s Optical Transceiver Business:
On December 28, 2001, the Company acquired IBM’s optical transceiver business. The Company believes that the acquisition will extend its product portfolio to provide optical solutions beyond its existing telecommunications markets to the growing enterprise data communications markets. Under the terms of the acquisition, the Company paid IBM $100.0 million in cash and issued 26.9 million shares of the Company’s common stock valued at $232.3 million using an average market price of $8.65 per share. The average market price was based on the average closing price for a range of trading days around the announcement date of the acquisition (December 19, 2001). The Company incurred an estimated $6.3 million in direct transaction costs and recorded total adjustments of $2.7 million as a result of final valuation of the inventories acquired.
The total purchase price of the acquisition is summarized as follows (in millions):
| Value of common stock issued | $ | 232.3 | ||||
| Cash consideration | 100.0 | |||||
| Total consideration | 332.3 | |||||
| Transaction costs | 6.3 | |||||
| Adjustments to purchase price | (2.7 | ) | ||||
| Total purchase price | $ | 335.9 |
The allocation of the total purchase price was as follows (in millions):
| Tangible assets acquired | $ | 30.7 | ||||
| Intangible assets acquired: | ||||||
| Existing technology | 45.1 | |||||
| Core technology | 15.4 | |||||
| Supply/contract manufacturing agreements | 6.4 | |||||
| Non-competition agreement | 1.7 | |||||
| Distribution agreements | 1.7 | |||||
| Real estate license agreement | 0.6 | |||||
| In-process research and development | 22.1 | |||||
| Goodwill | 212.2 | |||||
| Total purchase price | $ | 335.9 |
The weighted-average useful lives of the acquired intangible assets were as follows:
| Existing technology | 5 years | |||||
| Core technology | 5 years | |||||
| Supply / contract manufacturing agreements | 5 years | |||||
| Non-competition agreement | 3 years | |||||
| Distribution agreements | 5 years | |||||
| Real estate license agreement | 1 years | |||||
| On an aggregate basis | 5 years | |||||
A-107
JDS UNIPHASE CORPORATION
NOTES TO CONSOLIDATED FINANCIAL STATEMENTS — (Continued)
The acquisition was accounted for as a purchase transaction in accordance with SFAS No. 141, and accordingly, the tangible assets acquired were recorded at their fair value at the date of the acquisition. No liabilities were assumed from the acquisition. The results of operations of the optical transceiver business have been included in the Company’s financial statements subsequent to the date of acquisition. Pro forma results of operations have not been presented because the effect of the acquisition was not material.
The following table summarizes the components of the tangible assets acquired (in millions):
| Inventories | $ | 14.6 | ||||
| Property and equipment | 16.1 | |||||
| Tangible assets acquired | $ | 30.7 |
The tangible assets included an adjustment of $2.8 million to write up inventories and an adjustment of $13.9 million to write down property and equipment to their respective fair values.
A portion of the purchase price has been allocated to existing technology, core technology and acquired in-process research and development (“IPR&D”). They were identified and valued through analysis of data provided by IBM concerning developmental products, their stage of development, the time and resources needed to complete them, if applicable, their expected income generating ability, target markets and associated risks. The Income Approach, which includes an analysis of the markets, cash flows and risks associated with achieving such cash flows, was the primary technique utilized in valuing existing and core technology and IPR&D.
Those developmental projects that had not reached technological feasibility and had no future alternative uses were classified as IPR&D and expensed in the second quarter of fiscal 2002. The nature of the efforts required to develop the IPR&D into commercially viable products principally relates to the completion of all planning, designing, prototyping, verification and testing activities that are necessary to establish that the products can be produced to meet their design specifications, including functions, features and technical performance requirements.
The estimates used in valuing IPR&D were based upon assumptions believed to be reasonable but which are inherently uncertain and unpredictable. Assumptions may be incomplete or inaccurate, and no assurance can be given that unanticipated events and circumstances will not occur. Accordingly, actual results may vary from the projected results.
The rates utilized to discount the net cash flows to their present value are based on the optical transceiver business’ weighted average cost of capital. Given the nature of the risks associated with the difficulties and uncertainties in completing each project and thereby achieving technological feasibility, anticipated market acceptance and penetration, market growth rates and risks related to the impact of potential changes in future target markets, discount rates of 14%, 27% and 38% were determined to be appropriate for the existing technology, core technology and IPR&D, respectively.
The acquired existing technology, which is comprised of products that are already technologically feasible, includes small form factor transceivers and gigabit interface converters using optical fiber channel and gigabit Ethernet protocols. Goodwill has been assigned to the Communications Products Group operating segment and is expected to be deductible for tax purposes over 15 years under Internal Revenue Code 197.
Note 18. Operating Segments and Geographic Information
The Company evaluates its reportable segments in accordance with SFAS No. 131, “Disclosures about Segments of an Enterprise and Related Information.” For fiscal year 2004 the Company’s Chief Executive Officer, Kevin J. Kennedy was the Company’s Chief Operating Decision Maker (“CODM”) pursuant to SFAS No. 131. The CODM allocates resources to the segments based on their business prospects, competitive factors, net revenue and operating results.
The Company designs and manufactures products for fiberoptic communications, as well as for markets where its core optics technologies provide solutions for industrial, commercial and consumer applications. The two reportable segments are:
A-108
JDS UNIPHASE CORPORATION
NOTES TO CONSOLIDATED FINANCIAL STATEMENTS — (Continued)
| (i) | Communications Products Group: |
The Communications Products Group consists of the Company’s communication businesses, which provide fiberoptic components and modules for system manufacturers in the telecommunications, data communications and cable television industries.
| (ii) | Commercial and Consumer Products Group: |
The Commercial and Consumer Products Group, formerly known as the Thin Film Products Group, consists of the Company’s non-communications businesses and includes laser subsystems products and products for display, security, decorative and aerospace and defense applications.
The accounting policies of the reportable segments are the same as those described in the summary of significant accounting policies. The Company evaluates segment performance based on operating income (loss) excluding inter-segment revenue, which is eliminated in consolidation, and infrequent or unusual items.
The amounts shown as “All other” consists of certain unallocated corporate-level operating expenses. In addition, the Company does not allocate restructuring charges, income taxes, non-operating income and expenses or specifically identifiable assets to its segments. During fiscal 2003, the Company ceased the allocation of corporate sales, marketing, finance and administration expenses to the segments. All prior-period amounts have been restated for comparative presentation.
Information on reportable segments is as follows (in millions):
| Years Ended June 30, | |||||||||||||||
|---|---|---|---|---|---|---|---|---|---|---|---|---|---|---|---|
| 2004 | 2003 | 2002 | |||||||||||||
Communications Product Group: | |||||||||||||||
| Net revenue | $ | 317.4 | $ | 333.0 | $ | 795.9 | |||||||||
| Intersegment revenue | — | — | — | ||||||||||||
| Net revenue from external customers | 317.4 | 333.0 | 795.9 | ||||||||||||
| Operating income (loss) | (43.4 | ) | (167.4 | ) | (284.1 | ) | |||||||||
Commercial and Consumer Products Group: | |||||||||||||||
| Net revenue | 322.7 | 347.5 | 302.3 | ||||||||||||
| Intersegment revenue | (4.2 | ) | (4.6 | ) | — | ||||||||||
| Net revenue from external customers | 318.5 | 342.9 | 302.3 | ||||||||||||
| Operating income (loss) | 54.8 | 54.8 | 34.5 | ||||||||||||
| Total net revenue | $ | 635.9 | $ | 675.9 | $ | 1,098.2 | |||||||||
| Operating income (loss) by reportable segments | $ | 11.4 | $ | (112.6 | ) | $ | (249.6 | ) | |||||||
| All other operating loss | (101.3 | ) | (146.4 | ) | (148.7 | ) | |||||||||
| Unallocated amounts: | |||||||||||||||
| Acquisition-related charges and payroll taxes on stock option exercises | (20.3 | ) | (71.1 | ) | (1,463.5 | ) | |||||||||
| Reduction of goodwill, intangibles and other long-lived assets | (51.8 | ) | (393.6 | ) | (5,979.4 | ) | |||||||||
| Restructuring charges | (11.5 | ) | (121.3 | ) | (260.0 | ) | |||||||||
| Other realignment charges | (6.8 | ) | (55.7 | ) | (182.8 | ) | |||||||||
| Interest and other income, net | 22.7 | 32.5 | 48.3 | ||||||||||||
| Gain (loss) on sale of subsidiaries’ assets | — | (2.2 | ) | 0.1 | |||||||||||
| Gain on sale of investments | 41.2 | 4.0 | 15.0 | ||||||||||||
| Reduction in fair value of investments | (3.8 | ) | (45.4 | ) | (225.8 | ) | |||||||||
| Loss on equity method investments, net | (8.2 | ) | (8.5 | ) | (54.6 | ) | |||||||||
| Loss before income taxes and cumulative effect of an accounting change | $ | (128.4 | ) | $ | (920.3 | ) | $ | (8,501.0 | ) | ||||||
Intersegment sales were recorded at fair market value less an agreed-upon discount.
A-109
JDS UNIPHASE CORPORATION
NOTES TO CONSOLIDATED FINANCIAL STATEMENTS — (Continued)
The Company operates primarily in three geographic regions: North America, Europe and Asia and other. The following table presents net revenue and identifiable assets by geographic regions (in millions):
| Years Ended June 30, | |||||||||||||||
|---|---|---|---|---|---|---|---|---|---|---|---|---|---|---|---|
| 2004 | 2003 | 2002 | |||||||||||||
| Net revenue: | |||||||||||||||
| North America | $ | 406.9 | $ | 474.6 | $ | 807.3 | |||||||||
| Europe | 124.1 | 113.0 | 196.6 | ||||||||||||
| Asia and other | 104.9 | 88.3 | 94.3 | ||||||||||||
| Total net revenue | $ | 635.9 | $ | 675.9 | $ | 1,098.2 | |||||||||
| June 30, | |||||||||||
|---|---|---|---|---|---|---|---|---|---|---|---|
| 2004 | 2003 | ||||||||||
| Assets: | |||||||||||
| North America | $ | 2,297.2 | $ | 1,913.1 | |||||||
| Europe | 9.6 | 49.4 | |||||||||
| Asia and other | 114.7 | 175.3 | |||||||||
| Total assets | $ | 2,421.5 | $ | 2,137.8 | |||||||
Net revenue was assigned to geographic regions based on the customers’ shipment locations. Identifiable assets were identified based on the operations in the corresponding geographic areas.
During fiscal 2004 and 2002, no customer accounted for more than 10% of net revenue. During fiscal 2003, Texas Instruments (a customer of our Commercial and Consumer Products Group) accounted for 12% of net revenue.
Note 19. Sale of Subsidiaries’ Net Assets
The Company realized no net gain (loss) on the sale of subsidiaries’ net assets during fiscal 2004.
The following table summarizes the net gain (loss) the Company realized on the sale of the net assets of three subsidiaries during fiscal 2003 (in millions):
| Gain on sale of Cronos | $ | 0.2 | ||||
| Loss on sale of Epion | (1.7 | ) | ||||
| Loss on sale of SIFAM | (0.7 | ) | ||||
| Total | $ | (2.2 | ) |
During the second quarter of fiscal 2003, the Company completed the sale of the majority of the assets of Cronos; a subsidiary located in Raleigh, North Carolina, to MEMSCAP, a supplier of optical micro-electro-mechanical system (“MEMS”) solutions located in France. As part of the transaction, the Company received 10.5 million shares of MEMSCAP valued at $4.1 million. In addition, the Company received warrants to purchase up to 6.5 million shares of MEMSCAP based on the future performance of Cronos over a 30-month period following the completion of the sale. In connection with the sale, the Company and MEMSCAP entered into a long-term strategic supply relationship, under which MEMSCAP will supply the Company with MEMS products.
During the second quarter of fiscal 2003, the Company completed the sale of SIFAM, a subsidiary located in Torquay, United Kingdom, to SIFAM Fibre Optics Limited. As part of the transaction, the Company received approximately 31,000 preference shares of SIFAM Fibre Optics Limited valued at approximately $0.8 million.
During the fourth quarter of fiscal 2003, the Company completed the sale of the majority of the assets of Epion to New Epion. As part of the transaction, the Company received approximately 0.8 million preferred shares and 0.2 million warrants to purchase preferred shares of New Epion valued at approximately $3.6 million. After adjusting for the net costs of the assets sold, the Company realized a loss of $1.7 million from the transaction.
A-110
JDS UNIPHASE CORPORATION
NOTES TO CONSOLIDATED FINANCIAL STATEMENTS — (Continued)
In fiscal 2002, the Company sold 80.1% of its ownership in Iridian to IST Holdings for $1.1 million in cash, and retained the remaining 19.9%. After adjusting for the net costs of the assets sold and the expenses associated with the divestiture, the Company realized a gain of $0.1 million from the transaction.
Note 20. Guarantees
The Company from time to time enters into certain types of contracts that contingently require the Company to indemnify parties against third-party claims. These contracts primarily relate to: (i) divestiture agreements, under which the Company may provide customary indemnifications to purchasers of the Company’s businesses or assets; (ii) certain real estate leases, under which the Company may be required to indemnify property owners for environmental and other liabilities, and other claims arising from the Company’s use of the applicable premises; and (iii) certain agreements with the Company’s officers, directors and employees, under which the Company may be required to indemnify such persons for liabilities arising out of their employment relationship.
The terms of such obligations vary. Generally, a maximum obligation is not explicitly stated. Because the obligated amounts of these types of agreements often are not explicitly stated, the overall maximum amount of the obligations cannot be reasonably estimated. Historically, the Company has not been obligated to make significant payments for these obligations, and no liabilities have been recorded for these obligations on its balance sheet as of June 30, 2004 or 2003.
Product Warranties:
In general, the Company offers a one-year warranty for most of its products in the Communications Products Group, and a three-month to one-year warranty for most of its products in the Commercial and Consumer Products Group. The Company provides reserves for the estimated costs of product warranties at the time revenue is recognized. The Company estimates the costs of its warranty obligations based on its historical experience of known product failure rates, use of materials to repair or replace defective products and service delivery costs incurred in correcting product failures. In addition, from time to time, specific warranty accruals may be made if unforeseen technical problems arise with specific products. The Company periodically assesses the adequacy of its recorded warranty liabilities and adjusts the amounts as necessary.
The following table presents the changes in the Company’s warranty reserve during 2004 and 2003 (in millions):
| 2004 | 2003 | |||||||||
|---|---|---|---|---|---|---|---|---|---|---|
| Balance as of beginning of year | $ | 52.4 | $ | 73.6 | ||||||
| Provision for warranty | 8.8 | 14.2 | ||||||||
| Utilization of reserve | (17.0 | ) | (18.1 | ) | ||||||
| Adjustments related to pre-existing warranties (including changes in estimates) | (19.1 | ) | (17.3 | ) | ||||||
| Balance as of end of year | $ | 25.1 | $ | 52.4 | ||||||
Note 21. Patent License
During the second quarter of fiscal 2003, the Company determined that a payment on a patent dispute was probable and estimable, and accrued $8.3 million in connection with the dispute and included the amount under “Selling, general and administrative” expense. The Company finalized a royalty-bearing patent license agreement and determined that its total liabilities were $19.2 million as of March 31, 2003. Therefore, the Company accrued an additional $10.9 million in connection with the patent license agreement. Of this amount, $2.2 million was recorded as prepaid royalty expense, which will be amortized to “Cost of sales” through December 2004, and $8.7 million was recorded as royalty expense under “Cost of sales” for the three months ended March 31, 2003. In addition, the Company reclassified the previously recorded $8.3 million of “Selling, general and administrative” expense to royalty expense under “Cost of sales.” Total royalty expense recorded in fiscal 2003 in connection with the patent license was $17.3 million.
A-111
JDS UNIPHASE CORPORATION
NOTES TO CONSOLIDATED FINANCIAL STATEMENTS — (Continued)
In connection with this patent license agreement, the Company will incur additional minimum royalty obligations of $14.0 million to maintain the license over the next four years.
Note 22. Subsequent Events (Unaudited)
On August 3, 2004, the Company announced the acquisition of Advanced Digital Optics, Inc (ADO) for approximately $11.0 million in cash.
A-112
JDS UNIPHASE CORPORATION
NOTES TO CONSOLIDATED FINANCIAL STATEMENTS — (Continued)
Note 23. Quarterly Financial Information (Unaudited)
The following table presents the Company’s quarterly consolidated statements of operations for fiscal 2004 and 2003 (in millions, except per share data):
| June 30, 2004 (5) | March 31, 2004 | December 31, 2003 (4) | September 30, 2003 | June 30, 2003 | March 31, 2003 (3) | December 31, 2002 (2) | September 30, 2002 | |||||||||||||||||||||||||
|---|---|---|---|---|---|---|---|---|---|---|---|---|---|---|---|---|---|---|---|---|---|---|---|---|---|---|---|---|---|---|---|---|
| Net revenue | $ | 174.5 | $ | 161.4 | $ | 152.6 | $ | 147.4 | $ | 160.6 | $ | 165.7 | $ | 156.6 | $ | 193.0 | ||||||||||||||||
| Cost of sales | 133.0 | 121.0 | 120.5 | 115.6 | 121.6 | 142.9 | 171.0 | 185.0 | ||||||||||||||||||||||||
| Gross profit (loss) | 41.5 | 40.4 | 32.1 | 31.8 | 39.0 | 22.8 | (14.4 | ) | 8.0 | |||||||||||||||||||||||
| Operating expenses: | ||||||||||||||||||||||||||||||||
| Research and development | 25.1 | 25.6 | 24.1 | 24.7 | 32.1 | 36.8 | 40.1 | 44.7 | ||||||||||||||||||||||||
| Selling, general and administrative | 33.5 | 35.6 | 34.6 | 41.0 | 58.3 | 70.0 | 73.2 | 65.8 | ||||||||||||||||||||||||
| Amortization of other intangibles | 4.2 | 3.9 | 3.9 | 3.9 | 3.9 | 3.7 | 3.8 | 8.4 | ||||||||||||||||||||||||
| Acquired in-process research and development | 2.6 | — | — | — | — | — | — | 0.4 | ||||||||||||||||||||||||
| Reduction of goodwill | — | — | — | — | — | — | 1.3 | 224.4 | ||||||||||||||||||||||||
| Reduction of other long-lived assets | (1.9 | ) | 10.5 | 38.4 | 4.9 | 2.1 | 11.2 | — | 154.6 | |||||||||||||||||||||||
| Restructuring charges | 4.0 | 1.7 | 9.4 | (3.6 | ) | 6.2 | 16.3 | 75.8 | 23.0 | |||||||||||||||||||||||
| Total operating expenses | 67.5 | 77.3 | 110.4 | 70.9 | 102.6 | 138.0 | 194.2 | 521.3 | ||||||||||||||||||||||||
| Loss from operations | (26.0 | ) | (36.9 | ) | (78.3 | ) | (39.1 | ) | (63.6 | ) | (115.2 | ) | (208.6 | ) | (513.3 | ) | ||||||||||||||||
| Interest and other income, net | 6.2 | 5.1 | 8.5 | 2.9 | 5.9 | 7.1 | 6.6 | 12.9 | ||||||||||||||||||||||||
| Gain (loss) on sale of subsidiaries’ assets | — | — | — | — | (1.7 | ) | — | (0.5 | ) | — | ||||||||||||||||||||||
| Gain on sale of investments | 1.6 | 19.2 | 19.6 | 0.6 | 0.3 | 0.9 | 1.3 | 1.5 | ||||||||||||||||||||||||
| Reduction in fair value of investments | — | (1.5 | ) | (1.1 | ) | (1.3 | ) | (7.7 | ) | (9.8 | ) | (8.8 | ) | (19.1 | ) | |||||||||||||||||
| Loss on equity method investments | (1.6 | ) | (0.5 | ) | (4.7 | ) | (1.2 | ) | (0.8 | ) | (1.2 | ) | (4.0 | ) | (2.5 | ) | ||||||||||||||||
| Loss before income taxes and cumulative effect of an accounting change | (19.8 | ) | (14.6 | ) | (56.0 | ) | (38.1 | ) | (67.6 | ) | (118.2 | ) | (214.0 | ) | (520.5 | ) | ||||||||||||||||
| Income tax expense (benefit) | 1.9 | (7.3 | ) | 2.5 | (12.9 | ) | (6.0 | ) | 18.6 | 0.9 | — | |||||||||||||||||||||
| Loss before cumulative effect of an accounting change | (21.7 | ) | (7.3 | ) | (58.5 | ) | (25.2 | ) | (61.6 | ) | (136.8 | ) | (214.9 | ) | (520.5 | ) | ||||||||||||||||
| Cumulative effect of an accounting change | — | — | — | (2.9 | ) | — | — | — | — | |||||||||||||||||||||||
| Net loss | $ | (21.7 | ) | $ | (7.3 | ) | $ | (58.5 | ) | $ | (28.1 | ) | $ | (61.6 | ) | $ | (136.8 | ) | $ | (214.9 | ) | $ | (520.5 | ) | ||||||||
| Net loss per share — basic and diluted (1) | $ | (0.02 | ) | $ | (0.01 | ) | $ | (0.04 | ) | $ | (0.02 | ) | $ | (0.04 | ) | $ | (0.10 | ) | $ | (0.15 | ) | $ | (0.37 | ) | ||||||||
| Shares used in per share calculation — basic and diluted | 1,440.2 | 1,438.3 | 1,435.0 | 1,433.4 | 1,430.4 | 1,422.6 | 1,414.7 | 1,412.3 | ||||||||||||||||||||||||
| (1) | Net loss per share is computed independently for each of the quarters presented. Therefore, the sum of the quarterly net loss per share does not equal the annual net loss per share. |
| (2) | For the quarterly period ended December 31, 2002, the Company reclassified $8.3 million from selling, general and administrative expense into cost of sales in connection with a patent license agreement to cost of sales (see Note 20 “Patent License”). |
| (3) | For the quarterly period ended March 31, 2003, income tax expense included $18.0 million related to an increase in the Company’s valuation allowance for deferred tax assets related to the financial reporting period ended June 30, 2002. See “Note 15. Income Taxes” for additional discussion of this expense. |
| (4) | For the quarterly period ended December 31, 2003, the Company reclassified $2.2 million from selling, general and administrative expense into cost of sales in connection with a patent license settlement to cost of sales. |
| (5) | For the quarterly period ended June 30, 2004, the Company has recognized $5.0 million tax benefit related to the prior financial reporting period ended June 30, 2002. The Company has identified U.S. net operating losses for fiscal year 2002 available for carryback to pre-acquisition taxable years of acquired subsidiaries that will result in approximately $5.8 million of tax refunds. |
A-113
| ITEM 9. | CHANGES IN AND DISAGREEMENTS WITH ACCOUNTANTS ON ACCOUNTING AND FINANCIAL DISCLOSURE |
None.
ITEM 9A. CONTROLS AND PROCEDURES
| (a) | Evaluation of disclosure controls and procedures. As of the end of the period covered by this report, we carried out an evaluation, under the supervision and with the participation of our Chief Executive Officer and Chief Financial Officer, of the effectiveness of the design and operation of our disclosure controls and procedures. While our disclosure controls and procedures are designed to provide reasonable assurance of achieving their objectives, the design of any system of controls is based in part upon certain assumptions about the likelihood of future events, and there can be no assurance that any design will succeed in achieving its stated goals under all potential future conditions, regardless of how remote. However, based on the evaluation of the effectiveness of the design and operation of our disclosure controls and procedures, our Chief Executive Officer and Chief Financial Officer concluded that our disclosure controls and procedures were effective in timely alerting them to material information required to be included in our periodic SEC filings at the reasonable assurance level. |
| (b) | Changes in internal control over financial reporting. There has been no change in our internal control over financial reporting that occurred during our most recent fiscal quarter that has materially affected or is reasonably likely to materially affect our internal control over financial reporting. |
PART III
ITEM 10. DIRECTORS AND EXECUTIVE OFFICERS OF THE REGISTRANT
Information regarding the Company’s executive officers and directors required by this Item is incorporated by reference to the section entitled “Proposal One — Elections of Directors” in the Company’s Definitive Proxy Statement in connection with the 2004 Annual Meeting of Stockholders (the “Proxy Statement”), which will be filed with the Securities and Exchange Commission within 120 days after the fiscal year ended June 30, 2004. Information required by Item 405 of Regulation S-K is incorporated by reference to the section entitled “Section 16(a) Beneficial Ownership Reporting Compliance” in the Proxy Statement.
The Company has adopted a code of ethics entitled the “JDS Uniphase Corporate Code of Conduct,” which is applicable to all employees, officers and directors of the Company. The full text of the JDS Uniphase Corporate Code of Conduct is included under the Company’s Corporate Governance information available at the Company’s website at www.jdsu.com.
ITEM 11. EXECUTIVE COMPENSATION
Information required by this Item is incorporated by reference to the section entitled “Executive Compensation” in the Proxy Statement.
| ITEM 12. | SECURITY OWNERSHIP OF CERTAIN BENEFICIAL OWNERS AND MANAGEMENT AND RELATED STOCKHOLDER MATTERS |
Information regarding security ownership of certain beneficial owners and management is incorporated by reference to the section entitled “Security Ownership of Certain Beneficial Owners and Management” in the Proxy Statement.
Information regarding the Company’s stockholder approved and non-approved equity compensation plans is incorporated by reference to the section entitled “Equity Compensation Plans” in the Proxy Statement.
ITEM 13. CERTAIN RELATIONSHIPS AND RELATED TRANSACTIONS
Information required by this Item is incorporated by reference to the sections entitled “Certain Relationships and Related Transactions” and “Compensation Committee Interlocks and Insider Participation” in the Proxy Statement.
A-114
PART IV
ITEM 14. PRINCIPAL ACCOUNTANT FEES AND SERVICES
Information required by this item is incorporated by reference to the section entitled “Audit and Non-Audit Fees” in the Proxy Statement.
The Company has been made aware that affiliates of its Independent Registered Public Accounting Firm, Ernst & Young LLP (“Ernst & Young”), in Mauritius, Barbados, and Singapore performed certain secretarial and directorship services that raise issues under the auditor independence rules. These services are not permitted under the auditor independence rules. The Company, its Audit Committee and Ernst & Young have considered the impact the providing of these services may have had on Ernst & Young’s independence with respect to the Company and concluded there has been no impairment of Ernst & Young’s independence. The services were administrative in nature and the associated fees over the period the services were provided (fiscal year 2001 through 2004) aggregated approximately $71,000. The services have either been discontinued or are in the process of being discontinued.
ITEM 15. EXHIBITS, FINANCIAL STATEMENT SCHEDULES, AND REPORTS ON FORM 8-K:
| (a) | The following items are filed as part of this Annual Report on Form 10-K: |
| 1. | Financial Statements: |
| Page | ||||||
| Report of Independent Registered Public Accounting Firm | 58 | |||||
| Consolidated Statements of Operations — Years Ended June 30, 2004, 2003 and 2002 | 59 | |||||
| Consolidated Balance Sheets — June 30, 2004 and 2003 | 60 | |||||
| Consolidated Statements of Cash Flows — Years Ended June 30, 2004, 2003 and 2002 | 61 | |||||
| Consolidated Statements of Stockholders’ Equity — Years Ended June 30, 2004, 2003 and 2002 | 62 | |||||
| Notes to Consolidated Financial Statements | 63 |
| 2. | Financial Statement Schedule: |
The following financial statement schedule is filed as part of this Annual Report on Form 10-K. All other financial statement schedules have been omitted because they are not applicable, or the information required is presented in the Company’s consolidated financial statements and notes thereto under Item 8 of this Annual Report on Form 10-K.
JDS UNIPHASE CORPORATION
SCHEDULE II — VALUATION AND QUALIFYING ACCOUNTS
(in millions)
| Balance at Beginning of Period | Charged to Costs and Expenses | Charged to Other Accounts (1) | Deduction (2) | Balance at End of Period | ||||||||||||||||||
|---|---|---|---|---|---|---|---|---|---|---|---|---|---|---|---|---|---|---|---|---|---|---|
| Allowance for doubtful accounts: | ||||||||||||||||||||||
| Year ended June 30, 2004 | $ | 22.7 | $ | (4.4 | ) | $ | — | $ | (6.5 | ) | $ | 11.8 | ||||||||||
| Year ended June 30, 2003 | 42.9 | (3.4 | ) | — | (16.8 | ) | 22.7 | |||||||||||||||
| Year ended June 30, 2002 | 40.3 | 13.1 | 0.2 | (10.7 | ) | 42.9 | ||||||||||||||||
(1) Allowance assumed through the acquisition of Scion in fiscal 2002.
(2) Charges for uncollectible accounts, net of recoveries.
A-115
| 3. | Exhibits: |
| Exhibit Number | Exhibit Description | |||||
|---|---|---|---|---|---|---|
| 3.1(1) | Restated Certificate of Incorporation. | |||||
| 3.2(2) | Certificate of Designation of the Series A Preferred Stock. | |||||
| 3.3(3) | Certificate of Designation of the Series B Preferred Stock. | |||||
| 3.4(4) | Certificate of Designation of the Special Voting Stock. | |||||
| 3.5(25) | Amended and Restated Bylaws of JDS Uniphase Corporation. | |||||
| 4.1(5) | Exchangeable Share Provisions attaching to the Exchangeable Shares of JDS Uniphase Canada Ltd. (Formerly 3506967 Canada Inc.). | |||||
| 4.2(6) | Voting and Exchange Trust Agreement between JDS Uniphase, JDS Uniphase Canada Ltd. and CIBC Mellon Trust Company. | |||||
| 4.3(7) | Exchangeable Share Support Agreement between JDS Uniphase, JDS Uniphase Canada Ltd. and JDS Uniphase Nova Scotia Company. | |||||
| 4.4(8) | Registration Rights Agreement between JDS Uniphase, JDS Uniphase Canada Ltd. and The Furukawa Electric Co., Ltd. | |||||
| 4.5(9) | Fifth Amended and Restated Rights Agreement between JDS Uniphase and American Stock Transfer & Trust Company. | |||||
| 4.6(18) | Amended and Restated Rights Agreement between JDS Uniphase Canada Ltd. and CIBC Mellon Trust Company (Amended and Restated as of February 6, 2003). | |||||
| 4.7(26) | Indenture dated October 31, 2003 | |||||
| 10.1(10) | Support Agreement between Uniphase Corporation, 3506967 Canada Inc., The Furukawa Electric Company, Ltd., and JDS FITEL Inc. | |||||
| 10.2(11) | Amended and Restated 1993 Flexible Stock Incentive Plan (Amended and Restated as of November 9, 2001). | |||||
| 10.3(12) | Amended and Restated 1998 Employee Stock Purchase Plan (Amended and Restated as of July 31, 2002). | |||||
| 10.4(13) | Amended and Restated 1999 Canadian Employee Stock Purchase Plan (Amended and Restated as of July 31, 2002). | |||||
| 10.5(14) | Retention Agreement for Jozef Straus. | |||||
| 10.6(15) | Change of Control Agreement for Jozef Straus. | |||||
| 10.7(18) | Transition Agreement for Jozef Straus. | |||||
| 10.10(19) | Employment Agreement for Kevin J. Kennedy | |||||
| 10.11(20) | Indemnification Agreement for Kevin J. Kennedy | |||||
| 10.12(21) | Employment Agreement for Mark S. Sobey | |||||
| 10.13(22) | Employment Agreement for Christopher S. Dewees | |||||
| 10.14(23) | Employment Agreement for Donald E. Bossi | |||||
| 10.16(17) | Employment Agreement for Ronald C. Foster | |||||
| 10.17(24) | 2003 Equity Incentive Plan | |||||
A-116
| Exhibit Number | Exhibit Description | |||||
|---|---|---|---|---|---|---|
| 10.18(25) | Change of Control Agreement for Debra C. Shoquist | |||||
| 10.19(25) | Change of Control Agreement for Gary Ronco | |||||
| 10.20(25) | Change of Control Agreement for George C. Christensen | |||||
| 10.21(25) | Change of Control Agreement for Mark Sobey | |||||
| 10.22(25) | Change of Control Agreement for Roy W. Bie | |||||
| 10.23(25) | Change of Control Agreement for Stan Lumish | |||||
| 10.24(25) | Change of Control Agreement for David Gudmundson | |||||
| 10.25(25) | Change of Control Agreement for Thomas Znotins | |||||
| 10.26(25) | Change of Control Agreement for Chris Dewees | |||||
| 21.1(25) | Subsidiaries of JDS Uniphase Corporation. | |||||
| 23.1(25) | Consent of Independent Registered Public Accounting Firm | |||||
| 24.1 | Power of Attorney (included on page 116). | |||||
| 31.1(25) | Certification of the Chief Executive Officer pursuant to Section 302 of the Sarbanes-Oxley Act of 2002. | |||||
| 31.2(25) | Certification of the Chief Financial Officer pursuant to Section 302 of the Sarbanes-Oxley Act of 2002. | |||||
| 32.1(25) | Certification of the Chief Executive Officer pursuant to Section 906 of the Sarbanes-Oxley Act of 2002. | |||||
| 32.2(25) | Certification of the Chief Financial Officer pursuant to Section 906 of the Sarbanes-Oxley Act of 2002. | |||||
| (1) | Incorporated by reference to Exhibit 3.1 of the Company’s Annual Report on Form 10-K/A filed February 13, 2001. |
| (2) | Incorporated by reference to Exhibit 10.3 of the Company’s Current Report on Form 8-K filed June 24, 1998. |
| (3) | Incorporated by reference to Exhibit 3(i)(d) of the Company’s Annual Report on Form 10-K filed September 28, 1998. |
| (4) | Incorporated by reference to Exhibit 4.1 of the Company’s Registration Statement on Form S-3 filed July 14, 1999. |
| (5) | Incorporated by reference to the Company’s definitive Proxy Statement on Schedule 14A filed June 2, 1999. |
| (6) | Incorporated by reference to Exhibit 4.2 of the Company’s Annual Report on Form 10-K filed September 1, 1999. |
| (7) | Incorporated by reference to Exhibit 4.3 of the Company’s Annual Report on Form 10-K filed September 1, 1999. |
| (8) | Incorporated by reference to Exhibit 4.5 of the Company’s Annual Report on Form 10-K filed September 1, 1999. |
| (9) | Incorporated by reference to Exhibit 1 of the Company’s Registration Statement on Form 8-A12G/A filed February 18, 2003. |
| (10) | Incorporated by reference to Exhibit 10.23 of the Company’s Annual Report on Form 10-K filed September 1, 1999. |
| (11) | Incorporated by reference to Exhibit 10.1 of the Company’s Quarterly Report on Form 10-Q filed February 11, 2002. |
A-117
| (12) | Incorporated by reference to Exhibit 10.3 of the Company’s Annual Report on Form 10-K filed September 17, 2002. |
| (13) | Incorporated by reference to Exhibit 10.4 of the Company’s Annual Report on Form 10-K filed September 17, 2002. |
| (14) | Incorporated by reference to Exhibit 10.11 of the Company’s Annual Report on Form 10-K filed September 28, 2000. |
| (15) | Incorporated by reference to Exhibit 10.8 of the Company’s Annual Report on Form 10-K filed September 17, 2002. |
| (16) | Incorporated by reference to Exhibit 10.14 of the Company’s Annual Report on Form 10-K filed September 17, 2002. |
| (17) | Incorporated by reference to Exhibit 10.1 of the Company’s Quarterly Report on Form 10-Q filed May 13, 2003. |
| (18) | Incorporated by reference to Exhibit 10.7 of the Company’s Annual Report on Form 10-K filed September 24, 2003. |
| (19) | Incorporated by reference to Exhibit 10.10 of the Company’s Annual Report on Form 10-K filed September 24, 2003. |
| (20) | Incorporated by reference to Exhibit 10.11 of the Company’s Annual Report on Form 10-K filed September 24, 2003. |
| (21) | Incorporated by reference to Exhibit 10.12 of the Company’s Annual Report on Form 10-K filed September 24, 2003. |
| (22) | Incorporated by reference to Exhibit 10.13 of the Company’s Annual Report on Form 10-K filed September 24, 2003. |
| (23) | Incorporated by reference to Exhibit 10.14 of the Company’s Annual Report on Form 10-K filed September 24, 2003. |
| (24) | Incorporated by reference to the Company’s definitive Proxy Statement on Schedule 14A filed October 23, 2003. |
| (25) | Filed herewith. |
| (b) | Reports on Form 8-K: |
| (26) | Incorporated by reference to Exhibit 4.7 of the Company’s Registration Statement on Form S-3 filed November 14, 2003. |
A-118
The Company furnished two Current Reports on Form 8-K during the three months ended June 30, 2004:
| Date of Report | Item Reported on | |||||
|---|---|---|---|---|---|---|
| May 18, 2004 | Regulation FD disclosure in connection with a press release by the Company on May 17, 2004 that announced the acquisition of E2O Communications, Inc. | |||||
| April 28, 2004 | Regulation FD disclosure in connection with a conference call delivered by the officers of the Company on April 28, 2004 that included information contained in a script. | |||||
| (c) | Other Information: |
As of June 30, 2004, the following executive officers and members of the Company’s Board of Directors maintained “plans” under Rule 10b5-1 of the Securities Exchange Act of 1934, as amended, for trading in shares of the Company’s common stock and/or exchangeable shares:
Christopher S. Dewees
Robert E. Enos
Ronald C. Foster
Martin A. Kaplan
Stan Lumish
Jo S. Major (employee terminated on August 6, 2004)
Casimir Skrzypczak
Mark S. Sobey
Jozef Straus (trading plan terminated July 31, 2004)
Thomas Znotins
A-119
SIGNATURES
Pursuant to the requirements of Section 13 or 15(d) of the Securities Exchange Act of 1934, the Registrant has duly caused this report to be signed on its behalf by the undersigned, thereunto duly authorized.
| Date: September 15, 2004 | JDS UNIPHASE CORPORATION By: /s/ KEVIN J. KENNEDY Kevin J. Kennedy, Ph.D. Chief Executive Officer (Principal Executive Officer) |
POWER OF ATTORNEY
KNOW ALL PERSONS BY THESE PRESENTS, that each person whose signature appears below constitutes and appoints Ronald C. Foster his attorney-in-fact, each with the power of substitution, for him in any and all capacities, to sign any amendments to this Annual Report on Form 10-K, and to file the same with exhibits thereto and other documents in connection therewith, with the Securities and Exchange Commission, hereby ratifying and confirming all that said attorney-in-fact, or his substitute or substitutes, may do or cause to be done by virtue hereof.
Pursuant to the requirements of the Securities Exchange Act of 1934, this Annual Report on Form 10-K has been signed below by the following persons on behalf of the Registrant and in the capacities and on the dates indicated.
| Signature | Title | Date | ||||||||
|---|---|---|---|---|---|---|---|---|---|---|
/s/ KEVIN J. KENNEDY Kevin J. Kennedy, Ph.D. | Chief Executive Officer (Principal Executive Officer) | September 15, 2004 | ||||||||
/s/ RONALD C. FOSTER Ronald C. Foster | Executive Vice President and Chief Financial Officer (Principal Financial and Accounting Officer) | September 15, 2004 | ||||||||
/s/ BRUCE D. DAY Bruce D. Day | Director | September 15, 2004 | ||||||||
/s/ ROBERT E. ENOS Robert E. Enos | Director | September 15, 2004 | ||||||||
/s/ PETER A. GUGLIELMI Peter A. Guglielmi | Director | September 15, 2004 | ||||||||
/s/ MARTIN A. KAPLAN Martin A. Kaplan | Chairman | September 15, 2004 | ||||||||
/s/ RICHARD T. LIEBHABER Richard T. Liebhaber | Director | September 15, 2004 | ||||||||
/s/ CASIMIR S. SKRZYPCZAK Casimir S. Skrzypczak | Director | September 15, 2004 | ||||||||
A-120
Exhibit Index
| Exhibit Number | Exhibit Description | |||||
|---|---|---|---|---|---|---|
| 3.1(1) | Restated Certificate of Incorporation. | |||||
| 3.2(2) | Certificate of Designation of the Series A Preferred Stock. | |||||
| 3.3(3) | Certificate of Designation of the Series B Preferred Stock. | |||||
| 3.4(4) | Certificate of Designation of the Special Voting Stock. | |||||
| 3.5(25) | Amended and Restated Bylaws of JDS Uniphase Corporation. | |||||
| 4.1(5) | Exchangeable Share Provisions attaching to the Exchangeable Shares of JDS Uniphase Canada Ltd. (Formerly 3506967 Canada Inc.). | |||||
| 4.2(6) | Voting and Exchange Trust Agreement between JDS Uniphase, JDS Uniphase Canada Ltd. and CIBC Mellon Trust Company. | |||||
| 4.3(7) | Exchangeable Share Support Agreement between JDS Uniphase, JDS Uniphase Canada Ltd. and JDS Uniphase Nova Scotia Company. | |||||
| 4.4(8) | Registration Rights Agreement between JDS Uniphase, JDS Uniphase Canada Ltd. and The Furukawa Electric Co., Ltd. | |||||
| 4.5(9) | Fifth Amended and Restated Rights Agreement between JDS Uniphase and American Stock Transfer & Trust Company. | |||||
| 4.6(18) | Amended and Restated Rights Agreement between JDS Uniphase Canada Ltd. and CIBC Mellon Trust Company (Amended and Restated as of February 6, 2003). | |||||
| 4.7(26) | Indenture dated October 31, 2003 | |||||
| 10.1(10) | Support Agreement between Uniphase Corporation, 3506967 Canada Inc., The Furukawa Electric Company, Ltd., and JDS FITEL Inc. | |||||
| 10.2(11) | Amended and Restated 1993 Flexible Stock Incentive Plan (Amended and Restated as of November 9, 2001). | |||||
| 10.3(12) | Amended and Restated 1998 Employee Stock Purchase Plan (Amended and Restated as of July 31, 2002). | |||||
| 10.4(13) | Amended and Restated 1999 Canadian Employee Stock Purchase Plan (Amended and Restated as of July 31, 2002). | |||||
| 10.5(14) | Retention Agreement for Jozef Straus. | |||||
| 10.6(15) | Change of Control Agreement for Jozef Straus. | |||||
| 10.7(18) | Transition Agreement for Jozef Straus. | |||||
| 10.10(19) | Employment Agreement for Kevin J. Kennedy | |||||
| 10.11(20) | Indemnification Agreement for Kevin J. Kennedy | |||||
| 10.12(21) | Employment Agreement for Mark S. Sobey | |||||
| 10.13(22) | Employment Agreement for Christopher S. Dewees | |||||
| 10.14(23) | Employment Agreement for Donald E. Bossi | |||||
| 10.16(17) | Employment Agreement for Ronald C. Foster | |||||
| 10.17 (24) | 2003 Equity Incentive Plan | |||||
A-121
| Exhibit Number | Exhibit Description | |||||
|---|---|---|---|---|---|---|
| 10.18 (25) | Change of Control Agreement for Debra C. Shoquist | |||||
| 10.19 (25) | Change of Control Agreement for Gary Ronco | |||||
| 10.20 (25) | Change of Control Agreement for George C. Christensen | |||||
| 10.21 (25) | Change of Control Agreement for Mark Sobey | |||||
| 10.22 (25) | Change of Control Agreement for Roy W. Bie | |||||
| 10.23 (25) | Change of Control Agreement for Stan Lumish | |||||
| 10.24(25) | Change of Control Agreement for David Gudmundson | |||||
| 10.25 (25) | Change of Control Agreement for Thomas Znotins | |||||
| 10.26 (25) | Change of Control Agreement for Chris Dewees | |||||
| 21.1(25) | Subsidiaries of JDS Uniphase Corporation. | |||||
| 23.1(25) | Consent of Independent Registered Public Accounting Firm | |||||
| 24.1 | Power of Attorney (included on page 116). | |||||
| 31.1(25) | Certification of the Chief Executive Officer pursuant to Section 302 of the Sarbanes-Oxley Act of 2002. | |||||
| 31.2(25) | Certification of the Chief Financial Officer pursuant to Section 302 of the Sarbanes-Oxley Act of 2002. | |||||
| 32.1(25) | Certification of the Chief Executive Officer pursuant to Section 906 of the Sarbanes-Oxley Act of 2002. | |||||
| 32.2(25) | Certification of the Chief Financial Officer pursuant to Section 906 of the Sarbanes-Oxley Act of 2002. | |||||
| (1) | Incorporated by reference to Exhibit 3.1 of the Company’s Annual Report on Form 10-K/A filed February 13, 2001. |
| (2) | Incorporated by reference to Exhibit 10.3 of the Company’s Current Report on Form 8-K filed June 24, 1998. |
| (3) | Incorporated by reference to Exhibit 3(i)(d) of the Company’s Annual Report on Form 10-K filed September 28, 1998. |
| (4) | Incorporated by reference to Exhibit 4.1 of the Company’s Registration Statement on Form S-3 filed July 14, 1999. |
| (5) | Incorporated by reference to the Company’s definitive Proxy Statement on Schedule 14A filed June 2, 1999. |
| (6) | Incorporated by reference to Exhibit 4.2 of the Company’s Annual Report on Form 10-K filed September 1, 1999. |
| (7) | Incorporated by reference to Exhibit 4.3 of the Company’s Annual Report on Form 10-K filed September 1, 1999. |
| (8) | Incorporated by reference to Exhibit 4.5 of the Company’s Annual Report on Form 10-K filed September 1, 1999. |
| (9) | Incorporated by reference to Exhibit 1 of the Company’s Registration Statement on Form 8-A12G/A filed February 18, 2003. |
| (10) | Incorporated by reference to Exhibit 10.23 of the Company’s Annual Report on Form 10-K filed September 1, 1999. |
| (11) | Incorporated by reference to Exhibit 10.1 of the Company’s Quarterly Report on Form 10-Q filed February 11, 2002. |
A-122
| (12) | Incorporated by reference to Exhibit 10.3 of the Company’s Annual Report on Form 10-K filed September 17, 2002. |
| (13) | Incorporated by reference to Exhibit 10.4 of the Company’s Annual Report on Form 10-K filed September 17, 2002. |
| (14) | Incorporated by reference to Exhibit 10.11 of the Company’s Annual Report on Form 10-K filed September 28, 2000. |
| (15) | Incorporated by reference to Exhibit 10.8 of the Company’s Annual Report on Form 10-K filed September 17, 2002. |
| (16) | Incorporated by reference to Exhibit 10.14 of the Company’s Annual Report on Form 10-K filed September 17, 2002. |
| (17) | Incorporated by reference to Exhibit 10.1 of the Company’s Quarterly Report on Form 10-Q filed May 13, 2003. |
| (18) | Incorporated by reference to Exhibit 10.7 of the Company’s Annual Report on Form 10-K filed September 24, 2003. |
| (19) | Incorporated by reference to Exhibit 10.10 of the Company’s Annual Report on Form 10-K filed September 24, 2003. |
| (20) | Incorporated by reference to Exhibit 10.11 of the Company’s Annual Report on Form 10-K filed September 24, 2003. |
| (21) | Incorporated by reference to Exhibit 10.12 of the Company’s Annual Report on Form 10-K filed September 24, 2003. |
| (22) | Incorporated by reference to Exhibit 10.13 of the Company’s Annual Report on Form 10-K filed September 24, 2003. |
| (23) | Incorporated by reference to Exhibit 10.14 of the Company’s Annual Report on Form 10-K filed September 24, 2003. |
| (24) | Incorporated by reference to the Company’s definitive Proxy Statement on Schedule 14A filed October 23, 2003. |
| (25) | Filed herewith. |
| (26) | Incorporated by reference to Exhibit 4.7 of the Company’s Registration Statement on Form S-3 filed November 14, 2003. |
A-123
Exhibit 31.1
JDS UNIPHASE CORPORATION
CERTIFICATION PURSUANT TO SECTION 302
OF THE SARBANES-OXLEY ACT OF 2002
I, Kevin J. Kennedy, Ph.D., Chief Executive Officer (Principal Executive Officer), certify that:
| 1. | I have reviewed this Annual Report on Form 10-K of JDS Uniphase Corporation; |
| 2. | Based on my knowledge, this Annual Report on Form 10-K does not contain any untrue statement of a material fact or omit to state a material fact necessary to make the statements made, in light of the circumstances under which such statements were made, not misleading with respect to the period covered by this Annual Report on Form 10-K; |
| 3. | Based on my knowledge, the financial statements, and other financial information included in this Annual Report on Form 10-K, fairly present in all material respects the financial condition, results of operations and cash flows of the registrant as of, and for, the periods presented in this Annual Report on Form 10-K; |
| 4. | The registrant’s other certifying officer(s) and I are responsible for establishing and maintaining disclosure controls and procedures (as defined in Exchange Act Rules 13a-15(e) and 15d-15(e)) for the registrant and have: |
| a) | Designed such disclosure controls and procedures, or caused such disclosure controls and procedures to be designed under our supervision, to ensure that material information relating to the registrant, including its consolidated subsidiaries, is made known to us by others within those entities, particularly during the period in which this report is being prepared; |
| b) | Evaluated the effectiveness of the registrant’s disclosure controls and procedures and presented in this report our conclusions about the effectiveness of the disclosure controls and procedures, as of the end of the period covered by this report based on such evaluation; and |
| c) | Disclosed in this report any change in the registrant’s internal control over financial reporting that occurred during the registrant’s most recent fiscal quarter (the registrant’s fourth fiscal quarter in the case of an annual report) that has materially affected, or is reasonably likely to materially affect, the registrant’s internal control over financial reporting; and |
| 5. | The registrant’s other certifying officer(s) and I have disclosed, based on our most recent evaluation of internal control over financial reporting, to the registrant’s auditors and the audit committee of the registrant’s board of directors (or persons performing the equivalent functions): |
| a) | All significant deficiencies and material weaknesses in the design or operation of internal control over financial reporting which are reasonably likely to adversely affect the registrant’s ability to record, process, summarize and report financial information; and |
| b) | Any fraud, whether or not material, that involves management or other employees who have a significant role in the registrant’s internal control over financial reporting. |
Dated: September 15, 2004
/s/ KEVIN J. KENNEDY
Kevin J. Kennedy, Ph.D.
Chief Executive Officer
(Principal Executive Officer)
A-124
Exhibit 31.2
JDS UNIPHASE CORPORATION
CERTIFICATION PURSUANT TO SECTION 302
OF THE SARBANES-OXLEY ACT OF 2002
I, Ronald C. Foster, Executive Vice President and Chief Financial Officer (Principal Financial and Accounting Officer), certify that:
| 1. | I have reviewed this Annual Report on Form 10-K of JDS Uniphase Corporation; |
| 2. | Based on my knowledge, this Annual Report on Form 10-K does not contain any untrue statement of a material fact or omit to state a material fact necessary to make the statements made, in light of the circumstances under which such statements were made, not misleading with respect to the period covered by this Annual Report on Form 10-K; |
| 3. | Based on my knowledge, the financial statements, and other financial information included in this Annual Report on Form 10-K, fairly present in all material respects the financial condition, results of operations and cash flows of the registrant as of, and for, the periods presented in this Annual Report on Form 10-K. |
| 4. | The registrant’s other certifying officer(s) and I are responsible for establishing and maintaining disclosure controls and procedures (as defined in Exchange Act Rules 13a-15(e) and 15d-15(e)) for the registrant and have: |
| a) | Designed such disclosure controls and procedures, or caused such disclosure controls and procedures to be designed under our supervision, to ensure that material information relating to the registrant, including its consolidated subsidiaries, is made known to us by others within those entities, particularly during the period in which this report is being prepared; |
| b) | Evaluated the effectiveness of the registrant’s disclosure controls and procedures and presented in this report our conclusions about the effectiveness of the disclosure controls and procedures, as of the end of the period covered by this report based on such evaluation; and |
| c) | Disclosed in this report any change in the registrant’s internal control over financial reporting that occurred during the registrant’s most recent fiscal quarter (the registrant’s fourth fiscal quarter in the case of an annual report) that has materially affected, or is reasonably likely to materially affect, the registrant’s internal control over financial reporting; and |
| 5. | The registrant’s other certifying officer(s) and I have disclosed, based on our most recent evaluation of internal control over financial reporting, to the registrant’s auditors and the audit committee of the registrant’s board of directors (or persons performing the equivalent functions): |
| a) | All significant deficiencies and material weaknesses in the design or operation of internal control over financial reporting which are reasonably likely to adversely affect the registrant’s ability to record, process, summarize and report financial information; and |
| b) | Any fraud, whether or not material, that involves management or other employees who have a significant role in the registrant’s internal control over financial reporting. |
Dated: September 15, 2004
/s/ RONALD C. FOSTER
Ronald C. Foster
Executive Vice President and Chief Financial Officer
(Principal Financial and Accounting Officer)
A-125
Exhibit 32.1
JDS UNIPHASE CORPORATION
CERTIFICATION PURSUANT TO SECTION 906
OF THE SARBANES-OXLEY ACT OF 2002
In connection with the Annual Report on Form 10-K of JDS Uniphase Corporation (the “Company”) for the year ended June 30, 2004 as filed with the Securities and Exchange Commission (the “Report”), I, Kevin J. Kennedy, Ph.D., Chief Executive Officer (Principal Executive Officer) of the Company, hereby certify as of the date hereof, solely for purposes of Title 18, Chapter 63, Section 1350 of the United States Code, that to the best of my knowledge:
| 1. | The Report fully complies with the requirements of Section 13(a) or 15(d), as applicable, of the Securities Exchange Act of 1934; and |
| 2. | The information contained in the Report fairly presents, in all material respects, the financial condition and results of operations of the Company at the dates and for the periods indicated. |
This Certification has not been, and shall not be deemed, “filed” with the Securities and Exchange Commission.
Dated: September 15, 2004
/s/ KEVIN J. KENNEDY
Kevin J. Kennedy, Ph.D.
Chief Executive Officer
(Principal Executive Officer)
A-126
Exhibit 32.2
JDS UNIPHASE CORPORATION
CERTIFICATION PURSUANT TO SECTION 906
OF THE SARBANES-OXLEY ACT OF 2002
In connection with the Annual Report on Form 10-K of JDS Uniphase Corporation (the “Company”) for the year ended June 30, 2004 as filed with the Securities and Exchange Commission (the “Report”), I, Ronald C. Foster, Executive Vice President and Chief Financial Officer (Principal Financial and Accounting Officer) of the Company, hereby certify as of the date hereof, solely for purposes of Title 18, Chapter 63, Section 1350 of the United States Code, that to the best of my knowledge:
| 1. | The Report fully complies with the requirements of Section 13(a) or 15(d), as applicable, of the Securities Exchange Act of 1934; and |
| 2. | The information contained in the Report fairly presents, in all material respects, the financial condition and results of operations of the Company at the dates and for the periods indicated. |
This Certification has not been, and shall not be deemed, “filed” with the Securities and Exchange Commission.
Dated: September 15, 2004
/s/ KEVIN J. KENNEDY
Kevin J. Kennedy, Ph.D.
Chief Executive Officer
(Principal Executive Officer)
A-127
| VOTE BY INTERNET - www.proxyvote.com |
JDS UNIPHASE CORPORATION | and for electronic delivery of information up until 11:59 |
|
|
| VOTE BY PHONE - 1-800-690-6903 |
| Use any touch-tone telephone to transmit your voting |
|
|
| VOTE BY MAIL |
| Mark, sign and date your proxy card and return it in the |
TO VOTE, MARK BLOCKS BELOW IN BLUE OR BLACK INK AS FOLLOWS: | ||
| JDSUC1 | KEEP THIS PORTION FOR YOUR RECORDS |
DETACH AND RETURN THIS PORTION ONLY | ||
THIS PROXY CARD IS VALID ONLY WHEN SIGNED AND DATED. | ||
JDS UNIPHASE CORPORATION |
| ||||||||||||||||||||||||
|
|
| |||||||||||||||||||||||
| Vote On Directors |
|
| ||||||||||||||||||||||
|
|
|
| ||||||||||||||||||||||
| 1. | Election of THREE Class I Directors |
| For |
| Withhold |
| For All |
| To withhold authority to vote, mark “For All Except” |
| ||||||||||||||
|
| Nominees: 01) Bruce D. Day |
|
|
|
|
|
|
|
|
| ||||||||||||||
|
| 02) Martin A. Kaplan |
|
|
|
|
|
|
|
|
| ||||||||||||||
|
| 03) Kevin J. Kennedy, Ph.D. |
| o |
| o |
| o |
|
|
|
| |||||||||||||
|
|
|
|
|
|
|
|
|
|
|
|
| |||||||||||||
| Vote On Proposal | For | Against | Abstain |
| ||||||||||||||||||||
|
|
|
|
|
| ||||||||||||||||||||
| 2. | Proposal to ratify the appointment of Ernst & Young LLP as the independent auditors for JDS Uniphase Corporation for the fiscal year ending June 30, 2005. | o | o | o |
| |||||||||||||||||||
|
|
|
|
|
|
| |||||||||||||||||||
| Authority is hereby given to the proxies identified on the front of this card to vote in their discretion upon such other business as may properly come before the meeting. |
|
|
|
| ||||||||||||||||||||
|
|
|
|
|
|
| |||||||||||||||||||
| PLEASE MARK, SIGN, DATE AND RETURN THIS PROXY CARD PROMPTLY USING THE ENCLOSED REPLY ENVELOPE. | ||||||||||||||||||||||||
|
| ||||||||||||||||||||||||
| Please sign exactly as your name appears on this proxy card. If shares are held jointly, each person should sign. When signing as attorney, executor, administrator, trustee or guardian, please give full title as such. If a corporation, please sign in full corporate name by President or other authorized officer. If a partnership, please sign in partnership name by authorized person. |
| |||||||||||||||||||||||
|
|
| |||||||||||||||||||||||
|
| Yes | No |
|
| ||||||||||||||||||||
|
|
|
|
|
| ||||||||||||||||||||
| Please indicate if you plan to attend this meeting | o | o |
|
| ||||||||||||||||||||
|
|
|
|
|
|
| |||||||||||||||||||
| HOUSEHOLDING ELECTION - Please indicate if you consent to receive certain future investor communications in a single package per household | o | o |
|
| ||||||||||||||||||||
|
|
|
|
|
|
| |||||||||||||||||||
|
|
|
|
|
|
|
|
| |||||||||||||||||
|
|
|
|
|
|
|
|
| |||||||||||||||||
| Signature [PLEASE SIGN WITHIN BOX] | Date |
|
|
| Signature (Joint Owners) | Date | ||||||||||||||||||
|
|
|
|
|
|
| |
|
| |
|
| |
|
| |
THIS PROXY IS SOLICITED ON BEHALF OF THE BOARD OF DIRECTORS | ||
| ||
| The undersigned hereby appoints KEVIN J. KENNEDY, Ph.D. and RONALD C. FOSTER, or either of them, each with the power of substitution, and hereby authorizes each of them to represent and to vote, as designated on the reverse side, all of the shares of Common Stock of JDS Uniphase Corporation that the undersigned is entitled to vote at the Annual Meeting of Stockholders to be held at 8:30 a.m., Pacific Standard Time, on November 16, 2004 at the Company’s offices located at 1768 Automation Parkway, San Jose, California 95131, or any adjournment or postponement thereof. |
|
| ||
| THIS PROXY, WHEN PROPERLY EXECUTED, WILL BE VOTED AS DIRECTED BY THE UNDERSIGNED STOCKHOLDER. IF NO SUCH DIRECTIONS ARE MADE, THIS PROXY WILL BE VOTED FOR THE ELECTION OF THE NOMINEES LISTED ON THE REVERSE SIDE FOR THE BOARD OF DIRECTORS AND FOR PROPOSAL 2. |
|
|
|
|
|
| |
| ||
| ||
| ||