UNITED STATES
SECURITIES AND EXCHANGE COMMISSION
Washington, D.C. 20549
FORM N-CSR
CERTIFIED SHAREHOLDER REPORT
OF
REGISTERED MANAGEMENT INVESTMENT COMPANIES
Investment Company Act File Number: 811-08030
Name of Registrant: Royce Micro-Cap Trust, Inc.
Address of Registrant: 745 Fifth Avenue
New York, NY 10151
| Name and address of agent for service: | John E. Denneen, Esquire |
| | 745 Fifth Avenue
New York, NY 10151 |
Registrant's telephone number, including area code: (212) 508-4500
Date of fiscal year end: December 31
Date of reporting period: January 1, 2017 – December 31, 2017
Item 1. Reports to Shareholders.
| | | DECEMBER 31, 2017 |
| | | |
| | | |
| | | |
| | | 2017 Annual |
| | | Review and Report to Stockholders |
| | | |
| | | |
| | | |
| | | |
| | | |
| | | |
| | | |
| | | Royce Global Value Trust |
| | | | |
| | | Royce Micro-Cap Trust |
| | | | |
| | | Royce Value Trust |
| | | | |
| | | | |
| | | | |
| | | | |
| | | | |
| | | | |
| | | | |
| | | | |
| | | | |
| | | | |
| | | | |
| | | | |
| | | | |
| | | | |
| | | | |
| | | | |
| | | | |
| | | | |
| | | | |
| | | | |
| | | | |
| | | | |
| | | | |
| | | roycefunds.com |  |
| | | | |
| | | | |
| | | | |
A Few Words on Closed-End Funds
Royce & Associates, LP manages three closed-end funds: Royce Global Value Trust, which invests primarily in companies with headquarters outside of the United States, Royce Micro-Cap Trust, which invests primarily in micro-cap securities; and Royce Value Trust, which invests primarily in small-cap securities. A closed-end fund is an investment company whose shares are listed and traded on a stock exchange. Like all investment companies, including open-end mutual funds, the assets of a closed-end fund are professionally managed in accordance with the investment objectives and policies approved by the fund’s Board of Directors. A closed-end fund raises cash for investment by issuing a fixed number of shares through initial and other public offerings that may include shelf offerings and periodic rights offerings. Proceeds from the offerings are invested in an actively managed portfolio of securities. Investors wanting to buy or sell shares of a publicly traded closed-end fund after the offerings must do so on a stock exchange, as with any publicly traded stock. Shares of closed-end funds frequently trade at a discount to their net asset value. This is in contrast to open-end mutual funds, which sell and redeem their shares at net asset value on a continuous basis.
A Closed-End Fund Can Offer Several Distinct Advantages
| • | A closed-end fund does not issue redeemable securities or offer its securities on a continuous basis, so it does not need to liquidate securities or hold uninvested assets to meet investor demands for cash redemptions. |
| | |
| • | In a closed-end fund, not having to meet investor redemption requests or invest at inopportune times can be effective for value managers who attempt to buy stocks when prices are depressed and sell securities when prices are high. |
| | |
| • | A closed-end fund may invest in less liquid portfolio securities because it is not subject to potential stockholder redemption demands. This is potentially beneficial for Royce-managed closed-end funds, with significant investments in small- and micro-cap securities. |
| | |
| • | The fixed capital structure allows permanent leverage to be employed as a means to enhance capital appreciation potential. |
| | |
| • | Royce Micro-Cap Trust and Royce Value Trust distribute capital gains, if any, on a quarterly basis. Each of these Funds has adopted a quarterly distribution policy for its common stock. |
We believe that the closed-end fund structure can be an appropriate investment for a long-term investor who understands the benefits of a more stable pool of capital.
Why Dividend Reinvestment Is Important
A very important component of an investor’s total return comes from the reinvestment of distributions. By reinvesting distributions, our investors can maintain an undiluted investment in a Fund. To get a fair idea of the impact of reinvested distributions, please see the charts on pages 62 and 63. For additional information on the Funds’ Distribution Reinvestment and Cash Purchase Options and the benefits for stockholders, please see page 64 or visit our website at www.roycefunds.com.
Managed Distribution Policy
The Board of Directors of each of Royce Micro-Cap Trust and Royce Value Trust has authorized a managed distribution policy (“MDP”). Under the MDP, Royce Micro-Cap Trust and Royce Value Trust pay quarterly distributions at an annual rate of 7% of the average of the prior four quarter-end net asset values, with the fourth quarter being the greater of these annualized rates or the distribution required by IRS regulations. With each distribution, the Fund will issue a notice to its stockholders and an accompanying press release that provides detailed information regarding the amount and composition of the distribution (including whether any portion of the distribution represents a return of capital) and other information required by a Fund’s MDP. You should not draw any conclusions about a Fund’s investment performance from the amount of distributions or from the terms of a Fund’s MDP. A Fund’s Board of Directors may amend or terminate the MDP at any time without prior notice to stockholders; however, at this time there are no reasonably foreseeable circumstances that might cause the termination of any of the MDPs.
| This page is not part of the 2017 Annual Report to Stockholders |
| Table of Contents | | | |
| | | | |
| | | | |
| Annual Review | | | |
| | | | |
| Letter to Our Stockholders | | 2 | |
| | | | |
| Performance | | 7 | |
| | | | |
| | | | |
| Annual Report to Stockholders | | | |
| | | | |
| Royce Global Value Trust | | | |
| | | | |
Managers’ Discussions of Fund Performance | | 8 | |
| | | | |
Schedule of Investments | | 10 | |
| | | | |
Other Financial Statements | | 15 | |
| | | | |
| Royce Micro-Cap Trust | | | |
| | | | |
Managers’ Discussion of Fund Performance | | 24 | |
| | | | |
Schedule of Investments | | 26 | |
| | | | |
Other Financial Statements | | 31 | |
| | | | |
| Royce Value Trust | | | |
| | | | |
Managers’ Discussion of Fund Performance | | 42 | |
| | | | |
Schedule of Investments | | 44 | |
| | | | |
Other Financial Statements | | 50 | |
| | | | |
| History Since Inception | | 62 | |
| | | | |
| Distribution Reinvestment and Cash Purchase Options | | 64 | |
| | | | |
| Directors and Officers | | 65 | |
| | | | |
| Notes to Performance and Other Important Information | | 66 | |
| | | | |
| Results of Stockholders Meetings | | 67 | |

| This page is not part of the 2017 Annual Report to Stockholders |
Letter to Our Stockholders

A GOOD YEAR, A PUZZLING PATTERN
A good year for equities, 2017 also looked a little strange at first...
| It was a terrific year for stocks in 2017 up and down the asset class scale and across much of the globe. Yet it was also a seemingly odd year, and it played out much differently than we thought it would. A second consecutive year of double-digit returns for small-cap stocks, with the Russell 2000 Index gaining 14.6% in 2017,1 was more than welcome, of course, even as returns also defied what we would have anticipated against the backdrop of a rapidly growing domestic economy and a rebounding global one. While large-cap’s relatively higher returns in 2017 made sense to us in this context, we also expected that small-cap would draw the bulk of its strength from cyclicals and value stocks in this healthy environment. So we were surprised to see certain growth and defensive stocks take the lead early in 2017 after lagging—in some cases significantly—in 2016, a year that marked its own significant (and in our view favorable) leadership reversals to cyclicals and value. Over the last three years, then, we have transitioned from |
2015’s very narrow, growth-led market to 2016’s broader move driven by cyclicals and value stocks to 2017, in which growth reasserted leadership while value lagged significantly.
It was a terrific year for stocks in 2017 up and down the asset class scale and across much of the globe.
At first, we chalked up this apparent oddity to the market’s long history of refusing to behave in a logical fashion, at least over the short term. As we parsed the data more closely, however, we were able to more accurately decode what happened. First, the advantages enjoyed by growth stocks and defensives within the Russell 2000 came disproportionately from Health Care, which rose 35.5% in 2017, making it by far the best-performing sector within the small-cap index. Rising more than 50%, biotechnology was particularly strong, bouncing back from a corrective phase |
| 1 | It was also the first calendar year since its 1978 inception in which the small-cap index posted a return between 6% and 16%. |
| 2 | This page is not part of the 2017 Annual Report to Stockholders |
LETTER TO OUR STOCKHOLDERS
in 2016 while pharmaceuticals also made an impressive recovery, climbing 37.2%. In aggregate, five of the six industry groups that comprise the Health Care sector in the Russell 2000 outpaced the overall index in 2017.
Following Health Care, however, were four sectors in more cyclical areas, each of which also beat the small-cap index: Consumer Discretionary (+15.6%), Industrials (+19.8%), Information Technology (+17.4%), and Materials (+16.7%). Among the index’s largest sectors, tech is also arguably its most diverse, embracing a mix of cyclical growth and value companies. Two of its more growth-oriented industries—Internet software & services (+28.4%) and software (+27.3%)—did very well while two of its more cyclical industries—electronic equipment, instruments & components (+23.9%) and semiconductors & semiconductor equipment (+15.2%)—also had index-beating returns in 2017. |
| |
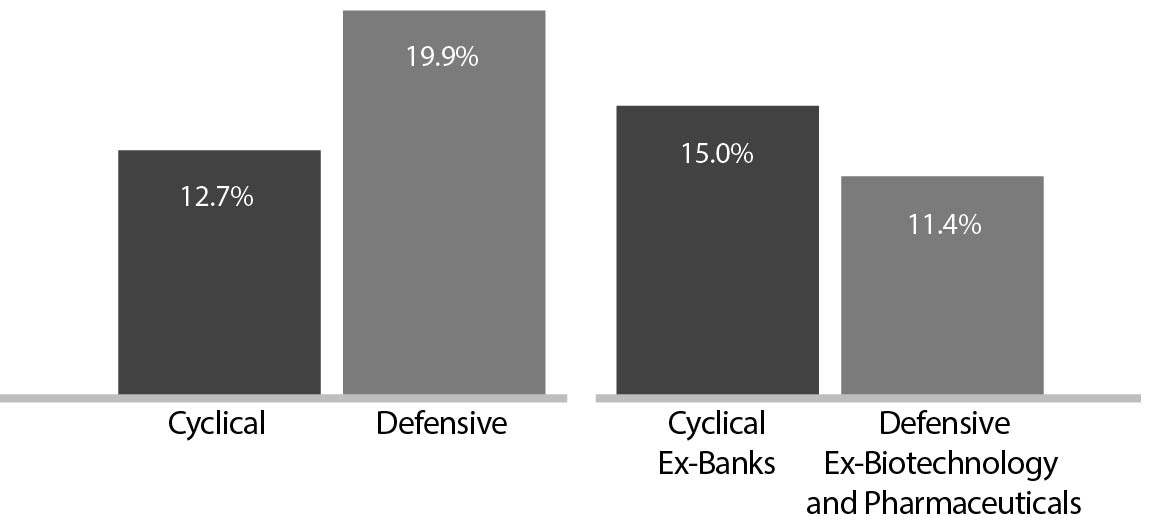
| What, then, contributed most to the odd disparity in small-cap results between cyclicals and defensives, value and growth? An underwhelming, low single-digit performance from banks was arguably the major factor. Slotted in the Financials sector, banks had a weighting just shy of 11% in the Russell 2000 at year-end, larger than six of the 11 sectors in the index, which gives their performance a meaningful impact. (In the Russell 2000 Value Index, their weighting was just shy of 20% at year-end— larger than any other sector in the style index.) Anemic returns for small-cap banks thus played a major role in relative disadvantages for both cyclicals and value. We find the following illustration especially revealing: defensives were up 20.0% in 2017 versus 12.7% for cyclicals. With banks, biotechnology, and pharmaceuticals excluded, however, cyclicals showed better absolute and relative performance—up 15.0% versus 11.4% for defensives. |
| |
A Different Picture Emerges Ex-Outliers
2017 Russell 2000 Cyclical vs Defensive Sector Returns |
 |
| |
| Cyclical and Defensive are defined as follows: Cyclical, Consumer Discretionary, Energy, Financials, Industrials. Defensive: Consumer Staples, Health Care, Real Estate, Telecommunication Services, Utilities. |
| |
We think this outlier—excluding comparison goes a long way toward explaining why results for cyclicals versus defensives and value versus growth at first glance looked so strange in a period of economic acceleration.
ARE SMALL-CAPS POISED FOR ANOTHER SHIFT?
After an encouraging 4Q17, can small-cap cyclicals take the lead going forward?
Being narrower, growth-led markets typically create challenges for active managers, who tend to embrace a wider swath of companies. So it was not surprising that results for domestic active small-cap strategies were more varied, and we were pleased to see a number of market-beating performances for a select number of approaches. No doubt, the intertwined effect of strong absolute and relative results for certain cyclical sectors and vibrant global economic growth was the dominant factor. So while active strategies faced crosscurrents during the year as investors revisited more speculative issues, they were also bolstered by the expanding global economy. |
Going forward, we expect investors to increasingly focus on individual company attributes, especially cyclical exposure and company-specific risks. Our view is that this performance pattern should extend into 2018.
| This page is not part of the 2017 Annual Report to Stockholders | 3 |
| |
| Equity Indexes as of December 31, 2017 (%) | | | | | | | | | | |
| | | 1-YR | | 3-YR | | 5-YR | | 10-YR |
| |
| Russell 2000 | | | 14.65 | | | | 9.96 | | | | 14.12 | | | | 8.71 | |
| |
| Russell 2000 Value | | | 7.84 | | | | 9.55 | | | | 13.01 | | | | 8.17 | |
| |
| Russell 2000 Growth | | | 22.17 | | | | 10.28 | | | | 15.21 | | | | 9.19 | |
| |
| S&P 500 | | | 21.83 | | | | 11.41 | | | | 15.79 | | | | 8.50 | |
| |
| Russell 1000 | | | 21.69 | | | | 11.23 | | | | 15.71 | | | | 8.59 | |
| |
| Nasdaq Composite | | | 28.24 | | | | 13.38 | | | | 17.98 | | | | 10.04 | |
| |
| Russell Midcap | | | 18.52 | | | | 9.58 | | | | 14.96 | | | | 9.11 | |
| |
| Russell Microcap | | | 13.17 | | | | 8.91 | | | | 14.29 | | | | 7.68 | |
| |
| Russell Global ex-U.S. Small Cap | | | 30.49 | | | | 11.27 | | | | 9.25 | | | | 3.89 | |
| |
| Russell Global ex-U.S. Large Cap | | | 27.47 | | | | 8.09 | | | | 7.17 | | | | 2.09 | |
| |
| For details on The Royce Funds’ performance in the period, please turn to the Managers’ Discussions that begin on page 8. Past performance is no guarantee of future results. |
This raises the question of when and how—even if—the market’s response to the quickening pace of global growth will mark a more pronounced shift to cyclicals. A clue may have been found in a reversal that occurred in the fourth quarter, when small-cap cyclicals enjoyed higher returns than defensives, which is typically the case in a growing economy. After trailing through the first three quarters of 2017, small-cap cyclicals advanced 3.9% while defensive stocks were up 1.9% (and the Russell 2000 was up 3.3%). Going forward, we expect investors to increasingly focus on individual company attributes, especially cyclical exposure and company-specific risks. Our view is that this performance pattern should extend into 2018.
WHEN IT COMES TO SMALL-CAP, IT’S THE COMPANIES, NOT THE INDEXES
Its high valuation makes the Russell 2000 Index look risky, but numerous opportunities can still be found in small-cap
Based on this view, we believe the opportunity for small-cap investors is not the index itself or the broader asset class as a whole—it’s in select companies in the asset class. In a similar vein, we think that investors should lower their expectations for overall small-cap returns—which is why we believe selectivity has been so critical of late, and why we are increasingly convinced that it will remain so in 2018. Both the lofty state of small-cap valuations at the end of 2017 and recent performance patterns suggest that returns are unlikely to stay as elevated as they have been—for |
the index, growth stocks, and defensives in particular, but not necessarily for certain cyclical small-caps. We suspect that success over the next few years will hinge on making careful selections and maintaining discipline—in essence, the time-honored argument for the importance of active small-cap management.
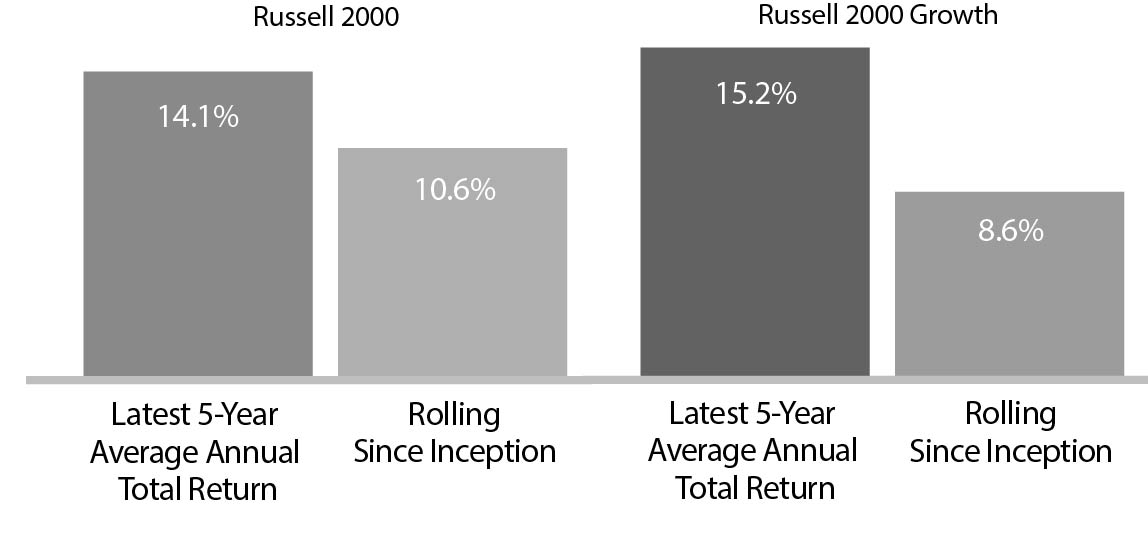
A look at five-year results for the Russell 2000 and Russell 2000 Growth best clarifies our thinking, as both exceeded their long-term averages. The small-cap index’s 14.1% five-year average annual total return for the period ended December 31, 2017 ran appreciably higher than its 10.6% monthly rolling five-year average since inception (12/31/78). The spread was even more pronounced for growth—a 15.2% five-year average annual total return for the same period versus its 8.6% monthly rolling five-year average since inception. These higher-than-average returns simply do not look sustainable to us over the long run. To be sure, while we are optimistic about the prospects for select small-cap companies, we remain firm believers in reversion to the mean for the index. |
| |
| |
| Latest Returns Much Higher Than History |
 |
For context, we invite investors to consider how the metrics for the Russell 2000 stack up compared to a fundamentally strong small-cap business with positive earnings and healthy cash flows from operations. At the end of 2017, more than 34% of the companies in the small-cap index had no earnings compared to only 25% at the end of 2007. The index in aggregate also had higher leverage than it did 10 years ago: at the end of 2017, the weighted average long-term debt to capital ratio2 for the Russell |
| 2 Long-term debt to capital is calculated by dividing a company’s long-term debt by its total capital. |
| 4 | This page is not part of the 2017 Annual Report to Stockholders |
LETTER TO OUR STOCKHOLDERS
2000 was 35% versus 29% at the end of 2007. Add to all this the fact that small-caps have not seen a pullback greater than 6.4% for nearly two years dating back to the last small-cap trough on February 11, 2016, and the Russell 2000 looks very risky to us, especially compared to the opportunities to be found in individual small-cap businesses. From our perspective as small-cap specialists, all of this makes a small-cap correction look increasingly likely in 2018. Financially sound companies with growing earnings and modest valuations look far better positioned to us for the kind of lower-return market we are anticipating. Our expectation for annual small-cap returns falls in the 5-7% range over the intermediate term. It’s also worth noting that five-year periods in the zone of 5-10% for the small-cap index have been those with the biggest outperformance spread for active managers.
Two other points are worth emphasizing. The first is to offer a seemingly counterintuitive word of caution about the expanding global economy. As excited as we are about the current period of synchronized global growth, we have also observed that Main Street and Wall Street do not always walk hand in hand. Market cycles and economic cycles are different animals. As economic news continues to improve, there is no guarantee that the market will match its pace. Ultimately, we see global growth as a positive for stocks. But the market may well deviate from what the economy is doing in the months ahead (which is fairly typical) as investors try to sort things out after an almost 10-year bull market for large-caps and a nearly two-year upswing for small-caps.
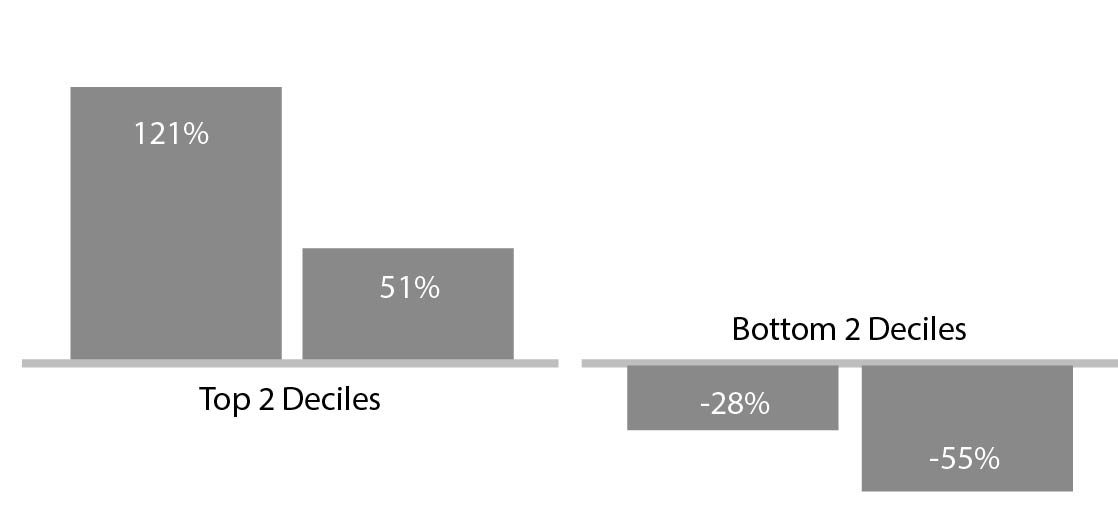
Our second point is to highlight the enormity and diversity of the U.S. small-cap universe. This goes beyond the more than 2,200 |
| publicly traded companies with market capitalizations between $100 million and $3 billion. It also pertains to performance and valuation. For example, the top two deciles of the Russell 2000 were up 121% and 51% in 2017, while the bottom two fell 55% and 28%. Given such wide dispersion, we believe that we can always find long-term opportunities. |
| |
| |
| Divergence: Russell 2017 Returns |
 |
THE SMALL-CAP OPPORTUNITY:
GLOBAL GROWTH IN CYCLICALS
We see leadership coming from small-caps in economically sensitive industries that blend profitability, relatively attractive valuation, and global exposure
As confidence in the economy solidifies, the mounting importance of earnings growth or recovery should benefit cyclicals—small-caps in particular—as it has in the past. Cyclicals have historically done best in exactly the kind of economic environment in which we now find ourselves. Valuations for small-cap cyclicals also look more attractive relative to defensives. Moreover, it seems that the end has come for the extended, 30-year bull market for bonds. Being far less yield sensitive, cyclicals should face fewer headwinds as rates rise. |
| Ultimately, we see global growth as a positive for stocks. But the market may well deviate from what the economy is doing in the months ahead (which is fairly typical) as investors try to sort things out after an almost 10-year bull market for large-caps and a nearly two-year upswing for small-caps. |
| This page is not part of the 2017 Annual Report to Stockholders | 5 |
LETTER TO OUR STOCKHOLDERS
2017 Russell 2000
Returns by Percent
of Foreign Sales | 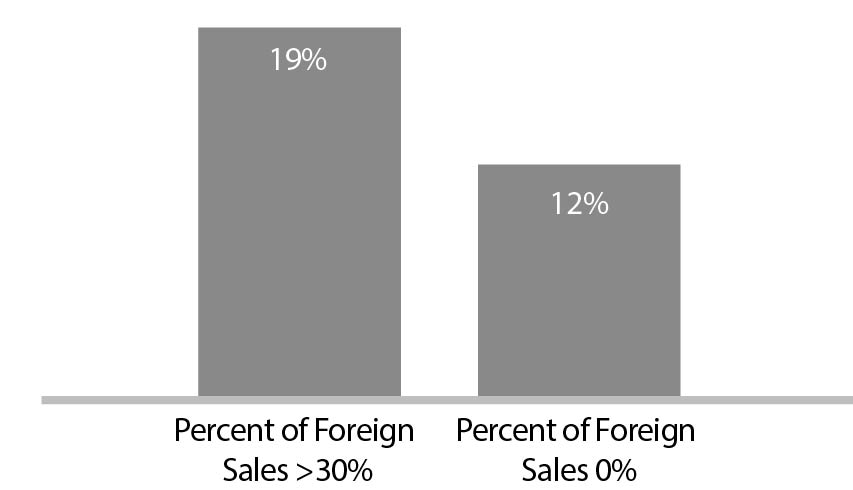 |
We think investors should be focusing on these matters rather than tax cuts or high valuations for indexes. While the reduced corporate tax rate is an undeniable benefit for small-caps, its positive effect is only lasting insofar as it encourages productive capital investment and allocation (the key, in our view, to creating additional growth beyond the reduced rate). As small-cap specialists, we see the accelerating global economy as the more significant development. Indeed, its effects can already be seen when one looks more closely at 2017’s returns. Companies in the Russell 2000 with no foreign sales were up 12% while those with foreign sales of 30% or greater advanced 19%. |
| So we enter 2018 with a measured confidence, charting a middle course between bullishness and bearishness. Our expectation is for positive small-cap returns that are nonetheless likely to be lower than their long-term historical average. We believe that small-cap performance will be driven by three factors: a preference for profitability, relatively lower valuations for both cyclicals and value stocks, and burgeoning economic strength at home and abroad. Together, these support the leadership case for small-cap companies with global exposure in cyclical industries that also possess quality in the form of high returns on invested capital. Russell 2000 companies with the highest ROIC did quite well in 2017, in fact. These kinds of businesses look best positioned to benefit from increasing economic growth—even in the event of a pullback. With selectivity and discipline being the keys, we see the opportunity for disciplined and select active small-cap strategies to shine in 2018. |
 | |  | |  |
| Charles M. Royce | | Christopher D. Clark | | Francis D. Gannon |
| Chairman, | | Chief Executive Officer and | | Co-Chief Investment Officer, |
| Royce & Associates, LP | | Co-Chief Investment Officer,
Royce & Associates, LP | | Royce & Associates, LP |
| | | | | |
| January 31, 2018 | | | | |
| 6 | This page is not part of the 2017 Annual Report to Stockholders |
Performance
| |
| |
NAV Average Annual Total Returns
As of December 31, 2017 (%) |
| | | | | | | | | | | |
| | | | | | | | | | | | | | | | | | | | | | |
| | | | 1-YR | | 3-YR | | 5-YR | | 10-YR | | 15-YR | | 20-YR | | 25-YR | | 30-YR | | SINCE
INCEPTION | | INCEPTION
DATE |
| |
| Royce Global Value Trust | | 31.07 | | 12.04 | | N/A | | N/A | | N/A | | N/A | | N/A | | N/A | | 7.50 | | 10/17/13 |
| |
| Royce Micro-Cap Trust | | 17.67 | | 8.21 | | 13.65 | | 7.75 | | 11.51 | | 9.84 | | N/A | | N/A | | 11.09 | | 12/14/93 |
| |
| Royce Value Trust | | 19.38 | | 11.63 | | 13.47 | | 7.18 | | 10.79 | | 9.45 | | 10.73 | | 11.53 | | 10.83 | | 11/26/86 |
| |
INDEX | | | | | | | | | | | | | | | | | | | | |
| |
| Russell Global Small Cap Index | | 23.33 | | 10.54 | | 10.94 | | 5.43 | | 11.34 | | 7.97 | | N/A | | N/A | | N/A | | N/A |
| |
| Russell Microcap Index | | 13.17 | | 8.91 | | 14.29 | | 7.68 | | 10.34 | | N/A | | N/A | | N/A | | N/A | | N/A |
| |
| Russell 2000 Index | | 14.65 | | 9.96 | | 14.12 | | 8.71 | | 11.17 | | 7.89 | | 9.54 | | 10.46 | | N/A | | N/A |
| |
Important Performance and Risk Information
All performance information in this Review and Report reflects past performance, is presented on a total return basis, net of the Fund’s investment advisory fee, and reflects the reinvestment of distributions. Past performance is no guarantee of future results. Investment return and principal value of an investment will fluctuate, so that shares may be worth more or less than their original cost when sold. Current performance may be higher or lower than performance quoted. Current month-end performance may be obtained at www.roycefunds.com. The Funds are closed-end registered investment companies whose respective shares of common stock may trade at a discount to the net asset value. Shares of each Fund’s common stock are also subject to the market risk of investing in the underlying portfolio securities held by each Fund. Certain immaterial adjustments were made to the net assets of Royce Micro-Cap Trust at 12/31/12, as well as 12/31/14 and of Royce Value Trust at 12/31/16, for financial reporting purposes, and as a result the total return based on that net asset value differs from the adjusted net asset value and total return reported in the Financial Highlights. All indexes referenced are unmanaged and capitalization-weighted. Each index’s returns include net reinvested dividends and/or interest income. Russell Investment Group is the source and owner of the trademarks, service marks and copyrights related to the Russell Indexes. Russell® is a trademark of Russell Investment Group. The Russell 2000 Index is an index of domestic small-cap stocks that measures the performance of the 2,000 smallest publicly traded U.S. companies in the Russell 3000 Index. The Russell Microcap Index includes 1,000 of the smallest securities in the small-cap Russell 2000 Index, along with the next smallest eligible securities as determined by Russell. The Russell Global Small Cap Index is an unmanaged, capitalization-weighted index of global small-cap stocks. The performance of an index does not represent exactly any particular investment, as you cannot invest directly in an index. Index returns include net reinvested dividends and/or interest income. Royce Value, Micro-Cap and Global Value Trust shares of common stock trade on the NYSE. Royce Fund Services, Inc (“RFS”) is a member of FINRA and files certain material with FINRA on behalf of each Fund. RFS is not an underwriter or distributor of any of the Funds.
This page is not part of the 2017 Annual Report to Stockholders | 7
| MANAGERS’ DISCUSSION |
| Royce Global Value Trust (RGT) |
 |
Chuck Royce
David Nadel
Chris Flynn |
| |
FUND PERFORMANCE
A strong absolute and relative showing in 2017 gave Royce Global Value Trust (“RGT”) an advantage over its unleveraged benchmark, the Russell Global Small Cap Index, for the one- and three-year periods ended December 31, 2017 on both a net asset value (“NAV”) and market price basis. The Fund advanced 31.1% on an NAV basis and 36.0% based on market price in 2017, in both instances substantially ahead of the Russell Global Small Cap Index, which rose 23.3% for the same period. 2017 was a terrific year for stocks up and down the asset class scale and across much of the globe, and we were pleased to see the portfolio more than fully participate. |
| WHAT WORKED... AND WHAT DIDN’T |
Nine of the Fund’s 11 equity sectors finished 2017 in the black. Only Energy detracted—and did so modestly—while Utilities was essentially flat. Industrials and Information Technology led by wide margins, followed by more-than-respectable contributions from Financials and Health Care. Relative to the benchmark, the portfolio’s advantage came overwhelmingly from stock selection, primarily in Financials, Information Technology, and Industrials. The first of these sectors saw the greatest relative edge come from holdings in capital markets and consumer finance while in Information Technology the electronic equipment, instruments & components and IT services groups had the biggest impact. In Industrials, trading companies & distributors and commercial services & supplies showed the best relative strength. Conversely, ineffective stock selection in Materials hurt relative performance, as did the portfolio’s cash position.
At the industry level, two groups dominated results on an absolute basis—the aforementioned capital markets and electronic equipment, instruments & components—while the IT services (Information Technology) and health care equipment & supplies (Health Care) industries also made noteworthy positive contributions. The impact of detractors at this same level was comparably very light, with oil, gas & consumable fuels (Energy), technology hardware, storage & peripherals (Information Technology), insurance (Financials), and communications equipment (Information Technology) detracting most. Those countries making the greatest positive impact in 2017 were the U.S., the United Kingdom, Japan, and Germany while South Africa and Puerto Rico detracted most.
The top contributor at the position level was Indian consumer finance company, Bajaj Finance. Its shares were lifted by its strong position in India’s nascent credit markets, which we believe have a long runway for growth given the nation’s fast-growing middle class and its low household debt to GDP ratio. Bajaj has also benefited from successfully cross selling services across its many locations. Cognex Corporation is the market leader in machine vision technology, which captures and analyzes visual information to automate tasks that previously relied on human eyesight and is thus a major driver of industrial and process automation. The firm has just begun to move into key end markets, such as consumer electronics, while adoption is expanding to other industries, including a fast-growing logistics segment. With ever-evolving proprietary technology and an unmatched global corps of engineers serving customers, the firm looks poised to sustain its well-above-average ROIC and compound its business value into the future. |
| |
| The top detractor at the position level was South Africa’s EOH Holdings, Africa’s largest independent information-technology provider, with leading positions in business process outsourcing and SAP implementation across the continent. We were attracted to its rare combination of attractive valuation, strong market position, high growth, and conservative balance sheet. However, we sold our shares when unexplained insider selling and the threat of customer losses compounded the effects of well-publicized accounting and corruption scandals engulfing even some of the blue-chip denizens of South African business. We had more confidence in the turnaround potential of CIRCOR International, which makes an array of valves and provides related flow control products and services. Valve sales to the domestic land-based oil industry improved when the price of oil rallied in the second half of the year, but could not offset the sales declines to large offshore project customers where investments are only now showing signs of bottoming and pricing is intense. We think it can eventually benefit from a recovery in energy prices and the further integration of a recent acquisition, which diversifies its end markets and brings higher margins, differentiated products, and aftermarket service revenue streams, factors that led us to add shares in 2017. |
| | | | | |
| | Top Contributors to Performance
For 2017 (%)1 | | | |
| | | | | |
| | Bajaj Finance | | 0.98 | |
| | | |
| | Cognex Corporation | | 0.97 | |
| | | |
| | SEI Investments | | 0.75 | |
| | | |
| | Relo Group | | 0.74 | |
| | | |
| | Vakrangee | | 0.71 | |
| | | |
| | 1 Includes dividends | | | |
| | | | | |
| | | | | |
| | Top Detractors from Performance
For 2017 (%)2 | | | |
| | | | | |
| | EOH Holdings Limited | | -0.28 | |
| | | |
| | CIRCOR International | | -0.26 | |
| | | |
| | MBIA | | -0.25 | |
| | | |
| | World Fuel Services | | -0.20 | |
| | | |
| | Diebold Nixdorf | | -0.18 | |
| | | |
| | 2 Net of dividends | | | |
| | | | | |
| CURRENT POSITIONING AND OUTLOOK |
| We have a more positive outlook for international stocks and are more cautious on domestic issues, which makes the Fund’s global flexibility particularly timely. While guarded about prospective U.S. small-cap index returns, we are also optimistic about the portfolio’s potential as it leans towards three factors that we believe will be rewarded going forward—cyclicals, global exposure, and—in many cases—high profitability. In this environment, we see the opportunity for the Fund to continue outperforming in the years ahead. |
| 8 | 2017 Annual Report to Stockholders |
| PERFORMANCE AND PORTFOLIO REVIEW | | SYMBOLS MARKET PRICE RGT NAV XRGTX |
| Performance |
| Average Annual Total Return (%) Through 12/31/17 |
| | | JUL-DEC 20171 | | 1-YR | | 3-YR | | SINCE INCEPTION (10/17/13) |
| |
| RGT (NAV) | | 12.89 | | 31.07 | | 12.04 | | 7.50 |
| |
| 1 Not Annualized | | | | | | | | |
Market Price Performance History Since Inception (10/17/13)Cumulative Performance of Investment1
| | | 1-YR | | 5-YR | | 10-YR | | 15-YR | | 20-YR | | SINCE INCEPTION (10/17/13) |
| |
| RGT | | 36.0% | | N/A | | N/A | | N/A | | N/A | | 28.0% |
| |
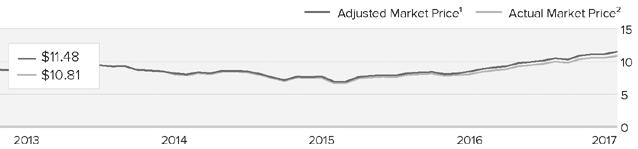
| 1 | Reflects the cumulative performance experience of a continuous common stockholder who purchased one share at inception ($8.975 IPO) and reinvested all distributions. |
| 2 | Reflects the actual month-end market price movement of one share as it has traded on NYSE and, prior to 12/1/03, on the Nasdaq. |
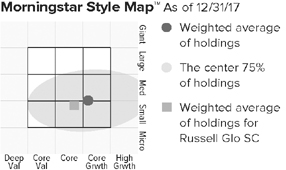
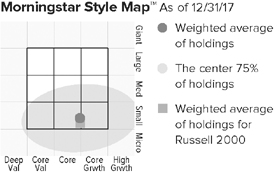
The Morningstar Style Map is the Morningstar Style Box™ with the center 75% of fund holdings plotted as the Morningstar Ownership Zone™. The Morningstar Style Box is designed to reveal a fund’s investment strategy. The Morningstar Ownership Zone provides detail about a portfolio’s investment style by showing the range of stock sizes and styles. The Ownership Zone is derived by plotting each stock in the portfolio within the proprietary Morningstar Style Box. Over time, the shape and location of a fund’s ownership zone may vary. See page 66 for additional information. |
|
| Top 10 Positions | | |
| % of Net Assets | | |
| | | |
| SEI Investments | | 1.9 |
| |
| Kirby Corporation | | 1.7 |
| |
| TGS-NOPEC Geophysical | | 1.7 |
| |
| FLIR Systems | | 1.5 |
| |
| VZ Holding | | 1.5 |
| |
| Lazard Cl. A | | 1.3 |
| |
| Ashmore Group | | 1.2 |
| |
| Clarkson | | 1.1 |
| |
| Spirax-Sarco Engineering | | 1.1 |
| |
| USS | | 1.1 |
| |
|
| Portfolio Sector Breakdown | | |
| % of Net Assets | | |
| | | |
| Industrials | | 25.6 |
| |
| Information Technology | | 18.4 |
| |
| Financials | | 16.7 |
| |
| Materials | | 11.1 |
| |
| Health Care | | 9.9 |
| |
| Consumer Discretionary | | 8.4 |
| |
| Energy | | 3.3 |
| |
| Consumer Staples | | 2.8 |
| |
| Real Estate | | 2.3 |
| |
| Telecommunication Services | | 0.2 |
| |
| Utilities | | 0.1 |
| |
| Cash and Cash Equivalents, Net of Outstanding Line of Credit | | 1.2 |
| |
|
| Calendar Year Total Returns (%) | | |
| | | |
| YEAR | | RGT |
| |
| 2017 | | 31.1 |
| |
| 2016 | | 11.1 |
| |
| 2015 | | -3.4 |
| |
| 2014 | | -6.2 |
| |
|
Portfolio Country Breakdown1,2
% of Net Assets | | |
| | | |
| |
| United States | | 27.5 |
| |
| United Kingdom | | 12.0 |
| |
| Japan | | 9.3 |
| |
| Canada | | 8.5 |
| |
| Switzerland | | 4.1 |
| |
| Australia | | 3.8 |
| |
| France | | 3.7 |
| |
| India | | 3.4 |
| |
| Germany | | 3.3 |
| |
| 1 Represents countries that are 3% or more of net assets. |
| 2 Securities are categorized by the country of their headquarters. |
|
| Portfolio Diagnostics | | |
| | | |
| Fund Net Assets | | $131 million |
| |
| Number of Holdings | | 348 |
| |
| 2017 Annual Turnover Rate | | 34% |
| |
| Net Asset Value | | $12.48 |
| |
| Market Price | | $10.81 |
| |
| Average Market Capitalization1 | | $1,933 million |
| |
| Weighted Average P/E Ratio2,3 | | 22.2x |
| |
| Weighted Average P/B Ratio2 | | 2.9x |
| |
| Active Share4 | | 97% |
| |
| 1 | Geometric Average. This weighted calculation uses each portfolio holding’s market cap in a way designed to not skew the effect of very large or small holdings; instead, it aims to better identify the portfolio’s center, which Royce believes offers a more accurate measure of average market cap than a simple mean or median. |
| 2 | Harmonic Average. This weighted calculation evaluates a portfolio as if it were a single stock and measures it overall. It compares the total market value of the portfolio to the portfolio’s share in the earnings or book value, as the case may be, of its underlying stocks. |
| 3 | The Fund’s P/E ratio calculation excludes companies with zero or negative earnings (7% of portfolio holdings as of 12/31/17). |
| 4 | Active Share is the sum of the absolute values of the different weightings of each holding in the Fund versus each holding in the benchmark, divided by two. |
| Important Performance and Risk Information All performance information reflects past performance, is presented on a total return basis, net of the Fund’s investment advisory fee, and reflects the reinvestment of distributions. Past performance is no guarantee of future results. Current performance may be higher or lower than performance quoted. Returns as of the most recent month-end may be obtained at www.roycefunds.com. The market price of the Fund’s shares will fluctuate, so that shares may be worth more or less than their original cost when sold. The Fund invests primarily in securities of small- and mid-cap companies, which may involve considerably more risk than investments in securities of larger-cap companies. The Fund’s broadly diversified portfolio does not ensure a profit or guarantee against loss. From time to time, the Fund may invest a significant portion of its net assets in foreign securities, which may involve political, economic, currency and other risks not encountered in U.S. investments. Regarding the “Top Contributors” and “Top Detractors” tables shown above, the sum of all contributors to, and all detractors from, performance for all securities in the portfolio would approximate the Fund’s year-to-date performance for 2017. |
| 2017 Annual Report to Stockholders | 9 |
| |
| Schedule of Investments | | | | | | | | |
| Common Stocks – 98.8% | | | | | | | | |
| | | | SHARES | | | | VALUE | |
| |
| | | | | | | | | |
| AUSTRALIA – 3.8% | | | | | | | | |
ALS | | | 155,000 | | | $ | 844,746 | |
Austal | | | 43,700 | | | | 61,786 | |
†Bravura Solutions | | | 395,449 | | | | 533,811 | |
Cochlear | | | 5,500 | | | | 734,261 | |
†Decmil Group | | | 60,000 | | | | 60,972 | |
†Eureka Group Holdings 1 | | | 175,000 | | | | 43,539 | |
†Hansen Technologies | | | 335,000 | | | | 1,031,112 | |
†HT&E | | | 110,400 | | | | 161,803 | |
Imdex 1 | | | 103,100 | | | | 84,750 | |
IPH | | | 260,000 | | | | 1,114,946 | |
NetComm Wireless 1 | | | 13,350 | | | | 12,484 | |
Seeing Machines 1 | | | 2,171,489 | | | | 164,892 | |
†Tassal Group | | | 48,300 | | | | 141,362 | |
| |
| Total (Cost $4,291,516) | | | | | | | 4,990,464 | |
| |
| | | | | | | | | |
| AUSTRIA – 0.8% | | | | | | | | |
Mayr-Melnhof Karton | | | 7,500 | | | | 1,102,357 | |
| |
| Total (Cost $893,160) | | | | | | | 1,102,357 | |
| |
| | | | | | | | | |
| BELGIUM – 0.1% | | | | | | | | |
†Agfa-Gevaert 1 | | | 15,200 | | | | 70,885 | |
†Greenyard | | | 2,700 | | | | 65,120 | |
| |
| Total (Cost $123,771) | | | | | | | 136,005 | |
| |
| | | | | | | | | |
| BRAZIL – 2.1% | | | | | | | | |
†B3 | | | 32,847 | | | | 225,163 | |
†Construtora Tenda 1 | | | 20,000 | | | | 120,380 | |
†Direcional Engenharia 1 | | | 14,000 | | | | 23,765 | |
†International Meal Company Alimentacao | | | 25,000 | | | | 65,045 | |
Minerva | | | 26,250 | | | | 84,186 | |
†MRV Engenharia e Participacoes | | | 21,700 | | | | 98,229 | |
OdontoPrev | | | 225,000 | | | | 1,076,219 | |
T4F Entretenimento | | | 50,400 | | | | 111,355 | |
TOTVS | | | 108,000 | | | | 972,174 | |
| |
| Total (Cost $2,398,739) | | | | | | | 2,776,516 | |
| |
| | | | | | | | | |
| CANADA – 8.5% | | | | | | | | |
Agnico Eagle Mines 2 | | | 5,000 | | | | 230,900 | |
AGT Food and Ingredients | | | 4,300 | | | | 68,793 | |
†Aimia 1 | | | 35,000 | | | | 104,137 | |
†Calfrac Well Services 1 | | | 26,100 | | | | 124,167 | |
Canaccord Genuity Group | | | 92,000 | | | | 424,503 | |
†Centric Health 1 | | | 221,800 | | | | 91,755 | |
Computer Modelling Group | | | 108,000 | | | | 824,821 | |
†Corsa Coal 1 | | | 99,200 | | | | 161,782 | |
E-L Financial | | | 1,200 | | | | 777,861 | |
Exco Technologies | | | 24,000 | | | | 193,604 | |
FirstService Corporation | | | 10,300 | | | | 720,176 | |
Franco-Nevada Corporation 2 | | | 10,200 | | | | 815,490 | |
Genworth MI Canada | | | 13,000 | | | | 449,881 | |
Gluskin Sheff + Associates | | | 23,000 | | | | 304,654 | |
†Hudbay Minerals | | | 7,400 | | | | 65,120 | |
†Leucrotta Exploration 1 | | | 27,700 | | | | 37,903 | |
Magellan Aerospace | | | 9,400 | | | | 157,115 | |
Major Drilling Group International 1 | | | 188,500 | | | | 1,058,719 | |
Morneau Shepell | | | 50,000 | | | | 887,033 | |
†North American Energy Partners | | | 31,882 | | | | 157,816 | |
Pan American Silver 2,3 | | | 31,800 | | | | 494,808 | |
†Rocky Mountain Dealerships | | | 7,100 | | | | 77,383 | |
Sandstorm Gold 1 | | | 10,000 | | | | 49,900 | |
Solium Capital 1 | | | 69,000 | | | | 598,878 | |
Sprott | | | 520,600 | | | | 1,010,552 | |
†Supremex | | | 18,500 | | | | 66,376 | |
Total Energy Services | | | 2,500 | | | | 29,554 | |
†Wajax Corporation | | | 3,400 | | | | 66,729 | |
Western Forest Products | | | 50,150 | | | | 97,747 | |
Winpak | | | 25,000 | | | | 930,788 | |
| |
| Total (Cost $10,916,771) | | | | | | | 11,078,945 | |
| |
| | | | | | | | | |
| CHILE – 0.1% | | | | | | | | |
†SMU 1 | | | 318,400 | | | | 96,234 | |
| |
| Total (Cost $85,780) | | | | | | | 96,234 | |
| |
| | | | | | | | | |
| CHINA – 1.4% | | | | | | | | |
China Communications Services | | | 203,400 | | | | 136,045 | |
†China Lesso Group Holdings | | | 130,900 | | | | 84,766 | |
Chinasoft International | | | 130,900 | | | | 86,752 | |
†Delong Holdings 1 | | | 67,000 | | | | 132,553 | |
Fufeng Group | | | 275,100 | | | | 179,556 | |
Hopefluent Group Holdings | | | 50,000 | | | | 21,947 | |
†Hua Hong Semiconductor | | | 58,000 | | | | 122,743 | |
TravelSky Technology | | | 300,000 | | | | 899,032 | |
†Xingda International Holdings | | | 160,500 | | | | 56,876 | |
Xtep International Holdings | | | 295,800 | | | | 115,471 | |
| |
| Total (Cost $1,399,684) | | | | | | | 1,835,741 | |
| |
| | | | | | | | | |
| DENMARK – 1.0% | | | | | | | | |
Chr. Hansen Holding | | | 5,500 | | | | 515,822 | |
Coloplast Cl. B | | | 4,000 | | | | 317,184 | |
Columbus | | | 26,200 | | | | 62,419 | |
†DFDS | | | 1,200 | | | | 64,008 | |
Zealand Pharma 1 | | | 24,000 | | | | 328,519 | |
| |
| Total (Cost $1,042,617) | | | | | | | 1,287,952 | |
| |
| | | | | | | | | |
| EGYPT – 0.1% | | | | | | | | |
†Egyptian Financial Group-Hermes Holding | | | | | | | | |
Company | | | 70,800 | | | | 93,975 | |
†Oriental Weavers | | | 82,300 | | | | 77,209 | |
| |
| Total (Cost $172,777) | | | | | | | 171,184 | |
| |
| | | | | | | | | |
| FINLAND – 0.0% | | | | | | | | |
†Ferratum | | | 1,300 | | | | 47,432 | |
| |
| Total (Cost $37,828) | | | | | | | 47,432 | |
| |
| | | | | | | | | |
| FRANCE – 3.7% | | | | | | | | |
Bigben Interactive 1 | | | 5,000 | | | | 82,601 | |
HighCo | | | 8,100 | | | | 47,503 | |
Interparfums | | | 13,500 | | | | 558,931 | |
Manutan International | | | 450 | | | | 48,315 | |
Neurones | | | 25,500 | | | | 880,548 | |
Rothschild & Co | | | 33,000 | | | | 1,207,840 | |
Synergie | | | 1,400 | | | | 73,648 | |
Thermador Groupe | | | 9,500 | | | | 1,293,798 | |
Vetoquinol | | | 8,000 | | | | 580,948 | |
| |
| Total (Cost $2,899,952) | | | | | | | 4,774,132 | |
| |
| | | | | | | | | |
| GEORGIA – 0.1% | | | | | | | | |
BGEO Group | | | 2,400 | | | | 115,015 | |
| |
| Total (Cost $72,732) | | | | | | | 115,015 | |
| |
| 10 | 2017 Annual Report to Stockholders | | THE ACCOMPANYING NOTES ARE AN INTEGRAL PART OF THESE FINANCIAL STATEMENTS |
| |
| Schedule of Investments (continued) | | | | | | | | |
| | | | | | | | | |
| | | | SHARES | | | | VALUE | |
| |
| | | | | | | | | |
| GERMANY – 3.3% | | | | | | | | |
CANCOM | | | 1,350 | | | $ | 112,193 | |
Carl Zeiss Meditec | | | 17,500 | | | | 1,084,791 | |
CompuGroup Medical | | | 8,000 | | | | 523,821 | |
†Deutsche EuroShop | | | 1,700 | | | | 69,203 | |
†Energiekontor | | | 6,200 | | | | 106,037 | |
Fielmann | | | 8,000 | | | | 704,068 | |
†FinTech Group 1 | | | 1,800 | | | | 65,971 | |
HolidayCheck Group 1 | | | 19,150 | | | | 64,132 | |
†JDC Group 1 | | | 7,000 | | | | 81,020 | |
MorphoSys 1 | | | 6,000 | | | | 549,246 | |
mutares | | | 2,500 | | | | 47,683 | |
†PSI Software | | | 2,600 | | | | 57,736 | |
STRATEC Biomedical | | | 9,000 | | | | 697,806 | |
VIB Vermoegen | | | 5,200 | | | | 132,145 | |
| |
| Total (Cost $2,616,679) | | | | | | | 4,295,852 | |
| |
| | | | | | | | | |
| GREECE – 0.1% | | | | | | | | |
Aegean Marine Petroleum Network 2 | | | 1,250 | | | | 5,375 | |
†JUMBO | | | 5,900 | | | | 105,302 | |
Sarantis | | | 2,900 | | | | 43,954 | |
| |
| Total (Cost $151,794) | | | | | | | 154,631 | |
| |
| | | | | | | | | |
| HONG KONG – 1.4% | | | | | | | | |
†Dah Sing Financial Holdings | | | 19,900 | | | | 127,375 | |
HKBN | | | 100,000 | | | | 126,456 | |
I.T | | | 182,900 | | | | 77,947 | |
†International Housewares Retail | | | 380,000 | | | | 75,825 | |
Oriental Watch Holdings | | | 232,950 | | | | 53,053 | |
†Perfect Shape Beauty Technology | | | 600,000 | | | | 96,150 | |
Pico Far East Holdings | | | 376,300 | | | | 149,308 | |
Television Broadcasts | | | 54,000 | | | | 194,651 | |
†Texhong Textile Group | | | 47,600 | | | | 61,770 | |
†Tongda Group Holdings | | | 224,100 | | | | 57,295 | |
Value Partners Group | | | 712,600 | | | | 754,107 | |
†Xinyi Glass Holdings | | | 71,100 | | | | 92,627 | |
| |
| Total (Cost $1,725,861) | | | | | | | 1,866,564 | |
| |
| | | | | | | | | |
| INDIA – 3.4% | | | | | | | | |
Bajaj Finance | | | 50,000 | | | | 1,378,247 | |
†Borosil Glass Works | | | 3,400 | | | | 51,996 | |
CCL Products India | | | 10,600 | | | | 49,786 | |
†Dewan Housing Finance | | | 6,500 | | | | 59,127 | |
†Edelweiss Financial Services | | | 19,300 | | | | 89,714 | |
†Hinduja Global Solutions | | | 3,500 | | | | 49,145 | |
IIFL Holdings | | | 2,750 | | | | 28,899 | |
†Indo Count Industries | | | 42,200 | | | | 82,071 | |
Manappuram Finance | | | 70,100 | | | | 134,633 | |
†Mphasis | | | 2,400 | | | | 27,113 | |
†Multi Commodity Exchange of India | | | 5,300 | | | | 75,775 | |
†NIIT 1 | | | 35,400 | | | | 56,948 | |
†Radico Khaitan | | | 13,900 | | | | 63,872 | |
†Redington India | | | 30,000 | | | | 82,433 | |
SH Kelkar & Company | | | 175,000 | | | | 810,260 | |
†Shriram Transport Finance | | | 2,400 | | | | 55,232 | |
†Vakrangee | | | 100,000 | | | | 655,634 | |
†Vakrangee (Bonus Shares) 1 | | | 100,000 | | | | 656,457 | |
| |
| Total (Cost $2,336,170) | | | | | | | 4,407,342 | |
| |
| | | | | | | | | |
| INDONESIA – 0.5% | | | | | | | | |
†Media Nusantara Citra | | | 378,800 | | | | 35,875 | |
†Mitra Pinasthika Mustika | | | 1,000,000 | | | | 71,507 | |
Selamat Sempurna | | | 5,800,000 | | | | 536,338 | |
| |
| Total (Cost $647,283) | | | | | | | 643,720 | |
| |
| | | | | | | | | |
| IRELAND – 0.6% | | | | | | | | |
Irish Residential Properties REIT | | | 20,000 | | | | 36,149 | |
Keywords Studios | | | 37,500 | | | | 804,977 | |
| |
| Total (Cost $113,998) | | | | | | | 841,126 | |
| |
| | | | | | | | | |
| ISRAEL – 0.7% | | | | | | | | |
†Frutarom Industries | | | 7,500 | | | | 703,945 | |
Nova Measuring Instruments 1,2,3 | | | 5,500 | | | | 142,505 | |
Sarine Technologies | | | 12,850 | | | | 9,606 | |
| |
| Total (Cost $635,614) | | | | | | | 856,056 | |
| |
| | | | | | | | | |
| ITALY – 0.8% | | | | | | | | |
†Anima Holding | | | 7,400 | | | | 52,852 | |
DiaSorin | | | 8,500 | | | | 754,250 | |
†Openjobmetis 1 | | | 11,900 | | | | 183,850 | |
| |
| Total (Cost $573,963) | | | | | | | 990,952 | |
| |
| | | | | | | | | |
| JAPAN – 9.3% | | | | | | | | |
Ai Holdings | | | 45,000 | | | | 1,088,184 | |
†As One | | | 15,000 | | | | 937,542 | |
†Ateam | | | 4,700 | | | | 112,861 | |
C. Uyemura & Co. | | | 1,100 | | | | 83,894 | |
EPS Holdings | | | 2,500 | | | | 56,456 | |
†Financial Products Group | | | 5,700 | | | | 69,150 | |
G-Tekt | | | 3,400 | | | | 69,930 | |
†H.I.S. | | | 1,100 | | | | 39,835 | |
†IDOM | | | 16,800 | | | | 119,037 | |
†Investors Cloud | | | 9,000 | | | | 133,702 | |
Itochu Techno-Solutions | | | 2,900 | | | | 125,697 | |
Kenedix | | | 13,450 | | | | 81,970 | |
Kenko Mayonnaise | | | 1,650 | | | | 59,678 | |
†Kyowa Exeo | | | 5,000 | | | | 129,457 | |
Leopalace21 | | | 11,500 | | | | 89,423 | |
Mandom Corporation | | | 2,800 | | | | 91,514 | |
Meitec Corporation | | | 26,400 | | | | 1,389,867 | |
Nihon Kohden | | | 37,500 | | | | 870,463 | |
Nitto Kohki | | | 3,100 | | | | 78,630 | |
NS Solutions | | | 6,800 | | | | 185,358 | |
†NSD | | | 3,600 | | | | 76,616 | |
Open House | | | 2,400 | | | | 128,882 | |
†Osaka Soda | | | 2,540 | | | | 65,003 | |
Outsourcing | | | 5,500 | | | | 100,161 | |
Pressance | | | 1,850 | | | | 24,684 | |
Relo Group | | | 40,000 | | | | 1,089,485 | |
Ryobi | | | 1,040 | | | | 29,554 | |
Santen Pharmaceutical | | | 55,000 | | | | 863,488 | |
Shimano | | | 3,500 | | | | 492,452 | |
SPARX Group | | | 27,550 | | | | 76,166 | |
Sugi Holdings | | | 17,500 | | | | 892,480 | |
Sun Frontier Fudousan | | | 12,000 | | | | 136,290 | |
Takara Leben | | | 12,600 | | | | 55,638 | |
Tenpos Busters | | | 5,800 | | | | 111,087 | |
Tokai Corporation | | | 4,400 | | | | 100,413 | |
†Tokuyama Corporation | | | 1,980 | | | | 64,389 | |
| THE ACCOMPANYING NOTES ARE AN INTEGRAL PART OF THESE FINANCIAL STATEMENTS | | 2017 Annual Report to Stockholders | 11 |
| |
| Schedule of Investments (continued) | | | | | | | | |
| | | | | | | | | |
| | | | SHARES | | | | VALUE | |
| |
| | | | | | | | | |
| JAPAN (continued) | | | | | | | | |
Trancom | | | 2,400 | | | $ | 168,742 | |
USS | | | 67,500 | | | | 1,427,970 | |
†Yumeshin Holdings | | | 15,300 | | | | 147,537 | |
†Zenkoku Hosho | | | 5,100 | | | | 219,685 | |
| |
| Total (Cost $9,037,116) | | | | | | | 12,083,370 | |
| |
| | | | | | | | | |
| MALAYSIA – 0.1% | | | | | | | | |
CB Industrial Product Holding | | | 151,200 | | | | 67,238 | |
| |
| Total (Cost $70,731) | | | | | | | 67,238 | |
| |
| | | | | | | | | |
| MEXICO – 0.7% | | | | | | | | |
†Becle 1 | | | 200,000 | | | | 321,424 | |
Bolsa Mexicana de Valores | | | 268,700 | | | | 462,034 | |
†Nemak | | | 57,700 | | | | 41,876 | |
Rassini | | | 31,700 | | | | 112,870 | |
| |
| Total (Cost $1,010,617) | | | | | | | 938,204 | |
| |
| | | | | | | | | |
| MONGOLIA – 0.0% | | | | | | | | |
†Mongolian Mining 1 | | | 862,000 | | | | 23,193 | |
| |
| Total (Cost $34,260) | | | | | | | 23,193 | |
| |
| | | | | | | | | |
| NETHERLANDS – 0.2% | | | | | | | | |
†AMG Advanced Metallurgical Group | | | 3,300 | | | | 165,779 | |
†DP Eurasia 1 | | | 24,400 | | | | 70,834 | |
| |
| Total (Cost $166,721) | | | | | | | 236,613 | |
| |
| | | | | | | | | |
| NEW ZEALAND – 1.6% | | | | | | | | |
Fisher & Paykel Healthcare | | | 102,875 | | | | 1,043,223 | |
New Zealand Refining | | | 21,550 | | | | 40,457 | |
†Trade Me Group | | | 300,000 | | | | 1,031,081 | |
| |
| Total (Cost $1,587,857) | | | | | | | 2,114,761 | |
| |
| | | | | | | | | |
| NORWAY – 1.9% | | | | | | | | |
Kongsberg Automotive 1 | | | 63,000 | | | | 90,043 | |
Nordic Semiconductor 1 | | | 10,750 | | | | 54,972 | |
NRC Group | | | 5,450 | | | | 40,821 | |
†Protector Forsikring | | | 8,950 | | | | 98,104 | |
TGS-NOPEC Geophysical | | | 92,500 | | | | 2,188,077 | |
| |
| Total (Cost $2,098,720) | | | | | | | 2,472,017 | |
| |
| | | | | | | | | |
| PERU – 0.1% | | | | | | | | |
†Ferreycorp | | | 93,200 | | | | 73,295 | |
| |
| Total (Cost $56,092) | | | | | | | 73,295 | |
| |
| | | | | | | | | |
| PHILIPPINES – 0.1% | | | | | | | | |
†Pryce Corporation 1 | | | 563,600 | | | | 76,407 | |
†Robinsons Retail Holdings | | | 44,500 | | | | 85,834 | |
| |
| Total (Cost $150,761) | | | | | | | 162,241 | |
| |
| | | | | | | | | |
| POLAND – 0.3% | | | | | | | | |
Warsaw Stock Exchange | | | 33,000 | | | | 445,467 | |
| |
| Total (Cost $459,764) | | | | | | | 445,467 | |
| |
| | | | | | | | | |
| PORTUGAL – 0.1% | | | | | | | | |
†Sonae SGPS | | | 60,000 | | | | 80,897 | |
| |
| Total (Cost $77,642) | | | | | | | 80,897 | |
| |
| | | | | | | | | |
| RUSSIA – 0.3% | | | | | | | | |
Globaltrans Investment GDR | | | 45,500 | | | | 427,257 | |
| |
| Total (Cost $239,644) | | | | | | | 427,257 | |
| |
| | | | | | | | | |
| SINGAPORE – 1.3% | | | | | | | | |
CSE Global | | | 535,150 | | | | 145,955 | |
†Duty Free International | | | 466,600 | | | | 92,453 | |
†Duty Free International (Warrants) 1 | | | 80,440 | | | | 481 | |
Sheng Siong Group | | | 141,800 | | | | 98,033 | |
†Tat Hong Holdings 1 | | | 200,000 | | | | 67,285 | |
XP Power | | | 24,000 | | | | 1,110,975 | |
†Yanlord Land Group | | | 143,000 | | | | 173,184 | |
| |
| Total (Cost $1,206,718) | | | | | | | 1,688,366 | |
| |
| | | | | | | | | |
| SOUTH AFRICA – 0.7% | | | | | | | | |
Adcock Ingram Holdings | | | 12,050 | | | | 56,817 | |
Coronation Fund Managers | | | 59,000 | | | | 351,790 | |
JSE | | | 15,000 | | | | 186,532 | |
†MiX Telematics ADR | | | 11,500 | | | | 146,740 | |
Nampak 1 | | | 77,200 | | | | 101,172 | |
Raubex Group | | | 52,250 | | | | 84,313 | |
| |
| Total (Cost $878,826) | | | | | | | 927,364 | |
| |
| | | | | | | | | |
| SOUTH KOREA – 0.8% | | | | | | | | |
Eugene Technology | | | 4,400 | | | | 86,296 | |
†Hansol Chemical | | | 900 | | | | 60,851 | |
Hanssem | | | 500 | | | | 84,071 | |
†Huchems Fine Chemical | | | 4,200 | | | | 96,240 | |
†Interojo Company | | | 2,958 | | | | 107,355 | |
†KIWOOM Securities | | | 700 | | | | 57,240 | |
Koh Young Technology | | | 2,600 | | | | 199,896 | |
†Loen Entertainment | | | 600 | | | | 63,049 | |
Modetour Network | | | 3,000 | | | | 85,426 | |
Samjin Pharmaceutical | | | 2,800 | | | | 93,693 | |
†SK Materials | | | 500 | | | | 84,033 | |
†Tera Semicon | | | 3,100 | | | | 80,722 | |
| |
| Total (Cost $897,954) | | | | | | | 1,098,872 | |
| |
| | | | | | | | | |
| SPAIN – 0.4% | | | | | | | | |
Atento 2 | | | 49,900 | | | | 506,485 | |
| |
| Total (Cost $501,699) | | | | | | | 506,485 | |
| |
| | | | | | | | | |
| SRI LANKA – 0.1% | | | | | | | | |
†National Development Bank | | | 71,600 | | | | 63,528 | |
†Sunshine Holdings | | | 158,150 | | | | 56,666 | |
| |
| Total (Cost $123,254) | | | | | | | 120,194 | |
| |
| | | | | | | | | |
| SWEDEN – 2.9% | | | | | | | | |
Addtech Cl. B | | | 61,460 | | | | 1,342,561 | |
Bravida Holding | | | 120,000 | | | | 801,170 | |
Byggmax Group | | | 12,200 | | | | 81,737 | |
Dustin Group | | | 8,250 | | | | 81,887 | |
†Hexpol | | | 100,000 | | | | 1,013,586 | |
Hoist Finance | | | 8,800 | | | | 98,859 | |
Knowit | | | 7,000 | | | | 132,469 | |
†Momentum Group 1 | | | 6,300 | | | | 89,439 | |
Proact IT Group | | | 8,100 | | | | 178,282 | |
| |
| Total (Cost $3,160,407) | | | | | | | 3,819,990 | |
| |
| | | | | | | | | |
| SWITZERLAND – 4.1% | | | | | | | | |
Burkhalter Holding | | | 10,000 | | | | 1,302,182 | |
LEM Holding | | | 500 | | | | 847,591 | |
Partners Group Holding | | | 1,800 | | | | 1,233,425 | |
VZ Holding | | | 5,600 | | | | 1,899,445 | |
| |
| Total (Cost $3,539,666) | | | | | | | 5,282,643 | |
| |
| 12 | 2017 Annual Report to Stockholders | | THE ACCOMPANYING NOTES ARE AN INTEGRAL PART OF THESE FINANCIAL STATEMENTS |
| |
| Schedule of Investments (continued) | | | | | | | | |
| | | | | | | | | |
| | | | SHARES | | | | VALUE | |
| |
| | | | | | | | | |
| TAIWAN – 1.0% | | | | | | | | |
Egis Technology 1 | | | 12,000 | | | $ | 91,366 | |
Flytech Technology | | | 16,390 | | | | 45,116 | |
†Formosa Laboratories | | | 29,050 | | | | 67,333 | |
Gourmet Master | | | 11,030 | | | | 160,976 | |
Posiflex Technology | | | 8,874 | | | | 40,604 | |
†Sinmag Equipment | | | 20,900 | | | | 119,390 | |
Sitronix Technology | | | 51,400 | | | | 144,746 | |
Sporton International | | | 33,781 | | | | 182,119 | |
Taiwan Paiho | | | 56,400 | | | | 229,287 | |
TCI | | | 16,470 | | | | 159,122 | |
†Tehmag Foods | | | 6,000 | | | | 47,371 | |
| |
| Total (Cost $1,109,346) | | | | | | | 1,287,430 | |
| |
| | | | | | | | | |
| THAILAND – 0.1% | | | | | | | | |
†Beauty Community | | | 57,200 | | | | 36,649 | |
†Erawan Group (The) | | | 130,000 | | | | 34,681 | |
†Forth Smart Service | | | 102,400 | | | | 55,414 | |
†Plan B Media | | | 300,000 | | | | 58,786 | |
| |
| Total (Cost $163,239) | | | | | | | 185,530 | |
| |
| | | | | | | | | |
| TURKEY – 0.2% | | | | | | | | |
†Soda Sanayii | | | 112,200 | | | | 149,155 | |
Tat Gida Sanayi | | | 72,350 | | | | 101,303 | |
| |
| Total (Cost $297,753) | | | | | | | 250,458 | |
| |
| | | | | | | | | |
| UNITED ARAB EMIRATES – 0.1% | | | | | | | | |
†ADES International Holding 1 | | | 5,600 | | | | 75,224 | |
| |
| Total (Cost $75,713) | | | | | | | 75,224 | |
| |
| | | | | | | | | |
| UNITED KINGDOM – 12.0% | | | | | | | | |
Abcam | | | 25,000 | | | | 355,755 | |
†Alliance Pharma | | | 100,000 | | | | 90,542 | |
Ashmore Group | | | 279,000 | | | | 1,525,650 | |
Avon Rubber | | | 3,000 | | | | 49,423 | |
†Berkeley Energia 1 | | | 61,600 | | | | 49,152 | |
†Biffa | | | 23,600 | | | | 83,480 | |
Character Group | | | 5,700 | | | | 34,221 | |
Clarkson | | | 38,100 | | | | 1,471,066 | |
Connect Group | | | 117,650 | | | | 177,755 | |
Consort Medical | | | 61,150 | | | | 963,300 | |
Conviviality | | | 30,800 | | | | 167,531 | |
Diploma | | | 25,000 | | | | 419,840 | |
†DiscoverIE Group | | | 17,500 | | | | 87,112 | |
dotdigital group | | | 117,200 | | | | 164,818 | |
Elementis | | | 200,000 | | | | 777,933 | |
Epwin Group | | | 72,750 | | | | 82,301 | |
Equiniti Group | | | 225,000 | | | | 867,338 | |
Ferroglobe 1 | | | 41,100 | | | | 665,820 | |
Ferroglobe (Warranty Insurance Trust) 1,4 | | | 41,100 | | | | 0 | |
Fidessa Group | | | 20,000 | | | | 683,198 | |
Finsbury Food Group | | | 41,000 | | | | 59,786 | |
†Gattaca | | | 6,000 | | | | 24,684 | |
Hilton Food Group | | | 16,100 | | | | 187,061 | |
ITE Group | | | 375,000 | | | | 919,538 | |
Jupiter Fund Management | | | 36,000 | | | | 305,305 | |
†Macfarlane Group | | | 45,500 | | | | 47,778 | |
Norcros | | | 47,360 | | | | 114,072 | |
Pendragon | | | 139,300 | | | | 53,652 | |
Polypipe Group | | | 60,000 | | | | 318,271 | |
Rank Group | | | 20,000 | | | | 64,947 | |
Real Estate Investors | | | 45,000 | | | | 35,519 | |
†Restore | | | 6,900 | | | | 54,812 | |
†River and Mercantile Group | | | 15,000 | | | | 72,329 | |
Rotork | | | 195,000 | | | | 700,480 | |
†RPC Group | | | 3,000 | | | | 35,488 | |
Severfield | | | 87,200 | | | | 94,292 | |
†SIG | | | 46,400 | | | | 110,301 | |
Spirax-Sarco Engineering | | | 19,000 | | | | 1,437,977 | |
†Staffline Group | | | 2,600 | | | | 36,500 | |
Stallergenes Greer 1 | | | 10,800 | | | | 498,997 | |
†STV Group | | | 17,500 | | | | 76,727 | |
†Topps Tiles | | | 90,000 | | | | 97,114 | |
Victrex | | | 32,500 | | | | 1,157,567 | |
†Wincanton | | | 17,000 | | | | 54,293 | |
Xaar | | | 90,000 | | | | 449,175 | |
| |
| Total (Cost $13,586,516) | | | | | | | 15,722,900 | |
| |
| | | | | | | | | |
| UNITED STATES – 27.5% | | | | | | | | |
Air Lease Cl. A | | | 24,560 | | | | 1,181,090 | |
Brooks Automation 2 | | | 18,100 | | | | 431,685 | |
Century Casinos 1 | | | 5,000 | | | | 45,650 | |
CIRCOR International | | | 18,100 | | | | 881,108 | |
Cognex Corporation | | | 10,748 | | | | 657,348 | |
Coherent 1 | | | 3,000 | | | | 846,660 | |
Copart 1 | | | 19,800 | | | | 855,162 | |
Diebold Nixdorf 2 | | | 28,800 | | | | 470,880 | |
Diodes 1 | | | 20,500 | | | | 587,735 | |
†Dorian LPG 1 | | | 4,475 | | | | 36,784 | |
DST Systems | | | 15,800 | | | | 980,706 | |
EnerSys 2 | | | 11,000 | | | | 765,930 | |
Expeditors International of Washington 2 | | | 13,300 | | | | 860,377 | |
FLIR Systems 2 | | | 42,400 | | | | 1,976,688 | |
Innospec 2 | | | 12,457 | | | | 879,464 | |
Kadant | | | 7,800 | | | | 783,120 | |
KBR 2 | | | 58,700 | | | | 1,164,021 | |
Kirby Corporation 1,2,3 | | | 32,900 | | | | 2,197,720 | |
Lazard Cl. A | | | 32,600 | | | | 1,711,500 | |
Lindsay Corporation | | | 13,700 | | | | 1,208,340 | |
Littelfuse | | | 4,000 | | | | 791,280 | |
ManpowerGroup | | | 8,800 | | | | 1,109,768 | |
MBIA 1,2,3 | | | 80,300 | | | | 587,796 | |
Nanometrics 1,2,3 | | | 35,600 | | | | 887,152 | |
National Instruments 2,3 | | | 15,200 | | | | 632,776 | |
Oaktree Capital Group LLC Cl. A | | | 10,400 | | | | 437,840 | |
Popular | | | 13,100 | | | | 464,919 | |
Quaker Chemical 2,3 | | | 6,069 | | | | 915,145 | |
Raven Industries | | | 40,000 | | | | 1,374,000 | |
Rogers Corporation 1,2,3 | | | 4,800 | | | | 777,216 | |
SEACOR Holdings | | | 20,200 | | | | 933,644 | |
†SEACOR Marine Holdings 1 | | | 20,309 | | | | 237,615 | |
SEI Investments 2 | | | 34,500 | | | | 2,479,170 | |
Sensient Technologies 2,3 | | | 9,500 | | | | 694,925 | |
Signet Jewelers | | | 5,500 | | | | 311,025 | |
Standard Motor Products | | | 11,200 | | | | 502,992 | |
Sun Hydraulics 2 | | | 15,139 | | | | 979,342 | |
Tennant Company 2 | | | 11,600 | | | | 842,740 | |
| THE ACCOMPANYING NOTES ARE AN INTEGRAL PART OF THESE FINANCIAL STATEMENTS | | 2017 Annual Report to Stockholders | 13 |
| Royce Global Value Trust | | December 31, 2017 |
| |
| Schedule of Investments (continued) | | | | | | | | |
| | | | | | | | | |
| | | | SHARES | | | | VALUE | |
| |
| | | | | | | | | |
| UNITED STATES (continued) | | | | | | | | |
Valmont Industries | | | 4,500 | | | $ | 746,325 | |
Virtu Financial Cl. A 2 | | | 74,300 | | | | 1,359,690 | |
World Fuel Services | | | 12,000 | | | | 337,680 | |
| |
| Total (Cost $27,056,544) | | | | | | | 35,925,008 | |
| |
| | | | | | | | | |
| URUGUAY – 0.4% | | | | | | | | |
†Arcos Dorados Holdings Cl. A 1 | | | 46,800 | | | | 484,380 | |
†Biotoscana Investments BDR 1 | | | 8,900 | | | | 55,128 | |
| |
| Total (Cost $416,576) | | | | | | | 539,508 | |
| |
| | | | | | | | | |
| TOTAL COMMON STOCKS | | | | | | | | |
| |
| (Cost $101,140,825) | | | | | | | 129,022,745 | |
| |
| | | | | | | | | |
| REPURCHASE AGREEMENT – 7.2% | | | | | | | | |
Fixed Income Clearing Corporation, 0.20% dated 12/29/17, due 1/2/18, maturity value
$9,331,207 (collateralized by obligations of various U.S. Government Agencies, 0.875%
due 5/15/19, valued at $9,521,062) | | | | | | | | |
| |
| Cost $9,331,000) | | | | | | | 9,331,000 | |
| |
| | | | | | | | | |
| TOTAL INVESTMENTS – 106.0% | | | | | | | | |
| |
| (Cost $110,471,825) | | | | | | | 138,353,745 | |
| |
| | | | | | | | | |
| LIABILITIES LESS CASH AND OTHER ASSETS – (6.0)% | | | | | | | (7,827,563 | ) |
| | | | | | | | |
| | | | | | | | | |
| |
| NET ASSETS – 100.0% | | | | | | $ | 130,526,182 | |
| |
| † | New additions in 2017. |
| 1 | Non-income producing. |
| 2 | All or a portion of these securities were pledged as collateral in connection with the Fund’s revolving credit agreement at December 31, 2017. Total market value of pledged securities at December 31, 2017, was $14,399,588. |
| 3 | At December 31, 2017, a portion of these securities were rehypothecated in connection with the Fund’s revolving credit agreement in the aggregate amount of $5,610,341. |
| 4 | A security for which market quotations are not readily available represents 0.0% of net assets. This security has been valued at its fair value under procedures approved by the Fund’s Board of Directors. This security is defined as a Level 3 security due to the use of significant unobservable inputs in the determination of fair value. See Notes to Financial Statements. |
| | |
| | Securities of Global/International Funds are categorized by the country of their headquarters, with the exception of exchange-traded funds.
Bold indicates the Fund’s 20 largest equity holdings in terms of December 31, 2017, market value. |
| | |
| | TAX INFORMATION: The cost of total investments for Federal income tax purposes was $111,882,790. At December 31, 2017, net unrealized appreciation for all securities was $26,470,955 consisting of aggregate gross unrealized appreciation of $30,869,278 and aggregate gross unrealized depreciation of $4,398,323. The primary causes of the differences between book and tax basis cost are the timing of the recognition of losses on securities sold, investments in publicly traded partnerships and Trusts and mark-to-market of Passive Foreign Investment Companies. |
| 14 | 2017 Annual Report to Stockholders | | THE ACCOMPANYING NOTES ARE AN INTEGRAL PART OF THESE FINANCIAL STATEMENTS |
| Royce Global Value Trust | | December 31, 2017 |
| |
| Statement of Assets and Liabilities | | | | |
| | | | | |
| ASSETS: | | | | |
| Investments at value | | $ | 129,022,745 | |
| |
| Repurchase agreements (at cost and value) | | | 9,331,000 | |
| |
| Cash and foreign currency | | | 597 | |
| |
| Receivable for investments sold | | | 555,458 | |
| |
| Receivable for dividends and interest | | | 203,693 | |
| |
| Prepaid expenses and other assets | | | 41,098 | |
| |
| Total Assets | | | 139,154,591 | |
| |
| LIABILITIES: | | | | |
| Revolving credit agreement | | | 8,000,000 | |
| |
| Payable for investments purchased | | | 244,677 | |
| |
| Payable for investment advisory fee | | | 136,108 | |
| |
| Payable for directors’ fees | | | 6,967 | |
| |
| Payable for interest expense | | | 2,351 | |
| |
| Accrued expenses | | | 78,472 | |
| |
| Deferred capital gains tax | | | 159,834 | |
| |
| Total Liabilities | | | 8,628,409 | |
| |
| Net Assets | | $ | 130,526,182 | |
| |
| ANALYSIS OF NET ASSETS: | | | | |
| Paid-in capital - $0.001 par value per share; 10,461,711 shares outstanding (150,000,000 shares authorized) | | $ | 117,980,744 | |
| |
| Undistributed net investment income (loss) | | | (1,199,309 | ) |
| |
| Accumulated net realized gain (loss) on investments and foreign currency | | | (13,980,873 | ) |
| |
| Net unrealized appreciation (depreciation) on investments and foreign currency | | | 27,725,620 | |
| |
| Net Assets (net asset value per share - $12.48) | | $ | 130,526,182 | |
| |
| Investments at identified cost | | $ | 101,140,825 | |
| |
| THE ACCOMPANYING NOTES ARE AN INTEGRAL PART OF THESE FINANCIAL STATEMENTS | | 2017 Annual Report to Stockholders | 15 |
| |
| Statement of Changes in Net Assets | | | | | | | | |
| | | | | | | | | |
| | | YEAR ENDED 12/31/17 | | YEAR ENDED 12/31/16 |
| |
| | | | | | | | | |
| INVESTMENT OPERATIONS: | | | | | | | | |
| Net investment income (loss) | | $ | 241,105 | | | $ | 651,129 | |
| |
| Net realized gain (loss) on investments and foreign currency | | | 6,555,345 | | | | (1,449,508 | ) |
| |
| Net change in unrealized appreciation (depreciation) on investments and foreign currency | | | 24,156,512 | | | | 10,740,946 | |
| |
| Net increase (decrease) in net assets from investment operations | | | 30,952,962 | | | | 9,942,567 | |
| |
| DISTRIBUTIONS: | | | | | | | | |
| Net investment income | | | (1,145,697 | ) | | | (1,435,789 | ) |
| |
| Net realized gain on investments and foreign currency | | | – | | | | – | |
| |
| Return of capital | | | – | | | | (12,497 | ) |
| |
| Total distributions | | | (1,145,697 | ) | | | (1,448,286 | ) |
| |
| CAPITAL STOCK TRANSACTIONS: | | | | | | | | |
| Reinvestment of distributions | | | 491,130 | | | | 559,946 | |
| |
| Total capital stock transactions | | | 491,130 | | | | 559,946 | |
| |
| Net Increase (Decrease) In Net Assets | | | 30,298,395 | | | | 9,054,227 | |
| |
| NET ASSETS: | | | | | | | | |
| |
| Beginning of year | | | 100,227,787 | | | | 91,173,560 | |
| |
| End of year (including undistributed net investment income (loss) of $(1,199,309) at 12/31/17 and $(672,740) at 12/31/16) | | $ | 130,526,182 | | | $ | 100,227,787 | |
| |
| 16 | 2017 Annual Report to Stockholders | | THE ACCOMPANYING NOTES ARE AN INTEGRAL PART OF THESE FINANCIAL STATEMENTS |
| Royce Global Value Trust | | Year Ended December 31, 2017 |
| |
| Statement of Operations | | | | |
| | | | | |
| INVESTMENT INCOME: | | | | |
| INCOME: | | | | |
| Dividends | | $ | 2,315,787 | |
| |
| Foreign withholding tax | | | (143,344 | ) |
| |
| Interest | | | 6,626 | |
| |
| Rehypothecation income | | | 4,306 | |
| |
| Total income | | | 2,183,375 | |
| |
| EXPENSES: | | | | |
| |
| Investment advisory fees | | | 1,450,623 | |
| |
| Interest expense | | | 179,613 | |
| |
| Custody and transfer agent fees | | | 111,286 | |
| |
| Professional fees | | | 66,067 | |
| |
| Stockholder reports | | | 61,312 | |
| |
| Administrative and office facilities | | | 28,644 | |
| |
| Directors’ fees | | | 28,487 | |
| |
| Other expenses | | | 16,360 | |
| |
| Total expenses | | | 1,942,392 | |
| |
| Compensating balance credits | | | (122 | ) |
| |
| Net expenses | | | 1,942,270 | |
| |
| Net investment income (loss) | | | 241,105 | |
| |
| REALIZED AND UNREALIZED GAIN (LOSS) ON INVESTMENTS AND FOREIGN CURRENCY: | | | | |
| |
| NET REALIZED GAIN (LOSS): | | | | |
| |
| Investments | | | 6,558,027 | |
| |
| Foreign currency transactions | | | (2,682 | ) |
| |
| NET CHANGE IN UNREALIZED APPRECIATION (DEPRECIATION): | | | | |
| |
| Investments and foreign currency translations | | | 24,234,510 | |
| |
| Other assets and liabilities denominated in foreign currency | | | (77,998 | ) |
| |
| Net realized and unrealized gain (loss) on investments and foreign currency | | | 30,711,857 | |
| |
| NET INCREASE (DECREASE) IN NET ASSETS FROM INVESTMENT OPERATIONS | | $ | 30,952,962 | |
| |
| THE ACCOMPANYING NOTES ARE AN INTEGRAL PART OF THESE FINANCIAL STATEMENTS | | 2017 Annual Report to Stockholders | 17 |
| Royce Global Value Trust | | Year Ended December 31, 2017 |
| |
| Statement of Cash Flows | | | | |
| | | | | |
| CASH FLOWS FROM OPERATING ACTIVITIES: | | | | |
| Net increase (decrease) in net assets from investment operations | | $ | 30,952,962 | |
| |
| Adjustments to reconcile net increase (decrease) in net assets from investment operations to net cash provided by operating activities: | | | | |
| |
Purchases of long-term investments | | | (40,717,589 | ) |
| |
Proceeds from sales and maturities of long-term investments | | | 43,446,710 | |
| |
Net purchases, sales and maturities of short-term investments | | | (2,541,000 | ) |
| |
Net (increase) decrease in dividends and interest receivable and other assets | | | (29,607 | ) |
| |
Net increase (decrease) in interest expense payable, accrued expenses and other liabilities | | | 134,385 | |
| |
Net change in unrealized appreciation (depreciation) on investments | | | (24,234,510 | ) |
| |
Net realized gain (loss) on investments and foreign currency | | | (6,555,345 | ) |
| |
| Net cash provided by operating activities | | | 456,006 | |
| |
| CASH FLOWS FROM FINANCING ACTIVITIES: | | | | |
| |
| Distributions | | | (1,145,697 | ) |
| |
| Reinvestment of distributions | | | 491,130 | |
| |
| Net cash used for financing activities | | | (654,567 | ) |
| |
| INCREASE (DECREASE) IN CASH: | | | (198,561 | ) |
| |
| Cash and foreign currency at beginning of year | | | 199,158 | |
| |
| Cash and foreign currency at end of year | | $ | 597 | |
| |
| 18 | 2017 Annual Report to Stockholders | | THE ACCOMPANYING NOTES ARE AN INTEGRAL PART OF THESE FINANCIAL STATEMENTS |
| |
| Financial Highlights |
| This table is presented to show selected data for a share outstanding throughout each year or other indicated period, and to assist stockholders in evaluating the Fund’s performance for the periods presented. |
| | | YEARS ENDED | | PERIOD ENDED |
| | | | | | | |
| | | 12/31/17 | | 12/31/16 | | 12/31/15 | | 12/31/14 | | 12/31/131 |
| |
| Net Asset Value, Beginning of Period | | $ | 9.62 | | | $ | 8.81 | | | $ | 9.25 | | | $ | 10.05 | | | $ | 9.78 | |
| |
| INVESTMENT OPERATIONS: | | | | | | | | | | | | | | | | | | | | |
| Net investment income (loss) | | | 0.02 | | | | 0.06 | | | | 0.10 | | | | 0.13 | | | | (0.00 | ) |
| |
| Net realized and unrealized gain (loss) on investments and foreign currency | | | 2.96 | | | | 0.90 | | | | (0.43 | ) | | | (0.77 | ) | | | 0.27 | |
| |
| Net increase (decrease) in net assets from investment operations | | | 2.98 | | | | 0.96 | | | | (0.33 | ) | | | (0.64 | ) | | | 0.27 | |
| |
| DISTRIBUTIONS: | | | | | | | | | | | | | | | | | | | | |
| Net investment income | | | (0.11 | ) | | | (0.14 | ) | | | (0.10 | ) | | | (0.15 | ) | | | – | |
| |
| Net realized gain on investments and foreign currency | | | – | | | | – | | | | – | | | | – | | | | – | |
| |
| Total distributions | | | (0.11 | ) | | | (0.14 | ) | | | (0.10 | ) | | | (0.15 | ) | | | – | |
| |
| CAPITAL STOCK TRANSACTIONS: | | | | | | | | | | | | | | | | | | | | |
| Effect of reinvestment of distributions by Common Stockholders | | | (0.01 | ) | | | (0.01 | ) | | | (0.01 | ) | | | (0.01 | ) | | | – | |
| |
| Total capital stock transactions | | | (0.01 | ) | | | (0.01 | ) | | | (0.01 | ) | | | (0.01 | ) | | | – | |
| |
| Net Asset Value, End of Period | | $ | 12.48 | | | $ | 9.62 | | | $ | 8.81 | | | $ | 9.25 | | | $ | 10.05 | |
| |
| Market Value, End of Period | | $ | 10.81 | | | $ | 8.04 | | | $ | 7.45 | | | $ | 8.04 | | | $ | 8.89 | |
| |
| TOTAL RETURN:2 | | | | | | | | | | | | | | | | | | | | |
| Net Asset Value | | | 31.07 | % | | | 11.12 | % | | | (3.44 | )% | | | (6.23 | )% | | | 2.76 | %3 |
| |
| Market Value | | | 35.96 | % | | | 9.77 | % | | | (6.06 | )% | | | (7.86 | )% | | | (0.95 | )%3 |
| |
| RATIOS BASED ON AVERAGE NET ASSETS: | | | | | | | | | | | | | | | | | | | | |
| Investment advisory fee expense | | | 1.25 | % | | | 1.25 | % | | | 1.25 | % | | | 1.25 | % | | | 1.25 | %4 |
| |
| Other operating expenses | | | 0.42 | % | | | 0.46 | % | | | 0.43 | % | | | 0.24 | % | | | 0.37 | %4 |
| |
| Total expenses (net) | | | 1.67 | % | | | 1.71 | % | | | 1.68 | % | | | 1.49 | % | | | 1.62 | %4 |
| |
| Expenses excluding interest expense | | | 1.52 | % | | | 1.57 | % | | | 1.58 | % | | | 1.49 | % | | | 1.62 | %4 |
| |
| Expenses prior to balance credits | | | 1.67 | % | | | 1.71 | % | | | 1.68 | % | | | 1.49 | % | | | 1.62 | %4 |
| |
| Net investment income (loss) | | | 0.21 | % | | | 0.69 | % | | | 1.03 | % | | | 1.30 | % | | | (0.13 | )%4 |
| |
| SUPPLEMENTAL DATA: | | | | | | | | | | | | | | | | | | | | |
| Net Assets, End of Period (in thousands) | | $ | 130,526 | | | $ | 100,228 | | | $ | 91,174 | | | $ | 95,285 | | | $ | 102,684 | |
| |
| Portfolio Turnover Rate | | | 34 | % | | | 59 | % | | | 65 | % | | | 43 | % | | | 7 | % |
| |
| REVOLVING CREDIT AGREEMENT: | | | | | | | | | | | | | | | | | | | | |
| Asset coverage | | | 1732 | % | | | 1353 | % | | | 1240 | % | | | | | | | | |
| |
| Asset coverage per $1,000 | | | 17,316 | | | | 13,528 | | | | 12,397 | | | | | | | | | |
| |
| 1 | The Fund commenced operations on October 18, 2013. |
| 2 | The Market Value Total Return is calculated assuming a purchase of Common Stock on the opening of the first business day and a sale on the closing of the last business day of each period. Dividends and distributions are assumed for the purposes of this calculation to be reinvested at prices obtained under the Fund’s Distribution Reinvestment and Cash Purchase Plan. Net Asset Value Total Return is calculated on the same basis, except that the Fund’s net asset value is used on the purchase and sale dates instead of market value. |
| 3 | Not annualized |
| 4 | Annualized |
| THE ACCOMPANYING NOTES ARE AN INTEGRAL PART OF THESE FINANCIAL STATEMENTS | | 2017 Annual Report to Stockholders | 19 |
| Royce Global Value Trust |
| |
| Notes to Financial Statements |
| Summary of Significant Accounting Policies |
Royce Global Value Trust, Inc. (the “Fund”), is a diversified closed-end investment company that was incorporated under the laws of the State of Maryland on February 14, 2011. The Fund commenced operations on October 18, 2013. |
The preparation of financial statements in conformity with accounting principles generally accepted in the United States of America requires management to make estimates and assumptions that affect the reported amounts of assets and liabilities and the disclosure of contingent assets and liabilities at the date of the financial statements and the reported amounts of income and expenses during the reporting period. Actual results could differ from those estimates. |
The Fund is an investment company and accordingly follows the investment company accounting and reporting guidance of the Financial Accounting Standards Board (FASB) Accounting Standard Codification Topic 946 “Financial Services-Investment Companies”. |
| VALUATION OF INVESTMENTS: |
Securities are valued as of the close of trading on the New York Stock Exchange (NYSE) (generally 4:00 p.m. Eastern time) on the valuation date. Securities that trade on an exchange, and securities traded on Nasdaq's Electronic Bulletin Board, are valued at their last reported sales price or Nasdaq official closing price taken from the primary market in which each security trades or, if no sale is reported for such day, at their highest bid price. Other over-the-counter securities for which market quotations are readily available are valued at their highest bid price, except in the case of some bonds and other fixed income securities which may be valued by reference to other securities with comparable ratings, interest rates and maturities, using established independent pricing services. The Fund values its non-U.S. dollar denominated securities in U.S. dollars daily at the prevailing foreign currency exchange rates as quoted by a major bank. Securities for which market quotations are not readily available are valued at their fair value in accordance with the provisions of the 1940 Act, under procedures approved by the Fund's Board of Directors, and are reported as Level 3 securities. As a general principle, the fair value of a security is the amount which the Fund might reasonably expect to receive for the security upon its current sale. However, in light of the judgment involved in fair valuations, there can be no assurance that a fair value assigned to a particular security will be the amount which the Fund might be able to receive upon its current sale. In addition, if, between the time trading ends on a particular security and the close of the customary trading session on the NYSE, events occur that are significant and may make the closing price unreliable, the Fund may fair value the security. The Fund uses an independent pricing service to provide fair value estimates for relevant non-U.S. equity securities on days when the U.S. market volatility exceeds a certain threshold. This pricing service uses proprietary correlations it has developed between the movement of prices of non-U.S. equity securities and indices of U.S.-traded securities, futures contracts and other indications to estimate the fair value of relevant non-U.S. securities. When fair value pricing is employed, the prices of securities used by the Fund may differ from quoted or published prices for the same security. Investments in money market funds are valued at net asset value per share. |
Various inputs are used in determining the value of the Fund’s investments, as noted above. These inputs are summarized in the three broad levels below: |
| | Level 1 | – | quoted prices in active markets for identical securities. |
| | Level 2 | – | other significant observable inputs (including quoted prices for similar securities, foreign securities that may be fair valued and repurchase agreements). The table below includes all Level 2 securities. Any Level 2 securities with values based on quoted prices for similar securities would be noted in the Schedule of Investments. |
| | Level 3 | – | significant unobservable inputs (including last trade price before trading was suspended, or at a discount thereto for lack of marketability or otherwise, market price information regarding other securities, information received from the company and/or published documents, including SEC filings and financial statements, or other publicly available information). |
The inputs or methodology used for valuing securities are not necessarily an indication of the risk associated with investing in those securities. |
The following is a summary of the inputs used to value the Fund’s investments as of December 31, 2017. For a detailed breakout of common stocks by country, please refer to the Schedule of Investments. |
| | | | | | | | | | | | | | | | |
| | | LEVEL 1 | | LEVEL 2 | | LEVEL 3 | | TOTAL |
| |
| Common Stocks | | $ | 50,120,139 | | | $ | 78,902,606 | | | $ | 0 | | | $ | 129,022,745 |
| |
| Cash Equivalents | | | – | | | | 9,331,000 | | | | – | | | | 9,331,000 |
| |
| Level 3 Reconciliation: | | | | | | | | | | | | | | | | |
| | | | | BALANCE AS OF 12/31/16 | | | | REALIZED GAIN (LOSS) | | | | UNREALIZED GAIN (LOSS)1 | | | | BALANCE AS OF 12/31/17 |
| |
| Common Stocks | | | | $9,349 | | | | $(341,019) | | | | $331,670 | | | | $0 |
| |
| 1 | The net change in unrealized appreciation (depreciation) is included in the accompanying Statement of Operations. Change in unrealized appreciation (depreciation) includes net unrealized appreciation (depreciation) resulting from changes in investment values during the reporting period and the reversal of previously recorded unrealized appreciation (depreciation) when gains or losses are realized. Net realized gain (loss) from investments and foreign currency transactions is included in the accompanying Statement of Operations. |
| 20 | 2017 Annual Report to Stockholders |
| Royce Global Value Trust |
| |
| Notes to Financial Statements (continued) |
| REPURCHASE AGREEMENTS: |
The Fund may enter into repurchase agreements with institutions that the Fund’s investment adviser has determined are creditworthy. The Fund restricts repurchase agreements to maturities of no more than seven days. Securities pledged as collateral for repurchase agreements, which are held until maturity of the repurchase agreements, are marked-to-market daily and maintained at a value at least equal to the principal amount of the repurchase agreement (including accrued interest). Repurchase agreements could involve certain risks in the event of default or insolvency of the counter-party, including possible delays or restrictions upon the ability of the Fund to dispose of its underlying securities. The remaining contractual maturity of the repurchase agreement held by the Fund at December 31, 2017 is overnight and continuous. |
| FOREIGN CURRENCY: |
Net realized foreign exchange gains or losses arise from sales and maturities of short-term securities, sales of foreign currencies, expiration of currency forward contracts, currency gains or losses realized between the trade and settlement dates on securities transactions, and the difference between the amounts of dividends, interest, and foreign withholding taxes recorded on the Fund's books and the U.S. dollar equivalent of the amounts actually received or paid. Net unrealized foreign exchange gains and losses arise from changes in the value of assets and liabilities, including investments in securities at the end of the reporting period, as a result of changes in foreign currency exchange rates. |
| DISTRIBUTIONS AND TAXES: |
As a qualified regulated investment company under Subchapter M of the Internal Revenue Code, the Fund is not subject to income taxes to the extent that it distributes substantially all of its taxable income for its fiscal year. The Schedule of Investments includes information regarding income taxes under the caption “Tax Information”. |
The Fund pays any dividends and capital gain distributions annually in December. Because federal income tax regulations differ from generally accepted accounting principles, income and capital gain distributions determined in accordance with tax regulations may differ from net investment income and realized gains recognized for financial reporting purposes. Accordingly, the character of distributions and composition of net assets for tax purposes differ from those reflected in the accompanying financial statements. |
| CAPITAL GAINS TAXES: |
The Fund is subject to a tax imposed on short-term capital gains on securities of issuers domiciled in certain countries. The Fund records an estimated deferred tax liability for gains in these securities that have been held for less than one year. This amount, if any, is reported as deferred capital gains tax in the accompanying Statement of Assets and Liabilities, assuming those positions were disposed of at the end of the period, and accounted for as a reduction in the market value of the security. |
| INVESTMENT TRANSACTIONS AND RELATED INVESTMENT INCOME: |
Investment transactions are accounted for on the trade date. Dividend income is recorded on the ex-dividend date. Non-cash dividend income is recorded at the fair market value of the securities received. Interest income is recorded on an accrual basis. Premiums and discounts on debt securities are amortized using the effective yield-to-maturity method. Realized gains and losses from investment transactions are determined on the basis of identified cost for book and tax purposes. |
| EXPENSES: |
The Fund incurs direct and indirect expenses. Expenses directly attributable to the Fund are charged to the Fund’s operations, while expenses applicable to more than one of the Royce Funds are allocated equitably. Certain personnel, occupancy costs and other administrative expenses related to the Funds are allocated by Royce & Associates (“Royce”) under an administration agreement and are included in administrative and office facilities and professional fees. |
| COMPENSATING BALANCE CREDITS: |
The Fund has an arrangement with its custodian bank, whereby a portion of the custodian's fee is paid indirectly by credits earned on the Fund's cash on deposit with the bank. This deposit arrangement is an alternative to purchasing overnight investments. Conversely, the Fund pays interest to the custodian on any cash overdrafts, to the extent they are not offset by credits earned on positive cash balances. |
| Capital Stock: |
The Fund issued 46,290 and 70,522 shares of Common Stock as reinvestment of distributions for the years ended December 31, 2017 and December 31, 2016, respectively. |
| 2017 Annual Report to Stockholders | 21 |
| Royce Global Value Trust |
| |
| Notes to Financial Statements (continued) |
| Borrowings: |
The Fund is party to a revolving credit agreement (the credit agreement) with BNP Paribas Prime Brokerage International, Limited (BNPPI). The Fund pays a commitment fee of 0.50% per annum on the unused portion of the credit agreement. The credit agreement has a 360-day rolling term that resets daily; however, if the Fund exceeds certain net asset value triggers, the credit agreement may convert to a 60-day rolling term that resets daily. The Fund is required to pledge portfolio securities as collateral in an amount up to two times the loan balance outstanding or as otherwise required by applicable regulatory standards and has granted a security interest in the securities pledged to, and in favor of, BNPPI as security for the loan balance outstanding. If the Fund fails to meet certain requirements, or maintain other financial covenants required under the credit agreement, the Fund may be required to repay immediately, in part or in full, the loan balance outstanding under the credit agreement which may necessitate the sale of portfolio securities at potentially inopportune times. BNPPI may terminate the credit agreement upon certain ratings downgrades of its corporate parent, which would result in the Fund’s entire loan balance becoming immediately due and payable. The occurrence of such ratings downgrades may necessitate the sale of portfolio securities at potentially inopportune times. The credit agreement also permits, subject to certain conditions, BNPPI to rehypothecate portfolio securities pledged by the Fund up to the amount of the loan balance outstanding. The Fund continues to receive payments in lieu of dividends and interest on rehypothecated securities. The Fund also has the right under the credit agreement to recall the rehypothecated securities from BNPPI on demand. If BNPPI fails to deliver the recalled security in a timely manner, the Fund is compensated by BNPPI for any fees or losses related to the failed delivery or, in the event a recalled security is not returned by BNPPI, the Fund, upon notice to BNPPI, may reduce the loan balance outstanding by the value of the recalled security failed to be returned. The Fund receives a portion of the fees earned by BNPPI in connection with the rehypothecation of portfolio securities. |
As of December 31, 2017, the Fund has outstanding borrowings of $8,000,000. During the year ended December 31, 2017, the Fund borrowed an average daily balance of $8,000,000 at a weighted average borrowing cost of 2.21%. The maximum amount outstanding during the year ended December 31, 2017 was $8,000,000. As of December 31, 2017, the aggregate value of rehypothecated securities was $5,610,341. During the year ended December 31, 2017, the Fund earned $4,306 in fees from rehypothecated securities. |
| Investment Advisory Agreement: |
The investment advisory agreement between Royce and the Fund provides for fees to be paid at an annual rate of 1.25% of the Fund’s average daily net assets. For the year ended December 31, 2017, the Fund expensed Royce investment advisory fees totaling $1,450,623. |
| Purchases and Sales of Investment Securities: |
For the year ended December 31, 2017, the costs of purchases and proceeds from sales of investment securities, other than short-term securities, amounted to $39,804,958 and $42,497,581, respectively. |
| Tax Information: |
Distributions during the years ended December 31, 2017 and 2016, were characterized as follows for tax purposes: |
| ORDINARY INCOME | | LONG-TERM CAPITAL GAINS | | RETURN OF CAPITAL |
| |
| 2017 | 2016 | | 2017 | 2016 | | 2017 | 2016 |
| |
| $1,145,697 | $1,435,789 | | $ – | $ – | | $ – | $12,497 |
| |
The tax basis components of distributable earnings at December 31, 2017, were as follows: |
| | | | | | | | | | | | | | | | | | | |
| | | | | | | | | | | QUALIFIED LATE YEAR | | | | | | | | |
| UNDISTRIBUTED | | | UNDISTRIBUTED LONG-TERM | | | | NET UNREALIZED | | | ORDINARY AND | | | | TOTAL | | | | CAPITAL LOSS |
| ORDINARY | | | CAPITAL GAINS OR | | | | APPRECIATION | | | POST-OCTOBER LOSS | | | | DISTRIBUTABLE | | | | CARRYFORWARD |
| INCOME | | | (CAPITAL LOSS CARRYFORWARD) | | | | (DEPRECIATION)1 | | | DEFERRALS1 | | | | EARNINGS | | | | UTILIZED |
| |
| $106,299 | | | $(13,708,861) | | | | $26,313,581 | | | $(165,581) | | | | $12,545,438 | | | | $6,007,549 |
| |
| 1 | Includes timing differences on foreign currency, investments in publicly traded partnerships, recognition of losses on securities sold and mark-to-market of Passive Foreign Investment Companies. |
| 2 | Under the current tax law, capital losses and qualified late year ordinary losses incurred after October 31 may be deferred and treated as occurring on the first day of the following fiscal year. |
For financial reporting purposes, capital accounts and distributions to stockholders are adjusted to reflect the tax character of permanent book/tax differences. For the year ended December 31, 2017, the Fund recorded the following permanent reclassifications, which relate primarily to current investments in publicly traded partnerships, foreign currency transactions, foreign capital gains tax and gains from the sale of Passive Foreign Investment Companies. Results of operations and net assets were not affected by these reclassifications. |
UNDISTRIBUTED NET
INVESTMENT INCOME | | | ACCUMULATED NET
REALIZED GAIN (LOSS) | | | PAID-IN CAPITAL |
| |
| $378,023 | | | $(390,520) | | | $12,497 |
| |
Management has analyzed the Fund’s tax positions taken on federal income tax returns for all open tax years (2014-2017) and has concluded that as of December 31, 2017, no provision for income tax is required in the Fund’s financial statements. |
| 22 | 2017 Annual Report to Stockholders |
| Report of Independent Registered Public Accounting Firm |
| |
| To the Board of Directors and the Stockholders of Royce Global Value Trust, Inc.: |
| Opinion on the Financial Statements |
| |
We have audited the accompanying statement of assets and liabilities, including the schedule of investments, of Royce Global Value Trust, Inc. (the “Fund”) as of December 31, 2017, the related statements of operations and cash flows for the year ended December 31, 2017, the statement of changes in net assets for each of the two years in the period ended December 31, 2017, including the related notes, and the financial highlights for each of the three years in the period ended December 31, 2017 (collectively referred to as the “financial statements”). In our opinion, the financial statements present fairly, in all material respects, the financial position of the Fund as of December 31, 2017, the results of its operations and its cash flows for the year then ended, the changes in its net assets for each of the two years in the period ended December 31, 2017 and the financial highlights for each of the three years in the period ended December 31, 2017 in conformity with accounting principles generally accepted in the United States of America. |
| |
The financial statements of the Fund as of and for the year ended December 31, 2014 and the financial highlights for each of the periods ended on or prior to December 31, 2014 (not presented herein, other than the financial highlights) were audited by other auditors whose report dated February 23, 2015 expressed an unqualified opinion on those financial statements and financial highlights. |
| Basis for Opinion |
| |
These financial statements are the responsibility of the Fund’s management. Our responsibility is to express an opinion on the Fund’s financial statements based on our audits. We are a public accounting firm registered with the Public Company Accounting Oversight Board (United States) (“PCAOB”) and are required to be independent with respect to the Fund in accordance with the U.S. federal securities laws and the applicable rules and regulations of the Securities and Exchange Commission and the PCAOB. |
| |
We conducted our audits of these financial statements in accordance with the standards of the PCAOB. Those standards require that we plan and perform the audit to obtain reasonable assurance about whether the financial statements are free of material misstatement, whether due to error or fraud. |
| |
Our audits included performing procedures to assess the risks of material misstatement of the financial statements, whether due to error or fraud, and performing procedures that respond to those risks. Such procedures included examining, on a test basis, evidence regarding the amounts and disclosures in the financial statements. Our audits also included evaluating the accounting principles used and significant estimates made by management, as well as evaluating the overall presentation of the financial statements. Our procedures included confirmation of securities owned as of December 31, 2017 by correspondence with the custodian and brokers; when replies were not received from brokers, we performed other auditing procedures. We believe that our audits provide a reasonable basis for our opinion. |
| /s/PricewaterhouseCoopers LLP |
| Baltimore, MD |
| February 22, 2018 |
We have served as the auditor of one or more investment companies in the Royce investment company group since at least 1967. We have not determined the specific year we began serving as auditor. |
| 2017 Annual Report to Stockholders | 23 |
| | | MANAGERS’ DISCUSSION |
| Royce Micro-Cap Trust (RMT) | | |
 |
Chuck Royce
Jim Harvey
Chris Flynn |
FUND PERFORMANCE
A second consecutive year of strong absolute and relative performance helped Royce Micro-Cap Trust (“RMT”) to further solidify advantages over both of its unleveraged benchmarks, the small-cap Russell 2000 and Russell Microcap Indexes. RMT beat the Russell 2000 on both a net asset value (“NAV”) and market price basis for the one-, 15-, 20-year, and since inception (12/14/93) periods ended December 31, 2017. It also outpaced the micro-cap index on both an NAV and market price basis for the one-, 10-, and 15-year periods ended December 31, 2017. (Data for the Russell Microcap Index goes back only to 6/30/00). The Fund advanced 17.7% on an NAV basis and 25.1% based on market price in 2017, ahead of respective gains of 14.6% and 13.2% for the Russell 2000 and Russell Microcap for the same period. The year was especially gratifying because it presented crosscurrents for the Fund’s multi-discipline approach in the form of leadership for larger companies and the lift from strength for cyclicals, in particular those with global exposure. |
| |
| WHAT WORKED... AND WHAT DIDN’T |
Information Technology, Industrials, and Health Care led the list of nine of 11 equity sectors that made positive contributions to 2017 performance. Energy and Consumer Staples, the two sectors that detracted, made decidedly modest negative impacts. Relative to the Russell 2000, the best performance in 2017 came from Financials, where both our lower weighting and (to a lesser degree) better investments in banks were the primary sources of outperformance. Superior stock selection drove positive relative results in Information Technology, most notably in the Internet software & services group, while both savvy stock picks and lower exposure were additive in Real Estate. Conversely, the largest relative detractor at the sector level came from ineffective stock selection in a number of Consumer Discretionary industries, including Internet & direct marketing retail and distributors. The portfolio’s cash position also had a negative impact on relative performance, as did poor stock selection in Health Care’s pharmaceuticals industry.
At the industry level, three groups made large contributions on an absolute basis—biotechnology (from Health Care and a relative strength in that sector), machinery (Industrials), and the previously mentioned Internet software & services industry. The impact of detractors at this level was comparably light, led by energy equipment & services (Energy, which was the only sector in the Russell 2000 to post net losses in 2017), food products (Consumer Staples), and distributors (Consumer Discretionary). These results are mostly consistent with a market that saw the biggest returns go to high-growth areas in healthcare and tech while more economically sensitive cyclical industries did well on an absolute basis while trailing on a relative scale. |
| Three biotechnology companies topped the portfolio’s list of contributors at the position level in 2017. Abeona Therapeutics develops gene therapies for rare, life-threatening diseases. Positive news in clinical trials for a gene-therapy treatment and a secondary stock offering in October helped to keep its share price healthy. We reduced our position through much of the fourth quarter as its stock climbed. We acted similarly throughout the second half of 2017 with our stake in Sangamo Therapeutics, which develops genomic therapies and medications that treat genetic diseases. Its share price began to rise in May when a collaboration with Pfizer to work on gene therapies for hemophilia was announced. The firm then reported in the fall that new partnerships with other firms were likely while also detailing promising developments in the progress of other treatments, such as its zinc finger nuclease technology that can be used in genome editing. Mirati Therapeutics develops cancer treatments and saw its stock rise on the steady progress of its product pipeline, along with the November announcement of a new public offering of common stock and warrants. We began to reduce our position in October. |
| As for positions that detracted, Era Group provides helicopter transportation services and personnel primarily to and from offshore oil drilling rigs and platforms. Earlier in 2017, its shares were challenged by falling oil prices that were reflected in disappointing earnings. Liking the long-term prospects for its niche business, we added shares and were pleased to see a little recovery for the stock in the second half of 2017. Our experience with automotive parts recycler and reseller Fenix Parts continued to be very disappointing as its shares were delisted on Nasdaq when it missed financial reporting filing deadlines. |
| | Top Contributors to Performance
For 2017 (%)1 | | | |
| | | |
| Abeona Therapeutics | | 0.87 |
| |
| Sangamo Therapeutics | | 0.87 |
| |
| Mirati Therapeutics | | 0.70 |
| |
| QuinStreet | | 0.62 |
| |
| Kadant | | 0.55 |
| |
| 1 Includes dividends | | |
| | Top Detractors from Performance
For 2017 (%)2 | | | |
| | | |
| Era Group | | -0.49 |
| |
| Fenix Parts | | -0.30 |
| |
| FTD Companies | | -0.29 |
| |
| Dundee Corporation Cl. A | | -0.27 |
| |
| Aceto Corporation | | -0.25 |
| |
| 2 Net of dividends | | |
| CURRENT POSITIONING AND OUTLOOK |
| While we are cautious about the prospects for small- and micro-cap returns as a whole, we are also optimistic about the portfolio’s return potential as it leans towards three factors that we believe will be rewarded going forward—economically sensitive cyclicals, global exposure, and—in many cases—high profitability. These are the select qualities that we anticipate will drive small-cap leadership. In this environment, we see the opportunity for the Fund to continue outperforming in the years ahead. |
| 24 | 2017 Annual Report to Stockholders | |
| PERFORMANCE AND PORTFOLIO REVIEW | SYMBOLS MARKET PRICE RMT NAV XOTCX |
|
| Performance | | | | | | | | | | | | | | | | |
| Average Annual Total Return (%) Through 12/31/17 | | | | | | | | | | | | |
| | | JUL-DEC 20171 | | 1-YR | | 3-YR | | 5-YR | | 10-YR | | 15-YR | | 20-YR | | SINCE INCEPTION (12/14/93) |
|
| RMT (NAV) | | 11.09 | | 17.67 | | 8.21 | | 13.65 | | 7.75 | | 11.51 | | 9.84 | | 11.09 |
| |
| 1 Not Annualized | | | | | | | | | | | | | | | | |
|
| Market Price Performance History Since Inception (12/14/93) |
| Cumulative Performance of Investment1 | | | | | | | | |
| | | 1-YR | | 5-YR | | 10-YR | | 15-YR | | 20-YR | | SINCE INCEPTION (12/14/93) |
| |
| RMT | | 25.1% | | 97.7% | | 114.4% | | 413.3% | | 530.0% | | 996.6% |
| |
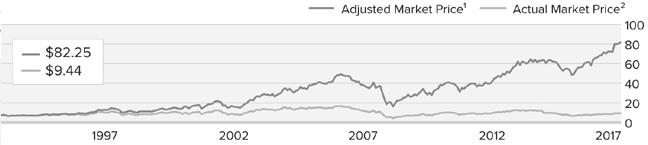
| 1 | Reflects the cumulative performance experience of a continuous common stockholder who purchased one share at inception ($7.50 IPO), reinvested all distributions and fully participated in the primary subscription of the Fund's 1994 rights offering. |
| 2 | Reflects the actual month-end market price movement of one share as it has traded on NYSE and, prior to 12/1/03, on the Nasdaq. |
| | |
| |
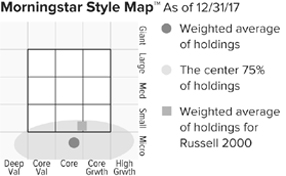
The Morningstar Style Map is the Morningstar Style Box™ with the center 75% of fund holdings plotted as the Morningstar Ownership Zone™. The Morningstar Style Box is designed to reveal a fund’s investment strategy. The Morningstar Ownership Zone provides detail about a portfolio’s investment style by showing the range of stock sizes and styles. The Ownership Zone is derived by plotting each stock in the portfolio within the proprietary Morningstar Style Box. Over time, the shape and location of a fund’s ownership zone may vary. See page 66 for additional information. |
|
| Top 10 Positions | | |
| % of Net Assets | | |
| | | |
| Kadant | | 1.2 |
| |
| Heritage-Crystal Clean | | 1.2 |
| |
| Sun Hydraulics | | 1.2 |
| |
| Major Drilling Group International | | 1.2 |
| |
| Orbotech | | 1.1 |
| |
| Clarkson | | 1.0 |
| |
| Mesa Laboratories | | 1.0 |
| |
| QuinStreet | | 1.0 |
| |
| Atrion Corporation | | 0.9 |
| |
| IES Holdings | | 0.9 |
| |
|
| Portfolio Sector Breakdown | | |
| % of Net Assets | | |
| | | |
| Industrials | | 20.9 |
| |
| Information Technology | | 20.7 |
| |
| Financials | | 12.8 |
| |
| Consumer Discretionary | | 12.7 |
| |
| Health Care | | 12.5 |
| |
| Energy | | 5.7 |
| |
| Materials | | 5.5 |
| |
| Real Estate | | 4.3 |
| |
| Consumer Staples | | 2.5 |
| |
| Utilities | | 0.4 |
| |
| Telecommunication Services | | 0.1 |
| |
| Miscellaneous | | 4.9 |
| |
| Outstanding Line of Credit, Net of Cash and Cash Equivalents | | -3.0 |
| |
|
| Calendar Year Total Returns (%) | |
| | | |
| YEAR | | RMT |
| |
| 2017 | | 17.7 |
| |
| 2016 | | 22.0 |
| |
| 2015 | | -11.7 |
| |
| 2014 | | 3.5 |
| |
| 2013 | | 44.5 |
| |
| 2012 | | 17.3 |
| |
| 2011 | | -7.7 |
| |
| 2010 | | 28.5 |
| |
| 2009 | | 46.5 |
| |
| 2008 | | -45.5 |
| |
| 2007 | | 0.6 |
| |
| 2006 | | 22.5 |
| |
| 2005 | | 6.8 |
| |
| 2004 | | 18.7 |
| |
| 2003 | | 55.5 |
| |
|
| Portfolio Diagnostics | | |
| | | |
| Fund Net Assets | | $410 million |
| |
| Number of Holdings | | 373 |
| |
| 2017 Annual Turnover Rate | | 15% |
| |
| Net Asset Value | | $10.48 |
| |
| Market Price | | $9.44 |
| |
| Net Leverage1 | | 3.0% |
| |
| Average Market Capitalization2 | | $449 million |
| |
| Weighted Average P/B Ratio3 | | 2.0x |
| |
| Active Share4 | | 95% |
| |
| U.S. Investments (% of Net Assets) | | 82.3% |
| |
| Non-U.S. Investments (% of Net Assets) | | 20.7% |
| |
| |
| 1 | Net leverage is the percentage, in excess of 100%, of the total value of equity type investments, divided by net assets. |
| 2 | Geometric Average. This weighted calculation uses each portfolio holding’s market cap in a way designed to not skew the effect of very large or small holdings; instead, it aims to better identify the portfolio’s center, which Royce believes offers a more accurate measure of average market cap than a simple mean or median. |
| 3 | Harmonic Average. This weighted calculation evaluates a portfolio as if it were a single stock and measures it overall. It compares the total market value of the portfolio to the portfolio’s share in the earnings or book value, as the case may be, of its underlying stocks. |
| 4 | Active Share is the sum of the absolute values of the different weightings of each holding in the Fund versus each holding in the benchmark, divided by two. |
Important Performance and Risk Information
All performance information reflects past performance, is presented on a total return basis, net of the Fund’s investment advisory fee, and reflects the reinvestment of distributions. Past performance is no guarantee of future results. Current performance may be higher or lower than performance quoted. Returns as of the most recent month-end may be obtained at www.roycefunds.com. Certain immaterial adjustments were made to the net assets of Royce Micro-Cap Trust at 12/31/12 and 12/31/14 for financial reporting purposes, and as a result the net asset value originally calculated on that date and the total return based on that net asset value differs from the adjusted net asset value and total return reported in the Financial Highlights. The market price of the Fund’s shares will fluctuate, so that shares may be worth more or less than their original cost when sold. The Fund normally invests in micro-cap companies, which may involve considerably more risk than investments in securities of larger-cap companies. The Fund’s broadly diversified portfolio does not ensure a profit or guarantee against loss. From time to time, the Fund may invest a significant portion of its net assets in foreign securities, which may involve political, economic, currency and other risks not encountered in U.S. investments. Regarding the “Top Contributors” and “Top Detractors” tables shown above, the sum of all contributors to, and all detractors from, performance for all securities in the portfolio would approximate the Fund’s year-to-date performance for 2017. |
| | | 2017 Annual Report to Stockholders | 25 |
| |
| Schedule of Investments |
| Common Stocks – 103.0% |
| | | | SHARES | | | | VALUE |
| |
| | | | | | | | |
| CONSUMER DISCRETIONARY – 12.7% | | | | | | | |
| AUTO COMPONENTS - 1.4% | | | | | | | |
Fox Factory Holding 1 | | | 5,300 | | | $ | 205,905 |
Motorcar Parts of America 1 | | | 54,800 | | | | 1,369,452 |
Sebang Global Battery | | | 50,500 | | | | 1,686,851 |
Standard Motor Products | | | 50,860 | | | | 2,284,123 |
Stoneridge 1 | | | 7,500 | | | | 171,450 |
Unique Fabricating | | | 12,200 | | | | 90,524 |
| | | | | | | |
| | | | | | | | 5,808,305 |
| | | | | | | |
| DISTRIBUTORS - 0.6% | | | | | | | |
Fenix Parts 1,2 | | | 440,800 | | | | 101,384 |
Uni-Select | | | 33,800 | | | | 763,929 |
Weyco Group | | | 54,300 | | | | 1,613,796 |
| | | | | | | |
| | | | | | | | 2,479,109 |
| | | | | | | |
| DIVERSIFIED CONSUMER SERVICES - 1.8% | | | | | | | |
American Public Education 1 | | | 73,200 | | | | 1,833,660 |
Collectors Universe 3 | | | 108,200 | | | | 3,098,848 |
Liberty Tax Cl. A | | | 142,900 | | | | 1,571,900 |
Universal Technical Institute 1 | | | 270,000 | | | | 648,000 |
| | | | | | | |
| | | | | | | | 7,152,408 |
| | | | | | | |
| HOTELS, RESTAURANTS & LEISURE - 1.4% | | | | | | | |
Century Casinos 1 | | | 222,500 | | | | 2,031,425 |
Del Taco Restaurants 1 | | | 8,200 | | | | 99,384 |
Lindblad Expeditions Holdings 1 | | | 254,000 | | | | 2,486,660 |
Lindblad Expeditions Holdings (Warrants) 1 | | | 18,100 | | | | 24,978 |
Red Lion Hotels 1 | | | 111,100 | | | | 1,094,335 |
| | | | | | | |
| | | | | | | | 5,736,782 |
| | | | | | | |
| HOUSEHOLD DURABLES - 3.2% | | | | | | | |
AV Homes 1 | | | 82,000 | | | | 1,365,300 |
Cavco Industries 1,3,4 | | | 20,241 | | | | 3,088,777 |
Ethan Allen Interiors 3 | | | 18,100 | | | | 517,660 |
Flexsteel Industries 3 | | | 16,100 | | | | 753,158 |
Lifetime Brands 3 | | | 119,294 | | | | 1,968,351 |
PICO Holdings 3,4 | | | 142,000 | | | | 1,817,600 |
Skyline Corporation 1 | | | 63,700 | | | | 818,545 |
Stanley Furniture 1 | | | 193,468 | | | | 168,317 |
Universal Electronics 1 | | | 6,100 | | | | 288,225 |
ZAGG 1 | | | 121,600 | | | | 2,243,520 |
| | | | | | | |
| | | | | | | | 13,029,453 |
| | | | | | | |
| INTERNET & DIRECT MARKETING RETAIL - 0.5% | | | | | | | |
FTD Companies 1 | | | 67,200 | | | | 483,168 |
Gaia Cl. A 1,3,4 | | | 125,000 | | | | 1,550,000 |
| | | | | | | |
| | | | | | | | 2,033,168 |
| | | | | | | |
| LEISURE PRODUCTS - 0.8% | | | | | | | |
American Outdoor Brands 1,3 | | | 27,100 | | | | 347,964 |
Clarus Corporation 1 | | | 174,926 | | | | 1,373,169 |
Nautilus 1 | | | 118,500 | | | | 1,581,975 |
| | | | | | | |
| | | | | | | | 3,303,108 |
| | | | | | | |
| MEDIA - 0.6% | | | | | | | |
Entravision Communications Cl. A | | | 126,200 | | | | 902,330 |
McClatchy Company (The) Cl. A 1 | | | 69,313 | | | | 618,965 |
New Media Investment Group | | | 66,200 | | | | 1,110,836 |
| | | | | | | |
| | | | | | | | 2,632,131 |
| | | | | | | |
| SPECIALTY RETAIL - 1.2% | | | | | | | |
AutoCanada | | | 115,200 | | | | 2,074,883 |
Barnes & Noble Education 1 | | | 80,000 | | | | 659,200 |
Destination Maternity 1 | | | 212,000 | | | | 629,640 |
Destination XL Group 1 | | | 50,000 | | | | 110,000 |
Haverty Furniture | | | 30,000 | | | | 679,500 |
Kirkland’s 1 | | | 11,000 | | | | 131,615 |
MarineMax 1 | | | 7,600 | | | | 143,640 |
Shoe Carnival 3 | | | 21,028 | | | | 562,499 |
Stage Stores 3 | | | 15,000 | | | | 25,200 |
| | | | | | | | 5,016,177 |
| | | | | | | |
| TEXTILES, APPAREL & LUXURY GOODS - 1.2% | | | | | | | |
Crown Crafts | | | 112,159 | | | | 723,426 |
Culp | | | 32,900 | | | | 1,102,150 |
J.G. Boswell Company 2 | | | 2,490 | | | | 1,765,410 |
YGM Trading | | | 1,482,000 | | | | 1,403,687 |
| | | | | | | |
| | | | | | | | 4,994,673 |
| |
| Total (Cost $53,083,590) | | | | | | | 52,185,314 |
| |
| | | | | | | | |
| CONSUMER STAPLES – 2.5% | | | | | | | |
| BEVERAGES - 0.2% | | | | | | | |
Crimson Wine Group 1,2 | | | 58,124 | | | | 609,721 |
| | | | | | | |
| FOOD PRODUCTS - 2.2% | | | | | | | |
Farmer Bros. 1,3,4 | | | 62,600 | | | | 2,012,590 |
John B. Sanfilippo & Son 3,4 | | | 17,800 | | | | 1,125,850 |
Landec Corporation 1,3 | | | 75,610 | | | | 952,686 |
Seneca Foods Cl. A 1 | | | 73,087 | | | | 2,247,425 |
Seneca Foods Cl. B 1 | | | 40,400 | | | | 1,373,600 |
SunOpta 1 | | | 176,281 | | | | 1,366,178 |
| | | | | | | |
| | | | | | | | 9,078,329 |
| | | | | | | |
| HOUSEHOLD PRODUCTS - 0.1% | | | | | | | |
Central Garden & Pet 1 | | | 12,000 | | | | 467,040 |
| |
| Total (Cost $6,140,646) | | | | | | | 10,155,090 |
| |
| | | | | | | | |
| ENERGY – 5.7% | | | | | | | |
| ENERGY EQUIPMENT & SERVICES - 2.6% | | | | | | | |
Aspen Aerogels 1 | | | 94,985 | | | | 463,527 |
CARBO Ceramics 1,3,4 | | | 70,000 | | | | 712,600 |
CES Energy Solutions | | | 25,000 | | | | 129,873 |
Dawson Geophysical 1 | | | 73,654 | | | | 366,060 |
Era Group 1 | | | 309,800 | | | | 3,330,350 |
Geospace Technologies 1,3 | | | 9,500 | | | | 123,215 |
Independence Contract Drilling 1 | | | 134,400 | | | | 534,912 |
Matrix Service 1,3 | | | 33,700 | | | | 599,860 |
Newpark Resources 1 | | | 11,200 | | | | 96,320 |
North American Energy Partners | | | 50,000 | | | | 247,500 |
Pioneer Energy Services 1,3 | | | 245,600 | | | | 749,080 |
†SEACOR Marine Holdings 1 | | | 205,457 | | | | 2,403,847 |
TerraVest Capital | | | 109,000 | | | | 810,780 |
Trican Well Service 1 | | | 53,300 | | | | 173,002 |
| | | | | | | |
| | | | | | | | 10,740,926 |
| | | | | | | |
| OIL, GAS & CONSUMABLE FUELS - 3.1% | | | | | | | |
Ardmore Shipping 1 | | | 199,300 | | | | 1,594,400 |
Cross Timbers Royalty Trust | | | 67,631 | | | | 991,470 |
Dorchester Minerals L.P. | | | 140,569 | | | | 2,136,649 |
Dorian LPG 1 | | | 138,138 | | | | 1,135,494 |
Hugoton Royalty Trust | | | 287,574 | | | | 402,603 |
Panhandle Oil and Gas Cl. A | | | 5,500 | | | | 113,025 |
Permian Basin Royalty Trust | | | 176,333 | | | | 1,564,074 |
Sabine Royalty Trust | | | 59,548 | | | | 2,655,841 |
San Juan Basin Royalty Trust | | | 143,407 | | | | 1,181,674 |
StealthGas 1 | | | 229,664 | | | | 1,001,335 |
| | | | | | | |
| | | | | | | | 12,776,565 |
| |
| Total (Cost $24,650,686) | | | | | | | 23,517,491 |
| |
| 26 | 2017 Annual Report to Stockholders | | THE ACCOMPANYING NOTES ARE AN INTEGRAL PART OF THESE FINANCIAL STATEMENTS |
| |
| Schedule of Investments (continued) |
| | | | SHARES | | | | VALUE |
| |
| | | | | | | | |
| FINANCIALS – 12.8% | | | | | | | |
| BANKS - 2.4% | | | | | | | |
Bank of N.T. Butterfield & Son | | | 43,810 | | | $ | 1,589,865 |
Blue Hills Bancorp | | | 50,000 | | | | 1,005,000 |
Bryn Mawr Bank | | | 25,000 | | | | 1,105,000 |
Caribbean Investment Holdings 1 | | | 735,635 | | | | 228,440 |
Chemung Financial | | | 31,000 | | | | 1,491,100 |
Fauquier Bankshares | | | 133,200 | | | | 2,914,416 |
Live Oak Bancshares 3,4 | | | 30,900 | | | | 736,965 |
†Midway Investments 1,5 | | | 735,647 | | | | 0 |
Peapack-Gladstone Financial | | | 20,606 | | | | 721,622 |
| | | | | | | |
| | | | | | | | 9,792,408 |
| | | | | | | |
| CAPITAL MARKETS - 8.6% | | | | | | | |
ASA Gold and Precious Metals | | | 171,150 | | | | 1,937,418 |
Canaccord Genuity Group | | | 224,100 | | | | 1,034,033 |
Diamond Hill Investment Group 3 | | | 3,584 | | | | 740,669 |
Dundee Corporation Cl. A 1 | | | 413,200 | | | | 831,660 |
EQT Holdings | | | 43,150 | | | | 673,574 |
Fiera Capital Cl. A | | | 78,000 | | | | 806,683 |
GAIN Capital Holdings | | | 25,000 | | | | 250,000 |
Gluskin Sheff + Associates | | | 67,400 | | | | 892,768 |
†Great Elm Capital Group 1 | | | 395,200 | | | | 1,600,560 |
†Hamilton Lane Cl. A 3 | | | 32,300 | | | | 1,143,097 |
INTL FCStone 1,3 | | | 41,727 | | | | 1,774,649 |
JZ Capital Partners 1 | | | 209,999 | | | | 1,375,095 |
Manning & Napier Cl. A | | | 136,600 | | | | 491,760 |
Medley Management Cl. A | | | 153,400 | | | | 997,100 |
MVC Capital | | | 341,430 | | | | 3,605,501 |
OHA Investment | | | 88,620 | | | | 101,913 |
Pzena Investment Management Cl. A | | | 6,100 | | | | 65,087 |
Queen City Investments 2 | | | 948 | | | | 1,232,400 |
Silvercrest Asset Management Group Cl. A | | | 203,300 | | | | 3,262,965 |
Sprott | | | 1,414,533 | | | | 2,745,792 |
U.S. Global Investors Cl. A 3 | | | 439,454 | | | | 1,713,871 |
Urbana Corporation | | | 237,600 | | | | 686,148 |
Value Line | | | 136,074 | | | | 2,633,032 |
Virtu Financial Cl. A 3 | | | 107,800 | | | | 1,972,740 |
Warsaw Stock Exchange | | | 52,900 | | | | 714,096 |
Westaim Corporation 1 | | | 45,000 | | | | 111,337 |
Westwood Holdings Group 3 | | | 12,400 | | | | 821,004 |
ZAIS Group Holdings Cl. A 1,3,4 | | | 262,960 | | | | 1,022,914 |
| | | | | | | |
| | | | | | | | 35,237,866 |
| | | | | | | |
| CONSUMER FINANCE - 0.6% | | | | | | | |
EZCORP Cl. A 1,3,4 | | | 201,000 | | | | 2,452,200 |
J.G. Wentworth Company Cl. A 1,2 | | | 135,000 | | | | 783 |
| | | | | | | |
| | | | | | | | 2,452,983 |
| | | | | | | |
| DIVERSIFIED FINANCIAL SERVICES - 0.1% | | | | | | | |
Banca Finnat Euramerica | | | 568,000 | | | | 272,160 |
Waterloo Investment Holdings 1,5 | | | 806,000 | | | | 241,800 |
| | | | | | | |
| | | | | | | | 513,960 |
| | | | | | | |
| INSURANCE - 1.1% | | | | | | | |
Hallmark Financial Services 1,3,4 | | | 114,000 | | | | 1,189,020 |
State Auto Financial | | | 59,264 | | | | 1,725,768 |
†Trupanion 1,3,4 | | | 52,300 | | | | 1,530,821 |
| | | | | | | |
| | | | | | | | 4,445,609 |
| |
| Total (Cost $50,587,017) | | | | | | | 52,442,826 |
| |
| | | | | | | | |
| HEALTH CARE – 12.5% | | | | | | | |
| BIOTECHNOLOGY - 4.6% | | | | | | | |
Abeona Therapeutics 1,3,4 | | | 142,221 | | | | 2,254,203 |
Aquinox Pharmaceuticals 1,3,4 | | | 145,397 | | | | 1,709,869 |
ARCA biopharma 1 | | | 324,847 | | | | 446,665 |
BioCryst Pharmaceuticals 1 | | | 144,000 | | | | 707,040 |
Invitae Corporation 1 | | | 156,412 | | | | 1,420,221 |
Keryx Biopharmaceuticals 1,3,4 | | | 117,725 | | | | 547,421 |
Kindred Biosciences 1 | | | 126,000 | | | | 1,190,700 |
Knight Therapeutics 1 | | | 187,000 | | | | 1,236,253 |
†Mirati Therapeutics 1 | | | 121,100 | | | | 2,210,075 |
Progenics Pharmaceuticals 1 | | | 6,500 | | | | 38,675 |
Sangamo Therapeutics 1 | | | 121,650 | | | | 1,995,060 |
Stemline Therapeutics 1 | | | 6,800 | | | | 106,080 |
Zafgen 1 | | | 548,491 | | | | 2,534,028 |
Zealand Pharma 1 | | | 187,900 | | | | 2,572,032 |
| | | | | | | |
| | | | | | | | 18,968,322 |
| | | | | | | |
| HEALTH CARE EQUIPMENT & SUPPLIES - 4.4% | | | | | | | |
Analogic Corporation | | | 18,200 | | | | 1,524,250 |
†AtriCure 1,3 | | | 15,000 | | | | 273,600 |
Atrion Corporation | | | 6,169 | | | | 3,890,171 |
CRH Medical 1 | | | 133,000 | | | | 350,223 |
CryoLife 1 | | | 4,600 | | | | 88,090 |
Exactech 1 | | | 38,700 | | | | 1,913,715 |
Inogen 1 | | | 5,400 | | | | 643,032 |
Invacare Corporation 3 | | | 44,300 | | | | 746,455 |
LeMaitre Vascular | | | 5,000 | | | | 159,200 |
†OraSure Technologies 1,3,4 | | | 50,000 | | | | 943,000 |
STRATEC Biomedical | | | 14,000 | | | | 1,085,475 |
Surmodics 1 | | | 125,892 | | | | 3,524,976 |
TearLab Corporation 1,2 | | | 8,500 | | | | 3,273 |
Utah Medical Products | | | 34,000 | | | | 2,767,600 |
| | | | | | | |
| | | | | | | | 17,913,060 |
| | | | | | | |
| HEALTH CARE PROVIDERS & SERVICES - 2.2% | | | | | | | |
Aceto Corporation | | | 79,600 | | | | 822,268 |
BioTelemetry 1 | | | 47,700 | | | | 1,426,230 |
Cross Country Healthcare 1 | | | 150,800 | | | | 1,924,208 |
National Research Cl. A | | | 89,529 | | | | 3,339,432 |
Psychemedics Corporation 3 | | | 37,500 | | | | 771,000 |
U.S. Physical Therapy | | | 10,000 | | | | 722,000 |
| | | | | | | |
| | | | | | | | 9,005,138 |
| | | | | | | |
| HEALTH CARE TECHNOLOGY - 0.3% | | | | | | | |
Connecture 1,2 | | | 20,000 | | | | 3,200 |
Vocera Communications 1 | | | 33,100 | | | | 1,000,282 |
| | | | | | | |
| | | | | | | | 1,003,482 |
| | | | | | | |
| PHARMACEUTICALS - 1.0% | | | | | | | |
Agile Therapeutics 1,3,4 | | | 80,000 | | | | 215,200 |
Arcturus Therapeutics 1 | | | 106,436 | | | | 847,230 |
Flex Pharma 1 | | | 310,210 | | | | 1,082,633 |
Lipocine 1 | | | 142,204 | | | | 489,182 |
Theravance Biopharma 1 | | | 59,009 | | | | 1,645,761 |
| | | | | | | |
| | | | | | | | 4,280,006 |
| |
| Total (Cost $32,617,874) | | | | | | | 51,170,008 |
| |
| | | | | | | | |
| INDUSTRIALS – 20.9% | | | | | | | |
| AEROSPACE & DEFENSE - 0.7% | | | | | | | |
Astronics Corporation 1 | | | 2,460 | | | | 102,016 |
CPI Aerostructures 1 | | | 11,800 | | | | 105,610 |
FLYHT Aerospace Solutions 1 | | | 191,680 | | | | 298,881 |
Innovative Solutions and Support 1 | | | 142,828 | | | | 419,914 |
Mercury Systems 1,3,4 | | | 29,700 | | | | 1,525,095 |
| THE ACCOMPANYING NOTES ARE AN INTEGRAL PART OF THESE FINANCIAL STATEMENTS | | 2017 Annual Report to Stockholders | 27 |
| |
| Schedule of Investments (continued) |
| | | | SHARES | | | | VALUE |
| |
| | | | | | | | |
| INDUSTRIALS (continued) | | | | | | | |
| AEROSPACE & DEFENSE (continued) | | | | | | | |
SIFCO Industries 1 | | | 45,800 | | | $ | 304,584 |
| | | | | | | |
| | | | | | | | 2,756,100 |
| | | | | | | |
| BUILDING PRODUCTS - 1.3% | | | | | | | |
Burnham Holdings Cl. A 2 | | | 117,000 | | | | 1,825,200 |
DIRTT Environmental Solutions 1 | | | 196,100 | | | | 1,051,483 |
Insteel Industries | | | 44,200 | | | | 1,251,744 |
Patrick Industries 1 | | | 17,250 | | | | 1,198,012 |
| | | | | | | |
| | | | | | | | 5,326,439 |
| | | | | | | |
| COMMERCIAL SERVICES & SUPPLIES - 2.1% | | | | | | | |
Atento | | | 191,401 | | | | 1,942,720 |
CompX International Cl. A | | | 78,200 | | | | 1,040,060 |
Heritage-Crystal Clean 1,3,4 | | | 223,477 | | | | 4,860,625 |
Team 1,3,4 | | | 57,500 | | | | 856,750 |
| | | | | | | |
| | | | | | | | 8,700,155 |
| | | | | | | |
| CONSTRUCTION & ENGINEERING - 2.3% | | | | | | | |
Ameresco Cl. A 1 | | | 251,400 | | | | 2,162,040 |
IES Holdings 1 | | | 220,000 | | | | 3,795,000 |
Layne Christensen 1,3,4 | | | 50,000 | | | | 627,500 |
Northwest Pipe 1,3,4 | | | 61,600 | | | | 1,179,024 |
NV5 Global 1,3,4 | | | 27,400 | | | | 1,483,710 |
| | | | | | | |
| | | | | | | | 9,247,274 |
| | | | | | | |
| ELECTRICAL EQUIPMENT - 0.9% | | | | | | | |
Encore Wire 3 | | | 4,100 | | | | 199,465 |
LSI Industries | | | 147,412 | | | | 1,014,195 |
Orion Energy Systems 1 | | | 170,000 | | | | 149,600 |
Powell Industries | | | 21,400 | | | | 613,110 |
Power Solutions International 1,2,3,4 | | | 21,100 | | | | 158,250 |
Preformed Line Products | | | 20,743 | | | | 1,473,790 |
Revolution Lighting Technologies 1,3,4 | | | 81,200 | | | | 267,148 |
| | | | | | | |
| | | | | | | | 3,875,558 |
| | | | | | | |
| INDUSTRIAL CONGLOMERATES - 0.9% | | | | | | | |
Raven Industries 3 | | | 102,559 | | | | 3,522,901 |
| | | | | | | |
| MACHINERY - 8.3% | | | | | | | |
CIRCOR International 3 | | | 56,900 | | | | 2,769,892 |
Eastern Company (The) | | | 39,750 | | | | 1,039,462 |
Exco Technologies | | | 85,400 | | | | 688,907 |
Foster (L.B.) Company 1,3,4 | | | 95,300 | | | | 2,587,395 |
FreightCar America | | | 86,500 | | | | 1,477,420 |
Global Brass and Copper Holdings | | | 5,000 | | | | 165,500 |
Graham Corporation 3,4 | | | 75,150 | | | | 1,572,890 |
Harsco Corporation 1 | | | 4,400 | | | | 82,060 |
Hurco Companies | | | 36,866 | | | | 1,555,745 |
Kadant | | | 49,800 | | | | 4,999,920 |
Kornit Digital 1 | | | 37,000 | | | | 597,550 |
Lindsay Corporation 3 | | | 32,600 | | | | 2,875,320 |
Luxfer Holdings 3 | | | 59,712 | | | | 943,450 |
Lydall 1 | | | 1,800 | | | | 91,350 |
NN | | | 45,300 | | | | 1,250,280 |
Sun Hydraulics | | | 74,000 | | | | 4,787,060 |
Tennant Company | | | 34,400 | | | | 2,499,160 |
Titan International | | | 212,200 | | | | 2,733,136 |
Westport Fuel Systems 1 | | | 377,900 | | | | 1,420,904 |
| | | | | | | |
| | | | | | | | 34,137,401 |
| | | | | | | |
| MARINE - 1.0% | | | | | | | |
Clarkson | | | 109,900 | | | | 4,243,312 |
| | | | | | | |
| PROFESSIONAL SERVICES - 1.3% | | | | | | | |
Acacia Research 1,3 | | | 190,000 | | | | 769,500 |
CBIZ 1 | | | 47,000 | | | | 726,150 |
Franklin Covey 1 | | | 40,100 | | | | 832,075 |
GP Strategies 1 | | | 7,600 | | | | 176,320 |
Heidrick & Struggles International | | | 46,300 | | | | 1,136,665 |
Kforce 3 | | | 4,700 | | | | 118,675 |
Resources Connection | | | 11,200 | | | | 173,040 |
RPX Corporation | | | 96,000 | | | | 1,290,240 |
| | | | | | | |
| | | | | | | | 5,222,665 |
| | | | | | | |
| ROAD & RAIL - 0.7% | | | | | | | |
Marten Transport | | | 5,500 | | | | 111,650 |
Patriot Transportation Holding 1,3 | | | 55,764 | | | | 980,889 |
Universal Logistics Holdings 3,4 | | | 77,600 | | | | 1,843,000 |
| | | | | | | |
| | | | | | | | 2,935,539 |
| | | | | | | |
| TRADING COMPANIES & DISTRIBUTORS - 1.4% | | | | | | | |
Central Steel & Wire 2 | | | 788 | | | | 354,600 |
EnviroStar 3,4 | | | 74,400 | | | | 2,976,000 |
Houston Wire & Cable 1 | | | 331,418 | | | | 2,386,209 |
| | | | | | | | 5,716,809 |
| |
| Total (Cost $59,573,079) | | | | | | | 85,684,153 |
| |
| | | | | | | | |
| INFORMATION TECHNOLOGY – 20.7% | | | | | | | |
| COMMUNICATIONS EQUIPMENT - 0.7% | | | | | | | |
ADTRAN 3 | | | 23,300 | | | | 450,855 |
Clearfield 1 | | | 61,300 | | | | 750,925 |
EMCORE Corporation 1 | | | 8,300 | | | | 53,535 |
Harmonic 1 | | | 147,000 | | | | 617,400 |
Oclaro 1 | | | 137,100 | | | | 924,054 |
PCTEL | | | 34,100 | | | | 251,317 |
| | | | | | | |
| | | | | | | | 3,048,086 |
| | | | | | | |
| ELECTRONIC EQUIPMENT, INSTRUMENTS & COMPONENTS - 6.1% | | | | | | | |
Airgain 1 | | | 4,800 | | | | 43,152 |
Bel Fuse Cl. A | | | 67,705 | | | | 1,478,000 |
ePlus 1 | | | 3,000 | | | | 225,600 |
Fabrinet 1 | | | 2,200 | | | | 63,140 |
FARO Technologies 1,3,4 | | | 76,800 | | | | 3,609,600 |
Firan Technology Group 1 | | | 25,000 | | | | 71,798 |
HollySys Automation Technologies | | | 58,500 | | | | 1,302,795 |
Inficon Holding | | | 3,220 | | | | 2,009,699 |
LRAD Corporation 1 | | | 853,456 | | | | 2,125,106 |
Mesa Laboratories 3 | | | 32,900 | | | | 4,089,470 |
Novanta 1 | | | 37,600 | | | | 1,880,000 |
Orbotech 1,3,4 | | | 87,000 | | | | 4,370,880 |
PC Connection | | | 43,716 | | | | 1,145,796 |
Perceptron 1 | | | 8,500 | | | | 82,875 |
Richardson Electronics | | | 316,900 | | | | 2,135,906 |
Rogers Corporation 1,3 | | | 600 | | | | 97,152 |
Vishay Precision Group 1 | | | 10,000 | | | | 251,500 |
| | | | | | | |
| | | | | | | | 24,982,469 |
| | | | | | | |
| INTERNET SOFTWARE & SERVICES - 5.0% | | | | | | | |
Actua Corporation 1 | | | 36,876 | | | | 575,266 |
Care.com 1,3,4 | | | 171,787 | | | | 3,099,037 |
comScore 1,2 | | | 64,195 | | | | 1,829,558 |
†Etsy 1 | | | 80,300 | | | | 1,642,135 |
IZEA 1,3,4 | | | 85,870 | | | | 388,132 |
MINDBODY Cl. A 1 | | | 38,900 | | | | 1,184,505 |
QuinStreet 1 | | | 475,550 | | | | 3,985,109 |
†Real Matters 1 | | | 255,000 | | | | 2,044,869 |
Reis | | | 25,000 | | | | 516,250 |
Solium Capital 1 | | | 309,700 | | | | 2,688,009 |
| 28 | 2017 Annual Report to Stockholders | | THE ACCOMPANYING NOTES ARE AN INTEGRAL PART OF THESE FINANCIAL STATEMENTS |
| |
| Schedule of Investments (continued) |
| | | | SHARES | | | | VALUE |
| |
| | | | | | | | |
| INFORMATION TECHNOLOGY (continued) | | | | | | | |
| INTERNET SOFTWARE & SERVICES (continued) | | | | | | | |
Stamps.com 1 | | | 12,300 | | | $ | 2,312,400 |
Support.com 1 | | | 105,600 | | | | 255,552 |
| | | | | | | |
| | | | | | | | 20,520,822 |
| | | | | | | |
| IT SERVICES - 0.5% | | | | | | | |
Computer Task Group 1,3 | | | 150,838 | | | | 769,274 |
Hackett Group (The) | | | 27,700 | | | | 435,167 |
Innodata 1 | | | 437,275 | | | | 594,694 |
Virtusa Corporation 1 | | | 2,300 | | | | 101,384 |
| | | | | | | |
| | | | | | | | 1,900,519 |
| | | | | | | |
| SEMICONDUCTORS & SEMICONDUCTOR EQUIPMENT - 4.8% | | | | | | | |
Amtech Systems 1,3,4 | | | 92,184 | | | | 928,293 |
Brooks Automation | | | 91,500 | | | | 2,182,275 |
CyberOptics Corporation 1 | | | 46,600 | | | | 699,000 |
FormFactor 1 | | | 22,869 | | | | 357,900 |
Intermolecular 1 | | | 240,000 | | | | 328,800 |
IXYS Corporation 1 | | | 18,800 | | | | 450,260 |
Kopin Corporation 1 | | | 242,200 | | | | 775,040 |
Kulicke & Soffa Industries 1 | | | 77,200 | | | | 1,878,662 |
MoSys 1,3,4 | | | 68,427 | | | | 75,954 |
Nanometrics 1 | | | 64,600 | | | | 1,609,832 |
NeoPhotonics Corporation 1,3,4 | | | 51,300 | | | | 337,554 |
Nova Measuring Instruments 1 | | | 66,100 | | | | 1,712,651 |
PDF Solutions 1 | | | 97,000 | | | | 1,522,900 |
Photronics 1 | | | 223,500 | | | | 1,905,337 |
Rudolph Technologies 1 | | | 52,100 | | | | 1,245,190 |
Sigma Designs 1 | | | 60,000 | | | | 417,000 |
Silicon Motion Technology ADR | | | 34,100 | | | | 1,805,936 |
Ultra Clean Holdings 1,3 | | | 49,900 | | | | 1,152,191 |
Veeco Instruments 1,3,4 | | | 17,500 | | | | 259,875 |
Xcerra Corporation 1 | | | 11,300 | | | | 110,627 |
| | | | | | | |
| | | | | | | | 19,755,277 |
| | | | | | | |
| SOFTWARE - 2.6% | | | | | | | |
Agilysys 1 | | | 170,587 | | | | 2,094,808 |
American Software Cl. A | | | 120,352 | | | | 1,399,694 |
BSQUARE Corporation 1 | | | 83,675 | | | | 389,088 |
Computer Modelling Group | | | 337,700 | | | | 2,579,093 |
Model N 1 | | | 67,193 | | | | 1,058,290 |
Monotype Imaging Holdings | | | 15,000 | | | | 361,500 |
PSI Software | | | 34,000 | | | | 755,009 |
RealNetworks 1 | | | 130,171 | | | | 445,185 |
Rubicon Project 1 | | | 75,000 | | | | 140,250 |
SeaChange International 1 | | | 284,200 | | | | 1,116,906 |
Varonis Systems 1 | | | 2,600 | | | | 126,230 |
| | | | | | | |
| | | | | | | | 10,466,053 |
| | | | | | | |
| TECHNOLOGY HARDWARE, STORAGE & PERIPHERALS - 1.0% | | | | | | | |
Intevac 1 | | | 293,400 | | | | 2,009,790 |
Kortek | | | 135,007 | | | | 2,059,314 |
| | | | | | | |
| | | | | | | | 4,069,104 |
| |
| Total (Cost $64,410,193) | | | | | | | 84,742,330 |
| |
| | | | | | | | |
| MATERIALS – 5.5% | | | | | | | |
| CHEMICALS - 2.0% | | | | | | | |
Balchem Corporation | | | 11,775 | | | | 949,065 |
FutureFuel Corporation | | | 85,262 | | | | 1,201,342 |
LSB Industries 1 | | | 135,800 | | | | 1,189,608 |
Quaker Chemical 3,4 | | | 24,400 | | | | 3,679,276 |
Trecora Resources 1 | | | 89,600 | | | | 1,209,600 |
| | | | | | | |
| | | | | | | | 8,228,891 |
| | | | | | | |
| CONSTRUCTION MATERIALS - 0.3% | | | | | | | |
Monarch Cement 2 | | | 16,303 | | | | 1,137,949 |
U.S. Concrete 1 | | | 3,400 | | | | 284,410 |
| | | | | | | |
| | | | | | | | 1,422,359 |
| | | | | | | |
| CONTAINERS & PACKAGING - 0.3% | | | | | | | |
UFP Technologies 1 | | | 36,445 | | | | 1,013,171 |
| | | | | | | |
| METALS & MINING - 2.9% | | | | | | | |
Alamos Gold Cl. A | | | 186,044 | | | | 1,212,172 |
Ampco-Pittsburgh | | | 79,002 | | | | 979,625 |
Comstock Mining 1 | | | 375,000 | | | | 146,250 |
Haynes International 3 | | | 26,100 | | | | 836,505 |
Imdex 1 | | | 750,666 | | | | 617,063 |
MAG Silver 1 | | | 74,050 | | | | 915,258 |
Major Drilling Group International 1 | | | 850,357 | | | | 4,776,070 |
Olympic Steel | | | 35,000 | | | | 752,150 |
Pretium Resources 1 | | | 80,000 | | | | 912,649 |
Universal Stainless & Alloy Products 1 | | | 15,300 | | | | 327,726 |
Victoria Gold 1 | | | 890,000 | | | | 307,995 |
| | | | | | | |
| | | | | | | | 11,783,463 |
| |
| Total (Cost $18,241,725) | | | | | | | 22,447,884 |
| |
| | | | | | | | |
| REAL ESTATE – 4.3% | | | | | | | |
| EQUITY REAL ESTATE INVESTMENT TRUSTS (REITS) - 0.7% | | | | | | | |
BRT Apartments | | | 230,331 | | | | 2,715,603 |
| | | | | | | |
| REAL ESTATE MANAGEMENT & DEVELOPMENT - 3.6% | | | | | | | |
Altus Group | | | 87,000 | | | | 2,556,014 |
FRP Holdings 1,3,4 | | | 76,500 | | | | 3,385,125 |
Griffin Industrial Realty | | | 38,784 | | | | 1,423,373 |
Hopefluent Group Holdings | | | 1,400,000 | | | | 614,522 |
Marcus & Millichap 1,3,4 | | | 49,567 | | | | 1,616,380 |
RMR Group Cl. A | | | 34,900 | | | | 2,069,570 |
Tejon Ranch 1,3,4 | | | 154,994 | | | | 3,217,675 |
| | | | | | | |
| | | | | | | | 14,882,659 |
| |
| Total (Cost $12,321,495) | | | | | | | 17,598,262 |
| |
| | | | | | | | |
| TELECOMMUNICATION SERVICES – 0.1% | | | | | | | |
| DIVERSIFIED TELECOMMUNICATION SERVICES - 0.1% | | | | | | | |
ORBCOMM 1 | | | 67,100 | | | | 683,078 |
| |
| Total (Cost $570,215) | | | | | | | 683,078 |
| |
| | | | | | | | |
| UTILITIES – 0.4% | | | | | | | |
| GAS UTILITIES - 0.1% | | | | | | | |
Shizuoka Gas | | | 40,000 | | | | 340,422 |
| | | | | | | |
| INDEPENDENT POWER & RENEWABLE ELECTRICITY PRODUCER - 0.1% | | | | | | | |
Alterra Power | | | 45,000 | | | | 286,396 |
| | | | | | | |
| WATER UTILITIES - 0.2% | | | | | | | |
Global Water Resources | | | 106,000 | | | | 990,040 |
| |
| Total (Cost $1,145,614) | | | | | | | 1,616,858 |
| |
| | | | | | | | |
| MISCELLANEOUS6 – 4.9% | | | | | | | |
| |
| Total (Cost $18,803,152) | | | | | | | 20,172,168 |
| |
| | | | | | | | |
| TOTAL COMMON STOCKS | | | | | | | |
| |
| (Cost $342,145,286) | | | | | | | 422,415,462 |
| |
| THE ACCOMPANYING NOTES ARE AN INTEGRAL PART OF THESE FINANCIAL STATEMENTS | | 2017 Annual Report to Stockholders | 29 |
| Royce Micro-Cap Trust | | December 31, 2017 |
| |
| Schedule of Investments (continued) |
| | | | VALUE | |
| |
| | | | | |
| REPURCHASE AGREEMENT– 7.7% | | | | |
Fixed Income Clearing Corporation, 0.20% dated 12/29/17, due 1/2/18, maturity value
$31,430,698 (collateralized by obligations of various U.S. Government Agencies, 0.75%-
1.75% due 10/31/18, valued at $32,059,068) | | $ | 31,430,000 | |
| |
| (Cost $31,430,000) | | | | |
| |
| | | | | |
| TOTAL INVESTMENTS – 110.7% | | | | |
| |
| (Cost $373,575,286) | | | 453,845,462 | |
| |
| | | | | |
| LIABILITIES LESS CASH AND OTHER ASSETS – (10.7)% | | | (43,940,546 | ) |
| | | | |
| | | | | |
| |
| NET ASSETS – 100.0% | | $ | 409,904,916 | |
| |
| † | New additions in 2017. |
| 1 | Non-income producing. |
| 2 | These securities are defined as Level 2 securities due to fair value being based on quoted prices for similar securities. See Notes to Financial Statements. |
| 3 | All or a portion of these securities were pledged as collateral in connection with the Fund’s revolving credit agreement at December 31, 2017. Total market value of pledged securities at |
| | December 31, 2017, was $69,255,541. |
| 4 | At December 31, 2017, a portion of these securities were rehypothecated in connection with the Fund’s revolving credit agreement in the aggregate amount of $42,559,647. |
| 5 | Securities for which market quotations are not readily available represent 0.1% of net assets. These securities have been valued at their fair value under procedures approved by the Fund’s Board of Directors. These securities are defined as Level 3 securities due to the use of significant unobservable inputs in the determination of fair value. See Notes to Financial Statements. |
| 6 | Includes securities first acquired in 2017 and less than 1% of net assets. |
| | |
| | Bold indicates the Fund’s 20 largest equity holdings in terms of December 31, 2017, market value. |
| | |
| | TAX INFORMATION: The cost of total investments for Federal income tax purposes was $375,885,077. At December 31, 2017, net unrealized appreciation for all securities was $77,960,385 consisting of aggregate gross unrealized appreciation of $125,706,455 and aggregate gross unrealized depreciation of $47,746,070. The primary causes of the differences between book and tax basis cost are the timing of the recognition of losses on securities sold, investments in publicly traded partnerships and Trusts and mark-to-market of Passive Foreign Investment Companies. |
| 30 | 2017 Annual Report to Stockholders | | THE ACCOMPANYING NOTES ARE AN INTEGRAL PART OF THESE FINANCIAL STATEMENTS |
| Royce Micro-Cap Trust | | December 31, 2017 |
| |
| Statement of Assets and Liabilities |
| ASSETS: | | | | |
| Investments at value | | $ | 422,415,462 | |
| |
| Repurchase agreements (at cost and value) | | | 31,430,000 | |
| |
| Receivable for investments sold | | | 1,356,246 | |
| |
| Receivable for dividends and interest | | | 317,349 | |
| |
| Prepaid expenses and other assets | | | 35,726 | |
| |
| Total Assets | | | 455,554,783 | |
| |
| LIABILITIES: | | | | |
| Revolving credit agreement | | | 45,000,000 | |
| |
| Payable to custodian for cash and foreign currency overdrawn | | | 303 | |
| |
| Payable for investments purchased | | | 350,225 | |
| |
| Payable for investment advisory fee | | | 162,616 | |
| |
| Payable for directors’ fees | | | 23,165 | |
| |
| Payable for interest expense | | | 13,223 | |
| |
| Accrued expenses | | | 100,335 | |
| |
| Total Liabilities | | | 45,649,867 | |
| |
| Net Assets | | $ | 409,904,916 | |
| |
| ANALYSIS OF NET ASSETS: | | | | |
| Paid-in capital - $0.001 par value per share; 39,116,640 shares outstanding (150,000,000 shares authorized) | | $ | 329,118,673 | |
| |
| Undistributed net investment income (loss) | | | (1,002,531 | ) |
| |
| Accumulated net realized gain (loss) on investments and foreign currency | | | 1,518,443 | |
| |
| Net unrealized appreciation (depreciation) on investments and foreign currency | | | 80,270,331 | |
| |
| Net Assets (net asset value per share - $10.48) | | $ | 409,904,916 | |
| |
| Investments at identified cost | | $ | 342,145,286 | |
| |
| THE ACCOMPANYING NOTES ARE AN INTEGRAL PART OF THESE FINANCIAL STATEMENTS | | 2017 Annual Report to Stockholders | 31 |
| |
| Statement of Changes in Net Assets |
| | | YEAR ENDED 12/31/17 | | YEAR ENDED 12/31/16 |
| |
| | | | | | | | | |
| INVESTMENT OPERATIONS: | | | | | | | | |
| Net investment income (loss) | | $ | 2,126,051 | | | $ | 1,040,381 | |
| |
| Net realized gain (loss) on investments and foreign currency | | | 25,657,103 | | | | 17,298,523 | |
| |
| Net change in unrealized appreciation (depreciation) on investments and foreign currency | | | 33,136,932 | | | | 46,017,634 | |
| |
| Net increase (decrease) in net assets from investment operations | | | 60,920,086 | | | | 64,356,538 | |
| |
| DISTRIBUTIONS: | | | | | | | | |
| Net investment income | | | (2,282,512 | ) | | | (2,974,373 | ) |
| |
| Net realized gain on investments and foreign currency | | | (24,135,451 | ) | | | (20,650,513 | ) |
| |
| Total distributions | | | (26,417,963 | ) | | | (23,624,886 | ) |
| |
| CAPITAL STOCK TRANSACTIONS: | | | | | | | | |
| Reinvestment of distributions | | | 11,702,040 | | | | 10,562,009 | |
| |
| Total capital stock transactions | | | 11,702,040 | | | | 10,562,009 | |
| |
| Net Increase (Decrease) In Net Assets | | | 46,204,163 | | | | 51,293,661 | |
| |
| NET ASSETS: | | | | | | | | |
| |
| Beginning of year | | | 363,700,753 | | | | 312,407,092 | |
| |
| End of year (including undistributed net investment income (loss) of $(1,002,531) at 12/31/17 and $(1,987,430) at 12/31/16) | | $ | 409,904,916 | | | $ | 363,700,753 | |
| |
| 32 | 2017 Annual Report to Stockholders | | THE ACCOMPANYING NOTES ARE AN INTEGRAL PART OF THESE FINANCIAL STATEMENTS |
| Royce Micro-Cap Trust | | Year Ended December 31, 2017 |
| INVESTMENT INCOME: | | | | |
| INCOME: | | | | |
| Dividends | | $ | 5,460,744 | |
| |
| Foreign withholding tax | | | (113,927 | ) |
| |
| Interest | | | 36,662 | |
| |
| Rehypothecation income | | | 105,571 | |
| |
| Total income | | | 5,489,050 | |
| EXPENSES: | | | | |
| |
| Investment advisory fees | | | 1,849,250 | |
| |
| Interest expense | | | 1,010,324 | |
| |
| Stockholder reports | | | 121,130 | |
| |
| Administrative and office facilities | | | 97,552 | |
| |
| Custody and transfer agent fees | | | 91,086 | |
| |
| Directors’ fees | | | 90,170 | |
| |
| Professional fees | | | 59,188 | |
| |
| Other expenses | | | 44,302 | |
| |
| Total expenses | | | 3,363,002 | |
| |
| Compensating balance credits | | | (3 | ) |
| |
| Net expenses | | | 3,362,999 | |
| |
| Net investment income (loss) | | | 2,126,051 | |
| |
| REALIZED AND UNREALIZED GAIN (LOSS) ON INVESTMENTS AND FOREIGN CURRENCY: | | | | |
| NET REALIZED GAIN (LOSS): | | | | |
| |
| Investments | | | 25,643,717 | |
| |
| Foreign currency transactions | | | 13,386 | |
| |
| NET CHANGE IN UNREALIZED APPRECIATION (DEPRECIATION): | | | | |
| |
| Investments and foreign currency translations | | | 33,135,300 | |
| |
| Other assets and liabilities denominated in foreign currency | | | 1,632 | |
| |
| Net realized and unrealized gain (loss) on investments and foreign currency | | | 58,794,035 | |
| |
| NET INCREASE (DECREASE) IN NET ASSETS FROM INVESTMENT OPERATIONS | | $ | 60,920,086 | |
| |
| THE ACCOMPANYING NOTES ARE AN INTEGRAL PART OF THESE FINANCIAL STATEMENTS | | 2017 Annual Report to Stockholders | 33 |
| Royce Micro-Cap Trust | | Year Ended December 31, 2017 |
| CASH FLOWS FROM OPERATING ACTIVITIES: | | | | |
| Net increase (decrease) in net assets from investment operations | | $ | 60,920,086 | |
| |
| Adjustments to reconcile net increase (decrease) in net assets from investment operations to net cash provided by operating activities: | | | | |
| |
Purchases of long-term investments | | | (60,892,834 | ) |
| |
Proceeds from sales and maturities of long-term investments | | | 61,228,982 | |
| |
Net purchases, sales and maturities of short-term investments | | | 12,042,000 | |
| |
Net (increase) decrease in dividends and interest receivable and other assets | | | 189,283 | |
| |
Net increase (decrease) in interest expense payable, accrued expenses and other liabilities | | | 19,867 | |
| |
Net change in unrealized appreciation (depreciation) on investments | | | (33,135,300 | ) |
| |
Net realized gain (loss) on investments and foreign currency | | | (25,657,103 | ) |
| |
| Net cash provided by operating activities | | | 14,714,981 | |
| |
| CASH FLOWS FROM FINANCING ACTIVITIES: | | | | |
| |
| Distributions | | | (26,417,963 | ) |
| |
| Reinvestment of distributions | | | 11,702,040 | |
| |
| Net cash used for financing activities | | | (14,715,923 | ) |
| |
| INCREASE (DECREASE) IN CASH: | | | (942 | ) |
| |
| Cash and foreign currency at beginning of year | | | 639 | |
| |
| Payable to custodian for cash and foreign currency overdrawn at end of year | | $ | (303 | ) |
| |
| 34 | 2017 Annual Report to Stockholders | | THE ACCOMPANYING NOTES ARE AN INTEGRAL PART OF THESE FINANCIAL STATEMENTS |
| |
| Financial Highlights |
| This table is presented to show selected data for a share of Common Stock outstanding throughout each period, and to assist stockholders in evaluating the Fund’s performance for the periods presented. |
| | | YEARS ENDED |
| | | |
| | | 12/31/17 | | 12/31/16 | | 12/31/15 | | 12/31/14 | | 12/31/13 |
| |
| Net Asset Value, Beginning of Period | | $ | 9.63 | | | $ | 8.59 | | | $ | 11.33 | | | $ | 14.12 | | | $ | 10.93 | |
| |
| INVESTMENT OPERATIONS: | | | | | | | | | | | | | | | | | | | | |
| Net investment income (loss) | | | 0.06 | | | | 0.03 | | | | 0.03 | | | | (0.01 | ) | | | 0.01 | |
| |
| Net realized and unrealized gain (loss) on investments and foreign currency | | | 1.52 | | | | 1.70 | | | | (1.42 | ) | | | 0.25 | | | | 4.64 | |
| |
| Net increase (decrease) in net assets from investment operations | | | 1.58 | | | | 1.73 | | | | (1.39 | ) | | | 0.24 | | | | 4.65 | |
| |
| DISTRIBUTIONS TO COMMON STOCKHOLDERS: | | | | | | | | | | | | | | | | | | | | |
| Net investment income | | | (0.06 | ) | | | (0.08 | ) | | | (0.01 | ) | | | (0.04 | ) | | | (0.03 | ) |
| |
| Net realized gain on investments and foreign currency | | | (0.63 | ) | | | (0.56 | ) | | | (1.25 | ) | | | (2.86 | ) | | | (1.35 | ) |
| |
| Total distributions to Common Stockholders | | | (0.69 | ) | | | (0.64 | ) | | | (1.26 | ) | | | (2.90 | ) | | | (1.38 | ) |
| |
| CAPITAL STOCK TRANSACTIONS: | | | | | | | | | | | | | | | | | | | | |
| Effect of reinvestment of distributions by Common Stockholders | | | (0.04 | ) | | | (0.05 | ) | | | (0.09 | ) | | | (0.13 | ) | | | (0.08 | ) |
| |
| Total capital stock transactions | | | (0.04 | ) | | | (0.05 | ) | | | (0.09 | ) | | | (0.13 | ) | | | (0.08 | ) |
| |
| Net Asset Value, End of Period | | $ | 10.48 | | | $ | 9.63 | | | $ | 8.59 | | | $ | 11.33 | | | $ | 14.12 | |
| |
| Market Value, End of Period | | $ | 9.44 | | | $ | 8.16 | | | $ | 7.26 | | | $ | 10.08 | | | $ | 12.61 | |
| |
| TOTAL RETURN:1 | | | | | | | | | | | | | | | | | | | | |
| Net Asset Value | | | 17.67 | % | | | 21.98 | % | | | (11.64 | )% | | | 3.46 | % | | | 44.66 | % |
| |
| Market Value | | | 25.09 | % | | | 22.30 | % | | | (16.06 | )% | | | 3.06 | % | | | 49.42 | % |
| |
| RATIOS BASED ON AVERAGE NET ASSETS: | | | | | | | | | | | | | | | | | | | | |
| Investment advisory fee expense2 | | | 0.49 | % | | | 0.87 | % | | | 0.93 | % | | | 0.93 | % | | | 0.82 | % |
| |
| Other operating expenses | | | 0.40 | % | | | 0.39 | % | | | 0.35 | % | | | 0.25 | % | | | 0.29 | % |
| |
| Total expenses (net) | | | 0.89 | % | | | 1.26 | % | | | 1.28 | % | | | 1.18 | % | | | 1.11 | % |
| |
| Expenses net of fee waivers and excluding interest expense | | | 0.62 | % | | | 1.02 | % | | | 1.08 | % | | | 1.05 | % | | | 0.96 | % |
| |
| Expenses prior to fee waivers and balance credits | | | 0.89 | % | | | 1.26 | % | | | 1.28 | % | | | 1.18 | % | | | 1.11 | % |
| |
| Expenses prior to fee waivers | | | 0.89 | % | | | 1.26 | % | | | 1.28 | % | | | 1.18 | % | | | 1.11 | % |
| |
| Net investment income (loss) | | | 0.56 | % | | | 0.32 | % | | | 0.26 | % | | | (0.09 | )% | | | 0.08 | % |
| |
| SUPPLEMENTAL DATA: | | | | | | | | | | | | | | | | | | | | |
| Net Assets, End of Period (in thousands) | | $ | 409,905 | | | $ | 363,701 | | | $ | 312,407 | | | $ | 387,488 | | | $ | 433,121 | |
| |
| Portfolio Turnover Rate | | | 15 | % | | | 26 | % | | | 39 | % | | | 41 | % | | | 29 | % |
| |
| REVOLVING CREDIT AGREEMENT: | | | | | | | | | | | | | | | | | | | | |
| Asset coverage | | | 1011 | % | | | 908 | % | | | 794 | % | | | 746 | % | | | 1062 | % |
| |
| Asset coverage per $1,000 | | $ | 10,109 | | | $ | 9,082 | | | $ | 7,942 | | | $ | 7,458 | | | $ | 10,625 | |
| |
| 1 | The Market Value Total Return is calculated assuming a purchase of Common Stock on the opening of the first business day and a sale on the closing of the last business day of each period. Dividends and distributions are assumed for the purposes of this calculation to be reinvested at prices obtained under the Fund’s Distribution Reinvestment and Cash Purchase Plan. Net Asset Value Total Return is calculated on the same basis, except that the Fund’s net asset value is used on the purchase and sale dates instead of market value. |
| 2 | The investment advisory fee is calculated based on average net assets over a rolling 36-month basis, while the above ratios of investment advisory fee expenses are based on the average net assets over a 12-month basis. |
| THE ACCOMPANYING NOTES ARE AN INTEGRAL PART OF THESE FINANCIAL STATEMENTS | | 2017 Annual Report to Stockholders | 35 |
Royce Micro-Cap Trust
Notes to Financial Statements
| Summary of Significant Accounting Policies |
Royce Micro-Cap Trust, Inc. (the “Fund”), is a diversified closed-end investment company that was incorporated under the laws of the State of Maryland on September 9, 1993. The Fund commenced operations on December 14, 1993. |
The preparation of financial statements in conformity with accounting principles generally accepted in the United States of America requires management to make estimates and assumptions that affect the reported amounts of assets and liabilities and the disclosure of contingent assets and liabilities at the date of the financial statements and the reported amounts of income and expenses during the reporting period. Actual results could differ from those estimates. |
The Fund is an investment company and accordingly follows the investment company accounting and reporting guidance of the Financial Accounting Standards Board (FASB) Accounting Standard Codification Topic 946 “Financial Services-Investment Companies”. |
| |
| VALUATION OF INVESTMENTS: |
Securities are valued as of the close of trading on the New York Stock Exchange (NYSE) (generally 4:00 p.m. Eastern time) on the valuation date. Securities that trade on an exchange, and securities traded on Nasdaq's Electronic Bulletin Board, are valued at their last reported sales price or Nasdaq official closing price taken from the primary market in which each security trades or, if no sale is reported for such day, at their highest bid price. Other over-the-counter securities for which market quotations are readily available are valued at their highest bid price, except in the case of some bonds and other fixed income securities which may be valued by reference to other securities with comparable ratings, interest rates and maturities, using established independent pricing services. The Fund values its non-U.S. dollar denominated securities in U.S. dollars daily at the prevailing foreign currency exchange rates as quoted by a major bank. Securities for which market quotations are not readily available are valued at their fair value in accordance with the provisions of the 1940 Act, under procedures approved by the Fund's Board of Directors, and are reported as Level 3 securities. As a general principle, the fair value of a security is the amount which the Fund might reasonably expect to receive for the security upon its current sale. However, in light of the judgment involved in fair valuations, there can be no assurance that a fair value assigned to a particular security will be the amount which the Fund might be able to receive upon its current sale. In addition, if, between the time trading ends on a particular security and the close of the customary trading session on the NYSE, events occur that are significant and may make the closing price unreliable, the Fund may fair value the security. The Fund uses an independent pricing service to provide fair value estimates for relevant non-U.S. equity securities on days when the U.S. market volatility exceeds a certain threshold. This pricing service uses proprietary correlations it has developed between the movement of prices of non-U.S. equity securities and indices of U.S.-traded securities, futures contracts and other indications to estimate the fair value of relevant non-U.S. securities. When fair value pricing is employed, the prices of securities used by the Fund may differ from quoted or published prices for the same security. Investments in money market funds are valued at net asset value per share. |
Various inputs are used in determining the value of the Fund’s investments, as noted above. These inputs are summarized in the three broad levels below: |
| | Level 1 | – | quoted prices in active markets for identical securities. |
| | Level 2 | – | other significant observable inputs (including quoted prices for similar securities, foreign securities that may be fair valued and repurchase agreements). The table below includes all Level 2 securities. Level 2 securities with values based on quoted prices for similar securities are noted in the Schedule of Investments. |
| | Level 3 | – | significant unobservable inputs (including last trade price before trading was suspended, or at a discount thereto for lack of marketability or otherwise, market price information regarding other securities, information received from the company and/or published documents, including SEC filings and financial statements, or other publicly available information). |
The inputs or methodology used for valuing securities are not necessarily an indication of the risk associated with investing in those securities. |
The following is a summary of the inputs used to value the Fund’s investments as of December 31, 2017. For a detailed breakout of common stocks by sector classification, please refer to the Schedule of Investments. |
| | | | | | | | | | | | | | | | | |
| | | LEVEL 1 | | LEVEL 2 | | LEVEL 3 | | TOTAL | |
| |
| Common Stocks | | | $394,133,310 | | | | $28,040,352 | | | | $241,800 | | | | $422,415,462 | |
| |
| Cash Equivalents | | | – | | | | 31,430,000 | | | | – | | | | 31,430,000 | |
| |
Certain securities have transferred in and out of Level 1 and Level 2 measurements during the reporting period. The Fund recognizes transfers between levels as of the end of the reporting period. For the year ended December 31, 2017, securities valued at $2,092,392 were transferred from Level 1 to Level 2 and securities valued at $1,403,688 were transferred from Level 2 to Level 1 within the fair value hierarchy. |
36 | 2017 Annual Report to Stockholders
Royce Micro-Cap Trust
Notes to Financial Statements (continued)
VALUATION OF INVESTMENTS (continued):
| Level 3 Reconciliation: |
| | | | | | | |
| | BALANCE AS OF 12/31/16 | PURCHASES | SALES | REALIZED GAIN (LOSS) | UNREALIZED GAIN (LOSS)1 | BALANCE AS OF 12/31/17 |
| |
| Common Stocks | $241,862 | $0 | $102 | $51 | $(11) | $241,800 |
| |
| 1 | The net change in unrealized appreciation (depreciation) is included in the accompanying Statement of Operations. Change in unrealized appreciation (depreciation) includes net unrealized appreciation (depreciation) resulting from changes in investment values during the reporting period and the reversal of previously recorded unrealized appreciation (depreciation) when gains or losses are realized. Net realized gain (loss) from investments and foreign currency transactions is included in the accompanying Statement of Operations. |
The following table summarizes the valuation techniques used and unobservable inputs approved by the Valuation Committee to determine the fair value of certain Level 3 investments. The table does not include Level 3 investments with values derived utilizing prices from prior transactions or third party pricing information with adjustments (e.g. broker quotes, pricing services, net asset values).
| | | | FAIR VALUE AT | | | | | | | | | | | | IMPACT TO VALUATION FROM |
| | | | 12/31/17 | | | VALUATION TECHNIQUE(S) | | | UNOBSERVABLE INPUT(S) | | | RANGE AVERAGE | | | AN INCREASE IN INPUT1 |
| |
| Common Stocks | | | $241,800 | | | Discounted Present Value
Balance Sheet Analysis | | | Liquidity Discount | | | 30%-40% | | | Decrease |
| |
| 1 | This column represents the directional change in the fair value of the Level 3 investments that would result in an increase from the corresponding unobservable input. A decrease to the unobservable input would have the opposite effect. Significant increases and decreases in these unobservable inputs in isolation could result in significantly higher or lower fair value measurements. |
| REPURCHASE AGREEMENTS: |
The Fund may enter into repurchase agreements with institutions that the Fund’s investment adviser has determined are creditworthy. The Fund restricts repurchase agreements to maturities of no more than seven days. Securities pledged as collateral for repurchase agreements, which are held until maturity of the repurchase agreements, are marked-to-market daily and maintained at a value at least equal to the principal amount of the repurchase agreement (including accrued interest). Repurchase agreements could involve certain risks in the event of default or insolvency of the counter-party, including possible delays or restrictions upon the ability of the Fund to dispose of its underlying securities. The remaining contractual maturity of the repurchase agreement held by the Fund at December 31, 2017 is overnight and continuous. |
| |
| FOREIGN CURRENCY: |
Net realized foreign exchange gains or losses arise from sales and maturities of short-term securities, sales of foreign currencies, expiration of currency forward contracts, currency gains or losses realized between the trade and settlement dates on securities transactions, and the difference between the amounts of dividends, interest, and foreign withholding taxes recorded on the Fund's books and the U.S. dollar equivalent of the amounts actually received or paid. Net unrealized foreign exchange gains and losses arise from changes in the value of assets and liabilities, including investments in securities at the end of the reporting period, as a result of changes in foreign currency exchange rates. |
| |
| TAXES: |
As a qualified regulated investment company under Subchapter M of the Internal Revenue Code, the Fund is not subject to income taxes to the extent that it distributes substantially all of its taxable income for its fiscal year. The Schedule of Investments includes information regarding income taxes under the caption “Tax Information”. |
| |
| DISTRIBUTIONS: |
The Fund pays quarterly distributions on the Fund’s Common Stock at the annual rate of 7% of the rolling average of the prior four calendar quarter-end NAVs of the Fund’s Common Stock, with the fourth quarter distribution being the greater of 1.75% of the rolling average or the distribution required by IRS regulations. Distributions to Common Stockholders are recorded on ex-dividend date. To the extent that distributions are not paid from long-term capital gains, net investment income or net short-term capital gains, they will represent a return of capital. Distributions are determined in accordance with income tax regulations that may differ from accounting principles generally accepted in the United States of America. Permanent book and tax differences relating to stockholder distributions will result in reclassifications within the capital accounts. Undistributed net investment income may include temporary book and tax basis differences, which will reverse in a subsequent period. Any taxable income or gain remaining undistributed at fiscal year end is distributed in the following year. |
2017 Annual Report to Stockholders | 37
Royce Micro-Cap Trust
Notes to Financial Statements (continued)
| INVESTMENT TRANSACTIONS AND RELATED INVESTMENT INCOME: |
Investment transactions are accounted for on the trade date. Dividend income is recorded on the ex-dividend date. Non-cash dividend income is recorded at the fair market value of the securities received. Interest income is recorded on an accrual basis. Premiums and discounts on debt securities are amortized using the effective yield-to-maturity method. Realized gains and losses from investment transactions are determined on the basis of identified cost for book and tax purposes. |
| |
| EXPENSES: |
The Fund incurs direct and indirect expenses. Expenses directly attributable to the Fund are charged to the Fund’s operations, while expenses applicable to more than one of the Royce Funds are allocated equitably. Certain personnel, occupancy costs and other administrative expenses related to the Funds are allocated by Royce & Associates (“Royce”) under an administration agreement and are included in administrative and office facilities and professional fees. The Fund has adopted a deferred fee agreement that allows the Directors to defer the receipt of all or a portion of directors’ fees otherwise payable. The deferred fees are invested in certain Royce Funds until distributed in accordance with the agreement. |
| |
| COMPENSATING BALANCE CREDITS: |
The Fund has an arrangement with its custodian bank, whereby a portion of the custodian's fee is paid indirectly by credits earned on the Fund's cash on deposit with the bank. This deposit arrangement is an alternative to purchasing overnight investments. Conversely, the Fund pays interest to the custodian on any cash overdrafts, to the extent they are not offset by credits earned on positive cash balances. |
| |
| Capital Stock: |
The Fund issued 1,336,310 and 1,405,544 shares of Common Stock as reinvestment of distributions for the years ended December 31, 2017 and December 31, 2016, respectively. |
| |
| Borrowings: |
The Fund is party to a revolving credit agreement (the credit agreement) with BNP Paribas Prime Brokerage International, Limited (BNPPI). The Fund pays a commitment fee of 0.50% per annum on the unused portion of the credit agreement. The credit agreement has a 360-day rolling term that resets daily; however, if the Fund exceeds certain net asset value triggers, the credit agreement may convert to a 60-day rolling term that resets daily. The Fund is required to pledge portfolio securities as collateral in an amount up to two times the loan balance outstanding or as otherwise required by applicable regulatory standards and has granted a security interest in the securities pledged to, and in favor of, BNPPI as security for the loan balance outstanding. If the Fund fails to meet certain requirements, or maintain other financial covenants required under the credit agreement, the Fund may be required to repay immediately, in part or in full, the loan balance outstanding under the credit agreement which may necessitate the sale of portfolio securities at potentially inopportune times. BNPPI may terminate the credit agreement upon certain ratings downgrades of its corporate parent, which would result in the Fund’s entire loan balance becoming immediately due and payable. The occurrence of such ratings downgrades may necessitate the sale of portfolio securities at potentially inopportune times. The credit agreement also permits, subject to certain conditions, BNPPI to rehypothecate portfolio securities pledged by the Fund up to the amount of the loan balance outstanding. The Fund continues to receive payments in lieu of dividends and interest on rehypothecated securities. The Fund also has the right under the credit agreement to recall the rehypothecated securities from BNPPI on demand. If BNPPI fails to deliver the recalled security in a timely manner, the Fund is compensated by BNPPI for any fees or losses related to the failed delivery or, in the event a recalled security is not returned by BNPPI, the Fund, upon notice to BNPPI, may reduce the loan balance outstanding by the value of the recalled security failed to be returned. The Fund receives a portion of the fees earned by BNPPI in connection with the rehypothecation of portfolio securities. |
As of December 31, 2017, the Fund has outstanding borrowings of $45,000,000. During the year ended December 31, 2017, the Fund borrowed an average daily balance of $45,000,000 at a weighted average borrowing cost of 2.21%. The maximum amount outstanding during the year ended December 31, 2017 was $45,000,000. As of December 31, 2017, the aggregate value of rehypothecated securities was $42,559,647. During the year ended December 31, 2017, the Fund earned $105,571 in fees from rehypothecated securities. |
| |
| Investment Advisory Agreement: |
As compensation for its services under the investment advisory agreement, Royce receives a fee comprised of a Basic Fee (“Basic Fee”) and an adjustment to the Basic Fee based on the investment performance of the Fund in relation to the investment record of the Russell 2000. |
38 | 2017 Annual Report to Stockholders
Royce Micro-Cap Trust
Notes to Financial Statements (continued)
| Investment Advisory Agreement (continued): |
The Basic Fee is a monthly fee equal to 1/12 of 1% (1% on an annualized basis) of the average of the Fund’s month-end net assets for the rolling 36-month period ending with such month (the “performance period”). The Basic Fee for each month is increased or decreased at the rate of 1/12 of .05% for each percentage point that the investment performance of the Fund exceeds, or is exceeded by, the percentage change in the investment record of the Russell 2000 for the performance period by more than two percentage points. The performance period for each such month is a rolling 36-month period ending with such month. The maximum increase or decrease in the Basic Fee for any month may not exceed 1/12 of .5%. Accordingly, for each month, the maximum monthly fee rate as adjusted for performance is 1/12 of 1.5% and is payable if the investment performance of the Fund exceeds the percentage change in the investment record of the Russell 2000 by 12 or more percentage points for the performance period, and the minimum monthly fee rate as adjusted for performance is 1/12 of .5% and is payable if the percentage change in the investment record of the Russell 2000 exceeds the investment performance of the Fund by 12 or more percentage points for the performance period. |
For the twelve rolling 36-month periods in 2017, the Fund’s investment performance ranged from 10% to 16% below the investment performance of the Russell 2000. Accordingly, the net investment advisory fee consisted of a Basic Fee of $3,580,381 and a net downward adjustment of $1,731,131 for the performance of the Fund relative to that of the Russell 2000. For the year ended December 31, 2017, the Fund expensed Royce investment advisory fees totaling $1,849,250. |
| |
| Purchases and Sales of Investment Securities: |
For the year ended December 31, 2017, the costs of purchases and proceeds from sales of investment securities, other than short-term securities, amounted to $60,777,855 and $60,339,949, respectively. |
Cross trades were executed by the Fund pursuant to Rule 17a-7 under the 1940 Act. Cross trading is the buying or selling of portfolio securities between funds to which Royce serves as investment adviser. At its regularly scheduled quarterly meetings, the Board reviews such transactions as of the most recent calendar quarter for compliance with the requirements and restrictions set forth by Rule 17a-7. Cross trades for the year ended December 31, 2017, were as follows: |
| COST OF PURCHASES | | | PROCEEDS FROM SALES | | | REALIZED GAIN (LOSS) |
| |
| $4,400,725 | | | $ – | | | $ – |
| |
| Tax Information: |
Distributions during the years ended December 31, 2017 and 2016, were characterized as follows for tax purposes: |
| ORDINARY INCOME | | | | LONG-TERM CAPITAL GAINS |
| |
| 2017 | | | 2016 | | | | 2017 | | | 2016 |
| |
| $5,516,070 | | | $5,291,974 | | | | $20,901,893 | | | $18,332,912 |
| |
The tax basis components of distributable earnings at December 31, 2017, were as follows:
| | | | | | | | | | QUALIFIED LATE YEAR | | | |
| UNDISTRIBUTED | | | UNDISTRIBUTED LONG-TERM | | | NET UNREALIZED | | | ORDINARY AND | | | TOTAL |
| ORDINARY | | | CAPITAL GAINS OR | | | APPRECIATION | | | POST-OCTOBER LOSS | | | DISTRIBUTABLE |
| INCOME | | | (CAPITAL LOSS CARRYFORWARD) | | | (DEPRECIATION)1 | | | DEFERRALS2 | | | EARNINGS |
| |
| $1,570,241 | | | $1,469,231 | | | $77,960,546 | | | $(213,775) | | | $80,786,243 |
| |
| 1 | Includes timing differences on foreign currency, recognition of losses on securities sold, investments in publicly traded partnerships and Trusts and mark-to-market of Passive Foreign Investment Companies. |
| 2 | Under the current tax law, capital losses and qualified late year ordinary losses incurred after October 31 may be deferred and treated as occurring on the first day of the following fiscal year. This column also includes passive activity losses. |
For financial reporting purposes, capital accounts and distributions to stockholders are adjusted to reflect the tax character of permanent book/tax differences. For the year ended December 31, 2017, the Fund recorded the following permanent reclassifications, which relate primarily to current investments in publicly traded partnerships and Trusts, foreign currency transactions, investments in Real Estate Investment Trusts and gains from the sale of Passive Foreign Investment Companies. Results of operations and net assets were not affected by these reclassifications.
| UNDISTRIBUTED NET | | | ACCUMULATED NET | | | |
| INVESTMENT INCOME | | | REALIZED GAIN (LOSS) | | | PAID-IN CAPITAL |
| |
| $1,141,360 | | | $(1,141,357) | | | $ (3) |
| |
Management has analyzed the Fund’s tax positions taken on federal income tax returns for all open tax years (2014-2017) and has concluded that as of December 31, 2017, no provision for income tax is required in the Fund’s financial statements.
2017 Annual Report to Stockholders | 39
Report of Independent Registered Public Accounting Firm
To the Board of Directors and the Stockholders of Royce Micro-Cap Trust, Inc.:
Opinion on the Financial Statements
We have audited the accompanying statement of assets and liabilities, including the schedule of investments, of Royce Micro-Cap Trust, Inc. (the “Fund”) as of December 31, 2017, the related statements of operations and cash flows for the year ended December 31, 2017, the statement of changes in net assets for each of the two years in the period ended December 31, 2017, including the related notes, and the financial highlights for each of the three years in the period ended December 31, 2017 (collectively referred to as the “financial statements”). In our opinion, the financial statements present fairly, in all material respects, the financial position of the Fund as of December 31, 2017, the results of its operations and its cash flows for the year then ended, the changes in its net assets for each of the two years in the period ended December 31, 2017 and the financial highlights for each of the three years in the period ended December 31, 2017 in conformity with accounting principles generally accepted in the United States of America.
The financial statements of the Fund as of and for the year ended December 31, 2014 and the financial highlights for each of the periods ended on or prior to December 31, 2014 (not presented herein, other than the financial highlights) were audited by other auditors whose report dated February 23, 2015 expressed an unqualified opinion on those financial statements and financial highlights.
Basis for Opinion
These financial statements are the responsibility of the Fund’s management. Our responsibility is to express an opinion on the Fund’s financial statements based on our audits. We are a public accounting firm registered with the Public Company Accounting Oversight Board (United States) (“PCAOB”) and are required to be independent with respect to the Fund in accordance with the U.S. federal securities laws and the applicable rules and regulations of the Securities and Exchange Commission and the PCAOB.
We conducted our audits of these financial statements in accordance with the standards of the PCAOB. Those standards require that we plan and perform the audit to obtain reasonable assurance about whether the financial statements are free of material misstatement, whether due to error or fraud.
Our audits included performing procedures to assess the risks of material misstatement of the financial statements, whether due to error or fraud, and performing procedures that respond to those risks. Such procedures included examining, on a test basis, evidence regarding the amounts and disclosures in the financial statements. Our audits also included evaluating the accounting principles used and significant estimates made by management, as well as evaluating the overall presentation of the financial statements. Our procedures included confirmation of securities owned as of December 31, 2017 by correspondence with the custodian and brokers; when replies were not received from brokers, we performed other auditing procedures. We believe that our audits provide a reasonable basis for our opinion.
/s/PricewaterhouseCoopers LLP
Baltimore, MD
February 22, 2018
We have served as the auditor of one or more investment companies in the Royce investment company group since at least 1967. We have not determined the specific year we began serving as auditor.
40 | 2017 Annual Report to Stockholders
This page is intentionally left blank.
2017 Annual Report to Stockholders | 41
| | | MANAGERS’ DISCUSSION |
| Royce Value Trust (RVT) | | |
 |
Chuck Royce
Chris Flynn
Lauren Romeo, CFA |
FUND PERFORMANCE
With a second consecutive year of strong absolute and relative performance, Royce Value Trust further solidified long-term advantages over its unleveraged small-cap benchmark, the Russell 2000 Index, outperforming on both a net asset value (“NAV”) and market price basis for the one-, three-, 20-, 25-, 30-year, and since inception (11/26/86) periods ended December 31, 2017. The Fund advanced 19.4% on an NAV basis and 30.5% based on market price in 2017, ahead of respective gains of 14.6% and 13.2% for the Russell 2000 and S&P SmallCap 600 for the same period. The year presented crosscurrents for the Fund’s multi-discipline approach in the form of leadership for growth stocks and the lift from strength for cyclicals, in particular those with global exposure. |
| |
| WHAT WORKED... AND WHAT DIDN’T |
Nine of the Fund’s 11 equity sectors made positive contributions to 2017 performance. Industrials and Information Technology—the portfolio’s two largest sectors—led by a wide margin, followed by solid net gains for Financials while Energy and Consumer Discretionary made only modest negative impacts. Relative to the Russell 2000, the best performance in 2017 came from Financials, where both our lighter weighting in banks and (to a lesser degree) heavier investment in capital markets companies were additive against the benchmark. Savvy stock selection in both Information Technology and Industrials was another important source of outperformance. Conversely, the largest relative detraction at the sector level came from our lower weighting in Health Care—the best-performing sector in the Russell 2000 in 2017—and ineffective stock selection in Consumer Discretionary. The portfolio’s cash position also had a negative impact on relative performance. At the industry level, the largest contribution by far on an absolute basis came from electronic equipment, instruments & components (Information Technology), followed by machinery (Industrials), each from one of the Fund’s leading sectors, while the largest detractors, energy equipment & services (Energy) and Internet & direct marketing retail (Consumer Discretionary), came from its two worst.
For many years, the portfolio has invested heavily in companies that increase productivity or otherwise help business operate faster, cheaper, and more effectively. This ‘picks and shovels’ approach often leads us to industrial and technology companies with very interesting—and in many cases ultimately profitable—niche businesses. Over the last few years, there has been a significant amount of innovation in areas such as process automation, robotics, lasers, cloud storage, etc.—all of which need equipment, components, and related technology. This has led us to invest in several companies that specialize in process automation or other innovative ways that boost productivity. Moreover, the long-term outlook for select companies in these areas looks very promising to us as the current global technology build-out continues. It was no surprise, then, that three of the portfolio’s five top-contributing stocks in 2017 were technology stocks while a fourth came from the Industrials sector. |
| The Fund’s two top contributors exemplify our goal for these kinds of companies. Laser diode and equipment maker Coherent saw its shares climb thanks to a record-setting fiscal 2017, which saw sales and earnings growth driven by increasing demand for ramped up OLED (organic light-emitting diode) capacity and service. Cognex Corporation is the market leader in machine vision technology, which captures and analyzes visual information to automate tasks that previously relied on human eyesight and is thus a major driver of industrial and process automation. The firm has just begun to move into key end markets, such as consumer electronics, while adoption is expanding to other industries, including a fast-growing logistics segment. With ever-evolving proprietary technology and an unmatched global corps of engineers serving customers, the firm looks poised to sustain its well-above-average ROIC and compound its business value into the future. |
| As for positions that detracted, we believe the new management team at Wesco Aircraft Holdings is well positioned to address the firm’s operational issues and eventually improve results. The situation is essentially a turnaround in waiting, and we built our position significantly in the fourth quarter. We held steady with our stake in FTD Companies, which provides flowers and other gifts through various subsidiaries. Disappointing sales and revenues were addressed with some changes in upper management that we think could help business to bloom. |
| | Top Contributors to Performance
For 2017 (%)1 | | | |
| | | |
| Coherent | | 1.22 |
| |
| Cognex Corporation | | 0.99 |
| |
| Ash Grove Cement Cl. B | | 0.94 |
| |
| IPG Photonics | | 0.53 |
| |
| Sun Hydraulics | | 0.53 |
| |
| 1 Includes dividends | | |
| | Top Detractors from Performance
For 2017 (%)2 | | | |
| | | |
| Wesco Aircraft Holdings | | -0.39 |
| |
| FTD Companies | | -0.38 |
| |
| Era Group | | -0.27 |
| |
| MBIA | | -0.23 |
| |
| Core-Mark Holding Company | | -0.22 |
| |
| 2 Net of dividends | | |
| CURRENT POSITIONING AND OUTLOOK |
| While we are cautious about the prospects for small-cap returns as a whole, we are also optimistic about the portfolio’s return potential as it leans towards three factors that we believe will be rewarded going forward—economically sensitive cyclicals, global exposure, and—in many cases—high profitability. These are the select qualities that we anticipate will drive small-cap leadership. In this environment, we see the opportunity for the Fund to continue outperforming in the years ahead. |
| 42 | 2017 Annual Report to Stockholders | |
| PERFORMANCE AND PORTFOLIO REVIEW | SYMBOLS MARKET PRICE RVT NAV XRVTX |
|
| Performance | | | | | | | | | | | | | | | | | |
| Average Annual Total Return (%) Through 12/31/17 | | | | | | | | | |
| | | JUL-DEC 20171 | | 1-YR | | 3-YR | | 5-YR | | 10-YR | | 15-YR | | 20-YR | | 25-YR | | 30-YR | | SINCE INCEPTION (11/26/86) |
|
| RVT (NAV) | | 11.27 | | 19.38 | | 11.63 | | 13.47 | | 7.18 | | 10.79 | | 9.45 | | 10.73 | | 11.53 | | 10.83 |
| |
| 1 Not Annualized | | | | | | | | | | | | | | | |
|
| Market Price Performance History Since Inception (11/26/86) |
| Cumulative Performance of Investment through 12/31/171 | | | | | | | | |
| | | 1-YR | | 5-YR | | 10-YR | | 15-YR | | 20-YR | | SINCE INCEPTION (11/26/86) |
| |
| RVT | | 30.5% | | 99.4% | | 96.3% | | 330.5% | | 533.7% | | 2029.7% |
| |

| 1 | Reflects the cumulative performance of an investment made by a stockholder who purchased one share at inception ($10.00 IPO), reinvested all distributions and fully participated in primary subscriptions of the Fund's rights offerings. |
| 2 | Reflects the actual month-end market price movement of one share as it has traded on the NYSE. |
| | |
| |
The Morningstar Style Map is the Morningstar Style Box™ with the center 75% of fund holdings plotted as the Morningstar Ownership Zone™. The Morningstar Style Box is designed to reveal a fund’s investment strategy. The Morningstar Ownership Zone provides detail about a portfolio’s investment style by showing the range of stock sizes and styles. The Ownership Zone is derived by plotting each stock in the portfolio within the proprietary Morningstar Style Box. Over time, the shape and location of a fund's ownership zone may vary. See page 66 for additional information. |
|
| Top 10 Positions | | |
| % of Net Assets | | |
| | | |
| Ash Grove Cement | | 1.8 |
| |
| FLIR Systems | | 1.7 |
| |
| HEICO Corporation | | 1.6 |
| |
| Coherent | | 1.5 |
| |
| Cognex Corporation | | 1.4 |
| |
| Sun Hydraulics | | 1.2 |
| |
| Quaker Chemical | | 1.1 |
| |
| Copart | | 1.1 |
| |
| RBC Bearings | | 1.0 |
| |
| E-L Financial | | 1.0 |
| |
|
| Portfolio Sector Breakdown | | |
| % of Net Assets | | |
| | | |
| Industrials | | 30.3 |
| |
| Information Technology | | 20.0 |
| |
| Financials | | 14.8 |
| |
| Consumer Discretionary | | 9.6 |
| |
| Materials | | 8.2 |
| |
| Energy | | 5.2 |
| |
| Health Care | | 4.2 |
| |
| Real Estate | | 3.1 |
| |
| Consumer Staples | | 2.1 |
| |
| Telecommunication Services | | 0.6 |
| |
| Utilities | | 0.1 |
| |
| Miscellaneous | | 3.3 |
| |
| Outstanding Line of Credit, Net of Cash and Cash Equivalents | | -1.5 |
| |
|
| Calendar Year Total Returns (%) | |
| | | |
| YEAR | | RVT |
| |
| 2017 | | 19.4 |
| |
| 2016 | | 26.8 |
| |
| 2015 | | -8.1 |
| |
| 2014 | | 0.8 |
| |
| 2013 | | 34.1 |
| |
| 2012 | | 15.4 |
| |
| 2011 | | -10.1 |
| |
| 2010 | | 30.3 |
| |
| 2009 | | 44.6 |
| |
| 2008 | | -45.6 |
| |
| 2007 | | 5.0 |
| |
| 2006 | | 19.5 |
| |
| 2005 | | 8.4 |
| |
| 2004 | | 21.4 |
| |
| 2003 | | 40.8 |
| |
|
| Portfolio Diagnostics | | |
| | | |
| Fund Net Assets | | $1,480 million |
| |
| Number of Holdings | | 476 |
| |
| 2017 Annual Turnover Rate | | 19% |
| |
| Net Asset Value | | $17.50 |
| |
| Market Price | | $16.17 |
| |
| Net Leverage1 | | 1.5% |
| |
| Average Market Capitalization2 | | $1,832 million |
| |
| Weighted Average P/E Ratio3,4 | | 23.9x |
| |
| Weighted Average P/B Ratio3 | | 2.3x |
| |
| Active Share5 | | 89% |
| |
| U.S. Investments (% of Net Assets) | | 83.6% |
| |
| Non-U.S. Investments (% of Net Assets) | | 17.9% |
| |
| |
| 1 | Net leverage is the percentage, in excess of 100%, of the total value of equity type investments, divided by net assets. |
| 2 | Geometric Average. This weighted calculation uses each portfolio holding’s market cap in a way designed to not skew the effect of very large or small holdings; instead, it aims to better identify the portfolio’s center, which Royce believes offers a more accurate measure of average market cap than a simple mean or median. |
| 3 | Harmonic Average. This weighted calculation evaluates a portfolio as if it were a single stock and measures it overall. It compares the total market value of the portfolio to the portfolio’s share in the earnings or book value, as the case may be, of its underlying stocks. |
| 4 | The Fund’s P/E ratio calculation excludes companies with zero or negative earnings (15% of portfolio holdings as of 12/31/17). |
| 5 | Active Share is the sum of the absolute values of the different weightings of each holding in the Fund versus each holding in the benchmark, divided by two. |
Important Performance and Risk Information
All performance information reflects past performance, is presented on a total return basis, net of the Fund’s investment advisory fee, and reflects the reinvestment of distributions. Past performance is no guarantee of future results. Current performance may be higher or lower than performance quoted. Returns as of the most recent month-end may be obtained at www.roycefunds.com. Certain immaterial adjustments were made to the net assets of Royce Value Trust at 12/31/16 for financial reporting purposes, and as a result the net asset value originally calculated on that date and the total return based on that net asset value differs from the adjusted net asset value and total return reported in the Financial Highlights. The market price of the Fund’s shares will fluctuate, so that shares may be worth more or less than their original cost when sold. The Fund invests primarily in securities of small- and micro-cap companies, which may involve considerably more risk than investing in larger-cap companies. The Fund’s broadly diversified portfolio does not ensure a profit or guarantee against loss. Regarding the “Top Contributors” and “Top Detractors” tables shown above, the sum of all contributors to, and all detractors from, performance for all securities in the portfolio would approximate the Fund’s year-to date performance for 2017. |
| | | 2017 Annual Report to Stockholders | 43 |
| |
| Schedule of Investments |
| Common Stocks – 101.5% |
| | | SHARES | | | VALUE | |
| |
| | | | | | | | |
| CONSUMER DISCRETIONARY– 9.6% | | | | | | | |
| AUTO COMPONENTS - 1.0% | | | | | | | |
Cooper Tire & Rubber | | 30,800 | | | $ | 1,088,780 | |
Dorman Products 1 | | 4,300 | | | | 262,902 | |
Gentex Corporation | | 210,270 | | | | 4,405,157 | |
LCI Industries | | 55,616 | | | | 7,230,080 | |
Sebang Global Battery | | 28,500 | | | | 951,985 | |
Standard Motor Products | | 13,391 | | | | 601,390 | |
| | | | | | | |
| | | | | | | 14,540,294 | |
| | | | | | | |
| AUTOMOBILES - 0.9% | | | | | | | |
Thor Industries 2 | | 87,730 | | | | 13,222,666 | |
| | | | | | | |
| DISTRIBUTORS - 0.9% | | | | | | | |
Core-Mark Holding Company | | 240,900 | | | | 7,607,622 | |
Fenix Parts 1,3 | | 255,000 | | | | 58,650 | |
LKQ Corporation 1 | | 53,500 | | | | 2,175,845 | |
Uni-Select | | 30,200 | | | | 682,564 | |
Weyco Group | | 97,992 | | | | 2,912,322 | |
| | | | | | | |
| | | | | | | 13,437,003 | |
| | | | | | | |
| DIVERSIFIED CONSUMER SERVICES - 0.6% | | | | | | | |
Adtalem Global Education 1 | | 52,054 | | | | 2,188,871 | |
American Public Education 1 | | 42,400 | | | | 1,062,120 | |
Cambium Learning Group 1 | | 70,000 | | | | 397,600 | |
Collectors Universe | | 50,000 | | | | 1,432,000 | |
H&R Block | | 8,000 | | | | 209,760 | |
Liberty Tax Cl. A | | 151,573 | | | | 1,667,303 | |
Lincoln Educational Services 1 | | 330,600 | | | | 667,812 | |
Universal Technical Institute 1 | | 504,032 | | | | 1,209,677 | |
| | | | | | | |
| | | | | | | 8,835,143 | |
| | | | | | | |
| HOTELS, RESTAURANTS & LEISURE - 0.5% | | | | | | | |
Biglari Holdings 1 | | 1,000 | | | | 414,400 | |
Century Casinos 1 | | 200,100 | | | | 1,826,913 | |
Lindblad Expeditions Holdings 1 | | 207,600 | | | | 2,032,404 | |
†Noodles & Company Cl. A 1,2,4 | | 208,721 | | | | 1,095,785 | |
Rank Group | | 400,000 | | | | 1,298,931 | |
Zoe’s Kitchen 1 | | 20,000 | | | | 334,400 | |
| | | | | | | |
| | | | | | | 7,002,833 | |
| | | | | | | |
| HOUSEHOLD DURABLES - 1.7% | | | | | | | |
AV Homes 1 | | 66,100 | | | | 1,100,565 | |
Cavco Industries 1 | | 14,700 | | | | 2,243,220 | |
Ethan Allen Interiors | | 237,600 | | | | 6,795,360 | |
Flexsteel Industries | | 13,900 | | | | 650,242 | |
Mohawk Industries 1,2,4 | | 12,400 | | | | 3,421,160 | |
Natuzzi ADR 1 | | 2,096,300 | | | | 3,354,080 | |
PICO Holdings | | 409,400 | | | | 5,240,320 | |
Samson Holding | | 2,500,000 | | | | 303,985 | |
Skyline Corporation 1 | | 55,400 | | | | 711,890 | |
Stanley Furniture 1,5 | | 912,235 | | | | 793,645 | |
| | | | | | | |
| | | | | | | 24,614,467 | |
| | | | | | | |
| INTERNET & DIRECT MARKETING RETAIL - 0.1% | | | | | | | |
CafePress 1 | | 110,000 | | | | 202,400 | |
FTD Companies 1 | | 298,014 | | | | 2,142,721 | |
| | | | | | | |
| | | | | | | 2,345,121 | |
| | | | | | | |
| LEISURE PRODUCTS - 0.7% | | | | | | | |
Character Group | | 91,500 | | | | 549,331 | |
MCBC Holdings 1 | | 85,500 | | | | 1,899,810 | |
Nautilus 1 | | 599,400 | | | | 8,001,990 | |
| | | | | | | |
| | | | | | | 10,451,131 | |
| | | | | | | |
| MEDIA - 0.5% | | | | | | | |
E.W. Scripps Company Cl. A 1,2,4 | | 68,660 | | | | 1,073,156 | |
Entravision Communications Cl. A | | 108,200 | | | | 773,630 | |
Global Eagle Entertainment 1 | | 110,000 | | | | 251,900 | |
Gray Television 1 | | 50,000 | | | | 837,500 | |
Meredith Corporation | | 32,800 | | | | 2,166,440 | |
New Media Investment Group | | 60,100 | | | | 1,008,478 | |
Pico Far East Holdings | | 2,734,400 | | | | 1,084,956 | |
T4F Entretenimento | | 150,000 | | | | 331,414 | |
Technicolor | | 120,000 | | | | 411,590 | |
| | | | | | | |
| | | | | | | 7,939,064 | |
| | | | | | | |
| MULTILINE RETAIL - 0.0% | | | | | | | |
New World Department Store China 1 | | 1,447,500 | | | | 307,337 | |
| | | | | | | |
| SPECIALTY RETAIL - 1.5% | | | | | | | |
AutoCanada | | 94,000 | | | | 1,693,047 | |
Barnes & Noble | | 67,000 | | | | 448,900 | |
Barnes & Noble Education 1 | | 20,000 | | | | 164,800 | |
Byggmax Group | | 100,000 | | | | 669,972 | |
Caleres 2 | | 108,100 | | | | 3,619,188 | |
Children’s Place | | 17,500 | | | | 2,543,625 | |
Container Store Group (The) 1,2 | | 158,200 | | | | 749,868 | |
Destination Maternity 1 | | 557,967 | | | | 1,657,162 | |
Haverty Furniture | | 23,700 | | | | 536,805 | |
I.T | | 827,000 | | | | 352,446 | |
Monro | | 95,300 | | | | 5,427,335 | |
Oriental Watch Holdings | | 967,900 | | | | 220,434 | |
Sears Hometown and Outlet Stores 1 | | 170,039 | | | | 442,101 | |
Signet Jewelers | | 35,000 | | | | 1,979,250 | |
Topps Tiles | | 750,000 | | | | 809,287 | |
TravelCenters of America LLC 1 | | 142,500 | | | | 584,250 | |
| | | | | | | |
| | | | | | | 21,898,470 | |
| | | | | | | |
| TEXTILES, APPAREL & LUXURY GOODS - 1.2% | | | | | | | |
Crown Crafts | | 97,741 | | | | 630,429 | |
Culp | | 29,400 | | | | 984,900 | |
J.G. Boswell Company 3 | | 3,940 | | | | 2,793,460 | |
Movado Group | | 74,271 | | | | 2,391,526 | |
Wolverine World Wide | | 298,800 | | | | 9,525,744 | |
YGM Trading | | 1,082,600 | | | | 1,025,393 | |
| | | | | | | |
| | | | | | | 17,351,452 | |
| |
| Total (Cost $127,744,145) | | | | | | 141,944,981 | |
| |
| | | | | | | | |
| CONSUMER STAPLES – 2.1% | | | | | | | |
| BEVERAGES - 0.2% | | | | | | | |
Compania Cervecerias Unidas ADR 2 | | 64,500 | | | | 1,907,910 | |
| | | | | | | |
| FOOD & STAPLES RETAILING - 0.0% | | | | | | | |
Conviviality | | 70,000 | | | | 380,751 | |
| | | | | | | |
| FOOD PRODUCTS - 1.7% | | | | | | | |
AGT Food and Ingredients | | 19,500 | | | | 311,969 | |
Cal-Maine Foods 1,2,4 | | 77,616 | | | | 3,450,031 | |
Farmer Bros. 1 | | 54,700 | | | | 1,758,605 | |
Hilton Food Group | | 70,000 | | | | 813,307 | |
Industrias Bachoco ADR | | 40,795 | | | | 2,337,554 | |
John B. Sanfilippo & Son | | 17,200 | | | | 1,087,900 | |
Lancaster Colony | | 13,400 | | | | 1,731,414 | |
Sanderson Farms | | 2,900 | | | | 402,462 | |
Seneca Foods Cl. A 1 | | 159,892 | | | | 4,916,679 | |
Seneca Foods Cl. B 1 | | 13,840 | | | | 470,560 | |
SunOpta 1,2,4 | | 187,459 | | | | 1,452,807 | |
Tootsie Roll Industries 2 | | 160,708 | | | | 5,849,771 | |
| | | | | | | |
| | | | | | | 24,583,059 | |
| | | | | | | |
| 44 | 2017 Annual Report to Stockholders | | THE ACCOMPANYING NOTES ARE AN INTEGRAL PART OF THESE FINANCIAL STATEMENTS |
| |
| Schedule of Investments (continued) | | | | | | | |
| | | | | | | | |
| | | SHARES | | | VALUE | |
| |
| | | | | | | | |
| CONSUMER STAPLES (continued) | | | | | | | |
| HOUSEHOLD PRODUCTS - 0.0% | | | | | | | |
Central Garden & Pet 1 | | 10,300 | | | $ | 400,876 | |
| | | | | | | |
| PERSONAL PRODUCTS - 0.2% | | | | | | | |
Inter Parfums | | 71,530 | | | | 3,107,979 | |
| |
| Total (Cost $22,453,527) | | | | | | 30,380,575 | |
| |
| | | | | | | | |
| ENERGY – 5.2% | | | | | | | |
| ENERGY EQUIPMENT & SERVICES - 3.9% | | | | | | | |
CARBO Ceramics 1,2,4 | | 78,000 | | | | 794,040 | |
Diamond Offshore Drilling 1,2,4 | | 189,000 | | | | 3,513,510 | |
Era Group 1 | | 554,693 | | | | 5,962,950 | |
Forum Energy Technologies 1 | | 144,654 | | | | 2,249,370 | |
Frank’s International 2,4 | | 108,600 | | | | 722,190 | |
Helmerich & Payne 2 | | 89,000 | | | | 5,752,960 | |
ION Geophysical 1,2,4 | | 71,880 | | | | 1,419,630 | |
Oil States International 1 | | 57,133 | | | | 1,616,864 | |
Pason Systems | | 543,580 | | | | 7,866,126 | |
Pioneer Energy Services 1 | | 164,500 | | | | 501,725 | |
Precision Drilling 1 | | 93,900 | | | | 283,578 | |
SEACOR Holdings | | 150,469 | | | | 6,954,677 | |
†SEACOR Marine Holdings 1 | | 638,834 | | | | 7,474,358 | |
TGS-NOPEC Geophysical | | 417,170 | | | | 9,868,107 | |
Trican Well Service 1 | | 944,000 | | | | 3,064,057 | |
| | | | | | | |
| | | | | | | 58,044,142 | |
| | | | | | | |
| OIL, GAS & CONSUMABLE FUELS - 1.3% | | | | | | | |
Ardmore Shipping 1 | | 75,000 | | | | 600,000 | |
Dorchester Minerals L.P. | | 262,839 | | | | 3,995,153 | |
Dorian LPG 1 | | 394,936 | | | | 3,246,374 | |
Green Plains | | 200,000 | | | | 3,370,000 | |
Hallador Energy | | 21,000 | | | | 127,890 | |
Hargreaves Services | | 57,683 | | | | 258,640 | |
New Zealand Refining | | 310,000 | | | | 581,979 | |
San Juan Basin Royalty Trust | | 320,352 | | | | 2,639,700 | |
World Fuel Services | | 110,800 | | | | 3,117,912 | |
WPX Energy 1 | | 110,000 | | | | 1,547,700 | |
| | | | | | | |
| | | | | | | 19,485,348 | |
| |
| Total (Cost $86,040,161) | | | | | | 77,529,490 | |
| |
| | | | | | | | |
| FINANCIALS – 14.8% | | | | | | | |
| BANKS - 2.5% | | | | | | | |
Banca Sistema | | 200,000 | | | | 543,626 | |
Bank of N.T. Butterfield & Son | | 178,416 | | | | 6,474,717 | |
Blue Hills Bancorp | | 54,080 | | | | 1,087,008 | |
Canadian Western Bank | | 279,500 | | | | 8,727,426 | |
Farmers & Merchants Bank of Long Beach 3 | | 1,080 | | | | 8,488,800 | |
Fauquier Bankshares | | 160,800 | | | | 3,518,304 | |
First Citizens BancShares Cl. A | | 14,676 | | | | 5,914,428 | |
Webster Financial | | 40,300 | | | | 2,263,248 | |
| | | | | | | |
| | | | | | | 37,017,557 | |
| | | | | | | |
| CAPITAL MARKETS - 8.2% | | | | | | | |
Affiliated Managers Group | | 7,000 | | | | 1,436,750 | |
Ares Management L.P. | | 366,300 | | | | 7,326,000 | |
Artisan Partners Asset Management Cl. A | | 256,000 | | | | 10,112,000 | |
ASA Gold and Precious Metals | | 199,821 | | | | 2,261,974 | |
Ashmore Group | | 1,354,000 | | | | 7,404,049 | |
Associated Capital Group Cl. A 2 | | 20,200 | | | | 688,820 | |
Citadel Capital 1 | | 7,749,921 | | | | 557,925 | |
Cowen Cl. A 1 | | 62,706 | | | | 855,937 | |
Dundee Corporation Cl. A 1 | | 1,079,900 | | | | 2,173,546 | |
Edmond de Rothschild (Suisse) | | 153 | | | | 2,901,480 | |
Federated Investors Cl. B | | 83,340 | | | | 3,006,907 | |
Gluskin Sheff + Associates | | 57,600 | | | | 762,959 | |
Houlihan Lokey Cl. A | | 69,000 | | | | 3,134,670 | |
Jupiter Fund Management | | 230,000 | | | | 1,950,559 | |
KKR & Co. L.P. | | 24,100 | | | | 507,546 | |
Lazard Cl. A | | 103,235 | | | | 5,419,838 | |
Manning & Napier Cl. A | | 395,692 | | | | 1,424,491 | |
MarketAxess Holdings | | 51,600 | | | | 10,410,300 | |
Medley Management Cl. A 2 | | 109,500 | | | | 711,750 | |
Morningstar | | 84,600 | | | | 8,203,662 | |
mutares | | 39,266 | | | | 748,929 | |
MVC Capital | | 271,183 | | | | 2,863,692 | |
Oaktree Capital Group LLC Cl. A | | 101,100 | | | | 4,256,310 | |
Rothschild & Co | | 216,893 | | | | 7,938,544 | |
SEI Investments | | 185,600 | | | | 13,337,216 | |
Sprott | | 1,927,000 | | | | 3,740,557 | |
TMX Group | | 40,700 | | | | 2,280,754 | |
U.S. Global Investors Cl. A 2 | | 520,551 | | | | 2,030,149 | |
Value Partners Group | | 5,453,000 | | | | 5,770,623 | |
Virtu Financial Cl. A 2 | | 101,200 | | | | 1,851,960 | |
Westwood Holdings Group | | 49,073 | | | | 3,249,123 | |
ZAIS Group Holdings Cl. A 1,2 | | 492,300 | | | | 1,915,047 | |
| | | | | | | |
| | | | | | | 121,234,067 | |
| | | | | | | |
| CONSUMER FINANCE - 0.1% | | | | | | | |
Bajaj Finance | | 55,000 | | | | 1,516,072 | |
Currency Exchange International 1 | | 30,000 | | | | 596,897 | |
| | | | | | | |
| | | | | | | 2,112,969 | |
| | | | | | | |
| DIVERSIFIED FINANCIAL SERVICES - 0.1% | | | | | | | |
First Pacific | | 1,020,000 | | | | 693,041 | |
Waterloo Investment Holdings 1,6 | | 2,972,000 | | | | 891,600 | |
| | | | | | | |
| | | | | | | 1,584,641 | |
| | | | | | | |
| INSURANCE - 2.6% | | | | | | | |
Alleghany Corporation 1 | | 709 | | | | 422,628 | |
Atlas Financial Holdings 1 | | 18,900 | | | | 388,395 | |
E-L Financial | | 22,500 | | | | 14,584,904 | |
Erie Indemnity Cl. A | | 25,000 | | | | 3,046,000 | |
Independence Holding Company | | 259,223 | | | | 7,115,671 | |
MBIA 1,2,4 | | 942,400 | | | | 6,898,368 | |
ProAssurance Corporation | | 17,139 | | | | 979,494 | |
RLI Corp. | | 83,100 | | | | 5,040,846 | |
WMIH 1 | | 77,742 | | | | 66,011 | |
| | | | | | | |
| | | | | | | 38,542,317 | |
| | | | | | | |
| INVESTMENT COMPANIES - 0.2% | | | | | | | |
RIT Capital Partners | | 101,400 | | | | 2,682,031 | |
| | | | | | | |
| THRIFTS & MORTGAGE FINANCE - 1.1% | | | | | | | |
BofI Holding 1,2,4 | | 16,300 | | | | 487,370 | |
Genworth MI Canada | | 216,195 | | | | 7,481,689 | |
Timberland Bancorp | | 288,857 | | | | 7,669,153 | |
Vestin Realty Mortgage II 1,3 | | 53 | | | | 121,900 | |
| | | | | | | |
| | | | | | | 15,760,112 | |
| |
| Total (Cost $169,233,211) | | | | | | 218,933,694 | |
| |
| | | | | | | | |
| HEALTH CARE – 4.2% | | | | | | | |
| BIOTECHNOLOGY - 0.8% | | | | | | | |
Keryx Biopharmaceuticals 1,2,4 | | 139,000 | | | | 646,350 | |
Novavax 1,2,4 | | 550,000 | | | | 682,000 | |
Sangamo Therapeutics 1 | | 209,315 | | | | 3,432,766 | |
| THE ACCOMPANYING NOTES ARE AN INTEGRAL PART OF THESE FINANCIAL STATEMENTS | | 2017 Annual Report to Stockholders | 45 |
| |
| Schedule of Investments (continued) | | | | | | | |
| | | | | | | | |
| | | SHARES | | | VALUE | |
| |
| | | | | | | | |
| HEALTH CARE (continued) | | | | | | | |
| BIOTECHNOLOGY (continued) | | | | | | | |
Zealand Pharma 1 | | 484,607 | | | $ | 6,633,449 | |
| | | | | | | |
| | | | | | | 11,394,565 | |
| | | | | | | |
| HEALTH CARE EQUIPMENT & SUPPLIES - 1.8% | | | | | | | |
Analogic Corporation | | 53,735 | | | | 4,500,306 | |
Atrion Corporation | | 15,750 | | | | 9,931,950 | |
DENTSPLY SIRONA | | 5,000 | | | | 329,150 | |
Hill-Rom Holdings | | 5,000 | | | | 421,450 | |
Integer Holdings 1 | | 42,400 | | | | 1,920,720 | |
Invacare Corporation | | 38,900 | | | | 655,465 | |
Masimo Corporation 1 | | 50,000 | | | | 4,240,000 | |
Neogen Corporation 1 | | 16,800 | | | | 1,381,128 | |
Surmodics 1 | | 138,500 | | | | 3,878,000 | |
| | | | | | | |
| | | | | | | 27,258,169 | |
| | | | | | | |
| HEALTH CARE PROVIDERS & SERVICES - 0.4% | | | | | | | |
Aceto Corporation | | 18,800 | | | | 194,204 | |
AMN Healthcare Services 1 | | 54,000 | | | | 2,659,500 | |
Community Health Systems 1 | | 790,000 | | | | 3,365,400 | |
| | | | | | | |
| | | | | | | 6,219,104 | |
| | | | | | | |
| HEALTH CARE TECHNOLOGY - 0.5% | | | | | | | |
†athenahealth 1,2,4 | | 32,500 | | | | 4,323,800 | |
Medidata Solutions 1 | | 50,000 | | | | 3,168,500 | |
| | | | | | | |
| | | | | | | 7,492,300 | |
| | | | | | | |
| LIFE SCIENCES TOOLS & SERVICES - 0.6% | | | | | | | |
Bio-Rad Laboratories Cl. A 1 | | 23,098 | | | | 5,512,800 | |
Bio-Techne | | 27,043 | | | | 3,503,420 | |
Dyadic International 1,3 | | 75,000 | | | | 102,750 | |
| | | | | | | |
| | | | | | | 9,118,970 | |
| | | | | | | |
| PHARMACEUTICALS - 0.1% | | | | | | | |
Intra-Cellular Therapies 1 | | 30,000 | | | | 434,400 | |
Theravance Biopharma 1,2 | | 34,291 | | | | 956,376 | |
| | | | | | | |
| | | | | | | 1,390,776 | |
| |
| Total (Cost $43,180,277) | | | | | | 62,873,884 | |
| |
| | | | | | | | |
| INDUSTRIALS – 30.3% | | | | | | | |
| AEROSPACE & DEFENSE - 3.0% | | | | | | | |
Austal | | 688,670 | | | | 973,688 | |
Ducommun 1 | | 117,200 | | | | 3,334,340 | |
HEICO Corporation | | 166,622 | | | | 15,720,786 | |
HEICO Corporation Cl. A | | 101,010 | | | | 7,984,840 | |
Hexcel Corporation | | 13,700 | | | | 847,345 | |
Magellan Aerospace | | 182,779 | | | | 3,055,041 | |
Mercury Systems 1 | | 25,400 | | | | 1,304,290 | |
Teledyne Technologies 1 | | 20,600 | | | | 3,731,690 | |
Wesco Aircraft Holdings 1 | | 915,364 | | | | 6,773,694 | |
| | | | | | | |
| | | | | | | 43,725,714 | |
| | | | | | | |
| AIR FREIGHT & LOGISTICS - 1.4% | | | | | | | |
Expeditors International of Washington | | 158,900 | | | | 10,279,241 | |
Forward Air | | 170,750 | | | | 9,807,880 | |
| | | | | | | |
| | | | | | | 20,087,121 | |
| | | | | | | |
| BUILDING PRODUCTS - 0.8% | | | | | | | |
American Woodmark 1 | | 11,400 | | | | 1,484,850 | |
Apogee Enterprises 2 | | 55,900 | | | | 2,556,307 | |
Burnham Holdings Cl. B 3 | | 36,000 | | | | 561,600 | |
DIRTT Environmental Solutions 1 | | 85,400 | | | | 457,912 | |
Epwin Group | | 300,000 | | | | 339,384 | |
Insteel Industries 2 | | 37,880 | | | | 1,072,762 | |
NCI Building Systems 1 | | 85,200 | | | | 1,644,360 | |
Patrick Industries 1 | | 14,775 | | | | 1,026,124 | |
Simpson Manufacturing | | 35,200 | | | | 2,020,832 | |
| | | | | | | |
| | | | | | | 11,164,131 | |
| | | | | | | |
| COMMERCIAL SERVICES & SUPPLIES - 2.8% | | | | | | | |
Atento | | 353,600 | | | | 3,589,040 | |
CECO Environmental | | 99,028 | | | | 508,014 | |
CompX International Cl. A | | 211,100 | | | | 2,807,630 | |
Copart 1 | | 368,200 | | | | 15,902,558 | |
Heritage-Crystal Clean 1 | | 146,527 | | | | 3,186,962 | |
Kimball International Cl. B | | 351,080 | | | | 6,554,663 | |
Mobile Mini | | 105,000 | | | | 3,622,500 | |
Ritchie Bros. Auctioneers | | 26,100 | | | | 781,173 | |
Steelcase Cl. A | | 114,060 | | | | 1,733,712 | |
UniFirst Corporation | | 14,070 | | | | 2,320,143 | |
| | | | | | | |
| | | | | | | 41,006,395 | |
| | | | | | | |
| CONSTRUCTION & ENGINEERING - 3.2% | | | | | | | |
Ameresco Cl. A 1 | | 40,000 | | | | 344,000 | |
Comfort Systems USA | | 21,400 | | | | 934,110 | |
EMCOR Group 2,4 | | 65,800 | | | | 5,379,150 | |
IES Holdings 1 | | 594,244 | | | | 10,250,709 | |
Jacobs Engineering Group | | 164,900 | | | | 10,876,804 | |
KBR | | 326,000 | | | | 6,464,580 | |
Northwest Pipe 1 | | 10,000 | | | | 191,400 | |
NV5 Global 1 | | 23,500 | | | | 1,272,525 | |
Sterling Construction 1,2 | | 122,300 | | | | 1,991,044 | |
Valmont Industries 2 | | 62,845 | | | | 10,422,843 | |
| | | | | | | |
| | | | | | | 48,127,165 | |
| | | | | | | |
| ELECTRICAL EQUIPMENT - 1.1% | | | | | | | |
EnerSys | | 29,600 | | | | 2,061,048 | |
Global Power Equipment Group 1,3 | | 631,820 | | | | 2,407,234 | |
Hubbell Cl. B | | 17,100 | | | | 2,314,314 | |
Powell Industries | | 94,500 | | | | 2,707,425 | |
Preformed Line Products | | 91,600 | | | | 6,508,180 | |
| | | | | | | |
| | | | | | | 15,998,201 | |
| | | | | | | |
| INDUSTRIAL CONGLOMERATES - 0.8% | | | | | | | |
A. Soriano | | 2,791,000 | | | | 394,031 | |
Carlisle Companies | | 20,100 | | | | 2,284,365 | |
Raven Industries | | 251,725 | | | | 8,646,754 | |
| | | | | | | |
| | | | | | | 11,325,150 | |
| | | | | | | |
| MACHINERY - 11.5% | | | | | | | |
Chen Hsong Holdings | | 1,159,000 | | | | 352,002 | |
CIRCOR International | | 115,484 | | | | 5,621,761 | |
Colfax Corporation 1 | | 82,242 | | | | 3,258,428 | |
Deutz | | 115,000 | | | | 1,043,250 | |
Donaldson Company | | 193,559 | | | | 9,474,713 | |
Exco Technologies | | 178,500 | | | | 1,439,929 | |
Franklin Electric | | 94,600 | | | | 4,342,140 | |
Graco | | 267,828 | | | | 12,111,182 | |
Greenbrier Companies (The) | | 70,700 | | | | 3,768,310 | |
Hurco Companies | | 25,952 | | | | 1,095,174 | |
Hyster-Yale Materials Handling Cl. A | | 10,000 | | | | 851,600 | |
IDEX Corporation | | 67,400 | | | | 8,894,778 | |
John Bean Technologies | | 83,526 | | | | 9,254,681 | |
Kadant | | 53,400 | | | | 5,361,360 | |
Kennametal | | 160,100 | | | | 7,750,441 | |
Lincoln Electric Holdings | | 61,360 | | | | 5,619,349 | |
Lindsay Corporation 2 | | 80,000 | | | | 7,056,000 | |
Luxfer Holdings | | 28,100 | | | | 443,980 | |
Lydall 1,2 | | 35,371 | | | | 1,795,078 | |
| 46 | 2017 Annual Report to Stockholders | | THE ACCOMPANYING NOTES ARE AN INTEGRAL PART OF THESE FINANCIAL STATEMENTS |
| |
| Schedule of Investments (continued) | | | | | | | |
| | | | | | | | |
| | | SHARES | | | VALUE | |
| |
| | | | | | | | |
| INDUSTRIALS (continued) | | | | | | | |
| MACHINERY (continued) | | | | | | | |
NN | | 308,700 | | | $ | 8,520,120 | |
Nordson Corporation | | 24,296 | | | | 3,556,934 | |
Proto Labs 1 | | 10,000 | | | | 1,030,000 | |
RBC Bearings 1 | | 121,300 | | | | 15,332,320 | |
Sarine Technologies | | 327,500 | | | | 244,819 | |
Sun Hydraulics | | 279,418 | | | | 18,075,551 | |
Tennant Company | | 111,900 | | | | 8,129,535 | |
Titan International | | 173,100 | | | | 2,229,528 | |
Wabash National | | 157,500 | | | | 3,417,750 | |
Watts Water Technologies Cl. A | | 61,000 | | | | 4,632,950 | |
Westinghouse Air Brake Technologies | | 81,200 | | | | 6,612,116 | |
Westport Fuel Systems 1,2,4 | | 327,100 | | | | 1,229,896 | |
Woodward | | 104,600 | | | | 8,006,084 | |
| | | | | | | |
| | | | | | | 170,551,759 | |
| | | | | | | |
| MARINE - 1.4% | | | | | | | |
Clarkson | | 291,000 | | | | 11,235,703 | |
Kirby Corporation 1 | | 144,500 | | | | 9,652,600 | |
| | | | | | | |
| | | | | | | 20,888,303 | |
| | | | | | | |
| PROFESSIONAL SERVICES - 1.7% | | | | | | | |
Franklin Covey 1 | | 40,800 | | | | 846,600 | |
Heidrick & Struggles International | | 91,380 | | | | 2,243,379 | |
ManpowerGroup | | 107,200 | | | | 13,518,992 | |
On Assignment 1,2,4 | | 106,700 | | | | 6,857,609 | |
Quess Corporation 1 | | 15,720 | | | | 282,571 | |
Robert Half International | | 4,532 | | | | 251,707 | |
TrueBlue 1 | | 56,245 | | | | 1,546,738 | |
Volt Information Sciences 1 | | 80,000 | | | | 304,000 | |
| | | | | | | |
| | | | | | | 25,851,596 | |
| | | | | | | |
| ROAD & RAIL - 1.9% | | | | | | | |
Genesee & Wyoming Cl. A 1 | | 15,000 | | | | 1,180,950 | |
Knight-Swift Transportation Holdings Cl. A 2 | | 122,400 | | | | 5,351,328 | |
Landstar System | | 130,560 | | | | 13,591,296 | |
Patriot Transportation Holding 1 | | 139,100 | | | | 2,446,769 | |
Saia 1,2,4 | | 59,630 | | | | 4,218,823 | |
Universal Logistics Holdings | | 78,916 | | | | 1,874,255 | |
| | | | | | | |
| | | | | | | 28,663,421 | |
| | | | | | | |
| TRADING COMPANIES & DISTRIBUTORS - 0.7% | | | | | | | |
Central Steel & Wire 3 | | 4,862 | | | | 2,187,900 | |
Houston Wire & Cable 1,5 | | 877,363 | | | | 6,317,014 | |
MSC Industrial Direct Cl. A 2 | | 14,763 | | | | 1,426,991 | |
SIG | | 350,000 | | | | 832,013 | |
Watsco | | 2,100 | | | | 357,084 | |
| | | | | | | |
| | | | | | | 11,121,002 | |
| | | | | | | |
| TRANSPORTATION INFRASTRUCTURE - 0.0% | | | | | | | |
Hopewell Highway Infrastructure | | 1,012,000 | | | | 645,622 | |
| |
| Total (Cost $244,724,053) | | | | | | 449,155,580 | |
| |
| | | | | | | | |
| INFORMATION TECHNOLOGY – 20.0% | | | | | | | |
| COMMUNICATIONS EQUIPMENT - 0.5% | | | | | | | |
ADTRAN 2 | | 234,973 | | | | 4,546,727 | |
Clearfield 1,2 | | 55,600 | | | | 681,100 | |
NetScout Systems 1 | | 65,600 | | | | 1,997,520 | |
Oclaro 1,2,4 | | 91,000 | | | | 613,340 | |
| | | | | | | |
| | | | | | | 7,838,687 | |
| | | | | | | |
| ELECTRONIC EQUIPMENT, INSTRUMENTS & COMPONENTS - 10.5% | | | | | | | |
Anixter International 1,2,4 | | 70,895 | | | | 5,388,020 | |
Bel Fuse Cl. B | | 30,238 | | | | 761,242 | |
Celestica 1 | | 303,700 | | | | 3,182,776 | |
Cognex Corporation 2 | | 350,600 | | | | 21,442,696 | |
Coherent 1 | | 80,500 | | | | 22,718,710 | |
Dolby Laboratories Cl. A | | 2,650 | | | | 164,300 | |
Fabrinet 1 | | 257,500 | | | | 7,390,250 | |
FARO Technologies 1 | | 161,467 | | | | 7,588,949 | |
FLIR Systems | | 545,737 | | | | 25,442,259 | |
HollySys Automation Technologies | | 50,082 | | | | 1,115,326 | |
Horiba | | 12,000 | | | | 721,381 | |
IPG Photonics 1,2,4 | | 56,800 | | | | 12,162,584 | |
LRAD Corporation 1 | | 744,944 | | | | 1,854,911 | |
Methode Electronics | | 27,130 | | | | 1,087,913 | |
National Instruments | | 261,850 | | | | 10,900,815 | |
Orbotech 1 | | 14,000 | | | | 703,360 | |
Perceptron 1 | | 357,700 | | | | 3,487,575 | |
Plexus Corporation 1 | | 150,600 | | | | 9,144,432 | |
Richardson Electronics | | 573,732 | | | | 3,866,954 | |
Rogers Corporation 1 | | 32,366 | | | | 5,240,703 | |
Systemax | | 38,520 | | | | 1,281,560 | |
TTM Technologies 1,2,4 | | 496,400 | | | | 7,778,588 | |
Vishay Intertechnology | | 79,500 | | | | 1,649,625 | |
Wasion Group Holdings | | 1,500,000 | | | | 733,256 | |
| | | | | | | |
| | | | | | | 155,808,185 | |
| | | | | | | |
| INTERNET SOFTWARE & SERVICES - 2.1% | | | | | | | |
Actua Corporation 1 | | 63,815 | | | | 995,514 | |
Care.com 1 | | 179,300 | | | | 3,234,572 | |
CommerceHub Ser. C 1 | | 50,000 | | | | 1,029,500 | |
comScore 1,3 | | 211,136 | | | | 6,017,376 | |
HolidayCheck Group 1 | | 94,900 | | | | 317,813 | |
IZEA 1,2,4 | | 75,306 | | | | 340,383 | |
j2 Global | | 75,020 | | | | 5,628,751 | |
Leaf Group 1 | | 50,000 | | | | 495,000 | |
MiX Telematics ADR | | 57,985 | | | | 739,889 | |
QuinStreet 1 | | 376,554 | | | | 3,155,522 | |
Solium Capital 1 | | 182,800 | | | | 1,586,593 | |
Stamps.com 1 | | 35,700 | | | | 6,711,600 | |
Support.com 1 | | 216,766 | | | | 524,574 | |
| | | | | | | |
| | | | | | | 30,777,087 | |
| | | | | | | |
| IT SERVICES - 1.2% | | | | | | | |
Acxiom Corporation 1 | | 48,000 | | | | 1,322,880 | |
Convergys Corporation 2 | | 121,000 | | | | 2,843,500 | |
CSE Global | | 3,050,000 | | | | 831,843 | |
DST Systems 2,4 | | 79,000 | | | | 4,903,530 | |
Hackett Group (The) | | 417,266 | | | | 6,555,249 | |
Innodata 1 | | 274,314 | | | | 373,067 | |
Unisys Corporation 1 | | 60,000 | | | | 489,000 | |
| | | | | | | |
| | | | | | | 17,319,069 | |
| | | | | | | |
| SEMICONDUCTORS & SEMICONDUCTOR EQUIPMENT - 3.5% | | | | | | | |
Amtech Systems 1 | | 79,271 | | | | 798,259 | |
Brooks Automation 2 | | 279,000 | | | | 6,654,150 | |
Cabot Microelectronics | | 51,600 | | | | 4,854,528 | |
Cohu | | 129,600 | | | | 2,844,720 | |
CyberOptics Corporation 1 | | 37,600 | | | | 564,000 | |
Diodes 1 | | 270,850 | | | | 7,765,269 | |
Intermolecular 1 | | 40,000 | | | | 54,800 | |
Kulicke & Soffa Industries 1 | | 155,000 | | | | 3,771,925 | |
MKS Instruments | | 15,010 | | | | 1,418,445 | |
Nanometrics 1 | | 60,500 | | | | 1,507,660 | |
†NeoPhotonics Corporation 1,2,4 | | 32,700 | | | | 215,166 | |
| THE ACCOMPANYING NOTES ARE AN INTEGRAL PART OF THESE FINANCIAL STATEMENTS | | 2017 Annual Report to Stockholders | 47 |
| |
| Schedule of Investments (continued) | | | | | | | |
| | | | | | | | |
| | | SHARES | | | VALUE | |
| |
| | | | | | | | |
| INFORMATION TECHNOLOGY (continued) | | | | | | | |
| SEMICONDUCTORS & SEMICONDUCTOR EQUIPMENT (continued) | | | | | | | |
Nova Measuring Instruments 1 | | 39,500 | | | $ | 1,023,445 | |
Photronics 1 | | 183,700 | | | | 1,566,043 | |
Rudolph Technologies 1,2 | | 34,400 | | | | 822,160 | |
Silicon Motion Technology ADR | | 101,200 | | | | 5,359,552 | |
Teradyne | | 130,000 | | | | 5,443,100 | |
Ultra Clean Holdings 1 | | 42,800 | | | | 988,252 | |
Veeco Instruments 1 | | 17,500 | | | | 259,875 | |
Versum Materials | | 123,000 | | | | 4,655,550 | |
Xperi | | 82,300 | | | | 2,008,120 | |
| | | | | | | |
| | | | | | | 52,575,019 | |
| | | | | | | |
| SOFTWARE - 1.8% | | | | | | | |
American Software Cl. A | | 108,690 | | | | 1,264,065 | |
ANSYS 1,2,4 | | 90,200 | | | | 13,312,618 | |
BroadSoft 1 | | 25,000 | | | | 1,372,500 | |
Computer Modelling Group | | 371,300 | | | | 2,835,704 | |
Manhattan Associates 1 | | 10,000 | | | | 495,400 | |
Model N 1 | | 114,887 | | | | 1,809,470 | |
Monotype Imaging Holdings | | 117,700 | | | | 2,836,570 | |
PSI Software | | 18,194 | | | | 404,019 | |
RealNetworks 1 | | 219,879 | | | | 751,986 | |
Rosetta Stone 1 | | 40,000 | | | | 498,800 | |
SeaChange International 1 | | 247,069 | | | | 970,981 | |
| | | | | | | |
| | | | | | | 26,552,113 | |
| | | | | | | |
| TECHNOLOGY HARDWARE, STORAGE & PERIPHERALS - 0.4% | | | | | | | |
Diebold Nixdorf | | 266,600 | | | | 4,358,910 | |
Intevac 1 | | 168,700 | | | | 1,155,595 | |
| | | | | | | |
| | | | | | | 5,514,505 | |
| |
| Total (Cost $185,355,306) | | | | | | 296,384,665 | |
| |
| | | | | | | | |
| MATERIALS – 8.2% | | | | | | | |
| CHEMICALS - 2.2% | | | | | | | |
FutureFuel Corporation | | 48,500 | | | | 683,365 | |
Hawkins | | 86,178 | | | | 3,033,466 | |
Innospec | | 36,883 | | | | 2,603,940 | |
Minerals Technologies | | 119,493 | | | | 8,227,093 | |
Quaker Chemical | | 109,669 | | | | 16,536,988 | |
Westlake Chemical | | 14,600 | | | | 1,555,338 | |
| | | | | | | |
| | | | | | | 32,640,190 | |
| | | | | | | |
| CONSTRUCTION MATERIALS - 1.8% | | | | | | | |
Ash Grove Cement 3 | | 50,518 | | | | 25,978,882 | |
| | | | | | | |
| CONTAINERS & PACKAGING - 0.3% | | | | | | | |
Mayr-Melnhof Karton | | 34,000 | | | | 4,997,352 | |
| | | | | | | |
| METALS & MINING - 3.6% | | | | | | | |
Alamos Gold Cl. A | | 413,300 | | | | 2,692,861 | |
Ampco-Pittsburgh | | 36,966 | | | | 458,378 | |
Ferroglobe 1 | | 50,000 | | | | 810,000 | |
Ferroglobe (Warranty Insurance Trust) 1,6 | | 49,300 | | | | 0 | |
Franco-Nevada Corporation | | 107,300 | | | | 8,578,635 | |
Gold Fields ADR | | 370,000 | | | | 1,591,000 | |
Haynes International 2 | | 113,900 | | | | 3,650,495 | |
Hecla Mining | | 321,300 | | | | 1,275,561 | |
Lundin Mining | | 640,000 | | | | 4,256,484 | |
Major Drilling Group International 1 | | 981,757 | | | | 5,514,085 | |
Pretium Resources 1 | | 165,000 | | | | 1,882,339 | |
Reliance Steel & Aluminum | | 128,720 | | | | 11,042,889 | |
Royal Gold | | 16,600 | | | | 1,363,192 | |
Sandstorm Gold 1 | | 250,000 | | | | 1,247,500 | |
Synalloy Corporation | | 178,800 | | | | 2,395,920 | |
Tree Island Steel | | 30,000 | | | | 63,723 | |
Worthington Industries | | 148,000 | | | | 6,520,880 | |
| | | | | | | |
| | | | | | | 53,343,942 | |
| | | | | | | |
| PAPER & FOREST PRODUCTS - 0.3% | | | | | | | |
Stella-Jones | | 94,600 | | | | 3,800,557 | |
| |
| Total (Cost $64,206,916) | | | | | | 120,760,923 | |
| |
| | | | | | | | |
| REAL ESTATE – 3.1% | | | | | | | |
| EQUITY REAL ESTATE INVESTMENT TRUSTS (REITS) - 0.0% | | | | | | | |
Irish Residential Properties REIT | | 125,000 | | | | 225,929 | |
| | | | | | | |
| REAL ESTATE MANAGEMENT & DEVELOPMENT - 3.1% | | | | | | | |
Altus Group | | 24,200 | | | | 710,983 | |
FirstService Corporation | | 135,100 | | | | 9,446,192 | |
FRP Holdings 1 | | 188,558 | | | | 8,343,692 | |
Jones Lang LaSalle | | 15,600 | | | | 2,323,308 | |
Kennedy-Wilson Holdings | | 116,300 | | | | 2,017,805 | |
Marcus & Millichap 1 | | 253,213 | | | | 8,257,276 | |
Real Estate Investors | | 500,000 | | | | 394,654 | |
RMR Group Cl. A 2,4 | | 27,200 | | | | 1,612,960 | |
St. Joe Company (The) 1 | | 177,000 | | | | 3,194,850 | |
Tejon Ranch 1 | | 478,479 | | | | 9,933,224 | |
| | | | | | | |
| | | | | | | 46,234,944 | |
| |
| Total (Cost $32,352,781) | | | | | | 46,460,873 | |
| |
| | | | | | | | |
| TELECOMMUNICATION SERVICES – 0.6% | | | | | | | |
| DIVERSIFIED TELECOMMUNICATION SERVICES - 0.1% | | | | | | | |
China Communications Services | | 750,182 | | | | 501,764 | |
HKBN | | 1,000,000 | | | | 1,264,561 | |
| | | | | | | |
| | | | | | | 1,766,325 | |
| | | | | | | |
| WIRELESS TELECOMMUNICATION SERVICES - 0.5% | | | | | | | |
Boingo Wireless 1 | | 50,000 | | | | 1,125,000 | |
Telephone and Data Systems | | 208,270 | | | | 5,789,906 | |
| | | | | | | |
| | | | | | | 6,914,906 | |
| |
| Total (Cost $7,460,886) | | | | | | 8,681,231 | |
| |
| |
| UTILITIES – 0.1% | | | | | | | |
| GAS UTILITIES - 0.1% | | | | | | | |
Shizuoka Gas | | 110,000 | | | | 936,161 | |
Toho Gas | | 12,000 | | | | 328,866 | |
UGI Corporation | | 6,500 | | | | 305,175 | |
| | | | | | | |
| | | | | | | 1,570,202 | |
| | | | | | | |
| MULTI-UTILITIES - 0.0% | | | | | | | |
Just Energy Group 2 | | 18,520 | | | | 79,451 | |
| |
| Total (Cost $1,529,171) | | | | | | 1,649,653 | |
| |
| | | | | | | | |
| MISCELLANEOUS7 – 3.3% | | | | | | | |
| |
| Total (Cost $47,298,833) | | | | | | 48,657,510 | |
| |
| | | | | | | | |
| TOTAL COMMON STOCKS | | | | | | | |
| |
| (Cost $1,031,579,267) | | | | | | 1,503,413,059 | |
| |
| 48 | 2017 Annual Report to Stockholders | | THE ACCOMPANYING NOTES ARE AN INTEGRAL PART OF THESE FINANCIAL STATEMENTS |
| |
| Schedule of Investments (continued) | | | | | | | |
| | | | | | | | |
| | | | | | VALUE | |
| |
| | | | | | | | |
| REPURCHASE AGREEMENT– 3.3% | | | | | | | |
Fixed Income Clearing Corporation, 0.20% dated 12/29/17, due 1/2/18, maturity value
$48,668,081 (collateralized by obligations of various U.S. Government Agencies, 1.75%
due 10/31/18, valued at $49,644,703) | |
| |
| (Cost $48,667,000) | | | | | $ | 48,667,000 | |
| |
| | | | | | | | |
| TOTAL INVESTMENTS – 104.8% | | | | | | | |
| |
| (Cost $1,080,246,267) | | | | | | 1,552,080,059 | |
| |
| | | | | | | | |
| LIABILITIES LESS CASH AND OTHER ASSETS – (4.8)% | | | | | | (71,630,606 | ) |
| | | | | | | |
| | | | | | | | |
| |
| NET ASSETS – 100.0% | | | | | $ | 1,480,449,453 | |
| |
| † | New additions in 2017. |
| 1 | Non-income producing. |
| 2 | All or a portion of these securities were pledged as collateral in connection with the Fund’s revolving credit agreement at December 31, 2017. Total market value of pledged securities at December 31, 2017, was $126,201,544. |
| 3 | These securities are defined as Level 2 securities due to fair value being based on quoted prices for similar securities. See Notes to Financial Statements. |
| 4 | At December 31, 2017, a portion of these securities were rehypothecated in connection with the Fund’s revolving credit agreement in the aggregate amount of $60,930,162. |
| 5 | At December 31, 2017, the Fund owned 5% or more of the Company’s outstanding voting securities thereby making the Company an Affiliated Company as that term is defined in the Investment Company Act of 1940. See Notes to Financial Statements. |
| 6 | Securities for which market quotations are not readily available represent 0.1% of net assets. These securities have been valued at their fair value under procedures approved by the Fund’s Board of Directors. These securities are defined as Level 3 securities due to the use of significant unobservable inputs in the determination of fair value. See Notes to Financial Statements. |
| 7 | Includes securities first acquired in 2017 and less than 1% of net assets. |
| | |
| | Bold indicates the Fund’s 20 largest equity holdings in terms of December 31, 2017, market value. |
| | |
| | TAX INFORMATION: The cost of total investments for Federal income tax purposes was $1,083,388,346. At December 31, 2017, net unrealized appreciation for all securities was $468,691,713 consisting of aggregate gross unrealized appreciation of $565,974,039 and aggregate gross unrealized depreciation of $97,282,326. The primary causes of the differences between book and tax basis cost are the timing of the recognition of losses on securities sold, investments in Real Estate Investment Trusts and publicly traded partnerships and Trusts and mark-to-market of Passive Foreign Investment Companies. |
| THE ACCOMPANYING NOTES ARE AN INTEGRAL PART OF THESE FINANCIAL STATEMENTS | | 2017 Annual Report to Stockholders | 49 |
| Royce Value Trust | | December 31, 2017 |
| | | |
| |
| Statement of Assets and Liabilities |
| ASSETS: | | | | | |
| Investments at value | | | | | |
| |
Non-Affiliated Companies | | | $ | 1,496,302,400 | |
| |
Affiliated Companies | | | | 7,110,659 | |
| |
| Repurchase agreements (at cost and value) | | | | 48,667,000 | |
| |
| Cash and foreign currency | | | | 73,896 | |
| |
| Receivable for investments sold | | | | 1,094,758 | |
| |
| Receivable for dividends and interest | | | | 1,142,291 | |
| |
| Prepaid expenses and other assets | | | | 623,991 | |
| |
| Total Assets | | | | 1,555,014,995 | |
| |
| LIABILITIES: | | | | | |
| Revolving credit agreement | | | | 70,000,000 | |
| |
| Payable for investments purchased | | | | 3,741,243 | |
| |
| Payable for investment advisory fee | | | | 511,607 | |
| |
| Payable for directors’ fees | | | | 44,911 | |
| |
| Payable for interest expense | | | | 20,570 | |
| |
| Accrued expenses | | | | 247,211 | |
| |
| Total Liabilities | | | | 74,565,542 | |
| |
| Net Assets | | | $ | 1,480,449,453 | |
| |
| ANALYSIS OF NET ASSETS: | | | | | |
| Paid-in capital -$0.001 par value per share; 84,587,724 shares outstanding (150,000,000 shares authorized) | | | $ | 1,006,120,990 | |
| |
| Undistributed net investment income (loss) | | | | (1,725,122 | ) |
| |
| Accumulated net realized gain (loss) on investments and foreign currency | | | | 4,219,264 | |
| |
| Net unrealized appreciation (depreciation) on investments and foreign currency | | | | 471,834,321 | |
| |
| Net Assets (net asset value per share -$17.50) | | | $ | 1,480,449,453 | |
| |
| Investments at identified cost | | | $ | 1,031,579,267 | |
| |
| 50 | 2017 Annual Report to Stockholders | | THE ACCOMPANYING NOTES ARE AN INTEGRAL PART OF THESE FINANCIAL STATEMENTS |
| Royce Value Trust |
| |
| |
| Statement of Changes in Net Assets |
| | | | YEAR ENDED 12/31/17 | | | YEAR ENDED 12/31/16 |
| |
| | | | | | | | | | | |
| INVESTMENT OPERATIONS: | | | | | | | | | | |
| Net investment income (loss) | | | $ | 10,969,682 | | | | $ | 9,680,260 | |
| |
| Net realized gain (loss) on investments and foreign currency | | | | 81,750,067 | | | | | 75,719,009 | |
| |
| Net change in unrealized appreciation (depreciation) on investments and foreign currency | | | | 146,329,916 | | | | | 186,502,762 | |
| |
| Net increase (decrease) in net assets from investment operations | | | | 239,049,665 | | | | | 271,902,031 | |
| |
| DISTRIBUTIONS: | | | | | | | | | | |
| Net investment income | | | | (10,679,021 | ) | | | | (10,786,801 | ) |
| |
| Net realized gain on investments and foreign currency | | | | (85,441,777 | ) | | | | (70,931,388 | ) |
| |
| Total distributions | | | | (96,120,798 | ) | | | | (81,718,189 | ) |
| |
| CAPITAL STOCK TRANSACTIONS: | | | | | | | | | | |
| Reinvestment of distributions | | | | 41,508,874 | | | | | 33,793,124 | |
| |
| Total capital stock transactions | | | | 41,508,874 | | | | | 33,793,124 | |
| |
| Net Increase (Decrease) In Net Assets | | | | 184,437,741 | | | | | 223,976,966 | |
| |
| NET ASSETS: | | | | | | | | | | |
| |
| Beginning of year | | | | 1,296,011,712 | | | | | 1,072,034,746 | |
| |
| End of year (including undistributed net investment income (loss) of $(1,725,122) at 12/31/17 and $(1,959,371) at 12/31/16) | | | $ | 1,480,449,453 | | | | $ | 1,296,011,712 | |
| |
| THE ACCOMPANYING NOTES ARE AN INTEGRAL PART OF THESE FINANCIAL STATEMENTS | | 2017 Annual Report to Stockholders | 51 |
| Royce Value Trust | | Year Ended December 31, 2017 |
| | | |
| |
| Statement of Operations |
| INVESTMENT INCOME: | | | | | |
| INCOME: | | | | | |
| Dividends | | | | | |
| |
Non-Affiliated Companies | | | $ | 19,679,505 | |
| |
Affiliated Companies | | | | 213,896 | |
| |
| Foreign withholding tax | | | | (446,367 | ) |
| |
| Interest | | | | 155,761 | |
| |
| Rehypothecation income | | | | 320,116 | |
| |
| Total income | | | | 19,922,911 | |
| |
| EXPENSES: | | | | | |
| |
| Investment advisory fees | | | | 5,983,920 | |
| |
| Interest expense | | | | 1,571,615 | |
| |
| Stockholder reports | | | | 381,577 | |
| |
| Administrative and office facilities | | | | 351,683 | |
| |
| Custody and transfer agent fees | | | | 204,139 | |
| |
| Professional fees | | | | 182,943 | |
| |
| Directors’ fees | | | | 178,047 | |
| |
| Other expenses | | | | 99,864 | |
| |
| Total expenses | | | | 8,953,788 | |
| |
| Compensating balance credits | | | | (559 | ) |
| |
| Net expenses | | | | 8,953,229 | |
| |
| Net investment income (loss) | | | | 10,969,682 | |
| |
| REALIZED AND UNREALIZED GAIN (LOSS) ON INVESTMENTS AND FOREIGN CURRENCY: | | | | | |
| | | | | | |
| NET REALIZED GAIN (LOSS): | | | | | |
| |
| Investments in Non-Affiliated Companies | | | | 78,822,196 | |
| |
| Investments in Affiliated Companies | | | | 2,891,007 | |
| |
| Foreign currency transactions | | | | 36,864 | |
| |
| NET CHANGE IN UNREALIZED APPRECIATION (DEPRECIATION): | | | | | |
| |
| Investments in Non-Affiliated Companies and foreign currency translations | | | | 144,856,029 | |
| |
| Investments in Affiliated Companies | | | | 1,420,227 | |
| |
| Other assets and liabilities denominated in foreign currency | | | | 53,660 | |
| |
| Net realized and unrealized gain (loss) on investments and foreign currency | | | | 228,079,983 | |
| |
| NET INCREASE (DECREASE) IN NET ASSETS FROM INVESTMENT OPERATIONS | | | $ | 239,049,665 | |
| |
| 52 | 2017 Annual Report to Stockholders | | THE ACCOMPANYING NOTES ARE AN INTEGRAL PART OF THESE FINANCIAL STATEMENTS |
| Royce Value Trust | | Year Ended December 31, 2017 |
| | | |
| |
| Statement of Cash Flows |
| CASH FLOWS FROM OPERATING ACTIVITIES: | | | | | |
| Net increase (decrease) in net assets from investment operations | | | $ | 239,049,665 | |
| |
| Adjustments to reconcile net increase (decrease) in net assets from investment operations to net cash provided by operating activities: | | | | | |
| |
Purchases of long-term investments | | | | (273,234,405 | ) |
| |
Proceeds from sales and maturities of long-term investments | | | | 284,510,862 | |
| |
Net purchases, sales and maturities of short-term investments | | | | 32,245,000 | |
| |
Net (increase) decrease in dividends and interest receivable and other assets | | | | 113,416 | |
| |
Net increase (decrease) in interest expense payable, accrued expenses and other liabilities | | | | (37,643 | ) |
| |
Net change in unrealized appreciation (depreciation) on investments | | | | (146,276,256 | ) |
| |
Net realized gain (loss) on investments and foreign currency | | | | (81,750,067 | ) |
| |
| Net cash provided by operating activities | | | | 54,620,572 | |
| |
| CASH FLOWS FROM FINANCING ACTIVITIES: | | | | | |
| |
| Distributions | | | | (96,120,798 | ) |
| |
| Reinvestment of distributions | | | | 41,508,874 | |
| |
| Net cash used for financing activities | | | | (54,611,924 | ) |
| |
| INCREASE (DECREASE) IN CASH: | | | | 8,648 | |
| |
| Cash and foreign currency at beginning of year | | | | 65,248 | |
| |
| Cash and foreign currency at end of year | | | $ | 73,896 | |
| |
| THE ACCOMPANYING NOTES ARE AN INTEGRAL PART OF THESE FINANCIAL STATEMENTS | | 2017 Annual Report to Stockholders | 53 |
| |
| Financial Highlights |
| This table is presented to show selected data for a share of Common Stock outstanding throughout each period, and to assist stockholders in evaluating the Fund’s performance for the periods presented. |
| | | YEARS ENDED |
| | | |
| | | 12/31/17 | | 12/31/16 | | 12/31/15 | | 12/31/14 | | 12/31/13 |
| |
| Net Asset Value, Beginning of Period | | $ | 15.85 | | | $ | 13.56 | | | $ | 16.24 | | | $ | 18.17 | | | $ | 15.40 | |
| |
| INVESTMENT OPERATIONS: | | | | | | | | | | | | | | | | | | | | |
| Net investment income (loss) | | | 0.13 | | | | 0.12 | | | | 0.12 | | | | 0.12 | | | | 0.12 | |
| |
| Net realized and unrealized gain (loss) on investments and foreign currency | | | 2.74 | | | | 3.27 | | | | (1.48 | ) | | | (0.13 | ) | | | 4.89 | |
| |
| Net increase (decrease) in net assets from investment operations | | | 2.87 | | | | 3.39 | | | | (1.36 | ) | | | (0.01 | ) | | | 5.01 | |
| |
| DISTRIBUTIONS TO COMMON STOCKHOLDERS: | | | | | | | | | | | | | | | | | | | | |
| Net investment income | | | (0.13 | ) | | | (0.13 | ) | | | (0.16 | ) | | | (0.14 | ) | | | (0.11 | ) |
| |
| Net realized gain on investments and foreign currency | | | (1.03 | ) | | | (0.89 | ) | | | (1.08 | ) | | | (1.68 | ) | | | (2.08 | ) |
| |
| Total distributions to Common Stockholders | | | (1.16 | ) | | | (1.02 | ) | | | (1.24 | ) | | | (1.82 | ) | | | (2.19 | ) |
| |
| CAPITAL STOCK TRANSACTIONS: | | | | | | | | | | | | | | | | | | | | |
| Effect of reinvestment of distributions by Common Stockholders | | | (0.06 | ) | | | (0.08 | ) | | | (0.08 | ) | | | (0.10 | ) | | | (0.05 | ) |
| |
| Total capital stock transactions | | | (0.06 | ) | | | (0.08 | ) | | | (0.08 | ) | | | (0.10 | ) | | | (0.05 | ) |
| |
| Net Asset Value, End of Period | | $ | 17.50 | | | $ | 15.85 | | | $ | 13.56 | | | $ | 16.24 | | | $ | 18.17 | |
| |
| Market Value, End of Period | | $ | 16.17 | | | $ | 13.39 | | | $ | 11.77 | | | $ | 14.33 | | | $ | 16.01 | |
| |
| TOTAL RETURN:1 | | | | | | | | | | | | | | | | | | | | |
| Net Asset Value | | | 19.31 | % | | | 26.87 | % | | | (8.09 | )% | | | 0.78 | % | | | 34.14 | % |
| |
| Market Value | | | 30.49 | % | | | 23.48 | % | | | (9.59 | )% | | | 0.93 | % | | | 35.63 | % |
| |
| RATIOS BASED ON AVERAGE NET ASSETS: | | | | | | | | | | | | | | | | | | | | |
| Investment advisory fee expense2 | | | 0.43 | % | | | 0.51 | % | | | 0.50 | % | | | 0.46 | % | | | 0.54 | % |
| |
| Other operating expenses | | | 0.22 | % | | | 0.22 | % | | | 0.18 | % | | | 0.15 | % | | | 0.25 | % |
| |
| Total expenses (net) | | | 0.65 | % | | | 0.73 | % | | | 0.68 | % | | | 0.61 | % | | | 0.79 | % |
| |
| Expenses net of fee waivers and excluding interest expense | | | 0.54 | % | | | 0.62 | % | | | 0.61 | % | | | 0.55 | % | | | 0.65 | % |
| |
| Expenses prior to fee waivers and balance credits | | | 0.65 | % | | | 0.73 | % | | | 0.68 | % | | | 0.61 | % | | | 0.79 | % |
| |
| Expenses prior to fee waivers | | | 0.65 | % | | | 0.73 | % | | | 0.68 | % | | | 0.61 | % | | | 0.79 | % |
| |
| Net investment income (loss) | | | 0.80 | % | | | 0.85 | % | | | 0.78 | % | | | 0.72 | % | | | 0.70 | % |
| |
| SUPPLEMENTAL DATA: | | | | | | | | | | | | | | | | | | | | |
| Net Assets, End of Period (in thousands) | | $ | 1,480,449 | | | $ | 1,296,012 | | | $ | 1,072,035 | | | $ | 1,231,955 | | | $ | 1,307,829 | |
| |
| Portfolio Turnover Rate | | | 19 | % | | | 28 | % | | | 35 | % | | | 40 | % | | | 33 | % |
| |
| REVOLVING CREDIT AGREEMENT: | | | | | | | | | | | | | | | | | | | | |
| Asset coverage | | | 2215 | % | | | 1951 | % | | | 1631 | % | | | 1860 | % | | | 1289 | % |
| |
| Asset coverage per $1,000 | | $ | 22,149 | | | $ | 19,514 | | | $ | 16,315 | | | $ | 18,599 | | | $ | 12,889 | |
| |
| 1 | The Market Value Total Return is calculated assuming a purchase of Common Stock on the opening of the first business day and a sale on the closing of the last business day of each period. Dividends and distributions are assumed for the purposes of this calculation to be reinvested at prices obtained under the Fund’s Distribution Reinvestment and Cash Purchase Plan. Net Asset Value Total Return is calculated on the same basis, except that the Fund’s net asset value is used on the purchase and sale dates instead of market value. |
| 2 | The investment advisory fee is calculated based on average net assets over a rolling 60-month basis, while the above ratios of investment advisory fee expenses are based on the average net assets over a 12-month basis. |
| 54 | 2017 Annual Report to Stockholders | | THE ACCOMPANYING NOTES ARE AN INTEGRAL PART OF THESE FINANCIAL STATEMENTS |
Royce Value Trust
Notes to Financial Statements
| Summary of Significant Accounting Policies |
Royce Value Trust, Inc. (the "Fund"), is a diversified closed-end investment company that was incorporated under the laws of the State of Maryland on July 1, 1986. The Fund commenced operations on November 26, 1986. |
The preparation of financial statements in conformity with accounting principles generally accepted in the United States of America requires management to make estimates and assumptions that affect the reported amounts of assets and liabilities and the disclosure of contingent assets and liabilities at the date of the financial statements and the reported amounts of income and expenses during the reporting period. Actual results could differ from those estimates. |
The Fund is an investment company and accordingly follows the investment company accounting and reporting guidance of the Financial Accounting Standards Board (FASB) Accounting Standard Codification Topic 946 “Financial Services-Investment Companies”. |
| |
| VALUATION OF INVESTMENTS: |
Securities are valued as of the close of trading on the New York Stock Exchange (NYSE) (generally 4:00 p.m. Eastern time) on the valuation date. Securities that trade on an exchange, and securities traded on Nasdaq's Electronic Bulletin Board, are valued at their last reported sales price or Nasdaq official closing price taken from the primary market in which each security trades or, if no sale is reported for such day, at their highest bid price. Other over-the-counter securities for which market quotations are readily available are valued at their highest bid price, except in the case of some bonds and other fixed income securities which may be valued by reference to other securities with comparable ratings, interest rates and maturities, using established independent pricing services. The Fund values its non-U.S. dollar denominated securities in U.S. dollars daily at the prevailing foreign currency exchange rates as quoted by a major bank. Securities for which market quotations are not readily available are valued at their fair value in accordance with the provisions of the 1940 Act, under procedures approved by the Fund's Board of Directors, and are reported as Level 3 securities. As a general principle, the fair value of a security is the amount which the Fund might reasonably expect to receive for the security upon its current sale. However, in light of the judgment involved in fair valuations, there can be no assurance that a fair value assigned to a particular security will be the amount which the Fund might be able to receive upon its current sale. In addition, if, between the time trading ends on a particular security and the close of the customary trading session on the NYSE, events occur that are significant and may make the closing price unreliable, the Fund may fair value the security. The Fund uses an independent pricing service to provide fair value estimates for relevant non-U.S. equity securities on days when the U.S. market volatility exceeds a certain threshold. This pricing service uses proprietary correlations it has developed between the movement of prices of non-U.S. equity securities and indices of U.S.-traded securities, futures contracts and other indications to estimate the fair value of relevant non-U.S. securities. When fair value pricing is employed, the prices of securities used by the Fund may differ from quoted or published prices for the same security. Investments in money market funds are valued at net asset value per share. |
Various inputs are used in determining the value of the Fund’s investments, as noted above. These inputs are summarized in the three broad levels below: |
| | Level 1 | – | quoted prices in active markets for identical securities. |
| | Level 2 | – | other significant observable inputs (including quoted prices for similar securities, foreign securities that may be fair valued and repurchase agreements). The table below includes all Level 2 securities. Level 2 securities with values based on quoted prices for similar securities are noted in the Schedule of Investments. |
| | Level 3 | – | significant unobservable inputs (including last trade price before trading was suspended, or at a discount thereto for lack of marketability or otherwise, market price information regarding other securities, information received from the company and/or published documents, including SEC filings and financial statements, or other publicly available information). |
The inputs or methodology used for valuing securities are not necessarily an indication of the risk associated with investing in those securities. |
The following is a summary of the inputs used to value the Fund’s investments as of December 31, 2017. For a detailed breakout of common stocks by sector classification, please refer to the Schedule of Investments. |
| | | | | | | | | | | | | | | | | |
| | | LEVEL 1 | | LEVEL 2 | | LEVEL 3 | | TOTAL | |
| |
| Common Stocks | | | $1,355,250,667 | | | | $147,270,792 | | | | $891,600 | | | | $1,503,413,059 | |
| |
| Cash Equivalents | | | – | | | | 48,667,000 | | | | – | | | | 48,667,000 | |
| |
Certain securities have transferred in and out of Level 1 and Level 2 measurements during the reporting period. The Fund recognizes transfers between levels as of the end of the reporting period. For the year ended December 31, 2017, securities valued at $6,076,026 were transferred from Level 1 to Level 2 and securities valued at $1,025,393 were transferred from Level 2 to Level 1 within the fair value hierarchy. |
2017 Annual Report to Stockholders | 55
Royce Value Trust
Notes to Financial Statements (continued)
VALUATION OF INVESTMENTS (continued):
| Level 3 Reconciliation: |
| | | | | | | | | | |
| | BALANCE AS OF 12/31/16 | | SALES | | REALIZED GAIN (LOSS) | | UNREALIZED GAIN (LOSS)1 | | BALANCE AS OF 12/31/17 |
| |
| Common Stocks | $892,063 | | $759 | | $745 | | $(449) | | $891,600 |
| |
| 1 | The net change in unrealized appreciation (depreciation) is included in the accompanying Statement of Operations. Change in unrealized appreciation (depreciation) includes net unrealized appreciation (depreciation) resulting from changes in investment values during the reporting period and the reversal of previously recorded unrealized appreciation (depreciation) when gains or losses are realized. Net realized gain (loss) from investments and foreign currency transactions is included in the accompanying Statement of Operations. |
The following table summarizes the valuation techniques used and unobservable inputs approved by the Valuation Committee to determine the fair value of certain Level 3 investments. The table does not include Level 3 investments with values derived utilizing prices from prior transactions or third party pricing information with adjustments (e.g. broker quotes, pricing services, net asset values).
| | | | FAIR VALUE AT | | | | | | | | | | | | IMPACT TO VALUATION FROM |
| | | | 12/31/17 | | | VALUATION TECHNIQUE(S) | | | UNOBSERVABLE INPUT(S) | | | RANGE AVERAGE | | | AN INCREASE IN INPUT1 |
| |
| Common Stocks | | | $891,600 | | | Discounted Present Value
Balance Sheet Analysis | | | Liquidity Discount | | | 30%-40% | | | Decrease |
| |
| 1 | This column represents the directional change in the fair value of the Level 3 investments that would result in an increase from the corresponding unobservable input. A decrease to the unobservable input would have the opposite effect. Significant increases and decreases in these unobservable inputs in isolation could result in significantly higher or lower fair value measurements. |
| REPURCHASE AGREEMENTS: |
The Fund may enter into repurchase agreements with institutions that the Fund’s investment adviser has determined are creditworthy. The Fund restricts repurchase agreements to maturities of no more than seven days. Securities pledged as collateral for repurchase agreements, which are held until maturity of the repurchase agreements, are marked-to-market daily and maintained at a value at least equal to the principal amount of the repurchase agreement (including accrued interest). Repurchase agreements could involve certain risks in the event of default or insolvency of the counter-party, including possible delays or restrictions upon the ability of the Fund to dispose of its underlying securities. The remaining contractual maturity of the repurchase agreement held by the Fund at December 31, 2017 is overnight and continuous. |
| |
| FOREIGN CURRENCY: |
Net realized foreign exchange gains or losses arise from sales and maturities of short-term securities, sales of foreign currencies, expiration of currency forward contracts, currency gains or losses realized between the trade and settlement dates on securities transactions, and the difference between the amounts of dividends, interest, and foreign withholding taxes recorded on the Fund's books and the U.S. dollar equivalent of the amounts actually received or paid. Net unrealized foreign exchange gains and losses arise from changes in the value of assets and liabilities, including investments in securities at the end of the reporting period, as a result of changes in foreign currency exchange rates. |
| |
| TAXES: |
As a qualified regulated investment company under Subchapter M of the Internal Revenue Code, the Fund is not subject to income taxes to the extent that it distributes substantially all of its taxable income for its fiscal year. The Schedule of Investments includes information regarding income taxes under the caption “Tax Information”. |
| |
| CAPITAL GAINS TAXES: |
The Fund is subject to a tax imposed on short-term capital gains on securities of issuers domiciled in certain countries. The Fund records an estimated deferred tax liability for gains in these securities that have been held for less than one year. This amount, if any, is reported as deferred capital gains tax in the accompanying Statement of Assets and Liabilities, assuming those positions were disposed of at the end of the period, and accounted for as a reduction in the market value of the security. |
| |
| DISTRIBUTIONS: |
The Fund pays quarterly distributions on the Fund’s Common Stock at the annual rate of 7% of the rolling average of the prior four calendar quarter-end NAVs of the Fund’s Common Stock, with the fourth quarter distribution being the greater of 1.75% of the rolling average or the distribution required by IRS regulations. Distributions to Common Stockholders are recorded on ex-dividend date. To the extent that distributions are not paid from long-term capital gains, net investment income or net short-term capital gains, they will represent a return of capital. Distributions are determined in accordance with income tax regulations that may differ from accounting principles generally accepted in the United States of America. Permanent book and tax differences relating to stockholder distributions |
56 | 2017 Annual Report to Stockholders
Royce Value Trust
Notes to Financial Statements (continued)
DISTRIBUTIONS (continued):
will result in reclassifications within the capital accounts. Undistributed net investment income may include temporary book and tax basis differences, which will reverse in a subsequent period. Any taxable income or gain remaining undistributed at fiscal year end is distributed in the following year.
| INVESTMENT TRANSACTIONS AND RELATED INVESTMENT INCOME: |
Investment transactions are accounted for on the trade date. Dividend income is recorded on the ex-dividend date. Non-cash dividend income is recorded at the fair market value of the securities received. Interest income is recorded on an accrual basis. Premiums and discounts on debt securities are amortized using the effective yield-to-maturity method. Realized gains and losses from investment transactions are determined on the basis of identified cost for book and tax purposes. |
| |
| EXPENSES: |
The Fund incurs direct and indirect expenses. Expenses directly attributable to the Fund are charged to the Fund’s operations, while expenses applicable to more than one of the Royce Funds are allocated equitably. Certain personnel, occupancy costs and other administrative expenses related to the Funds are allocated by Royce & Associates (“Royce”) under an administration agreement and are included in administrative and office facilities and professional fees. The Fund has adopted a deferred fee agreement that allows the Directors to defer the receipt of all or a portion of directors’ fees otherwise payable. The deferred fees are invested in certain Royce Funds until distributed in accordance with the agreement. |
| |
| COMPENSATING BALANCE CREDITS: |
The Fund has an arrangement with its custodian bank, whereby a portion of the custodian's fee is paid indirectly by credits earned on the Fund's cash on deposit with the bank. This deposit arrangement is an alternative to purchasing overnight investments. Conversely, the Fund pays interest to the custodian on any cash overdrafts, to the extent they are not offset by credits earned on positive cash balances. |
| |
| Capital Stock: |
The Fund issued 2,795,800 and 2,740,162 shares of Common Stock as reinvestment of distributions for the years ended December 31, 2017 and December 31, 2016, respectively. |
| |
| Borrowings: |
The Fund is party to a revolving credit agreement (the credit agreement) with BNP Paribas Prime Brokerage International, Limited (BNPPI). The Fund pays a commitment fee of 0.50% per annum on the unused portion of the credit agreement. The credit agreement has a 360-day rolling term that resets daily; however, if the Fund exceeds certain net asset value triggers, the credit agreement may convert to a 60-day rolling term that resets daily. The Fund is required to pledge portfolio securities as collateral in an amount up to two times the loan balance outstanding or as otherwise required by applicable regulatory standards and has granted a security interest in the securities pledged to, and in favor of, BNPPI as security for the loan balance outstanding. If the Fund fails to meet certain requirements, or maintain other financial covenants required under the credit agreement, the Fund may be required to repay immediately, in part or in full, the loan balance outstanding under the credit agreement which may necessitate the sale of portfolio securities at potentially inopportune times. BNPPI may terminate the credit agreement upon certain ratings downgrades of its corporate parent, which would result in the Fund’s entire loan balance becoming immediately due and payable. The occurrence of such ratings downgrades may necessitate the sale of portfolio securities at potentially inopportune times. The credit agreement also permits, subject to certain conditions, BNPPI to rehypothecate portfolio securities pledged by the Fund up to the amount of the loan balance outstanding. The Fund continues to receive payments in lieu of dividends and interest on rehypothecated securities. The Fund also has the right under the credit agreement to recall the rehypothecated securities from BNPPI on demand. If BNPPI fails to deliver the recalled security in a timely manner, the Fund is compensated by BNPPI for any fees or losses related to the failed delivery or, in the event a recalled security is not returned by BNPPI, the Fund, upon notice to BNPPI, may reduce the loan balance outstanding by the value of the recalled security failed to be returned. The Fund receives a portion of the fees earned by BNPPI in connection with the rehypothecation of portfolio securities. |
As of December 31, 2017, the Fund has outstanding borrowings of $70,000,000. During the year ended December 31, 2017, the Fund borrowed an average daily balance of $70,000,000 at a weighted average borrowing cost of 2.21%. The maximum amount outstanding during the year ended December 31, 2017 was $70,000,000. As of December 31, 2017, the aggregate value of rehypothecated securities was $60,930,162. During the year ended December 31, 2017, the Fund earned $320,116 in fees from rehypothecated securities. |
2017 Annual Report to Stockholders | 57
Royce Value Trust
Notes to Financial Statements (continued)
|
| Investment Advisory Agreement: |
As compensation for its services under the investment advisory agreement, Royce receives a fee comprised of a Basic Fee (“Basic Fee”) and an adjustment to the Basic Fee based on the investment performance of the Fund in relation to the investment record of the S&P SmallCap 600 Index (“S&P 600”). |
The Basic Fee is a monthly fee equal to 1/12 of 1% (1% on an annualized basis) of the average of the Fund’s month-end net assets applicable to Common Stockholders, plus the liquidation value of outstanding Preferred Stock, for the rolling 60-month period ending with such month (the "performance period"). The Basic Fee for each month is increased or decreased at the rate of 1/12 of .05% for each percentage point that the investment performance of the Fund exceeds, or is exceeded by, the percentage change in the investment record of the S&P 600 for the performance period by more than two percentage points. The performance period for each such month is a rolling 60-month period ending with such month. The maximum increase or decrease in the Basic Fee for any month may not exceed 1/12 of .5%. Accordingly, for each month, the maximum monthly fee rate as adjusted for performance is 1/12 of 1.5% and is payable if the investment performance of the Fund exceeds the percentage change in the investment record of the S&P 600 by 12 or more percentage points for the performance period, and the minimum monthly fee rate as adjusted for performance is 1/12 of .5% and is payable if the percentage change in the investment record of the S&P 600 exceeds the investment performance of the Fund by 12 or more percentage points for the performance period. |
Notwithstanding the foregoing, Royce is not entitled to receive any fee for any month when the investment performance of the Fund for the rolling 36-month period ending with such month is negative. In the event that the Fund’s investment performance for such a performance period is less than zero, Royce will not be required to refund to the Fund any fee earned in respect of any prior performance period. |
For the twelve rolling 60-month periods in 2017, the Fund’s investment performance ranged from 17% to 39% below the investment performance of the S&P 600. Accordingly, the net investment advisory fee consisted of a Basic Fee of $11,967,837 and a net downward adjustment of $5,983,917 for the performance of the Fund relative to that of the S&P 600. For the year ended December 31, 2017, the Fund expensed Royce investment advisory fees totaling $5,983,920. |
| |
| Purchases and Sales of Investment Securities: |
For the year ended December 31, 2017, the costs of purchases and proceeds from sales of investment securities, other than short-term securities, amounted to $274,765,818 and $255,530,768, respectively. |
Cross trades were executed by the Fund pursuant to Rule 17a-7 under the 1940 Act. Cross trading is the buying or selling of portfolio securities between funds to which Royce serves as investment adviser. At its regularly scheduled quarterly meetings, the Board reviews such transactions as of the most recent calendar quarter for compliance with the requirements and restrictions set forth by Rule 17a-7. Cross trades for the year ended December 31, 2017, were as follows: |
| COST OF PURCHASES | | | PROCEEDS FROM SALES | | | REALIZED GAIN (LOSS) |
| |
| $14,263,727 | | | $– | | | $– |
| |
| Tax Information: |
Distributions during the years ended December 31, 2017 and 2016, were characterized as follows for tax purposes: |
| ORDINARY INCOME | | | | LONG-TERM CAPITAL GAINS |
| |
| 2017 | | | 2016 | | | | 2017 | | | 2016 |
| |
| $19,301,057 | | | $12,241,385 | | | | $76,819,741 | | | $69,476,804 |
| |
The tax basis components of distributable earnings at December 31, 2017, were as follows:
| | | | | | | | | | QUALIFIED LATE YEAR | | | |
| UNDISTRIBUTED | | | UNDISTRIBUTED LONG-TERM | | | NET UNREALIZED | | | ORDINARY AND | | | TOTAL |
| ORDINARY | | | CAPITAL GAINS OR | | | APPRECIATION | | | POST-OCTOBER LOSS | | | DISTRIBUTABLE |
| INCOME | | | (CAPITAL LOSS CARRYFORWARD) | | | (DEPRECIATION)1 | | | DEFERRALS2 | | | EARNINGS |
| |
| $2,114,248 | | | $3,679,814 | | | $468,684,059 | | | $(149,658) | | | $474,328,463 |
| |
| 1 | Includes timing differences on foreign currency, recognition of losses on securities sold, investments in publicly traded partnerships and Trusts and mark-to-market of Passive Foreign Investment Companies. |
| 2 | Under the current tax law, capital losses and qualified late year ordinary losses incurred after October 31 may be deferred and treated as occurring on the first day of the following fiscal year. This column also includes passive activity losses. |
58 | 2017 Annual Report to Stockholders
Royce Value Trust
Notes to Financial Statements (continued)
Tax Information (continued):
For financial reporting purposes, capital accounts and distributions to stockholders are adjusted to reflect the tax character of permanent book/tax differences. For the year ended December 31, 2017, the Fund recorded the following permanent reclassifications, which relate primarily to current investments in Real Estate Investment Trusts, publicly traded partnerships and Trusts, foreign currency transactions, foreign capital gains tax and gains from the sale of Passive Foreign Investment Companies. Results of operations and net assets were not affected by these reclassifications.
| UNDISTRIBUTED NET | | | ACCUMULATED NET | | | |
| INVESTMENT INCOME | | | REALIZED GAIN (LOSS) | | | PAID-IN CAPITAL |
| |
| $(56,412) | | | $(1,742,832) | | | $1,799,244 |
| |
Management has analyzed the Fund’s tax positions taken on federal income tax returns for all open tax years (2014-2017) and has concluded that as of December 31, 2017, no provision for income tax is required in the Fund’s financial statements.
| Transactions in Affiliated Companies: |
| An “Affiliated Company” as defined in the Investment Company Act of 1940, is a company in which a fund owns 5% or more of the company’s outstanding voting securities at any time during the period. The Fund effected the following transactions in shares of such companies for the year ended December 31, 2017: |
| | | | | | | | | | | CHANGE IN NET | | | | | | | |
| | | | | | | | | | | UNREALIZED | | | | | | | |
| | | SHARES | MARKET VALUE | COST OF | PROCEEDS | APPRECIATION | REALIZED | DIVIDEND | SHARES | MARKET VALUE |
| AFFILIATED COMPANY | | 12/31/16 | 12/31/16 | PURCHASES | FROM SALES | (DEPRECIATION) | GAIN (LOSS) | INCOME | 12/31/17 | 12/31/17 |
| |
| Houston Wire & Cable | | 509,200 | | $ 3,309,800 | | $1,951,264 | | $ – | | $1,055,950 | | $ – | | $ – | | 877,363 | | $6,317,014 |
| |
| Stanley Furniture | | 912,235 | | 821,194 | | – | | – | | (27,549) | | – | | – | | 912,235 | | 793,645 |
| |
| Timberland Bancorp1 | | 444,200 | | 9,177,172 | | – | | 4,790,852 | | 391,826 | | 2,891,007 | | 213,896 | | | | |
| |
| | | | | $13,308,166 | | | | | | $1,420,227 | | $2,891,007 | | $213,896 | | | | $7,110,659 |
| |
1Not an Affiliated Company at December 31, 2017. 2017 Annual Report to Stockholders | 59
Report of Independent Registered Public Accounting Firm
To the Board of Directors and the Stockholders of Royce Value Trust, Inc.:
Opinion on the Financial Statements
We have audited the accompanying statement of assets and liabilities, including the schedule of investments, of Royce Value Trust, Inc. (the "Fund") as of December 31, 2017, the related statements of operations and cash flows for the year ended December 31, 2017, the statement of changes in net assets for each of the two years in the period ended December 31, 2017, including the related notes, and the financial highlights for each of the three years in the period ended December 31, 2017 (collectively referred to as the “financial statements”). In our opinion, the financial statements present fairly, in all material respects, the financial position of the Fund as of December 31, 2017, the results of its operations and its cash flows for the year then ended, the changes in its net assets for each of the two years in the period ended December 31, 2017 and the financial highlights for each of the three years in the period ended December 31, 2017 in conformity with accounting principles generally accepted in the United States of America.
The financial statements of the Fund as of and for the year ended December 31, 2014 and the financial highlights for each of the periods ended on or prior to December 31, 2014 (not presented herein, other than the financial highlights) were audited by other auditors whose report dated February 23, 2015 expressed an unqualified opinion on those financial statements and financial highlights.
Basis for Opinion
These financial statements are the responsibility of the Fund’s management. Our responsibility is to express an opinion on the Fund’s financial statements based on our audits. We are a public accounting firm registered with the Public Company Accounting Oversight Board (United States) (“PCAOB”) and are required to be independent with respect to the Fund in accordance with the U.S. federal securities laws and the applicable rules and regulations of the Securities and Exchange Commission and the PCAOB.
We conducted our audits of these financial statements in accordance with the standards of the PCAOB. Those standards require that we plan and perform the audit to obtain reasonable assurance about whether the financial statements are free of material misstatement, whether due to error or fraud.
Our audits included performing procedures to assess the risks of material misstatement of the financial statements, whether due to error or fraud, and performing procedures that respond to those risks. Such procedures included examining, on a test basis, evidence regarding the amounts and disclosures in the financial statements. Our audits also included evaluating the accounting principles used and significant estimates made by management, as well as evaluating the overall presentation of the financial statements. Our procedures included confirmation of securities owned as of December 31, 2017 by correspondence with the custodian and broker; when replies were not received from brokers, we performed other auditing procedures. We believe that our audits provide a reasonable basis for our opinion.
/s/PricewaterhouseCoopers LLP
Baltimore, MD
February 22, 2018
We have served as the auditor of one or more investment companies in the Royce investment company group since at least 1967. We have not determined the specific year we began serving as auditor.
60 | 2017 Annual Report to Stockholders
This page is intentionally left blank.
2017 Annual Report to Stockholders | 61
History Since Inception
The following table details the share accumulations by an initial investor in the Funds who reinvested all distributions and participated fully in primary subscriptions for each of the rights offerings. Full participation in distribution reinvestments and rights offerings can maximize the returns available to a long-term investor. This table should be read in conjunction with the Performance and Portfolio Reviews of the Funds.
| HISTORY | | | | | AMOUNT INVESTED | | | PURCHASE PRICE1 | | | | SHARES | | | | NAV VALUE2 | | | | MARKET VALUE2 |
| |
| Royce Global Value Trust | | | | | | | | | | | | | | | | | | |
| 10/17/13 | | Initial Purchase | | $ | 8,975 | | $ | 8.975 | | | | 1,000 | | | $ | 9,780 | | | $ | 8,975 |
| |
| 12/11/14 | | Distribution $0.15 | | | | | | 7.970 | | | | 19 | | | | 9,426 | | | | 8,193 |
| |
| 12/10/15 | | Distribution $0.10 | | | | | | 7.230 | | | | 14 | | | | 9,101 | | | | 7,696 |
| |
| 12/9/16 | | Distribution $0.14 | | | | | | 7.940 | | | | 18 | | | | 10,111 | | | | 8,446 |
| |
| 12/12/17 | | Distribution $0.11 | | | | | | 10.610 | | | | 11 | | | | | | | | |
| |
| 12/31/17 | | | | $ | 8,975 | | | | | | | 1,062 | | | $ | 13,254 | | | $ | 11,484 |
| |
| | | | | | | | | | | | | | | | | | | | | |
| Royce Micro-Cap Trust | | | | | | | | | | | | | | | | | | |
| 12/14/93 | | Initial Purchase | | $ | 7,500 | | $ | 7.500 | | | | 1,000 | | | $ | 7,250 | | | $ | 7,500 |
| |
| 10/28/94 | | Rights Offering | | | 1,400 | | | 7.000 | | | | 200 | | | | | | | | |
| |
| 12/19/94 | | Distribution $0.05 | | | | | | 6.750 | | | | 9 | | | | 9,163 | | | | 8,462 |
| |
| 12/7/95 | | Distribution $0.36 | | | | | | 7.500 | | | | 58 | | | | 11,264 | | | | 10,136 |
| |
| 12/6/96 | | Distribution $0.80 | | | | | | 7.625 | | | | 133 | | | | 13,132 | | | | 11,550 |
| |
| 12/5/97 | | Distribution $1.00 | | | | | | 10.000 | | | | 140 | | | | 16,694 | | | | 15,593 |
| |
| 12/7/98 | | Distribution $0.29 | | | | | | 8.625 | | | | 52 | | | | 16,016 | | | | 14,129 |
| |
| 12/6/99 | | Distribution $0.27 | | | | | | 8.781 | | | | 49 | | | | 18,051 | | | | 14,769 |
| |
| 12/6/00 | | Distribution $1.72 | | | | | | 8.469 | | | | 333 | | | | 20,016 | | | | 17,026 |
| |
| 12/6/01 | | Distribution $0.57 | | | | | | 9.880 | | | | 114 | | | | 24,701 | | | | 21,924 |
| |
| 2002 | | Annual distribution total $0.80 | | | | | | 9.518 | | | | 180 | | | | 21,297 | | | | 19,142 |
| |
| 2003 | | Annual distribution total $0.92 | | | | | | 10.004 | | | | 217 | | | | 33,125 | | | | 31,311 |
| |
| 2004 | | Annual distribution total $1.33 | | | | | | 13.350 | | | | 257 | | | | 39,320 | | | | 41,788 |
| |
| 2005 | | Annual distribution total $1.85 | | | | | | 13.848 | | | | 383 | | | | 41,969 | | | | 45,500 |
| |
| 2006 | | Annual distribution total $1.55 | | | | | | 14.246 | | | | 354 | | | | 51,385 | | | | 57,647 |
| |
| 2007 | | Annual distribution total $1.35 | | | | | | 13.584 | | | | 357 | | | | 51,709 | | | | 45,802 |
| |
| 2008 | | Annual distribution total $1.193 | | | | | | 8.237 | | | | 578 | | | | 28,205 | | | | 24,807 |
| |
| 3/11/09 | | Distribution $0.223 | | | | | | 4.260 | | | | 228 | | | | 41,314 | | | | 34,212 |
| |
| 12/2/10 | | Distribution $0.08 | | | | | | 9.400 | | | | 40 | | | | 53,094 | | | | 45,884 |
| |
| 2011 | | Annual distribution total $0.533 | | | | | | 8.773 | | | | 289 | | | | 49,014 | | | | 43,596 |
| |
| 2012 | | Annual distribution total $0.51 | | | | | | 9.084 | | | | 285 | | | | 57,501 | | | | 49,669 |
| |
| 2013 | | Annual distribution total $1.38 | | | | | | 11.864 | | | | 630 | | | | 83,110 | | | | 74,222 |
| |
| 2014 | | Annual distribution total $2.90 | | | | | | 10.513 | | | | 1,704 | | | | 86,071 | | | | 76,507 |
| |
| 2015 | | Annual distribution total $1.26 | | | | | | 7.974 | | | | 1,256 | | | | 75,987 | | | | 64,222 |
| |
| 2016 | | Annual distribution total $0.64 | | | | | | 7.513 | | | | 779 | | | | 92,689 | | | | 78,540 |
| |
| 2017 | | Annual distribution total $0.69 | | | | | | 8.746 | | | | 783 | | | | | | | | |
| |
| 12/31/17 | | | | $ | 8,900 | | | | | | | 10,408 | | | $ | 109,076 | | | $ | 98,252 |
| |
| 1 | The purchase price used for annual distribution totals is a weighted average of the distribution reinvestment prices for the year. |
| 2 | Values are stated as of December 31 of the year indicated, after reinvestment of distributions, other than for initial purchase. |
| 3 | Includes a return of capital. |
| 62 | 2017 Annual Report to Stockholders |
History Since Inception (continued)
| HISTORY | | | | | | AMOUNT INVESTED | | | | PURCHASE PRICE1 | | | | SHARES | | | | NAV VALUE2 | | | | MARKET VALUE2 |
| |
| Royce Value Trust | | | | | | | | | | | | | | | | | | | |
| 11/26/86 | | | Initial Purchase | | $ | 10,000 | | | $ | 10.000 | | | | 1,000 | | | $ | 9,280 | | | $ | 10,000 |
| |
| 10/15/87 | | | Distribution $0.30 | | | | | | | 7.000 | | | | 42 | | | | | | | | |
| |
| 12/31/87 | | | Distribution $0.22 | | | | | | | 7.125 | | | | 32 | | | | 8,578 | | | | 7,250 |
| |
| 12/27/88 | | | Distribution $0.51 | | | | | | | 8.625 | | | | 63 | | | | 10,529 | | | | 9,238 |
| |
| 9/22/89 | | | Rights Offering | | | 405 | | | | 9.000 | | | | 45 | | | | | | | | |
| |
| 12/29/89 | | | Distribution $0.52 | | | | | | | 9.125 | | | | 67 | | | | 12,942 | | | | 11,866 |
| |
| 9/24/90 | | | Rights Offering | | | 457 | | | | 7.375 | | | | 62 | | | | | | | | |
| |
| 12/31/90 | | | Distribution $0.32 | | | | | | | 8.000 | | | | 52 | | | | 11,713 | | | | 11,074 |
| |
| 9/23/91 | | | Rights Offering | | | 638 | | | | 9.375 | | | | 68 | | | | | | | | |
| |
| 12/31/91 | | | Distribution $0.61 | | | | | | | 10.625 | | | | 82 | | | | 17,919 | | | | 15,697 |
| |
| 9/25/92 | | | Rights Offering | | | 825 | | | | 11.000 | | | | 75 | | | | | | | | |
| |
| 12/31/92 | | | Distribution $0.90 | | | | | | | 12.500 | | | | 114 | | | | 21,999 | | | | 20,874 |
| |
| 9/27/93 | | | Rights Offering | | | 1,469 | | | | 13.000 | | | | 113 | | | | | | | | |
| |
| 12/31/93 | | | Distribution $1.15 | | | | | | | 13.000 | | | | 160 | | | | 26,603 | | | | 25,428 |
| |
| 10/28/94 | | | Rights Offering | | | 1,103 | | | | 11.250 | | | | 98 | | | | | | | | |
| |
| 12/19/94 | | | Distribution $1.05 | | | | | | | 11.375 | | | | 191 | | | | 27,939 | | | | 24,905 |
| |
| 11/3/95 | | | Rights Offering | | | 1,425 | | | | 12.500 | | | | 114 | | | | | | | | |
| |
| 12/7/95 | | | Distribution $1.29 | | | | | | | 12.125 | | | | 253 | | | | 35,676 | | | | 31,243 |
| |
| 12/6/96 | | | Distribution $1.15 | | | | | | | 12.250 | | | | 247 | | | | 41,213 | | | | 36,335 |
| |
| 1997 | | | Annual distribution total $1.21 | | | | | | | 15.374 | | | | 230 | | | | 52,556 | | | | 46,814 |
| |
| 1998 | | | Annual distribution total $1.54 | | | | | | | 14.311 | | | | 347 | | | | 54,313 | | | | 47,506 |
| |
| 1999 | | | Annual distribution total $1.37 | | | | | | | 12.616 | | | | 391 | | | | 60,653 | | | | 50,239 |
| |
| 2000 | | | Annual distribution total $1.48 | | | | | | | 13.972 | | | | 424 | | | | 70,711 | | | | 61,648 |
| |
| 2001 | | | Annual distribution total $1.49 | | | | | | | 15.072 | | | | 437 | | | | 81,478 | | | | 73,994 |
| |
| 2002 | | | Annual distribution total $1.51 | | | | | | | 14.903 | | | | 494 | | | | 68,770 | | | | 68,927 |
| |
| 1/28/03 | | | Rights Offering | | | 5,600 | | | | 10.770 | | | | 520 | | | | | | | | |
| |
| 2003 | | | Annual distribution total $1.30 | | | | | | | 14.582 | | | | 516 | | | | 106,216 | | | | 107,339 |
| |
| 2004 | | | Annual distribution total $1.55 | | | | | | | 17.604 | | | | 568 | | | | 128,955 | | | | 139,094 |
| |
| 2005 | | | Annual distribution total $1.61 | | | | | | | 18.739 | | | | 604 | | | | 139,808 | | | | 148,773 |
| |
| 2006 | | | Annual distribution total $1.78 | | | | | | | 19.696 | | | | 693 | | | | 167,063 | | | | 179,945 |
| |
| 2007 | | | Annual distribution total $1.85 | | | | | | | 19.687 | | | | 787 | | | | 175,469 | | | | 165,158 |
| |
| 2008 | | | Annual distribution total $1.723 | | | | | | | 12.307 | | | | 1,294 | | | | 95,415 | | | | 85,435 |
| |
| 3/11/09 | | | Distribution $0.323 | | | | | | | 6.071 | | | | 537 | | | | 137,966 | | | | 115,669 |
| |
| 12/2/10 | | | Distribution $0.03 | | | | | | | 13.850 | | | | 23 | | | | 179,730 | | | | 156,203 |
| |
| 2011 | | | Annual distribution total $0.783 | | | | | | | 13.043 | | | | 656 | | | | 161,638 | | | | 139,866 |
| |
| 2012 | | | Annual distribution total $0.80 | | | | | | | 13.063 | | | | 714 | | | | 186,540 | | | | 162,556 |
| |
| 2013 | | | Annual distribution total $2.194 | | | | | | | 16.647 | | | | 1,658 | | | | 250,219 | | | | 220,474 |
| |
| 2014 | | | Annual distribution total $1.82 | | | | | | | 14.840 | | | | 1,757 | | | | 252,175 | | | | 222,516 |
| |
| 2015 | | | Annual distribution total $1.24 | | | | | | | 12.725 | | | | 1,565 | | | | 231,781 | | | | 201,185 |
| |
| 2016 | | | Annual distribution total $1.02 | | | | | | | 12.334 | | | | 1,460 | | | | 293,880 | | | | 248,425 |
| |
| 2017 | | | Annual distribution total $1.16 | | | | | | | 14.841 | | | | 1,495 | | | | | | | | |
| |
| 12/31/17 | | | | | $ | 21,922 | | | | | | | | 20,048 | | | $ | 350,840 | | | $ | 324,176 |
| |
| 1 | The purchase price used for annual distribution totals is a weighted average of the distribution reinvestment prices for the year. |
| 2 | Values are stated as of December 31 of the year indicated, after reinvestment of distributions, other than for initial purchase. |
| 3 | Includes a return of capital. |
| 4 | Includes Royce Global Value Trust spin-off of $1.40 per share. |
| 2017 Annual Report to Stockholders | 63 |
| Distribution Reinvestment and Cash Purchase Options |
| Why should I reinvest my distributions? |
| By reinvesting distributions, a stockholder can maintain an undiluted investment in the Fund. The regular reinvestment of distributions has a significant impact on stockholder returns. In contrast, the stockholder who takes distributions in cash is penalized when shares are issued below net asset value to other stockholders. |
| |
| How does the reinvestment of distributions from the Royce closed-end funds work? |
| The Funds automatically issue shares in payment of distributions unless you indicate otherwise. The shares are generally issued at the lower of the market price or net asset value on the valuation date. |
| |
| How does this apply to registered stockholders? |
| If your shares are registered directly with a Fund, your distributions are automatically reinvested unless you have otherwise instructed the Funds’ transfer agent, Computershare, in writing, in which case you will receive your distribution in cash. A registered stockholder also may have the option to receive the distribution in the form of a stock certificate. |
| |
| What if my shares are held by a brokerage firm or a bank? |
| If your shares are held by a brokerage firm, bank, or other intermediary as the stockholder of record, you should contact your brokerage firm or bank to be certain that it is automatically reinvesting distributions on your behalf. If they are unable to reinvest distributions on your behalf, you should have your shares registered in your name in order to participate. |
| |
| What other features are available for registered stockholders? |
| The Distribution Reinvestment and Cash Purchase Plans also allow registered stockholders to make optional cash purchases of shares of a Fund’s common stock directly through Computershare on a monthly basis, and to deposit certificates representing your RVT and RMT shares with Computershare for safekeeping. (RGT does not issue shares in certificated form). Plan participants are subject to a $0.75 service fee for each voluntary cash purchase under the Plans. The Funds’ investment adviser absorbed all commissions on optional cash purchases under the Plans through December 31, 2017. |
| |
| How do the Plans work for registered stockholders? |
| Computershare maintains the accounts for registered stockholders in the Plans and sends written confirmation of all transactions in the account. Shares in the account of each participant will be held by Computershare in non-certificated form in the name of the participant, and each participant will be able to vote those shares at a stockholder meeting or by proxy. A participant may also send stock certificates for RVT and RMT held by them to Computershare to be held in non-certificated form. RGT does not issue shares in certificated form. There is no service fee charged to participants for reinvesting distributions. If a participant elects to sell shares from a Plan account, Computershare will deduct a $2.50 service fee from the sale transaction. The Funds’ investment adviser absorbed all commissions on optional sales under the Plans through December 31, 2017. If a nominee is the registered owner of your shares, the nominee will maintain the accounts on your behalf. |
| |
| How can I get more information on the Plans? |
You can call an Investor Services Representative at (800) 221-4268 or you can request a copy of the Plan for your Fund from Computershare. All correspondence (including notifications) should be directed to: [Name of Fund] Distribution Reinvestment and Cash Purchase Plan, c/o Computershare, PO Box 43078, Providence, RI 02940-3078, telephone (800) 426-5523 (from 9:00 A.M. to 5:00 P.M.). |
| 64 | 2017 Annual Report to Stockholders |
Directors and Officers
All Directors and Officers may be reached c/o The Royce Funds, 745 Fifth Avenue, New York, NY 10151
Charles M. Royce, Director1
Age: 78 | Number of Funds Overseen: 22 | Tenure: Since 1982
Non-Royce Directorships: Director of TICC Capital Corp.
Principal Occupation(s) During Past Five Years: Chairman of the Board of Managers of Royce & Associates, LP (“Royce”), the Funds’ investment adviser; Chief Executive Officer (1972–June 2016), President (1972-June 2014) of Royce.
Christopher D. Clark, Director1, President
Age: 52 | Number of Funds Overseen: 22 | Tenure: Since 2014
Principal Occupation(s) During Past Five Years: Chief Executive Officer (since July 2016), President (since July 2014), Co-Chief Investment Officer (Since January 2014), Managing Director of Royce, a Member of the Board of Managers of Royce, having been employed by Royce since May 2007.
Patricia W. Chadwick, Director
Age: 69 | Number of Funds Overseen: 22 | Tenure: Since 2009
Non-Royce Directorships: Trustee of ING Mutual Funds and Director of Wisconsin Energy Corp.
Principal Occupation(s) During Past 5 Years: Consultant and President of Ravengate Partners LLC (since 2000).
Christopher C. Grisanti, Director
Age 56 | Number of Funds Overseen: 22 | Tenure: Since 2017
Non-Royce Directorships: None
Principal Occupation(s) During Past Five Years: Co-Founder and Chief Executive Officer of Grisanti Capital Management LLC, an investment advisory firm (since 1999). Mr. Grisanti’s prior business experience includes serving as Director of Research and Portfolio Manager at Spears Benzak, Salomon & Farrell (from 1994 to 1999) and a senior associate at the law firm of Simpson, Thacher & Bartlett (from 1988 to 1994).
Stephen L. Isaacs, Director
Age: 78 | Number of Funds Overseen: 22 | Tenure: Since 1989
Non-Royce Directorships: None
Principal Occupation(s) During Past Five Years: Attorney and President of Health Policy Associates, Inc., consultants. Mr. Isaacs’s prior business experience includes having served as President of the Center for Health and Social Policy (from 1996 to 2012); Director of Columbia University Development Law and Policy Program and Professor at Columbia University (until August 1996).
Arthur S. Mehlman, Director
Age: 75 | Number of Funds Overseen: 40 | Tenure: Since 2004
Non-Royce Directorships: Director/Trustee of registered investment companies constituting the 18 Legg Mason Funds.
Principal Occupation(s) During Past Five Years: Director of The League for People with Disabilities, Inc.; Director of University of Maryland Foundation (non-profits). Formerly: Director of Municipal Mortgage & Equity, LLC (from October 2004 to April 1, 2011); Director of University of Maryland College Park Foundation (non-profit) (from 1998 to 2005); Partner, KPMG LLP (international accounting firm) (from 1972 to 2002); Director of Maryland Business Roundtable for Education (from July 1984 to June 2002).
David L. Meister, Director
Age: 78 | Number of Funds Overseen: 22 | Tenure: Since 1982
Non-Royce Directorships: None
Principal Occupation(s) During Past Five Years: Consultant. Chairman and Chief Executive Officer of The Tennis Channel (from June 2000 to March 2005). Mr. Meister’s prior business experience includes having served as Chief Executive Officer of Seniorlife.com, a consultant to the communications industry, President of Financial News Network, Senior Vice President of HBO, President of Time-Life Films, and Head of Broadcasting for Major League Baseball.
G. Peter O’Brien, Director
Age: 72 | Number of Funds Overseen: 40 | Tenure: Since 2001
Non-Royce Directorships: Director/Trustee of registered investment companies constituting the 18 Legg Mason Funds; Director of TICC Capital Corp.
Principal Occupation(s) During Past Five Years: Trustee Emeritus of Colgate University (since 2005); Board Member of Hill House, Inc. (since 1999); Formerly: Trustee of Colgate University (from 1996 to 2005), President of Hill House, Inc. (from 2001 to 2005) and Managing Director/Equity Capital Markets Group of Merrill Lynch & Co. (from 1971 to 1999).
Michael K. Shields, Director
Age: 59 | Number of Funds Overseen: 22 | Tenure: Since 2015
Principal Occupation(s) During Past Five Years: President and Chief Executive Officer of Piedmont Trust Company, a private North Carolina trust company (since May 2012). Mr. Shields’s prior business experience includes owning Shields Advisors, an investment consulting firm (from April 2010 to June 2012).
Francis D. Gannon, Vice President
Age: 50 | Tenure: Since 2014
Principal Occupation(s) During Past Five Years: Co-Chief Investment Officer (since January 2014) and Managing Director of Royce, having been employed by Royce since September 2006.
Daniel A. O’Byrne, Vice President
Age: 55 | Tenure: Since 1994
Principal Occupation(s) During Past Five Years: Principal and Vice President of Royce, having been employed by Royce since October 1986.
Peter K. Hoglund, Treasurer
Age: 51 | Tenure: Since 2015
Principal Occupation(s) During Past Five Years: Chief Financial Officer, Chief Administrative Officer, and Managing Director of Royce, having been employed by Royce since December 2014. Prior to joining Royce, Mr. Hoglund spent more than 20 years with Munder Capital Management in Birmingham, MI, serving as Managing Director and Chief Financial Officer and overseeing all financial aspects of the firm. He began his career at Munder as a portfolio manager.
John E. Denneen, Secretary and Chief Legal Officer
Age: 50 | Tenure: 1996-2001 and Since 2002
Principal Occupation(s) During Past Five Years: General Counsel, Managing Director, and, since June 2015, a Member of the Board of Managers of Royce. Chief Legal and Compliance Officer and Secretary of Royce.
Lisa Curcio, Chief Compliance Officer
Age: 58 | Tenure: Since 2004
Principal Occupation(s) During Past Five Years: Chief Compliance Officer of The Royce Funds (since October 2004) and Compliance Officer of Royce (since June 2004).
| 1 | Interested Director. |
| | Director will hold office until their successors have been duly elected and qualified or until their earlier resignation or removal. |
2017 Annual Report to Stockholders | 65
Notes to Performance and Other Important Information
The thoughts expressed in this Review and Report concerning recent market movements and future prospects for small company stocks are solely the opinion of Royce at December 31, 2017, and, of course, historical market trends are not necessarily indicative of future market movements. Statements regarding the future prospects for particular securities held in the Funds’ portfolios and Royce’s investment intentions with respect to those securities reflect Royce’s opinions as of December 31, 2017 and are subject to change at any time without notice. There can be no assurance that securities mentioned in this Review and Report will be included in any Royce-managed portfolio in the future. Investments in securities of micro-cap, small-cap and/or mid-cap companies may involve considerably more risk than investments in securities of larger-cap companies. All publicly released material information is always disclosed by the Funds on the website at www.roycefunds.com.
Sector weightings are determined using the Global Industry Classification Standard (“GICS”). GICS was developed by, and is the exclusive property of, Standard & Poor’s Financial Services LLC (“S&P”) and MSCI Inc. (“MSCI”). GICS is the trademark of S&P and MSCI. “Global Industry Classification Standard (GICS)” and “GICS Direct” are service marks of S&P and MSCI.
All indexes referred to are unmanaged and capitalization weighted. Each index’s returns include net reinvested dividends and/or interest income. Russell Investment Group is the source and owner of the trademarks, service marks, and copyrights related to the Russell Indexes. Russell® is a trademark of Russell Investment Group. The Russell 2000 Index is an index of domestic small-cap stocks. It measures the performance of the 2,000 smallest publicly traded U.S. companies in the Russell 3000 Index. The Russell 2000 Value and Growth Indexes consist of the respective value and growth stocks within the Russell 2000 as determined by Russell Investments. The Russell Microcap Index includes 1,000 of the smallest securities in the Russell 2000 Index along with the next smallest eligible securities as determined by Russell. The Russell 1000 Index is an index of domestic large-cap stocks. It measures the performance of the 1,000 largest publicly traded companies in the Russell 3000 Index. The Russell Midcap Index measures the performance of the mid-cap segment of the U.S. equity universe. It includes approximately 800 of the smallest securities in the Russell 1000 Index. The Russell Global Small Cap Index is an unmanaged, capitalization-weighted index of global small-cap stocks. The Russell Global ex-U.S. Large Cap Index is an index of global large-cap stocks, excluding the United States. The Russell Global ex-U.S. Small Cap Index is an index of global small-cap stocks, excluding the United States. The S&P 500 and SmallCap 600 are indexes of U.S. large- and small-cap stocks, respectively, selected by Standard & Poor’s based on market size, liquidity, and industry grouping, among other factors. The Nasdaq Composite is an index of the more than 3,000 common equities listed on the Nasdaq stock exchange. The performance of an index does not represent exactly any particular investment, as you cannot invest directly in an index. Returns for the market indexes used in this report were based on information supplied to Royce by Russell Investments.
The Price-Earnings, or P/E, Ratio is calculated by dividing a company’s share price by its trailing 12-month earnings-per share (EPS). The Price to-Book, or P/B, Ratio is calculated by dividing a company’s share price by its book value per share. For the Morningstar Small Blend Category: © 2017 Morningstar. All Rights Reserved. The information regarding the category in this piece is: (1) is proprietary to Morningstar and/or its content providers; (2) may not be copied or distributed; and (3) is not warranted to be accurate, complete or timely. Neither Morningstar nor its content providers are responsible for any damages or losses arising from any use of this information. The Morningstar Style Map uses proprietary scores of a stock’s value and growth characteristics to determine its placement in one of the five categories listed on the horizontal axis. These characteristics are then compared to those of other stocks within the same market capitalization band. Each is scored from zero to 100 for both value and growth attributes. The value score is subtracted from the growth score to determine the overall style score. For the vertical, market cap axis, Morningstar subdivides into size groups. Giant-cap stocks are defined as those that account for the top 40% of the capitalization of each style zone; large-cap stocks represent the next 30%; mid-cap stocks the next 20%; small-cap stocks the next 7%; micro-cap stocks the smallest 3%. The Royce Funds is a service mark of The Royce Funds. Distributor: Royce Fund Services, LLC.
Forward-Looking Statements
This material contains forward-looking statements within the meaning of the Securities Exchange Act of 1934, as amended (the “Exchange Act”), that involve risks and uncertainties, including, among others, statements as to:
| • | the Funds’ future operating results |
| • | the prospects of the Funds’ portfolio companies |
| • | the impact of investments that the Funds have made or may make |
| • | the dependence of the Funds’ future success on the general economy and its impact on the companies and industries in which the Funds invest, and |
| • | the ability of the Funds’ portfolio companies to achieve their objectives. |
This Review and Report uses words such as “anticipates,” “believes,” “expects,” “future,” “intends,” and similar expressions to identify forward-looking statements. Actual results may differ materially from those projected in the forward-looking statements for any reason.
The Royce Funds have based the forward-looking statements included in this Review and Report on information available to us on the date of the report, and we assume no obligation to update any such forward-looking statements. Although The Royce Funds undertake no obligation to revise or update any forward-looking statements, whether as a result of new information, future events or otherwise, you are advised to consult any additional disclosures that we may make through future stockholder communications or reports.
Authorized Share Transactions
Royce Global Value Trust, Royce Micro-Cap Trust, and Royce Value Trust may each repurchase up to 5% of the issued and outstanding shares of its respective common stock during the year ending December 31, 2017. Any such repurchases would take place at then prevailing prices in the open market or in other transactions. Common stock repurchases would be effected at a price per share that is less than the share’s then current net asset value.
Royce Global Value Trust, Royce Micro-Cap Trust, and Royce Value Trust are also authorized to offer their common stockholders an opportunity to subscribe for additional shares of their common stock through rights offerings at a price per share that may be less than the share’s then current net asset value. The timing and terms of any such offerings are within each Board’s discretion.
Annual Certifications
As required, the Funds have submitted to the New York Stock Exchange (“NYSE”) for the annual certification of the Funds’ Chief Executive Officer that he is not aware of any violation of the NYSE’s listing standards. The Funds also have included the certification of the Funds’ Chief Executive Officer and Chief Financial Officer required by section 302 of the Sarbanes-Oxley Act of 2002 as exhibits to the Funds’ form N-CSR for the period ended December 31, 2016, filed with the Securities and Exchange Commission.
Proxy Voting
A copy of the policies and procedures that The Royce Funds use to determine how to vote proxies relating to portfolio securities and information regarding how each of The Royce Funds voted proxies relating to portfolio securities during the most recent 12-month period ended June 30 is available, without charge, on The Royce Funds’ website at www.roycefunds.com, by calling (800) 221-4268 (toll-free) and on the website of the Securities and Exchange Commission (“SEC”), at www.sec.gov.
Form N-Q Filing
The Funds file their complete schedules of investments with the SEC for the first and third quarters of each fiscal year on Form N-Q. The Funds’ Forms N-Q are available on the SEC’s website at www.sec.gov. The Royce Funds’ holdings are also on the Funds’ website approximately 15 to 20 days after each calendar quarter end and remain available until the next quarter’s holdings are posted. The Funds’ Forms N-Q may also be reviewed and copied at the SEC’s Public Reference Room in Washington, D.C. To find out more about this public service, call the SEC at (800) 732-0330. The Funds’ complete schedules of investments are updated quarterly, and are available at www.roycefunds.com.
66 | 2017 Annual Report to Stockholders
Results of Stockholders Meeting
Royce Global Value Trust, Inc.
At the 2017 Annual Meeting of Stockholders held on September 28, 2017, the Fund’s stockholders elected three Directors, consisting of:
| | | VOTES FOR | | VOTES WITHHELD |
| |
| Stephen L. Isaacs | | 8,844,487 | | 182,288 |
| |
| Christopher D. Clark | | 8,900,214 | | 126,562 |
| |
| Christopher C. Grisanti | | 8,841,967 | | 184,808 |
| |
Royce Micro-Cap Trust, Inc.
At the 2017 Annual Meeting of Stockholders held on September 28, 2017, the Fund’s stockholders elected three Directors, consisting of:
| | | VOTES FOR | | VOTES WITHHELD |
| |
| Stephen L. Isaacs | | 33,915,596 | | 430,464 |
| |
| Christopher D. Clark | | 34,044,756 | | 301,304 |
| |
| Christopher C. Grisanti | | 33,919,361 | | 426,699 |
| |
Royce Value Trust, Inc.
At the 2017 Annual Meeting of Stockholders held on September 28, 2017, the Fund’s stockholders elected three Directors, consisting of:
| | | VOTES FOR | | VOTES WITHHELD |
| |
| Stephen L. Isaacs | | 70,538,590 | | 1,550,816 |
| |
| Christopher D. Clark | | 71,095,361 | | 994,046 |
| |
| Christopher C. Grisanti | | 70,532,547 | | 1,556,859 |
| |
2017 Annual Report to Stockholders | 67
This page is intentionally left blank.
| | | | | | |
| |
 | |
| | | | | | |
| | | | | | |
| | | | | | |
| | About The Royce Funds | | | Contact Us | |
| | | | | | |
| | | | | | |
| | Unparalleled Knowledge + Experience
Pioneers in small-cap investing, with 40+ years of experience, depth of knowledge, and focus.
Independent Thinking
The confidence to go against consensus, the insight to uncover opportunities others might miss, and the tenacity to stay the course through market cycles.
Specialized Approaches
Strategies that use value, core, or growth investment approaches to select micro-cap, small-cap, and mid-cap companies.
Unwavering Commitment
Our team of 17 portfolio managers have significant personal investments in the strategies they manage. | | | GENERAL INFORMATION
General Royce Funds information including an overview of our firm and Funds
(800) 221-4268
COMPUTERSHARE
Transfer Agent and Registrar
Speak with a representative about:
• Your account, transactions, and forms
(800) 426-5523
FINANCIAL ADVISORS AND BROKER-DEALERS
Speak with your regional Royce contact regarding:
• Information about our firm, strategies, and Funds
• Fund Materials
(800) 337-6923 | |
| | | | | | |
| | | | | | |
| | | | | | |
| | | | | | |
| |
| | | | | | |
| | | | | | |
| | | | | | |
| |  | | |  |  |
| | | | | | |
| | | | | | |
Item 2. Code(s) of Ethics. As of the end of the period covered by this report, the Registrant had adopted a code of ethics, as defined in Item 2 of Form N-CSR, applicable to its principal executive officer, principal financial officer, principal accounting officer or controller, or persons performing similar functions. A copy of this code of ethics is filed as an exhibit to this Form N-CSR. No substantive amendments were approved or waivers were granted to this code of ethics during the period covered by this report.
Item 3. Audit Committee Financial Expert.
| (a)(1) | The Board of Directors of the Registrant has determined that it has an audit committee financial expert. |
| (a)(2) | Arthur S. Mehlman and Patricia W. Chadwick were designated by the Board of Directors as the Registrant’s Audit Committee Financial Experts, effective April 15, 2004 and April 8, 2010, respectively. Mr. Mehlman and Ms. Chadwick are “independent” as defined under Item 3 of Form N-CSR. |
Item 4. Principal Accountant Fees and Services.
Year ended December 31, 2017 - $35,027
Year ended December 31, 2016 - $34,340
Year ended December 31, 2017 - $0
Year ended December 31, 2016 - $0
Year ended December 31, 2017 - $9,550 - Preparation of tax returns
Year ended December 31, 2016 - $9,360 - Preparation of tax returns
Year ended December 31, 2017 - $0
Year ended December 31, 2016 - $0
(e)(1) Annual Pre-Approval: On an annual basis, the Registrant’s independent auditor submits to the Audit Committee a schedule of proposed audit, audit-related, tax and other non-audit services to be rendered to the Registrant and/or investment adviser(s) for the following year that require pre-approval by the Audit Committee. This schedule provides a description of each type of service that is expected to require pre-approval and the maximum fees that can be paid for each such service without further Audit Committee approval. The Audit Committee then reviews and determines whether to approve the types of scheduled services and the projected fees for them. Any subsequent revision to already pre-approved services or fees (including fee increases) are presented for consideration at the next regularly scheduled Audit Committee meeting, as needed.
If subsequent to the annual pre-approval of services and fees by the Audit Committee, the Registrant or one of its affiliates determines that it would like to engage the Registrant’s independent auditor to perform a service not already pre-approved, the request is to be submitted to the Registrant’s Chief Financial Officer, and if he or she determines that the service fits within the independence guidelines (e.g., it is not a prohibited service), he or she will then arrange for a discussion of the proposed service and fee to be included on the agenda for the next regularly scheduled Audit Committee meeting so that pre-approval can be considered.
Interim Pre-Approval: If, in the judgment of the Registrant's Chief Financial Officer, a proposed engagement needs to commence before the next regularly scheduled Audit Committee meeting, he or she shall submit a written summary of the proposed engagement to all members of the Audit Committee, outlining the services, the estimated maximum cost, the category of the services (e.g., audit, audit-related, tax or other) and the rationale for engaging the Registrant’s independent auditor to perform the services. To the extent the proposed engagement involves audit, audit-related or tax services, any individual member of the Audit Committee who is an independent Board member is authorized to pre-approve the engagement. To the extent the proposed engagement involves non-audit services other than audit-related or tax, the Chairman of the Audit Committee is authorized to pre-approve the engagement. The Registrant’s Chief Financial Officer will arrange for this interim review and
coordinate with the appropriate member(s) of the Committee. The independent auditor may not commence the engagement under consideration until the Registrant’s Chief Financial Officer has informed the auditor in writing that pre-approval has been obtained from the Audit Committee or an individual member who is an independent Board member. The member of the Audit Committee who pre-approves any engagements in between regularly scheduled Audit Committee meetings is to report, for informational purposes only, any pre-approval decisions to the Audit Committee at its next regularly scheduled meeting.
(e)(2) Not Applicable
(f) Not Applicable
(g) Year ended December 31, 2017 - $9,550
Year ended December 31, 2016 - $9,360
| (h) | No such services were rendered during 2017 or 2016. |
Item 5. Audit Committee of Listed Registrants. The Registrant has a separately designated standing audit committee established in accordance with Section 3(a)(58)(A) of the Securities Exchange Act of 1934. Patricia W. Chadwick, Richard M. Galkin, Stephen L. Isaacs, Arthur S. Mehlman, David L. Meister and G. Peter O’Brien are members of the Registrant’s audit committee.
Item 6. Investments.
(a) See Item 1.
(b) Not applicable.
Item 7. Disclosure of Proxy Voting Policies and Procedures for Closed-End Management Investment Companies.
Royce & Associates, LP (“Royce”) has adopted written proxy voting policies and procedures (the “Proxy Voting Procedures”) for itself and client accounts for which Royce is responsible for voting proxies. Royce is generally granted proxy voting authority at the inception of its management of each client account. Proxy voting authority is generally either (i) specifically authorized in the applicable investment management agreement or other instrument; or (ii) where not specifically authorized, is granted to Royce where general investment discretion is given to Royce in the applicable investment management agreement. In voting proxies, Royce is guided by general fiduciary principles. Royce’s goal is to act prudently, solely in the best interest of the beneficial owners of the accounts it manages. Royce attempts to consider all factors of its vote that could affect the value of the investment and will vote proxies in the manner it believes will be consistent with efforts to enhance and/or protect stockholder value.
Royce’s personnel are responsible for monitoring receipt of all proxies and seeking to ensure that proxies are received for all securities for which Royce has proxy voting authority. Royce is not responsible for voting proxies it does not receive. Royce divides proxies into "regularly recurring" and "non-regularly recurring" matters. Examples of regularly recurring matters include non-contested elections of directors and non-contested approvals of independent auditors. Royce’s personnel are responsible for developing and maintaining a list of matters Royce treats as “regularly recurring” and for ensuring that instructions from a Royce Co-Chief Investment Officer are followed when voting those matters on behalf of Royce clients. Non-regularly recurring matters are all other proxy matters and are brought to the attention of the relevant portfolio manager(s) for the applicable account(s). After giving consideration to advisories provided by an independent third party research firm with respect to such non-regularly recurring matters, the portfolio manager(s) directs that such matters be voted in a way that he or she believes should better protect or enhance the value of the investment.
Certain Royce portfolio managers may provide instructions that they do not want regularly recurring matters to be voted in accordance with the standing instructions for their accounts and individual voting instructions on all matters, both regularly recurring and non-regularly recurring, will be obtained from such portfolio managers. Under certain circumstances, Royce may also vote against a proposal from the issuer's board of directors or management. Royce's portfolio managers decide these issues on a case-by-case basis. A portfolio manager of Royce
may, on occasion, decide to abstain from voting a proxy or a specific proxy item when such person concludes that the potential benefit of voting is outweighed by the cost or when it is not in the client's best interest to vote.
There may be circumstances where Royce may not be able to vote proxies in a timely manner, including, but not limited to, (i) when certain securities are out on loan at the time of a record date; (ii) when administrative or operational constraints impede Royce’s ability to cast a timely vote, such as late receipt of proxy voting information; and/or (iii) when systems, administrative or processing errors occur (including errors by Royce or third party vendors).
To further Royce's goal to vote proxies in the best interests of its client, Royce follows specific procedures outlined in the Proxy Voting Procedures to identify, assess and address material conflicts that may arise between Royce's interests and those of its clients before voting proxies on behalf of such clients. In the event such a material conflict of interest is identified, the proxy will be voted by Royce in accordance with the recommendation given by an independent third party research firm.
You may obtain a copy of the Proxy Voting Procedures at www.roycefunds.com or by calling 212-508-4500. Additionally, you can obtain information on how your securities were voted by calling 212-508-4500.
Item 8. Portfolio Managers of Closed-End Management Investment Companies.
(a)(1) Portfolio Managers of Closed-End Management Investment Companies (information as of December 31, 2017)
Name | Title | Length of Service | Principal Occupation(s) During Past 5 Years |
| Charles M. Royce | Portfolio Manager and Member of the Board of Directors of the Registrant | Since 1993 | Chairman of the Board of Managers of Royce & Associates, LP (“Royce”), investment adviser to the Registrant, Member of the boards of directors/trustees of the Registrant, Royce Value Trust, Inc. ("RVT"), Royce Global Value Trust, Inc. ("RGT"),The Royce Fund (“TRF”) and Royce Capital Fund ("RCF") (collectively, "The Royce Funds"). | |
| Chris E. Flynn | Assistant Portfolio Manager* | Since April 1, 2007 | Assistant Portfolio Manager of the Registrant (since April 1, 2007); and Principal, Portfolio Manager and Senior Analyst at Royce (since 1993). | |
| James J. Harvey | Assistant Portfolio Manager* | Since April 1, 2007 | Assistant Portfolio Manager of the Registrant (since April 1, 2007); and Portfolio Manager and Analyst at Royce (since 1999). | |
| | | | | | |
* Assistant Portfolio Managers may have investment discretion over a portion of the Registrant’s portfolio subject to the supervision of Registrant’s Portfolio Manager.
(a)(2) Other Accounts Managed by Portfolio Manager and Potential Conflicts of Interest (information as of December 31, 2017)
Other Accounts
Name of
Portfolio
Manager | Type of Account | Number
of Accounts
Managed | Total
Assets
Managed | Number of
Accounts
Managed for which
Advisory Fee is
Performance-Based | Value of Managed Accounts for which Advisory Fee is Performance
Based |
| | | | | | |
| Charles M. Royce | | | | | |
| | Registered investment companies | 8 | 9,126,157,867 | 2 | 1,890,354,369 |
| | Private pooled investment vehicles | 1 | 12,619,047 | 1 | 12,619,047 |
| | Other accounts* | 12 | 51,481,114 | - | - |
| | | | | | |
| Chris E. Flynn | | | | | |
| | Registered investment companies | 6 | 6,582,848,932 | 2 | 1,890,354,369 |
| | Private pooled investment vehicles | - | - | - | - |
| | Other accounts* | - | - | - | - |
| | | | | | |
| James J. Harvey | | | | | |
| | Registered investment companies | 2 | 417,858,059 | 1 | 409,905,340 |
| | Private pooled investment vehicles | - | - | - | - |
| | Other accounts* | - | - | - | - |
| | | | | | |
| | | | | | |
*Other accounts include all other accounts managed by the Portfolio Manager in either a professional or personal capacity except for personal accounts subject to pre-approval and reporting requirements under the Registrant’s Rule 17j-1 Code of Ethics.
Conflicts of Interest
The fact that a Portfolio Manager has day-to-day management responsibility for more than one client account may create actual, potential or only apparent conflicts of interest. For example, the Portfolio Manager may have an opportunity to purchase securities of limited availability. In this circumstance, the Portfolio Manager is expected to review each account's investment guidelines, restrictions, tax considerations, cash balances, liquidity needs and other factors to determine the suitability of the investment for each account and to ensure that his or her managed accounts are treated equitably. The Portfolio Manager may also decide to purchase or sell the same security for multiple managed accounts at approximately the same time. To address any conflicts that this situation may create, the Portfolio Manager will generally combine managed account orders (i.e., enter a "bunched" order) in an effort to obtain best execution or a more favorable commission rate. In addition, if orders to buy or sell a security for multiple accounts managed by common Portfolio Managers on the same day are executed at different prices or commission rates, the transactions will generally be allocated by Royce to each of such managed accounts at the weighted average execution price and commission. In circumstances where a pre-allocated bunched order is not completely filled, each account will normally receive a pro-rated portion of the securities based upon the account's level of participation in the order. Royce may under certain circumstances allocate securities in a manner other than pro-rata if it determines that the allocation is fair and equitable under the circumstances and does not discriminate against any account.
As described below, there is a revenue-based component of each Portfolio Manager's Performance-Related Variable Compensation and the Portfolio Managers also receive Firm-Related Variable Compensation based on revenues (adjusted for certain imputed expenses) generated by Royce. In addition, Charles M. Royce receives variable compensation based on Royce's retained pre-tax profits from operations. As a result, the Portfolio Managers may receive a greater relative benefit from activities that increase the value to Royce of The Royce Funds and/or other Royce client accounts, including, but not limited to, increases in sales of Registrant’s shares and assets under management.
Also, as described above, the Portfolio Managers generally manage more than one client account, including, among others, registered investment company accounts, separate accounts and private pooled accounts managed on behalf of institutions (e.g., pension funds, endowments and foundations) and for high-net-worth individuals. The appearance of a conflict of interest may arise where Royce has an incentive, such as a performance-based management fee (or any other variation in the level of fees payable by the Registrant or other Royce client accounts to Royce), which relates to the management of one or more of The Royce Funds or accounts with respect to which the same Portfolio Manager has day-to-day management responsibilities. Except as described below, no Royce Portfolio Manager's compensation is tied to performance fees earned by Royce for the management of any one client account. Although variable and other compensation derived from Royce revenues or profits is impacted to some extent, the impact is relatively minor given the small percentage of Royce firm assets under management for which Royce receives performance-measured revenue. Notwithstanding the above, the Performance-Related Variable Compensation paid to Charles M. Royce as Portfolio Manager of two registered investment company accounts (the Registrant and RMT) is based, in part, on performance-based fee revenues. The Registrant and RMT pay Royce a fulcrum fee that is adjusted up or down depending on the performance of the Fund relative to its benchmark index.
Finally, conflicts of interest may arise when a Portfolio Manager personally buys, holds or sells securities held or to be purchased or sold for the Registrant or other Royce client account or personally buys, holds or sells the shares of one or more of The Royce Funds. To address this, Royce has adopted a written Code of Ethics designed to prevent and detect personal trading activities that may interfere or conflict with client interests (including Registrant’s stockholders’ interests). Royce generally does not permit its Portfolio Managers to purchase small- or micro-cap securities for their personal investment portfolios.
Royce and The Royce Funds have adopted certain compliance procedures which are designed to address the above-described types of conflicts. However, there is no guarantee that such procedures will detect each and every situation in which a conflict arises.
(a)(3) Description of Portfolio Manager Compensation Structure (information as of December 31, 2017)
Royce seeks to maintain a compensation program that is competitively positioned to attract and retain high-caliber investment professionals. All Portfolio Managers, receive from Royce a base salary, Portfolio-Related Variable Compensation (generally the largest element of each Portfolio Manager’s compensation with the exception of Charles M. Royce), Firm-Related Variable Compensation based primarily on registered investment company and other client account revenues generated by Royce and a benefits package. Portfolio Manager compensation is reviewed and may be modified from time to time as appropriate to reflect changes in the market, as well as to adjust the factors used to determine variable compensation. Except as described below, each Portfolio Manager’s compensation consists of the following elements:
| - | BASE SALARY. Each Portfolio Manager is paid a base salary. In setting the base salary, Royce seeks to be competitive in light of the particular Portfolio Manager’s experience and responsibilities. |
| - | PORTFOLIO-RELATED VARIABLE COMPENSATION. Each Portfolio Manager receives quarterly Portfolio-Related Variable Compensation that is either asset-based, or revenue-based and therefore in part based on the value of the net assets of the account for which he or she is being compensated, determined with reference to each of the registered investment company and other client accounts they are managing. The revenue used to determine the quarterly Portfolio-Related Variable Compensation received by Charles M. Royce that relates to each of RMT and RVT is performance-based fee revenue. |
Payment of the Portfolio-Related Variable Compensation may be deferred, and any amounts deferred are forfeitable, if the Portfolio Manager is terminated by Royce with or without cause or resigns. The amount of the deferred Portfolio-Related Variable Compensation will appreciate or depreciate during the deferral period, based on the total return performance of one or more Royce-managed registered investment company accounts selected by the Portfolio Manager at the beginning of the deferral period. The amount deferred will depend on the Portfolio Manager’s total direct, indirect beneficial and deferred unvested investments in the Royce registered investment company accounts for which he or she is receiving portfolio management compensation.
| - | FIRM-RELATED VARIABLE COMPENSATION. Portfolio Managers receive quarterly variable compensation based on Royce’s net revenues. |
| - | BENEFIT PACKAGE. Portfolio Managers also receive benefits standard for all Royce employees, including health care and other insurance benefits, and participation in Royce’s 401(k) Plan and Money Purchase Pension Plan. From time to time, on a purely discretionary basis, Portfolio Managers may also receive options to acquire stock in Royce’s parent company, Legg Mason, Inc. Those options typically represent a relatively small portion of a Portfolio Manager’s overall compensation. |
(a)(4) Dollar Range of Equity Securities in Registrant Beneficially Owned by Portfolio Manager (information as of December 31, 2017)
The following table shows the dollar range of the Registrant’s shares owned beneficially and of record by the Portfolio Managers, including investments by his immediate family members sharing the same household and amounts invested through retirement and deferred compensation plans.
| Portfolio Manager | Dollar Range of Registrant’s Shares Beneficially Owned |
| Charles M. Royce | Over $1,000,000 |
| Chris E. Flynn | $100,001 to $500,000 |
| James J. Harvey | $10,000 to $50,000 |
(b) Not Applicable
Item 9. Purchases of Equity Securities by Closed-End Management Investment Company and Affiliated Purchasers. Not Applicable
Item 10. Submission of Matters to a Vote of Security Holders. Not Applicable.
Item 11. Controls and Procedures.
(a) Disclosure Controls and Procedures. The Principal Executive and Financial Officers concluded that the Registrant's Disclosure Controls and Procedures are effective based on their evaluation of the Disclosure Controls and Procedures as of a date within 90 days of the filing date of this report.
(b) Internal Control over Financial Reporting. There were no significant changes in Registrant's internal control over financial reporting or in other factors that could significantly affect this control subsequent to the date of the evaluation, including any corrective actions with regard to significant deficiencies and material weaknesses during the second fiscal quarter of the period covered by this report.
Item 12. Exhibits. Attached hereto.
(a)(1) The Registrant’s code of ethics pursuant to Item 2 of Form N-CSR.
(a)(2) Separate certifications by the Registrant’s Principal Executive Officer and Principal Financial Officer as required by Rule 30a-2(a) under the Investment Company Act of 1940.
(a)(3) Not Applicable
(b) Separate certifications by the Registrant’s Principal Executive Officer and Principal Financial Officer, pursuant to Section 906 of the Sarbanes-Oxley Act of 2002 and required by Rule 30a-2(b) under the Investment Company Act of 1940.
Pursuant to the requirements of the Securities Exchange Act of 1934 and the Investment Company Act of 1940, the registrant has duly caused this report to be signed on its behalf by the undersigned, thereunto duly authorized.
ROYCE MICRO-CAP TRUST, INC.
BY: /s/ Christopher D. Clark
Christopher D. Clark
President
Date: March 2, 2018
Pursuant to the requirements of the Securities Exchange Act of 1934 and the Investment Company Act of 1940, this report has been signed below by the following persons on behalf of the registrant and in the capacities and on the dates indicated.
| ROYCE MICRO-CAP TRUST, INC. | ROYCE MICRO-CAP TRUST, INC. |
| | |
| | |
| BY: /s/ Christopher D. Clark | BY: /s/ Peter K. Hoglund |
| Christopher D. Clark | Peter K. Hoglund |
| President | Treasurer |
| | |
| Date: March 2, 2018 | Date: March 2, 2018 |
| | |