Exhibit 99.2
CANADA MORTGAGE AND HOUSING CORPORATION 2023 ANNUAL REPORT To request an alternate format, please contact us at: 1-800-668-2642 700 Montreal Road, contactcentre@cmhc.ca Ottawa, ON K1A 0P7 CMHC.ca

2023 Annual Report 2
4 2023 Highlights 5 National Housing Strategy (NHS) Highlights 6 Message From the Chair 8 Message From the President and CEO 10 Management Discussion and Analysis 11 Our Strategy 14 Our Performance 16 Data, Research and Insights 18 Reconciliation and Indigenous Relations 21 Anti-Racism and Equity 23 Our Culture 24 Our People 26 Business and Financial Highlights 26 Economic and Housing Environment 28 Consolidated Financial Highlights 31 Assisted Housing 35 Mortgage Insurance 39 Mortgage Funding 41 Capital Management 43 Risk Management 45 Climate-Related Financial Risk Disclosures 52 Looking Ahead to 2024 53 Consolidated Financial Statements 143 Corporate Governance 147 Appendix: OSFI Consultations and Guidelines 149 Glossary 152 Historical Information TABLE OF CONTENTS

2023 HIGHLIGHTS $29 billion of Affordability-Linked NHA Mortgage-Backed Securities were issued by Approved Issuers in 2023. More than 48,000 housing units were purchased across Canada with the help of our homeowner insurance products in 2023 (over 15% insured in rural areas). Of the 220,000-plus rental units insured in 2023 close to 40% were for new construction, adding new units to the marketplace. CMB program limit increase, providing funding for CMHC insured loans on multi-unit rental projects. Over 127,000 rental units insured in 2023 were for MLI Select, a mortgage loan insurance product that advances affordability and climate compatibility.
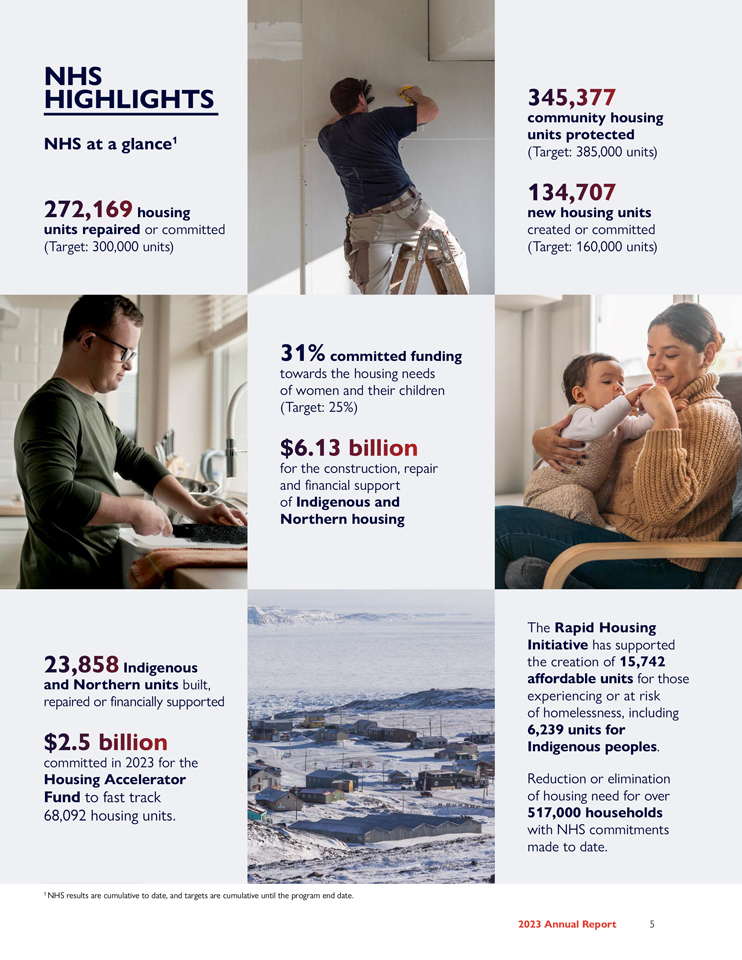
NHS HIGHLIGHTS NHS at a glance1 272,169 housing units repaired or committed (Target: 300,000 units) 345,377 community housing units protected (Target: 385,000 units) 134,707 new housing units created or committed (Target: 160,000 units) 31% committed funding towards the housing needs of women and their children (Target: 25%) $6.13 billion for the construction, repair and financial support of Indigenous and Northern housing 23,858 Indigenous and Northern units built, repaired or financially supported $2.5 billion committed in 2023 for the Housing Accelerator Fund to fast track 68,092 housing units. The Rapid Housing Initiative has supported the creation of 15,742 affordable units for those experiencing or at risk of homelessness, including 6,239 units for Indigenous peoples. Reduction or elimination of housing need for over 517,000 households with NHS commitments made to date. 1 NHS results are cumulative to date, and targets are cumulative until the program end date.

MESSAGE FROM THE CHAIR The year 2023 was one in which Canadians learned a lot about housing and the scale of our country’s housing shortage. Housing affordability led the news consistently. Experts, including many top minds from CMHC, were consulted on the challenge and on solutions. This national focus is a great source of strength as we work together, as a country, to make housing accessible.
Making progress Transforming that attention into roofs over heads doesn’t happen overnight. However, as you’ll see in the pages of this report, progress is being made. This includes real headway toward the ambitious targets set out in the federal government’s National Housing Strategy – which CMHC helps to deliver. CMHC’s industry-leading market intelligence and research work is giving us all a clearer picture, and guiding decision makers toward targeted solutions. Meanwhile, CMHC’s commercial operations – which are separate from government programming and pay dividends back to the federal government – continue to provide stability and liquidity to Canada’s housing system. People behind the numbers You’re going to see a lot of numbers in the following pages, but I ask to read through those to see the people behind them. For example, when you’re reading about the more than 192,700 housing units created and repaired by the Affordable Housing Fund2, know that one of those units is home to Robert in Edmonton, and it changed his life. The Fund supported the Salvation Army Grace Village, a 175-bed supportive housing facility for people like Robert, who need help making the move from chronic homelessness to permanent housing. I’ll speak for all my fellow Board members when I say that we work very hard to keep the Roberts of this country in mind as we oversee and guide CMHC’s work. Leadership changes We also keep in mind the people who produced CMHC’s results, and we said a fond farewell to one of them in 2023. President and CEO Romy Bowers, who left the organization in December, was a great leader for CMHC, and her influence will continue for years to come. I was pleased that Senior Vice-President Michel Tremblay, who’s already had a long career with CMHC, accepted the Board’s request to step in on an interim basis. His steady hands will guide us forward until the Governor in Council appoints a permanent successor, and we thank him for taking on this responsibility. Meanwhile, the government is also in the process of selecting five Board directors, and a new chair. It’s my honour and privilege to continue in the position until the new chair is named. I’ll speak, again, for my fellow Board members when I say it was also a privilege and an honour to be part of CMHC’s work in 2023. And I hope that, as you read through this report, you will see why. Derek Ballantyne Chair, CMHC Board of Directors 2 The 2023 Fall Economic Statement announced changes to the following program names: The Affordable Housing Fund (AHF), formerly known as the National Housing Co-Investment Fund (NHCF) and, The Apartment Construction Loan Program (ACLP), formerly known as the Rental Construction Financing Initiative (RCFi).

MESSAGE FROM THE PRESIDENT AND CEO It’s no understatement to say that 2023 brought significant housing challenges in Canada. Rising interest rates to tame inflation and labour shortages hindered the country’s ability to create much-needed housing supply. Many Canadians found it tough to pay their mortgage or rent, and far too many vulnerable people struggled to keep a roof over their heads.

Yet, even in these challenging times, CMHC continued to prove it’s a company that Canadians can count on. As this annual report shows, we made strong progress on our ambitious goals for 2023. This is the result of great work from our leadership and dedicated, expert staff – and the laser focus we gave to three pillars of work that will drive our strategy moving forward. Deliver Commercial Solutions Our commercial products continued to help stabilize the housing finance system in these uncertain economic times and incentivize more supply. Our team successfully met an unprecedented demand for MLI Select, part of our multi-unit mortgage loan insurance products. We also delivered an expansion of financing for purpose-built rentals through Canada Mortgage Bonds. In fact, loans insured by CMHC accounted for most of the urgently needed purpose-built rental apartment construction in the country. Build for the Future We were able to articulate the sheer scope of the country’s housing shortage. CMHC researchers found that Canada needs an additional 3.5 million homes beyond current projections to restore affordability. This one number raised awareness of all levels of government and the private and non-profit sectors to the magnitude of the efforts needed to overcome the current housing affordability crisis. CMHC will continue to be a leader in providing vital research and thought leadership through opportunities like our National Housing Conference in March 2024, where we highlighted cutting-edge innovation knowledge. Delivering Government Programs and Priorities In 2023, we also continued to deliver on federal government priorities for Canadians. There has been good progress on the National Housing Strategy targets, despite tough economic conditions. We reached agreements with 15 cities and the Province of Québec for the Housing Accelerator Fund, which will help these local governments get more housing built more quickly. In 2024, we will be extending proven supply-oriented programs, such as the Affordable Housing Fund and the Apartment Construction Loan program. We will also stand up newly announced initiatives, including consulting with the housing industry on a catalogue of homes to help accelerate construction. Creating impact amid change These accomplishments took place against the backdrop of significant changes for CMHC. We recalibrated our responsibilities with Infrastructure Canada, and they now lead on certain areas of housing policy advice, for example. This is an opportunity to align housing policies government-wide. The end of 2023 saw the departure of our former President and CEO, Romy Bowers. I would like to recognize Romy’s strong and steady leadership, which guided CMHC to reach the extraordinary achievements highlighted in this report. I would also like to thank our Chair, Derek Ballantyne, for his wise stewardship of CMHC since 2018. I have the utmost confidence in our skilled and dedicated senior leadership team and our employees across the country, who continue to deliver results for Canadians throughout these many changes. Canada’s housing challenges are serious, complex and urgent. However, I am optimistic that our country is united in facing them with strength and resolve – and CMHC is proud to be at the heart of this effort. Michel Tremblay Acting President and Chief Executive Officer
MANAGEMENT DISCUSSION AND ANALYSIS The following management discussion and analysis of the financial condition and results of operations was prepared for the year ended 31 December 2023 and approved by the Board of Directors on 20 March 2024. This section should be read in conjunction with the audited consolidated financial statements. Unless otherwise indicated, all financial information in this report has been prepared in accordance with International Financial Reporting Standards (IFRS) and all amounts are expressed in Canadian dollars. Forward-looking statements Our annual report contains forward-looking statements that include, but are not limited to: • the statements with respect to our outlook for the regulatory environment in which we operate • the outlook and priorities for each activity • the risk environment By their nature, forward-looking statements require us to make assumptions. They are subject to inherent risks and uncertainties that may cause actual results to differ materially from expectations expressed in the forward-looking statements. Non-IFRS measures We use a number of financial measures to assess our performance. Some of these measures are not calculated in accordance with IFRS and are not defined by IFRS, and do not have standardized meanings that would ensure consistency and comparability with other institutions. These non-IFRS measures are presented to supplement the information disclosed. They may be useful in analyzing performance and understanding the measures used by management in its financial and operational decision making. Where non-IFRS measures are used throughout the annual report, a definition of the term will be disclosed in the glossary for non-IFRS financial measures.

OUR STRATEGY Our strategy focuses our work on where we can improve the housing system and have the greatest possible impact on outcomes and results for Canadians. We work in close coordination and collaboration with many federal partners as well as other orders of government, Indigenous governments and partners, housing providers and stakeholders, and people with lived experience. Our enhanced collaboration with Infrastructure Canada will better link housing and infrastructure investments at the community level, better align housing with other federal policies and will improve housing outcomes.

Outcomes People in core housing need have equitable and reliable access to housing that is secure and affordable. Canada has the number of homes and mix of housing options to serve diverse needs. Canada’s housing system supports sustainability and stability. Strategic Results 1. Needs of households in core housing need are met through public policy measures. 2. Systemic racism, inequities and other barriers to access are removed. 3. Current and future housing needs and supply gaps are understood by system participants. 4. Barriers to access, building, or renovating housing are removed. 5. Current and future financial, environmental, and social vulnerabilities, including racism and discrimination, to the housing system are understood and tempered. 6. The housing system advances climate compatibility. 7. Housing is in the spirit of Reconciliation.

Our strategy focuses our work on where we can improve the housing system and have the greatest possible impact on outcomes and results for Canadians.
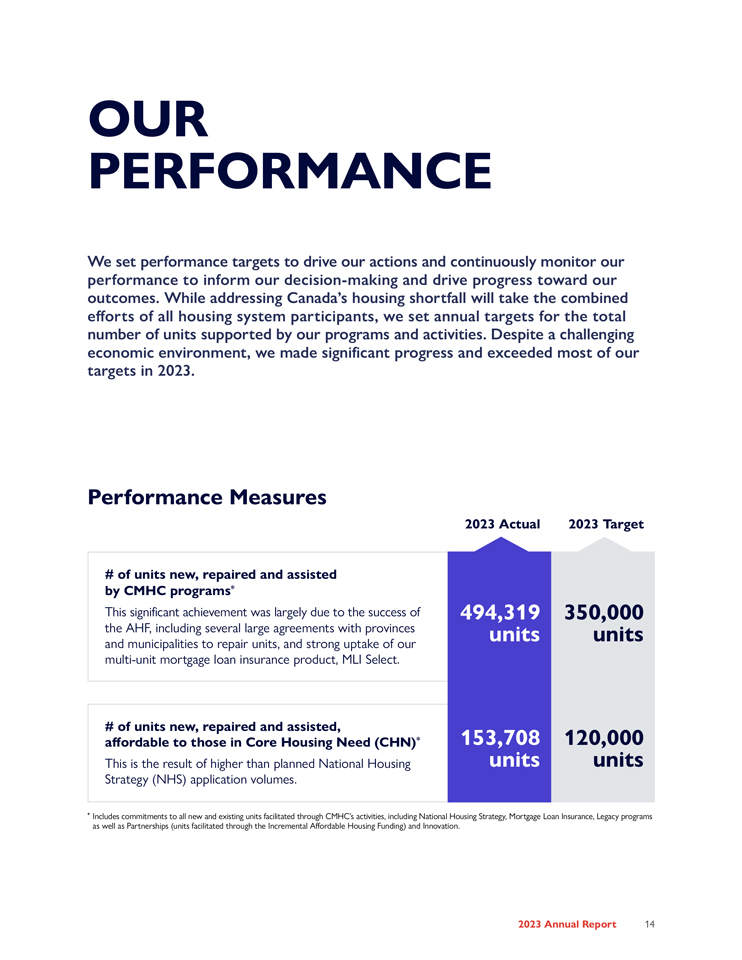
OUR PERFORMANCE We set performance targets to drive our actions and continuously monitor our performance to inform our decision-making and drive progress toward our outcomes. While addressing Canada’s housing shortfall will take the combined efforts of all housing system participants, we set annual targets for the total number of units supported by our programs and activities. Despite a challenging economic environment, we made significant progress and exceeded most of our targets in 2023. Performance Measures 2023 Actual 2023 Target # of units new, repaired and assisted by CMHC programs* This significant achievement was largely due to the success of 494,319 350,000 the AHF, including several large agreements with provinces units units and municipalities to repair units, and strong uptake of our multi-unit mortgage loan insurance product, MLI Select. # of units new, repaired and assisted, affordable to those in Core Housing Need (CHN)* 153,708 120,000 This is the result of higher than planned National Housing units units Strategy (NHS) application volumes. * Includes commitments to all new and existing units facilitated through CMHC’s activities, including National Housing Strategy, Mortgage Loan Insurance, Legacy programs as well as Partnerships (units facilitated through the Incremental Affordable Housing Funding) and Innovation.
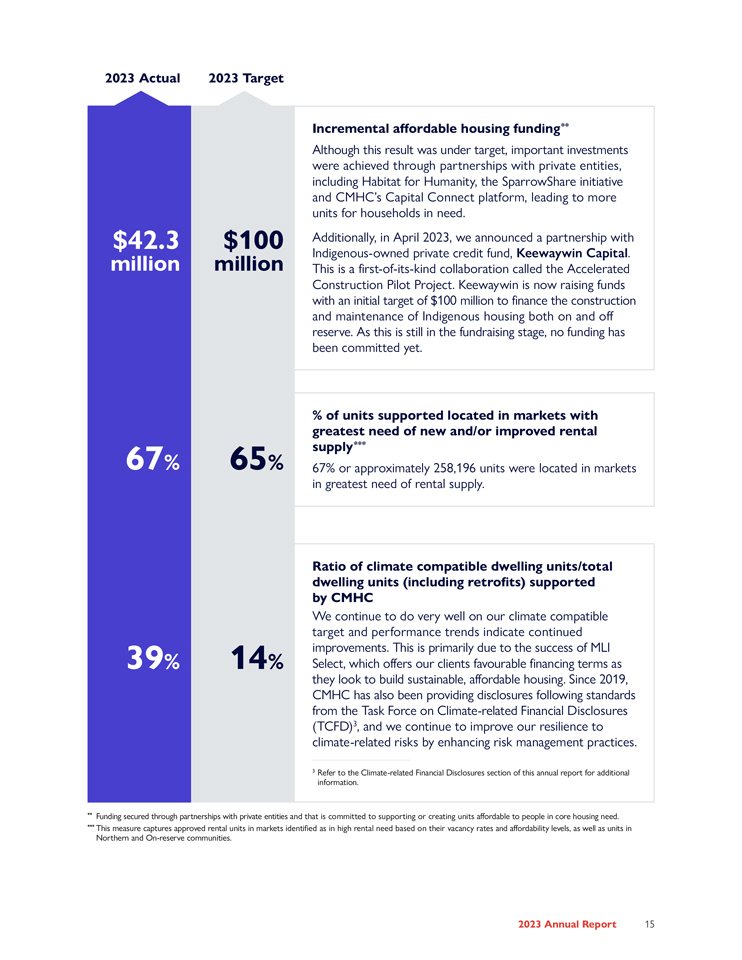
2023 Actual 2023 Target Incremental affordable housing funding** Although this result was under target, important investments were achieved through partnerships with private entities, including Habitat for Humanity, the SparrowShare initiative and CMHC’s Capital Connect platform, leading to more units for households in need. $42.3 $100 Additionally, in April 2023, we announced a partnership with million million Indigenous-owned private credit fund, Keewaywin Capital. This is a first-of-its-kind collaboration called the Accelerated Construction Pilot Project. Keewaywin is now raising funds with an initial target of $100 million to finance the construction and maintenance of Indigenous housing both on and off reserve. As this is still in the fundraising stage, no funding has been committed yet. % of units supported located in markets with greatest need of new and/or improved rental 67 supply*** % 65% 67% or approximately 258,196 units were located in markets in greatest need of rental supply. Ratio of climate compatible dwelling units/total dwelling units (including retrofits) supported by CMHC We continue to do very well on our climate compatible target and performance trends indicate continued improvements. This is primarily due to the success of MLI 39% 14% Select, which offers our clients favourable financing terms as they look to build sustainable, affordable housing. Since 2019, CMHC has also been providing disclosures following standards from the Task Force on Climate-related Financial Disclosures (TCFD)3, and we continue to improve our resilience to climate-related risks by enhancing risk management practices. 3 Refer to the Climate-related Financial Disclosures section of this annual report for additional information. ** Funding secured through partnerships with private entities and that is committed to supporting or creating units affordable to people in core housing need. *** This measure captures approved rental units in markets identified as in high rental need based on their vacancy rates and affordability levels, as well as units in Northern and On-reserve communities.

DATA, RESEARCH AND INSIGHTS Housing affordability and supply are complex issues driven by a web of financial, governance, fiscal, social, demographic and environmental factors. Broad research is needed to find root causes and potential solutions to tackle the biggest questions. • We conduct housing surveys, research and analysis to better understand current and future challenges of the housing system, barriers to housing affordability and households in core housing need, while recognizing the unique needs of Indigenous and vulnerable populations. • We strengthen CMHC’s leadership in the housing system by offering bold insights and thought leadership that influence others to act. • We work to deepen our understanding of the scale and factors behind households in core housing need and the social and economic arguments for additional investments. • We work to identify the systemic barriers that racialized Canadians face in securing and maintaining access to affordable, adequate housing, to ensure housing policies address inequity, bias and discrimination.
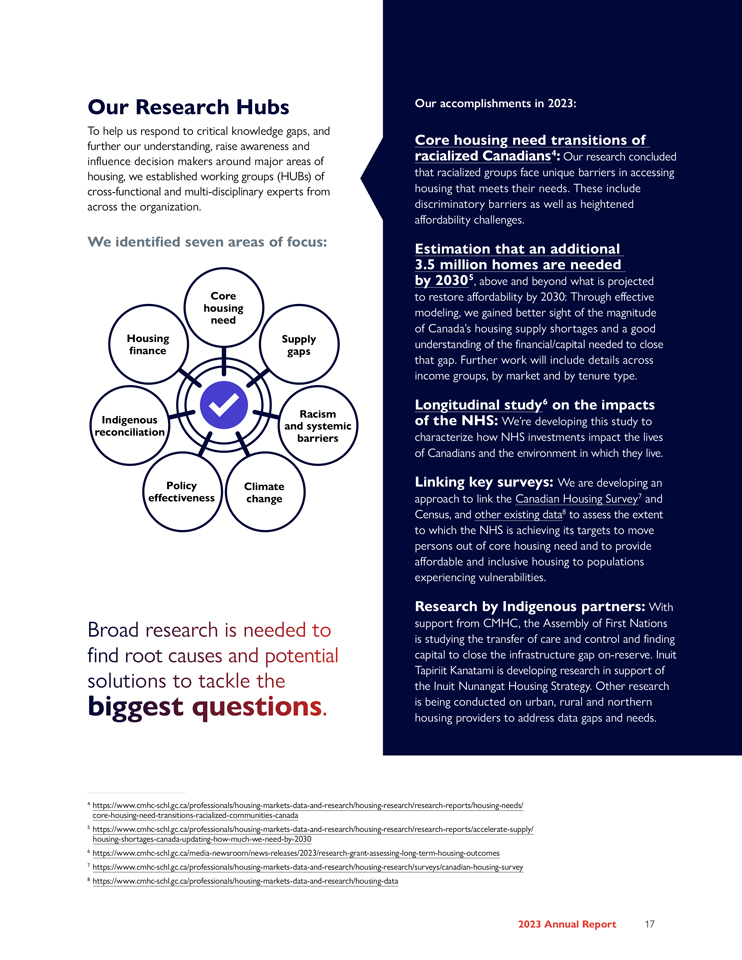
Our Research Hubs To help us respond to critical knowledge gaps, and further our understanding, raise awareness and influence decision makers around major areas of housing, we established working groups (HUBs) of cross-functional and multi-disciplinary experts from across the organization. We identified seven areas of focus: Core housing need Housing Supply finance gaps Racism Indigenous and systemic reconciliation barriers Policy Climate effectiveness change Broad research is needed to find root causes and potential solutions biggest to questions tackle the . Our accomplishments in 2023: Core housing need transitions of racialized Canadians4: Our research concluded that racialized groups face unique barriers in accessing housing that meets their needs. These include discriminatory barriers as well as heightened affordability challenges. Estimation that an additional 3.5 million homes are needed by 20305, above and beyond what is projected to restore affordability by 2030: Through effective modeling, we gained better sight of the magnitude of Canada’s housing supply shortages and a good understanding of the financial/capital needed to close that gap. Further work will include details across income groups, by market and by tenure type. Longitudinal study6 on the impacts of the NHS: We’re developing this study to characterize how NHS investments impact the lives of Canadians and the environment in which they live. Linking key surveys: We are developing an approach to link the Canadian Housing Survey7 and Census, and other existing data8 to assess the extent to which the NHS is achieving its targets to move persons out of core housing need and to provide affordable and inclusive housing to populations experiencing vulnerabilities. Research by Indigenous partners: With support from CMHC, the Assembly of First Nations is studying the transfer of care and control and finding capital to close the infrastructure gap on-reserve. Inuit Tapiriit Kanatami is developing research in support of the Inuit Nunangat Housing Strategy. Other research is being conducted on urban, rural and northern housing providers to address data gaps and needs. 4 https://www.cmhc-schl.gc.ca/professionals/housing-markets-data-and-research/housing-research/research-reports/housing-needs/ core-housing-need-transitions-racialized-communities-canada 5 https://www.cmhc-schl.gc.ca/professionals/housing-markets-data-and-research/housing-research/research-reports/accelerate-supply/ housing-shortages-canada-updating-how-much-we-need-by-2030 6 https://www.cmhc-schl.gc.ca/media-newsroom/news-releases/2023/research-grant-assessing-long-term-housing-outcomes 7 https://www.cmhc-schl.gc.ca/professionals/housing-markets-data-and-research/housing-research/surveys/canadian-housing-survey 8 https://www.cmhc-schl.gc.ca/professionals/housing-markets-data-and-research/housing-data

RECONCILIATION AND INDIGENOUS RELATIONS CMHC, is committed to closing the housing gap for Indigenous peoples. This cannot be accomplished without adopting reconciliation principles within our organization, including in our housing programs and policies. Our Reconciliation Action Plan In 2022, an Indigenous-led team began developing CMHC’s Reconciliation Action Plan (RAP). The RAP articulates the vision, goals, guiding principles and actions to advance meaningful reconciliation.
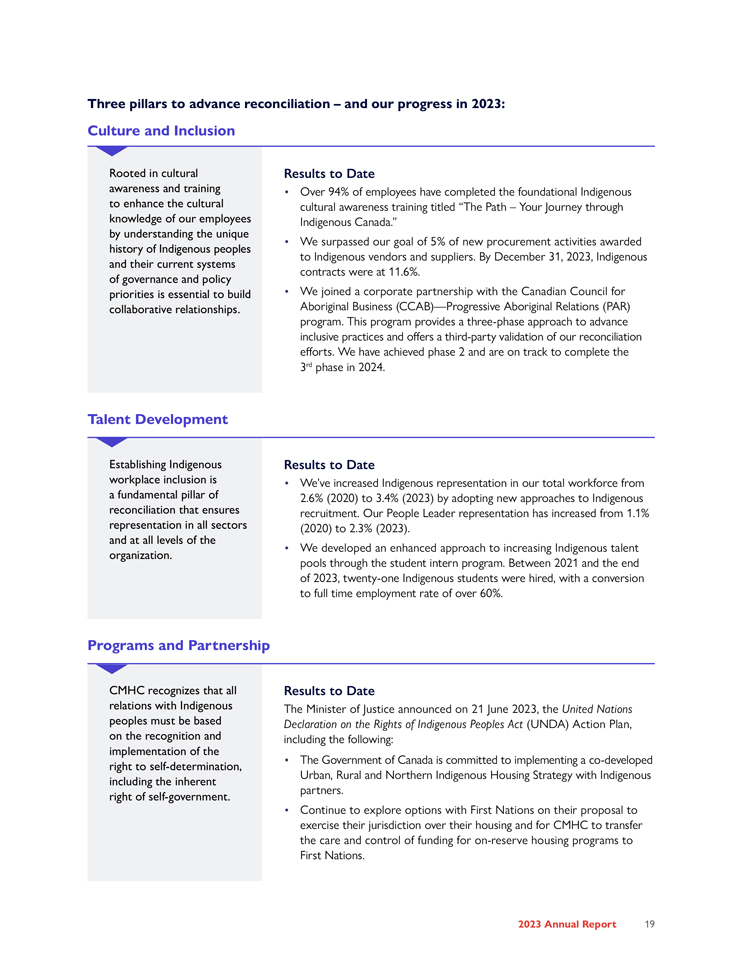
Three pillars to advance reconciliation – and our progress in 2023: Culture and Inclusion Rooted in cultural Results to Date awareness and training • Over 94% of employees have completed the foundational Indigenous to enhance the cultural cultural awareness training titled “The Path – Your Journey through knowledge of our employees Indigenous Canada.” by understanding the unique • We surpassed our goal of 5% of new procurement activities awarded history of Indigenous peoples to Indigenous vendors and suppliers. By December 31, 2023, Indigenous and their current systems contracts were at 11.6%. of governance and policy priorities is essential to build • We joined a corporate partnership with the Canadian Council for collaborative relationships. Aboriginal Business (CCAB)—Progressive Aboriginal Relations (PAR) program. This program provides a three-phase approach to advance inclusive practices and offers a third-party validation of our reconciliation efforts. We have achieved phase 2 and are on track to complete the 3rd phase in 2024. Talent Development Establishing Indigenous Results to Date workplace inclusion is • We’ve increased Indigenous representation in our total workforce from a fundamental pillar of 2.6% (2020) to 3.4% (2023) by adopting new approaches to Indigenous reconciliation that ensures recruitment. Our People Leader representation has increased from 1.1% representation in all sectors (2020) to 2.3% (2023). and at all levels of the • We developed an enhanced approach to increasing Indigenous talent organization. pools through the student intern program. Between 2021 and the end of 2023, twenty-one Indigenous students were hired, with a conversion to full time employment rate of over 60%. Programs and Partnership CMHC recognizes that all Results to Date relations with Indigenous The Minister of Justice announced on 21 June 2023, the United Nations peoples must be based Declaration on the Rights of Indigenous Peoples Act (UNDA) Action Plan, on the recognition and including the following: implementation of the • The Government of Canada is committed to implementing a co-developed right to self-determination, Urban, Rural and Northern Indigenous Housing Strategy with Indigenous including the inherent partners. right of self-government. • Continue to explore options with First Nations on their proposal to exercise their jurisdiction over their housing and for CMHC to transfer the care and control of funding for on-reserve housing programs to First Nations.
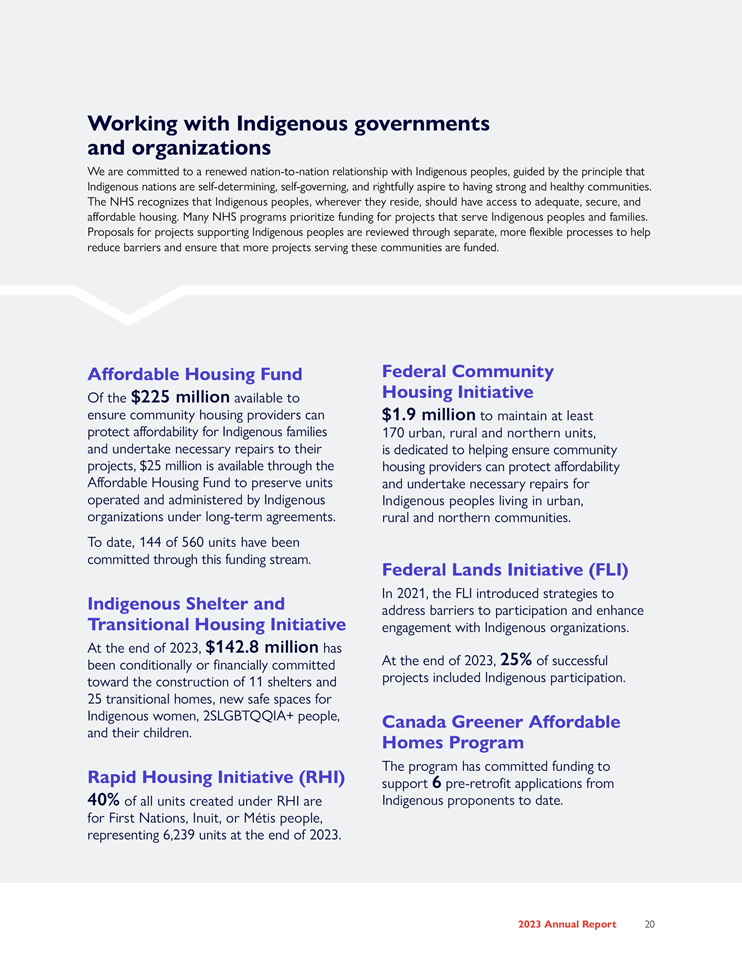
Working with Indigenous governments and organizations We are committed to a renewed nation-to-nation relationship with Indigenous peoples, guided by the principle that Indigenous nations are self-determining, self-governing, and rightfully aspire to having strong and healthy communities. The NHS recognizes that Indigenous peoples, wherever they reside, should have access to adequate, secure, and affordable housing. Many NHS programs prioritize funding for projects that serve Indigenous peoples and families. Proposals for projects supporting Indigenous peoples are reviewed through separate, more flexible processes to help reduce barriers and ensure that more projects serving these communities are funded. Affordable Housing Fund Of the $225 million available to ensure community housing providers can protect affordability for Indigenous families and undertake necessary repairs to their projects, $25 million is available through the Affordable Housing Fund to preserve units operated and administered by Indigenous organizations under long-term agreements. To date, 144 of 560 units have been committed through this funding stream. Indigenous Shelter and Transitional Housing Initiative At the end of 2023, $142.8 million has been conditionally or financially committed toward the construction of 11 shelters and 25 transitional homes, new safe spaces for Indigenous women, 2SLGBTQQIA+ people, and their children. Rapid Housing Initiative (RHI) 40% of all units created under RHI are for First Nations, Inuit, or Métis people, representing 6,239 units at the end of 2023. Federal Community Housing Initiative $1.9 million to maintain at least 170 urban, rural and northern units, is dedicated to helping ensure community housing providers can protect affordability and undertake necessary repairs for Indigenous peoples living in urban, rural and northern communities. Federal Lands Initiative (FLI) In 2021, the FLI introduced strategies to address barriers to participation and enhance engagement with Indigenous organizations. At the end of 2023, 25% of successful projects included Indigenous participation. Canada Greener Affordable Homes Program The program has committed funding to support 6 pre-retrofit applications from Indigenous proponents to date.

ANTI-RACISM AND EQUITY CMHC is committed in supporting populations in core housing need, and experiencing homelessness, which affect many equity-denied groups who continue to face barriers to accessing housing. We are committed to doing our part to build a more equitable housing system.
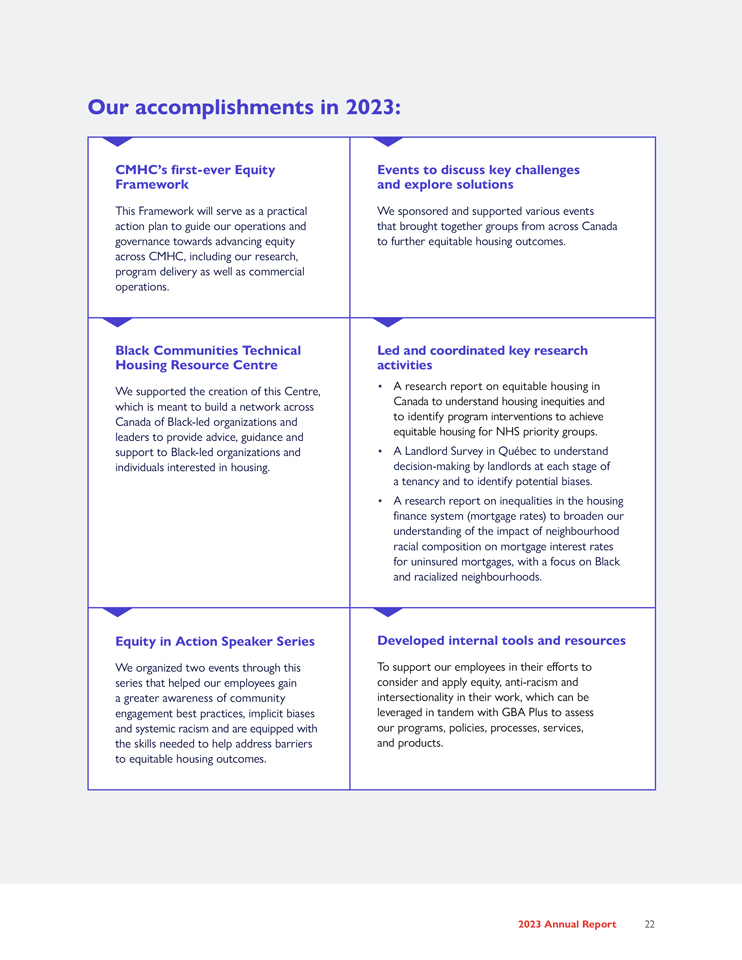
Our accomplishments in 2023: CMHC’s first-ever Equity Events to discuss key challenges Framework and explore solutions This Framework will serve as a practical We sponsored and supported various events action plan to guide our operations and that brought together groups from across Canada governance towards advancing equity to further equitable housing outcomes. across CMHC, including our research, program delivery as well as commercial operations. Black Communities Technical Led and coordinated key research Housing Resource Centre activities We supported the creation of this Centre, • A research report on equitable housing in which is meant to build a network across Canada to understand housing inequities and Canada of Black-led organizations and to identify program interventions to achieve leaders to provide advice, guidance and equitable housing for NHS priority groups. support to Black-led organizations and • A Landlord Survey in Québec to understand individuals interested in housing. decision-making by landlords at each stage of a tenancy and to identify potential biases. • A research report on inequalities in the housing finance system (mortgage rates) to broaden our understanding of the impact of neighbourhood racial composition on mortgage interest rates for uninsured mortgages, with a focus on Black and racialized neighbourhoods. Equity in Action Speaker Series Developed internal tools and resources We organized two events through this To support our employees in their efforts to series that helped our employees gain consider and apply equity, anti-racism and a greater awareness of community intersectionality in their work, which can be engagement best practices, implicit biases leveraged in tandem with GBA Plus to assess and systemic racism and are equipped with our programs, policies, processes, services, the skills needed to help address barriers and products. to equitable housing outcomes.

OUR CULTURE • If strategy is what we do, then culture is how we do it. When combined with strategy, culture accelerates execution and creates strategic advantage. Culture is created communally and is a key driver to influence meaningful change. Demonstrating our values is a shared accountability and our employee community is expected and motivated to do so every day. Our corporate values articulate how we want to think and act – Courage, Community and Impact. • Our approach to culture gives us the courage to do what is right – ask tough questions, try new things, and stand up for those who face housing challenges. As a community (inside and outside CMHC), we champion diversity and equity in our housing system and trust in one another. We are committed to building impactful solutions by focusing on the outcomes that matter the most as we strive toward a future where everyone in Canada has a place to call home. • While culture is a shared accountability for all employees, our People Leaders have enormous influence to set the organizational context for their teams by establishing clear goals, coaching and providing ongoing feedback, and making decisions on priorities – all while fostering an inclusive and collaborative environment. Courage Community Impact We have a bold aspiration and We are one diverse team, mutually We prioritize the results that must lead difficult but necessary trusting and supporting each other, have the most impact on changes to the housing system. and creating partnerships in the our aspiration. best interest of the communities that we serve.

OUR PEOPLE Workplace Diversity, Equity and Inclusion Our culture of inclusivity makes it possible for us to attract and retain top talent, foster innovation and growth, and deliver meaningful programs and services to the people we serve. Our 2023-2025 Workplace Diversity, Equity and Inclusion Framework guides our efforts to sustain a diverse workforce and cultivate an inclusive workplace culture. It is creating meaningful changes and greater shared accountability in advancing workplace diversity, equity and inclusion at CMHC, evident in our stable Inclusion Index at 82%. We improved our self-identification form and strengthened our workforce representation measurements. This ensures that we’re collecting reliable and inclusive data to inform our work. We made important progress in meeting our minimum workforce representation goals, including leadership representation. We remain committed to having a workforce that is representative of the Canadian population.
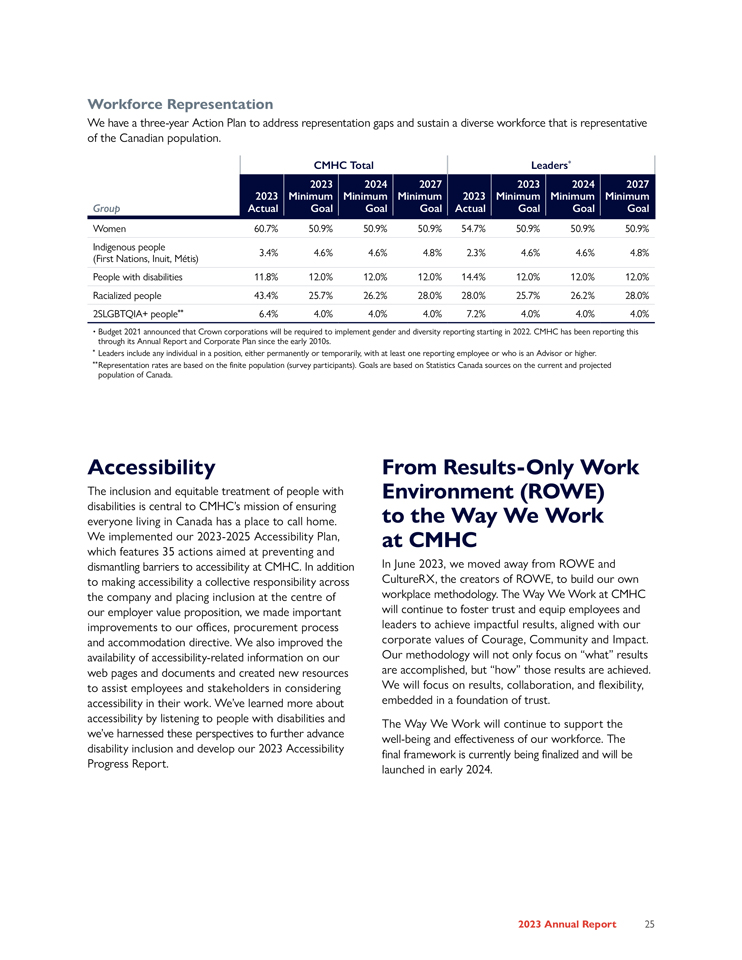
Workforce Representation We have a three-year Action Plan to address representation gaps and sustain a diverse workforce that is representative of the Canadian population. CMHC Total Leaders* 2023 2024 2027 2023 2024 2027 2023 Minimum Minimum Minimum 2023 Minimum Minimum Minimum Group Actual Goal Goal Goal Actual Goal Goal Goal Women 60.7% 50.9% 50.9% 50.9% 54.7% 50.9% 50.9% 50.9% Indigenous people 3.4% 4.6% 4.6% 4.8% 2.3% 4.6% 4.6% 4.8% (First Nations, Inuit, Métis) People with disabilities 11.8% 12.0% 12.0% 12.0% 14.4% 12.0% 12.0% 12.0% Racialized people 43.4% 25.7% 26.2% 28.0% 28.0% 25.7% 26.2% 28.0% 2SLGBTQIA+ people** 6.4% 4.0% 4.0% 4.0% 7.2% 4.0% 4.0% 4.0% • Budget 2021 announced that Crown corporations will be required to implement gender and diversity reporting starting in 2022. CMHC has been reporting this through its Annual Report and Corporate Plan since the early 2010s. * Leaders include any individual in a position, either permanently or temporarily, with at least one reporting employee or who is an Advisor or higher. ** Representation rates are based on the finite population (survey participants). Goals are based on Statistics Canada sources on the current and projected population of Canada. Accessibility The inclusion and equitable treatment of people with disabilities is central to CMHC’s mission of ensuring everyone living in Canada has a place to call home. We implemented our 2023-2025 Accessibility Plan, which features 35 actions aimed at preventing and dismantling barriers to accessibility at CMHC. In addition to making accessibility a collective responsibility across the company and placing inclusion at the centre of our employer value proposition, we made important improvements to our offices, procurement process and accommodation directive. We also improved the availability of accessibility-related information on our web pages and documents and created new resources to assist employees and stakeholders in considering accessibility in their work. We’ve learned more about accessibility by listening to people with disabilities and we’ve harnessed these perspectives to further advance disability inclusion and develop our 2023 Accessibility Progress Report. From Results-Only Work Environment (ROWE) to the Way We Work at CMHC In June 2023, we moved away from ROWE and CultureRX, the creators of ROWE, to build our own workplace methodology. The Way We Work at CMHC will continue to foster trust and equip employees and leaders to achieve impactful results, aligned with our corporate values of Courage, Community and Impact. Our methodology will not only focus on “what” results are accomplished, but “how” those results are achieved. We will focus on results, collaboration, and flexibility, embedded in a foundation of trust. The Way We Work will continue to support the well-being and effectiveness of our workforce. The final framework is currently being finalized and will be launched in early 2024.
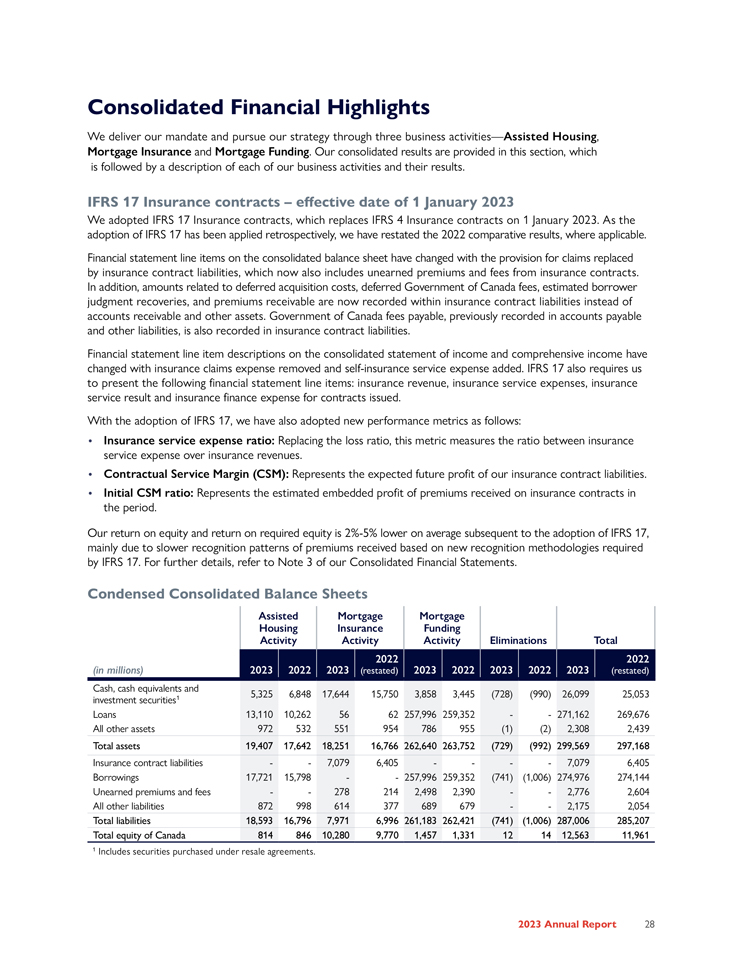
BUSINESS AND FINANCIAL HIGHLIGHTS Economic and Housing Environment Economic growth in Canada eased over the course Canada: Real GDP Growth of 2023. Households and businesses reduced their % spending as a result of the higher interest rate 6 5.3 environment. Real gross domestic product (GDP) growth was largely supported by household spending 4 3.8 early in the year, as well as higher exports and increases 1.9 2 1.1 in government spending. However, slower inventory 0.6 accumulation and declines in housing investment 0 weighed on economic activity, partly offsetting some -2 of the growth in other components of GDP. Overall, Canada posted GDP growth of 1.0% in 2023, sharply -4 down from the rapid 3.8% growth in 2022. Going -6 -5.0 forward, growth is expected to remain subdued at 0.4% in 2024, according to the January Consensus 2019 2020 2021 2022 2023 2024f Economics Forecast9. Sources: Statistics Canada, table 36-10-0222-01, gross domestic product, expenditure-based via CMHC calculations; 2024f: Consensus Forecasts 9 Consensus Economics survey of private sector forecasters, as of December 2023.
While headline inflation declined from its peak of 8.1% in 2022, its downward trend slowed over the first half of 2023 (reaching 3.4% in December). To bring inflation down, the Bank of Canada continued to raise its policy rate further throughout 2023, reaching 5% in July. Long-term bond yields rose sharply since July, reaching levels not recorded since the 2008-2009 recession. However, bond yields have fallen in recent months, roughly returning to the same levels at the start of the year, at 3.21%. Persistently higher bond yields are likely to constrain both investment and consumption in Canada. As the impacts of this uncertain environment spread throughout the economy, household consumption growth started to slow over the final three quarters of the year. Meanwhile, household disposable income continued to rise. As a result, the household savings rate moved slightly higher, to 5.6% in 2023, above its 3.4% average in the decade to 2020. Stronger disposable income was also a key factor contributing to a slight improvement in the ratio of household debt to disposable income. Disposable income was 1.0% higher in the third quarter of 2023 compared with the previous quarter, while debt edged up by 0.8%. Overall, the ratio fell to a seasonally adjusted 181.6% in the third quarter, from 181.9% in the second quarter. This means that for every dollar of disposable income, Canadians owed $1.82 in credit market debt. Looking ahead, however, the ratio is expected to edge higher before stabilizing, as the share of income spent on interest payments at current rates is expected to continue to rise as homeowners renew their mortgages. Thus, elevated household indebtedness remained a key vulnerability for the Canadian economy. Labour markets in Canada showed some resilience in 2023. However, the pace of employment growth started moderating during the first half of the year. While the unmet demand for labour started to ease, reports of shortages of skilled workers remained widespread. The unemployment rate rose throughout the year but remained low, rising from 5.0% in April to 5.8% in December. Wage growth stayed in the 4-5% range since 2022, considerably higher than the 2.3% average over the past decade. The series of mortgage rate hikes since mid-2022, combined with strict mortgage qualification criteria, limited the number of eligible homebuyers. Higher rates also pose potential challenges for mortgage renewals in the future. In 2023, Canada MLS® sales dropped 11% to 443,636 units relative to the previous year. This level was 33% below peak sales recorded in 2021. MLS® listings decreased by 8% as some sellers opted to wait for better housing conditions or couldn’t afford upgrades. This led to price declines. The average MLS® home price fell 4% in 2023 to $678,319, aligning closely with 2021 levels. Higher interest rates and persistent labour shortages hindered developers’ ability to increase housing supply. Nevertheless, new home construction almost hit multi-decade highs at 241,735 units, but fell short of the 2021-2022 levels of approximately 270,000 units. While high-rise starts peaked in 2023, low-rise sectors, notably single-detached and semi-detached homes, experienced declines. The intensified affordability issue prompted a shift in demand towards more affordable housing options. Furthermore, apartment projects often require an extended period, spanning several years between pre-selling and construction. Therefore, the surge in apartment starts might not entirely reflect the weakening of housing demand and might instead mirror pre-inflationary conditions. Strong demand for rentals persisted due to favourable job market conditions and demographic factors, such as immigration and population aging. The reduced opportunities for potential homebuyers also contributed to the increased rental demand. Despite substantial rental construction, the vacancy rate for rental apartments reached a new low of 1.5% in 2023. This led to record rent growth. The fixed-sample average 2-bedroom apartment rent in existing apartment structures grew by 8.0% to $1,359 in 2023. In the condominium market, average 2-bedroom rents reached $2,049 in 2023. This increased housing affordability challenges, particularly for low-income renters.
Consolidated Financial Highlights We deliver our mandate and pursue our strategy through three business activities—Assisted Housing, Mortgage Insurance and Mortgage Funding. Our consolidated results are provided in this section, which is followed by a description of each of our business activities and their results. IFRS 17 Insurance contracts – effective date of 1 January 2023 We adopted IFRS 17 Insurance contracts, which replaces IFRS 4 Insurance contracts on 1 January 2023. As the adoption of IFRS 17 has been applied retrospectively, we have restated the 2022 comparative results, where applicable. Financial statement line items on the consolidated balance sheet have changed with the provision for claims replaced by insurance contract liabilities, which now also includes unearned premiums and fees from insurance contracts. In addition, amounts related to deferred acquisition costs, deferred Government of Canada fees, estimated borrower judgment recoveries, and premiums receivable are now recorded within insurance contract liabilities instead of accounts receivable and other assets. Government of Canada fees payable, previously recorded in accounts payable and other liabilities, is also recorded in insurance contract liabilities. Financial statement line item descriptions on the consolidated statement of income and comprehensive income have changed with insurance claims expense removed and self-insurance service expense added. IFRS 17 also requires us to present the following financial statement line items: insurance revenue, insurance service expenses, insurance service result and insurance finance expense for contracts issued. With the adoption of IFRS 17, we have also adopted new performance metrics as follows: • Insurance service expense ratio: Replacing the loss ratio, this metric measures the ratio between insurance service expense over insurance revenues. • Contractual Service Margin (CSM): Represents the expected future profit of our insurance contract liabilities. • Initial CSM ratio: Represents the estimated embedded profit of premiums received on insurance contracts in the period. Our return on equity and return on required equity is 2%-5% lower on average subsequent to the adoption of IFRS 17, mainly due to slower recognition patterns of premiums received based on new recognition methodologies required by IFRS 17. For further details, refer to Note 3 of our Consolidated Financial Statements. Condensed Consolidated Balance Sheets Assisted Mortgage Mortgage Housing Insurance Funding Activity Activity Activity Eliminations Total (in millions) 2023 2022 2023 2022 2023 2022 2023 2022 (restated) 2023 2022 (restated) Cash, cash equivalents and 1 5,325 6,848 17,644 15,750 3,858 3,445 (728) (990) 26,099 25,053 investment securities Loans 13,110 10,262 56 62 257,996 259,352 — 271,162 269,676 All other assets 972 532 551 954 786 955 (1) (2) 2,308 2,439 Total assets 19,407 17,642 18,251 16,766 262,640 263,752 (729) (992) 299,569 297,168 Insurance contract liabilities — 7,079 6,405 — — 7,079 6,405 Borrowings 17,721 15,798 — 257,996 259,352 (741) (1,006) 274,976 274,144 Unearned premiums and fees — 278 214 2,498 2,390 — 2,776 2,604 All other liabilities 872 998 614 377 689 679 — 2,175 2,054 Total liabilities 18,593 16,796 7,971 6,996 261,183 262,421 (741) (1,006) 287,006 285,207 Total equity of Canada 814 846 10,280 9,770 1,457 1,331 12 14 12,563 11,961 1 Includes securities purchased under resale agreements.
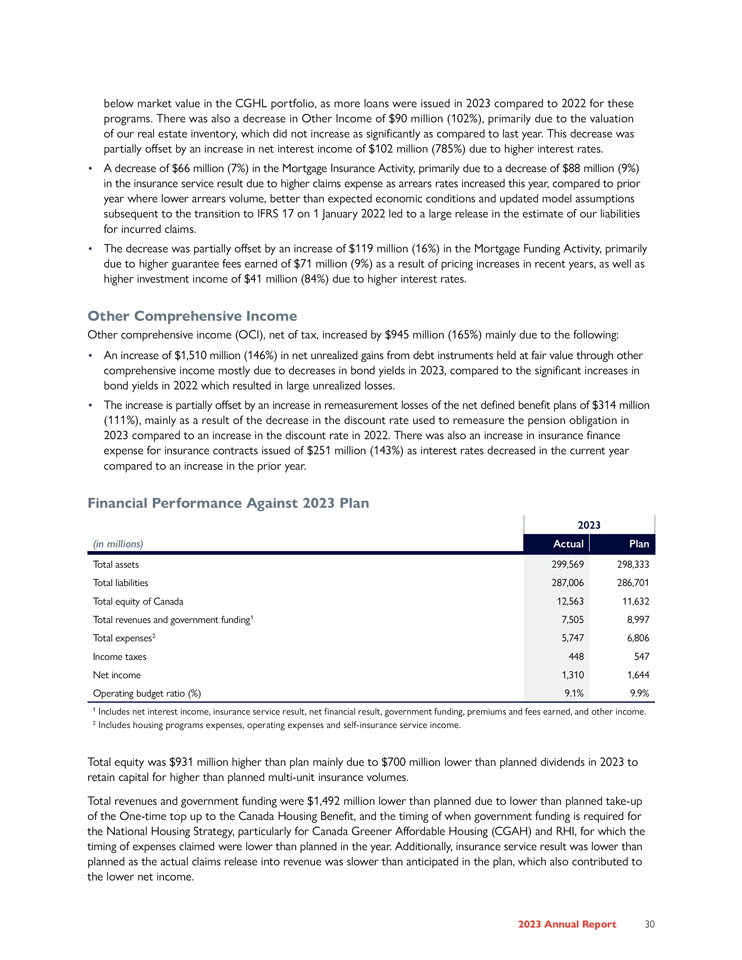
Financial Position In 2023, we declared dividends of $1,080 million, funded from our retained earnings from prior years and our 2023 net income of $1,310 million. We declare dividends after regulatory and other capitalization requirements are met ensuring that our Mortgage Insurance and Mortgage Funding activities are appropriately capitalized. Our total assets and liabilities increased throughout the year primarily due to increases in loans ($2,809 million) and borrowings ($2,078 million) at amortized cost in the Assisted Housing Activity due to additional loans under the Apartment Construction Loan Program (ACLP), the Affordable Housing Fund (AHF) and Canada Greener Homes Loans (CGHL). A decrease in interest rates and the suspension of the dividend in the Mortgage Insurance Activity, contributed to an increase of $1,046 million in cash, cash equivalents and investment securities. Insurance contract liabilities increased $674 million primarily attributed to new business underwritten outpacing our recognition of unearned profit. These increases in assets and liabilities were partially offset by decreases in both loans and borrowings at amortized cost of $1,356 million in the Mortgage Funding Activity as maturities of Canada Mortgage Bonds (CMB) exceeded new issuances and balances are decreasing under the Insured Mortgage Purchase Program (IMPP) as we are no longer issuing loans under the program. Condensed Consolidated Statements of Income and Comprehensive Income Assisted Mortgage Mortgage Housing Insurance Funding Activity Activity Activity Eliminations Total (in millions) 2023 2022 2023 2022 2023 2023 2022 2023 2022 (restated) 2022 (restated) Government funding 5,494 3,408 — — — 5,494 3,408 Housing programs expenses (5,114) (3,061) — — — (5,114) (3,061) Premiums and fees earned — 33 23 827 756 — 860 779 Insurance service result — 885 973 — — 885 973 Operating expenses (405) (361) (172) (177) (64) (68) — (641) (606) All other income1 5 204 160 153 97 53 12 23 274 433 Income (loss) before income taxes (20) 190 906 972 860 741 12 23 1,758 1,926 Income taxes—(50) (230) (245) (215) (185) (3) (6) (448) (486) Net income (loss) (20) 140 676 727 645 556 9 17 1,310 1,440 Other comprehensive income (loss) (12) 137 334 (573) 61 (160) (11) 23 372 (573) Comprehensive income (32) 277 1,010 154 706 396 (2) 40 1,682 867 1 Includes net interest income (loss), investment income, net gains (losses) on financial instruments, insurance finance expense for contracts issued, other income (loss) and self-insurance service income. Revenues and Expenses • In the Assisted Housing Activity, our revenues include government funding for the expenses we incur to deliver housing programs, resulting in no impact to net income. Government funding and housing programs expenses have increased in 2023, mainly due to the Housing Accelerator Fund (HAF), and increased activity in the Rapid Housing Initiative (RHI) and AHF. Related operating expenses also increased driven mainly by administration expenses to run CGHL and the third round of the RHI program, which were launched in the third quarter of 2022 and the first quarter of 2023, respectively. In 2023, our total income before income taxes decreased by $168 million (9%) mainly due to the following: • A decrease of $210 million (111%) in the Assisted Housing Activity, mainly due to an increase in net losses on financial instruments of $211 million (164%), primarily due to decreases in borrowing issuances for ACLP as we borrow at below market rates which leads to gains at the time of borrowing, as well as losses on loans issued
below market value in the CGHL portfolio, as more loans were issued in 2023 compared to 2022 for these programs. There was also a decrease in Other Income of $90 million (102%), primarily due to the valuation of our real estate inventory, which did not increase as significantly as compared to last year. This decrease was partially offset by an increase in net interest income of $102 million (785%) due to higher interest rates. • A decrease of $66 million (7%) in the Mortgage Insurance Activity, primarily due to a decrease of $88 million (9%) in the insurance service result due to higher claims expense as arrears rates increased this year, compared to prior year where lower arrears volume, better than expected economic conditions and updated model assumptions subsequent to the transition to IFRS 17 on 1 January 2022 led to a large release in the estimate of our liabilities for incurred claims. • The decrease was partially offset by an increase of $119 million (16%) in the Mortgage Funding Activity, primarily due to higher guarantee fees earned of $71 million (9%) as a result of pricing increases in recent years, as well as higher investment income of $41 million (84%) due to higher interest rates. Other Comprehensive Income Other comprehensive income (OCI), net of tax, increased by $945 million (165%) mainly due to the following: • An increase of $1,510 million (146%) in net unrealized gains from debt instruments held at fair value through other comprehensive income mostly due to decreases in bond yields in 2023, compared to the significant increases in bond yields in 2022 which resulted in large unrealized losses. • The increase is partially offset by an increase in remeasurement losses of the net defined benefit plans of $314 million (111%), mainly as a result of the decrease in the discount rate used to remeasure the pension obligation in 2023 compared to an increase in the discount rate in 2022. There was also an increase in insurance finance expense for insurance contracts issued of $251 million (143%) as interest rates decreased in the current year compared to an increase in the prior year. Financial Performance Against 2023 Plan 2023 (in millions) Actual Plan Total assets 299,569 298,333 Total liabilities 287,006 286,701 Total equity of Canada 12,563 11,632 Total revenues and government funding1 7,505 8,997 Total expenses2 5,747 6,806 Income taxes 448 547 Net income 1,310 1,644 Operating budget ratio (%) 9.1% 9.9% 1 Includes net interest income, insurance service result, net financial result, government funding, premiums and fees earned, and other income. 2 Includes housing programs expenses, operating expenses and self-insurance service income. Total equity was $931 million higher than plan mainly due to $700 million lower than planned dividends in 2023 to retain capital for higher than planned multi-unit insurance volumes. Total revenues and government funding were $1,492 million lower than planned due to lower than planned take-up of the One-time top up to the Canada Housing Benefit, and the timing of when government funding is required for the National Housing Strategy, particularly for Canada Greener Affordable Housing (CGAH) and RHI, for which the timing of expenses claimed were lower than planned in the year. Additionally, insurance service result was lower than planned as the actual claims release into revenue was slower than anticipated in the plan, which also contributed to the lower net income.

Assisted Housing What we do We help people living in Canada access housing that meets their needs and that they can afford. We achieve this through a range of programs and initiatives to support the construction of new housing supply, including affordable housing, and the repair, preservation and revitalization of existing affordable and community housing. How we do it We receive parliamentary appropriations and low-cost funding from the government to deliver housing programs that: • support the creation, repair and preservation of housing; • provide funding for affordability supports to housing proponents; • fund housing programs, including those in response to circumstances of critical national importance; • help Canadians acquire affordable housing, prioritizing target populations and those who have been made vulnerable and are facing housing challenges. We do this through our program delivery and partnerships with provinces, territories, municipalities, Indigenous governments and organizations, non-profit and co-operative housing organizations, and private sector companies. National Housing Strategy update We continue to deliver on the National Housing Strategy (NHS), which is giving more people in Canada a place to call home. We are currently on track to meet or exceed its targets for new units, repaired units, community housing units protected, as well as households for which housing need is reduced or eliminated. We are closely monitoring the potential impact of the current economic environment on our overall program outcomes for future years. Ongoing reporting for the NHS is available on the Place to Call Home website and includes achievements for all its initiatives (placetocallhome.ca). We help people living in Canada access housing that meets their needs and that they can afford.
Federal Budgets and 2023 Fall Economic Statement We were encouraged by additional housing investments announced in recent Federal Budgets and in the 2023 Fall Economic Statement (FES). We have worked diligently to ensure a timely launch of supporting initiatives. The following were launched in 2023: • Housing Accelerator Fund (HAF): Budget 2022 included $4 billion over five years, starting in 2022-2023, for a new Housing Accelerator Fund, that provides incentive funding to local governments encouraging initiatives aimed at increasing housing supply. The HAF was launched on 17 March 2023, the application portal opened on 4 July 2023 and has since closed. • Canada Greener Affordable Housing (CGAH): Announced in Budget 2021, an additional $458.5 million was allocated in Budget 2022 for this program. CGAH was launched on 26 May 2023 and the application portal opened on 1 June 2023. The following will have an impact starting in 2024: • Affordable Housing Fund (AHF) (formerly National Housing Co-Investment Fund (NHCF)): As announced in Budget 2022, funding was advanced so that all remaining funds will be committed by 2025-2026. This will accelerate the creation of up to 4,300 new units and the repair of up to 17,800 units for Canadians most in need. • Low-cost flood insurance program: Funding is provided for Public Safety Canada and CMHC to work with the Department of Finance Canada to establish this program, aimed at protecting households at high risk of flooding and without access to adequate insurance. • Reallocation of funding from the Affordable Housing Fund’s (AHF), repair stream to its new construction stream: This reallocation will be used, as needed, to boost the construction of new affordable homes for Canadians most in need.
Funding retrofits for greener homes The Canada Greener Affordable Homes Program (CGAH) contributes to the decarbonization goals of Canada’s Green Buildings Strategy, to help meet net-zero emissions by 2050. There are two funding opportunities: 1. Retrofit funding for deep energy retrofits aims to reduce energy consumption and greenhouse gas emissions of rental buildings. This funding will allow affordable housing providers to make improvements to aging buildings that will improve energy efficiency and extend their lifespan. 2. Pre-Retrofit funding is available for various activities, including energy audits, energy modelling studies and building condition assessment reports, needed for a Retrofit Funding application. The levels of energy consumption and greenhouse gas reductions needed to be eligible for CGAH are significant. Achieving this deep level of energy retrofits is new for many eligible proponents and takes complex project planning. The success of a Retrofit Funding project depends on a building’s physical characteristics, such as age, structure, and heating source. In other words, it takes time to develop a comprehensive deep energy retrofit plan that includes professional reports detailing how a project can achieve climate objectives, documents the scope of retrofits, cost estimates, and expected timelines for completion. Here is how we aimed to make the process easier for proponents: • Following the program launch, we gave virtual information sessions to affordable housing providers, highlighting program features, clarifying proponent and project eligibility criteria, and documentation requirements. There are ongoing efforts to market the program to eligible proponents. • We developed the CGAH application process, drawing on the success and simplicity of the Rapid Housing Initiative implementation and delivery. We used best practices, such as reducing documentation needed to apply, and improving the application portal user experience. This has made the process simpler and has provided a more positive client experience, and faster application approvals. • The delivery team meets with clients prior to their application submission to help determine the qualification of candidates or whether other programs with a lower depth of requirement are more suitable. • The delivery team works directly with applicants who may not fully meet the energy reduction requirements to determine a pathway forward for their project. • The first application window for Pre-Retrofit Funding was competitive and oversubscribed, with nearly 250 applications totaling $34.2 million in requested funding. This demonstrates great interest in completing deep energy retrofits on affordable housing projects. As successful proponents complete the necessary pre-development work over the next few months, we expect to see an influx of Retrofit Funding applications. • As of December 31, there were sixty-three Pre-Retrofit Funding commitments, of which sixty-two files have started advancing, and 2 are fully funded. 6 Retrofit Funding projects are currently under review. The Canada Greener Homes Loan (CGHL) was launched in June 2022. The CGHL builds on the Canada Greener Homes Grant delivered by Natural Resources Canada and offers interest-free financing of up to $40,000 to homeowners who undertake retrofits identified through an authorized EnerGuide energy assessment. Budget 2021 had provided $4.4 billion over five years for the Canada Greener Homes Loan (CGHL), that also included a dedicated stream of funding for the Canada Greener Affordable Housing. At the end of 2023, the Canada Greener Homes Loan has committed over 48,000 loans for more than $1.1 billion. Approximately 55% of applicants have completed their retrofits and have received final loan funding. The most popular retrofits are heat pumps, with 45% of loans including funding for a heat pump, windows and solar panels.
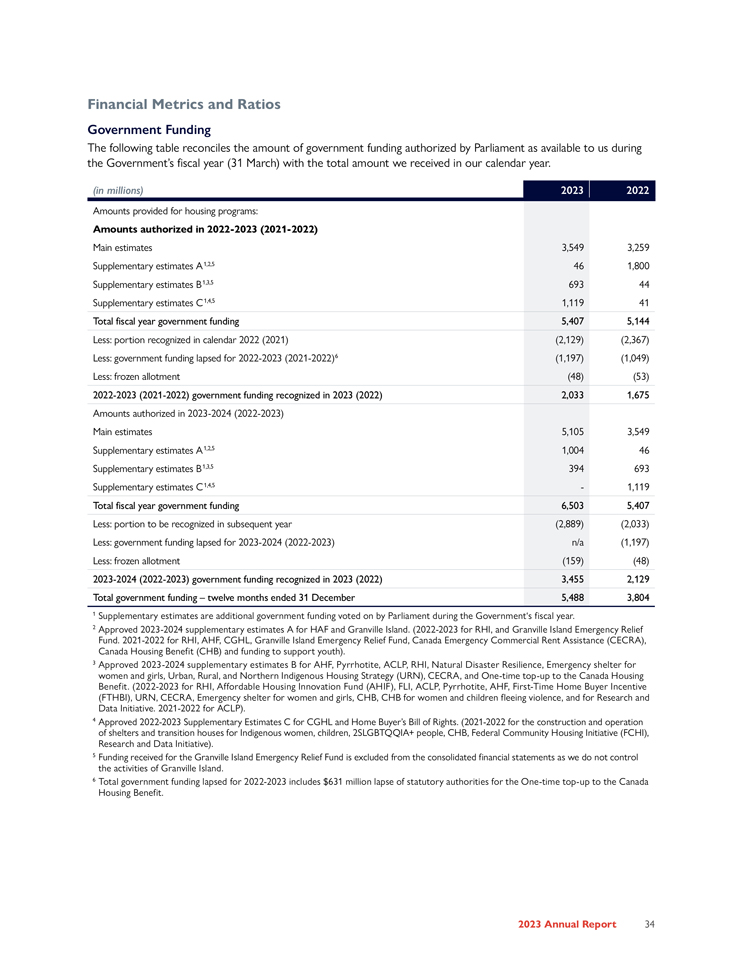
Financial Metrics and Ratios Government Funding The following table reconciles the amount of government funding authorized by Parliament as available to us during the Government’s fiscal year (31 March) with the total amount we received in our calendar year. (in millions) 2023 2022 Amounts provided for housing programs: Amounts authorized in 2022-2023 (2021-2022) Main estimates 3,549 3,259 Supplementary estimates A1,2,5 46 1,800 Supplementary estimates B1,3,5 693 44 Supplementary estimates C1,4,5 1,119 41 Total fiscal year government funding 5,407 5,144 Less: portion recognized in calendar 2022 (2021) (2,129) (2,367) Less: government funding lapsed for 2022-2023 (2021-2022)6 (1,197) (1,049) Less: frozen allotment (48) (53) 2022-2023 (2021-2022) government funding recognized in 2023 (2022) 2,033 1,675 Amounts authorized in 2023-2024 (2022-2023) Main estimates 5,105 3,549 Supplementary estimates A1,2,5 1,004 46 Supplementary estimates B1,3,5 394 693 Supplementary estimates C1,4,5—1,119 Total fiscal year government funding 6,503 5,407 Less: portion to be recognized in subsequent year (2,889) (2,033) Less: government funding lapsed for 2023-2024 (2022-2023) n/a (1,197) Less: frozen allotment (159) (48) 2023-2024 (2022-2023) government funding recognized in 2023 (2022) 3,455 2,129 Total government funding – twelve months ended 31 December 5,488 3,804 1 Supplementary estimates are additional government funding voted on by Parliament during the Government‘s fiscal year. 2 Approved 2023-2024 supplementary estimates A for HAF and Granville Island. (2022-2023 for RHI, and Granville Island Emergency Relief Fund. 2021-2022 for RHI, AHF, CGHL, Granville Island Emergency Relief Fund, Canada Emergency Commercial Rent Assistance (CECRA), Canada Housing Benefit (CHB) and funding to support youth). 3 Approved 2023-2024 supplementary estimates B for AHF, Pyrrhotite, ACLP, RHI, Natural Disaster Resilience, Emergency shelter for women and girls, Urban, Rural, and Northern Indigenous Housing Strategy (URN), CECRA, and One-time top-up to the Canada Housing Benefit. (2022-2023 for RHI, Affordable Housing Innovation Fund (AHIF), FLI, ACLP, Pyrrhotite, AHF, First-Time Home Buyer Incentive (FTHBI), URN, CECRA, Emergency shelter for women and girls, CHB, CHB for women and children fleeing violence, and for Research and Data Initiative. 2021-2022 for ACLP). 4 Approved 2022-2023 Supplementary Estimates C for CGHL and Home Buyer’s Bill of Rights. (2021-2022 for the construction and operation of shelters and transition houses for Indigenous women, children, 2SLGBTQQIA+ people, CHB, Federal Community Housing Initiative (FCHI), Research and Data Initiative). 5 Funding received for the Granville Island Emergency Relief Fund is excluded from the consolidated financial statements as we do not control the activities of Granville Island. 6 Total government funding lapsed for 2022-2023 includes $631 million lapse of statutory authorities for the One-time top-up to the Canada Housing Benefit.

Mortgage Insurance What we do We offer competitive mortgage insurance products to support homeownership financing and facilitate the construction, purchase, and refinance of multi-unit residential properties. These activities support the stability of the Canadian financial system. We operate these programs on a commercial basis with due regard for loss and without the need for government funding. How we do it We work with lenders to offer transactional homeowner and portfolio mortgage insurance products in all parts of Canada. We also offer multi-unit mortgage insurance, which provides access to preferred lenders’ interest rates for the construction, purchase and refinancing of multi-unit residential properties, including affordable rental housing. Our Products Transactional Homeowner Insurance Protects lenders against borrower default, enabling qualified borrowers, with a minimum down payment of 5% and less than 20%, to access mortgage financing at competitive rates for the purchase of 1-4 unit residential properties. Portfolio Insurance Allows lenders to pool low-ratio residential mortgages (i.e. mortgages on 1-4 unit residential properties with down payments of 20% or more) and insure these against borrower default, making them eligible for our securitization programs. Multi-Unit Residential Insurance Protects lenders against borrower default on loans for the construction, purchase and refinancing of multi-unit (5+ units) residential properties.
Homeowner Mortgage Loan Insurance (MLI) Homeowner mortgage loan insurance (MLI) is an important contributor to our affordability and stability objectives, and we continue to deliver on our commercial activities and seek an appropriate and diverse presence in the market. In 2023, our homeowner insurance products helped buyers purchase over 48,000 housing units across Canada, with just over 15% insured in rural areas of the country. CMHC also offers lenders default-management tools to help them assist borrowers who are facing difficulty in paying their insured mortgages. Energy-efficient housing is made more affordable with MLI. CMHC’s Eco Plus and Eco Improvement programs help reduce the impact of housing on climate change and contribute to the Government of Canada’s plan to achieve carbon neutrality by 2050. These programs offer a 25% partial insurance premium refund on the cost of mortgage loan insurance for those buying, building or improving homes for energy efficiency. As energy efficiency standards improve, so will the criteria for the Eco programs, which will see more certifications and ongoing alignment with Natural Resources Canada’s EnerGuide rating system. 187 loans benefitted from these programs in 2023. CMHC Connect is modernizing our homeowner mortgage loan insurance business by introducing enhanced technologies, processes and services that allow for faster decision-making and increased transparency. CMHC Connect is the umbrella platform that includes our insurance servicing, transactional homeowner MLI, portfolio insurance, and administration systems. Through this long-term project and investment, we are providing an improved client experience for lenders, which will ultimately better serve Canadians and build a strong foundation for the future. Significant components of our portfolio and claims, defaults and arrears functions have been modernized. Focus is on replacing and modernizing our transactional homeowner insurance underwriting system, emili, over the next few years. In the interim, we will continue to make investments in emili to ensure mortgage insurance risk is managed appropriately and that we deliver a positive experience to clients. Multi-Unit Mortgage Loan Insurance (MU MLI) Over 2023, uncertain economic conditions including high interest rates and increased construction costs continued to add pressure to the rental housing market, making it harder for multi-unit (MU) projects to be viable. Higher capital requirements for uninsured loans also incentivized lenders to send more loans to CMHC for MU MLI, allowing them to offer lower interest rates. Collectively, these conditions pushed demand for MU MLI to record-high levels. Focus on Underwriting Operations With the increased demand for MU MLI, CMHC undertook a composite plan focused on several key factors: augmented staffing resources, process and policy clarifications, and risk-based accelerated underwriting. The efficiency gained allowed us to succeed in processing the higher volume of applications received. These efforts have positioned our Underwriting Operations function well for 2024 as the evolution of our approach to underwriting continues. Enhanced GST Rental Rebate On 14 September 2023, the Prime Minister announced the introduction of legislation to enhance the Goods and Services Tax (GST) Rental Rebate for new purpose-built rental housing, to incentivize construction of much-needed rental housing. The legislation received Royal Assent on 15 December 2023. The enhanced GST rental rebate increases the GST rebate from 36% to 100% of the GST for new purpose-built rental housing, such as apartment buildings, student housing, and senior residences, built specifically for long-term rental accommodation. This enhancement is a temporary measure that will apply to purpose-built rental housing that qualify for the current rebate where the construction of the building or addition begins after 13 September 2023 and is substantially completed before 2036. Furthermore, certain harmonized provinces announced that they would match the enhanced GST rental rebate and remove fully or partially the provincial comment of the HST. The enhanced GST rental rebate is expected to increase volumes in our MLI business, however the impact is not yet known.
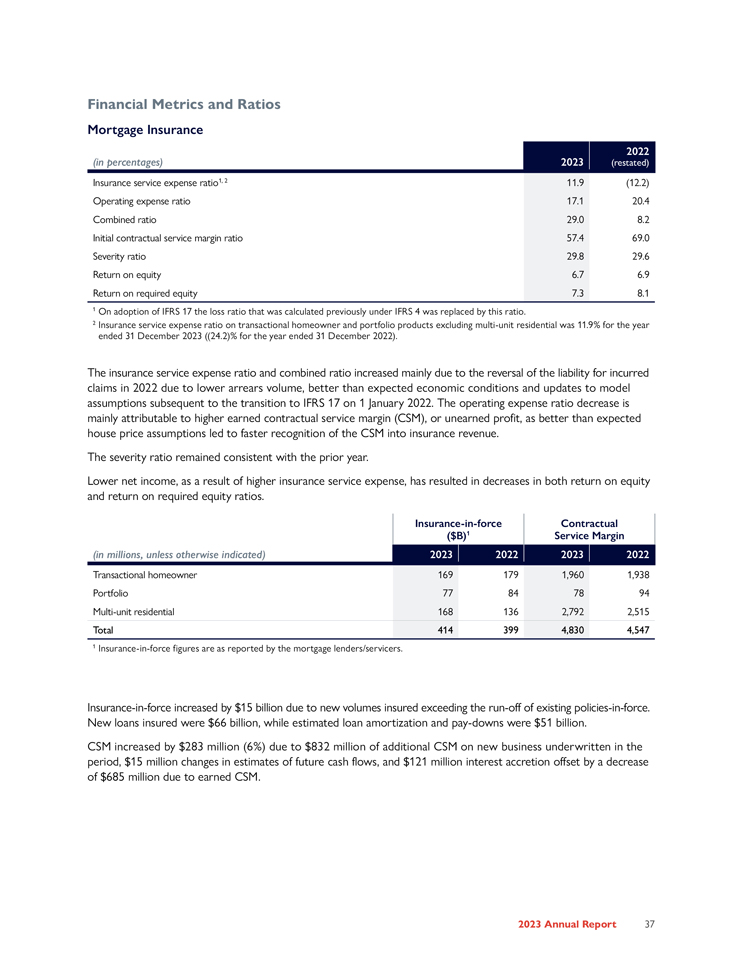
Financial Metrics and Ratios Mortgage Insurance percentages) 2023 2022 (in (restated) Insurance service expense ratio1, 2 11.9 (12.2) Operating expense ratio 17.1 20.4 Combined ratio 29.0 8.2 Initial contractual service margin ratio 57.4 69.0 Severity ratio 29.8 29.6 Return on equity 6.7 6.9 Return on required equity 7.3 8.1 1 On adoption of IFRS 17 the loss ratio that was calculated previously under IFRS 4 was replaced by this ratio. 2 Insurance service expense ratio on transactional homeowner and portfolio products excluding multi-unit residential was 11.9% for the year ended 31 December 2023 ((24.2)% for the year ended 31 December 2022). The insurance service expense ratio and combined ratio increased mainly due to the reversal of the liability for incurred claims in 2022 due to lower arrears volume, better than expected economic conditions and updates to model assumptions subsequent to the transition to IFRS 17 on 1 January 2022. The operating expense ratio decrease is mainly attributable to higher earned contractual service margin (CSM), or unearned profit, as better than expected house price assumptions led to faster recognition of the CSM into insurance revenue. The severity ratio remained consistent with the prior year. Lower net income, as a result of higher insurance service expense, has resulted in decreases in both return on equity and return on required equity ratios. Insurance-in-force Contractual ($B)1 Service Margin (in millions, unless otherwise indicated) 2023 2022 2023 2022 Transactional homeowner 169 179 1,960 1,938 Portfolio 77 84 78 94 Multi-unit residential 168 136 2,792 2,515 Total 414 399 4,830 4,547 1 Insurance-in-force figures are as reported by the mortgage lenders/servicers. Insurance-in-force increased by $15 billion due to new volumes insured exceeding the run-off of existing policies-in-force. New loans insured were $66 billion, while estimated loan amortization and pay-downs were $51 billion. CSM increased by $283 million (6%) due to $832 million of additional CSM on new business underwritten in the period, $15 million changes in estimates of future cash flows, and $121 million interest accretion offset by a decrease of $685 million due to earned CSM.
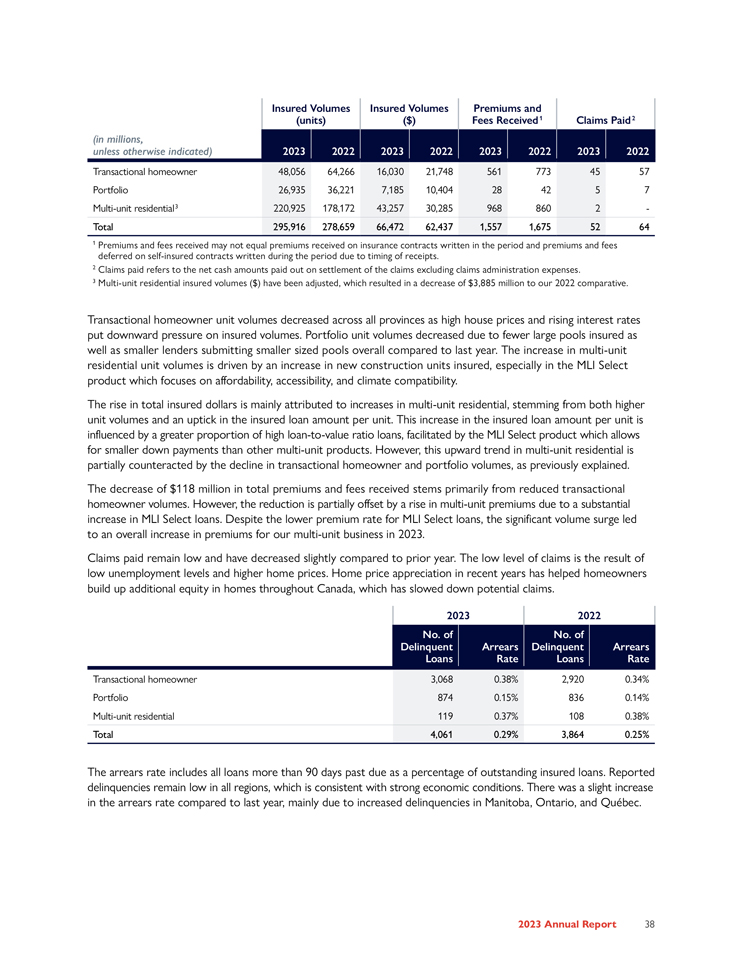
Insured Volumes Insured Volumes Premiums and (units) ($) Fees Received1 Claims Paid2 (in millions, unless otherwise indicated) 2023 2022 2023 2022 2023 2022 2023 2022 Transactional homeowner 48,056 64,266 16,030 21,748 561 773 45 57 Portfolio 26,935 36,221 7,185 10,404 28 42 5 7 Multi-unit residential3 220,925 178,172 43,257 30,285 968 860 2—Total 295,916 278,659 66,472 62,437 1,557 1,675 52 64 1 Premiums and fees received may not equal premiums received on insurance contracts written in the period and premiums and fees deferred on self-insured contracts written during the period due to timing of receipts. 2 Claims paid refers to the net cash amounts paid out on settlement of the claims excluding claims administration expenses. 3 Multi-unit residential insured volumes ($) have been adjusted, which resulted in a decrease of $3,885 million to our 2022 comparative. Transactional homeowner unit volumes decreased across all provinces as high house prices and rising interest rates put downward pressure on insured volumes. Portfolio unit volumes decreased due to fewer large pools insured as well as smaller lenders submitting smaller sized pools overall compared to last year. The increase in multi-unit residential unit volumes is driven by an increase in new construction units insured, especially in the MLI Select product which focuses on affordability, accessibility, and climate compatibility. The rise in total insured dollars is mainly attributed to increases in multi-unit residential, stemming from both higher unit volumes and an uptick in the insured loan amount per unit. This increase in the insured loan amount per unit is influenced by a greater proportion of high loan-to-value ratio loans, facilitated by the MLI Select product which allows for smaller down payments than other multi-unit products. However, this upward trend in multi-unit residential is partially counteracted by the decline in transactional homeowner and portfolio volumes, as previously explained. The decrease of $118 million in total premiums and fees received stems primarily from reduced transactional homeowner volumes. However, the reduction is partially offset by a rise in multi-unit premiums due to a substantial increase in MLI Select loans. Despite the lower premium rate for MLI Select loans, the significant volume surge led to an overall increase in premiums for our multi-unit business in 2023. Claims paid remain low and have decreased slightly compared to prior year. The low level of claims is the result of low unemployment levels and higher home prices. Home price appreciation in recent years has helped homeowners build up additional equity in homes throughout Canada, which has slowed down potential claims. 2023 2022 No. of No. of Delinquent Arrears Delinquent Arrears Loans Rate Loans Rate Transactional homeowner 3,068 0.38% 2,920 0.34% Portfolio 874 0.15% 836 0.14% Multi-unit residential 119 0.37% 108 0.38% Total 4,061 0.29% 3,864 0.25% The arrears rate includes all loans more than 90 days past due as a percentage of outstanding insured loans. Reported delinquencies remain low in all regions, which is consistent with strong economic conditions. There was a slight increase in the arrears rate compared to last year, mainly due to increased delinquencies in Manitoba, Ontario, and Québec.
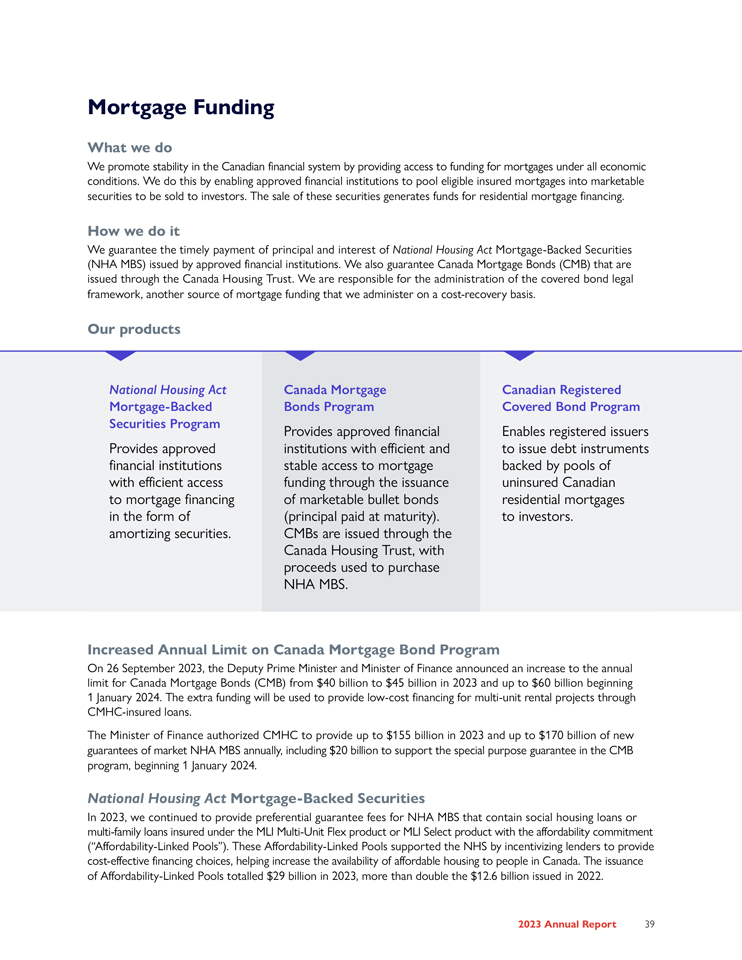
Mortgage Funding What we do We promote stability in the Canadian financial system by providing access to funding for mortgages under all economic conditions. We do this by enabling approved financial institutions to pool eligible insured mortgages into marketable securities to be sold to investors. The sale of these securities generates funds for residential mortgage financing. How we do it We guarantee the timely payment of principal and interest of National Housing Act Mortgage-Backed Securities (NHA MBS) issued by approved financial institutions. We also guarantee Canada Mortgage Bonds (CMB) that are issued through the Canada Housing Trust. We are responsible for the administration of the covered bond legal framework, another source of mortgage funding that we administer on a cost-recovery basis. Our products National Housing Act Mortgage-Backed Securities Program Provides approved financial institutions with efficient access to mortgage financing in the form of amortizing securities. Canada Mortgage Bonds Program Provides approved financial institutions with efficient and stable access to mortgage funding through the issuance of marketable bullet bonds (principal paid at maturity). CMBs are issued through the Canada Housing Trust, with proceeds used to purchase NHA MBS. Canadian Registered Covered Bond Program Enables registered issuers to issue debt instruments backed by pools of uninsured Canadian residential mortgages to investors. Increased Annual Limit on Canada Mortgage Bond Program On 26 September 2023, the Deputy Prime Minister and Minister of Finance announced an increase to the annual limit for Canada Mortgage Bonds (CMB) from $40 billion to $45 billion in 2023 and up to $60 billion beginning 1 January 2024. The extra funding will be used to provide low-cost financing for multi-unit rental projects through CMHC-insured loans. The Minister of Finance authorized CMHC to provide up to $155 billion in 2023 and up to $170 billion of new guarantees of market NHA MBS annually, including $20 billion to support the special purpose guarantee in the CMB program, beginning 1 January 2024. National Housing Act Mortgage-Backed Securities In 2023, we continued to provide preferential guarantee fees for NHA MBS that contain social housing loans or multi-family loans insured under the MLI Multi-Unit Flex product or MLI Select product with the affordability commitment (“Affordability-Linked Pools”). These Affordability-Linked Pools supported the NHS by incentivizing lenders to provide cost-effective financing choices, helping increase the availability of affordable housing to people in Canada. The issuance of Affordability-Linked Pools totalled $29 billion in 2023, more than double the $12.6 billion issued in 2022.
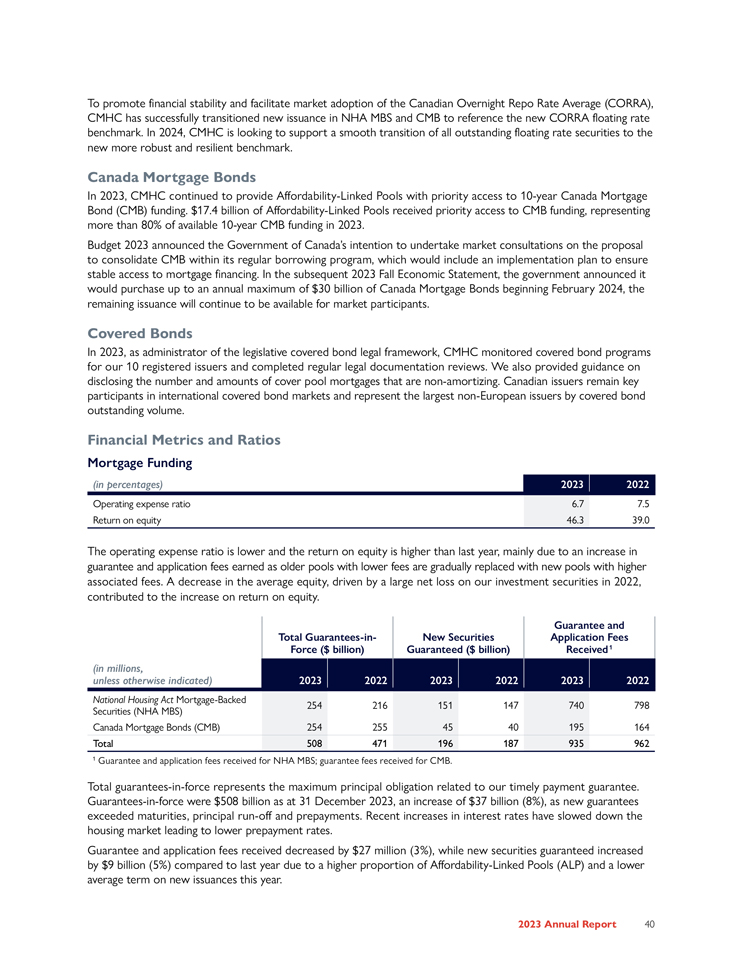
To promote financial stability and facilitate market adoption of the Canadian Overnight Repo Rate Average (CORRA), CMHC has successfully transitioned new issuance in NHA MBS and CMB to reference the new CORRA floating rate benchmark. In 2024, CMHC is looking to support a smooth transition of all outstanding floating rate securities to the new more robust and resilient benchmark. Canada Mortgage Bonds In 2023, CMHC continued to provide Affordability-Linked Pools with priority access to 10-year Canada Mortgage Bond (CMB) funding. $17.4 billion of Affordability-Linked Pools received priority access to CMB funding, representing more than 80% of available 10-year CMB funding in 2023. Budget 2023 announced the Government of Canada’s intention to undertake market consultations on the proposal to consolidate CMB within its regular borrowing program, which would include an implementation plan to ensure stable access to mortgage financing. In the subsequent 2023 Fall Economic Statement, the government announced it would purchase up to an annual maximum of $30 billion of Canada Mortgage Bonds beginning February 2024, the remaining issuance will continue to be available for market participants. Covered Bonds In 2023, as administrator of the legislative covered bond legal framework, CMHC monitored covered bond programs for our 10 registered issuers and completed regular legal documentation reviews. We also provided guidance on disclosing the number and amounts of cover pool mortgages that are non-amortizing. Canadian issuers remain key participants in international covered bond markets and represent the largest non-European issuers by covered bond outstanding volume. Financial Metrics and Ratios Mortgage Funding (in percentages) 2023 2022 Operating expense ratio 6.7 7.5 Return on equity 46.3 39.0 The operating expense ratio is lower and the return on equity is higher than last year, mainly due to an increase in guarantee and application fees earned as older pools with lower fees are gradually replaced with new pools with higher associated fees. A decrease in the average equity, driven by a large net loss on our investment securities in 2022, contributed to the increase on return on equity. Guarantee and Total Guarantees-in- New Securities Application Fees Force ($ billion) Guaranteed ($ billion) Received1 (in millions, unless otherwise indicated) 2023 2022 2023 2022 2023 2022 National Housing Act Mortgage-Backed 254 216 151 147 740 798 Securities (NHA MBS) Canada Mortgage Bonds (CMB) 254 255 45 40 195 164 Total 508 471 196 187 935 962 1 Guarantee and application fees received for NHA MBS; guarantee fees received for CMB. Total guarantees-in-force represents the maximum principal obligation related to our timely payment guarantee. Guarantees-in-force were $508 billion as at 31 December 2023, an increase of $37 billion (8%), as new guarantees exceeded maturities, principal run-off and prepayments. Recent increases in interest rates have slowed down the housing market leading to lower prepayment rates. Guarantee and application fees received decreased by $27 million (3%), while new securities guaranteed increased by $9 billion (5%) compared to last year due to a higher proportion of Affordability-Linked Pools (ALP) and a lower average term on new issuances this year.
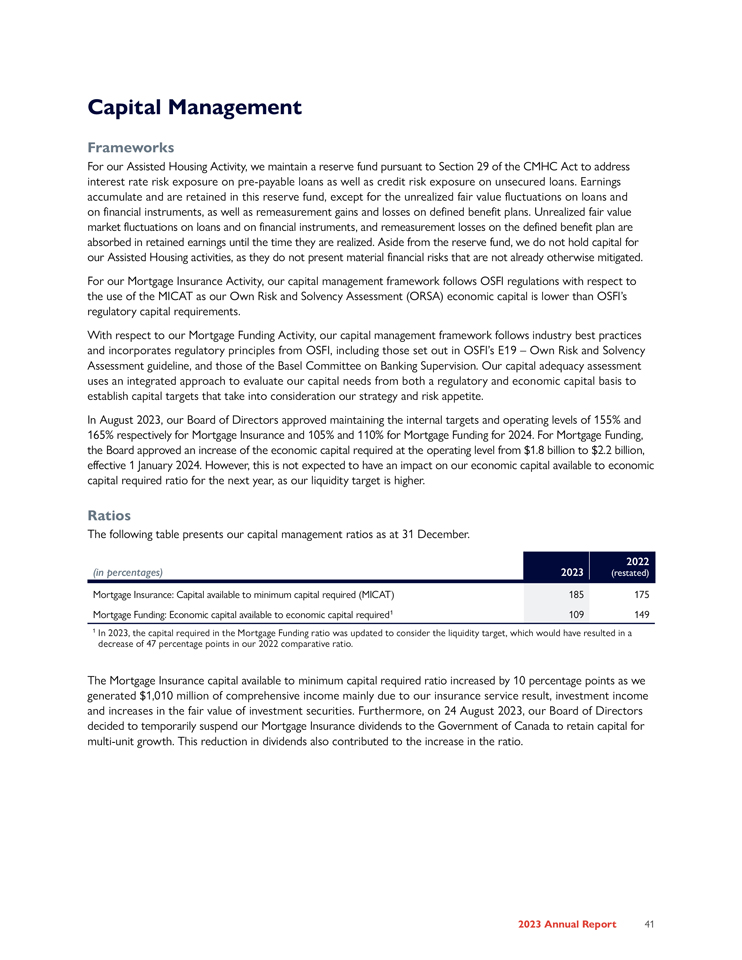
Capital Management Frameworks For our Assisted Housing Activity, we maintain a reserve fund pursuant to Section 29 of the CMHC Act to address interest rate risk exposure on pre-payable loans as well as credit risk exposure on unsecured loans. Earnings accumulate and are retained in this reserve fund, except for the unrealized fair value fluctuations on loans and on financial instruments, as well as remeasurement gains and losses on defined benefit plans. Unrealized fair value market fluctuations on loans and on financial instruments, and remeasurement losses on the defined benefit plan are absorbed in retained earnings until the time they are realized. Aside from the reserve fund, we do not hold capital for our Assisted Housing activities, as they do not present material financial risks that are not already otherwise mitigated. For our Mortgage Insurance Activity, our capital management framework follows OSFI regulations with respect to the use of the MICAT as our Own Risk and Solvency Assessment (ORSA) economic capital is lower than OSFI’s regulatory capital requirements. With respect to our Mortgage Funding Activity, our capital management framework follows industry best practices and incorporates regulatory principles from OSFI, including those set out in OSFI’s E19 – Own Risk and Solvency Assessment guideline, and those of the Basel Committee on Banking Supervision. Our capital adequacy assessment uses an integrated approach to evaluate our capital needs from both a regulatory and economic capital basis to establish capital targets that take into consideration our strategy and risk appetite. In August 2023, our Board of Directors approved maintaining the internal targets and operating levels of 155% and 165% respectively for Mortgage Insurance and 105% and 110% for Mortgage Funding for 2024. For Mortgage Funding, the Board approved an increase of the economic capital required at the operating level from $1.8 billion to $2.2 billion, effective 1 January 2024. However, this is not expected to have an impact on our economic capital available to economic capital required ratio for the next year, as our liquidity target is higher. Ratios The following table presents our capital management ratios as at 31 December. percentages) 2023 2022 (in (restated) Mortgage Insurance: Capital available to minimum capital required (MICAT) 185 175 Mortgage Funding: Economic capital available to economic capital required1 109 149 1 In 2023, the capital required in the Mortgage Funding ratio was updated to consider the liquidity target, which would have resulted in a decrease of 47 percentage points in our 2022 comparative ratio. The Mortgage Insurance capital available to minimum capital required ratio increased by 10 percentage points as we generated $1,010 million of comprehensive income mainly due to our insurance service result, investment income and increases in the fair value of investment securities. Furthermore, on 24 August 2023, our Board of Directors decided to temporarily suspend our Mortgage Insurance dividends to the Government of Canada to retain capital for multi-unit growth. This reduction in dividends also contributed to the increase in the ratio.
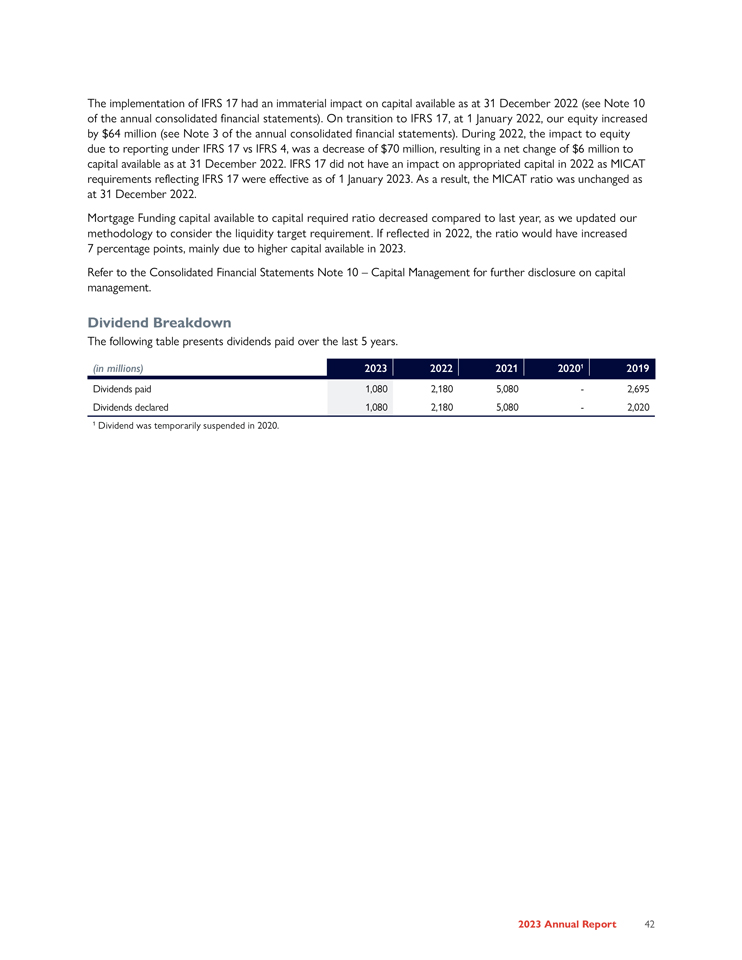
The implementation of IFRS 17 had an immaterial impact on capital available as at 31 December 2022 (see Note 10 of the annual consolidated financial statements). On transition to IFRS 17, at 1 January 2022, our equity increased by $64 million (see Note 3 of the annual consolidated financial statements). During 2022, the impact to equity due to reporting under IFRS 17 vs IFRS 4, was a decrease of $70 million, resulting in a net change of $6 million to capital available as at 31 December 2022. IFRS 17 did not have an impact on appropriated capital in 2022 as MICAT requirements reflecting IFRS 17 were effective as of 1 January 2023. As a result, the MICAT ratio was unchanged as at 31 December 2022. Mortgage Funding capital available to capital required ratio decreased compared to last year, as we updated our methodology to consider the liquidity target requirement. If reflected in 2022, the ratio would have increased 7 percentage points, mainly due to higher capital available in 2023. Refer to the Consolidated Financial Statements Note 10 – Capital Management for further disclosure on capital management. Dividend Breakdown The following table presents dividends paid over the last 5 years. (in millions) 2023 2022 2021 20201 2019 Dividends paid 1,080 2,180 5,080—2,695 Dividends declared 1,080 2,180 5,080—2,020 1 Dividend was temporarily suspended in 2020.

RISK MANAGEMENT Our Enterprise Risk Management Framework (ERMF) is crucial to our proactive risk management practice. It helps us effectively manage risks in the financial system affecting housing and our business activities. ERMF Overview In 2023, we conducted a comprehensive review of our ERMF. The updated ERMF focuses on key risk management activities, and it is underpinned by a set of principles to guide our decisions and risk management activities. It includes a more robust risk taxonomy that provides greater coverage for the identification, assessment, mitigation, and reporting of risks relevant to CMHC. The ERMF helps ensure our risk management activities are comprehensive and an integral part of strategy formulation as well as day-to-day business activities and decision-making. In these ways, the ERMF reinforces an effective risk culture across the organization and supports the achievement of CMHC’s strategic and business objectives.
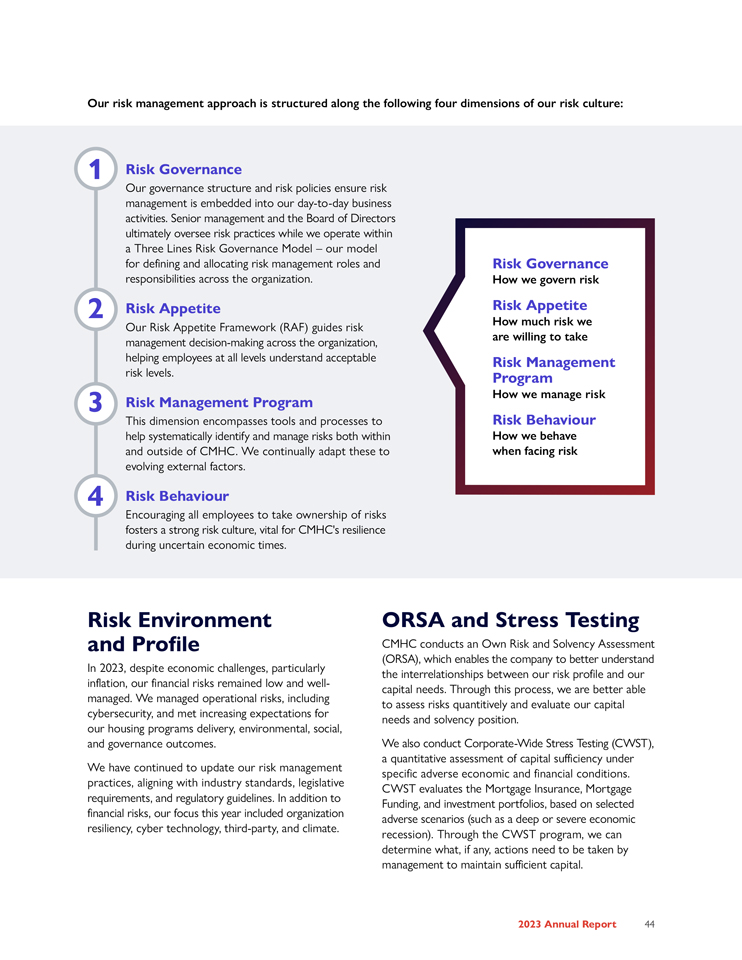
Our risk management approach is structured along the following four dimensions of our risk culture: 1 Risk Governance Our governance structure and risk policies ensure risk management is embedded into our day-to-day business activities. Senior management and the Board of Directors ultimately oversee risk practices while we operate within a Three Lines Risk Governance Model – our model for defining and allocating risk management roles and responsibilities across the organization. 2 Risk Appetite Our Risk Appetite Framework (RAF) guides risk management decision-making across the organization, helping employees at all levels understand acceptable risk levels. 3 Risk Management Program This dimension encompasses tools and processes to help systematically identify and manage risks both within and outside of CMHC. We continually adapt these to evolving external factors. 4 Risk Behaviour Encouraging all employees to take ownership of risks fosters a strong risk culture, vital for CMHC’s resilience during uncertain economic times. Risk Governance How we govern risk Risk Appetite How much risk we are willing to take Risk Management Program How we manage risk Risk Behaviour How we behave when facing risk Risk Environment and Profile In 2023, despite economic challenges, particularly inflation, our financial risks remained low and well-managed. We managed operational risks, including cybersecurity, and met increasing expectations for our housing programs delivery, environmental, social, and governance outcomes. We have continued to update our risk management practices, aligning with industry standards, legislative requirements, and regulatory guidelines. In addition to financial risks, our focus this year included organization resiliency, cyber technology, third-party, and climate. ORSA and Stress Testing CMHC conducts an Own Risk and Solvency Assessment (ORSA), which enables the company to better understand the interrelationships between our risk profile and our capital needs. Through this process, we are better able to assess risks quantitively and evaluate our capital needs and solvency position. We also conduct Corporate-Wide Stress Testing (CWST), a quantitative assessment of capital sufficiency under specific adverse economic and financial conditions. CWST evaluates the Mortgage Insurance, Mortgage Funding, and investment portfolios, based on selected adverse scenarios (such as a deep or severe economic recession). Through the CWST program, we can determine what, if any, actions need to be taken by management to maintain sufficient capital.

CLIMATE-RELATED FINANCIAL RISK DISCLOSURES CMHC continues to monitor and advance its climate risk management practices in response to evolving expectations and standards for climate risk management and climate-related financial disclosures set out by: • The Task-Force on Climate-related Financial Disclosures (TCFD) by the international Financial Stability Board; • The Office of the Superintendent of Financial Institutions (OSFI) published Guideline B-15: Climate Risk Management; • International Sustainability Standards Board (ISSB) S1 General Requirements for Disclosure of Sustainability-related Financial Information; and • ISSB S2 Climate-related Disclosures.
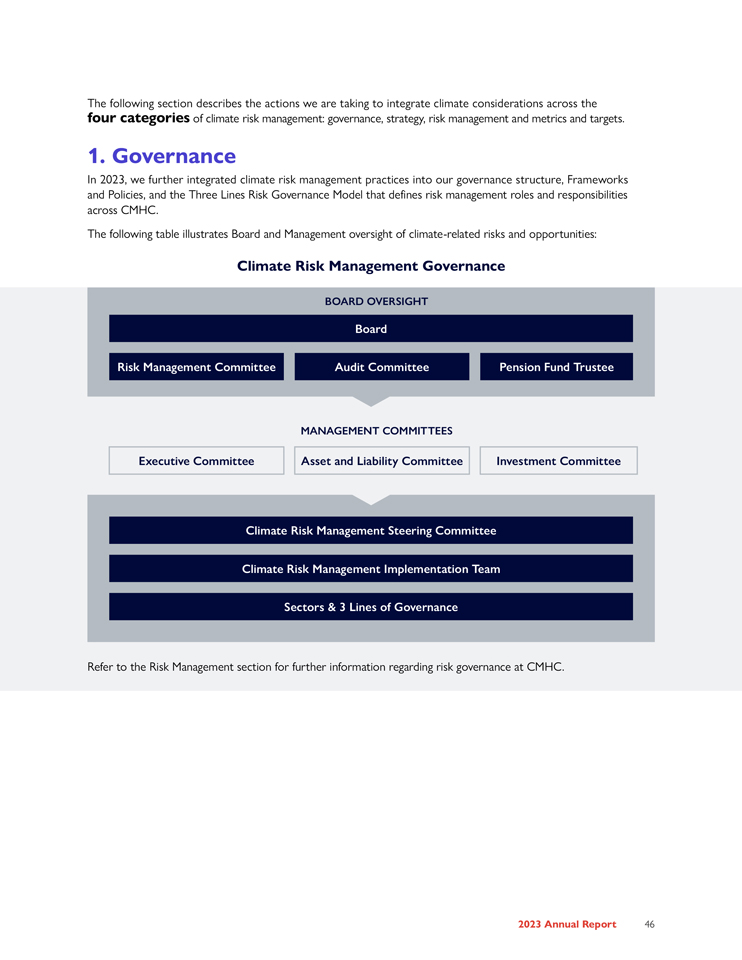
The following section describes the actions we are taking to integrate climate considerations across the four categories of climate risk management: governance, strategy, risk management and metrics and targets. 1. Governance In 2023, we further integrated climate risk management practices into our governance structure, Frameworks and Policies, and the Three Lines Risk Governance Model that defines risk management roles and responsibilities across CMHC. The following table illustrates Board and Management oversight of climate-related risks and opportunities: Climate Risk Management Governance BOARD OVERSIGHT Board Risk Management Committee Audit Committee Pension Fund Trustee MANAGEMENT COMMITTEES Executive Committee Asset and Liability Committee Investment Committee Climate Risk Management Steering Committee Climate Risk Management Implementation Team Sectors & 3 Lines of Governance Refer to the Risk Management section for further information regarding risk governance at CMHC.

2. Strategy Climate change increases the intensity and frequency of extreme weather events and long-term shifts in climate patterns. These physical risk drivers along with the Government of Canada’s goal of transitioning to a net-zero greenhouse gas emissions introduce potential risks to CMHC. In 2023, as a result of prioritizing climate risk drivers, CMHC identified flood and wildfire as priority physical risk drivers to assess impacts on our business strategies, operations and financial plan. Prioritizing Climate Drivers To identify, assess and manage climate-related risks and opportunities, CMHC prioritized which climate drivers were most relevant and had potentially material impacts to the company. A repeatable annual process for prioritizing and selecting climate risk drivers was established and supported by a set of criteria to determine the priority drivers. The criteria are: • Frequency of event, using data from the Canadian National Disaster Database; • total value of primary insurance claims, by single-event costs according to information available from the Insurance Bureau of Canada. • Government of Canada priorities expressed in National Adaptation Strategy, the National Risk Profile, and federal budgets; • data availability. We acknowledge that data challenges and the nascency of methodologies limited our ability to separately identify and assess transition risks at this time. Opportunities We continue to offer products and programs that incentivize energy efficiency and greenhouse gas (GHG) emissions reductions. (Refer to the Assisted Housing and Mortgage Insurance sections of this report for products and programs).
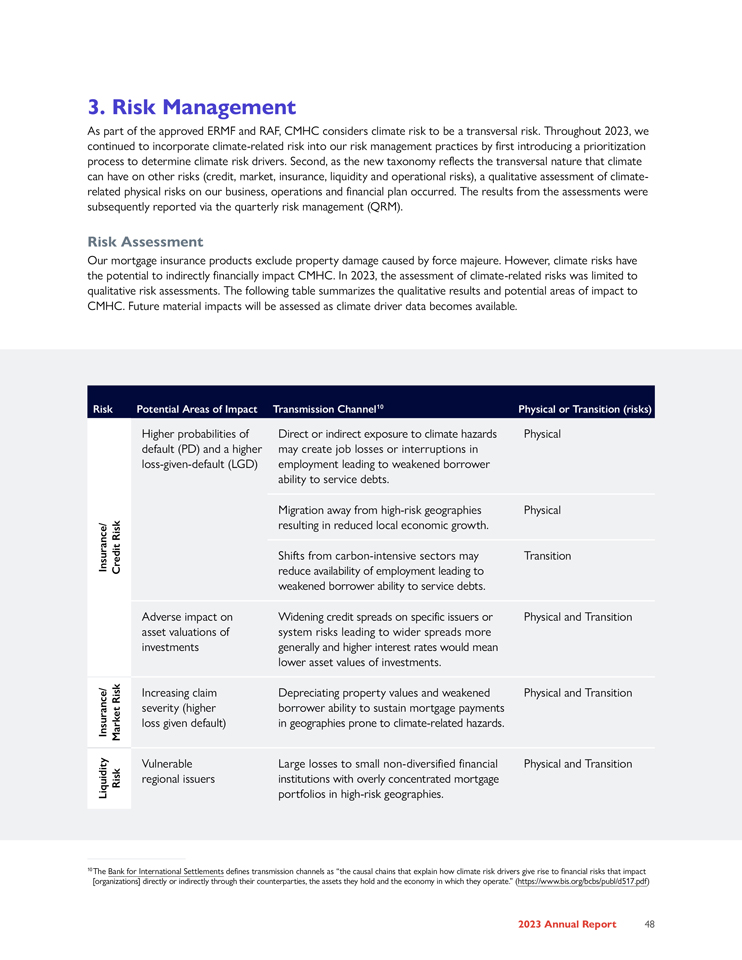
3. Risk Management As part of the approved ERMF and RAF, CMHC considers climate risk to be a transversal risk. Throughout 2023, we continued to incorporate climate-related risk into our risk management practices by first introducing a prioritization process to determine climate risk drivers. Second, as the new taxonomy reflects the transversal nature that climate can have on other risks (credit, market, insurance, liquidity and operational risks), a qualitative assessment of climate-related physical risks on our business, operations and financial plan occurred. The results from the assessments were subsequently reported via the quarterly risk management (QRM). Risk Assessment Our mortgage insurance products exclude property damage caused by force majeure. However, climate risks have the potential to indirectly financially impact CMHC. In 2023, the assessment of climate-related risks was limited to qualitative risk assessments. The following table summarizes the qualitative results and potential areas of impact to CMHC. Future material impacts will be assessed as climate driver data becomes available. Risk Potential Areas of Impact Transmission Channel10 Physical or Transition (risks) Higher probabilities of Direct or indirect exposure to climate hazards Physical default (PD) and a higher may create job losses or interruptions in loss-given-default (LGD) employment leading to weakened borrower ability to service debts. Migration away from high-risk geographies Physical Risk resulting in reduced local economic growth. Insurance/ Credit Shifts from carbon-intensive sectors may Transition reduce availability of employment leading to weakened borrower ability to service debts. Adverse impact on Widening credit spreads on specific issuers or Physical and Transition asset valuations of system risks leading to wider spreads more investments generally and higher interest rates would mean lower asset values of investments. Risk Increasing claim Depreciating property values and weakened Physical and Transition severity (higher borrower ability to sustain mortgage payments Insurance/ Market loss given default) in geographies prone to climate-related hazards. Vulnerable Large losses to small non-diversified financial Physical and Transition Risk regional issuers institutions with overly concentrated mortgage Liquidity portfolios in high-risk geographies. 10The Bank for International Settlements defines transmission channels as “the causal chains that explain how climate risk drivers give rise to financial risks that impact [organizations] directly or indirectly through their counterparties, the assets they hold and the economy in which they operate.” (https://www.bis.org/bcbs/publ/d517.pdf)
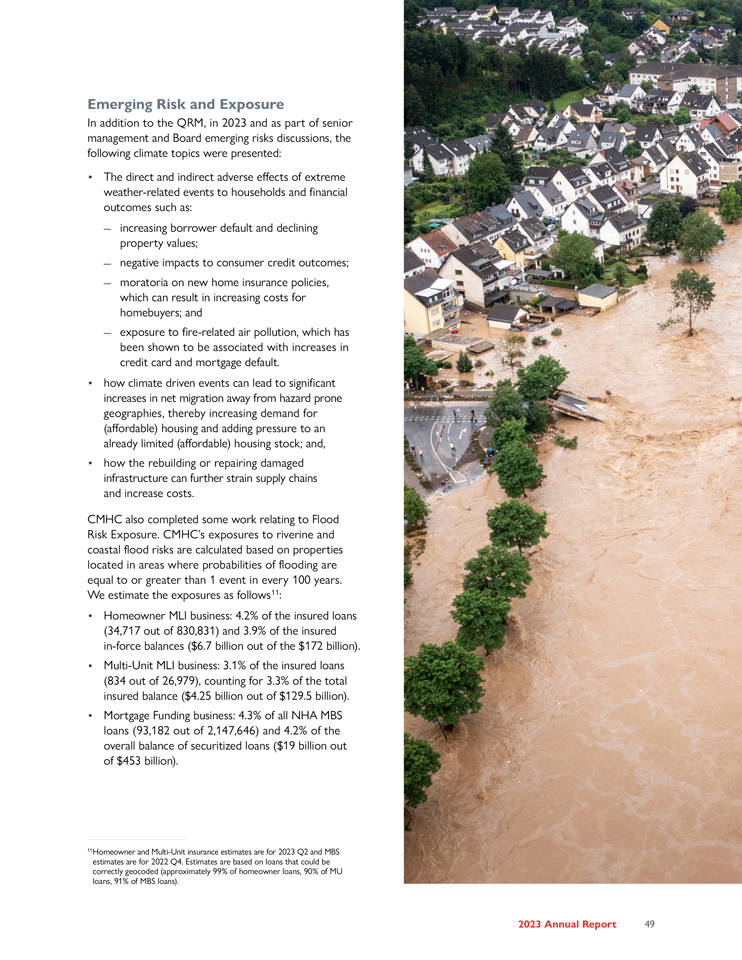
Emerging Risk and Exposure In addition to the QRM, in 2023 and as part of senior management and Board emerging risks discussions, the following climate topics were presented: • The direct and indirect adverse effects of extreme weather-related events to households and financial outcomes such as: – increasing borrower default and declining property values; – negative impacts to consumer credit outcomes; – moratoria on new home insurance policies, which can result in increasing costs for homebuyers; and – exposure to fire-related air pollution, which has been shown to be associated with increases in credit card and mortgage default. • how climate driven events can lead to significant increases in net migration away from hazard prone geographies, thereby increasing demand for (affordable) housing and adding pressure to an already limited (affordable) housing stock; and, • how the rebuilding or repairing damaged infrastructure can further strain supply chains and increase costs. CMHC also completed some work relating to Flood Risk Exposure. CMHC’s exposures to riverine and coastal flood risks are calculated based on properties located in areas where probabilities of flooding are equal to or greater than 1 event in every 100 years. We estimate the exposures as follows11: • Homeowner MLI business: 4.2% of the insured loans (34,717 out of 830,831) and 3.9% of the insured in-force balances ($6.7 billion out of the $172 billion). • Multi-Unit MLI business: 3.1% of the insured loans (834 out of 26,979), counting for 3.3% of the total insured balance ($4.25 billion out of $129.5 billion). • Mortgage Funding business: 4.3% of all NHA MBS loans (93,182 out of 2,147,646) and 4.2% of the overall balance of securitized loans ($19 billion out of $453 billion). 11 Homeowner and Multi-Unit insurance estimates are for 2023 Q2 and MBS estimates are for 2022 Q4. Estimates are based on loans that could be correctly geocoded (approximately 99% of homeowner loans, 90% of MU loans, 91% of MBS loans).
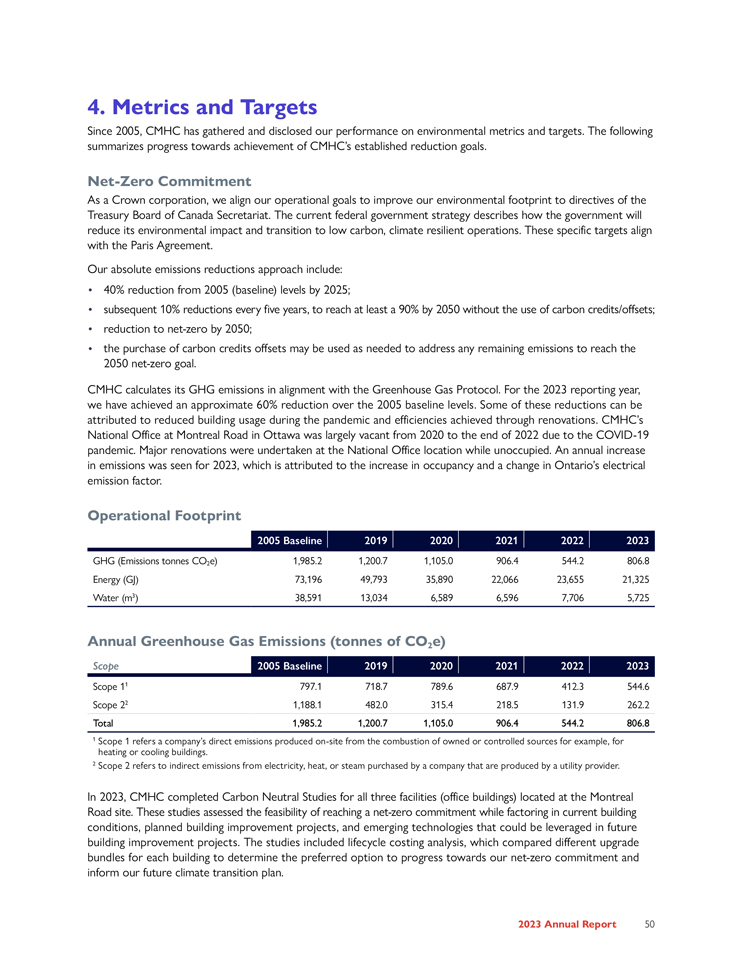
4. Metrics and Targets Since 2005, CMHC has gathered and disclosed our performance on environmental metrics and targets. The following summarizes progress towards achievement of CMHC’s established reduction goals. Net-Zero Commitment As a Crown corporation, we align our operational goals to improve our environmental footprint to directives of the Treasury Board of Canada Secretariat. The current federal government strategy describes how the government will reduce its environmental impact and transition to low carbon, climate resilient operations. These specific targets align with the Paris Agreement. Our absolute emissions reductions approach include: • 40% reduction from 2005 (baseline) levels by 2025; • subsequent 10% reductions every five years, to reach at least a 90% by 2050 without the use of carbon credits/offsets; • reduction to net-zero by 2050; • the purchase of carbon credits offsets may be used as needed to address any remaining emissions to reach the 2050 net-zero goal. CMHC calculates its GHG emissions in alignment with the Greenhouse Gas Protocol. For the 2023 reporting year, we have achieved an approximate 60% reduction over the 2005 baseline levels. Some of these reductions can be attributed to reduced building usage during the pandemic and efficiencies achieved through renovations. CMHC’s National Office at Montreal Road in Ottawa was largely vacant from 2020 to the end of 2022 due to the COVID-19 pandemic. Major renovations were undertaken at the National Office location while unoccupied. An annual increase in emissions was seen for 2023, which is attributed to the increase in occupancy and a change in Ontario’s electrical emission factor. Operational Footprint 2005 Baseline 2019 2020 2021 2022 2023 GHG (Emissions tonnes CO2e) 1,985.2 1,200.7 1,105.0 906.4 544.2 806.8 Energy (GJ) 73,196 49,793 35,890 22,066 23,655 21,325 Water (m3) 38,591 13,034 6,589 6,596 7,706 5,725 Annual Greenhouse Gas Emissions (tonnes of CO2e) Scope 2005 Baseline 2019 2020 2021 2022 2023 Scope 11 797.1 718.7 789.6 687.9 412.3 544.6 Scope 22 1,188.1 482.0 315.4 218.5 131.9 262.2 Total 1,985.2 1,200.7 1,105.0 906.4 544.2 806.8 1 Scope 1 refers a company’s direct emissions produced on-site from the combustion of owned or controlled sources for example, for heating or cooling buildings. 2 Scope 2 refers to indirect emissions from electricity, heat, or steam purchased by a company that are produced by a utility provider. In 2023, CMHC completed Carbon Neutral Studies for all three facilities (office buildings) located at the Montreal Road site. These studies assessed the feasibility of reaching a net-zero commitment while factoring in current building conditions, planned building improvement projects, and emerging technologies that could be leveraged in future building improvement projects. The studies included lifecycle costing analysis, which compared different upgrade bundles for each building to determine the preferred option to progress towards our net-zero commitment and inform our future climate transition plan.
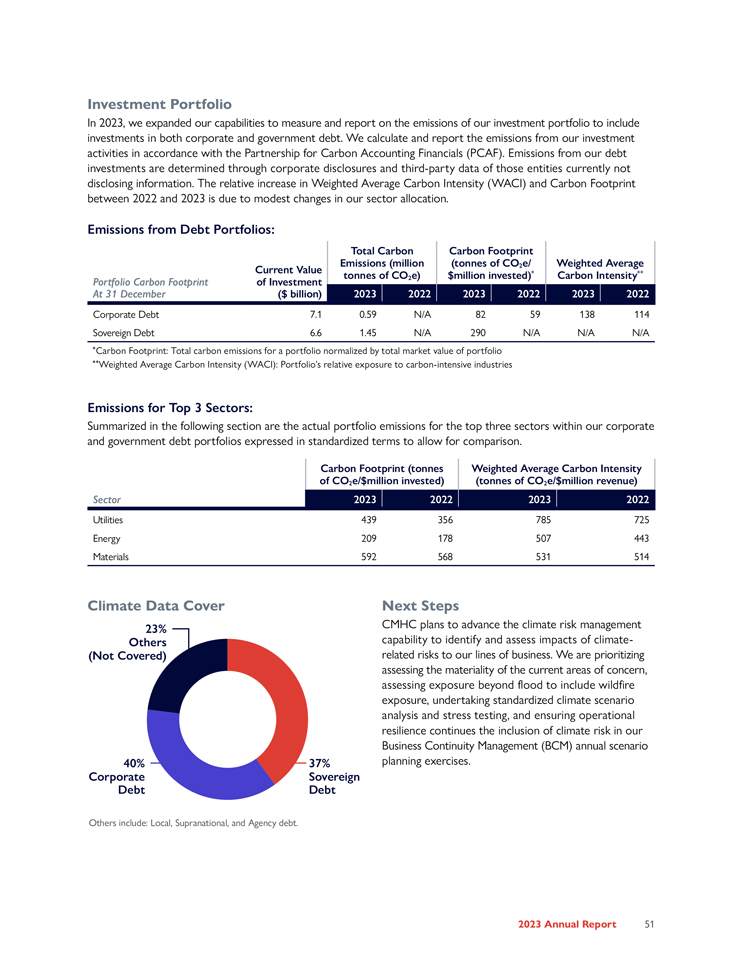
Investment Portfolio In 2023, we expanded our capabilities to measure and report on the emissions of our investment portfolio to include investments in both corporate and government debt. We calculate and report the emissions from our investment activities in accordance with the Partnership for Carbon Accounting Financials (PCAF). Emissions from our debt investments are determined through corporate disclosures and third-party data of those entities currently not disclosing information. The relative increase in Weighted Average Carbon Intensity (WACI) and Carbon Footprint between 2022 and 2023 is due to modest changes in our sector allocation. Emissions from Debt Portfolios: Total Carbon Carbon Footprint Emissions (million (tonnes of CO2e/ Weighted Average Current Value * ** tonnes of CO2e) $million invested) Carbon Intensity Portfolio Carbon Footprint of Investment At 31 December ($ billion) 2023 2022 2023 2022 2023 2022 Corporate Debt 7.1 0.59 N/A 82 59 138 114 Sovereign Debt 6.6 1.45 N/A 290 N/A N/A N/A *Carbon Footprint: Total carbon emissions for a portfolio normalized by total market value of portfolio **Weighted Average Carbon Intensity (WACI): Portfolio’s relative exposure to carbon-intensive industries Emissions for Top 3 Sectors: Summarized in the following section are the actual portfolio emissions for the top three sectors within our corporate and government debt portfolios expressed in standardized terms to allow for comparison. Carbon Footprint (tonnes Weighted Average Carbon Intensity of CO2e/$million invested) (tonnes of CO2e/$million revenue) Sector 2023 2022 2023 2022 Utilities 439 356 785 725 Energy 209 178 507 443 Materials 592 568 531 514 Climate Data Cover Next Steps 23% CMHC plans to advance the climate risk management Others capability to identify and assess impacts of climate-(Not Covered) related risks to our lines of business. We are prioritizing assessing the materiality of the current areas of concern, assessing exposure beyond flood to include wildfire exposure, undertaking standardized climate scenario analysis and stress testing, and ensuring operational resilience continues the inclusion of climate risk in our Business Continuity Management (BCM) annual scenario 40% 37% planning exercises. Corporate Sovereign Debt Debt Others include: Local, Supranational, and Agency debt.

LOOKING AHEAD TO 2024 We are working on the following that will carry through in 2024: Deliver on federal investments We will continue to work with Infrastructure Canada to develop the Affordable Housing Fund (AHF), the Apartment Construction Loan Program (ACLP), the Co-operative Housing Development Program and the Urban, Rural, and Northern Indigenous Housing Strategy, as announced in the 2023 Fall Economic Statement and Budgets 2022 and 2023. Office of the Superintendent of Financial Institutions (OSFI) In 2023, CMHC participated in various public consultations related to the publication of new, or revision of existing OSFI Guidelines, such as Integrity & Security; Culture & Behaviour; B-15: Climate Risk Management, B-20: Residential Mortgage Underwriting, E-21: Operational Resilience & Operational Risk Management and E-23: Model Risk Management. While the majority of these guidelines will carry into and become effective in 2024, CMHC continues to ensure that its policies and processes align with OSFI requirements and ongoing compliance monitoring is performed. Refer to the OSFI Consultations and Guidelines Appendix for additional information.
CONSOLIDATED
FINANCIAL STATEMENTS
| Management’s Responsibility for Financial Reporting | 54 | |||
| Independent Auditors’ Report | 55 | |||
| Consolidated Balance Sheet | 57 | |||
| Consolidated Statement of Income and Comprehensive Income | 58 | |||
| Consolidated Statement of Equity of Canada | 59 | |||
| Consolidated Statement of Cash Flows | 60 | |||
| Notes to Consolidated Financial Statements | 61 | |||
1. Corporate Information | 61 | |||
2. Basis of Preparation and Material Accounting Policy Information | 61 | |||
3. Current and Future Accounting Changes | 77 | |||
4. Critical Judgments in Applying Accounting Policies and Making Estimates | 80 | |||
5. Segmented Information | 85 | |||
6. Government Funding and Housing Programs Expenses | 89 | |||
7. Mortgage Insurance | 90 | |||
8. Mortgage Funding | 99 | |||
9. Structured Entities | 100 | |||
10. Capital Management | 101 | |||
11. Fair Value Measurement | 104 | |||
12. Cash and Cash Equivalents | 110 | |||
13. Investment Securities | 111 | |||
14. Loans | 113 | |||
15. Borrowings | 116 | |||
16. Derivatives | 118 | |||
17. Financial Instruments Income and Expenses | 120 | |||
18. Market Risk | 122 | |||
19. Credit Risk | 125 | |||
20. Liquidity Risk | 129 | |||
21. Accounts Receivable and Other Assets | 131 | |||
22. Investment Property | 131 | |||
23. Accounts Payable and Other Liabilities | 132 | |||
24. Pension and Other Post-Employment Benefits | 132 | |||
25. Income Taxes | 138 | |||
26. Related Party Transactions | 140 | |||
27. Commitments and Contingent Liabilities | 141 | |||
28. Operating Expenses | 141 | |||
29. Current and Non-Current Assets and Liabilities | 142 | |||
30. Comparative Figures | 142 | |||
31. Subsequent Event | 142 | |||
| 2023 Annual Report | 53 |
Management’s Responsibility for Financial Reporting
Year ended 31 December 2023
Management is responsible for the integrity and objectivity of the consolidated financial statements and related financial information presented in this annual report. The consolidated financial statements have been prepared in accordance with International Financial Reporting Standards (IFRS) and, consequently, include amounts which are based on the best estimates and judgment of Management. The financial information contained elsewhere in this Annual Report is consistent with that in the consolidated financial statements.
In carrying out its responsibilities, Management maintains appropriate financial systems and related internal controls to provide reasonable assurance that financial information is reliable; assets are safeguarded; transactions are properly authorized and are in accordance with the relevant legislation, by-laws of the Corporation and Government directives; resources are managed efficiently and economically; and operations are carried out effectively. The system of internal controls is assessed by internal audit, which conducts periodic audits of different aspects of the operations.
The Board of Directors, acting through the Audit Committee whose members are neither officers nor employees of the Corporation, oversees Management’s responsibilities for financial reporting and internal control systems. The Board of Directors, upon the recommendation of the Audit Committee, has approved the consolidated financial statements.
Ernst & Young LLP and the Auditor General of Canada have audited the consolidated financial statements. The auditors have full access to, and meet periodically with, the Audit Committee to discuss their audit and related matters.
 |  | |
| Michel Tremblay, CPA | Nadine Leblanc, CPA | |
| Acting President and | Interim Chief Financial Officer and | |
| Chief Executive Officer | Senior Vice President, Policy | |
| 20 March 2024 | ||
| 2023 Annual Report | 54 |

INDEPENDENT AUDITORS’ REPORT
To the Minister of Housing, Infrastructure and Communities
Report on the Audit of the Consolidated Financial Statements
Opinion
We have audited the consolidated financial statements of Canada Mortgage and Housing Corporation and its subsidiary (the Group), which comprise the consolidated balance sheets as at 31 December 2023, 31 December 2022 and 1 January 2022, and the consolidated statements of income and comprehensive income, consolidated statements of equity of Canada and consolidated statements of cash flows for the years ended 31 December 2023 and 31 December 2022, and notes to the consolidated financial statements, including material accounting policy information.
In our opinion, the accompanying consolidated financial statements present fairly, in all material respects, the consolidated financial position of the Group as at 31 December 2023, 31 December 2022 and 1 January 2022, and its consolidated financial performance and its consolidated cash flows for the years ended 31 December 2023 and 31 December 2022 in accordance with International Financial Reporting Standards (IFRSs).
Basis for Opinion
We conducted our audit in accordance with Canadian generally accepted auditing standards. Our responsibilities under those standards are further described in the Auditors’ Responsibilities for the Audit of the Consolidated Financial Statements section of our report. We are independent of the Group in accordance with the ethical requirements that are relevant to our audit of the consolidated financial statements in Canada, and we have fulfilled our other ethical responsibilities in accordance with these requirements. We believe that the audit evidence we have obtained is sufficient and appropriate to provide a basis for our opinion.
Other Information
Management is responsible for the other information. The other information comprises the information included in the annual report, but does not include the consolidated financial statements and our auditors’ report thereon.
Our opinion on the consolidated financial statements does not cover the other information and we do not express any form of assurance conclusion thereon.
In connection with our audit of the consolidated financial statements, our responsibility is to read the other information and, in doing so, consider whether the other information is materially inconsistent with the consolidated financial statements or our knowledge obtained in the audit, or otherwise appears to be materially misstated.

If, based on the work we have performed, we conclude that there is a material misstatement of this other information, we are required to report that fact. We have nothing to report in this regard.
Responsibilities of Management and Those Charged with Governance for the Consolidated Financial Statements
Management is responsible for the preparation and fair presentation of the consolidated financial statements in accordance with IFRSs, and for such internal control as management determines is necessary to enable the preparation of consolidated financial statements that are free from material misstatement, whether due to fraud or error.
In preparing the consolidated financial statements, management is responsible for assessing the Group’s ability to continue as a going concern, disclosing, as applicable, matters related to going concern and using the going concern basis of accounting unless management either intends to liquidate the Group or to cease operations, or has no realistic alternative but to do so.
Those charged with governance are responsible for overseeing the Group’s financial reporting process.
Auditors’ Responsibilities for the Audit of the Consolidated Financial Statements
Our objectives are to obtain reasonable assurance about whether the consolidated financial statements as a whole are free from material misstatement, whether due to fraud or error, and to issue an auditors’ report that includes our opinion. Reasonable assurance is a high level of assurance, but is not a guarantee that an audit conducted in accordance with Canadian generally accepted auditing standards will always detect a material misstatement when it exists. Misstatements can arise from fraud or error and are considered material if, individually or in the aggregate, they could reasonably be expected to influence the economic decisions of users taken on the basis of these consolidated financial statements.
As part of an audit in accordance with Canadian generally accepted auditing standards, we exercise professional judgment and maintain professional skepticism throughout the audit. We also:
| ● | Identify and assess the risks of material misstatement of the consolidated financial statements, whether due to fraud or error, design and perform audit procedures responsive to those risks, and obtain audit evidence that is sufficient and appropriate to provide a basis for our opinion. The risk of not detecting a material misstatement resulting from fraud is higher than for one resulting from error, as fraud may involve collusion, forgery, intentional omissions, misrepresentations, or the override of internal control. |
| 2023 Annual Report | 55 |
| ● | Obtain an understanding of internal control relevant to the audit in order to design audit procedures that are appropriate in the circumstances, but not for the purpose of expressing an opinion on the effectiveness of the Group’s internal control. |
| ● | Evaluate the appropriateness of accounting policies used and the reasonableness of accounting estimates and related disclosures made by management. |
| ● | Conclude on the appropriateness of management’s use of the going concern basis of accounting and, based on the audit evidence obtained, whether a material uncertainty exists related to events or conditions that may cast significant doubt on the Group’s ability to continue as a going concern. If we conclude that a material uncertainty exists, we are required to draw attention in our auditors’ report to the related disclosures in the consolidated financial statements or, if such disclosures are inadequate, to modify our opinion. Our conclusions are based on the audit evidence obtained up to the date of our auditors’ report. However, future events or conditions may cause the Group to cease to continue as a going concern. |
| ● | Evaluate the overall presentation, structure and content of the consolidated financial statements, including the disclosures, and whether the consolidated financial statements represent the underlying transactions and events in a manner that achieves fair presentation. |
| ● | Obtain sufficient appropriate audit evidence regarding the financial information of the Canada Housing Trust or business activities within the Group to express an opinion on the consolidated financial statements. We are responsible for the direction, supervision, and performance of the group audit. We remain solely responsible for our audit opinion. |
We communicate with those charged with governance regarding, among other matters, the planned scope and timing of the audit and significant audit findings, including any significant deficiencies in internal control that we identify during our audit.
Report on Compliance with Specified Authorities
Opinion
In conjunction with the audit of the consolidated financial statements, we have audited transactions of Canada Mortgage and Housing Corporation coming to our notice for compliance with specified authorities. The specified authorities against which compliance was audited are Part X of the Financial Administration Act and regulations, the Canada Mortgage and Housing Corporation Act, the National Housing Act, the by-laws of Canada Mortgage and Housing Corporation, and the directives issued pursuant to section 89 of the Financial Administration Act.
In our opinion, the transactions of Canada Mortgage and Housing Corporation that came to our notice during the audit of the consolidated financial statements have complied, in all material respects, with the specified authorities referred to above. Further, as required by the Financial Administration Act, we report that, in our opinion, the accounting principles in IFRSs have been applied, after giving retrospective effect to the change in the method of accounting for insurance contracts as explained in Note 3 to the consolidated financial statements, on a basis consistent with that of the preceding year.
Responsibilities of Management for Compliance with Specified Authorities
Management is responsible for Canada Mortgage and Housing Corporation’s compliance with the specified authorities named above, and for such internal control as management determines is necessary to enable Canada Mortgage and Housing Corporation to comply with the specified authorities.
Auditors’ Responsibilities for the Audit of Compliance with Specified Authorities
Our audit responsibilities include planning and performing procedures to provide an audit opinion and reporting on whether the transactions coming to our notice during the audit of the consolidated financial statements are in compliance with the specified authorities referred to above.

Riowen Yves Abgrall, CPA, CA
Principal
for the Auditor General of Canada
Chartered Professional Accountants
Licensed Public Accountants
Ottawa, Canada
20 March 2024
| 2023 Annual Report | 56 |
Consolidated Balance Sheet
| As at | ||||||||||||||||
(in millions of Canadian dollars) | Notes | 31 December 2023 | 31 December 2022 (restated – Note 3) | 1 January 2022 (restated – Note 3) | ||||||||||||
Assets | ||||||||||||||||
Cash and cash equivalents | 12 | 1,939 | 2,649 | 1,525 | ||||||||||||
Securities purchased under resale agreements | 700 | 650 | - | |||||||||||||
Income taxes receivable | - | 206 | 64 | |||||||||||||
Accrued interest receivable | 843 | 878 | 720 | |||||||||||||
Investment securities: | 13 | |||||||||||||||
Fair value through profit or loss | 69 | 133 | 289 | |||||||||||||
Fair value through other comprehensive income | 20,162 | 18,043 | 19,982 | |||||||||||||
Amortized cost | 3,229 | 3,578 | 2,817 | |||||||||||||
Derivatives | 16 | 161 | - | 31 | ||||||||||||
Due from the Government of Canada | 6 | 240 | - | 363 | ||||||||||||
Loans: | 14 | |||||||||||||||
Fair value through profit or loss | 512 | 469 | 500 | |||||||||||||
Amortized cost | 270,650 | 269,207 | 272,781 | |||||||||||||
Accounts receivable and other assets | 21 | 479 | 735 | 471 | ||||||||||||
Investment property | 22 | 398 | 402 | 314 | ||||||||||||
Defined benefit plan asset | 24 | 187 | 218 | - | ||||||||||||
| 299,569 | 297,168 | 299,857 | ||||||||||||||
Liabilities | ||||||||||||||||
Accounts payable and other liabilities | 23 | 573 | 707 | 606 | ||||||||||||
Income taxes payable | 545 | - | - | |||||||||||||
Accrued interest payable | 786 | 818 | 612 | |||||||||||||
Derivatives | 16 | 55 | 87 | 50 | ||||||||||||
Insurance contract liabilities | 7 | 7,079 | 6,405 | 6,132 | ||||||||||||
Due to the Government of Canada | 6 | - | 6 | - | ||||||||||||
Borrowings: | 15 | |||||||||||||||
Fair value through profit or loss | 219 | 374 | 475 | |||||||||||||
Amortized cost | 274,757 | 273,770 | 275,869 | |||||||||||||
Defined benefit plans liability | 24 | 180 | 166 | 250 | ||||||||||||
Unearned premiums and fees | 7, 8 | 2,776 | 2,604 | 2,321 | ||||||||||||
Deferred income tax liabilities | 25 | 36 | 270 | 268 | ||||||||||||
| 287,006 | 285,207 | 286,583 | ||||||||||||||
Commitments and contingent liabilities | 27 | |||||||||||||||
Equity of Canada | 10 | |||||||||||||||
Contributed capital | 25 | 25 | 25 | |||||||||||||
Accumulated other comprehensive income (loss) | (321) | (725) | 130 | |||||||||||||
Reserve fund | 72 | 17 | 29 | |||||||||||||
Retained earnings | 12,787 | 12,644 | 13,090 | |||||||||||||
| 12,563 | 11,961 | 13,274 | ||||||||||||||
| 299,569 | 297,168 | 299,857 | ||||||||||||||
The accompanying notes are an integral part of these consolidated financial statements.
 |  | |
| Derek Ballantyne | Michel Tremblay, CPA | |
| Chairperson | Acting President and Chief Executive Officer | |
| 2023 Annual Report | 57 |
Consolidated Statement of Income and Comprehensive Income
Year ended 31 December
(in millions of Canadian dollars) | Notes | 2023 | 2022 (restated – Note 3) | |||||||||
Interest income | 17 | 7,077 | 5,395 | |||||||||
Interest expense | 17 | (6,961) | (5,375) | |||||||||
Net interest income | 116 | 20 | ||||||||||
Insurance revenue | 7 | 1,004 | 867 | |||||||||
Insurance service income (expense) | 7 | (119) | 106 | |||||||||
Insurance service result | 885 | 973 | ||||||||||
Investment income | 17 | 553 | 388 | |||||||||
Net gains (losses) on financial instruments | 17 | (212) | 43 | |||||||||
Insurance finance expense for contracts issued | 7 | (178) | (114) | |||||||||
Net financial result | 163 | 317 | ||||||||||
Government funding | 6 | 5,494 | 3,408 | |||||||||
Housing programs expenses | 6 | (5,114) | (3,061) | |||||||||
Premiums and fees earned | 7, 8 | 860 | 779 | |||||||||
Operating expenses | 28 | (641) | (606) | |||||||||
Other income (expenses) | (13) | 90 | ||||||||||
Self-insurance service income | 8 | 6 | ||||||||||
Income before income taxes | 1,758 | 1,926 | ||||||||||
Income taxes | 25 | (448) | (486) | |||||||||
Net income | 1,310 | 1,440 | ||||||||||
Other comprehensive income (loss), net of tax | ||||||||||||
Items that will be subsequently reclassified to net income (loss) | ||||||||||||
Net unrealized gains (losses) from debt instruments held at fair value through other comprehensive income | 357 | (1,019) | ||||||||||
Reclassification of losses (gains) on debt instruments held at fair value through other comprehensive income on disposal in the year | 122 | (12) | ||||||||||
Insurance finance income (expense) for contracts issued | 7, 25 | (75) | 176 | |||||||||
| 404 | (855) | |||||||||||
Items that will not be subsequently reclassified to net income | ||||||||||||
Remeasurement gains (losses) on defined benefit plans | 24, 25 | (32) | 282 | |||||||||
Total other comprehensive income (loss), net of tax | 372 | (573) | ||||||||||
Comprehensive income | 1,682 | 867 | ||||||||||
The accompanying notes are an integral part of these consolidated financial statements.
| 2023 Annual Report | 58 |
Consolidated Statement of Equity of Canada
Year ended 31 December
(in millions of Canadian dollars) | Notes | 2023 | 2022 (restated – Note 3) | |||||||||
Contributed capital | 25 | 25 | ||||||||||
Accumulated other comprehensive income (loss) | ||||||||||||
Fair value reserve balance at beginning of year | (900) | 131 | ||||||||||
Other comprehensive income (loss) – fair value | 479 | (1,031) | ||||||||||
Fair value reserve balance at end of the year | (421) | (900) | ||||||||||
Opening insurance finance reserve | 175 | - | ||||||||||
Impact of adopting IFRS 17 | 3 | - | (1) | |||||||||
Restated opening insurance finance reserve | 175 | (1) | ||||||||||
Other comprehensive income (loss) – insurance finance reserve | (75) | 176 | ||||||||||
Insurance finance reserve balance at end of year | 100 | 175 | ||||||||||
Balance at end of year | (321) | (725) | ||||||||||
Reserve fund | ||||||||||||
Balance at the beginning of year | 17 | 29 | ||||||||||
Net income (loss) | 55 | (12) | ||||||||||
Balance at end of year | 10 | 72 | 17 | |||||||||
Retained earnings | ||||||||||||
Opening retained earnings | 12,644 | 13,025 | ||||||||||
Impact of adopting IFRS 17 | 3 | - | 65 | |||||||||
Restated opening retained earnings | 12,644 | 13,090 | ||||||||||
Net income | 1,255 | 1,452 | ||||||||||
Other comprehensive income (loss) | (32) | 282 | ||||||||||
Dividends | 10 | (1,080) | (2,180) | |||||||||
Total retained earnings | 12,787 | 12,644 | ||||||||||
Equity of Canada | 10 | 12,563 | 11,961 | |||||||||
The accompanying notes are an integral part of these consolidated financial statements.
| 2023 Annual Report | 59 |
Consolidated Statement of Cash Flows
Year ended 31 December
(in millions of Canadian dollars) | Notes | 2023 | 2022 (restated – Note 3) | |||||||||
Cash flows from (used in) operating activities | ||||||||||||
Net income | 1,310 | 1,440 | ||||||||||
Adjustments to determine net cash flows from operating activities | ||||||||||||
Amortization of premiums and discounts on financial instruments | (8) | 81 | ||||||||||
Net (gains) losses on financial instruments | 394 | (114) | ||||||||||
Capitalized interest | 14 | (83) | (47) | |||||||||
Deferred income taxes | (241) | (32) | ||||||||||
Depreciation, amortization and impairment of fixed and intangible assets | 39 | 29 | ||||||||||
Net unrealized gains on investment property | 22 | (13) | (88) | |||||||||
Changes in operating assets and liabilities | ||||||||||||
Derivatives | (193) | 68 | ||||||||||
Accrued interest receivable | 35 | (158) | ||||||||||
Due from (to) the Government of Canada | (230) | 369 | ||||||||||
Accounts receivable and other assets | 228 | (221) | ||||||||||
Accounts payable and other liabilities | (135) | 106 | ||||||||||
Income taxes payable/receivable | 633 | 123 | ||||||||||
Accrued interest payable | (32) | 206 | ||||||||||
Insurance contract liabilities | 581 | 508 | ||||||||||
Defined benefit plans | 7 | 35 | ||||||||||
Unearned premiums and fees | 172 | 283 | ||||||||||
Other | (6) | (2) | ||||||||||
Loans | 14 | |||||||||||
Repayments | 47,320 | 46,344 | ||||||||||
Disbursements | (48,739) | (42,641) | ||||||||||
Borrowings | 15 | |||||||||||
Repayments | (58,227) | (55,553) | ||||||||||
Issuances | 59,035 | 53,875 | ||||||||||
| 1,847 | 4,611 | |||||||||||
Cash flows from (used in) investing activities | ||||||||||||
Investment securities | ||||||||||||
Sales and maturities | 8,442 | 9,368 | ||||||||||
Purchases | (9,741) | (9,694) | ||||||||||
Foreign currency forward contract maturities | ||||||||||||
Receipts | 302 | 310 | ||||||||||
Disbursements | (413) | (564) | ||||||||||
Investment property | 22 | |||||||||||
Additions | - | - | ||||||||||
Disposals | 17 | - | ||||||||||
Securities purchased under resale agreements | (50) | (650) | ||||||||||
Property and equipment and intangible asset acquisitions | (34) | (77) | ||||||||||
| (1,477) | (1,307) | |||||||||||
Cash flows used in financing activities | ||||||||||||
Dividends paid | 10 | (1,080) | (2,180) | |||||||||
Change in cash and cash equivalents | (710) | 1,124 | ||||||||||
Cash and cash equivalents | ||||||||||||
Beginning of year | 2,649 | 1,525 | ||||||||||
End of year | 1,939 | 2,649 | ||||||||||
Represented by | ||||||||||||
Cash | 106 | 227 | ||||||||||
Cash equivalents | 1,833 | 2,422 | ||||||||||
| 1,939 | 2,649 | |||||||||||
Supplementary disclosure of cash flows from operating activities | ||||||||||||
Amount of interest received during the year | 8,040 | 6,259 | ||||||||||
Amount of interest paid during the year | 7,503 | 5,785 | ||||||||||
Amount of dividends received during the year | 2 | 5 | ||||||||||
Amount of income taxes paid during the year | 58 | 391 | ||||||||||
The accompanying notes are an integral part of these consolidated financial statements.
| 2023 Annual Report | 60 |
Notes to Consolidated Financial Statements
Year ended 31 December 2023
1. Corporate Information
Canada Mortgage and Housing Corporation (CMHC, we, or us) was established in Canada as a Crown corporation in 1946 by the Canada Mortgage and Housing Corporation Act (CMHC Act) to carry out the provisions of the National Housing Act (NHA). We are also subject to Part X of the Financial Administration Act (FAA) by virtue of being listed in Part 1 of Schedule III, wholly owned by the Government of Canada (Government), and an agent Crown corporation. Our National Office is located at 700 Montreal Road, Ottawa, Ontario, Canada, K1A 0P7.
Our mandate, as set out in the NHA, is to promote the construction of new houses, the repair and modernization of existing houses, and the improvement of housing and living conditions. In relation to financing for housing, the NHA’s purpose is to promote housing affordability and choice; to facilitate access to, and competition and efficiency in the provision of, housing finance; to protect the availability of adequate funding for housing; and generally to contribute to the well-being of the housing sector. In addition, we have the following objectives in carrying out any activities related to mortgage insurance and guarantee programs and in administering the Canadian covered bond legal framework: (a) to promote the efficient functioning and competitiveness of the housing finance market; (b) to promote and contribute to the stability of the financial system, including the housing market; and (c) to have due regard to our exposure to loss. We deliver on our mandate through our reportable segments: Assisted Housing (AH), Mortgage Insurance (MI) and Mortgage Funding (MF).
Within the Public Accounts of Canada, our annual consolidated net income reduces the Government’s annual deficit; our consolidated retained earnings and accumulated other comprehensive income (AOCI) reduce the Government’s accumulated deficit.
As a Crown corporation, we have been issued the following directives pursuant to Section 89 of the FAA for which we are compliant:
| • | P.C. 2008-1598, requiring due consideration to the personal integrity of those to whom we lend or provide benefits; |
| • | P.C. 2014-1380, to provide a 50:50 current service cost-sharing ratio between employees and employer for pension contributions for all members; and |
| • | P.C. 2015-1106, to align our travel, hospitality, conference and event expenditure policies, guidelines and practices with those of Treasury Board of Canada Secretariat (TBS) in a manner consistent with our legal obligations and to report on the implementation of this directive in our next corporate plan. |
2. Basis of Preparation and Material Accounting Policy Information
Basis of preparation
Our consolidated financial statements have been prepared in accordance with IFRS Accounting Standards as issued by the International Accounting Standards Board (IASB). We have applied the same accounting policies consistently to all periods presented.
Our consolidated financial statements were approved by the Board of Directors on 20 March 2024.
| 2023 Annual Report | 61 |
Accounting policy changes
Effective 1 January 2023 we adopted IFRS 17 Insurance contracts which replaces IFRS 4 Insurance contracts. As a result, many of our accounting policies related to our Mortgage Insurance Activity have been updated. We have restated the comparative information for 2022 applying the transitional provisions in Appendix C to IFRS 17. Refer to Note 3 for further information on our adoption of this accounting standard.
Measurement basis
Our consolidated financial statements have been prepared on a going concern basis using a historical cost basis except for the following items in the consolidated balance sheet:
| • | Financial assets at fair value through profit or loss (FVTPL) or fair value through other comprehensive income (FVOCI), as well as liabilities at FVTPL, are measured at fair value; |
| • | Investment property is measured at fair value; |
| • | Insurance contract liabilities are measured at current value; and |
| • | Defined benefit liabilities for post-employment benefit plans are recognized at the present value of the defined benefit obligations, net of the fair value of plan assets. |
Functional currency
Our consolidated financial statements are stated in millions of Canadian dollars, unless otherwise indicated, which is our functional currency.
Material accounting policy information
The following summarizes the material accounting policy information we use in the preparation of our consolidated financial statements.
Basis of consolidation
We consolidate our accounts with those of Canada Housing Trust (CHT), as we control its activities as described in Note 4.
Inter-segment balances and transactions have been eliminated.
Foreign currency translation
Monetary assets and liabilities denominated in foreign currencies are translated into Canadian dollars at exchange rates prevailing at the balance sheet date. Exchange gains and losses resulting from the translation of foreign denominated balances are included in net gains (losses) on financial instruments. Purchases and sales of foreign securities and the related income are translated into Canadian dollars at the exchange rates prevailing on the respective settlement dates of the transactions.
Government funding and housing programs expenses
Government funding
Government funding is recognized when there is reasonable assurance that it will be received, and all attached conditions will be complied with. This is generally achieved when the recipient meets specific program criteria which permits us to make the related claim to the Government.
Government funding earned, but not yet received, is included in due from the Government of Canada and Government funding received, but not yet earned, is included in due to the Government of Canada.
| 2023 Annual Report | 62 |
Housing programs expenses
Housing programs expenses are recorded on an accrual basis and those incurred, but not yet paid, are included in accounts payable and other liabilities.
Costs to deliver housing programs are included in operating expense.
Amounts advanced from us to proponents for which the relevant program expenses have not yet been incurred are recorded in Accounts Receivable and Other Assets.
Mortgage insurance
Insurance contract classification
We accept significant insurance risk in issuing our mortgage insurance contracts as the lender faces uncertainty with regards to potential borrower default on a mortgage and therefore pays a mortgage insurance premium to transfer the insurance risk to us. Our exposure to this risk, which consists of the outstanding mortgage balance less the estimated sales price of the insured property, forms the basis of our coverage units for purposes of recognizing the contractual service margin (CSM).
Self-insurance
For certain housing programs, we receive a premium related to an insurance contract in which we are the lender for a portion of the life of the insured loan. During the period we are the lender, we are self-insuring and therefore, there is no insurance contract as we are not exposed to significant insurance risk. The related premiums are due at the inception of the insurance contract and are deferred and included in unearned premiums and fees. The unearned premiums are recognized as revenue and recorded in premiums and fees earned over the period covered by the self-insurance contract using earning factors which reflect historical claim occurrence patterns.
We recognize a provision for incurred claims, in accounts payable and other liabilities, during the self-insurance period. The provision is an estimate of expected claims net of the related expected property sale proceeds, for defaults on insurance contracts that have occurred on or before the balance sheet date. This provision includes claims that have been incurred but not reported (IBNR), claims incurred but not enough reported (IBNER) and claims in process (CIP). The provision takes into consideration the time value of money and includes an explicit provision for adverse deviation. A change in the estimated provision for claims is recorded in self-insurance service expense in the period in which it occurs.
When we are no longer the lender, there is no longer self-insurance, as we accept significant insurance risk from the policyholder at this point. Therefore, the carrying amount in unearned premiums and fees for the self-insurance contract is de-recognized and accounted for as a premium transfer to the newly recognized insurance contract. If the amount of transferred premium is less than the fulfilment cash flows of the insurance contract, a loss is recognized immediately in insurance service expense for the period. If the difference results in a gain, the gain will form part of the CSM which will be earned over the remaining coverage period of the insurance contract.
Recognition
We recognize groups of insurance contracts from the earliest of the date of when the mortgage insurance premium is received or when the contract is reported as in-force by the lender as this represents the earliest point we have a substantive obligation to provide the lender with coverage for insurance risk.
| 2023 Annual Report | 63 |
Contract boundary
We measure our groups of insurance contracts based on all cash flows included within the boundary of our insurance contracts. The cash flows which are directly related to fulfilling our insurance contracts include premiums, fees, insurance acquisition cash flows, claims and other insurance service expenses, and estimated borrower judgment recoveries (BJR). Our contract boundary ends when the insured mortgage is terminated either through repayment of the outstanding mortgage, when a claim is paid or on certain mortgage modifications. We do not have the ability to re-price our mortgage insurance contracts once they have been written.
Level of aggregation
We aggregate our insurance contracts into portfolios based on similar risks and how we manage them. Our three main products lines, transactional homeowner insurance, portfolio insurance and multi-unit residential insurance, are exposed to the same risk, being borrower default. However, each of our products are managed separately with unique pricing and product designs to achieve business and policy objectives.
Our portfolios are further divided based on expected profitability at inception into three categories:
| • | contracts that, on initial recognition, have no significant possibility of becoming onerous subsequently; |
| • | contracts that are onerous on initial recognition; and |
| • | remaining contracts in the portfolio. |
Each insurance contract group is then further aggregated by quarterly cohort of issue which represents the level of which our recognition and measurement of our accounting policies are applied. For further details on the estimates used to aggregate our insurance contracts see Note 4.
Initial recognition
We use the general measurement model to measure the liability for remaining coverage (LRC) of a group of insurance contracts at initial recognition as the total of the estimated future fulfilment cash flows that are within the boundary of our insurance contracts and a CSM representing unearned profit to be recognized as service is provided under our insurance contracts.
The LRC represents our obligation for insured events at the balance sheet date that have not yet occurred, and comprise all remaining expected future cash inflows and cash outflows under our groups of insurance contracts, including any CSM.
The liability for incurred claims (LIC) represents our obligation for insured events that have occurred, including insured events that have been incurred but for which claims are in process, claims are IBNR, claims are IBNER and expected BJR that are due. At initial recognition, the LIC is expected to be nil, as significant insured events have not occurred.
Fulfilment cash flows
The estimate of fulfilment cash flows is an unbiased probability-weighted estimate adjusted to reflect the time value of money and a risk adjustment for non-financial risk. We will consider all reasonable and supportable information available at the reporting date without undue cost or effort.
The fulfilment cash flows of our insurance contracts include:
Premiums
Mortgage insurance premiums are due at the inception of the mortgage insurance contract and result in a CSM if the premiums are greater than the fulfilment cash flows or an onerous contract (loss at inception) if less than the fulfilment cash flows. Any premium refunds paid in the period reduce the CSM or increase the loss on onerous contracts.
| 2023 Annual Report | 64 |
Fees
Application fees recover part or all acquisition costs associated with issuing mortgage insurance contracts related to multi-unit residential loans and are treated similar to the mortgage insurance premiums at initial recognition.
Insurance acquisition cash flows
Insurance acquisition cash flows consist of:
| • | Policy issuance costs, such as internal salary and personnel costs that are directly attributable to the underwriting of insurance contracts; |
| • | Fees paid to the Government of Canada to compensate for mortgage insurance risks. Fees are payable at a rate of 3.25% of premiums written during the period for all insurance contracts and an additional 0.1% on new portfolio insurance contracts written in the period; and |
| • | an allocation of fixed and variable overheads that relate to salaries and benefits for different internal departments that are directly attributable to the underwriting of our insurance contracts. |
Insurance acquisition cash flows reduce the CSM or increase the loss at inception of the insurance contract liabilities. They are subsequently amortized over the expected coverage period of our insurance contracts using the same coverage units used to recognize the CSM with equal offsetting amounts to insurance revenue and insurance service expense in the period.
We do not recognize a separate asset for any acquisition cash flows as all significant insurance acquisition cash flows are incurred in the same period that the insurance contracts are issued and realized.
Claims and other insurance service expenses
Our claims and other insurance service expenses consist of:
| • | expected mortgage insurance claims where the insured loan balance, accrued interest and other settlement costs exceed the expected sale price of the insured property; |
| • | claims handling or servicing costs; and |
| • | an allocation of fixed and variable overheads that are directly attributable to fulfilling our insurance contracts. |
The expected claims and other insurance service expenses is included in the fulfilment cash flows of the LRC on initial recognition of a group of insurance contracts and it reduces the CSM or increases the loss on an onerous group of insurance contracts.
Estimated borrower judgment recoveries
We estimate the BJR related to claims paid using historical data and assumptions related to past BJR received. Estimated BJR are included in the fulfilment cash flows of the LRC on initial recognition of a group of insurance contracts and will increase the CSM or reduce the loss on an onerous group of insurance contracts.
Subsequent measurement
We measure the CSM at the end of the period as the unearned profit relating to a group of insurance contracts that has not been recognized as it relates to the future services to be provided.
For a group of insurance contracts, the carrying amount of the CSM at the end of the reporting period equals the carrying amount at the beginning of the period adjusted for:
| • | the effects of new contracts issued in the period; |
| • | interest accreted on the carrying amount of the CSM during the period, measured at the discount rates at initial recognition; |
| 2023 Annual Report | 65 |
| • | changes in fulfilment cash flows that relate to future service to the extent that they do not: |
| – | create a loss component; |
| – | or those changes are allocated to existing loss components; and |
| • | the amount recognized as insurance revenue reflecting the coverage provided on our insurance contracts in the period, determined by the allocation of the CSM remaining at the end of the reporting period over the current and future coverage units. |
The changes in fulfilment cash flows relating to future service that adjust the CSM comprise:
| • | changes in estimates of the present value of future cash flows in the LRC, except those relating to the time value of money; and |
| • | changes in the risk adjustment for non-financial risk that relate to future service. |
Adjustments to the CSM, noted previously including the accretion of interest are measured at the locked-in discount rates determined at initial recognition of the groups of insurance contracts.
At each reporting period, we decrease the fulfilment cash flows of the LRC for expected claims in the period and increase our LIC for our estimate of incurred claims, increasing both our insurance revenue and insurance service expense. The related release of the LRC and the recorded LIC will not match as there are differences between expected claims from the prior reporting period as compared to our estimate for actual incurred claims in the period and due to a lower risk adjustment in our LIC as the risk of uncertainty of the amount and timing of cash flows are lower.
We measure the carrying amount of a group of insurance contracts at the end of each reporting period as the sum of:
| • | the LRC excluding loss components comprising fulfilment cash flows related to future service allocated to the group at that date and the CSM of the group at that date; |
| • | the LRC related to the loss components; and |
| • | the LIC that comprises the fulfilment cash flows related to current and past service allocated to the group insurance contracts at that date. |
Changes in the LIC that relate to current or past services is recorded in insurance service expense in the period. For further details on how we determine the LIC see Note 4.
Insurance revenue
The amount of insurance revenue recognized in the period reflects the insurance coverage provided on our insurance contracts in the period.
The insurance revenue to be recognized in the period for a group of insurance contracts is comprised of:
| • | expected incurred claims and other insurance service expenses, excluding any amounts allocated to the loss component of the LRC; |
| • | the change in the risk adjustment for non-financial risk, excluding any amounts allocated to the loss component of the LRC; |
| • | the CSM to be recognized for the coverage provided; and |
| • | the recovery of insurance acquisition cash flows. |
| 2023 Annual Report | 66 |
Onerous contracts and loss components
If there is an onerous group of insurance contracts on initial recognition, a loss is immediately recognized in insurance service expense resulting in no CSM for the group and the carrying amount of the insurance contract liability equal to the fulfilment cash flows. A loss component for the LRC is recognized representing the excess of the fulfilment cash flows above the cash inflows.
The loss component is released based on a systematic allocation of the subsequent changes in the fulfilment cash flows to:
| • | the loss component; and |
| • | the LRC, excluding the loss component. |
Subsequent changes in fulfilment cash flows that relate to current service represent the release of expected incurred claims and the release of the risk adjustment for non-financial risk. The loss component is also updated for subsequent changes in the fulfilment cash flows that relate to future service. Changes in fulfilment cash flows that relate to future service can increase, decrease or cause the amount of loss component to be nil, resulting in the emergence of a CSM.
The systematic allocation of subsequent changes to the loss component results in the total amounts allocated to the loss component being equal to zero by the end of the coverage period of groups of insurance contracts. We have defined the systematic allocation as the relative percentage of the beginning of period loss component to the total LRC at the initial discount rate.
Risk adjustment for non-financial risk
We disaggregate the financial and non-financial portion of the risk adjustment for non-financial risk between insurance revenue and insurance finance expense for our groups of insurance contracts. For further details on the estimates and assumptions used to calculate the risk adjustment for non-financial risk see Note 4.
Insurance finance expenses – discount rates
Insurance finance expenses reflect the change in the carrying amount of our groups of insurance contracts arising from the effect of the time value of money and changes in the time value of money.
We disaggregate insurance finance expenses on our insurance contract liabilities between income and other comprehensive income. The impact of changes in discount rates on the value of our insurance contract liabilities are reflected in insurance finance expense, in other comprehensive income, to minimize accounting mismatches between the accounting for financial assets and insurance contract liabilities. The financial assets backing our insurance contract liabilities are primarily measured at fair value through other comprehensive income.
We systematically allocate the total insurance finance expense over the duration of the group of insurance contracts into income using discount rates determined on initial recognition of the group of insurance contracts. For further details on the estimates and assumptions used to determine discount rates see Note 4.
De-recognition and modification of insurance contracts
Insurance contracts are de-recognized when the rights and obligations relating to the insurance contract are extinguished or if the terms are modified in a way that significantly change the measurement of the insurance contract had the new terms always existed. When the de-recognition criteria are met, the initial contract is de-recognized and a new contract based on the modified terms is recognized. If the modification does not result in de-recognition, then the modification is treated as a change in estimates of fulfilment cash flows.
| 2023 Annual Report | 67 |
Timely payment guarantees (TPG)
Classification
Financial guarantee contracts are defined as contracts that require the issuer to make specified payments to reimburse the holder for a loss it incurs because a specified debtor fails to make payment when due. We classify the TPG for National Housing Act Mortgage-Backed Securities (NHA MBS) and Canada Mortgage Bonds (CMB) as financial guarantee contracts. Such contracts remain financial guarantee contracts until all rights and obligations are extinguished or expire.
Recognition and measurement
TPG and application fees are initially recognized in unearned premiums and fees at fair value (the premium received). Subsequently, they are measured at the higher of i) the amount initially recognized less the amortization of guarantee and application fee revenue; and ii) the amount of the allowance for expected credit losses (ECL). The fees are recognized into premiums and fees earned on a straight-line basis over the expected life (typically the contractual life) of the related NHA MBS or CMB. All fees are received within five business days after the invoice date.
Government of Canada guarantee fees for risk exposure
We pay guarantee fees to the Department of Finance to compensate for its exposure to the risks arising from the guarantee. These fees are deferred in accounts receivable and other assets and recognized in operating expenses on a straight-line basis over the period covered by the guarantee. These fees are payable at a rate of 0.075% of CMB issuances.
Financial instruments
Classification and measurement of debt instruments
The classification and measurement of debt instruments are based on the business model for managing the assets and whether contractual cash flows are solely payments of principal and interest (SPPI).
Business model assessment
The business model reflects how we manage assets to generate cash flows, that is, whether the objective is solely to collect contractual cash flows, or to collect both contractual cash flows and cash flows arising from the sale of assets.
We assess our business models at a level that reflects how our financial instruments are managed to achieve our business objectives. This assessment begins at the operating segment level, and where applicable, by sub-portfolios of instruments that are managed together within a particular activity to achieve common business objectives. We perform our business model assessment based on the following main criteria:
| • | Strategic objectives of the business model and how these objectives are carried out in practice; |
| • | How performance of the business model is evaluated and reported to key management personnel; |
| • | The risks that affect the performance of the business model and how we manage those risks. Key risks include market, credit, and liquidity risks as described in detail in Notes 18, 19 and 20 respectively; |
| • | How managers of the business model are compensated; |
| • | The frequency, value and timing of historical sales activity and expectations for future sales activities. |
| 2023 Annual Report | 68 |
SPPI Assessment
We assess whether the cash flows of our debt instruments meet the SPPI criteria based on the asset’s contractual terms. For this assessment, we define principal, as the fair value of the asset upon initial recognition and interest, as consideration for the time value of money, the credit risk of the transaction and for other lending risks and costs as well as a profit margin.
Contractual terms that introduce exposure to risk or volatility to the contractual cash flows that are inconsistent with a basic lending agreement do not satisfy the SPPI requirement.
Classification and measurement of financial instruments
We use settlement date accounting for purchases and sales of financial assets and financial liabilities, and we recognize realized gains and losses on sales on a weighted average cost basis. The following table presents a description of our financial instruments along with their classification under IFRS 9 and the criteria for classifying them as such:
Classification | Financial Instruments (Activity)1 | Description | Criteria and accounting treatment | |||
Financial assets at amortized cost | Cash and cash equivalents (AH, MI, MF)
Securities purchased under resale agreements (Reverse Repurchase Agreements) (AH, MI)
Accrued interest receivable (AH, MI, MF)
Investment securities (AH)
Loans – CMB Program and Insured Mortgage Purchase Program (IMPP) (MF)
Loans – Lending Programs (AH)
Loans (MI) | Highly liquid investments with a term to maturity of 98 days or less from the date of acquisition that are readily convertible to known amounts of cash and which are subject to an insignificant risk of change in value.
Purchase of securities, typically Government treasury bills or bonds, with the commitment to resell the securities to the original seller at a specified price and future date in the near term.
Interest earned on financial assets, but not yet collected.
Corporate, Federal, Provincial and Sovereign debt instruments.
Amounts due from Canadian financial institutions as a result of the sale of their beneficial interest in NHA MBS to CHT (for the CMB Program) or CMHC (for the IMPP).
Loans not economically hedged within our AH Activity.
Mortgages or loans (workouts) that benefit from the MI-supported default management activities that enable borrowers to work through their financial difficulties.
| We classify financial assets at amortized cost if we hold them with the objective to collect contractual cash flows and are SPPI.
Initially measured at fair value plus transaction costs and subsequently measured at amortized cost using the effective interest rate method (EIRM), net of an allowance for ECL.
Interest income is recognized using the EIRM in interest income in AH and MF (CMB and IMPP loans), and investment income in MI and MF (cash).
ECL are recognized in net gains (losses) on financial instruments in AH and MI.
Gains and losses arising on derecognition are recognized directly in net gains (losses) on financial instruments, together with foreign exchange gains and losses.
For certain lending program loans originated from 1946 to 1984 through provisions of the NHA, interest rate losses from the loans having lower interest rates than the related borrowings are reimbursed through government funding. In assessing the fair value of these loans at initial recognition, the continued receipt of the government funding in the future is assumed. | |||
1 Denotes in which Activity we hold the instruments: Assisted Housing, Mortgage Insurance, or Mortgage Funding.
| 2023 Annual Report | 69 |
Classification | Financial Instruments (Activity)1 | Description | Criteria and accounting treatment | |||
Debt instruments at FVOCI | Cash equivalents (MI, MF)
Investment Securities – debt instruments (MI, MF) | Highly liquid investments with a term to maturity of 98 days or less from the date of acquisition that are readily convertible to known amounts of cash and which are subject to an insignificant risk of change in value.
Corporate, Federal, Provincial and Sovereign debt instruments. | We classify financial assets at FVOCI if we hold them with the objective to collect contractual cash flows or to sell the assets and are SPPI.
Initially recognized at fair value plus transaction costs and subsequently measured at fair value. Unrealized gains and losses arising from changes in fair value are recorded in other comprehensive income (OCI) until the financial asset is derecognized at which point, cumulative gains or losses previously recognized in OCI are reclassified from AOCI to net gains (losses) on financial instruments. Unrealized foreign exchange gains (losses) are recognized in net gains (losses) on financial instruments.
Interest income is recognized using the EIRM in investment income.
The cumulative ECL allowance on financial assets held at FVOCI is recorded in OCI and does not reduce the carrying amount of the financial asset. The change in the ECL allowance is recognized in net gains (losses) on financial instruments.
| |||
Financial assets at FVTPL | Cash equivalents, loans, investment securities designated at FVTPL (AH)
Derivatives – Interest rate swaps (AH), Foreign Exchange (FX) contracts (MI) and First-Time Home Buyer Incentive (FTHBI) loan derivative (AH)
Investment Securities – Limited partnership units (MI)
Investment Securities – debt instruments (MI)
Loans – (AH, MI) | For certain portfolios of loans and associated borrowings originated prior to August 2016, the AH Activity uses derivatives to manage refinancing and reinvestment risks, as well as mismatches between the timing of receipts from assets and payments of liabilities. These assets form part of the lending economic hedging structure and are designated at FVTPL.
Interest rate swaps are used in our lending economic hedging structure. Foreign exchange contracts are used to mitigate foreign exchange risks on U.S. dollar-denominated debt instruments. The FTHBI loan derivative is used to recognize the payable to, or receivable from, the Government of Canada when there are underlying loan gains or losses.
Canadian real estate investment trust equity investments. all mandatorily classified at FVTPL.
Subordinated debt securities and certain asset-backed securities whose contractual cash flows do not give rise to cash flows that are SPPI.
Loans including those with interest adjustment clauses, those for which we only expect to recover the value of the underlying collateral, and those that are economically hedged.
| We classify financial assets at FVTPL if they do not meet the criteria for classification as financial assets at amortized cost, or financial assets at FVOCI.
Includes derivatives or instruments that have been irrevocably designated upon initial recognition as at FVTPL to eliminate or significantly reduce an accounting mismatch that would otherwise arise from not classifying them in this category.
Initially recognized and subsequently measured at fair value. Unrealized gains and losses arising from changes in fair value and gains and losses realized on disposition are recorded in net gains (losses) on financial instruments. Transaction costs are recognized in net gains (losses) on financial instruments as incurred.
Interest income and dividend income are recognized in investment income.
ECL are not recognized on financial instruments measured at FVTPL. | |||
1 Denotes in which Activity we hold the instruments: Assisted Housing, Mortgage Insurance, or Mortgage Funding.
| 2023 Annual Report | 70 |
Classification | Financial Instruments (Activity)1 | Description | Criteria and accounting treatment | |||
Financial liabilities at FVTPL | Borrowings from the Government of Canada – Lending programs (AH) | Borrowings that are economically hedged as part of our lending hedging structure.
We may irrevocably designate a financial liability as at FVTPL upon initial recognition if doing so eliminates or reduces significantly an accounting mismatch, or its performance is evaluated on a fair value basis in accordance with risk management policies. | Unrealized gains and losses arising from changes in fair value are recognized in net gains (losses) on financial instruments except for changes in fair value attributable to our own credit risk for financial liabilities designated at FVTPL. These changes are recognized in OCI unless doing so would create an accounting mismatch, in which case, the entire fair value change is presented in net gains (losses) on financial instruments. | |||
Financial liabilities at amortized cost | Accrued interest payable (AH, MF)
Borrowings – CMB (MF)
Borrowings from the Government of Canada – Lending Programs (AH)
Borrowings from the Government of Canada – IMPP (MF)
Securities sold under repurchase agreements (MI) | Interest expense incurred on borrowings and other financial obligations, but not yet paid.
Interest-bearing bullet bonds issued by CHT that we guarantee. See after this table for further details about CMB.
Borrowings incurred to fund loans in the AH Activity that are not part of the lending hedging structure.
Amortizing borrowings incurred to fund loans under the IMPP.
Sale of securities with the commitment to repurchase the securities from the original buyer at a specified price and future date in the near term. Proceeds received from these agreements may be used for liquidity purposes or invested in Reverse Repurchase Agreements or cash equivalents for the purpose of generating additional income. | Financial liabilities are classified at amortized cost, unless they have been classified at FVTPL.
Initially recognized at fair value plus transaction costs and subsequently measured at amortized cost using the EIRM, with interest expense recorded in interest expense in AH and MF and investment income in MI. | |||
1 Denotes in which Activity we hold the instruments: Assisted Housing, Mortgage Insurance, or Mortgage Funding.
Initial measurement of financial instruments
When a financial instrument’s fair value at initial recognition differs from its transaction price, we recognize the resulting gain or loss as follows:
When the instrument’s fair value is determined using significant observable inputs, we immediately recognize the gain or loss in net gains (losses) on financial instruments and subsequently amortize it into interest income, for loans, or interest expense, for borrowings, using the EIRM. This is the case for all funds we borrow from the Government for Lending programs under the Crown Borrowing Program (CBP), as well as certain Lending program loans. See Note 17 for information on the amounts of these gains or losses.
When the instrument’s fair value is determined using significant unobservable inputs, we defer and amortize the gain or loss into net gains (losses) on financial instruments and interest income using the EIRM. This is the case for certain Lending program loans. See Note 17 for information on the amounts of these deferred gains or losses which are recorded within Loans.
| 2023 Annual Report | 71 |
Measurement of expected credit losses
Expected credit losses are defined as the difference between all contractual cash flows due in accordance with the contract, and the cash flows that we expect to receive (cash shortfalls), discounted at the original effective interest rate (or credit-adjusted effective interest rate for purchased or originated credit-impaired assets). ECL are the weighted average of expected credit losses determined by evaluating a range of possible outcomes using reasonable, supportable information about past events and current and forecasted future economic conditions.
We have an impairment model to determine the allowance for ECL on our debt securities classified as amortized cost or FVOCI and our financial guarantee contracts. We determine an allowance for ECL at initial recognition of the financial instrument (or the date we become party to a financial guarantee) that is updated at each balance sheet date throughout the life of the instrument.
The ECL allowance is based on the ECL over the life of the financial instrument (lifetime ECL), unless there has been no significant increase in credit risk (SICR) since initial recognition, in which case the ECL allowance is measured at an amount equal to the portion of lifetime ECL that result from default events possible within the next 12 months (12-month ECL). ECL are determined based on three main drivers: probability of default, loss given default and exposure at default.
| • | Probability of default (PD): A point-in-time estimate of the likelihood of default either over the next 12 months (12-month ECL) or over the remaining life of the instrument (lifetime ECL). Our PDs are determined by mapping internal credit ratings to point-in-time PD tables based on statistical models derived from a large data set of publicly traded entities. |
| • | Loss given default (LGD): The percentage of the gross carrying amount of the instrument that will be lost on default at a given point in time. It is determined by taking the difference between contractual cash flows due and those expected to be received, including the realization of collateral, and comparing this value to the gross carrying amount. |
| • | Exposure at default (EAD): The gross carrying amount of the instrument at a given point in time, which is calculated as the present value of the outstanding contractual cash flows using the EIRM. |
The ECL is calculated using a scenario-based approach where, for each scenario, the PD, LGD and EAD are projected for each individual exposure at each cash flow date over the next 12 months (12-month ECL) or remaining life of the instrument (lifetime ECL). The components are multiplied together at each future date and discounted back using the original effective interest rate to the reporting date and summed. A probability-weighted average ECL is then determined across the multiple scenarios. We model all ECL at the individual instrument level.
Significant increase in credit risk
We have established a policy to perform an assessment at each balance sheet date of whether the instrument’s credit risk has increased significantly since initial recognition (or the date we become party to a financial guarantee). Based on this assessment, we group the instruments into the following categories:
| • | Stage 1: Instruments that have not experienced a SICR since initial recognition. ECL are recognized based on 12-month ECL and interest revenue is calculated on the gross carrying amount of the asset; |
| • | Stage 2: Instruments that have experienced a SICR since initial recognition, but are not considered credit impaired. In subsequent periods, if the credit risk of an instrument has improved such that there is no longer a SICR since initial recognition, the ECL allowance will revert to stage 1. ECL are recognized based on lifetime ECL and interest revenue is calculated on the gross carrying amount of the asset; |
| • | Stage 3: Instruments that are considered credit-impaired as one or more events that have a detrimental impact on estimated future cash flows have occurred. ECL are recognized based on lifetime ECL; |
| • | Purchased or originated credit-impaired (POCI) – instruments that are credit impaired on initial recognition. ECL are recognized based on lifetime ECL. |
| 2023 Annual Report | 72 |
Interest revenue on stage 3 or POCI financial instruments is calculated based on the net carrying amount of the asset, which is the gross carrying amount, net of the loss allowance.
For instruments that we assess as having low credit risk at the reporting date, we applied the low credit risk exemption (stage 1) and have presumed that credit risk has not increased significantly since initial recognition. We use internal credit ratings based on internal assessments of counterparty creditworthiness at the reporting date to assess whether the instrument has low credit risk. For externally-managed investment portfolios, a credit rating for each instrument is based on ratings available from credit rating agencies. We consider an instrument to have low credit risk when our internal rating is BBB- or higher.
We apply a backstop to all financial instruments for which the counterparty is more than 30 days past due on its contractual payments, whereby we consider the instrument to have experienced a SICR.
We consider an instrument in default, which is fully aligned with the definition of credit-impaired, when it meets the following criteria:
| • | Observable data exists that has a detrimental impact on the estimated future cash flows such as: |
| – | significant financial difficulty of the issuer; |
| – | the granting of a new loan to assist the borrower to work through financial difficulties; |
| – | it becomes probable that the issuer will enter bankruptcy or other financial reorganization, and |
| – | the disappearance of an active market due to financial difficulties. |
| • | Borrower becomes 90 days past due on its contractual payments. |
An instrument is no longer considered impaired when all past due amounts, including interest, have been recovered and it is determined that the principal and interest are fully collectable in accordance with the original contractual terms of the instrument. We write off instruments, either partially or in full, against the related ECL allowance when we judge that there is no realistic prospect of future recovery.
In addition to the 30-day backstop discussed previously, we apply the following policies in determining whether there has been a SICR on our financial instruments subject to ECL:
Debt instruments at amortized cost / FVOCI
Our credit risk policies restrict the amount of investments in debt instruments that have an internal rating lower than BBB-. All other instruments are presumed to have low credit risk and we have applied the low credit risk exemption (stage 1) on those instruments.
Loans under the CMB program and the IMPP
Loans under the CMB program and under the IMPP represent amounts due from Canadian financial institutions as a result of the sale of their beneficial interest in NHA MBS securities to us. The loans are collateralized by the NHA MBS, as well as associated reinvestment securities in the case of the CMB program only, acquired in the transactions. The NHA MBS, reinvestment assets and swaps represent the sole source of repayment on the loans, and thus directly affect the probability of a default occurring. Therefore, our assessment of SICR is based on the credit risk of these supporting assets.
The supporting assets are limited to NHA MBS and reinvestment assets rated R-1 (high) or AAA and swap counterparties with a minimum rating of BBB+ (under the CMB program) or A- (under the IMPP). As such, all loans under the CMB program and the IMPP are presumed to have low credit risk and we have applied the low credit risk exemption (stage 1). We also do not recognize a separate ECL for these loans because the credit risk arising from loans under the CMB program and the IMPP is already reflected in the credit risk of the NHA MBS and CMB TPGs as discussed under the Financial guarantees section.
| 2023 Annual Report | 73 |
Assisted Housing Activity loans / Mortgage Insurance Activity loans
Loans with an internal rating of BBB- or higher are presumed to have low credit risk and the low credit risk exemption has been applied (stage 1). These loans consist of those issued to municipalities under the Municipal Infrastructure Lending Program (MILP), loans indemnified by provinces and territories through provisions under Social Housing Agreements (SHA) where the credit rating of the province or territory is considered in the SICR assessment and loans guaranteed by the Government of Canada under the Canada Greener Homes Loans (CGHL) program where the credit rating of the Government of Canada is considered in the SICR assessment. For loans indemnified by provinces and territories, this credit enhancement is relevant to assessing changes in credit risk since it directly impacts the PD. The province or territory is responsible for collecting loan payments from the borrower and, in turn, makes all payments to us directly in accordance with the contractual terms of the loan on behalf of the borrower. These payments are made to us, irrespective of the borrower’s payment status. For loans guaranteed by the Government of Canada, this credit enhancement is relevant to assessing changes in credit risk as the Government of Canada has explicitly guaranteed all losses on these loans. Any credit loss arising from a deficiency in collecting an amount due from the borrower would be covered by the Government of Canada as they bear all responsibility for a loan loss under this guarantee.
All remaining loans issued under our Assisted Housing or Mortgage Insurance activities have not been internally rated and therefore the low credit risk presumption is not used. Our SICR assessment of these loans is primarily based on days past due, as this is a historically reliable indicator of loan credit quality and performance status. Following are the staging criteria:
| • | Stage 1: All current loans to 30 days past due. |
| • | Stage 2: Loans between 30 and 90 days past due. |
| • | Stage 3: Loans more than 90 days past due. Also, a loan that is not past due but has been issued a workout loan to assist with financial difficulties is considered credit impaired irrespective of days past due. |
If exceptional loan payment deferrals are granted, the circumstances under which they are granted are assessed to determine if their impact on days past due should result in a transfer between stages. When deferrals are the result of circumstances outside a borrower’s control, the deferral will not be treated as additional days past due and should not, in itself, result in a stage transfer.
Under the terms of certain construction loans issued by our Assisted Housing Activity or workout loans issued by our Mortgage Insurance Activity, there may be a period of time where the loan has been advanced but is not under repayment and therefore days past due cannot be used in the SICR assessment. For these loans that are not under repayment, we assess SICR by applying the following criteria:
| • | Days past due on loans issued by the same borrower; |
| • | Collective assessment by reviewing past due status of borrowers with shared credit risk characteristics; |
| • | Qualitative assessment of specific indicators of the construction project such as: project delays, performance against budget and remaining costs to complete. |
Financial guarantees
Under the NHA MBS program, a financial institution (the “NHA MBS issuer”) creates a pool of eligible mortgages and sells the pool to investors. The underlying pool of mortgages is designed to provide sufficient cash flows to fund the NHA MBS. The issuer is obligated to fund any cash flow shortfalls that may arise, thus exposing us to credit risk with the underlying pool of mortgages serving as a credit enhancement. Our assessment of SICR is therefore based on both the credit risk of the issuer and the credit risk of the pool of mortgages underlying the NHA MBS. The pool of mortgages is considered low credit risk since only mortgages that we or approved private mortgage insurers insure are eligible to be pooled in NHA MBS.
| 2023 Annual Report | 74 |
Under the CMB program, the credit risk exposures are, by design, the CMB loans that are the sole source of funds to fulfill CHT’s CMB obligations. As previously discussed, the NHA MBS, reinvestment assets and swaps represent the sole source of repayment on the loans. The SICR assessment for the CMB guarantee is based on the credit risk of these supporting assets, all of which have been assessed as low credit risk.
We have assessed the TPG under both the NHA MBS and CMB programs as having low credit risk and we therefore apply the low credit risk exemption (stage 1).
Forward-looking macroeconomic variables
We have incorporated forward-looking economic information into our ECL by performing the calculation under multiple scenarios resulting in a probability-weighted average ECL based on the weightings of each scenario. We have used three sets of economic forecasts for all instruments representing a baseline, upside and downside scenario.
We performed an economic variable selection process to identify the sets of macroeconomic variables that had the highest correlation with our portfolios. This process resulted in using different sets of economic variables depending on the geographic and industry sector of the exposure. The following variables are included: unemployment rates, oil prices, 10-year corporate bond spreads, and equity index values.
All macroeconomic variables are projected over a five-year period, with ECL subsequently reverting to long-run averages. We base our forecasts and scenario weightings on forecasted macroeconomic inputs published by third parties that are reviewed and approved by our Chief Economist.
Financial liabilities at amortized cost
Canada Mortgage Bonds
CMB are interest-bearing bullet bonds issued by CHT that we guarantee. Coupon payments are made semi-annually for fixed rate CMB and quarterly for floating rate CMB. Principal repayments on the bonds are made at maturity. The approved MBS Sellers reimburse CHT for the cost of arranging financing, including the fees paid to underwriters and others for the distribution of CMB. Transaction costs directly attributable to the issuance of CMB, net of reimbursements thereof, are included in the amount initially recognized and amortized to interest expense using the EIRM.
We may purchase and resell CMB in the market for investment purposes. Purchases are treated as retirements of debt with the difference between the purchase price and the carrying value of the CMB being recognized as a gain or loss in net gains (losses) on financial instruments. Subsequent sales are treated as re-issuance of the debt with gains and losses deferred and amortized over the remaining life of the CMB sold. When we hold a CMB to maturity or acquire CMB in the primary market, the related cash flows are excluded from the consolidated statement of cash flows as they are not considered external cash flows to the consolidated entity.
CMB program and IMPP
Loans under the CMB program and under the IMPP represent amounts due from Canadian financial institutions as a result of the sale of their beneficial interest in NHA MBS securities to us. These loans are funded by the issuance of CMB (CMB program) or borrowings from the Government of Canada (IMPP). There are both fixed and floating rate loans in this category. Under the CMB program, principal is due at maturity, and under the IMPP, principal is due monthly (amortizing).
Under these arrangements, substantially all the risks and rewards of the NHA MBS are retained by the issuers through swap agreements with us and CHT. Consequently, the NHA MBS, and the reinvestment of principal proceeds under the CMB program, serve as collateral to the loans and are not recognized in the consolidated balance sheet. This collateral is, however, held in our name and represents the sole source of principal repayments for the loans. The amount due from the swap counterparties represents the interest earned on the loans and is recognized in interest income.
| 2023 Annual Report | 75 |
Cloud computing arrangements
We enter into cloud computing arrangements for certain information technology solutions. Under these arrangements, we incur costs for the right to access a supplier’s application software, as well as for software configuration, customization, and implementation. When we control the design, configuration and customization in a cloud computing arrangement, we recognize an intangible asset for these related costs, including the costs of integration with other software and testing.
Provided that the cloud computing arrangements meet the definition and recognition criteria of intangible assets, we capitalize costs for design, configuration, customization, integration with other software, and testing, and we present these amounts in accounts receivable and other assets. However, general access and hosting are not capitalized and we present these costs in operating expenses.
After initial recognition, we value intangible assets at cost less accumulated amortization and any impairment losses. We amortize these assets on a straight-line basis over their useful lives, which range from five to ten years, and we include amortization expense in operating expenses.
Investment property
Investment properties are properties held to earn rental income or for capital appreciation, or both. Investment properties are initially recognized at cost plus transaction costs and subsequent to initial recognition, they are measured at fair value. Gains or losses arising from changes in fair value are recognized in other income in the period in which they arise.
Pension and other post-employment benefits
We have a number of benefit arrangements which provide pension and other post-employment benefits to eligible employees. These include a federally regulated pension plan (Pension Plan), an unregistered supplemental pension plan (Supplemental Plan) and other non-pension post-employment defined benefits consisting mainly of life and medical insurance. The Supplemental Plan offers benefits in excess of statutory limits as defined under the Income Tax Act (ITA).
The Pension Plan is subject to the federal Pension Benefits Standards Act, 1985 (PBSA) and its regulations and to the ITA. The Pension Plan is registered with the Office of the Superintendent of Financial Institutions (OSFI) and the Canada Revenue Agency (CRA).
Defined benefit plans
The defined benefit plans include the Pension Plan and the Supplemental Plan as well as the other post-employment benefits (OPEB). The benefits available under both the Pension Plan and the Supplemental Plan are based on length of service and average annual salary.
The net defined benefit liability recognized is the present value of the obligations under the defined benefit plans less the fair value of the assets of those plans. The defined benefit plan assets are limited to the present value of any economic benefits available in the form of reductions in future contributions to these plans.
Net benefit costs of the plans include the current service costs and the interest cost on the defined benefit obligation net of the interest income on the plan assets and the gain or loss on curtailment. Net benefit costs are included in operating expenses.
Remeasurement gains and losses on defined benefit plans include actuarial gains and losses and changes in the return on plan assets (excluding net interest). They are recognized in OCI as incurred and then flow into retained earnings and are not reclassified to profit or loss in subsequent periods.
| 2023 Annual Report | 76 |
Income taxes
We are a prescribed federal Crown corporation under Reg. 7100 of the ITA and are subject to federal income tax as a prescribed corporation for purposes of subsection 27(2) of the ITA. We are not subject to provincial income tax. CHT is subject to federal and provincial income taxes on the amount of taxable income for the period and is permitted a deduction for all amounts paid or payable to CHT’s beneficiaries in determining income for tax purposes. As all taxable income was distributed to the beneficiaries, no provision for income taxes has been reflected for CHT.
We use the liability method of accounting for income taxes. Under this method, deferred income tax assets and liabilities are recognized based on the estimated tax effect of temporary differences between the carrying value of assets and liabilities on the financial statements and their respective tax bases. We use substantively enacted income tax rates at the balance sheet date that are expected to be in effect when the asset is realized or the liability is settled. The carrying amount of deferred income tax assets is reviewed at each balance sheet date and reduced to the extent that it is no longer probable that sufficient taxable profit will be available to allow all or part of the deferred income tax asset to be utilized.
Related party transactions
Except for funds borrowed from the Government for Lending programs under the CBP, related party transactions are made on terms equivalent to those that prevail in arm’s length transactions. Funds borrowed under the CBP, which we include in borrowings at amortized cost and borrowings designated at FVTPL, are at below market rates. In turn, this allows us to issue loans at favorable rates, which reduces the Government’s cost to subsidize social housing. Borrowings at below market rates generate gains, which we recognize in net gains (losses) on financial instruments at the borrowing date, as discussed previously under Initial measurement of financial instruments.
3. Current and Future Accounting Changes
Current accounting changes
We adopted IFRS 17 Insurance contracts, which replaces IFRS 4 Insurance contracts on 1 January 2023. IFRS 17 sets out the requirements for recognizing and measuring our insurance contract liabilities.
IFRS 17 establishes specific principles for the recognition and measurement of our insurance contracts, these specific principles include:
| • | identifiying those insurance contracts that we accept significant insurance risk from the mortgage insurance policyholder by agreeing to compensate the policyholder if an uncertain future event, the insured event, were to occur and this event had a negative impact on the policyholder; |
| • | aggregating our insurance contracts into groups that we will recognize and measure on a quarterly basis; |
| • | recognizing and measuring groups of our insurance contracts as: |
| – | a probability-weighted present value of the fulfilment cash flows within the contract boundary of our insurance contracts; and |
| – | an amount representing the unearned profit or CSM; |
| • | recognizing insurance revenues from our groups of insurance contracts over the period that we provide insurance coverage and we are released from insurance risk; and |
| • | when a group of our insurance contracts are expected to be onerous over the coverage period, we recognize a loss immediately. |
| 2023 Annual Report | 77 |
The financial statement line items description on the consolidated balance sheet have changed when compared to last year. We no longer present a provision for claims financial statement line item and we now present an insurance contract liabilities financial statement line item.
The financial statement line item descriptions on the consolidated statement of income and other comprehensive income have changed compared to last year. We no longer present an insurance claims financial statement line item and we now present a self-insurance service expense financial statement line item. IFRS 17 also requires that we present the following financial statement line items:
| • | Insurance revenue |
| • | Insurance service expense |
| • | Insurance service result |
| • | Insurance finance expense for insurance contracts issued |
IFRS 17 also sets out specific transition requirements when adopting the standard for the first time these are discussed below.
Transition
On the transition date 1 January 2022 we have:
| • | recognized and measured each group of insurance contracts as if the standard had always applied unless impracticable, whereby we applied the fair value approach described below; |
| • | derecognized any existing balances that would not have existed under IFRS 17; these balances include: |
| – | deferred acquisition costs previously recorded in accounts receivable and other assets; |
| – | deferred Government of Canada fees previously recorded in accounts receivable and other assets; |
| – | estimated borrower judgment recoveries previously recorded in accounts receivable and other assets; |
| – | premiums receivable previously recorded in accounts receivable and other assets; |
| – | Government of Canada fees payable previously recorded in accounts payable and other liabilities; |
| – | unearned premiums and fees related to our Mortgage Insurance Activity; and |
| – | provision for claims. |
| • | recognized the resulting net difference in retained earnings, refer to the Consolidated Statement of Equity of Canada. |
Full retrospective approach
We are required to apply the standard using the full retrospective approach, unless impracticable. We have determined that we can apply the standard retrospectively from 1 January 2021 without the use of hindsight. Prior to 1 January 2021, we would be using hindsight in determining key actuarial assumptions and in creating the actuarial model to be used to project loan level fulfilment cash flows. The build and testing of the actuarial assumptions and model were completed in late 2020. As a result, we determined that we were unable to recreate what the assumptions and relevant models prior to 1 January 2021 without the use of hindsight. This prevented us from applying the standard retrospectively prior to 1 January 2021. For those insurance contracts that exist prior to 1 January 2021, we have elected to apply the fair value approach to recognize these insurance contracts.
| 2023 Annual Report | 78 |
Fair value approach
We have applied the fair value approach to determine the CSM of the LRC for those insurance contracts that exist prior to 1 January 2021. The CSM is determined as the difference between the fair value of the insurance contracts and the fulfilment cash flows measured at the transition date.
Under the fair value approach, we have aggregated all the insurance contracts issued prior to 1 January 2021 into a single other group as we did not have reasonable and supportable information to aggregate these insurance contracts into groups of contracts only issued within one year at the date of transition.
In determining fair value, we have applied the requirements of IFRS 13 Fair Value Measurement and used the income approach to estimate the fair value of the insurance contracts that existed prior to 1 January 2021 on 1 January 2022. This fair value measurement is a non-recurring fair value measurement. The insurance contract liability is subsequently measured in accordance with the requirements of IFRS 17.
The significant inputs to the fair value calculation are:
| • | the fulfilment cash flows for insurance contracts in force; |
| • | a risk adjustment for non-financial risk; |
| • | a risk free discount rate for the measurement of the fulfilment cash flows and the accretion of the CSM at a locked-in rate; |
| • | a risk free rate of return for the financial assets included in the fair value measurement; |
| • | a coverage unit curve for recognition of CSM; |
| • | capital required and its projection over the life of the fulfilment cash flows; and |
| • | a target required return on capital from a market participants view. |
Refer to Note 4 for further details on the most significant assumptions used in the fair value calculation.
We have elected to disaggregate insurance finance expenses between amounts included in net income and amounts included in other comprehensive income and to reset the cumulative amount of insurance finance expense recognized in other comprehensive income at the transition date to zero.
Re-designation of financial assets
We have decided not to reassess any elections made to measure our financial assets under IFRS 9 Financial Instruments which was previously adopted on 1 January 2018.
The following table summarizes the impacts of adopting IFRS 17 on our opening balance sheet as at 1 January 2022.
Financial statement line item (in millions $) | IFRS 4 31 December 2021 | Adjustments | IFRS 17 1 January 2022 | |||||||||
Accounts receivable and other assets | 1,035 | (500) | 535 | |||||||||
Accounts payable and other liabilities | 650 | (44) | 606 | |||||||||
Provision for claims | 310 | (310) | - | |||||||||
Insurance contract liabilities | - | 6,132 | 6,132 | |||||||||
Unearned premiums | 8,684 | (6,363) | 2,321 | |||||||||
Deferred income tax liabilities | 247 | 21 | 268 | |||||||||
Equity of Canada | 13,210 | 64 | 13,274 | |||||||||
| 2023 Annual Report | 79 |
The following table summarizes the nature of the IFRS 17 opening balance sheet adjustments as at 1 January 2022.
Adjustment | Description | |
Measurement of insurance contract liability under IFRS 17 | We have recognized and measured each group of insurance contracts as if the standard had always applied and where impracticable we have applied the fair value approach. This has resulted in an increase in our insurance contract liabilities of $6,132 million and a corresponding decrease in retained earnings of $4,615 million (net of deferred taxes of $1,539 million).
| |
Derecognition of existing balances that would not exist under IFRS 17 | The following balances were derecognized:
• Deferred acquisition costs, deferred Government of Canada fees, estimated borrower judgment recoveries, and premiums receivable, all of which, were previously recorded in accounts receivable and other assets of $500 million;
• Government of Canada fees payable previously recorded in accounts payable and other liabilities of $61 million;
• Unearned premiums and fees related to our Mortgage Insurance Activity of $6,363 million; and
• Provision for claims of $310 million.
The net of the above has resulted in an increase in retained earnings of $4,679 million (net of deferred taxes of $1,560 million) and an increase in accounts payable and other liabilities of $17 million related to unearned premiums for social housing and indexed-linked mortgages.
| |
Future accounting changes
There have been no new standards and interpretations issued by the IASB that we have assessed as having a possible impact on the Corporation in the future. We will continue to monitor new standards and interpretations as they are issued by the IASB.
| 4. | Critical Judgments in Applying Accounting Policies and Making Estimates |
Judgments in applying accounting policies
We have made the following judgments, which have the most significant effect on the amounts recognized in our consolidated financial statements.
Consolidation
We apply significant judgment in assessing whether the substance of our relationship with CHT indicates that we control CHT. We guarantee the timely payment of principal and interest on the CMB, and choose when to provide that guarantee. CHT cannot undertake new business (e.g. issue new bonds) without the benefit of a guarantee, and we are currently its only available guarantor. Within that context, we have direct influence over the activities of CHT and can use this influence to manage our exposure to CHT.
Derecognition
In assessing whether transfers of NHA MBS from Issuers to CHT under the CMB program, and to us under the IMPP, qualify for derecognition, significant judgment is applied in determining whether substantially all the risks and rewards of ownership of the NHA MBS have been transferred. We have determined that the sellers of NHA MBS to CHT or to us fail to meet the derecognition criteria as they retain the risk and rewards of the NHA MBS through swap agreements. As a result, we do not recognize the underlying NHA MBS in the consolidated balance sheet but rather account for the transfers as loans.
| 2023 Annual Report | 80 |
Use of estimates
In preparing our consolidated financial statements, we are required to make estimates that affect the reported amount of revenues, expenses, assets and liabilities, and the accompanying disclosures. The key assumptions concerning the future and other key sources of estimation uncertainty at the reporting date that have a significant risk of causing a material adjustment to the carrying amounts of assets and liabilities within the next financial year are discussed in the following sections. We based our estimates on information available when the consolidated financial statements were prepared. Existing circumstances and assumptions about future developments, however, may change due to market changes or circumstances arising that are beyond our control. Such changes are reflected in the estimate when they occur.
Insurance contract liabilities
The insurance contract liability at 31 December is determined using deterministic cashflow models that consider a range of possible economic conditions. The following assumptions are used when calculating the cash flows within the boundary of our insurance contract liabilities:
Claim frequency
Arrears rate and claim rate
Arrears rate, determined by loans that are more than 90 days past due for our homeowner and portfolio insurance products and 30 days past due for multi-unit insurance products, are a key determinant of future claims. A claim occurs when a borrower has defaulted on the loan and the lender has completed the foreclosure. The arrears and claim rate assumptions are based on our own experience and expectations.
An increase (decrease) in expected arrears or claim rates will increase (decrease) the expected claim cost which will reduce (increase) future profits.
Termination rate
A termination occurs when an insurance contract is no longer in-force and there is no reported claim. Termination rate assumptions are based on historical experience and are adjusted, when appropriate, to reflect revised expectations.
An increase (decrease) in expected termination rates will reduce (increase) the expected claim frequency which will increase (decrease) future profits.
Cure rate
A loan is cured from arrears when the borrower pays all the past due amounts. Cure rate assumptions are based on historical experience and are adjusted, when appropriate, to reflect revised expectations.
An increase (decrease) in expected cure rates will reduce (increase) the expected claim frequency which will increase (decrease) future profits.
Claim severity
Loss given default
LGD represents the estimated net cash outflow when a default occurs and is based on historical experience and adjusted, when appropriate, to reflect revised expectations.
An increase (decrease) in loss given default will increase (decrease) the fulfilment cash flow which will reduce (increase) future expected profits.
| 2023 Annual Report | 81 |
Economic conditions (unemployment rate and housing repeat-sales price index)
The economic conditions are non-financial assumptions used to project future claim levels. Changes in these assumptions, which impact both claim frequency and claim severity, could increase or decrease the fulfilment cash flow which will impact future profits. An increase in unemployment rate (UR) and a decrease in the housing repeat-sales price index (RPI) will increase claims. Refer to Note 7 for more details on these assumptions.
Determining the LRC and LIC involves the risk that the actual results will deviate, and in certain cases significantly, from the estimates made.
The LIC reflects claims that have been IBNR, CIP, IBNER and reduced by BJR. The estimate for IBNR is based on loans that are reported in arrears and an estimate of loans that are not yet reported in arrears (pure IBNR) at the valuation date and the probability of those loans going to claim without subsequently becoming cured. The CIP are estimated by multiplying the insured loan amounts by the claim severity. The estimate for IBNER is estimated from the payment pattern of the supplementary amounts on open claims. The estimate for BJR is determined based on historical information on BJR received related to claims paid.
The fulfilment cash flows included in the LRC relate to future claims are derived from simulations that project the lifecycle of mortgages. This includes considerations such as mortgage renewals, prepayments, and variable rate versus fixed rate mortgages. These are subject to a greater degree of uncertainty than the LIC.
Risk adjustment
The risk adjustment for non-financial risk represents the compensation required for bearing the uncertainty of the amount and timing of the cash flows of groups of insurance contracts and covers insurance risk, lapse risk and expense risk. The risk adjustment reflects an amount we would pay to remove the uncertainty that the future cash outflows will exceed our best estimate of our insurance contract liabilities. We have estimated our risk adjustment for non-financial risk using a cost of capital approach for the LRC and the quantile approach for the LIC. The cost of capital approach requires us to estimate the fulfilment cash flows, and the required capital at each future date following regulatory capital requirements. A cost of capital rate is applied to the additional capital requirement in future reporting periods. The cost of capital represents the return required to compensate for exposure to the non-financial risk and is set at 6% per annum. The quantile approach requires us to estimate a distribution of the fulfillment cash flows and select a confidence level that reflects our risk appetite.
We target an overall confidence level for both the LRC and LIC to be within the range of 85%-90%. As at 31 December 2023, the risk adjustment for our insurance contracts corresponds to a 90% confidence level for both the LRC and LIC.
Discount rate
Fulfilment cashflows are determined by discounting the expected future cash flows using a bottom-up approach, starting with a risk-free curve and applying an illiquidity premium. The risk-free curve is determined by reference to the Government of Canada yield curve. The illiquidity premium is determined by reference to observable market rates of A-rated and BBB-rated investment grade bonds, plus a constant illiquidity premium factor of 0.5%.
The weighted average discount rates applied for discounting of future cash flows as at 31 December are listed below:
Portfolio duration | ||||||||||||||||||||||||||||||||||||||||||||||||
| 1-5 years | 5-10 years | 10-15 years | 15-20 years | 20-25 years | over 25 years | |||||||||||||||||||||||||||||||||||||||||||
| 2023 | 2022 | 2023 | 2022 | 2023 | 2022 | 2023 | 2022 | 2023 | 2022 | 2023 | 2022 | |||||||||||||||||||||||||||||||||||||
Discount rates | 4.9% | 5.3% | 4.8% | 5.1% | 4.8% | 5.3% | 4.9% | 5.4% | 4.9% | 5.4% | 4.9% | 5.0% | ||||||||||||||||||||||||||||||||||||
| 2023 Annual Report | 82 |
Coverage units
The CSM is a component of the insurance contract liabilities and represents the unearned profit to be recognized as insurance coverage is provided.
An amount of the CSM by group of insurance contracts is recognized as insurance revenue each quarter reflecting the services provided during the period.
The amount of CSM recognized is determined by:
| • | identifying the coverage units applicable to groups of insurance contracts; |
| • | allocating the CSM at the end of the period equally to each coverage unit provided in the current period and expected to be provided in future periods; and |
| • | recognizing, in insurance revenue, the amount allocated to coverage units provided in the period. |
The number of coverage units in a group is the total coverage expected to be provided by the insurance contracts in the group, determined by considering the quantity of the benefits provided and the expected duration of the coverage. The quantity of benefits expected to be provided to the policyholder at the end of each period, is the outstanding mortgage balance, including accrued interest and customary settlement costs, less the estimated sales price of the insured property securing the mortgage. This is calculated based on a historical average LGD (claim severity), given a loan is in arrears. The total coverage units of each group of insurance contracts are reassessed at the end of each reporting period to reflect changes of expected LGD. The coverage units are then allocated based on probability-weighted average duration of each coverage unit provided in the current period and expected to be provided in the future.
Level of aggregation – grouping criteria
Once insurance contracts are aggregated into portfolios based on mortgage insurance products, expected profitability is used to further disaggregate the insurance contracts into those contracts that are onerous, those that have no significant chance of becoming onerous subsequently and a remaining other group of contracts within the portfolio.
To assess expected profitability, the following characteristics are used:
| • | pricing levels (loan-to-value band) |
| • | product type (affordable, market, purchase, refinance, new construction) |
| • | credit score band |
| • | region or province |
| • | property type (standard, student, retirement, supportive, single room) |
Fair value measurement of insurance contract liabilities
In applying the fair value approach to determine the transition amount of the insurance contract liabilities on adoption of IFRS 17, we have used an income approach. The following were the main assumptions used in determining the fair value:
Target required return on capital
To determine what a market participant would expect to receive when acquiring our insurance contract liabilities, we have set a target required return on capital, by product, of what we believe the market participant would expect to be compensated for bearing the insurance risk from our insurance contracts and for the capital they will be required to hold to back the insurance contract liabilities.
A 200 basis points increase (decrease) in the target required return on capital would increase (decrease) the fair value of our transition insurance contract liabilities by approximately $596 million.
| 2023 Annual Report | 83 |
Capital required
In determining the target required return on capital, we have assessed the required capital that a market participant would expect to hold if they were to take on our insurance contract liabilities. To inform this assessment, we referred to OSFI’s supervisory target of 150% of the Mortgage Insurer Capital Adequacy Test (MICAT).
A 500 basis points increase (decrease) in the capital required would increase (decrease) the fair value of our transition insurance contract liabilities by approximately $91 million.
Mortgage Insurer Capital Adequacy Test
Insurance-in-force (IIF) is a key input in determining our MICAT ratio and is subject to estimation. Due to availability of data, IIF used in the MICAT is the higher of 1) a projection reflecting an estimate of new business, terminations and claims from our most recent previous quarter-end; and 2) our actual IIF as reported by lenders for the previous quarter-end. Changes in underwriting requirements, regulatory environment and market trends can add volatility to our estimate.
Lenders have been reporting temporarily extended amortizations on variable rate mortgages (VRMs) that do not have payments that automatically adjust with interest rates. Due to increasing interest rates, OSFI released a revised MICAT calculation which specifies that a maximum amortization period of 40 years should be used in determining capital required. Our required capital calculation uses the maximum amortization period of 40 years for most VRM loans. Despite a shrinking number of VRM loans, there are now more VRM loans at the maximum amortization period. We estimate that the MICAT would be 13% points higher if these loans were not negatively amortizing.
Valuation of pension benefit obligation
The current service cost of the defined benefit pension plan and the present value of the pension obligation are determined based on actuarial valuations. The actuarial valuation involves making various assumptions that may differ from actual developments in the future. These include the determination of the discount rate, mortality rates and inflation. Due to the complexities involved in the valuation and its long-term nature, a defined benefit obligation is highly sensitive to changes in these assumptions. All assumptions are reviewed at least annually.
The assumption most sensitive to change is the discount rate. In determining the appropriate discount rate, we consider the interest rates of Canadian dollar corporate bonds with an ‘AA’ rating and extrapolated as needed along the yield curve to correspond with the expected term of the defined benefit obligation. The mortality rate is based on publicly available Public Sector mortality tables for Canada as we have determined they are representative of our workforce.
In 2023, inflation remained higher than the Bank of Canada’s target range increasing uncertainty around our long-term inflation assumption for our defined benefit plans. Our inflation estimate reflects a short-term overlay of 2.6% in 2024 and then reverts back to the long-term inflation target of 2% from 2025 onwards.
In assessing the recoverability of the defined benefit plan assets, we have applied assumptions to determine the maximum future economic benefit available from a reduction in future contributions. This is determined by the difference between the present value of employer current service costs and the present value of the projected employer minimum funding requirements (MFR). In determining the MFR we have applied assumptions around discount rates (6.3% on a going concern basis and 3.85% on a solvency basis per year) and projected future asset returns (6.55% per year).
See Note 24 for more information on assumptions and sensitivity.
| 2023 Annual Report | 84 |
| 5. | Segmented Information |
Our operating segments include Assisted Housing, Mortgage Insurance, Mortgage Funding and CHT. As described in Note 1, we have determined our reportable segments to be Assisted Housing, Mortgage Insurance and Mortgage Funding.
Our Chief Operating Decision Maker (CODM) is our President and Chief Executive Officer. Our CODM monitors the operating results of the activities separately for the purpose of making decisions about resource allocation and performance assessment. Segment performance is evaluated based on financial and non-financial metrics that are tied to the objectives of each operating segment and may differ by operating segment.
Assisted Housing includes Housing and Lending programs which share many similarities and satisfy the same objective of supporting access to affordable housing for Canadians in need. Our CODM allocates resources and assesses performance of the Housing and Lending programs as one. Housing programs are administered either directly by us or by provinces and territories under SHA and the Federal/Provincial/Territorial Housing Partnership Framework. We lend to non-profit and private sectors, First Nation, Métis and Inuit organizations and communities, provinces and municipalities in the delivery of affordable and community housing programs. Assisted Housing earns interest income on loans and investments, and receives government funding to operate its housing programs.
Mortgage Insurance provides mortgage insurance for transactional homeowner, portfolio and multi-unit residential loans in all parts of Canada. We operate these programs on a commercial basis with due regard for loss without the need for funding from the Government. Mortgage Insurance revenues are earned from premiums, fees and investment income.
Mortgage Funding provides TPGs of interest and principal of securities issued on the basis of eligible housing loans and on CMB. We provide these guarantees on a commercial basis. Mortgage Funding also includes interests in NHA MBS as a result of acquisitions under the IMPP in 2020.
CHT’s functions include the acquisition of interests in eligible housing loans such as NHA MBS, the issuance of CMB, as well as the purchase of highly rated investments and certain related financial hedging activities.
For the purposes of our segmented reporting, we aggregate Mortgage Funding and CHT (a separate entity) in the Mortgage Funding reportable segment. Accordingly, Mortgage Funding earns revenues from guarantee and application fees, and investment income.
Corporate overheads and assets are allocated to each operating segment and are included in the amounts presented.
We define a major lender to be one from which we receive premiums, guarantee fees, and application fees amounting to 10% or more of our total premiums and fees received. In 2023, we had no major lenders from which we received more than 10% of our total premiums and fees received (2022 – $287 million or 11% from one major lender). We report these amounts in our Mortgage Insurance and Mortgage Funding Activities; see Note 2 for information on our revenue recognition policies.
For all segments, revenues are attributed to, and assets are located in, Canada.
Aggregation of the Mortgage Funding and CHT
Mortgage Funding and CHT both support our objective of ensuring adequate supply of funds for mortgage lending through mortgage securitization. Through the CMB program in its entirety (including the guarantee by Mortgage Funding) and the IMPP, we contribute to the stability of the financial system by allowing lenders to access funds for residential mortgage lending.
| 2023 Annual Report | 85 |
Both segments’ business is generated by market demand for our TPG for mortgage funding through NHA MBS and through CMB issued by CHT.
There are many similarities in the nature of the issuance processes, customers and methods of distribution. CMB are available to both institutional investors and retail investors and can be bought through investment dealers, banks, trust companies, and other types of financial institutions. The guarantee takes effect at issuance.
| Assisted Housing Activity | Mortgage Insurance Activity | Mortgage Funding Activity | Eliminations | Total | ||||||||||||||||||||||||||||||||||||
(in millions) | 2023 | 2022 | 2023 | 2022 (restated) | 2023 | 2022 | 2023 | 2022 | 2023 | 2022 (restated) | ||||||||||||||||||||||||||||||
Interest income | 570 | 369 | - | - | 6,514 | 5,033 | (7) | (7) | 7,077 | 5,395 | ||||||||||||||||||||||||||||||
Interest expense | (481) | (382) | - | - | (6,505) | (5,024) | 25 | 31 | (6,961) | (5,375) | ||||||||||||||||||||||||||||||
Net interest income (loss) | 89 | (13) | - | - | 9 | 9 | 18 | 24 | 116 | 20 | ||||||||||||||||||||||||||||||
Insurance revenue | - | - | 1,004 | 867 | - | - | - | - | 1,004 | 867 | ||||||||||||||||||||||||||||||
Insurance service income (expense) | - | - | (119) | 106 | - | - | - | - | (119) | 106 | ||||||||||||||||||||||||||||||
Insurance service result | - | - | 885 | 973 | - | - | - | - | 885 | 973 | ||||||||||||||||||||||||||||||
Investment income (losses) | - | - | 473 | 346 | 90 | 49 | (10) | (7) | 553 | 388 | ||||||||||||||||||||||||||||||
Net gains (losses) on financial instruments | (82) | 129 | (126) | (79) | (8) | (13) | 4 | 6 | (212) | 43 | ||||||||||||||||||||||||||||||
Insurance finance expense for contracts issued | - | - | (178) | (114) | - | - | - | - | (178) | (114) | ||||||||||||||||||||||||||||||
Net financial result | (82) | 129 | 169 | 153 | 82 | 36 | (6) | (1) | 163 | 317 | ||||||||||||||||||||||||||||||
Government funding | 5,494 | 3,408 | - | - | - | - | - | - | 5,494 | 3,408 | ||||||||||||||||||||||||||||||
Housing programs expenses | (5,114) | (3,061) | - | - | - | - | - | - | (5,114) | (3,061) | ||||||||||||||||||||||||||||||
Premiums and fees earned | - | - | 33 | 23 | 827 | 756 | - | - | 860 | 779 | ||||||||||||||||||||||||||||||
Operating expenses | (405) | (361) | (172) | (177) | (64) | (68) | - | - | (641) | (606) | ||||||||||||||||||||||||||||||
Other income (loss) | (2) | 88 | (17) | (6) | 6 | 8 | - | - | (13) | 90 | ||||||||||||||||||||||||||||||
Self- insurance service income | - | - | 8 | 6 | - | - | - | - | 8 | 6 | ||||||||||||||||||||||||||||||
Income before income taxes | (20) | 190 | 906 | 972 | 860 | 741 | 12 | 23 | 1,758 | 1,926 | ||||||||||||||||||||||||||||||
Income taxes | - | (50) | (230) | (245) | (215) | (185) | (3) | (6) | (448) | (486) | ||||||||||||||||||||||||||||||
Net income | (20) | 140 | 676 | 727 | 645 | 556 | 9 | 17 | 1,310 | 1,440 | ||||||||||||||||||||||||||||||
Other comprehensive income (loss) | (12) | 137 | 334 | (573) | 61 | (160) | (11) | 23 | 372 | (573) | ||||||||||||||||||||||||||||||
Comprehensive income (loss) | (32) | 277 | 1,010 | 154 | 706 | 396 | (2) | 40 | 1,682 | 867 | ||||||||||||||||||||||||||||||
Total revenues and government funding1 | 5,499 | 3,612 | 1,070 | 1,143 | 924 | 809 | 12 | 23 | 7,505 | 5,587 | ||||||||||||||||||||||||||||||
Less Inter- segment income (loss)2 | 7 | 3 | 6 | 5 | (25) | (31) | 12 | 23 | - | - | ||||||||||||||||||||||||||||||
External revenues and government funding | 5,492 | 3,609 | 1,064 | 1,138 | 949 | 840 | - | - | 7,505 | 5,587 | ||||||||||||||||||||||||||||||
| 1 | Includes net interest income (loss), insurance service result, net financial result, government funding, premiums and fees earned and other income. |
| 2 | Inter- segment income (loss) relates to the following: |
• Assisted Housing recognizes interest income from investing in holdings of CMB;
• Mortgage Insurance recognizes investment income from investing in holdings of CMB; and
• Within Mortgage Funding, CHT recognizes interest expense on CMB held by Assisted Housing and Mortgage Insurance.
| 2023 Annual Report | 86 |
As at 31 December
| Assisted Housing Activity | Mortgage Insurance Activity | Mortgage Funding Activity | Eliminations1 | Total | ||||||||||||||||||||||||||||||||||||
(in millions) | 2023 | 2022 | 2023 | 2022 (restated) | 2023 | 2022 | 2023 | 2022 | 2023 | 2022 (restated) | ||||||||||||||||||||||||||||||
Assets | ||||||||||||||||||||||||||||||||||||||||
Cash and cash equivalents | 1,169 | 2,070 | 767 | 576 | 3 | 3 | - | - | 1,939 | 2,649 | ||||||||||||||||||||||||||||||
Securities purchased under resale agreements | 700 | 650 | - | - | - | - | - | - | 700 | 650 | ||||||||||||||||||||||||||||||
Income taxes receivable | - | 6 | - | 218 | - | (18) | - | - | - | 206 | ||||||||||||||||||||||||||||||
Accrued interest receivable | 79 | 88 | 98 | 88 | 667 | 704 | (1) | (2) | 843 | 878 | ||||||||||||||||||||||||||||||
Investment securities: | ||||||||||||||||||||||||||||||||||||||||
Fair value through profit or loss | - | 33 | 69 | 100 | - | - | - | - | 69 | 133 | ||||||||||||||||||||||||||||||
Fair value through other comprehensive income | - | - | 16,808 | 15,074 | 3,855 | 3,442 | (501) | (473) | 20,162 | 18,043 | ||||||||||||||||||||||||||||||
Amortized cost | 3,456 | 4,095 | - | - | - | - | (227) | (517) | 3,229 | 3,578 | ||||||||||||||||||||||||||||||
Derivatives | - | - | 161 | - | - | - | - | - | 161 | - | ||||||||||||||||||||||||||||||
Due from the Government of Canada | 240 | - | - | - | - | - | - | - | 240 | - | ||||||||||||||||||||||||||||||
Loans: | ||||||||||||||||||||||||||||||||||||||||
Fair value through profit or loss | 494 | 455 | 18 | 14 | - | - | - | - | 512 | 469 | ||||||||||||||||||||||||||||||
Amortized cost | 12,616 | 9,807 | 38 | 48 | 257,996 | 259,352 | - | - | 270,650 | 269,207 | ||||||||||||||||||||||||||||||
Accounts receivable and other assets | 176 | (55) | 190 | 528 | 113 | 262 | - | - | 479 | 735 | ||||||||||||||||||||||||||||||
Investment property | 398 | 402 | - | - | - | - | - | - | 398 | 402 | ||||||||||||||||||||||||||||||
Defined benefit plan asset | 79 | 91 | 102 | 120 | 6 | 7 | - | - | 187 | 218 | ||||||||||||||||||||||||||||||
| 19,407 | 17,642 | 18,251 | 16,766 | 262,640 | 263,752 | (729) | (992) | 299,569 | 297,168 | |||||||||||||||||||||||||||||||
Liabilities | ||||||||||||||||||||||||||||||||||||||||
Accounts payable and other liabilities | 440 | 591 | 98 | 85 | 35 | 31 | - | - | 573 | 707 | ||||||||||||||||||||||||||||||
Income taxes payable | 28 | - | 486 | - | 31 | - | - | - | 545 | - | ||||||||||||||||||||||||||||||
Accrued interest payable | 137 | 124 | - | - | 650 | 696 | (1) | (2) | 786 | 818 | ||||||||||||||||||||||||||||||
Derivatives | 51 | 41 | 4 | 46 | - | - | - | - | 55 | 87 | ||||||||||||||||||||||||||||||
Insurance contract liabilities | - | - | 7,079 | 6,405 | - | - | - | - | 7,079 | 6,405 | ||||||||||||||||||||||||||||||
Due to the Government of Canada | - | 6 | - | - | - | - | - | - | - | 6 | ||||||||||||||||||||||||||||||
Borrowings: | ||||||||||||||||||||||||||||||||||||||||
Fair value through profit or loss | 219 | 374 | - | - | - | - | - | - | 219 | 374 | ||||||||||||||||||||||||||||||
Amortized cost | 17,502 | 15,424 | - | - | 257,996 | 259,352 | (741) | (1,006) | 274,757 | 273,770 | ||||||||||||||||||||||||||||||
Defined benefit plans liability | 77 | 69 | 97 | 91 | 6 | 6 | - | - | 180 | 166 | ||||||||||||||||||||||||||||||
Unearned premiums and fees | - | - | 278 | 214 | 2,498 | 2,390 | - | - | 2,776 | 2,604 | ||||||||||||||||||||||||||||||
Deferred income tax liabilities | 139 | 167 | (71) | 155 | (33) | (54) | 1 | 2 | 36 | 270 | ||||||||||||||||||||||||||||||
| 18,593 | 16,796 | 7,971 | 6,996 | 261,183 | 262,421 | (741) | (1,006) | 287,006 | 285,207 | |||||||||||||||||||||||||||||||
Equity of Canada | 814 | 846 | 10,280 | 9,770 | 1,457 | 1,331 | 12 | 14 | 12,563 | 11,961 | ||||||||||||||||||||||||||||||
| 19,407 | 17,642 | 18,251 | 16,766 | 262,640 | 263,752 | (729) | (992) | 299,569 | 297,168 | |||||||||||||||||||||||||||||||
| 1 | The balance sheet eliminations remove inter-segment holdings of CMB and inter-segment receivables/payables. |
| 2023 Annual Report | 87 |
As at 1 January 2022
| (in millions) | Assisted Housing Activity | Mortgage Insurance Activity (restated) | Mortgage Funding Activity | Eliminations1 | Total (restated) | |||||||||||||||
Assets | ||||||||||||||||||||
Cash and cash equivalents | 1,071 | 450 | 4 | - | 1,525 | |||||||||||||||
Income taxes receivable | 12 | 60 | (8) | - | 64 | |||||||||||||||
Accrued interest receivable | 82 | 84 | 556 | (2) | 720 | |||||||||||||||
Investment securities: | ||||||||||||||||||||
Fair value through profit or loss | 159 | 130 | - | - | 289 | |||||||||||||||
Fair value through other comprehensive income | - | 16,835 | 3,615 | (468) | 19,982 | |||||||||||||||
Amortized cost | 3,259 | - | - | (442) | 2,817 | |||||||||||||||
Derivatives | 8 | 23 | - | - | 31 | |||||||||||||||
Due from the Government of Canada | 363 | - | - | - | 363 | |||||||||||||||
Loans: | ||||||||||||||||||||
Fair value through profit or loss | 480 | 20 | - | - | 500 | |||||||||||||||
Amortized cost | 7,897 | 63 | 264,821 | - | 272,781 | |||||||||||||||
Accounts receivable and other assets | 104 | 244 | 123 | - | 471 | |||||||||||||||
Investment property | 314 | - | - | - | 314 | |||||||||||||||
| 13,749 | 17,909 | 269,111 | (912) | 299,857 | ||||||||||||||||
Liabilities | ||||||||||||||||||||
Accounts payable and other liabilities | 482 | 93 | 31 | - | 606 | |||||||||||||||
Accrued interest payable | 62 | - | 552 | (2) | 612 | |||||||||||||||
Derivatives | 32 | 18 | - | - | 50 | |||||||||||||||
Insurance contract liabilities | - | 6,132 | - | - | 6,132 | |||||||||||||||
Borrowings: | ||||||||||||||||||||
Fair value through profit or loss | 475 | - | - | - | 475 | |||||||||||||||
Amortized cost | 11,921 | - | 264,821 | (873) | 275,869 | |||||||||||||||
Defined benefit plans liability | 102 | 140 | 8 | - | 250 | |||||||||||||||
Unearned premiums and fees | - | 137 | 2,184 | - | 2,321 | |||||||||||||||
Deferred income tax liabilities | 106 | 173 | - | (11) | 268 | |||||||||||||||
| 13,180 | 6,693 | 267,596 | (886) | 286,583 | ||||||||||||||||
Equity of Canada | 569 | 11,216 | 1,515 | (26) | 13,274 | |||||||||||||||
| 13,749 | 17,909 | 269,111 | (912) | 299,857 | ||||||||||||||||
| 1 | The balance sheet eliminations remove inter-segment holdings of CMB and inter-segment receivables/payables. |
| 2023 Annual Report | 88 |
6. Government Funding and Housing Programs Expenses
Our activities are presented into the following three core responsibilities.
| • | Assistance for housing needs: encompasses programs where we provide federal funding (primarily contribution based programs) to improve access to affordable housing for Canadians in housing need, including First Nations, Métis and Inuit peoples, Canadians with special or distinct needs, and certain vulnerable groups. |
| • | Financing for housing: encompasses programs whereby we make financing available (primarily loan based programs) for new and existing housing-related initiatives. |
| • | Housing expertise and capacity development: encompasses a variety of programs whereby we support capacity and skills development activities within the housing sector and conduct research and analysis as well as disseminate information on a range of issues that support the housing sector and inform decision making by Government and other sectors. |
The following table presents the amount of government funding, including housing programs expenses and operating expenses incurred to support these programs by core responsibility.
(in millions) | 2023 | 2022 | ||||||
Assistance for housing needs | 3,381 | 3,112 | ||||||
Financing for housing | 1,182 | 538 | ||||||
Housing expertise and capacity development | 925 | 154 | ||||||
Total | 5,488 | 3,804 | ||||||
Net change in government funding deferred in the year | 6 | (396) | ||||||
Total government funding recognized1,2 | 5,494 | 3,408 | ||||||
| 1 | Includes recoveries of operating expenses of $386 million (2022 – $337 million) and expected credit loss recovery of $13 million (2022 – $10 million) and excludes $19 million (2022 – nil) of housing programs expenses in which the appropriations are deducted from the carrying amount of the related capital assets. |
| 2 | Total government funding recognized does not include gains resulting from below market rate funds borrowed under the CBP, which are recognized in net gains (losses) on financial instruments. These gains totaled $80 million (2022 – $175 million). |
The following table presents the change in the due from (to) the Government of Canada account. The outstanding balance as at 31 December 2023 is mainly composed of housing programs expenses incurred but not yet reimbursed.
(in millions) | 2023 | 2022 | ||||||
Balance at beginning of year | (6) | 363 | ||||||
Total government funding | 5,488 | 3,804 | ||||||
Government funding received during the year | (5,483) | (3,872) | ||||||
Third party remittances from (owing to) the Government of Canada | (7) | (2) | ||||||
Balance at end of year before prior/future year adjustments | (8) | 293 | ||||||
Net change in One-time top-up to the Canada Housing Benefit advances | 229 | (263) | ||||||
Net change in prior year adjustments | 19 | (36) | ||||||
Balance at end of year | 240 | (6) | ||||||
| 2023 Annual Report | 89 |
7. Mortgage Insurance
Mortgage Insurance risk management
We assume the risk of loss from borrower default through mortgage insurance contracts entered into with approved lenders, exposing us to uncertainty surrounding the timing, frequency and severity of claims. Insurance risk management policies are in place to identify, mitigate, report and monitor this risk to ensure activities are managed within our risk appetite, tolerances and risk limits to successfully deliver on our mandate and meet our strategic directions.
We manage our exposure to insurance risk of loss through prudent product design, pricing, insurance underwriting policies, claims payment and default management, reserving, fraud and misrepresentation risk management, market diversification and borrower review and monitoring for the multi-unit, portfolio and transactional homeowner products.
Product design
The development of mortgage insurance products takes into account changing client needs, new legislation and regulations, the evolving economic environment and our mandate to serve Canadians across the country, particularly in those market segments not served or less well-served by the private sector. Product design is based on prudent underwriting practices combined with our goal to ensure that creditworthy borrowers have access to mortgage insurance products that meet their needs.
Pricing
Premiums are set based on projections of claim frequency, claim severity, return on investment, operating expenses, taxes, capital targets, profitability considerations and market demand. In addition, pricing decisions also take into account other considerations related to competition, strategic direction and our public mandate. Pricing risk refers to the potential that these projections and considerations may substantively and persistently differ from actual developments and values in the long term, which could have significant implications for our risk of loss, profitability and achievement of mandate.
At least annually, we conduct a pricing review of our products to: i) ensure they support Canadians in meeting their housing needs for a wide range of housing types and tenures; ii) support the profitability and long-term viability of the Mortgage Insurance Activity; iii) foster competition; iv) support financial stability; and v) be in line with our risk appetite and tolerances.
Insurance underwriting policies
Risks related to underwriting could arise from: i) the lender; ii) the borrower; iii) the property; and/or iv) the market. As a result, we have developed prudent and disciplined underwriting policies and guidelines which set the contractual framework and general obligations with respect to underwriting, provides approved lenders with underwriting criteria for mortgage insurance and also includes policies to obtain the approved lender designation.
In addition, for transactional homeowner products, risks related to insurance for different types of residential properties are assessed using our mortgage insurance risk assessment methodology and a rigorous underwriting and post-approval due diligence process.
In the case of multi-unit underwriting, due to different risk characteristics, applications undergo additional individual in-depth assessments to evaluate borrower, property, market and loan characteristics by our underwriters.
| 2023 Annual Report | 90 |
Claims payment and default management
Our Claims Payment Centre supports approved lenders in managing default related to homeowner and small rental loans to reduce risk of default on payment.
Our Insurance Servicing team works with approved lenders for multi-unit residential rental, licensed care or retirement properties in resolving default situations, evaluating workout alternatives and other matters. We consider workouts through effective management of projects in difficulty by following established frameworks.
We actively pursue recoveries, which are amounts expected to be recovered from borrowers to mitigate our potential loss.
Reserving
Reserving risk refers to the risk that insurance liabilities differ significantly from the actual claim payments. We estimate insurance policy liabilities to cover future losses and payments on claims. These policy liabilities are established based on projections of claim frequency, severity and timing, within the context of the economic environment and recent performance indicators such as arrears rates.
Fraud and misrepresentation risk management
Fraud risk management comprises all activities aiming to detect and prevent fraud or misrepresentation and mitigating losses due to fraud or misrepresentation. We mitigate fraud using models to identify mortgage loan applications that have a high probability of containing misrepresentation and taking the appropriate measures upon identification. We maintain specialized underwriting staff to review these claims and, if appropriate, require enhanced due diligence by the lender.
Market diversification
Concentration risk may arise from insurance contracts issued in a particular geographical area where local economic conditions are significantly different from the national average that could expose us to a greater risk of loss. The relative impact of the outcome is mitigated as a result of the distribution of business across different geographic areas. There are no lender or regional limits on business volumes as our mandate is to support Canadians’ housing needs from coast to coast. However, we do monitor the conditions of the housing market and economy in each region of Canada against predetermined risk tolerances in accordance with our Risk Appetite Framework.
The following table sets out the concentration of original loan amount insured during the year:
| 2023 | 2022 | |||||||||||||||||||||||||||||||
| Transactional | Multi-Unit | Transactional | Multi-Unit | |||||||||||||||||||||||||||||
(in percentages) | homeowner | Portfolio | residential | Overall | homeowner | Portfolio | residential | Overall | ||||||||||||||||||||||||
Atlantic | 7 | 7 | 8 | 8 | 6 | 6 | 7 | 7 | ||||||||||||||||||||||||
Quebec | 25 | 15 | 30 | 27 | 32 | 18 | 32 | 30 | ||||||||||||||||||||||||
Ontario | 27 | 37 | 29 | 29 | 26 | 36 | 31 | 30 | ||||||||||||||||||||||||
Prairies and territories | 30 | 27 | 19 | 23 | 26 | 23 | 12 | 18 | ||||||||||||||||||||||||
British Columbia | 11 | 14 | 14 | 13 | 10 | 17 | 18 | 15 | ||||||||||||||||||||||||
Canada | 100 | 100 | 100 | 100 | 100 | 100 | 100 | 100 | ||||||||||||||||||||||||
| 2023 Annual Report | 91 |
Monitoring
A comprehensive monitoring and quality assurance framework also enables our ongoing rigorous review of business trends, performance and lender compliance in order to make timely adjustments to underwriting and other risk management criteria and processes as needed.
Insurance-in-force
At 31 December 2023, insurance-in-force, which represents the maximum potential total risk exposure of the Mortgage Insurance Activity, totaled $414 billion (2022 – $399 billion). This amount includes $6,952 million (2022 – $5,044 million) in outstanding loan balances from the Lending programs included in the Assisted Housing Activity (refer to Note 14). Under Section 11 of the NHA, the total of outstanding insured amounts of all insured loans may not exceed the limit of $750 billion (2022 – $750 billion). The IIF limit was increased in March 2020 for a five-year period to accommodate the expanded eligibility criteria for portfolio insurance in conjunction with the IMPP.
The following table presents the percentage distribution of insurance-in-force by region:
| 2023 | 2022 | |||||||||||||||||||||||||||||||
| Transactional | Multi-Unit | Transactional | Multi-Unit | |||||||||||||||||||||||||||||
(in percentages) | homeowner | Portfolio | residential | Overall | homeowner | Portfolio | residential | Overall | ||||||||||||||||||||||||
Atlantic | 7 | 4 | 6 | 6 | 7 | 4 | 8 | 7 | ||||||||||||||||||||||||
Quebec | 26 | 13 | 30 | 25 | 26 | 13 | 28 | 24 | ||||||||||||||||||||||||
Ontario | 24 | 46 | 35 | 33 | 24 | 46 | 36 | 33 | ||||||||||||||||||||||||
Prairies and territories | 33 | 20 | 15 | 23 | 33 | 19 | 14 | 23 | ||||||||||||||||||||||||
British Columbia | 10 | 17 | 14 | 13 | 10 | 18 | 14 | 13 | ||||||||||||||||||||||||
Canada | 100 | 100 | 100 | 100 | 100 | 100 | 100 | 100 | ||||||||||||||||||||||||
Overview of insurance contracts
The following table presents the insurance contract liabilities by portfolio at year end.
(in millions) | 2023 | 2022 | ||||||
Insurance contracts | ||||||||
Homeowner transactional | 3,180 | 3,082 | ||||||
Portfolio | 135 | 148 | ||||||
Multi-unit residential | 3,764 | 3,175 | ||||||
Total insurance contract liabilities | 7,079 | 6,405 | ||||||
Insurance revenue
The following table presents the breakdown of insurance revenue recognized in the year.
(in millions) | 2023 | 2022 | ||||||
Amounts relating to changes in the liability for remaining coverage | ||||||||
CSM recognized for services provided | 685 | 546 | ||||||
Change in the risk adjustment for non-financial risk | 130 | 136 | ||||||
Expected incurred claims and other insurance expenses | 148 | 161 | ||||||
Recovery of insurance acquisition cash flows | 41 | 24 | ||||||
Total insurance revenue | 1,004 | 867 | ||||||
| 2023 Annual Report | 92 |
Insurance finance expenses
The following table presents the net investment result, specifically, the relationship between the insurance finance expenses and investment returns on assets.
(in millions) | 2023 | 2022 | ||||||
Investment income | 473 | 346 | ||||||
Net gains (losses) on financial instruments | (126) | (79) | ||||||
Amounts recognized in other comprehensive income | 570 | (1,180) | ||||||
Total investment return | 917 | (913) | ||||||
Interest accreted on insurance contracts using locked-in rate | (178) | (114) | ||||||
Impact of changes in interest rates in other comprehensive income | (100) | 234 | ||||||
Total finance (expense) income from insurance contracts | (278) | 120 | ||||||
Total net financial result | 639 | (793) | ||||||
Represented by: | ||||||||
Amounts recognized in income before income taxes | 169 | 153 | ||||||
Amounts recognized in OCI before income taxes | 470 | (946) | ||||||
Insurance contracts by remaining coverage and incurred claims
The following tables present the reconciliation of insurance contract liabilities by LRC and LIC.
As at 31 December 2023
(in millions) | LRC | LIC | Total | |||||||||
Insurance contract liabilities at beginning of year | 6,229 | 176 | 6,405 | |||||||||
Insurance revenue | ||||||||||||
Contracts under the fair value approach | (526) | - | (526) | |||||||||
Other contracts | (478) | - | (478) | |||||||||
| (1,004) | - | (1,004) | ||||||||||
Insurance service expense | ||||||||||||
Incurred claims and other insurance expenses | - | 156 | 156 | |||||||||
Amortization of insurance acquisition cash flows | 41 | - | 41 | |||||||||
Changes to the liabilities for incurred claims | - | (78) | (78) | |||||||||
| 41 | 78 | 119 | ||||||||||
Insurance service result | (963) | 78 | (885) | |||||||||
Insurance finance expenses | 275 | 3 | 278 | |||||||||
Total changes in the statement of income and comprehensive income before income taxes | (688) | 81 | (607) | |||||||||
Cash flows | ||||||||||||
Premiums received | 1,465 | - | 1,465 | |||||||||
Claims and other insurance service expense paid1 | - | (54) | (54) | |||||||||
Insurance acquisition cash flows | (130) | - | (130) | |||||||||
Total cash flows | 1,335 | (54) | 1,281 | |||||||||
Insurance contract liabilities at end of year | 6,876 | 203 | 7,079 | |||||||||
| 1 | Includes $10 million of claims administration expense, $13 million of initial provision for properties that we obtained in the year through default management activities, and excludes $21 million of losses on subsequent disposal of the properties which are recorded in other income as they are no longer subject to insurance risk. |
| 2023 Annual Report | 93 |
As at 31 December 2022
(in millions) | LRC | LIC | Total | |||||||||
Insurance contract liabilities at beginning of year | 5,749 | 383 | 6,132 | |||||||||
Insurance revenue | ||||||||||||
Contracts under the fair value approach | (586) | - | (586) | |||||||||
Other contracts | (281) | - | (281) | |||||||||
| (867) | - | (867) | ||||||||||
Insurance service expense | ||||||||||||
Incurred claims and other insurance expenses | - | 225 | 225 | |||||||||
Amortization of insurance acquisition cash flows | 24 | - | 24 | |||||||||
Changes to the liabilities for incurred claims | - | (355) | (355) | |||||||||
| 24 | (130) | (106) | ||||||||||
Insurance service result | (843) | (130) | (973) | |||||||||
Insurance finance expenses (income) | (122) | 2 | (120) | |||||||||
Total changes in the statement of income and comprehensive income before income taxes | (965) | (128) | (1,093) | |||||||||
Cash flows | ||||||||||||
Premiums received | 1,567 | - | 1,567 | |||||||||
Claims and other insurance service expense paid1 | - | (79) | (79) | |||||||||
Insurance acquisition cash flows | (122) | - | (122) | |||||||||
Total cash flows | 1,445 | (79) | 1,366 | |||||||||
Insurance contract liabilities at end of year | 6,229 | 176 | 6,405 | |||||||||
| 1 | Includes $9 million of claims administration expense, $26 million of initial provision for properties that we obtained in the year through default management activities, and excludes $20 million of losses on disposal of the properties which are recorded in other income as they are no longer subject to insurance risk. |
As at 31 December 2023 there were nil loss components (31 December 2022 – nil).
| 2023 Annual Report | 94 |
Insurance contracts by measurement components
The following tables present the reconciliation of insurance contract liabilities by measurement component.
As at 31 December 2023
| CSM | ||||||||||||||||||||
(in millions) | Present value of future cash flows | Risk adjustment for non- financial risk | Contracts under the fair value approach | Other contracts | Total | |||||||||||||||
Insurance contract liabilities at beginning of year | 1,038 | 820 | 2,597 | 1,950 | 6,405 | |||||||||||||||
Changes that relate to current services | ||||||||||||||||||||
CSM recognized for services provided | - | - | (350) | (335) | (685) | |||||||||||||||
Change in the risk adjustment for non-financial risk | - | (104) | - | - | (104) | |||||||||||||||
Experience adjustments | (18) | - | - | - | (18) | |||||||||||||||
Changes that relate to future services | ||||||||||||||||||||
Contracts initially recognized in the year | (1,084) | 252 | - | 832 | - | |||||||||||||||
Changes in estimates that adjust the CSM | (58) | 43 | 17 | (2) | - | |||||||||||||||
Changes that relate to past services | ||||||||||||||||||||
Changes to the liabilities for incurred claims | (67) | (11) | - | - | (78) | |||||||||||||||
Insurance service result | (1,227) | 180 | (333) | 495 | (885) | |||||||||||||||
Insurance finance expenses | 86 | 71 | 54 | 67 | 278 | |||||||||||||||
Total changes in the statement of income and comprehensive income before income taxes | (1,141) | 251 | (279) | 562 | (607) | |||||||||||||||
Cash flows | ||||||||||||||||||||
Premiums received | 1,465 | - | - | - | 1,465 | |||||||||||||||
Claims and other insurance service expense paid1 | (54) | - | - | - | (54) | |||||||||||||||
Insurance acquisition cash flows | (130) | - | - | - | (130) | |||||||||||||||
Total cash flows | 1,281 | - | - | - | 1,281 | |||||||||||||||
Insurance contract liabilities at end of year | 1,178 | 1,071 | 2,318 | 2,512 | 7,079 | |||||||||||||||
| 1 | Includes $10 million of claims administration expense, $13 million of initial provision for properties that we obtained in the year through default management activities, and excludes $21 million of losses on disposal of the properties which are recorded in other income as they are no longer subject to insurance risk. |
| 2023 Annual Report | 95 |
As at 31 December 2022
| CSM | ||||||||||||||||||||
(in millions) | Present value of future cash flows | Risk adjustment for non- financial risk | Contracts under the fair value approach | Other contracts | Total | |||||||||||||||
Insurance contract liabilities at beginning of year | 1,268 | 976 | 2,704 | 1,184 | 6,132 | |||||||||||||||
Changes that relate to current services | ||||||||||||||||||||
CSM recognized for services provided | - | - | (332) | (214) | (546) | |||||||||||||||
Change in the risk adjustment for non-financial risk | - | (94) | - | - | (94) | |||||||||||||||
Experience adjustments | 22 | - | - | - | 22 | |||||||||||||||
Changes that relate to future services | ||||||||||||||||||||
Contracts initially recognized in the year | (1,254) | 176 | - | 1,078 | - | |||||||||||||||
Changes in estimates that adjust the CSM | (33) | (17) | 178 | (128) | - | |||||||||||||||
Changes that relate to past services | ||||||||||||||||||||
Changes to the liabilities for incurred claims | (228) | (127) | - | - | (355) | |||||||||||||||
Insurance service result | (1,493) | (62) | (154) | 736 | (973) | |||||||||||||||
Insurance finance expenses (income) | (103) | (94) | 47 | 30 | (120) | |||||||||||||||
Total changes in the statement of income and comprehensive income before income taxes | (1,596) | (156) | (107) | 766 | (1,093) | |||||||||||||||
Cash flows | ||||||||||||||||||||
Premiums received | 1,567 | - | - | - | 1,567 | |||||||||||||||
Claims and other insurance service expense paid1 | (79) | - | - | - | (79) | |||||||||||||||
Insurance acquisition cash flows | (122) | - | - | - | (122) | |||||||||||||||
Total cash flows | 1,366 | - | - | - | 1,366 | |||||||||||||||
Insurance contract liabilities at end of year | 1,038 | 820 | 2,597 | 1,950 | 6,405 | |||||||||||||||
| 1 | Includes $9 million of claims administration expense, $26 million of initial provision for properties that we obtained in the year through default management activities, and excludes $20 million of losses on disposal of the properties which are recorded in other income as they are no longer subject to insurance risk. |
Effect of new business recognized in the year
The following table presents effects of insurance contracts initially recognized in the year. There were no new onerous contracts in the year.
(in millions) | 2023 | 2022 | ||||||
Estimates of the present value of future cash outflows, excluding insurance acquisition cash flows | 251 | 187 | ||||||
Estimates of insurance acquisition cash flows | 114 | 122 | ||||||
Estimate of the present value of future cash outflows | 365 | 309 | ||||||
Estimate of the present value of future cash inflows | (1,449) | (1,563) | ||||||
Risk adjustment for non-financial risk | 252 | 176 | ||||||
CSM | 832 | 1,078 | ||||||
| 2023 Annual Report | 96 |
Contractual service margin
The following table presents when the CSM is expected to be recognized into income in future years.
(in millions) | Within 1 year | 1 to 5 years | 5 to 10 years | More than 10 years | ||||||||||||
Insurance contracts | 660 | 1,661 | 1,098 | 1,411 | ||||||||||||
Sensitivity analysis
The following table presents the sensitivity in the significant assumptions relating to underwriting risk. Changes in the assumptions below would have the greatest effect on the measurement of the insurance contract liabilities. The percentage change in the assumptions is applied to a range of existing actuarial modeling assumptions to derive the possible impact on the CSM, income before income taxes and equity of Canada for reasonably possible movements in key loss assumptions with all other assumptions held constant. In practice, this is unlikely to occur and changes in some of the assumptions might be correlated, which might magnify or counteract the sensitivities. The relationship of a change in assumption to the change in value may not be linear.
Underwriting risk – insurance contracts
(in millions) | Weighted Average Assumptions | Change indicator | Change in assumptions | Impact on the CSM | Impact on income before income taxes | Impact on equity of Canada | ||||||||||||||||||||||||||||||||||
| 2023 | 2022 | 2023 | 2022 | 2023 | 2022 | 2023 | 2022 | |||||||||||||||||||||||||||||||||
Loss sensitivity factors | ||||||||||||||||||||||||||||||||||||||||
Claim frequency1 | 0.7% | 0.7% | Relative | +10% | (101) | (67) | (10) | (7) | (2) | (2) | ||||||||||||||||||||||||||||||
| Relative | -10% | 106 | 70 | 11 | 7 | 3 | 2 | |||||||||||||||||||||||||||||||||
Claim severity2 | 43.7% | 42.2% | Relative | +10% | (198) | (157) | (33) | (26) | (14) | (11) | ||||||||||||||||||||||||||||||
| Relative | -10% | 198 | 157 | 33 | 26 | 14 | 11 | |||||||||||||||||||||||||||||||||
Economic sensitivity factors | ||||||||||||||||||||||||||||||||||||||||
UR3 | 6.3% | 5.8% | Absolute | +1% | (268) | (215) | (27) | (22) | (5) | (4) | ||||||||||||||||||||||||||||||
RPI3 | 534 | 497 | Absolute | -10% | (611) | (510) | (60) | (50) | (23) | (20) | ||||||||||||||||||||||||||||||
| 1 | The weighted average assumption includes the weighted average arrears, claims, termination and cure rate. Reflects the probability of a loan going from healthy to claim during its life. |
| 2 | Reflects net claim, including expenses as a percentage of the insured loan amount, when a loan defaults. |
| 3 | Refers to national ten year average projected rates. |
| 2023 Annual Report | 97 |
Claims development
Liability for incurred claims
The following table shows the development of the expected losses on the LIC over a period of time and the estimated ultimate cost of claims for 2019 through 2023 to present the earliest material claim that has arisen and for which there is still uncertainty about the amount and timing of claim payments. The expected claims and claims costs paid are net of expected and actual borrower judgment recoveries received. The information is presented on a default year basis where claims are related to the year in which the insured event occurred and not the year in which the policy was underwritten.
(in millions) | 2019 | 2020 | 2021 | 2022 | 2023 | Total | ||||||
Expected losses | ||||||||||||
Default year | 253 | 445 | 220 | 135 | 167 | |||||||
One year later | 320 | 130 | 87 | 74 | ||||||||
Two years later | 175 | 60 | 80 | |||||||||
Three years later | 133 | 45 | ||||||||||
Four years later | 127 | |||||||||||
Total estimate of undiscounted claims | 127 | 45 | 80 | 74 | 167 | 493 | ||||||
Cumulative actual claim cost payments | (131) | (47) | (56) | (26) | (1) | (261) | ||||||
Cumulative expected claim payments (default years from 2019 to 2023) | (4) | (2) | 24 | 48 | 166 | 232 | ||||||
Cumulative expected claim payments (default years prior to 2019) | (22) | |||||||||||
Effect of discounting | (7) | |||||||||||
Liabilities for incurred claims | - | - | - | - | - | 203 | ||||||
Self-insurance products and other application fees
The following table presents the composition of premiums and fees earned for our self-insurance product and other application fees.
(in millions) | 2023 | 2022 | ||||||
Earned premium | 25 | 15 | ||||||
Earned application fees1 | 8 | 8 | ||||||
Total | 33 | 23 | ||||||
| 1 | Includes low loan-to-value transactional homeowner applications fees which are earned when received and application fees earned on our self-insurance product. |
The following table presents the changes in the unearned premiums and fees balance for our self-insured products.
(in millions) | 2023 | 2022 | ||||||
Balance at beginning of year | 214 | 137 | ||||||
Premiums and fees deferred on self-insured products in the year | 90 | 92 | ||||||
Premiums and fees earned on self-insured products in the year | (26) | (15) | ||||||
Balance at end of year | 278 | 214 | ||||||
We have recognized a provision for incurred claims on our self-insurance products recognized in note 23, accounts payable and other liabilities.
| 2023 Annual Report | 98 |
8. Mortgage Funding
We guarantee the timely payment of principal and interest of CMB issued by CHT under the CMB program and NHA MBS issued by Approved Issuers on the basis of housing loans under the NHA MBS program and under the IMPP in the event that an issuer is unable to satisfy its obligations under these programs. In that circumstance, we will mitigate our loss by realizing on the collateral securing the obligations, consisting primarily of insured mortgage loans, under each of the programs.
At the balance sheet date, we have not received a claim, nor do we expect to receive a claim, in excess of the unearned guarantee fee on our TPG. As such, no provision in addition to the remaining unearned premium is required.
The following table presents the changes in the unearned TPG fees balance.
| 2023 | 2022 | |||||||||||||||||||||||
(in millions) | NHA MBS | CMB | Total | NHA MBS | CMB | Total | ||||||||||||||||||
Balance at beginning of year | 1,809 | 581 | 2,390 | 1,617 | 567 | 2,184 | ||||||||||||||||||
TPG fees received in the year | 740 | 195 | 935 | 798 | 164 | 962 | ||||||||||||||||||
TPG fees earned in the year | (675) | (152) | (827) | (606) | (150) | (756) | ||||||||||||||||||
Balance at end of year | 1,874 | 624 | 2,498 | 1,809 | 581 | 2,390 | ||||||||||||||||||
The unearned TPG fees balance relates to the consideration received from customers at inception of the TPG contracts, for which revenue is recognized over the expected life of the security. The expected life of the securities varies with the average expected life being five years (2022 – five years).
Transaction price allocated to the remaining timely payment guarantee
The following table presents the revenue expected to be recognized in future years related to guarantees that are unsatisfied at the balance sheet date.
| 2029 and thereafter | ||||||||||||||||||||||||
(in millions) | 2024 | 2025 | 2026 | 2027 | 2028 | |||||||||||||||||||
NHA MBS | 653 | 524 | 345 | 176 | 76 | 100 | ||||||||||||||||||
CMB | 142 | 120 | 97 | 78 | 58 | 129 | ||||||||||||||||||
| 2023 Annual Report | 99 |
Guarantees-in-force
Total guarantees-in-force represents the maximum principal obligation related to TPGs1. Under Section 15 of the NHA, the aggregate outstanding amount of principal guarantees may not exceed $750 billion (2022 – $750 billion). The guarantees-in-force limit was increased in March 2020 from $600 billion to $750 billion for a five-year period to accommodate the one-year increase in NHA MBS and CMB guarantee limits of $295 billion and $60 billion, respectively.
The following table presents the total guarantees-in-force by program. We do not expect these to result in future cash outflows.
(in billions) | 2023 | 2022 | ||||||
NHA MBS | 254 | 216 | ||||||
CMB2 | 254 | 255 | ||||||
Total | 508 | 471 | ||||||
| 1 | Exposure excludes the realizable value of the related assets securing the NHA MBS and CMB guaranteed. |
| 2 | Includes $0.7 billion (2022 – $1 billion) in investments which are eliminated in the consolidated balance sheet. |
The following table presents the maturity profile of the guarantees-in-force based on principal amount outstanding as at 31 December 2023.
(in millions) | NHA MBS guarantees | CMB guarantees | Total | |||||||||
2024 | 21,520 | 37,500 | 59,020 | |||||||||
2025 | 50,697 | 40,750 | 91,447 | |||||||||
2026 | 76,303 | 32,500 | 108,803 | |||||||||
2027 | 58,086 | 31,750 | 89,836 | |||||||||
2028 | 42,953 | 39,000 | 81,953 | |||||||||
2029 and thereafter | 4,514 | 72,500 | 77,014 | |||||||||
Total | 254,073 | 254,000 | 508,073 | |||||||||
9. Structured Entities
Canada Housing Trust
CHT was established in 2001 as a special-purpose trust, separate from CMHC. While we control the activities of CHT, its assets and liabilities are neither owned by nor held for our benefit. CHT’s functions are limited to the acquisition of interests in eligible housing loans such as NHA MBS, the issuance of CMB, as well as the purchase of highly rated investments and certain related financial hedging activities. The beneficiaries of the Trust, after payment of all obligations, are one or more charitable organizations. Financial information for CHT is presented in the following tables on an unconsolidated basis.
| 2023 Annual Report | 100 |
Condensed Balance Sheet
(in millions) | 2023 | 2022 | ||||||
Loans – amortized cost | 255,130 | 255,903 | ||||||
Other assets | 648 | 694 | ||||||
Total assets | 255,778 | 256,597 | ||||||
Borrowings – amortized cost | 255,130 | 255,903 | ||||||
Other liabilities | 648 | 694 | ||||||
Total liabilities | 255,778 | 256,597 | ||||||
Total equity of Canada | - | - | ||||||
Condensed Statement of Income
(in millions) | 2023 | 2022 | ||||||
Interest income – loans | 6,460 | 4,969 | ||||||
Interest expense | 6,451 | 4,960 | ||||||
Net interest income | 9 | 9 | ||||||
Total revenues | 9 | 9 | ||||||
Operating expenses | 9 | 9 | ||||||
Total expenses | 9 | 9 | ||||||
Net income | - | - | ||||||
10. Capital Management
For capital management, we consider our capital available to be equal to the total equity of Canada less regulatory deductions.
Our primary objective with respect to capital management is to ensure that our commercial operations, being our Mortgage Insurance and Mortgage Funding activities, have adequate capital to deliver their mandate while remaining financially self-sustaining and to follow prudent business practices and guidelines existing in the private sector as appropriate. We voluntarily follow guidelines set out by OSFI.
We perform an Own Risk & Solvency Assessment (ORSA), which is an integrated process that evaluates capital adequacy on both a regulatory and economic capital basis and is used to establish capital targets taking into consideration our strategy and risk appetite. Our ‘Own View’ of capital needs is determined by identifying our risks and evaluating whether or not an explicit amount of capital is necessary to absorb losses from each risk. With this, we also meet the requirements of the CMHC Act and the NHA.
We set an internal target for our Mortgage Insurance Activity and our Mortgage Funding Activity at a level that is expected to cover all material risks. The internal target is calibrated using specified confidence intervals and is designed to provide an early indication of the need to resolve financial problems. Under our capital management policy, we operate at available capital levels above the internal target on all but unusual and infrequent occasions. Accordingly, we have established an operating level for our Mortgage Insurance Activity and our Mortgage Funding Activity in excess of our internal target. The operating level is calibrated using confidence intervals specified by our capital management policy and is designed to provide us with adequate time to resolve financial problems before available capital decreases below the internal target.
| 2023 Annual Report | 101 |
In August 2023, our Board of Directors approved maintaining the internal targets and operating levels of 155% and 165% respectively for Mortgage Insurance and 105% and 110% for Mortgage Funding for 2024.
We declare dividends to the Government from our Mortgage Insurance and Mortgage Funding Activities, to the extent there are profits and retained earnings not allocated to reserves, capitalization or to meet our needs for purposes of the NHA, CMHC Act or any other purpose authorized by Parliament relating to housing. In the current year, we declared and paid $1,080 million in dividends (2022 – $2,180 million dividends declared and paid).
The components of consolidated capital available are presented in the following table.
(in millions) | 2023 | 2022 (restated)3 | ||||||
Contributed capital | 25 | 25 | ||||||
Accumulated other comprehensive income | (321) | (725) | ||||||
Reserve fund | 72 | 17 | ||||||
Appropriated retained earnings | 10,564 | 11,004 | ||||||
Unappropriated retained earnings1 | 2,223 | 1,640 | ||||||
Total equity of Canada2 | 12,563 | 11,961 | ||||||
Less: regulatory deductions | (170) | (185) | ||||||
Total capital available | 12,393 | 11,776 | ||||||
| 1 | Unappropriated retained earnings represents retained earnings in excess of our operating level for the Mortgage Insurance and Mortgage Funding Activities. |
| 2 | Equity of Canada includes the impact of eliminations. |
| 3 | On transition to IFRS 17, total equity of Canada decreased by $6 million. |
Mortgage Insurance capital
The appropriated retained earnings of the Mortgage Insurance Activity is based on our ORSA. As regulatory capital, based on guidelines developed by OSFI, is higher than our economic capital requirements, we have set our capital targets based on regulatory capital. OSFI’s minimum regulatory capital requirement is 100% of its MICAT. The OSFI Supervisory target is 150% of the minimum capital required. We set an internal target above the Supervisory capital required under OSFI guidelines. The following table presents the components of capital available.
(in millions) | 2023 | 2022 (restated) | ||||||
Accumulated other comprehensive income (loss) | (271) | (624) | ||||||
Appropriated retained earnings | 9,282 | 9,663 | ||||||
Appropriated capital1 | 9,011 | 9,039 | ||||||
Unappropriated capital | 1,269 | 731 | ||||||
Total Mortgage Insurance capital | 10,280 | 9,770 | ||||||
Less: regulatory deductions | (170) | (185) | ||||||
Total Mortgage Insurance capital available | 10,110 | 9,585 | ||||||
Internal target | 155% | 155% | ||||||
Operating level | 165% | 165% | ||||||
Capital available to minimum capital required (% MICAT)2 | 185% | 175% | ||||||
| 1 | We appropriate retained earnings and AOCI at the operating level of 165% of MICAT. |
| 2 | On transition to IFRS 17, unappropriated capital decreased by $6 million which has not impacted the MICAT ratio. |
| 2023 Annual Report | 102 |
Mortgage Funding capital
Mortgage Funding capital is appropriated for the guarantees provided by our NHA MBS and CMB programs. There is no regulatory capital and the appropriated amount of capital is based on our economic capital methodology. At 31 December 2023, the total asset required (economic capital required) at the operating level is $1.8 billion which compares to $4.0 billion of assets available (31 December 2022 - $2.7 billion total assets required and $3.7 billion assets available). These amounts exclude assets and liabilities related to IMPP. Appropriated capital is determined by deducting unearned guarantee and application fees from the total asset required, subject to a minimum liquidity requirement. The liquidity requirement ensures that our total equity and the additional liquidity needed to cover the largest exposure to a single counterparty exceeds our investment balance (cash, cash equivalents, investment securities and related accrued interest). The Board approved an increase of the economic capital required from $1.8 billion to $2.2 billion, effective 1 January 2024, which will be applied prospectively from that date. In 2023 and 2022, the binding constraint is the liquidity requirement.
We do not have separate capital amounts for CHT because the TPG exposure to CMB issued by CHT is covered by the Mortgage Funding capital. Similarly, any exposure to IMPP is covered by Mortgage Funding Capital because the NHA MBS loans sold into IMPP form part of the same TPG. The amounts of Mortgage Funding capital held also recognize the risk mitigation provided by mortgage insurers, who are required to hold capital for the underlying mortgage default risk.
The following table presents the components of the capital available.
(in millions) | 2023 | 2022 | ||||||
Accumulated other comprehensive income (loss) | (102) | (164) | ||||||
Appropriated retained earnings | 1,282 | 1,341 | ||||||
Appropriated capital | 1,180 | 1,177 | ||||||
Unappropriated capital | 277 | 154 | ||||||
Total Mortgage Funding capital available | 1,457 | 1,331 | ||||||
Economic capital available to economic capital required (%)1 | 109% | 149% | ||||||
| 1 | In 2023, the capital required in the Mortgage Funding ratio has been updated to consider the liquidity target which would have resulted in a decrease of 47 percentage points in our 2022 comparative ratio. |
Assisted Housing capital
Lending programs
We maintain a reserve fund pursuant to Section 29 of the CMHC Act. A portion of the Lending programs’ earnings is retained in this reserve fund as part of our strategy to address interest rate risk exposure on pre-payable loans as well as credit risk exposure on unsecured loans. The reserve fund is subject to a statutory limit of $240 million (2022 – $240 million), which we have determined through our ORSA to be in a reasonable range. Should we exceed the statutory limit, we would be required to pay the excess to the Government. Aside from the reserve fund, we do not hold capital for our Assisted Housing activities, as they do not present material financial risks for us that we do not already otherwise mitigate (see Note 14).
Unrealized fair value fluctuations as well as remeasurement gains and losses on defined benefit plans are absorbed in retained earnings. The Housing programs’ portion of remeasurement gains and losses on defined benefit plans is recorded in retained earnings until it is reimbursed by the Government through government funding for housing programs.
| 2023 Annual Report | 103 |
The following table presents the components of the capital available.
(in millions) | 2023 | 2022 | ||||||
Reserve fund1 | 75 | 23 | ||||||
Retained earnings | 714 | 798 | ||||||
Total Lending programs capital available | 789 | 821 | ||||||
| 1 | Excludes the impact of eliminations of $3 million (2022 – $6 million). |
Housing programs
We do not hold additional capital for Housing programs as this activity does not present risks that would require us to set capital aside.
11. Fair Value Measurement
Fair value measurement
We measure certain financial instruments and non-financial assets at fair value in the consolidated balance sheet and disclose the fair value of certain other items. Fair value is determined using a consistent measurement framework.
Fair value is the price that would be received to sell an asset or paid to transfer a liability in an orderly transaction between market participants at the measurement date under current market conditions. The fair value of an asset or a liability is measured using the assumptions that market participants would use when pricing the asset or liability, assuming that market participants act in their economic best interest. Fair value measurement of non-financial assets (i.e. investment property) takes into account a market participant’s ability to generate economic benefits by using the asset in its highest and best use or by selling it to another market participant that would use the asset in its highest and best use. For financial instruments, accrued interest is separately recorded and disclosed.
Fair value hierarchy
The methods used to measure fair value make maximum use of relevant observable inputs and minimize the use of unobservable inputs. Fair value measurements are classified in a fair value hierarchy as Level 1, 2 or 3 according to the observability of the most significant inputs used in making the measurements.
Level 1
Assets and liabilities that are measured based on unadjusted quoted prices in active markets for identical assets or liabilities.
Level 2
Assets and liabilities that are measured based on observable inputs other than Level 1 prices. Level 2 inputs include prices obtained from markets that are not considered sufficiently active, and fair values obtained by discounting expected future cash flows, making maximum use of directly or indirectly observable market data.
Level 3
Assets and liabilities not quoted in active markets that are measured using valuation techniques. Where observable inputs are not available, unobservable inputs are used. For Level 3 assets and liabilities, unobservable inputs are significant to the overall measurement of fair value.
| 2023 Annual Report | 104 |
We have processes and controls in place to ensure fair value is reasonably measured. The valuation of financial instruments is performed by the Systems and Analytics Division (SAD) of the Investments and Treasury group. SAD has developed models and methodologies to determine fair value of financial instruments not quoted in active markets which are reviewed and monitored on an ongoing basis. All valuations are subject to independent price verification (IPV) managed by the sector of the Chief Risk Officer. IPV is a process where valuations are independently verified against external market prices and other relevant market data on an ongoing basis.
Generally, the unit of account for a financial instrument is the individual instrument, and valuation adjustments are applied at an individual instrument level, consistent with that unit of account.
For investment property, fair value is determined by independent external property appraisers or our internal appraisers who hold recognized and relevant professional qualifications.
Methods and assumptions
We measure fair value using the following methods and assumptions:
Investment securities
Fixed income securities are valued based on a third-party pricing provider, which uses market data from a variety of sources. Actively traded instruments are valued based on market data such as indicative quotes or trade prices for identical securities. Instruments that are not actively traded are valued based on techniques using other observable inputs, such as spread differentials of similar actively traded securities. Future cash flows of certain floating rate bonds are estimated based on observable implied forward rate curves.
For our private limited partnership and real estate investment trust equity investments, fair value is measured as our share of the partnership’s or trust’s net asset value. In measuring net asset value, the fair value of the partnership’s or trust’s real estate assets is determined at least annually by independent appraisers using the income approach or the market approach, and the fair value of its long-term debt is measured by discounting expected future cash flows.
Loans
Loans are valued by discounting future cash flows using discount rate curves that reflect the collection guarantees provided by provincial, territorial or federal levels of government. Inputs into the discounting model are the Government yield curve and spreads derived from assets with comparable financial risks.
Loans issued under the FTHBI are valued by multiplying the carrying amount of the loans by the housing repeat-sales price index. The repeat-sales price index is intended to reflect the increase/decrease in the fair values of the individual properties.
Derivatives
Derivatives consist of over-the-counter interest rate swaps and foreign currency forward contracts. These are valued by discounting estimated future cash flows using observable discount rate curves constructed using benchmark interest rates and foreign exchange rates. Future cash flows for floating rate legs are estimated based on observable implied forward rate curves. An adjustment is made to reflect the credit risk that either counterparty may not be able to fulfil its obligations. Inputs to this adjustment include market-implied default rates and estimated recovery rates, and the adjustment takes into account master netting and collateral arrangements in place.
First Time Home Buyer loan derivatives result from the recognition of a payable to, or receivable from, the Government of Canada when there are underlying loan gains or losses. The value of these derivatives is derived from movement on the repeat-sales price index as discussed above.
| 2023 Annual Report | 105 |
Investment property
The fair value of investment property is determined using either the income approach or the market approach, incorporating the highest and best use of the property. Of the total fair value of investment properties, 45% (2022 – 43%) was based on valuations performed by independent valuators and 55% (2022 – 57%) was based on internal valuations during 2023.
The income approach is primarily applied in determining the fair value of rent-producing properties. Under the income approach, fair value is based upon the present value of expected future cash flows of each property using an unobservable discount rate reflective of the characteristics of the property. Future cash flows are estimated using unobservable assumptions about future rental values and vacancy rates.
The market approach is primarily applied in determining the fair value of vacant land. Under the market approach, fair value is based upon market transactions involving comparable property, with adjustments made to reflect the unique aspects of the property being valued.
Borrowings
Borrowings from the Government of Canada are valued by discounting future cash flows using discount rate curves derived from the directly observable yields of our market-traded borrowings (i.e. CMBs).
Comparison of carrying and fair values for financial instruments not carried at fair value
The following table compares the carrying and fair values of financial instruments not carried at fair value. Carrying value is the amount at which an item is measured in the consolidated balance sheet.
| 2023 | 2022 | |||||||||||||||||||||||
(in millions) | Carrying value | Fair value | Fair value over (under) carrying value | Carrying value | Fair value | Fair value over (under) carrying value | ||||||||||||||||||
Financial assets1 | ||||||||||||||||||||||||
Investments at amortized cost2 | 3,229 | 3,176 | (53) | 3,578 | 3,464 | (114) | ||||||||||||||||||
Loans at amortized cost3 | 270,650 | 261,936 | (8,714) | 269,207 | 254,629 | (14,578) | ||||||||||||||||||
Financial liabilities | ||||||||||||||||||||||||
Borrowings at amortized cost4 | 274,757 | 266,144 | (8,613) | 273,770 | 258,915 | (14,855) | ||||||||||||||||||
| 1 | Does not include cash and cash equivalents of $1,074 million (2022– $1,924 million) and securities purchased under resale agreements of $700 million (2022 – $650 million) carried at amortized cost as the fair value of these financial instruments is equal to their carrying value. |
| 2 | $444 million (2022 – $608 million) fair value categorized as Level 1 and $2,732 million (2022– $2,856 million) fair value categorized as Level 2. |
| 3 | $255,725 million (31 December 2022 – $250,204 million) fair value categorized as level 2, $6,211 million (31 December 2022 – $4,425 million) fair value categorized as level 3. |
| 4 | $193,908 million (31 December 2022 – $156,522 million) fair value categorized as level 1, $72,236 million (31 December 2022 – $102,393 million) fair value categorized as level 2. |
| 2023 Annual Report | 106 |
Fair value hierarchy for items carried at fair value
The following table presents the fair value hierarchy for assets and liabilities carried at fair value in the consolidated balance sheet.
| 2023 | 2022 | |||||||||||||||||||||||||||||||
(in millions) | Level 1 | Level 2 | Level 3 | Total | Level 1 | Level 2 | Level 3 | Total | ||||||||||||||||||||||||
Assets | ||||||||||||||||||||||||||||||||
Cash equivalents | ||||||||||||||||||||||||||||||||
Interest bearing deposits with banks | - | 172 | - | 172 | - | 240 | - | 240 | ||||||||||||||||||||||||
Federal government issued | - | 686 | - | 686 | 183 | 262 | - | 445 | ||||||||||||||||||||||||
Corporate/other entities | - | 7 | - | 7 | - | 40 | - | 40 | ||||||||||||||||||||||||
Total cash equivalents | - | 865 | - | 865 | 183 | 542 | - | 725 | ||||||||||||||||||||||||
Investment securities | ||||||||||||||||||||||||||||||||
FVTPL | ||||||||||||||||||||||||||||||||
Debt instruments | ||||||||||||||||||||||||||||||||
Corporate/other entities | - | 18 | - | 18 | - | 22 | - | 22 | ||||||||||||||||||||||||
Provinces/municipalities | - | - | - | - | - | 25 | - | 25 | ||||||||||||||||||||||||
Sovereign and related entities | - | - | - | - | - | 8 | - | 8 | ||||||||||||||||||||||||
Equities | ||||||||||||||||||||||||||||||||
Limited partnership units | - | - | 51 | 51 | - | - | 78 | 78 | ||||||||||||||||||||||||
Total at FVTPL | - | 18 | 51 | 69 | - | 55 | 78 | 133 | ||||||||||||||||||||||||
FVOCI | ||||||||||||||||||||||||||||||||
Debt instruments | ||||||||||||||||||||||||||||||||
Corporate/other entities | 2,261 | 5,044 | - | 7,305 | 2,110 | 5,106 | - | 7,216 | ||||||||||||||||||||||||
Federal government issued | 7,587 | 1,771 | - | 9,358 | 7,057 | 618 | - | 7,675 | ||||||||||||||||||||||||
Provinces/municipalities | 2,685 | 465 | - | 3,150 | 2,421 | 515 | - | 2,936 | ||||||||||||||||||||||||
Sovereign and related entities | 282 | 67 | - | 349 | 122 | 94 | - | 216 | ||||||||||||||||||||||||
Total at FVOCI | 12,815 | 7,347 | - | 20,162 | 11,710 | 6,333 | - | 18,043 | ||||||||||||||||||||||||
Loans designated at FVTPL | - | 54 | - | 54 | - | 112 | - | 112 | ||||||||||||||||||||||||
Loans mandatorily at FVTPL | - | 12 | 446 | 458 | - | 13 | 344 | 357 | ||||||||||||||||||||||||
Derivatives | - | 161 | - | 161 | - | - | - | - | ||||||||||||||||||||||||
Investment property | - | - | 398 | 398 | - | - | 402 | 402 | ||||||||||||||||||||||||
Total assets carried at fair value | 12,815 | 8,457 | 895 | 22,167 | 11,893 | 7,055 | 824 | 19,772 | ||||||||||||||||||||||||
Liabilities | ||||||||||||||||||||||||||||||||
Borrowings designated at FVTPL | - | (219) | - | (219) | - | (374) | - | (374) | ||||||||||||||||||||||||
Derivatives | - | (8) | (47) | (55) | - | (53) | (34) | (87) | ||||||||||||||||||||||||
Total liabilities carried at fair value | - | (227) | (47) | (274) | - | (427) | (34) | (461) | ||||||||||||||||||||||||
Net assets at FVTPL | 12,815 | 8,230 | 848 | 21,893 | 11,893 | 6,628 | 790 | 19,311 | ||||||||||||||||||||||||
| 2023 Annual Report | 107 |
Transfers between fair value hierarchy levels
For assets and liabilities measured at fair value on a recurring basis, we determine if reclassifications have occurred between levels in the hierarchy by re-assessing categorization at each balance sheet date. Transfers are dependent on internal classification criteria that are based on variables such as observability of prices and market trading volumes considered as at each balance sheet date. Transfers between levels are deemed to occur at the beginning of the quarter in which the transfer occurs. There were $2,289 million of transfers from level 2 to level 1 and $3,067 million of transfers from level 1 to level 2 during the year ended 31 December 2023 (31 December 2022 – $2,645 million and $4,830 million, respectively).
Change in fair value measurement for items classified as level 3
The following table presents the change in fair value for items carried at fair value and classified as level 3.
(in millions) | Investment securities – FVTPL | Loans – FVTPL | Investment property | Derivatives | Total | |||||||||||||||
2023 | ||||||||||||||||||||
Fair value as at 1 January 2023 | 78 | 344 | 402 | (34) | 790 | |||||||||||||||
Purchases/issuances | - | 117 | - | - | 117 | |||||||||||||||
Net gains (losses) in profit or loss1,2 | - | 13 | 13 | (13) | 13 | |||||||||||||||
Cash receipts on settlements/disposals | (27) | (28) | (17) | - | (72) | |||||||||||||||
Fair value as at 31 December 2023 | 51 | 446 | 398 | (47) | 848 | |||||||||||||||
2022 | ||||||||||||||||||||
Fair value as at 1 January 2022 | 79 | 298 | 314 | (31) | 660 | |||||||||||||||
Purchases/issuances | 3 | 86 | - | - | 89 | |||||||||||||||
Net gains (losses) in profit or loss1,2 | 1 | 2 | 88 | (3) | 88 | |||||||||||||||
Cash receipts on settlements/disposals | (5) | (42) | - | - | (47) | |||||||||||||||
Fair value as at 31 December 2022 | 78 | 344 | 402 | (34) | 790 | |||||||||||||||
| 1 | Included in net gains (losses) on financial instruments for investment securities, loans and derivatives; other income for investment property. |
| 2 | Solely relates to unrealized gains for assets held at the end of the respective years. |
| 2023 Annual Report | 108 |
Unobservable inputs for items classified as level 3
The valuations of items classified as level 3 use unobservable inputs, changes in which may significantly affect the measurement of fair value. Valuations were based on assessments of the prevailing conditions at 31 December 2023, which may change materially in subsequent periods. The following table presents quantitative information about the significant unobservable inputs used in level 3 fair value measurements for items carried at fair value.
| 2023 | 2022 | |||||||||||||||||||||||
(in millions) | Valuation technique | Unobservable inputs | Asset fair value | Weighted average input/range | Asset fair value | Weighted average input/range | ||||||||||||||||||
Investment securities | ||||||||||||||||||||||||
Equities at FVTPL – Limited partnership units | | Share of partnership equity |
| | Reported partnership equity | | 51 | n/a | 78 | n/a | ||||||||||||||
Loans at FVTPL | ||||||||||||||||||||||||
MI Activity workout loans | | Discounted cash flow | | Loss rate | 2 | 63% | 2 | 63% | ||||||||||||||||
MI Activity mortgage assignments | Market approach | Value per square foot | 16 | $16-$1,408 | 12 | $7-$645 | ||||||||||||||||||
AH Activity loans – FTHBI | Market approach | | Repeat-sales price index |
| 428 | n/a | 330 | n/a | ||||||||||||||||
Total loans at FVTPL | 446 | - | 344 | - | ||||||||||||||||||||
Investment property | ||||||||||||||||||||||||
AH Activity | | Discounted cash flow | | | Estimated rental value per square foot | | 63 | $15-$294 | 80 | $25-$306 | ||||||||||||||
| Discount rate | - | 4%-6% | - | 4%-6% | ||||||||||||||||||||
| Market approach | Value per square foot | 335 | $6-$677 | 322 | $6-$641 | |||||||||||||||||||
Total investment property | 398 | - | 402 | - | ||||||||||||||||||||
FTHBI loan derivative | Market approach | | Repeat-sales price index | | (47) | n/a | (34) | n/a | ||||||||||||||||
Total Level 3 items carried at fair value | 848 | - | 790 | - | ||||||||||||||||||||
Level 3 sensitivity analysis
Investment property
For investment property, increases (decreases) in estimated rental value and price per square foot could result in a significantly higher (lower) fair value of the properties. Increases (decreases) in discount rates could result in a significantly lower (higher) fair value.
| 2023 Annual Report | 109 |
12. Cash and Cash Equivalents
The following table provides a breakdown of our cash and cash equivalents:
| 2023 | 2022 | |||||||||||||||||||||||||||||||
(in millions) | Amortized cost | FVOCI | FVTPL | Total | Amortized cost | FVOCI | FVTPL | Total | ||||||||||||||||||||||||
Cash | 106 | - | - | 106 | 227 | - | - | 227 | ||||||||||||||||||||||||
Interest-bearing deposits with banks | 805 | - | 172 | 977 | 1,329 | - | 240 | 1,569 | ||||||||||||||||||||||||
Corporate/other entities | - | 7 | - | 7 | - | 40 | - | 40 | ||||||||||||||||||||||||
Federal government issued | - | 686 | - | 686 | - | 445 | - | 445 | ||||||||||||||||||||||||
Provinces/municipalities | 163 | - | - | 163 | 368 | - | - | 368 | ||||||||||||||||||||||||
Total cash and cash equivalents | 1,074 | 693 | 172 | 1,939 | 1,924 | 485 | 240 | 2,649 | ||||||||||||||||||||||||
We hold the following cash and cash equivalents that are intended for use as part of the respective programs:
(in millions) | 2023 | 2022 | ||||||
Affordable Rental Housing Innovation Fund | 35 | 46 | ||||||
Apartment Construction Loan Program (ACLP) | 757 | 694 | ||||||
Affordable Housing Fund (AHF) | 209 | 643 | ||||||
Direct Lending (DL) – Economically Hedged | 172 | 240 | ||||||
Total | 1,173 | 1,623 | ||||||
| 2023 Annual Report | 110 |
13. Investment Securities
The following tables present the contractual maturity profile and average yield of investment securities.
| Remaining term to maturity | ||||||||||||||||||||||||
(in millions) | Within 1 year | 1 to 3 years | 3 to 5 years | Over 5 years | Total 2023 | Total 2022 | ||||||||||||||||||
FVTPL | ||||||||||||||||||||||||
Fixed income1 | ||||||||||||||||||||||||
Corporate/other entities | - | 18 | - | - | 18 | 22 | ||||||||||||||||||
Provinces/municipalities | - | - | - | - | - | 25 | ||||||||||||||||||
Sovereign and related entities | - | - | - | - | - | 8 | ||||||||||||||||||
Total fixed income | - | 18 | - | - | 18 | 55 | ||||||||||||||||||
Yield2 | - | 1.7% | - | - | 1.7% | 1.8% | ||||||||||||||||||
Canadian equities | 51 | 78 | ||||||||||||||||||||||
Yield3 | 2.6% | 6.5% | ||||||||||||||||||||||
Total at FVTPL | 69 | 133 | ||||||||||||||||||||||
FVOCI | ||||||||||||||||||||||||
Fixed income4 | ||||||||||||||||||||||||
Corporate/other entities | 265 | 1,906 | 2,182 | 2,952 | 7,305 | 7,216 | ||||||||||||||||||
Federal government issued | 3,904 | 2,899 | 1,325 | 1,230 | 9,358 | 7,675 | ||||||||||||||||||
Provinces/municipalities | 48 | 617 | 703 | 1,782 | 3,150 | 2,936 | ||||||||||||||||||
Sovereign and related entities | - | 62 | 134 | 153 | 349 | 216 | ||||||||||||||||||
Total at FVOCI | 4,217 | 5,484 | 4,344 | 6,117 | 20,162 | 18,043 | ||||||||||||||||||
Yield2 | 3.6% | 2.6% | 3.2% | 3.2% | 3.1% | 2.1% | ||||||||||||||||||
Amortized cost | ||||||||||||||||||||||||
Fixed income | ||||||||||||||||||||||||
Corporate/other entities | 335 | 307 | 205 | - | 847 | 819 | ||||||||||||||||||
Federal government issued | 5 | - | - | - | 5 | 5 | ||||||||||||||||||
Provinces/municipalities | 504 | 449 | 128 | - | 1,081 | 1,528 | ||||||||||||||||||
Sovereign and related entities | 303 | 836 | 146 | 11 | 1,296 | 1,226 | ||||||||||||||||||
Total at Amortized cost | 1,147 | 1,592 | 479 | 11 | 3,229 | 3,578 | ||||||||||||||||||
Yield2 | 2.7% | 2.6% | 3.5% | 4.6% | 2.8% | 1.9% | ||||||||||||||||||
Total | 23,460 | 21,754 | ||||||||||||||||||||||
| 1 | Includes debt securities denominated in U.S. dollars with a carrying value of $11 million (31 December 2022 - $13 million). |
| 2 | Represents the weighted-average yield, determined as the weighted average of the effective yields of individual securities. |
| 3 | Represents the average yield, determined by dividing dividend income by average cost in 2023. |
| 4 | Includes debt securities denominated in U.S. dollars with a carrying value of $4,116 million (31 December 2022 - $4,047 million). |
| 2023 Annual Report | 111 |
The following table shows the cumulative unrealized gains (losses) on investment securities recorded at fair value.
| 2023 | 2022 | |||||||||||||||||||||||||||||||
(in millions) | Amortized cost1 | Gross gains | Gross losses | Fair value | Amortized cost1 | Gross gains | Gross losses | Fair value | ||||||||||||||||||||||||
Debt instruments | ||||||||||||||||||||||||||||||||
FVTPL2 | 18 | - | - | 18 | 55 | - | - | 55 | ||||||||||||||||||||||||
FVOCI3 | 20,777 | 173 | (788) | 20,162 | 19,149 | 176 | (1,282) | 18,043 | ||||||||||||||||||||||||
Equities | ||||||||||||||||||||||||||||||||
FVTPL | 49 | 14 | (12) | 51 | 63 | 24 | (9) | 78 | ||||||||||||||||||||||||
| 1 | Amortized cost for equities is weighted-average acquisition cost. |
| 2 | Includes debt securities denominated in U.S. dollars with a carrying value of $11 million (31 December 2022 - $13 million). |
| 3 | Includes debt instruments denominated in U.S. dollars with a carrying value of $4,116 million (2022 – $4,047 million). |
Expected credit losses
See Note 19 for further information about the credit quality of our investment securities. At 31 December 2023, all of our debt instruments held at FVOCI and at amortized cost had a 12-month ECL allowance.
The ECL allowance for debt instruments held at FVOCI and amortized cost was $21 million at 31 December 2023 (2022 – $14 million).
We performed a sensitivity analysis by shifting economic scenario weightings to each extreme to assess the ECL impacts on our investment securities at amortized cost and FVOCI. The focus of these analyses is on Stage 1 and Stage 2 exposures, as Stage 3 ECLs do not vary between scenarios. Each scenario has been run independently from the others, and the results represent a simulated impact as follows:
| As at 31 December 2023 | As at 31 December 2022 | |||||||||||||||||||||||
| Weight | Unweighted ECL | Weighted ECL | Weight | Unweighted ECL | Weighted ECL | |||||||||||||||||||
Optimistic | 20% | 13 | - | 20% | 8 | - | ||||||||||||||||||
Baseline | 50% | 17 | 21 | 45% | 12 | 14 | ||||||||||||||||||
Pessimistic | 30% | 33 | - | 35% | 20 | - | ||||||||||||||||||
| 2023 Annual Report | 112 |
14. Loans
The following tables present the contractual maturity profile and average yield of loans based on carrying value.
| Year of maturity | ||||||||||||||||||||||||||||||||
(in millions) | 2024 | 2025 | 2026 | 2027 | 2028 | 2029 and thereafter | Total 2023 | Total 2022 | ||||||||||||||||||||||||
FVTPL | ||||||||||||||||||||||||||||||||
Lending programs | 23 | 29 | 3 | - | - | 439 | 494 | 455 | ||||||||||||||||||||||||
MI Activity loans | 18 | - | - | - | - | - | 18 | 14 | ||||||||||||||||||||||||
Total FVTPL | 41 | 29 | 3 | - | - | 439 | 512 | 469 | ||||||||||||||||||||||||
Yield | 3.7% | 1.6% | 1.5% | - | - | - | 0.4% | 0.6% | ||||||||||||||||||||||||
Amortized cost | ||||||||||||||||||||||||||||||||
CMB program loans | 37,552 | 41,080 | 32,494 | 31,828 | 39,173 | 73,003 | 255,130 | 255,903 | ||||||||||||||||||||||||
Lending programs | 481 | 438 | 497 | 530 | 808 | 9,862 | 12,616 | 9,807 | ||||||||||||||||||||||||
IMPP loans | 2,512 | 354 | - | - | - | - | 2,866 | 3,449 | ||||||||||||||||||||||||
MI Activity loans | 33 | 1 | - | 1 | - | 3 | 38 | 48 | ||||||||||||||||||||||||
Total amortized cost | 40,578 | 41,873 | 32,991 | 32,359 | 39,981 | 82,868 | 270,650 | 269,207 | ||||||||||||||||||||||||
Yield | 3.2% | 2.3% | 2.1% | 3.4% | 3.6% | 2.7% | 2.8% | 2.4% | ||||||||||||||||||||||||
Total | 40,619 | 41,902 | 32,994 | 32,359 | 39,981 | 83,307 | 271,162 | 269,676 | ||||||||||||||||||||||||
| 2023 Annual Report | 113 |
The following table presents the cash flows and non-cash changes for loans.
| Cash flows | Non-cash changes | |||||||||||||||||||||||||||||||||||
(in millions) | Opening balance | Repayments | Disbursements | Fair value changes | Accretion | ECL | Transfers1 | Capitalized interest | Balance at end of year | |||||||||||||||||||||||||||
2023 | ||||||||||||||||||||||||||||||||||||
FVTPL | ||||||||||||||||||||||||||||||||||||
Lending programs | 455 | (51) | 101 | 18 | - | - | (29) | - | 494 | |||||||||||||||||||||||||||
MI Activity loans | 14 | (12) | 16 | - | - | - | - | - | 18 | |||||||||||||||||||||||||||
Total at FVTPL | 469 | (63) | 117 | 18 | - | - | (29) | - | 512 | |||||||||||||||||||||||||||
Amortized cost | ||||||||||||||||||||||||||||||||||||
CMB program loans | 255,903 | (46,040) | 45,225 | - | 42 | - | - | - | 255,130 | |||||||||||||||||||||||||||
Lending programs2 | 9,807 | (594) | 3,397 | (109) | 5 | (2) | 29 | 83 | 12,616 | |||||||||||||||||||||||||||
IMPP loans | 3,449 | (583) | - | - | - | - | - | - | 2,866 | |||||||||||||||||||||||||||
MI Activity loans | 48 | (40) | - | - | 14 | 16 | - | - | 38 | |||||||||||||||||||||||||||
Total amortized cost | 269,207 | (47,257) | 48,622 | (109) | 61 | 14 | 29 | 83 | 270,650 | |||||||||||||||||||||||||||
Total | 269,676 | (47,320) | 48,739 | (91) | 61 | 14 | - | 83 | 271,162 | |||||||||||||||||||||||||||
2022 | ||||||||||||||||||||||||||||||||||||
FVTPL | ||||||||||||||||||||||||||||||||||||
Lending programs | 480 | (61) | 65 | (5) | - | - | (24) | - | 455 | |||||||||||||||||||||||||||
MI Activity loans | 20 | (25) | 19 | - | - | - | - | - | 14 | |||||||||||||||||||||||||||
Total at FVTPL | 500 | (86) | 84 | (5) | - | - | (24) | - | 469 | |||||||||||||||||||||||||||
Amortized cost | ||||||||||||||||||||||||||||||||||||
CMB program loans | 260,587 | (44,848) | 40,119 | - | 45 | - | - | - | 255,903 | |||||||||||||||||||||||||||
Lending programs2 | 7,897 | (589) | 2,436 | (3) | - | (5) | 24 | 47 | 9,807 | |||||||||||||||||||||||||||
IMPP loans | 4,234 | (785) | - | - | - | - | - | - | 3,449 | |||||||||||||||||||||||||||
MI Activity loans | 63 | (36) | 2 | - | 6 | 13 | - | - | 48 | |||||||||||||||||||||||||||
Total amortized cost | 272,781 | (46,258) | 42,557 | (3) | 51 | 8 | 24 | 47 | 269,207 | |||||||||||||||||||||||||||
Total | 273,281 | (46,344) | 42,641 | (8) | 51 | 8 | - | 47 | 269,676 | |||||||||||||||||||||||||||
| 1 | Transfers are matured loans that have been renewed where the new loans are no longer part of a portfolio of economically hedged loans and borrowings and therefore classified at amortized cost. |
| 2 | Fair value changes for loans at amortized cost relate to losses recognized immediately upon initial advance of loans issued below market value. |
| 2023 Annual Report | 114 |
Credit quality – amortized cost
The following table presents the credit quality of loans at amortized cost, presented separately for those based on 12-month or lifetime ECL. For loans where past due information is used as the primary criteria in assessing SICR, aging of loans past due from contractual due date is presented. For loans where past due information is not the primary criteria used in assessing SICR, credit quality is presented by credit rating category based on our internal credit rating system. Amounts in the table represent the gross carrying amount of the financial asset.
| 2023 | ||||||||||||||||||||||||
(in millions) | Stage 1: 12-month ECL | Stage 2: Lifetime impaired) | Stage 3: Lifetime ECL (credit | POCI | Total | 2022 Total | ||||||||||||||||||
Days past due: | ||||||||||||||||||||||||
0-30 days | 11,546 | - | - | - | 11,546 | 8,498 | ||||||||||||||||||
30-90 | - | - | - | - | - | 26 | ||||||||||||||||||
90+ | - | - | 40 | - | 40 | 64 | ||||||||||||||||||
POCI | - | - | - | 45 | 45 | 62 | ||||||||||||||||||
Total gross carrying amount | 11,546 | - | 40 | 45 | 11,631 | 8,650 | ||||||||||||||||||
Internal credit ratings: | ||||||||||||||||||||||||
AAA | 12 | - | - | - | 12 | 13 | ||||||||||||||||||
AA- to AA+ | 536 | - | - | - | 536 | 723 | ||||||||||||||||||
A- to A+ | 472 | - | - | - | 472 | 465 | ||||||||||||||||||
BBB- to BBB+ | 60 | - | - | - | 60 | 76 | ||||||||||||||||||
Total gross carrying amount | 1,080 | - | - | - | 1,080 | 1,277 | ||||||||||||||||||
Total | 12,626 | - | 40 | 45 | 12,711 | 9,927 | ||||||||||||||||||
ECL allowance | (16) | - | (23) | (18) | (57) | (72) | ||||||||||||||||||
Total, net of ECL allowance | 12,610 | - | 17 | 27 | 12,654 | 9,855 | ||||||||||||||||||
CMB program loans | - | - | - | - | 255,130 | 255,903 | ||||||||||||||||||
IMPP loans | - | - | - | - | 2,866 | 3,449 | ||||||||||||||||||
Total loans at amortized cost | 270,650 | 269,207 | ||||||||||||||||||||||
Total undrawn loan commitments outstanding at 31 December 2023 were $9,028 million (2022 – $8,885 million), Of which $8,549 million are subject to 12-month ECL (2022 – $8,362 million) and $2 million are commitments outstanding on POCI loans (2022 – $2 million).
The allowance for ECL on undrawn loan commitments, which we record in accounts payable and other liabilities, was $25 million at 31 December 2023 (2022 – $15 million), an increase of $10 million for the year (2022 – no change from prior year).
The ECL allowance on our loan portfolio is not materially sensitive to changes in economic inputs or weightings as the majority of the allowance is comprised of loans classified as Stage 3, where ECL does not vary between scenarios.
| 2023 Annual Report | 115 |
Sources of guarantee
We are assured collection of principal and accrued interest on 99% (2022 – 99%) of our loans. The sources of guarantee for these loans are provided in the following table.
| 2023 | 2022 | |||||||||||||||||||||||
(in millions) | FVTPL | Amortized cost | Total | FVTPL | Amortized cost | Total | ||||||||||||||||||
Provinces and territories through provisions in the SHA | 54 | 953 | 1,007 | 112 | 1,143 | 1,255 | ||||||||||||||||||
Government of Canada through provisions in the NHA | 428 | 818 | 1,246 | 330 | 343 | 673 | ||||||||||||||||||
Indigenous Services Canada through Ministerial Loan Guarantees | - | 1,411 | 1,411 | - | 1,389 | 1,389 | ||||||||||||||||||
Loans underwritten by our MI Activity | - | 6,952 | 6,952 | - | 5,044 | 5,044 | ||||||||||||||||||
Collateral1 | - | 257,996 | 257,996 | - | 259,352 | 259,352 | ||||||||||||||||||
Total guaranteed loans | 482 | 268,130 | 268,612 | 442 | 267,271 | 267,713 | ||||||||||||||||||
Other Lending programs loans2 | 12 | 2,482 | 2,494 | 13 | 1,888 | 1,901 | ||||||||||||||||||
MI Activity loans | 18 | 38 | 56 | 14 | 48 | 62 | ||||||||||||||||||
Total | 512 | 270,650 | 271,162 | 469 | 269,207 | 269,676 | ||||||||||||||||||
| 1 | Represents collateral held for CMB program and IMPP loans, which consists of NHA MBS securities and in the case of the CMB program only, high quality reinvestment assets. |
| 2 | Consists of loans to provincial entities, municipalities and partnerships between governments, non-profits and private sector. Losses on some of these loans would be eligible for partial reimbursement from the Government of Canada. |
15. Borrowings
The following tables present the contractual maturity profile and average yield of borrowings based on carrying value.
| Year of maturity | ||||||||||||||||||||||||||||||||
(in millions) | 2024 | 2025 | 2026 | 2027 | 2028 | 2029 and thereafter | Total 2023 | Total 2022 | ||||||||||||||||||||||||
Designated at FVTPL | ||||||||||||||||||||||||||||||||
Borrowings from the Government of Canada – Lending programs | 77 | 122 | 20 | - | - | - | 219 | 374 | ||||||||||||||||||||||||
Yield1 | 2.3% | 1.6% | 1.3% | - | - | - | 1.8% | 2.0% | ||||||||||||||||||||||||
Borrowings at amortized cost | ||||||||||||||||||||||||||||||||
Canada mortgage bonds | 37,352 | 40,874 | 32,376 | 31,747 | 39,073 | 72,967 | 254,389 | 254,897 | ||||||||||||||||||||||||
Borrowings from the Government of Canada – Lending programs | 1,784 | 674 | 606 | 537 | 668 | 13,233 | 17,502 | 15,424 | ||||||||||||||||||||||||
Borrowings from the Government of Canada – IMPP | 2,512 | 354 | - | - | - | - | 2,866 | 3,449 | ||||||||||||||||||||||||
Total borrowings at amortized cost | 41,648 | 41,902 | 32,982 | 32,284 | 39,741 | 86,200 | 274,757 | 273,770 | ||||||||||||||||||||||||
Yield1 | 3.2% | 2.3% | 2.1% | 3.4% | 3.6% | 2.6% | 2.8% | 2.5% | ||||||||||||||||||||||||
Total | 41,725 | 42,024 | 33,002 | 32,284 | 39,741 | 86,200 | 274,976 | 274,144 | ||||||||||||||||||||||||
| 1 | Represents the weighted-average yield, determined by applying the weighted-average effective yields of individual fixed rate borrowings and the weighted-average yields-to-reset of floating rate borrowings. |
| 2023 Annual Report | 116 |
Borrowings – designated at fair value through profit or loss
Included in this category are medium-term borrowings from the Government taken to fund certain Assisted Housing Activity loans originated prior to August 2016. Medium-term debt includes fixed rate notes, with an original term to maturity ranging from two to ten years.
The carrying amount at 31 December 2023 of borrowings – designated at FVTPL is $7 million lower (2022 – $14 million lower) than the contractual amount due at maturity. Our liabilities are backed by the credit of the Government and there is no significant change in value that can be attributed to changes in credit risk.
Borrowings – amortized cost
This category includes borrowings under the CMB program and under the IMPP, as well as short- and medium-term borrowings from the Government taken to fund certain Assisted Housing Activity loans, including all those originated after July 2016. Short-term debt, having an original term to maturity less than 365 days, was $939 million at 31 December 2023 (2022 – $395 million). Medium-term debt includes fixed rate notes, with an original term to maturity ranging from two to ten years. The following table presents the cash flows and non-cash changes for borrowings.
| Cash flows | Non-cash changes | |||||||||||||||||||||||||||
(in millions) | Balance at beginning of year | Issuances | Repayments | Fair value changes | Accretion and other | Eliminations | Balance at end of year | |||||||||||||||||||||
2023 | ||||||||||||||||||||||||||||
Designated at FVTPL | ||||||||||||||||||||||||||||
Borrowings from the Government of Canada – Lending programs | 374 | - | (162) | 7 | - | - | 219 | |||||||||||||||||||||
Borrowings at amortized cost | ||||||||||||||||||||||||||||
Canada mortgage bonds | 254,897 | 45,204 | (45,727) | - | 42 | (27) | 254,389 | |||||||||||||||||||||
Borrowings from the Government of Canada – Lending programs | 15,424 | 13,831 | (11,755) | (80) | 82 | - | 17,502 | |||||||||||||||||||||
Borrowings from the Government of Canada – IMPP | 3,449 | - | (583) | - | - | - | 2,866 | |||||||||||||||||||||
Total borrowings at amortized cost | 273,770 | 59,035 | (58,065) | (80) | 124 | (27) | 274,757 | |||||||||||||||||||||
Total | 274,144 | 59,035 | (58,227) | (73) | 124 | (27) | 274,976 | |||||||||||||||||||||
2022 | ||||||||||||||||||||||||||||
Designated at FVTPL | ||||||||||||||||||||||||||||
Borrowings from the Government of Canada – Lending programs | 475 | - | (80) | (21) | - | - | 374 | |||||||||||||||||||||
Borrowings at amortized cost | ||||||||||||||||||||||||||||
Canada mortgage bonds | 259,714 | 40,081 | (44,520) | - | 45 | (423) | 254,897 | |||||||||||||||||||||
Borrowings from the Government of Canada – Lending programs | 11,921 | 13,794 | (10,168) | (175) | 52 | - | 15,424 | |||||||||||||||||||||
Borrowings from the Government of Canada – IMPP | 4,234 | - | (785) | - | - | - | 3,449 | |||||||||||||||||||||
Total borrowings at amortized cost | 275,869 | 53,875 | (55,473) | (175) | 97 | (423) | 273,770 | |||||||||||||||||||||
Total | 276,344 | 53,875 | (55,553) | (196) | 97 | (423) | 274,144 | |||||||||||||||||||||
| 2023 Annual Report | 117 |
When we hold CMB to maturity or acquire CMB in the primary market, we exclude the related cash flows from the consolidated statement of cash flows. During the year ended 31 December 2023, we have excluded $313 million (2022 – $328 million) of CMB maturities from repayments in the previous table and from investment securities – sales and maturities in the consolidated statement of cash flows. We have also excluded $21 million (2022 – $38 million) of CMB purchases in the primary market from issuances in the previous table and from investment securities – purchases in the consolidated statement of cash flows.
Borrowing authorities
The Minister of Finance approves our Borrowing Plan annually and establishes limits and parameters for borrowings, namely capital market borrowings and borrowings from the Government in the Assisted Housing and Mortgage Funding Activities.
For 2023, the limits on our short-term borrowings outstanding and long-term borrowings issued are $6.5 billion and $6.5 billion, respectively (2022 - $6 billion and $6.5 billion). Actual short-term borrowings outstanding as at 31 December 2023, and long-term borrowings issued in 2023 were $939 million and $2.4 billion, respectively (2022– $395 million and $4.5 billion).
The legislative authority, which is separate from the limits and does not apply to borrowings of CHT, requires that the total indebtedness outstanding at any time, other than to the Government, not exceed $15 billion (2022 – $20 billion). The outstanding principal balance of this indebtedness was nil as at 31 December 2023 (2022 – nil).
16. Derivatives
Derivatives are financial contracts whose value is derived from movements in one or more underlying securities, rates, indices or other instruments. We use derivatives in conjunction with our risk management activities.
Interest rate swaps are transactions in which two parties exchange interest cash flows on a specified notional amount for a predetermined period based on agreed-upon fixed and floating rates. Notional amounts are not exchanged. The value of these swaps is derived from movements in interest rates. We use them to manage either reinvestment risk or mismatches in the timing of receipts from assets versus payments of liabilities.
Foreign currency forward contracts are over-the-counter contracts in which two parties agree to exchange one currency for another at a specified price for settlement at a future predetermined date. The value of these contracts is derived from movements in foreign exchange and interest rates. We use them to manage currency risk associated with U.S. dollar-denominated debt securities.
FTHBI loan derivatives result from the recognition of a payable to, or receivable from, the Government of Canada when there are underlying loan gains or losses. Upon loan settlement, we will either pay loan gains to, or recover loan losses from, the Government. The value of these derivatives is derived from movement in the fair value of the underlying home values, which affects the fair value of the loans.
| 2023 Annual Report | 118 |
The following table provides the notional amounts of the derivative transactions recognized in the consolidated financial statements. Notional amounts, which are off-balance sheet, serve as a point of reference for calculating payments and do not represent the fair value, or the potential gain or loss associated with the credit or market risk of such instruments.
| 2023 | 2022 | |||||||||||||||||||||||||||||||
| Average term to maturity | Notional amount | Fair value | Average term to maturity | Notional amount | Fair value | |||||||||||||||||||||||||||
(in millions) | Asset | Liability | Asset | Liability | ||||||||||||||||||||||||||||
Interest rate swaps | 1 year | 397 | - | 4 | 2 years | 667 | - | 7 | ||||||||||||||||||||||||
Foreign currency forward contracts | | Within 1 year | | 4,329 | 161 | 4 | | Within 1 year | | 4,094 | - | 46 | ||||||||||||||||||||
First Time Home Buyer loan derivative | 23 years | 428 | - | 47 | 23 years | 330 | - | 34 | ||||||||||||||||||||||||
Total | 5,154 | 161 | 55 | 5,091 | - | 87 | ||||||||||||||||||||||||||
Credit exposure of derivatives
The following table presents the credit exposure of derivatives by term to maturity. The replacement value is the total current fair value including accrued interest of all outstanding contracts with a positive fair value, after factoring in the impact of master netting agreements. The replacement value represents our maximum derivative credit exposure. Potential future credit exposure represents an estimate of the potential change in the market value of the transaction up to maturity which is calculated in relation to the notional principal of the contracts by applying factors consistent with guidelines issued by OSFI.
Credit risk equivalent is the total of the replacement value and the potential future credit exposure. The risk weighted equivalent is determined by applying a standard OSFI defined measure of counterparty credit risk to the credit equivalent amount.
| Replacement value | 2023 | 2022 | ||||||||||||||||||||||||||||||
(in millions) | Within 1 year | 1 to 5 years | Over 5 years | Potential future credit exposure | Credit risk | Risk- weighted equivalent | Credit risk | Risk- weighted equivalent | ||||||||||||||||||||||||
Derivatives | 161 | - | - | 44 | 205 | 41 | 17 | 3 | ||||||||||||||||||||||||
The fair value of the collateral we hold related to our derivatives as at 31 December 2023 was nil (2022 – nil).
| 2023 Annual Report | 119 |
17. Financial Instruments Income and Expenses
Interest income, investment income and interest expense
The following table outlines the total interest income and expense for financial instruments and the investment income recognized in the consolidated statement of income and comprehensive income.
| 2023 | 2022 | |||||||||||||||||||||||
(in millions) | Interest Income | Investment Income | Interest Expense | Interest Income | Investment Income | Interest Expense | ||||||||||||||||||
Interest for financial instruments not at FVTPL: | ||||||||||||||||||||||||
Cash equivalents | 81 | 30 | - | 28 | 11 | - | ||||||||||||||||||
Debt instruments – FVOCI | - | 522 | - | - | 372 | - | ||||||||||||||||||
Debt instruments – amortized cost | 84 | - | - | 44 | - | - | ||||||||||||||||||
Loans – amortized cost | 6,876 | - | - | 5,305 | - | - | ||||||||||||||||||
Securities purchased under resale agreements | 28 | - | - | 8 | - | - | ||||||||||||||||||
Borrowings – amortized cost | - | - | 6,954 | - | - | 5,366 | ||||||||||||||||||
Total interest for financial instruments not at FVTPL | 7,069 | 552 | 6,954 | 5,385 | 383 | 5,366 | ||||||||||||||||||
Interest for financial instruments at FVTPL: | ||||||||||||||||||||||||
Debt instruments | 12 | - | - | 6 | - | - | ||||||||||||||||||
Loans | 1 | - | - | 2 | - | - | ||||||||||||||||||
Borrowings | - | - | 7 | - | - | 9 | ||||||||||||||||||
Derivatives | (5) | - | - | 2 | - | - | ||||||||||||||||||
Total interest for financial instruments at FVTPL | 8 | - | 7 | 10 | - | 9 | ||||||||||||||||||
Total Interest | 7,077 | 552 | 6,961 | 5,395 | 383 | 5,375 | ||||||||||||||||||
Dividend income | - | 1 | - | - | 5 | - | ||||||||||||||||||
Total | 7,077 | 553 | 6,961 | 5,395 | 388 | 5,375 | ||||||||||||||||||
| 2023 Annual Report | 120 |
Net gains (losses) on financial instruments
The following table presents the net gains (losses) on financial instruments recognized in the consolidated statement of income and comprehensive income.
(in millions) | 2023 | 2022 (restated) | ||||||
Financial instruments designated at FVTPL | ||||||||
Loans | 2 | (5) | ||||||
Borrowings | (7) | 21 | ||||||
Total financial instruments designated at FVTPL | (5) | 16 | ||||||
Financial instruments mandatorily at FVTPL | ||||||||
Equity securities | - | 1 | ||||||
Derivatives | 80 | (321) | ||||||
Loans | 16 | 1 | ||||||
Total financial instruments mandatorily at FVTPL | 96 | (319) | ||||||
Debt instruments held at FVOCI1 | (231) | 198 | ||||||
Loans amortized cost2 | (150) | (31) | ||||||
Borrowings – amortized cost | 80 | 175 | ||||||
Expected credit recoveries (losses) on financial assets3 | (2) | 4 | ||||||
Total | (212) | 43 | ||||||
| 1 | Includes foreign exchange loss of $119 million (2022 – gains of $324 million) resulting from translation of U.S. dollar-denominated debt instruments. |
| 2 | Includes losses on loans recognized immediately upon initial advance of $109 million (2022 – $3 million) and the amortization of deferred net losses of $41 million (2022 – $28 million). |
| 3 | Includes a release of ECL on MI Activity loans and MI loan commitments at amortized cost of $17 million (2022 – restated to include $15 million, previously presented in insurance claims expense). |
| 2023 Annual Report | 121 |
Deferred net losses on financial instruments
The following table presents the deferred net losses on financial instruments for certain Lending program loans not recognized in the consolidated statement of income and comprehensive income.
(in millions) | 2023 | 2022 | ||||||
Balance at beginning of the year | 263 | 161 | ||||||
Deferred net losses on financial instruments in the year | 211 | 130 | ||||||
Recognized net losses on financial instruments in the year | (41) | (28) | ||||||
Balance at end of year | 433 | 263 | ||||||
18. Market Risk
Market risk is the risk of adverse financial impacts arising from changes in underlying market factors, including interest rates and foreign exchange rates. Despite changes in economic and market conditions, there were no material changes to our assessment and management of market risk in the year ended 31 December 2023.
Interest rate risk
Interest rate risk is the risk that the fair value or future cash flows of a financial instrument or insurance contract held will fluctuate because of changes in market interest rates.
The investment portfolios for the Mortgage Insurance and Mortgage Funding Activities are managed in accordance with their Strategic Asset Allocation (SAA), which limits interest rate risk relative to internal limits and benchmarks.
There is no direct contractual relationship between our financial assets and our insurance contracts. However, we manage net interest rate risk by maintaining an appropriate mix of financial assets which would support the insurance contract liabilities in an economic stress scenario.
The Assisted Housing Activity is exposed to interest rate risk when asset and liability principal and interest cash flows have different payment, repricing or maturity dates. Some of our loans contain prepayment and/or repricing options, however our interest rate risk remains minimal in these instances as we have the right to prepay our borrowings from the Government of Canada totaling $17,721 million (2022 – $15,798 million) with minimal penalty, at any time.
We manage interest rate risk in the Assisted Housing Activity’s lending programs differently depending on the cash flow characteristics of the program’s loans and when the loans were originated. The interest rate risk is managed in each of the lending programs, as described below.
For certain DL loans originated prior to August 2016 and having a gross carrying amount of $54 million at 31 December 2023 (2022 – $112 million), we use derivatives to manage reinvestment and refinancing risks as well as mismatches in the timing of cash flows between the loans, reinvested principal receipts and borrowings. For DL loans originated after July 2016 and having a gross carrying amount of $2,020 million as at 31 December 2023 (2022 – $2,170 million), we use an asset/liability matching strategy on a portfolio basis whereby we structure our borrowings matching the future obligations to the cash flows to be received on the loans. Under this matching strategy, we do not use derivatives and the term over which we must reinvest principal receipts is significantly reduced. Cumulative cash flow mismatches are limited by policy to $30 million (2022- $30 million).
| 2023 Annual Report | 122 |
For the MILP, closed to new loans since 2011, we manage interest rate risk through matching the present value of cash flows of the program’s assets and liabilities. Loans in this program had a gross carrying amount of $534 million at 31 December 2023 (2022 – $636 million).
For the ACLP and AHF programs which have longer-term expected draw schedules, we manage the uncertainty of the timing of loan cash flows and of investment returns earned on borrowed funds by building these factors into our loan pricing. The gross carrying amount of loans in these programs was $8,742 million at 31 December 2023 (2022 – $6,070 million).
For the FTHBI and CGHL programs, which are non-interest bearing loans, we manage interest rate risks through the receipt of government funding for interest costs. Loans under these programs had a gross carrying amount of $938 million at 31 December 2023 (2022 – $351 million).
Interest rate risk on other Assisted Housing Activity loans of $844 million at 31 December 2023 (2022 – $944 million) is managed primarily through the maintenance of a reserve fund pursuant to Section 29 of the CMHC Act.
For loans under the CMB program, we enter into swap agreements with approved financial institution counterparties to manage interest rate risk and prepayment/reinvestment risk, as principal on the liabilities is due at maturity and reinvested. We pay all interest received from the underlying NHA MBS and reinvestment assets to the swap counterparties in exchange for an amount equal to the CMB coupon payments. For loans under the IMPP, we enter into swap agreements to manage interest rate and prepayment risk, as principal on the liabilities is due over time. We pay the effective interest received on the underlying NHA MBS less administration costs to the swap counterparties in exchange for an amount equal to the interest owed on borrowings from the Government of Canada. As a result of these swap agreements, these risks related to the CMB program and IMPP have no net impact on the consolidated statement of income and comprehensive income.
Currency risk
Currency risk is the risk that the fair value or future cash flows of a financial instrument will fluctuate because of changes in foreign exchange rates. We are exposed to currency risk from our holdings of foreign currency denominated investment securities. Our internal policies limit the amount of foreign currency investments and require full hedging of currency risk. We held $4,116 million in FVOCI debt securities denominated in U.S. dollars as at 31 December 2023 (2022 – $4,047 million) and $11 million in FVTPL debt securities denominated in U.S. dollars as at 31 December 2023 (2022 – $13 million).
Our strategy to fully hedge currency risk is to continuously enter into a series of short-term foreign currency forward contracts that have terms up to one year. Under these contracts, we exchange U.S. dollars for Canadian dollars at an exchange rate fixed at the outset of the contract for settlement at a future predetermined date. Given the short-term nature of the forward contracts, full hedging of currency risk over the life of the foreign-denominated debt securities will require continued application of our strategy in the future. The exposures presented in the Value at Risk (VaR) table in the next section reflect the mitigating effect of the derivative contracts. Currency risk was assessed as immaterial as at 31 December 2023 (2022 – immaterial) after accounting for derivatives.
| 2023 Annual Report | 123 |
Sensitivity analyses
Value at risk
We evaluate market risk for investment securities in the Mortgage Insurance and Mortgage Funding Activities through the use of VaR models. VaR is a statistical technique used to measure the maximum potential loss of an investment portfolio over a specified holding period with a given level of confidence. The VaR for the Mortgage Insurance and Mortgage Funding Activities as at 31 December, calculated with 95% confidence over a 22 business day holding period, is outlined in the following table. VaR is presented separately for individual market risk factors and for the total portfolio. The effect of diversification results from the fact that market risks are not perfectly correlated and, consequently, there is a benefit from investment diversification. The VaR figures are based on one year of historical prices and correlations of bond and equity markets and 26 weeks of volatility.
| Mortgage Insurance | Mortgage Funding | |||||||||||||||
(in millions) | 2023 | 2022 | 2023 | 2022 | ||||||||||||
Investment securities: | ||||||||||||||||
Interest rate risk on debt instruments | - | - | - | - | ||||||||||||
CAD-denominated securities | 187 | 199 | 78 | 66 | ||||||||||||
USD-denominated securities | 86 | 83 | - | - | ||||||||||||
Effect of diversification | (1) | (8) | - | - | ||||||||||||
Total VaR | 272 | 274 | 78 | 66 | ||||||||||||
Interest rate risk on insurance contracts – Mortgage Insurance
The following table presents the Mortgage Insurance Activity’s exposure to interest rate risk for our insurance contracts. The percentage change in the discount rate is applied to derive the possible impact on other comprehensive income before income taxes and equity of Canada with all other assumptions held constant.
Change indicator | Impact on other comprehensive income before income taxes | Impact on equity of Canada | ||||||||||||||||||||||
(in millions) | Change in assumptions |
2023 | 2022 | 2023 | 2022 | |||||||||||||||||||
Discount rate | Relative | +1% | 137 | 103 | 103 | 77 | ||||||||||||||||||
| Relative | -1% | (158) | (117) | (119) | (88) | |||||||||||||||||||
Interest rate sensitivity – Assisted Housing
We evaluate market risk for the Assisted Housing Activity portfolio of loans, investments, borrowings and swaps by measuring their sensitivity to changes in interest rates.
For the Assisted Housing Activity’s financial instruments designated at FVTPL and derivatives, we assessed the impact of a 200 bps shift in interest rates as immaterial as at 31 December 2023 after accounting for derivatives.
| 2023 Annual Report | 124 |
The Assisted Housing Activity’s investments, loans and borrowings measured at amortized cost are also exposed to interest rate risk. The net impact of a shift in interest rates on their fair value is presented in the following table.
| 2023 | 2022 | |||||||||||||||
| Interest rate shift | Interest rate shift | |||||||||||||||
(in millions) | -200 bps | +200 bps | -200 bps | +200 bps | ||||||||||||
Increase (decrease) in fair value of net assets1 | (694) | 572 | (774) | 631 | ||||||||||||
| 1 | The changes in fair value of net assets resulting from interest rate shifts presented in this table would not be recognized in comprehensive income as the underlying financial instruments are measured at amortized cost. |
19. Credit Risk
Credit risk is the potential for financial loss arising from failure of a borrower or an institutional counterparty to fulfill its contractual obligations. We are exposed to credit risk from various sources including borrower default through mortgage insurance contracts and institutional counterparty credit risk arising from financial guarantees under the NHA MBS and CMB programs, lending arrangements, fixed income investments and derivative transactions. There has been no significant change in the nature of risks and how we manage them in the year ended 31 December 2023.
A detailed breakdown of credit risk is presented in the following section.
Maximum exposure to credit risk
(in billions) | 2023 | 2022 | ||||||
Mortgage insurance: insurance-in-force (Note 7) | 414 | 399 | ||||||
TPGs: guarantees-in-force (Note 8)1 | 508 | 471 | ||||||
| 1 | Includes underlying instruments which are also insured by CMHC included in insurance-in-force. |
For all financial assets other than guarantees or derivatives, the maximum exposure to credit risk is the carrying amount. For derivatives, the maximum exposure to credit risk is indicated in Note 16.
Credit risk associated with mortgage insurance is managed through prudent product design, underwriting and default management practices, and the establishment of adequate capital reserves as described in Notes 7 and 10.
Credit risk associated with TPGs is managed through due diligence in approving NHA MBS Issuers, ongoing monitoring of Issuer credit quality and program compliance, and the requirement that all mortgages supporting the NHA MBS be insured against borrower default. We have further mitigated this risk by having been assigned all rights, title and interest in the underlying mortgages so that we have access to principal and interest payments in the event of issuer default.
Credit risk associated with loans in the Assisted Housing Activity is in part mitigated through measures that include loan guarantees from other government entities as described in Note 14. We are assured collection of principal and accrued interest on 99% of our loans.
Under the CMB program, and the IMPP, loans represent amounts due from Canadian financial institutions as a result of the sale of their beneficial interest in NHA MBS securities to us. The loans are collateralized by the NHA MBS and associated reinvestment securities under the CMB program only, acquired in the transactions. The collateral, which is rated R-1 (high) or AAA by at least two rating agencies, is held in our name and represents the sole source of principal repayments for the loans.
| 2023 Annual Report | 125 |
Under the CMB program and the IMPP, we are exposed to credit-related counterparty risk in the event of default of swap counterparties. This risk is mitigated by transacting with highly rated swap counterparties and collateralization requirements based on credit ratings. All swap counterparties must have a minimum credit rating of BBB+ (high) (CMB program), or A- (IMPP), or their equivalents, by at least two rating agencies.
The fair value of total loan collateral held under the CMB program was $250,488 million, 98.2% of loan carrying value, as at 31 December 2023 (2022 – $246,797 million, 96.4% of loan carrying value).
The fair value of total loan collateral held under the IMPP was $2,785 million, 97.2% of loan carrying value, as at 31 December 2023 (2022 – $3,281 million, 95.1% of loan carrying value).
We manage credit risk associated with fixed income investments and derivatives through policies which include minimum counterparty credit ratings and investment portfolio diversification limits by issuer, credit rating, term and by industry sector, and through legal agreements and collateralization requirements for derivatives.
Concentration risk
Concentration risk arises from holdings of financial instruments issued by entities that operate in the same sector or geographic area or engage in similar activities such that they may be affected similarly by changes in economic or other conditions.
The following table presents the concentration of credit risk by sector and geographic region of our investment securities and derivative transactions:
(in millions) | 2023 | 2022 | ||||||||||||||
By sector1: | ||||||||||||||||
Federal | 10,655 | 41.9% | 8,731 | 36.1% | ||||||||||||
Provincial | 4,288 | 16.8% | 4,553 | 18.8% | ||||||||||||
Financial | 4,253 | 16.7% | 4,555 | 18.8% | ||||||||||||
Supranationals | 1,328 | 5.2% | 1,322 | 5.5% | ||||||||||||
Energy and Utilities | 1,123 | 4.4% | 1,008 | 4.2% | ||||||||||||
Industrial | 1,077 | 4.2% | 963 | 4.0% | ||||||||||||
Real estate | 575 | 2.3% | 502 | 2.1% | ||||||||||||
Consumer goods | 510 | 2.0% | 574 | 2.4% | ||||||||||||
Communications | 494 | 1.9% | 519 | 2.1% | ||||||||||||
Technology | 475 | 1.9% | 548 | 2.3% | ||||||||||||
Other | 676 | 2.7% | 901 | 3.7% | ||||||||||||
Total2 | 25,454 | 100.0% | 24,176 | 100.0% | ||||||||||||
By geographic region: | ||||||||||||||||
Canada | 18,204 | 71.6% | 17,169 | 71.0% | ||||||||||||
U.S. | 4,874 | 19.1% | 4,516 | 18.7% | ||||||||||||
Europe | 1,117 | 4.4% | 1,212 | 5.0% | ||||||||||||
Asia and Pacific | 797 | 3.1% | 793 | 3.3% | ||||||||||||
Other | 462 | 1.8% | 486 | 2.0% | ||||||||||||
Total2 | 25,454 | 100.0% | 24,176 | 100.0% | ||||||||||||
| 1 | In 2023, real estate has been disaggregated from ‘other’ and the 2022 comparative has been adjusted accordingly. |
| 2 | Total comprised of cash equivalents of $1,833 million (2022 – $2,422 million), investment securities of $23,460 million (2022 – $21,754 million) and derivatives with a positive fair value, net of collateral, of $161 million (2022 – nil). |
| 2023 Annual Report | 126 |
Credit quality
The following table presents the credit quality of our cash equivalents and investment securities based on our internal credit rating system. Amounts in the table represent gross carrying amounts.
| Credit Rating1 | ||||||||||||||||||||||||||||||||||||||||||||
| 2023 | 2022 | |||||||||||||||||||||||||||||||||||||||||||
(in millions) | AAA | AA- to AA+ | A- to A+ | BBB- to BBB+ | Lower than BBB- | Total | AAA | AA- to AA+ | A-to A+ | BBB- to BBB+ | Lower than BBB- | Total | ||||||||||||||||||||||||||||||||
Cash equivalents | 686 | 303 | 844 | - | - | 1,833 | 445 | 571 | 1,406 | - | - | 2,422 | ||||||||||||||||||||||||||||||||
Investment securities2 | ||||||||||||||||||||||||||||||||||||||||||||
FVTPL | 18 | - | - | - | - | 18 | 22 | 33 | - | - | - | 55 | ||||||||||||||||||||||||||||||||
FVOCI | 10,199 | 3,708 | 3,765 | 2,421 | 69 | 20,162 | 7,972 | 3,962 | 3,801 | 2,238 | 70 | 18,043 | ||||||||||||||||||||||||||||||||
Amortized cost | 1,524 | 1,399 | 306 | - | - | 3,229 | 1,410 | 1,664 | 504 | - | - | 3,578 | ||||||||||||||||||||||||||||||||
| 1 | The internal credit ratings are based upon internal assessments of the counterparty creditworthiness. These ratings correspond to those provided by the credit rating agencies except in cases where stand-alone ratings exist. A counterparty internal credit rating cannot be higher than the highest stand-alone rating from any of the agencies. A stand-alone rating removes the assumption of government support from the rating. |
| 2 | Includes fixed income investments. |
Derivatives
We limit the credit risk associated with interest rate swaps and foreign currency forward contracts by dealing with counterparties whose credit ratings are in accordance with our Enterprise Risk Management Policies; through the use of International Swaps Derivatives Association (ISDA) master agreements for derivatives; and, where appropriate, through the use of ratings-based collateral thresholds in the Credit Support Annexes (CSA).
ISDA is a master agreement that sets out standard terms that apply to all transactions we entered with the counterparty. The ISDA outlines procedures and calculations of termination costs in the event of default by either party. The ISDA master agreements give us a legally enforceable right to settle all transactions covered by the agreement with the same counterparty on a net basis in the event of default. All derivative counterparties must have a minimum credit rating of A-, or its equivalent, from at least two rating agencies.
The CSA document, included in the ISDA master agreements, regulates the collateral requirements of derivative transactions and the terms under which collateral is transferred to mitigate credit risk. The CSA gives us the right, in the event of default, to liquidate collateral held and apply proceeds received from liquidation against amounts due from the counterparty. Collateral held to offset mark-to-market exposures is not used for any other purpose than to offset such exposure.
Securities purchased under resale agreements
By their nature, these balances have low credit risk given their short terms and are secured by the underlying securities purchased under the agreements and any incremental margin obtained from counterparties.
These transactions are subject to Global Master Repurchase Agreements which set out the standard terms of all repurchase agreements transacted with each counterparty. These agreements give us a legally enforceable right to settle all repurchase transactions with the same counterparty on a net basis in the event of default. These agreements also provide for the posting of margin by the counterparty when our exposure to that entity exceeds a certain ratings-based threshold. Securities held as eligible margin include debt obligations issued by or guaranteed by the Government, including Crown corporations and CHT. Margin securities should not be used for any other purpose than to offset such exposure. In the event of counterparty default, we have the right to liquidate these securities. We held $6 million in margin securities at 31 December 2023 (2022 – nil).
| 2023 Annual Report | 127 |
Netting arrangements and offsetting of financial assets and financial liabilities
The following tables present the potential effects of the netting arrangements described previously.
Financial assets
| (i) | (ii) | (iii) = (i) - (ii) | (iv) | (v) = (iii) - (iv) | ||||||||||||||||||||
| Gross amount of recognized assets | Gross offset in the | Net amount of assets presented in the consolidated balance sheet1 | Gross amount not offset in the consolidated balance sheet | Net amount4 | ||||||||||||||||||||
(in millions) | Financial instruments2 | Financial received3 | ||||||||||||||||||||||
2023 | ||||||||||||||||||||||||
Derivatives1 | 162 | - | 162 | (5) | - | 157 | ||||||||||||||||||
Securities purchased under resale agreements1 | 700 | - | 700 | - | (707) | - | ||||||||||||||||||
Total | 862 | - | 862 | (5) | (707) | 157 | ||||||||||||||||||
2022 | ||||||||||||||||||||||||
Derivatives1 | 1 | - | 1 | (1) | - | - | ||||||||||||||||||
Securities purchased under resale agreements1 | 650 | - | 650 | - | (644) | 6 | ||||||||||||||||||
Total | 651 | - | 651 | (1) | (644) | 6 | ||||||||||||||||||
| 1 | Derivatives are carried at fair value. Securities purchased under resale agreements are carried at amortized cost. |
| 2 | Gross amounts of financial instruments not offset in the consolidated balance sheet refers to amounts recorded to derivative liabilities and securities sold under repurchase agreements where we have a legally enforceable right to offset against amounts recorded to derivative assets and securities purchased under resale agreements, on a counterparty-by-counterparty basis, in the event of default of the counterparty. |
| 3 | We have the right, in the event of default, to liquidate and apply financial collateral held against amounts due from counterparties. For derivatives, these amounts represent the fair value of collateral posted by swap counterparties to us. For securities purchased under resale agreements, these amounts represent fair value of margin posted by counterparties and of securities we purchased with the commitment to resell to the counterparty at a future date. |
| 4 | We have no exposure to counterparties in our securities purchased under resale agreements. As such we have included a net exposure of nil. |
Derivative assets, as presented in the previous table, are reconciled to the consolidated balance sheet as follows:
(in millions) | 2023 | 2022 | ||||||
Derivative assets presented in offsetting table | 162 | 1 | ||||||
Less: Accrued interest receivable presented separately in consolidated balance sheet | (1) | (1) | ||||||
Derivative asset balance presented in the consolidated balance sheet | 161 | - | ||||||
| 2023 Annual Report | 128 |
Financial liabilities
| (i) | (ii) | (iii) = (i) - (ii) | (iv) | (v) = (iii) - (iv) | ||||||||||||||||||||
| Gross amount of recognized liabilities | Gross offset in the | Net amount of in the consolidated | Gross amount not offset in the consolidated balance sheet | Net amount | ||||||||||||||||||||
(in millions) | Financial instruments2 | Financial collateral pledged3 | ||||||||||||||||||||||
2023 | ||||||||||||||||||||||||
Derivatives1 | 55 | - | 55 | (5) | - | 50 | ||||||||||||||||||
2022 | ||||||||||||||||||||||||
Derivatives1 | 87 | - | 87 | (1) | - | 86 | ||||||||||||||||||
| 1 | Derivatives are carried at fair value. |
| 2 | Gross amounts of financial instruments not offset in the consolidated balance sheet refers to amounts recorded to derivative assets and securities purchased under resale agreements where we have a legally enforceable right to offset against amounts recorded to derivative liabilities and securities sold under repurchase agreements, on a counterparty-by-counterparty basis, in the event of default of the counterparty. |
| 3 | Represents the fair value of securities we sold to counterparties with our commitment to repurchase from the counterparty at a future date, net of the fair value of any margin posted by our counterparties. |
20. Liquidity Risk
Liquidity risk is the risk that we will encounter difficulty in meeting obligations associated with financial liabilities. Liquidity risk comprises both funding liquidity risk, which is the risk that we will be unable to meet our payment obligations when required due to an inability to borrow or realize on overdraft facilities, and market liquidity risk, which is the risk that we are not able to unwind or offset a particular position without incurring losses because of inadequate market depth or market disruption.
The principal financial obligations exposing us to liquidity risk include, but are not limited to:
| • | the payment of claims incurred by the Mortgage Insurance Activity; |
| • | the need to fulfill the TPGs we have issued if sufficient funds are not available for the payment of principal or interest on NHA MBS or CMB by Approved Issuers or CHT, respectively; and |
| • | payments required by borrowings and derivatives. |
We have a liquidity risk policy which includes appropriate limits and other mitigants to ensure sufficient resources to meet current and projected cash requirements.
The Mortgage Insurance and Mortgage Funding Activities’ investment portfolios are managed to ensure that there is sufficient cash flow to meet projected claims. Sources of liquidity include: fees, premiums, investment income and proceeds from sales and maturities of investments.
Within the NHA MBS and CMB programs, liquidity risk refers to the risk that we may not be able to provide the funding required, in a timely fashion, to satisfy a call on our TPG obligations. As guarantor, we are exposed to the risk of NHA MBS issuer default, CMB program repo and swap counterparty default, impairment of eligible CMB program collateral securities and system or other operational failures. With respect to our TPGs, our policy is to maintain sufficient liquidity to cover the largest exposure to a single counterparty on a given payment date. Cash, the sale of short-term investments, and the sale of investment securities with the commitment to repurchase the securities are liquidity sources that could be utilized to satisfy a call on the TPGs. Additional liquidity sources in the event of an immediate need to fulfill the TPGs include overdraft facilities and a $350 million (2022 – $350 million) line of credit with the Central Paying Agent. The Central Paying Agent acts on CHT’s behalf to carry out certain payment functions in the CMB program, including collection of monthly payments on NHA MBS purchased and administration and reporting of cash flows. Other policies in place to mitigate liquidity risk include ensuring high credit quality investments as permitted by the CHT trust agreements and swap counterparties and the establishment of maturity monitoring guidelines.
| 2023 Annual Report | 129 |
The Assisted Housing Activity investment portfolio is managed to ensure that there is sufficient cash flow to meet funding needs in case of contingencies causing operational disruptions, unanticipated needs, and to facilitate use of the CBP. As described in Note 18, for our DL loan portfolios, we either use derivatives to manage mismatches in the timing of cash flows or our asset/liability management strategy to match our future cash inflows with future obligations. Further sources of liquidity associated with our Assisted Housing Activity include overdraft facilities and cash and short-term investments in marketable securities. For any additional liquidity requirements, we can access the CBP upon Department of Finance approval as per our borrowing authorities as disclosed in Note 15.
At 31 December 2023, we had $300 million (2022 – $300 million) of overnight overdraft facilities available with our banker, under which we had been drawn $4 million (2022 – nil).
We also mitigate liquidity risk through the use of ISDA master netting agreements that reduce the amount of cash required to satisfy derivative obligations.
Maturity analysis
The following table presents our undiscounted contractual cash flows payable, including accrued interest, under financial liabilities by remaining contractual maturities; this table therefore cannot be reconciled to the consolidated balance sheet.
(in millions) | Up to 1 year | 1 to 2 years | 2 to 3 years | 3 to 4 years | 4 to 5 years | Over 5 years | Total 2023 | |||||||||||||||||||||
2023 | ||||||||||||||||||||||||||||
Accounts payable and other liabilities1 | 204 | 59 | 12 | 21 | 5 | 11 | 312 | |||||||||||||||||||||
Derivatives | 7 | 1 | - | - | - | 46 | 54 | |||||||||||||||||||||
Insurance contract liabilities | 160 | 169 | 163 | 145 | 119 | 958 | 1,714 | |||||||||||||||||||||
Borrowings – designated at FVTPL | 81 | 130 | 21 | - | - | - | 232 | |||||||||||||||||||||
Borrowings – amortized cost | 48,848 | 47,592 | 38,100 | 36,393 | 42,884 | 94,151 | 307,968 | |||||||||||||||||||||
Total | 49,300 | 47,951 | 38,296 | 36,559 | 43,008 | 95,166 | 310,280 | |||||||||||||||||||||
| 1 | Excludes expected credit losses on loan commitments, repayable loans and employee benefits. |
(in millions) | Up to 1 year | 1 to 2 years | 2 to 3 years | 3 to 4 years | 4 to 5 years | Over 5 years | Total (restated) | |||||||||||||||||||||
2022 | ||||||||||||||||||||||||||||
Accounts payable and other liabilities1 | 372 | 69 | 17 | 8 | 3 | 15 | 484 | |||||||||||||||||||||
Derivatives | 49 | 1 | 1 | - | - | 36 | 87 | |||||||||||||||||||||
Insurance contract liabilities | 168 | 143 | 140 | 127 | 105 | 824 | 1,507 | |||||||||||||||||||||
Borrowings – designated at FVTPL | 168 | 82 | 129 | 21 | - | - | 400 | |||||||||||||||||||||
Borrowings – amortized cost | 53,854 | 47,909 | 43,633 | 36,243 | 34,551 | 84,088 | 300,278 | |||||||||||||||||||||
Total | 54,611 | 48,204 | 43,920 | 36,399 | 34,659 | 84,963 | 302,756 | |||||||||||||||||||||
| 1 | Excludes expected credit losses on loan commitments, repayable loans and employee benefits. |
Commitments related to loans and financial guarantees are disclosed in Note 14 and Note 8 respectively.
| 2023 Annual Report | 130 |
21. Accounts Receivable and Other Assets
The following table presents the composition of accounts receivable and other assets.
(in millions) | 2023 | 2022 (restated) | ||||||
Property and equipment | 150 | 168 | ||||||
Intangible assets | 130 | 135 | ||||||
Deferred Government of Canada fees | 113 | 109 | ||||||
One-time top-up to the Canada Housing Benefit advances1 | 34 | 263 | ||||||
Non-current assets held for sale | 28 | 37 | ||||||
Accounts receivable and other | 15 | 11 | ||||||
Right-of-use assets | 9 | 12 | ||||||
Total | 479 | 735 | ||||||
| 1 | We made advances to CRA in the amount of $100 million during 2023 (2022 - $400 million). $254 million was advanced to proponents in 2023 (2022 - $137 million) and unused funds totaling $75 million (2022 – nil) was returned to the Government via CMHC. |
22. Investment Property
The following table presents the changes in the investment property balance within our Assisted Housing segment. Disclosures related to the determination of fair value of investment property are included in Note 11.
(in millions) | 2023 | 2022 | ||||||
Balance at beginning of year | 402 | 314 | ||||||
Disposals | (17) | - | ||||||
Net unrealized gains (losses) in net income1 | 13 | 88 | ||||||
Balance at end of year | 398 | 402 | ||||||
| 1 | Included in other income. |
The highest and best use of the investment property held in the Assisted Housing Activity differs from its current use as these investment properties are used to carry out our social housing mandate rather than maximize economic value.
To support affordable housing we may sell the investment properties below their fair value.
| 2023 Annual Report | 131 |
23. Accounts Payable and Other Liabilities
The following table presents the composition of accounts payable and other liabilities.
(in millions) | 2023 | 2022 (restated) | ||||||
Accrued housing programs expenses | 167 | 280 | ||||||
Accounts payable and accrued liabilities | 146 | 174 | ||||||
Affordable Rental Housing Innovation Fund deferred funding | 100 | 105 | ||||||
Other miscellaneous liabilities | 96 | 77 | ||||||
Government of Canada fees | 37 | 33 | ||||||
Self Insured Provision | 16 | 23 | ||||||
Lease liabilities | 11 | 15 | ||||||
Total | 573 | 707 | ||||||
24. Pension and Other Post-Employment Benefits
Defined benefit plans
The defined benefit plans include the defined benefit Pension Plan and Supplemental Plan as well as the OPEB plans.
On 1 January 2018, all eligible members were transferred to a new modified defined benefit pension plan. All pension plan modifications applied to service following the implementation date. All benefits earned by employees under the existing plans prior to the implementation date remained unchanged. Our defined benefit Pension Plan requires contributions to be made to a separately administered fund (Pension Fund) whereas the defined benefit Supplemental Plan and the OPEB are unfunded and we pay the benefits directly.
Pursuant to a trust agreement we entered into with the Pension Fund Trustees (the Trustees), they are responsible for the management and administration of the Pension Fund. There are eight Trustees, including our President, one member of our Board of Directors, three members of Senior Management and three Pension Council members (a combination of current and retired employees). The Trustees set investment policies and objectives within the context of the investment philosophy and Risk Appetite Framework established by the Board of Directors and periodically review these policies. The Pension Fund’s Investment Committee assists the Trustees in the investment management of the defined benefit Pension Plan.
The Pension Fund’s SAA policy is based on the principle of diversification of investments among various asset classes relative to the liabilities of the defined benefit Pension Plan. In 2021, the Board of Directors approved a new asset allocation policy, which we expect to fully adhere to by 2026. The SAA under the new policy is 37% public equity, 29% fixed income, 21% real assets, 5% private equity, 3% private debt and 5% US dollar-denominated emerging market debt, on a net asset basis. The policy includes permissible ranges around these percentage weights. Additionally, the policy allows for the use of a modest level of leverage of 25% of net asset value to purchase fixed income assets to reduce the interest rate risk of the portfolio.
The Pension Fund’s investments are subject to credit, liquidity and market risks. The most significant of these risks is asset volatility due to market conditions. For service accrued before 1 January 2018, benefits are indexed to the Consumer Price Index (CPI) in accordance with the Pension Plan rules. For service accrued after 1 January 2018, indexation of the benefits to the CPI are conditional in accordance with the Pension Plan rules and upon approval from the Board of Directors. As such, liabilities that are adjusted to CPI are subject to interest rate risks, inflation risk and changes in the life expectancy of the plan members. The most significant risk is interest rate risk as the present value of the liabilities is calculated using a discount rate set with reference to Canadian AA-rated corporate bond yields. If the Pension Fund assets underperform this yield, the funded position of the defined benefit Pension Plan decreases. Financial risks are managed primarily through the diversification of assets and prudent investment strategies.
| 2023 Annual Report | 132 |
The actuarial valuation on a going concern basis of our defined benefit component of the Pension Plan reports a surplus as at 31 December 2023. As a result, we are not required to make going concern special payments. The valuation on a solvency basis, which assumes that the plan is wound up at the valuation date, reports a surplus as at 31 December 2023 and we do not expect to make solvency special payments in 2024.
We continue to make full normal contributions and to monitor the defined benefit Pension Plan. The next actuarial valuation will be undertaken at 31 December 2024 with the results reported in the 2024 consolidated financial statements.
The defined benefit obligation relating to the defined benefit plans is funded as follows:
| Pension benefit plans | Other post-employment benefit plans | |||||||||||||||
(in millions) | 2023 | 2022 | 2023 | 2022 | ||||||||||||
Wholly or partially funded | 2,251 | 2,033 | - | - | ||||||||||||
Wholly unfunded | 92 | 87 | 93 | 86 | ||||||||||||
Defined benefit obligation | 2,343 | 2,120 | 93 | 86 | ||||||||||||
Defined benefit pension and other post-employment benefit plans
The following tables present information about the defined benefit plans.
Pension expense included in net income | ||||||||||||||||||||||||||||||||||||
2023 (in millions) | 1 Jan 2023 | Current cost | Interest cost/ | Sub-total in net | Benefits paid | Remeasurements incl. in OCI1 | Employees’ contributions | CMHC’s contributions | 31 Dec | |||||||||||||||||||||||||||
Pension Plan | ||||||||||||||||||||||||||||||||||||
Defined benefit obligation | 2,039 | 32 | 101 | 133 | (104) | 162 | 25 | - | 2,255 | |||||||||||||||||||||||||||
Fair value of plan assets | (2,257) | - | (113) | (113) | 104 | (137) | (25) | (14) | (2,442) | |||||||||||||||||||||||||||
Defined benefit plan (asset) | (218) | 32 | (12) | 20 | - | 25 | - | (14) | (187) | |||||||||||||||||||||||||||
Supplemental Plan | ||||||||||||||||||||||||||||||||||||
Defined benefit obligation | 81 | 1 | 4 | 5 | (6) | 8 | - | - | 88 | |||||||||||||||||||||||||||
Fair value of plan assets | (1) | - | - | - | 6 | - | - | (6) | (1) | |||||||||||||||||||||||||||
Supplemental Plan liability | 80 | 1 | 4 | 5 | - | 8 | - | (6) | 87 | |||||||||||||||||||||||||||
OPEB | ||||||||||||||||||||||||||||||||||||
Defined benefit obligation | 86 | 1 | 4 | 5 | (3) | 5 | - | - | 93 | |||||||||||||||||||||||||||
Fair value of plan assets | - | - | - | - | 3 | - | - | (3) | - | |||||||||||||||||||||||||||
OPEB liability | 86 | 1 | 4 | 5 | - | 5 | - | (3) | 93 | |||||||||||||||||||||||||||
Defined benefit plans liability | 166 | 2 | 8 | 10 | - | 13 | - | (9) | 180 | |||||||||||||||||||||||||||
| 1 | The detailed breakdown of remeasurement gains and losses on defined benefit plans included in OCI is found in the following tables. |
| 2023 Annual Report | 133 |
| Pension expense included in net income | ||||||||||||||||||||||||||||||||||||
2022 | 1 Jan 2022 | Current service cost | Interest cost/ (income) | Sub- total included in net income | Benefits paid | Remeasurements of the net defined benefit plans incl. in OCI1 | Employees’ contributions | CMHC’s contributions | 31 Dec 2022 | |||||||||||||||||||||||||||
Pension Plan | ||||||||||||||||||||||||||||||||||||
Defined benefit obligation | 2,629 | 56 | 77 | 133 | (101) | (647) | 25 | - | 2,039 | |||||||||||||||||||||||||||
Fair value of plan assets | (2,610) | - | (78) | (78) | 101 | 377 | (25) | (22) | (2,257) | |||||||||||||||||||||||||||
Defined benefit plan (asset) | 19 | 56 | (1) | 55 | - | (270) | - | (22) | (218) | |||||||||||||||||||||||||||
Supplemental Plan | ||||||||||||||||||||||||||||||||||||
Defined benefit obligation | 106 | 1 | 3 | 4 | (4) | (25) | - | - | 81 | |||||||||||||||||||||||||||
Fair value of plan assets | (1) | - | - | - | 4 | - | - | (4) | (1) | |||||||||||||||||||||||||||
Supplemental Plan liability | 105 | 1 | 3 | 4 | - | (25) | - | (4) | 80 | |||||||||||||||||||||||||||
OPEB | ||||||||||||||||||||||||||||||||||||
Defined benefit obligation | 126 | 1 | 4 | 5 | (3) | (42) | - | - | 86 | |||||||||||||||||||||||||||
Fair value of plan assets | - | - | - | - | 3 | - | - | (3) | - | |||||||||||||||||||||||||||
OPEB liability | 126 | 1 | 4 | 5 | - | (42) | - | (3) | 86 | |||||||||||||||||||||||||||
Defined benefit plans liability | 231 | 2 | 7 | 9 | - | (67) | - | (7) | 166 | |||||||||||||||||||||||||||
| 1 | The detailed breakdown of remeasurement gains and losses on defined benefit plans included in OCI is found in the following tables. |
| 2023 Annual Report | 134 |
The following table presents further detailed information on the various sources of remeasurement in OCI included in the prior table.
| Remeasurement (gains)/losses included in OCI | ||||||||||||||||||||
(in millions) | Remeasurement of plan assets (excluding interest income) | Actuarial changes arising from changes in demographic assumptions | Actuarial changes arising from assumptions | Actuarial from plan | Total included in OCI | |||||||||||||||
Year ended 31 December 2023 |
| |||||||||||||||||||
Pension Plan | ||||||||||||||||||||
Defined benefit obligation | - | - | 151 | 11 | 162 | |||||||||||||||
Fair value of plan assets | (137) | - | - | - | (137) | |||||||||||||||
Pension benefit plans liability | (137) | - | 151 | 11 | 25 | |||||||||||||||
Supplemental Plan | ||||||||||||||||||||
Defined benefit obligation | - | - | 6 | 2 | 8 | |||||||||||||||
Other post-employment benefit plans | ||||||||||||||||||||
Defined benefit obligation | - | - | 6 | (1) | 5 | |||||||||||||||
| (137) | - | 163 | 12 | 38 | ||||||||||||||||
Year ended 31 December 2022 |
| |||||||||||||||||||
Pension Plan | ||||||||||||||||||||
Defined benefit obligation | - | - | (697) | 50 | (647) | |||||||||||||||
Fair value of plan assets | 377 | - | - | - | 377 | |||||||||||||||
Pension benefit plans liability | 377 | - | (697) | 50 | (270) | |||||||||||||||
Supplemental Plan | ||||||||||||||||||||
Defined benefit obligation | - | - | (29) | 4 | (25) | |||||||||||||||
Other post-employment benefit plans | ||||||||||||||||||||
Defined benefit obligation | - | - | (41) | (1) | (42) | |||||||||||||||
| 377 | - | (767) | 53 | (337) | ||||||||||||||||
The remeasurement of plan assets is the difference between the actual rate of return on the defined benefit pension plan assets and the expected rate of return based on the discount rate used to measure the obligation at the prior year-end. The actual return on plan assets was $250 million (2022 – $299 million loss).
| 2023 Annual Report | 135 |
The following table presents information on the fair value of the plan assets.
| 2023 | 2022 | |||||||||||||||||||||||||||||||
(in millions) | Quoted | Unquoted | Total | % | Quoted | Unquoted | Total | % | ||||||||||||||||||||||||
Cash | 6 | - | 6 | 0.2% | 5 | - | 5 | 0.2% | ||||||||||||||||||||||||
Short-term investments1 | - | 138 | 138 | 5.6% | 115 | 23 | 138 | 6.1% | ||||||||||||||||||||||||
Bonds and debentures | ||||||||||||||||||||||||||||||||
Securities issued or guaranteed by the Government of Canada | 121 | 54 | 175 | 7.2% | 111 | 49 | 160 | 7.1% | ||||||||||||||||||||||||
Provinces/municipalities | 244 | 108 | 352 | 14.4% | 391 | 171 | 562 | 24.9% | ||||||||||||||||||||||||
Equities | ||||||||||||||||||||||||||||||||
Canadian equities | 470 | - | 470 | 19.2% | 451 | - | 451 | 20.0% | ||||||||||||||||||||||||
Foreign equities | 463 | - | 463 | 19.0% | 441 | - | 441 | 19.5% | ||||||||||||||||||||||||
Emerging market debt | 60 | 44 | 104 | 4.3% | 49 | 47 | 96 | 4.3% | ||||||||||||||||||||||||
Private Debt | - | 16 | 16 | 0.7% | - | - | - | 0.0% | ||||||||||||||||||||||||
Infrastructure | - | 177 | 177 | 7.2% | - | 164 | 164 | 7.3% | ||||||||||||||||||||||||
Other real assets | - | 29 | 29 | 1.2% | - | 21 | 21 | 0.9% | ||||||||||||||||||||||||
Real return securities2 | 43 | 234 | 277 | 11.3% | 39 | 211 | 250 | 11.1% | ||||||||||||||||||||||||
Real estate, net of mortgages payable | - | 376 | 376 | 15.4% | - | 353 | 353 | 15.6% | ||||||||||||||||||||||||
Securities sold under repurchase agreements | - | (139) | (139) | (5.7)% | - | (382) | (382) | (16.9)% | ||||||||||||||||||||||||
Other liabilities net of non-investment assets | - | (1) | (1) | 0.0% | - | (1) | (1) | (0.1)% | ||||||||||||||||||||||||
Total | 1,407 | 1,036 | 2,443 | 100.0% | 1,602 | 656 | 2,258 | 100.0% | ||||||||||||||||||||||||
| 1 | Includes $121 million or 5.0% (2022 – $115 million or 5.1%) of investments made in securities issued or guaranteed by related parties. |
| 2 | Includes $272 million or 11.1% (2022 – $247 million or 11.0%) of investments made in securities issued or guaranteed by related parties. |
| 2023 Annual Report | 136 |
Assumptions
The assets and obligation of the defined benefits were measured for accounting purposes as at 31 December 2023 with the following assumptions.
| Pension benefit plans | Other post-employment benefit plans | |||||||||||||||
| 2023 | 2022 | 2023 | 2022 | |||||||||||||
Defined benefit obligation | ||||||||||||||||
Discount rate | 4.6% | 5.1% | 4.6% | 5.1% | ||||||||||||
Rate of compensation increase | 3.3% | 3.3% | 3.3% | 3.3% | ||||||||||||
Inflation rate2 | | 2.6% trending to 2.0% |
| | 3.5% trending to 2.0% |
| | 2.6% trending to 2.0% |
| | 3.5% trending to 2.0% |
| ||||
Benefit costs | ||||||||||||||||
Discount rate | 5.1% | 3.0% | 5.1% | 3.0% | ||||||||||||
Rate of compensation increase | 3.3% | 3.3% | 3.3% | 3.3% | ||||||||||||
Inflation rate | | 3.5% trending to 2.0% |
| 2.0% | | 3.5% trending to 2.0% |
| 2.0% | ||||||||
Assumed medical cost trend | ||||||||||||||||
Initial medical cost trend rate | - | - | 4.8% | 4.8% | ||||||||||||
Medical cost trend rate declines to1 | - | - | 4.0% | 4.0% | ||||||||||||
Year that the rate reaches the ultimate trend rate | - | - | 2040 | 2040 | ||||||||||||
Life expectancy of plan members at age 65 | ||||||||||||||||
Male | | Defined Benefit plan: 24 years | | | Defined Benefit plan: 24 years | | 24 years | 24 years | ||||||||
| | Supplemental Plan: 24 years | | | Supplemental Plan: 24 years | | |||||||||||
Female | | Defined Benefit Plan: 25 years | | | Defined Benefit Plan: 25 years | | 25 years | 25 years | ||||||||
| | Supplemental plan: 26 years | | | Supplemental plan: 26 years | | |||||||||||
| 1 | Average decrease per year of 0.05% (2022 – 0.04%). |
| 2 | 2.6% per year for 2024, and 2.0% per year thereafter (2022 – 3.5% per year for 2023, 2.3% per year for 2024, and 2.0% per year thereafter). |
The discount rates are determined by reference to Canadian AA-rated corporate bonds with terms to maturity approximating the duration of the defined benefit obligation. The weighted average duration of the defined pension benefit obligation is 14 years (2022 – 14 years).
The mortality assumptions used are derived from standard tables published by the Canadian Institute of Actuaries (2014 Public Sector Mortality Table).
| 2023 Annual Report | 137 |
Sensitivity
The following table shows the impact of changes in the assumptions as at 31 December 2023.
(in millions) | Increase (decrease) in defined benefit obligation | Increase (decrease) in net benefit costs recognized in operating expenses in 2024 | ||||||
100 bps increase/decrease in discount rate | (300)/381 | (25)/27 | ||||||
50 bps increase/decrease in rate of compensation increase | 21/(20) | 3/(3) | ||||||
25 bps increase/decrease in inflation rate | 69/(66) | 5/(4) | ||||||
100 bps increase/decrease in health care cost trend rates | 5/(4) | -/- | ||||||
One year increase in life expectancy of plan members | 70 | 4 | ||||||
The sensitivity analyses are based on a change in one assumption while holding all other assumptions constant. In practice, this is unlikely to occur and changes in some of the assumptions might be correlated. The method and types of assumptions used in preparing the sensitivity analyses have not changed from the previous year.
Cash flows
In 2024, we expect to make contributions to the defined benefit plans of approximately $13 million (2023 – $23 million).
25. Income Taxes
The following table presents the components of income tax.
(in millions) | 2023 | 2022 (restated) | ||||||
Current income tax expense | 714 | 518 | ||||||
Deferred income tax relating to origination and reversal of temporary differences | (266) | (32) | ||||||
Total income tax expense included in net income | 448 | 486 | ||||||
Income tax expense (recovery) on other comprehensive income (loss) | ||||||||
Net unrealized gains (losses) from FVOCI financial instruments | 119 | (343) | ||||||
Reclassification of prior years’ net unrealized losses (gains) realized in the year in net income | 40 | (4) | ||||||
Insurance finance income (expense) for insurance contracts issued | (25) | 61 | ||||||
Remeasurement gains (losses) on defined benefits plans | (6) | 55 | ||||||
Total income tax expense (recovery) included in other comprehensive income (loss) | 128 | (231) | ||||||
Total | 576 | 255 | ||||||
The following is a reconciliation of the statutory tax rate to the effective tax rate.
(in millions) | 2023 | 2022 (restated) | ||||||
Income before income taxes | 1,758 | 1,926 | ||||||
Statutory tax rate | 25% | 25% | ||||||
Income taxes computed at statutory tax rate | 440 | 482 | ||||||
Permanent differences | 8 | 4 | ||||||
Income tax expense | 448 | 486 | ||||||
Effective tax rate | 25% | 25% | ||||||
| 2023 Annual Report | 138 |
The statutory tax rate of 25% is comprised of the federal income tax rate of 38% less the general rate reduction of 13%.
The following tables present the tax-effected temporary differences which result in deferred income tax assets and liabilities.
(in millions) | As at 31 2022 (restated) | Change through consolidated net income | Change OCI | Change through retained | As at 31 2023 | |||||||||||||||
Deferred income tax assets | ||||||||||||||||||||
Insurance contract liabilities | 3 | 267 | - | - | 270 | |||||||||||||||
Self insurance | 6 | 25 | - | - | 31 | |||||||||||||||
Net realized losses on borrowings | 18 | (5) | - | - | 13 | |||||||||||||||
Post-employment benefits | (6) | 5 | 6 | - | 5 | |||||||||||||||
Total deferred income tax assets | 21 | 292 | 6 | - | 319 | |||||||||||||||
Deferred income tax liabilities | ||||||||||||||||||||
Additional policy reserve | (173) | - | - | (2) | (175) | |||||||||||||||
Fair value of investment properties | (93) | 3 | - | - | (90) | |||||||||||||||
Fair value of financial instruments | 10 | (34) | (36) | - | (60) | |||||||||||||||
Intangible Assets | (29) | 1 | - | - | (28) | |||||||||||||||
Other | (6) | 4 | - | - | (2) | |||||||||||||||
Total deferred income tax liabilities | (291) | (26) | (36) | (2) | (355) | |||||||||||||||
Net deferred income tax assets (liabilities) | (270) | 266 | (30) | (2) | (36) | |||||||||||||||
(in millions) | As at 1 2022 (restated) | Change through consolidated net income | Change OCI | Change through retained | As at 31 2022 (restated) | |||||||||||||||
Deferred income tax assets | ||||||||||||||||||||
Insurance contract liabilities | (18) | 82 | (61) | - | 3 | |||||||||||||||
Self insurance | 7 | (1) | - | - | 6 | |||||||||||||||
Net realized losses on borrowings | 23 | (5) | - | - | 18 | |||||||||||||||
Fair value of financial instruments | (53) | (21) | 84 | - | 10 | |||||||||||||||
Total deferred income tax assets (liabilities) | (41) | 55 | 23 | - | 37 | |||||||||||||||
Deferred income tax liabilities | ||||||||||||||||||||
Additional policy reserve | (171) | - | - | (2) | (173) | |||||||||||||||
Fair value of investment properties | (71) | (22) | - | - | (93) | |||||||||||||||
Post-employment benefits | 46 | 3 | (55) | - | (6) | |||||||||||||||
Intangible Assets | (26) | (3) | - | - | (29) | |||||||||||||||
Other | (5) | (1) | - | - | (6) | |||||||||||||||
Total deferred income tax liabilities | (227) | (23) | (55) | (2) | (307) | |||||||||||||||
Net deferred income tax assets (liabilities) | (268) | 32 | (32) | (2) | (270) | |||||||||||||||
The deferred income tax assets have been recognized in full as it is probable that taxable profit will be available against which the deductible temporary differences can be utilized.
| 2023 Annual Report | 139 |
26. Related Party Transactions
Our related parties include the Government and its departments, agencies and Crown corporations (in terms of common ownership), key management personnel and their close family members and the Pension Plan.
All material related party transactions and outstanding balances not disclosed elsewhere are disclosed in the following sections.
Transactions or balances between the entities that have been eliminated on consolidation are not reported.
Government of Canada and its departments, agencies and Crown corporations
The following tables summarize income earned and receivable, the total amount invested in instruments issued or guaranteed by the Government and government and related party fees.
(in millions) | 2023 | 2022 (restated) | ||||||
Income earned and receivable | ||||||||
Investment income – cash equivalents | 27 | 10 | ||||||
Investment income – investment securities | 203 | 58 | ||||||
Interest receivable – investment securities1 | 34 | 21 | ||||||
Government issued | ||||||||
Cash equivalents | 686 | 445 | ||||||
Investment securities | 9,363 | 7,680 | ||||||
Government and Related Party fees | ||||||||
One-time top-up to the Canada Housing Benefit – Expense2 | 49 | 49 | ||||||
Mortgage Funding – Expense | 30 | 30 | ||||||
Mortgage Insurance – Expense3 | 18 | 11 | ||||||
Mortgage Funding – Payable | 34 | 30 | ||||||
Mortgage Insurance – Payable | 55 | 63 | ||||||
| 1 | Included in accrued interest receivable. |
| 2 | $4 million remains payable at year end and is included in accounts payable and other liabilities (2022 — $49 million) |
| 3 | These fees will reduce the CSM on initial recognition and are subsequently amortized over the expected coverage period of our insurance contracts with equal offsetting amounts to insurance revenue and insurance service expense in the year. Included in operating expenses are $1 million of Government of Canada fees for self-insured products (2022 – nil). |
Key management personnel
The following table presents the compensation of key management personnel, defined as those persons having authority and responsibility for planning, directing and controlling our activities. This includes the Board of Directors and members of the Executive Committee.
| 2023 | 2022 | |||||||||||||||||||||||
(in thousands) | Board of Directors | Executive Committee | Total | Board of Directors | Executive Committee | Total | ||||||||||||||||||
Short-term benefits | 122 | 4,158 | 4,280 | 117 | 5,121 | 5,238 | ||||||||||||||||||
Post-employment benefits | - | 685 | 685 | - | 1,158 | 1,158 | ||||||||||||||||||
Total | 122 | 4,843 | 4,965 | 117 | 6,279 | 6,396 | ||||||||||||||||||
| 2023 Annual Report | 140 |
27. Commitments and Contingent Liabilities
Letters of credit
We have $92 million in letters of credit outstanding, representing the actuarial value of the liability as at 1 January 2024, which secure benefits accrued up to 31 December 2017 under the Supplemental Plans (2022 - $99 million as at 1 January 2023).
Other financial obligations
Total estimated remaining contractual financial obligations for our significant arrangements are as follows based on minimum commitment:
(in millions) | 2024 | 2025 | 2026 | 2027 | 2028 | 2029 and thereafter | ||||||||||||||||||
Housing programs1 | 2,747 | 1,920 | 1,706 | 777 | 535 | 1,619 | ||||||||||||||||||
Office rental lease commitments | 2 | 2 | 2 | 2 | 1 | 5 | ||||||||||||||||||
Technology project and run costs | 115 | 90 | 45 | 6 | 6 | 4 | ||||||||||||||||||
Total | 2,864 | 2,012 | 1,753 | 785 | 542 | 1,628 | ||||||||||||||||||
| 1 | Total remaining contractual financial obligations for housing programs extend for periods up to 25 years (2022 – 25 years). |
Legal claims
There are legal claims of $4 million (2022 - $4 million) against us. Due to the uncertainty of the outcome of these claims, no provision for loss has been recorded. We do not expect the ultimate resolution of any of the proceedings to which we are party to have a significant adverse effect on our financial position.
28. Operating Expenses
The following table presents the composition of operating expenses.
(in millions) | 2023 | 2022 (restated) | ||||||
Personnel costs | 290 | 293 | ||||||
Professional services | 139 | 117 | ||||||
Information and technology costs | 120 | 114 | ||||||
Depreciation, amortization and impairment of property and equipment and intangible assets | 34 | 25 | ||||||
Amortization of Government of Canada fees | 31 | 30 | ||||||
Other administrative goods and services | 27 | 27 | ||||||
Total operating expenses | 641 | 606 | ||||||
| 2023 Annual Report | 141 |
29. Current and Non-Current Assets and Liabilities
The following table presents assets and liabilities we expect to recover or settle within 12 months of the balance sheet date.
| 2023 | 2022 (restated) | |||||||||||||||||||||||
(in millions) | Within 1 year | After 1 year | Total | Within 1 year | After 1 year | Total | ||||||||||||||||||
Assets | ||||||||||||||||||||||||
Cash and cash equivalents | 1,939 | - | 1,939 | 2,649 | - | 2,649 | ||||||||||||||||||
Securities purchased under resale agreements | 700 | - | 700 | 650 | - | 650 | ||||||||||||||||||
Income taxes receivable | - | - | - | 206 | - | 206 | ||||||||||||||||||
Accrued interest receivable | 843 | - | 843 | 878 | - | 878 | ||||||||||||||||||
Investment securities: | ||||||||||||||||||||||||
Fair value through profit or loss | - | 69 | 69 | 36 | 97 | 133 | ||||||||||||||||||
Fair value through other comprehensive income | 4,217 | 15,945 | 20,162 | 2,547 | 15,496 | 18,043 | ||||||||||||||||||
Amortized cost | 1,147 | 2,082 | 3,229 | 1,314 | 2,264 | 3,578 | ||||||||||||||||||
Derivatives | 161 | - | 161 | - | - | - | ||||||||||||||||||
Due from the Government of Canada | 118 | 122 | 240 | - | - | - | ||||||||||||||||||
Loans: | ||||||||||||||||||||||||
Fair value through profit or loss | 41 | 471 | 512 | 53 | 416 | 469 | ||||||||||||||||||
Amortized cost | 40,578 | 230,072 | 270,650 | 46,642 | 222,565 | 269,207 | ||||||||||||||||||
Accounts receivable and other assets | 87 | 392 | 479 | 323 | 412 | 735 | ||||||||||||||||||
Investment property | - | 398 | 398 | - | 402 | 402 | ||||||||||||||||||
Defined benefit plan asset | - | 187 | 187 | - | 218 | 218 | ||||||||||||||||||
| 49,831 | 249,738 | 299,569 | 55,298 | 241,870 | 297,168 | |||||||||||||||||||
Liabilities | ||||||||||||||||||||||||
Accounts payable and other liabilities | 464 | 109 | 573 | 604 | 103 | 707 | ||||||||||||||||||
Income taxes payable | 545 | - | 545 | - | - | - | ||||||||||||||||||
Accrued interest payable | 786 | - | 786 | 818 | - | 818 | ||||||||||||||||||
Derivatives | 8 | 47 | 55 | 46 | 41 | 87 | ||||||||||||||||||
Insurance contract liabilities | 871 | 6,208 | 7,079 | 780 | 5,625 | 6,405 | ||||||||||||||||||
Due to the Government of Canada | - | - | - | 102 | (96) | 6 | ||||||||||||||||||
Borrowings: | ||||||||||||||||||||||||
Fair value through profit or loss | 77 | 142 | 219 | 159 | 215 | 374 | ||||||||||||||||||
Amortized cost | 41,648 | 233,109 | 274,757 | 47,067 | 226,703 | 273,770 | ||||||||||||||||||
Defined benefit plans liability | 9 | 171 | 180 | 8 | 158 | 166 | ||||||||||||||||||
Unearned premium and fees | 821 | 1,955 | 2,776 | 759 | 1,845 | 2,604 | ||||||||||||||||||
Deferred income tax liabilities | - | 36 | 36 | - | 270 | 270 | ||||||||||||||||||
| 45,229 | 241,777 | 287,006 | 50,343 | 234,864 | 285,207 | |||||||||||||||||||
Net | 4,602 | 7,961 | 12,563 | 4,955 | 7,006 | 11,961 | ||||||||||||||||||
30. Comparative Figures
Certain comparative figures have been reclassified, where necessary, to conform to the 2023 presentation. In the consolidated Balance Sheet, the presentation of income taxes receivable has been separated from accounts receivable and other assets, and income taxes payable has been separated from accounts payable and other liabilities.
31. Subsequent Event
On 20 March 2024, we declared dividends of $145 million, which we expect to pay no later than 30 April 2024.
| 2023 Annual Report | 142 |
CORPORATE
GOVERNANCE
Legislative framework
Incorporated under the Canada Mortgage and Housing Corporation Act, the company is accountable to Parliament through the minister responsible for CMHC, currently the Minister of Housing, Infrastructure, and Communities. Our legislative framework includes the CMHC Act, the National Housing Act, the National Housing Strategy Act and the Financial Administration Act.
Board of Directors
The Board of Directors is responsible for managing our affairs and the conduct of our business in accordance with applicable legislation and the governing bylaws of CMHC. As steward of the company, the Board:
| • | sets strategic direction in support of government policies and priorities; |
| • | ensures the integrity and adequacy of company policies, information systems and management practices; |
| • | ensures that principal risks are identified and managed; and |
| • | evaluates and monitors the company’s performance and results. |
The Board has a duty to:
| • | protect the short- and long-term interests of the company; |
| • | safeguard CMHC’s assets; and |
| • | be prudent and professional in fulfilling its duties. |
The Board consists of the Chair, the President and Chief Executive Officer, the Deputy Minister to the Minister responsible for CMHC, the Deputy Minister of Finance, and eight other independent directors appointed by the Minister with the approval of the Governor in Council. The Board committees include: (mandates are available on our website12):
| • | Audit |
| • | Corporate Governance and Human Resources |
| • | Risk Management |
| • | Pension Fund Trustees |
| • | Executive Committee |
The Board meets a minimum of five times per year and holds an annual public meeting. To understand the diversity of housing needs of people living in Canada, the Board conducts its meetings across Canada to meet with community representatives and housing proponents from across Canada. In 2023 the Board met in Ottawa, Kamloops, Banff, Montréal, and Halifax.
The Board undergoes regular assessments to identify opportunities for enhanced Board performance, development, and education. The assessment methodology varies between a self-assessment, and one administered by a third party that examines the functioning and performance of the Board compared to the boards of other Crown corporations and financial institutions.
The Board recognizes the importance of diversity and its benefits to the success of the organization. It regularly reviews its composition against a competency, diversity and geographical location matrix and collaborates with the Minister in filling Board vacancies in a way that represents all Canadians.
| 12 | https://www.cmhc-schl.gc.ca/about-us/management-and-governance/board-of-directors-and-its- committees |
| 2023 Annual Report | 143 |

As of 31 December 2023 Derek Ballantyne Chair of the Board of Directors (29 April 2018 – 28 April 2024) CEO, Encasa Financial Inc., Toronto Michel Tremblay Acting President and Chief Executive Officer (effective 15 December 2023, until a new President and CEO is appointed) Kelly Gillis (ex officio) Deputy Minister, Infrastructure and Communities (effective 26 October 2021) Chris Forbes (ex officio) Deputy Minister, Department of Finance (effective 11 September 2023) Gordon Laing Chair of the Audit Committee (12 January 2018 – 02 February 2026) Special Assistant to the Executive Chair, Southwest Properties Limited, Halifax André Hébert Chair of the Risk Management Committee (27 February 2019 – 26 February 2025) Head of Technology, Air Canada Vacations, Montréal Linda Morris Chair of the Corporate Governance and Human Resources Committee (14 December 2017 – 13 December 2021; continues in office until an appointment is made) Formerly served as Senior Vice-President of Business Development, Member and Community Engagement at Vancity, Vancouver Navjeet (Bob) Dhillon (5 February 2015 – 4 February 2019; continues in office until an appointment is made) President, CEO and Founder, Mainstreet Equity Corporation Christopher Sicotte (23 June 2022 – 22 June 2026) Executive Director, National Aboriginal Trust Officers Association 3 vacant positions
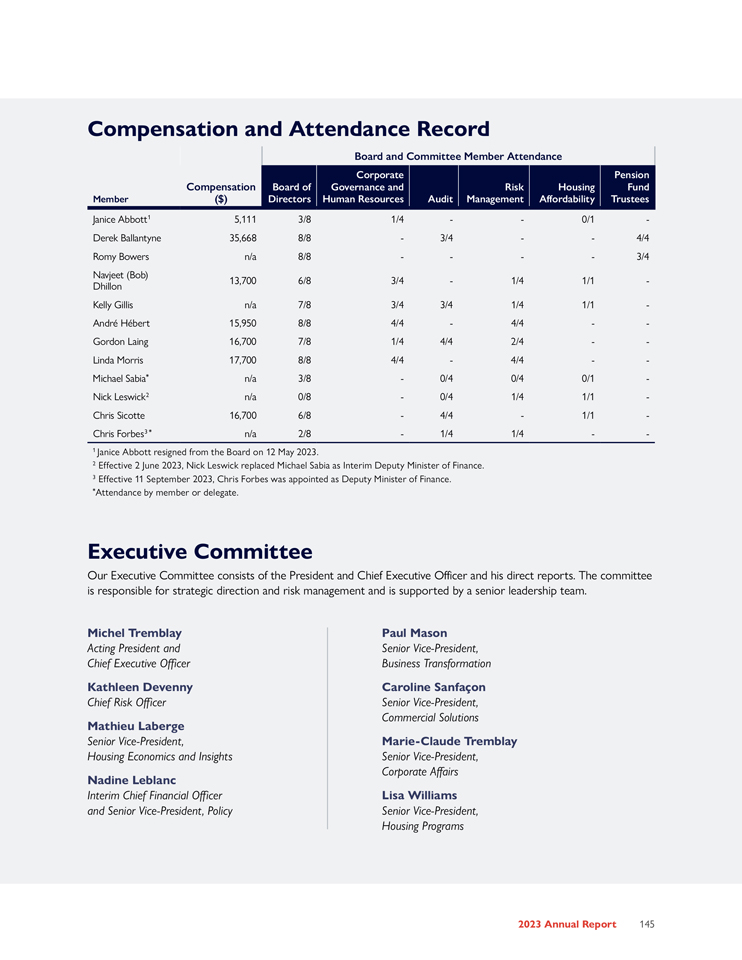
Compensation and Attendance Record Board and Committee Member Attendance Member Compensation ($) Board of DirectorCorporate Governance and Human Resources Audit Risk Management Housing Affordability Pension Fund Trustees Janice Abbott1 5,111 3/8 1/4 — — 0/1 — Derek Ballantyne 35,668 8/8 — 3/4 — — 4/4 Romy Bowers n/a 8/8 — — — — 3/4 Navjeet (Bob) Dhillon 13,700 6/8 3/4 — 1/4 1/1 — Kelly Gillis n/a 7/8 3/4 3/4 1/4 1/1 — André Hébert 15,950 8/8 4/4 — 4/4 — — Gordon Laing 16,700 7/8 1/4 4/4 2/4 — — Linda Morris 17,700 8/8 4/4 — 4/4 — — Michael Sabia* n/a 3/8 — 0/4 0/4 0/1 — Nick Leswick2 n/a 0/8 — 0/4 1/4 1/1 — Chris Sicotte 16,700 6/8 — 4/4 — 1/1 — Chris Forbes3 * n/a 2/8 — 1/4 1/4 — — 1 Janice Abbott resigned from the Board on 12 May 2023. 2 Effective 2 June 2023, Nick Leswick replaced Michael Sabia as Interim Deputy Minister of Finance. 3 Effective 11 September 2023, Chris Forbes was appointed as Deputy Minister of Finance. *Attendance by member or delegate. Executive Committee Our Executive Committee consists of the President and Chief Executive Officer and his direct reports. The committee is responsible for strategic direction and risk management and is supported by a senior leadership team. Michel Tremblay Acting President and Chief Executive Officer Paul Mason Senior Vice-President, Business Transformation Kathleen Devenny Chief Risk Officer Caroline Sanfaçon Senior Vice-President, Commercial Solutions Mathieu Laberge Senior Vice-President, Housing Economics and Insights Marie-Claude Tremblay Senior Vice-President, Corporate Affairs Nadine Leblanc Interim Chief Financial Officer and Senior Vice-President, Policy Lisa Williams Senior Vice-President, Housing Programs
Management Team
Caroline Bilodeau
Vice-President, People and Culture
Mark Chamie
Vice-President, Investments and Treasury
Andre Charbonneau
Deputy Chief Financial Officer
Samir Chhelavda
Vice-President, Audit and Evaluation
Holly Cooper
Vice-President, Indigenous Policy and Relations
Brett Dietrich
Vice-President, Multi-Unit Operations
Pam Hine
Vice-President, Housing Solutions (Multi-Unit)
Riaz Kara
Vice-President, Equity
Amélie Lecompte
Chief Information Officer |
| Neil Levecque
Vice-President, Housing Operations
Marie-Anna Murat
Vice-President, Communications and Marketing
Stéphane Poulin
Vice-President, Data, Research and Insight
Camille Ringrose
Deputy Chief Risk Officer
Patricia Roset-Zuppa
Vice-President, Housing Markets, Finance and Climate Policy
Carla Staresina
Vice-President, Commercial Products
Debbie Stewart
Vice-President, Innovation and Partnerships
Mark Young
General Counsel |
| 2023 Annual Report | 146 |
APPENDIX: OSFI CONSULTATIONS AND GUIDELINES
Significant OSFI announcements which affect CMHC include the following:
| • | Parliament passed Bill C-47, the Budget Implementation Act (BIA), which expands OSFI’s mandate and adds to the suite of compliance and intervention tools available to the Superintendent and the Minister of Finance. These changes are expected to enhance the strong oversight of Federally Regulated Financial Institutions (FRFIs) that underpins a sound and stable Canadian financial system. Starting 1 January 2024, FRFIs will be required to have and adhere to adequate policies and procedures to protect themselves from threats to their integrity and security, including foreign interference. |
| • | OSFI’s new supervisory framework for FRFIs and pension plans will become effective in April 2024. The supervisory framework guides oversight of financial institutions with a primary goal to protect depositors, policyholders, and pension plan members from loss. The new framework will apply to both financial institutions and pension plans and recognizes the specific nature of the different industries OSFI regulates. |
| • | OSFI published the Mortgage Insurer Capital Adequacy Test (MICAT) 2024 guideline. This revised guideline builds on MICAT 2023 and reflects two key revisions, including clarifying the maximum remaining amortization in the requirements calculations, and increasing the maximum LTV to 105% from 100% in the requirements calculations (effective January 2024). |
| • | Culture and Behaviour: In February 2023, OSFI released a draft Culture and Behaviour Risk Guideline for consultation. The draft Guideline sets principles-based expectations for federally regulated financial institutions (FRFIs) to oversee their culture and assess the impact of behavioural patterns to effectively manage the associated risks. A final Guideline is expected to be issued in the near future. |
| • | B-15 Climate Risk Management: In March 2023, OSFI published B-15, which sets out OSFI’s expectations for the management of climate-related risks with respect to Governance and Financial Disclosures. This Guideline is OSFI’s first prudential framework that is climate sensitive and recognizes the impact of climate change on managing risk in Canada’s financial system. Guideline B-15 will be effective in 2025. |
| • | B-20: Residential Mortgage Underwriting Practices and Procedures: In October 2023, OSFI published the results and next steps of its public consultation focused on debt serviceability measures. OSFI will pursue targeted supervisory actions that will aim to limit federally regulated financial institutions’ (FRFIs) individual exposures to high household indebtedness over time. OSFI will continue reviewing its expectations relating to real estate secured lending through to 2024. |
| 2023 Annual Report | 147 |
| • | E-21 Operational Resilience and Operational Risk Management: In October 2023, OSFI published a draft revised Guideline that sets expectations for operational resilience to strengthen FRFIs’ ability to prepare for and recover from severe disruptive events, modernizes OSFI’s expectation for operational risk management and contributes to FRFIs’ integrity and security. The release of a final guideline is expected in Q4 2024. |
| • | E-23 Model Risk Management. In November 2023, OSFI launched a consultation on Guideline E-23 which will expand the scope to include forecasting economic conditions, estimating financial risks, pricing products and services, and optimizing business strategies. It now also includes models used for non-financial risks such as climate, cyber and technology and digital innovation risks. Final guidance is planned for publication by July 2024 and target implementation by July 2025. |
| • | B-10 Third-Party Risk Management: In April 2023, OSFI published Guideline B-10 which sets out associated risk expectations to manage third-party arrangements. Updates to policies, guidelines, and processes will be introduced as required to meet OSFI’s requirements by May 2024. |
| • | B-13 for Technology and Cyber Risk Management: In July 2022, OSFI released its final Guideline B-13, which sets out OSFI’s expectations for how FRFIs should manage technology and cyber risks such as data breaches, technology outages and more. This Guideline is effective January 2024. |
| • | Guideline for Assurance on Capital, Leverage and Liquidity Returns: In November 2022, OSFI released a new Guideline for Assurance on Capital, Leverage and Liquidity Returns. The Guideline seeks to inform external auditors and institutions on the work to be performed on their regulatory returns in an effort to enhance and align OSFI’s assurance expectations across all FRFIs. Regulatory returns are key contributors to the assessment of the soundness of an FRFI. OSFI expects review and senior management attestation on the accuracy and completeness of the MICAT Cover schedule on a quarterly basis, beginning fiscal 2024. Updates to policies, guidelines, and processes will be introduced as required to meet OSFI’s requirements. |
| 2023 Annual Report | 148 |
GLOSSARY
Non-IFRS financial measures: We use a number of financial measures to assess our performance. Some are not calculated in accordance with International Financial Reporting Standards (IFRS), are not defined by IFRS and do not have standardized meaning that would ensure consistency and comparability with other institutions.
Arrears rate: The ratio (expressed as a percentage) of all loans that are typically more than 90 days past due to the number of outstanding insured loans.
Borrower defaults: Defaults from the mortgage insurance business occur when a borrower has missed the equivalent of at least one payment as at the reporting date.
Capital available to capital required: Under the Mortgage Funding activity, the ratio (expressed as a percentage) of capital available to capital required, where capital required is calculated by applying risk factors to asset and liability exposures using a framework developed in accordance with both regulatory and economic capital principles.
Capital available to minimum capital required: Under the Mortgage Insurance activity, the ratio (expressed as a percentage) of capital available to minimum capital required, where capital available is calculated as total equity adjusted for assets with a capital requirement of 100% and minimum capital required is calculated by applying risk factors to investment asset and liability exposures in accordance with guidelines established by the Office of the Superintendent of Financial Institutions.
Combined ratio: This ratio is the combination of the insurance service expense ratio and the operating expense ratio.
Contractual Service Margin (CSM): Represents the expected future profit of our insurance contract liabilities.
Guarantees-in-force: The total guarantees related to the timely payment of principal and interest of National Housing Act Mortgage-Backed Securities for investors in securities issued by approved issuers on the basis of housing loans through the National Housing Act Mortgage-Backed Securities program and the Canada Mortgage Bonds issued by the Canada Housing Trust.
Initial CSM ratio: Represents the estimated embedded profit of premiums received on insurance contracts in the period.
Insurance service expense ratio: Replacing the loss ratio, this metric measures the ratio between insurance service expense over insurance revenues.
Insurance-in-force: The total amount of outstanding loan balances covered by mortgage insurance policies at a specific period in time.
Main estimates: The main estimates present the government’s spending plans for each federal organization and provide items that will be included in an appropriation bill.
Minimum Capital Test (MCT): The minimum capital required, calculated by applying risk factors to the Mortgage Insurance activity’s assets and liabilities using a defined methodology prescribed by the Office of the Superintendent of Financial Institutions.
Mortgage Insurance Capital Adequacy Test (MICAT): The minimum capital required, calculated by applying a risk-based formula defined in the Office of the Superintendent of Financial Institutions Capital Adequacy Requirements Guideline for Canadian mortgage insurance companies.
Operating budget ratio: The ratio (expressed as a percentage) of operating budget expenses for all of CMHC’s activities (excluding Canada Housing Trust) during the period to premiums, fees, guarantee and application fees received, net interest income from lending programs and normalized government funding.
| 2023 Annual Report | 149 |
Operating expense ratio: Mortgage Insurance activity: the ratio (expressed as a percentage) of operating expenses during the period to Insurance Revenue during the period for the mortgage insurance activity. Mortgage Funding activity: the ratio (expressed as a percentage) of operating expenses during the period, exclusive of those related to the administration of the covered bond legal framework, to guarantee fees earned during the period.
Return on equity: The annualized net income divided by the average of the beginning and ending equity for the period, used to highlight operating performance.
Return on required equity: The annualized net income, adjusted to remove investment income earned on capital in excess of capital required, divided by the average required capital for the period.
Severity ratio: The ratio (expressed as a percentage) of insurance claims to the original insured loan amount for the claims paid in the period.
Other glossary terms
Affordability/Affordable Housing: In Canada, housing is generally considered affordable if it costs less than 30% of a household’s before-tax income. Affordable housing can include housing provided by the private, public and non-profit sectors. It also includes all forms of housing tenure: rental, ownership and co-operative ownership, as well as temporary and permanent housing.
Approved issuer: A business organization that, having met the criteria established by CMHC, is approved to issue and administer guaranteed National Housing Act Mortgage-Backed Securities.
Approved lender: A lending institution designated as an approved lender by CMHC under the National Housing Act. Only approved lenders may qualify for CMHC loan insurance.
Canada Housing Trust: The Canada Housing Trust is a special-purpose trust that acquires interests in eligible insured housing loans, such as National Housing Act Mortgage-Backed Securities, and issues Canada Mortgage Bonds. The Canada Housing Trust also purchases highly rated investments and undertakes certain related financial hedging activities. We consolidate the accounts of Canada Housing Trust with our Mortgage Funding activity. Canada Housing Trust’s assets and liabilities are neither owned by nor held for our benefit. The beneficiaries of the trust, after payment of all obligations, are one or more charitable organizations.
Committed: Committed in this context refers to funding earmarked to support the building or repair of units of whose formal project agreement is still subject to final approvals and conditions, as well as funding for which a formal loan agreement is duly executed and a binding agreement is reached to provide credit under pre-specified terms and conditions.
Core housing need: A household is said to be in core housing need if its housing falls below at least one of the adequacy, affordability or suitability standards and it would have to spend 30% or more of its total before-tax income to pay the median rent of alternative local housing that meets all three housing standards:
| 1. | Adequate housing is reported by their residents as not requiring any major repairs. |
| 2. | Affordable housing has shelter costs equal to less than 30% of total before-tax household income. |
| 3. | Suitable housing has enough bedrooms for the size and composition of its residents, according to National Occupancy Standard (NOS) requirements. |
Financial commitment: Achieved once a formal loan agreement is duly executed and a binding agreement to provide credit under pre-specified terms and conditions is reached.
Forgivable loan: A loan granted by a government or an organization, which the lender agrees to forgive if certain conditions are met by the borrower.
| 2023 Annual Report | 150 |
Gender-based Analysis Plus (GBA Plus): An analytical process that provides a rigorous method for assessing systemic inequalities, as well as a means to assess how diverse groups of women, men and gender diverse people may experience policies, programs and initiatives. The “plus” in GBA+ acknowledges that the assessment is not just about biological (sexes) and socio-cultural (genders) differences. We all have multiple characteristics that intersect and contribute to who we are. GBA+ considers many other identity factors, such as race, ethnicity, religion, age, and mental or physical disability, and how the interaction between these factors influences the way we might experience government policies and initiatives.
Using GBA+ involves taking a gender- and diversity-sensitive approach to our work. Considering all intersecting identity factors as part of GBA+, not only sex and gender, is a Government of Canada commitment.
Home retrofits for energy efficiency: When you do an energy-efficiency retrofit on your building, you upgrade its energy-consuming systems. Retrofitting may involve improving or replacing lighting fixtures, ventilation systems or windows and doors, or adding insulation where it makes economic sense. It also means including energy efficiency measures in all your renovation and repair activities.
Housing programs expenses: All activities funded by the government under Assisted Housing and Market Analysis and Research activities.
Lending programs: Under the National Housing Act, and in support of Canada’s National Housing Strategy, we provide loans and contributions to federally subsidized social housing sponsors, First Nations, provinces, territories and municipalities. We also provide non-subsidized housing support loans. Our loan portfolio is comprised of a mix of renewable and non-renewable loans which may be on or off-reserve. Direct Lending is the current borrowing initiative we use to refinance our renewable loans as well as to finance new commitments on-reserve. These loans can be financed at lower interest rates due to our status as a federal Crown corporation. As such, we are able to lower the cost of government assistance required for social housing projects. Direct Lending is operated on a planned break-even basis.
Lived experience: The experience and knowledge gained through direct, first-hand involvement in everyday situations, events and interactions as a result of personally experiencing housing need or homelessness.
Physical risk: Effect of uncertainties related to severe and frequent extreme weather events, as well as chronic changes to the environment due to climate change (e.g., temperature increase, sea level rise), on the achievement of our strategic results.
Rural area: Refers to all land lying outside population centres and the people living within those areas.
Transition risk: Effect of uncertainties associated with efforts to move to a low-carbon economy, including changes to current or future government policies, technological innovations and/or consumer and investor preferences and their impacts on the achievement of our strategic results.
United Nations Declaration on the Rights of Indigenous Peoples (UNDRIP): UNDRIP is a comprehensive statement addressing the human rights of Indigenous peoples. It emphasizes the rights of Indigenous peoples to live in dignity, to maintain and strengthen their own institutions, cultures and traditions, and to pursue their self-determined development, in keeping with their own needs and aspirations.
Vulnerable: People belonging, or perceived to belong, to groups that are in a disadvantaged position or marginalized are often referred to as groups that are made vulnerable. In the case of the National Housing Strategy, priority groups currently defined as vulnerable include survivors (especially women and children) fleeing domestic violence, seniors, Indigenous peoples, people with disabilities, those dealing with mental health and addiction issues, veterans, 2SLGBTQIA+, racialized groups, newcomers (including refugees), individuals and families experiencing homelessness, and young adults.
| 2023 Annual Report | 151 |
HISTORICAL INFORMATION
Actual | ||||||||||||||||||||
(in millions, unless otherwise indicated) | 2023 | 2022 (restated)1 | 2021 | 2020 | 2019 | |||||||||||||||
Consolidated Results | ||||||||||||||||||||
Total assets | 299,569 | 297,168 | 300,357 | 300,970 | 276,259 | |||||||||||||||
Total liabilities | 287,006 | 285,207 | 287,147 | 284,395 | 261,646 | |||||||||||||||
Total equity of Canada | 12,563 | 11,961 | 13,210 | 16,575 | 14,613 | |||||||||||||||
Total revenues and government funding2 | 7,505 | 5,587 | 6,296 | 7,951 | 4,716 | |||||||||||||||
Total expenses (including income taxes)3 | 6,195 | 4,147 | 4,372 | 6,289 | 3,136 | |||||||||||||||
Net income | 1,310 | 1,440 | 1,924 | 1,662 | 1,580 | |||||||||||||||
Operating budget ratio | 9.1% | 11.6% | 9.6% | 9.6% | 15.6% | |||||||||||||||
Assisted Housing | ||||||||||||||||||||
Government funding | 5,494 | 3,408 | 3,668 | 4,892 | 2,039 | |||||||||||||||
Net income (loss) | (20) | 140 | 91 | 68 | 42 | |||||||||||||||
Total equity of Canada | 814 | 846 | 569 | 332 | 302 | |||||||||||||||
Mortgage Insurance | ||||||||||||||||||||
Insurance-in-force ($B)4 | 414 | 399 | 401 | 431 | 429 | |||||||||||||||
Total insured volumes5,6 | 66,472 | 62,437 | 53,911 | 76,845 | 50,465 | |||||||||||||||
Premiums and fees received | 1,557 | 1,675 | 1,802 | 2,009 | 1,549 | |||||||||||||||
Premiums and fees earned | 33 | 23 | 1,399 | 1,372 | 1,429 | |||||||||||||||
Insurance revenue | 1,004 | 867 | - | - | - | |||||||||||||||
Claims paid | 52 | 64 | 139 | 140 | 236 | |||||||||||||||
Insurance claims expense | - | - | (317) | 472 | 191 | |||||||||||||||
Insurance service expense | 119 | (106) | - | - | - | |||||||||||||||
Net income | 676 | 727 | 1,285 | 1,062 | 1,096 | |||||||||||||||
Arrears rate | 0.29% | 0.25% | 0.28% | 0.34% | 0.31% | |||||||||||||||
Loss ratio | - | - | (22.7)% | 34.4% | 13.4% | |||||||||||||||
Insurance service expense ratio | 11.9% | (12.2)% | - | - | - | |||||||||||||||
Operating expense ratio | 17.1% | 20.4% | 23.2% | 22.7% | 21.8% | |||||||||||||||
Combined ratio | 29.0% | 8.2% | 0.5% | 57.1% | 35.2% | |||||||||||||||
Initial contractual service margin ratio | 57.4% | 69.0% | - | - | - | |||||||||||||||
Severity ratio | 29.8% | 29.6% | 31.7% | 30.5% | 31.1% | |||||||||||||||
Return on equity | 6.7% | 6.9% | 10.3% | 8.4% | 9.1% | |||||||||||||||
Return on required equity | 7.3% | 8.1% | 14.8% | 10.5% | 10.6% | |||||||||||||||
Capital available to minimum capital required (% MICAT) | 185% | 175% | 213% | 234% | 195% | |||||||||||||||
% Estimated outstanding Canadian residential mortgages with CMHC insurance coverage ($) | 19.3% | 19.2% | 24.1% | 26.2% | 26.4% | |||||||||||||||
Mortgage Funding | ||||||||||||||||||||
Guarantees-in-force ($B)4 | 508 | 471 | 461 | 489 | 493 | |||||||||||||||
Annual securities guaranteed ($B) | 196 | 187 | 184 | 225 | 174 | |||||||||||||||
Guarantee and application fees received | 935 | 962 | 1,008 | 904 | 664 | |||||||||||||||
Guarantee and application fees earned | 827 | 756 | 716 | 667 | 582 | |||||||||||||||
Net income | 645 | 556 | 545 | 530 | 464 | |||||||||||||||
Operating expense ratio | 6.7% | 7.5% | 8.2% | 8.3% | 9.3% | |||||||||||||||
Return on equity | 46.3% | 39.0% | 24.6% | 20.4% | 19.4% | |||||||||||||||
Economic capital available to economic capital required7 | 109% | 149% | 136% | 176% | 145% | |||||||||||||||
% Estimated outstanding Canadian residential mortgages with CMHC securitization guarantee ($) | 23.8% | 22.9% | 24.1% | 29.5% | 30.6% | |||||||||||||||
| 1 | Figures have been restated to reflect the adoption of IFRS 17 effective 1 January 2022. |
| 2 | For 2022 and 2023, includes net interest income, insurance service result, net financial result, government funding, premiums and fees earned, and other income, to reflect the presentation under IFRS 17. |
| 3 | For 2022 and 2023, includes housing programs expenses, operating expenses, self-insurance service income, and income taxes, to reflect the presentation under IFRS 17. |
| 4 | Our total exposure is less than the sum of these figures because we insure a portion of the instruments included in guarantees-in-force. |
| 5 | Total insured volumes include portfolio substitutions. |
| 6 | Total insured volumes have been updated from previously published reports, resulting in a decrease of 6% in 2022 and 5% in 2021. |
| 7 | In 2023, the capital required in the Mortgage Funding ratio has been updated to consider the minimum liquidity target. |
| 2023 Annual Report | 152 |