UNITED STATES
SECURITIES AND EXCHANGE COMMISSION
Washington, D.C. 20549
FORM N-CSRS
CERTIFIED SHAREHOLDER REPORT OF REGISTERED MANAGEMENT INVESTMENT COMPANIES
Investment Company Act file number 811-08034
Franklin Real Estate Securities Trust
(Exact name of registrant as specified in charter)
_ONE FRANKLIN PARKWAY, SAN MATEO, CA 94403-1906
(Address of principal executive offices) (Zip code)
_Craig S. TYLE, ONE FRANKLIN PARKWAY, SAN MATEO, CA 94403-1906
(Name and address of agent for service)
Registrant's telephone number, including area code: 650 312-2000
Date of fiscal year end:_4/30
Date of reporting period:_10/31/10
Item 1. Reports to Stockholders.

FRANKLIN
REAL ESTATE SECURITIES FUND

Semiannual Report
Franklin Real Estate Securities Fund
Your Fund’s Goal and Main Investments: Franklin Real Estate Securities Fund seeks to maximize total return by investing at least 80% of its net assets in equity securities of companies in the real estate industry, including real estate investment trusts (REITs) and companies that derive at least half of their assets or revenues from the ownership, construction, management or sale of residential, commercial or industrial real estate.1
Semiannual Report | 3
annualized rates of 1.7% and 2.5% as trade dynamics turned negative and government spending waned. Corporate profits largely surpassed consensus estimates during the six-month period, and businesses restocked their depleted inventories. Challenges remained as mixed economic data, elevated debt concerns surrounding the U.S. budget deficit and a lack of job prospects for the unemployed reflected considerable slack in the economy. The housing market overall remained weak as home sales and housing starts failed to gain traction despite an earlier, first-time homebuyer tax credit program that had helped lift the housing market in early 2010.
As signs emerged of a demand-led global recovery, oil prices began the period at $86 per barrel at the end of April, just off their 17-month high price of $87 early that month. As doubts surfaced about the recovery’s sustainability, oil prices dipped to $66 in late May. Despite an abundant oil supply, prices rebounded to $81 per barrel by the end of October largely due to a falling U.S. dollar and speculative buying. The October 2010 inflation rate was an annualized 1.2%.3 Core inflation, which excludes volatile food and energy costs, rose at a 0.6% annualized rate, the smallest 12-month increase in more than 50 years.3 Job gains were disappointing until October when businesses added more jobs than expected. The unemployment rate fell from 9.9% in April to 9.6% at period-end with some of the decline attributable to a shrinking labor force as some unemployed workers stopped looking for jobs.3
Given few inflationary pressures and uncertainty surrounding the economic recovery, the Federal Open Market Committee (FOMC) made no major changes to its monetary policy for most of the period. It repeatedly stated it will keep the federal funds target rate in the exceptionally low 0% to 0.25% range “for an extended period” while shifting its focus to its outlook and the status of its current holdings. In September, the FOMC revealed concerns about the subdued recovery and said inflation was below the pace “consistent with its mandate.” Having already lowered interest rates effectively to zero, the FOMC appeared ready to purchase government securities to stimulate the economy and promote a low level of inflation consistent with healthy economic growth.
Investor confidence shifted with each release of encouraging or discouraging economic, regulatory or political news, and U.S. equity markets grew volatile. Ultimately, equities had a lackluster six months. During the period, U.S. equity markets generally fell amid conflicting economic reports and investor uncertainty before rallying in the period’s latter half. Overall, the blue-chip stocks of the Dow Jones Industrial Average posted a +2.39% total return, while the broader Standard & Poor’s 500 Index (S&P 500) had a +0.74% total return and the technology-heavy NASDAQ Composite Index produced a +2.33%
3. Source: Bureau of Labor Statistics.
4 | Semiannual Report
total return.4 Performance among the major sectors varied widely, with telecommunication services, utilities and consumer staples making solid gains, while financials, industrials and energy lost ground.
Investment Strategy
We are research-driven, fundamental investors with an active investment strategy. We use a bottom-up, value-oriented, long-term approach that incorporates macro-level views in our evaluation process. We analyze individual stock and real estate market fundamentals including supply and demand trends and outlooks for various property types and regional markets while evaluating company management and a security’s underlying properties.
Manager’s Discussion
During the six months ended October 31, 2010, several holdings contributed to the Fund’s performance relative to the S&P U.S. Property Index, the Fund’s benchmark index, including Ventas, Boston Properties and National Retail Properties. The health care REIT sector outperformed the benchmark index during the period under review due to its defensive nature, as investors perceived the sector as a relatively safe haven during market uncertainty. Health care REIT Ventas benefited from the trend toward safety and the company’s strong earnings. Office property REITs, one of the Fund’s largest sector allocations during the period under review, contributed most to relative Fund returns due to stock selection. Within the sector, Boston Properties rose in value as the company benefited from high occupancy rates at its commercial office buildings, located primarily in New York, Boston, San Francisco and Washington, DC. T he share price of National Retail Properties, a REIT that invests primarily in high-quality retail properties subject generally to long-term leases, rallied after management reported strong results for the second quarter and raised the outlook for the second half of 2010. Our overweighting in Ventas, Boston Properties and National Retail Properties compared with the index benefited relative performance.
Holdings that detracted from absolute and relative performance during the six-month period included Host Hotels & Resorts, Strategic Hotels & Resorts and Cedar Shopping Centers. The two hotel stocks came under pressure when disappointing economic news caused a negative market reaction to them midway
4. Source: © 2010 Morningstar. The Dow Jones Industrial Average is price weighted based on the average market price of 30 blue chip stocks of companies that are generally industry leaders. The S&P 500 is a market capitalization-weighted index of 500 stocks designed to measure total U.S. equity market performance. The NASDAQ Composite Index is a broad-based, market capitalization-weighted index designed to measure all NASDAQ domestic and international based common type stocks listed on The NASDAQ Stock Market.
| | |
| Top 10 Holdings | | |
| 10/31/10 | | |
| |
| Company | % of Total | |
| Sector/Industry | Net Assets | |
| Simon Property Group Inc. | 9.7 | % |
| Retail REITs | | |
| Boston Properties Inc. | 6.5 | % |
| Office REITs | | |
| Equity Residential | 6.1 | % |
| Residential REITs | | |
| Host Hotels & Resorts Inc. | 6.0 | % |
| Specialized REITs | | |
| Vornado Realty Trust | 5.8 | % |
| Diversified REITs | | |
| Ventas Inc. | 5.5 | % |
| Specialized REITs | | |
| Public Storage | 5.1 | % |
| Specialized REITs | | |
| HCP Inc. | 4.2 | % |
| Specialized REITs | | |
| AvalonBay Communities Inc. | 3.0 | % |
| Residential REITs | | |
| SL Green Realty Corp. | 2.7 | % |
| Office REITs | | |
Semiannual Report | 5
through the period. The share price of Host Hotels & Resorts plummeted during the period and hampered relative results due to the Fund’s overweighting. Host Hotels & Resorts reported a surprise second quarter profit and the REIT’s first increase in two years in revenue per available room, a key industry measure of performance. Management also raised its 2010 outlook. However, Host Hotels’ share price fell after its management announced plans to sell as much as $400 million of equity to raise funds for potential acquisitions and other purposes. Strategic Hotels & Resorts lost value during the period due to investors’ concerns that the tepid economic recovery and possible slowdown would lead to lower leisure and business travel, and ultimately, a decline in demand for hotel rooms. Share prices of several retail property REITs, including Cedar Shopping Centers, suffered due to rising concerns about th e sluggish economic recovery, especially after the release of weaker-than-expected economic data and a slight decrease in U.S. retail sales in July. We sold both Strategic Hotels & Resorts and Cedar Shopping Centers by period end.
Thank you for your continued participation in Franklin Real Estate Securities Fund. We look forward to serving your future investment needs.

Portfolio Management Team
Franklin Real Estate Securities Fund
6 | Semiannual Report
The foregoing information reflects our analysis, opinions and portfolio holdings as of October 31, 2010, the end of the reporting period. The way we implement our main investment strategies and the resulting portfolio holdings may change depending on factors such as market and economic conditions. These opinions may not be relied upon as investment advice or an offer for a particular security. The information is not a complete analysis of every aspect of any market, country, industry, security or the Fund. Statements of fact are from sources considered reliable, but the investment manager makes no representation or warranty as to their completeness or accuracy. Although historical performance is no guarantee of future results, these insights may help you understand our investment management philosophy.
Effective September 1, 2010, Wilson Magee assumed lead portfolio manager responsibilities for Franklin Real Estate Securities Fund. He joined Franklin Templeton as Director of Global REITs in August 2010. Mr. Magee has managed U.S. and global real estate securities portfolios, including long, long/short and income strategies, since 1997. He has experience in public and private property investments since 1981. Prior to joining Franklin Templeton, Mr. Magee was president and portfolio manager for Colony Investment Management. He previously was a portfolio manager at Goldman Sachs Asset Management and Grantham Mayo Van Otterloo (GMO) and an investor at AEW Capital Management. He also served on the boards of several private real estate funds sponsored by Citigroup. Mr. Magee serves as Chair, Dean’s Advisory Council of Tulane University where he graduated in 1977 with a B.A. in English literature and history.
Semiannual Report | 7
Performance Summary as of 10/31/10
Your dividend income will vary depending on dividends or interest paid by securities in the Fund’s portfolio, adjusted for operating expenses of each class. Capital gain distributions are net profits realized from the sale of portfolio securities. The performance table does not reflect any taxes that a shareholder would pay on Fund dividends, capital gain distributions, if any, or any realized gains on the sale of Fund shares. Total return reflects reinvestment of the Fund’s dividends and capital gain distributions, if any, and any unrealized gains or losses.
| | | | | | | | |
| Price and Distribution Information | | | | | | |
| |
| Class A (Symbol: FREEX) | | | | Change | | 10/31/10 | | 4/30/10 |
| Net Asset Value (NAV) | | | +$ | 0.61 | $ | 13.18 | $ | 12.57 |
| Distributions (5/1/10–10/31/10) | | | | | | | | |
| Dividend Income | $ | 0.0637 | | | | | | |
| Class B (Symbol: FBREX) | | | | Change | | 10/31/10 | | 4/30/10 |
| Net Asset Value (NAV) | | | +$ | 0.61 | $ | 12.96 | $ | 12.35 |
| Distributions (5/1/10–10/31/10) | | | | | | | | |
| Dividend Income | $ | 0.0636 | | | | | | |
| Class C (Symbol: FRRSX) | | | | Change | | 10/31/10 | | 4/30/10 |
| Net Asset Value (NAV) | | | +$ | 0.57 | $ | 12.80 | $ | 12.23 |
| Distributions (5/1/10–10/31/10) | | | | | | | | |
| Dividend Income | $ | 0.0340 | | | | | | |
| Advisor Class (Symbol: FRLAX) | | | | Change | | 10/31/10 | | 4/30/10 |
| Net Asset Value (NAV) | | | +$ | 0.62 | $ | 13.27 | $ | 12.65 |
| Distributions (5/1/10–10/31/10) | | | | | | | | |
| Dividend Income | $ | 0.0739 | | | | | | |
8 | Semiannual Report
Performance Summary (continued)
Performance
Cumulative total return excludes sales charges. Average annual total returns and value of $10,000 investment include maximum sales charges. Class A: 5.75% maximum initial sales charge; Class B: contingent deferred sales charge (CDSC) declining from 4% to 1% over six years, and eliminated thereafter; Class C: 1% CDSC in first year only; Advisor Class: no sales charges.
| | | | | | | | | | | | | | |
| Class A | | 6-Month | | | | | 1-Year | | | 5-Year | | | 10-Year | |
| Cumulative Total Return1 | + | 5.37 | % | | | + | 39.91 | % | | -18.17 | % | + | 89.74 | % |
| Average Annual Total Return2 | | -0.71 | % | | | + | 31.90 | % | | -5.06 | % | + | 5.98 | % |
| Value of $10,000 Investment3 | $ | 9,929 | | | | $ | 13,190 | | $ | 7,712 | | $ | 17,879 | |
| Avg. Ann. Total Return (9/30/10)4 | | | | | | + | 20.18 | % | | -6.14 | % | + | 5.14 | % |
| Total Annual Operating Expenses5 | | | | 1.34 | % | | | | | | | | | |
| Class B | | 6-Month | | | | | 1-Year | | | 5-Year | | | 10-Year | |
| Cumulative Total Return1 | + | 5.47 | % | | | + | 40.09 | % | | -19.41 | % | + | 80.03 | % |
| Average Annual Total Return2 | + | 1.47 | % | | | + | 36.09 | % | | -4.45 | % | + | 6.06 | % |
| Value of $10,000 Investment3 | $ | 10,147 | | | | $ | 13,609 | | $ | 7,966 | | $ | 18,003 | |
| Avg. Ann. Total Return (9/30/10)4 | | | | | | + | 23.67 | % | | -5.54 | % | + | 5.20 | % |
| Total Annual Operating Expenses5 | | | | 2.09 | % | | | | | | | | | |
| Class C | | 6-Month | | | | | 1-Year | | | 5-Year | | | 10-Year | |
| Cumulative Total Return1 | + | 4.95 | % | | | + | 38.92 | % | | -21.22 | % | + | 76.08 | % |
| Average Annual Total Return2 | + | 3.95 | % | | | + | 37.92 | % | | -4.66 | % | + | 5.82 | % |
| Value of $10,000 Investment3 | $ | 10,395 | | | | $ | 13,792 | | $ | 7,878 | | $ | 17,608 | |
| Avg. Ann. Total Return (9/30/10)4 | | | | | | + | 25.55 | % | | -5.72 | % | + | 4.98 | % |
| Total Annual Operating Expenses5 | | | | 2.09 | % | | | | | | | | | |
| Advisor Class | | 6-Month | | | | | 1-Year | | | 5-Year | | | 10-Year | |
| Cumulative Total Return1 | + | 5.50 | % | | | + | 40.34 | % | | -17.18 | % | + | 94.58 | % |
| Average Annual Total Return2 | + | 5.50 | % | | | + | 40.34 | % | | -3.70 | % | + | 6.88 | % |
| Value of $10,000 Investment3 | $ | 10,550 | | | | $ | 14,034 | | $ | 8,282 | | $ | 19,458 | |
| Avg. Ann. Total Return (9/30/10)4 | | | | | | + | 27.94 | % | | -4.78 | % | + | 6.03 | % |
| Total Annual Operating Expenses5 | | | | 1.09 | % | | | | | | | | | |
Performance data represent past performance, which does not guarantee future results. Investment return and principal value will fluctuate, and you may have a gain or loss when you sell your shares. Current performance may differ from figures shown. For most recent month-end performance, go to franklintempleton.com or call (800) 342-5236.
Semiannual Report | 9
Performance Summary (continued)
Endnotes
Investing in a nondiversified fund involves the risk of greater price fluctuation than a more diversified portfolio. Also, the Fund concentrates in real estate securities, which involves special risks, such as declines in the value of real estate and increased susceptibility to adverse economic or regulatory developments affecting the sector. The Fund’s investments in small- and medium-capitalization stocks carry special risks, since these securities have historically been more volatile in price than larger capitalization stocks, particularly over the short term. The Fund’s prospectus also includes a description of the main investment risks.
| |
Class B: Class C: | These shares have higher annual fees and expenses than Class A shares. Prior to 1/1/04, these shares were offered with an initial sales charge; thus actual total returns would have differed. These shares have higher annual fees and expenses than Class A shares. |
Advisor Class: | Shares are available to certain eligible investors as described in the prospectus. |
1. Cumulative total return represents the change in value of an investment over the periods indicated.
2. Average annual total return represents the average annual change in value of an investment over the periods indicated. Six-month return has not been annualized.
3. These figures represent the value of a hypothetical $10,000 investment in the Fund over the periods indicated.
4. In accordance with SEC rules, we provide standardized average annual total return information through the latest calendar quarter.
5. Figures are as stated in the Fund’s prospectus current as of the date of this report. In periods of market volatility, assets may decline significantly, causing total annual Fund operating expenses to become higher than the figures shown.
10 | Semiannual Report
Your Fund’s Expenses
As a Fund shareholder, you can incur two types of costs:
- Transaction costs, including sales charges (loads) on Fund purchases; and
- Ongoing Fund costs, including management fees, distribution and service (12b-1) fees, and other Fund expenses. All mutual funds have ongoing costs, sometimes referred to as operating expenses.
The following table shows ongoing costs of investing in the Fund and can help you understand these costs and compare them with those of other mutual funds. The table assumes a $1,000 investment held for the six months indicated.
Actual Fund Expenses
The first line (Actual) for each share class listed in the table provides actual account values and expenses. The “Ending Account Value” is derived from the Fund’s actual return, which includes the effect of Fund expenses.
You can estimate the expenses you paid during the period by following these steps. Of course, your account value and expenses will differ from those in this illustration:
| 1. | Divide your account value by $1,000. |
| | If an account had an $8,600 value, then $8,600 ÷ $1,000 = 8.6. |
| 2. | Multiply the result by the number under the heading “Expenses Paid During Period.” |
| | If Expenses Paid During Period were $7.50, then 8.6 x $7.50 = $64.50. |
In this illustration, the estimated expenses paid this period are $64.50.
Hypothetical Example for Comparison with Other Funds
Information in the second line (Hypothetical) for each class in the table can help you compare ongoing costs of investing in the Fund with those of other mutual funds. This information may not be used to estimate the actual ending account balance or expenses you paid during the period. The hypothetical “Ending Account Value” is based on the actual expense ratio for each class and an assumed 5% annual rate of return before expenses, which does not represent the Fund’s actual return. The figure under the heading “Expenses Paid During Period” shows the hypothetical expenses your account would have incurred under this scenario. You can compare this figure with the 5% hypothetical examples that appear in shareholder reports of other funds.
Semiannual Report | 11
Your Fund’s Expenses (continued)
Please note that expenses shown in the table are meant to highlight ongoing costs and do not reflect any transaction costs, such as sales charges. Therefore, the second line for each class is useful in comparing ongoing costs only, and will not help you compare total costs of owning different funds. In addition, if transaction costs were included, your total costs would have been higher. Please refer to the Fund prospectus for additional information on operating expenses.
| | | | | | |
| | | Beginning Account | | Ending Account | | Expenses Paid During |
| Class A | | Value 5/1/10 | | Value 10/31/10 | | Period* 5/1/10–10/31/10 |
| Actual | $ | 1,000 | $ | 1,053.70 | $ | 6.47 |
| Hypothetical (5% return before expenses) | $ | 1,000 | $ | 1,018.90 | $ | 6.36 |
| Class B | | | | | | |
| Actual | $ | 1,000 | $ | 1,054.70 | $ | 6.47 |
| Hypothetical (5% return before expenses) | $ | 1,000 | $ | 1,018.90 | $ | 6.36 |
| Class C | | | | | | |
| Actual | $ | 1,000 | $ | 1,049.50 | $ | 10.33 |
| Hypothetical (5% return before expenses) | $ | 1,000 | $ | 1,015.12 | $ | 10.16 |
| Advisor Class | | | | | | |
| Actual | $ | 1,000 | $ | 1,055.00 | $ | 5.18 |
| Hypothetical (5% return before expenses) | $ | 1,000 | $ | 1,020.16 | $ | 5.09 |
*Expenses are calculated using the most recent six-month expense ratio, annualized for each class (A: 1.25%; B: 1.25% (net of expense waiver); C: 2.00%; and Advisor: 1.00%), multiplied by the average account value over the period, multiplied by 184/365 to reflect the one-half year period.
12 | Semiannual Report
Franklin Real Estate Securities Trust
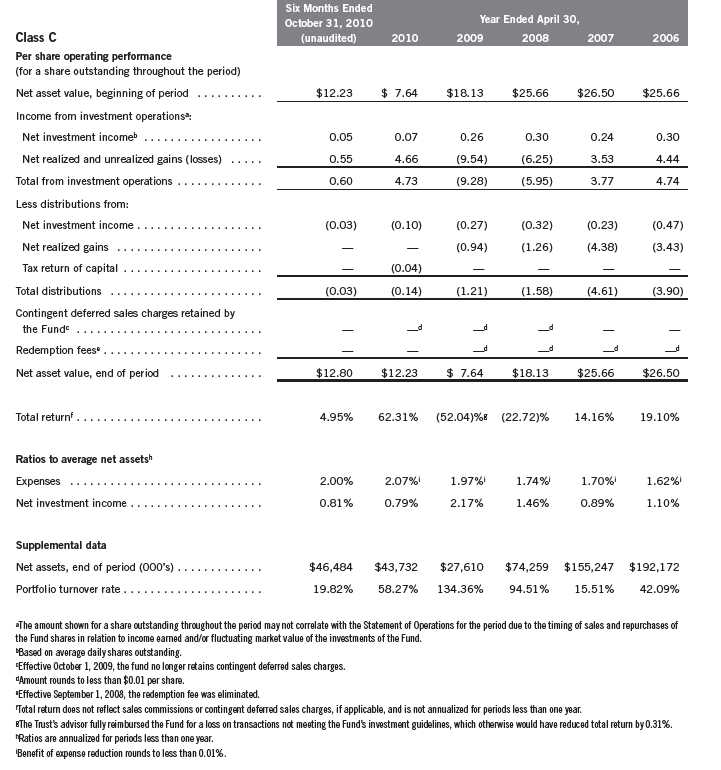
Financial Highlights
Franklin Real Estate Securities Fund
Semiannual Report | The accompanying notes are an integral part of these financial statements. | 13
Franklin Real Estate Securities Trust
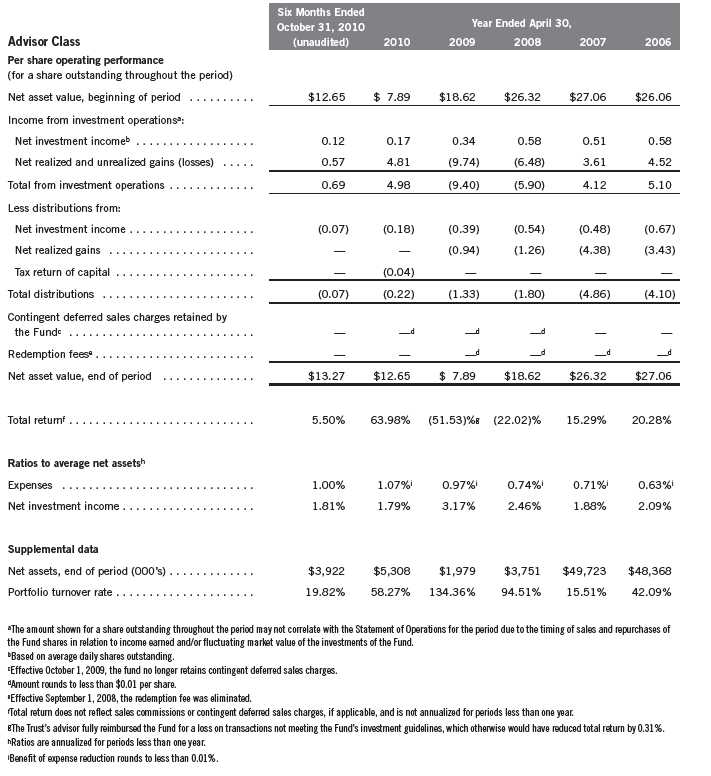
Financial Highlights (continued)
Franklin Real Estate Securities Fund
14 | The accompanying notes are an integral part of these financial statements. | Semiannual Report
Franklin Real Estate Securities Trust
Financial Highlights (continued)
Franklin Real Estate Securities Fund
Semiannual Report | The accompanying notes are an integral part of these financial statements. | 15
Franklin Real Estate Securities Trust
Financial Highlights (continued)
Franklin Real Estate Securities Fund
16 | The accompanying notes are an integral part of these financial statements. | Semiannual Report
Franklin Real Estate Securities Trust
Statement of Investments, October 31, 2010 (unaudited)
| | | | |
| Franklin Real Estate Securities Fund | Industry | Shares | | VValue |
| Common Stocks 97.8% | | | | |
| Diversified REITs 7.9% | | | | |
| Colonial Properties Trust | | 205,700 | $ | 3,688,201 |
| Liberty Property Trust | | 52,900 | | 1,770,034 |
| Vornado Realty Trust | | 164,945 | | 14,414,544 |
| | | | | 19,872,779 |
| Hotels, Resorts & Cruise Lines 2.0% | | | | |
| a Hyatt Hotels Corp. | | 61,100 | | 2,462,330 |
| Starwood Hotels & Resorts Worldwide Inc. | | 49,100 | | 2,658,274 |
| | | | | 5,120,604 |
| Industrial REITs 4.6% | | | | |
| AMB Property Corp. | | 188,200 | | 5,305,358 |
| DuPont Fabros Technology Inc. | | 120,100 | | 3,014,510 |
| b ProLogis | | 229,300 | | 3,129,945 |
| | | | | 11,449,813 |
| Office REITs 16.3% | | | | |
| Alexandria Real Estate Equities Inc. | | 69,900 | | 5,136,252 |
| Boston Properties Inc. | | 187,300 | | 16,143,387 |
| Digital Realty Trust Inc. | | 50,100 | | 2,992,473 |
| Douglas Emmett Inc. | | 108,500 | | 1,946,490 |
| Government Properties Income Trust | | 68,100 | | 1,817,589 |
| Highwoods Properties Inc. | | 98,000 | | 3,246,740 |
| Kilroy Realty Corp. | | 79,700 | | 2,723,349 |
| SL Green Realty Corp. | | 101,900 | | 6,696,868 |
| | | | | 40,703,148 |
| Real Estate Operating Companies 0.6% | | | | |
| a Forest City Enterprises Inc., A | | 102,900 | | 1,501,311 |
| Residential REITs 18.0% | | | | |
| American Campus Communities Inc. | | 90,300 | | 2,856,189 |
| Apartment Investment & Management Co., A | | 133,400 | | 3,109,554 |
| AvalonBay Communities Inc. | | 70,072 | | 7,449,354 |
| BRE Properties Inc. | | 63,900 | | 2,743,227 |
| Camden Property Trust | | 56,400 | | 2,796,876 |
| Equity Lifestyle Properties Inc. | | 26,200 | | 1,491,304 |
| Equity Residential | | 313,244 | | 15,233,056 |
| Essex Property Trust Inc. | | 25,000 | | 2,824,000 |
| UDR Inc. | | 288,362 | | 6,482,378 |
| | | | | 44,985,938 |
| Retail REITs 21.9% | | | | |
| Developers Diversified Realty Corp. | | 348,007 | | 4,489,290 |
| Federal Realty Investment Trust | | 77,500 | | 6,353,450 |
| Kimco Realty Corp. | | 268,400 | | 4,624,532 |
| The Macerich Co. | | 77,021 | | 3,435,907 |
| National Retail Properties Inc. | | 161,000 | | 4,363,100 |
| Realty Income Corp. | | 90,600 | | 3,105,768 |
| Regency Centers Corp. | | 96,500 | | 4,070,370 |
| Simon Property Group Inc. | | 252,300 | | 24,225,846 |
| | | | | 54,668,263 |
Semiannual Report | 17
Franklin Real Estate Securities Trust
Statement of Investments, October 31, 2010 (unaudited) (continued)
| | | | |
| Franklin Real Estate Securities Fund | Shares | | Value | |
| Common Stocks (continued) | | | | |
| Specialized REITs 26.5% | | | | |
| HCP Inc. | 294,900 | $ | 10,619,349 | |
| Health Care REIT Inc. | 95,900 | | 4,900,490 | |
| Hersha Hospitality Trust | 225,800 | | 1,377,380 | |
| Host Hotels & Resorts Inc. | 942,800 | | 14,981,092 | |
| LaSalle Hotel Properties | 89,000 | | 2,108,410 | |
| Nationwide Health Properties Inc. | 110,800 | | 4,523,964 | |
| a Pebblebrook Hotel Trust | 64,300 | | 1,259,637 | |
| Public Storage | 129,400 | | 12,839,068 | |
| Ventas Inc. | 255,942 | | 13,708,253 | |
| | | | 66,317,643 | |
| Total Common Stocks (Cost $144,809,614) | | | 244,619,499 | |
| |
| Short Term Investments (Cost $6,415,988) 2.6% | | | | |
| Money Market Funds 2.6% | | | | |
| a,cInstitutional Fiduciary Trust Money Market Portfolio, 0.00% | 6,415,988 | | 6,415,988 | |
| Total Investments (Cost $151,225,602) 100.4% | | | 251,035,487 | |
| Other Assets, less Liabilities (0.4)% | | | (895,520 | ) |
| Net Assets 100.0% | | $ | 250,139,967 | |
See Abbreviations on page 30.
aNon-income producing.
bA portion or all of the security purchased on a delayed delivery basis. See Note 1(b).
cSee Note 7 regarding investments in the Institutional Fiduciary Trust Money Market Portfolio. The rate shown is the annualized seven-day yield at period end.
18 | The accompanying notes are an integral part of these financial statements. | Semiannual Report
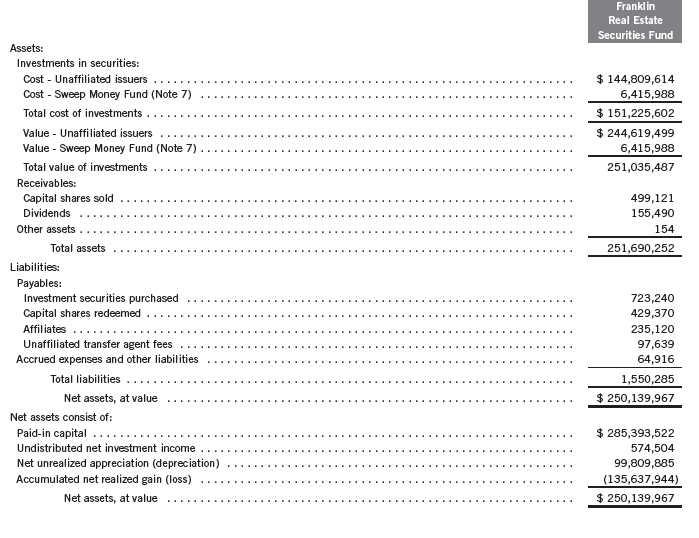
Franklin Real Estate Securities Trust
Financial Statements
Statement of Assets and Liabilities
October 31, 2010 (unaudited)
Semiannual Report | The accompanying notes are an integral part of these financial statements. | 19
Franklin Real Estate Securities Trust
Financial Statements (continued)
Statement of Assets and Liabilities (continued)
October 31, 2010 (unaudited)
| | |
| | | Franklin |
| | | Real Estate |
| | | Securities Fund |
| Class A: | | |
| Net assets, at value | $ | 194,648,296 |
| Shares outstanding | | 14,764,903 |
| Net asset value per sharea | $ | 13.18 |
| Maximum offering price per share (net asset value per share ÷ 94.25%) | $ | 13.98 |
| Class B: | | |
| Net assets, at value | $ | 5,085,083 |
| Shares outstanding | | 392,507 |
| Net asset value and maximum offering price per sharea | $ | 12.96 |
| Class C: | | |
| Net assets, at value | $ | 46,484,423 |
| Shares outstanding | | 3,630,807 |
| Net asset value and maximum offering price per sharea | $ | 12.80 |
| Advisor Class: | | |
| Net assets, at value | $ | 3,922,165 |
| Shares outstanding | | 295,514 |
| Net asset value and maximum offering price per share | $ | 13.27 |
| |
| |
| aRedemption price is equal to net asset value less contingent deferred sales charges, if applicable. | | |
20 | The accompanying notes are an integral part of these financial statements. | Semiannual Report
Franklin Real Estate Securities Trust
Financial Statements (continued)
Statement of Operations
for the six months ended October 31, 2010 (unaudited)
| | | |
| | | Franklin | |
| | | Real Estate | |
| | | Securities Fund | |
| Investment income: | | | |
| Dividends | $ | 3,321,361 | |
| Expenses: | | | |
| Management fees (Note 3a) | | 647,141 | |
| Distribution fees: (Note 3c) | | | |
| Class A | | 227,106 | |
| Class B | | 29,406 | |
| Class C | | 218,505 | |
| Transfer agent fees (Note 3e) | | 405,276 | |
| Custodian fees (Note 4) | | 1,616 | |
| Reports to shareholders | | 47,407 | |
| Registration and filing fees | | 42,311 | |
| Professional fees | | 22,781 | |
| Trustees’ fees and expenses | | 9,252 | |
| Other | | 4,189 | |
| Total expenses | | 1,654,990 | |
| Expenses waived/paid by affiliates (Note 3c) | | (22,063 | ) |
| Net expenses | | 1,632,927 | |
| Net investment income | | 1,688,434 | |
| Realized and unrealized gains (losses): | | | |
| Net realized gain (loss) from investments | | 7,301,749 | |
| Net change in unrealized appreciation (depreciation) on investments | | 3,343,766 | |
| Net realized and unrealized gain (loss) | | 10,645,515 | |
| Net increase (decrease) in net assets resulting from operations | $ | 12,333,949 | |
Semiannual Report | The accompanying notes are an integral part of these financial statements. | 21
Franklin Real Estate Securities Trust
Financial Statements (continued)
| | | | | | | |
| Statements of Changes in Net Assets | | | | | | | |
| |
| |
| | | Franklin Real Estate | |
| | | Securities Fund | | |
| | | Six Months Ended | | | | | |
| | | October 31, 2010 | | | Year Ended | |
| | | (unaudited) | | | April 30, 2010 | |
| Increase (decrease) in net assets: | | | | | | | |
| Operations: | | | | | | | |
| Net investment income | $ | 1,688,434 | | $ | 2,888,743 | |
| Net realized gain (loss) from investments | | 7,301,749 | | | 16,328,217 | |
| Net change in unrealized appreciation (depreciation) on investments | | 3,343,766 | | | 81,161,041 | |
| Net increase (decrease) in net assets resulting from operations | | 12,333,949 | | | 100,378,001 | |
| Distributions to shareholders from: | | | | | | | |
| Net investment income: | | | | | | | |
| Class A | | (926,776 | ) | | (2,664,085 | ) |
| Class B | | (29,575 | ) | | | (118,245 | ) |
| Class C | | (122,626 | ) | | | (346,451 | ) |
| Advisor Class | | (34,953 | ) | | | (48,176 | ) |
| Tax return of capital: | | | | | | | |
| Class A | | — | | | | (631,767 | ) |
| Class B | | — | | | | (27,359 | ) |
| Class C | | — | | | | (133,348 | ) |
| Advisor Class | | — | | | | (11,564 | ) |
| Total distributions to shareholders | | (1,113,930 | ) | | (3,980,995 | ) |
| Capital share transactions: (Note 2) | | | | | | | |
| Class A | | 3,163,377 | | | (33,255,615 | ) |
| Class B | | (2,078,893 | ) | | (3,382,605 | ) |
| Class C | | 700,682 | | | | (54,594 | ) |
| Advisor Class | | (1,656,414 | ) | | 1,819,607 | |
| Total capital share transactions | | 128,752 | | | (34,873,207 | ) |
| Contingent deferred sales charges retained by the Fund | | — | | | | 878 | |
| Net increase (decrease) in net assets | | 11,348,771 | | | 61,524,677 | |
| Net assets: | | | | | | | |
| Beginning of period | | 238,791,196 | | | 177,266,519 | |
| End of period | $ | 250,139,967 | | $ | 238,791,196 | |
| Undistributed net investment income included in net assets: | | | | | | | |
| End of period | $ | 574,504 | | | $ | — | |
22 | The accompanying notes are an integral part of these financial statements. | Semiannual Report
Franklin Real Estate Securities Trust
Notes to Financial Statements (unaudited)
Franklin Real Estate Securities Fund
1. ORGANIZATION AND SIGNIFICANT ACCOUNTING POLICIES
Franklin Real Estate Securities Trust (Trust) is registered under the Investment Company Act of 1940, as amended, (1940 Act) as an open-end investment company, consisting of one fund, the Franklin Real Estate Securities Fund (Fund). The Fund offers four classes of shares: Class A, Class B, Class C, and Advisor Class. Each class of shares differs by its initial sales load, contingent deferred sales charges, distribution fees, voting rights on matters affecting a single class and its exchange privilege.
The following summarizes the Fund’s significant accounting policies.
a. Financial Instrument Valuation
The Fund values its investments in securities and other assets and liabilities carried at fair value daily. Fair value is the price that would be received to sell an asset or paid to transfer a liability in an orderly transaction between market participants on the measurement date. Under procedures approved by the Fund’s Board of Trustees, the Fund may utilize independent pricing services, quotations from securities and financial instrument dealers, and other market sources to determine fair value.
Equity securities listed on an exchange or on the NASDAQ National Market System are valued at the last quoted sale price or the official closing price of the day, respectively. Over-the-counter securities are valued within the range of the most recent quoted bid and ask prices. Securities that trade in multiple markets or on multiple exchanges are valued according to the broadest and most representative market. Certain equity securities are valued based upon fundamental characteristics or relationships to similar securities. Investments in open-end mutual funds are valued at the closing net asset value.
The Fund has procedures to determine the fair value of securities and other financial instruments for which market prices are not readily available or which may not be reliably priced. Under these procedures, the Fund primarily employs a market-based approach which may use related or comparable assets or liabilities, recent transactions, market multiples, book values, and other relevant information for the investment to determine the fair value of the investment. The Fund may also use an income-based valuation approach in which the anticipated future cash flows of the investment are discounted to calculate fair value. Discounts may also be applied due to the nature or duration of any restrictions on the disposition of the investments. Due to the inherent uncertainty of valuations of such investments, the fair values may differ significantly from the values that would have been used had an active market existed.
Semiannual Report | 23
Franklin Real Estate Securities Trust
Notes to Financial Statements (unaudited) (continued)
Franklin Real Estate Securities Fund
| 1. | ORGANIZATION AND SIGNIFICANT ACCOUNTING POLICIES (continued) |
| b. | Securities Purchased on a Delayed Delivery Basis |
The Fund may purchase securities on a delayed delivery basis, with payment and delivery scheduled for a future date. These transactions are subject to market fluctuations and are subject to the risk that the value at delivery may be more or less than the trade date purchase price. Although the Fund will generally purchase these securities with the intention of holding the securities, it may sell the securities before the settlement date. Sufficient assets have been segregated for these securities.
c. Income Taxes
It is the Fund’s policy to qualify as a regulated investment company under the Internal Revenue Code and to distribute to shareholders substantially all of its taxable income and net realized gains. As a result, no provision for U.S. federal income taxes is required. The Fund files U.S. income tax returns as well as tax returns in certain other jurisdictions. The Fund recognizes in its financial statements the effects including penalties and interest, if any, of a tax position taken on tax return (or expected to be taken) when it’s more likely than not (a greater than 50% probability), based on the technical merits, that the tax position will be sustained upon examination by the tax authorities. As of October 31, 2010, and for all open tax years, the Fund has determined that no provision for income tax is required in the Fund’s financial statements. Open tax years are those that remain subject to examination and are ba sed on each tax jurisdiction statute of limitation. The Fund is not aware of any tax position for which it is reasonably possible that the total amounts of unrecognized tax effects will significantly change in the next twelve months.
d. Security Transactions, Investment Income, Expenses and Distributions
Security transactions are accounted for on trade date. Realized gains and losses on security transactions are determined on a specific identification basis. Estimated expenses are accrued daily. Dividend income is recorded on the ex-dividend date. Distributions to shareholders are recorded on the ex-dividend date and are determined according to income tax regulations (tax basis). Distributable earnings determined on a tax basis may differ from earnings recorded in accordance with accounting principles generally accepted in the United States of America. These differences may be permanent or temporary. Permanent differences are reclassified among capital accounts to reflect their tax character. These reclassifications have no impact on net assets or the results of operations. Temporary differences are not reclassified, as they may reverse in subsequent periods.
Realized and unrealized gains and losses and net investment income, not including class specific expenses, are allocated daily to each class of shares based upon the relative proportion of net assets of each class. Differences in per share distributions, by class, are generally due to differences in class specific expenses.
24 | Semiannual Report
Franklin Real Estate Securities Trust
Notes to Financial Statements (unaudited) (continued)
Franklin Real Estate Securities Fund
| 1. | ORGANIZATION AND SIGNIFICANT ACCOUNTING POLICIES (continued) |
| d. | Security Transactions, Investment Income, Expenses and Distributions (continued) |
Distributions received by the Fund from certain securities may be a return of capital (ROC). Such distributions reduce the cost basis of the securities, and any distributions in excess of the cost basis are recognized as capital gains.
e. Accounting Estimates
The preparation of financial statements in accordance with accounting principles generally accepted in the United States of America requires management to make estimates and assumptions that affect the reported amounts of assets and liabilities at the date of the financial statements and the amounts of income and expenses during the reporting period. Actual results could differ from those estimates.
f. Guarantees and Indemnifications
Under the Trust’s organizational documents, its officers and trustees are indemnified by the Trust against certain liabilities arising out of the performance of their duties to the Trust. Additionally, in the normal course of business, the Trust, on behalf of the Fund, enters into contracts with service providers that contain general indemnification clauses. The Trust’s maximum exposure under these arrangements is unknown as this would involve future claims that may be made against the Trust that have not yet occurred. Currently, the Trust expects the risk of loss to be remote.
2. SHARES OF BENEFICIAL INTEREST
At October 31, 2010, there were an unlimited number of shares authorized ($0.01 par value).
Transactions in the Fund’s shares were as follows:
| | | | | | | | | | | | |
| | Six Months Ended | | Year Ended | |
| | October 31, 2010 | | April 30, 2010 | |
| | Shares | | | | Amount | | Shares | | | | Amount | |
| Class A Shares: | | | | | | | | | | | | |
| Shares sold | 2,094,450 | | $ | 25,883,124 | | 4,268,997 | | $ | 42,180,930 | |
| Shares issued in reinvestment of | | | | | | | | | | | | |
| distributions | 65,583 | | | | 842,010 | | 316,139 | | | | 3,066,157 | |
| Shares redeemed | (1,939,096 | ) | | (23,561,757 | ) | (7,969,298 | ) | | (78,502,702 | ) |
| Net increase (decrease) | 220,937 | | | $ | 3,163,377 | | (3,384,162 | ) | $ | (33,255,615 | ) |
| Class B Shares: | | | | | | | | | | | | |
| Shares sold | 12,805 | | | $ | 154,356 | | 34,781 | | | $ | 330,447 | |
| Shares issued in reinvestment of | | | | | | | | | | | | |
| distributions | 2,146 | | | | 27,042 | | 14,224 | | | | 134,646 | |
| Shares redeemed | (185,860 | ) | | | (2,260,291 | ) | (408,704 | ) | | | (3,847,698 | ) |
| Net increase (decrease) | (170,909 | ) | | $ | (2,078,893 | ) | (359,699 | ) | | $ | (3,382,605 | ) |
Semiannual Report | 25
Franklin Real Estate Securities Trust
Notes to Financial Statements (unaudited) (continued)
| | | | | | | | | | |
| Franklin Real Estate Securities Fund | | | | | | | | | | |
| |
| |
| 2. SHARES OF BENEFICIAL INTEREST (continued) | | | | | | | | | |
| |
| | Six Months Ended | | Year Ended | |
| | October 31, 2010 | | April 30, 2010 | |
| | Shares | | | Amount | | Shares | | | Amount | |
| Class C Shares: | | | | | | | | | | |
| Shares sold | 447,819 | | $ | 5,423,092 | | 825,938 | | $ | 8,275,548 | |
| Shares issued in reinvestment of | | | | | | | | | | |
| distributions | 8,779 | | | 109,641 | | 43,619 | | | 425,145 | |
| Shares redeemed | (402,393 | ) | | (4,832,051 | ) | (908,157 | ) | | (8,755,287 | ) |
| Net increase (decrease) | 54,205 | | $ | 700,682 | | (38,600 | ) | $ | (54,594 | ) |
| Advisor Class Shares: | | | | | | | | | | |
| Shares sold | 161,960 | | $ | 1,986,863 | | 243,052 | | $ | 2,591,549 | |
| Shares issued in reinvestment of | | | | | | | | | | |
| distributions | 2,526 | | | 32,665 | | 5,550 | | | 54,236 | |
| Shares redeemed | (288,676 | ) | | (3,675,942 | ) | (79,840 | ) | | (826,178 | ) |
| Net increase (decrease) | (124,190 | ) | $ | (1,656,414 | ) | 168,762 | | $ | 1,819,607 | |
3. TRANSACTIONS WITH AFFILIATES
Franklin Resources, Inc. is the holding company for various subsidiaries that together are referred to as Franklin Templeton Investments. Certain officers and trustees of the Trust are also officers and/or directors of the following subsidiaries:
| |
Subsidiary Franklin Templeton Institutional, LLC (FT Institutional) Franklin Templeton Services, LLC (FT Services) Franklin Templeton Distributors, Inc. (Distributors) Franklin Templeton Investor Services, LLC (Investor Services) | Affiliation Investment manager Administrative manager Principal underwriter Transfer agent |
a. Management Fees
The Fund pays an investment management fee to FT Institutional based on the month-end net assets of the Fund as follows:
| | |
| Annualized Fee Rate | | Net Assets |
| 0.625 | % | Up to and including $100 million |
| 0.500 | % | Over $100 million, up to and including $250 million |
| 0.450 | % | Over $250 million, up to and including $7.5 billion |
| 0.440 | % | Over $7.5 billion, up to and including $10 billion |
| 0.430 | % | Over $10 billion, up to and including $12.5 billion |
| 0.420 | % | Over $12.5 billion, up to and including $15 billion |
| 0.400 | % | In excess of $15 billion |
26 | Semiannual Report
Franklin Real Estate Securities Trust
Notes to Financial Statements (unaudited) (continued)
Franklin Real Estate Securities Fund
| 3. | TRANSACTIONS WITH AFFILIATES (continued) |
| b. | Administrative Fees |
Under an agreement with FT Institutional, FT Services provides administrative services to the Fund. The fee is paid by FT Institutional based on average daily net assets, and is not an additional expense of the Fund.
c. Distribution Fees
The Fund’s Board of Trustees has adopted distribution plans for each share class, with the exception of Advisor Class shares, pursuant to Rule 12b-1 under the 1940 Act. Under the Fund’s Class A reimbursement distribution plan, the Fund reimburses Distributors for costs incurred in connection with the servicing, sale and distribution of the Fund’s shares up to the maximum annual plan rate. Under the Class A reimbursement distribution plan, costs exceeding the maximum for the current plan year cannot be reimbursed in subsequent periods.
In addition, under the Fund’s Class B and C compensation distribution plans, the Fund pays Distributors for costs incurred in connection with the servicing, sale and distribution of the Fund’s shares up to the maximum annual plan rate for each class.
The maximum annual plan rates, based on the average daily net assets, for each class, are as follows:
| | |
| Class A | 0.25 | % |
| Class B | 1.00 | %a |
| Class C | 1.00 | % |
aThe Class B maximum annual plan rate consists of a dealer-service fee of 0.25% and an asset based sales charge of 0.75%. For the period from December 17, 2007 through September 30, 2009, the Fund temporarily discontinued payments of the asset-based sales charge in accordance with NASD Rule 2830, which sets forth a maximum aggregate sales charge payable by a fund. Because the maximum aggregate sales charge adjusts based on certain factors, payments of the asset-based sales charge could have resumed on October 1, 2009. However, Distributors has voluntarily agreed to waive the asset-based sales charge until further notice to the Board of Trustees.
d. Sales Charges/Underwriting Agreements
Distributors has advised the Fund of the following commission transactions related to the sales and redemptions of the Fund’s shares for the period:
| | |
| Sales charges retained net of commissions paid to unaffiliated | | |
| broker/dealers | $ | 51,038 |
| Contingent deferred sales charges retained | $ | 2,207 |
e. Transfer Agent Fees
For the period ended October 31, 2010, the Fund paid transfer agent fees of $405,276, of which $235,385 was retained by Investor Services.
Semiannual Report | 27
Franklin Real Estate Securities Trust
Notes to Financial Statements (unaudited) (continued)
Franklin Real Estate Securities Fund
4. EXPENSE OFFSET ARRANGEMENT
The Fund has entered into an arrangement with its custodian whereby credits realized as a result of uninvested cash balances are used to reduce a portion of the Fund’s custodian expenses. During the period ended October 31, 2010, there were no credits earned.
5. INCOME TAXES
For tax purposes, capital losses may be carried over to offset future capital gains, if any.
At April 30, 2010, the capital loss carryforwards were as follows:
| | |
| Capital loss carryforwards expiring in: | | |
| 2017 | $ | 32,158,781 |
| 2018 | | 63,919,027 |
| | $ | 96,077,808 |
For tax purposes, realized capital losses occurring subsequent to October 31 may be deferred and treated as occurring on the first day of the following fiscal year. At April 30, 2010, the Fund deferred realized capital losses of $1,883,172.
At October 31, 2010, the cost of investments and net unrealized appreciation (depreciation) for income tax purposes were as follows:
| | | |
| Cost of investments | $ | 186,403,105 | |
| |
| Unrealized appreciation | $ | 65,439,234 | |
| Unrealized depreciation | | (806,852 | ) |
| Net unrealized appreciation (depreciation) | $ | 64,632,382 | |
Net investment income differs for financial statement and tax purposes primarily due to differing treatment of regulatory settlement.
Net realized gains (losses) differ for financial statement and tax purposes primarily due to differing treatment of wash sales.
6. INVESTMENT TRANSACTIONS
Purchases and sales of investments (excluding short term securities) for the period ended October 31, 2010, aggregated $46,781,388 and $45,177,529, respectively.
28 | Semiannual Report
Franklin Real Estate Securities Trust
Notes to Financial Statements (unaudited) (continued)
Franklin Real Estate Securities Fund
7. INVESTMENTS IN INSTITUTIONAL FIDUCIARY TRUST MONEY MARKET PORTFOLIO
The Fund may invest in the Institutional Fiduciary Trust Money Market Portfolio (Sweep Money Fund), an open-end investment company managed by Franklin Advisers, Inc. (an affiliate of the investment manager). Management fees paid by the Fund are reduced on assets invested in the Sweep Money Fund, in an amount not to exceed the management and administrative fees paid by the Sweep Money Fund.
8. CREDIT FACILITY
The Fund, together with other U.S. registered and foreign investment funds (collectively “Borrowers”), managed by Franklin Templeton Investments, are borrowers in a joint syndicated senior unsecured credit facility totaling $750 million (Global Credit Facility) which matures on January 21, 2011. This Global Credit Facility provides a source of funds to the Borrowers for temporary and emergency purposes, including the ability to meet future unanticipated or unusually large redemption requests.
Under the terms of the Global Credit Facility, the Fund shall, in addition to interest charged on any borrowings made by the Fund and other costs incurred by the Fund, pay its share of fees and expenses incurred in connection with the implementation and maintenance of the Global Credit Facility, based upon its relative share of the aggregate net assets of all of the Borrowers, including an annual commitment fee of 0.10% based upon the unused portion of the Global Credit Facility, which is reflected in other expenses on the Statement of Operations. During the period ended October 31, 2010, the Fund did not use the Global Credit Facility.
9. REGULATORY MATTERS
During the period ended October 31, 2010, the Fund received $24,313 resulting from a settlement between the SEC and Franklin Advisers, Inc. (an affiliate of the investment manager) relating to market-timing activities, as previously reported in the Fund’s financial statements during the years ended April 30, 2004 through April 30, 2007. This payment is included in capital shares transactions on the Statements of Changes in Net Assets.
Semiannual Report | 29
Franklin Real Estate Securities Trust
Notes to Financial Statements (unaudited) (continued)
Franklin Real Estate Securities Fund
10. FAIR VALUE MEASUREMENTS
The Fund follows a fair value hierarchy that distinguishes between market data obtained from independent sources (observable inputs) and the Fund’s own market assumptions (unobservable inputs). These inputs are used in determining the value of the Fund’s investments and are summarized in the following fair value hierarchy:
- Level 1 – quoted prices in active markets for identical securities
- Level 2 – other significant observable inputs (including quoted prices for similar securities, interest rates, prepayment speed, credit risk, etc.)
- Level 3 – significant unobservable inputs (including the Fund’s own assumptions in determining the fair value of investments)
The inputs or methodology used for valuing securities are not an indication of the risk associated with investing in those securities.
For movements between the levels within the fair value hierarchy, the Fund has adopted a policy of recognizing the transfers as of the date of the underlying event which caused the movement.
At October 31, 2010, all of the Fund’s investments in securities carried at fair value were in Level 1 inputs. For detailed industry descriptions, see the accompanying Statement of Investments.
11. SUBSEQUENT EVENTS
The Fund has evaluated subsequent events through the issuance of the financial statements and determined that no events have occurred that require disclosure.
ABBREVIATIONS
Selected Portfolio
REIT - Real Estate Investment Trust
30 | Semiannual Report
Franklin Real Estate Securities Trust
Shareholder Information
Franklin Real Estate Securities Fund
Proxy Voting Policies and Procedures
The Fund’s investment manager has established Proxy Voting Policies and Procedures (Policies) that the Fund uses to determine how to vote proxies relating to portfolio securities. Shareholders may view the Fund’s complete Policies online at franklintempleton.com. Alternatively, shareholders may request copies of the Policies free of charge by calling the Proxy Group collect at (954) 527-7678 or by sending a written request to: Franklin Templeton Companies, LLC, 500 East Broward Boulevard, Suite 1500, Fort Lauderdale, FL 33394, Attention: Proxy Group. Copies of the Fund’s proxy voting records are also made available online at franklintempleton.com and posted on the U.S. Securities and Exchange Commission’s website at sec.gov and reflect the most recent 12-month period ended June 30.
Quarterly Statement of Investments
The Fund files a complete statement of investments with the U.S. Securities and Exchange Commission for the first and third quarters for each fiscal year on Form N-Q. Shareholders may view the filed Form N-Q by visiting the Commission’s website at sec.gov. The filed form may also be viewed and copied at the Commission’s Public Reference Room in Washington, DC. Information regarding the operations of the Public Reference Room may be obtained by calling (800) SEC-0330.
Semiannual Report | 31
This page intentionally left blank.

Item 2. Code of Ethics.
(a) The Registrant has adopted a code of ethics that applies to its principal executive officers and principal financial and accounting officer.
(c) N/A
(d) N/A
(f) Pursuant to Item 12(a)(1), the Registrant is attaching as an exhibit a copy of its code of ethics that applies to its principal executive officers and principal financial and accounting officer.
Item 3. Audit Committee Financial Expert.
(a)(1) The Registrant has an audit committee financial expert serving on its audit committee.
(2) The audit committee financial expert is John B. Wilson and he is "independent" as defined under the relevant Securities and Exchange Commission Rules and Releases.
Item 4. Principal Accountant Fees and Services. N/A
Item 5. Audit Committee of Listed Registrants. N/A
Item 6. Schedule of Investments. N/A
Item 7. Disclosure of Proxy Voting Policies and Procedures for Closed-End Management Investment Companies. N/A
Item 8. Portfolio Managers of Closed-End Management Investment Companies. N/A
Item 9. Purchases of Equity Securities by Closed-End Management Investment Company and Affiliated Purchasers. N/A
Item 10. Submission of Matters to a Vote of Security Holders.
There have been no changes to the procedures by which shareholders may recommend nominees to the Registrant's Board of Trustees that would require disclosure herein.
Item 11. Controls and Procedures.
(a) Evaluation of Disclosure Controls and Procedures. The Registrant maintains disclosure controls and procedures that are designed to ensure that information required to be disclosed in the Registrant’s filings under the Securities Exchange Act of 1934 and the Investment Company Act of 1940 is recorded, processed, summarized and reported within the periods specified in the rules and forms of the Securities and Exchange Commission. Such information is accumulated and communicated to the Registrant’s management, including its principal executive officer and principal financial officer, as appropriate, to allow timely decisions regarding required disclosure. The Registrant’s management, including the principal executive officer and the principal financial officer, recognizes that any set of controls and procedures, no matter how well designed and operated, can provide only reasonable assurance of achieving the desired control objectives.
Within 90 days prior to the filing date of this Shareholder Report on Form N-CSR, the Registrant had carried out an evaluation, under the supervision and with the participation of the Registrant’s management, including the Registrant’s principal executive officer and the Registrant’s principal financial officer, of the effectiveness of the design and operation of the Registrant’s disclosure controls and procedures. Based on such evaluation, the Registrant’s principal executive officer and principal financial officer concluded that the Registrant’s disclosure controls and procedures are effective.
(b) Changes in Internal Controls. There have been no significant changes in the Registrant’s internal controls or in other factors that could significantly affect the internal controls subsequent to the date of their evaluation in connection with the preparation of this Shareholder Report on Form N-CSR.
Item 12. Exhibits.
(a) (1) Code of Ethics
(a) (2) Certifications pursuant to Section 302 of the Sarbanes-Oxley Act of 2002 of Laura F. Fergerson, Chief Executive Officer - Finance and Administration, and Gaston Gardey, Chief Financial Officer and Chief Accounting Officer
(b) Certifications pursuant to Section 906 of the Sarbanes-Oxley Act of 2002 of Laura F. Fergerson, Chief Executive Officer - Finance and Administration, and Gaston Gardey, Chief Financial Officer and Chief Accounting Officer
SIGNATURES
Pursuant to the requirements of the Securities Exchange Act of 1934 and the Investment Company Act of 1940, the registrant has duly caused this report to be signed on its behalf by the undersigned, thereunto duly authorized.
FRANKLIN REAL ESTATE SECURITIES TRUST
By /s/LAURA F. FERGERSON
Laura F. Fergerson
Chief Executive Officer –
Finance and Administration
Date December 28, 2010
Pursuant to the requirements of the Securities Exchange Act of 1934 and the Investment Company Act of 1940, this report has been signed below by the following persons on behalf of the registrant and in the capacities and on the dates indicated.
By /s/LAURA F. FERGERSON
Laura F. Fergerson
Chief Executive Officer –
Finance and Administration
Date December 28, 2010
By /s/GASTON GARDEY
Gaston Gardey
Chief Financial Officer and
Chief Accounting Officer
Date December 28, 2010