
| 1
Semiannual Report
Franklin Real Estate Securities Fund
Your Fund’s Goal and Main Investments: Franklin Real Estate Securities Fund seeks to maximize total return by investing at least 80% of its net assets in equity securities of companies in the real estate industry, including real estate investment trusts (REITs) and companies that derive at least half of their assets or revenues from the ownership, construction, management or sale of residential, commercial or industrial real estate.1

Semiannual Report | 3

gross domestic product growth registered an estimated annualized 2.0% rate, following a 1.3% annualized rate in 2011’s second quarter.3
The U.S. financial system continued to heal, but the country still faced persistent unemployment, housing market weakness and massive debt. The U.S. Federal Reserve Board (Fed) cut its growth forecast for the world’s largest economy as manufacturing growth slowed globally. Some observers attributed the slow growth to the effects of Japan’s earthquake and its aftermath, high commodity prices and a fading inventory restocking cycle. Monetary policy tightening in most parts of the world also inhibited growth and cooled the commodities rally. Inflation rose across much of the world but stayed relatively contained in the U.S. The Fed sought to boost economic growth by maintaining its accommodative monetary policy and undertook a second round of quantitative easing that ended on June 30. Subsequently, the Fed continued to purchase Treasuries with proceeds from maturing debt to support economic growth.
Corporate profit strength and favorable economic prospects in some regions of the world supported equities, but investors weathered oil supply disruptions due to revolutions and civil unrest in the Middle East and North Africa that began in late 2010, as well as the multiple crises triggered by Japan’s earthquake and tsunami in early 2011. Also weighing on investor sentiment were sovereign debt worries and credit downgrades in Europe, the political stalemate in raising the U.S. debt ceiling and Standard & Poor’s downgrade of the long-term U.S. credit rating to AA+ from AAA. U.S. stocks declined for the six-month reporting period as measured by the Standard & Poor’s® 500 Index.
In late September, the Fed announced plans designed to boost the economy by driving down long-term interest rates. The Fed intends to sell $400 billion in short-term securities over the next year and purchase an equal amount of long-term securities. The Fed also anticipated it would keep short-term rates near zero through mid-2013. In this environment, investors sought the perceived safety of U.S. Treasuries, which drove their prices higher and yields lower for the period under review.
3. Source: Bureau of Economic Analysis.
4 | Semiannual Report
Investment Strategy
We are research-driven, fundamental investors with an active investment strategy. We use a fundamental, bottom-up, long-term approach that incorporates macro-level views in our evaluation process. We analyze individual stock and real estate market fundamentals to provide regional, property type and company-size perspectives in identifying local cyclical and thematic trends that highlight investment opportunities.
Manager’s Discussion
During the six months ended October 31, 2011, several holdings contributed to the Fund’s performance relative to its benchmark, the S&P U.S. Property Index. Two of the major contributors, Simon Property Group and Taubman Centers, are retail REITs that operate shopping malls, a group that benefited the Fund largely due to overweighting and stock selection. Simon Property’s share price rose as the company continued to generate strong earnings from its mall and premium outlet operations. As of the quarter ended September 30, 2011, Simon’s management reported higher occupancy rates, total tenant sales per square foot and average rent per square foot from the same period a year earlier. Similarly, Taubman Centers, which owns high-end shopping centers, also generated robust earnings from its mall operations, leading management to raise its guidance for full-year 2011 results in October.
The Fund’s relative and absolute performance also benefited from an overweighted position in American Campus Communities, which delivered positive returns. The residential REIT’s sales and profits received a boost during the six-month period from generally advantageous trends in the U.S. rental housing market, as well as factors specific to its operations. American Campus Communities’ apartment buildings are strategically situated, in our opinion, because they are located near or on university campuses — markets that have generally been less economically sensitive and have usually enjoyed stable demand, primarily from students.
Several holdings detracted from the Fund’s relative performance during the six-month period under review, including hotel REIT Host Hotels & Resorts, hotel company Starwood Hotels & Resorts Worldwide, and industrial REIT ProLogis. Hotel stocks generally fell on an absolute basis during the period due to investor concerns that the global economic slowdown could lead to fewer hotel bookings. The Fund’s off-benchmark position in Starwood Hotels

Semiannual Report | 5
& Resorts Worldwide and overweighted allocation to Host Hotels & Resorts hurt relative and absolute results as their stock prices tumbled during the period. ProLogis’ share price dropped during the six-month period mainly due to investor concerns about the company’s high debt and large exposure to continental Europe, especially in terms of its undeveloped land bank and development prospects.
Thank you for your continued participation in Franklin Real Estate Securities Fund. We look forward to serving your future investment needs.

Portfolio Management Team
Franklin Real Estate Securities Fund
The foregoing information reflects our analysis, opinions and portfolio holdings as of October 31, 2011, the end of the reporting period. The way we implement our main investment strategies and the resulting portfolio holdings may change depending on factors such as market and economic conditions. These opinions may not be relied upon as investment advice or an offer for a particular security. The information is not a complete analysis of every aspect of any market, country, industry, security or the Fund. Statements of fact are from sources considered reliable, but the investment manager makes no representation or warranty as to their completeness or accuracy. Although historical performance is no guarantee of future results, these insights may help you understand our investment management philosophy.
6 | Semiannual Report
Performance Summary as of 10/31/11
Your dividend income will vary depending on dividends or interest paid by securities in the Fund’s portfolio, adjusted for operating expenses of each class. Capital gain distributions are net profits realized from the sale of portfolio securities. The performance table does not reflect any taxes that a shareholder would pay on Fund dividends, capital gain distributions, if any, or any realized gains on the sale of Fund shares. Total return reflects reinvestment of the Fund’s dividends and capital gain distributions, if any, and any unrealized gains or losses.

Semiannual Report | 7
Performance Summary (continued)
Performance
Cumulative total return excludes sales charges. Average annual total returns and value of $10,000 investment include maximum sales charges. Class A: 5.75% maximum initial sales charge; Class B: contingent deferred sales charge (CDSC) declining from 4% to 1% over six years, and eliminated thereafter; Class C: 1% CDSC in first year only; Advisor Class: no sales charges.

Performance data represent past performance, which does not guarantee future results. Investment return and principal value will fluctuate, and you may have a gain or loss when you sell your shares. Current performance may differ from figures shown. For most recent month-end performance, go to franklintempleton.com or call (800) 342-5236.
8 | Semiannual Report
Performance Summary (continued)
Endnotes
The Fund concentrates in real estate securities, which involve special risks, such as declines in the value of real estate and increased susceptibility to adverse economic or regulatory developments affecting the sector. The Fund’s investments in REITs involve additional risks; since REITs typically are invested in a limited number of projects or in a particular market segment, they are more susceptible to adverse developments affecting a single project or market segment than more broadly diversified investments. Also, the Fund is a nondiversified fund and investing in a nondiversified fund involves the risk of greater price fluctuation than a more diversified portfolio. The Fund is actively managed but there is no guarantee that the manager’s investment decisions will produce the desired results. The Fund’s prospectus also includes a description of the main investment risks.
| |
Class B: Class C: | These shares have higher annual fees and expenses than Class A shares. Prior to 1/1/04, these shares were offered with an initial sales charge; thus actual total returns would have differed. These shares have higher annual fees and expenses than Class A shares. |
Advisor Class: | Shares are available to certain eligible investors as described in the prospectus. |
1. Cumulative total return represents the change in value of an investment over the periods indicated.
2. Average annual total return represents the average annual change in value of an investment over the periods indicated. Six-month return has not been annualized.
3. These figures represent the value of a hypothetical $10,000 investment in the Fund over the periods indicated.
4. In accordance with SEC rules, we provide standardized average annual total return information through the latest calendar quarter.
5. Figures are as stated in the Fund’s prospectus current as of the date of this report. In periods of market volatility, assets may decline significantly, causing total annual Fund operating expenses to become higher than the figures shown.
Semiannual Report | 9
Your Fund’s Expenses
As a Fund shareholder, you can incur two types of costs:
- Transaction costs, including sales charges (loads) on Fund purchases; and
- Ongoing Fund costs, including management fees, distribution and service (12b-1) fees, and other Fund expenses. All mutual funds have ongoing costs, sometimes referred to as operating expenses.
The following table shows ongoing costs of investing in the Fund and can help you understand these costs and compare them with those of other mutual funds. The table assumes a $1,000 investment held for the six months indicated.
Actual Fund Expenses
The first line (Actual) for each share class listed in the table provides actual account values and expenses. The “Ending Account Value” is derived from the Fund’s actual return, which includes the effect of Fund expenses.
You can estimate the expenses you paid during the period by following these steps. Of course, your account value and expenses will differ from those in this illustration:
| 1. | Divide your account value by $1,000. |
| | If an account had an $8,600 value, then $8,600 ÷ $1,000 = 8.6. |
| 2. | Multiply the result by the number under the heading “Expenses Paid During Period.” |
| | If Expenses Paid During Period were $7.50, then 8.6 x $7.50 = $64.50. |
In this illustration, the estimated expenses paid this period are $64.50.
Hypothetical Example for Comparison with Other Funds
Information in the second line (Hypothetical) for each class in the table can help you compare ongoing costs of investing in the Fund with those of other mutual funds. This information may not be used to estimate the actual ending account balance or expenses you paid during the period. The hypothetical “Ending Account Value” is based on the actual expense ratio for each class and an assumed 5% annual rate of return before expenses, which does not represent the Fund’s actual return. The figure under the heading “Expenses Paid During Period” shows the hypothetical expenses your account would have incurred under this scenario. You can compare this figure with the 5% hypothetical examples that appear in shareholder reports of other funds.
10 | Semiannual Report
Your Fund’s Expenses (continued)
Please note that expenses shown in the table are meant to highlight ongoing costs and do not reflect any transaction costs, such as sales charges. Therefore, the second line for each class is useful in comparing ongoing costs only, and will not help you compare total costs of owning different funds. In addition, if transaction costs were included, your total costs would have been higher. Please refer to the Fund prospectus for additional information on operating expenses.

Semiannual Report | 11

aThe amount shown for a share outstanding throughout the period may not correlate with the Statement of Operations for the period due to the timing of sales and repurchases of
the Fund shares in relation to income earned and/or fluctuating market value of the investments of the Fund.
bBased on average daily shares outstanding.
cEffective October 1, 2009, the fund no longer retains contingent deferred sales charges.
dAmount rounds to less than $0.01 per share.
eEffective September 1, 2008, the redemption fee was eliminated.
fTotal return does not reflect sales commissions or contingent deferred sales charges, if applicable, and is not annualized for periods less than one year.
gThe Trust’s advisor fully reimbursed the Fund for a loss on transactions not meeting the Fund’s investment guidelines, which otherwise would have reduced total return by 0.31%.
hRatios are annualized for periods less than one year.
iBenefit of expense reduction rounds to less than 0.01%.
12 | The accompanying notes are an integral part of these financial statements. | Semiannual Report

aThe amount shown for a share outstanding throughout the period may not correlate with the Statement of Operations for the period due to the timing of sales and repurchases of
the Fund shares in relation to income earned and/or fluctuating market value of the investments of the Fund.
bBased on average daily shares outstanding.
cEffective October 1, 2009, the fund no longer retains contingent deferred sales charges.
dAmount rounds to less than $0.01 per share.
eEffective September 1, 2008, the redemption fee was eliminated.
fTotal return does not reflect sales commissions or contingent deferred sales charges, if applicable, and is not annualized for periods less than one year.
gThe Trust’s advisor fully reimbursed the Fund for a loss on transactions not meeting the Fund’s investment guidelines, which otherwise would have reduced total return by 0.31%.
hRatios are annualized for periods less than one year.
iBenefit of expense reduction rounds to less than 0.01%.
Semiannual Report | The accompanying notes are an integral part of these financial statements. | 13

aThe amount shown for a share outstanding throughout the period may not correlate with the Statement of Operations for the period due to the timing of sales and repurchases of
the Fund shares in relation to income earned and/or fluctuating market value of the investments of the Fund.
bBased on average daily shares outstanding.
cEffective October 1, 2009, the fund no longer retains contingent deferred sales charges.
dAmount rounds to less than $0.01 per share.
eEffective September 1, 2008, the redemption fee was eliminated.
fTotal return does not reflect sales commissions or contingent deferred sales charges, if applicable, and is not annualized for periods less than one year.
gThe Trust’s advisor fully reimbursed the Fund for a loss on transactions not meeting the Fund’s investment guidelines, which otherwise would have reduced total return by 0.31%.
hRatios are annualized for periods less than one year.
iBenefit of expense reduction rounds to less than 0.01%.
14 | The accompanying notes are an integral part of these financial statements. | Semiannual Report

aThe amount shown for a share outstanding throughout the period may not correlate with the Statement of Operations for the period due to the timing of sales and repurchases of
the Fund shares in relation to income earned and/or fluctuating market value of the investments of the Fund.
bBased on average daily shares outstanding.
cEffective October 1, 2009, the fund no longer retains contingent deferred sales charges.
dAmount rounds to less than $0.01 per share.
eEffective September 1, 2008, the redemption fee was eliminated.
fTotal return is not annualized for periods less than one year.
gThe Trust’s advisor fully reimbursed the Fund for a loss on transactions not meeting the Fund’s investment guidelines, which otherwise would have reduced total return by 0.31%.
hRatios are annualized for periods less than one year.
iBenefit of expense reduction rounds to less than 0.01%.
Semiannual Report | The accompanying notes are an integral part of these financial statements. | 15


Semiannual Report | The accompanying notes are an integral part of these financial statements. | 17
Franklin Real Estate Securities Trust
Financial Statements
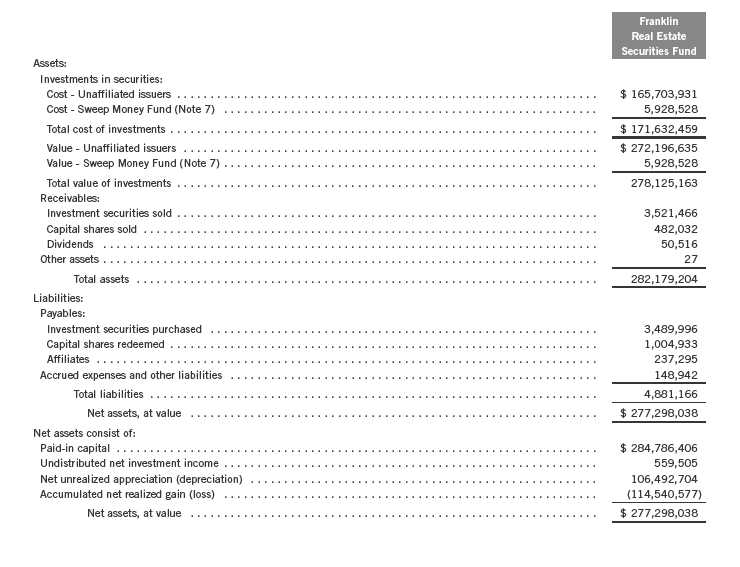
Statement of Assets and Liabilities
October 31, 2011 (unaudited)
18 | The accompanying notes are an integral part of these financial statements. | Semiannual Report

Semiannual Report | The accompanying notes are an integral part of these financial statements. | 19
Franklin Real Estate Securities Trust
Financial Statements (continued)
Statement of Operations
for the six months ended October 31, 2011 (unaudited)

20 | The accompanying notes are an integral part of these financial statements. | Semiannual Report
Franklin Real Estate Securities Trust
Financial Statements (continued)

Semiannual Report | The accompanying notes are an integral part of these financial statements. | 21
Franklin Real Estate Securities Trust
Notes to Financial Statements (unaudited)
Franklin Real Estate Securities Fund
1. ORGANIZATION AND SIGNIFICANT ACCOUNTING POLICIES
Franklin Real Estate Securities Trust (Trust) is registered under the Investment Company Act of 1940, as amended, (1940 Act) as an open-end investment company, consisting of one fund, the Franklin Real Estate Securities Fund (Fund). The Fund offers four classes of shares: Class A, Class B, Class C, and Advisor Class. Each class of shares differs by its initial sales load, contingent deferred sales charges, distribution fees, voting rights on matters affecting a single class and its exchange privilege.
The following summarizes the Fund’s significant accounting policies.
a. Financial Instrument Valuation
The Fund’s investments in securities and other financial instruments are carried at fair value daily. Fair value is the price that would be received to sell an asset or paid to transfer a liability in an orderly transaction between market participants on the measurement date. Under procedures approved by the Fund’s Board of Trustees, the Fund may utilize independent pricing services, quotations from securities and financial instrument dealers, and other market sources to determine fair value.
Equity securities listed on an exchange or on the NASDAQ National Market System are valued at the last quoted sale price or the official closing price of the day, respectively. Over-the-counter securities are valued within the range of the most recent quoted bid and ask prices. Securities that trade in multiple markets or on multiple exchanges are valued according to the broadest and most representative market. Certain equity securities are valued based upon fundamental characteristics or relationships to similar securities. Investments in open-end mutual funds are valued at the closing net asset value.
The Fund has procedures to determine the fair value of securities and other financial instruments for which market prices are not readily available or which may not be reliably priced. Under these procedures, the Fund primarily employs a market-based approach which may use related or comparable assets or liabilities, recent transactions, market multiples, book values, and other relevant information for the investment to determine the fair value of the investment. The Fund may also use an income-based valuation approach in which the anticipated future cash flows of the investment are discounted to calculate fair value. Discounts may also be applied due to the nature or duration of any restrictions on the disposition of the investments. Due to the inherent uncertainty of valuations of such investments, the fair values may differ significantly from the values that would have been used had an active market existed.
22 | Semiannual Report
Franklin Real Estate Securities Trust
Notes to Financial Statements (unaudited) (continued)
Franklin Real Estate Securities Fund
| 1. | ORGANIZATION AND SIGNIFICANT ACCOUNTING POLICIES (continued) |
| b. | Income Taxes |
It is the Fund’s policy to qualify as a regulated investment company under the Internal Revenue Code. The Fund intends to distribute to shareholders substantially all of its taxable income and net realized gains to relieve it from federal income and excise taxes. As a result, no provision for U.S. federal income taxes is required. The Fund files U.S. income tax returns as well as tax returns in certain other jurisdictions. The Fund records a provision for taxes in its financial statements including penalties and interest, if any, for a tax position taken on a tax return (or expected to be taken) when it fails to meet the more likely than not (a greater than 50% probability) threshold and based on the technical merits, the tax position may not be sustained upon examination by the tax authorities. As of October 31, 2011, and for all open tax years, the Fund has determined that no provision for income tax is required in the Fund’s financial statements. Open tax years are those that remain subject to examination and are based on each tax jurisdiction statute of limitation.
c. Security Transactions, Investment Income, Expenses and Distributions
Security transactions are accounted for on trade date. Realized gains and losses on security transactions are determined on a specific identification basis. Estimated expenses are accrued daily. Dividend income is recorded on the ex-dividend date. Distributions to shareholders are recorded on the ex-dividend date and are determined according to income tax regulations (tax basis). Distributable earnings determined on a tax basis may differ from earnings recorded in accordance with accounting principles generally accepted in the United States of America. These differences may be permanent or temporary. Permanent differences are reclassified among capital accounts to reflect their tax character. These reclassifications have no impact on net assets or the results of operations. Temporary differences are not reclassified, as they may reverse in subsequent periods.
Realized and unrealized gains and losses and net investment income, not including class specific expenses, are allocated daily to each class of shares based upon the relative proportion of net assets of each class. Differences in per share distributions, by class, are generally due to differences in class specific expenses.
Distributions received by the Fund from certain securities may be a return of capital (ROC). Such distributions reduce the cost basis of the securities, and any distributions in excess of the cost basis are recognized as capital gains.
Semiannual Report | 23
Franklin Real Estate Securities Trust
Notes to Financial Statements (unaudited) (continued)
Franklin Real Estate Securities Fund
| 1. | ORGANIZATION AND SIGNIFICANT ACCOUNTING POLICIES (continued) |
| d. | Accounting Estimates |
The preparation of financial statements in accordance with accounting principles generally accepted in the United States of America requires management to make estimates and assumptions that affect the reported amounts of assets and liabilities at the date of the financial statements and the amounts of income and expenses during the reporting period. Actual results could differ from those estimates.
e. Guarantees and Indemnifications
Under the Trust’s organizational documents, its officers and trustees are indemnified by the Trust against certain liabilities arising out of the performance of their duties to the Trust. Additionally, in the normal course of business, the Trust, on behalf of the Fund, enters into contracts with service providers that contain general indemnification clauses. The Trust’s maximum exposure under these arrangements is unknown as this would involve future claims that may be made against the Trust that have not yet occurred. Currently, the Trust expects the risk of loss to be remote.
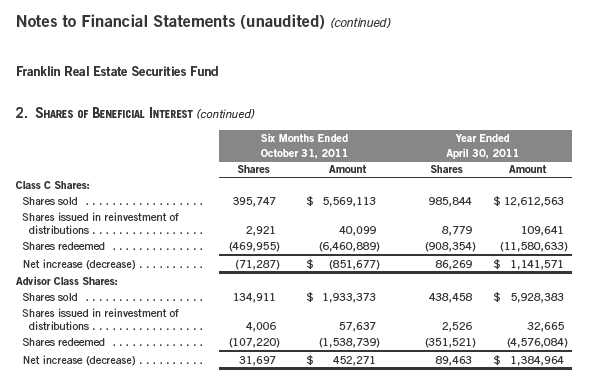
2. SHARES OF BENEFICIAL INTEREST
At October 31, 2011, there were an unlimited number of shares authorized ($0.01 par value).
Transactions in the Fund’s shares were as follows:

24 | Semiannual Report
Franklin Real Estate Securities Trust
3. TRANSACTIONS WITH AFFILIATES
Franklin Resources, Inc. is the holding company for various subsidiaries that together are referred to as Franklin Templeton Investments. Certain officers and trustees of the Trust are also officers and/or directors of the following subsidiaries:

a. Management Fees
The Fund pays an investment management fee to FT Institutional based on the month-end net assets of the Fund as follows:

Semiannual Report | 25
Franklin Real Estate Securities Trust
Notes to Financial Statements (unaudited) (continued)
Franklin Real Estate Securities Fund
| 3. | TRANSACTIONS WITH AFFILIATES (continued) |
| b. | Administrative Fees |
Under an agreement with FT Institutional, FT Services provides administrative services to the Fund. The fee is paid by FT Institutional based on average daily net assets, and is not an additional expense of the Fund.
c. Distribution Fees
The Fund’s Board of Trustees has adopted distribution plans for each share class, with the exception of Advisor Class shares, pursuant to Rule 12b-1 under the 1940 Act. Under the Fund’s Class A reimbursement distribution plan, the Fund reimburses Distributors for costs incurred in connection with the servicing, sale and distribution of the Fund’s shares up to the maximum annual plan rate. Under the Class A reimbursement distribution plan, costs exceeding the maximum for the current plan year cannot be reimbursed in subsequent periods.
In addition, under the Fund’s Class B and C compensation distribution plans, the Fund pays Distributors for costs incurred in connection with the servicing, sale and distribution of the Fund’s shares up to the maximum annual plan rate for each class.
The maximum annual plan rates, based on the average daily net assets, for each class, are as follows:

aThe Class B maximum annual plan rate consists of a dealer-service fee of 0.25% and an asset based sales charge of 0.75%. For the period from December 17, 2007 through September 30, 2009, the Fund temporarily discontinued payments of the asset-based sales charge in accordance with NASD Rule 2830, which sets forth a maximum aggregate sales charge payable by a fund. Because the maximum aggregate sales charge adjusts based on certain factors, payments of the asset-based sales charge could have resumed on October 1, 2009. However, Distributors has voluntarily agreed to waive the asset-based sales charge until further notice to the Board of Trustees.
d. Sales Charges/Underwriting Agreements
Front-end sales charges and contingent deferred sales charges (CDSC) do not represent expenses of the Fund. These charges are deducted from the proceeds of sales of Fund shares prior to investment or from redemption proceeds prior to remittance, as applicable. Distributors has advised the Fund of the following commission transactions related to the sales and redemptions of the Fund’s shares for the period:

26 | Semiannual Report
Franklin Real Estate Securities Trust
Notes to Financial Statements (unaudited) (continued)
Franklin Real Estate Securities Fund
| 3. | TRANSACTIONS WITH AFFILIATES (continued) |
| e. | Transfer Agent Fees |
For the period ended October 31, 2011, the Fund paid transfer agent fees of $390,421, of which $228,649 was retained by Investor Services.
4. EXPENSE OFFSET ARRANGEMENT
The Fund has entered into an arrangement with its custodian whereby credits realized as a result of uninvested cash balances are used to reduce a portion of the Fund’s custodian expenses. During the period ended October 31, 2011, there were no credits earned.
5. INCOME TAXES
For tax purposes, capital losses may be carried over to offset future capital gains, if any. At April 30, 2011, the capital loss carryforwards were as follows:

Under the Regulated Investment Company Modernization Act of 2010, the Fund will be permitted to carry forward capital losses incurred in taxable years beginning after December 22, 2010 for an unlimited period. Post-enactment capital loss carryforwards will retain their character as either short-term or long-term capital losses rather than being considered short-term as under previous law. Any post-enactment capital losses generated will be required to be utilized prior to the losses incurred in pre-enactment tax years.
At October 31, 2011, the cost of investments and net unrealized appreciation (depreciation) for income tax purposes were as follows:

Differences between income and/or capital gains as determined on a book basis and a tax basis are primarily due to differing treatments of a regulatory settlement and wash sales.
6. INVESTMENT TRANSACTIONS
Purchases and sales of investments (excluding short term securities) for the period ended October 31, 2011, aggregated $23,663,952 and $27,169,873, respectively.
Semiannual Report | 27
Franklin Real Estate Securities Trust
Notes to Financial Statements (unaudited) (continued)
Franklin Real Estate Securities Fund
7. INVESTMENTS IN INSTITUTIONAL FIDUCIARY TRUST MONEY MARKET PORTFOLIO
The Fund invests in the Institutional Fiduciary Trust Money Market Portfolio (Sweep Money Fund), an open-end investment company managed by Franklin Advisers, Inc. (an affiliate of the investment manager). Management fees paid by the Fund are reduced on assets invested in the Sweep Money Fund, in an amount not to exceed the management and administrative fees paid by the Sweep Money Fund.
8. CREDIT FACILITY
The Fund, together with other U.S. registered and foreign investment funds (collectively, Borrowers), managed by Franklin Templeton Investments, are borrowers in a joint syndicated senior unsecured credit facility totaling $750 million (Global Credit Facility) which matures on January 20, 2012. This Global Credit Facility provides a source of funds to the Borrowers for temporary and emergency purposes, including the ability to meet future unanticipated or unusually large redemption requests.
Under the terms of the Global Credit Facility, the Fund shall, in addition to interest charged on any borrowings made by the Fund and other costs incurred by the Fund, pay its share of fees and expenses incurred in connection with the implementation and maintenance of the Global Credit Facility, based upon its relative share of the aggregate net assets of all of the Borrowers, including an annual commitment fee of 0.08% based upon the unused portion of the Global Credit Facility, which is reflected in other expenses on the Statement of Operations. During the period ended October 31, 2011, the Fund did not use the Global Credit Facility.
9. FAIR VALUE MEASUREMENTS
The Fund follows a fair value hierarchy that distinguishes between market data obtained from independent sources (observable inputs) and the Fund’s own market assumptions (unobservable inputs). These inputs are used in determining the value of the Fund’s investments and are summarized in the following fair value hierarchy:
- Level 1 – quoted prices in active markets for identical securities
- Level 2 – other significant observable inputs (including quoted prices for similar securities, interest rates, prepayment speed, credit risk, etc.)
- Level 3 – significant unobservable inputs (including the Fund’s own assumptions in determining the fair value of investments)
The inputs or methodology used for valuing securities are not an indication of the risk associated with investing in those securities.
28 | Semiannual Report
Franklin Real Estate Securities Trust
Notes to Financial Statements (unaudited) (continued)
Franklin Real Estate Securities Fund
9. FAIR VALUE MEASUREMENTS (continued)
For movements between the levels within the fair value hierarchy, the Fund has adopted a policy of recognizing the transfers as of the date of the underlying event which caused the movement.
At October 31, 2011, all of the Fund’s investments in securities carried at fair value were valued using Level 1 inputs. For detailed categories, see the accompanying Statement of Investments.
10. NEW ACCOUNTING PRONOUNCEMENTS
In May 2011, the Financial Accounting Standards Board (FASB) issued Accounting Standards Update (ASU) No. 2011-04, Fair Value Measurement (Topic 820): Amendments to Achieve Common Fair Value Measurement and Disclosure Requirements in U.S. GAAP and IFRSs. The amendments in the ASU will improve the comparability of fair value measurements presented and disclosed in financial statements prepared in accordance with U.S. GAAP (Generally Accepted Accounting Principles) and IFRS (International Financial Reporting Standards) and include new guidance for certain fair value measurement principles and disclosure requirements. The ASU is effective for interim and annual periods beginning after December 15, 2011. The Fund is currently reviewing the requirements and believes the adoption of this ASU will not have a material impact on the financial statements.
11. SUBSEQUENT EVENTS
The Fund has evaluated subsequent events through the issuance of the financial statements and determined that no events have occurred that require disclosure.
ABBREVIATIONS
Selected Portfolio
REIT - Real Estate Investment Trust
Semiannual Report | 29
Franklin Real Estate Securities Trust
Shareholder Information
Franklin Real Estate Securities Fund
Proxy Voting Policies and Procedures
The Fund’s investment manager has established Proxy Voting Policies and Procedures (Policies) that the Fund uses to determine how to vote proxies relating to portfolio securities. Shareholders may view the Fund’s complete Policies online at franklintempleton.com. Alternatively, shareholders may request copies of the Policies free of charge by calling the Proxy Group collect at (954) 527-7678 or by sending a written request to: Franklin Templeton Companies, LLC, 300 S.E. 2nd Street, Fort Lauderdale, FL 33301, Attention: Proxy Group. Copies of the Fund’s proxy voting records are also made available online at franklintempleton.com and posted on the U.S. Securities and Exchange Commission’s website at sec.gov and reflect the most recent 12-month period ended June 30.
Quarterly Statement of Investments
The Fund files a complete statement of investments with the U.S. Securities and Exchange Commission for the first and third quarters for each fiscal year on Form N-Q. Shareholders may view the filed Form N-Q by visiting the Commission’s website at sec.gov. The filed form may also be viewed and copied at the Commission’s Public Reference Room in Washington, DC. Information regarding the operations of the Public Reference Room may be obtained by calling (800) SEC-0330.
30 | Semiannual Report
This page intentionally left blank.
This page intentionally left blank.

Item 2. Code of Ethics.
(a) The Registrant has adopted a code of ethics that applies to its principal executive officers and principal financial and accounting officer.
| (c) | N/A |
| (d) | N/A |
| (f) | Pursuant to Item 12(a)(1), the Registrant is attaching as an exhibit a copy of its code of ethics that applies to its principal executive officers and principal financial and accounting officer. |
Item 3. Audit Committee Financial Expert.
(a)(1) The Registrant has an audit committee financial expert serving on its audit committee.
(2) The audit committee financial expert is John B. Wilson and he is "independent" as defined under the relevant Securities and Exchange Commission Rules and Releases.
Item 4. Principal Accountant Fees and Services. N/A
Item 5. Audit Committee of Listed Registrants. N/A
Item 6. Schedule of Investments. N/A
Item 7. Disclosure of Proxy Voting Policies and Procedures for Closed-End Management Investment Companies. N/A
Item 8. Portfolio Managers of Closed-End Management Investment Companies. N/A
Item 9. Purchases of Equity Securities by Closed-End Management Investment Company and Affiliated Purchasers. N/A
Item 10. Submission of Matters to a Vote of Security Holders.
There have been no changes to the procedures by which shareholders may recommend nominees to the Registrant's Board of Trustees that would require disclosure herein.
Item 11. Controls and Procedures.
(a) Evaluation of Disclosure Controls and Procedures. The Registrant maintains disclosure controls and procedures that are designed to
ensure that information required to be disclosed in the Registrant’s filings under the Securities Exchange Act of 1934 and the Investment Company Act of 1940 is recorded, processed, summarized and reported within the periods specified in the rules and forms of the Securities and Exchange Commission. Such information is accumulated and communicated to the Registrant’s management, including its principal executive officer and principal financial officer, as appropriate, to allow timely decisions regarding required disclosure. The Registrant’s management, including the principal executive officer and the principal financial officer, recognizes that any set of controls and procedures, no matter how well designed and operated, can provide only reasonable assurance of achieving the desired control objectives.
Within 90 days prior to the filing date of this Shareholder Report on Form N-CSR, the Registrant had carried out an evaluation, under the supervision and with the participation of the Registrant’s management, including the Registrant’s principal executive officer and the Registrant’s principal financial officer, of the effectiveness of the design and operation of the Registrant’s disclosure controls and procedures. Based on such evaluation, the Registrant’s principal executive officer and principal financial officer concluded that the Registrant’s disclosure controls and procedures are effective.
(b) Changes in Internal Controls. There have been no significant changes in the Registrant’s internal controls or in other factors that could significantly affect the internal controls subsequent to the date of their evaluation in connection with the preparation of this Shareholder Report on Form N-CSR.
Item 12. Exhibits.
| (a) | (1) Code of Ethics |
| (a) | (2) Certifications pursuant to Section 302 of the Sarbanes-Oxley Act of 2002 of Laura F. Fergerson, Chief Executive Officer - Finance and Administration, and Gaston Gardey, Chief Financial Officer and Chief Accounting Officer |
(b) Certifications pursuant to Section 906 of the Sarbanes-Oxley Act of 2002 of Laura F. Fergerson, Chief Executive Officer - Finance and Administration, and Gaston Gardey, Chief Financial Officer and Chief Accounting Officer
SIGNATURES
Pursuant to the requirements of the Securities Exchange Act of 1934 and the Investment Company Act of 1940, the registrant has duly caused this report to be signed on its behalf by the undersigned, thereunto duly authorized.
FRANKLIN REAL ESTATE SECURITIES TRUST
By /s/LAURA F. FERGERSON
Laura F. Fergerson
Chief Executive Officer –
Finance and Administration
5079-4
Date December 28, 2011
Pursuant to the requirements of the Securities Exchange Act of 1934 and the Investment Company Act of 1940, this report has been signed below by the following persons on behalf of the registrant and in the capacities and on the dates indicated.
By /s/LAURA F. FERGERSON
Laura F. Fergerson
Chief Executive Officer –
Finance and Administration
Date December 28, 2011
By /s/GASTON GARDEY
Gaston Gardey
Chief Financial Officer and
Chief Accounting Officer
Date December 28, 2011
5079-4