SECURITIES AND EXCHANGE COMMISSION
Washington, D.C. 20549
FORM 20-F
| REGISTRATION STATEMENT PURSUANT TO SECTION 12(b) OR 12(g) OF THE SECURITIES EXCHANGE ACT OF 1934 | |
| OR | |
| ANNUAL REPORT PURSUANT TO SECTION 13 OR 15(d) OF THE SECURITIES EXCHANGE ACT OF 1934 | |
| For the fiscal year ended December 31, 2004 | |
| OR | |
| TRANSITION REPORT PURSUANT TO SECTION 13 OR 15(d) OF THESECURITIES EXCHANGE ACT OF 1934 | |
| For the transition period from__________ to __________ |
Commission file number 001-12440
ENERSIS S.A.
(Exact name of Registrant as specified in its charter)
| ENERSIS S.A. | CHILE | |
| (Translation of Registrant’s name into English) | (Jurisdiction of incorporation or organization) | |
| Avenida Santa Rosa 76,Santiago Santiago, Chile | ||
| (Address of principal executive offices) | ||
| Securities registered or to be registered pursuant to Section 12(b) of the Act: | ||
| Title of Each Class | Name of each exchange on which registered | |
| American Depositary Shares representing Common Stock | New York Stock Exchange | |
| Common Stock, no par value | New York Stock Exchange* | |
| U.S.$ 300,000,000 6.90% Notes due December 1, 2006 | New York Stock Exchange | |
| U.S.$ 350,000,000 7.40% Notes due December 1, 2016 | New York Stock Exchange | |
| U.S.$ 150,000,000 6.60% Notes due December 1, 2026 | New York Stock Exchange | |
| * | Listed, not for trading, but only in connection with the registration of American Depositary Shares, pursuant to the requirements of the Securities and Exchange Commission. |
Securities registered or to be registered pursuant to Section 12(g) of the Act: None
Securities for which there is a reporting obligation pursuant to Section 15(d) of the Act:
U.S.$ 350,000,000 7.375% Notes due January 15, 2014
Indicate the number of outstanding shares of each of the issuer’s classes of capital or common stock as of the close of the period covered by the annual report: Shares of Common Stock: 32,651,166,465
Indicate by check mark whether the registrant (1) has filed all reports required to be filed by Section 13 or 15(d) of the Securities Exchange Act of 1934 during the preceding 12 months (or for such shorter period that the registrant was required to file such reports), and (2) has been subject to such filing requirements for the past 90 days:
YES ![]() NO
NO ![]()
Indicate by check mark which financial statements item the registrant has elected to follow:
| ITEM 17 | ITEM 18 | |
TABLE OF CONTENTS
i
Enersis Simplified Corporate Structure
as of December 31, 2004*
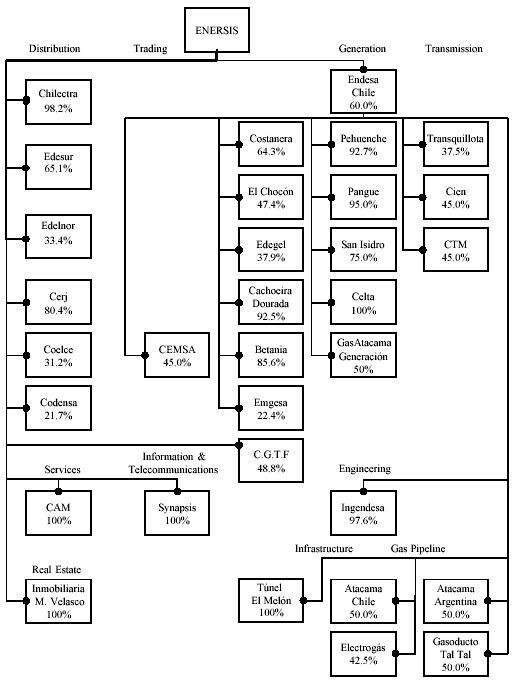
| * | Percentages refer to economic interest in each one of our main operating entities. See “Introduction—Calculation of Economic Interest.” |
ii
INTRODUCTION
Financial Information
As used in this annual report on Form 20-F, first person personal pronouns such as “we,” “us” or “our” refers to ENERSIS S.A. (“Enersis”) and our consolidated subsidiariesunless the context indicates otherwise. Unless otherwise indicated, our interest in our principal subsidiaries and related companies is expressed in terms of our economic interest as of December 31, 2004.
In this annual report on Form 20-F, unless otherwise specified, references to “dollars,” “$,” “U.S. dollars” or “U.S.$ “ are to U.S. dollars, references to “pesos” or “Ch$ ” are to Chilean pesos, the legal currency of Chile, references to “Ar$” or “Argentine pesos” are to the legal currency of Argentina, references to “R$,” “reals” or “reais” are to Brazilian reals, the legal currency of Brazil, references to “soles” are to Peruvian soles, the legal currency of Peru, references to “CPs” or Colombian pesos are to the legal currency of Colombia and references to “UF” are to Unidades de Fomento. The Unidad de Fomento is a Chilean inflation-indexed, peso-denominated monetary unit. The UF rate is set daily in advance based on changes in the previous month’s inflation rate. As of December 31, 2004, 1 UF was equivalent to Ch$ 17,317.05. The U.S. dollar equivalent of 1 UF was U.S.$ 31.07 at December 31, 2004, using the Observed Exchange Rate reported by theBanco Central de Chile (the “Chilean Central Bank” or the “Central Bank”) as of December 31, 2004 of Ch$ 557.40 per U.S.$ 1.00. As of May 31, 2005, 1 UF was equivalent to Ch$ 17,407.28. The U.S. dollar equivalent of 1 UF was U.S.$ 29.86 as of May 31, 2005, using the Observed Exchange Rate reported by the Central Bank of Ch$ 583.00 per U.S.$ 1.00.
Our consolidated financial statements and, unless otherwise indicated, other financial information concerning us and our subsidiaries included in this annual report are presented in constant Chilean pesos in conformity with Chilean generally accepted accounting principles (“Chilean GAAP”) and the rules of theSuperintendencia de Valores y Seguros, or SVS. Our audited consolidated financial statements for the three fiscal years ended December 31, 2004 are expressed in constant Chilean pesos as of December 31, 2004. See note 2(c) to our consolidated financial statements. For Chilean accounting purposes, inflation adjustments are calculated based on a “one-month lag” convention using an inflation adjustment factor based on theIndice de Precios al Consumidor (Chilean consumer price index or “Chilean CPI”). The Chilean CPI is published by Chile’sInstituto Nacional de Estadísticas (the “National Bureau of Statistics”). For example, the inflation adjustment applicable for the 2004 calendar year is the percentage change between the November 2003 Chilean CPI and the November 2004 Chilean CPI, which was 2.5%. Chilean GAAP differs in certain important respects from accounting principles generally accepted in the United States (“U.S. GAAP”). See Note 36 to our consolidated financial statements contained elsewhere in this annual report for a description of the principal differences between Chilean GAAP and U.S. GAAP, as they relate to us, and for a reconciliation to U.S. GAAP of net income and stockholders’ equity for the period and as of the dates therein indicated. Certain amounts may not add up due to rounding.
Under Chilean GAAP, we consolidate the results from operations of a company defined as a “subsidiary” under Law No. 18,046 (the “Chilean Companies Act”). In order to consolidate a company, we must generally satisfy one of two criteria:
| • | control, directly or indirectly, more than a 50% voting interest in that company; or | |
| • | nominate or have the power to nominate a majority of the board of directors of that company if we control 50% or less of the voting interest of that company. |
As of December 31, 2004, we consolidated Endesa-Chile,Enersis Internacional, or Enersis Internacional,Chilectra S.A., or Chilectra,Inversiones Distrilima S.A. (which in turn consolidatedEmpresa de Distribución Eléctrica de Lima Norte S.A.A. or Edelnor),Empresa Distribuidora Sur S.A., or Edesur,Inmobiliaria Manso de Velasco Limitada, or IMV,Synapsis Soluciones y Servicios IT Ltda., or Synapsis,Compañía Americana de Multiservicios Ltda., or CAM,Companhia de Eletricidade do Rio de Janeiro S.A., or Cerj,Codensa S.A. E.S.P. or Codensa,Elesur S.A.or Elesur andInvestluz (which in turn consolidatedCompanhia Energética do Ceará S.A., or Coelce).
3
Endesa-Chile, in turn, consolidated all of its operational Chilean subsidiaries. In Argentina, Endesa-Chile consolidated the hydroelectric companyCentral Hidroeléctrica El Chocón S.A., or El Chocón, and thermoelectric companiesCentral Costanera S.A., or Costanera. In Colombia, Endesa-Chile consolidated generation companiesCentral Hidroeléctrica de Betania S.A. E.S.P., or Betania, andEmgesa S.A. E.S.P., or Emgesa. Endesa-Chile also consolidated the hydroelectric companyCachoeira Dourada S.A., or Cachoeira Dourada, in Brazil and the generation companyEdegel S.A.A., or Edegel, in Peru.
For the convenience of the reader, this annual report contains translations of certain Chilean peso amounts into U.S.$ at specified rates. Unless otherwise indicated, the U.S. dollar equivalent for information in Chilean pesos is based on the Observed Exchange Rate, as defined in “Item 3. Key Information—A. Selected Financial Data—Exchange Rates” at December 31, 2004. The Federal Reserve Bank of New York does not report a noon buying rate for Chilean pesos. No representation is made that the Chilean peso or U.S. dollar amounts shown in this annual report could have been or could be converted into U.S.$ or Chilean pesos, as the case may be, at such rate or at any other rate. See “Item 3. Key Information—A. Selected Financial Data—Exchange Rates.”
Technical Terms
References to “GW” and “GWh” are to gigawatts and gigawatt hours, respectively; references to “MW” and “MWh” are to megawatts and megawatt hours, respectively; references to “kW” and “kWh” are to kilowatts and kilowatt hours, respectively; and references to “kV” are to kilovolts. Unless otherwise indicated, statistics provided in this annual report with respect to electricity generation facilities are expressed in MW, in the case of the installed capacity of such facilities, and in GWh, in the case of the aggregate annual electricity production of such facilities. One GW = 1,000 MW, and one MW = 1,000 kW. Statistics relating to aggregate annual electricity production are expressed in GWh and are based on a year of 8,760 hours. Statistics relating to installed capacity and production of the electricity industry do not include electricity of self-generators. Statistics relating to our production do not include electricity consumed by our generators.
Energy losses are calculated by:
| • | subtracting the number of GWh of energy sold from the number of GWh of energy purchased and self-generated within a given period; and | |
| • | calculating the percentage that the resulting quantity bears to the aggregate number of GWh of energy purchased and self-generated within the same period. |
Calculation of Economic Interest
References are made in this annual report to the “economic interest” of Enersis in its subsidiaries or related companies. In circumstances where Enersis does not own its interest in a subsidiary or related company directly, the economic interest of Enersis in such ultimate subsidiary or related company is calculated by multiplying the percentage ownership interest of Enersis in a directly held subsidiary or related company by the percentage ownership interest of any entity in the chain of ownership of such ultimate subsidiary or related company. For example, if Enersis owns 60% of a directly held subsidiary and that subsidiary owns 40% of a related company, Enersis’ economic ownership interest in such related company would be 24%. References are also made in this annual report to the economic interest of Endesa-Chile in its subsidiaries and related companies. Calculation of Endesa-Chile’s economic interest is made based on the same method used to calculate the economic interest of Enersis.
Enersis, a holding company engaged in the generation, transmission and distribution of electricity in Chile, Argentina, Brazil, Colombia and Peru, beneficially owned as of the date of this annual report, directly or indirectly, 60.0% of Endesa-Chile’s outstanding capital stock. ENDESA, S.A. (“Endesa-Spain”), the largest electricity generation and distribution company in Spain, owned a 60.6% beneficial interest in Enersis as of December 31, 2004.
4
Forward-Looking Statements
This annual report contains statements that are or may constitute forward-looking statements. These statements appear throughout this annual report and include statements regarding our intent, belief or current expectations, including but not limited to any statements concerning:
| • | our capital investment program; | |
| • | trends affecting our financial condition or results from operations; | |
| • | our dividend policy; | |
| • | the future impact of competition and regulation; | |
| • | political and economic conditions in the countries in which we or our related companies operate or may operate in the future; | |
| • | any statements preceded by, followed by or that include the words “believes,” “expects,” “predicts,” “anticipates,” “intends,” “estimates,” “should,” “may” or similar expressions; and | |
| • | other statements contained or incorporated by reference in this annual report regarding matters that are not historical facts. |
Because such statements are subject to risks and uncertainties, actual results may differ materially from those expressed or implied by such forward-looking statements. Factors that could cause actual results to differ materially include, but are not limited to:
| • | changes in the regulatory environment in one or more of the countries in which we operate; | |
| • | changes in the environmental regulatory framework in one or more of the countries in which we operate; | |
| • | our ability to implement proposed capital expenditures, including our ability to arrange financing where required; | |
| • | the nature and extent of future competition in our principal markets; | |
| • | political, economic and demographic developments in the emerging market countries of South America where we conduct our business; and | |
| • | the factors discussed below under “Risk Factors.” |
You should not place undue reliance on such statements, which speak only as of the date that they were made. You should consider these cautionary statements together with any written or oral forward-looking statements that we may issue in the future. We do not undertake any obligation to release publicly any revisions to forward-looking statements contained in this annual report to reflect later events or circumstances or to reflect the occurrence of unanticipated events.
For all these forward-looking statements, we claim the protection of the safe harbor for forward-looking statements contained in the Private Securities Litigation Reform Act of 1995.
5
PART I
Item 1. Identity of Directors, Senior Management and Advisers
Not applicable.
Item 2. Offer Statistics and Expected Timetable
Not applicable.
Item 3. Key Information
| A. | Selected Financial Data. |
The following summary of consolidated financial data should be read in conjunction with, and is qualified in its entirety by reference to our audited consolidated financial statements including their notes, included elsewhere in this annual report. Our consolidated financial statements are prepared in accordance with Chilean GAAP and the related rules of the SVS, which together differ in certain important respects from U.S. GAAP. Note 36 to our consolidated financial statements provides a description of the principal differences between Chilean GAAP and U.S. GAAP and a reconciliation to U.S. GAAP of net income (loss) and shareholders’ equity for the periods and as of the dates therein indicated. Financial data as of or for each of the five years ended December 31, 2004 in the following table have been restated in constant Chilean pesos as of December 31, 2004. All data, except ratios and operating data, are in millions. For convenience purposes, all data presented in U.S.$ in the following summary as of or for the year ended December 31, 2004 are translated at the Observed Exchange Rate for December 31, 2004 of Ch$ 557.40 per U.S.$ 1.00. Such translations should not be construed as representing that the Chilean peso amounts actually represent, have been or could be converted into U.S.$ at the rates indicated or used herein or at all. For information concerning historical exchange rates, see “—Exchange Rates” below.
In 2003, we soldCompañía Eléctrica del Río Maipo or Río Maipo andInfraestructura Dos Mil S.A. or Infraestructura 2000, and, as a result, these companies ceased to be reflected in our financial statements with effect from January 1, 2003.
On May 27, 2004, we acquired 99.99% of Elesur S.A. and we have consolidated Elesur S.A. from that date.
The information detailed in the following table includes changes in certain accounting policies for the five years ended and as of December 31, 2004, which affect the comparability of the data presented below. See Note 3 to our consolidated financial statements for a further description of changes in our accounting policies.
6
| For the year ended December 31, | ||||||||||||
| 2000 | 2001 | 2002 | 2003 | 2004 | 2004 | |||||||
| (millions of | ||||||||||||
| (millions of constant Ch$ of December 31, 2004) | U.S.$ )(1) | |||||||||||
| CONSOLIDATED INCOME | ||||||||||||
| STATEMENT DATA | ||||||||||||
| Chilean GAAP: | ||||||||||||
| Sales | 2,854,232 | 3,167,223 | 2,573,500 | 2,418,451 | 2,708,925 | 4,860 | ||||||
| Cost of operations | (1,961,835 | ) | (2,096,704 | ) | (1,791,035 | ) | (1,695,212 | ) | (1,898,088 | ) | (3,405 | ) |
| Administrative and selling expenses | (320,165 | ) | (289,377 | ) | (231,045 | ) | (173,741 | ) | (176,635 | ) | (317 | ) |
| Operating income | 572,232 | 781,142 | 551,420 | 549,498 | 634,202 | 1,138 | ||||||
| Equity in income (loss) of related | ||||||||||||
| Companies, net | 80 | (11,077 | ) | 8,556 | 17,955 | 31,145 | 56 | |||||
| Goodwill amortization | (74,242 | ) | (83,417 | ) | (524,192 | ) | (54,559 | ) | (53,201 | ) | (95 | ) |
| Interest (expense) income, net | (466,481 | ) | (410,174 | ) | (372,275 | ) | (362,027 | ) | (286,504 | ) | (514 | ) |
| Price-level restatement, net | (17,085 | ) | (29,368 | ) | (11,537 | ) | (10,818 | ) | 13,630 | 24 | ||
| Other non-operating income (expense), net | 382,344 | 11,145 | 74,841 | (56,832 | ) | (73,723 | ) | (132 | ) | |||
| Income before income taxes, minority | ||||||||||||
| interest and amortization of negative | ||||||||||||
| goodwill(2) | 396,848 | 258,251 | (273,187 | ) | 83,217 | 265,549 | 477 | |||||
| Income taxes | (151,481 | ) | (134,428 | ) | (68,344 | ) | (42,610 | ) | (137,241 | ) | (246 | ) |
| Extraordinary loss | — | — | (23,165 | ) | — | — | — | |||||
| Minority interest | (190,486 | ) | (129,565 | ) | 16,857 | (80,283 | ) | (101,107 | ) | (181 | ) | |
| Amortization of negative goodwill | 44,149 | 49,381 | 116,204 | 52,456 | 17,107 | 31 | ||||||
| Net Income (loss) | 99,030 | 43,639 | (231,635 | ) | 12,780 | 44,308 | 81 | |||||
| Net Income (loss) per Share | 14.56 | 5.26 | (27.94 | ) | 0.39 | 1.36 | n.a. | |||||
| Net Income (loss) per ADS | 728.16 | 263.17 | (1,396.90 | ) | 19.57 | 67.85 | n.a. | |||||
| U.S. GAAP (3): | ||||||||||||
| Operating Income | 795,191 | 832,342 | (223,671 | ) | 484,294 | 631,378 | 1,133 | |||||
| Equity in Income (loss) of Related | ||||||||||||
| Companies | 80 | (29,169 | ) | 24,115 | 44,703 | 31,147 | 56 | |||||
| Income taxes | (240,520 | ) | (228,010 | ) | (2,853 | ) | (22,293 | ) | (127,835 | ) | (229 | ) |
| Net Income (loss) from continuing | ||||||||||||
| operations | 76,530 | (40,083 | ) | (341,711 | ) | 30,217 | 151,774 | 272 | ||||
| Income (loss) from discontinued | ||||||||||||
| operations net of tax and minority | ||||||||||||
| interest | 270 | 294 | 172 | 71 | — | — | ||||||
| Net Income (loss) | 76,798 | 2,938 | (341,539 | ) | 30,001 | 151,774 | 272 | |||||
| Net Income (loss) from continuing | ||||||||||||
| operations per Share | 10.66 | (4.85 | ) | (41.21 | ) | 1.48 | 4.65 | — | ||||
| Net Income (loss) from continuing | — | |||||||||||
| operations per ADS | 532.08 | (241.73 | ) | (2,060.76 | ) | 73.80 | 67.85 | — | ||||
| Net Income (loss) per Share | 10.66 | 0.38 | (41.21 | ) | 1.47 | 4.65 | — | |||||
| Net Income (loss) per ADS | 533.92 | 17.70 | (2,059.74 | ) | 73.29 | 67.85 | — | |||||
| Cash Dividends per share | — | 1.95 | — | — | — | |||||||
| Cash Dividends per ADS | — | 96.35 | — | — | — | |||||||
| Capital stock | 812,235 | 812,235 | 812,235 | 2,446,711 | 2,446,130 | 4,388 | ||||||
| Number of shares of common stock | ||||||||||||
| (thousands) | 6,800,000 | 8,291,020 | 8,291,020 | 32,651,166 | 32,651,166 | 58,578 | ||||||
| Number of American Depository Shares | ||||||||||||
| (thousands) | 21,019 | 14,892 | 6,578 | 55,111 | 66,345 | 119 | ||||||
7
| As at December 31, | ||||||||||||
| 2000 | 2001 | 2002 | 2003 | 2004 | 2004 | |||||||
| (millions of | ||||||||||||
| (millions of constant Ch$ of December 31, 2004) | U.S.$ )(1) | |||||||||||
| CONSOLIDATED BALANCE SHEET DATA | ||||||||||||
| Chilean GAAP: | ||||||||||||
| Total assets | 12,169,731 | 13,209,583 | 13,056,307 | 10,982,893 | 10,507,525 | 18,851 | ||||||
| Long Term Debt | 5,408,966 | 6,037,954 | 5,594,683 | 3,782,448 | 3,804,155 | 6,825 | ||||||
| Minority interest | 3,862,233 | 4,217,165 | 4,193,387 | 3,433,014 | 3,125,006 | 5,606 | ||||||
| Shareholders’ equity | 1,209,960 | 1,257,376 | 1,041,027 | 2,612,102 | 2,559,553 | 4,592 | ||||||
| U.S. GAAP (3): | ||||||||||||
| Total assets | 12,265,727 | 13,568,929 | 12,764,812 | 10,826,515 | 10,556,885 | 18,940 | ||||||
| Long Term Debt | 5,663,768 | 6,634,789 | 5,389,355 | 3,901,670 | 3,994,458 | 7,166 | ||||||
| Minority Interest | 3,709,857 | 4,103,444 | 4,407,383 | 3,205,939 | 2,901,154 | 5,205 | ||||||
| Shareholders’ Equity | 1,175,467 | 1,199,434 | 886,229 | 2,575,334 | 2,634,544 | 4,726 | ||||||
| �� | ||||||||||||
| As of or for the year ended | ||||||||||||
| December 31, | ||||||||||||
| 2000 | 2001 | 2002 | 2003 | 2004 | 2004 | |||||||
| (millions of constant Ch$ of December 31, 2004, | (millions of | |||||||||||
| except for ratios and operating data) | U.S.$ )(1) | |||||||||||
| OTHER CONSOLIDATED FINANCIAL DATA | ||||||||||||
| Chilean GAAP: | ||||||||||||
| Capital expenditures | 355,101 | 353,594 | 329,121 | 265,256 | 265,934 | 477 | ||||||
| Depreciation and amortization | 450,018 | 449,353 | 481,247 | 415,124 | 386,292 | 693 | ||||||
| U.S. GAAP(3): | ||||||||||||
| Capital expenditures | 355,101 | 353,594 | 329,121 | 265,256 | 265,934 | 477 | ||||||
| Depreciation and amortization | 506,140 | 513,260 | 1,073,868 | 414,542 | 366,751 | 658 | ||||||
| (1) | Solely for the convenience of the reader, Chilean peso amounts have been translated into dollars at the rate of Ch$ 557.40 per U.S. dollar, the Observed Exchange Rate for December 31, 2004. |
| (2) | “Income before income taxes, minority interest and amortization of negative goodwill” as shown in our audited consolidated income statement. |
| (3) | See “Item 5. Results from Operations for the Fiscal Years Ended December 31, 2003 and December 31, 2004 and Note 36 for a discussion of how our income statement and balance sheet can be impacted by accounting differences under Chilean and U.S. GAAP. The two most significant adjustments that result from reconciling our Chilean GAAP accounts to U.S. GAAP relate to accounting for amortization of goodwill discussed in paragraphs (i), (h) and (II-o) of Note 36 and accounting for derivative instruments discussed in paragraphs (t) and (II-j) of Note 36 to the audited consolidated financial statements. |
8
| As of or for the year ended December 31, | ||||||||||
| 2000 | 2001 | 2002 | 2003 | 2004 | ||||||
| Operating Data of Subsidiaries | ||||||||||
| Chilectra | ||||||||||
| Electricity Sold (GWh) (1) | 8,854 | 9,585 | 9,952 | 10,518 | 11,317 | |||||
| Number of Customers (thousands) | 1,262 | 1,289 | 1,319 | 1,341 | 1,371 | |||||
| Total Energy Losses (%) (2) | 5.2 | 5.4 | 5.6 | 5.6 | 5.2 | |||||
| Río Maipo | ||||||||||
| Electricity Sold (GWh) | 1,191 | 1,245 | 1,274 | — | — | |||||
| Number of Customers (thousands) | 287 | 294 | 302 | — | — | |||||
| Total Energy Losses (%) (2) | 5.4 | 6.4 | 6.2 | — | — | |||||
| Edesur | ||||||||||
| Electricity Sold (GWh) | 12,597 | 12,909 | 12,138 | 12,656 | 13,322 | |||||
| Number of Customers (thousands) | 2,108 | 2,097 | 2,090 | 2,117 | 2,139 | |||||
| Total Energy Losses (%) (2) | 10.3 | 9.9 | 11.6 | 11.8 | 11.8 | |||||
| Cerj | ||||||||||
| Electricity Sold (GWh) | 7,656 | 6,739 | 7,145 | 7,276 | 7,628 | |||||
| Number of Customers (thousands) | 1,581 | 1,691 | 1,778 | 2,012 | 2,115 | |||||
| Total Energy Losses (%) (2) | 19.7 | 22.7 | 22.6 | 23.6 | 22.8 | |||||
| Coelce | ||||||||||
| Electricity Sold (GWh) | 5,894 | 5,352 | 5,558 | 5,905 | 6,141 | |||||
| Number of Customers (thousands) | 1,796 | 1,917 | 2,009 | 2,109 | 2,334 | |||||
| Total Energy Losses (%) (2) | 13.3 | 13.0 | 12.9 | 13.5 | 13.9 | |||||
| Codensa | ||||||||||
| Electricity Sold (GWh) | 8,776 | 8,673 | 9,015 | 9,254 | 9,656 | |||||
| Number of Customers (thousands) | 1,802 | 1,850 | 1,911 | 1,972 | 2,015 | |||||
| Total Energy Losses (%) (2) | 10.5 | 11.8 | 10.3 | 10.2 | 9.7 | |||||
| Edelnor | ||||||||||
| Electricity Sold (GWh) | 3,583 | 3,685 | 3,872 | 3,968 | 4,250 | |||||
| Number of Customers (thousands) | 852 | 867 | 871 | 892 | 912 | |||||
| Total Energy Losses (%) (2) | 9.9 | 8.9 | 8.5 | 8.4 | 8.4 | |||||
| Endesa-Chile | ||||||||||
| Installed capacity in Chile (MW) | 4,035 | 3,935 | 3,935 | 3,763 | 4,477 | |||||
| Installed capacity in Argentina(MW) | 3,622 | 3,622 | 3,622 | 3,622 | 3,623 | |||||
| Installed capacity in Colombia (MW) | 3,035 | 3,035 | 2,735 | 2,589 | 2,609 | |||||
| Installed capacity in Brazil (MW) (3) | 658 | 658 | 658 | 658 | 658 | |||||
| Installed capacity in Peru (MW) | 997 | 997 | 1,003 | 967 | 967 | |||||
| Production in Chile (GWh) (4) | 15,346 | 15,741 | 16,286 | 16,524 | 16,797 | |||||
| Production in Argentina (GWh) (4) | 10,129 | 9,948 | 7,167 | 7,997 | 11,290 | |||||
| Production in Colombia (GWh) (4) | 9,618 | 10,106 | 10,699 | 10,794 | 11,881 | |||||
| Production in Brazil (GWh) (4) | 3,406 | 2,256 | 2,467 | 3,024 | 3,262 | |||||
| Production in Peru (GWh) (4) | 3,623 | 4,176 | 4,141 | 4,287 | 4,136 | |||||
| (1) | Energy sold by Chilectra includes sales to Río Maipo up to 2003, year in which we sold this company. |
| (2) | Energy losses are calculated by (a) subtracting the number of GWh of energy sold from the aggregate GWh of energy purchased and self-generated within a period and (b) calculating the percentage that the resulting sum bears to the aggregate number of GWh of energy purchased and self-generated within the same period. Energy losses arise from illegally tapped energy as well as technical failures. |
| (3) | If Enersis’ investments in C.G.T. Fortaleza (319 MW) and in Cerj (62 MW) were included, total installed capacity in Brazil would be 1,039 MW as of December 31, 2004. See “Item 4. Information on the Company – D. Property, plants and equipment”. |
| (4) | Energy production is defined as total generation minus energy consumption and technical losses within our own power plants. |
9
EXCHANGE RATES
To the extent our financial liabilities are denominated in foreign currencies, fluctuations in the exchange rate between the Chilean peso and the foreign currencies may have a significant impact on our earnings.
Chile’sLey Orgánica del Banco Central de Chile No. 18,840, or the Central Bank Act, enacted in 1989, liberalized the ability to buy and sell foreign exchange in Chile. Prior to 1989, the law authorized the purchase and sale of foreign exchange only in those cases explicitly authorized by the Central Bank. The Central Bank Act currently provides that the Central Bank may require that certain purchases and sales of foreign exchange be carried out in theMercado Cambiario Formal, or the formal exchange market, a market formed by banks and other entities explicitly authorized by the Central Bank. Purchases and sales of foreign exchange which are generally permitted to be transacted outside the formal exchange market can be carried out in theMercado Cambiario Informal, or the informal exchange market, which is a recognized currency market in Chile. Both the formal and informal exchange markets are driven by free market forces.
For the purposes of the operation of the formal exchange market, the Central Bank sets a reference exchange rate (dólar acuerdo). The reference exchange rate is reset daily by the Central Bank, taking into account internal and external inflation and variations in parties between the Chilean peso and each of the U.S. dollar, the Japanese yen and the Euro in a ratio of 80:5:15, respectively. In order to keep the average exchange rate within certain limits, on rare occasions the Central Bank intervenes by buying or selling foreign exchange in the formal exchange market. The daily observed exchange rate (dólar observado) reported by the Central Bank and published daily in Chilean newspapers is computed by taking the weighted average of the previous business day’s transactions in the formal exchange market.
The informal exchange market reflects transactions carried out at informal exchange rates by entities not expressly authorized to operate in the formal exchange market (e.g., certain foreign exchange houses, travel agencies and others). There are no limits imposed on the extent to which the rate of exchange in the informal exchange market can fluctuate above or below the observed exchange rate. Since 1993, the observed exchange rate and the informal exchange rate have typically been within less than 1% of each other. On December 31, 2004, the informal exchange rate was Ch$ 556.00, or 0.25% lower than the published observed exchange rate of Ch$ 557.40 per U.S.$ 1.00. On May 31, 2005, the informal exchange rate was Ch$ 583.00 per U.S.$ 1.00, the same as the observed exchange rate corresponding to such date. Unless otherwise indicated, amounts translated to U.S. dollars were calculated based on the exchange rates in effect as of December 31, 2004.
The following table sets forth, for the periods and dates indicated, certain information concerning the observed exchange rate reported by the Central Bank. No representation is made that the Chilean peso or U.S. dollar amounts referred to herein could have been or could be converted into U.S. dollars or Chilean pesos, as the case may be, at the rates indicated or at any other rate. The Federal Reserve Bank of New York does not report a noon buying rate for Chilean pesos.
| Observed Exchange Rate (1) | |||||||||
| (Ch$ per U.S.$ ) | |||||||||
| Year | Low (2) | High (2) | Average (3) | Period-end | |||||
| 2000 | 501.04 | 580.37 | 542.08 | 573.65 | |||||
| 2001 | 557.13 | 716.62 | 637.57 | 654.79 | |||||
| 2002 | 641.75 | 756.56 | 692.32 | 718.61 | |||||
| 2003 | 593.10 | 758.21 | 686.89 | 593.80 | |||||
| 2004 | 557.40 | 649.45 | 611.11 | 557.40 | |||||
| Observed Exchange Rate (1) | |||||||||
| (Ch$ per U.S.$ ) | |||||||||
| Last six months | Low (2) | High (2) | Average | Period-end | |||||
| 2004 | |||||||||
| December | 557.40 | 597.27 | — | 557.40 | |||||
| Observed Exchange Rate (1) | |||||||||
| (Ch$ per U.S.$ ) | |||||||||
| Last six months | Low (2) | High (2) | Average | Period-end | |||||
| 2005 | |||||||||
| January | 560.30 | 586.18 | — | 585.40 | |||||
| February | 563.22 | 583.84 | — | 573.55 | |||||
| March | 578.60 | 591.69 | — | 585.93 | |||||
| April | 572.75 | 588.95 | — | 582.73 | |||||
| May | 570.83 | 583.59 | — | 583.00 | |||||
| Source: Central Bank. | |||||||||
| (1) | Reflects Chilean pesos at historical values rather than in constant Chilean pesos. |
| (2) | Exchange rates are the high and low, on a day-by-day basis, for each period. |
| (3) | The average of the exchange rates on the last day of each month during the period. |
10
| B. | Capitalization and indebtedness. |
| Not applicable. | |
| C. | Reasons for the offer and use of proceeds. |
| Not applicable. | |
| D. | Risk Factors. |
Risks Relating to Our Operations
Since our business depends heavily on hydrological conditions, drought conditions may hurt our profitability.
Approximately 69% of our consolidated installed capacity in Chile, Argentina, Brazil, Colombia and Peru is hydroelectric. Accordingly, adverse hydrological conditions affect our business and have a substantial influence over our results.
During periods of drought, thermal plants, including those that use natural gas, fuel oil or coal as a fuel, are dispatched more frequently. Our operating expenses increase during these periods and, depending on the size of our electricity commitments, we may have to buy electricity from other parties in order to meet these commitments. The cost of these electricity purchases in the spot market may exceed the price at which we committed to sell electricity, thus producing losses.
In 2000, our generation subsidiaries established a new commercial policy in order to mitigate the potential impact of interruptions to our ability to supply electricity, including those caused by droughts, interruptions in gas supply and prolonged plant stoppages. Pursuant to this policy, a volume of contracts is determined for each generation company that reduces the risks to acceptable levels, assured by a degree of statistical reliability of 95%. Any contracts for volumes that exceed this 95% level are required to include clauses transferring the risk of interruptions to the customers. However, there can be no assurance that this policy will shield us from the potential negative consequences of long droughts.
The Argentine natural gas crisis has increased the vulnerability of the electricity sector in Chile.
In Argentina, the low price imposed by regulators on natural gas has directly affected production and investment in natural gas fields, which has in turn impacted the short and medium-term availability of this fuel in Chile. A natural gas shortage may force electricity generation companies, including ours, to use more expensive fuel oil, thus substantially increasing production costs. Strong demand for electricity in Chile’s central region, which increased by 7.9% in 2004 and is expected to continue to increase significantly in the foreseeable future, combined with a low level of investment in the electricity sector, makes the Chilean electricity sector particularly exposed to the adverse effects of the Argentine natural gas crisis.
11
In Chile’s central region, Endesa-Chile’s thermal plants San Isidro and Taltal use natural gas for thermal generation and have take-or-pay gas contracts with Argentine suppliers. On March 26, 2004, the Argentine government announced a resolution allowing governmental authorities to partially suspend natural gas exports and giving the President of Argentina the power to temporarily suspend the long-term supply contracts of Argentine exporters. Since that date, Argentina has significantly curtailed its natural gas exports to Chile. As a result, the Chilean electricity sector is more vulnerable than in the past.
We are a holding company and depend on payments from our subsidiaries and related companies to meet our payment obligations.
We are a holding company with no significant assets other than the stock of our subsidiaries. To pay our obligations, we rely on cash from dividends, loans, interest payments, capital reductions and other distributions from our subsidiaries, as well as cash from proceeds of the issuance of our own capital stock or new debt. In addition, the ability of our subsidiaries to pay dividends, interest payments, loans and other distributions to us is subject to legal constraints such as dividend restrictions, fiduciary duties, contractual limitations and foreign exchange controls that may be imposed in any of the five countries where our subsidiaries operate, and to the operating results of our subsidiaries and equity affiliates. Our subsidiaries and equity affiliates may be additionally limited by their operating results.
We have generally been able to access the cash flows of our Chilean subsidiaries. We have not been similarly able to access the cash flows of our non-Chilean operating subsidiaries due to government regulations, strategic considerations, economic conditions, and credit restrictions. See “Item 5 — Operating and Financial Review and Prospects — Results from Operations for the years ended December 31, 2003 and 2004 — Liquidity and Capital Resources”.
Our future results from operations outside Chile may continue to be subject to greater economic and political uncertainties than what we have experienced in Chile, thereby reducing the likelihood that we will be able to rely on cash flow from operations in those entities to repay our debt.
Dividend Limits and Other Legal Restrictions. We and our Chilean subsidiaries are subject to customary legal restrictions limiting the amount of dividend distributions. Some of our non-Chilean subsidiaries are also subject to legal reserve requirements and other restrictions on dividend payments. In addition, the ability of any of our less-than-wholly-owned subsidiaries to upstream cash to us may be limited by the fiduciary duties of the directors of such subsidiaries to their minority shareholders. As a consequence of such duties, our subsidiaries could, under certain circumstances, be prevented from upstreaming cash to us.
Contractual Constraints. Upstreaming restrictions in our subsidiaries’ contractual agreements include:
| • | prohibitions against dividend distributions by Endesa-Chile in the case of default, and Pangue, our Chilean generation subsidiary, if it is not in compliance with certain debt to equity ratios and debt coverage ratios (each as defined in Pangue’s credit agreements); | |
| • | prohibitions against dividend distributions by Edelnor and Edegel in Peru, and Betania in Colombia in the case of default of certain loans; | |
| • | prohibitions against repayments by Betania of intercompany debt unless it raises additional funds from the sale of assets or capital reductions of Emgesa, and against payments of interest on intercompany debt if any scheduled payment of Betania’s syndicated loan is due and not paid; | |
| • | prohibitions against dividend distributions, capital reductions, intercompany interest payments and debt repayment by Cerj and Coelce in Brazil and Costanera in Argentina while certain of its debt is outstanding. |
We are not aware of any contractual limitations on our equity affiliates’ ability to pay dividends or other distributions to us.
12
Operating Results of Our Subsidiaries. The ability of our subsidiaries and equity affiliates to pay dividends or make loan payments or other distributions to us is limited by their operating results. To the extent that the cash needs at any of our subsidiaries exceed available cash, such subsidiary will not be able to make cash available to us.
Foreign Exchange Controls. The ability of our non-Chilean subsidiaries and equity affiliates to pay dividends and make loan payments or other distributions to us may be subject to emergency restrictions that may be imposed by Central Banks or other governmental authorities in the various jurisdictions in which we operate. For example, during the economic crisis in Argentina, the Central Bank of Argentina imposed restrictions on the transfer of funds outside of Argentina.
Chilean regulatory authorities may impose fines on our Chilean subsidiaries due to operational failures which affect the electricity system
In Chile, our electricity businesses may be subject to regulatory fines for any breach of current regulations, including energy supply failure. As of December 31, 2004, such fines may range from 1 Unidad Tributaria Mensual (“UTM”), equivalent to approximately U.S. $ 54, to 10,000 Unidades Tributarias Anuales (“UTA”), equivalent to approximately U.S.$ 6.5 million. Any electricity company supervised by the Chilean Superintendency of Electricity and Fuels, or SEF, may be subject to these fines, which apply in cases where, in the opinion of the SEF, operational failures that affect the regular energy supply to the system are the fault of such company. These fines are subject to appeal.
If rationing policies are imposed by any regulatory authority as a result of adverse hydrological conditions in the countries in which we operate, our business, financial condition and results from operations may be affected adversely in a material way. Rationing periods may occur in the future, and consequently our generation subsidiaries may be required to pay regulatory penalties if such subsidiaries fail to provide adequate service under such conditions.
Our subsidiaries may be subject to other significant regulatory fines.
Our generation and distribution subsidiaries may be required to pay fines or to compensate customers if those subsidiaries are unable to deliver electricity to them even if such failure is due to forces outside of our control. For example, in 1999 Argentine regulators required us to pay approximately U.S.$ 59 million in fines as a consequence of electricity outages resulting from a fire in one of our distribution substations belonging to Edesur. The imposition of these penalties in Argentina increased our operating costs significantly and was not accounted for under the tariff structure that determines our revenues. Although we received compensation from the contractor responsible for the fire, there can be no assurance that we will receive compensation from third parties in the event of any future delivery failure. See “Item 5 — Operating and Financial Review and Prospects — Results from Operations for the years ended December 31, 2003 and 2004.” Our profitability will be affected adversely if we are required to pay penalties and compensation.
On August 14, 2003, the SEF imposed fines on some of our Chilean generation subsidiaries in an aggregate amount of 5,330 UTA, equivalent to approximately U.S.$ 3.5 million, due to a failure in the transmission of energy in the Metropolitan Region on September 23, 2002. On April 27 and May 3, 2004, the SEF imposed fines on both Endesa-Chile and Chilectra in an aggregate amount of 2,030 UTA, equivalent to approximately U.S.$ 1.3 million, due to a black out that occurred in the Metropolitan Region on January 13, 2003. Our subsidiaries are currently appealing these fines, but these appeals may not be successful.
Governmental regulations may impose additional operating costs which may reduce our profits.
We are subject to extensive regulation of tariffs and other aspects of our business in the countries in which we operate, and these regulations may affect our profitability adversely. In addition, changes in the regulatory framework, including changes that if adopted would significantly affect our operations, are frequently submitted to the legislators and administrative authorities in the countries in which we operate, and could have a material adverse impact on our business.
13
Electricity rationing in Chile: If our Chilean generating subsidiaries cannot satisfy their contracts during electricity rationing periods, we may be exposed to higher costs of sales. In the event of droughts or prolonged shutdowns in the country’s thermal plants, the Chilean government may impose periods of electricity rationing, limiting the volume of electricity we can generate. If as a result of a rationing decree, we are unable to generate sufficient electricity to satisfy our contracts, we may be forced to buy electricity in the spot market at the corresponding node withdrawal price. The spot price can be significantly higher than our electricity generating costs and can be as high as the "failure cost" set by the National Energy Commission (NEC). The "failure cost" is determined by the NEC’s economic models as the highest cost of electricity not delivered during periods of energy deficits. If we cannot buy enough electricity in the spot market to meet all our contractual obligations, we would have to compensate our regulated customers, among others, for the volume not supplied at the “rationed end-consumer price”. If rationing policies are imposed by regulatory authorities in Chile, our business, financial conditions and results of operations may be affected adversely.
Water Rights. Approximately 76% of the installed capacity of our Chilean generation subsidiaries is hydroelectric. These generation companies own unlimited duration unconditional and absolute property water rights granted by the Chilean Water Authority. However, in March 2005, Chilean Congress approved a modification to the current laws governing unused water rights. Under the amended law, beginning on January 1, 2006, Chilean generation companies will have to pay an annual license for unused water rights. By the end of 2005, we will have to determine which water rights are likely to be eventually utilized for a hydroelectric project and which will not. If we determine that some water rights will not be used for a future project, we will abandon such water rights in order to avoid liability for license payments. We estimate that in the event that we do not abandon any water rights in the SIC, we will have to pay license fees aggregating no more than the equivalent of U.S.$ 4.0 million per year. When any future project commences operations, license fees paid for the corresponding water rights will be recovered retroactively through a tax credit, for a term of up to eight years before the start up of the project that utilizes the water rights.
In the case of water rights located in the extreme south of Chile (in particular, the eleventh and twelfth regions, outside the area comprised by the SIC), the license payments will be paid starting as of January 1, 2013, using the same tax refund regime mentioned above for the SIC.
Following the prolonged drought in 1999, the Electricity Law was amended pursuant to Article 99 bis to provide that a drought can no longer constitute a force majeure event and therefore cannot be invoked by hydroelectric generating companies as a basis for failure to deliver energy. Despite the fact that generation companies have changed their commercial strategies and have been more reluctant to enter into long-term contracts, any contractual shortfall caused by extreme droughts can no longer be invoked as an exception to our obligations.
Resolution 88. In May 2001, the Ministry of Economy issued Resolution 88, under which electricity generators such as Endesa-Chile and its Chilean subsidiaries are required to provide electricity to distribution companies that are not able to freely contract adequate supply to deliver to their customers. Under the terms of Resolution 88, each generator must supply energy to the distributors with deficit positions in proportion to the firm energy of each generator at a price equal to the node price. Firm energy is the estimated amount of energy that can be reliably delivered to an interconnected system during a given year by all generating units in that system, under certain assumptions. If Endesa-Chile and its Chilean subsidiaries cannot generate sufficient energy to supply their share of distribution companies’ needs, they will be required to purchase energy on the spot market, at prices that may be significantly higher than the price at which they would be required to sell to distributors, and accordingly they may incur losses. In addition, the requirement to sell to distributors limits Endesa-Chile’s ability to expand sales to non-regulated customers, who may be more profitable for us. For a more complete discussion of this topic, see “Item 4. Information on the Company—Electricity Industry Regulatory Framework”.
Environmental regulations in the countries in which we operate may increase our costs of operations.
Our operating subsidiaries are also subject to environmental regulations, which, among other things, require us to perform environmental impact studies for future projects and obtain permits from both local and national regulators. Approval of these environmental impact studies may be withheld by governmental authorities, public opposition may result in delays or modifications to any proposed project and laws or regulations may change or be interpreted in a manner that could adversely affect our operations or our plans for companies in which we holdinvestments. See “Item 4. Information on the Company—D. Property, plants and equipment—Environmental Issues”.
14
Construction of new facilities may be affected adversely by factors associated commonly with new construction projects.
Factors that may affect our ability to build new facilities include:
| • | delays in obtaining regulatory approvals, including environmental permits; | |
| • | shortages or changes in the prices of equipment, materials or labor; | |
| • | local opposition of political and ethnic groups; | |
| • | adverse changes in the political and regulatory environment in the countries where we and our related companies operate; | |
| • | adverse weather conditions, which may delay the completion of power plants or substations, or natural disasters, accidents or other unforeseen events; and | |
| • | the inability to obtain financing at affordable rates. |
Any of these factors may cause delays in the completion of all or part of our capital investments program and may increase the cost of the projects.
Foreign exchange risks may affect our results from operations and financial condition adversely.
The Chilean peso and the other South American currencies in which we and our subsidiaries operate have been subject to large devaluations and appreciations against the U.S. dollar in the past and may be subject to significant fluctuations in the future. Historically, a significant portion of our consolidated indebtedness has been denominated in U.S. dollars and, although a substantial portion of our revenues are linked in part to U.S. dollars, we generally have been and will continue to be materially exposed to fluctuations of our local currencies against the dollar because of time lags and other limitations in the indexation of our tariffs to the U.S. dollar.
Because of this exposure, the cash generated by us and our subsidiaries can be diminished materially when our local currencies devalue against the dollar. For example, in the case of our Argentine subsidiaries, regulatory changes introduced in 2002 eliminated dollar indexation of our tariffs altogether, which together with a devaluation of approximately 71% of the Argentine peso against the U.S. dollar and pesification of our contractual rates, resulted in a reduction of net cash generation. Future volatility in the exchange rate of the Chilean peso, and the other currencies in which we receive revenues or incur expenditures, to the U.S. dollar, may affect our financial condition and results from operations. For more information on the risks associated with foreign exchange rates, see “Item 11. Quantitative and Qualitative Disclosures About Market Risk.”
As of December 31, 2004, Enersis had total consolidated indebtedness (net of derivatives transactions) of U.S.$ 6,657 million, of which U.S.$ 3,560 million, or 53.5%, was denominated in U.S. dollars. The latter amount is net of a U.S./UF swap contract for U.S. $750 million. For the twelve-month period ended December 31, 2004, our revenues amounted to U.S.$ 5,476 million (before consolidation adjustments) of which U.S.$ 400 million, or 7.3%, were denominated in U.S. dollars, and U.S.$ 772 million, or 14.1% were linked in some way to the U.S. dollar. In aggregate, 21.4% of our revenues (before consolidation adjustments) were either in U.S. dollars or correlated to such currency through some form of indexation. On the other hand, the equivalent of U.S.$ 1,152 million were revenues in pesos, which represents 21.0% of our 2004 revenues (before consolidation adjustments).
In addition to the U.S. dollar and the Chilean peso, and as of December 31, 2004, our foreign-currency denominated consolidated indebtedness included the equivalent of U.S.$ 609 million in Brazilian reals (net of a U.S.$/R$ swap contract for U.S.$ 79 million), U.S.$ 697 million in Colombian pesos, U.S.$ 250 million in Peruvian soles, and U.S.$ 80 million in Argentine pesos, for an aggregate of U.S.$ 1,637 million in currencies other than Chilean pesos and U.S. dollars. At the same time, revenues before consolidation adjustments in these other currencies for the twelve-month period ended December 31, 2004, included the equivalent of U.S.$ 1,196 million in Brazilian reais, U.S.$ 927 million in Colombian pesos, U.S.$ 601 million in Argentine pesos, and U.S.$ 428 million in Peruvian soles. Despite the fact that we have both revenues and debt in these same currencies, we believe that we are exposed to risk in terms of our foreign exchange exposure to these four currencies. The most material case is that of Argentina, where most of our debt is denominated in U.S. dollars while our revenues are mostly in Argentine pesos, as discussed above.
15
The impact on the value of our assets of high levels of devaluation in the countries in which we operate outside Chile may not be reflected on our reported financial condition as a result of Chilean accounting treatment.
The manner in which we restate our foreign investments under Chilean GAAP requires us to translate non-monetary assets and non-monetary liabilities of our non-Chilean subsidiaries and equity affiliates into U.S. dollars at historical rates of exchange. This accounting treatment may have the effect of excluding from our reported balance sheet the effect of devaluation on our non-monetary assets in the countries in which our subsidiaries and investments are located because devaluations of the local currency against the dollar or the Chilean peso are not reflected. See “Item 5. Results from Operations for the Fiscal Years Ended December 31, 2003 and December 31, 2004—Critical Accounting Policies—Technical Bulletin No. 64”.
We and our subsidiaries may be subject to refinancing risk.
As of December 31, 2004, on a consolidated basis, we had U.S.$ 635 million of indebtedness maturing in 2005, U.S.$ 1,169 million in 2006, and U.S.$ 1,279 million of indebtedness maturing in the period 2007 through 2008 and U.S.$ 3,573 million maturing thereafter.
We may be unable to refinance our indebtedness or obtain such refinancing on terms acceptable to us. In the absence of such refinancing, we could be forced to dispose of assets in order to make up for any shortfall in the payments due on our indebtedness under circumstances that might not be favorable to obtaining the best price for such assets. Furthermore, assets may not be sold quickly enough, or for amounts sufficient to enable us to make such payments.
As of December 31, 2004, the debt of our Brazilian and Argentine operating subsidiaries amounted to approximately U.S.$ 999 million. U.S.$ 254 million of this amount is short-term debt due in 2005. As a matter of policy for all of our Brazilian and Argentine subsidiaries, we are primarily making interest payments when due, and we are negotiating extensions of the principal payment dates of most of our outstanding debt. Our international creditors have understood the extraordinary circumstances that have led us to take these steps and have accepted these financing arrangements. However, if our international creditors do not continue to accept rolling over debt principal when it becomes due, we may be unable to refinance our indebtedness on terms acceptable to us. Default under the indebtedness of our Argentine or Brazilian subsidiaries could trigger a cross-default under our other indebtedness. For further discussion of our short term debt obligations and their expected refinancing, see “Item 5 — Results from Operations for the years ended December 31, 2003 and 2004 — Liquidity and Capital Resources”.
We are subject to financial covenants under our existing indebtedness.
We are subject to certain fairly standard financial covenants related to maximum ratios of indebtedness to adjusted cash flow, indebtedness to EBITDA, debt to equity and minimum ratio of adjusted cash flow to interest expense. In addition, substantially all of our indebtedness contains cross-default provisions, generally triggered by default on other indebtedness in amounts exceeding U.S.$ 30 million on an individual basis. In the event that any of our cross-default provisions are triggered and our existing creditors demand immediate repayment, substantially all of our indebtedness will become due and we would be unable to pay such debt.
For more information on these credit facilities, see “Item 5 — Results from Operations for the years ended December 31, 2003 and 2004 — Liquidity and Capital Resources”.
16
We are currently involved in various litigation proceedings, which could result in unfavorable decisions or financial penalties for us, and we will continue to be subject to future litigation proceedings, which could have material adverse consequences to our business.
We are a party to a number of legal proceedings, some of which have been pending for several years. Some of these claims may be resolved against us. Our financial condition or results from operations could be affected adversely to a material extent if certain of these material claims are resolved against us. See “Item 8 - Legal Proceedings” and Note 30 to our consolidated financial statements included in this annual report.
There may be potential conflicts of interest with our affiliates which could adversely affect our business.
As of December 31, 2004 Endesa-Spain owned 60.6% of Enersis’ share capital. Therefore, Endesa-Spain has the power to determine the outcome of most material matters to be decided by a vote of our shareholders, such as the election of the majority of our board members and, subject to contractual and legal restrictions, the distribution of dividends. Endesa-Spain can also exercise influence over our operations and business strategies. Endesa-Spain conducts its business in South America through us and through affiliates not consolidated by us. To the extent any conflict arises between our interests and those of Endesa-Spain’s other businesses in any jurisdiction in South America, Endesa-Spain may have a conflict of interest, which could have an adverse effect on our business.
Certain of our directors are officers of Endesa-Spain and officers and directors of certain subsidiaries of Endesa-Spain. For more information about these directors please refer to “Item 6. Directors, Senior Management and Employees – Directors and Senior Management.”
Our subsidiaries sell electricity to other companies controlled by Endesa-Spain at regulated prices and have entered into contracts for other services with other companies controlled by Endesa-Spain, or the Endesa Group.
The values of our subsidiaries’ long-term energy supply contracts are subject to fluctuations in the market prices of certain commodities.
We have economic exposure to fluctuations in the market prices of certain commodities as a result of the long-term energy sales contracts we have entered into. Our subsidiaries have material obligations under long-term fixed-price electricity sales contracts, the values of which fluctuate with the market price of electricity. In addition, our generation subsidiaries have material obligations as selling parties under long-term energy supply contracts with prices that vary in accordance with the market price of electricity, water levels in our reservoirs, the market prices of primary materials such as natural gas, oil, coal and other energy-related products, as well as the exchange rate of the U.S. dollar. Changes in the market price of these commodities and in the exchange rate do not always correlate with changes in the market price of electricity or with our cost of production of electricity; accordingly, there may be times when the price paid to us under these contracts is less than our cost of production or acquisition of electricity. We do not carry out transactions in commodity derivative instruments to manage our exposure to commodity price fluctuations. Under Chilean GAAP, our income statement does not reflect fluctuations in the fair value of our long-term energy contracts, although we are required to do so under U.S. GAAP. Our policy is not to enter into supply contracts for amounts exceeding our firm capacity under adverse hydrological conditions. For further discussion, please refer to “Item 11. Quantitative and Qualitative Disclosures About Market Risk—Commodity Price Risk” in this annual report.
Risk Factors Relating to Chile
Our business is dependent on the Chilean economy and our revenues are sensitive to its performance.
A substantial portion of our assets and operations are located in Chile and, accordingly, our financial condition and results from operations are to a certain extent dependent upon economic conditions prevailing in Chile. In 2004, the Chilean economy grew by 6.1% compared to a 3.7% increase in 2003. The Central Bank recently reclassified its criteria for growth measurements. The latest Chilean Central Bank forecasts for GDP growths between 5.3% and 6.3% for 2005 and approximately 5% for 2006 (Central Bank, “Informe Política Monetaria,” May 2005). There is no assurance that such growth will be achieved, that the growth trend will continue in the future, or that future developments in the Chilean economy will not impair our ability to proceed with our strategic plans or impact our financial condition or results from operations adversely. Our financial condition and results from operations could also be affected by changes in economic or other policies of the Chilean government, which has exercised and continues to exercise a substantial influence over many aspects of the private sector. In addition, our financial condition and results from operations could also be affected by other political or economic developments in Chile, as well as regulatory changes or administrative practices of Chilean authorities, over which we have no control.
17
Increased inflation in Chile may affect our results from operations adversely.
Although Chilean inflation has been low in recent years, Chile experienced high levels of inflation in the past. High levels of inflation in Chile could affect the Chilean economy adversely and, indirectly, the value of shares of Enersis’ common stock and ADSs. The Chilean Consumer Price Index, or Chilean CPI, for the 12 months ended December 31, 2004, was 2.4%, and government officials expect Chilean CPI to be approximately 2.0% and 3.0% for 2005 and 2006, respectively. Historically, a substantial part of our expenses have been denominated in Chilean pesos, and future increases in Chilean inflation could cause our expenses to rise significantly. As a result, the level of Chilean inflation may affect our financial condition and results from operations.
We believe that moderate inflation will not materially affect our business in Chile. Electricity tariffs in Chile, both for generation and distribution, contain indexing mechanisms that are intended to neutralize the effects of inflation. However, we believe that the performance of the Chilean economy, our operating results, and the value of securities issued by us, could be affected adversely if inflation levels were to rise significantly.
Lawsuits against us brought outside Chile or complaints against us based on foreign legal concepts may be unsuccessful.
We are incorporated under the laws of Chile and substantially all of our assets are located in Chile or elsewhere in South America. All of our directors and officers reside outside the United States and most of their assets are located outside the United States as well. If any shareholder were to bring a lawsuit against our directors, officers or experts in the United States, it may be difficult for them to effect service of legal process within the United States upon these persons or to enforce against them, in United States courts or Chilean courts, judgments obtained in the United States courts based upon the civil liability provisions of the federal securities laws of the United States. In addition, there is doubt as to whether an action could be brought successfully in Chile on the basis of liability based solely upon the civil liability provisions of the United States federal securities laws.
Foreign exchange risks may affect the U.S. dollar amount of dividends payable to holders of Enersis’ ADSs adversely.
Chilean trading in the shares of common stock underlying the ADSs is conducted in pesos. Enersis’ depositary will receive cash distributions that we make with respect to the shares underlying the ADSs in pesos. The depositary will convert such pesos to U.S. dollars at the then-prevailing exchange rate to make dividend and other distribution payments in respect of ADSs. If the Chilean peso appreciates against the U.S. dollar, the value of the ADSs and any distributions ADS holders receive from the depositary may decrease.
The relative illiquidity and volatility of Chilean securities markets could affect the price of the Enersis ADSs and common stock adversely.
Chilean securities markets are substantially smaller and less liquid than the major securities markets in the United States. In addition, Chilean securities markets may be affected materially by developments in other emerging markets, particularly other countries in South America. The low liquidity of the Chilean market may impair the ability of holders of ADSs to sell shares of our common stock withdrawn from the ADS program into the Chilean market in the amount and at the price and time they wish to do so.
Risk Factors Relating to the Rest of South America.
South American economic fluctuations are likely to affect our results from operations.
All of our operations are located in South America. Although we originally operated only in Chile, we have, through strategic acquisitions and investments, expanded our operations throughout South America. In 2004, we generated 65% of our consolidated operating revenues and 62% of our consolidated operating income outside Chile (before consolidation adjustments). Accordingly, our consolidated revenues are sensitive to the performance of the South American economies as a whole. If local, regional or worldwide economic trends adversely affect the economy of any of the countries in which we have investments or operations, our financial condition and results from operations could be affected adversely.
18
The South American financial and securities markets are, to varying degrees, influenced by economic and market conditions in other emerging market countries. Although economic conditions are different in each country, investor reaction to developments in one country can have significant effects on the securities of issuers in other countries, including Chile. Chilean financial and securities markets may be affected adversely by events elsewhere, especially in other emerging markets, and such effects may affect the value of or the interest rate yields in the secondary markets for our debt securities. Moreover, Enersis and Endesa-Chile have significant investments in relatively risky non-Chilean countries such as Argentina, Brazil, Colombia and Peru. Generation and upstreaming of cash from subsidiaries in these countries have proven to be volatile.
Certain South American economies have been characterized by frequent and occasionally drastic intervention by governmental authorities, which may affect our business adversely.
Governmental authorities have often changed monetary, credit, tariff and other policies to influence the course of the economy of Argentina, Brazil, Colombia and Peru. These governments’ actions to control inflation and effect other policies have often involved wage, price and tariff rate controls as well as other interventionist measures, which have included freezing bank accounts and imposing capital controls. Changes in the policies of these governmental authorities with respect to tariff rates, exchange controls, regulations and taxation could affect our business and financial results adversely, as could inflation, devaluation, social instability and other political, economic or diplomatic developments, including the response by governments in the region to such circumstances. If governmental authorities intervene in any of the countries in which we operate, it could cause our business to be less profitable, and our results from operations may be affected adversely.
Risk Factors Related to Brazil
Energy losses in Brazil may affect our financial results adversely.
Our Brazilian distribution subsidiaries experience materially higher energy losses than occur in the rest of our distribution operations, with Coelce and Cerj experiencing loss rates for 2004 of 13.9% and 22.8%, respectively, compared with an average loss rate of 9.0% for the rest of our distribution operations. Elevated energy loss rates in our Brazilian distribution subsidiaries are due principally to energy theft, which is particularly acute in areas with high concentrations of low-income customers and in periods of economic downturn. Energy losses affect our financial results because lost energy could otherwise have been distributed to customers or sold to other distributors in return for payment.
Brazilian Energy Sector Reform could have an adverse effect on our business and operations in Brazil.
Following the electricity supply crisis in 2001, due to low rainfalls, the electricity committee of the Brazilian federal government announced various measures for revitalizing the energy sector and ensuring a high level of competition, attracting new investments and increasing the transparency of the rules governing these services.
In March 2004, Federal Laws Nº 10,847 and 10,848 were enacted in order to establish a new model for the Brazilian Electricity Sector. These laws were subsequently implemented by decrees and resolutions enacted by MME (Ministry of Mines and Energy) and ANEEL (the Brazilian National Agency of Electric Energy). Additionally, these resolutions will, among other things, determine how the inherent risks will be distributed among the different market participants (i.e. hydrological risk, market fluctuations and accounts receivable) and prohibit the participation of distribution companies in related activities like generation.
The new Brazilian model for the electricity sector creates a regulatory framework based on the principle of stability and low tariffs for consumers. It also seeks to guarantee the expansion of installed capacity to satisfy demand growth. Pursuant to this model, 100% of distributors’ forecasted energy demand must be satisfied through long-term contracts. Accordingly, several bidding processes have been and will be called by ANEEL and the Chamber of Energy Sales in advance of the expiration of current contracts in the regulated environment. Therefore, our distribution companies may end up bidding for either more or less than actual demand. For additional information, please refer to “Item 4. Information on the Company’s Operations in Brazil – Structure of the new Electricity Sector”.
19
Future governmental initiatives may affect our operations adversely.
Program for Regulatory Losses in Brazil.In connection with the next distribution tariff setting process in 2008, we expect the government to reduce the provision for energy losses in tariffs. This represents a risk for our companies, Cerj and Coelce, because tariffs today recognize a level of losses close to the real level of each company. Consequently, any future reduction will negatively affect Brazilian operations if we are not able to reduce the high level of energy theft.
Brazilian social low-income program. The Brazilian authorities have designed a program that will ensure electricity to those who cannot afford it. The program provides a subsidy to the distributor supply in order to allow residential consumers to pay a lower tariff for energy if they satisfy certain requirements. Consumers have faced difficulties enrolling in government programs of this kind. To solve this problem, ANEEL enacted Resolution No. 148/05, which allows consumers to enjoy the benefits of the government program by making a simple declaration agreeing to deliver the documentation that proves compliance with the applicable requirements of the program until February 2006. It is uncertain whether ANEEL will extend the deadline beyond such date, or whether consumers who have not delivered the required documentation by that date will lose the benefit of the electricity subsidy. Approximately 40% of Cerj’s customers require this benefit in order to pay their electricity bills. If these customers are unable to participate in this program, they may be unable to pay amounts owing to us in a timely manner, if at all, and electricity theft may increase, any of which may adversely affect our operating results.
Universalization Program in Brazil. We are currently participating in the creation of the “Universalization Program”, a governmental initiative to provide electricity in rural areas. This program will require us to make certain investments, and we are uncertain at this time as to the amounts of such required investments or how such investments will be financed.
Risk Factors Related to Argentina
The Central Bank of Argentina has recently lifted, but may reinstate, restrictions on the transfer of funds outside of Argentina that could prevent our Argentine subsidiaries from distributing dividends and paying principal on certain of their external debt as it comes due.
From December 3, 2001 to May 6, 2003, the Argentine government imposed a number of monetary and currency exchange control measures that included restrictions on the free transfer of funds deposited with banks and severe restrictions on transferring funds abroad (including payments of dividends, principal and interest on debt), with certain exceptions for transfers related to foreign trade and other authorized transactions. The restrictions, requiring the Argentine Central Bank’s prior authorization for the transfer of funds abroad in order to make payments of principal and/or interest, were gradually relaxed from January to May 2003.
Currently, funds may be transferred abroad without the prior authorization of the Argentine Central Bank in order to pay dividends corresponding to prior periods provided that independent accountants have certified the financial statements for such period.
There can be no assurance, however, that the Argentine Central Bank will not once again require its prior authorization for the transfer of funds abroad for principal and/or interest payments by any of our Argentine subsidiaries to their foreign creditors or for dividend payments by our Argentine subsidiaries to their shareholders.
Should the Argentine Central Bank reimpose restrictions on the transfer of funds outside of Argentina that prevent our Argentine subsidiaries from paying principal on certain of their external debt, a substantial portion of their debt obligations may become due and payable, unless new financing is funded outside Argentina and is available to our Argentine subsidiaries or they are able to renegotiate, or obtain a waiver with respect to the indebtedness that would be subject to such restrictions. If similar restrictions are imposed again, our Argentine subsidiaries may not be able to obtain new financing or be able to renegotiate or obtain waivers with respect to indebtedness subject to foreign exchange restrictions. In addition, such restrictions may impede the ability of our Argentine subsidiaries to make cash distributions to us.
20
As of December 31, 2004, the debt of our Argentine subsidiaries amounted to approximately U.S.$ 506 million. As a matter of policy for all of our Argentine subsidiaries, including generation and distribution companies, as long as the foreign currency restrictions remain in Argentina, and as long as fundamental issues concerning the electricity sector remain unresolved, we are primarily making interest payments when due, as permitted by the Argentine Central Bank, and we are rolling over most of our outstanding debt. On December 31, 2003, our Argentine subsidiaries’ total outstanding debt was U.S.$ 620 million, of which U.S.$ 393 million was due during 2004. We paid U.S.$ 113 million of principal and rolled over U.S.$ 280 million. Our international creditors have understood the extraordinary circumstances that have led us to take these steps and to date have accepted these refinancing arrangements. If our creditors do not continue to accept, or the Argentine Central Bank will not continue to permit, rolling over debt principal when it becomes due, we may be unable to refinance our indebtedness on terms acceptable to us.
Argentine authorities have implemented a number of monetary and currency-exchange control measures that have had, and may continue to have, an adverse effect on our results from operations and financial condition in Argentina.
The Economic Emergency Law has affected Edesur adversely by repealing the provisions of Edesur’s concession contract that permitted its distribution tariffs to be pegged to the dollar, and that provided for certain price indexation mechanisms. Since Edesur’s invoices to its clients are no longer pegged to the dollar, the dollar value of such receivables declined significantly in the wake of the devaluation of the Argentine peso. Because Edesur’s indebtedness is largely dollar-denominated, the above-mentioned factors have had, and may continue to have, a significant negative impact on Edesur’s net income.
The Economic Emergency Law also authorized the Argentine Federal Executive Branch to renegotiate all public service contracts, and establishes certain guidelines dealing with potential impacts on the Argentine domestic economy, quality of service and capital expenditure plans, consumer interests, the security of the systems, and the profitability of the companies providing such services. On March 20, 2002, the government listed the set of contracts to be renegotiated, as well as the general procedures to be used as guidance in such negotiations. Among these contracts is Edesur’s concession contract.
As of the date of this report, Argentina had nearly completed the restructuring of a substantial portion of its bond indebtedness, but such restructuring continued to be subject to litigation. In addition, an agreement with the IMF had not been reached. The failure to do so could block Argentina’s further access to international financing, affecting the new government’s ability to implement reforms required to restore stability, economic growth and public confidence. In addition, our Argentine subsidiaries may encounter incremental financing risk.
The Argentine electricity sector shortfalls could impact the interconnection business between Argentina and Brazil.
As a result of the strong increase in domestic demand for natural gas and electricity in Argentina, coupled with the lack of investment in natural gas production and transportation, the Argentine electricity generation business is operating in very tight conditions and as a result may be unable to meet its internal demand and have further difficulties in exporting electricity to Brazil. The Argentine government has adopted measures with the intention of assuring domestic supply. Our Argentine generation subsidiary, Costanera, is not currently allowed to export electricity produced with natural gas, nor is it allowed to purchase electricity in the wholesale market in order to satisfy its export contracts. For these reasons, the electricity capacity and energy contracts that link Argentine generation companies, including Costanera, to CIEN, our affiliated transmission company with an electricity interconnection business between Argentina and Brazil, could be affected adversely. If hydrological conditions in southern Brazil do not improve, or if the Argentine authorities do not relax certain recent restrictions to export electricity to Brazil, CIEN and Costanera may encounter non-performance risk, which could lead to an adverse effect on our companies. (See Item 4, “Endesa-Chile’s Operations in Argentina” and “Endesa-Chile’s Operations in Brazil”).
21
Risk Factor Related to Colombia
Colombia’s electricity power industry has in the past been affected adversely by guerilla attacks.
Guerrilla organizations have long been active in Colombia. Although our Colombian facilities have never been subject to any attacks, we cannot assure that such attacks will not occur in the future. In many remote regions of the country that have traditionally lacked an effective governmental presence, the guerillas have exerted influence over the local population. In recent years, guerilla organizations have employed acts of terrorism to draw attention to their causes. Despite efforts by the Colombian government to address the situation, Colombia continues to be affected by social friction and violence related to guerilla activity. Most of this activity has been directed toward the oil industry. The persisting violence could also result in renewed attacks against electricity assets, which may adversely affect our business. The Colombian government has targeted its intervention on inflation, devaluation, unemployment, fiscal policy and drug-related violence. We cannot assure you, however, that these interventionist measures will result in higher economic growth in Colombia or remove the risks of attack against our electricity assets.
During 2002, our Colombian companies paid an anti-terrorism tax which affected our net income. Although we believe such a tax was non-recurrent, future guerilla or terrorist actions in Colombia may result in similar actions by the Colombian tax authorities.
Formation of an electronic contract system could affect our business in Colombia.
The Commission for the Regulation of Energy and Gas (CREG) is promoting the creation of an electronic electricity exchange similar to a financial market. This would serve to increase the levels of competition and transparency in energy transactions between the different market players. However, according to preliminary documentation, the contracting parties would not be able to evaluate the creditworthiness of their counterparts. If, in the future, we are forced to conduct transactions through an electronic electricity exchange which does not allow us to assess counterparty credit risk, we will be exposed to a greater risk of payment and non-performance default, which may affect our revenues adversely.
Risk Factor Related to Peru
We may suffer losses as a result of differences between the node price and the marginal cost of electricity.
In 2004, generators in Peru agreed to meet the demand of the regulated market at the node price through 2007. Each generator will supply energy in proportion to its share of installed capacity. This agreement exposes the company to possible losses as a result of differences between the node price and the marginal cost of electricity because the company may be required to purchase electricity at higher prices in the spot market and resell it at fixed node prices.
Law 28,447 of December 2004 changed the node price calculation method, which will now be set annually rather than semi-annually, and modified the study period for calculation of the node price. This period is of 12 months prior to the price setting and 24 months of projected future demand and supply of energy. It is still not possible to foresee the impacts of this new calculation mechanism.
Future tariff reductions may adversely affect our business.
VAD Tariff Setting Process.The new VAD tariffs will be introduced in November 2005. Due to the early stage of the process, it is not possible to estimate the impact, if any, that these new tariffs will have on Edelnor’s results of operations.
Secondary Transmission Tariff Setting Process. The tariff setting process for secondary transmission systems (grids which are not part of the principal systems and are used to link generators or customers with the main grid) began in May 2005. This process will give rise to new tariffs at the end of 2006, and could affect Edelnor as owner of secondary transmission systems.
22
Future regulatory reforms may adversely affect our business.
Governmental authorities are currently in discussions with electricity companies to explore a future reform of the Peruvian electricity sector regulatory framework. Due to the early stage of conversations, we cannot estimate whether this reform will take place or not, or what its scope could be.
Item 4. Information on the Company
| A. | History and development of the company. |
Description of Business
Enersis was originally organized asCompañía Chilena Metropolitana de Distribución Eléctrica S.A., as recorded in a public deed on June 19, 1981. The existence of our company was authorized, and its by-laws were approved, pursuant to Resolution No. 409-S on July 17, 1981, issued by the Chilean Superintendency of Securities and Insurance, or SVS (using the Spanish acronym). The by-laws have been amended subsequently. The existence of our company under its current name, ENERSIS S.A., or Enersis, dates back to August 1, 1988. Enersis is a limited liability stock company domiciled in Santiago, Chile, and operates under Chilean law and regulations. The corporate headquarters are located in Avenida Santa Rosa 76, Santiago, Chile. Our telephone number is (562) 353 4400.
The Company’s authorized representative in the United States of America is Puglisi & Associates, whose contact information is:
| Main office: | 850 Library Avenue, Suite 204, Newark, Delaware |
| Mailing Address: | P.O. Box 885, Newark, Delaware, 19711 |
| Telephone: | (302) 738-6680 |
| Fax: | (302) 738-7210 |
Introduction
We are an electricity utility company primarily engaged, through our principal subsidiaries and related companies, in the generation, transmission and distribution of electricity in Chile, Argentina, Brazil, Colombia and Peru. We are one of the largest private sector electricity companies in South America in terms of consolidated assets and operating revenues with over 10 million customers and the largest electricity company in Chile. Through Endesa-Chile, our largest consolidated subsidiary, we are one of the largest private sector electricity generation company in South America in terms of installed capacity. We also have smaller operations in other non-electricity businesses. Endesa-Spain, Spain’s largest electricity generation and distribution company, acquired control of our company in April 1999 and owned 60.62% of our outstanding shares as of December 31, 2004.
For the eight years ended December 31, 2004, we have ranked as the largest private sector electricity company in Chile, measured by consolidated assets and consolidated operating revenues. As of and for the year ended December 31, 2004, our consolidated assets were Ch$ 10,507.5 billion and our consolidated operating revenue was Ch$ 2,708.9 billion.
We trace our origin toCompañía Chilena de Electricidad Ltda., or CCE, which was formed in 1921 as a result of the merger of Chilean Electric Tramway and Light Co., founded in 1889, andCompañía Nacional de Fuerza Eléctrica, with operations dating back to 1919. In 1970, the Chilean government nationalized CCE. In 1981, CCE’s operations were divided into one generation company, the current AESGener S.A., and two distribution companies, one with a concession in Region V, the currentChilquinta S.A., and the other with a concession in the Santiago metropolitan region,Compañía Chilena Metropolitana de Distribución Eléctrica S.A.From 1982 to 1987, the Chilean electric utility sector went through a process of re-privatization. On August 1, 1988,Compañía Chilena Metropolitana de Distribución Eléctrica S.A.changed its name to ENERSIS S.A. and became the new parent company ofDistribuidora Chilectra Metropolitana S.A.,later renamedChilectra S.A.In 1989, Río Maipo was spun off from Chilectra, and Río Maipo has since operated the electricity distribution concession in the more rural southern and western portions of the Santiago metropolitan region. Enersis sold Río Maipo on April 30, 2003. In the 1990s, we diversified into electricity generation and transmission through our increasing equity stakes in Endesa-Chile. We began our international operations with the 1992 investment in Edesur, the Argentine electricity distribution company. We then expanded primarily into electricity generation and distribution businesses in four South American countries: Argentina, Brazil, Colombia and Peru. Currently, we remain focused on the electricity sector, although we also have small operations in other businesses.
23
Electricity Generation
Our electricity generation business is conducted primarily through Endesa-Chile, which has operations in Chile, Argentina, Brazil, Colombia and Peru. As of December 31, 2004, Endesa-Chile, together with its principal subsidiaries and related companies, accounted for an aggregate of 12,333 MW of generation capacity. In addition, Enersis participates in the electricity generation sector in Brazil through our 49% equity interest in Central Geradora Termelectrica Fortaleza (“CGTF”) with a 319 MW capacity, and through 62 MW of capacity owned by our subsidiary, Cerj.
Endesa-Chile’s consolidated electricity production reached 47,366 GWh in 2004, 11.1% greater than the 42,626 GWh produced in 2003. Total generation in 2002 was 40,760 GWh. In the electricity industry it is common to segment the business into hydroelectric and thermoelectric generation. This is done because each method of generation has different variable costs for generating electricity. Thermoelectric generation requires the purchase of fuel rather than the use of water from reservoirs or rivers, consequently increasing the variable costs of generation. Of Endesa-Chile’s consolidated generation, 74% was from hydroelectrical sources while the remaining 26% from thermal sources.
The following table summarizes the information relating to Endesa-Chile’s electricity generation:
| Year ended December 2002 | |||||||||||||
| 2002 | 2003 | 2004 | |||||||||||
| (GWh) | % | (GWh) | % | (GWh) | % | ||||||||
| Hydroelectric Generation | 34,304 | 84 | 35,035 | 82 | 34,858 | 74 | |||||||
| Thermal Generation | 6,456 | 16 | 7,591 | 18 | 12,508 | 26 | |||||||
| Total Generation | 40,760 | 100 | 42,626 | 100 | 47,366 | 100 | |||||||
Endesa-Chile’s Operation in Chile
The Chilean electricity system is divided into four systems: Sistema Interconectado Central (the “SIC”);Sistema Interconectado del Norte Grande (the “SING”); and two minor isolated systems,Aysén andMagallanes.
Endesa-Chile is the largest electricity generation company in Chile measured by installed capacity and one of the largest private sector electricity companies in the country. Endesa-Chile had operating income of Ch$ 397.2billion and Ch$ 360.5 billion for the fiscal years ended December 31, 2004 and 2003, respectively. We own 60.0% of Endesa-Chile.
As of December 31, 2004, Endesa-Chile had a total of 22 generation facilities in Chile. Twenty of the generation facilities owned and operated by Endesa-Chile in Chile were connected to the SIC, with the remaining generation facilities located in the SING. These generation facilities provide electricity to the northern mining region of Chile.
The SIC, the largest of the systems, extends 2,400 km from Tal Tal in the north to Quellón on the southern island of Chiloé. Installed capacity in December 2004 was 8,290 MW (defined as the maximum power considered by CDEC-SIC in the calculation of firm power in 2004), 61% of which is hydroelectric and 39% thermal. Peak demand on the SIC in 2004 was 5,430 MW and annual physical sales were 34,627 GWh. Electricity sales to the SIC grew by 7.9 % from 2003 to 2004. The SIC covers the area where over 70% of the Chilean demand for electricity is located.
24
The SING covers the northern territory of the country from Arica to Coloso, a distance of approximately 700 km. The SING has an installed capacity as of December 2004 of 3,596 MW, 99% of which is thermal. Peak hourly generation in the SING in 2004 was 1,645 MW and annual physical sales were 11,240 GWh. Consumption in the SING grew by 7.3 % from 2003 to 2004.
We and our Chilean generation subsidiaries supply electricity to the major regulated electricity distribution companies, large unregulated industrial firms (primarily in the mining, pulp and steel sectors) and the market pool. Commercial relationships with customers are normally governed by formal contracts. Supply contracts with distribution companies must be adjudicated in a bidding process, have a price fixed by governmental authorities, are generally standardized and have an average term of ten years. Supply contracts with unregulated customers (large industrial customers) are specific to the needs of each client and all the conditions are agreed upon between both parties and reflect competitive market conditions. As of December 31, 2004, 56.3% of Endesa-Chile’s energy production in Chile was sold to regulated customers, 26.4% to unregulated customers and 17.3% was sold in the spot market. For further information, see “Electricity Industry Regulatory Framework.”
In 2002, 2003 and 2004, Endesa-Chile had 67, 60 and 56 customers in Chile, respectively, including the main distribution companies of the SIC and the major unregulated industrial customers. During the last three years, sales to unregulated customers represented approximately one-third of Endesa-Chile’s total energy sales.
The following table sets out information relating to Endesa-Chile’s installed capacity and electricity sales in Chile:
| Year ended December 31 | ||||||
| 2002 | 2003 | 2004 | ||||
| Installed Capacity (MW) | 3,935 | 3,763 | 4,477 | |||
| Electricity Sales (GWh) | 18,344 | 18,681 | 18,462 | |||
Total installed capacity increased by 690 MW with the Ralco hydroelectric plant, which started its operations in September 2004, and by 23 MW with one unit of Diego de Almagro which we have rented from Codelco.
The Company’s total electricity generation in Chile reached 16,797 GWh in 2004, 1.7% higher than in 2003, and accounted for approximately 35% of total electricity production in Chile.
Natural Gas.Our first gas-fired plant built by San Isidro, a 75%-owned subsidiary of Endesa-Chile, commenced its operations in the SIC in October 1998. Endesa-Chile, through its subsidiaryElectrogas S.A., has a 42.5% interest in a consortium which built a natural gas pipeline from Santiago to Quillota to supply natural gas to the combined cycle plants built by San Isidro and Colbún, a competitor, and to regional gas distribution companies. The pipeline became fully operational in two stages during 1998. We also contract for delivery of gas from third parties.
Endesa-Chile has a 50% ownership interest in GasAtacama S.A., a company incorporated in Chile. CMS Energy Corp. (CMS), a U.S. corporation, has the remaining 50% ownership interest. GasAtacama, a holding company, operates, through a subsidiary, a 940 kilometer natural gas pipeline from northern Argentina into northern Chile. GasAtacama acts through Gasoducto Atacama Chile S.A. and Gasoducto Atacama Argentina S.A., which own and operate the pipeline, as well as GasAtacama Generación, which owns and operates a thermal generation plant.
Hydrological conditions and rationing decree.A substantial portion of Endesa-Chile’s operations in Chile, Argentina, Brazil, Colombia and Peru involve hydroelectric generation and, accordingly, are dependent upon hydrological conditions prevailing from time to time in the geographic regions in which it operates. Endesa-Chile’s operations in Chile, Argentina and Colombia were affected adversely by extreme weather conditions during 1996 and the first part of 1997. In addition, beginning with the second half of 1998, and lasting through June 1999, Chile endured the worst drought in its recorded history, as measured by rainfall and snow-melt runoffs during such period in the SIC. During periods of drought conditions, the amount of electricity that Endesa-Chile has contractually agreed to provide may exceed the amount of electricity that it is able to generate, which means that Endesa-Chile is then required to purchase electricity from thermal producers on the spot market in order to satisfy its contractual
25
commitments. The cost of these spot market purchases may, under certain circumstances, exceed price at which Endesa-Chile sells electricity under contracts, resulting in a loss. Endesa-Chile attempts to minimize the effect of poor hydrological conditions on its operations in any year primarily by limiting contractual sales requirements to an amount not in excess of estimated production in a dry year. In determining estimated production in a dry year, Endesa-Chile takes into account available statistical information concerning rainfall and water-flows, as well as the capacity of key reservoirs. In addition, Endesa-Chile may take other measures such as using water from reservoirs, installing temporary thermal capacity, negotiating lower consumption levels with its unregulated customers and negotiating with other water users. However, in 1998 and the first half of 1999, for example, contractual commitments exceeded ability to supply electricity to customers from Endesa-Chile’s own production. The severity of the 1998-1999 drought, coupled with delays in the beginning of operation of a large gas-fired plant of Colbún, led to the implementation by the Chilean Ministry of the Economy of periods of electricity rationing in 1998 and 1999.
Government Resolutions adopted during 2004
The Argentine Gas Crisis: Argentina is currently going through what has been called a “Natural Gas Crisis”. Towards the end of the first quarter of 2004, the Argentine Government announced the restriction of natural gas exports and distribution within Argentina. The main causes of these restrictions are the lack of investment in extraction and transportation capacity within Argentina, as well as the increased internal demand for natural gas. Both elements are due to the pesification of natural gas contracts and the freezing of the price of natural gas in Argentina since the beginning of 2002. The resulting artificially low price encouraged consumers to replace more expensive oil derivative energy with natural gas, leading to an explosive growth in demand. At the same time, the fixed, low price of natural gas discouraged producers from investing in natural gas exploration and increasing their extraction and transportation capacity. Consequently, current supply is not able to satisfy internal demand and export commitments. Strong demand for electricity in Chile’s central region, which increased by 7.9% in 2004 and is expected to continue to increase significantly in the foreseeable future, combined with the low level of investment in the electricity sector, makes the Chilean electricity sector particularly vulnerable to the adverse effects of the Argentine natural gas crisis. Endesa-Chile’s thermal plants San Isidro and Taltal use natural gas for thermal generation and have take-or-pay gas contracts with Argentine suppliers. On March 26, 2004, the Argentine government, in order to reduce the risk of domestic residential shortages, announced a resolution allowing governmental authorities to partially suspend natural gas exports and giving the President of Argentina the power to temporarily suspend the long-term supply contracts of Argentine exporters. Since that date, Argentina has significantly curtailed its natural exports to Chile. As a result, Endesa-Chile’s thermal plants have at times been forced to, and may in the future continue to be forced to, shift to more expensive fuel oil.
Endesa-Chile’s Operations in Argentina
Endesa-Chile participates in electricity generation in Argentina through its subsidiaries Costanera and El Chocón, with a total of 5 power plants, two of which are hydroelectric plants, with total installed capacity of 1,320 MW, and three of which are thermal plants, with a total installed capacity of 2,303 MW. In 2004, Endesa-Chile’s hydro and thermal generation plants in Argentina represented 15% of the country’s total electricity generation capacity, in accordance with theCompañía Administradora del Mercado Mayorista Eléctrico S.A., or CAMMESA.
El Chocón is an electricity generation company, incorporated in Argentina, located between the Neuquén and Río Negro provinces in southern Argentina (the Comahue Zone). It has two hydroelectric power stations with an aggregate installed capacity of 1,320 MW. El Chocón is currently the second largest hydroelectric facility in Argentina. El Chocón has a 30-year concession, which was granted by the Argentine government to our subsidiary, Hidroinvest S.A., which bought 59.0% of the shares in July 1993 during the privatization process. Endesa-Chile operates El Chocón for a fee pursuant to an operating agreement with a term equal to the duration of the concession. Endesa-Chile’s has an indirect ownership of 47.4% and a 65.2% voting share in El Chocón.
Costanera is a publicly traded electricity generation company in Buenos Aires, Argentina, with total installed capacity of 2,303 MW, which includes a 1,451 MW oil and gas-fired generation facility and a 852 MW natural gas combined-cycle facility in Buenos Aires, that came into service in December 1998. The facility was acquired from the Argentine government following the privatization ofServicios Eléctricos del Gran Buenos Aires S.A. in 1992, when Endesa-Chile acquired a 24% interest. Endesa-Chile subsequently increased its interest, reaching a total ownership share to date, through its subsidiary Endesa Argentina, of 64.3%.
26
In 1996 and 1997, the governments of Argentina and Brazil subscribed several protocols and memoranda of understanding related to energy integration and interconnection between the two countries. Subsequent to such governmental agreements, and in that cross-country energy integration framework, Costanera contracted to sell 500 MW of electricity capacity to CIEN, a Brazilian company in which Endesa-Chile has a 45% interest, until 2020. An additional 462 MW of Costanera’s capacity is committed to Brazil through a contractual agreement with CEMSA, a 45%-owned Argentine affiliate of Endesa-Chile. Costanera has received payments for having take-or-pay capacity available for Brazil. During 2004, Costanera’s electricity generation was affected by the natural gas crisis in the Argentine economy. Costanera has the ability to operate its steam turbine power plant with either natural gas or fuel oil.
Because of the very tight electricity and natural gas conditions currently prevailing in Argentina, local authorities have not recently allowed generation companies, including Costanera, to export electricity produced with natural gas. In addition, Argentine Resolutions 426/04 and 949/04 only permit export contracts to be satisfied with generation units that were previously identified for such purpose, and do not allow the purchase of any deficits in the M.E.M., the electricity wholesale market. For this reason, on April 27, 2005, Costanera, alluding to the precarious state of the wholesale electricity market in Argentina, and to completely involuntary reasons, invokedforce majeure clauses in its export agreements with CIEN and CEMSA in order to explain that is was able to only partially comply with the terms under such export contracts. As of the date of this annual report, it is uncertain whether Costanera will be able to continue servicing its export contracts.
The following table sets out information regarding Endesa-Chile’s installed capacity and electricity sales in Argentina for the periods indicated:
| Year ended December 31 | ||||||
| 2002 | 2003 | 2004 | ||||
| Installed Capacity (MW) | 3,622 | 3,622 | 3,623 | |||
| Electricity Sales (GWh) | 7,897 | 9,259 | 11,604 | |||
Endesa-Chile’s Operations in Brazil
In September 1997, a consortium comprised of Endesa-Chile, with an 81.9% interest and Endesa-Chile’s Peruvian affiliate, Edegel, with its 18.1% interest, was awarded 79.4% of the share capital of Cachoeira Dourada in a 30-year concession. Between 1997 and 2003, Endesa-Chile increased its total indirect ownership in Cachoeira Dourada to 92.5%, and its voting share to 99.6%. Cachoeira Dourada, incorporated in Brazil, is located in Goias state, south of Brasilia. It owns a run-of-the-river hydroelectric plant with a total installed capacity of 658 MW, representing approximately 0.7% of the total installed capacity in the Brazilian market, according to ANEEL. Cachoeira Dourada has a long-term take-or-pay contract, which was executed in September 1997 when Endesa-Chile acquired the concession of Cachoeira Dourada, withCompanhia Elétrica de Estado de Goiás S.A. (“CELG”), a regional state-owned distribution company. The contract has a term of 15 years, expiring in 2012. Until 2002, CELG purchased all of the contracted capacity of Cachoeira Dourada (415 MW). That amount was reduced by 10% (42 MW) per year beginning in September 2002. As a result, physical sales to CELG declined by 11% in 2004 as compared to 2003. The electricity generated monthly in excess of Cachoeira Dourada’s contractual commitment to CELG is sold to third parties, including the pool market.
In addition to its ownership of Cachoeira Dourada, Endesa-Chile operates in Brazil through its affiliate, CIEN, of which Endesa-Chile has a 45% ownership interest, in the trading and transportation of electricity between Argentina and Brazil. See “–Organization Structure” for details. Through CIEN, Endesa-Chile has participated in a 2,000 MW interconnection project corresponding to the transmission line between Argentina and Brazil. CIEN has received two twenty-year authorizations from ANEEL (which expire in 2020 and 2022) to operate the Brazilian side of the transmission lines, after which time the transmission lines and the converter stations will become the property of the Brazilian government. CIEN, through its subsidiaries CTM and TESA, owns and operates the Argentine side of both lines.
CIEN has executed four energy sales agreements to sell energy in Brazil with the following customers: Furnas Centrais Elétricas S.A. (“Furnas”);Centrais Geradoras do Sul do Brasil S.A. (“Gerasul”);Companhia Paranaense de Energia - COPEL (“Copel”) and Companhia de Electricidade do Río de Janeiro (“Cerj”). The contracts are at fixed real-denominated prices, indexed in part to the dollar. The contracts with Gerasul and Furnas are not “take or pay” as to the amount of energy to be purchased, but do require the supply of 1,000 MW of capacity at all times. In order to satisfy its commitments with Brazilian customers, CIEN maintains contracts with Argentine generators, including Endesa-Chile’s subsidiary in Argentina, Costanera.
27
Due to generation constraints in Argentina and after conducting certain tests for actual generation availability and guaranteed energy, on March 31, 2005, certain resolutions by the ANEEL and the MME (the Ministry of Mines and Energy) reduced CIEN’s “guaranteed energy” (a theoretical regulatory concept related to the capacity that is recognized for purposes of contracts between energy producers and their clients) from approximately 1,700 MW to 400 MW, although such restriction is subject to review by the ANEEL in the event that CIEN can restore its electricity imports from Argentina.
If Argentine generators continue to be unable to fulfill their contracts with CIEN and the aforementioned resolutions are not relaxed by ANEEL, CIEN may be forced to renegotiate its contracts with its suppliers and its customers. CIEN may also be subject to penalties if it is found to be in breach of contract with its Brazilian clients or with norms issued by the Brazilian regulatory authorities. As of the date of this annual report, some of CIEN’s clients, under the first interconnection line, have rejectedforce majeure claims made by our transmission related company.
The following table sets out certain statistical information regarding Endesa-Chile’s installed capacity and electricity sales in Brazil for the periods indicated below. Electricity demand in Brazil increased 5.0% during 2004, 5.3% during 2003 and 5.2% during 2002 after decreasing in 2001 as a consequence of the government rationing program which limited the amount of electricity consumers could utilize.
| Year ended December 31 | ||||||
| 2002 | 2003 | 2004 | ||||
| Installed Capacity (MW)-Cachoeira Dourada | 658 | 658 | 658 | |||
| Electricity Sales (GWh) | 3,591 | 3,770 | 3,902 | |||
Endesa-Chile’s Operations in Colombia
Endesa-Chile controls two electricity generation companies in Colombia, Betania and Emgesa. Betania is a hydroelectric generation facility with installed capacity of 540 MW, and is located at the intersection of the Magdalena and Yaguará rivers, in the southwest of Colombia. In December 1996, a consortium comprised of Endesa-Chile, with a 75% interest, and the Colombian company Corfivalle, with the remaining 25% interest, was awarded 99.9% of the share capital of Betania. Following a capital increase in 1999, in which Corfivalle did not participate, Endesa-Chile’s economic interest increased to 85.6% of Betania.
Endesa-Chile’s economic interest in Emgesa, a Colombian generation company with total installed generating capacity of 2,069 MW, is 22.4%, while its voting interest is 57.1%.
The following table sets out information regarding the installed capacity and electricity sales for Endesa-Chile’s subsidiaries in Colombia for the periods indicated:
| Year ended December 31 | ||||||
| 2002 | 2003 | 2004 | ||||
| Installed Capacity (MW) | 2,735 | 2,589 | 2,609 | |||
| Electricity Sales (GWh) | 14,639 | 14,481 | 15,148 | |||
Approximately 91% of Endesa-Chile’s total installed capacity in Colombia is hydroelectric. As a result, our physical generation depends on the reservoir levels and yearly rainfalls. Endesa-Chile’s generation market share in Colombia in 2004 was approximately 25% according to ISA. In addition to hydrological conditions, the amount of generation is dependent on the company’s commercial strategy. Colombia’s electricity market is less regulated than the markets of the other countries in which Endesa-Chile operates. Companies are free to offer their electricity on any given day at the price that they determine convenient, as opposed to being forced by a centralized operating entity to generate according to the minimum marginal costs of the system. Betania and Emgesa sold approximately 64% of their electricity under contracts in 2004, with the remainder under non-contract sales.
28
Endesa-Chile’s Operations in Peru
Edegel is an electricity generation company, acquired by Endesa-Chile in 1995. It currently owns seven hydroelectric plants (Huinco, Matucana, Callahuanca, Moyopampa, Huampani, Yanango and Chimay) and one thermal plant (Santa Rosa), with a combined installed capacity of 967 MW. As of December 31, 2004, Endesa-Chile had a 37.9% indirect ownership share in this subsidiary. Endesa-Chile has a 63.6% voting share in Edegel throughGenerandes Peru S.A.
The following table sets forth information regarding Endesa-Chile’s installed capacity and electricity sales in Peru for the periods indicated:
| Year ended December 31 | ||||||
| 2002 | 2003 | 2004 | ||||
| Installed Capacity (MW) | 1,003 | 967 | 967 | |||
| Electricity Sales (GWh) | 4,158 | 4,443 | 4,328 | |||
Endesa-Chile’s hydroelectric and thermal generation plants in Peru represent 22% of the country’s total electricity generation capacity according to the information reported in October 2004 by the Osinerg for the calculation of the node prices.
Enersis Generation Business (CGTF)
CGTF is 51%-owned byEndesa Internacional, S.A., a wholly owned subsidiary of Endesa-Spain, and 49%-owned by Enersis. CGTF owns a combined cycle generating plant, located 50 kilometers from the capital of the Brazilian State of Ceará, which initiated commercial operations in December 2003.
During the first semester of 2004, it operated on a continuous basis for a period of nearly 100 days. This permitted the testing of the equipment, especially during the period of the guarantee, and the plant operated as planned. On January 28, 2004 the National Agency for Electric Energy (ANEEL) issued Resolution Nº 40, which reduced the firm capacity of the plants in the northeast, including Endesa Fortaleza, as a result of the problems with the supply of gas in the region. On November 18, 2004, an agreement was signed by Endesa Fortaleza, other plants in the Thermo Electricity Priority Program (PPT) in the northeast and by Petrobrás, with the intervention of ONS and CCEE (ex MAE), which re-established the original firm capacity for the plants that signed the agreement. This operating procedure was approved by ANEEL on December 24, 2004.
Gross generation in 2004 amounted to 1,322 GWh and sales of energy for Coelce during 2004 amounted to 2,690 GWh. Endesa Fortaleza has a fixed contract with CEGÁS/Petrobrás for the purchase of gas for a volume of 1,550,000 cubic meters per day.
The installed capacity is 319 MW and the market share of Endesa Fortaleza is 0.5% of the total installed capacity of the National Integrated System (SIN) and 3.2% of the thermoelectric generators. This is a combined cycle plant that can utilize natural gas or fuel oil.
Electricity Distribution
Our electricity distribution business has been conducted in Chile through Chilectra, in Argentina through Edesur, in Brazil through Cerj and Coelce, in Colombia through Codensa and in Peru through Edelnor. For the year ended December 31, 2004, our principal subsidiaries and related companies sold approximately 52,314 GWh of electricity. For more information on energy sales by our distribution subsidiaries for the past three fiscal years, see “Item 3. Key Information—A. Selected Financial Data.” Currently, Chilectra is the technical operator of Edesur, Edelnor, Cerj and Coelce.
29
Chilectra
Chilectra is the largest electricity distribution company in Chile in terms of regulated clients, distribution assets and energy sales. Chilectra had consolidated operating income of Ch$ 97.6 billion for the year ended December 31, 2004. Subsequent to a tender offer that commenced in November 2000 and was renewed in July 2001, we increased our equity stake in Chilectra by 26%, and we now (directly) own a 98.2% interest. Chilectra operates in a concession area of 2,118 square kilometers.
Chilectra transmits and distributes electricity in 33 municipalities of the Santiago metropolitan region. Chilectra’s service area is defined mainly as a high density area under the Chilean tariff regulations governing electricity distribution companies and includes all residential, commercial, industrial, governmental and toll customers, as well as Compañía Eléctrica del Río Maipo S.A., among others. The Santiago metropolitan region is Chile’s most densely populated area and has the highest concentration of industries, industrial parks and office facilities in Chile. As of December 31, 2004, Chilectra served approximately 1.4 million customers.
Chilectra currently owns a 34% interest in Edesur and, as the operator of Edesur through 2007, receives management fees pursuant to the terms of an operating agreement between Chilectra and the stockholders of Edesur. In November 2004, this agreement was amended to change the composition of Chilectra’s management fees. Chilectra will receive fixed income of U.S.$ 50,000 per month, plus a variable fee, which will be calculated based on the number of effective hours in which Chilectra assisted Edesur.
In January 2004, Cerj’s shareholders approved a capital increase of 1,339,623 million shares. In this operation, Enersis capitalized intercompany loans for approximately U.S.$ 243 million. During March 2004, Chilectra acquired part of Enersis’ share of Cerj for approximately U.S.$ 138 million, increasing its interest in Cerj from 41.2% to 46.1%. Its interest in Coelce in Brazil was also indirectly increased, through Cerj, from 14.4% to 15.4% as of December 2004. Chilectra also owns a9.9% interest in Codensa in Colombia and a 15.6% interest in Edelnor in Peru. Chilectra is the operator of Cerj, Coelce and Edelnor, although there are no operator fees associated with these arrangements.
Chilectra has significantly improved its operating efficiency by steadily reducing energy losses from both theft and technical factors from 22.4% in 1983, at the time of Chilectra’s privatization, to 5.2% as of December 31, 2004. Chilectra has also implemented proprietary billing and accounts receivable management systems, increased labor productivity and improved information systems.
In 2004, Chilectra’s energy sales amounted to 11,317 GWh. For the five-year period ended December 31, 2004, physical energy sales increased at a compounded annual rate of 6.3%. For the year ended December 31, 2004, revenues from electricity sales were Ch$ 483.0 billion.
Edesur
Edesur is the second largest electricity distribution company in Argentina as measured by energy purchases. Pursuant to an agreement entered into with Edesur, Chilectra is and will remain the technical operator of Edesur until 2007. Our economic interest in Edesur increased to 65.1%. Edesur operates in a concession area of 3,309 square kilometers.
Edesur distributes electricity in the south-central part of the greater Buenos Aires metropolitan area. Edesur’s service area comprises the major business district of Buenos Aires and several residential areas of the southern part of Buenos Aires. As of December 31, 2004, Edesur distributed electricity to 2.1 million customers. For the fiscal year ended December 31, 2004, residential, commercial, industrial and other customers, primarily public and municipal, represented approximately 23%, 33%, 22% and 22%, respectively, of Edesur’s total energy sales of 13,322 GWh. Edesur had energy losses of 11.8% for the fiscal years ended December 31, 2004 and 2003 compared to 11.6% in 2002.
For the year ended December 31, 2004, Edesur’s physical energy sales increased by approximately 5.3%, to 13,322 GWh, compared to 12,656 GWh in 2003 and 12,138 GWh in 2002. Energy sales at Edesur in 2002 include toll revenues received from other companies for the use of Edesur’s distribution network.
30
Cerj
Cerj is the second largest electricity distribution company in the State of Rio de Janeiro, Brazil. As of December 31, 2004, we had an 80.4% interest in Cerj. Chilectra is Cerj’s technical operator but does not receive any fees for its role as operator.
Cerj is engaged principally in the distribution of electricity to 66 municipalities of the State of Rio de Janeiro and serves 2.1 million customers in a concession area of 32,054 square kilometers, where an estimated 6.1 million people live. As of December 31, 2004, residential, commercial, industrial and other customers represented approximately 41%, 20%, 20% and 19%, respectively, of Cerj’s total sales of 7,628 GWh. Cerj also owns nine small power plants in the State of Rio de Janeiro with a total installed capacity of 62 MW.
Coelce
We hold a 31.2% economic interest in Coelce, the sole electricity distributor in the State of Ceará, in northeastern Brazil, through a 52% interest in Investluz, which owns 56.6% of the capital stock of Coelce. We acquired our interest in Coelce in the second quarter of 1998. Chilectra is Coelce’s technical operator but does not receive fees for its role as operator. As of December 31, 2004, Coelce served over 2.3 million customers within a concession area of 148,825 square kilometers. During 2004, Coelce had annual sales of 6,141 GWh of energy. Coelce’s energy sales increased by 4.0% in 2004 compared to 2003.
Coelce has a relatively stable client base with residential clients representing approximately 30% of energy sold. Approximately 34% of the population and 41% of the energy demand in the State of Ceará are presently concentrated in the metropolitan area of the capital city of Fortaleza. In 2004, Coelce bought 54.2% of its energy fromCompanhia Hidroelétrica do São Francisco, 37.7% from CGTF and 8.1% from other suppliers.
As of December 31, 2004, residential, commercial, industrial and other customers represented approximately 30%, 18%, 29% and 23%, respectively, of Coelce’s total energy sales.
As of December 31, 2004, Coelce’s energy losses were 13.9% compared to 13.5% in 2003.
Codensa
We hold a 21.7% economic interest in Codensa, an electricity distribution company that serves a region of approximately 14,087 square kilometers in Bogotá, and 96 other municipalities in the Department of Cundinamarca, Tolima and Boyacá. More than 11.9 million people, or approximately 22.6% of the Colombian population, live in Codensa’s service area. Codensa serves approximately 2.0 million customers in its service area. During 2004,Luz de Bogotá S.A.was dissolved. Enersis’ previous investment through Luz de Bogota in Codensa is now directly held by Enersis. A subsidiary of Endesa-Spain is the technical operator of Codensa. Operating income was Ch$ 84.4 billion for the year ended December 31, 2004. During 2004, Codensa had annual sales of 9,656 GWh, of which, residential, commercial, industrial and other customers represented approximately 37%, 14%, 6% and 43%, respectively. Codensa purchased 51% of its energy in 2004 from Emgesa, a generating company controlled by Endesa-Chile, and 49% from other suppliers. Physical energy sales increased by 4.3% in 2004 compared to 2003. Since 2001, Codensa only services regulated clients. The unregulated market is serviced directly by our generation company, Emgesa, with the exception of the public lighting in Bogotá.
In 2004, Codensa had energy losses of 9.7% compared to 10.2% in 2003 and 10.3% in 2002. We will continue implementing the same energy loss reduction measures that we have applied in Chile, Argentina and Peru.
Edelnor
Edelnor is a Peruvian electricity distribution company that is 60% owned by Distrilima. Chilectra is Edelnor’s operator but does not receive any fees for its role as operator. As of December 31, 2004, we owned an equity interest of 55.7% in Distrilima which represents a 33.4% interest in Edelnor. Edelnor operates in a concession area of 2,440 square kilometers and its operating income was Ch$ 27.8 billion as of December 31, 2004.
31
Edelnor has an exclusive concession to distribute electricity in the northern part of the Lima metropolitan area, some provinces of the Lima department such as Huaral, Huaura and Barranca, and in the adjacent province of Callao. As of December 31, 2004, Edelnor distributed electricity to approximately 912,000 customers, a 2.3% increase from December 31, 2003.
Edelnor had energy losses of 8.4% in 2004, remaining at the same level as in 2003.
For the year ended December 31, 2004, Edelnor had total energy sales of 4,250 GWh. The compounded annual growth rate in energy sales from 2000 to 2004 was 4.4% per annum.
Other Businesses
IMV
IMV, our wholly owned subsidiary, develops real estate projects in Chile. Among other projects, IMV has a 55% interest in ENEA, a long-term project involving 2,594 acres near Santiago’s international airport. The goal of this project is to create both industrial and residential lots. Autopista Costanera Norte, an important new highway that crosses Santiago and passes through ENEA’s properties, has increased the value of the project. The real estate business is not a core business of Enersis and, as a result, we plan to divest our interest in IMV under the best possible conditions.
CAM
CAM is engaged in the electrical parts procurement business and is the entity in charge of giving continuity to our engineering and electrical service activities, both in Chile and abroad, and concentrates on managing large-scale services for public utility companies, especially in the electricity, telecommunications, gas and water distribution sectors. The services provided by CAM include maintaining and calibrating electricity meters and other precision equipment, connecting electricity to final users, and constructing electrical facilities and distribution network connections. The company is able to provide improved value in turnkey solutions with reduced transaction costs by integrating the procurement of materials as part of the services.
Synapsis
Synapsis, a wholly owned subsidiary of Enersis, is engaged in the computer services business. Synapsis provides support services to our electric utility businesses, both in Chile and abroad, and also transacts business with unrelated third parties. Synapsis is the main provider of information systems to Enersis and its subsidiaries and supplies services and equipment relating to computers and data processing.
Other businesses
Endesa-Chile’s other Chilean businesses include infrastructure projects, including building and operating a concession for a private tunnel and two toll roads, as well as engineering services primarily associated with large hydroelectric dam construction. Endesa-Chile has decided to discontinue further expansion of its involvement in infrastructure projects.
B. Business overview.
Business Strategy
We believe that there is long-term potential for significant growth in per capita energy demand in South America, as well as for significant growth attributable to demographic trends, and we seek to take advantage of our know-how and market position as the leading private sector electricity company in the region to:
| • | enhance earnings through expansion of our unregulated client base; | |
| • | improve our operating margins by reducing the operating costs of our existing businesses; and | |
| • | take advantage of the continued demographic growth in the regions where we operate. |
32
We believe that we have considerable expertise in managing utilities, including:
| • | reducing energy losses associated with distribution businesses over the long term; | |
| • | building and operating generation facilities; | |
| • | implementing proprietary billing and accounts receivable management systems; | |
| • | increasing work force productivity while maintaining good labor relations; | |
| • | operating under a range of tariff and regulatory frameworks that reward efficient operations; and | |
| • | maximizing our return on actively managed subsidiaries |
We continually evaluate potential asset reorganizations with the purpose of optimizing operating, financing and tax considerations. We are currently expecting to undertake two such transactions; namely, a reorganization of all of the Group’s interests in Brazil and a generation company merger in Peru.
The Brazilian project, which was approved by our Board of Directors on May 24, 2005, seeks to simplify the shareholding structure of our Brazilian companies by having all of them become subsidiaries of a new Brazilian holding company, Endesa Brasil S.A. (“Endesa-Brasil”). Our Brazilian companies are currently owned by Endesa Internacional (our parent company, and a subsidiary of ENDESA, S.A.), Endesa-Chile, Chilectra and Enersis (the “Contributing Shareholders”). The initial intention is for Endesa-Brasil to be ultimately owned approximately as follows: Endesa-Chile, Endesa Internacional and Chilectra would have voting interests of 33.6%, 23.7%, and 19.2%, respectively. Enersis, on a stand-alone basis, would have a 23.5% interest. Because of Enersis’ interests in both Endesa-Chile and Chilectra, Enersis would hold majority control over Endesa-Brasil, and would consolidate the company.
The Brazilian project calls for Endesa-Brasil’s shareholders’ equity to be constituted by successive capital contributions by the Contributing Shareholders of their interests in each of the following companies domiciled in Brazil: Cerj, C.G.T. Fortaleza, Investluz, CIEN, Cachoeira Dourada and Coelce. An investment agreement regulates the manner in which the capital contributions are scheduled to take place, as well as the rights and obligations of each of the Contributing Shareholders. The investment agreement calls for a deferred contribution of Cerj’s shares because of tax considerations. Approximately 45% of Cerj shares in the hands of the Contributing Shareholders will be contributed in a future capital increase, to be held no later than 2008. The aggregate book value at December 31, 2004 of the shares expected to be contributed to Endesa-Brasil was R$ 3,575 million (or US$ 1.4 billion at year-end exchange rates). Completion of the Brazilian reorganization is subject to receipt of regulatory approvals in Brazil.
The aim of the Brazilian reorganization is to enhance access to third-party financings (including the domestic capital markets), improve positioning for potential growth opportunities, achieve greater stability for cash flows through a centralized cash management, as well as generate operating synergies. Endesa-Brasil will be governed through a shareholders’ agreement among the Contributing Shareholders.
The goal of the Peruvian project is to achieve generation synergies through the merger of Edegel andEmpresa de Generación Termoeléctrica Ventanilla S.A. (“Etevensa”), a 500 MW thermoelectric generation company 60%-owned by Endesa-Spain. As of the date of this annual report, this merger has not yet been approved.
There can be no assurance that either of these projects will be undertaken or that they will ultimately achieve the intended goals that have been described above.
Capital Investment Program
We coordinate the overall financing strategy of our subsidiaries and intercompany advances to optimize debt management as well as the terms and conditions of our financing. Our operating subsidiaries independently develop capital expenditure plans financed by internally generated funds or direct financings. One of our aims is to focus on investments that will provide a long-term benefit, such as energy loss reduction projects. Additionally, by focusing on the Enersis group as a whole and seeking to provide services across the group, we are aiming to reduce the level of investment necessary at the individual subsidiary level in items such as procurement, telecommunication and information systems.
33
For the period between 2005 and 2009, we expect to make capital expenditures of approximately Ch$ 1,884 billion in our majority-owned subsidiaries, including Endesa-Chile. The table below sets forth the capital expenditures made by our subsidiaries in 2004 and the expected capital expenditures for the period 2005-2009.
| Capital Expenditure | ||||
| (in billions of Ch$ ) | ||||
| 2004 | 2005-2009 | |||
| Electricity Generation | ||||
| Endesa-Chile (Chile, Argentina, Brazil, Colombia and Peru) | 90 | 490 | ||
| Electricity Distribution | ||||
| Chilectra (Chile) | 44 | 233 | ||
| Edesur (Argentina) | 27 | 285 | ||
| Cerj (Brazil) | 47 | 272 | ||
| Coelce (Brazil) | 33 | 303 | ||
| Codensa (Colombia) | 22 | 202 | ||
| Edelnor (Peru) | 12 | 84 | ||
| Other Businesses | 6 | 15 | ||
| Total | 281 | 1,884 | ||
Electricity Generation
Endesa-Chile had total capital expenditures of Ch$ 90 billion in 2004. For the period between 2005 and 2009, Endesa-Chile expects to make further capital expenditures of approximately Ch$ 490 billion in maintenance of existing operating plants expand installed capacity. Endesa-Chile is currently evaluating the construction of the San Isidro II 370 MW thermal power plant, which will be located next to San Isidro I. On August 16, 2004, the Chilean environmental authority approved the environmental impact study for the plant, which has a total expected investment cost of U.S.$ 220 million. This project will be fully owned by Endesa Chile and is currently awaiting determination of the availability of liquified natural gas for Chile. The financing for the San Isidro II project has not been determined.
Electricity Distribution
All of our distribution companies expect to fund capital expenditures through internally generated funds. In 2004, Chilectra incurred capital expenditures of Ch$ 44 billion. The capital expenditures were principally to support demographic growth and new clients. Edesur incurred capital expenditures of Ch$ 27 billion in 2004, principally due to repairs and expansion of existing facilities to support new clients, and to improve quality. During 2004 Cerj incurred capital expenditures of Ch$ 47 billion due to expansion of existing facilities and reduction of energy losses. In 2004, Coelce had capital expenditures of Ch$ 33 billion. The capital expenditures were principally made to support new clients and to meet regulatory requirements.
Competition
In the electricity generation business, companies compete largely on the basis of technical experience and reliability and, in the case of unregulated customers, price.
Our Chilean subsidiary, Endesa-Chile, competes in the SIC primarily with two other electricity generation companies,AES Gener S.A. (formerlyChilgener S.A.) (“Gener”) andColbún S.A. (“Colbún”). According to statistics published by autonomous generating industry groups, known asCentro de Despacho Económico de Carga(“CDEC”), as of December 31, 2004, in Chile Gener had an installed capacity of 1,498 MW, of which approximately 82% was thermal electric, and Colbún had an installed capacity of 1,651 MW, of which approximately 52% was thermal electric. Colbún increased its capacity during 2004 with the steam turbine of Nehuenco II. In addition to these two large competitors, there are a number of smaller entities that generate electricity in the SIC. Endesa-Chile believes that it has considerable competitive strength in the SIC due to its large diversified capacity, extensive geographic coverage, technical expertise, customer service and established commercial relationships. In addition, as 76% of Endesa-Chile’s installed capacity is derived from hydroelectric power plants, Endesa-Chile generally has lower production costs than companies generating electricity in the SIC from thermal plants. During periods of extended droughts, however, Endesa-Chile is often forced to buy more expensive electricity from thermoelectric generators at spot prices in order to satisfy its contractual obligations.
34
Endesa-Chile, through its subsidiary Celta, has one 182 MW thermal power plant connected to the SING, which represents approximately 5% of the total capacity of the SING. Through its associate companyGasAtacama Generación Limitada, Endesa-Chile has an additional participation in the SING, with a total 26.8% of the SING’s total installed capacity in 2004. The main generation companies operating in the SING are Electroandina (formerlyCorporación Nacional del Cobre División Tocopilla),Empresa Eléctrica del Norte Grande S.A. (“Edelnor”), andNorgener S.A.
Also within our electricity generation business segment, our Argentine subsidiaries, Costanera and El Chocón, compete against other important operators in the Argentine market such as AES, Pluspetrol, PECOM Energia and TotalFinaElf. Our Peruvian subsidiary,Edegel, competes within the Peruvian market against Electroperú, Egenor, Enersur, Eepsa and Etevensa. Our Colombian subsidiaries, Betania and Emgesa compete against AES and Unión Fenosa within the Colombian market. Finally, our Brazilian subsidiary, Cachoeira Dourada, competes against other important private operators in the Brazilian market, including Tractebel, AES, Duke and state-ownedEletrobrás.
In the electricity distribution business segment, each one of our subsidiaries is a natural monopoly in its respective concession area. There are natural, although not legal, barriers to entry since it is uneconomic for more than one distribution company to operate in the same concession area. However, the long-term trend in many of our markets is toward increased competition through the incorporation, among other matters, of trading companies that compete with distribution companies for certain customers. In addition, distribution companies are normally allowed to charge trading companies a toll for the use of their lines. At the date of this annual report, the only such country where there is a trading market is Colombia. At the same time, if such trading companies are allowed in other countries by future regulatory changes, we would expect to form such trading companies ourselves in order to compete effectively with our existing technical and commercial know-how.
Utility Business
Chile
In accordance with Chile’s regulatory framework for electricity distribution, more than one concession may be granted for the same territory. However, barriers to entry are high because electricity distribution requires an extensive distribution network and significant capital outlays. To date, the Ministry of Economy has not granted any significant overlapping concessions. Nevertheless, the existing tariff system for distribution companies, which sets tariffs by applying efficiency guidelines to a selected actual company of similar size, the model company, has the inherent effect of creating competition between similar-sized electricity distribution companies to improve operating efficiency, reduce distribution energy losses and increase operating margins.
Electricity generation companies compete with each other to obtain long-term contracts with distribution companies, and they compete with each other and with distribution companies to provide service to unregulated (high-usage) customers. All sales to regulated customers are subject to tariffs that fix the maximum prices that can be charged. The Chilean Electricity Law requires that the difference between such maximum prices charged to regulated customers and actual prices to unregulated customers not exceed 5% on average. Any variation of more than 5% requires that the regulated prices be adjusted. Consequently, competition for sales to unregulated customers may affect the tariff for regulated sales.
By law, distribution and transmission companies must permit the use of their lines and ancillary facilities for the transmission of electricity upon payment of a toll. Unregulated customers have several distribution alternatives, including:
| • | installing their own lines directly from a generation company; |
35
| • | arranging a supply contract with a generation company, which pays a toll to a transmission company and a distribution company; | |
| • | negotiating a contract with a distribution company; and | |
| • | generating their own electricity. |
We are not aware of customers in our concession area that have installed their own lines from a generation company as of the date of this annual report. We believe there is presently no significant self-generation or co-generation within Chilectra’s concession area.
Argentina
Our electricity distribution operations in Argentina are conducted through Edesur, which holds a concession from the Argentine government to transmit and distribute electricity in its territory. The concession agreement precludes third parties from constructing distribution assets within Edesur’s territory.
Electricity transmission companies are required by law to provide generators, distributors and large users access to available transmission capacity upon payment of a toll.
Our electricity generation operations in Argentina are carried out by El Chocón and Costanera. Generation companies compete with each other in the wholesale electricity market for sales to distribution companies and large users. The prices received by electricity generation companies in the wholesale market are determined primarily by the marginal cost of supplying additional capacity on the system.
Brazil
As of December 31, 2004, our electricity distribution business in Brazil was conducted through Cerj and Coelce. The concession agreements for Cerj and Coelce are non-exclusive for their respective territories. Brazil’s electricity sector is mainly comprised of government-owned generation and transmission companies. Currently, Brazil’s electricity generation needs are supplied primarily by approximately 70 companies. Substantially all of the country’s generating capacity is controlled by either states or the federal government.
As a means to promote the integrated development of the electricity sector, Brazil was divided into four regions: the Southeast (including the State of Rio de Janeiro and Cerj’s concession area), the South, the North and the Northeast (including Coelce’s concession area). Each of these regions is supplied primarily by a federally-owned generation company which is charged with promoting the development of electricity power generation and transmission in its region. The main federal generating company for the Southeast region isFurnas Centrais Elétricas S.A., or FURNAS.Centrais Elétricas Brasileiras, or Eletrobrás, a company controlled by the Brazilian federal government, owns three of the four regional generating companies and is generally responsible for implementing policy with respect to the operation of the electricity sector as well as coordinating its planning, financing and operations together with theOperador Nacional do Sistema Elétricos, or ONS. Our electricity generation in Brazil is conducted through Cachoeira Dourada,Endesa Fortaleza(CGTF orCentral Geradora Termelectrica Fortaleza) andCompanhia de Interconexao Energetica. In addition, Cerj owns a small electricity generation plant with a total installed capacity of 62 MW.
Colombia
Enersis conducts its Colombian electricity distribution business through Codensa, the second such company to be privatized in Colombia. Since most of the other distribution companies are state owned, there is a very limited level of competition in the electricity distribution business. On the other hand, the possibility of trading energy in Colombia makes that country’s electricity market quite competitive.
Our electricity generation business in Colombia is conducted through Betania, one of the first electricity generation facilities to be privatized in Colombia and through Emgesa.
36
Peru
Our electricity distribution business in Peru is conducted through Edelnor. Edelnor’s concession agreement is exclusive for its territory. As in Chile, the Peruvian regulatory authority sets tariffs for distribution companies by using the model company approach, which entails applying efficiency guidelines to a selected actual company of comparable size. This approach to setting tariffs has the inherent effect of encouraging distribution companies to improve operating efficiency, reduce distribution losses and increase operating margins.
Our electricity generation business in Peru is conducted through Edegel, the largest privately-owned electricity generation company in the country. Electricity generation companies compete with each other and with distribution companies to provide service to unregulated large users. Edegel is located in the geographic area covered by the SICN electricity grid system, but competes with the generation companies in both the northern and southern electricity systems. Competition for sales to unregulated customers may affect the tariff for regulated sales. As is the case in Chile, distribution and transmission companies are required by law to permit the use of their lines and ancillary facilities for the transmission of electricity upon payment of a toll.
ELECTRICITY INDUSTRY REGULATORY FRAMEWORK
Chile
Industry Structure
The electricity industry in Chile is divided into three sectors: generation, transmission and distribution. The generation sector consists of companies that produce electricity. They sell their production to distribution companies, unregulated customers and other generation companies through private contracts and through the spot market. The transmission sector consists of companies that transmit at high voltage the electricity produced by generation companies. The third sector consists of distribution companies that purchase electricity from generation companies for sale to their regulated and unregulated customers. Distribution is defined for regulatory purposes to include all supply of electricity at a voltage up to and including 23 kV.
The electricity sector in Chile is regulated pursuant to DFL No. 1, which was enacted in 1982, and the regulations under Decree No. 327 of 1998, as amended from time to time, collectively known as the Chilean Electricity Law. Under the Chilean Electricity Law, the generation, transmission and distribution of electricity are supervised by theSuperintendencia de Electricidad y Combustibles, or the SEF, and the Ministry of Economy acting through theComisión Nacional de Energía, or NEC. The Ministry of Economy grants concessions to generation companies for hydroelectric facilities and to transmission and distribution companies for networks. The NEC calculates maximum prices for electricity sales to regulated end users.
Chile’s electricity industry is organized into separate interconnected electricity systems which facilitate the coordination of generation, transmission and distribution activities within a given geographic area. The largest generation companies in Chile, including Endesa-Chile, sell electricity through interconnected electricity systems. In addition to the SIC and the SING, there are several other isolated and less significant systems, including systems in the Aysén and Magallanes regions of southern Chile that provide electricity in remote areas outside the interconnected electricity systems. The operation of electricity generation companies in each of the two major interconnected electricity systems in Chile, the SIC and the SING, is coordinated by autonomous generating industry groups and transmission companies, the dispatch center, known as theCentro de Despacho Económico de Carga or CDEC. The SIC and the SING are intended to be efficient markets for the sale of electricity in which the lowest marginal cost producer is used to satisfy demand. As a result, at any specific level of demand, the appropriate supply will be provided at the lowest possible cost of production available in the system. In addition, certain major industrial companies own and operate generation systems to meet their own demand.
37
Chilean Electricity Law
General
The goal of the Chilean Electricity Law is to provide sufficient incentives toward maximizing efficiency and a simplified regulatory scheme and tariff-setting process which limits the discretionary role of the government through the establishment of objective criteria for setting prices. The expected result is an economically efficient allocation of resources to and within the electricity sector. The regulatory system is designed to provide a competitive rate of return on investments in order to stimulate private investment, while ensuring the availability of electricity service to all who request it. We are subject to regulation of our prices and other aspects of our business in Chile under the Chilean Electricity Law. Three governmental entities have primary responsibility for the implementation and enforcement of the Chilean Electricity Law. The NEC calculates retail tariffs and wholesale, or node-prices, which require the final approval of the Ministry of Economy, and prepares the indicative plan, a 10-year guide for the expansion strategy of the electricity system that must be consistent with the calculated node-prices. The SEF sets and enforces the technical standards of the system and the correct compliance of the law. In addition, the Ministry of Economy grants final approval of tariffs and node-prices set by the NEC and regulates the granting of concessions to electricity generation, transmission and distribution companies.
Pursuant to the Chilean Electricity Law, companies engaged in the generation of electricity in Chile must coordinate their operations through the CDECs to minimize the operating costs of the electricity system and monitor the quality of service provided by the generation and transmission companies. Generation companies meet their contractual sales requirements with dispatched electricity, whether produced by them or purchased from other generation companies in the spot market. The principal purpose of a CDEC in operating the dispatch system is to ensure that only the most efficiently produced electricity is dispatched to customers. However, the CDEC also seeks to ensure that every generation company has enough installed capacity and can produce enough electricity to meet the demand of its customers. Because Endesa-Chile’s production in the SIC is primarily hydroelectric, and therefore its marginal cost of production is generally the lowest in that interconnected system, its electricity capacity in the SIC is generally dispatched under normal or abundant hydrological conditions. Generation companies balance their contractual obligations with their dispatch by buying electricity at the spot market price, which is set hourly by the CDECs, based on the marginal cost of production of the next kWh to be dispatched. This is known as the spot marginal cost.
Sales by Generation Companies
Sales may be made pursuant to short- or long-term contracts or, in the case of sales to other generation companies, on a spot basis. Generation companies may also be engaged in contracted sales among each other at negotiated prices. Generation companies are free to determine whether and with whom to contract, the duration of the contracts and the amount of electricity to be sold.
Sales to Distribution Companies and Certain Regulated Customers
Under the Chilean Electricity Law and regulations thereunder, sales to distribution companies for resale to regulated customers must be made at the node-prices then in effect at the relevant locations (nodes) on the interconnected system through which such electricity is supplied. Until March 2006, two years after approval of the “Short Law,” regulated customers are those with a maximum consumption capacity not in excess of 2 MW. After March 2006, those clients with maximum consumption capacity between 0.5 MW and 2 MW will be able to choose their status as a regulated or unregulated customer. Two node-prices are paid by distribution companies: node-prices for capacity and node-prices for energy consumption. Node-prices for capacity are determined by making a calculation of the marginal cost of increasing the existing capacity of the electricity system with the least expensive generating facility. Node prices for energy consumption are calculated based on the projected short-term marginal cost of satisfying the demand for energy at a given point in the interconnected system, during the succeeding 48 months in the SIC and during the succeeding 24 months in the SING. The determination of such marginal cost in the SIC takes into account the principal variables in the cost of energy over the 10-year period, including projected growth in demand, reservoir levels (which are important in determining the availability and price of hydroelectricity), fuel costs for thermal electricity generation facilities, planned maintenance schedules and other factors that would affect the availability of existing generation capacity and scheduled additions to generation capacity during the 10-year Indicative Electricity Development Plan. The same general principles are used to determine marginal cost in the SING.
38
Node-prices for capacity and energy consumption are established every six months, in April and October, by a decree issued by the Ministry of Economy. Although node-prices are quoted in Chilean pesos, the calculations used to determine node-prices are mainly effected in U.S. dollars. Node-prices so established become effective in May and November. Node-prices are adjusted during a six-month period only if changes in the underlying variables in the formula used to project a node-price then in effect would result in a variation in excess of 10% with respect to the initially calculated price. In addition, the Chilean Electricity Law requires that the difference between node-prices and the average price paid by unregulated customers in the six-month period prior to the date of node-price calculation not exceed 5%. If node-prices do not meet this requirement, they will be adjusted so that such difference will not exceed 5%. Distribution companies are required to pay generation companies for each month’s electricity purchases on the 21st day of the following month, at the applicable node-prices in effect at the time.
The Chilean Electricity Law provides that if a generation company sells directly to a regulated customer outside the concession area of a distribution company, then the generation company must apply the same price as the nearest distribution company would be required to apply.
Sales to Other Generation Companies
To accomplish its objective of operating the dispatch system to ensure that only the most efficiently produced electricity reaches customers, each CDEC annually determines “Firm Energy” and “Firm Capacity.”
Firm Capacity is the total probable capacity of all generating units in an interconnected system at any point in time, calculated using historical data, statistical analyses and certain assumptions regarding hydrology. Each CDEC compares Firm Capacity to the maximum anticipated peak demand for capacity at peak hours on the system. The amount by which the system-wide probable capacity exceeds the maximum anticipated demand at peak hours is prorated for each generating unit in the system based on the installed capacity of such unit. Installed capacity of each unit is reduced by such pro rata amount to determine “Allocated Firm Capacity.” If the Allocated Firm Capacity of any generation company exceeds its peak hour contracted commitments to customers, such generation company will be paid for its excess Allocated Firm Capacity by generation companies with peak hour commitments to customers in excess of their Allocated Firm Capacity, based on the prevailing node-price for capacity.
A generation company may be required to purchase or sell energy or capacity in the spot market at any time, depending upon its contractual requirements in relation to the amount of electricity to be dispatched from such company. Purchases and sales made in the spot market are transacted at the spot marginal cost of the interconnected system in which the companies are located, which is the marginal cost of the next kWh to be dispatched. Generation companies making sales in the spot market are paid for each month’s sales on the 22nd day of the following month at the spot marginal cost in effect at the time of sale.
Transmission
To the extent that a company’s transmission assets were built pursuant to concessions granted by the Chilean government, the Chilean Electricity Law requires such company to operate the covered transmission system on an “open access” basis in which users may obtain access to the system by contributing towards the costs of operating, maintaining and, if necessary, expanding the system. Transmission companies recover their investment in transmission assets through tolls, or “wheeling rates”, which are charged to generation companies and final customers according to the following proportion defined by law: 80% to generators and 20% to customers in the central part of the network (the “Common Influence Area”, initially located between both nodes that includes at least 75% of the system’s energy injection and demand) and in the rest of the transmission system, 100% to either generators or customers, according to the direction of the power flows. According to the “Short Law” the transmission companies become public service companies and their tariffs are determined every 4 years by Decree of the Ministerio de Economía, Fomento y Reconstrucción.
39
Sub-transmission
In 2005, there will be a new tariff setting process for all sub-transmission systems in Chile, which will affect Chilectra’s high voltage grid used to connect its distribution network with the main transmission system. Up to now, this grid was remunerated by non-regulated distance charges; the new tariff setting process will be based on an adjusted economic model and will regulate the related prices. These new tariffs will begin to be applied as of 2006. It is uncertain what the precise effect will be on our income, although these tariffs should be lower than the ones prevailing today.
Sales to Unregulated Customers
The Electricity Law distinguishes between regulated and unregulated prices for electricity supply. Electricity supply prices are unregulated for:
| • | final customers with a connected capacity greater than 2 MW, commonly known as large customers; | |
| • | temporary customers; and | |
| • | customers with special quality requirements. |
From March 2006, final customers with a connected capacity between 0.5 MW and 2 MW may voluntarily decide to leave their status as regulated customers by informing the distribution company 12 months in advance. However, these customers must remain at their chosen status for the next four years.
Customers not subject to regulated prices, commonly known as unregulated customers, may negotiate prices freely with distribution and/or generation companies. All other customers are subject to the maximum prices established by the tariffs.
Distribution Tariff to Final Customers
The tariff charged by distribution companies to their final customers is determined by the sum of the cost of electricity purchased by the distribution company (the node-prices for capacity and energy consumption at the point of purchase from the generation company), a transmission charge and sub-transmission surcharge, and the value added by the distribution network, or the VAD. The price for both generation and distribution capacity sold to customers includes a factor which reflects the simultaneous contribution of each customer to peak capacity demand of the system as a whole. The transmission charge reflects the cost paid to transmission companies and sub-transmission surcharge reflects the cost of transmitting and transforming electricity from a node on the interconnected system to a substation at the distribution level. The VAD includes an allowed return on investment.
VAD Tariff
The Chilean tariff system allows distribution companies to recover the operating costs, including allowed losses, and a return on investment, of a “model company”. Recovery is primarily made through capacity charges and, in the case relating to the lowest voltage tariff rate (“BT-1”), through sales of energy. The BT-1 tariff rate is designed for customers with connected capacity not greater than 10 kW for whom capacity usage is not metered. This tariff only measures energy consumed and the capacity usage by such customers is determined based on energy (kWh) used. The distribution costs associated with all other customers are recovered through either measured or contracted capacity (kW) sales.
The VAD, which is based on a “model company,” includes the following costs: selling, general and administrative costs of distribution; maintenance and operating costs of distribution assets; cost of energy and energy losses; and an expected return on investment, before taxes, of 10% per annum in real terms based on the new replacement cost of assets employed in distribution. The new replacement cost of assets includes the cost of renewing all the facilities and physical assets used to provide the distribution services, including interest expense, intangible assets and working capital.
40
Distribution Tariff-Setting Process
The distribution tariffs are set every four years. During the tariff-setting process, the NEC classifies companies into groups, hereinafter referred to as the Typical Distribution Areas or TDAs, based on economic factors that classify like-companies with similar distribution costs.
By applying efficiency guidelines established by the NEC to a selected actual company, the NEC chooses a “model company” for the purpose of setting a tariff. The tariff is not based on actual costs incurred by any given distribution company, but on investment, operating, maintenance and general administrative standards and overall efficiency of operations of the model company, which is used as a benchmark.
A given distribution company’s actual return on investment is dependent on its performance relative to the standards chosen by the NEC for the model company. The tariff system allows for a greater return to distribution companies that are more efficient than the model company. For the four-year period beginning November 2004, Chilectra was the only company classified in the high-density TDA, andCompañía General de Electricidad S.A. was chosen for the medium-density TDA. Tariff studies are performed both by the NEC and by the distribution companies. Each party typically retains specialized consultants to perform a parallel tariff study. The tariffs are calculated as a weighted average of the results of the NEC-commissioned study and the companies’ study, with the results of the NEC’s study bearing twice the weight of the companies’ results. Preliminary tariffs are tested to ensure that they provide an average real annual internal rate of return between 6% and 14% on the replacement cost of assets for the entire distribution industry.
The distribution tariffs are enacted by the Ministry of Economy and are valid for four years, unless:
| • | the cumulative variation in the consumer price index exceeds 100% within the four-year period; or | |
| • | the annual internal real rate of return for the electricity distribution industry as a whole falls below 5%, or increases above 15%. |
In addition, the tariff formulas can be modified before their expiration date by agreement between all of the companies and the NEC. As required by the Chilean Electricity Law, distribution tariffs have been reset every four years, starting in 1984. The last tariff setting process finished in 2004, resulting in a 4.5% tariff reduction for Chilectra. Tariff formulas allow monthly indexing based on variations in node-prices and distribution costs, including the consumer price index, the wholesale price index for domestic goods, copper prices, currency exchange rates and import duties. The indexed tariffs are the maximum prices that distribution companies may charge regulated customers for supplying electricity. Node-prices are adjusted during the six-month period only if changes in the underlying variables in the formula used to project a node-price then in effect would result in a variation in excess of 10%.
Concessions
In certain cases, the Chilean Electricity Law permits the generation and transmission of electricity without the need to obtain a concession from the Chilean government. However, companies may apply for a concession from the Chilean government, particularly to facilitate the use of and access to third-party properties. Third-party property owners are entitled to compensation, which may be agreed to by the parties or, absent agreement, determined by an administrative proceeding that may be appealed to the Chilean courts.
Concessions for the operation of distribution networks are granted by the Ministry of Economy pursuant to the Chilean Electricity Law. Concessions are non-exclusive and of indefinite duration but may be revoked by the President of Chile if certain quality and safety standards are not met. In such case, the distribution company’s assets will be liquidated in a public auction. The net proceeds from such auction will be paid to the concession holder after all associated expenses are reimbursed. Government approval is required for the transfer of concessions and for the territorial expansion of a concession. The concession holder has the right to use public rights-of-way to install overhead and underground lines for the distribution of electricity within its territory.
41
Distribution companies are required to provide service within their concession area at applicable tariffs, and may provide service to customers outside the concession area connected to the distribution facilities through their own lines or lines of third parties at applicable tariffs. The Chilean Electricity Law permits a distribution company to demand that a customer finance the capital investment required to extend the transmission and distribution facilities necessary to provide service. Such law requires that customer financing be repaid by the distribution company, but gives the distribution company the discretion to determine the form of repayment over a period not to exceed 15 years. Repayment may be made by delivery of promissory notes, electricity, common shares or other form of consideration agreed to by both parties.
Changes to Electricity Law, Potential Fines, Compensations and Regulatory Payments
Chilean Congress amended the Chilean Electricity Law, effective as of June 8, 2000, placing severe penalties on deficit generation companies in the event of prolonged periods of electricity shortages. Electricity rationing may be enforced by the enactment of a rationing decree which is subject to the prior approval by the NEC and the Ministry of Economy. Such approval is contingent upon the severity of the prevailing conditions causing the electricity shortage.
The Chilean Electricity Law, as amended, no longer exempts deficit generation companies from fines if power shortages are due to severe drought and states that such weather conditions will no longer be considered a force majeure event. In addition, the Chilean Electricity Law, as amended, requires that generation companies compensate consumers during periods of rationing as compared to the law prior to amendment, which only compensated surplus generators but did not penalize deficit generators during power shortages. Companies penalized under the legislation will have the right to appeal but only after they have made a prepayment equal to 25% of the fine.
Under the Chilean Electricity Law, as currently in effect, we may be required to pay fines to the regulatory authorities, make compensatory payments to electricity consumers affected by the shortage of electricity and make payments to generation companies from whom we are forced to purchase electricity in order to meet contractual commitments. These types of penalties or payments are described below.
| • | Fines. The fines, that could apply to any electricity company supervised by the NEC and the SEF, including generation, transmission and distribution companies, range from the equivalent of approximately U.S.$ 54 to a maximum of the equivalent of approximately U.S.$ 6.5 million. Companies penalized under the legislation will have the right to appeal but only after they have made a prepayment equal to 25% of the fine. | |
| • | Compensatory payments by generation companies. If the Ministry of Economy issues a rationing decree, generation companies may be required to reimburse distribution customers on a pro rata basis for credits given to final consumers in an amount equal to the product of: (i) the difference between the rationed end-consumer price specified in the rationing decree and the applicable node price, and (ii) the difference between the consumer’s actual energy consumption during the rationing period (taking into account only the hours of effective interruptions of service) and during the same period in the prior year, with certain adjustments. | |
| • | Failure cost. Chile’s Electricity Law calls for a “failure cost” equal to the amount that must be paid by deficit generators that cannot meet their contractual commitments to the surplus generators to deliver electricity during periods when a rationing decree is in effect. | |
| • | Compensatory payments by distribution companies. Distribution companies may be required to compensate final customers if there are shortages of electricity that exceed the authorized standards. These compensatory payments shall be at an amount equal to double the non-supplied energy at failure cost. |
On March 21, 2001, the Chilean Antitrust Commission issued Resolution No. 525, which established a list of 25 services related to the supply of electricity, such as the lease of meters that should be regulated. As mentioned above, in 2004 the tariff setting process for these services resulted in lower tariffs (for example the tariff for disconnection and reconnection of service was reduced by 9 %). In 2005, a new tariff setting process for these services will conclude, and from now on the process will be part of the regular VAD tariff setting process.
42
On May 30, 2001, the Ministry of Economy issued Resolution No. 88, which stated that generation companies are required to supply electricity to SAESA, a distribution company which was not able to renew its electricity supply contracts. Such resolution also stated that the electricity supply shall be provided at the node-price and on a pro rata basis, considering the firm capacity of each generation company.
The “Short Law”
In March 2004, the so-called Ley Corta, or Short Law, was enacted by Chilean Congress. This law establishes a new framework for electricity companies, which allows us to better evaluate new investment opportunities. The principal changes implemented by the Short Law include:
| • | a new methodology concerning compensation to, and expansion of, transmission systems, reducing generators’ transmission costs by transferring part of the cost to final customers, | |
| • | regulation on the subject of ancillary services (including frequency regulation, among others); | |
| • | reduction of the regulated node price band with respect to the unregulated customer contract price from 10% to 5%, | |
| • | regulation of the distribution toll (wheeling rate), requiring electricity distributors to provide service to third parties; | |
| • | a change in the definition of unregulated customer, reducing power capacity needs from 2 MW to 0.5 MW, starting two years after the law was declared effective. The newly eligible customers will be given the option to decide whether to remain as regulated or to change their status to unregulated. | |
| • | a permanent expertise commission will be established to resolve discrepancies that arise in each of the tariff and toll setting processes. |
In our opinion, the approval of this law has established a better framework for companies to analyze new investments. Nevertheless, the convenience of developing new projects depends not only on regulations, but also on the stability and attractiveness of the industry price levels.
On March 14, 2005, Chilean Congress received a project that intends to modify Law DFL N° 1 and Law 18,410 of the SEF in order to encourage investment in generation. Of the modifications that were introduced, the following are the most relevant for us:
| • | the introduction of a long-term node price, as well as a stable price signal, meant to encourage investment in generation; and | |
| • | the notion that sales to distribution companies that are not made pursuant to contractual agreements already in existence be carried out until December 2008 at the marginal cost of energy and not at the node price. |
These price signals have been interpreted in a positive way by our generation subsidiaries because they pave the way for potentially undertaking long-term investments in alternative fuels at a time in which it has become evident that Chile cannot rely on Argentine natural gas. Because of these recent regulatory developments, Endesa-Chile, together with other companies, including ENAP (Empresa Nacional del Petróleo), is in the initial phase of bidding on a liquefied natural gas (LNG) project that would eventually grant such fuel to San Isidro’s second power plant, which was originally planned to burn Argentine natural gas. For more information, please see the risk factor entitiled, “the Argentine natural gas crisis has increased the vulnerability of the electricity sector in Chile.”
Environmental Regulation
The Chilean Constitution of 1980 grants to all citizens the right to live in an environment free of pollution. It further provides that other constitutional rights may be limited in order to protect the environment. Although environmental regulation is not as well developed in Chile as in the United States and certain other countries, Chile has numerous laws, regulations, decrees and municipal ordinances that may raise environmental considerations.
43
Among them are regulations relating to waste disposal (including the discharge of liquid industrial wastes), the establishment of industries in areas in which they may affect public health and the protection of water for human consumption.
Our operations in Chile are also subject toLey No. 19,300, or the Chilean Environmental Law, which was enacted in 1994. The Chilean Environmental Law requires Endesa-Chile to conduct environmental impact studies of any future generation or transmission projects or activities that may affect the environment and to arrange for the review of such studies by the Chilean Environmental Commission, or CONAMA. It also requires an evaluation of environmental impact by the Chilean government or the posting of an environmental insurance policy insuring compliance with standards for emissions, noise, waste and disposal and authorizes the relevant ministries to establish emission standards. The Chilean Environmental Law was implemented byReglamento No. 30 del Ministerio Secretaria General de la Presidencia (“Reglamento No. 30”) on March 20, 1997. Endesa-Chile applies the guidelines set out in Reglamento No. 30 when analyzing the development of future projects. Prior to the enactment of the Chilean Environmental Law and its implementation through Reglamento No. 30, Endesa-Chile applied similar guidelines to its projects. Chilectra’s transmission lines may be also affected by regulations under the Chilean Environmental Law issued on April 3, 1997, which require environmental impact studies for projects involving high voltage transmission lines and their substations.
Water rights
Endesa-Chile owns unlimited duration unconditional and absolute property water rights granted by the Chilean Water Authority. However, in March 2005, Chilean Congress approved a modification to the current laws governing unused water rights. Under the amended law, beginning on January 1, 2006, Chilean generation companies will have to pay an annual license for such unused water rights. By the end of 2005, Endesa-Chile will have to determine which water rights are likely to be eventually utilized for a hydroelectric project and which will not. If Endesa-Chile determines that some water rights will not be used for a future project, it will abandon such water rights in order to avoid liability for license payments. We estimate that in the event that Endesa-Chile does not abandon any water rights in the SIC, it will have to pay license fees aggregating no more than U.S.$ 4.0 million per year. When any future project commences operations, license fees paid for the corresponding water rights will be recovered retroactively through a tax credit, for a term of up to eight years before the start up of the project that utilizes the water rights.
In the case of water rights located in the extreme south of Chile (in particular, the eleventh and twelfth regions, outside the area comprised by the SIC), the license payments will be paid starting as of January 1, 2013, using the same tax refund regime mentioned above for the SIC.
General Regulation Applicable to Non-Chilean Operating Companies
Enersis’ and Endesa-Chile’s non-Chilean operating companies were acquired in connection with the privatization of formerly government-owned and controlled companies. In connection with these privatizations, in certain instances, the bidding terms established limitations on the winning bidders’ ability to transfer their shares without prior regulatory approval or expiration of prescribed waiting periods. Accordingly, Enersis’ and Endesa-Chile’s ability to transfer interests in their non-Chilean operating entities is subject to compliance with such requirements.
Argentina
Industry Structure
Federal LawNo. 24,065 of January 1992, or the Argentine Electricity Act, divides the electricity industry into three sectors: generation, transmission and distribution. The generation sector is organized on a competitive basis with independent generation companies selling their production in the spot market of the Wholesale Electricity Market, or the WEM, or by private contracts with certain other market participants in the term market of the WEM. Transmission is organized on a regulated basis. Transmission companies are required to operate, maintain and provide third parties access to the transmission systems they own and are authorized to collect a toll for transmission services. Transmission companies are prohibited from generating or distributing electricity. The major transmissioncompany isCompañía de Transporte de Energía Eléctrica en Alta Tensión S.A.or Transener. Distribution involves the transfer of electricity from the supply points of transmitters to customers. Distribution companies operate as geographic monopolies, providing service to almost all customers within their specific region. Accordingly, distribution companies are regulated as to rates and are subject to service specifications. Although distribution companies may acquire the electricity needed to meet the demand either in the WEM at seasonal prices or through contracts with generation companies, all of them prefer to buy electricity in the WEM because distribution companies are allowed to pass through only the seasonal prices reflecting the average spot energy price.
44
The WEM classifies large users of energy into three categories: Major Large Users, or GUMAs in its Spanish acronym, Minor Large Users, or GUMEs in its Spanish acronym, and Large Particular Users, or GUPAs in its Spanish acronym. Users in each of the three categories may freely negotiate their supply contract prices with generating companies. GUMAs are all users with a peak capacity demand of at least 1.0 MW and a minimum annual energy consumption of 4.38 GWh. GUMAs must contract to purchase at least 50% of their demand and purchase the rest in the spot market. GUMEs are all users with peak capacity demand ranging between 0.03 MW and 2.0 MW. GUPAs are all users with a peak demand ranging between 0.03 MW and 0.1 MW. GUMEs and GUPAs are not required to have a minimum annual energy consumption. GUMEs and GUPAs must contract to purchase all of their demand and do not effect any transactions in the spot market.
The regulation also recognizes the following entities as participants in the WEM:
| • | power traders, who market generation capacity and energy demand by entering into contracts with generation companies and large consumers; | |
| • | provinces which can sell the energy received under royalty rights; and | |
| • | foreign companies that are part of import/export energy contracts. |
Dispatch and Pricing
The Argentine electricity dispatch system, like the Chilean system, is designed to ensure that the lowest cost electricity reaches customers. The National Interconnected System, or NIS, coordinates the generation, transmission, and distribution of electricity. Generation companies sell their electricity to distribution companies, power traders and large users in the competitive WEM through freely negotiated supply contracts or through the spot market at prices set by theCompañía Administradora del Mercado Mayorista Eléctrico S.A., or CAMMESA. The operation of the WEM is the responsibility of CAMMESA. CAMMESA’s stockholders are generation, transmission and distribution companies, large users (through their respective associations) and the Secretariat of Energy.
All generation companies that are in the NIS pool operate in the WEM. The contractual price is paid by distribution companies, power traders and large users that have entered into supply contracts with generation companies. Large users who contract directly with generation companies must also pay their distribution companies a toll for the use of their distribution networks. The average spot price is the price paid by distribution companies for electricity from the pool and is a fixed price reset every six months and revised every three months by CAMMESA and approved by the Secretariat of Energy according to supply, demand, available capacity and other factors. The spot price is the price paid to generation companies, or by power traders marketing generation capacity, for energy dispatched under CAMMESA’s direction and for capacity required by CAMMESA to maintain adequate reserves. This hourly price paid for energy reflects the marginal cost of generation.
The actual operation of CAMMESA involves the dispatch of generating resources without regard to the contracts among generation companies, power traders and distribution companies or large users. Consequently, a generation company’s capacity may be dispatched to provide more or less energy to the pool irrespective of its contractual commitments. Under these circumstances, the generation company will be obligated to buy or sell excess energy from or to the pool at spot prices.
45
Transmission Tariff
The transmission tariff that must be paid by generation companies, distributors and large users can be broken down into:
| • | a connection charge that underwrites the costs of operating and maintaining the equipment that links them to the transmission system; | |
| • | a capacity charge that underwrites costs of operating and maintaining lines; and | |
| • | a variable charge based on the aggregate amount of electricity energy transported to cover losses that occur during transmission. |
Regulation of Hydroelectric Operations
The Basin Authority. Ley Nacional No. 23,896 of 1990 created the Basin Authority of the Limay, Neuquén and Negro Rivers, or the Basin Authority. The Basin Authority is responsible for the administration, control, use and preservation of the basin of the Limay, Neuquén and Negro Rivers, and for the adequate management of related water resources. The Basin Authority monitors compliance by El Chocón, one of the largest hydroelectric generation facilities in Argentina, and other hydroelectric concession holders in the region with the provisions of their respective concession agreements, environmental laws and the Basin Authority’s resolutions. The Basin Authority also serves as a forum for public hearings at which complaints against those holding concessions can be heard and resolved.
ORSEP.The Entity for Safety of Dams, or ORSEP in its Spanish acronym, is in charge of supervising the safety of El Chocón’s dams, and of any additional works performed by El Chocón. ORSEP supervises and inspects the construction, operation, maintenance, repair or modification of the works related to the dams and related structures in order to monitor their safety and to protect persons and assets. ORSEP is empowered to:
| • | inspect and verify the functioning of any part of the dams or related structures; | |
| • | require reports on the design, construction, operation, maintenance, use, repair or modification of dams and related structures; and | |
| • | monitor any situation which may cause risk to the dam or any death or injury caused by such dams or related structures. |
ORSEP also handles the approval of quality control programs submitted by El Chocón, the determination of specifications to prevent accidents and the maintenance of public safety within the area of the dams and related structures.
Distribution Tariff to Final Customers
In general, Edesur’s distribution tariff is comprised of:
| • | a fixed charge applicable to small users who are generally residential, small industrial and commercial customers, or a charge per unit of maximum demand for medium or large users who are generally commercial, industrial or governmental customers; and | |
| • | variable energy charges, which are recalculated at the beginning of each three-month period coinciding with the dates on which the seasonal prices reflecting the average spot energy prices in the WEM are effective. |
The fixed charge or the charge per unit of maximum demand portion of the tariff includes two components:
| • | the cost of capacity in the WEM, adjusted at the beginning of the same three-month period; and | |
| • | the distribution component (VAD) which was fixed in U.S. dollars for each class of users until the enactment of the Economic Emergency Law, adjusted semi-annually for changes in U.S. wholesale and consumer price index. |
46
The variable energy charges are designed to allow a distribution company to recover its variable energy costs based upon the weighted proportion of each distribution company’s energy supply derived from the average spot prices set for the next three months, energy purchased under post-privatization long-term contracts and amounts payable by such distribution company into the National Energy Fund.
Upon expiration of the initial ten-year period and upon each successive five-year period thereafter, the tariff schedule will be revised for the next five years. One year before the end of each such period, Edesur must propose its recommended revisions. According to Argentine regulations, theEnte Nacional Regulador de la Electricidad, or ENRE, must appoint experts to propose alternative tariff formulas taking into consideration the interests of both consumers and Edesur.
The tariff schedule should have been revised in 2002, but the tariff revision process is in a stage of uncertainty because ENRE postponed the presentation of the tariff proposal for the period starting on September 1, 2002 and ending on October 31, 2007. The postponement was requested by the distribution companies due to the renegotiation of the concession contracts, which is taking place under the Economic Emergency Law, and because it is not possible, under the current circumstances, to establish the criteria and valid premises to determine the economic costs and a reasonable rate of return for distribution companies. Law No. 25,790 recognized the authority of the ENRE to revise tariff schedules in a manner consistent with the development of the renegotiation process and the possibility of transitory modifications of the concession contracts.
Emergency Measures
As of the date of this annual report, the Argentine electricity regulatory framework is undergoing significant changes, the effects of which are hard to evaluate in the long-term. Although Law No. 24,065 has not been formally derogated, and as such, it still prevails from a formal perspective, the trend that has been observed in 2002 to date leads us to believe that there will be an increased state intervention that will modify the regulatory framework described herein. In particular, in January 2002, the Argentine congress approved the Public Emergency and Reform of the Exchange Regulation Law 25,561 (the “Economic Emergency Law”). This law authorized the forced renegotiation of public service contracts, imposed the conversion of dollar denominated obligations into Argentine pesos at a rate of AR$ 1 per U.S.$ 1 (with some exceptions) and empowered the Federal Executive Power to implement, among other things, additional monetary, financial and exchange measures to overcome the economic crisis in the medium term, such as the creation of a system for determining the rate at which the Argentine peso is to be exchanged into foreign currencies.
From December 3, 2001 to May 6, 2003, the Argentine government imposed a number of monetary and currency exchange control measures that included restrictions on the free transfer of funds deposited with banks and severe restrictions on transferring funds abroad, with certain exceptions for transfers related to foreign trade and other authorized transactions. The restrictions requiring the Argentine Central Bank’s prior authorization for the transfer of funds abroad in order to make payments of principal and/or interest, which were in place during 2002, were progressively reduced from January to May 2003.
Even after the creation of the Renegotiation Entity, which replaced the Renegotiation Commission and is composed of two ministries of the Argentine Federal Executive Branch, as of the date of this annual report, the progress in the renegotiation process has been minimal and we cannot predict if, and when, we will obtain acceptable tariffs for Edesur.
Other than as discussed below, during 2004 there were no significant advances regarding the renegotiation of Edesur’s concession contract and there is currently no formal agenda on this issue.
On November 25, 2004, the“Unidad de Renegociación y Análisis de Contratos de Servicios Públicos” (UNIREN), the governmental institution in charge of the renegotiation, presented to Edesur a proposal of an Understanding Letter to be used to reach a definitive agreement on the renegotiation. Edesur ultimately rejected this proposal, the principal points of which were:
| • | a 23% increase of VAD (Distribution Added Value); |
47
| • | a tariff setting process would take place between January 2005 and September 2006; | |
| • | withdrawal of actions taken in the jurisdiction of ICSID, before having acknowledged the results of the mentioned tariff setting process; and | |
| • | financing of unpaid fines. |
Concessions
Edesur holds an exclusive concession to distribute electricity within the concession area for a period of 95 years from August 31, 1992. The concession consists of an initial 15-year period and eight additional ten-year periods. This exclusive concession may expire, or the area of concession may be changed, if technical advances permit new methods of electricity distribution. The government must notify Edesur at least six months before the expiration of the first concession period, August 31, 2007, or any subsequent concession period, if it intends to exercise its right to modify the concession area.
On March 25, 1997, the ENRE approved an amendment to Edesur’s by-laws passed by stockholders at a meeting held on March 14, 1997, allowing Edesur to participate in other energy distribution companies, to act as a broker in the electricity market, and to provide services to third parties.
Edesur is required under the concession contract to supply electricity upon request by owners or occupants of premises in its concession area, meet certain quality standards relating to electricity supplied, meet certain operating requirements relating to the maintenance of distribution assets and bill customers based on actual readings. As a condition of the concession, and to ensure its performance under the terms thereof, Distrilec, the direct owner of 56.4% of the shares of Edesur and the entity through which we hold part of our beneficial ownership in Edesur, has pledged its shares of Edesur to the Argentine government. The Argentine government may sell the pledged shares if, for instance:
| • | Edesur does not comply with the quality standards established in the concession agreement or accumulates penalties in any given year in an amount greater than 20% of its invoices after taxes and contributions; and | |
| • | Distrilec transfers its shares of Edesur without authorization or allows another person to pledge its shares in Edesur. |
The Argentine government may also cancel the concession if Edesur does not comply with its obligations and thereby prevents or materially affects the concession service for more than 90 days after compliance is required.
The concession agreement also provides that, before the end of each concession period, the ENRE will arrange for a public auction of the shares of Edesur owned by Distrilec. Distrilec will participate in the auction, and its bid will establish the minimum price for the shares. If a bid is made that exceeds Distrilec’s bid, Distrilec must sell its Edesur shares to the bidder for the bid price. If no bid exceeds Distrilec’s bid, Distrilec will retain the concession but will not be obligated to make any payment.
The Economic Emergency Law enacted on January 6, 2002, has affected Edesur adversely by repealing the provisions of Edesur’s concession contract that permitted its distribution tariffs to be pegged to the dollar, and that provided for certain price indexation mechanisms. Since Edesur’s invoices to its clients are no longer pegged to the dollar, the dollar value of such receivables has declined significantly in the wake of the devaluation of the Argentine peso. Because Edesur’s indebtedness is largely dollar-denominated, the above-mentioned factors have had a significant negative impact on Edesur’s net income.
The Economic Emergency Law also authorized the Argentine Federal Executive Branch to renegotiate all public service contracts, and establishes certain guidelines dealing with potential impacts on the Argentine domestic economy, quality of service and capital expenditure plans, consumer interests, the security of the systems, and the profitability of the companies providing such services. On March 20, 2002, the government listed the set of contracts to be renegotiated, as well as the general procedures to be used as guidance in such negotiations. Among these contracts is Edesur’s concession contract, in which we are appealing for improved tariffs.
48
Electricity Regulatory Changes and Emergency Measures
In 2002 and during 2003, the Secretary of Energy introduced some regulatory measures (including Resolutions No. 2 and 8 in 2002 and Resolutions 1, 82, 240, 406 and 784 in 2003) in order to correct the mismatches produced by the devaluation of the Argentine peso, to reduce energy prices and distribution tariffs and to ensure the normal operation of generation activities. Even though the Secretary of Energy first recognized the U.S. dollar as the correct currency of denomination for certain variable costs of production such as liquid fuels, spot prices are no longer determined by a uniform tariff calculated for all generation companies in the spot market, and limits on spot market prices have been imposed by the Secretary of Energy at its discretion.
A second important aspect of these regulatory measures was to make an adjustment in the price stabilization system in order to identify real costs and prices, reduce the price volatility and diminish the arbitrage risk of differences between the spot prices and seasonal prices. Consequently, an anticipated spot market has been created that introduces a prior adjustment to energy prices that acts as a price stabilization system.
Subsequently, the Secretary of Energy enacted Resolution No. 246/2002 that established various regulatory changes. The following are the more significant measures:
| • | the separation of capacity and energy payments such that the capacity payments are tied to availability and short-term reserves are regulated and tied to commitment reserves; | |
| • | the modification of energy supply guarantee rights and obligations, supply priority and demand interruptability, and regulation of short- and medium-term reserves for service disruption conditions with respect to large customers; | |
| • | a new capacity relief scheme proposed by CAMMESA; | |
| • | the integration of node and adaptation factors for demand without affecting the calculation of the variable transmission remuneration and energy delivered by generation companies and traders; | |
| • | the acknowledgement of new tax rates that are applied to natural gas, oil and fuel transfers as additional costs; | |
| • | expansion and increased ease of the conditions of the contract market; and | |
| • | the adjustment of forced generation regulations. |
On July 18, 2002 Resolution No. 317/2002 of the Secretary of Energy, which supplements Resolution No. 246/2002, increased the capacity payment from Ar$ 10/MW to Ar$ 12/MW in the hours that the capacity is remunerated.
Finally, on January 2, 2003, the Secretary of Energy enacted Resolution SE No. 1/2003 whose principal features are the following:
| • | an increase in the compensation for generation companies whose variable costs are higher than the first failure cost step (Ar$ 120/MWh); | |
| • | the establishment of a new reserve service to ensure availability in areas where shortage of natural gas in winter will be foreseen; | |
| • | the adjustment of the reserve service reliability to cover the peak time capacity demand; | |
| • | the reestablishment of the anticipated spot market operation for seasonal energy transactions; and | |
| • | the implementation of a transitional process to identify and manage the high voltage system and distribution expansions and to improve the availability of energy supply. | |
49
With respect to generation, regulatory changes have been introduced in order to:
| • | increase the actual market price transparency to improve the predictability of the generation companies’ remunerations and facilitate their decisions; and | |
| • | gradually obtain a more stable seasonal price. | |
With respect to transmission, regulatory changes have been introduced in order to: | ||
| • | provide a more friendly environment and create incentives to accomplish certain critical projects; and | |
| • | revise the operational and design guidelines to meet the safety and operating requirements enacted in the law. | |
As a result, the seasonal stabilization fund, a fund created to collect the seasonal stabilization prices paid by distributors and to provide the amounts to cover the gap between the spot prices and the seasonal prices that are passed through to the end users by the distributors, is now depleted. In accordance with Resolution SE No. 406/2003, the Secretary of Energyestablished a priority for payments in the WEM, by which generators are compensated only after certain other creditors of the WEM are compensated, granting hydro-generators priority only in collecting the part of their remuneration which reflects their operational and transmission costs and eliminating the right of hydro-generators to collect the total energy price sanctioned in the spot market.
Additionally, on August 14, 2003 the Secretary of Energy took further measures pursuant to Resolution SE No. 240/2003 which “temporarily” imposed, until certain alleged restrictions in the supply of natural gas are overcome, an artificial limit on the energy spot price by ignoring the actual restrictions on gas supply to electricity generation companies. According to the resolution, in order to define the energy spot price, the WEM will not consider variable costs reflecting liquid fuels prices but it will only consider natural gas tariffs, which excludes the possibility that water values of the hydro facilities and hourly import transactions of energy may influence the spot prices in the event that they are higher than the variable costs of the marginal unit using natural gas. In addition, Resolution SE No. 240/2003 discriminates against hydro-generators by not permitting them to recognize their generation costs in excess of the node-price, whereas thermal generators’ variable costs in excess of the node-price continue to be recognized as asobrecosto transitorio de despacho (a transitory dispatch cost).
In 2004, the Secretary of Energy enacted resolutions N° 93, 839 and 1,434 in February, August and December, respectively, through which seasonal prices were increased. The increase was applied to each consumer according to its level of consumption, in order to minimize the effect of the increase on lower demand and residential users.
In 2004, Congress received a proposed law known as the “Public Services National Regime” sent by the Executive Branch, which recommends a common regulatory framework for all public services. The main contents of this project are:
| • | the government would define the investment needs for public services concessions; | |
| • | impossibility of submitting claims through international courts; | |
| • | a governmental authorization would be required for taking any decision that may affect the “future financial capacity” of the company (such as dividend policy and indebtedness policy); | |
| • | the government would have the right to modify the scope of the concession as long as the indemnification is recognized; | |
| • | the companies would not be able to use the Concession Contract’s dispositions to oppose to future normative enactments; | |
| • | forbid automatic tariff indexation, making it difficult to transfer the costs of energy purchases (wholesale costs) to final tariffs; and | |
| • | the concession contract can be revised by the Executive Branch. |
50
While the Argentine Congress continues to discuss the project, we are unable to determine if or when it will be approved, nor on which conditions it will be approved.
Environmental Regulation
The operations of electricity generation facilities are subject to federal and local environmental laws and regulations, includingLey Nacional No. 24,051 enacted in January 1992, or the Hazardous Waste Law, and its implementing decree, Decree No. 831/1993, which regulate the disposal of hazardous waste in Argentina.
Pursuant to the terms and conditions established by the Argentine government for the concession relating to El Chocón’s hydroelectric facilities and the sale of Costanera, El Chocón and Costanera must comply with certain reporting and monitoring obligations and emission standards. The failure by El Chocón and Costanera to comply with these requirements and federal and local environmental legislation entitles the Argentine government to impose penalties, and in certain cases, cancel the concession agreement of El Chocón or order the suspension of operations of Costanera. Costanera and El Chocón have filed reports pursuant to the Hazardous Waste Law and its implementing decree, Decree 831/1993, which regulate the disposal of hazardous waste. El Chocón and Costanera have been classified as “eventual” generators of hazardous waste. Endesa-Chile believes that El Chocón and Costanera are in compliance with all material obligations relating to environmental matters. Pursuant to the regulations established by the Argentine government, Edesur must comply with requirements relating to environmental protection, human health and safety, handling, use and release of hazardous substances, and pollution. We believe that Edesur is in compliance with all material obligations relating to environmental matters, except for Resolution SPA No. 1118/2002 and the related regulations of the Province of Buenos Aires, relating to polychlorated biphenyl (PCB), which has been objected to by administrative proceeding and which has also caused us to file a claim before the Argentine Federal Supreme Court seeking a declaration of unconstitutionality and an injunction, based on our belief that the resolution and regulations, among other things, are contrary to the applicable federal regulatory framework. Edesur complies with the provisions set forth by Federal Law of Minimum Budgets No. 25,670 regarding PCB and is currently in the process of obtaining some necessary environmental permits in the Province of Buenos Aires.
With respect to electromagnetic fields, Edesur complies with the current regulation (Resolution SE No. 77). This compliance was ratified by the Federal Court of the city of La Plata, in the Province of Buenos Aires, which decided that, even as Edesur remains in compliance with the current regulation, it must still avoid causing damage to the public health.
Brazil
Industry Structure
Brazil’s electricity industry is organized into one large interconnected electricity system, which is known as the Sistema Interconectado Nacional (the “Brazilian SIN”), which is comprised of electricity companies in the southern, southeast, central-western, northeast and other parts of the northern regions of Brazil, and several other small, isolated systems.
Generation, transmission, distribution and supply activities are legally separated in Brazil. Non-regulated customers in Brazil are currently those customers who demand 3,000 kW or more annually, though this threshold is under discussion.
Under the present regulatory structure, the electricity industry in Brazil is comprehensively regulated by the União (Union), acting through the Ministry of Mines and Energy, or MME, which has exclusive authority over the electricity sector through its concessionaire and regulatory powers. Regulatory policy for the sector is implemented by the National Agency of Electric Energy, or ANEEL, established pursuant to Law No. 9.427/96. ANEEL is responsible on behalf of the União for, among other things:
| • | granting and supervising concessions on behalf of the União for electricity generation, transmission, trading and distribution, including approval of applications for the setting of tariff rates; | |
| • | supervising and auditing the concessionaire companies; |
51
| • | issuing regulations for the electricity sector; | ||
| • | granting decisions in order to solve, as an administrative matter, the differences among concessionaires, independent producers, consumers and other industry participants; | ||
| • | establishing the criteria to calculate transmission prices; | ||
| • | imposing contractual and regulatory penalties; | ||
| • | implementing public policies (such as low-income program) pointed out by the Federal Government; | ||
| • | establishing the tariff rate for consumers; | ||
| • | managing the process of tariff adjustments; | ||
| • | managing the bidding process for the wholesale of energy; | ||
| • | managing the concession contracts; and | ||
| • | terminating a concession, in those cases contemplated in the law and/or a concession agreement. | ||
Recently privatized electricity companies, including Coelce, have executed concession contracts with ANEEL. Planning functions were executed by two executive committees coordinated by Eletrobrás (the federally-owned electric utility company), the Grupo Coordenador de Planejamento dos Sistemas, or the GCPS, and the Grupo Coordenador de Operações Interligadas, or the GCOI, which include representatives of each of the major concessionaires.
As of March 1999, pursuant to the terms of Law No. 9,648/98, the GCOI’s coordination and supervisory role over the generation and transmission of energy in the interconnected systems has been transferred to theOperador Nacional do Sistema Elétrico, or the ONS, which is a nonprofit private entity in which the concession holders and the unregulated consumers participate as members with voting rights and the Ministry of Mines and Energy and the board of consumers participate as members with no voting rights. The ONS is responsible for:
| • | the planning and coordination of the operations and dispatch of electricity in order to optimize the electricity produced in the interconnected systems; | |
| • | the supervision and coordination of the operation centers of the electricity systems; and | |
| • | the definition of rules for the transmission of energy in the interconnected systems. |
Law No. 8,631 (1993) fundamentally changed the regulatory structure governing electricity rates in Brazil. This law abolished utilities’ guaranteed annual real rate of return (“Guaranteed Return”) and the system of uniformity of electricity rates throughout the country. This law called for automatic inflation tariff adjustments according to a complex multivariable parametric formula. Law No. 8,631 (1993) established that electricity tariffs were expected to reflect the operating costs of each company plus a certain return on capital, which is not a predefined return, but instead it is obtained through a financial/economic equilibrium.
In December 1994, the Brazilian government introduced the “Real Plan.” Specifically in the electricity industry, the Real Plan superseded previous rate setting laws. Under the Real Plan, rate increases for public utilities due to inflation are no longer granted automatically. In an attempt to curtail inflation, the Real Plan prohibited price adjustments for periods of less than one year in any and all contracts. Under the Real Plan, prices are reviewed and corrected on an annual basis.
Deregulation
Brazil’s concessions regulations were replaced by two statutes enacted in 1995, Law No. 8,987 of February 13, 1995 (the “Concessions Law”), and Law No. 9,074 of July 7, 1995 (the “Power Sector Law”). The Concessions Law and the Power Sector Law gave rise to substantial changes in both the regulations for public service concessions and the rule for renewal and approval of concessions. The objectives of these laws with respect to the electricity sector include the injection of competition into what had been a government monopoly, the infusion of private capital into the sector, the creation of incentives to complete projects on which work was suspended or delayed due to financial and macroeconomic difficulties and the laying of the groundwork for privatizations in the sector.
52
Independent Power Producers and Self-Producers
The Power Sector Law also introduced the concept of the independent power producers, or IPP, as a further factor in opening up the electricity sector to private investment. The Power Sector Law provides for the formation of consortia to generate power for public utilities, for use by consortium members, for independent power production or for any one or more of these, in each case governed by applicable rules. Self-producers (producers who generate power primarily for their own use) may:
| • | contribute or exchange energy with other self-producers within a consortium; | |
| • | sell excess energy to the local distribution concessionaire; or | |
| • | exchange energy with the local distribution concessionaire to allow for consumption by industrial plants owned by the self-producer and located somewhere other than in the area of generation. |
Decree No. 2,003 (of 1996) sets forth the regulatory framework for IPPs and self-producers. Pursuant to such decree, the development of hydroelectric power plants by an IPP or a self-producer requires a concession (awarded following a bidding process) only when the project will generate power in excess of 1 MW in the case of an IPP and 10 MW in the case of a self-producer. In all other cases, including development of thermoelectric plants, the IPP or self-producer is only required to obtain authorization from, or to register with, ANEEL. Decree No. 2,003 also provides that concessions and authorizations granted thereunder have terms of 35 and 30 years, respectively, with the possibility of extensions for periods equal to the initial terms.
As part of the former federal government’s attempt to abolish the monopolies enjoyed by most power companies, the Concessions Law also provides that, upon receiving a concession, IPPs, self-producers, suppliers and consumers will be permitted access to the distribution and transmission systems of all concessionaires, provided that the concessionaires are reimbursed for their related costs. The basis on which such costs will be reimbursed has been determined by ANEEL.
The power industry was reviewed by the Cardoso administration and was subject to additional significant changes, including, but not limited to, restructuring and privatization of assets owned by the Federal Government of Brazil in addition to those which were already privatized (mostly in distribution area). Such changes attempt to result in the creation of a more competitive electricity industry.
The former federal government requested recommendations from independent consultants for a restructuring regime in anticipation of the privatization of the Brazilian electricity sector. Such recommendations were contemplated by Law No. 9,648/98 whereby the federal government has determined the creation of a Wholesale Energy Market formed by the generation and distribution companies. The price offered at the Wholesale Energy Market for energy contracts is determined according to market conditions, and therefore the spot price derived from the operation of the market system is independent of the contractual relationships of the agents. According to this model, the purchase and sale of electricity was going to be negotiated freely. However, in order to facilitate the transition to this competitive model, the contracts already in effect at the time of the creation of the Wholesale Energy Market called “Initial Contracts” were to remain in effect until 2002 and afterward be reduced annually at the rate of 25%. The first bundle of energy was liberalized in January 1, 2003, previously having been auctioned among generation companies in September 2002. The auction had little success, with only 33% of the energy offered successfully auctioned. The lack of interest was due in part to the decline in energy demand in Brazil and in part to consumption pattern changes after rationing, whereby consumers continue to save energy as they were legally required to do during the rationing period.
53
Former President Cardoso announced a significant restructuring of the Brazilian power industry. Pursuant to Law No. 10,433, dated April 24, 2002, the Wholesale Energy Market structure changed to be closely regulated and monitored by ANEEL. As a result of Law No. 10,433, ANEEL will be responsible for setting Wholesale Energy Market governance rules. Under the former regime, such rules were primarily established by the market players, subject only to ANEEL’s ratification. This restructuring seeks to reorganize the electricity system model to allow for continued external investment. The new Law (No. 10,848/04) of the electricity sector has maintained this restructuring. Nevertheless, this law has revoked Law N. 10,433/02 and replaced the Wholesale of Energy Market (MAE) with the Chamber of Commercialization of Energy – CCEE, which is now responsible for the activities of MAE. According to the new model, ANEEL continues to be responsible for setting governance rules for CCEE (ex-MAE).
On April 26, 2002, former President Cardoso issued another relevant rule to the sector (Law No. 10,438), with the objective of recovering revenues lost due to the rationing decree which occurred between June 2001 and February 2002, expanding the emergency energy supply and increasing the alternative energy sources and producing modifications of some important rules to the electricity sector.
During its first year in office, the government of President Luiz Inácio Lula da Silva recognized that Cardoso’s regulatory regime had not been successful in stimulating growth in the electricity generation industry or with respect to the maintenance of low tariffs. As a result, in February 2003, the Ministry of Mines and Energy created a committee to work on institutional reform. The committee published a “Proposal of an Institutional Model for the Electricity Sector.” The basic guidelines or goals of this proposal, which were approved by the CNPE (Resolution No. 5, July 21, 2003), consist of:
| • | maintaining the public service concept for the production and distribution of the electricity to consumers within our concession area; | |
| • | restructuring the system planning; | |
| • | transparency in the auction and bidding process for public projects; | |
| • | mitigating the systemic risks; | |
| • | maintaining centralized and coordinated operations of the Brazilian energy system; | |
| • | granting universal use and access to electricity services throughout Brazil; and | |
| • | modify the bidding process of public service concessions. |
Contract Level Rule
Following the enactment of Law N° 10,848/04 in 2004, the demand from distribution companies must now be contracted completely.
Intercompany Contracts Approval
ANEEL approval is required for related company contracts. The contracts between companies of the Enersis Group, Cerj-CIEN, Coelce-CIEN, Coelce-Synapsys, Cerj-Synapsis and Cerj-CAM were approved by ANEEL.
The modifications to the contract between Cerj and Enertrade (subsidiary of Electricidad de Portugal EDP and a shareholder of Cerj) determined by ANEEL are being questioned in court by Enertrade.
Structure of the New Electricity Sector
As expected, the power industry was reviewed by Luiz Inácio Lula da Silva´s administration and it was subject to significant changes. The federal Laws No. 10,847 and 10,848 of March 2004 established a new model for the Brazilian electricity sector. The new model seeks to provide cheaper tariffs for consumers and guarantee the expansion of the system, with the EPE (Power Research Company), a governmental body, responsible for the planning of generation and transmission activities. This new model has defined two contracting environments: the free contracting and the regulated environment.
54
In the free contracting environment the conditions for purchasing energy are negotiable between suppliers and their customers, maintaining essentially the same characteristics as the old model. In relation to the regulated environment, where energy distributors operate, the new model has introduced significant changes. Whereas the old model allowed self-dealing and allowed distributors to conduct their own auctions for their energy purchases, under the new model the purchase of energy in the regulated environment must be executed pursuant to the bidding process coordinated by ANEEL.
The new Brazilian model for the electricity sector creates a regulatory framework based on the principle of stability and low tariffs for consumers. It also seeks to guarantee the expansion of installed capacity to satisfy demand growth. Pursuant to this model, 100 % of the energy demand of distributors must be satisfied through long-term contracts. Accordingly, several bidding processes have been and will be called by ANEEL and the Chamber of Energy Sales in advance of the expiration of current contracts in the regulated environment.
In the unregulated environment, participants may negotiate price, indexing, tenor of the contracts and energy volume.
Another change imposed on the electricity sector is the separation of the bidding process for “existing power” and “new project power”.Power plants that were in existence prior to 2000 are considered “existing power” and those that were developed after 2000 are considered “new power project”.Cachoeira Dourada and CIEN are considered existing powers.The government believes that existing power plants are able to provide power at more competitive prices, and therefore it should give priority in the bidding process to power generated by new project power companies. Under the new electricity sector, this priority will be in the form of more favorable contractual terms. For example, a generator considered a new project power is guaranteed a power purchase agreement with a twenty-year term if it wins the bidding process, while an existing power is not necessarily even guaranteed participation in the bidding process. Brazil has an excess supply of energy, and therefore existing power generators are adversely affected by the priority given to the new project power.
Additionally, the new model forces the creation of new sector agents, likeEmpresa de Pesquisa Energética (Power Research Company), or EPE, bound to Ministry of Mines and Energy. EPE will have the objective of researching the Brazilian Power Sector Planning. Other new sector agents will be theCámara de Comercialização de Energia Elétrica (Power Commercialization Chamber), or CCEE, which will be the MAE’s substitute in contract administration and monitoring contractual warranties; andComitê de Monitoramento do Setor Elétrico (Monitoring Committee of the Electricity Sector) or CMSE, which will monitor and evaluate the safety and security in the energy supply industry.
Moreover, the new model has establishedthe separation of the sector activities by forbidding distribution companies to participate in generation and transmission activities and in other companies. This prohibition on vertical and horizontal integration in the electricity sector affects Cerj’s generation activities and its ownership in Coelce through Investluz. However, Cerj is in the process of adjusting its structure to comply with this new requirement by separating its generation assets, as well as its ownership of Coelce, another distribution company.
Finally, the contracts in effect at the time of the enactment of the law will be respected, but amendments changing term, price and quantities to the mentioned contracts is forbidden.
Distribution Pricing
The Concessions Law establishes three kinds of revisions related to the energy supply to final consumers. These are: Annual Tariff Resetting, Ordinary Tariff Revision and Extraordinary Tariff Revisions.
Annual Tariff Resetting
Distribution company pricing during a first period that ends in 2003 aims to maintain constant a concessionaire’s operating margins by:
55
| • | allowing for tariff increases related to costs beyond management’s control; and | |
| • | permitting the concessionaire to retain any efficiencies achieved, such as energy loss reductions, for defined periods of time, beyond which such efficiencies are expected to be transferred to the final consumer. |
The tariff formula presupposes that the company is breaking even at the time that it was purchased by the consortium and that revenues are exactly sufficient to cover the costs of the concessionaire. Costs are divided into two broad categories: those over which management has an influence, such as wages, or VPB, and those over which management does not have an influence, or VPA. Since the tariff formula presupposes a break-even equilibrium, VPB costs, in contrast, are defined as the difference between revenues and VPA costs. In practice, the financial losses which result from increases between tariff settings of the VPA costs were at first difficult to transfer to final distribution tariffs. The problem has been partially solved with the creation of a compensatory tracking account. Resolution No. 361/04 of the MME (Ministry of Mines and Energy) and the Ministry of Fazenda (Ministry of Economics) established that not only should the tariff charges be compensated but also the cost of purchasing energy. Nevertheless, an amendment to the concession contract must be signed in order to realize this compensation. The tariff adjustment formula that applies to Cerj for the first seven years since its purchase keeps VPA costs as actually incurred, indexes VPB by inflation, and divides the sum of those two components for the following year by annual revenues for the previous year, assuming constant demand in each year. The established convention for “annual revenues” is the aggregate of the last 12 months’ revenues as accounted for in the company’s books. Every year within a tariff-setting period, the parameters of the formula are updated to arrive at break-even equilibrium for the previous year. Application of this tariff formula to Cerj resulted in a nominal local currency increase of 24.0% for the 1999-2000 period, 17.6% for 2001, 18.6% as of January 2002, 28.6% as of January 2003 and 16.5% as of December 2004.
For Coelce, the tariff adjustments in nominal local currency were 10.6% for 1997, 11.4% for 1999, 11.3% in 2000, 15.0% for 2001 and 14.3% for 2002. In 2003, Coelce and Cerj had their first ordinary tariff revision, explained below. For 2004 the tariff adjustment was 11.1%.
Ordinary Tariff Revision
A tariff revision is different than a tariff resetting because a tariff revision takes into account the entire tariff setting structure of the company, including the costs of providing services, the costs of purchasing energy and the remuneration of the investor, which occurs every four years for Coelce and every five years for Cerj, according to their concession contracts. During 2002, the ANEEL established, through Resolution No. 493, a methodology to determine the asset base to be remunerated. This asset base consists of the market value of the assets or the replacement value of the depreciated assets during their useful life from an accounting point of view.
During 2003, ANEEL set the rate of return for the distribution assets based on the use of weighted average cost of capital, or WACC, on a model company, considering efficient capital costs of equity, debt and an efficient leverage level. The operating and maintenance costs that are reflected in the tariff are calculated based on the model company that considers the unique characteristics of the concession area for each distributor.
Coelce had its first ordinary tariff revision adjustment on April 22, 2003, resulting in an increase of 31.3%. Cerj had its first ordinary tariff revision adjustment on December 31, 2003, resulting in an increase of 15.5%.
These ordinary tariff revisions were provisional, as the final value recognized for the basis of the definitive compensation and the quota of regulatory reintegration still needed to be determined. For Coelce, we expect this pending issue to be resolved in the second quarter of 2005. However, in relation to Cerj, the recalculation occurred in December 2004 and the ordinary tariff revision decreased from 15.5% to 13.9%. As a result of this reduction of the ordinary tariff revision, which is included in the annual tariff resetting, the net increase of the tariff was 14.8% instead of 16.5%.
56
Extraordinary Tariff Revision
The Concessions Law guarantees an economic and financial equilibrium for a company in the event that there is a substantial change in its operating cost.
In the event that VPA, the cost components over which management does not exert influence (such as energy purchases and taxes) increases significantly within the period between two annual tariff adjustments and the concessionaire makes a formal request, ANEEL may permit those costs in the tariff to be charged by the distribution company to be adjusted.
Concessions
Under the current Brazilian Concessions Law, concessions are exclusive with respect to generation, transmission and distribution assets that, in the opinion of ANEEL, will permit the concessionaire to recover its investment. However, trading is permitted subject to payment of tolls. Such time period is limited to 35 years in the case of concessions for power generation and 30 years in the case of concessions for transmission or distribution. Concessions may be renewed at the discretion of ANEEL for a period equal to their initial term. Concessionaires may apply for further extensions, but the terms under which such extensions may be granted in cases in which the concessionaires may be deemed to have recovered their investments are unclear under the Concessions Law.
The consortium and the company that were awarded controlling interests in Cerj and Coelce, respectively, signed 30-year concession agreements with the Brazilian government for distribution on November 20, 1996 and May 13, 1998, respectively. The two concession agreements establish the norms applicable for operations, marketing and purchase of electricity from generation companies. They also impose certain restrictions on investments to be carried out and require Cerj and Coelce to participate in certain studies. The concession agreements establish a mathematical formula for tariffs, taking into consideration the rights and responsibilities of both the concessionaire and ANEEL. Subject to the terms of the concession agreements, ANEEL has substantial discretion to set Cerj’s and Coelce’s tariffs beginning in 2003.
Concessions for the operation of electrical distribution networks in each concession area are granted by the MME on an exclusive basis, with the exception that large users are free to negotiate their supply of electricity with any generating company, in accordance with Articles 15 and 16 of Law No. 9,074 (1995). Cerj and Coelce are required to supply electricity for public services at the established prices, on a continuous basis, in sufficient quantity and within certain standards of quality. The concessions may be revoked by the MME in the event of non-compliance with certain commercial, operating and quality standards. The concession agreements also provide for ANEEL to levy fines and penalties in the event of non-compliance as previously defined in each concession agreement.
Cachoeira Dourada also executed a 30-year generation concession agreement with the Brazilian government as of September 30, 1997.
If a concession is revoked, all the property and the facilities used in connection with the concession revert to the federal government against payment of compensation to the electricity utility. Until the end of 2010, electricity utilities are required to make monthly contributions to theReserva Global de Reversão, or RGR, a reserve fund designed to provide funds for such compensation to such utilities. As disposed on ANEEL´s Resolution 23/99 the monthly contributions are at an annual rate equal to 2.5% of Revertible Assets. The amount of contributions is capped at an amount equal to 3% of total revenues. If a concession is revoked or not renewed, the electricity utility is entitled to receive compensation from the reserve fund in an amount equal to the value of its Revertible Assets as stated on its balance sheet.
Environmental Regulation
The Brazilian Constitution gives both the federal and state governments power to enact laws designed to protect the environment and to issue regulations under such laws. While the federal government has power to promulgate environmental regulations, state governments have the power to enact more stringent environmental regulations. Most of the environmental regulations in Brazil are thus at the State and local level rather than at the level of the federal government. We are currently in the process of obtaining necessary environmental permits for our subsidiaries operating in Brazil.
57
In Brazil, hydroelectric generation companies are required to obtain the use of water concessions and environmental approvals, and thermal electricity generation, transmission and distribution companies are required to obtain environmental approvals from ANEEL and the environmental regulatory authorities.
Recent Changes in the Tax Law
Recent tax changes may affect results of Brazilian operations. On December 29, 2003 the Federal Government issued Law No. 10,833/03. Under the new methodology, the tax rate increases from 3.6% to 9.3% of gross revenues, but permits the compensation of some costs through tax credits. This changes the previous tax regime, and CIEN revenues arising from long-term agreements will now be impacted by this new legal framework. For 2004, CIEN will have to pay an additional R$ 28 million. Cachoeira Dourada is not affected by this new tax regime, since Cachoeira Dourada is subject to the presumed income tax regime.
Another relevant change in tax legislation was Law No. 10, 865/04 (conversion of Provisional Measure 164/04), which creates a tax to be applied to imports of movable assets, the “Imports PIS/COFINS”, effective as of May 2004. This new rule follows the general terms and conditions of Law No. 10.833/03 and also foresees the possibility of a tax credit. The tax rate for “Imports PIS/COFINS” is 9.25% (7.6% of COFINS and 1.65% of PIS). Cachoeira Dourada is not involved in the import of goods and services and therefore is not subject to this tax regime. However, CIEN’s main activity is the import of electricity from Argentina and therefore it could be affected by this new legislation. We cannot determine at this time whether CIEN will be affected by “Imports PIS/COFINS”, since CIEN´s import activity is very specific and unique. A group of electricity import companies intends to propose changes to the legislation in order to clarify the applicability of Law No. 10,865/04 to import operations such as those conducted by CIEN.
Colombia
Industry Structure
The Colombian constitution provides that the government has a duty to ensure that public services are made available in an efficient manner to all of the country’s inhabitants.Ley No. 142 of 1994, or Law 142, provides the broad regulatory framework for the provision of residential public services, including electricity, andLey No. 143 of 1994, or the Colombian Electricity Law, provides the regulatory framework for the generation, trading, transmission and distribution of energy.
Law 142 establishes that the provision of electricity services is considered an essential public service that may be provided by public and private sector entities. Among other obligations, public service companies are required to:
| • | ensure continuous and efficient service without monopolistic abuse; | |
| • | facilitate for low-income users access to subsidies granted by the authorities; | |
| • | inform users regarding efficient and safe usage of the services; | |
| • | protect the environment; | |
| • | allow free and indiscriminate access for the transmission and interconnection to the electric network to other public service companies, or to their large users; | |
| • | report the commencement of their activities to the appropriate regulatory commission and the Superintendencia de Servicios Públicos Domiciliarios, or the SSPD; and | |
| • | cooperate with the authorities in the event of an emergency to prevent damage to the users. |
The Colombian Electricity Law sets out the following principles for the electricity industry, which are implemented in the resolutions promulgated by theComisión de Regulación de Energía y Gas, or CREG, and other regulatory bodies governing the electricity sector such as the Ministry of Mines and Energy and the SSPD:
58
| • | efficiency (correct allocation and utilization of resources and the supply of electricity at minimum cost); | |
| • | quality (compliance with the technical requirements established in regulations affecting the sector); | |
| • | continuity (a continuous electricity supply without unjustified interruptions); | |
| • | adaptability (the incorporation of modern technology and administrative systems to promote quality and efficiency); | |
| • | neutrality (the impartial treatment of all electricity consumers); | |
| • | solidarity (the provision of funds by higher-income consumers to subsidize the subsistence consumption of lower income consumers); and | |
| • | equity (an adequate and non-discriminatory supply of electricity to all regions and sectors of the country). |
Prior to the passage of the Colombian Electricity Law, the Colombian electricity sector was extensively vertically integrated. The Colombian Electricity Law separately regulates generation, transmission, trading and distribution hereinafter referred to as the Activities and, individually, as Activity. Under this law, any company, domestic or foreign, may undertake any of the Activities. New companies, however, must engage exclusively in one of the Activities. Trading can be combined with either generation or distribution. Companies which were vertically integrated at the time Law 143 became effective may continue to engage in all the Activities in which they were engaged prior to the effectiveness of Law 143, but must maintain separate accounting records for each Activity.
Pursuant to Resolutions 128 of 1996 and 065 of 1998, effective as of January 1, 2002, the market share of generation companies, traders and distributors will be limited as follows:
| • | a generation company may not own more than 25% of the installed generating capacity in Colombia; | |
| • | a trader may not account for over 25% of the trading activity in the Colombian National Interconnected System, or the Colombian NIS; and | |
| • | a distributor cannot have more than 25% of the distribution activity in the Colombian NIS. |
In order to calculate these limits, the participation of a given company is added with those of other companies of the same corporate group, of parent companies, of affiliates and of subsidiaries. In addition, effective as of January 1, 2002, generation companies may not own more than a 25% interest in a distributor, and vice versa; however, this limitation only applies to individual companies and does not preclude cross-ownership by companies of the same corporate group, nor by its parents, affiliates or subsidiaries. In 1999, CREG issued Resolution 42 which established that no generation company may increase, directly or indirectly, its participation in the Generation Market pursuant to acquisitions or mergers, if the total MW of Net Effective Capacity resulting therefrom exceed the so-called “Capacity Band” as set by CREG.
The Ministry of Mines and Energy defines the government’s policies for the energy sector. Other government entities which play an important role in the electricity industry are:
| • | SSPD, which is in charge of overseeing and inspecting the companies incorporated as public services companies; | |
| • | CREG, which is in charge of regulating the energy and gas sectors; and | |
| • | the Unidad de Planeación Minera y Energética (Mining and Energy Planning Agency), which is in charge of planning the expansion of the generation and transmission network, among other things. |
59
Under the Colombian Electricity Law, CREG is empowered to issue mandatory regulations governing the technical and commercial operation of the sector and the setting of charges for regulated activities. Among such attributions, CREG’s main functions are as follows:
| • | to establish the conditions for the gradual deregulation of the electricity sector toward an open and competitive market; | |
| • | to approve charges for transmission and distribution networks and charges for trading to regulated customers; | |
| • | to establish methodology for calculating and establishing maximum tariffs for supplying the regulated market; | |
| • | to establish the operations’ regulations for the planning and coordination of the operation of Colombian NIS; | |
| • | to regulate monopolies in public service companies when there is no possibility of competition; | |
| • | to establish technical requirements for the quality, reliability and security of supply; | |
| • | to protect customers’ rights; and | |
| • | to define agreements in order to promote energy regulation harmonization between countries directly affected by CAN decision N°536. |
CREG resolutions do not require Congressional approval. Law No. 142 establishes that any CREG resolutions which give rise to a right or obligation on the part of an individual utility may be contested first through arecurso de reposición, an appeal filed with CREG which makes a decision or promulgates an administrative act, requesting reversal, modification or clarification of its decisions or resolutions; and secondly through lawsuits before the administrative courts. Resolutions of a general nature may be directly contested through a lawsuit before an administrative court. CREG also has the authority to resolve disputes between participants in the electricity and gas sectors, at their request, through arbitration, when the dispute refers to the interpretation of operational or commercial rules. In order to supplement the regulations pertaining to CREG’s functioning, in particular the determination of voting mechanisms for decision making, a Presidential Decree was issued, the effect of which is to grant special powers to the Ministry of Mines and Energy. The Ministry of Mines and Energy may settle ties only in the case that ties persist after two consecutive occasions. In August 2004, a Presidential Decree set new mandatory rules for regulatory commissions. These rules require the establishment of a five-year strategic plan that must include an annual agenda, and require commissions to publish draft resolutions with technical, economic and legal support before such resolutions become final.
The generation sector is organized on a competitive basis with generation companies selling their production on the spot market in an energy pool known as the Bolsa de Energía (the “Bolsa”) at the spot price or by long-term private contracts with certain other market participants and non-regulated users at freely negotiated prices. The NIS is the Colombian electricity system formed by the following elements: the generation plants, the interconnection grid, the regional and inter-regional transmission lines, the distribution lines and the electrical loads of the users. Betania and Emgesa are part of the NIS. The spot price is the price paid by the participant in the wholesale market for energy dispatched under the direction of the Centro Nacional de Despacho (“CND”). The hourly spot price paid for energy reflects prices offered by generators in the Bolsa and the respective supply and demand. Generators connected to the NIS also receive a capacity charge provided they meet certain conditions established in the CREG Resolution 116 of 1996 (“Resolution 116”), as amended by Resolution 113 of 1998, Resolutions 47 and 59 of 1999 and Resolutions 77 and 111 of 2000. The capacity charge is calculated pursuant to formulas also included in such Resolutions. In 2004, the government announced that capacity charge will continue beyond 2006, but it will become a Reliability Charge that pays for energy and power separately. Since the creation of the wholesale electricity market in July of 1995, relatively stable amounts of energy have been exchanged between generators and distribution companies, acting in their capacity as traders. Initially, distribution companies were required to enter into contracts to supply 100% of their regulated market, and although this requirement has gradually been reduced, distribution companies have still tended to secure contracts for a large proportion of their regulated market. A new scheme for wholesale trading, the Electronic Contract System, has been proposed by CREG. This system will replace bilateral agreements among agents with standardized contracts including options and futures. CREG’s main objectives for this system, which is expected to become operative in 2005, are to improve price formation and eliminate price discrimination.
60
The purchase and sale of electricity can take place between generators, distributors acting in their capacity as traders, traders (who do not generate or distribute electricity) and unregulated consumers. There are no restrictions limiting new entrants into the market as long as the participants comply with the applicable laws and regulations.
The principal function of the Bolsa is to allow for the sale of excess energy not committed under contracts and for spot sales of electricity. Its operations are similar to the electricity pools which operate in England, Wales and Argentina. In the Bolsa an hourly spot price for all units dispatched is established based on the offer price of the highest priced generating unit dispatched for that period. Every day the CND receives price bids from all the generation companies that participate in the Bolsa. These bids indicate the daily prices at which the generation companies are willing to supply electricity and the hourly available capacity for the following day. Based on this information, the CND following the principle known as “optimal dispatch” (which assumes an infinite transmission capacity through the network) ranks the generators according to their offer price, starting with the lowest bid, thereby establishing on an hourly basis the merit order in which generators would be dispatched in the following day to meet expected demand. The price in the Bolsa for all generators is set by the costliest generator dispatched in each hourly period under the optional dispatch. This price ranking system is intended to ensure that national demand, increased by the total amount of energy exported to other countries, will be satisfied by the lowest cost combination of available generating units in the country. During 2003, international short term electricity transactions were regulated through Resolution CREG 004, which became effective in March 2003 when electricity trading with Ecuador began. Also, the CND performs the “planned dispatch,” which takes into consideration the limitations of the network as well as every other condition necessary to attend energy demands expected for the following day, in a secure, reliable and cost efficient manner. The planned dispatch is revised continuously by the CND in response to any changes affecting the system (e.g., demand, actual plant availability, system restrictions, etc.) that may take place throughout the day.
Differences among real dispatch and “optimal dispatch” give rise to what is known as “restrictions,” which are settled for each generation company in the following way: restricted generation companies (those whose real generation is lower than the required dispatch) are charged with the difference, appraised at its offer price; and out-of-merit generation companies (those whose real generation is greater than the required dispatch) are credited with the difference, also appraised at its offer price. The net value of these restrictions are assigned proportionally to all the traders within the Colombian NIS, according to their demands of energy. The attacks by guerrillas on the transmission infrastructure gave rise to a significant increase in restrictions, which in turn gave rise to claims from users given the subsequent increase of tariffs. This situation forced CREG to issue Resolution 34 (2001) and some other amending resolutions, in order to intervene in the settlement of the restrictions, in such a manner that for the restricted generation companies, the difference is appraised with the sum of the offer price and the spot price divided by two. The out-of-merit generation companies have a maximum cap on the recognized price (i.e. on the credit they can receive for their supplemental generation). This resolution, which is still in force, despite the fact that it had been announced as a temporary measure, has been challenged, and, in certain cases, has resulted in legal proceedings initiated by the thermal generation companies, who consider that the recognized prices do not cover the costs associated with these restrictions.
The dominance of hydroelectric generation and the marked seasonal variations in Colombia’s hydrology result in a high degree of price volatility in the Bolsa. In order to enhance predictability and mitigate the volatility of spot sale prices, CREG introduced a new firm capacity charge pursuant to Resolution 116 (the “Capacity Charge”), effective as of December 1, 1997, amended by Resolution 113 of 1998, Resolutions 47 and 59 of 1999 and Resolutions 77 and 111 of 2000. The Capacity Charge is a fixed monthly charge intended to be equivalent to the capital costs of an open-cycle gas turbine. The Capacity Charge remunerates generators for the firm capacity made available to the SIN in periods of critical hydrology. Generators receive the Capacity Charge payment regardless of actual plant dispatch, provided that their declared availability exceeds certain limits and that they meet other conditions set forth in Resolution 116, as amended. The Capacity Charge provides generators with a source of fixed revenue which is dependent primarily on the generator’s own firm energy. The CND can verify a generator’s declared availability and the SSPD can impose sanctions if the actual availability is lower than the declared availability. If a generator’s availability is less than the minimum limit, the generator does not receive the total amount of the Capacity Charge.
61
If a generator’s availability is less than the minimum limit during the dry season, between December 1 and April 30 of each year, the generator only receives the Capacity Charge equivalent to its actual availability. Also, the minimum limit for the rainy season (between May 1 and November 30 of each year) is determined by the lowest value between the minimum limit and the average actual availability during the dry season. In 2000, Resolution 077 and 111 modified the calculation of the Capacity Charge for generation companies, shifting the balance in favor of thermal generation companies over hydroelectric generation companies. The Capacity Charge of a given power plant is calculated on the basis of the firm energy that could be supplied during a period of drought assuming hydrological conditions that prevailed during the “El Niño” phenomenon that occurred between 1991 and 1992. Pursuant to Resolution 077 and 111 (2000) the capacity charge of a given power plant is calculated on the basis of the firm energy that could be supplied during a hypothetical period that assumes the most severe hydrological conditions.
Transmission companies (defined as those that operate networks of voltages of at least 220 kV, which in turn make up the National Transmission System, or NTS) are required to provide third-party access to the transmission system under equal conditions and are authorized to collect a tariff for transmission services. If the parties do not agree upon the conditions of such access, CREG is entitled to impose an easement of access. The transmission tariff that must be paid by generation companies, distribution companies and traders is composed of:
| • | a connection charge that underwrites the cost of operating the equipment that links the user to the transmission system, which is not charged if the generation or distribution company is the owner of the connecting equipment; and | |
| • | a usage charge, applicable only to traders, effective January 1, 2002. |
The NTS regulates income for transmission companies by means of a guaranteed annual fixed income, subject to the compliance of certain minimum availability, which is determined by the new replacement value of the networks and equipment existing as of January 1, 2000, and in the case of new projects, by the resulting value of the bidding processes awarded for the expansion of the NTS. Until 2001, the monthly value required in order to compensate transmission companies within the NTS was allocated as follows: 25% for generation companies and 75% for NTS traders. Effective January 1, 2002, such value has been allocated 100% among the traders of the NTS in proportion to the energy demand registered by all of its clients.
According to CREG Resolution 51/98, with the exception ofInterconexión Eléctrica S.A. E.S.P.(the government-owned transmission company), no company or real beneficiary (i.e. one who benefits substantially from the contracts of the Public Service Companies, SSPD and CREG) can own more than 25% of the NTS. Pursuant to Resolution 51/98, the CREG issued Resolution 004/99 which established that the generation companies, distributors, traders and companies that are vertically integrated and carry on these activities simultaneously cannot own more than 15% of the social capital of an existing or future national transmission company or otherwise control or be under common control with such a company.
The expansion of the NTS is carried out according to model expansion plans designed byUnidad Planeación Minero-Energética, or UPME, and pursuant to bidding processes opened to existing transmission companies and new companies whose sole purpose is the transmission of power, which are handled by the Ministry of Mines and Energy following the guidelines set forth in CREG Resolutions 51 of 1998 and 004 of 1999. According to such Resolutions, the construction, operation and maintenance of new projects is awarded to the Company that demands the lowest present value of cash flows needed for carrying out the project. CREG has enacted subsequent resolutions which modify and replace CREG 051 of 1998 by improving the plan of expansion of STN but conserving the same conceptual framework.
62
| Distribution |
Distribution is defined as the operation of local networks at below 220 kV. Any user may have access to a distribution network provided the user pays a connection charge. CREG regulates distribution prices and operations. Distribution prices should permit distribution companies to recover their reasonable costs, including operating, maintenance and capital costs. The use of the system charges, or DUOS charges, for each company is approved by CREG and varies depending on the voltage level.
In June 1998, CREG issued Resolution 70 (1998), also known as the Distribution Code. The latter determined maximum limits on the frequency and duration of service disruptions to distribution company users. ThisResolution, as amended, compels companies to compensate users who suffer disruptions that exceed these maximum limits, valuing energy not delivered at the rationing cost. A new stringent compensation scheme is scheduled to start operating in 2005, which differs from the actual scheme in that it creates higher quality standards for urban customers and new compensation charges discriminated by user type (i.e. industrial, commercial or residential). Although the final regulation is under discussion, it is expected that the new scheme will require more network investments and higher cash compensations. In December 2002, CREG enacted Resolution No. 082, which determines the compensation for distribution activities for a five-year period ending December 2007. Although the general conception for distribution compensation is based on an asset’s replacement cost, particular methodologies were used depending on asset operating voltage. In 2005, CREG will review the capital cost (WACC) applicable to calculate distribution charges, as established by Resolution No. 13 of 2002. The cost of capital included in the current calculation is 16.1% for assets in voltage levels up to 62 kV and 14.1% for assets between 62 kV and 220 kV. Nevertheless, we cannot estimate the possible effects of the mentioned revision.
During 2003, CREG approved distribution tariffs for all companies based on Resolution 082. Resolutions 071 and 072 involving Codensa´s distribution business were approved on August 2003. These regulations became fully operative by October 2003, resulting in a tariff improvement of approximately 15%. Codensa formally presented to CREG a proposal to revise the distribution tariffs approved in Resolutions 071 and 072 because of a mistake in the averaging of the company’s urban rural customer-based composition. Codensa argued that these approved tariffs did not take into account Bogota’s high underground network component built in compliance with municipal regulations. Codensa’s arguments were accepted by CREG, which, under Resolution No. 065 released in October 2004, reviewed Codensa’s rural urban composition and included Bogota’s underground network component. As a result Codensa’s distribution tariffs were increased by 4.4%.
| Trading |
Trading is the resale directly to end users of electricity purchased in the wholesale market and may be conducted by generators, distributors or independent agents which must comply with the requirements of CREG. The parties freely agree upon trading prices for deregulated users. Trading to regulated users is subject to a “regulated freedom regime” where the tariffs are set by each trader using the tariff options based on a formula established by CREG in Resolution 31 (1997) for the 5-year period ending on December 31, 2002; and individual trading costs approved by CREG for each trader.
The approved costs are maximum costs. Thus the traders may set tariffs applying lower costs supported by economic reasons, duly evidenced. Tariffs include, among other things, the costs for the purchase of electricity by the trader, transmission charges, distribution charges and a margin to cover the risks of the activity and the return on the investment.
Because CREG did not decide on the new tariff formula to be applied in the next tariff period, the current methodology remained in effect for 2004. It is expected that the new tariff formula, the regulated margin for trading activities and the conditions of competition of the industry will be determined by the CREG during 2005.
It is expected that the elements in retail trading regulation that grant artificial competitive advantages to independent traders will be corrected by the new retail trading scheme. The bulk of National Development Plan regulation regarding the electric retail business is published in decree 3734, published by the Ministry of Mines in December 2003. Under this decree, independent traders are forced to have the same market composition, in terms of average energy consumption per customer, as the established trading and distribution company. This decree also imposes an obligation to recognize costs associated with being the last resort supplier. As presented before, at a wholesale level, the new long-term energy supply scheme -SEC- is expected to become fully operative in 2005.
63
| Environmental Regulation |
Law No. 99 of 1993 provides the legal framework for environmental regulation and, among other things, created the Ministry of the Environment as the authority for establishing environmental policies. Since 1993, Colombia has experienced a significant expansion in its environmental regulations. Of particular importance is Law No. 99 of 1993, which created the Ministry of the Environment as the supervisory governmental authority in this field, with a specific focus on the definition, issuance and execution of policies and regulations seeking the recuperation, conservation, protection, organization, administration and use of renewable resources. Thus, the use of natural resources or any impact to them as a result of any activity or project will require the issuance of permits and environmental licenses or the establishment of environmental management plans. The law places particular attention on environmental impact prevention by entities in the energy sector. Any such entity planning to undertake projects or activities relating to generation, interconnection, transmission or distribution of electricity which may result in environmental deterioration, must first obtain an environmental license.
| Inspection and Control |
According to the National Constitution and the Public Utilities Law, the Superintendency of Public Utilities exercises supervision of public services companies involved in the aforementioned electricity activities. In 2003, the Superintendency of Public Utilities implemented a central information system in order to consolidate all the information of public utilities for both control and information purposes.
Peru
| Industry Structure |
The regulatory framework for the electricity industry in Peru was modeled after the regulatory framework in Chile. Its main regulations are: Law of Electrical Concessions (Law Decree No. 25,844) and its regulation (Supreme Decree No. 009-93 EM), Technical Regulation on the Quality of the Electrical Supply (Supreme Decree No. 020-97 EM), Antitrust Law on the Electrical Sector (Law No. 26,876) and its regulation (Supreme Decree No. 017-98-ITINCI), Law No. 26,734 which created the regime that supervises Investments in Energy and its Regulation (Decree No. 54-2001 PCM), in addition to the supplementary Law 27,699 ofOrganismo Supervisor de la Inversión en Energía,or OSINERG (the Peruvian regulatory electricity authority), and the regulation for resolution of controversies that arise within this institution (Resolution No. 0826-2002-OS/CD).
Some of the most important characteristics of the regulatory framework for the electricity industry in Peru are: (i) vertical disintegration, or separation of the three main activities: generation, transmission and distribution; (ii) freedom of prices for the supply of energy in competitive markets, and a system of regulated prices based on the principle of efficiency (correct allocation and utilization of resources and the supply of electricity at minimum costs); and (iii) private operation of the interconnected electricity systems subject to the principles of efficiency and service quality (compliance with the technical requirements established in regulations affecting the sector).
The electricity sector in Peru consists of one interconnected system, theSistema Eléctrico Interconectado Nacional, or the SEIN, plus several isolated regional and smaller systems which provide electricity to rural areas. In Peru, theMinisterio de Energía y Minas, or the Ministry of Energy and Mines, defines energy sector policies, and regulates matters relating to the environment, and the granting, supervision, maturity and termination of licenses and concessions for generation, transmission, and distribution activities, among others. OSINERG is an autonomous public regulatory entity established in 1996 to control the compliance with legal and technical regulations related to electrical and hydrocarbon activities, as well as the conservation of the environment in connection with the development of these activities. One of OSINERG’s functions is the publication of the regulated tariffs. TheComité de Operación Económica del Sistema, or the COES, coordinates the dispatch of electricity of Peru’s SEIN in a manner similar to the CDECs in Chile and prepares the technical and financial study that serves as a basis for the semi-annual node tariff calculations.
As of October 1997, there are established technical norms against which to compare the quality and conditions of the service provided by electricity companies. As of October 1999, those companies that do not meet the minimum quality standards are subject to fines and penalties imposed by OSINERG, as well as to compensatory mechanisms for those customers who received substandard service.
64
| Dispatch and Pricing |
The dispatch methodology and pricing at the generation level in Peru are virtually identical to the dispatch methodology and pricing in Chile and unregulated customers in Peru are those with demand for capacity of greater than 1 MW. Supplies for demand capacity lower than 1MW are considered a public service supply and served by electricity distribution companies.
Edelnor, as a distribution company is required to supply electricity within its concession area for public service supplies at regulated prices on a continuous basis in sufficient quantity and within certain quality standards. In addition, it is responsible for supplying electricity for public lighting. Until December 22, 1999, electricity provided to non-public service customers was supplied at negotiated prices. Currently, in the case of both electricity sold to the public and private service customers, the transmission and distribution tariffs are regulated by OSINERG.
| Transmission |
At the transmission level in Peru, transmission lines are divided into principal and secondary systems. The principal system lines, all of which form part of the main grid, are accessible to all generation facilities connected to the grid and allow electricity to be carried to all customers. The transmission concessionaire of facilities that form part of the main transmission system receives tariff revenues and connection tolls reflecting a charge determined in accordance with the respective concession agreement. The secondary system lines typically link generation facilities or unregulated customers with the grid.
| Distribution Pricing |
Sales by generation companies to distribution companies of capacity or energy for resale to regulated customers must be made at node prices set by OSINERG. Node prices for capacity and energy have been published every six months, in April and October, and become effective the first day of May and November, respectively; but in 2005, this publication will be made annually, in April of each year, in accordance with a recent amendment to the law. Node prices are the maximum prices for electricity purchased by distribution companies that can be transferred to regulated customers. Although these prices are quoted in Peruvian soles, the calculations are mainly effected in U.S. dollars. Other conditions of distribution pricing are similar to those in Chile.
The electricity tariff for a customer of theServicio Público de Electricidad (regulated clients) includes charges for capacity and energy from generation and transmission (node prices) and from the VAD which considers a regulated return over capital investments, operating and maintenance fixed charges and a standard for energy distribution losses.
Distribution electricity tariffs are set on the basis of voltage levels. Regulated customers have a range of tariff options that allow them to manage the charges based on consumption in peak hours (between 6:00 p.m. and 11:00 p.m.) or non-peak hours (all the remaining hours of the day). However, the majority of the regulated clients of Edelnor are within the tariff category that simply measures the energy consumed without any reference to capacity or division of consumption between peak and non-peak hours (Tarifa BT-5). Regulated customers subject toTarifa BT-5 represented 99.6% of Edelnor’s clients and 45.3% of total sales of electricity during 2002.Unregulated customers can choose to pay for energy consumed or capacity or consumption distinguishing between peak and non-peak hours, or a combination of these factors according to stipulations on their contracts.
| Value Added from Distribution |
Value Added from Distribution (VAD) includes the following distribution costs: (a) general, administrative and selling costs; (b) maintenance and operation costs for distribution equipment; (c) a margin for standard energy and capacity losses; and (d) a return on investment based on the net replacement value (VNR in its Spanish acronym) of the equipment used in distribution. VNR equipment includes costs for renewal of all the installations and equipment used to provide distribution services, including intangible assets and working capital.
65
The process to set the VAD gathers distribution companies in groups hereinafter referred to as Typical Sectors or ST, which are established by The Ministry of Energy and Mines based on factors such as energy consumer density or equipment density in the distribution network. Different efficiency standards are applied depending on the ST.
Based on the efficiency standards obtained from a selected real company, OSINERG chooses a “model company” for purposes of setting the VAD. A given distribution company’s actual return on investment is dependent on its performance relative to the standards chosen by OSINERG for the model company. The tariff system allows for a greater return to distribution companies that are more efficient than the model company.
Once OSINERG has established the performance standards, the distribution companies retain specialized consultants who perform a parallel tariff study subject to OSINERG guidelines. Preliminary tariffs established by OSINERG are tested to ensure that they provide an average real annual internal rate of return between 8% and 16% on the VNR of assets for the entire distribution industry.
Once the component of the VAD for the tariff has been set, it will remain in effect for a period of four years unless the adjustment tariff index has doubled during such period. The VAD index allows adjustments based on variations on node prices and distribution costs, including wages, the wholesale price index for domestic products, aluminum prices, currency exchange rates and import duties. The VAD index is adjusted when the underlying variables in the formula to project the VAD then in effect would result in a variation in excess of 3%. The current VAD component of the tariff was set in November 2001. The next VAD setting is expected for November 2005.
| Concessions |
Concessions for the operation of distribution networks are granted by the Ministry of Energy and Mines. Edelnor holds exclusive concessions to distribute electricity within its concession areas for an indefinite period of time. The concession areas may be expanded by the holder of the concession upon prior notice to the Ministry of Energy and Mines every two years. The concession area may not be reduced without the authorization of the Ministry of Energy and Mines. The concessions may be revoked by the Ministry of Energy and Mines in the event of non-compliance with certain commercial operating and quality standards. Edelnor may give up its concession with one year’s prior notice to the Ministry of Energy and Mines.
A concession for electricity generation activities is required when a hydroelectric or geothermal power plant has an installed capacity in excess of 10 MW while an authorization for electricity generation activities is required when a thermoelectric, hydroelectric or geothermal power plant has an installed capacity in excess of 500 kW.
Neither an authorization nor concession is required for electricity generation activities when the hydroelectric, geothermal or thermoelectric power plant has an installed capacity below 500 kW.
A concession for electricity generation activities constitutes an agreement between the generation company and Ministry of Energy and Mines while an authorization is merely an unilateral permission granted by the ministry. Authorizations and concessions are granted by the ministry under the procedures set forth in the Electricity Concessions Law and its regulations and amendments.
| Environmental Regulation |
In Peru, electricity distribution companies are subject to the general environmental and penal laws which govern environmental matters and to theReglamento de Protección Ambiental de las Actividades Eléctricas, a regulation which specifically governs the protection of the environment by electricity companies and maximizes the emission standards set from time to time by the governmental authority. The regulation establishes a number of requirements that need to be satisfied by electricity companies, including reporting requirements, environmental audits and record-keeping of emissions. Companies that do not comply with the regulation are subject to penalties. The authorities governing environmental matters are theDirección General de Asuntos Ambientales, or the General Office of Environmental Matters, which is dependent on the Ministry of Energy and Mines and OSINERG.
66
Electricity distribution companies that were in operation prior to 1994 are required to have a Programa de Adecuación y Manejo Ambiental, or PAMA, or a set of environmental compliance standards to conduct their operations within the maximum allowed limits for gas and liquid emissions and to comply with environmental regulations. Distribution companies and companies that meet certain minimum standards set by the applicable laws, that began operations after 1994, are required to prepare and obtain the approval by the Ministry of Energy of an environmental impact study that, among others things, meets certain emission limits and other rules applicable to the company.
| Changes to Electricity Law |
TheMinisterio de Energía y Minas(the Ministry of Energy and Mines) announced in recent years its plan with the participation of regulators, customer representatives and electricity operators who are members of theComité de Energía de la Sociedad Nacional de Minería, Petróleo y Energíato discuss the “Reform to the Second Generation of the Electricity Sector” and to set a tentative agenda. However, the reform is advancing at a relatively low speed and only minor changes have been recently approved.
| Other Recent Regulatory Changes |
Article 176 of Electricity Concession Rules and Regulations was modified on March 21, 2003 to establish the maximum interest rate that a distribution company may charge for supplies to regulated consumers that are not paid when due.
Article 180 was also modified on November 13, 2003 to establish the maximum costs of interruption of supply for public service that OSINERG could approve.
On January 5, 2004, Articles 1 and 5 were modified to establish certain OSINERG functions. Pursuant to Article 1 of Law 26,734, OSINERG will regulate and supervise the electricity sector’s compliance with technical and legal regulations on public safety. OSINERG will also inform the appropriate entity or regulator of any violations and sanctions imposed.
Articles N° 36, 46, 47, 50, 51 and 52 of the Electrical Concessions Law were modified on December 30, 2004 by the Law 28,447. The principal changes were:
The node prices will be settled during May of each year.
For the establishment of energy’s node prices, a period of 36 months is considered: 24 future months and 12 historic months.
The projection of the 24 future months considers the offer and demand of foreign interconnections.
A commission was created, which must elaborate a proposed law in 6 months to assure the efficient development of electricity generation by means of the incorporation of market mechanisms.
| C. | Organizational Structure. |
Principal Subsidiaries and Related Companies
The subsidiaries listed in the following table were consolidated by us as of December 31, 2004. Our economic interest is calculated by multiplying our percentage ownership interest in a directly held subsidiary by the percentage ownership interest of any entity in the chain of ownership of such ultimate subsidiary. As of the date of this annual report, the economic ownership interest in Cerj and Coelce have changed as described earlier. All other subsidiaries and related companies have not changed since December 31, 2004.
67
| Consolidated Assets | Operating Income | |||||
| % Economic | of Each | of Each | ||||
| Ownership of | Principal Subsidiary | Principal Subsidiary | ||||
| Principal Subsidiary and | Principal Subsidiary | on a | on a | |||
| Country of Operation | by Enersis | Stand-alone Basis | Stand-alone Basis | |||
| (in billions of Ch $ except percentages) | ||||||
| Electricity Generation | ||||||
| Endesa-Chile (Chile) | 60.0 | % | 5,317.6 | 369.0 | ||
| Electricity Distribution | ||||||
| Chilectra (Chile) | 98.2 | % | 1,076.9 | 97.6 | ||
| Edesur (Argentina) | 65.1 | % | 693.8 | (0.3 | ) | |
| Edelnor (Peru) | 33.4 | % | 342.7 | 27.8 | ||
| Cerj (Brazil) | 80.4 | % | 1,157.5 | 46.8 | ||
| Coelce (Brazil) | 31.2 | % | 725.0 | 4.9 | ||
| Codensa (Colombia) | 21.7 | % | 1,082.5 | 84.4 | ||
| Other Businesses | ||||||
| IMV (Chile) | 100.0 | % | 78.2 | (0.9 | ) | |
| Synapsis (Chile) | 100.0 | % | 23.7 | 6.0 | ||
| CAM (Chile) | 100.0 | % | 66.4 | 9.2 | ||
68
Business and Subsidiaries Description
Enersis controls subsidiaries engaged in the electricity generation and distribution businesses in South America and wholly owns subsidiaries that provide support services to related and unrelated companies. The following chart represents Enersis’ direct and indirect ownership participation in its main operating subsidiaries and affiliates as of December 31, 2004.
69
D. Property, plants and equipment.
Description of Property
In April 2002, Enersis relocated to its new corporate headquarters in Santa Rosa 76, Santiago, Chile, shared with Endesa-Chile (see further below) and Chilectra. Additionally, we own 26 administrative properties in Santiago with a total of 71,454 square meters. Through IMV, we own 21 office buildings and properties in Santiago, a 4-acre property in Viña del Mar and a 55% interest in a 2,030 acre plot of land outside of Santiago.
We also have significant interests or control of investments in electricity distribution companies in Argentina, Brazil, Colombia and Peru, where Enersis maintained a total concession area of over 200,000 square kilometers as of December 31, 2004. The description of each distribution company is included in “Item 4. Information on the Company”. The table set forth hereunder describes Enersis’ main equipment used for its distribution business, such as transmission lines, power and interconnection sub-stations, distribution networks and transformers.
Our distribution facilities are insured, according to international standards, against damage to sub-stations and administration buildings. Risks covered include losses caused by fires, explosions, earthquakes, floods, lightning, damage to machinery and others. Insurance policies include third-party liability clauses, which cover our companies from complaints made by third parties. Transmission lines and the equipment attached to them do not qualify as insurable assets in the standard market.
Endesa-Chile’s main properties in Chile are its 22 electricity generation facilities detailed below in addition to its 27,793 square meter headquarters buildings in Santiago.
Over 95% of Endesa-Chile’s revenues are derived from the sale of electricity produced by its electricity generation facilities. Significant damage to one or more of Endesa-Chile’s main electricity generation facilities or interruption in the production of electricity, whether as a result of an earthquake, flood, volcanic activity or other cause, would have a material adverse effect on Endesa-Chile’s operations. Endesa-Chile insures all of its electricity generation facilities against damage due to earthquakes, fires, floods and other similar occurrences and from damage due to third-party actions, based on the appraised value of the facilities as determined from time to time by an independent appraiser. Based on geological, hydrological and engineering studies, however, Endesa-Chile’s management believes that the risk of such an event is remote. Claims under Endesa-Chile’s insurance policies are subject to customary deductibles and other conditions. Endesa-Chile also maintains business interruption insurance providing for coverage for failure of any of its facilities for a period of up to 18 months, commencing after the deductible period.
Endesa-Chile also has investments in generating companies in Argentina, Brazil, Colombia and Peru, which involve a total of 24 generation facilities detailed below. The insurance coverage taken abroad is approved by the management of each affiliate, taking into account the quality of the insurance companies and the needs, conditions and risk evaluations of each generating facility, and are based on general corporate guidelines given by Endesa-Chile.
All insurance policies are purchased from reputable international insurers. We continuously monitor the insurance industry in order to obtain what we believe to be the most commercially reasonable coverage and premiums available on the market.
The following table identifies the power plants that Endesa-Chile is currently operating and their basic characteristics.
70
Table of Generation Facilities
| Capacity (MW) (1) | Ownership Interest | ||||||||||||||
| Company | Location | Facility Name | Type | 2003 | 2004 | Endesa-Chile | Enersis | ||||||||
| Costanera | Argentina | Costanera steam | Thermoelectric | 1,131 | 1,131 | 64.26 | % | 38.54 | % | ||||||
| Costanera combined | |||||||||||||||
| Costanera | Argentina | cycle | Thermoelectric | 851 | 852 | 64.26 | % | 38.54 | % | ||||||
| Costanera | Argentina | Central Buenos Aires | Thermoelectric | 320 | 320 | 64.26 | % | 38.54 | % | ||||||
| El Chocón | Argentina | Chocón | Hydroelectric | 1,200 | 1,200 | 47.45 | % | 28.46 | % | ||||||
| El Chocón | Argentina | Arroyito | Hydroelectric | 120 | 120 | 47.45 | % | 28.46 | % | ||||||
| Cachoeira Dourada | Brazil | Cachoeira Dourada | Hydroelectric | 658 | 658 | 92.51 | % | 55.49 | % | ||||||
| C. G. T. F. | Brazil | C. G. T. Fortaleza | Thermoelectric | 310 | 319 | 0.00 | % | 48.82 | % | ||||||
| Cerj | Brasil | various small facilities | Hydroelectric | 63 | 62 | 0.00 | % | 71.80 | % | ||||||
| Endesa-Chile | Chile | Rapel | Hydroelectric | 377 | 377 | 100.00 | % | 59.98 | % | ||||||
| Endesa-Chile | Chile | Cipreses | Hydroelectric | 106 | 106 | 100.00 | % | 59.98 | % | ||||||
| Endesa-Chile | Chile | El Toro | Hydroelectric | 450 | 450 | 100.00 | % | 59.98 | % | ||||||
| Endesa-Chile | Chile | Los Molles | Hydroelectric | 18 | 18 | 100.00 | % | 59.98 | % | ||||||
| Endesa-Chile | Chile | Sauzal | Hydroelectric | 90 | 77 | 100.00 | % | 59.98 | % | ||||||
| Endesa-Chile | Chile | Sauzalito (2) | Hydroelectric | 0 | 12 | 100.00 | % | 59.98 | % | ||||||
| Endesa-Chile | Chile | Isla | Hydroelectric | 68 | 68 | 100.00 | % | 59.98 | % | ||||||
| Endesa-Chile | Chile | Antuco | Hydroelectric | 320 | 320 | 100.00 | % | 59.98 | % | ||||||
| Endesa-Chile | Chile | Abanico | Hydroelectric | 136 | 136 | 100.00 | % | 59.98 | % | ||||||
| Endesa-Chile | Chile | Ralco | Hydroelectric | 0 | 690 | 100.00 | % | 59.98 | % | ||||||
| Endesa-Chile | Chile | Huasco steam | Thermoelectric | 16 | 16 | 100.00 | % | 59.98 | % | ||||||
| Endesa-Chile | Chile | Bocamina | Thermoelectric | 128 | 128 | 100.00 | % | 59.98 | % | ||||||
| Endesa-Chile | Chile | Diego de Almagro (3) | Thermoelectric | 24 | 47 | 100.00 | % | 59.98 | % | ||||||
| Endesa-Chile | Chile | Huasco gas turbines | Thermoelectric | 64 | 64 | 100.00 | % | 59.98 | % | ||||||
| Endesa-Chile | Chile | Taltal | Thermoelectric | 243 | 245 | 100.00 | % | 59.98 | % | ||||||
| Pangue | Chile | Pangue | Hydroelectric | 467 | 467 | 94.98 | % | 56.97 | % | ||||||
| Pehuenche | Chile | Pehuenche | Hydroelectric | 566 | 566 | 92.65 | % | 55.57 | % | ||||||
| Pehuenche | Chile | Curillinque | Hydroelectric | 89 | 89 | 92.65 | % | 55.57 | % | ||||||
| Pehuenche | Chile | Loma Alta | Hydroelectric | 40 | 40 | 92.65 | % | 55.57 | % | ||||||
| Celta | Chile | Tarapacá | Thermoelectric | 182 | 182 | 100.00 | % | 59.98 | % | ||||||
| San Isidro | Chile | San Isidro | Thermoelectric | 379 | 379 | 75.00 | % | 44.99 | % | ||||||
| Emgesa | Colombia | Guavío | Hydroelectric | 1,150 | 1,150 | 22.37 | % | 13.42 | % | ||||||
| Emgesa | Colombia | Cadena Nueva | Hydroelectric | 600 | 600 | 22.37 | % | 13.42 | % | ||||||
| Emgesa | Colombia | Termozipa | Thermoelectric | 223 | 223 | 22.37 | % | 13.42 | % | ||||||
| Emgesa | Colombia | Otras | Hydroelectric | 76 | 96 | 22.37 | % | 13.42 | % | ||||||
| Betania | Colombia | Betania | Hydroelectric | 540 | 540 | 85.62 | % | 51.35 | % | ||||||
| Edegel | Perú | Huinco | Hydroelectric | 247 | 247 | 37.90 | % | 22.73 | % | ||||||
| Edegel | Perú | Matucana | Hydroelectric | 129 | 129 | 37.90 | % | 22.73 | % | ||||||
| Edegel | Perú | Callahuanca | Hydroelectric | 75 | 75 | 37.90 | % | 22.73 | % | ||||||
| Edegel | Perú | Moyopampa | Hydroelectric | 65 | 65 | 37.90 | % | 22.73 | % | ||||||
| Edegel | Perú | Huampani | Hydroelectric | 30 | 30 | 37.90 | % | 22.73 | % | ||||||
| Edegel | Perú | Yanango | Hydroelectric | 43 | 43 | 37.90 | % | 22.73 | % | ||||||
| Edegel | Perú | Chimay | Hydroelectric | 151 | 151 | 37.90 | % | 22.73 | % | ||||||
| Edegel | Perú | Santa Rosa | Thermoelectric | 227 | 227 | 37.90 | % | 22.73 | % | ||||||
| TOTAL | Argentina | 3,622 | 3,623 | ||||||||||||
| Brazil | 1,031 | 1,039 | |||||||||||||
| Chile | 3,763 | 4,477 | |||||||||||||
| Colombia | 2,589 | 2,609 | |||||||||||||
| Perú | 967 | 967 | |||||||||||||
| (1) | Total installed capacity defined as the maximum MW capacity of generation units, under specific technical conditions and characteristics. To be noted when estimating market share figures. |
| (2) | Sauzalito MW’s are included in Sauzal figure in 2003. |
| (3) | Includes one additional unit of Diego de Almagro (23 MW), as of 2004 which Endesa-Chile rents from Codelco. |
71
Table of Distribution Facilities
General Characteristics
| Concession | Transmission | |||||||
| Location | Area (km2) | Lines (km) (1) | ||||||
| 2003 | 2004 | |||||||
| Chilectra | Chile | 2,118 | 355 | 355 | ||||
| Edesur | Argentina | 3,309 | 1,181 | 1,174 | ||||
| Edelnor | Peru | 2,440 | 419 | 419 | ||||
| Cerj | Brazil | 32,054 | 2,241 | 2,282 | ||||
| Coelce | Brazil | 146,817 | 3,651 | 3,787 | ||||
| Codensa | Colombia | 14,087 | 1,150 | 1,143 | ||||
| Total | 200,825 | 8,997 | 9,160 | |||||
| (1) | The transmission lines consists of circuits, which voltages are in the range of 27 kV - 220 kV. |
Power and Interconnection Sub-Stations and Transformers (2)
| 2003 | 2004 | |||||||||||
| Number of | Number of | Capacity | Number of | Number of | Capacity | |||||||
| Sub-stations | Transformers | (MVA) | Sub-stations | Transformers | (MVA) | |||||||
| Chilectra | 53 | 127 | 5,558 | 53 | 133 | 5,830 | ||||||
| Edesur | 63 | 166 | 10,046 | 63 | 163 | 10,302 | ||||||
| Edelnor | 32 | 66 | 2,128 | 32 | 66 | 2,138 | ||||||
| Cerj | 113 | 221 | 3,937 | 113 | 223 | 4,071 | ||||||
| Coelce | 88 | 140 | 1,886 | 88 | 141 | 1,942 | ||||||
| Codensa | 61 | 191 | 6,292 | 61 | 191 | 6,545 | ||||||
| Total | 410 | 911 | 29,847 | 410 | 917 | 30,828 | ||||||
| (2) | Voltage of these transformers are in the range of 500/220 kV (high voltage) and 13.8/10 kV (low voltage). |
Distribution Network - Medium and Low Voltage Lines (3)
| 2003 | 2004 | |||||||
| Medium | Low | Medium | Low | |||||
| Voltage (km) | Voltage (km) | Voltage (km) | Voltage (km) | |||||
| Chilectra | 4,332 | 9,016 | 4,412 | 9,157 | ||||
| Edesur | 6,857 | 15,013 | 6,885 | 15,275 | ||||
| Edelnor | 3,147 | 16,257 | 3,184 | 16,626 | ||||
| Cerj | 24,940 | 14,778 | 25,810 | 15,157 | ||||
| Coelce | 53,256 | 25,812 | 54,422 | 25,937 | ||||
| Codensa | 17,212 | 21,720 | 17,310 | 21,768 | ||||
| Total | 109,744 | 102,596 | 112,023 | 103,920 | ||||
| (3) | Medium voltage lines: 11,400 V - 35,500 V; Low voltage lines: 380/220 V. |
Transformers for Distribution (4)
| 2003 | 2004 | |||||||
| Number of | Capacity | Number of | Capacity | |||||
| Transformers | (MVA) | Transformers | (MVA) | |||||
| Chilectra | 25,183 | 4,498 | 25,866 | 4,742 | ||||
72
| 2003 | 2004 | |||||||
| Number of | Capacity | Number of | Capacity | |||||
| Transformers | (MVA) | Transformers | (MVA) | |||||
| Edesur | 22,886 | 4,682 | 22,764 | 4,726 | ||||
| Edelnor | 8,468 | 1,318 | 8,548 | 1,373 | ||||
| Cerj | 74,251 | 2,689 | 80,398 | 2,911 | ||||
| Coelce | 84,055 | 3,273 | 85,306 | 3,343 | ||||
| Codensa | 57,366 | 6,749 | 57,909 | 6,834 | ||||
| Total | 272,209 | 23,209 | 280,791 | 23,929 | ||||
| (4) | Range of voltage of these transformers is 11,400/35,000 V (high voltage) and 380/220 V (low voltage). |
Environmental Issues
The electricity sector is subject to extensive environmental regulations that require environmental impact studies to be made to obtain approval for future projects. Enersis’ subsidiaries have always planned their projects and operations to meet and comply with the environmental regulations of the various jurisdictions in which they operate.
Major Encumbrances
Costanera S.A.’s debt with Mitsubishi Corporation was used to finance the purchase of equipment. As of December 31, 2004, the value of the assets pledged as a guarantee for this debt was Ch$ 20.6 billion. Additionally, Costanera has executed liens in favor of J.P.Morgan and ING in order to guarantee a syndicated loan in the amount of Ch$ 29 billion as of December 31, 2004.
Pangue S.A.executed the following liens and mortgages: (1) first mortgage on the water rights and real estate on which the power plant is located; (2) lien on the electricity lines, machinery and equipment of the power plant; and (3) prohibition to sell, transfer or encumber such assets, including the definitive concession to establish the Pangue power plant. The value of the pledged assets was Ch$ 88.4 billion at December 31, 2004. These encumbrances and prohibitions guarantee the obligations ofPangue S.A.with the project lenders: Skandinaviska Enskilda Banken, Export Development Corporation and Kreditanstalt für Wiederaufbau.
San Isidro executed a lien in connection with equipment provided by Mitsubishi Corporation. As of December 31, 2004, the value of the equipment was Ch$ 84.1 billion.
Item 5. Operating and Financial Review and Prospects
Introduction
We are a holding company that owns and operates electricity generation, transmission and distribution companies in Chile, Argentina, Brazil, Colombia and Peru. Substantially all of our revenues, income and cash flow comes from our subsidiaries and equity affiliates’ operations in these five countries.
Factors such as hydrological conditions, extraordinary actions by government authorities, regulatory developments and economic conditions in each country in which we operate are important in determining our financial results. In addition, our reported results from operations and financial condition are significantly affected by variations in exchange rates between the U.S. dollar and the Chilean peso and other currencies of the countries in which we operate. Such exchange rate variations have a significant non-cash effect due to the implementation of Chilean GAAP’s Technical Bulletin No. 64, “Accounting for Permanent Foreign Investments” in connection with the consolidation of the results of our companies outside of Chile. Lastly, our other critical accounting policies also have a significant effect on our consolidated results from operations.
73
| • | Hydrological conditions. A substantial portion of our generation business is dependent upon the hydrological conditions prevailing in the countries where we operate. Our thermal generators, which are fueled with natural gas, coal or diesel, are dispatched to cover peaks in energy demand and any shortfalls of our hydroelectric plants because of insufficient water resources. The use of fuels for the generation of electricity results in higher costs of operations that we would not have to incur otherwise. Accordingly, our results of operation may be adversely affected by low rainfall although only extreme hydrological conditions actually materially affect our operating results and financial condition. In addition, adverse hydrological conditions at times have led governments to take affirmative steps to regulate the electricity business. For additional information regarding the effects of hydrological conditions on our results from operations, please see “Item 4. Information on the Company —Introduction—Electricity Generation —Hydrological conditions and rationing decree”. | ||
| • | Extraordinary actions by government authorities. Our operations are materially affected by extraordinary actions taken by the governments of the countries in which we operate. In the past few years the results from operations of our Argentine, Brazilian and Colombian subsidiaries were affected by actions taken by the governments of those countries. Following are some examples: | ||
| • | In Argentina, electricity tariffs historically were expressed in U.S. dollars at an exchange of Ar$ 1.00 to U.S.$ 1.00. However, following a devaluation of the Argentine peso against the U.S. dollar from Ar$ 1.00 per U.S.$ 1.00 to Ar$ 3.37 per U.S.$ 1.00 as of December 31, 2002, the Argentine government converted electricity tariffs to Argentine pesos at the old exchange rate of Ar$ 1.00 to U.S.$ 1.00. As a result of this devaluation and the tariff conversion rate dictated by the Argentine government, the U.S. dollar equivalent of our Argentine revenues declined significantly. | ||
| • | As a consequence of a severe drought in Brazil, during 2001 and the first quarter of 2002, the Brazilian government imposed restrictions limiting the consumption of electricity in certain provinces where our distribution companies operate. As a result of these restrictions on electricity consumption our distribution subsidiaries experienced a reduction in their revenues. | ||
| • | In 2002, the Colombian government imposed an extraordinary tax to finance Colombia’s antiterrorist campaign and in 2004, it imposed, for the first time, a 1.2% tax on shareholders’ equity on all Colombian companies. | ||
| • | Regulatory developments. The regulatory structure governing our distribution and generation business has a material effect in our results from operations. In particular, regulators in the countries in which we operate set (x) distribution tariffs taking into consideration the costs of energy purchases paid by distribution companies (which distribution companies pass on to their customers) and the “Distribution Added Value”, or VAD and (y) generation tariffs taking into consideration principally the costs of fuels, level of reservoirs, exchange rate, future investments in installed capacity and growth in demand, all of which is intended to reflect investment and operating costs incurred by distribution and generation companies and is meant to allow such companies to earn a regulated level of return on their investments. Accordingly, the earnings of our electricity subsidiaries are determined in significant part by the actions of government regulators. For additional information relating to the regulatory frameworks in the countries in which we operate, please see “Item 4. The Company—Electricity Industry Regulatory Framework” included in this annual report. | ||
| • | Economic conditions. Macroeconomic conditions in the countries in which we operate have a significant effect on our results from operations. For example, when a country experiences sustained economic growth, consumption of electricity by industrial and individual consumers of electricity increases while electricity theft decreases. Other macroeconomic factors such as a devaluation of the local currency in the countries in which we operate may have a negative impact in our results from operations because while most of our revenues are denominated in the currency of the countries in which we operate, our financing and significant other costs such as depreciation are denominated in U.S. dollars. As a result, devaluation of local currencies against the dollar shrinks our operating margins and increases the cost of capital expenditure plans. | ||
74
Technical Bulletin No. 64
Our consolidation of the results of our non-Chilean subsidiaries is governed by Technical Bulletin No. 64. Technical Bulletin No. 64 establishes a mechanism to consolidate the financial results of a non-Chilean company prepared in local GAAP and denominated in local currency into the financial results of its Chilean parent which are prepared in Chilean GAAP and denominated in Chilean pesos. The implementation of Technical Bulletin No. 64 affects the reporting of our results from operations. In particular, exchange rate variations, if significant, can materially affect the amounts of operating revenues and expenses reported in our consolidated financial statements in Chilean GAAP as well as generate material non-operating gains and losses.
Technical Bulletin No. 64—Conversion Effect. Technical Bulletin No. 64 requires Enersis to convert the denomination of the financial statements of its non-Chilean subsidiaries from local currency to U.S. dollars and to restate such financial statements into Chilean GAAP after such conversion, including by converting such U.S. dollar amounts into Chilean pesos. We refer to the gain or loss resulting from this balance sheet conversion as the “conversion effect.” In order to convert monetary assets and liabilities of its non-Chilean subsidiaries to U.S. dollars, Enersis must use the U.S. dollar/local currency exchange rate applicable at period-end. In order to convert Enersis’s equity interests in such subsidiaries as well as such subsidiaries’ non-monetary assets and liabilities to U.S. dollars, Enersis must use the U.S. dollar/local currency exchange rate applicable at the time when such equity interests or non-monetary assets or liabilities were acquired or incurred.
In addition, Technical Bulletin No. 64 requires income and expense accounts (except for the expenses incurred in connection with depreciation and amortization) of foreign subsidiaries to be converted into U.S. dollars at the average exchange rate of the month during which such results or expenses were recorded. All amounts converted from local currency to U.S. dollars are then converted from U.S. dollars to Chilean pesos at the exchange rate applicable at the end of the reporting period. Technical Bulletin No. 64 may have the effect of excluding from our reported financial condition the effect on non-monetary assets of devaluation in the countries in which our subsidiaries and investments are located. For example, the carrying value of our Argentine and Brazilian non-monetary assets increased in 2002 notwithstanding the devaluation of Argentine peso and Brazilian real because these assets are carried at historical dollar value and the dollar appreciated against the Chilean peso in 2002.
The currency conversion from local currencies to U.S. dollars can have different effects depending on a foreign subsidiary’s structure of monetary and non-monetary assets and liabilities. For example, when a foreign subsidiary has more monetary assets than monetary liabilities, a devaluation of the applicable local currency against the U.S. dollar may result in a loss due to the effects of the currency conversion. On the other hand, the appreciation of the applicable local currency results in a gain. The reverse is also true for foreign subsidiaries with more monetary liabilities than monetary assets, where a devaluation of the applicable local currency against the U.S. dollar may result in a gain, whereas an appreciation may result in a loss. The fluctuations of the exchange rates between the currencies of the countries where we operate and the U.S. dollar, as well as in the exchange rate between the Chilean peso and the U.S. dollar, have materially affected the comparability of our results from operations during the periods discussed below because of this conversion effect.
Technical Bulletin No. 64—Equity Hedge. Technical Bulletin No. 64 allows U.S. dollar denominated debt incurred in connection with the acquisition of equity in non-Chilean subsidiaries located in unstable countries, to be hedged by the investing company against and limited to the book-value of such equity investments. For purposes of Technical Bulletin No. 64 all the countries where we have investments – Argentina, Brazil, Colombia and Peru – are considered unstable countries. This hedge results in the elimination of the effects of exchange rate variations on the debt incurred in connection with such investments. If the book-value of an equity investment is lower than the U.S. dollar denominated debt incurred in connection with its acquisition, the results of the exchange rate fluctuations affecting the amount of U.S. dollar denominated debt that is not hedged are included in determining net income. On the other hand, if the book-value of an equity investment is higher than the U.S. dollar denominated debt incurred in connection with its acquisition, then the results of the exchange rate fluctuations affecting the book-value of the equity that is not hedged are recorded in cumulative translation adjustment in a reserve account as part of shareholders’ equity.
75
Critical accounting policies
Financial Reporting Release No. 60 encourages all companies to include a discussion of critical accounting policies or methods used in the preparation of the financial statements. Critical accounting policies are defined as those that are reflective of significant judgments and uncertainties, which would potentially result in materially different results under different assumptions and conditions. We believe that our critical accounting policies in the preparation of our Chilean GAAP financial statements are limited to the policies described below. In many cases, Chilean GAAP specifically dictates the accounting treatment of a particular transaction, with no need for management’s judgment in its application. For a summary of significant accounting policies and methods used in the preparation of the financial statements, see Note 2 to our consolidated financial statements.
| Impairment of long-lived assets |
In accordance with Chilean GAAP, the Company evaluates for impairment the recoverability of the carrying amount of property, plant and equipment and other long-lived assets, in relation to the operating performance and future undiscounted cash flows of the underlying business. These standards require that an impairment loss be recognized in the event that facts and circumstances indicate that the carrying amount of an asset may not be fully recoverable. Impairment is recorded based on an estimate of future discounted cash flows, as compared to current carrying amounts. The most significant estimates made in determining discounted future net cash flow include the selection of appropriate discount rates and the number of years on which to base the cash flow projection, as well as appropriate adjustments to historical results for anticipated operating conditions. As described in greater detail below, these estimates are subject to meaningful variation from period to period, which could materially affect our analysis of the impairment of our long-lived assets.
The number of years included in determining discounted cash flow, in our opinion, is estimable in the case of our generating companies because the number is closely associated with the useful lives of the plants and their equipment. These useful lives are readily determinable based on historical experience and type of power generated. The discount rates used in the analysis vary by country and fluctuate as economic conditions in these countries vary. Therefore, the likelihood of change in estimate in any given period is high. Adjustments to historical results based on anticipated operating conditions are estimated in light of the current competitive market in the countries in which we do business. These conditions change periodically; therefore, the likelihood of a change in estimate in any given period is high.
On the distribution side of our business, the probability of a change in the number of years included in discounted cash flow and the discount rate would be based on the same factors as the generation business.
Adjustments to historical results based on anticipated operating conditions in the distribution business depend on underlying assumptions about the tariff regulatory scheme to which our distribution companies are subject. Tariff-setting procedures vary from country to country in the countries in which we do business. Because underlying economic factors, weather conditions affecting the availability of power and global prices for fuel used in producing power may be relatively volatile, it is highly likely that assumptions about anticipated operating conditions may change significantly from period to period.
| Impairment of goodwill |
Goodwill includes the cost of acquired subsidiaries and equity investees in excess of the book value of the net assets recorded in connection with acquisitions. Accounting for goodwill requires management to estimate the appropriate amortization period and the recoverability of the carrying value of goodwill. The maximum amortization period under Chilean GAAP is 20 years. Factors that are considered in estimating the appropriate amortization period of goodwill include:
| • | the foreseeable life of the business; | |
| • | expected actions by competitors and potential competitors; and | |
| • | legal, regulatory, or contractual provisions affecting the useful life. |
76
Estimates of these factors are necessarily uncertain and subject to change, which could cause our determination of the appropriate amortization period to change. Under Chilean GAAP, we test goodwill for impairment in the same way as any other long-lived asset. The likelihood of materially different reported results under different conditions or assumptions is similar to that disclosed under “Impairment of Long-Lived Assets” for both the generation and the distribution business.
| Regulatory Asset and Deferred Costs |
Under Brazilian law Enersis’ distribution subsidiaries in Brazil have recognized as of December 31, 2001 a regulatory asset based on extraordinary tariffs expected to be in effect over a period of approximately three years in order to allow electricity companies to recover losses experienced during the period of energy rationing from June 1, 2001 to March 1, 2002.
The regulatory asset recorded by the Company’s distribution subsidiaries (Cerj and Coelce) was Ch$ 33.1 billion as of December 31, 2002 and Ch$ 99.7 billion as of December 31, 2001, each expressed in Ch$ as of December 31, 2004 and recorded as revenue during 2002 and 2001. In order to record this asset, our subsidiaries and other companies in the energy sector have agreed to forfeit any future claim related to the events and regulations derived from the rationing program and increases through the extraordinary tariff.
Additionally, certain costs, including fuel costs, energy transfer costs, and generator transmission costs were deferred by Cerj and Coelce for the years ending December 31, 2001 and 2002, respectively and amounted to 24.6 billion and Ch$ 32.6 billion, respectively. These costs will be recovered through future billings.
We assume that the remaining regulatory asset and deferred costs will be collected through future billings during the established period of recovery. That assumption is based on an historical analysis of the costs recovered to date in relation to the period of recovery expired compared to the unrecovered costs and the period remaining to recover them, assuming these events will occur ratably over time. Tariff-setting regulation changes could materially affect our assumptions about recovery.
| Estimation of fair value of certain energy contracts under U.S. GAAP |
Certain of our generation and distribution commodity contracts are accounted for as derivatives underU.S. GAAP and are required to be accounted for at fair value. Estimates of fair values of these contracts, for which no quoted prices or secondary market exists, are made using valuation techniques such as forward pricing models, present value of estimated future cash flows, and other modeling techniques. These estimates of fair value include assumptions made by the Company about market variables that may change in the future. Changes in assumptions could have a significant impact on the estimate of fair values disclosed. As a result, such fair value amounts are subject to significant volatility and are highly dependent on the quality of the assumptions used.
Our purchase and sale interconnection contracts are for periods up to 20 years in complex markets, where no similar-term forward market information is available. We have estimated the fair values of these contracts based on the best information available; however, with different assumptions regarding interest rates, inflation rates, exchange rates, electricity rates and cost trends, materially different fair values could result. As a result, such estimates are highly volatile and dependent upon the assumptions used.
| Pension and post-retirement benefits liabilities |
We sponsor several defined benefit plans for employees. These plans pay benefits to employees at retirement using formulas based on participants’ years of service and compensation. We provide certain additional benefits for certain retired employees as well.
Recorded pensions and other post-retirement benefit liabilities reflect our best estimate of the future cost of honoring our obligations under these benefit plans. In accounting for defined benefit plans, actuarial calculations are made. These calculations contain key assumptions, which include: employee turnover, mortality and retirement ages, discount rates, expected returns on assets, future salary and benefit level, claim rates under medical plans and future medical cost. These assumptions change as market and economic conditions change and any change in any of these assumptions could have a material effect on our reported results from operations. Once every three years we review the key assumptions used in the determination of the pension obligation plan assets and net periodic pension cost as prescribed by Technical Bulletin No. 8.
77
The following table shows the effect of a 1% change in discount rate on our projected benefit obligation for the periods indicated.
| Year ended December 31, | ||||
| 2003 | 2004 | |||
| (increase in millions of Ch$ ) | ||||
| Projected benefit obligation | 15,776 | 24,385 | ||
The following table shows the effect of a 1% change in discount rate on our accumulated post-retirement benefit obligation for the periods indicated.
| Year ended December 31, | ||||
| 2003 | 2004 | |||
| (increase in millions of Ch$ ) | ||||
| Accumulated post-retirement benefit obligation | 1,344 | 3,201 | ||
SAB 74 Disclosures -
Recent accounting pronouncements
| Accounting for Conditional Asset Retirement Obligations |
In March 2005 the Financial Accounting Standards Board (FASB) published FASB Interpretation No. 47, “Accounting for Conditional Asset Retirement Obligations”. Interpretation 47 will result in (a) more consistent recognition of liabilities relating to asset retirement obligations, (b) more information about expected future cash outflows associated with those obligations, and (c) more information about investments in long-lived assets because additional asset retirement costs will be recognized as part of the carrying amounts of the assets.
Interpretation 47 clarifies that the term “conditional asset retirement obligation” as used in FASB Statement No. 143, Accounting for Asset Retirement Obligations, refers to a legal obligation to perform an asset retirement activity in which the timing and (or) method of settlement are conditional on a future event that may or may not be within the control of the entity. The obligation to perform the asset retirement activity is unconditional even though uncertainty exists about the timing and (or) method of settlement. Uncertainty about the timing and (or) method of settlement of a conditional asset retirement obligation should be factored into the measurement of the liability when sufficient information exists. Interpretation 47 also clarifies when an entity would have sufficient information to reasonably estimate the fair value of an asset retirement obligation. Interpretation 47 is effective no later than the end of fiscal years ending after December 15, 2005 (December 31, 2005, for calendar-year enterprises). The Company adopted SFAS 143 effective January 1, 2003, and currently does not expect that the adoption of Interpretation 47 will have a material impact on the Company’s results of operation or financial position.
Enersis’ Results from Operations for the Years Ended
December 31, 2003 and December 31, 2004
Overview
Our 2004 results, when compared to those of 2003, were mainly affected by the following factors:
| • | our operating income increased by Ch$ 84.7 billion, or 15.4%, to Ch$ 634.2 billion in 2004, principally reflecting increased operating income at our generation subsidiaries in Colombia and Brazil, and our distribution companies in Colombia and, to a lesser extent, Argentina. If we eliminate the negative impact of the 6.1% appreciation of the Chilean peso against the United States dollar in 2004, operating income would have increased by 21.0%. In 2004, the Colombian peso appreciated by 8.6%, the Brazilian real appreciated by 4.9% and the Peruvian sol appreciated by 1.9%, all against the U.S. dollar, which offset in part the negative impact of the appreciation of the Chilean peso. We believe that it is helpful to eliminate the effects of the appreciation of the Chilean peso against the dollar in order to understand the underlying trend in our operating income. For a reconciliation of this non-GAAP measures to Chilean GAAP, see “Reconciliation of non-GAAP measures to Chilean GAAP” below. |
78
| • | Physical sales in our distribution operations increased by 5.5% to 52,314 GWh in 2004. Physical sales in generation also increased by 5.5% to 53,443 GWh in 2004. These increases reflect an economic recovery in all the economies of the countries in which we operate. Our number of distribution clients increased by 4.2% to 10.9 million at the end of 2004. | |
| • | Our non-operating results improved by Ch$ 97.6 billion, or 20.9%, from a loss of Ch$ 466.3 billion in 2003 to a loss of Ch$ 368.6 billion in 2004. This is attributable primarily to lower interest expense, the effects of foreign exchange movements, and income from unconsolidated investments. | |
| • | Tax expenses increased by Ch$ 94.6 billion, from Ch$ 42.6 billion in 2003 to Ch$ 137.2 billion in 2004, partly due to incremental Ch$ 107.2 billion of non-cash deferred tax expense. This increase was partly offset by Ch$ 12.6 billion in tax expense. |
Operating income
The table below breaks down operating income by country for the years ended December 31, 2003 and 2004.
| Year ended December 31, | ||||||||
| 2003 | 2004 | Change | % Change | |||||
| (in millions of Ch$ ) | ||||||||
| Chilectra (Chile) | 95,375 | 97,611 | 2,236 | 2.3 | % | |||
| Non-electricity subsidiaries (Chile) (1) | 7,998 | 961 | (7,037 | ) | (88.0 | )% | ||
| Total operating income Chile except generation business | 103,373 | 98,572 | (4,801 | ) | (4.6 | )% | ||
| Edesur (Argentina) | (5,378 | ) | (253 | ) | 5,125 | (95.3 | )% | |
| Distrilima/Edelnor (Peru) | 27,197 | 27,825 | 628 | 2.3 | % | |||
| Cerj (Brazil) | 25,126 | 46,893 | 21,767 | 86.6 | % | |||
| Investluz/Coelce (Brazil) | 20,176 | 4,890 | (15,286 | ) | (75.8 | )% | ||
| Codensa (Colombia) | 31,383 | 84,449 | 53,066 | 169.1 | % | |||
| Total operating income, excluding Chile and generation business | 98,504 | 163,804 | 65,300 | 66.3 | % | |||
| Endesa-Chile | ||||||||
| Operating income (Chile) | 159,141 | 149,718 | (9,423 | ) | (5.9 | )% | ||
| Operating income (Argentina) | 33,121 | 34,380 | 1,259 | 3.8 | % | |||
| Operating income (Brazil) | 3,749 | 14,314 | 10,565 | 281.8 | % | |||
| Operating income (Colombia) | 88,133 | 118,456 | 30,323 | 34.4 | % | |||
| Operating income (Peru) | 62,829 | 52,157 | (10,672 | ) | (17.0 | )% | ||
| Other | ||||||||
| Endesa-Chile’s total operating income | 346,973 | 369,025 | 22,052 | 6.4 | % | |||
| Less: intercompany transactions | 648 | 2,801 | 2,153 | 332.3 | % | |||
| Total operating income | 549,498 | 634,202 | 84,704 | 15.4 | % | |||
(1) Includes operating income of CAM, Synapsis, IMV, Enersis Holding and investment vehicles. | ||||||||
79
The table below breaks down operating income by segment for the years ended December 31, 2003 and 2004.
| Year ended December 31, | ||||||||||||||||||||
| Generation | Distribution | Other | Interc. transactions | Total | ||||||||||||||||
| 2003 | 2004 | 2003 | 2004 | 2003 | 2004 | 2003 | 2004 | 2003 | 2004 | |||||||||||
| (in million of Ch$ ) | ||||||||||||||||||||
| Operatingrevenues | 918,634 | 1,012,305 | 1,651,253 | 1,858,860 | 181,139 | 181,031 | (332,575 | ) | (343,271 | ) | 2,418,451 | 2,708,925 | ||||||||
| Operating costs | (543,006 | ) | (611,808 | ) | (1,316,948 | ) | (1,458,325 | ) | (137,837 | ) | (144,358 | ) | 302,579 | 316,403 | (1,695,212 | ) | (1,898,088 | ) | ||
| Operatingmargin | 375,628 | 400,497 | 334,305 | 400,535 | 43,302 | 36,673 | (29,996 | ) | (26,868 | ) | 723,239 | 810,837 | ||||||||
| Selling and administrativeexpenses | (31,018 | ) | (33,003 | ) | (140,427 | ) | (139,121 | ) | (32,940 | ) | (34,180 | ) | 30,644 | 29,669 | (173,741 | ) | (176,635 | ) | ||
| Operating income | 344,610 | 367,494 | 193,878 | 261,414 | 10,362 | 2,493 | 648 | 2,801 | 549,498 | 634,202 | ||||||||||
Revenues from operations
Our revenues from operations are derived principally from electricity generation and distribution. Generation revenues are derived mainly from the sale of electricity we generate. Distribution revenues are derived primarily from the resale of electricity purchased from generators. Resale of electricity revenues consist of revenues related to the recovery of the cost of wholesale electricity purchased from electricity generation companies and Value Added from Distribution, or VAD, revenues, which relate to the recovery of costs and return on investment with respect to distribution assets as well as allowed losses under tariff regulations. Other revenues from our distribution services consist of charges related to new connections and maintenance and leases of meters.
The table below presents the distribution business segment breakdown for physical sales of electricity by our subsidiaries, arranged by country, and their corresponding changes for the twelve-month periods ended December 31, 2003 and 2004.
| Distribution Business | ||||||||
| Physical sales during | ||||||||
| Year ended December 31, | ||||||||
| 2003 | 2004 | Change | % Change | |||||
| (GWh) | �� | |||||||
| Chile | 10,518 | 11,317 | 799 | 7.6 | % | |||
| Argentina (1) | 12,656 | 13,322 | 666 | 5.3 | % | |||
| Peru | 3,968 | 4,250 | 282 | 7.1 | % | |||
| Brazil | 13,181 | 13,769 | 588 | 4.5 | % | |||
| Colombia (1) | 9,254 | 9,656 | 402 | 4.3 | % | |||
| Total | 49,577 | 52,314 | 2,737 | 5.5 | % | |||
| (1) | Includes sales of energy by third parties who pay us transmission tolls. In Edesur and Codensa, transmission toll revenues as of December 31, 2004 represented 4.3% and 36.9% of their total revenues, respectively. |
Generation Business
The table below presents the generation business segment breakdown for physical sales of electricity by our subsidiaries, arranged by country, and their corresponding changes for the twelve month periods ended December 31, 2003 and 2004.
80
| Physical sales during | ||||||||
| Year ended December 31, | ||||||||
| 2003 | 2004 | Change | % Change | |||||
| (GWh) | ||||||||
| Chile | 18,681 | 18,462 | (219 | ) | (1.2 | )% | ||
| Argentina | 9,259 | 11,604 | 2,345 | 25.3 | % | |||
| Peru | 4,443 | 4,328 | (115 | ) | (2.6 | )% | ||
| Brazil | 3,770 | 3,902 | 132 | 3.5 | % | |||
| Colombia | 14,481 | 15,148 | 667 | 4.6 | % | |||
| Total | 50,634 | 53,444 | 2,810 | 5.5 | % | |||
The table below presents, for the periods indicated, the breakdown of our operating revenues and percentage changes from period to period.
| Year ended December 31, | ||||||||
| 2003 | 2004 | Change | % Change | |||||
| (in million of Ch$) | ||||||||
| Chilectra (Chile) | 444,803 | 483,006 | 38,203 | 8.6 | % | |||
| Non-electricity subsidiaries (Chile) (1) | 156,483 | 160,673 | 4,190 | 2.7 | % | |||
| Total operating revenues from Chile, except generation business | 601,286 | 643,679 | 42,393 | 7.1 | % | |||
| Edesur (Argentina) | 188,541 | 208,983 | 20,442 | 10.8 | % | |||
| Distrilima/Edelnor (Peru) | 180,346 | 182,363 | 2,017 | 1.1 | % | |||
| Cerj (Brazil) | 325,533 | 354,638 | 29,105 | 8.9 | % | |||
| Investluz/Coelce (Brazil) | 212,572 | 264,358 | 51,786 | 24.4 | % | |||
| Codensa (Colombia) | 299,459 | 365,513 | 66,054 | 22.1 | % | |||
| Total operating revenues, excluding Chile and generation business | 1,206,451 | 1,375,855 | 169,404 | 14.0 | % | |||
| Endesa-Chile | ||||||||
| Sales of electricity (Chile) | 469,324 | 467,583 | (1,741 | ) | (0.4 | )% | ||
| Sales of electricity (Argentina) | 114,060 | 148,300 | 34,240 | 30.0 | % | |||
| Sales of electricity (Brazil) | 31,562 | 42,006 | 10,444 | 33.1 | % | |||
| Sales of electricity (Colombia) | 213,810 | 251,398 | 37,588 | 17.6 | % | |||
| Sales of electricity (Peru) | 114,532 | 123,375 | 8,843 | 7.7 | % | |||
| Endesa-Chile’s total operating revenues | 943,288 | 1,032,662 | 89,374 | 9.5 | % | |||
| Less: intercompany transactions | (332,574 | ) | (343,271 | ) | (10,697 | ) | 3.2 | % |
| Total operating revenues | 2,418,451 | 2,708,925 | 290,474 | 12.0 | % | |||
| (1) | Includes operating income of CAM, Synapsis, IMV, Enersis Holding and investment vehicles. |
Distribution business revenues from operations
In Chile, revenues from operations from our electricity distribution subsidiary, Chilectra, increased by Ch$ 38.2 billion, or 8.6%, in 2004 from 2003. This increase was primarily attributable to a 7.6% increase in physical sales which, in turn, reflected a 5.2% increase in average consumption per customer in the two periods under comparison. The average price of electricity sold by Chilectra increased 0.7% in 2004.
Revenues from our non-electric subsidiaries increased by Ch$ 4.2 billion, principally reflecting a Ch$ 6.4 billion increase in revenues of CAM due to higher sales of materials and services. This effect was offset in part by decreases at Manso de Velasco of Ch$ 1.3 billion, and at Synapsis of Ch$ 1.0 billion. Revenues at Manso de Velasco declined in 2004 because certain real estate projects came to an end, and Synapsis’ revenues declined principally because we did not provide services to INP in 2004.
81
Revenues from our Argentine distribution subsidiary, Edesur, increased by Ch$ 20.4 billion, or 10.8%, reaching Ch$ 209.0 billion in 2004. This increase is primarily attributable to a 10.8% increase in the average price of sales in local currency, and a 5.3% increase in physical sales, to 13,322 GWh in 2004. Average electricity consumption per customer increased by 4.2%. The benefit of these increases was partly offset by a Ch$ 15.9 billion reduction in revenues as a result of the 6.1% appreciation of the Chilean peso in 2004.
Revenues from our Peruvian holding company, Distrilima, which consolidates our Peruvian distribution company Edelnor, increased by Ch$ 2.0 billion, or 1.1%, in 2004 as compared to 2003. This increase is primarily attributable to a 7.1% increase in physical sales, to 4,250 GWh in 2004. In addition, Distrilima’s 2004 revenues expressed in U.S. dollars, using the average exchange rate convention of Technical Bulletin 64, increased as a consequence of the 1.9% appreciation of the Peruvian sol, when compared to 2003. Average per capita consumption of electricity increased 4.7% in 2004. These positive factors were partly offset by the adverse effect of the 6.1% appreciation of the Chilean peso against the dollar, which amounted to Ch$ 15.2 billion in 2004.
Revenues from our Brazilian electricity distribution company, Cerj, increased by Ch$ 29.1 billion in 2004, or 8.9%, primarily due to a 16.2% increase in the average price of sales in 2004 in local currency terms, as well as higher physical sales, which grew from by 4.8% to 7,628 GWh in 2004. In addition, Cerj’s 2004 revenues expressed in U.S. dollars, using the average exchange rate convention increased as a consequence of the 4.9% appreciation of the Brazilian real, when compared to 2003. The number of customers increased by 5.1%, from 2.0 million in 2003 to 2.1 million in 2004. These positive factors were partly offset by the adverse effect of the appreciation of the Chilean peso against the dollar during 2004, which amounted to Ch$ 27.4 billion.
Operating revenues from our other Brazilian distribution company, Coelce, increased by Ch$ 51.8 billion, or 24.4%, in 2004. This increase is primarily attributable to a 28.9% increase in the average price of sales in local currency, and a 4.0% increase in physical sales, to 6,141 GWh in 2004. In addition, as with Cerj, Coelce’s 2004 revenues expressed in dollars, increased as a consequence of the 4.9% appreciation of the Brazilian real against the dollar, when compared to 2003. These positive factors were partly offset by the adverse effect of the appreciation of the Chilean peso against the dollar during 2004, which amounted to Ch$ 17.9 billion.
In Colombia, revenues from our electricity distribution company, Codensa, increased by Ch$ 66.1 billion, or 22.1%, over 2003. This increase is primarily attributable to a 12.1% increase in the average price of sales in local currency, and a 4.3% increase in physical sales, to 9,656 GWh in 2004. In addition, our 2004 revenues expressed in dollars, using the average exchange rate convention increased as a consequence of the 8.6% appreciation of the Colombian peso, when compared to 2003. The number of customers increased by 2.2%, to 2.0 million in 2004, while average electricity consumption rose by 2.1%. These positive factors were partly offset by the adverse effect of the appreciation of the Chilean peso against the dollar during 2004, which amounted to Ch$ 25.2 billion.
Generation business revenues from operations
Revenues from sales in Chile accounted for 45.3% and 49.8% of our consolidated revenues in 2004 and 2003, respectively. Revenues from sales of electricity in Argentina accounted for 14.4% of our consolidated revenues in 2004 as compared to 12.1% in 2003. Revenues from sales of electricity in Colombia accounted for 24.3% in 2004 as compared to 22.6% in 2003 and revenues from sales of electricity in Brazil accounted for 4.1% in 2003 as compared to 3.3% in 2003. In addition, revenues from sales of electricity in Perú accounted for 11.9% in 2004 as compared to 12.1% in 2003. Other, non-core business revenues accounted for less than 5% of total consolidated revenues in both 2003 and 2004.
Total revenues in Chile decreased 0.4% in 2004 due to lower sales of non generation businesses, mainly at Ingendesa, our engineering services subsidiary in Chile. Revenues from sales of electricity increased by 0.2% to Ch$ 440.7 billion in 2004 from Ch$ 439.9 billion in 2003. The increase in electricity sales reflected a 1.3% increase in the average sales price, from Ch$ 23.6 per kWh in 2003 to Ch$ 23.9 per kWh in 2004,due to increases in the regulated node price and the average spot market price. The price increase effect was offset by the reduced volume of electricity sales, which declined 1.2% in 2004. The lower level of volume sales was a consequence of the level of contractual commitments and hydrology. The lower hydro generation due to the level of hydrology in reservoirs and rivers was partly offset by thermal generation and the successful start up of the 690 MW Ralco power plant, which began operations in September 2004 and supplied nearly 1,300 GWh at December 31, 2004. Spot market GWh sales increased 9.3% from 2,920 GWh in 2003 to 3,192 GWh in 2004 while sales to contracted customers declined 3.1%.
82
Revenues in Argentina increased by 30.0%, from Ch$ 114.1 billion in 2003 to Ch$ 148.3 billion in 2004. The increase in revenues was primarily due to 25.3% increase in the volume of electricity sales. The main drivers of this increase are greater demand for electricity in the Argentine market and Costanera’s ability to generate electricity with liquid fuels as an alternative to natural gas when the natural gas supply in Argentina is in crisis. Volume sales at our Chocón plant in 2004 were 22.4% lower than in 2003 due to less favorable water levels. The Company’s average sales price in Argentina expressed in Chilean pesos according to the convention of Technical Bulletin 64 increased 4%, from Ch$ 12.3 per kWh in 2003 to Ch$ 12.8 in 2004. However, when expressed in Argentine local currency, the nominal average sales price increased 13% in 2004 due to an increase in the wholesale market spot price.
Revenues in Colombia increased by 17.6%, from Ch$ 213.8 billion in 2003 to Ch$ 251.4 billion in 2004. Physical electricity sales increased 4.6% due to higher sales at Emgesa which were driven by market demand and hydrology. Both spot market and contracted energy sales increased in both 2004 and 2003, representing 36% and 64%, respectively, of our total sales in Colombia.. The average sales price increased 12.2%, from Ch$ 14.8 per kWh in 2003 to Ch$ 16.6 per kWh in 2004, expressed in Chilean pesos according to the convention of Technical Bulletin 64. When expressed in local currency, the average sales price increase was 7.8% in 2004.
Revenues from our Brazilian subsidiary, Cachoeira Dourada, increased by 33.1% from Ch$ 31.6 billion in 2003 to Ch$ 42.0 billion in 2004. This revenue increase is due to a 3.5% increase in physical sales, which reached 3,902 GWh in 2004, and higher electricity prices. Volume increased due to greater demand and favorable hydroelectric conditions in the southeast. Sales prices were higher in both the spot market and the contracted market. Revenues from Cachoeira Dourada’s main customer, Celg, increased according to the terms of their contractual agreement and also as a result of 14 million reales recognized in June 2004 following the conclusion of a legal dispute regarding revenues not billed during the second semester of 2003. The Company’s overall average sales price increased 20.4% from Ch$ 8.4 per kWh in 2003 to Ch$ 10.1 per kWh in 2004, expressed in Chilean pesos according to the convention of Technical Bulletin 64 (after adjusting for income in arrears from 2003). In Brazilian local currency, the Company’s average sales price increased by 26.2% during 2004.
Revenues from sales of our Peruvian electricity generation company, Edegel, increased by 7.7%, from Ch$ 114.5 billion in 2003 to Ch$ 123.4 billion in 2004. The volume of electricity sales declined due to lower hydro generation as a consequence of poor hydrology in the region, mainly during the first semester of 2004. The average sales price increased from Ch$ 25.6 per kWh in 2003 to Ch$ 28.3 per kWh in 2004, equivalent to a 10.4% increase, expressed in Chilean pesos according to the convention of Technical Bulletin 64. The average sales price increase in local currency was 18.2% in 2004.
| Operating Costs |
Operating costs consist principally of electricity purchases from third parties, depreciation and amortization, tolls paid to transmission companies, maintenance costs, salaries, fuel purchases and other expenses.
The table below sets forth the breakdown of the costs described above as a percentage of our total costs of operations for the years ended December 2003 and 2004.
83
| Year ended December 31 | ||||
| 2003 | 2004 | |||
| (percentage of total costs of operations) | ||||
| Electricity purchases | 44.10 | % | 46.80 | % |
| Depreciation and amortization | 23.40 | % | 19.50 | % |
| Transmission tolls | 7.90 | % | 7.50 | % |
| Operating costs and maintenance | 7.80 | % | 7.50 | % |
| Salaries | 5.90 | % | 5.70 | % |
| Fuel purchases | 5.20 | % | 8.10 | % |
| Other expenses | 5.70 | % | 4.90 | % |
| 100.00 | % | 100.00 | % | |
The table below sets forth the breakdown of costs of operations for the years ended on December 31, 2003 and 2004.
| Year ended December 31, | ||||||||
| 2003 | 2004 | Change | % Change | |||||
| (in million of Ch$ ) | ||||||||
| Chilectra (Chile) | 314,129 | 342,987 | 28,858 | 9.2 | % | |||
| Non-electricity subsidiaries (Chile) (1) | 116,635 | 126,974 | 10,339 | 8.9 | % | |||
| Total operating costs, Chile except generation business | 430,764 | 469,961 | 39,197 | 9.1 | % | |||
| Edesur (Argentina) | 165,195 | 181,425 | 16,230 | 9.8 | % | |||
| Distrilima/Edelnor (Peru) | 135,623 | 137,720 | 2,097 | 1.5 | % | |||
| Cerj (Brazil) | 289,209 | 293,145 | 3,936 | 1.4 | % | |||
| Investluz/Coelce (Brazil) | 162,022 | 229,674 | 67,652 | 41.8 | % | |||
| Codensa (Colombia) | 250,770 | 273,375 | 22,605 | 9.0 | % | |||
| Total operating costs, excluding Chile and generation business Endesa-Chile | 1,002,819 | 1,115,339 | 112,520 | 11.2 | % | |||
| Cost of operations (Chile) | 292,396 | 298,927 | 6,531 | 2.2 | % | |||
| Cost of operations (Argentina) | 78,962 | 111,351 | 32,389 | 41.0 | % | |||
| Cost of operations (Brazil) | 25,845 | 25,951 | 106 | 0.4 | % | |||
| Cost of operations (Colombia) | 122,892 | 129,183 | 6,291 | 5.1 | % | |||
| Cost of operations (Peru) | 44,113 | 63,779 | 19,666 | 44.6 | % | |||
| Endesa-Chile’s total operating costs | 564,208 | 629,191 | 64,983 | 11.5 | % | |||
| Less: intercompany transactions | (302,579 | ) | (316,403 | ) | (13,824 | ) | 4.6 | % |
| Total operating costs | 1,695,212 | 1,898,088 | 202,876 | 12.0 | % | |||
| (1) | Includes operating costs of CAM, Synapsis, IMV, Enersis Holding and investment vehicles. |
Distribution business operating costs
Operating costs in Chile increased by Ch$ 28.9 billion, or 9.2%, during 2004, mainly due to (i) a higher level of energy purchases, which increased by 7.2% to 11,937 GWh in 2004, reflecting higher demand, and (ii) an average purchase price increase of 3.8%. Physical losses decreased 7.1%, from 5.6% in 2003 to 5.2% in 2004. Our non-electricity subsidiaries also experienced an increase in costs of Ch$ 10.3 billion, arising primarily from CAM, explained by an increase in the costs of materials of Ch$ 4.9 billion, and higher wages of Ch$ 2.1 billion.
Operating costs of our Argentine subsidiary Edesur increased by Ch$ 16.2 billion, or 9.8%, explained primarily by a 5.2% increase in energy purchased to 15,097 GWh in 2004, as well as a 27.7% increase in the average price of electricity purchased in local currency terms. These cost increases were partly offset by a Ch$ 5.4 billion decrease in depreciation of fixed assets, and a Ch$ 2.1 billion decrease in operation and maintenance costs. Energy losses, arising from theft and vandalism, remained at 11.8% in 2004, the same level as 2003. The increase in average purchase price was also partly offset by the appreciation of the Chilean peso against the dollar in 2004, which led to a decrease in operating costs of Ch$ 13.9 billion.
84
Operating costs of our Peruvian company, Distrilima, which consolidates our electricity distribution company Edelnor, increased by Ch$ 2.1 billion, or 1.5%, primarily because of a 7.2% increase in energy purchases to 4,641 84 GWh in 2004, and an increase of 1.0% in the average price of energy purchased in local currency forms. In addition, Distrilima’s 2004 operating costs expressed in U.S. dollars, using the average exchange rate convention of Technical Bulletin 64, increased as a consequence of the 1.9% appreciation of the Peruvian sol, when compared to 2003, with the exception of the depreciation of fixed assets, which is carried in nominal dollars. These factors were partly offset by a Ch$ 0.5 billion reduction in operating and maintenance costs, a Ch$ 0.4 billion decline in fixed asset depreciation, a Ch$ 0.4 billion reduction in costs of services and the effect of the appreciation of the Chilean peso against the dollar in 2004, which led to a decrease in operating costs of Ch$ 11.4 billion. Energy losses remained constant at 8.4% during the two periods under comparison.
Operating costs at Cerj increased by Ch$ 3.9 billion, or 1.4%, primarily because of an 8.4% increase in the average price of energy purchased in local currency terms, a Ch$ 9.6 billion increase in operating and maintenance costs, and a Ch$ 1.4 billion rise in wages and social welfare benefits. Cerj’s 2004 operating cost expressed in U.S. dollars, using the average exchange rate convention of Technical Bulletin 64, increased as a consequence of the 4.9% appreciation of the Brazilian real, when compared to 2003, with the exception of the depreciation of fixed assets carried in nominal dollars. These increases were partly offset by a Ch$ 3.7 billion decline in depreciation, a 473 GWh reduction in energy purchases and the effect of the 6.1% appreciation of the Chilean peso against the dollar in 2004, which led to a decrease in operating costs of Ch$ 24.3 billion. Energy losses decreased from 23.6% in 2003 to 22.8% in 2004, reflecting management’s focus on reducing such losses.
Operating costs at Coelce, our second Brazilian distribution company, increased by Ch$ 67.6 billion in 2004, a 41.8% increase when compared to 2003, primarily due to a 74.5% increase in the average price of energy purchased expressed in local currency terms which is distorted in 2004 because of the first-time purchases from CGTF. Coelce signed a long-term contract with CGTF in order to assure its electricity supply, and CGTF’s prices are higher because it is a combined cycle plant. Physical energy purchases increased by 3.8%. Additionally, Coelce’s 2004 operating cost expressed in dollars, increased as a consequence of the 4.9% appreciation of the Brazilian real, when compared to 2003, with the exception of the depreciation of fixed assets. These increases were partly offset by Ch$ 2.7 billion in lower depreciation expense and the effect of the 6.1% appreciation of the Chilean peso against the dollar in 2004, which reduced costs by Ch$ 13.4 billion. Energy losses increased by 3.0%, reaching 13.9% in 2004. Despite the increase in energy losses, the absolute level is significantly lower than for Cerj. Coelce’s concession area does not have the same socioeconomic difficulties as that of Cerj, but it is so large that significant loss reductions are difficult to achieve for technical reasons.
Operating costs arising from Codensa, our Colombian distribution company, increased by Ch$ 22.6 billion, or 9.0%, in 2004, principally reflecting a 2.1% increase in physical energy purchases, a salary expense increase of Ch$ 6.1 billion, and an operating and maintenance expense increase of Ch$ 2.5 billion. Our 2004 operating costs expressed in dollars, increased as a consequence of the 8.6% appreciation of the Colombian peso, when compared to 2003. These increases were partly offset by a Ch$ 5.4 billion decline in depreciation expense and the effect of the 6.1% appreciation of the Chilean peso in 2004, which reduced costs by Ch$ 21.1 billion. Energy losses decreased from 10.2% in December 2003 to 9.7% in December 2004.
Generation business operating costs
The 2.2% increase in operating costs in Chile during 2004 when compared to 2003 is due to greater thermal generation fuel expenses and electricity purchases. Weaker hydro conditions during the first semester of 2004 led to a 26% increase in thermal generation, resulting in an average variable cost of generation, excluding electricity purchases, of Ch$ 8.9 per kWh in 2004, compared to Ch$ 8.5 per kWh in 2003. Electricity purchases, both energy and capacity, increased from Ch$ 49.7 billion in 2003 to Ch$ 53.1 billion in 2004. Physical GWh purchases declined, but a higher average price, which grew from Ch$ 20.6 in 2003 to Ch$ 27.7 in 2004, increased total cost. These greater costs were partly offset by a 7% reduction in asset depreciation, from Ch$ 70.7 in 2003 to Ch$ 65.7 in 2004.
Costs of operations in Argentina increased by 41.0% to Ch$ 111.4 billion in 2004. Total physical generation increased by 41%. Thermal generation increased 99% and hydro generation declined 15%. As a result of the natural gas shortage in Argentina, Costanera increased its use of liquid fuel in thermal generation, which is relatively more expensive than natural gas. As a result of the increase in volume and price, fuel costs increased by 237.6% to Ch$ 38.8 billion in 2004. The average variable cost of generation, excluding the cost of electricity purchases, increased from Ch$ 3.1 per kWh in 2003 to Ch$ 5.7 per kWh in 2004 due to the higher cost of fuel. Physical electricity purchases declined in 2004, reducing purchase expenses from Ch$ 9.6 billion in 2003 to Ch$ 5.9 billion in 2004. The cost of asset depreciation increased 7.3%. The appreciation of the Chilean peso in terms of the U.S. dollar reduced total operating expenses in 2004 when compared to 2003 by Ch$ 6.8 billion.
85
Costs of operations in Colombia increased by 5.1% to Ch$ 129.1 billion in 2004 from Ch$ 122.9 billion in 2003. Physical generation was 10.1% greater in 2004 than 2003 as a consequence of favorable hydrology, which, although leading to higher tolls and energy transportation costs, reduced electricity purchases. The variable cost per kWh generated in 2004, excluding the cost of energy purchases, was Ch$ 3.6 compared to Ch$ 4.3 in 2003. The volume of electricity purchases declined 11% and the cost of purchases expressed in Chilean pesos declined 1% affected by the 8% appreciation of the yearly average Colombian peso U.S. dollar exchange rate.Asset depreciation declined 8.4%. The appreciation of the Chilean peso in terms of the U.S. dollar reduced total operating expenses in 2004 when compared to 2003 by Ch$ 11.1 billion.
Costs of operations in Brazil remained stable, reaching Ch$ 26.0 billion in 2004 as compared to Ch$ 25.8 billion in 2003. Physical generation was 8.4% greater in 2004 than 2003 as a consequence of favorable hydrology, which increased transportation costs, but reduced the volume of electricity purchases. The volume of electricity purchases declined 14.1%, but the cost of purchases increased due to the increase in the price of purchases. The average variable cost per kWh generation in 2004, excluding the cost of energy purchases, was Ch$ 1.8 in 2004 and Ch$ 1.9 in 2003. Asset depreciation expense declined. The appreciation of the Chilean peso in terms of the U.S. dollar reduced total operating expenses in 2004 when compared to 2003 by Ch$ 2.2 billion.
Costs of operations in Perú increased by 44.6% to Ch$ 63.8 billion in 2004 from Ch$ 44.1 billion in 2003, mainly due to an increase of Ch$ 14.0 billion in fuel expenses and a Ch$ 4.2 billion increase in energy purchases. The increase in these expenses was due to the lack of rainfall, mainly during the first semester of 2004, which caused total thermal generation in 2004 to be 15 times greater than 2003 and also required an increase in physical energy purchases of 26.6%. The variable cost of generation per kWh, excluding electricity purchases, was Ch$ 7.6 in 2004 compared to Ch$ 3.5 in 2003. The cost of asset depreciation declined 4.6%. The appreciation of the Chilean peso in terms of the U.S. dollar reduced total operating expenses in 2004 when compared to 2003 by Ch$ 3.7 billion.
Selling and administrative expenses
Selling and administrative expenses consist principally of salaries, general administrative expenses, depreciation and amortization, uncollectible accounts and materials and office supplies.
The table below sets forth the breakdown of selling and administrative expenses as a percentage of our total selling and administrative expenses.
| Year ended December 31 | ||||
| 2003 | 2004 | |||
| (as a percentage of selling and administrative expenses) | ||||
| Salaries | 42.80 | % | 42.30 | % |
| General administrative expenses | 38.20 | % | 38.70 | % |
| Depreciation and amortization | 10.90 | % | 9.60 | % |
| Uncollectible accounts | 7.40 | % | 8.90 | % |
| Materials and office supplies | 0.80 | % | 0.60 | % |
| 100.00 | % | 100.00 | % | |
The table below sets forth the breakdown of selling and administrative expenses for the years ended on December 31, 2003 and 2004, as well as percentage changes from period to period.
86
| Year ended December 31, | ||||||||
| 2003 | 2004 | Change | % Change | |||||
| (in million of Ch$ ) | ||||||||
| Chilectra (Chile) | 35,299 | 42,408 | 7,109 | 20.1 | % | |||
| Non-electricity subsidiaries (Chile) (1) | 31,851 | 32,738 | 887 | 2.8 | % | |||
| Total selling and administrative expenses Chile, except generation business | 67,150 | 75,146 | 7,996 | 11.9 | % | |||
| Edesur (Argentina) | 28,724 | 27,811 | (913 | ) | (3.2 | )% | ||
| Distrilima/Edelnor (Peru) | 17,526 | 16,818 | (708 | ) | (4.0 | )% | ||
| Cerj (Brazil) | 11,198 | 14,600 | 3,402 | 30.4 | % | |||
| Investluz/Coelce (Brazil) | 30,374 | 29,794 | (580 | ) | (1.9 | )% | ||
| Codensa (Colombia) | 17,306 | 7,689 | (9,617 | ) | (55.6 | )% | ||
| Total selling and administrative expenses, excluding Chile and generation business | 105,128 | 96,712 | (8,416 | ) | (8.0 | )% | ||
| Endesa-Chile’s total selling and administrative expenses | 32,107 | 34,446 | 2,339 | 7.3 | % | |||
| Less: intercompany transactions | (30,644 | ) | (29,669 | ) | 975 | (3.2 | )% | |
| Total selling and administrative expenses | 173,741 | 176,635 | (2,894 | ) | 1.7 | % | ||
| (1) | Includes operating expenses of CAM, Synapsis, IMV, Enersis Holding and investment vehicles. |
Consolidated selling and administrative expenses increased slightly, from Ch$ 173.7 billion in 2003 to Ch$176.6 billion in 2004, an increase of 1.7%. The largest increases in selling and administrative expenses arose from Chilectra, our Chilean electricity subsidiary, with an increase of Ch$ 7.1 billion, or 20.1% over 2003, and expenses in Cerj, which increased by Ch$ 3.4 billion, or 30.4%, over 2003. Chilectra’s expenses are attributable primarily to application of a more conservative discount rate applied to its future pension benefit liability, which increased expenses by Ch$ 2.8 billion, higher marketing-related expenses of Ch$ 2.4 billion and Ch$ 1.5 billion in incremental expenses associated with employee severance indemnity. Cerj’s increase in selling and administrative expenses is explained primarily by a Ch$ 4.2 billion increase in provisions for uncollectible amounts, partly offset by a decrease in salary expense. These increases in selling and administrative expenses were partly offset by decreases in the selling and administrative expenses of other subsidiaries, particularly Codensa, which had a Ch$ 9.6 billion decrease in selling and administrative expenses in 2004, caused primarily by Ch$ 4.1 billion in lower wages, benefits and compensations, Ch$ 2.8 billion in general reductions, and Ch$ 0.5 billion in the reversal of provisions for uncollectible amounts.
Non-operating income (expense)
The table below sets forth non-operating income (expense) for the year ended December 31, 2003 and 2004, and the percentage change from period to period.
| Year ended December 31, | ||||||||
| 2003 | 2004 | Change | % Change | |||||
| (in million of Ch$ ) | ||||||||
| Net interest expense | (362,027 | ) | (286,504 | ) | 75,523 | (20.9 | )% | |
| Net income from related companies | 17,955 | 31,145 | 13,190 | 73.5 | % | |||
| Net other non-operating income (expense) | (56,832 | ) | (73,723 | ) | (16,891 | ) | 29.7 | % |
| Net monetary exposure | (10,818 | ) | 13,630 | 24,448 | (226.0 | )% | ||
| Goodwill amortization | (54,559 | ) | (53,201 | ) | 1,358 | (2.5 | )% | |
| Non-operating expense | (466,281 | ) | (368,653 | ) | 97,628 | (20.9 | )% | |
Non-operating expenses decreased by Ch$ 97.6 billion, from Ch$ 466.3 billion in 2003 to Ch$ 368.7 billion in 2004, a decrease of Ch$ 97.6 billion, or 20.9%, primarily because of reduced interest expense, beneficial exchange rate differences, and higher income from related companies.
87
Interest expense, net of interest income, decreased from Ch$ 362.0 billion in 2003 to Ch$ 286.5 billion in 2004, a reduction of Ch$ 75.5 billion, or 20.9%. The lower interest expense is a consequence of lower indebtedness and lower interest rates in existing and refinanced debt. Average level of indebtedness, translated into U.S. dollars at year-end exchange rates, decreased by 15.4% in 2004, from U.S.$ 7,952 million in 2003 to U.S.$ 6,724 million in 2004.
Income from unconsolidated entities increased by Ch$ 13.2 billion, or 73.5%, primarily due to Ch$ 11.9 billion in income from Central Generadora de Fortaleza, which started operations in 2004, as well as Ch$ 6.5 billion in increased income from GasAtacama, partly offset by Ch$ 5.0 billion in lower income from CIEN.
Other net non-operating expenses increased by Ch$ 16.9 billion, and are mainly attributable to:
| • | non-recurrence in 2004 of the disposition of investments (Río Maipo and Infraestructura 2000) carried out in 2003 that generated Ch$ 91.5 billion in gains in that period; | |
| • | higher net incremental expenses of Ch$ 12.5 billion associated with the need to pay other electricity generators as a consequence of new calculations carried out by the CDEC-SIC and their corresponding claim that some of our generators needed to compensate for firm capacity in accordance with the Panel of Experts’ interpretation of the Short Law. These payments are being contested by Endesa. See “Item 8—Legal Proceedings” for further information. | |
| • | net losses of Ch$ 5.2 billion on derivative contracts; | |
| • | a greater tax on shareholders’ equity (1.2%) in Colombia, which applies for the first year for all Colombian companies, amounting to Ch$ 4.5 billion; and | |
| • | a Ch$ 2.4 billion decrease in dividends received from Empresa Eléctrica de Bogotá, an unconsolidated equity investment. | |
| Non-operating expense increases were partially offset by: | ||
| • | a Ch$ 12.2 billion decline in losses arising from the Technical Bulletin 64 conversion adjustments, primarily from Cerj and Coelce as a result of the appreciation of the Brazilian real against the United States dollar, and the excess of monetary assets over monetary liabilities at these companies; | |
| • | lower provisions for legal claims against us and the reversal of prior legal provisions, for Ch$ 44.0 billion; | |
| • | lower pension plan expenses in Brazil, for Ch$ 16.2 billion; and | |
| • | indemnity payment received by Edesur related to the Azopardo fire incident in 1999 for Ch$ 7.7 billion. | |
Net monetary exposure consists of the effects of foreign exchange movements and price level restatement on the balance sheet of Enersis and its consolidated subsidiaries. Net monetary exposure led to gains of Ch$ 13.6 billion in 2004 compared to an expense of Ch$ 10.8 billion in 2003. The 2004 gains were attributable primarily to holding a long position in dollars during the first semester, when the dollar reached its peak levels against the Chilean peso, while taking a neutral position in the second semester, when the Chilean peso appreciated significantly against the dollar. In 2004, the Chilean peso appreciated 6.1% against the dollar as compared to 2003. In 2003, the 17.4% appreciation of the peso against the dollar led to losses.
88
Net income
The following table sets forth our net income for the periods indicated.
| Year ended December 31, | ||||||||
| 2003 | 2004 | Change | % Change | |||||
| (in million of Ch$ ) | ||||||||
| Operating income | 549,498 | 634,202 | 84,704 | 15.4 | % | |||
| Non-operating income | (466,281 | ) | (368,653 | ) | 97,628 | (20.9 | )% | |
| Net income before taxes, minority interest andnegative goodwill amortization | 83,217 | 265,549 | 182,332 | 219.1 | % | |||
| Income taxes | (42,610 | ) | (137,241 | ) | (94,631 | ) | 222.1 | % |
| Minority interest | (80,283 | ) | (101,107 | ) | (20,824 | ) | 25.9 | % |
| Amortization of negative goodwill | 52,455 | 17,107 | (35,348 | ) | (67.4 | )% | ||
| Net income | 12,779 | 44,308 | 31,529 | 246.7 | % | |||
The sum of operating and non-operating income increased from Ch$ 83.2 billion in 2003 to Ch$ 265.5 billion in 2004, an increase of Ch$ 182.3 billion, or 219%, for the reasons detailed above.
Following tables shows an analysis on income taxes:
| Year ended December 31, | ||||||||
| 2003 | 2004 | Change | % Change | |||||
| (in million of Ch$ ) | ||||||||
| Income taxes | (103,272 | ) | (90,712 | ) | 12,560 | (12.2 | )% | |
| Deferred taxes | 60,662 | (46,529 | ) | (107,191 | ) | (176.7 | )% | |
| (42,610 | ) | (137,241 | ) | (94,631 | ) | 222.1 | % | |
Income tax paid for fiscal year ended December 31, 2004 decreased by Ch$ 12.6 billion as compared to 2003, primarily due to the non-recurrence in 2003 of income tax arising from the sale of Río Maipo, Canutillar and Infraestructura 2000, which amounted to Ch$ 23.1 billion. This amount was offset by more taxes paid during 2004 due to our companies’ higher taxable results, including tax increases of Ch$ 8.7 billion in Emgesa, Ch$ 6.4 billion in Codensa, Ch$ 3.4 billion in Edelnor and Ch$ 3.2 billion in Cerj.
Deferred taxes, which are non-cash items, increased by Ch$ 107.2 billion, primarily due to an increase of Ch$ 48.0 billion at our generation companies in Argentina, Costanera and Chocón. During 2003, these companies registered important tax losses due to the original devaluation of the Argentine peso. These losses were eliminated in 2004 because of the appreciation of the Argentine peso against the dollar. To a lesser extent, other companies with an increase in deferred taxes include Cerj with Ch$ 27.8 billion, Enersis with Ch$ 12.9 billion, Endesa with Ch$ 8.4 billion, Edegel with Ch$ 5.3 billion, and Edelnor with Ch$ 5.1 billion.
Gains arising from amortization of negative goodwill decreased by Ch$ 35.3 billion in 2004, from Ch$ 52.5 in 2003 to Ch$ 17.1 billion in 2004. The purchase of our increased equity interest in Cerj in early 2003 for an amount below book value created negative goodwill, which was amortized completely during such year, in compliance with accounting norms.
As a consequence of all of the above, our net income increased from Ch$ 12.8 billion in 2003 to Ch$ 44.3 billion in 2004, an increase of Ch$ 31.5 billion, or 247%.
89
Enersis’s Results From Operations for the Years Ended
December 31, 2002 and December 31, 2003
Overview
Our 2003 results, when compared to those of 2002, were mainly affected by the following factors:
| • | our operating income amounted to Ch$ 549.5 billion for the year ended December 31, 2003, which represents a decrease of Ch$ 1.9 billion , or 0.3%, compared to the same period in 2002. The decrease was mainly due to the accounting effect under Technical Bulletin No. 64 of the appreciation of the Chilean peso against the U.S. dollar and the deconsolidation of Río Maipo and Infraestructura 2000. If we eliminate the negative impact of the appreciation of the Chilean peso during 2003, our operating income would have increased by 8.2%. If we eliminate the effect of the deconsolidation of Río Maipo and Infraestructura 2000, as well as the effect of the appreciation of the Chilean peso against the U.S. dollar, operating income would have increased by 12.4%, for the reasons explained below. We believe that it is helpful to eliminate the effects of the deconsolidation of Río Maipo and Infraestructura 2000 and of the appreciation of the Chilean peso in order to understand the underlying trend in our operating income. | |
| • | our non-operating expenses amounted to Ch$ 466.3 billion for the year ended December 31, 2003, which represents a decrease of Ch$ 358.3 billion, or 43.5%, compared to the same period in 2002. This decrease in expenses is mainly explained by the non-recurrence of Ch$ 458.1 billion in write-offs in December 2002 of goodwill arising from our investments in Argentina and Brazil. The effects of Technical Bulletin No. 64 in our non-operating expenses decreased from Ch$ 186.3 billion of gains arising from the conversion effect discussed above during 2002 to Ch$ 69,188 billion of losses from that effect during 2003, mainly due to the fluctuations of the Brazilian real and the Argentine peso against the U.S. dollar during 2002 and 2003; and | |
| • | our amortization of negative goodwill decreased to Ch$ 52.5 billion for the year ended December 31, 2003, which represents a decrease of Ch$ 63.8 billion, or 54.9%, compared to the same period in 2002. This decrease is mainly explained by the write-off of negative goodwill arising from our investments in Argentina and Brazil in December 2002, which did not occur again in 2003. |
The Chilean peso depreciated 6.5% in 2002 and appreciated 18.2% against the U.S. dollar during 2003. We have described the effects of the Chilean peso appreciation during 2003 in our analysis comparing our results of operations of 2002 and 2003.
Operating income
The table below breaks down operating income by country for the years ended December 31, 2002 and 2003.
| Year ended December 31, | ||||||||
| 2002 | 2003 | Change | % Change | |||||
| (in millions of Ch$ ) | ||||||||
| Electricity distribution subsidiaries (Chile) | 101,031 | 95,374 | (5,657 | ) | (5.6 | )% | ||
| Non-electricity subsidiaries (Chile)(1) | 3,779 | 7,998 | 4,217 | 111.6 | % | |||
| Total operating income, Chile except | ||||||||
| generation business (Endesa-Chile) | 104,810 | 103,370 | (1,438 | ) | (1.4 | )% | ||
| Edesur (Argentina) | (13,187 | ) | (5,378 | ) | 7,809 | (59.2 | )% | |
| Distrilima/Edelnor (Peru) | 34,051 | 27,196 | (6,855 | ) | (20.1 | )% | ||
| Cerj (Brazil) | 21,124 | 25,126 | 4,002 | 18.9 | % | |||
| Investluz/Coelce (Brazil) | 24,838 | 20,176 | (4,662 | ) | (18.8 | )% | ||
| Luz de Bogota/Codensa (Colombia) | 22,122 | 31,382 | 9,260 | 41.9 | % | |||
| Total operating income, excluding Chile and generation business | 88,948 | 98,502 | 9,554 | 10.7 | % | |||
90
| Endesa-Chile | ||||||||
| Year ended December 31, | ||||||||
| 2002 | 2003 | Change | % Change | |||||
| (in millions of Ch$ ) | ||||||||
| Operating Income (Chile) | 176,813 | 159,142 | (17,671 | ) | (10.0 | )% | ||
| Operating Income (Argentina) | 13,043 | 33,121 | 20,078 | 153.9 | % | |||
| Operating Income (Colombia) | 78,032 | 88,134 | 10,102 | 12.9 | % | |||
| Operating Income (Brazil) | 17,580 | 3,748 | (13,832 | ) | (78.7 | )% | ||
| Operating Income (Peru) | 72,962 | 62,829 | (10,133 | ) | (13.9 | )% | ||
| Endesa-Chile’s total operating income | 358,430 | 346,974 | (11,454 | ) | (3.2 | )% | ||
| Less: intercompany transactions | (768 | ) | 650 | 1,418 | n.a. | |||
| Total operating income | 551,420 | 549,498 | (1,922 | ) | (0.3 | )% | ||
| (1) | Includes operating income of CAM, Synapsis, IMV, Enersis Holding and investment vehicles. |
The table below breaks down operating income by segment for the years ended December 31, 2002 and 2003.
| Year ended December 31, | ||||||||||||||||||||
| (in million of Ch$ ) | ||||||||||||||||||||
| Intercompany | ||||||||||||||||||||
| Generation | Distribution | Other | Transactions | Total | ||||||||||||||||
| 2002 | 2003 | 2002 | 2003 | 2002 | 2003 | 2002 | 2003 | 2002 | 2003 | |||||||||||
| Operating revenues | 929,166 | 918,633 | 1,824,225 | 1,651,254 | 206,748 | 181,138 | (386,639 | ) | (332,574 | ) | 2,573,500 | 2,418,451 | ||||||||
| Operating costs | (545,437 | ) | (543,006 | ) | (1,447,592 | ) | (1,316,948 | ) | (151,871 | ) | (137,837 | ) | 353,865 | 302,579 | (1,791,035 | ) | (1,695,212 | ) | ||
| Operating margin | 383,729 | 375,627 | 376,633 | 334,306 | 54,877 | 43,301 | (32,774 | ) | (29,995 | ) | 782,465 | 723,239 | ||||||||
| Selling and administrative expenses | (35,242 | ) | (31,017 | ) | (186,671 | ) | (140,429 | ) | (41,140 | ) | (32,939 | ) | 32,008 | 30,644 | (231,045 | ) | (173,741 | ) | ||
| Operating income | 348,487 | 344,610 | 189,962 | 193,877 | 13,737 | 10,362 | (766 | ) | 649 | 551,420 | 549,498 | |||||||||
In 2003, our operating income decreased Ch$ 1.9 billion, or 0.3%, to Ch$ 549.5 billion. This decrease reflects the effect of the appreciation of the Chilean peso against the U.S. dollar and the deconsolidation of Río Maipo and Infraestructura 2000, offset in part by increased volumes of electricity sold and price increases in some of the markets in which we operate. If we eliminate the effect of the appreciation of the Chilean peso against the U.S. dollar and the deconsolidation of Río Maipo and Infraestructura 2000 our operating income would have increased 12.4% year on year, or 8.2% if we eliminate only the effect of appreciation of the Chilean peso. We believe that it is helpful to eliminate the effects of the deconsolidation of Río Maipo and Infraestructura 2000 and of the appreciation of the Chilean peso in order to understand the underlying trend in our operating income.
Operating income in our subsidiaries Codensa, Cerj, Edesur, Synapsis and CAM increased while that of our subsidiaries Endesa-Chile, Edelnor, Coelce and IMV decreased.
Physical sales in our distribution business increased from 48,953 GWh as of December 31, 2002 to 49,677 GWh as of December 31, 2003, or 1.5%. In addition, physical sales in our generation business also increased from 48,629 GWh as of December 31, 2002 to 51,053 GWh as of December 31, 2003, or 5.0%. These increases are mainly due to economic recovery in most of the countries in which we operate. Our customer base increased 5.0% from 9.98 million as of December 31, 2002 to 10.48 million as of December 31, 2003. This amounts to 0.5 million new clients. Our 2003 operating income also benefited from distribution tariff increases in Brazil and Colombia, which are discussed in greater detail below in “Operating Revenues,” and improved margins in Argentina due to high levels of rainfall, which allowed more electricity to be dispatched from our hydroelectric generation subsidiary, El Chocón.
Our operating margin as a percentage of revenues decreased slightly from 30.4% in 2002 to 29.8% in 2003, reflecting a decline in operating margin in Brazil.
91
Revenues from operations
Our revenues from operations are derived principally from electricity generation and distribution. Generation revenues are derived mainly from the sale of electricity. Electricity distribution operating revenues consist of resale of electricity and Value Added from Distribution, or VAD, revenues. Resale of electricity revenues consist of revenues related to the recovery of the cost of wholesale electricity purchased from electricity generation companies. VAD revenues consist of revenues related to the recovery of costs and return on investment associated with distribution assets and allowed losses under the current tariff regulations. Other revenues derived from our distribution services consist of charges related to new connections and maintenance and leases of meters.
The table below presents, for the periods indicated, the breakdown of physical sales of electricity by our distribution subsidiaries and percentage changes from period to period.
| Physical sales during | ||||||||
| Distribution Business | Year ended December 31, | |||||||
| 2002 | 2003 | Change | % Change | |||||
| (GWh) | ||||||||
| Chile | ||||||||
| Chilectra | 9,952 | 10,518 | 566 | 5.7 | % | |||
| Río Maipo | 1,274 | 0 | (1,274 | ) | n.a. | |||
| Argentina(1) | 12,138 | 12,638 | 500 | 4.1 | % | |||
| Peru | 3,872 | 3,972 | 100 | 2.6 | % | |||
| Brazil | 12,703 | 13,295 | 592 | 4.7 | % | |||
| Colombia(1) | 9,014 | 9,254 | 240 | 2.7 | % | |||
| Total | 48,953 | 49,677 | 724 | 1.5 | % | |||
| (1) | Includes sales of third party energy for which we are paid transmission tolls. |
The table below presents, for the periods indicated, the breakdown of physical sales of electricity by our generation subsidiaries and percentage changes from period to period.
| Physical sales during | ||||||||
| Generation Business | Year ended December 31, | |||||||
| 2002 | 2003 | Change | % Change | |||||
| (GWh) | ||||||||
| Chile | 18,344 | 18,681 | 337 | 1.8 | % | |||
| Argentina | 7,897 | 9,259 | 1,362 | 17.2 | % | |||
| Peru | 4,158 | 4,443 | 285 | 6.9 | % | |||
| Brazil | 3,591 | 3,770 | 179 | 5.0 | % | |||
| Colombia | 14,639 | 14,900 | 261 | 1.8 | % | |||
| Total | 48,629 | 51,053 | 2,424 | 5.0 | % | |||
The table below presents, for the periods indicated, the breakdown of our operating revenues and percentage changes from period to period.
| Year ended December 31, | ||||||||
| 2002 | 2003 | Change | % Change | |||||
| (in millions of Ch$ ) | ||||||||
| Electricity distribution subsidiaries (Chile) | 470,632 | 444,802 | (25,830 | ) | (5.5 | )% | ||
| Non-electricity subsidiaries (Chile)(1) | 164,748 | 156,484 | (8,264 | ) | (5.0 | )% | ||
| Total operating revenues, Chile except generation business | 635,380 | 601,286 | (34,094 | ) | (5.4 | )% | ||
| Edesur (Argentina) | 206,510 | 188,540 | (17,969 | ) | (8.7 | )% | ||
| Distrilima/Edelnor (Peru) | 210,812 | 180,346 | (30,466 | ) | (14.5 | )% | ||
| Year ended December 31, | ||||||||
| 2002 | 2003 | Change | % Change | |||||
| (in millions of Ch$ ) | ||||||||
| Cerj (Brazil) | 357,328 | 325,533 | (31,795 | ) | (8.9 | )% | ||
| Investluz/Coelce (Brazil) | 235,752 | 212,572 | (23,180 | ) | (9.8 | )% | ||
| Luz de Bogotá/Codensa (Colombia) | 343,190 | 299,459 | (43,731 | ) | (12.7 | )% | ||
| Total operating revenues, excluding Chile and generation business | 1,353,592 | 1,206,451 | (147,141 | ) | (10.9 | )% | ||
| Endesa-Chile | ||||||||
| Sales of electricity (Chile) | 418,959 | 439,877 | 20,918 | 5.0 | % | |||
| Sales of electricity (Argentina) | 101,615 | 114,061 | 12,446 | 12.2 | % | |||
| Sales of electricity (Colombia) | 233,227 | 213,583 | (19,644 | ) | (8.4 | )% | ||
| Sales of electricity (Brazil) | 53,215 | 31,562 | (21,653 | ) | (40.7 | )% | ||
| Sales of electricity (Peru) | 120,982 | 113,685 | (7,297 | ) | (6.0 | )% | ||
| Other | 43,169 | 30,520 | (12,649 | ) | (29.3 | )% | ||
| Endesa-Chile’s total revenues | 971,167 | 943,288 | (27,879 | ) | (2.9 | )% | ||
| Less: intercompany transactions | (386,639 | ) | (332,574 | ) | 54,065 | (14.0 | )% | |
| Total operating revenues | 2,573,500 | 2,418,451 | (155,049 | ) | (6.0 | )% | ||
| (1) | Includes operating revenues of CAM, Synapsis, IMV, Enersis Holding and investment vehicles |
Distribution business revenues from operations
Operating revenues of our Chilean distribution subsidiaries (Chilectra S.A., or Chilectra, and Río Maipo in 2002, and only Chilectra for 2003) decreased Ch$ 25.8 billion, or 5.5%, compared to 2002. This decrease is mainly explained by the sale of Río Maipo in April 2003. In accordance with Chilean GAAP, the 2002 period includes the full year of Río Maipo results amounting to Ch$ 58.26 billion in consolidated revenues, whereas the 2003 period includes no results of Río Maipo. This decrease is partially offset by an increase of Ch$ 25.5 billion in operating revenues of Chilectra during 2003, mainly due to a 5.7% increase in physical sales from 9,952 GWh in 2002 to 10,518 GWh in 2003, resulting from a 1.7% increase in customers to 1.34 million as of December 31, 2003 and an increase in average per capita consumption of 3.5% compared to the same period in 2002. The gain from the sale of Río Maipo as well as the results of Río Maipo as of April 2003 are reflected in Enersis’ non-operating income in 2003.
Operating revenues from our Argentine electricity distributor,Empresa Distribuidora Sur S.A., or Edesur, decreased Ch$ 17.9 billion, or 8.7%, during 2003. This decrease is mainly explained by a negative effect amounting to Ch$ 35.4 billion resulting from the appreciation of the Chilean peso against the U.S. dollar in the periods under comparison and by the reduction of toll-related revenues during 2003 which decreased Ch$ 3.6 billion, or 11.8% in Gwh terms, compared to the same period in 2002. Operating revenues decreased, despite an increase of 4.1% in physical sales resulting from a 1.3% increase in customers to 2.12 million as of December 31, 2003 and an increase in average per capita consumption of 3.44% compared to the same period in 2002. Edesur’s operating revenues as reflected in our consolidated operating revenues under Chilean GAAP also were positively affected by the appreciation of the Argentine peso against the U.S. dollar in 2003 compared to 2002.
Operating revenues ofDistrilima S.A., or Distrilima, our Peruvian subsidiary that consolidates the electricity distribution companyEmpresa de Distribución Eléctrica de Lima Norte S.A.A., or Edelnor, decreased Ch$ 30.4 billion, or 14.5%, during 2003. This decrease is mainly explained by a negative effect amounting to Ch$ 36.1 billion resulting from the appreciation of the Chilean peso against the U.S. dollar in the periods under comparison. Operating revenues decreased, despite an increase of 2.6% in physical sales resulting from a 2.4% increase in customers to 0.89 million as of December 31, 2003 and an increase in average per capita consumption of 1.2% compared to the same period in 2002.
93
Operating revenues of our Brazilian distribution subsidiary,Companhia de Electricidade do Rio de Janeiro S.A., or Cerj, decreased Ch$ 31.8 billion, or 8.9%, during 2003. This decrease is mainly explained by a negative effect amounting to Ch$ 61.4 billion resulting from the appreciation of the Chilean peso against the U.S. dollar in the periods under comparison. In addition, there was no recurrence during 2003 of the Ch$ 19.7 billion one-time tariff compensation package received by Cerj in 2002 from the Brazilian government to partially compensate for the rationing that took place during 2001 and the first quarter of 2002. Operating revenues decreased, despite an increase of 3.5% in physical sales resulting from a 7.1% increase in customers to 1.9 million as of December 31, 2003 and a decrease in average per capita consumption of 2.9% compared to the same period in 2002. Also, in January 2003 the Brazilian government increased the tariffs charged by Cerj by 28.56% which resulted in an increase of 23.4% in Cerj’s average tariffs in local currency terms compared to average tariffs charged during 2002.
Operating revenues of our Brazilian distribution subsidiary,Companhia Energetica do Ceara S.A., or Coelce, our other Brazilian distribution subsidiary, decreased Ch$ 23.2 billion, or 9.8%, during 2003. This decrease is mainly explained by a negative effect amounting to Ch$ 40.6 billion resulting from the appreciation of the Chilean peso against the U.S. dollar in the periods under comparison. In addition, like Cerj, during 2003 Colece did not receive a Ch$ 15.7 billion one-time tariff compensation package paid in 2002 by the Brazilian government. Operating revenues decreased, despite an increase of 6.1% in physical sales resulting from a 12.2% increase in customers to 2.3 million as of December 31, 2003 and an increase in average per capita consumption of 2.1% compared to the same period in 2002. Also, in April 2003 the Brazilian government increased the tariffs charged by Coelce by 31.8% which resulted in an increase of 28.0% in Coelce’s average tariffs in local currency terms compared to tariffs charged during 2002.
Operating revenues ofCodensa S.A. E.S.P., or Codensa, decreased Ch$ 43.8 billion, or 12.7%, during 2003. This decrease is mainly explained by a negative effect amounting to Ch$ 59.0 billion resulting from the appreciation of the Chilean peso against the U.S. dollar in the periods under comparison. Operating revenues decreased, despite an increase of 2.7% in physical sales resulting from a 3.2% increase in customers to 1.97 million as of December 31, 2003 and a decrease in average per capita consumption of 0.7% during 2003 compared to the same period in 2002. Also, in September 2003 the Colombian government increased the average tariffs charged by Codensa by 15.4% which resulted in an increase of 14.0% in Codensa’s average tariffs in local currency terms compared to average tariffs charged during 2002. The effect of this tariff increase on our Chilean GAAP consolidated operating revenues was largely offset by the devaluation of the Colombian peso against the U.S. dollar in 2003 compared to 2002.
Generation business revenues from operations
Revenues from sales of electricity in Chile increased by 5.0% to Ch$ 439.8 billion in 2003 from Ch$ 418.9 billion in 2002. This increase was mainly due to an increase in the average sales price of 3.1% to Ch$ 23.6 per kWh in 2003 from Ch$ 22.9 per kWh in 2002 and an increase in volume terms of approximately 4.6% in contractual sales offset in part by a decrease in spot sales volumes of approximately 10.7%.
Revenues from sales of electricity in Argentina increased by 12.2% to Ch$ 114.1 billion in 2003, from Ch$ 101.6 billion in 2002. The increase in revenues was primarily due to higher water levels in El Chocón’s reservoir, which allowed the company to increase physical energy sales by 25.7% (generating a Ch$ 14.0 billion increase in revenues), as well as a 9.7% increase in physical energy sales at Costanera (generating a Ch$ 16.9 billion increase in revenues) from the second interconnection line with Brazil, which operated throughout 2003, but only the last five months of 2002. These positive factors were offset in part by the impact of the appreciation of the Chilean peso against the dollar, which caused a decrease in revenues of Ch$ 18.5 billion.
Revenues from sales of electricity in Colombia decreased by 8.4% to Ch$ 213.6 billion in 2003 from Ch$ 233.2 billion in 2002. This was mainly due to the impact of the appreciation of the Chilean peso against the U.S. dollar, which caused a decrease in revenues of Ch$ 42.6 billion.This decrease was offset in part by an increase of 1.8% in physical energy sales (generating a Ch$ 21.7 billion increase in revenues) due to a 208.5% increase in non-regulated sales offset in part by a decrease of 37.5% in regulated and spot physical energy sales.
Revenues from sales of electricity in Brazil decreased by 40.7% to Ch$ 31.6 billion in 2003 from Ch$ 53.2 billion in 2002. This primarily reflected a decline of 43.4% in the average price of electricity sold due to good hydrological conditions in the region as well as the dispute between Cachoeira Dourada and CELG, which resulted in a loss of Ch$ 12.0 billion. Revenues were also adversely affected by the appreciation of the Chilean peso against the U.S. dollar, which caused a decrease in revenues of Ch$ 9.6 billion. These effects were offset in part by a 5% increase in physical sales.
94
Revenues from sales of electricity in Peru decreased by 6.0% to Ch$ 113.6 billion in 2003 from Ch$ 121.0 billion in 2002, due to the appreciation of the Chilean peso against the U.S. dollar, which caused a decrease of Ch$ 22.1 billion, partially offset by an increase of 6.9% in physical sales that generated additional revenues of Ch$ 15.0 billion.
Other revenues decreased by 29,3% to Ch$ 30.5 billion in 2003 from Ch$ 43.1 billion in 2002, mainly due to the sale of Infraestructura Dos Mil S.A. (“Infraestructura”) in June 2003. Infraestructura Dos Mil S.A. revenues in 2002 amounted to Ch$ 20.9 billion. Under Chilean GAAP, Endesa-Chile ceased consolidating Infraestructura Dos Mil S.A. with effect from January 1, 2003. The effect of this disposition was partially offset by an increase of Ch$ 6.2 billion of other revenues in Chile.
Operating costs
Operating costs consist principally of electricity purchases from third parties, depreciation and amortization, tolls paid to transmission companies, maintenance costs, salaries, fuel purchases and other expenses.
The table below sets forth the breakdown of the costs described above as a percentage of our total costs of operations for the years ended December 2002 and 2003.
| Year ended December 31, | ||||
| 2002 | 2003 | |||
| (as a percentage of | ||||
| operating costs) | ||||
| Electricity purchases | 42.2 | % | 44.2 | % |
| Depreciation and amortization | 25.7 | % | 23.4 | % |
| Transmission tolls | 7.3 | % | 8.0 | % |
| Operating costs and maintenance | 9.3 | % | 7.8 | % |
| Salaries | 5.9 | % | 5.9 | % |
| Fuel purchases | 5.1 | % | 5.5 | % |
| Other expenses | 4.4 | % | 5.2 | % |
| 100 | % | 100 | % | |
The table below sets forth the breakdown of costs of operations for the years ended on December 31, 2002 and 2003.
| Year ended December 31, | ||||||||
| 2002 | 2003 | Change | % Change | |||||
| (in millions of Ch$ ) | ||||||||
| Electricity distribution subsidiaries (Chile) | (332,473 | ) | (314,129 | ) | 18,344 | (5.5 | )% | |
| Non-electricity subsidiaries (Chile)(1) | (122,138 | ) | (116,635 | ) | 5,503 | (4.5 | )% | |
| Total operating costs, Chile except generation business | (454,611 | ) | (430,764 | ) | 23,847 | (5.7 | )% | |
| Edesur (Argentina) | (188,033 | ) | (165,195 | ) | 22,838 | (12.1 | )% | |
| Distrilima/Edelnor (Peru) | (156,539 | ) | (135,623 | ) | 20,916 | (13.4 | )% | |
| Cerj (Brazil) | (314,040 | ) | (289,209 | ) | 24,831 | (7.9 | )% | |
| Investluz/Coelce (Brazil) | (169,078 | ) | (162,022 | ) | 7,056 | (4.2 | )% | |
| Luz de Bogotá/Codensa (Colombia) | (287,427 | ) | (250,770 | ) | 36,657 | (12.8 | )% | |
| Total operating costs, excluding Chile and generation business | (1,115,117 | ) | (1,002,819 | ) | 112,298 | (10.1 | )% | |
95
| Year ended December 31, | ||||||||
| 2002 | 2003 | Change | % Change | |||||
| (in millions of Ch$ ) | ||||||||
| Endesa-Chile | ||||||||
| Cost of operations (Chile) | (265,386 | ) | (292,396 | ) | 27,010 | 10.2 | % | |
| Cost of operations (Argentina) | (86,717 | ) | (78,962 | ) | (7,755 | ) | (8.9 | )% |
| Cost of operations (Colombia) | (148,916 | ) | (122,891 | ) | (26,025 | ) | (17.5 | )% |
| Cost of operations (Brazil) | (33,724 | ) | (25,845 | ) | (7,879 | ) | (23.4 | )% |
| Cost of operations (Peru) | (40,428 | ) | (44,114 | ) | 3,686 | 9.1 | % | |
| Endesa-Chile’s total operating costs | (575,171 | ) | (564,208 | ) | 10,693 | (1.9 | )% | |
| Less: intercompany transactions | 353,864 | 302,579 | (51,285 | ) | (14.5 | )% | ||
| Total operating costs | (1,791,035 | ) | (1,695,212 | ) | 95,823 | 5.4 | % | |
| (1) | Includes operating costs of CAM, Synapsis, IMV, Enersis Holding and investment vehicles. |
Distribution business operating costs
Operating costs in Chile decreased Ch$ 23.8 billion, or 5.7%, during 2003 mainly due to a Ch$ 18.3 billion decrease in operating costs of our electricity subsidiaries, resulting from a Ch$ 43.9 billion decrease in costs due to the deconsolidation of Río Maipo, partially offset by a Ch$ 23.3 billion increase in operating costs of Chilectra. The higher operating costs of Chilectra are related to a 5.7% increase in physical sales. Our non-electricity subsidiaries experienced a decrease in operating costs equal to Ch$ 5.5 billion, or 4.5%, during 2003 due to lower material and equipment purchases by Synapsis of Ch$ 5.7 billion and by CAM of Ch$ 6.5 billion, partially offset by an increase in costs of IMV by Ch$ 4.7 billion.
Operating costs of Edesur, our Argentine distribution subsidiary, decreased Ch$ 22.8 billion, or 12.1%, as of December 31, 2003 compared to the same period in 2002. This decrease is mainly explained by a positive effect amounting to Ch$ 32.2 billion resulting from the appreciation of the Chilean peso against the U.S. dollar in the periods under comparison and a reduction of maintenance costs by Ch$ 4.4 billion. This decrease was partially offset by a 4.5% increase in energy purchases from 13,750 GWh during 2002 to 14,364 GWh during 2003, equal to Ch$ 14.2 billion, due to increased demand, a 7.2% increase in average purchase price in local currency terms and by an increase in energy losses from 11.6% during 2002 to 11.8% during 2003 due to vandalism and theft. Edesur’s operating costs as reflected in our consolidated Chilean GAAP operating costs also were respectively affected by the appreciation of the Argentine peso against the U.S. dollar in 2003 compared to 2002.
Operating costs for Distrilima, the Peruvian company that consolidates the electricity distribution company Edelnor, decreased Ch$ 20.9 billion, or 13.4%, as of December 31, 2003 compared to the same period in 2002. This decrease is mainly explained by a positive effect amounting to Ch$ 26.9 billion resulting from the appreciation of the Chilean peso against the U.S. dollar in the periods under comparison, and to a lesser extent to a decrease in energy losses from 8.5% during 2002 to 8.4% during 2003. This decrease was partially offset by a 2.3% increase in energy purchases from 4,233 GWh during 2002 to 4,329 GWh during 2003, equal to Ch$ 6.8 billion, due to increased demand, and a 4% increase in average purchase price in local currency terms.
Operating costs for Cerj, one of our Brazilian electricity distribution companies, decreased Ch$ 24.8 billion, or 7.9%, as of December 31, 2003 compared to the same period in 2002. This decrease is mainly explained by a positive effect amounting to Ch$ 54.0 billion resulting from the appreciation of the Chilean peso against the U.S. dollar in the periods under comparison, a decrease of Ch$ 1.9 billion in salaries and a decrease of Ch$ 9.8 billion in maintenance costs. This decrease was partially offset by a 4.1% increase in energy purchases from 8,914 GWh during 2002 to 9,283 GWh during 2003, equal to Ch$ 43.6 billion, due to increased demand, a 38.8% increase in average purchase price in local currency terms and by an increase in energy losses from 22.6% during 2002 to 23.6% during 2003 due to vandalism and theft especially in thefavelas, which are very low income housing areas where energy theft is high during economic downturns. The increase in the average purchase price of energy reflected the effect of inflation and currency indexation provisions in our energy purchase contracts.
96
Operating costs for Coelce, our other Brazilian electricity distribution company, decreased Ch$ 7.1 billion, or 4.2%, as of December 31, 2003 compared to the same period in 2002. This decrease is mainly explained by a positive effect amounting to Ch$ 29.1 billion resulting from the appreciation of the Chilean peso against the U.S. dollar in the periods under comparison. This decrease was partially offset by a 6.8% increase in energy purchases from 6,393 GWh during 2002 to 6,825 GWh during 2003, equal to Ch$ 14.6 billion, due to increased demand, an increase of Ch$ 3.3 billion in miscellaneous costs, an increase of Ch$ 2.7 billion in salaries, a 43.3% increase in average purchase price in local currency terms and by an increase in energy losses from 12.9% during 2002 to 13.5% during 2003 due to defects in the electric grid and to a lesser extent to vandalism and theft. The increase in the average purchase price of energy reflected the effect of inflation and currency index energy provisions in our energy purchase contracts.
Operating costs for Codensa, our Colombian electricity distribution company, decreased Ch$ 36.7 billion, or 12.8%, as of December 31, 2003 compared to the same period in 2002. This decrease is mainly explained by a positive effect amounting to Ch$ 49.4 billion resulting from the appreciation of the Chilean peso against the U.S. dollar in the periods under comparison and to a lesser extent to a decrease in energy losses from 10.3% during 2002 to 10.2% during 2003. This decrease was partially offset by a 2.4% increase in energy purchases from 10,067 GWh during 2002 to 10,310 GWh during 2003, equal to Ch$ 11.1 billion, due to increased demand and a 16.7% increase in average purchase price in local currency terms. The increase in average purchase price of energy resulted from the bankruptcy of the counterparty to a long term supply contract, which required Codensa to recontract the supply on a shorter term, more expensive basis. Codensa’s operating costs as reflected in our consolidated Chilean GAAP operating costs also were positively affected by the devaluation of the Colombian peso against the U.S. dollar in 2003 compared to 2002.
Generation business operating costs
Chilean operating costs increased 10.2% to Ch$ 292.4 billion in 2003 from Ch$ 265.4 billion in 2002. Weaker hydrological conditions caused a 17.4% increase in variable costs (Ch$ 28.1 billion) resulting from: (i) a 26.5% increase in thermoelectric generation, producing a Ch$ 5.0 billion increase in fuel costs and Ch$ 2.9 billion higher tolls and energy transport costs, mainly gas transportation necessary for the thermo generation, and (ii) a 63.1% increase in energy and power purchases at an average purchase price of Ch$ 20.6 per KWh during 2003, 60% higher than during 2002, which increased costs by Ch$ 19.3 billion.
Costs of operations in Argentina decreased by 8.9% to Ch$ 78.9 billion in 2003 from Ch$ 86.7 billion in 2002, mainly due to a Ch$ 15.8 billion decrease in expenses due to the appreciation of the Chilean peso against the U.S. dollar. This effect was offset in part by an increase of Ch$ 4.4 billion in fuel costs, energy and power purchases at Costanera due to 13.3% higher thermoelectric generation and Ch$ 2.9 billion of higher energy and power purchases at el Chócon, both because of higher levels of energy demand.
Costs of operations in Colombia decreased by 17.5% to Ch$ 122.8 billion in 2003 from Ch$ 148.9 billion in 2002, principally reflecting a Ch$ 27.1 billion decrease in expenses due to the appreciation of the Chilean peso against the U.S. dollar.
Costs of operations in Brazil decreased by 23.4% to Ch$ 25.8 billion in 2003 from Ch$ 33.7 billion in 2002, principally reflecting a Ch$ 6.2 billion decrease in expenses due to the appreciation of the Chilean peso against the U.S. dollar and Ch$ 4.5 billion decrease due to a 71% decrease in the average price of purchased energy, offset in part by a Ch$ 2.7 billion increase in other variable costs.
Costs of operations in Peru increased by 9.1% to Ch$ 44.1 billion in 2003 from Ch$ 40.4 billion in 2002, mainly due to an increase of Ch$ 7.3 billion in energy purchases and tolls and transport costs due to lack of rainfall and an increase of Ch$ 4.4 billion in depreciation because of higher fixed assets. These increases were offset in part by a Ch$ 7.4 billion decrease in expenses due to the appreciation of the Chilean peso against the U.S. dollar and also by Ch$ 1.2 billion of lower other fixed costs.
97
Selling and administrative expenses
Selling and administrative expenses consist principally of salaries, general administrative expenses, depreciation and amortization, uncollectible accounts and materials and office supplies.
The table below sets forth the breakdown of selling and administrative expenses as a percentage of our total selling and administrative expenses.
| Year ended December 31, | ||||
| 2002 | 2003 | |||
| (as a percentage of | ||||
| administrative expenses) | ||||
| Salaries | 41.8 | % | 42.8 | % |
| General administrative expenses | 40.1 | % | 38.2 | % |
| Depreciation and amortization | 9.0 | % | 10.9 | % |
| Uncollectible accounts | 8.4 | % | 7.4 | % |
| Materials and office supplies | 0.7 | % | 0.8 | % |
| 100 | % | 100 | % | |
The table below sets forth the breakdown of selling and administrative expenses for the years ended on December 31, 2002 and 2003, as well as percentage changes from period to period.
| Year ended December 31, | ||||||||
| 2002 | 2003 | Change | % Change | |||||
| (in millions of Ch$ ) | ||||||||
| Electricity distribution subsidiaries (Chile) | (37,127 | ) | (35,299 | ) | 1,828 | (4.9 | )% | |
| Non-electricity subsidiaries (Chile)(1) | (38,830 | ) | (31,851 | ) | 6,979 | (18.0 | )% | |
| Total selling and administrative expenses Chile, except generation business | (75,957 | ) | (67,150 | ) | 8,807 | (11.6 | )% | |
| Edesur (Argentina) | (31,663 | ) | (28,724 | ) | 2,939 | (9.3 | )% | |
| Distrilima/Edelnor (Peru) | (20,222 | ) | (17,526 | ) | 2,696 | (13.3 | )% | |
| Cerj (Brazil) | (22,165 | ) | (11,198 | ) | 10,967 | (49.5 | )% | |
| Investluz/Coelce (Brazil) | (41,836 | ) | (30,374 | ) | 11,462 | (27.4 | )% | |
| Luz de Bogota/Codensa (Colombia) | (33,642 | ) | (17,306 | ) | 16,336 | (48.6 | )% | |
| Total selling and administrative expenses, excluding Chile and generation business | (149,528 | ) | (105,128 | ) | 44,400 | (29.7 | )% | |
| Endesa-Chile | (37,568 | ) | (32,107 | ) | 5,461 | (14.5 | )% | |
| Less: intercompany transactions | 32,008 | 30,644 | (1,364 | ) | (4.3 | )% | ||
| Total selling and administrative expenses | (231,045 | ) | (173,741 | ) | 57,304 | (24.8 | )% | |
| (1) | Includes selling and administrative expenses of CAM, Synapsis, IMV, Enersis Holding and investment vehicles. |
Selling and administrative expenses for our Chilean electricity distribution subsidiaries decreased by 4.9%, or Ch$ 1.8 billion, from Ch$ 37.1 billion as of December 2002 to Ch$ 35.3 billion as of December 2003. This was attributable to a Ch$ 4.1 billion decrease resulting from the deconsolidation of Río Maipo, partially offset by a Ch$ 1.5 billion increase in operating and maintenance expenses, and a Ch$ 0.4 billion increase in salaries.
Selling and administrative expenses for our Chilean non-electricity subsidiaries decreased by 18.0%, or Ch$ 7.0 billion, from Ch$ 38.8 billion in 2002 to Ch$ 31.9 billion in 2003, explained by a decrease of Ch$ 1.9 billion in salary expense, a reduction in the provision for uncollectible accounts at CAM of Ch$ 0.8 billion and a number of other smaller reductions.
98
Edesur’s expenses fell to Ch$ 28.7 billion in 2003, a decrease of Ch$ 2.9 billion, or 9.3%, in comparison to 2002. There was a Ch$ 2.4 billion decrease in provisions for uncollectible accounts, partially offset by a Ch$ 815.9 million increase in salaries, as well as number of other smaller effects.
Edelnor’s selling and general administrative expenses decreased by Ch$ 2.7 billion, or 13.3%, in 2003, primarily explained by Ch$ 1.1 billion reduction in salary expenses.
Cerj’s selling and administrative expenses decreased by 49.5%, or Ch$ 10.9 billion, from Ch$ 22.1 billion in 2002 to Ch$ 11.1 billion in 2003, primarily because of the non-recurrence in 2003 of approximately Ch$ 9.1 billion in expenses incurred in 2002 in connection with a campaign against energy theft, and to a lesser degree, on a salary expense reduction of Ch$ 1.0 billion.
Coelce’s expenses in 2003 decreased by 27.4%, or Ch$ 11.4 billion, reflecting a Ch$ 2.9 billion reduction in salary expenses and a number of other smaller reductions.
Codensa’s expenses decreased by 48.6%, or Ch$ 16.3 billion, in 2003, in comparison to 2002, primarily because of a Ch$ 11.5 billion reduction in salary expenses resulting from a reversal of provisions for pension expense and, to a lesser extent, reduced headcount and to a Ch$ 2.9 billion reduction provisions for uncollectible accounts.
Administrative and selling expenses at Endesa-Chile and its subsidiaries decreased by 14.5% to Ch$ 32.1 billion in 2003 from Ch$ 37.6 billion in 2002. This is due to a decrease of Ch$ 3.6 billion resulting from the impact of the appreciation of the Chilean peso against the U.S. dollar. Other important factors were a decrease in salaries and other expenses in Colombia by Ch$ 3.6 billion and Ch $1.6 billion higher general expenses in the other foreign subsidiaries.
Non-operating income (expense)
The table below sets forth non-operating income (expense) for the year ended December 31, 2002 and 2003, and the percentage change from period to period.
| Year ended December 31, | ||||||||
| 2002 | 2003 | Change | % Change | |||||
| (in millions of Ch$ ) | ||||||||
| Net interest expense | (372,275 | ) | (362,027 | ) | 10,248 | (2.8 | )% | |
| Net income from related companies | 8,556 | 17,955 | 9,399 | 109.9 | % | |||
| Net other non-operating income (expense) | 74,841 | (56,832 | ) | (131,673 | ) | (175.9 | )% | |
| Net monetary exposure | (11,537 | ) | (10,818 | ) | 719 | (6.2 | )% | |
| Goodwill amortization | (524,192 | ) | (54,559 | ) | 469,633 | (89.6 | )% | |
| Total non-operating income (expense) | (824,607 | ) | (466,281 | ) | 358,326 | (43.5 | )% | |
Total non-operating expense decreased Ch$ 358.3 billion, or 43.5%, from Ch$ 824.6 billion losses as of December 2002, to Ch$ 466.2 billion losses as of December 2003. This was mainly explained by a Ch$ 469.6 billion decrease in goodwill amortizations due to the non-recurrence in 2003 of write-offs relating to investments in Argentina and Brazil, partially offset by an increase of Ch$ 131.7 billion in other non-operating expenses.
Net interest expense decreased Ch $ 4.7 billion, or 1.3%, as a consequence of debt repayments, offset in part by an increase in the spread over LIBOR paid on our indebtedness Through its debt repayments, Enersis reduced its consolidated debt by Ch$ 1,566.0 billion. Notwithstanding, this reduction was partially offset by fees amounting to Ch$ 40.0 billion associated with the prepayment of bank loans with the proceeds of the capital increase during 2003 and other loans that were refinanced during the same period. Net interest expense excluding such fees declined by 13.5%. We believe that it is important to consider our interest expenses excluding such fees because prepayment levels in 2003 were unusual. During 2002, we did not have any prepayment expenses. Please see a reconciliation of this non-GAAP measure to Chilean GAAP in section “Reconciliation of non-GAAP measures to Chilean GAAP” below. We expect that our net interest expense will be further reduced during 2004 compared to 2003 because of lower average levels of indebtedness and a decrease in the spread over LIBOR to be paid on our indebtedness. See “Item 5 — Results from Operations for the years ended December 31, 2002 and 2003 — Liquidity and Capital Resources”.
99
As of December 31, 2003 net income from related companies increased Ch$ 9.4 billion, or 109.9%, compared to the same period in 2002. This increase is mainly due to the favorable results of CIEN andGasAtacama Generación Limitada, or GasAtacama, companies in which we hold minority interests. As of December 31, 2003, CIEN’s income increased Ch$ 3.9 billion, or 52.0%, compared to the same period in 2002, mainly due to the opening of a second transmission line. GasAtacama’s net income reached Ch$ 2.1 million as of December 2003 compared to a net loss of Ch$ 4.9 billion in the same period of 2002, due to a 17% of decrease in operational costs mainly resulting from a Ch$ 2.4 billion reduction in gas transportation costs and Ch$ 1.0 billion reduction in depreciation after the sale of transmission lines during 2003.
As of December 31, 2003 net other non-operating income decreased Ch$ 126.1 billion, or 182.1%, compared to the same period in 2002, mainly due to:
| • | an increase in losses amounting to Ch$ 255.6 billion from the application of Technical Bulletin No. 64. As explained in the overview to this section, the different structures of monetary assets and monetary liabilities in our foreign subsidiaries, and the depreciation and the appreciation of the Brazilian real and the Argentine peso against the U.S. dollar during 2002 and 2003, respectively, generated net non-operating consolidated losses, which we refer to as the “conversion effect,” of Ch$ 69.2 billion in 2003. During 2002 we had Ch$ 186.4 billion in gains, from this conversion effect. | |
| • | an increase in pension funds expenses amounting to Ch$15.4 billion reflecting payments made pursuant to our obligation to fully fund employee pension funds; | |
| • | a loss of Ch$ 7.2 billion in connection with the sale of assets; | |
| • | lower dividends from related companies for Ch$ 6.8 billion; and | |
| • | lower profits from forward operations in Ch$ 5.0 billion. | |
| These higher expenses were partially offset by: | ||
| • | profits before taxes, amounting to Ch$ 91.5 billion, due to the sales of Río Maipo and Infraestructura 2000; | |
| • | the non-recurrence in 2003 of Ch$ 65.1 billion in write-offs of real estate and other non-generation assets that occurred in 2002; | |
| • | a reduction of Ch$ 4.3 billion in litigation provisions; and | |
| • | a reduction of Ch$ 4.9 billion in connection with power compensation payments at the SIC in Chile. | |
Net monetary exposure consists of the effects of foreign exchange movements and price level restatement on the balance sheet of Enersis and its Chilean subsidiaries. In 2003, net monetary exposure increased Ch$ 0.7 billion, or 6.2%, compared to the same period in 2003, reflecting the effects of the appreciation of the Chilean peso against the U.S. dollar in 2003, compared to the devaluation of the Chilean peso in the previous year, which effects were offset to a large extent by foreign exchange hedges.
Goodwill amortization decreased Ch$ 469.6 billion, or 89.6%, as of December 31, 2003 compared to the same period in 2002. This decrease is mainly due to the non-recurrence in 2003 of write-offs that occurred in December 2002 amounting to Ch$ 439.6 billion and relating to investments in Argentina and Brazil.
100
Net income
The following table sets forth our net income for the periods indicated.
| Year ended December 31, | ||||||||
| 2002 | 2003 | Change | % Change | |||||
| (in millions of Ch$ ) | ||||||||
| Operating income | 551,420 | 549,498 | (1,922 | ) | (0.3 | )% | ||
| Non-operating income (expense) net | (824,607 | ) | (466,281 | ) | 358,326 | (43.5 | )% | |
Net income before taxes, minority interest and negative goodwill amortization | (273,187 | ) | 83,217 | 356,404 | (130.5 | )% | ||
| Income tax | (77,736 | ) | (103,272 | ) | (25,536 | ) | 32.8 | % |
| Deferred taxes | 9,392 | 60,662 | 51,270 | 545.9 | % | |||
| Total income taxes | (68,344 | ) | (42,610 | ) | 25,734 | (37.7 | )% | |
| Minority interest | 16,857 | (80,283 | ) | (97,140 | ) | (576.3 | )% | |
| Amortization of negative goodwill | 116,204 | 52,456 | (63,748 | ) | (54.9 | )% | ||
| Extraordinary items | (23,165 | ) | 0 | 23,165 | n.a. | |||
| Net income | (231,635 | ) | 12,780 | 244,415 | (105.5 | )% | ||
As of December 31, 2003 net income increased Ch$ 244.4 billion to Ch$ 12.8 billion from a net loss of Ch$ 231.6 billion in 2002.
As described above, as of December 31, 2003, the Ch$ 1.9 billion decrease in operating income was offset by the Ch$ 358.3 billion in non-operating expense during the same period.
Income tax increased by Ch$ 25.5 billion from Ch$ 77.7 billion during 2002 to Ch$ 103.2 billion for the comparable period in 2003. This increase is mainly due to tax of Ch$ 16.7 billion paid by Enersis, relating to the sale of Río Maipo, and to tax of Ch$ 7.3 billion paid by Endesa-Chile for the sale of Canutillar. The remainder of the variation was due to net increased taxable income of our subsidiaries.
Deferred taxes reflected a positive effect of Ch$ 51.3 billion, increasing from Ch$ 9.4 billion during 2002, to Ch$ 60.7 billion during 2003. This was mainly due to an increase of Ch$ 19.8 billion in gains from deferred taxes in Enersis, as a consequence of higher taxable losses. Cerj, Costanera and Chocón had deferred tax gains of Ch$ 17.7 billion, Ch$ 17.0 billion and Ch$ 16.9 billion, respectively, due to the effect of exchange differences in Brazil and Argentina. This was partially offset by deferred tax losses in Edesur of Ch$ 12.8 billion, resulting from the partial reversal of deferred tax recognized during 2002 primarily as a result of the depreciation of the Argentine peso in 2002.
As of December 31, 2003 amortization of negative goodwill decreased by Ch$ 63.8 billion reflecting the write-offs of negative goodwill made by Enersis in Argentina and Brazil in December 2002, partially offset by the additional negative goodwill arising from additional equity investment by us in Cerj which we subscribed in exchange for the cancellation of an inter-company loan for Ch$ 35.3 billion in January 2003.
Extraordinary items increased Ch$ 23.2 billion as of December 31, 2003, due to the non-recurrence in 2003 of the payments from our Colombian subsidiaries to the Colombian government relating to special anti-terrorist taxes.
| B. | Liquidity and capital resources |
We are a holding company with no significant assets other than the stock of our subsidiaries. For the twelve month period ended December 31, 2004, our principal sources of liquidity, expressed in U.S. dollars at the year end exchange rate, were:
| • | U.S.$ 127.7 million in intercompany debt amortizations and intercompany interest payments from Chilectra and wholly owned subsidiaries; | |
| • | U.S.$ 136.2 million from new debt (excluding proceeds used to refinance debt) |
101
| • | U.S.$ 70.2 million in principal payments from an intercompany loan to Endesa-Chile; | |
| • | U.S.$ 18.9 million in management fees; | |
| • | U.S.$ 18.1 million of dividends received from Endesa-Chile; | |
| • | U.S.$ 11.4 million and U.S.$ 6.6 million in dividends from Codensa and Edelnor, respectively; | |
| • | U.S.$ 6.5 million and U.S.$ 7.4 million in intercompany interest payments from Coelce and Cerj, respectively; | |
| • | U.S.$ 9.4 million from a capital reduction in Edelnor; and | |
| • | U.S.$ 1.0 million in interest income. |
The aggregate inflows of cash from these sources amounted to approximately U.S.$ 413 million in 2004.
For the same twelve month period ended December 31, 2004, we applied a total of U.S.$ 293.5 million in cash, on the following items:
| • | U.S.$ 213.4 million to pay outstanding indebtedness (U.S.$ 150 million for the prepayment of a credit facility in April 2004; U.S.$ 63.4 million for prepayment of debt with Banco Estado in December 2004); and | |
| • | U.S.$ 80.0 million primarily to pay interest expenses and derivative contract payments; | |
| Net cash generation during 2004 was approximately U.S.$ 120.0 million. | ||
For the twelve month period ended December 31, 2003, our principal sources of liquidity, expressed in U.S. dollars at the year end exchange rate, were:
| • | U.S.$ 800.8 million in cash from our capital increase; | |
| • | U.S.$ 174.2 million in cash from the sale of Río Maipo; | |
| • | U.S.$ 146.6 million in intercompany debt amortizations and intercompany interest payments from Chilectra, Río Maipo and wholly owned subsidiaries; | |
| • | U.S.$ 19.9 million and U.S.$ 8.7 million in dividends from Codensa and Edelnor, respectively; | |
| • | U.S.$ 21.6 million in principal payments from an intercompany loan to Endesa-Chile; | |
| • | U.S.$ 19.4 million from new debt (excluding proceeds used to refinance debt); | |
| • | U.S.$ 9.5 million from a capital reduction in Edelnor; | |
| • | U.S.$ 6.5 million and U.S.$ 0.1 million in intercompany interest payments from Coelce and Cerj, respectively; | |
| • | U.S.$ 5.7 million in interest income; and | |
| • | U.S.$ 1.9 million in management fees. |
The aggregate inflows of cash from these sources amounted to approximately U.S.$ 1,210 million in 2003.
For the same twelve month period ended December 31, 2003, we applied a total of U.S.$ 1,116 million in cash, on the following items:
102
| • | U.S.$ 898.2 million to pay outstanding indebtedness (U.S.$ 737.5 million for the remaining outstanding portion of a syndicated credit facility entered into in May 2003, U.S.$ 149.1 million to pay for almost all the bondholders who exercised their put option on our 6.6% Notes due 2026 on December 1, 2003, and U.S.$ 11.5 million to pay local bond amortizations); | |
| • | U.S.$ 211.6 million primarily to pay interest expenses and derivative contract payments; and | |
| • | U.S.$ 6.6 million for other uses. |
Net cash generation during 2003 was approximately U.S.$ 93.6 million.
For a description of liquidity risks resulting from our holding company status, please see “Item 3—Risk Factors—Risks Relating to Our Operations—We are a holding company and depend on payments from our subsidiaries and related companies to meet our payment obligations” in this annual report.
We coordinate the overall financing strategy of our majority owned subsidiaries. Our operating subsidiaries independently develop capital expenditure plans and our strategy is generally to have the operating subsidiaries independently finance capital expansion programs through internally generated funds or direct financings. We also coordinate acquisition financing in respect of distribution operations with Chilectra. We coordinate all generation and transmission acquisition financing with Endesa-Chile. For information regarding our commitments for capital expenditures, see “Item 4. Information on the Company—B. Business overview—Business Strategy—Capital Investment Program” and our contractual obligations table set forth below.
We have accessed the international equity capital markets, with three SEC registered ADS issuances in October 1993, February 1996 and September 2000, for Enersis and once in 1994 for Endesa-Chile. We have also frequently issued bonds in the international capital markets, or Yankee Bonds, for both Enersis and Endesa-Chile, as well as for Pehuenche, a subsidiary of Endesa-Chile. Enersis issued U.S.$ 800 million in Yankee Bonds in November 1996, and U.S.$ 350 million in November 2003. Endesa-Chile and its consolidated subsidiaries have also issued Yankee Bonds between 1996 and 2003, of which U.S.$ 2,200 million are currently outstanding. In June 2000, both Enersis and Endesa-Chile established Euro medium-term note programs, or EMTN Programs, for an aggregate amount of ¬11 billion each. Endesa-Chile issued ¬1400 million in 3 year floating rate notes in July 2000 under its EMTN Program.
The following table lists the Yankee Bonds of Enersis and consolidated subsidiaries outstanding at December 31, 2004. The weighted average annual interest rate for Yankee Bonds issued by Enersis and its consolidated subsidiaries, of which an aggregate principal amount U.S.$ 3.2 billion is outstanding as of the date of this report, is approximately 7.8%.
| Aggregate Principal | |||||||
| Issuer | Maturity | Coupon | Amount Issued | ||||
| (as a percentage) | (in U.S. millions) | ||||||
| Endesa Chile Internacional | April 1, 2006 | 7.200 | 150 | ||||
| Endesa-Chile | July 15, 2008 | 7.750 | 400 | ||||
| Endesa-Chile | April 1, 2009 | 8.500 | 400 | ||||
| Endesa-Chile | August 1, 2013 | 8.350 | 400 | ||||
| Endesa-Chile | August 1, 2015 | 8.625 | 200 | ||||
| Endesa-Chile (3) | February 1, 2027 | 7.875 | 230 | ||||
| Endesa-Chile (1) | February 1, 2037 | 7.325 | 220 | ||||
| Endesa-Chile (3) | February 1, 2097 | 8.125 | 200 | ||||
| Enersis | December 1, 2006 | 6.900 | 300 | ||||
| Enersis | January 15, 2014 | 7.375 | 350 | ||||
| Enersis (3) | December 1, 2016 | 7.400 | 350 | ||||
| Enersis (2) | December 1, 2026 | 6.600 | 150 |
| (1) | Holders of these Yankee Bonds can exercise a put option against Endesa-Chile on February 1, 2009. |
| (2) | Holders of these Yankee Bonds exercised a put option against Enersis on December 1, 2003 for an aggregate principal amount of U.S.$ 149.1 million. |
| (3) | In 2001, Enersis and Endesa-Chile repurchased an aggregate of U.S.$ 284 million of these Yankee Bonds. |
103
Both Enersis and Endesa-Chile, as well as our subsidiaries in the five countries in which we operate, also haveaccess to local capital markets, where we have issued debt instruments including commercial paper and medium and long-term bonds that are primarily sold to pension funds, life insurance companies and other institutional investors. In 2001, Endesa-Chile issued UF 7.5 million (approximately U.S.$ 180 million at the time of issuance) in 5-year and 21-year local bonds, in each case with an interest rate of 6.2% per annum. In 2001, Enersis also issued UF 6.5 million (approximately U.S.$ 169 million at the time of issuance) in 8-year and 21-year local bonds, each with interest rates of 5.5% and 5.75% per annum, respectively. On October 24, 2003, Endesa-Chile issued UF 4 million in 7-year UF denominated bonds with an interest rate of 5.65% per annum, and another UF 4 million in 25-year UF denominated bonds with an interest rate of 6.20% per annum, for an aggregate principal amount of UF 8 million (U.S.$ 214 million at the time of issuance). For a full description of the local bonds issued by Enersis and Endesa-Chile, see “Item 18. Audited Consolidated Financial Statements as of December 31, 2004—[Note 18—Bonds Payable]”.
Our companies are also frequent borrowers in the commercial bank markets, both in the form of bilateral loans as well as in syndicated loans. In 1999, we entered into U.S.$ 3.5 billion in 2-year bilateral loans with a group of relationship banks. The loans were extended for two additional years, and were scheduled to mature in 2003, but were paid with the proceeds of syndicated credit facilities that we entered into in May 2003. We have also entered into several syndicated loans over the last few years, including, among others, an aggregate of U.S.$ 400 million 3-year bullet syndicated facility for Enersis in March 2001 and two 3-year bullet U.S.$ 500 million syndicated facilities, one for Enersis and one for Endesa-Chile, in July 2001. These loans were also paid before their stated maturity with the proceeds of syndicated credit facilities that we entered into in May 2003.
On March 31, 2003, at an extraordinary shareholders’ meeting, our shareholders approved the issuance of up to 24,382,994,488 shares in a capital increase, including two pre-emptive rights offering periods. The first pre-emptive rights period ended on June 30, 2003 and the second pre-emptive rights period took place between November 20 and December 20, 2003.
Endesa, S.A. (“Endesa-Spain”), acting through an intermediary, exercised a portion of its pre-emptive options corresponding to 14,406,840,511 new shares, which were paid by the extinguishment of a Ch$ 1.0 trillion (approximately U.S.$ 1.4 billion at the exchange rate applicable at that time) intercompany loan that had previously been granted to Enersis by Elesur (the “Loan”). As required by Chilean law, an independent appraiser valued the Loan exclusively for purposes of the capital increase at 86.84% of its par value. Endesa-Spain subscribed for 59.09% of the new shares at a value of approximately Ch$ 870.5 billion, the appraised value of the Loan.
Endesa-Spain and its wholly-owned subsidiaries did not exercise all their pre-emptive options during the first pre-emptive rights period in order to make shares available for a possible exchange offer to local bondholders and voluntarily excluded themselves from the second pre-emptive rights period in order to permit minority shareholders to participate with higher pro rata shares in that period.
Minority shareholders subscribed 31.61% of the shares available to third parties in the first pre-emptive rights period for a total cash subscription of approximately Ch$ 465.6 billion. During the second pre-emptive rights period, minority shareholders subscribed an additional 5.55% for a total cash subscription of approximately Ch$ 81.8 billion. Additionally, 3.66% of the new shares were subscribed as part of the local bond exchange offer, which took place between the first and the second pre-emptive rights periods of the capital increase. As a result, the total amount of local bonds exchanged was equivalent to approximately Ch$ 54 billion.
In summary, the total number of shares subscribed was 24,360,123,331 for an aggregate capital increase of U.S.$ 2,106 million. Of this amount, 59.1% were subscribed by Endesa-Spain and 40.9% were subscribed by minority shareholders. As a result of the foregoing, since December 20, 2003, Endesa-Spain’s ownership interest in Enersis has been 60.6% decreasing from 65.0% prior to the capital increase.
Our capital increase during 2003 resulted in an increase of our outstanding shares from 8,291,020,100 to 32,651,166,465. The increase in the number of outstanding shares resulted in a dilution of 75% of the holdings that did not participate in the subscription of new shares. The capital increase allowed us to significantly reduce our indebtedness as a result of the extinguishment of the Ch$ 1.0 trillion intercompany loan from Elesur and the application of cash proceeds from the capital increase to repay U.S.$ 741 million of indebtedness.
104
As of December 31, 2004, Endesa Spain’s ownership interest in Enersis remained at 60.6%, the same level as at December 31, 2003.
On May 15, 2003, Enersis entered into credit facilities for an aggregate amount of approximately U.S.$ 1,588 million and Endesa-Chile entered into a credit facility for U.S.$ 743 million. These facilities refinanced most of Enersis’ and Endesa-Chile’s indebtedness under outstanding syndicated and bilateral credit agreements, which otherwise would have matured in 2003 and 2004. The total outstanding amounts under both these credit facilities have been prepaid in full as described below.
On November 14, 2003, we entered into an agreement with a syndicate of banks to provide a new U.S.$ 800 million senior unsecured term loan facility through our Cayman Islands branch (the “Enersis November 2003 Facility”), consisting of a U.S.$ 500 million tranche and a U.S.$ 300 million tranche. The U.S.$ 500 million tranche was drawn on November 19, 2003. The period for drawing the U.S.$ 300 million tranche expired on the closing date upon the issuance of 7.375% notes due 2014 in the aggregate principal amount of U.S.$ 350 million. The proceeds of the Enersis November 2003 Facility and the proceeds from the issuance and sale of the 7.375% notes, together with cash from other sources, were used to repay all amounts outstanding under the U.S.$ 1,588 million credit facilities dated May 15, 2003.
On April 14, 2004, we made a voluntary repayment of U.S.$ 150 million under the Enersis November 2003 Facility, reducing the outstanding amount of the loans to U.S.$ 350 million. On the same date, we amended and restated the Enersis November 2003 Facility (the “Amended Enersis Facility”). The margin over LIBOR at which interest accrues under the Amended Enersis Facility is determined by reference to our foreign currency issuer credit rating by S&P. Such margin ranges from 75 basis points for an A- or higher rating to 275 basis points for a rating lower than BB+. At the time of this filing, the current interest rate applicable to the Amended Enersis Facility is LIBOR plus 115 basis points.
On November 10, 2004, we refinanced the Amended Enersis Facility with a syndicated loan of U.S.$ 350 million through Enersis’s Cayman Islands branch. The new facility operates as a credit line or revolving facility (“Revolving Credit Facility”). This revolving structure allows us to prepay or obtain funds several times while the facility is outstanding, as long as the total indebtedness under this facility does not exceed U.S.$ 350 million. The Revolving Credit Facility will mature on November 10, 2008. The margin over LIBOR is 37.5 basis points. In addition to the margin, the facility accrues a commitment fee with interest payable on the unused portion of the total commitment of U.S.$ 350 million. The accrued interest is 15 basis points if the used amount of the revolving is higher than 66% of the total amount; 20 basis points if the used amount is between 33% and 66% or 25 basis points if utilization is lower than 33%.
The Revolving Credit Facility ranks pari passu with all other unsecured and unsubordinated debt of Enersis and requires us to be in compliance on the last day of any fiscal quarter with specified financial covenants related to maximum ratios of indebtedness to adjusted cash flow (ranging from 7.00:1 in 2004 to 6.00:1 in 2008), indebtedness to EBITDA (as defined in the credit agreement, which may differ from the manner in which EBITDA may be commonly calculated) (ranging from 5.00:1 in 2004 to 3.00:1 in 2008), debt to equity (ranging from 80% in 2004 to 70% in 2008) and minimum ratio of adjusted cash flow to interest expense (ranging from 1.60:1 in 2004 to 2.20:1 in 2008).
On February 4, 2004, Endesa-Chile entered into an agreement with a syndicate of banks to provide a new U.S.$ 250 million senior unsecured term loan facility through Endesa-Chile’s Cayman Islands branch (the “Endesa-Chile Facility”). Endesa-Chile borrowed the full amount under this facility and used the proceeds of the borrowing plus the proceeds of the issuance of U.S.$ 600 million Yankee Bonds on July 18, 2003 to repay all amounts under another Endesa-Chile credit facility dated May 15, 2003 for an original amount of U.S.$ 743 million. The margin over LIBOR at which interest accrues under the Endesa-Chile Facility is determined by reference to the S&P rating of Endesa-Chile’s senior unsecured long-term foreign currency denominated debt; such margin ranges from 75 basis points for an A- or higher rating to 275 basis points for a rating lower than BB+.
105
On November 10, 2004, Endesa-Chile refinanced the Endesa-Chile Facility with a syndicated loan of U.S.$ 250 million. The new facility operates as a credit line or revolving facility (the “Endesa-Chile Revolving Credit Facility”). This revolving feature allows the company to prepay or obtain funds several times while the facility is outstanding, as long as the total indebtedness under this facility does not exceed U.S.$ 250 million. The Revolving Credit Facility will mature on November 10, 2008. The margin over LIBOR is 37.5 basis points. In addition to the margin, the facility accrues a commitment fee with interest payable on the unused portion of the total commitment of U.S.$ 250 million. The accrued interest is 15 basis points if the used amount of the revolving is higher than 66% of the total amount; 20 basis points if the used amount is between 33% and 66% or 25 basis points if the utilization is lower than 33%.
The Endesa-Chile Facility ranks pari passu with all other unsubordinated debt of Endesa-Chile and matures on November 10, 2010. The Endesa-Chile Facility requires Endesa-Chile to maintain specified financial covenants related to maximum ratios of indebtedness to adjusted cash flow (ranging from 9.40:1 in 2004 to 7.50:1 in 2010), indebtedness to EBITDA (ranging from 6.30:1 in 2004 to 4.20:1 in 2010), debt to equity (ranging from 112.5% in 2004 to 100.0% in 2010) and minimum ratio of adjusted cash flow to interest expense (ranging from 1.50:1 in 2004 to 2.0:1 in 2010).
The Enersis and Endesa-Chile Yankee Bonds contain covenants that place restrictions on the extent to which Enersis and Endesa-Chile and certain of their subsidiaries (i) create or incur liens on properties and assets and (ii) enter into sale and leaseback transactions.
As is customary for certain credit and capital market debt facilities, a significant portion of Enersis’ financial indebtedness is subject to cross default provisions. The Enersis Revolving Credit Facility, the Endesa-Chile Revolving Credit Facility and the Yankee Bonds represent the Company’s most material indebtedness, and contain the most material cross default provisions. Other outstanding indebtedness is for less significant amounts, and their cross default provisions, if any, have higher thresholds.
Payment defaults in relation to any individual indebtedness of Endesa-Chile, or certain of its more relevant subsidiaries, subject to expiration of applicable grace periods (if any) and a materiality threshold of U.S.$ 30 million outstanding (on an individual basis) could give rise to a cross default under the Endesa-Chile Revolving Credit Facility. Endesa-Chile’s relevant subsidiaries which have indebtedness in excess of U.S.$ 30 million as of December 31, 2004 are Pangue, Endesa Internacional, Cía. Eléctrica Cono Sur, Betania and Pehuenche.
Likewise, payment defaults in relation to any individual indebtedness of Enersis, or certain of its more relevant subsidiaries, including Endesa-Chile, subject to expiration of applicable grace periods (if any) and a materiality threshold of U.S.$ 30 million (on an individual basis) could give rise to a cross default under the Enersis Revolving Credit Facility. Enersis’s relevant subsidiaries which indebtedness exceeds U.S.$ 30 million as of December 31, 2004 are Endesa-Chile, Chilectra, Cía. Eléctrica Cono Sur, Betania and Cerj.
If Enersis or any of its subsidiaries defaults in the payment on any individual indebtedness having a principal amount in excess of U.S.$ 30 million, an event of default would be triggered under the Enersis’ Yankee Bonds. Enersis’ subsidiaries, which include certain subsidiaries of Endesa-Chile, and have indebtedness in excess of U.S.$ 30 million as of December 31, 2004 are Endesa-Chile, Chilectra, Cerj, Coelce, Cía. Eléctrica Cono Sur, Betania and Codensa.
In addition, if Endesa-Chile or any of its subsidiaries defaults in the payment on any individual indebtedness having a principal amount in excess of U.S.$ 30 million, an event of default would be triggered under the Endesa-Chile Yankee Bonds. Endesa-Chile’s subsidiaries which have indebtedness in excess of U.S.$ 30 million as of December 31, 2004 are Celta, Pehuenche, San Isidro, Central Costanera, Cía. Eléctrica Cono Sur, Endesa Argentina, Betania and Emgesa. Any event of default arising out of Endesa-Chile’s or Enersis’ Yankee Bonds would trigger a cross default under most of the existing bank credit agreements.
In addition to the payment cross default provisions described in the previous paragraphs, certain Enersis and Endesa-Chile indebtedness is subject to (A) cross acceleration provisions, again subject to a materiality threshold of U.S.$ 30 million (U.S.$ 50 million in certain cases) on an individual basis, and (B) certain other customary events of default. Some of the more material examples of such customary event of default triggers include bankruptcy and insolvency proceedings, material adverse judgments, and certain governmental actions such as nationalization, seizure, or expropriation of assets. The general cross acceleration provisions give rise to an event of default only when other material indebtedness has been accelerated at the direction of the required lenders thereunder or otherwise pursuant to its terms, after expiration of grace periods where applicable.
106
At the time of this filing, we are in compliance with our material covenants contained in our debt instruments.
We will probably need to access external credit in order to refinance Enersis’ and Endesa-Chile’s stand-alone indebtedness, mostly in the form of local and Yankee Bond issuances, starting in 2006. We expect that we will continue to have access to sufficient sources of liquidity, principally local and international bond markets and bank loans.
In addition to available cash, as of this filing, Enersis currently has the ability to draw up to approximately U.S.$ 150 million from unused lines of credit granted by Chilean banks, and Endesa-Chile has the ability to draw up to approximately another U.S.$ 156 million from similar sources. Our levels of consolidated indebtedness increased by 4%, from U.S.$ 6.4 billion as of December 31, 2003, to U.S.$ 6.7 billion as of December 31, 2004. The Company does not currently anticipate liquidity shortfalls affecting its ability to meet the obligations outlined in the table above. We expect to refinance our indebtedness as it becomes due, fund our purchase obligations outlined in the table above with intentionally generated cash, and fund capital expenditures with a mixture of intentionally generated cash and borrowings.
Reconciliation of non-GAAP measures to Chilean GAAP
The table below excludes the effect of the appreciation of the Chilean peso against the U.S. dollar in our operating income for the periods indicated.
| 2003 | 2004 | |||
| (in millions Ch$ ) | ||||
| Operating Income | 549,498 | 634,202 | ||
| Effect of Ch$ appreciation | (25,274 | ) | — | |
| Operating income excluding above | 524,224 | 634,202 | ||
The table below excludes the effect of fees associated with the prepayment of bank loans on our net interest expense for the period indicated.
| 2003 | 2004 | |||
| (in millions Ch$ ) | ||||
| Net interest expense | (362,028 | ) | (286,505 | ) |
| Prepayment fees | 40,072 | 9,154 | ||
| Net interest expense excluding above | 321,956 | 277,351 | ||
| C. | Research and development, patents and licenses, etc. |
| None | |
| D. | Trend Information |
In general, trends cannot be easily established for the energy business in the five countries in which we operate. However, we have identified the following: There is a tendency toward greater competition in some countries, combined with a liberalization of regulated markets, and a proposed introduction of trading companies that will market energy to final clients. In addition to increasing competition, this would give us access to a wider universe of customers, allowing us to compete to serve higher margin clients. There is also a general trend toward the interconnection of electricity systems, including systems that cross international borders, such as our CIEN project between Argentina and Brazil, increasing competition in the markets served by interconnection projects and at the same time opening new markets for our current installed capacity.
107
Our ability to rely on natural gas from Argentina is increasingly uncertain, because of natural gas restrictions applied by the Argentine government. See “Item 3. Key Information—Risk Factors relating to Argentina.”
| E. | Off balance sheet arrangements |
| Enersis is not a party to any off balance sheet transactions. | |
| F. | Tabular disclosure of contractual obligations |
| The table below sets forth the Company’s cash payment obligations as of December 31, 2004. |
| Jan 2005 | Jan 2006 | Jan 2007 | Jan 2008 | After | |||||||||
| As of December 31, 2004: | Dec 2005 | Dec 2006 | Dec 2007 | Dec 2008 | 2008 | Total(1) | |||||||
| (in U.S. millions) | |||||||||||||
| Contractual Obligations (1) | |||||||||||||
| Operational Leases (2) | — | — | — | — | — | — | |||||||
| Purchase Obligations (3) | 1,052 | 1,060 | 965 | 885 | 4,706 | 8,666 | |||||||
| Bank Debt | 395 | 112 | 69 | 362 | 273 | 1,212 | |||||||
| Yankee bonds (4) | — | 465 | — | 400 | 2,157 | 3,022 | |||||||
| Local bonds | 89 | 488 | 138 | 38 | 901 | 1,654 | |||||||
| Pension and post-retirement obligations (5) | 44 | 44 | 44 | 44 | 239 | 415 | |||||||
| Interest on Indebtedness | 571 | 487 | 418 | 366 | 2,995 | 4,837 | |||||||
| Other long term liabilities (6) | 151 | 104 | 154 | 118 | 242 | 768 | |||||||
| Total | 2,302 | 2,760 | 1,788 | 2,213 | 11,513 | 20,574 | |||||||
| (1) | In addition to the contractual obligation set forth above, we expect to make capital expenditures of U.S.$ 273 million in 2004, U.S.$ 285 million in 2005 and U.S.$ 275 million in 2006. |
| (2) | We do not have any material operating lease obligations. |
| (3) | Includes generation and distribution business purchase obligations comprised mainly of energy purchases, operating and maintenance contracts and other services. |
| (4) | During 2004, some of our Yankee debt in U.S. dollars was swapped into UF, and amounts shown in this table include such swaps. |
| (5) | We have funded and unfunded pension and postretirement benefit plans. Our funded plans have contractual annual commitments for contributions which do not change based on funding status. Cash flow estimates in the table are based on such annual contractual commitments including certain estimable variable factors such as interest. Cash flow estimates in the table relating to our unfunded plans are based on future undiscounted payments necessary to meet all of our pension and post-retirement obligations. The amount of U.S.$ 239 million in the “After 2008” column includes all of our cash flow estimates relating to our unfunded plans plus one year’s estimate of our contractual commitment for our funded plans (we estimate that our contractual commitments for our funded plans is approximately equal to U.S.$ 28 million per annum). However, you should assume that for every year after 2008, we have estimated that we will have an approximate U.S.$ 28 million cash flow commitment in connection with our funded plans. We have only included one year of cash flow estimates for our funded plans in this column because such plans do not have an expiration or settlement date and therefore the aggregate of our obligations relating to such plans after 2008 would not accurately represent our year to year cash commitments. |
| (6) | Includes Endesa-Chile capital lease obligations for a total of U.S.$ 43 million. |
| G. | Safe harbor |
This Item 5, Management Discussion and Analysis, contains information that may constitute forward-looking statements. See “Forward-Looking Statements” in the Introduction of this report, for safe harbor provisions.
108
Item 6. Directors, Senior Management and Employees
| A. | Directors and Senior Management |
We are managed by our board of directors, which consists of seven members who are elected for a term of three years at the General Stockholders’ meeting. If a vacancy occurs, the board of directors will elect a temporary director to fill the vacancy until the next regularly scheduled meeting of stockholders, at which time the entire board of directors will be elected. Our officers are appointed by the board of directors and hold office at the discretion of the board. Set forth below are the members of our board of directors as of December 31, 2004.
| Directors | Current Position | |||||
| Age | Position | Held Since | ||||
| Pablo Yrarrázaval (1) | 53 | Chairman | 2002 | |||
| Rafael Miranda | 56 | Vice Chairman | 1999 | |||
| Alfonso Arias | 53 | Director | 2003 | |||
| José Luis Palomo | 51 | Director | 2002 | |||
| Ernesto Silva (1) | 56 | Director | 1997 | |||
| Hernán Somerville (1) | 64 | Director | 1999 | |||
| Eugenio Tironi | 53 | Director | 2000 |
| (1) | Member of the Comité de Directores |
Set forth below are brief biographical descriptions of our directors, as of December 31, 2004, four of whom reside in Chile and three of whom reside in Spain.
Pablo Yrarrázaval. Mr. Yrarrázaval became Chairman of the board of directors in July 2002. Mr. Yrarrázaval is a partner in the firmCorredora de Bolsa Yrarrázaval y Compañía, Limitada, Vice Chairman ofDepósito Central de Valores S.A., DCV, and is also Chairman of the Santiago Stock Exchange, a position he has occupied since 1982.Before Mr. Yrarrázaval became Chairman of the board of directors of Enersis he was Chairman of Endesa-Chile.
Rafael Miranda. Mr. Miranda, an industrial engineer, joined Endesa-Spain as Chief Executive Officer in 1997.Prior to that, he was in charge of the industrial division ofCampofrío, S.A. for four years and worked forTudor, S.A.for 12 years in several capacities. Mr. Miranda currently serves on the board of directors of Endesa-Spain and as Chairman of several of its subsidiaries, includingEndesa Internacional,Compañía Sevillana de Electricidad, S.A. andFecsa. At Enersis, Mr. Miranda has been a director and Vice Chairman since April 1999.
Alfonso Arias. Mr. Arias received a law degree as well as graduate degrees in Economy and Management fromUniversidad Complutense de Madrid. Mr. Arias is the General Counsel of Endesa Internacional, S.A., a wholly-owned subsidiary of Endesa-Spain. From 1995 to 1997 he was General Secretary of the Nuclear Safety Council of Spain. Mr. Arias joined Endesa Spain Group in 1997 as General Secretary of Endesa Internacional. At Enersis, Mr. Arias has been a director since March 2003.
José Luis Palomo. Mr. Palomo holds degrees in Business Administration, in Sociology and in Law from theUniversidad de Madrid. He also holds an MBA degree from IESE,Universidad de Navarra. Since 1991, he has been the Chief Financial Officer of Endesa-Spain. Mr. Palomo started his professional career in the Financial Division of the INI (National Industry Institute) in 1976, where he became Assistant Financial Director. Appointed in 1983, he has been Financial Director of the Spanish/Canadian Aluminum Group, today INESPAL. Mr. Palomo has been a member of the board of directors of Banco Arabe Español (Aresbank), Banco Saudi Español S.A. (Saudesbank) , Infoleasing S.A., Musini, Babcock Wilcox Española, S.A., Sevillana de Electricidad, S.A. and Vice Chairman of Unelco. At Enersis, Mr. Palomo has been a director since July 2002.
Ernesto Silva. Mr. Silva has a commercial engineering degree fromPontificia Universidad Católica de Chile and holds an M.A. in Economics from the University of Chicago. Mr. Silva was Chief Executive Officer of Pehuenche between 1990 and 1995. Subsequently, he held several positions at Endesa-Chile including Energy Division Director and Deputy Chief Executive Officer. In the past, Mr. Silva served as CEO ofLadeco S.A., CEO of Refractorios Chilenos S.A., CEO of Empresa Nacional de Petróleo, the state-owned oil company, as well as leading positions in Mideplan and Comisión Chilena del Cobre. He also worked as a university professor and in numerous non-profit organizations. Currently, he is President of the Universidad del Desarrollo. At Enersis, Mr. Silva has been a director since 1997.
109
Hernán Somerville. Mr. Somerville has a law degree fromUniversidad de Chile, and a M.C.J. degree from New York University Law School. From 1988 to the present, Mr. Somerville has been a Managing Director and Partner of FINTEC, a Chilean investment management company through which, among other things, he has led the bank debt-to-equity conversion program sponsored by the Chilean Central Bank. For a six-year period beginning in 1983, he was also Director of the Chilean Central Bank, and Chief Debt Negotiator for Chilean public debt and private commercial bank debt. Mr. Somerville is also a member of the Interamerican Bar Association and the New York City Bar Association. He is on the board of directors of several Chilean companies and serves on the boards of several banks and bank associations. Among other activities, Mr. Somerville is a director of a technical educational institute, and is Chairman of the Chilean Indian Chamber of Commerce. At Enersis, Mr. Somerville has been a director since 1999.In 2005, Mr. Somerville was elected as Chairman of the Cámara de Producción y Comercio.
Eugenio Tironi.Mr. Tironi received a Ph.D. in sociology fromL’Ecole des Hautes Etudes en Sciences Sociales (Paris, France). He is currently a Professor of the Sociology Department ofPontificia Universidad Católica de Chile, and has published thirteen books and hundreds of articles in this field, both in Chile and abroad. Mr. Tironi has been a consultant to international organizations such as the World Bank, the International Labor Organization, the Economic Commission for South America and the Caribbean (“CEPAL” in its Spanish acronym) and the United Nations Development Program. Between 1990 and 1994, he was a Director of the Secretary for Communication and Culture of the Chilean Government.In addition, since 1994, Mr. Tironi has been the Chairman of Tironi Asociados, a consulting and strategic communications firm, which has advised many Chilean and international firms. Mr. Tironi was a visiting professor at Notre Dame University (USA) for the fall 2002 semester.Mr. Tironi has been a director of Enersis since July 2000.
Officers (as of December 31, 2004)
| Age | Position | Current Position Held Since | Years with Enersis and Subsidiaries | |||||
| Mario Valcarce | 55 | Chief Executive Officer | 2003 | 13 | ||||
| Francisco Herrera | 41 | Corporate Auditing Officer | 2003 | 8 | ||||
| José Luis Domínguez | 49 | Communications Officer | 2003 | 17 | ||||
| Domingo Valdés | 41 | General Counsel | 1999 | 11 | ||||
| Alfredo Ergas | 39 | Chief Financial Officer | 2003 | 11 | ||||
| Macarena Lama (1) | 46 | Regional Planning and Control Officer | 2003 | 2 | ||||
| Fernando Isac (2) | 52 | Regional Accounting Officer | 2003 | 4 | ||||
| Francisco Silva | 45 | Human Resources Officer | 2003 | 17 |
| (1) | Ms. Macarena Lama joined Endesa-Spain in 1997 and she has been working with Enersis since September 2003. |
| (2) | Mr. Fernando Isaac joined Endesa-Spain in 1977 and he has been working with Enersis for the last 4 years. |
Set forth below are brief biographical descriptions of our executive officers, all of whom reside in Chile.
Mario Valcarce. Mr. Valcarce has been Chief Executive Officer of Enersis since July 31, 2003.Before becoming Chief Executive Officer, Mr. Valcare held the position of Chief Financial Officer of Enersis since October 2002. Prior to that, Mr. Valcarce was the CFO of Endesa-Chile since 1995. Mr. Valcarce holds a degree in commercial engineering from theUniversidad Católica de Valparaíso. He is also a member of the Risk Classification Commission of the Chilean Pension Funds System.Currently, Mr. Valcarce is also Director ofGenerandes Peru S.A., Chairman ofEnersis International, Chairman ofChilectra International, and ChairmanofElesur S.A., all affiliates or subsidiaries of Enersis.
110
Francisco Herrera. Mr. Herrera, Auditing Officer since July 2003, is a civil engineer fromPontificia Universidad Católica de Chile.He joined the Enersis Group in 1996, having worked as Finance Director of Endesa-Chile subsidiaries prior to his most current position. Prior to joining the Enersis Group, Mr. Herrera worked at Cemento Polpaico, CMPC and Ladeco.
José Luis Domínguez. Mr. Domínguez, currently Chief Communications Officer since July 2003, is a civil engineer fromPontificia Universidad Católica de Chile. Mr. Domínguez joined the Enersis Group in May 1987 and held many positions in Endesa-Chile and its Chilean subsidiaries until 2000, [when he became the Public Affairs Director for Enersis.]
Domingo Valdés. Mr. Valdés, General Counsel since May 1999, is a lawyer fromUniversidad de Chile with a Master of Laws Degree from the University of Chicago. Prior to his current position, he was a lawyer at Chilectra since 1993 and Legal Counselor at Enersis since December 1997. Mr. Valdés also worked as an intern at the New York City law firms of Milbank, Tweed, Hadley & McCloy and Chadbourne & Parke LLP. Before joining Chilectra, Mr. Valdés was a lawyer at Chase Manhattan Bank, n.a. (Chile) and an associate atCarey & Cía., a Santiago-based law firm. Mr. Valdés is also Secretary of the Enersis board of directors and a Professor of Law and Economics atUniversidad de Chile Law School.Currently, Mr. Valdés is also a Director ofElesur S.A., a subsidiary of Enersis.
Alfredo Ergas. Mr. Ergas, a commercial engineer fromUniversidad de Chile is currently the Chief Financial Officer of Enersis since July 2003, after having held a similar position at Endesa-Chile. Before that, Mr. Ergas served as Chief Finance and Administration Officer of the Chilean telecommunications company, Smartcom, from 2000 to 2002.Prior to that, Mr. Ergas served in Enersis as Chief Planning and Control Officer and since April 1993 he served as Deputy Chief Financial Officer for Endesa-Chile.Currently, Mr. Ergas serves as Director ofCodensa S.A. E.S.P.,Elesur S.A., Enersis Internacional, Chilectra Internacional, Lajas Inversora S.A., Compañía Eléctrica Cono Sur S.A., Endesa-Chile Internacional, andInversiones GasAtacama Holding Ltda., all affiliates or subsidiaries of Enersis.
Macarena Lama. Ms. Lama, an agricultural engineer by profession, is a graduate ofEscuela Técnica Superior de Ingenieros, and received a degree in business management in 1984. Prior to joining Endesa-Spain in 1997, she worked at SEPI (the Spanish state-owned entity in charge of sales of operating companies to the private sector), among others. Over the last six years, she has held several key positions in planning, control and financing obligations of Endesa Diversificación S.A. (Spain). Since September 2003, Ms. Lama has been Enersis’ Regional Planning and Control Officer.
Fernando Isac. Mr. Isac, an economist, is a graduate ofUniversidad de Zaragoza. Mr. Isac worked in several accounting and financing positions in Eléctricas Reunidas de Zaragoza (“ERZ”), a subsidiary of Endesa-Spain, between 1977 and 1996. Subsequently, he was a Director ofElectricidad de Caracas (Venezuela)until 1998.Between 1998 and September 2000, he was Deputy Chief Financial Officer (Subdirector Económico Financiero)of ERZ, a subsidiary of Endesa-Spain.In September 2000, Mr. Isac joined Enersis as Accounting Director. Since July 2003, Mr. Isac has been the Regional Accounting Officer of Enersis, reporting directly to the CEO,and he is also CEO ofElesur S.A., a subsidiary of Enersis.
Francisco Silva. Mr. Silva, a business administrator, is a graduate ofUniversidad de Chile, and received a D.P.A. fromUniversidad Adolfo Ibáñez in 1986. Mr. Silva joined Chilectra in 1987, and has since worked mostly in human resources and general management positions in several subsidiaries and affiliates of Enersis. Between 1998 and 2000, and again since July 2003, he has been the Enersis Human Resources Officer. From January 2001 to June 2003, he worked as Adjunct Director of an Endesa-Spain subsidiary.
| B. | Compensation |
Directors are paid fees for attendance at meetings of the board of directors and for service on the Boards of Directors of our subsidiaries. In 2004, the total compensation paid to each of our directors, which in certain cases includes compensation for service on the boards of our subsidiaries, was as follows:
111
| Year ended December 31, 2004 | ||
| (in thousands of Ch$ ) | ||
| Pablo Yrarrázaval | 52,013 | |
| Rafael Miranda | 28,771 | |
| José Luis Palomo | 22,288 | |
| Alfonso Arias | 22,288 | |
| Ernesto Silva | 29,725 | |
| Hernán Somerville | 29,725 | |
| Eugenio Tironi | 22,288 | |
| Total | 207,098 | |
For the year ended December 31, 2004, the aggregate amount of compensation paid by us to all directors and executive officers, was approximately U.S.$ 4.3 million. These amounts include executive performance-related executive cash bonuses and compensation for officers who are no longer with the company. Enersis provides for its executive officers an annual bonus plan for meeting company-wide objectives and for their individual contribution to Enersis. The annual bonus plan is in a range according to seniority level, and amounts to certain additional months of gross salary compensation. Enersis does not offer stock options.
| C. | Board practices |
The current board of directors was elected at the Shareholders’ meeting dated March 31, 2003 for a period of three years. (For the period during which that person has served, please see “— A. Directors and Senior Management” above). Directors have no service contracts with Enersis.
Corporate Governance
Enersis is managed by its executive officers under the direction of its board of directors which, in accordance with theestatutos, or articles of incorporation and bylaws, of Enersis, consists of seven directors who are elected at an annual regular shareholders’ meeting. Each director serves for a three year term and the term of each of the seven directors expires on the same day. Staggered terms are not permitted under Chilean law. If a vacancy occurs on the board during the three year term, the board of directors may appoint a temporary director to fill the vacancy. In addition, the vacancy will trigger an election for every seat on the board of directors at the next general shareholders' meeting. The current board of directors was elected in March 2003 and their terms expire in March 2006. The members of the board of directors do not have service contracts with Enersis or any of its subsidiaries that provide benefits upon termination of employment.
Chilean corporate law provides that a company’s board of directors is responsible for the management, administration and representation of a company in all matters concerning its corporate purpose, subject to the provisions of the company’sestatutos and the stockholders’ resolutions. In addition to theestatutos, the Board of Directors of Enersis has adopted regulations and policies that guide our corporate governance principles. The most important of these regulations and policies are the following:
The Internal Regulations on Conduct in Securities Markets, approved by the Board on January 31, 2002, which determine the rules of conduct that must be followed by members of the Board of Directors, senior management and other managers and employees who, due to the nature of their job responsibilities, may have access to sensitive or confidential information, with a view to contributing to transparency and to the protection of investors. These regulations are based on the principles of impartiality, good faith, placing the company’s interests before one’s own, and care and diligence in using information when acting in the securities markets.
The Charter Governing Executives(“Estatuto del Directivo”), approved by the Board on May 28, 2003, and the Employees Code of Conduct, which develop our principles and values, establish the rules governing dealings with customers and suppliers, and establish the principles that should be followed by employees in their work, including ethical conduct, professionalism and confidentiality. They also impose limitations on the activities our senior executives and other employees may undertake outside the scope of their employment with us, such as non-compete limitations.
112
The above regulations and rules reflect our core principles of transparency, respect for stockholders’ rights, and the duty of care and loyalty of the directors imposed by Chilean law.
Compliance with NYSE Listing Standards on Corporate Governance
Following is a summary of the significant differences between our corporate governance practices and those applicable to domestic issuers under the corporate governance rules of the New York Stock Exchange. Because we are a “controlled company” under NYSE rules (a company of which more than 50% of the voting power is held by an individual, a group or another company), we would not, were we to be a U.S. company, be subject to the requirement that we have a majority of independent directors, or nomination and compensation committees.
Independence and functions of the Audit Committee
Under the NYSE corporate governance rules, all members of the Audit Committee must be independent. We will be subject to this requirement effective July 31, 2005. As required by Chilean Law, Enersis has aComité de Directores composed of three directors. Although Chilean Law requires that a majority of theComité de Directores (two out of three members) must be composed of directors who were not nominated by the controlling shareholder and did not seek votes from the controlling shareholder (a “non-control director”), it permits theComité de Directores to be composed of a majority or even a unanimity of control directors, if there are not sufficient non-control directors on the board to serve on the committee. Currently, ourComité de Directores is composed by one non-control director and by two directors appointed by the controlling shareholder. OurComité de Directoresdoes not currently meet the independence requirements to which the Audit Committee of Enersis, will become subject on July 31, 2005, or the additional independence requirements to which the audit committees of U.S. companies are subject.
Under the NYSE corporate governance rules, the audit committee of a U.S. company must perform the functions detailed in the NYSE Listed Company Manual Rules 303A.06 and 303A.07. Non-U.S. companies are required to comply with Rule 303A.06 beginning July 31, 2005, but are not at any time required to comply with Rule 303A.07. We do not currently comply with these rules, but we expect that when we become subject to Rule 303A.06, we will comply with both the independence and the function requirements of the rule.
Corporate Governance Guidelines
The NYSE’s corporate governance rules require U.S. listed companies to adopt and disclose corporate governance guidelines. Chilean law does not contemplate this practice, other than with respect to the codes of conduct described above.
Committees and Other Advisory Bodies
The Comité de Directores
TheComité de Directores is composed of three members who are simultaneously directors of the Company. It performs the following functions:
| • | examination of Annual Report, Financial Statements and the Reports of the External Auditors and Inspectors of the Accounts; | |
| • | formulation of the proposal to the Board of Directors for the selection of external auditors and private rating agencies; | |
| • | examination of information related to operations by the Company with related parties and/or related to operations in which the Company board members or relevant executive officers may have personal interest; | |
| • | examination of the remuneration framework and compensation plans for managers and executive officers; and | |
| • | any other function mandated to the committee by theestatutos, the board of directors or the shareholders of the company. |
113
Pablo Yrarrázaval, chairman of the board, has also served as chairman of this committee since July 31, 2002. The other members are Hernán Somerville and Ernesto Silva.
| D. | Employees |
The following table provides the total number of employees for our company and its subsidiaries for the past five fiscal years:
| Years ended December 31, | ||||||||||
| 2000 | 2001 | 2002 | 2003 | 2004 | ||||||
| Enersis (Chile) | 267 | 235 | 242 | 206 | 212 | |||||
| Endesa-Chile (1) | 1,764 | 1,752 | 1,937 | 1,515 | 1,562 | |||||
| Chilectra (Chile) | 868 | 722 | 720 | 745 | 692 | |||||
| Edesur (Argentina) | 2,379 | 2,267 | 2,251 | 2,258 | 2,277 | |||||
| Edelnor (Peru) | 618 | 557 | 565 | 554 | 543 | |||||
| Cerj (Brazil) | 1,402 | 1,354 | 1,451 | 1,517 | 1,408 | |||||
| Codensa (Colombia) | 969 | 813 | 802 | 858 | 901 | |||||
| Coelce (Brazil) | 1,592 | 1,464 | 1,401 | 1,375 | 1,337 | |||||
| Other Businesses (2) | 1,006 | 1,169 | 1,549 | 2,128 | 2,286 | |||||
| Total | 10,865 | 10,333 | 10,918 | 11,156 | 11,218 | |||||
| (1) | Includes Chilean operations and subsidiaries abroad. |
| (2) | Includes CAM, Synapsis and IMV. |
Chile
As of December 31, 2004, Enersis and its principal subsidiaries and related companies had 11,218 employees, including 2,328 employees of Enersis and of all Chilean majority owned subsidiaries, which in turn includes 473 employees of Endesa-Chile employed in Chile. In July and December 2003, two collective bargaining agreements were entered with employees of Enersis. Each agreement expires in 4 years, in July and December 2007, respectively. Collective bargaining agreements with employees of Chilectra took effect on December 2004 and are scheduled to expire on December 2008. Endesa-Chile signed an agreement with the Engineers Union in December 2003. This agreement will expire in December 2006. Endesa’s collective bargaining agreements with electromechanical, technical and administrative personnel terminate in December 2005 and December 2008. In December 2004, two collective agreements with the employees of CAM were signed, which expire in December 2007 and December 2008, respectively.
Argentina
As of December 31, 2004, Edesur had 2,277 employees, Costanera (a subsidiary of Endesa-Chile) had 262 employees and El Chocón had 49 employees. In October 2004 two collective agreements were signed with the employees of Edesur; however, the agreements have not yet been registered with government authorities and have accordingly not taken effect. We anticipate that the agreements will be registered and will take effect in 2005. Costanera is also a party to two collective bargaining agreements: one that began in April 2005 and another that is expected to expire in October 2005.
Brazil
As of December 31, 2004, Cerj had 1,408 employees, Endesa-Chile employed 53 persons in Cachoeira Dourada and Coelce had 1,337 employees. Coelce is a party to a collective bargaining agreement that is scheduled to expire in December 2006. Cachoeira Dourada is a party to two collective bargaining agreements, both of which expire in 2006. Cerj is a party to collective bargaining agreements that are scheduled to expire in September 2005. Such
114
agreements establish salaries, productivity bonuses, individual performance evaluation and general working conditions. Brazilian law stipulates that collective bargaining agreements cannot be for more than two years.
Colombia
As of December 31, 2004, Codensa had 901 employees. Betania, Endesa-Chile’s subsidiary, employed 34 persons and Emgesa had 285 employees as of December 31, 2004. Codensa has two collective bargaining agreements that expire in December 2007. Typically, collective bargaining agreements have two-year terms; however, there are no legal restrictions on the maximum duration of such agreements. Emgesa is a party to a collective bargaining agreement that is scheduled to expire in December 2007.
Peru
As of December 31, 2004, Edelnor had 543 employees and Endesa-Chile s related company Edegel had 157 employees. Edelnor is a party to two collective bargaining agreements that are scheduled to expire in November and December 2005.
| E. | Share ownership |
To the best of the Company’s knowledge, none of Enersis’ directors or officers owns more than 0.1% of the shares of the Company. None of Enersis’ directors and officers have any stock options.
| Item 7. Major Shareholders and Related Party Transactions |
| A. | Major shareholders |
As of December 31, 2004, Endesa-Spain, beneficially owned 60.6% of the shares of Enersis. Chilean private pension funds, or AFPs, owned 16.6% in the aggregate, with the highest AFP shareholding being AFP Provida, with 5.9%. Chilean stockbrokers, mutual funds, insurance companies, foreign equity funds, and other Chilean institutional investors collectively owned 8.3% of our equity. ADR holders own 10.2% of the equity. Approximately 9,615 minority shareholders own the remaining 4.4% of shares.
Principal Shareholders
Enersis’ only outstanding voting securities are shares of common stock. As of December 31, 2004, according to our stockholder records, our 32,651,166,465 shares of common stock outstanding were held by 9,771 stockholders of record.
As of December 31, 2004, five of seven members of our board of directors were designees of Endesa-Spain and one of the two remaining directors was elected with votes from Endesa-Spain.As a result of the foregoing, Endesa-Spain has exerted majority control over Enersis since April 1999. However, Endesa-Spain does not have different voting rights than the other shareholders of Enersis. The following table sets forth certain information concerning ownership of the common stock as of December 31, 2004, with respect to each stockholder known to us to own more than 5% of the outstanding shares of common stock.
| No. of | Percentage of Total | |||
| Shares Owned | Shares Outstanding | |||
| Endesa-Spain (1) | 19,794,583,473 | 60.6 | % | |
| AFP Provida (2) | 1,909,012,845 | 5.9 | % | |
| (1) | Endesa-Spain’s 60.6% beneficial interest is held through Endesa Internacional, S.A. |
| (2) | The beneficial interest of AFP Provida (a private pension fund) is held through four different investment funds. |
| B. | Related party transactions |
Article 89 of the Chilean Companies Act requires that our transactions with our parent company, subsidiaries and/or their related parties be on equitable conditions, similar to those customarily prevailing in the market.
115
Directors and executive officers of companies who violate Article 89 are liable for losses resulting from such violation. In addition, Article 44 of the Chilean Companies Act, as amended, provides that a corporation may only execute transactions, in which one or more directors have a personal interest or an interest as a representative of another person, when such transactions are previously examined and reported to the Board of Directors by the Comité de Directores and then approved by the Board of Directors prior to execution by the company, and the terms of such transactions are adjusted to equitable conditions similar to those customarily prevailing in the market. Resolutions approving transactions under Article 44 must be reported to our stockholders in the next stockholders’ meeting. If the transactions involve a material amount, the board of directors must determine in advance if the transactions are adjusted to equitable conditions similar to those customarily prevailing in the market or not. If the board decides that it is not possible to ascertain such conditions, the board of directors, with the exclusion of interested directors, may approve or reject the transaction, or appoint two independent appraisers. The appraisers’ report will be available to the shareholders and the board of directors for a period of 20 business days. Once such term has expired, the board of directors may approve or reject the transaction, with the abstention of interested directors. If shareholders representing 5% or more of the voting shares consider that the terms and conditions of the transactions are not favorable to the interests of the company, or that the appraisers’ reports are substantially different, they may request that the board convoke an extraordinary shareholders’ meeting to approve or reject the transaction with a majority of 2/3 of the voting shares. Violation of Article 44 may result in administrative and criminal sanctions and civil liability to us, our shareholders or interested third parties who suffer losses as a result of such violation. We, our shareholders and interested third parties, however, may ask the interested director to reimburse the company in an amount equivalent to the benefits that the transaction in violation of Article 44 represented to the interested director, relatives and/or representatives.
It is common practice in Chile to transfer surplus funds of one company to another related company that has a cash deficit. These transactions are carried out through short-term intercompany loans. Under Chilean law and regulation, such transactions must be carried out on an arms’ length basis. It is our policy to manage all cash inflows and outflows of our wholly-owned Chilean subsidiaries, Endesa-Chile and Endesa-Chile’s Chilean subsidiaries by way of a centralized cash management policy. Such centralized cash management is more efficient for both financial and tax reasons. All of these operations are subject to the supervision of our Comité de Directores.
In other countries in the regions in which we do business, these intercompany transactions are permitted but they have adverse tax consequences. Accordingly, we do not similarly manage the cash flows of our non-Chilean subsidiaries.
Enersis has made structured loans in Chile, at the same cost of funds for Enersis, primarily in order to finance foreign investments. As of December 31, 2004, the outstanding net balance for such loans was U.S.$ 862 million, the largest amount outstanding during 2004. Additionally, Enersis lent to its foreign subsidiaries an amount of U.S.$ 279 million as of December 31, 2004. The largest amount outstanding during 2004 for such loans to its foreign subsidiaries was U.S.$ 376 million.
The interest rate on these intercompany loans to Enersis’ subsidiaries ranges from 4.8% to 6.1% in Chile, with a weighted average interest rate of approximately 5.4%. The interest rate on these intercompany loans to Enersis’ foreign subsidiaries ranges from 7.4% to 8.5%, with a weighted average interest rate of approximately 7.9%.
Endesa-Chile has also made structured loans to its subsidiaries in Chile, primarily to finance projects and refinance existing indebtedness. As of December 31, 2004, the outstanding net balance for such loans was U.S.$ 444 million, the largest amount outstanding during 2004. Additionally, Endesa-Chile lent money to its foreign subsidiaries, in order to finance foreign investments, in an amount of U.S.$ 343 million as of December 31, 2004. The largest amount outstanding during 2004 for such loans to its foreign subsidiaries was U.S.$ 481 million.
The interest rate on these intercompany loans to Endesa-Chile’s subsidiaries ranges from 2.2% to 6.5% in Chile, with a weighted average interest rate of approximately 3.6%. The interest rate on these intercompany loans to Endesa-Chile’s foreign subsidiaries ranges from 6.6% to 9.0%, with a weighted average interest rate of approximately 7.7%.
116
| C. | Interests of experts and counsel |
| Not applicable. | |
Item 8. Financial Information | |
| A. | Consolidated Statements and Other Financial Information |
| See Item 18 for our consolidated financial statements. | |
Legal Proceedings
We and our principal subsidiaries and related companies are routinely parties to legal proceedings arising in the normal course of business that are not material to our consolidated results from operations. Our most recent litigation is described below. For more information on all of our legal proceeding please refer to Note 30 of our consolidated financial statements.
Divergence of Firm Capacity (Resolution No. 35)
In December 2004 Endesa-Chile and its subsidiaries Pehuenche and Pangue filed a public law annulment suit against Ministry Resolution No. 35 of the Ministry of Economy. The Ministry of Economy resolved a disagreement among the companies of the CDEC-SIC in relation to the sums of the firm capacity in 2000-2003 and instructed the CDEC-SIC to redefine the hours of greatest probability of charge in the system. This instruction created a series of conflicts in the CDEC-SIC which were resolved by the creation of the “Panel de Expertos” (Experts Panel) in September and December 2004, which resulted in payments on behalf of Pehuenche to other generation companies in the sum of approximately Ch$ 23 billion. On a consolidated level the effect of firm capacity recalculations of 2000-2003 implied a cost to the Company of approximately Ch$ 14.5 billion.
Dividends
As determined by Enersis’ board of directors, the dividend policy for fiscal year 2004 was to pay provisional dividends to stockholders as close as possible to 85% of annual “net income from normal operations.” “Net income from normal operations” generally includes income from Enersis’ majority-owned Chilean subsidiaries and excludes income from accounting gains arising from non-cash equity contributions by Enersis to its subsidiaries, gains recorded which arise from the issuance of shares by subsidiaries at prices in excess of book value, certain other non-cash accounting gains, and income (but not losses) arising, directly or indirectly, from our interests in Endesa-Chile and our non-Chilean subsidiaries and related companies. The board of directors customarily declared provisional dividends amounting to 85% of net income from “normal operations” derived from the quarters ending in March, June, September and December. To perform such calculation, previously paid dividends were credited and deducted from the accumulated profits to date at the time of dividend distribution. According to such dividend policy, the Company pays a provisional quarterly dividend in May, August and November of each year and in February of each following year. However, in 2001, 2002, 2003 and 2004 we made no such provisional dividend payments.
In addition, the board generally proposes to the shareholders a “definitive dividend” payable each year, and attributable to the prior year, which cannot be less than the legal minimum, which is 30% of annual net income before negative goodwill amortization. At a board of directors meeting held on February 28, 2005 the Board agreed to propose to the general shareholders’ meeting the payment of a definitive dividend attributable to fiscal year 2004, equivalent to 50% of the annual net income before negative goodwill amortization.
The Board of Directors also approved a dividend policy for fiscal year 2005, which includes not paying provisional dividends. The Board intends to propose to the general shareholders’ meeting to be held during the first four months of 2006, a definitive dividend payment equivalent to 50% of the annual net income of fiscal year 2005 before negative goodwill amortization. Such definitive dividend policy reflects the Board of Director’s intention; however, actual dividends will be subject to net profits actually obtained in each period, as well as to expectations of future profit levels and other conditions that may exist at the moment of such dividend declaration.
117
Enersis, as a holding company, is primarily dependent upon remittances from its operating subsidiaries in the form of dividend payments in servicing its debt obligations. The principal operating subsidiaries and related companies of Enersis are Endesa-Chile and Chilectra in Chile, Edesur in Argentina, Edelnor in Peru, Cerj and Coelce in Brazil and Codensa in Colombia. See “Item 4. Information on the Company—C. Organizational structure—Principal Subsidiaries and Related Companies.”
Stockholders set dividend policies at each subsidiary and related company. There are currently no material currency controls which prohibit Enersis from repatriating the dividend payments from its non-Chilean principal subsidiaries and related companies.
To the extent Enersis’ subsidiaries and related companies are not able for any given period to pay dividends due to insufficient net income for such period or otherwise, Enersis may receive intercompany advances of funds for liquidity purposes.
We believe that cash flow generated from operations, cash balances, assets sales, borrowings from commercial banks and access to both domestic and foreign capital markets will be sufficient to meet our needs for working capital, debt service, dividends and routine capital expenditures.
Dividends Paid
| Nominal | U.S.$ | ||||
| Year | Ch$ | per ADS(1) | |||
| (Ch$ per share) | |||||
| 2000 | 0.00 | 0.00 | |||
| 2001 | 1.81 | 0.16 | |||
| 2002 | 0.00 | 0.00 | |||
| 2003 | 0.00 | 0.00 | |||
| 2004 | 0.00 | 0.00 | |||
| 2005 (through April 30) | 0.42 | 0.04 |
| (1) | The U.S. dollar per ADS amount has been calculated by applying the exchange rate of Ch$ 557.4 = U.S.$ 1.00, the Observed Exchange Rate prevailing on December 31, 2004, to the constant Chilean peso amount. |
For a discussion of Chilean Withholding Taxes and access to the formal currency market in Chile in connection with the payment of dividends and sales of ADSs and the underlying Common Stock, see “Item 10. Additional Information – E. Taxation.” and “Item 10. Additional Information – D. Exchange Controls.”
| B. | Significant Changes |
| None. | |
| Item 9. The Offer and Listing | |
| A. | Offer and listing details |
Market Price and Volume Information
The shares of Common Stock are currently traded on the Chilean Exchanges. Shares of Common Stock have traded in the United States on the NYSE since October 19, 1993 in the form of ADSs under the ticker symbol “ENI.” Each ADS represents 50 shares of Common Stock, with the ADSs in turn evidenced by American Depositary Receipts (“ADRs”). The ADRs are outstanding under a deposit agreement dated as of October 18, 1993, as amended, among us, Citibank, n.a., as Depositary, and the holders from time to time of ADRs issued thereunder. Only persons in whose names ADRs are registered on the books of the Depositary are treated by the Depositary as owners of ADRs.
118
The table below shows, for the periods indicated, the share volume, quarterly high and low closing prices in Chilean pesos of the Shares on the Santiago Stock Exchange and the quarterly high and low closing prices of the ADSs in U.S.$ as reported by the NYSE.
| Chilean Pesos Per Share(1) | U.S.$ per ADS(2) | ||||||||||
| Share Volume | High | Low | High | Low | |||||||
| 2005 | |||||||||||
| May | 506,391,087 | 109.50 | 100.99 | 9 | 4/7 | 8 | 3/5 | ||||
| April | 1,094,831,877 | 110.51 | 97.00 | 9 | 3/5 | 8 | 1/4 | ||||
| March | 567,186,683 | 103.50 | 95.00 | 8 | 7/8 | 8 | |||||
| February | 380,476,426 | 101.00 | 93.00 | 9 | 8 | ||||||
| January | 400,676,398 | 95.00 | 87.00 | 8 | 2/3 | 7 | 1/3 | ||||
| 2004 | |||||||||||
| December | 568,896,414 | 97.00 | 87.00 | 8 | 5/8 | 7 | 2/5 | ||||
| 4th quarter | 2,248,285,905 | 97.00 | 84.00 | 8 | 5/8 | 6 | 4/5 | ||||
| 3rd quarter | 2,236,312,231 | 89.51 | 73.00 | 7 | 1/2 | 5 | 2/3 | ||||
| 2nd quarter | 1,032,271,059 | 82.01 | 70.00 | 6 | 5/6 | 5 | 1/2 | ||||
| 1st quarter | 1,413,791,567 | 87.50 | 73.00 | 7 | 3/4 | 5 | 7/8 | ||||
| 2003 | |||||||||||
| 4th quarter | 2,949,415,326 | 88.00 | 72.01 | 7 | 2/5 | 5 | 7/9 | ||||
| 3rd quarter | 2,615,141,119 | 76.50 | 60.80 | 6 | 4 | 1/2 | |||||
| 2nd quarter | 2,037,701,115 | 73.00 | 56.00 | 5 | 1/4 | 3 | 6/7 | ||||
| 1st quarter | 435,639,838 | 67.00 | 55.00 | 4 | 5/7 | 3 | 5/8 | ||||
| 2002 | |||||||||||
| 4th quarter | 684,639,252 | 77.00 | 52.00 | 5 | 2/9 | 3 | 5/7 | ||||
| 3rd quarter | 692,521,240 | 92.80 | 65.01 | 6 | 4/5 | 4 | 1/6 | ||||
| 2nd quarter | 474,079,058 | 127.02 | 79.49 | 10 | 5 | 4/7 | |||||
| 1st quarter | 512,037,133 | 176.00 | 117.50 | 13 | 3/4 | 8 | 3/4 | ||||
| 2001 | |||||||||||
| 4th quarter | 393,051,601 | 202.00 | 163.76 | 15 | 1/2 | 11 | 1/3 | ||||
| 3rd quarter | 226,195,786 | 200.00 | 171.00 | 15 | 2/5 | 12 | 1/4 | ||||
| 2nd quarter | 292,388,256 | 207.75 | 185.00 | 17 | 2/5 | 14 | 1/8 | ||||
| 1st quarter | 217,618,425 | 222.00 | 188.00 | 20 | 1/9 | 15 | 3/5 | ||||
| 2000 | |||||||||||
| 4th quarter | 198,483,727 | 218.00 | 166.99 | 19 | 14 | 1/2 | |||||
| 3rd quarter | 88,658,193 | 226.00 | 191.00 | 21 | 1/4 | 17 | |||||
| 2nd quarter | 110,101,006 | 234.00 | 192.00 | 28 | 4/7 | 18 | 3/8 | ||||
| 1st quarter | 190,988,287 | 252.00 | 190.00 | 24 | 1/8 | 18 | 3/8 | ||||
| (1) | As reported by the Santiago Stock Exchange. Chilean pesos per share reflect the nominal price as of the trade date. The price has not been restated in constant Chilean pesos. |
| (2) | As reported by the NYSE. One ADS = 50 Shares. |
As of December 31, 2004, there were 66,347,447 ADSs (equivalent to 3,317,372,350 common shares) outstanding. Such ADSs represented at such date approximately 10.2% of the total number of outstanding shares. It is not practicable for us to determine the proportion of ADRs beneficially owned by U.S. persons
Trading
The Santiago Stock Exchange was established in 1893 and is a private company whose equity consists of 48 shares held by 46 stockholders as of the date of this filing. As of December 31, 2004, 239 companies had shares listed on the Santiago Stock Exchange.
119
Equities, closed-end funds, fixed-income securities, short-term and money market securities, gold and U.S.$ are traded on the Santiago Stock Exchange. In 1990, the Santiago Stock Exchange initiated a futures market with two instruments, U.S. dollar futures and Selective Shares Price Index, or IPSA, futures. Securities are traded primarily through an open voice auction system, a firm offers system or the daily auction. Trading through the open voice system occurs on each business day from 9:30 a.m. to 4:30 p.m., Santiago time, which varies from New York City time depending on the season. The Santiago Stock Exchange has an electronic trading system calledTelepregón, which operates continuously from 9:30 a.m. to 4:30 p.m. on each business day. On days in which auctions are scheduled, there are three times available for such auctions: 9:15 a.m., 12:30 p.m. and 4:30 p.m.
There are two share price indices on the Santiago Stock Exchange: the General Share Price Index, or IGPA, and the IPSA. The IGPA is calculated using the prices of over 160 issues and is broken into five main sectors: banks and finance; farming and forest products; mining; industry and miscellaneous. The IPSA is calculated using the prices of the 40 most actively traded shares. The shares included in the IPSA are weighted according to the value of the shares traded. As of December 31, 2004, Enersis and Endesa-Chile shares were included in the IPSA.
Shares of Enersis were first listed and began trading on theBolsa de Valores Latinoamericanos de la Bolsa de Madrid, or Latibex, as of December 17, 2001. One trading unit is the equivalent of 50 common shares (the same unit conversion of 50:1 as an ADS) and the trading ticker symbol is “XENI.” Banco Santander Central Hispano Bolsa S.A. S.V.B. acts as the liaison entity, and the Banco Santander as the depositary in Chile. Trading of our shares in the Latibex amounted to approximately 3 million units in 2004, which in turn was the equivalent of € 14 million. The stock closed at € 6.22 the last day of trading in Latibex in 2004.
| B. | Plan of distribution |
| Not applicable. | |
| C. | Markets |
| See “—A. Offer and listing details—Market Price and Volume Information” above. | |
| D. | Selling shareholders |
| Not applicable. | |
| E. | Dilution |
| Not applicable. | |
| F. | Expense of the issue |
| Not applicable. |
Item 10. Additional Information
| A. | Share capital |
| Included below in Section B of this item. | |
| B. | Memorandum and articles of association |
Description of Share Capital
Set forth below is certain information concerning our share capital and a brief summary of certain significant provisions of our by-laws and Chilean law.
General
Shareholders’ rights in Chilean companies are governed by a company’s by-laws, which effectively serve the purpose of both the articles, or certificate, of incorporation and the by-laws of a company incorporated in the United States, and by the Chilean Companies Act. In accordance with the Chilean Companies Act, legal actions by shareholders against us to enforce their rights as shareholders must be brought in Chile in arbitration proceedings or at the option of the plaintiff before the ordinary courts of Chile.
120
The Chilean securities markets are principally regulated by the Superintendency of Securities and Insurance (Superintendencia de Valores y Seguros or SVS), under the Securities Market Law (Ley de Mercado de Valores No. 18045) and the Chilean Companies Act. These two laws provide for disclosure requirements, restrictions on insider trading and price manipulation, and protection of minority investors. The Securities Market Law sets forth requirements for public offerings, stock exchanges and brokers, and outlines disclosure requirements for companies that issue publicly offered securities. On December 20, 2000, Law 19,705 was enacted, introducing important amendments to the Chilean Companies Act and the Securities Market Law. Among other things, it provides a new definition for publicly held limited liability stock companies and new rules regarding takeovers, tender offers, transactions with directors, qualified majorities, share repurchase, director’s committee, stock options and derivative actions. Publicly held limited liability stock companies are those with 500 or more shareholders, or companies in which 100 or more shareholders own at least 10% of the subscribed capital, excluding those whose individual holdings directly or indirectly exceed such percentage, and all other companies whose shares are registered voluntarily with the SVS, regardless of the number of their shareholders. Enersis is a publicly held limited liability stock company (sociedad anónima abierta).
Reporting Requirements Regarding Acquisition or Sale of Shares.
Under Article 12 of the Securities Market Law and Section II of Circular 585 of the SVS, certain information regarding transactions in shares of publicly held limited liability stock companies must be reported to the SVS and the Chilean stock exchanges. Since the ADRs are deemed to represent the shares of common stock underlying the ADRs, transactions in ADRs will be subject to these reporting requirements and those established in Circular 1,375 of the SVS. Shareholders of publicly held limited liability stock companies are required to report to the SVS and the Chilean stock exchanges:
| • | any direct or indirect acquisition or sale of shares or options to buy or sell shares that results in the holder’s acquiring or disposing, directly or indirectly, of 10% or more of a publicly held limited liability stock company’s subscribed capital; and | |
| • | any direct or indirect acquisition or sale of shares or options to buy or sell shares, in any amount, if made by a holder of 10% or more of a publicly held limited liability stock company’s subscribed capital. |
Any direct or indirect acquisition or sale of shares or options to buy or sell shares, in any amount, made by a director, receiver, principal executive, general manager or manager of a company whose shares are registered with the SVS must be reported to the SVS and the Chilean stock exchanges.
In addition, the majority shareholders must inform the SVS and the Chilean stock exchanges if the above-mentioned acquisitions are done with the intention to obtain the control of the company or only as passive investment.
Under new Article 54 of the Securities Market Law andNorma de Carácter General No. 104 enacted by the SVS on January 5, 2001, any person who directly or indirectly intends to take control of a publicly held limited liability stock company must disclose his intent to the market at least 10 business days in advance of the change of control and, in any event, as soon as the negotiations for the change of control have started. If the change of control shall occur by means of a tender offer, the new provisions on tender offers will apply.
Law 19,705 introduces a new chapter to the Securities Market Law, establishing a comprehensive regulation on tender offers. The law defines a tender offer as the offer to purchase shares of corporations which publicly offer their shares or securities convertible into shares and which offer is made to shareholders to purchase their shares on conditions which allow the bidder to reach a certain percentage of ownership of the corporation within a fixed period of time. The new provisions apply to both voluntary and mandatory tender offers.
Register
Enersis is registered with the SVS and its entry number is 0175.
121
Corporate Objective and Purpose
Article 4 of our by-laws states that our corporate objective and purpose are, among other things, to conduct the exploration, development, operation, generation, distribution, transmission, transformation, or sale of energy in any form, directly or through other companies, as well as to provide engineering-consultancy services related to these objectives, in Chile and abroad.
In the Enersis Extraordinary Shareholders’ Meeting held on April 11, 2002, an amendment to the corporate objective and purpose of the company was approved in order to allow Enersis, directly or through its subsidiaries, to participate in the telecommunications business. Other amendments to the aforementioned article of our by-laws were approved in order to clarify some aspects of our corporate object and purpose.
Board of Directors
Our board of directors is made up of 7 members who may or may not be shareholders of Enersis. Members of the board are appointed by the general meeting of shareholders and are elected for a period of three years at the end of which they will be re-elected or replaced.
The seven directors elected at the shareholders’ meeting are those seven individual nominees who receive the most votes. Each shareholder may vote all of his shares in favor of one nominee or may apportion his shares among any number of nominees. These voting provisions ensure that a shareholder owning more than 12.5% of our shares outstanding will be able to elect a member of the board of directors.
The compensation of the directors is set annually by the general meeting of shareholders. The Chairman is entitled to receive twice the compensation paid, and the Vice Chairman 50% more than that paid, to each director. Thus, the board of directors does not have power to vote compensation for themselves or any members of their body.
Certain Powers of the Board of Directors
In addition, our by-laws do not contain provisions relating to:
| • | borrowing powers exercisable by the directors and how such borrowing powers can be varied; or | |
| • | retirement or non-retirement of directors under an age limit requirement. |
Certain Provisions Regarding Shareholder Rights
As of the date of the filing of this annual report, Enersis’ capital is comprised of only one class of shares, all of which are ordinary shares and have the same rights.
Our by-laws do not contain any provisions relating to:
| • | redemption provisions; | |
| • | sinking funds; or | |
| • | liability to further capital calls by the company. |
Under Chilean law, the rights of holders of stock may only be changed by an amendment to the by-laws of the company that complies with the requirements explained below under “–Shareholders’ Meetings and Voting Rights.”
122
Capitalization
Under Chilean law, the shareholders of a company, acting at an extraordinary shareholders’ meeting, have the power to authorize an increase in its capital. When an investor subscribes for shares, the shares are officially issued and registered in his name, and the subscriber is treated as a shareholder for all purposes except receipt of dividends and for return of capital in the event that the shares have been subscribed but not paid for. The subscriber becomes eligible to receive dividends once he has paid for the shares, or, if he has paid for only a portion of such shares, such subscriber is entitled to receive a corresponding pro-rata portion of the dividends declared with respect to such shares unless the company’s by-laws provide otherwise. If a subscriber does not fully pay for shares for which he has subscribed on or prior to the date agreed upon for payment, the company is entitled to auction the shares on the stock exchange where such shares are traded and has a cause of action against the subscriber for the difference, if any, between the subscription price and the price received at auction. However, until such shares are sold at auction, the subscriber continues to exercise all the rights of a shareholder, except the right to receive dividends and return of capital. Authorized shares, and issued shares for which full payment has not been made within the period fixed by the extraordinary shareholders’ meeting at which their subscription was authorized, which in no case may exceed three years from the date of such meeting, are canceled and are no longer available for issuance.
On April 30, 1999, our shareholders approved a capital increase of 2.58 billion shares. In 2000, the Company issued a Pre-Emptive Rights’ Offering, including an ADS Offering, in which approximately 1.49 billion common shares were fully subscribed and paid under this capital increase. On April 30, 2002, the three-year period, granted by the Company’s shareholders in order to carry out the remainder of the authorized capital increase, expired. Therefore, the shares of the Company were reduced to the number which until now have been fully subscribed and paid.
On March 31, 2003, at an Extraordinary Shareholders’ Meeting, Enersis’ shareholders approved the issuance of 24,382,994,488 shares, at a market value of approximately U.S.$ 2 billion. The capital increase allowed Endesa-Spain, acting through a subsidiary, to exercise a portion of its pre-emptive options corresponding to 14,406,840,511 new shares, which were paid by the extinguishment of a Ch$ 1.0 trillion (approximately U.S.$ 1.4 billion at the exchange rate applicable at that time) intercompany loan that had previously been granted to Enersis. As required by Chilean law, an independent appraiser valued the loan exclusively for purposes of the capital increase at 86.8% of its par value. Endesa-Spain, acting through a subsidiary, subscribed for 59.1% of the new shares at a value of approximately Ch$ 870.5 billion, the appraised value of the loan. Additionally, the capital increase allowed the subscription for 3.7% of the new shares as part of the local bond exchange offer, which took place in between the first and the second pre-emptive rights periods of the capital increase. The total amount of local bonds exchanged was equivalent to approximately Ch$ 54 billion.
At the same Extraordinary Shareholders’ Meeting held on March 31, 2003, the shareholders approved the elimination of the 65% by-laws’ restriction on the maximum shareholding by any party. On March 26, 2004, our shareholders approved a new amendment to our by-laws to reinstate, among other things, the 65% maximum shareholding restriction set forth above.
Pre-emptive Rights and Increases of Share Capital
The Chilean Companies Act requires Chilean companies to grant shareholders the pre-emptive right to purchase a sufficient number of shares to maintain their existing ownership percentage of such company whenever such company issues new shares.
Under Chilean law, pre-emptive rights are exercisable or freely transferable by shareholders during the 30-day period following the granting of such rights. During such 30-day period, and for an additional 30-day period, Chilean publicly held limited liability stock companies are not permitted to offer any unsubscribed shares to third parties on terms which are more favorable than those offered to their shareholders, but they may be freely sold after the 30-day period following the granting of such rights to third parties on terms less favorable for the purchaser than those offered to shareholders. At the end of such additional 30-day period, a Chilean publicly held limited liability stock company is authorized to sell non-subscribed shares to third parties on any terms, provided they are sold on one of the Chilean stock exchanges.
Under the last capital increase, the first pre-emptive rights period ended on June 30, 2003 and the second period was from November 20 and December 20, 2003. Between the two pre-emptive rights periods, there was also a preferred opportunity for Enersis’ local bondholders to tender their bonds in exchange for shares of common stock.
123
Shareholders’ Meetings and Voting Rights
A modification of our by-laws requires the affirmative vote of shareholders holding not less than two-thirds of the shares eligible to vote.
An ordinary annual meeting of our shareholders is held within the first four months following the end of our fiscal year, generally in March or April. The last ordinary annual meeting was held on April 8, 2005. Extraordinary meetings may be called by the board of directors when deemed appropriate or when requested by shareholders representing at least 10% of the issued voting shares or by the SVS. To convene an extraordinary meeting, or an ordinary annual meeting, notice must be given by three publications in a prescribed manner in a newspaper of our corporate domicile. The newspaper designated by our shareholders is the Santiago edition ofEl Mercurio. The first notice must be published not less than 15 days nor more than 20 days in advance of the scheduled meeting. Notice must also be mailed to each shareholder and given to the SVS and the Chilean stock exchanges. The last extraordinary meeting of shareholders was held on March 26, 2004.
Under Chilean law, a quorum for a shareholders’ meeting is established by the presence, in person or by proxy, of shareholders representing at least a majority of the issued voting shares of a company. If a quorum is not present at the first meeting, a reconvened meeting can take place at which the shareholders present are deemed to constitute a quorum regardless of the percentage of the shares represented. The second meeting must take place within 45 days following the scheduled date for the first meeting. Shareholders’ meetings adopt resolutions by the affirmative vote of an absolute majority of those shares present, or represented, at the meeting. Additionally, if a shareholders’ meeting is called for the purpose of considering:
| • | a transformation of the company into a different form of entity, a merger or division of the company; | |
| • | an amendment to the term of duration or early dissolution; | |
| • | a change in the corporation’s domicile; | |
| • | a decrease of corporate capital; | |
| • | approval of capital contributions in kind and assessment of such assets; | |
| • | modification of the authority reserved to shareholders or limitations on the board of directors’ powers; | |
| • | reduction in the number of members of the board of directors; | |
| • | disposition of 50% or more of the assets of the corporation, whether it includes disposition of liabilities or not, as well as the approval or the amendment of the business plan which contemplates the disposition of assets for such amount; | |
| • | the form of distributing corporate benefits; | |
| • | issue of guarantees for third parties’ liabilities which exceed 50% of the assets, but if the third party is a subsidiary of the company, the approval of the board of directors is sufficient; | |
| • | the purchase of the corporation’s own shares; or | |
| • | certain remedies for the nullification of the corporate by-laws, |
regardless of the quorum present, the vote required for the action is a two-thirds majority of the issued voting shares.
By-law amendments for the creation of a new class of shares, or an amendment to or an elimination of those classes of shares that already exist, must be approved by two-thirds of the outstanding shares of the affected series.
Shareholders are entitled to examine the books of the company within the 15-day period before the scheduled shareholders’ meeting. Under Chilean law, a notice of a shareholders’ meeting listing matters to be addressed at the meeting must be mailed at least 15 days prior to the date of such meeting, and, in cases of an ordinary annual meeting, shareholders must be sent an annual report of the company’s activities which includes audited financial statements. Limitations on the distribution of annual reports are established for the SVS in Circular No. 1,108. In addition to these requirements, we regularly provide, and management currently intends to continue to provide, together with the notice of the ordinary shareholders’ meetings, a proposal for the final dividend and an explanation of the dividend policy for interim dividends for that current year, previously approved by the board of directors.
124
The Chilean Companies Act provides that, upon the request by shareholders representing 10% or more of the issued voting shares, a Chilean company’s annual report must include, in addition to the materials provided by the board of directors to shareholders, such shareholders’ comments and proposals in relation to the company’s affairs. Similarly, the Chilean Companies Act provides that whenever the board of directors of a publicly held limited liability stock company convenes an ordinary meeting of shareholders and solicits proxies for the meeting, or circulates information supporting its decisions or other similar material, it is obligated to include the pertinent comments and proposals that may have been made by shareholders owning 10% or more of the company’s voting shares who request that such comments and proposals be so included.
Only shareholders registered as such with Enersis five business days prior to the date of a meeting are entitled to attend and vote their shares. A shareholder may appoint another individual, who need not be a shareholder as his proxy to attend and vote on his behalf. Proxies for such representation shall be given in writing for all the shares held by the owner. Every shareholder entitled to attend and vote at a shareholders’ meeting shall have one vote for every share subscribed.
Dividends and Liquidation Rights
In accordance with Chilean law, we are required to pay cash dividends equal to at least 30% of annual audited net income, calculated in accordance with Chilean GAAP (before negative goodwill amortization). If there is no net income in a given year, we may, but are not legally obligated to, distribute dividends out of retained earnings.
Any dividend in excess of 30% of such net income may be paid, at the election of the shareholder, in cash, in Enersis’ shares or in shares of publicly held limited liability stock corporations held by Enersis. Shareholders who do not expressly elect to receive a dividend other than in cash are legally presumed to have decided to receive the dividend in cash.
Dividends which are declared but not paid or held available to shareholders within the appropriate time period set forth in the Chilean Companies Act — as to minimum dividends, 30 days after declaration; as to additional dividends, the date set for payment at the time of declaration, are adjusted to reflect the change in the value of UF, a Chilean inflation adjusted currency, from the date set for payment to the date such dividends are actually paid. Such dividends also accrue interest at the then prevailing rate for UF -denominated deposits during such period. The right to receive a dividend lapses if it is not claimed within five years from the date such dividend is payable.
In the event of a liquidation of Enersis, the holders of shares would participate in the assets available in proportion to the number of paid-in shares held by them, after payment of all creditors.
Approval of Financial Statements
The board of directors is required to submit Enersis’ financial statements to the shareholders annually for their approval. If the shareholders by a vote of a majority of shares present (in person or by proxy) at the shareholders’ meeting reject the financial statements, the board of directors must submit new financial statements no later than 60 days from the date of such meeting. If the shareholders reject the new financial statements, the entire board of directors is deemed removed from office and a new board is elected at the same meeting. Directors who individually approved such financial statements are disqualified for reelection for the following period. Our shareholders have never rejected the financial statements presented by the board of directors.
Change of Control
Our by-laws do not contain any provisions that would delay, defer or prevent a change in control of Enersis. Under new Article 54 of the Securities Market Law andNorma de Carácter General No. 104 enacted by the SVS on January 5, 2001, any person who directly or indirectly intends to take control of a publicly held limited liability stock company must disclose his intent to the market at least 10 business days in advance of the change of control and, in any event, as soon as the negotiations for the change of control have started. If the change of control shall occur by means of a tender offer, the new provisions on tender offers will apply.
125
Acquisition of Shares
There are no provisions in our by-laws that discriminate against any existing or prospective holder of shares as a result of such shareholder owning a substantial number of shares, except for the maximum concentration limit of shares to be held or voted, which currently is set at 65%, and provided for in Articles 5 Bis and 27 Bis of our bylaws.
Right of Dissenting Shareholders to Tender Their Shares
The Chilean Companies Act provides that upon the adoption of any of the resolutions enumerated below at an extraordinary meeting of shareholders, dissenting shareholders acquire the right to withdraw from the company and to compel the company to repurchase their shares, subject to the fulfillment of certain terms and conditions. In order to exercise such rights, holders of ADRs must first withdraw the shares represented by their ADRs pursuant to the terms of the deposit agreement.
“Dissenting” shareholders are defined as those who vote against a resolution that results in the withdrawal right, or who if absent from such meeting, state in writing their opposition to the respective resolution, within 30 days following the shareholders’ meeting where the resolution giving rise to the withdrawal right was approved. The price paid to a dissenting shareholder of a publicly held limited liability stock company, the shares of which are quoted and actively traded on one of Chilean stock exchanges, is the greatest among (i) the weighted average of the sales prices for the shares as reported on the Chilean stock exchanges on which the shares are quoted for the two-month period preceding the shareholders’ meeting giving rise to the withdrawal right, and (ii) the market price resulting from the average price of transactions on such day. If, because of the volume, frequency, number and diversity of the buyers and sellers, the SVS determined that the shares are not actively traded on a stock exchange, the price paid to the dissenting shareholder shall be the book value. Book value for this purpose shall equal paid capital plus reserves and profits, less losses, divided by the total number of subscribed shares, whether entirely or partially paid. For the purpose of making this calculation, the last annual balance sheet is used, as adjusted to reflect inflation up to date of the shareholders’ meeting which gave rise to the withdrawal right.
| The resolutions that result in a shareholder’s right to withdraw include, among others, the following: | ||
| • | the transformation of the company into another type of entity; | |
| • | the merger of the company with another company; | |
| • | disposition of 50% or more of the assets of the corporation, whether it includes disposition of liabilities or not, as well as the approval or the amendment of the business plan which contemplates the disposition of assets for such amount; | |
| • | issue of guarantees for third parties’ liabilities which exceed 50% of the assets, but if the third party is a subsidiary of the company, the approval of the board of directors is sufficient; | |
| • | the creation of preferential rights for a class of shares or an amendment to the existing ones. In this case the right to withdraw only accrues to the dissenting shareholders of the class or classes of shares adversely affected; | |
| • | certain remedies for the nullification of the corporate by-laws; and | |
| • | such other causes as may be established by a company’s by-laws. | |
126
Investments by AFPs
Title XII of DL-3500 permits AFPs to invest their fund assets in companies that are subject to Title XII and, subject to greater restrictions, in other companies. The determination of which stocks may be purchased by AFPs is made by theComisión Clasificadora de Riesgo, or the CCR. The CCR establishes investment guidelines and is empowered to approve or disapprove those companies that are eligible for AFP investments. Except for the period from March 2003 to March 2004 (discussed below), Enersis has been a Title XII Company since 1985 and is approved by the CCR.
Title XII companies are required, among other things: (i) to have by-laws that limit the ownership of any shareholder or shareholder groups to a specified maximum percentage, (ii) to take only certain actions at shareholders’ meetings, and (iii) to give the shareholders the right to approve certain investment and financing policies.
At the Extraordinary Shareholders’ Meeting held on March 31, 2003, the shareholders approved the elimination of the 65% by-laws restriction on the maximum shareholding by any party, among other by-law amendments referred to Title XII. On March 26, 2004, our shareholders approved a new amendment to our by-laws to reinstate the 65% maximum shareholding restriction described above as well as certain other related restrictions, thus, fully recovering its Title XII company status.
Registrations and Transfers
The shares are currently registered by Enersis through an Administrative Agent namedDCV Registros S.A.This entity is responsible for Enersis’ shareholders registry as well. In case of jointly owned shares, an attorney-in-fact must be appointed to represent the joint owners in dealing with Enersis.
| C. | Material contracts. |
On May 27, 2004, Enersis entered into a Stock Purchase and Sale Agreement with Endesa Internacional, underwhich Enersis acquired from Endesa Internacional 49,207,343 shares of Elesur, representing 99.9989% of Elesur’s share capital. As a result of this transaction, Elesur became a subsidiary of Enersis. Prior to this transaction, in August 2003 and December 2003, Elesur had sold to Endesa Internacional all of the shares of Enersis owned by Elesur.
| D. | Exchange controls. |
The Central Bank is responsible for, among other things, monetary policies and exchange controls in Chile.
On January 23, 2002, the Chilean Central Bank approved a new Compendium of Foreign Exchange Regulationsthat replaced the existing one. The new Compendium is in effect since March 1, 2002.
With these new rules, the Central Bank ends a process of gradual deregulation of the foreign exchange market.
| • | This new Compendium enhances the information gathered by the Central Bank and the quality of such information. In addition, this new Compendium includes the main rules that modified the Compendium of Foreign Exchange Regulations in April 1991. In other words, new cross-border investing and financing decisions will no longer be subject to any restrictions set forth in both Articles 42 and 49 of the Central Bank Law such as: | |
| • | the prior Central Bank authorization requirement for the entry of capital associated with foreign loans, investments, capital contributions, bonds and ADRs; | |
| • | the prior Central Bank authorization for capital remittances associated with returns of capital, dividends, and other benefits related to capital contributions, investments and prepayment of foreign loans; | |
| • | the prior Central Bank authorization for the return of capital, profits and other benefits associated with investments made by Chilean residents abroad; |
127
| • | the limitations to the special prepayment and acceleration clauses contained in foreign loans; | |
| • | the restrictions of minimum risk classification and the weighted duration for the issuance of bonds; | |
| • | the limitations with respect to the currencies in which external debt can be issued or contracted; | |
| • | the restrictions to the issue of ADRs; and | |
| • | the reserve requirement on funds coming from abroad (which was already 0%). |
The Compendium and International Bond Issuance
Chilean issuers may offer bonds internationally under Chapter XIV, as amended, of the Compendium of Foreign Exchange Regulations (the “Compendium”), issued by the Central Bank.
Prior to September 17, 1998, foreign loans (including international bond offerings) granted to individuals or companies in Chile were subject to a mandatory deposit (“encaje”) of an amount equal to 10% (reduced from a prior level of 30%) of the proceeds of the loan (or bond offering) in a one-year, non interest-bearing U.S. dollar account with the Central Bank (or to payment of a charge to the Central Bank on the next working day after the date of conversion of foreign currency into Chilean pesos in an amount equal to interest on such deposit at the rate of the twelve-month LIBOR for U.S. dollar deposits plus a market spread that currently approximates 4%). OnSeptember 17, 1998, the encaje deposit requirement was reduced to 0%, and on April 19, 2001, the encaje was eliminated. Despite this elimination, the Central Bank may at any time reinstate the encaje.
Foreign Investment Contract and Chapter XXVI
In connection with our initial offering of ADSs in 1993, we entered into a foreign investment contract (the “Foreign Investment Contract”) with the Central Bank and Citibank N.A., New York, the Depositary, pursuant to Article 47 of the Central Bank Act and Chapter XXVI of the Compendium of Foreign Exchange Regulations of the Central Bank (“Chapter XXVI”), which governed the issuance of ADSs by a Chilean company. Pursuant to the Foreign Investment Contract, the foreign exchange for payments and distributions with respect to the ADSs may be purchased in either the Formal Exchange Market or the Informal Exchange Market, but such payments must be necessarily remitted through the Formal Exchange Market. A new Compendium of Foreign Exchange Regulations in force since April 19, 2001 eliminated Chapter XXVI. This Compendium was restated and has been in force since March 1, 2002. As a result of the elimination of Chapter XXVI, there is no longer assured access to the Formal Exchange Market. However, because the Foreign Investment Contract was entered into pursuant to Chapter XXVI, the principles of Chapter XXVI still apply to its terms. Foreign investors who have purchased their shares under a Foreign Investment Contract pursuant to Chapter XXVI continue to have access to the Formal Exchange Market for the purpose of converting Chilean pesos to U.S.$ and repatriating from Chile amounts received with respect to the deposited shares of common stock or shares of common stock withdrawn from deposit on surrender of ADRs (including amounts received as cash dividends and proceeds from the sale in Chile of the underlying shares of common stock and any rights with respect thereto). The Foreign Investment Contracts cannot be modified or terminated without consent of all parties, and therefore foreign investors who have purchased their shares under a Foreign Investment Contract will continue to have access to the Formal Exchange Market. However, foreign investors who did not deposit their shares of common stock into our ADS facility will not have the benefits of our foreign investment contract with the Central Bank but instead will be subject to the normal foreign investment rules.
The following is a summary of certain provisions which were contained in Chapter XXVI and the Foreign Investment Contract, and which therefore remain relevant. This summary does not purport to be complete and is qualified in its entirety by reference to Chapter XXVI and the Foreign Investment Contract.
Under Chapter XXVI and the Foreign Investment Contract, the Central Bank agreed to grant to the Depositary, on behalf of ADR holders, and to any investor not residing or domiciled in Chile who withdraws common stock upon delivery of ADRs (such shares of common stock being referred to herein as “Withdrawn Shares”) access to the Formal Exchange Market to convert Chilean pesos into U.S. dollars (and to remit such dollars outside of Chile), including amounts received as:
128
| • | cash dividends; | |
| • | proceeds from the sale in Chile of Withdrawn Shares subject to receipt by the Central Bank of a certificate from the holder of the Withdrawn Shares (or from an institution authorized by the Central Bank) that such holder’s residence and domicile are outside Chile and a certificate from a Chilean stock exchange (or from a brokerage or securities firm established in Chile) that such Withdrawn Shares were sold on a Chilean stock exchange; | |
| • | proceeds from the sale in Chile of rights to subscribe for additional shares of Common Stock; | |
| • | proceeds from the liquidation, merger or consolidation of our company; and | |
| • | other distributions, including without limitation those resulting from any recapitalization, as a result of holding shares of Common Stock represented by ADSs or Withdrawn Shares. |
Transferees of Withdrawn Shares were not entitled to any of the foregoing rights under Chapter XXVI. Investors receiving Withdrawn Shares in exchange for ADRs had the right to redeposit such shares in exchange for ADRs, provided that certain conditions relating to redeposit were satisfied.
Chapter XXVI provided that access to the Formal Exchange Market in connection with dividend payments was conditioned upon certification by us to the Central Bank that a dividend payment has been made and any applicable tax has been withheld. Chapter XXVI also provided that the access to the Formal Exchange Market in connection with the sale of Withdrawn Shares or distributions thereon was conditioned upon receipt by the Central Bank of certification by the Depositary (or the Custodian on its behalf) that such Shares have been withdrawn in exchange for ADRs and receipt of a waiver of the benefit of the Foreign Investment Contract with respect thereto until such Withdrawn Shares were redeposited.
The Foreign Investment Contract provides that a person who brings foreign currency into Chile to purchase shares of common stock with the benefit of the Foreign Investment Contract must convert it into Chilean pesos on the same date and has five banking business days within which to invest in shares of common stock in order to receive the benefits of the Foreign Investment Contract. If such person decides within such period not to acquire shares of common stock, such person can access the Formal Exchange Market to reacquire U.S.$ , provided that the applicable request is presented to the Central Bank within seven banking business days of the initial conversion into pesos. Shares acquired as described above may be deposited for ADRs and receive the benefits of the Foreign Investment Contract, subject to receipt by the Central Bank of a certificate from the Depositary (or the Custodian on its behalf) that such deposit has been effected and that the related ADRs have been issued and receipt of a declaration from the person making such deposit waiving the benefits of the Foreign Investment Contract with respect to the deposited shares of common stock.
Access to the Formal Exchange Market under any of the circumstances described above is not automatic. Pursuant to Chapter XXVI, such access required approval of the Central Bank based on a request therefore presented through a banking institution established in Chile. The Foreign Investment Contract provides that if the Central Bank has not acted on such request within seven banking days, the request will be deemed approved.
In November 1995, the Central Bank amended Chapter XXVI to regulate secondary offerings of ADSs by companies that have previously entered into a Foreign Investment Contract. In accordance with the new regulations, we entered into an amended Foreign Investment Contract in connection with its offering of ADSs completed in February 1996 to comply with the rules in effect on the date of Central Bank approval of the new issuance of ADSs.
On November 16, 1999, the Central Bank issued new regulations which amended Chapter XXVI. Among the amendments, Chapter XXVI required that foreign currency that entered Chile pursuant to Chapter XXVI be converted into Chilean pesos in the Formal Exchange Market, and the shares evidencing ADRs only be paid in Chilean pesos. In addition, foreign currency required to remit the proceeds of the sale of the underlying shares be acquired alternatively in the Formal or in the Informal Exchange Market, although remittance of such amounts necessarily was to be made through the Formal Exchange Market (i.e., through a bank). On May 12, 2000, the rule that required that the invested capital remain in the country for at least one year before being repatriated was eliminated.
129
In connection with our capital increase approved in our shareholders’ meeting of April 30, 1999, we first amended our Foreign Investment Contract on September 7, 2000 and subsequently entered into a new Foreign Investment Contract on October 12, 2000.
Under current Chilean law, the Foreign Investment Contract cannot be changed unilaterally by the Central Bank. It is not certain, however, that additional Chilean restrictions applicable to the holders of ADRs, the disposition of underlying shares of Common Stock or the repatriation of the proceeds from such disposition could not be imposed in the future, nor can there be any assessment of the duration or impact of such restrictions if imposed.
E. Taxation.
Chilean Tax Considerations
The following discussion summarizes material Chilean income and withholding tax consequences to beneficial owners arising from the receipt, the exercise and/or the sale of ADS rightsas well as from the purchase, ownership and disposition of the shares and ADSs. The summary which follows does not purport to be a comprehensive description of all of the tax considerations that may be relevant to a decision to purchase, own or dispose of shares or ADSs and does not purport to deal with the tax consequences applicable to all categories of investors, some of which may be subject to special rules. Holders of shares and ADSs are advised to consult their own tax advisors concerning the Chilean and other tax consequences of the ownership of shares or ADSs.
The summary which follows is based on Chilean law, as in effect on the date hereof, and is subject to any changes in these or other laws occurring after such date, possibly with retroactive effect. Under Chilean law, provisions contained in statutes such as tax rates applicable to foreign investors, the computation of taxable income for Chilean purposes and the manner in which Chilean taxes are imposed and collected may be amended only by another law. In addition, the Chilean tax authorities enact rulings and regulations of either general or specific application and interpret the provisions of Chilean tax law. Chilean tax may not be assessed retroactively against taxpayers who act in good faith relying on such rulings, regulations and interpretations, but Chilean tax authorities may change their rulings, regulations and interpretations prospectively. The discussion which follows is also based, in part, on representations of the depositary, and assumes that each obligation in the deposit agreement and any related agreements will be performed in accordance with its terms. There is no income tax treaty in force between Chile and the United States.
As used in this annual report, the term “foreign holder” means either:
| • | in the case of an individual, a person who is not a resident in Chile; for purposes of Chilean taxation, an individual holder is resident in Chile if he or she has resided in Chile for more than six months in one calendar year, or a total of more than six months in two consecutive fiscal years; or | |
| • | in the case of a legal entity, an entity that is not organized under the laws of Chile, unless the shares or ADSs are assigned to a branch, agent, representative or permanent establishment of such entity in Chile. |
Taxation of Shares and ADSs
Taxation of Cash Dividends and Property Distributions
Cash dividends paid with respect to the shares or ADSs held by a foreign holder will be subject to a 35% Chilean withholding tax, which is withheld and paid over by the company. A credit against the Chilean withholding tax is available based on the level of corporate income tax actually paid by the company on the income to be distributed; however, this credit does not reduce the Chilean withholding tax on a one-for-one basis because it also increases the base on which the Chilean withholding tax is imposed. In addition, if the company distributes less than all of its distributable income, the credit for the Chilean corporate income tax paid by the company is proportionately reduced. On September 28, 2001, the Chilean corporate tax rate was amended. Until December 31,
130
2001, the corporate tax rate was 15%. For 2002, the corporate tax rate was to 16%. For 2003, the corporate tax rate increased to 16.5% and since 2004 it has been 17%. The example below illustrates the effective Chilean withholding tax burden on a cash dividend received by a foreign holder, assuming a Chilean withholding tax rate of 35%, an effective Chilean corporate income tax rate of 17% and a distribution of 50% of the net income of the company distributable after payment of the Chilean corporate income tax:
| Company taxable income | 100.0 | |
| Chilean corporate income tax (17% of Ch$100) | (17 | ) |
| Net distributable income | 83 | |
| Dividend distributed (50% of net distributable income) | 41.5 | |
| Withholding tax (35% of the sum of Ch$ 41.50 dividend plus Ch$ 8.50 credit) | (17.5 | ) |
| Credit for 50% of Chilean corporate income tax | 8.5 | |
| Net withholding tax | (9 | ) |
| Net dividend received | 32.5 | |
| Effective dividend withholding rate | 21.69 | % |
In general, the effective dividend Chilean withholding tax rate, after giving effect to the credit for the Chilean corporate income tax paid by the company, can be computed using the following formula:
| Effective Dividend | (Withholding tax rate) – (Chilean corporate income tax rate) | |
| = | ||
| Withholding Tax Rate | 1 – (Chilean corporate income tax rate) |
Dividends generally are assumed to have been paid out of the Company’s oldest retained profits for purposes of determining the level of Chilean corporate income tax that was paid by the Company. For information as to the retained earnings of the Company for tax purposes and the tax credit available on the distribution of such retained earnings, see note 8 to our consolidated financial statements.
Under Chilean tax law, dividend distributions made in property are subject to the same Chilean tax rules as cash dividends. Stock dividends are not subject to Chilean taxation.
Taxation on Sale or Exchange of Shares or ADSs
Gains obtained by a foreign holder from the sale or exchange of ADSs, or ADRs evidencing ADSs outside Chile will not be subject to Chilean taxation.
Taxation on shares acquired on or before April 19, 2001
Gain recognized on a sale or exchange of shares (as distinguished from sales or exchanges of ADSs representing such shares) will be subject to both a 17% Chilean income tax and the 35% Chilean withholding tax (the former being creditable against the latter) if either the foreign holder:
| • | has held the shares for less than one year since exchanging ADSs for the shares; or | |
| • | acquired and disposed of the shares in the ordinary course of its business or as an habitual trader of shares. |
In all other cases, gain on the disposition of shares will be subject to a 17% Chilean income tax but will not be subject to the 35% Chilean withholding tax.
Taxation on shares acquired after April 19, 2001
On November 7, 2001, the income tax law was amended in order to create a tax exemption on capital gains arising from the sale of shares of listed companies traded in the stock markets. Although there are certain restrictions established in the amended income tax law, in general terms, the amendment provides that in order to have access to the capital gain exemption: (i) the shares must be of a public stock corporation with a certain minimum level of trading in a stock exchange; (ii) the sale must be carried out in a Chilean stock exchange, or in another stock exchange authorized by the SVS, or in a tender offer subject to Chapter XXV of the Chilean Securities Market Law; (iii) the shares which are being sold must have been acquired on a stock exchange, or in a tender offer subject to Chapter XXV of the Chilean Securities Market Law, or in an initial public offering (due to the creation of a company or to a capital increase), or due to the exchange of convertible bonds; and (iv) the shares must have been acquired after April 19, 2001.
131
The tax basis of shares received in exchange for ADSs will be the acquisition value of the shares. The valuation procedure set forth in the deposit agreement, which values shares at the highest price at which they trade on the Santiago Stock Exchange on the date of the exchange, will determine the acquisition value for this purpose. Consequently, the conversion of ADSs into shares and the immediate sale of the shares for the value established under the deposit agreement will not generate a capital gain subject to taxation in Chile.
Taxation of Rights and ADS Rights
For Chilean tax purposes, the receipt of rights or ADS rights by a foreign holder of shares or ADSs pursuant to a rights offering is a non-taxable event. In addition, there is no Chilean income tax consequences to foreign holders upon the exercise or the lapse of the rights or the ADS rights. Any gain on the sale, exchange or transfer of the rights by a foreign holder is subject to a 35% Chilean withholding tax.
Other Chilean Taxes
There are no gift, inheritance or succession taxes applicable to the ownership, transfer or disposition of ADSs by a foreign holder, but such taxes will generally apply to the transfer at death or by gift of the shares by a foreign holder. There are no Chilean stamp, issue, registration or similar taxes or duties payable by holders of shares or ADSs.
United States Tax Considerations
The following discussion describes the material U.S. federal income tax consequences of acquiring, owning and disposing of our ADSs or shares to a beneficial owner that is, for U.S. federal income tax purposes: (i) a citizen or resident of the United States, (ii) a corporation, or other entity taxable as a corporation, created or organized in or under the laws of the United States or of any political subdivision thereof, or (iii) an estate or trust the income of which is subject to United States federal income taxation regardless of its source. The discussion is based on the tax laws of the United States, including the Internal Revenue Code of 1986, as amended (the “Code”), final, temporary and proposed regulations, published rulings and court decisions, all as currently in effect or proposed, any of which is subject to change at any time, possibly with retroactive effect.
This discussion deals only with our ADSs or shares held by you as capital assets as defined in Section 1221 of the Code and does not address the tax treatment to you, if you are a member of a class of holders subject to special treatment under U.S. federal income tax laws such as:
| • | certain financial institutions; | |
| • | a dealer in securities or foreign currencies; | |
| • | a trader in securities that elects to use a mark-to-market method of accounting for your securities holdings; | |
| • | an insurance company; | |
| • | a tax-exempt entity; | |
| • | a person subject to the alternative minimum tax; | |
| • | partnerships or other entities classified as partnerships for U.S. federal income tax purposes; | |
| • | a person who will hold our ADSs or shares as part of a straddle, hedging transaction, conversion transaction or other integrated transaction; | |
| • | a person that has a principal place of business or “tax home” outside the United States, or a person whose functional currency is not the U.S. dollar; |
132
| • | a person who acquired our ADSs or shares pursuant to the exercise of an employee stock option or otherwise as compensation; and | |
| • | a person owning directly, indirectly or by attribution 10% or more of our capital stock. |
Moreover, the effect of any applicable U.S. state or local tax laws as well as of any foreign taxing jurisdiction is not discussed herein.
In general, if you hold ADSs, you will be treated as the holder of underlying shares represented by those ADSs for U.S. federal income tax purposes. Accordingly, no gain or loss will be recognized if you exchange ADSs for the underlying shares represented by those ADSs.
Unless otherwise stated, this discussion assumes that we are not, and will not become, a passive foreign investment company (a “PFIC”) for U.S. federal income tax purposes, as described more fully below. This discussion also assumes that each obligation in the Deposit Agreement and any related agreement will be performed in accordance with its terms and that the representations made by the Depositary regarding the pre-release of our ADRs are true. The U.S. Treasury has expressed concern that parties to whom ADSs are pre-released may be taking actions that are inconsistent with the claiming of foreign tax credits. Such actions would also be inconsistent with claiming the 15% rate described below applicable to certain dividends received by non-corporate holders. Accordingly, the creditability of Chilean taxes and the availability of the 15% rate for dividends received by certain non-corporate holders, each described below could be affected by actions taken by parties to whom ADSs are pre-released.
Taxation of Distributions
To the extent paid out of our current or accumulated earnings and profits (as determined in accordance with U.S. federal income tax principles), distributions made in respect of our ADSs or shares, other than certain pro rata distributions of common shares, (including amounts withheld by us in respect of Chilean taxes) will be treated as foreign-source dividend income to you and will not be eligible for the dividends-received deduction allowed to corporations under the Code. Subject to applicable limitations and the discussion above regarding concerns expressed by the U.S. Treasury, dividends paid to non-corporate U.S. Holders in taxable years beginning before January 1, 2009, will be taxable at a maximum rate of 15%. U.S. Holders should consult their own tax advisors regarding the implications of this new legislation in their particular circumstances. The amount of any distribution of property other than cash will be the fair market value of the property on the date of distribution.
Dividends paid in Chilean pesos in a U.S. dollar amount calculated by reference to the exchange rate in effect on the date you (or in the case of ADSs, the depositary) actually or constructively received such dividends, regardless of whether the pesos are in fact converted into U.S. dollars at that time. If you hold shares, dividends are treated as received on the date you receive your distribution. If you hold ADSs, that date would be the date on which the Depositary receives the distribution. If items received in pesos are not converted into U.S. dollars on the day they are received, you may be required to recognize foreign currency gain or loss (which will be U.S.-source ordinary income or loss, as the case may be) upon a subsequent sale or other disposition of the pesos.
Effect of Chilean withholding taxes
Payments of dividends on our ADSs or shares to foreign investors are subject to Chilean withholding taxes. For U.S. federal income tax purposes, you will be treated as having received the gross amount of any dividend paid, including the net amount of Chilean taxes withheld by us and then as having paid over the withheld taxes to the Chilean tax authorities. As a result, the amount of dividend income includible in gross income for U.S. federal income tax purposes by you in connection with a payment of dividends will be greater than the amount of cash actually received by you.
However, subject to generally applicable limitations and restrictions, that may vary depending upon your circumstances and subject to the discussion above regarding concerns expressed by the U.S. Treasury, you will be entitled to a credit against your U.S. federal income tax liability, or a deduction in computing your U.S. federal taxable income, for the net amount of Chilean income taxes withheld by us. The limitation on foreign taxes eligible for credit is calculated separately for specific classes of income. The rules governing foreign tax credits are complex and, therefore, you are urged to consult your tax advisor to determine the extent to which you are entitled to foreign tax credits with respect to dividends paid on our ADSs or shares.
133
Sale or other disposition
Upon a sale or other disposition of our ADSs or shares, you generally will recognize a capital gain or loss for U.S. federal income tax purposes equal to the difference between the amount realized on the disposition and your adjusted tax basis in the ADSs or shares. This gain or loss will be long-term capital gain or loss if you held our ADSs or shares for more than one year on the date of disposition. Capital losses are subject to limitations. Any gain or loss will generally be U.S.-source gain or loss for foreign tax credit purposes. Certain gains recognized upon a sale or exchange of our shares or ADSs (except for ADSs that are disposed of outside Chile) are subject to Chilean income taxes. Due to generally applicable limitations and restrictions, those taxes may not be creditable against your U.S. federal income tax liability. You are urged to consult your tax adviser to determine the extent to which you may be entitled to foreign tax credits with respect to gains recognized upon sale or exchange of our shares or ADSs.
Passive Foreign Investment Company rules
We believe that we will not be considered a PFIC for United States federal income tax purposes for the 2004 taxable year. We believe that we have never been a PFIC and that it is unlikely that we will become a PFIC in the foreseeable future. However, because PFIC status depends upon the composition of a company’s income and assets and the market value of its assets (including, among others, less-than-25-percent-owned equity investments) from time to time, and because it is unclear whether certain types of our income constitute passive income for PFIC purposes, there can be no assurance that we will not be considered a PFIC for any taxable year. If we were treated as a PFIC for any taxable year during which you held an ADS or a share, certain adverse consequences could apply to you.
If we were treated as a PFIC for any taxable year during your holding period, certain adverse consequences could apply to you, including the imposition of higher amounts of tax than would otherwise apply and additional tax form filing requirements. You are urged to consult your tax advisors regarding the consequences to you if we were considered to be a PFIC, as well as the availability and advisability of making an election to avoid the adverse United States federal income tax consequences of PFIC status should we be classified as a PFIC for any taxable year.
Backup withholding and other reporting requirements
Payment of dividends and sales proceeds that are made within the United States or through certain U.S.-related financial intermediaries generally are subject to information reporting and to backup withholding unless (i) you are a corporation or other exempt recipient or (ii) in the case of backup withholding, you provide a correct taxpayer identification number and certify that you are not subject to backup withholding. Backup withholding is not an additional tax. The amount of any backup withholding from a payment to you will be allowed as a credit against your United States federal income tax liability and may entitle you to a refund, provided that the required information is furnished to the Internal Revenue Service.
| F. | Dividends and paying agents. |
| Not applicable. | |
| G. | Statement by experts. |
| Not applicable. | |
| H. | Documents on display. |
We are subject to the information requirements of the Exchange Act, except that as a foreign issuer, we are not subject to the proxy rules or the short-swing profit disclosure rules of the Exchange Act. In accordance with these statutory requirements, we file or furnish reports and other information with the SEC. Reports and other information filed or furnished by us with the SEC may be inspected and copied at the public reference facilities maintained by the SEC at Room 1024, 450 Fifth Street, N.W., Washington, D.C. 20549, and at the SEC’s regional offices at 233 Broadway, New York, New York 10279 and 175 W. Jackson Boulevard, Suite 900, Chicago, Illinois 60604. Copies of such material may also be inspected at the offices of the New York Stock Exchange, 11 Wall Street, New York, New York 10005, on which our ADSs are listed. In addition, the SEC maintains a Web site that contains information filed electronically with the SEC, which can be accessed over the Internet at http://www.sec.gov.
134
| 1. | Subsidiary Information. |
Not applicable.
Item 11. Quantitative and Qualitative Disclosures About Market Risk
We are exposed to risks associated with interest rates and foreign exchange rates. These risks are constantly monitored and managed by our finance department and finance committee, which in turn report directly to the board of directors. Since many of our subsidiaries are widely held, risk management criteria of such subsidiaries is determined by the Boards of Directors at each subsidiary. In addition, we manage our participation in the remaining unmanaged exposure in order to mitigate market risk at a consolidated level. The respective Boards of Directors must first approve risk management policies at all levels. The tables included in this section show the net debt position of Enersis after cross-currency swaps, interest rate collars and interest rate swaps.
Our core businesses are the generation, transmission and distribution of electricity. We do not enter into financial instruments for trading or speculative purposes. As a result, all market risks are non-trading risks.
Commodity Price Risk
In our electricity generation business we are exposed to market risks arising from the volatility of electricity, fuel oil,natural gas, and coal prices. In order to manage these exposures, we enter into long-term contracts with suppliers and customers. In Brazil and Argentina we also enter into contracts to secure long-term supplies of electricity for our interconnection business between Argentina and Brazil. All such contracts that constitute commodity-price sensitive instruments that were held as of December 31, 2004 and 2003 related to electricity and were entered into for purposes other than trading.
We are exposed to the volatility of natural gas prices in the Chilean and Argentine markets. We manage our exposure to this commodity by securing long-term contracts with our suppliers for terms that are expected to match the lifetime of our generation assets. These contracts generally provide for us to purchase gas at market prices prevailing at the time the purchase occurs. As of December 31, 2004 and 2003 we did not hold any contracts classified as either derivative financial instruments, financial instruments or derivative commodity instruments related to natural gas.
We are exposed to the volatility of coal prices in the Chilean and Colombian market. We manage our exposure to this commodity by entering into short-term contracts with our suppliers. We believe that our exposure to this commodity is immaterial. As of December 31, 2004 and 2003 we did not hold any contracts classified as either derivative financial instruments, financial instruments or derivative commodity instruments related to coal.
The following tables set forth certain information with respect to electricity price-sensitive instruments issued or held by the Company as of December 31, 2004 and 2003 differentiated by power market and company. These electricity price sensitive-instruments are power forward contracts with multiple delivery dates and require physical delivery. Net settlement is not allowed for any of the contracts. Most contracts have optionality features in quantities and prices with indexation clauses to factors such as inflation indices, foreign currencies and natural gas prices in Argentina. In the construction of these tables management makes assumptions using available market data and pricing models. Inputs to pricing models include estimated forward prices of electricity and natural gas, interest rates, foreign exchange rates, inflation indices, transmission costs and others. These inputs become more difficult to predict and the estimates less precise as the term of the contract increases. As a result, fair values are highly dependent upon the assumptions being used. Intercompany amounts have not been eliminated in the following tables.
135
| As of December 31, 2004 (in millions of U.S.$) | ||||||||||||||||
| 2005 | 2006 | 2007 | 2008 | 2009 | Thereafter | Total | Fair value | |||||||||
| Chile Endesa-Chile: | ||||||||||||||||
| Purchase of electricity in GWh | 720 | 720 | 720 | — | — | 2,160 | (14.28 | ) | ||||||||
| Weighted average price in U.S.$/MWh | 25.2 | 25.2 | 34.1 | — | — | — | — | |||||||||
| Colombia Emgesa and Betania: | ||||||||||||||||
| Sale of electricity in GWh | 232 | — | — | — | — | — | 232 | 0.96 | ||||||||
| Weighted average price in U.S.$/MWh | 32.4 | — | — | — | — | — | — | — | ||||||||
| Purchase of electricity in GWh | — | — | — | — | — | — | — | — | ||||||||
| Weighted average price in U.S.$/MWh | — | — | — | — | — | — | — | — | ||||||||
| Brazil CIEN: | ||||||||||||||||
| Sale of electricity in GWh | 7,469 | 8,943 | 9,256 | 10,620 | 10,591 | 87,003 | 133,882 | 291.16 | ||||||||
| Weighted average price in U.S.$/MWh | 30.1 | 26.7 | 26.5 | 25.3 | 25.4 | 25.8 | — | — | ||||||||
| Purchase of electricity in GWh | 2,505 | 5,004 | 5,535 | 7,819 | 7,798 | 62,693 | 91,354 | (301.40 | ) | |||||||
| Weighted average price in U.S.$ | 16.2 | 17.3 | 17.3 | 17.4 | 17.5 | 17.8 | — | — | ||||||||
| Argentina CEMSA: | ||||||||||||||||
| Sale of electricity in GWh | 1,767 | 3,529 | 3,903 | 5,514 | 5,499 | 42,151 | 62,361 | 318.02 | ||||||||
| Weighted average price in U.S.$/MWh | 16.5 | 18.0 | 18.1 | 18.2 | 18.3 | 19.0 | — | — | ||||||||
| Purchase of electricity in GWh | 2,003 | 4,001 | 4,425 | 6,252 | 6,235 | 47,920 | 70,836 | (220.73 | ) | |||||||
| Weighted average price in U.S.$ | 15.3 | 17.7 | 17.9 | 18.2 | 18.3 | 19.1 | — | — | ||||||||
| Argentina COSTANERA | ||||||||||||||||
| Sale of electricity in GWh | 1,421 | 2,839 | 3,140 | 4,436 | 4,424 | 39,274 | 55,534 | 14.61 | ||||||||
| Weighted average price in U.S.$/MWh | 15.4 | 16.2 | 16.2 | 16.3 | 16.3 | 16.7 | — | — | ||||||||
| As of December 31, 2003 (in millions of U.S.$) | ||||||||||||||||
| 2004 | 2005 | 2006 | 2007 | 2008 | Thereafter | Total | Fair value | |||||||||
| Chile Endesa-Chile: | ||||||||||||||||
| Purchase of electricity in GWh | 720 | 720 | 720 | 720 | — | — | 2,880 | (10.03 | ) | |||||||
| Weighted average price in U.S.$/MWh | 24 | 23.2 | 23.3 | 23.6 | — | — | — | — | ||||||||
| Colombia Emgesa and Betania: | ||||||||||||||||
| Sale of electricity in GWh | 4,850 | 232 | — | — | — | — | 5,082 | 12.65 | ||||||||
| Weighted average price in U.S.$/MWh | 27.8 | 24.9 | — | — | — | — | — | — | ||||||||
| Purchase of electricity in GWh | 102 | — | — | — | — | — | 102 | 0.08 | ||||||||
| Weighted average price in U.S.$/MWh | 24.2 | — | — | — | — | — | — | — | ||||||||
| Brazil CIEN: (1) | ||||||||||||||||
| Sale of electricity in GWh | 7,584 | 7,744 | 8,182 | 9,934 | 10,400 | 101,468 | 145,312 | 440.22 | ||||||||
| Weighted average price in U.S.$/MWh | 29.9 | 28.1 | 27.5 | 25.7 | 25.2 | 25.4 | — | — | ||||||||
| Purchase of electricity in GWh | 2,326 | 3,086 | 3,857 | 6,943 | 7,735 | 74,567 | 98,514 | (305.26 | ) | |||||||
| Weighted average price in U.S.$ | 16.9 | 15.4 | 15.7 | 16.3 | 16.9 | 17.0 | — | — | ||||||||
136
| As of December 31, 2003 (in millions of U.S.$) | ||||||||||||||||
| 2004 | 2005 | 2006 | 2007 | 2008 | Thereafter | Total | Fair value | |||||||||
| Argentina CEMSA: (1) | ||||||||||||||||
| Sale of electricity in GWh | 1,388 | 2,210 | 2,762 | 4,972 | 5,539 | 52,055 | 68,926 | 298.51 | ||||||||
| Weighted average price in U.S.$/MWh | 15.1 | 15.5 | 15.9 | 16.7 | 17.5 | 17.8 | — | — | ||||||||
| Purchase of electricity in GWh | 1,426 | 2,270 | 2,837 | 5,107 | 5,690 | 53,308 | 70,638 | (182.51 | ) | |||||||
| Weighted average price in U.S.$ | 14.3 | 14.7 | 15.2 | 16.1 | 16.6 | 18.1 | — | — | ||||||||
| Argentina COSTANERA: (1) | ||||||||||||||||
| Sale of electricity in GWh | 1,059 | 1,685 | 2,107 | 3,792 | 4,225 | 44,666 | 57,534 | (18.51 | ) | |||||||
| Weighted average price in U.S.$/MWh | 15.0 | 15.0 | 15.1 | 15.3 | 15.4 | 15.5 | — | — | ||||||||
| (1) | During 2003 some of the Company’s long-term contracts related to the electricity interconnection business between Argentina and Brazil were amended. Such amendments were primarily made to reduce the quantity of electricity that was sold in the Brazilian market and purchased on Argentine market. |
We do not have material holdings of commodity-price sensitive instruments in our distribution business.
Interest Rate Risk
As of December 31, 2003 and 2004, 33% and 16%, respectively, of our outstanding debt obligations bore interest at floating rates of interest. We manage interest rate risk by maintaining a mixture of both variable and fixed rate debt. Additionally, we manage interest rate risk through the use of interest rate swaps and collars.
As of December 31, 2004, the recorded values of our financial debt for accounting purposes, and the corresponding fair values of the significant financial instruments exposing us to interest rate risk are as follows, according to the date of maturity:
| Contract Terms | ||||||||||||||||
| As of December 31, | 2005 | 2006 | 2007 | 2008 | 2009 | Thereafter | Total | Fair Value (1) | ||||||||
| (in millions of constant Ch$ ) | ||||||||||||||||
| Long-term Debt | ||||||||||||||||
| Fixed rate: | ||||||||||||||||
| Ch$ - and UF-denominated | 4,456 | 209,479 | 5,207 | 5,220 | 5,431 | 580,162 | 809,956 | 828,361 | ||||||||
| Weighted average interest rate | 9.2 | % | 9.5 | % | 9.5 | % | 9.5 | % | 9.5 | % | — | 9.4 | % | — | ||
| U.S.$ -denominated | 81,438 | 253,078 | 80,834 | 441,979 | 365,740 | 662,541 | 1,885,609 | 2,068,586 | ||||||||
| Weighted average interest rate | 6.6 | % | 6.4 | % | 6.3 | % | 7.2 | % | 6.5 | % | — | 6.6 | % | — | ||
| Other currencies (2) | 33,854 | 109,957 | 17,859 | 19,635 | 29,583 | 205,030 | 415,920 | 422,075 | ||||||||
| Weighted average interest rate | 11.2 | % | 11.3 | % | 11.6 | % | 12.0 | % | 12.0 | % | 18.3 | % | 11.6 | % | — | |
| Variable rate: | ||||||||||||||||
| Ch$ - and UF-denominated | 0 | 0 | 0 | 0 | 0 | 0 | 0 | 0 | ||||||||
| Weighted average interest rate | — | — | — | — | — | — | — | — | ||||||||
| U.S.$ -denominated | 69,377 | 4,879 | 10,428 | 809 | 6,591 | 6,597 | 98,681 | 98,808 | ||||||||
| Weighted average interest rate | 7.5 | % | 6.0 | % | 5.0 | % | 5.6 | % | 5.3 | % | — | 6.3 | % | — | ||
| Other currencies (2) | 165,018 | 74,614 | 86,775 | 43,760 | 82,503 | 47,750 | 500,420 | 504,019 | ||||||||
| Weighted average interest rate | 17.2 | % | 16.9 | % | 16.8 | % | 15.5 | % | 18.8 | % | 16.0 | % | 16.9 | % | — | |
| Total | 354,143 | 652,007 | 201,103 | 511,403 | 489,849 | 1,502,081 | 3,710,586 | 3,921,849 | ||||||||
| (1) | As of December 31, 2004. Fair values were calculated based on the discounted value of future cash flows expected to be paid (or received), considering current discount rates that reflect the different risks involved. |
| (2) | “Other currencies” includes the Euro, the Brazilian real, the Colombian peso and the Peruvian sol, among others. |
137
By comparison, as of December 31, 2003, the recorded values of our financial debt for accounting purposes, and the corresponding fair values of the significant financial instruments exposing us to interest rate risk are as follows, according to the date of maturity:
| Contract Terms | |||||||||||||||||
| As of December 31, | 2004 | 2005 | 2006 | 2007 | 2008 | Thereafter | Total | Fair Value (1) | |||||||||
| (in millions of constant Ch$ ) | |||||||||||||||||
| Long-term Debt | |||||||||||||||||
| Fixed rate: | |||||||||||||||||
| Ch$ - and UF-denominated | 3,889 | 4,354 | 75,538 | 5,088 | 5,100 | 196,314 | 290,283 | 272,409 | |||||||||
| Weighted average interest rate | 5.5 | % | 5.5 | % | 5.7 | % | 5.7 | % | 5.7 | % | - | 5.6 | % | - | |||
| U.S.$ -denominated | 33,461 | 78,837 | 319,899 | 84,103 | 261,071 | 1,268,837 | 2,046,207 | 2,183,179 | |||||||||
| Weighted average interest rate | 7.7 | % | 7.7 | % | 7.9 | % | 7.9 | % | 7.9 | % | — | 7.8 | % | — | |||
| Other currencies (2) | 27,960 | 31,237 | 98,976 | 17,280 | 5,855 | 22,343 | 203,650 | 207,139 | |||||||||
| Weighted average interest rate | 10.7 | % | 10.6 | % | 10.2 | % | 11.9 | % | 12.5 | % | — | 11.1 | % | — | |||
| Variable rate: | |||||||||||||||||
| Ch$ - and UF-denominated | 34,553 | 0 | 0 | 0 | 0 | 0 | 34,553 | 30,396 | |||||||||
| Weighted average interest rate | 4.6 | % | — | — | — | — | - | 4.6 | % | — | |||||||
| U.S.$ -denominated | 15,183 | 28,527 | 143,599 | 212,249 | 181,351 | 11,452 | 735,360 | 736,994 | |||||||||
| Weighted average interest rate | 4.4 | % | 5.7 | % | 6.8 | % | 7.4 | % | 6.7 | % | 8.1 | % | 5.9 | % | — | ||
| Other currencies (2) | 263,222 | 34,478 | 33,687 | 28,587 | 16,652 | 118,072 | 494,699 | 504,586 | |||||||||
| Weighted average interest rate | 14.9 | % | 14.6 | % | 14.1 | % | 13.9 | % | 13.7 | % | 16.0 | % | 14.4 | % | — | ||
| Total | 521,268 | 177,433 | 671,698 | 347,306 | 470,030 | 1,617,017 | 3,804,752 | 3,934,702 | |||||||||
| (1) | As of December 31, 2003. Fair values were calculated based on the discounted value of future cash flows expected to be paid (or received), considering current discount rates that reflect the different risks involved. |
| (2) | “Other currencies” includes the Euro, the Brazilian real, the Colombian peso and the Peruvian sol, among others. |
Foreign Currency Risk
We are exposed to foreign currency risk arising from long-term debt denominated in foreign currencies, the majority of which is the U.S. dollar. This risk is mitigated, as a substantial portion of our revenues is linked to the U.S. dollar either directly or indirectly. For example, approximately 90% of revenues of Endesa-Chile, in Chile, are linked to the U.S. dollar. Despite these natural hedges, to a certain extent we remain subject to such exchange rate fluctuations between the Chilean peso and the U.S. dollar, which we manage through the use of U.S. dollar/UF (inflation-indexed Chilean peso) exchange currency swaps and U.S. dollar/Chilean peso forward foreign exchange contracts.
Prior to our acquisition of a controlling interest in Endesa-Chile, we did not manage foreign exchange rate risk. This risk management became active in 1999 due to the instability of the Chilean peso and the change in the trend in which the UF, or inflation-indexed peso, began to devaluate against the United States dollar. Moreover, during 2004, we changed our corporate currency risk policy from a pure accounting hedge to a cash flow hedge. This policy takes the level of operating income of each country that is indexed to the United States dollar and seeks to hedge them with liabilities in the same currency. For Enersis, we entered into U.S. dollar/UF cross currency swaps for U.S.$ 700 million in order to hedge income in Chilean pesos with liabilities in Chilean pesos.
138
In addition, our currency risk policy determines a maximum level of consolidated accounting mismatch. We manage accounting foreign currency risk on a consolidated basis to the extent that such risks are not managed at the subsidiary level, for those amounts not fully hedged for our proportionate equity interest in such subsidiaries.
Although the actual foreign currency exchange risk to which we are exposed depends upon the fluctuation of foreign exchange rates in which monetary assets and liabilities are maintained as compared to the Chilean peso, for accounting purposes our results from operations are affected by variations in the exchange rate between the U.S. dollar and the Chilean peso, due to the application of Technical Bulletin No. 64. Under this Chilean accounting standard, the effects of re-measuring many of our non-Chilean investments into U.S. dollars are recorded in income, while the accumulated effects of Chilean peso to U.S. dollar exchange rate fluctuations are recorded in equity, net of any price-level restatement, due to the effects of Chilean inflation on such foreign investment amounts.
Foreign currency gains and losses are included in the results from operations for the period together with price-level restatement.
As of December 31, 2004, the recorded values of our financial debt for accounting purposes and the corresponding fair values of the significant financial instruments exposing us to foreign currency risk are as follows, according to the date of maturity:
| Contract Terms | |||||||||||||||||
| As of December 31, | 2005 | 2006 | 2007 | 2008 | 2009 | Thereafter | Total | Fair Value (1) | |||||||||
| (in millions of constant Ch$ ) | |||||||||||||||||
| Long-term Debt | |||||||||||||||||
| Fixed rate: | |||||||||||||||||
| U.S.$ -denominated | 81,438 | 253,078 | 80,834 | 441,979 | 365,740 | 662,541 | 1,885,609 | 2,068,586 | |||||||||
| Other currencies (2) | 33,854 | 109,957 | 17,859 | 19,635 | 29,583 | 205,030 | 415,920 | 422,075 | |||||||||
| Variable rate | |||||||||||||||||
| U.S.$ -denominated | 69,377 | 4,879 | 10,428 | 809 | 6,591 | 6,597 | 98,681 | 98,808 | |||||||||
| Other currencies (2) | 165,018 | 74,614 | 86,775 | 43,760 | 82,503 | 47,750 | 500,420 | 504,019 | |||||||||
| Other instruments (3) | |||||||||||||||||
| U.S.$ -denominated assets | 361,115 | 3,632 | — | — | — | — | 364,747 | 364,747 | |||||||||
| Assets in other currencies (2) | 710,969 | 54,161 | 33,702 | 17,972 | 12,838 | 965 | 830,607 | 830,607 | |||||||||
| Forward contracts (receive U.S.$ /Pay Ch$ ) (1) | 48,737 | — | — | — | — | — | 48,737 | (134 | ) | ||||||||
| Swap contract (sreceive U.S.$ /Pay Ch$ ) | 8,655 | 111,480 | 5,574 | 2,122 | — | 334,440 | 462,271 | (62,145 | ) | ||||||||
| Other foreign currency derivatives (2) | 2,787 | 347,260 | — | — | — | — | 350,047 | (2,938 | ) | ||||||||
| (1) | Calculated based on the Observed Exchange Rate as of December 31, 2004, which was Ch$ 557.4 = U.S.$ 1.00. Fair values were calculated based on the discounted value of future cash flows expected to paid (or received), considering current discount rates that reflect the different risks involved. |
| (2) | “Other currencies” includes the Euro, Brazilian real, the Colombian pesos and Peruvian soles among others. |
| (3) | “Other instruments” include cash, time deposits and short-term accounts receivables (see Note 29 to financial statements) |
As of December 31, 2003, the recorded values of our financial debt for accounting purposes and the corresponding fair values of the significant financial instruments exposing us to foreign currency risk are as follows, according to the date of maturity:
139
| Contract Terms | ||||||||||||||||
| As of December 31, | 2004 | 2005 | 2006 | 2007 | 2008 | Thereafter | Total | Fair Value (1) | ||||||||
| (in millions of constant Ch$ ) | ||||||||||||||||
| Long-term Debt | ||||||||||||||||
| Fixed rate: | ||||||||||||||||
| U.S.$ -denominated | 33,461 | 78,837 | 319,899 | 84,103 | 261,071 | 1,268,837 | 2,046,207 | 2,183,179 | ||||||||
| Other currencies (2) | 27,960 | 31,237 | 98,976 | 17,280 | 5,855 | 22,343 | 203,650 | 207,139 | ||||||||
| Variable rate: | ||||||||||||||||
| U.S.$ -denominated | 158,183 | 28,527 | 143,599 | 212,249 | 181,351 | 11,452 | 735,360 | 736,994 | ||||||||
| Other currencies (2) | 263,222 | 34,478 | 33,687 | 28,587 | 16,653 | 118,072 | 494,699 | 504,586 | ||||||||
| Other instruments (3) | ||||||||||||||||
| U.S.$ -denominated assets | 162,800 | 132,903 | — | — | — | — | 295,703 | 295,703 | ||||||||
| Assets in other currencies (2) | 579,672 | 21,437 | 25,074 | 28,896 | 12,564 | — | 667,643 | 667,643 | ||||||||
| Forward contracts(receive U.S.$ /Pay Ch$ ) (1) | (90,258 | ) | — | — | — | — | — | (90,258 | ) | 6,720 | ||||||
| Other foreign currency derivatives (2) | 517,361 | 45,488 | 768,674 | — | 172,202 | — | 1,503,726 | (37,946 | ) | |||||||
| (1) | Calculated based on the Observed Exchange Rate as of December 31, 2003, which was Ch$ 593.80 = U.S.$ 1.00. Fair values were calculated based on the discounted value of future cash flows expected to paid (or received), considering current discount rates that reflect the different risks involved. |
| (2) | “Other currencies” includes the €1, Brazilian real, the Colombian pesos and Peruvian soles among others. |
| (3) | “Other instruments” include cash, time deposits and short-term accounts receivables (see Note 29 to financial statements.) |
| D. | Safe Harbor |
The information in this Item 11. Quantitative and Qualitative Disclosures About Market Risk, contains information that may constitute forward-looking statements. See “Forward-Looking Statements” in the Introduction of this report, for safe harbor provisions.
Item 12. Description of Securities Other than Equity Securities
| A. | Debt Securities. |
| Not applicable. | |
| B. | Warrants and Rights. |
| Not applicable. | |
| C. | Other Securities. |
| Not applicable. | |
| D. | American Depositary Shares. |
| Not applicable. |
140
PART II
Item 13. Defaults, Dividend Arrearages and Delinquencies
None.
Item 14. Material Modifications to the Rights of Security Holders and Use of Proceeds
None.
Item 15. Controls and Procedures
During 2004 and early 2005, we carried out significant changes in our internal controls over financial reporting in anticipation of the requirements of the Sarbanes-Oxley Act of 2002. In May 2004, Enersis’ Chief Financial Officer promoted the Norms and Procedures Project, which consisted of identifying relevant and critical business processes in each of the areas reporting to him and designing each one of these processes so as to have an effective control. This initiative was not only applied in Chile but also in our subsidiaries abroad.
Another change related to Enersis’ internal control over financial reporting corresponds to Norm 43 Latam, which is an adapted version of Endesa-Spain’s Norm 43, enacted by our parent company in December 2004. This norm establishes the principles and the responsible units for the establishment and maintenance of internal controls for the elaboration of financial information and internal controls and procedures for the disclosure of public information. The purpose of this norm is to ensure the accuracy of information and ensure that reports, events, transactions and all other relevant information is revealed in a correct format and in a timely manner.
Enersis’ management, under the supervision of the Chief Executive Officer and the Chief Financial Officer, performed an evaluation of the effectiveness of Enersis’ disclosure controls and procedures as of December 31, 2004. Based on this evaluation, Enersis’ Chief Executive Officer and Chief Financial Officer concluded that Enersis’ disclosure controls and procedures are effective at the reasonable assurance level for gathering, analyzing and disclosing the information Enersis is required to disclose in the reports it files under the Securities Exchange Act of 1934, within the time periods specified in the SEC’s rules and forms. Enersis’ management applied its judgment in assessing the costs and benefits of such controls and procedures, which by their nature can provide only reasonable assurance regarding management’s control objectives.
Item 16. [Reserved]
Item 16A. Audit Committee Financial Expert
Our Board of Directors has determined that José Luis Palomo is an audit committee financial expert as defined under Item 16A of Form 20-F.
Item 16B. Code of Ethics
The standards of ethical conduct at Enersis are governed by means of two corporate rulings or policies: the Charter Governing Executives (estatutos del directivo) and the Internal Regulations on Conduct in Securities Markets.
The Charter Governing Executives, approved as a corporate statute, was adopted by the Board of Directors in May 2003 and is applicable to all managers contractually related to Enersis, including the Chief Executive Officer, the Chief Financial Officer and other senior financial officers of the Company, and to all controlled subsidiaries in which Enersis is the majority shareholder, both in Chile and internationally. The objective of this statute is to establish standards for the governance of our management’s actions.
141
A copy of these documents is also available upon request, free of charge, by writing or telephoning us at:
ENERSIS S.A.
Attention: Investor Relations Department
Santa Rosa 76
Santiago, Chile
(56-2) 353-4682
During fiscal year 2004, there have been no amendments to any provisions of the Charter Governing Executives or the Internal Regulations on Conduct in Securities Markets.
No waivers from any provisions of the Charter Governing Executives or the Internal Regulations on Conduct in Securities Markets were expressly or implicitly granted to the Chief Executive Officer, the Chief Financial Officer or any other senior financial officer of the Company in fiscal year 2004.
Item 16C. Principal Accountant Fees and Services
Audit fees are fees for professional services performed by our auditors for the audit of the Company’s annual financial statements and services that are normally provided in connection with statutory and regulatory filings. Audit related fees consist mainly of accounting consultations and audits in connection with acquisitions and disposals of businesses, reviews of internal controls and advice on accounting control policies and procedures, attest services not required by statute or regulation and consultations concerning financial accounting and reporting standards.
Audit-related fees are fees related to the performance of the audit or review of Enersis’ financial statements that are not covered by the audit fees. Typical examples of audit-related fees are those fees associated with non-periodic consultations and issuances.
The following table summarize the fees to our independent external auditor for the years ended December 31, 2003 and 2004:
| Services Rendered | 2003 | 2004 | |||
| (in U.S.$ millions) | |||||
| Audit Fees | 2.3 | 2.4 | |||
| Audit-Related Fees | 0.2 | 0.7 | |||
| Tax Fees (1) | — | 0.2 | |||
| All Other Fees | — | 0 | |||
| Total fees | 2.5 | 3.3 | |||
| (1) | Tax fees correspond mainly to: a tax recovery from Elesur (U.S.$ 90,000), an analysis for the dissolving of Luz de Bogotá (U.S.$ 31,000), tax services research on price transfers between CEMSA and CTM in Argentina (U.S.$ 62,000). |
Each year the Comité de Directores submits to the Board of Directors a proposal with the name or names of potential external auditors for the Company. This proposal relates only to the selection of the external auditors who will perform the audit of Enersis’ financial statements in that year. The Comité de Directores proposal may be adopted or not adopted by the Board of Directors. If such proposal is not adopted by the Board of Directors, the Board of Directors will propose one or more other audit firms to perform the audit of Enersis’ financial statements in that year. In either case, the actual selection of the external auditor is made by the shareholders’ meeting, which votes on the proposal of the Comité de Directores adopted by the Board of Directors or, if the Board of Directors does not adopt the Comité de Directores proposal, chooses between the audit firm or firms recommended by the Comité de Directores and the audit firm or firms recommended by the Board of Directors. Any engagement of the external auditor to perform services in addition to the audit of the financial statements is pre-approved by the Board of Directors.
142
Item 16D. Exemptions from Listing Requirements for Audit Committees
Not Required.
Item 16E. Purchases of Equity Securities by One Issuer and Affiliated Persons
Neither Enersis nor any affiliated purchaser acquired any shares of Enersis during 2004.
143
PART III
Item 17. Financial Statements
None.
Item 18. Financial Statements
144
Item 19. Exhibits
| Exhibit | Description | |
| 1.1 | By-laws (Estatutos) of ENERSIS S.A., as amended. (previously filed) | |
| 1.2 | By-laws (Estatutos) of ENERSIS S.A., as amended (English translation). (previously filed) | |
| 4.1 | Assignment of Rights Contract, dated January 27, 2004, between Endesa Internacional S.A. and ENERSIS S.A. (Spanish version). | |
| 4.2 | Assignment of Rights Contract, dated January 27, 2004 between Endesa Internacional S.A. and ENERSIS S.A. (English version). | |
| 8.1 | List of Subsidiaries (incorporated by reference to Exhibit 21 of our Amendment No. 1 to Form F-4 filed with the Securities and Exchange Commission on June 2, 2004). | |
| 12.1 | Certification of Chief Executive Officer pursuant to Section 302 of the Sarbanes-Oxley Act | |
| 12.2 | Certification of Chief Financial Officer pursuant to Section 302 of the Sarbanes-Oxley Act | |
| 13.1 | Certification of Chief Executive Officer and Chief Financial Officer pursuant to Section 906 of the Sarbanes-Oxley Act | |
We will furnish to the Securities and Exchange Commission, upon request, copies of any unfiled instruments that define the rights of holders of long-term debt of ENERSIS S.A.
145
SIGNATURES
The registrant certifies that it meets all of the requirements for filing on Form 20-F and that it has duly caused and authorized the undersigned to sign this annual report on its behalf.
| ENERSIS S.A. | ||
| By: | /s/ Mario Valcarce | |
| Name: Mario Valcarce | ||
| Title: Chief Executive Officer | ||
146
Enersis S.A. and Subsidiaries
Index to the Audited Consolidated Financial Statements
F-1
Deloitte & Touche | |
REPORT OF INDEPENDENT REGISTERED PUBLIC ACCOUNTING FIRM
To the Shareholders of Enersis S.A.:
We have audited the accompanying consolidated balance sheets of Enersis S.A. and Subsidiaries (the "Company") as of December 31, 2003 and 2004, and the related consolidated statements of operations, shareholders' equity and cash flows for each of the three years in the period ended December 31, 2004 (expressed in constant Chilean pesos). Our audit also included the financial statement schedule listed in the index to Item 18. These financial statements are the responsibility of the Company's management. Our responsibility is to express an opinion on these financial statements based on our audits. We did not audit the financial statements for each of the three years in the period ended December 31, 2004 of Empresa Nacional de Electricidad S.A. and certain of its consolidated subsidiaries and certain of its equity method investees, or the financial statements for the year ended December 31, 2002 of Empresa Distribuidora Edesur S.A. (a consolidated subsidiary) or the financial statements for the year ended December 31, 2004 of Generadora Termolectrica Fortaleza S.A (an equity method investee). These financial statements reflect total assets constituting 31.19% and 34.44% of consolidated total assets at December 31, 2003 and 2004 respectively, and total revenues constituting 23.36%, 30.40% and 23.72% of consolidated total revenues for the years ended December 31, 2002, 2003 and 2004, respectively. Of the consolidated shareholders' equity and net income (loss) information determined on the basis of accounting principles generally accepted in the States of America ("U.S. GAAP") presented in Note 36, these financial statements reflect total shareholders' equity constituting 14.21% and 18.80% of consolidated U.S. GAAP basis shareholders’ equity at December 31, 2003 and 2004, respectively, and total net income (loss) constituting 16.16%, 58.46% and 33.72% of consolidated U.S. GAAP basis net income (loss) for the years ended December 31, 2002, 2003 and 2004, respectively. Such statements were audited by other auditors whose reports have been provided to us and our opinion, insofar as it relates to the amounts included for these companies, is based solely on the reports of such other auditors.
We conducted our audits in accordance with the standards of the Public Company Accounting Oversight Board (United States). Those standards require that we plan and perform the audit to obtain reasonable assurance about whether the financial statements are free of material misstatement. The Company is not required to have, nor were we engaged to perform, an audit of its internal control over financial reporting. Our audits included consideration of internal control over financial reporting as a basis for designing audit procedures that are appropriate in the circumstances, but not for the purpose of expressing an opinion on the effectiveness of the Company's internal control over financial reporting. Accordingly, we express no such opinion. An audit also includes examining, on a test basis, evidence supporting the amounts and disclosures in the financial statements, assessing the accounting principles used and significant estimates made by management, as well as evaluating the overall financial statement presentation. We believe that our audits and the reports of the other auditors provide a reasonable basis for our opinion.
| Deloitte se refiere a uno o más entre Deloitte Touche Tohmatsu, una asociación suiza, sus firmas miembro y sus respectivas filiales o afiliadas. Como una asociación suiza, ni Deloitte Touche Tohmatsu ni cualquiera de sus firmas miembro tienen responsabilidad por los actos u omisiones cometidos por otra de las partes. Cada una de las firmas miembro es una entidad legal separada e independiente que funciona bajo los nombres de "Deloitte", "Deloitte & Touche", "Deloitte Touche Tohmatsu", u otros nombres relacionados. Los servicios son proporcionados por las firmas miembro, sus filiales o afiliadas y no por la asociación suiza Deloitte Touche Tohmatsu. | Una firma miembro de Deloitte Touche Tohmatsu |
F-2
In our opinion, based on our audits and the reports of the other auditors, such consolidated financial statements present fairly, in all material respects, the financial position of Enersis S.A. and subsidiaries as of December 31, 2003 and 2004, and the results of their operations, changes in shareholders' equity and cash flows for each of the three years in the period ended December 31, 2004, in conformity with accounting principles generally accepted in Chile. Also, in our opinion and (as to the amounts included for the companies which we did not audit as discussed in the first paragraph herein) the reports of other auditors, such financial statement schedule, when considered in relation to the basic consolidated financial statements taken as a whole, present fairly in all material respects the information set forth therein.
As discussed in Note 3 a) to the financial statements, in 2004 Enersis S.A. and Subsidiaries adopted Technical Bulletin No. 72 of the Chilean Association of Accountants, which prescribes the accounting treatment for business combinations.
Accounting principles generally accepted in Chile vary in certain significant respects from U.S. GAAP. The application of the latter would have affected the determination of net income (loss) for each of the three years in the period ended December 31, 2004, and the determination of shareholders' equity as of December 31, 2003 and 2004, to the extent summarized in Note 36 to the consolidated financial statements.
Our audits also comprehended the translation of constant Chilean Peso amounts into U.S. dollar amounts and, in our opinion, such translation has been made in conformity with the basis stated in Note 2 (c). Such U.S. dollar amounts are presented solely for the convenience of readers in the United States of America.
Santiago, Chile
June 1, 2005
F-3
| Huérfanos 770, 5° Piso | Teléfono | : (56-2) 676 1000 | |||||
| Santiago, Chile | Fax: | : (56-2) 676 1010 | |||||
| Casifla | : 2823 |
To the Board of Directors and Shareholders of
Empresa Nacional de Electricidad S.A. (Endesa-Chile) and subsidiaries:
We have audited the accompanying consolidated balance sheets of Endesa-Chile and subsidiaries (the “Company”) as of December 31, 2003 and 2004, and the related consolidated statements of income, changes in shareholders’ equity and cash flows for each of the three years in the period ended December 31, 2004. These financial statements are the responsibility of the Company's management. Our responsibility is to express an opinion on these financial statements based on our audits. We did not audit the consolidated financial statements of certain subsidiaries, which statements reflect total assets representing 49.61 percent and 38.87 percent as of December 31, 2003 and 2004, respectively, and total revenues representing of 31.93 percent, 39.38 percent and 38.78 percent for each of the three years in the period ended December 31, 2002, 2003 and 2004, respectively. We also did not audit the financial statements of certain investments accounted for under the equity method, which value represented 1.07 percent and 0.18 percent of total consolidated assets as of December 31, 2003 and 2004, respectively, and equity in their net results represented (61.49) percent, 14.87 percent and 0.74 percent of the consolidated net income for each of the years in the period ended December 31, 2002, 2003 and 2004, respectively. Those statements were audited by other auditors whose reports have been furnished to us, and our opinion, insofar as it relates to the amounts included for those entities, is based solely on the reports of the other auditors.
We conducted our audits in accordance with the standards of the Public Company Accounting Oversight Board (United States). Those standards require that we plan and perform the audit to obtain reasonable assurance about whether the financial statements are free of material misstatement. We were not engaged to perform an audit of the Company's internal control over financial reporting. Our audit included consideration of internal control over financial reporting as a basis for designing audit procedures that are appropriate in the circumstances, but not for the purpose of expressing an opinion on the effectiveness of the Company's internal control over financial reporting. Accordingly, we express no such opinion. An audit also includes examining, on a test basis, evidence supporting the amounts and disclosures in the financial statements, assessing the accounting principles used and significant estimates made by management, and evaluating the overall financial statement presentation. We believe that our audits and the reports of other auditors provide a reasonable basis for our opinion.
In our opinion, based on our audits and the reports of other auditors, the financial statements referred to above present fairly, in all material respects, the consolidated financial position of Endesa-Chile and subsidiaries at December 31, 2003 and 2004, and the results of their operations and their cash flows for each of the three years in the period ended December 31, 2004 in conformity with accounting principles generally accepted in Chile, which differ in certain respects from accounting principles generally accepted in the United States of America (see Note 33 to the consolidated financial statements). Also, in our opinion, the related financial statement schedule, when considered in relation to the basic financial statements taken as a whole, presents fairly, in all material respects, the information set forth therein.
| ERNST & YOUNG LIMITADA |  |
| Santiago, Chile | |
| January 21, 2005 | |
| (except for Notes 31 and 33 for which the date is May 31, 2005) |
Firma miembro de Ernst & Young Global
F-4
| Deloitte & Touche Ltda. | |
| Cra. 7 N° 74 - 09 | |
| A.A. 075874 | |
| Nit. 860.005.813-4 | |
| Bogotá D.C | |
| Colombia | |
| Tel. +57(1)5461810-5461815 | |
| Fax : +57(1)2178088 | |
| www.deloitte.com.co |
Report of Independent Registered Public Accounting Firm
(Translation of a report originally issued in Spanish)
To the Board of Directors and Shareholders of
Endesa de Colombia S.A.
We have audited the consolidated balance sheet of Endesa de Colombia S.A. and subsidiaries (the “Company”) as of December 31, 2003, and the related statements of income and cash flows for the years ended December 31, 2003 and 2002, all expressed in thousands of constant Chilean pesos (not separately presented herein). These financial statements are the responsibility of the Company's management. Our responsibility is to express an opinion on these financial statements based on our audits.
We conducted our audits in accordance with the standards of the Public Company Accounting Oversight Board (United States of America). Those standards require that we plan and perform the audit to obtain reasonable assurance about whether the financial statements are free of material misstatement. An audit includes examining, on a test basis, evidence supporting the amounts and disclosures in the financial statements. An audit also includes assessing the accounting principles used and significant estimates made by management, as well as evaluating the overall financial statement presentation. We believe that our audits provide a reasonable basis for our opinion.
In our opinion, such financial statements present fairly, in all material respects, the consolidated financial position of Endesa de Colombia S.A. and subsidiaries as of December 31, 2003 and the results of their operations and their cash flows for the years ended December 31, 2003 and 2002 in conformity with accounting principles generally accepted in Chile.
Accounting principles generally accepted in Chile vary in certain significant respects from accounting principles generally accepted in the United States of America. The application of the latter would have affected the determination of net income for the years ended December 31, 2003 and 2002 and the determination of stockholders' equity at December 31, 2003, to the extent summarized in Note 18.
 |  |
| Carlos Eduardo Tovar | |
| Bogotá Colombia, January 15, 2004, | |
| except for Note l8 for which the date is April 30, 2004 | DELOITTE & TOUCHE LTDA. |
| Audit.Tax.Consulting.Financial Advisory. | Una firma miembro de |
| Deloitte Touche Tohmatsu |
F-5
| Deloitte & Touche Ltda. | |
| Cra. 7 N° 74 - 09 | |
| A.A. 075874 | |
| Nit. 860.005.813-4 | |
| Bogotá D.C. | |
| Colombia | |
| Tel.+57(1) 5461810 - 5461815 | |
| Fax: +57(1) 2178088 | |
| www.deloitte.com.co |
Report of Independent Registered Public Accounting Firm
(Translation of a report originally issued in Spanish)
To the Board of Directors and Shareholders of
Central Hidroeléctrica de Betania S.A. E.S.P. and Subsidiaries:
We have audited the consolidated balance sheets of Central Hidroeléctrica de Betania S.A. E.S.P. and Subsidiaries (the “Company”) as of December 31, 2004 and 2003 and the related consolidated statements of income and cash flows for the years then ended, all expressed in thousands of constant Chilean pesos (not separately presented herein). These financial statements are the responsibility of the Company's management. Our responsibility is to express an opinion on these financial statements based on our audit.
We conducted our audits in accordance with the standards of the Public Company Accounting Oversight Board (United States of America). Those standards require that we plan and perform the audit to obtain reasonable assurance about whether the financial statements are free of material misstatement. The Company is not required to have, nor were we engaged to perform, an audit of its internal control over financial reporting. Our audits included consideration of internal control over financial reporting as a basis for designing audit procedures that are appropriate in the circumstances, but not for the purpose of expressing an opinion on the effectiveness of the Company's internal control over financial reporting. Accordingly, we express no such opinion. An audit also includes examining, on a test basis, evidence supporting the amounts and disclosures in the financial statements, assessing the accounting principles used and significant estimates made by management, as well as evaluating the overall financial statement presentation. We believe that our audits provide a reasonable basis for our opinion.
In our opinion, based on our audit, the financial statements referred to above present fairly, in all material respects, the consolidated financial position of Central Hidroeléctrica de Betania S.A. E.S.P. and its Subsidiaries as of December 31, 2004 and 2003, and the results of their operations and their cash flows for the years then ended in conformity with accounting principles generally accepted in Chile.
Accounting principles generally accepted in Chile vary in certain significant respects from accounting principles generally accepted in the United States of America. The application of the latter would have affected the determination of net income for each of the two years in the period ended December 31, 2004 and the determination of stockholders' equity and financial position at December 31, 2004 and 2003, to the extent summarized in Note 27.
| |
| Carlos Eduardo Tovar | |
| Bogotá, Colombia, January 14, 2005, | |
| except for Note 27 for which the date is May 2, 2005 | DELOITTE & TOUCHE LTDA. |
| Audit.Tax.Consulting.Financial Advisory. | Una firma miembro de |
| Deloitte Touche Tohmatsu |
F-6
| Deloitte & Co. S.R. L. | |
| Florida 234 5° | |
| Capital Federal | |
| C1005AAF | |
| Argentina | |
| Tel: 54 (11) 4320-2700/ | |
| 4326-4046 | |
| Fax: 54 (11) 4325-8081 | |
| www.deloitte.com.ar |
REPORT OF INDEPENDENT REGISTERED PUBLIC ACCOUNTING FIRM
(English translation of the report originally issued in Spanish)
To the President and Board of Directors of
Endesa Argentina S.A.
We have audited the consolidated balance sheets of Endesa Argentina S.A. and Subsidiaries (the “Company”) as of December 31, 2003 and 2004 and the consolidated statements of operations and cash flows for each of the three years in the period ended December 31, 2004 (not presented separately herein). These financial statements are the responsibility of the Company's Management. Our responsibility is to express an opinion on these financial statements based on our audits.
We conducted our audits in accordance with the standards of the Public Company Accounting Oversight Board (United States of America). Those standards require that we plan and perform the audit to obtain reasonable assurance about whether the financial statements are free of material misstatement. The Company is not required to have, nor were we engaged to perform, an audit of its internal control over financial reporting. Our audits included consideration of internal control over financial reporting as a basis for designing audit procedures that are appropriate in the circumstances, but not for the purpose of expressing an opinion on the effectiveness of the Company’s internal control over financial reporting. Accordingly, we express no such opinion. An audit also includes examining, on a test basis, evidence supporting the amounts and disclosures in the financial statements, assessing the accounting principles used and significant estimates made by management, as well as evaluating the overall financial statement presentation. We believe that our audits provide a reasonable basis for our opinion.
In our opinion, such financial statements present fairly, in all material respects, the consolidated financial position of Endesa Argentina S.A. and subsidiaries as of December 31, 2003 and 2004, and the results of their operations and their cash flows for each of the three years in the period ended December 31, 2004 in conformity with accounting principles generally accepted in Chile.
Accounting principles generally accepted in Chile vary in certain significant respects from accounting principles generally accepted in the United States of America. The application of the latter would have affected the determination of net income for each of the three years in the period ended December 31, 2004 and the determination of stockholders’ equity at December 31, 2003 and 2004, to the extent summarized in Note 39.
Buenos Aires, January 20, 2005, except for Note 39 for which the date is May 2, 2005.
| DELOITTE & Co. S.R.L. | |
 | |
| Carlos A. Lloveras | |
| (Partner) |
Deloitte refers to one or more of Deloitte Touche Tohmatsu, a Swiss Verein, its member firms, and their respective subsidiaries and affiliates. As a Swiss Verein(association), neither Deloitte Touche Tohmatsu nor any of its member firms has any liability for each other's acts or omissions. Each of the member firms is a separate and independent legal entity operating under the names “Deloitte,” “Deloitte & Touche,” “Deloitte Touche Tohmatsu,” or other related names. Services areprovided by the member firms or their subsidiaries or affiliates and not by the Deloitte Touche Tohmatsu Verein.
F-7
| Pistrelli, Henry Martin y Asociados SRL | Tel.: {54-11} 4318-1600/4311-6644 | |||||
| 25 de Mayo 487 - C1002ABI | Fax: {54-11} 4312-8647/4318-1777 | |||||
| Buenos Aires, Argentina | www.ey.com/ar |
REPORT OF INDEPENDENT REGISTERED PUBLIC ACCOUNTING FIRM
To the Shareholders and Board of Directors of
EMPRESA DISTRIBUIDORA SUR S.A.
(EDESUR S.A.)
We have audited the balance sheet of EDESUR S.A. (an Argentine corporation) as of December 31, 2002, and the related statements of income, changes in shareholders’ equity andcash flows for the year then ended, all expressed in U.S. dollars (not presented separately herein). Those financial statements are the responsibility of the Company’s Management. Our responsibility is to express an opinion on those financial statements based on our audit.
We conducted our audit in accordance with the standards of the Public Company Accounting Oversight Board (United States). Those standards require that we plan and perform the audit to obtain reasonable assurance about whether the financial statements are free of material misstatement. An audit includes examining, on a test basis, evidence supporting the amounts and disclosures in the financial statements. An audit also includes assessing the accounting principles used and significant estimates made by management, as well as evaluating the overall financial statement presentation. We believe that our audit provides a reasonable basis for our opinion.
In our opinion, the 2002 financial statements referred to above (not presented separately herein) present fairly, in all material respects, the financial position of EDESUR S.A. as of December 31, 2002, and the results of its operations and its cash flows for the year then ended, in conformity with accounting principles generally accepted in Chile.
Accounting principles generally accepted in Chile vary in certain significant respects from accounting principles generally accepted in the United States of America. Application of accounting principles generally accepted in the United States of America would have affected shareholders’ equity as of December 31, 2002 and the results of operations for the year then ended to the extent summarized in Note 29 of the Notes to the financial statements.
| Buenos Aires, Argentina | ||
| February 7, 2003 | ||
| PISTRELLI, HENRY MARTIN Y ASOCIADOS S.R.L. | ||
| (Member Firm of Ernst & Young Global) | ||
 | ||
| EZEQUIEL A. CALCIATI | ||
| Partner |
Miembro de Ernst & Young Global
F-8
| Deloitte Touche Tohmatsu | |
| Av. Pres. Wilson, 231 | |
| 22° e 25° andares | |
| 20030-905 - Rio de Janeiro - RJ | |
| Brasil | |
| Tel.: +55 (21) 3981-0500 | |
| Fax: +55 (21) 3981-0600 | |
www.deloitte.com.br |
REPORT OF INDEPENDENT REGISTERED PUBLIC ACCOUNTING FIRM
To the Board of Directors and Shareholders of
Centrais Elétricas Cachoeira Dourada S.A.
Cachoeira Dourada - GO, Brazil
We have audited the balance sheet of Centrais Elétricas Cachoeira Dourada S.A. as of December 31, 2003, and the related statements of operations and cash flows for the years ended December 31, 2003 and 2002, all expressed in United States dollars (not presented separately herein). These financial statements are the responsibility of the Company’s management. Our responsibility is to express an opinion on these financial statements based on our audits.
We conducted our audits in accordance with the standards of the Public Company Accounting Oversight Board (United States). Those standards require that we plan and perform the audit to obtain reasonable assurance about whether the financial statements are free of material misstatement. An audit includes examining, on a test basis, evidence supporting the amounts and disclosures in the financial statements. An audit also includes assessing the accounting principles used and significant estimates made by management, as well as evaluating the overall financial statement presentation. We believe that our audits provide a reasonable basis for our opinion.
In our opinion, the financial statements referred to above present fairly, in all material respects, the financial position of Centrais Elétricas Cachoeira Dourada S.A. as of December 31, 2003, and the results of its operations and its cash flows for the years ended December 31, 2003 and 2002, in conformity with accounting principles generally accepted in Chile.
Accounting principles generally accepted in Chile vary in certain significant respects from accounting principles generally accepted in the United States of America. The application of the latter would have affected the determination of net income (loss) for the years ended December 31, 2003 and 2002, and the determination of shareholders’ equity as of December 31, 2003, to the extent summarized in Note 21 to the financial statements.
![]()
January 17, 2004
F-9
| Deloitte Touche Tohmatsu Av. Pres. Wilson, 231 22° e 25° andares 20030-905 - Rio de Janeiro - RJ Brasil | |
| Tel.: +55(21)3981- 0500 Fax: +55 (21) 3981-0600 www.deloitte.com. br | |
REPORT OF INDEPENDENT REGISTERED PUBLIC ACCOUNTING IRM
To the Board of Directors andShareholders of
CIEN – Companhia de Interconexão Energética
Rio de Janeiro, RJ. Brazil
| 1. | We have audited the accompanying balance sheets of CIEN – Companhia de Interconexão Energética as of December 31, 2003 and 2002, and the related statements of income and cash flows for the years then ended, all expressed in United States dollars. These financial statements are the responsibility of the Company's management. Our responsibility is to express an opinion on these financial statements based on our audits. |
| 2. | We conducted our audits in accordance with the standards of the Public Company Accounting Oversight Board (United States). Those standards require that we plan and perform the audit to obtain reasonable assurance about whether the financial statements are free of material misstatement. The Company is not required to have, nor were we engaged to perform, an audit of its internal control over financial reporting. Our audit included consideration of internal control over financial reporting as a basis for designing audit procedures that are appropriate in the circumstances, but not for the purpose of expressing an opinion on the effectiveness of the Company's internal control over financial reporting. Accordingly, we express no such opinion. An audit includes examining, on a test basis, evidence supporting the amounts and disclosures in the financial statements. An audit also includes assessing the accounting principles used and significant estimates made by management, as well as evaluating the overall financial statement presentation. We believe that our audits provide a reasonable basis for our opinion. |
| 3. | In our opinion, the financial statements referred to above present fairly, in all material respects, the financial position of CIEN — Companhia de Interconexão Energética S.A. as of December 31, 2003 and 2002, and the results of its operations and its cash flows for the years then ended, in conformity with accounting principles generally accepted in Chile. |
| 4. | Accounting principles generally accepted in Chile vary in certain significant respects from accounting principles generally accepted in the United States of America. Information relating to the nature and effect of such differences is presented in Note 23 to the financial statements. |
| 5. | As discussed in Note 24, the accompanying financial statements have been restated. |
![]()
January 17, 2004 (except for the restatements mentioned in paragraph 5, for which the date is May 2, 2005)
F - 10
ENERSIS S.A. AND SUBSIDIARIES
CONSOLIDATED BALANCE SHEETS
(Restated for general price-level changes and expressed in thousands of constant
Chilean pesos of December 31, 2004 and thousands of US dollars
As of December 31, | ||||||
| ASSETS | 2003 | 2004 | 2004 | |||
| ThCh$ | ThCh$ | ThUS$ | ||||
| CURRENT ASSETS | ||||||
| Cash | 27,029,488 | 56,494,414 | 101,353 | |||
| Time deposits | 262,660,971 | 450,743,859 | 808,654 | |||
| Marketable securities | 11,434,635 | 12,321,537 | 22,105 | |||
| Accounts receivable, net | 478,849,624 | 528,740,129 | 948,583 | |||
| Notes receivable, net | 8,571,693 | 2,828,014 | 5,074 | |||
| Other accounts receivable, net | 96,549,123 | 63,814,202 | 114,485 | |||
| Amounts due from related companies | 17,486,628 | 114,385,763 | 205,213 | |||
| Inventories | 45,415,899 | 50,981,315 | 91,463 | |||
| Income taxes recoverable | 62,818,496 | 97,637,872 | 175,167 | |||
| Prepaid expenses | 16,863,806 | 45,011,188 | 80,752 | |||
| Deferred income taxes | 53,023,911 | 60,005,717 | 107,653 | |||
| Other current assets | 75,777,002 | 36,117,180 | 64,796 | |||
| Total current assets | 1,156,481,276 | 1,519,081,190 | 2,725,298 | |||
| PROPERTY, PLANT AND EQUIPMENT | ||||||
| Land | 118,340,129 | 122,606,995 | 219,962 | |||
| Buildings and infrastructure and works in progress | 10,305,284,602 | 9,864,985,666 | 17,698,216 | |||
| Machinery and equipment | 1,806,292,572 | 1,721,120,263 | 3,087,765 | |||
| Other plant and equipment | 356,791,936 | 398,709,319 | 715,302 | |||
| Technical appraisal | 634,958,011 | 584,183,038 | 1,048,050 | |||
| Accumulated depreciation | (4,922,897,727 | ) | (5,006,783,339 | ) | (8,982,388 | ) |
| Total property, plant and equipment, net | 8,298,769,523 | 7,684,821,942 | 13,786,907 | |||
| OTHER ASSETS | ||||||
| Investments in related companies | 184,716,758 | 191,465,062 | 343,497 | |||
| Investments in other companies | 136,796,804 | 49,992,754 | 89,689 | |||
| Goodwill, net | 799,907,148 | 733,535,103 | 1,315,994 | |||
| Negative goodwill, net | (81,215,498 | ) | (56,735,814 | ) | (101,786 | ) |
| Long-term receivables | 131,133,420 | 125,910,089 | 225,888 | |||
| Amounts due from related companies | 132,331,429 | 456,246 | 819 | |||
| Intangibles | 79,100,256 | 80,708,810 | 144,795 | |||
| Accumulated amortization | (40,254,130 | ) | (44,013,845 | ) | (78,963 | ) |
| Other assets | 185,126,301 | 222,303,602 | 398,822 | |||
| Total other assets | 1,527,642,488 | 1,303,622,007 | 2,338,755 | |||
| TOTAL ASSETS | 10,982,893,287 | 10,507,525,139 | 18,850,960 | |||
The accompanying notes are an integral part of these consolidated financial statements
F - 11
ENERSIS S.A. AND SUBSIDIARIES
CONSOLIDATED BALANCE SHEETS
(Restated for general price-level changes and expressed in thousands of constant
Chilean pesos of December 31, 2004 and thousands of US dollars)
| As of December 31, | ||||||
| LIABILITIES AND SHAREHOLDERS´ EQUITY | 2003 | 2004 | 2004 | |||
| ThUS$ | ThCh$ | ThUS$ | ||||
| CURRENT LIABILITIES: | ||||||
| Short-term debt due to banks and financial institutions | 319,960,476 | 191,923,129 | 344,318 | |||
| Current portion of long-term debt due to banks and financial institutions | 169,837,388 | 106,940,945 | 191,857 | |||
| Current portion of bonds payable | 72,718,823 | 107,084,047 | 192,113 | |||
| Current portion of long-term notes payable | 21,969,710 | 26,749,661 | 47,990 | |||
| Dividends payable | 3,237,512 | 3,399,501 | 6,099 | |||
| Accounts payable | 220,830,333 | 253,002,503 | 453,898 | |||
| Short-term notes payable | 21,596,628 | 13,409,165 | 24,057 | |||
| Miscellaneous payables | 45,014,408 | 38,606,503 | 69,262 | |||
| Amounts payable to related companies | 31,517,000 | 81,508,675 | 146,230 | |||
| Accrued expenses | 55,046,830 | 44,333,117 | 79,535 | |||
| Withholdings | 65,295,025 | 49,749,518 | 89,253 | |||
| Income taxes payable | 49,036,057 | 54,418,780 | 97,630 | |||
| Deferred income | 12,274,758 | 6,504,696 | 11,670 | |||
| Other current liabilities | 66,994,856 | 41,180,674 | 73,880 | |||
| Total current liabilities | 1,155,329,804 | 1,018,810,914 | 1,827,792 | |||
| LONG-TERM LIABILITIES: | ||||||
| Due to banks and financial institutions | 854,742,232 | 626,112,271 | 1,123,273 | |||
| Bonds payable | 2,356,777,340 | 2,493,500,109 | 4,473,448 | |||
| Long-term notes payable | 148,976,745 | 143,254,068 | 257,004 | |||
| Accounts payable | 27,472,799 | 50,583,709 | 90,749 | |||
| Amounts payable to related companies | 86,428 | — | ��� | |||
| Acrued expenses | 325,352,408 | 311,025,273 | 557,993 | |||
| Deferred income taxes | 7,194,942 | 63,535,888 | 113,986 | |||
| Other long-term liabilities | 61,845,032 | 116,143,763 | 208,367 | |||
| Total long-term liabilities | 3,782,447,926 | 3,804,155,081 | 6,824,820 | |||
| MINORITY INTEREST | 3,433,013,869 | 3,125,006,002 | 5,606,398 | |||
| SHAREHOLDERS´ EQUITY: | ||||||
| Paid-in capital, no par value | 2,283,404,124 | 2,283,404,124 | 4,096,527 | |||
| Additional paid-in capital | 163,306,446 | 162,725,821 | 291,937 | |||
| Other reserves | (26,313,477 | ) | (122,588,994 | ) | (219,930 | ) |
| Retained earnings | 180,417,144 | 194,378,259 | 348,723 | |||
| Net income (loss) for the year | 12,779,560 | 44,307,596 | 79,490 | |||
| Deficit of subsidiaries in development stage | (1,492,109 | ) | (2,673,664 | ) | (4,797 | ) |
| Total shareholders´ equity | 2,612,101,688 | 2,559,553,142 | 4,591,950 | |||
| TOTAL LIABILITIES AND SHAREHOLDERS´ EQUITY | 10,982,893,287 | 10,507,525,139 | 18,850,960 | |||
F - 12
ENERSIS S.A. AND SUBSIDIARIES
CONSOLIDATED STATEMENTS OF OPERATIONS
(Restated for general price-level changes and expressed in thousands of constant
Chilean pesos of December 31, 2004 and thousands of US dollars)
| As of December 31, | |||||||||
| 2002 | 2003 | 2004 | 2004 | ||||||
| ThCh$ | ThCh$ | ThCh$ | ThUS$ | ||||||
| OPERATING INCOME: | |||||||||
| SALES | 2,573,500,251 | 2,418,451,270 | 2,708,925,344 | 4,859,930 | |||||
| COST OF SALES | (1,791,034,632 | ) | (1,695,212,019 | ) | (1,898,087,991 | ) | (3,405,253 | ) | |
| GROSS PROFIT | 782,465,619 | 723,239,251 | 810,837,353 | 1,454,677 | |||||
| ADMINISTRATIVE AND SELLING EXPENSES | (231,045,544 | ) | (173,741,457 | ) | (176,635,722 | ) | (316,892 | ) | |
| OPERATING INCOME | 551,420,075 | 549,497,794 | 634,201,631 | 1,137,785 | |||||
| NON-OPERATING INCOME AND EXPENSE: | |||||||||
| Interest income | 88,290,908 | 68,916,018 | 73,635,633 | 132,106 | |||||
| Equity in income of related companies | 15,524,861 | 18,198,366 | 31,146,566 | 55,878 | |||||
| Other non-operating income | 319,005,958 | 195,206,651 | 133,632,882 | 239,743 | |||||
| Equity in loss of related companies | (6,969,781 | ) | (243,650 | ) | (683 | ) | (1 | ) | |
| Amortization of goodwill | (524,192,803 | ) | (54,558,943 | ) | (53,201,320 | ) | (95,445 | ) | |
| Interest expense | (460,565,169 | ) | (430,943,444 | ) | (360,140,223 | ) | (646,107 | ) | |
| Other non-operating expenses | (244,163,588 | ) | (252,038,400 | ) | (207,355,499 | ) | (372,005 | ) | |
| Price-level restatement, net | 5,139,902 | (4,611,876 | ) | (776,878 | ) | (1,394 | ) | ||
| Exchange difference, net | (16,678,133 | ) | (6,205,662 | ) | 14,406,781 | 25,846 | |||
| NON-OPERATING EXPENSE, NET | (824,607,845 | ) | (466,280,940 | ) | (368,652,741 | ) | (661,379 | ) | |
INCOME (LOSS) BEFORE INCOME TAXES; EXTRAORDINARY ITEMS, MINORITY INTEREST AND AMORTIZATION OF NEGATIVE GOODWILL | (273,187,770 | ) | 83,216,854 | 265,548,890 | 476,406 | ||||
| INCOME TAXES | (68,344,084 | ) | (42,609,984 | ) | (137,241,207 | ) | (246,217 | ) | |
| EXTRAORDINARY ITEMS | (23,164,381 | ) | — | — | — | ||||
INCOME (LOSS) BEFORE MINORITY INTEREST AND AMORTIZATION OF NEGATIVE GOODWILL | (364,696,235 | ) | 40,606,870 | 128,307,683 | 230,189 | ||||
| MINORITY INTEREST | 16,856,520 | (80,282,913 | ) | (101,106,989 | ) | (181,390 | ) | ||
| INCOME (LOSS) BEFORE AMORTIZATION OF NEGATIVE GOODWILL | (347,839,715 | ) | (39,676,043 | ) | 27,200,694 | 48,799 | |||
| AMORTIZATION OF NEGATIVE GOODWILL | 116,204,508 | 52,455,603 | 17,106,902 | 30,691 | |||||
| NET INCOME (LOSS) FOR THE YEAR | (231,635,207 | ) | 12,779,560 | 44,307,596 | 79,490 | ||||
The accompanying notes are an integral part of these consolidated financial statements
F - 13
ENERSIS S.A. AND SUBSIDIARIES
CONSOLIDATED STATEMENTS OF CASH FLOWS
(Restated for general price-level changes and expressed in thousands of constant
Chilean pesos of December 31, 2004 and thousands of US dollars)
| As of December 31, | ||||||||
| 2002 | 2003 | 2004 | 2004 | |||||
| ThCh$ | ThCh$ | ThCh$ | ThUS$ | |||||
| Net income (loss) for the year | (231,635,207 | ) | 12,779,560 | 44,307,596 | 79,490 | |||
| GAIN (LOSSES) FROM SALES OF ASSETS: | ||||||||
| Losses (gain) on sale of property, plant and equipment | (1,134,547 | ) | 6,410,580 | (6,613,618 | ) | (11,865 | ) | |
| Gain on sale of investments | — | (91,517,236 | ) | — | — | |||
| Losses (gain) on sale of other assets | — | 409,474 | (227,863 | ) | (409 | ) | ||
| Charges (credits) to income which do not represent cash flows: | ||||||||
| Depreciation | 470,491,241 | 406,326,019 | 379,491,166 | 680,824 | ||||
| Amortization of intangibles | 10,755,510 | 8,798,057 | 6,801,368 | 12,202 | ||||
| Write-offs and accrued expenses | 57,910,136 | 55,762,447 | 38,380,540 | 68,856 | ||||
| Equity in income of related companies | (15,524,861 | ) | (18,198,366 | ) | (31,146,566 | ) | (55,878 | ) |
| Equity in losses of related companies | 6,969,781 | 243,650 | 683 | 1 | ||||
| Amortization of goodwill | 524,192,803 | 54,558,943 | 53,201,320 | 95,445 | ||||
| Amortization of negative goodwill | (116,204,508 | ) | (52,455,603 | ) | (17,106,902 | ) | (30,691 | ) |
| Price-level restatement, net | (5,139,902 | ) | 4,611,876 | 776,878 | 1,394 | |||
| Exchange difference, net | 16,678,133 | 6,205,662 | (14,406,781 | ) | (25,846 | ) | ||
| Other credits to income which do not represent cash flows | (237,128,997 | ) | (30,521,567 | ) | (15,464,081 | ) | (27,743 | ) |
| Other charges to income which do not represent cash flows | 152,860,243 | 157,087,979 | 111,142,000 | 199,394 | ||||
| Changes in assets which affect operating cash flows: | ||||||||
| Decrease (increase) in trade receivables | 57,946,158 | (86,517,194 | ) | (24,173,451 | ) | (43,368 | ) | |
| Decrease (increase) in inventory | 12,183,581 | 10,631,639 | (6,983,775 | ) | (12,529 | ) | ||
| Decrease (increase) in other assets | (23,860,362 | ) | 19,852,923 | (7,544,309 | ) | (13,535 | ) | |
| Changes in liabilities which affect operating cash flows: | ||||||||
| Increase (decrease) in acounts payable associated with operating results | (51,335,665 | ) | 32,552,808 | (9,452,542 | ) | (16,958 | ) | |
| Increase (decrease) in interest payable | 57,068,203 | (11,368,109 | ) | 46,422,045 | 83,283 | |||
| Increase (decrease) in income tax payable | (47,454,034 | ) | (42,043,955 | ) | 38,053,662 | 68,270 | ||
| Increase in other accounts payable associated with operating results | 31,088,438 | 40,178,565 | (65,352,965 | ) | (117,246 | ) | ||
| Net decrease (increase) in value added tax and other similar taxes payable | (1,957,962 | ) | 24,767,831 | (3,205,890 | ) | (5,752 | ) | |
| Income (loss) attributable to minority interest | (16,856,520 | ) | 80,282,913 | 101,106,989 | 181,390 | |||
| Net cash flows provided by operating activities | 649,911,662 | 588,838,896 | 618,005,504 | 1,108,729 | ||||
| CASH FLOWS FROM FINANCING ACTIVITIES: | ||||||||
| Proceeds from issuance of shares to minority shareholders | 1,972,828 | 560,126,472 | — | — | ||||
| Proceeds from the issuance of debt | 1,013,421,316 | 1,048,163,788 | 827,706,442 | 1,484,942 | ||||
| Proceeds from bond issuances | 136,151,327 | 848,824,902 | 328,720,066 | 589,738 | ||||
| Other sources of financing | 27,277,250 | 24,639,020 | 22,781,843 | 40,872 | ||||
| Distribution of capital in subsidiary | (123,491,420 | ) | (24,632,422 | ) | (21,172,115 | ) | (37,984 | ) |
| Dividends paid | (103,987,047 | ) | (82,815,176 | ) | (97,013,165 | ) | (174,046 | ) |
| Payment of debt | (1,133,128,575 | ) | (2,181,273,813 | ) | (1,191,304,739 | ) | (2,137,253 | ) |
| Payment of bonds | (30,381,693 | ) | (499,247,807 | ) | (22,110,493 | ) | (39,667 | ) |
| Payment of loans obtained from related companies | (45,954,367 | ) | (4,579,223 | ) | — | — | ||
| Payment of share issuance costs | — | (11,102,445 | ) | — | — | |||
| Payment of bond issuance costs | (11,533,492 | ) | (5,823,428 | ) | (2,363,467 | ) | (4,240 | ) |
| Other disbursements for financing | (25,433,644 | ) | (118,931,382 | ) | (34,368,618 | ) | (61,659 | ) |
| Net cash used in financing activities | (295,087,517 | ) | (446,651,514 | ) | (189,124,246 | ) | (339,297 | ) |
| CASH FLOWS FROM INVESTING ACTIVITIES: | ||||||||
| Proceeds from sales of property, plant and equipment | 23,402,247 | 164,779,451 | 15,537,528 | 27,875 | ||||
| Sales of investment in related companies | — | 124,873,051 | 2,557,742 | 4,589 | ||||
| Payments received from notes receivable from related companies | — | 25,596,801 | 15,294,722 | 27,439 | ||||
| Other receipts from investments | 19,210,250 | 51,033,045 | 40,574,360 | 72,792 | ||||
| Additions to property, plant and equipment | (329,121,962 | ) | (265,255,289 | ) | (265,934,353 | ) | (477,098 | ) |
| Long-term investments | (24,292,428 | ) | (3,061,889 | ) | (343,959 | ) | (617 | ) |
| Investment in financial instruments | (749,938 | ) | — | — | — | |||
| Other loans granted to related companies | — | (320,222 | ) | — | — | |||
| Other investment disbursements | (37,201,901 | ) | (7,060,165 | ) | (1,591,615 | ) | (2,855 | ) |
| Net cash provided by (used in) investing activities | (348,753,732 | ) | 90,584,783 | (193,905,575 | ) | (347,875 | ) | |
| POSITIVE NET CASH FLOW FOR THE PERIOD | 6,070,413 | 232,772,165 | 234,975,683 | 421,557 | ||||
| EFFECT OF PRICE-LEVEL RESTATEMENT ON CASH AND CASH EQUIVALENTS | (2,587,744 | ) | (122,485,010 | ) | (27,014,194 | ) | (48,465 | ) |
| NET INCREASE IN CASH AND CASH EQUIVALENTS | 3,482,669 | 110,287,155 | 207,961,489 | 373,092 | ||||
| CASH AND CASH EQUIVALENTS AT BEGINNING OF THE YEAR | 225,506,024 | 228,988,693 | 339,275,848 | 608,676 | ||||
| CASH AND CASH EQUIVALENTS AT END OF THE YEAR | 228,988,693 | 339,275,848 | 547,237,337 | 981,768 | ||||
The accompanying notes are an integral part of these consolidated financial statements
F - 14
CONSOLIDATED STATEMENTS OF CHANGES IN SHAREHOLDERS’ EQUITY
(Expressed in thousands of historical Chilean pesos, except as stated)
| Additional | Deficit of | Net income | ||||||||||||
| Paid-in | paid-in | Other | Retained | subsidiaries in | (loss) for | |||||||||
| capital | capital | reserves | earnings | development stage | the year | Total | ||||||||
| ThCh$ | ThCh$ | ThCh$ | ThCh$ | ThCh$ | ThCh$ | ThCh$ | ||||||||
| As of January 1, 2002 | 729,328,347 | 32,398,114 | 25,517,158 | 350,149,143 | 867,381 | 40,926,246 | 1,179,186,389 | |||||||
| Transfer of prior year income to retained earnings | — | — | — | 40,926,246 | — | (40,926,246 | ) | — | ||||||
| Deficit of subsidiaries in the development stage | — | — | — | — | (5,830,512 | ) | — | (5,830,512 | ) | |||||
| Cumulative translation adjustment | — | — | 20,596,914 | — | — | — | 20,596,914 | |||||||
| Price-level restatement of capital | 21,879,850 | 971,943 | 765,515 | 11,732,261 | 26,021 | — | 35,375,590 | |||||||
| Net loss for the year | — | — | — | — | — | (223,748,087 | ) | (223,748,087 | ) | |||||
| As of December 31, 2002 | 751,208,197 | 33,370,057 | 46,879,587 | 402,807,650 | (4,937,110 | ) | (223,748,087 | ) | 1,005,580,294 | |||||
| As of December 31, 2002 (1) | 777,688,286 | 34,546,352 | 48,532,092 | 417,006,620 | (5,111,143 | ) | (231,635,207 | ) | 1,041,027,000 | |||||
| As of January 1, 2003 | 751,208,197 | 33,370,057 | 46,879,587 | 402,807,650 | (4,937,110 | ) | (223,748,087 | ) | 1,005,580,294 | |||||
| Capital increase | 1,471,844,920 | 125,881,577 | — | — | — | — | 1,597,726,497 | |||||||
| Transfer of prior year loss to retained earnings | — | — | — | (228,581,520 | ) | 4,833,433 | 223,748,087 | — | ||||||
| Changes in equity of affiliates | — | — | (11,432,599 | ) | — | — | — | (11,432,599) | ||||||
| Deficit of subsidiaries in the development stage | — | — | — | — | (1,302,667 | ) | — | (1,302,667 | ) | |||||
| Cumulative translation adjustment | — | — | (61,587,469 | ) | — | — | — | (61,587,469 | ) | |||||
| Price-level restatement of capital | 4,658,223 | 71,728 | 468,796 | 1,790,596 | (49,372 | ) | — | 6,939,971 | ||||||
| Net income for the year | — | — | — | — | — | 12,467,863 | 12,467,863 | |||||||
| As of December 31, 2003 | 2,227,711,340 | 159,323,362 | (25,671,685 | ) | 176,016,726 | (1,455,716 | ) | 12,467,863 | 2,548,391,890 | |||||
| As of December 31, 2003 (1) | 2,283,404,124 | 163,306,446 | (26,313,477 | ) | 180,417,144 | (1,492,109 | ) | 12,779,560 | 2,612,101,688 | |||||
| As of January 1, 2004 | 2,227,711,340 | 159,323,362 | (25,671,685 | ) | 176,016,726 | (1,455,716 | ) | 12,467,863 | 2,548,391,890 | |||||
| Capital increase | (563,714 | ) | — | — | — | — | (563,714 | ) | ||||||
| Transfer of prior year income to retained earnings | — | — | — | 13,629,822 | (1,161,959 | ) | (12,467,863 | ) | — | |||||
| Changes in equity of affiliates | — | — | (4,435,524 | ) | — | — | — | (4,435,524 | ) | |||||
| Cumulative translation adjustment | — | — | (103,832,123 | ) | — | — | — | (103,832,123 | ) | |||||
| Reserve Technical Bulletin No. 72 | 11,992,130 | — | — | — | 11,992,130 | |||||||||
| Price-level restatement of capital | 55,692,784 | 3,966,173 | (641,792 | ) | 4,731,711 | (55,989 | ) | — | 63,692,887 | |||||
| Net income for the year | — | — | — | — | — | 44,307,596 | 44,307,596 | |||||||
| As of December 31, 2004 | 2,283,404,124 | 162,725,821 | (122,588,994 | ) | 194,378,259 | (2,673,664 | ) | 44,307,596 | 2,559,553,142 | |||||
| As of December 31, 2004 (2) | 4,096,527 | 291,937 | (219,930 | ) | 348,723 | (4,797 | ) | 79,490 | 4,591,950 | |||||
| (1) | Restated in thousands of constant Chilean pesos as of December 31, 2004. |
| (2) | Restated in thousands of US$ as of December 31, 2004 |
The accompanying notes are an integral part of these consolidated financial statements
F - 15
ENERSIS S.A. AND SUBSIDIARIES
NOTES TO THE CONSOLIDATED FINANCIAL STATEMENTS
(Restated for general price-level changes and expressed in thousands of constant
Chilean pesos of December 31, 2004, except as stated)
As of and for the years ended December 31, 2002, 2003 and 2004
| Note 1. | Description of Business |
Enersis S.A. (the “Company”) is registered in the Securities Register under No.0175 and is regulated by the Chilean Superintendency of Securities and Insurance (the “SVS”). The Company issued publicly registered American Depositary Receipts in 1993 and 1996. Enersis S.A. is a reporting company under the United States Securities and Exchange Act of 1934.
The Company’s subsidiaries, Chilectra S.A. and Empresa Nacional de Electricidad S.A. (Endesa S.A.) are registered in the Securities Register under No. 0321 and 0114, respectively.
| Note 2. | Summary of Significant Accounting Policies |
| a) | General |
| (i) | The consolidated financial statements of the Company have been prepared in accordance with generally accepted accounting principles in Chile and the regulations established by the SVS (collectively “Chilean GAAP”), and the specific corporate regulations of Law No.18,046, related to the formation, registration and liquidation of Chilean corporations, among others. Certain amounts in the prior year’s financial statements have been reclassified to conform to the current year’s presentation. |
| The preparation of financial statements in conformity with Chilean GAAP requires management to make estimates and assumptions that affect the reported amounts of assets and liabilities, disclosures of contingent assets and liabilities as of the date of the financial statements, and the reported amounts of revenues and expenses during the reporting year. Actual results could differ from those estimates. | |
| In certain cases generally accepted accounting principles in Chile require that assets or liabilities be recorded or disclosed at their fair values. The fair value is the amount at which an asset could be bought or sold or the amount at which a liability could be incurred or settled in a current transaction between willing parties, other than in a forced or liquidation sale. Where available, quoted market prices in active markets have been used as the basis for the measurement; however, where quoted market prices in active markets are not available, the Company has estimated such values based on the best information available, including using modeling and other valuation techniques. | |
| (ii) | Reclassifications - For purposes of comparison, the following reclassifications were made in the 2002 and 2003 financial statements: |
F - 16
ENERSIS S.A. AND SUBSIDIARIES
Notes to the Consolidated Financial Statements – (Continued)
| 2002: | ||||||
| Statement of operations reclassifications | ||||||
| From | Credit | To | Debit | |||
| ThCh$ | ThCh$ | |||||
| Other non-operating expenses | (5,535,196 | ) | Interest expense | 5,535,196 | ||
| 2003: | ||||||
| Balance sheet reclassifications | ||||||
| From | Debit | To | Credit | |||
| ThCh$ | ThCh$ | |||||
| Deferred income tax liabilities long-term | 18,172,355 | Current deferred income tax assets | (18,172,355 | ) | ||
| Statement of operations reclassifications | ||||||
| From | Credit | To | Debit | |||
| ThCh$ | ThCh$ | |||||
| Other non-operating income | 7,309,555 | Operating Income | (7,309,555 | ) | ||
| Other non-operating expenses | (2,186,889 | ) | Operating Expenses | 2,186,889 | ||
F - 17
ENERSIS S.A. AND SUBSIDIARIES
Notes to the Consolidated Financial Statements – (Continued)
| (iii) | The accompanying financial statements reflect the consolidated results of operations of Enersis S.A. and its subsidiaries. All significant intercompany transactions have been eliminated in consolidation. Investments in companies in the development stage are accounted for using the equity method, except that income or losses are included directly in equity instead of being reflected in the Company’s consolidated statement of operations. The Company consolidates the financial statements of companies in which it controls over 50% of the voting shares, provided there are no substantive minority participating rights that prevent control, as detailed as follows: |
| Percentage participation in voting rights as of December 31, | |||||||||||
| Company | 2002 | 2003 | 2004 | ||||||||
| Total | Total | Direct | Indirect | Total | |||||||
| Chilectra S.A. | 98.24 | 98.24 | 98.24 | — | 98.24 | ||||||
| Compañía Eléctrica del Río Maipo S.A. (2) | 98.74 | — | — | — | — | ||||||
| Synapsis Soluciones y Servicios IT Ltda. | 100.00 | 100.00 | 99.99 | 0.01 | 100.00 | ||||||
| Inmobiliaria Manso de Velasco Ltda. | 100.00 | 100.00 | 100.00 | 0.00 | 100.00 | ||||||
| Cía. Americana de Multiservicios Ltda. | 100.00 | 100.00 | 99.93 | 0.07 | 100.00 | ||||||
| Endesa Chile S.A. (4) | 59.98 | 59.98 | 59.98 | — | 59.98 | ||||||
| Elesur S.A. (4) | — | — | 100.00 | — | 100.00 | ||||||
| Enersis de Argentina S.A. (3) | 100.00 | — | — | — | — | ||||||
| Enersis Internacional Ltda. | 100.00 | 100.00 | 100.00 | — | 100.00 | ||||||
| Inversiones Distrilima S.A. | 55.68 | 55.68 | 15.93 | 39.75 | 55.68 | ||||||
| Empresa Distribuidora Sur S.A. (Edesur) | 65.09 | 65.09 | 16.02 | 49.07 | 65.09 | ||||||
| Luz de Bogotá S.A. (5) | 44.66 | 44.66 | — | — | — | ||||||
| Codensa S.A. (5) | — | — | 12.47 | 9.19 | 21.66 | ||||||
| Cerj | 61.95 | 71.81 | 35.13 | 45.29 | 80.41 | ||||||
| Investluz (1) | 48.41 | 52.00 | 15.61 | 39.52 | 55.13 | ||||||
| Enersis Energía de Colombia S.A. (3) | 100.00 | — | — | — | — | ||||||
| (1) | Investluz is Parent Company of Companhia Energética do Céará S.A. Coelce. The Company obtained shareholder agreements dated June 25, 1999, from Endesa International, the majority shareholder of these companies, giving the Company the right to elect a majority of the Board of Directors. The Superintendency of Securities and Insurance was notified on June 28, 1999. | |
| (2) | On April 30, 2003, Compañía Eléctrica del Río Maipo S.A. was sold to Compañía General de Electricidad Industrial S.A. and, as a result, that company ceased to be reflected in our consolidation from January 1, 2003 and was treated as an equity - method investee until its sale. | |
| (3) | Enersis de Argentina S.A. and Enersis Energía de Colombia S.A. have been dissolved during 2003. | |
| (4) | On May 27, 2004, 99.9989% of Elesur S.A. was purchased, therefore, as from that date it is consolidated into Enersis S.A. financial statements. | |
| (5) | On July 9, 2004 the subsidiary Luz de Bogotá S.A., which had investment in Codensa, was liquidated. As a result of the liquidation, the Enersis and Chilectra agencies that owned Luz de Bogotá S.A. shares have direct investment in Codensa S.A. | |
| Codensa S.A. is consolidated because of the majority presence on the board of directors, obtained through the shareholders’ agreement of January 27, 2004, between Endesa Internacional and subsidiaries of Enersis S.A. |
F - 18
ENERSIS S.A. AND SUBSIDIARIES
Notes to the Consolidated Financial Statements – (Continued)
| (iv) | Consolidated subsidiaries of Endesa Chile S.A. area detailed as follows: |
| Company name | Percentage participation in voting | |||||||||
| rights as of December 31, | ||||||||||
| 2002 | 2003 | 2004 | ||||||||
| Total | Total | Direct | Indirect | Total | ||||||
| % | % | % | % | % | ||||||
| Enigesa S.A. | 100.00 | 100.00 | 99.51 | 0.49 | 100.00 | |||||
| Ingendesa S.A. | 97.64 | 97.64 | 96.39 | 1.25 | 97.64 | |||||
| Pehuenche S.A. | 92.65 | 92.65 | 92.95 | — | 92.95 | |||||
| Endesa Argentina S.A. (5) | 99.99 | 99.99 | 97.99 | 2.00 | 99.99 | |||||
| Endesa-Chile Internacional | 100.00 | 100.00 | 100.00 | — | 100.00 | |||||
| Pangue S.A. | 94.99 | 94.99 | 94.97 | 0.02 | 94.99 | |||||
| Hidroinvest S.A. | 69.93 | 69.93 | — | 69.93 | 69.93 | |||||
| Infraestructura 2000 S.A. (1) | 60.00 | — | — | — | — | |||||
| Hidroeléctrica El Chocón S.A. | 65.19 | 65.19 | — | 65.19 | 65.19 | |||||
| Central Costanera S.A. | 51.93 | 64.26 | 12.33 | 51.93 | 64.26 | |||||
| Endesa Brasil Participacoes Ltda. | 100.00 | 100.00 | 5.00 | 95.00 | 100.00 | |||||
| Túnel El Melón S.A. | 99.95 | 99.95 | 99.95 | — | 99.95 | |||||
| Soc. Concesionaria Autopista del Sol S.A. (1) | 100.00 | — | — | — | — | |||||
| Inecsa 2000 S.A. (1) | 97.32 | — | — | — | — | |||||
| Soc. Concesionaria Autopista Los Libertadores S.A. (1) | 99.95 | — | — | — | — | |||||
| Compañía Eléctrica Cono Sur S.A. | 100.00 | 100.00 | 100.00 | — | 100.00 | |||||
| Central Hidroeléctrica Betania S.A. | 85.62 | 85.62 | 0.44 | 85.18 | 85.62 | |||||
| Endesa de Colombia S.A. (4) | 100.00 | 100.00 | — | — | — | |||||
| Lajas Inversora S.A. | 100.00 | 100.00 | 100.00 | — | 100.00 | |||||
| Centrais Electricas Cachoeira Dourada S.A. | 99.59 | 99.61 | — | 99.61 | 99.61 | |||||
| Capital de Energía S.A. | 50.90 | 50.90 | 0.05 | 50.95 | 51.00 | |||||
| Emgesa S.A (2) | 48.48 | 48.48 | — | 51.32 | 51.32 | |||||
| Edegel S.A. | 63.56 | 63.56 | — | 63.56 | 63.56 | |||||
| Generandes Perú S.A. | 59.63 | 59.63 | — | 59.63 | 59.63 | |||||
| Compañía Eléctrica San Isidro S.A. (3) | 100.00 | 100.00 | 100.00 | — | 100.00 | |||||
| Compañía Eléctrica Tarapacá S.A. | 100.00 | 100.00 | 100.00 | — | 100.00 | |||||
| Inversiones Endesa Norte S.A. | 100.00 | 100.00 | 99.91 | 0.09 | 100.00 | |||||
| Ingendesa Do Brasil Limitada | 100.00 | 100.00 | — | 100.00 | 100.00 | |||||
| (1) | On June 23, 2003 Infraestructura 2000 Holding and its consolidated subsidiaries was sold, and a result, these companies ceased to be consolidated in our financial statements Chile-from January 1, 2003 and were treated as equity - method investees until their sale. On June 23, 2003 these companies were sold as part of the sale of Infraestructura 2000. |
| (2) | Endesa-Chile exercises control over this company under an agreement with other shareholders. |
| (3) | Endesa-Chile directly owns all A shares, which compose 50% of share capital of this company. Only shares A have voting rights - other shareholders do not have voting rights. |
| (4) | Endesa de Colombia S.A., which held 8.91% of Central Hidroeléctrica Betania S.A. was liquidated on December 17, 2004. As a result of this transaction Endesa-Chile (Individual legal entity) and Compañía Eléctrica Conosur S.A., who owned shares of Endesa de Colombia S.A., acquired additional participation in Central Hidroeléctrica Betania S.A. |
| (5) | On November 17, 2004, Endesa Chile sold 492,920 shares (2% of its participation) of this company to Enigesa S.A. |
F - 19
ENERSIS S.A. AND SUBSIDIARIES
Notes to the Consolidated Financial Statements – (Continued)
The participation in voting rights is equal to economic participation in all subsidiaries except for those presented as follows:
| Percentage of economic | ||||||
| participation as of December 31, | ||||||
| 2002 | 2003 | 2004 | ||||
| % | % | % | ||||
| Lajas Inversora S.A. | 92.88 | 92.88 | 92.88 | |||
| Centrais Electricas Cachoeira Dourada S.A. | 92.51 | 92.51 | 92.51 | |||
| Emgesa S.A. | 22.36 | 22.36 | 22.36 | |||
| Edegel S.A. | 37.90 | 37.90 | 37.90 | |||
| Capital de Energía S.A. | 43.58 | 43.58 | 43.68 | |||
| Compañía Eléctrica San Isidro S.A. | 75.00 | 75.00 | 75.00 | |||
| Hidroeléctrica El Chocon S.A. | 47.45 | 47.45 | 47.45 | |||
Economic participation is calculated taking into account Enersis participation in share capital of its subsidiaries and equity method investees.
| b) | Years covered |
These financial statements reflect the Company’s financial position as of December 31, 2003 and 2004, and the results of its operations, the changes in its shareholders’ equity and its cash flows for the years ended December 31, 2002, 2003 and 2004.
| c) | Constant currency restatement |
The cumulative inflation rate in Chile as measured by the Chilean Consumer Price Index (“CPI”) for the three-year ended December 31, 2004 was approximately 6.52%.
Chilean GAAP requires that the financial statements be restated to reflect the full effects of gain or loss in the purchasing power of the Chilean peso on the financial position and results of operations of reporting entities. The method described below is based on a model that enables calculation of net inflation gains or losses caused by monetary assets and liabilities exposed to changes in the purchasing power of local currency. The model prescribes that the historical cost of all non-monetary accounts be restated for general price-level changes between the date of origin of each item and the year-end.
The financial statements of the Company have been price-level restated in order to reflect the effects of the changes in the purchasing power of the Chilean currency during each year. All non-monetary assets and liabilities, all equity accounts and income statement accounts have been restated to reflect the changes in the CPI from the date they were acquired or incurred to year-end (see also Note 24).
The purchasing power gain or loss included in net income reflects the effects of Chilean inflation on the monetary assets and liabilities held by the Company.
The restatements were calculated using the official consumer price index of the National Institute of Statistics and based on the “prior month rule,” in which the inflation adjustments are based on the CPI at the close of the month preceding the close of the respective year or transaction. This index is considered by the business community, the accounting profession and the Chilean government to be the index that most closely complies with the technical requirement to reflect the variation in the general level of prices in Chile, and consequently it is widely used for financial reporting purposes.
F - 20
ENERSIS S.A. AND SUBSIDIARIES
Notes to the Consolidated Financial Statements – (Continued)
The values of the Chilean consumer price indices used to reflect the effects of the changes in the purchasing power of the Chilean peso (“price-level restatement”) are as follows:
| Index | Change over | |||
| Previous | ||||
| November 30, | ||||
| November 30, 2002 | 113.36 | 3.0 | % | |
| November 30, 2003 | 114.44 | 1.0 | % | |
| November 30, 2004 | 117.28 | 2.5 | % |
By way of comparison, the actual values of the Chilean consumer price indices as of the balance sheet dates are as follows:
| Change over | ||||
| Previous | ||||
| Index | December 31, | |||
| December 31, 2002 | 112.86 | 2.8 | % | |
| December 31, 2003 | 114.07 | 1.1 | % | |
| December 31, 2004 | 116.84 | 2.4 | % |
The above-mentioned price-level restatements do not purport to represent appraisal or replacement values and are only intended to restate all non-monetary financial statement components in terms of local currency of a single purchasing power and to include in net income or loss for each year the gain or loss in purchasing power arising from the holding of monetary assets and liabilities exposed to the effects of inflation.
Index-linked assets and liabilities
Assets and liabilities that are denominated in index-linked units of account are stated at the year-end values of the respective units of account. The principal index-linked unit used in Chile is the Unidad de Fomento (“UF”), which is adjusted daily to reflect the changes in Chile’s CPI. Certain of the Company’s investments are linked to the UF. As the Company’s indexed liabilities exceed its indexed assets, the increase in the index results in a net loss on indexation. Values for the UF are as follows (historical Chilean pesos per UF):
| Ch$ | ||
| December 31, 2002 | 16,744.12 | |
| December 31, 2003 | 16,920.00 | |
| December 31, 2004 | 17,317.05 |
Comparative financial statements
For comparative purposes, the 2002 and 2003 consolidated financial statements and the amounts disclosed in the related Notes have been restated in terms of Chilean pesos of December 31, 2004, purchasing power.
This updating does not change the prior years’ statements or information in any way except to update the amounts to constant Chilean pesos of similar purchasing power.
F - 21
ENERSIS S.A. AND SUBSIDIARIES
Notes to the Consolidated Financial Statements – (Continued)
Convenience translation to U.S. dollars
The financial statements are stated in Chilean pesos. The translations of Chilean pesos into US dollars are included solely for the convenience of the reader, using the observed exchange rate reported by the Chilean Central Bank as of December 31, 2004 of Ch$557.4 to US$1.00. The convenience translations should not be construed as representations that the Chilean peso amounts have been, could have been, or could in the future be, converted into US dollars at this or any other rate of exchange.
| d) | Assets and liabilities in foreign currencies |
Assets and liabilities denominated in foreign currencies are detailed in Note 32. These amounts have been stated at the observed exchange rates reported by the Central Bank of Chile as of each December 31, as follows:
| Currency | Symbol used | 2002 | 2003 | 2004 | ||||
| Ch$ | Ch$ | Ch$ | ||||||
| United States dollar | US$ | 718.61 | 593.80 | 557.40 | ||||
| British pound sterling | £ | 1,152.91 | 1,056.21 | 1,073.37 | ||||
| Colombian peso | $Col | 0.25 | 0.21 | 0.23 | ||||
| New Peruvian sol | Soles | 204.73 | 171.62 | 169.84 | ||||
| Brazilian real | Rs | 203.57 | 205.52 | 209.99 | ||||
| Japanese yen | ¥ | 6.07 | 5.55 | 5.41 | ||||
| Euro | € | 752.55 | 744.95 | 760.13 | ||||
| Pool Unit (IBRD)(1) | UP | 9,089,158.76 | 8,408,776.27 | 7,874,799.07 | ||||
| Unidad de Fomento (UF) | UF | 16,744.12 | 16,920.00 | 17,317.05 | ||||
| Unit of Account (IDB) (1) | UC | 1,093.75 | 970.23 | 899.42 | ||||
| Argentine peso | $Arg | 219.09 | 200.61 | 187.65 |
| (1) | Units of measurement used by the International Bank for Reconstruction and Development (IBRD) and Interamerican Development Bank (IDB) to express the weighted-average of multicurrency loan obligations granted using fixed currency rates to the US dollar, at a determined date. |
| e) | Time deposits and marketable securities |
Time deposits are presented at original placement plus accrued interest and UF indexation adjustments, as applicable. Marketable securities include investments in quoted shares that are valued at the lower of cost or market value. The investments are in both short-term highly liquid fixed rate investment shares and mutual fund units valued at cost plus interest and indexation or redemption value as appropriate (Note 4).
| f) | Allowance for doubtful accounts |
The estimates for the allowance for doubtful accounts have been made considering the aging and nature of the accounts receivables. Accounts receivable are classified as current or long-term, depending on their collection terms. Current and long-term trade accounts receivable, notes receivable and other receivables are presented net of allowances for doubtful accounts (see Note 5). The allowance for doubtful accounts amounted ThCh$119,415,603, ThCh$106,994,829 and ThCh$104,345,783 for the years ended December 31, 2002, 2003 and 2004, respectively. In addition, the total sum owed by companies that have gone into bankruptcy amounting to ThCh$908,570 in 2004, ThCh$842,006 in 2003 and ThCh$732,704 in 2002, is included in the bad debt allowance estimation.
F - 22
ENERSIS S.A. AND SUBSIDIARIES
Notes to the Consolidated Financial Statements – (Continued)
| g) | Inventories |
Inventory of materials in transit, and operation and maintenance materials on hand, are valued at the lower of price-level restated cost or net realizable value.
The cost of real estate projects under development, included in inventory, include the cost of land, demolition, urbanizing, payments to contractors and other direct costs.
The costs and revenues of construction in progress are accounted for under the completed contract method in accordance with Technical Bulletin No. 39 of the Chilean Association of Accountants and are included in current assets as their realization is expected in the short-term.
| h) | Property, plant and equipment |
Property, plant and equipment are valued at net replacement cost as determined by the former Superintendency of Electric and Gas Services (SEG) adjusted for price-level restatement in accordance with D.F.L. No.4 of 1959. The latest valuation under the D.F.L. 4 was in 1980.
Property, plant and equipment acquired after the latest valuation of net replacement cost are shown at cost, plus price-level restatement. Interest on debt directly obtained to finance construction projects is capitalized during the year of construction (only in power generators).
In 1986, an increase based upon a technical appraisal of property, plant and equipment was recorded in the manner authorized by the SVS in Circulars No.’s 550 and 566 dated October 15 and December 16, 1985, respectively, and Communication No.4790, dated December 11, 1985.
In accordance with Chilean GAAP, the Company has evaluated the recoverability of its foreign investments as required by Technical Bulletin No. 33 of the Chilean Association of Accountants. It is the Company’s policy, when evidence exists of an other than temporary impairment of fixed assets, such that the Company’s operations are not expected to generate sufficient net cash flows, to recover all fixed asset costs, including depreciation, that the book values of those assets must be reduced to their net realizable values with a charge to non-operating expenses. The Company has not identified impairments in the net book values of its property, plant and equipment.
| i) | Depreciation |
Depreciation expense is calculated on the revalued balances using the straight-line method over the estimated useful lives of the assets.
The table below provides the useful life range for our most significant fixed assets classes.
| Table | Useful life in years |
| Distribution and transmission lines network | 20 – 50 |
| Substations | 20 – 40 |
| Public lighting | 20 – 50 |
| Generator and turbines | 20 – 40 |
| Combined cycle | 20 – 40 |
| j) | Leased assets |
The leased assets, whose contracts have financial lease characteristics, are accounted for as an acquisition of property, plant and equipment, recognizing the total obligation and the unrecorded interest. Said assets do not legally belong to the Company, for which reason, as long as the purchase option is not exercised, it will not be able to freely dispose of them.
F - 23
ENERSIS S.A. AND SUBSIDIARIES
Notes to the Consolidated Financial Statements – (Continued)
| k) | Power installations financed by third parties |
As established by D.F.L. 1 of the Ministry of Mines dated September 13, 1982, power installations financed by third parties are treated as reimbursable contributions. As such, the installations constructed using this mechanism form part of the Company’s plant and equipment.
Such installations completed prior to D.F.L. 1 are deducted from Plant and equipment and their depreciation is charged to Power installations financed by third parties.
| l) | Investments in related companies |
Investments in related companies are included in “Other assets” using the equity method. This valuation method recognizes in income the Company’s equity in the net income or loss of each investee on an accrual basis (Note 11).
Investments in foreign affiliates are recorded in accordance with Technical Bulletin No. 64 of the Chilean Association of Accountants.
Under Technical Bulletin No. 64 of the Chilean Association of Accountants, investments in foreign subsidiaries are price-level restated, the effects of which are reflected in income, while the effects of the foreign exchange gains or losses between the Chilean peso and the US dollar on the foreign investment measured in US dollars, are reflected in equity in the account “Cumulative Translation Adjustment”.
Investments in related companies over which the Company has significant influence are included in Other assets and are recorded using the equity method. Accordingly, the Company’s proportional share in net income (or loss) of each investee is recognized in the non-operating income and expense classification in the consolidated statements of income on an accrual basis, after eliminating any unrealized profits from transactions with the related companies.
In accordance with Chilean GAAP, the Company has evaluated the recoverability of its foreign investments as required by Technical Bulletins No. 33 of the Chilean Association of Accountants. The Company has not identified impairments in the net book values of its investments.
| m) | Intangibles, other than goodwill |
Intangibles, other than goodwill, correspond mainly to easements, adjustments to carrying value for assets contributed by the state of Chile upon incorporation of the Company, and rights for the use of telephone lines and are amortized in accordance with Technical Bulletin No.55 of the Chilean Association of Accountants.
| n) | Severance indemnities |
The severance indemnity that the Company is obliged to pay to its employees under collective bargaining agreements is stated at the present value of the benefit under the vested cost method, discounted at 6.5% (9.5% in 2003 and 2002) and assuming an average employment span which varies based upon years of service with the Company.
| o) | Revenue recognition |
Revenue consists of revenue for electric power generation and distribution, among which is included energy supplied and unbilled at each year-end, valued at the selling price using the current rates which has been included in revenue from operations. The unbilled amount is presented in current assets as trade receivables and the corresponding cost is included in cost of operations.
The Company also recognizes revenues for amounts received from highway tolls for motorized vehicles, income related to computer advisory services, engineering services, sale of materials and sale of real estate.
F - 24
ENERSIS S.A. AND SUBSIDIARIES
Notes to the Consolidated Financial Statements – (Continued)
| p) | Cost of sales and Administrative and selling expenses |
The cost of sales line item includes: purchased energy and power, materials, fuel, tolls and energy transportation cost, direct production salaries, productive assets’ depreciation, amortization, and maintenance and operation cost. The purchase of power amounted to ThCh$756,477,638, ThCh$748,236,474 and ThCh$888,503,807 for the years ended December 31, 2002, 2003 and 2004. The administrative and selling expense line item includes: general and administrative, materials and office supplies, overhead salaries, bad debt expense, non-productive assets’ amortization and depreciation.
| q) | Income tax and deferred income taxes |
At December 31, 2002, 2003 and 2004, the Company recorded current tax expense according to the tax laws and regulations in each country of ThCh$77,736,155, ThCh$103,272,006 and ThCh$90,711,798, respectively and, additionally, it recorded in the year’s income a deferred tax benefit of ThCh$9,392,071 in 2002, a deferred tax benefit of ThCh$60,662,022 in 2003 and deferred tax expense of ThCh$46,529,409 in 2004. The Company records deferred income taxes in accordance with Technical Bulletin No.60 of the Chilean Association of Accountants, and with circular No.1466 issued on January 27, 2000 by the SVS, recognizing, using the liability method, the deferred tax effects of temporary differences between the financial and tax values of assets and liabilities using the tax rates estimated to be in effect at the time of reversal of the temporary differences that gave rise to them.
| r) | Accrued vacation expense |
In accordance with Technical Bulletin No.47 issued by the Chilean Association of Accountants, employee vacation expense is recorded on an accrual basis.
| s) | Reverse repurchase agreements |
Reverse repurchase agreements are included in “Other current assets” and are stated at cost plus interest and indexation accrued at year-end, in conformity with the related contracts.
| t) | Statements of cash flows |
The Consolidated Statements of Cash Flows have been prepared in accordance with the indirect method.
Investments considered as cash equivalents, as indicated in point 6.2 of Technical Bulletin No.50 issued by the Chilean Association of Accountants, include time deposits, investments in fixed income securities classified as marketable securities, repurchase agreements classified as other current assets, and other cash balances classified as other accounts receivable with maturities less than 90 days.
For classification purposes, cash flows from operations include collections from clients and payments to suppliers, payroll and taxes.
| u) | Financial derivative contracts |
As of December 31, 2003 and 2004 the Company and its subsidiaries have forward contracts, currency swaps, and interest rate swaps and collars with several financial institutions, to hedge against mainly foreign currency and interest risk exposures, which are recorded according to Technical Bulletin No.57 of the Chilean Association of Accountants. Forward foreign exchange contracts gains and losses are recorded at estimated fair value with certain gains and losses deferred as assets or liabilities until settlement if the instrument qualifies as a hedge which are included in earnings as “Other non-operating income and expense”.
F - 25
ENERSIS S.A. AND SUBSIDIARIES
Notes to the Consolidated Financial Statements – (Continued)
| v) | Goodwill and negative goodwill |
Goodwill and negative goodwill are determined according to Circular No.368 of the SVS. Amortization is determined using the straight-line method, considering the nature and characteristic of each investment, foreseeable life of the business and investment return, not to exceed 20 years.
As of December 31, 2002, 2003 and 2004 the Company evaluated the recoverability of its goodwill and negative goodwill value arising from investments abroad and under the guidance of Technical Bulletin No.56 of the Chilean Association of Accountants, under IAS 36 “Impairment of Assets Value”, an impairment of goodwill and negative goodwill was recorded.
At December 31, 2002, and as a result of the recoverability analysis specified in the previous paragraph, the Company wrote off all of the goodwill and negative goodwill recorded for investments in Argentina and Brazil, since expected cash flows from our subsidiaries in those countries did not support the recoverability of the goodwill and negative goodwill recorded. Effects in 2002 were a net charge to income of ThCh$244,768,877, net of minority interest which was included in the income statement under the amortization of negative goodwill.
| w) | Pension and post-retirement benefits |
Pension and post-retirement benefits are recorded in accordance with the respective collective bargaining contracts of the employees based on the actuarially determined projected benefit obligation.
| x) | Bonds |
Bonds payable are recorded at the face value of the bonds. The difference between the face value and the placement value, equal to the premium or discount, is deferred and amortized over the term of the bonds.
| y) | Investments in other companies |
Investments in other companies are presented at acquisition cost adjusted for price-level restatement, as they do not trade in an organized market.
| z) | Research and development costs |
Costs incurred by the Company in research and development relate mainly to water-level studies, hydroelectric research, and seismic-activity surveys which are expensed as incurred. Costs incurred in performing studies related to specific construction projects are capitalized. During the years ended December 31, 2002, 2003 and 2004 no such costs was incurred.
| aa) | Cost of share issue |
Costs incurred to date associated with issuing and placing shares are recorded according to the provisions of Circular No. 1370 of 1998 of the Superintendency of Securities and Insurance. The amounts are deducted from the share premium account. A breakdown of the costs is shown in Note 27.
| ab) | Litigation and other legal action |
As of December 31, 2004, the Company has established accruals for probable losses in the aggregate amount of ThCh$66,544,240 (US$119,383,279), including accruals Endesa-Chile has established in the amount of ThCh$17,199,250 (US$30,856,208). See Note 30 for detail of claims to which such accruals relate to.
The Company has not recognized any assets for expected recoveries, through insurance or from others, related to litigation and other legal actions, in the periods presented. The Company records such recoveries only in the case that it is virtually certain such recoveries will be realized. In the case that the Company does record expected recoveries, the Company’s policy is to record such amounts as an asset in our consolidated balance sheet, unless a right of offset clearly exists.
F - 26
ENERSIS S.A. AND SUBSIDIARIES
Notes to the Consolidated Financial Statements – (Continued)
Note 3. Change in Accounting Principles
There were no changes in accounting principles during the year ended December 31, 2002, 2003 and 2004 that would affect the comparison with the prior year financial statements.
| • | As of January 1, 2004, the Superintendency of Securities and Insurance, through Circular Letter 1697, has made effective the adoption of Technical Bulletin 72 on Business Combinations issued by the Chilean Association of Accountants. These regulations have been applied by the Company and pertain to the nature of permanent investments and financial statement consolidation. |
| • | Regarding indemnity for years of service, the Company modified the discount rate from 9.5% in 2003 to 6.5% in 2004 and its workers’ estimated service lives, which are the assumptions used to assess the said liabilities. These changes resulted in the acknowledgment of a larger net charge of ThCh$22,060 to income during the current year. |
In addition, in the provision for post-retirement benefits, the discount rate was also modified from 9.5% in 2003 to 6.5% in 2004, which resulted in a charge to income of ThCh$3,411,293. |
F - 27
ENERSIS S.A. AND SUBSIDIARIES
Notes to the Consolidated Financial Statements – (Continued)
| Note 4. | Time Deposits |
Time deposits as of each year end are as follows:
| 2003 | 2004 | As of December 31, | ||||||||||||
| Financial Institution | Annual | Scheduled | Annual | Scheduled | 2003 | 2004 | ||||||||
| Rate % | Maturity | Rate % | Maturity | ThCh$ | ThCh$ | |||||||||
| AVvillas | — | — | 8.85 | % | 01-02-05 | — | 11,150,382 | |||||||
| Bancafe | — | — | 7.79 | % | 02-01-05 | — | 10,456,693 | |||||||
| Banco Bilbao Vizcaya | 0.97 | % | 05-01-04 | 2.41 | % | 02-01-05 | 70,181,356 | 87,359,136 | ||||||
| Banco Colpatria | 9.35 | % | 02-01-04 | 8.15 | % | 02-01-05 | 8,665,882 | 18,833,799 | ||||||
| Banco Continental | 1.48 | % | 06-01-04 | 2.35 | % | 02-01-05 | 2,157,070 | 3,974,531 | ||||||
| Banco Crédito | — | — | 5.43 | % | 02-01-05 | — | 6,651,891 | |||||||
| Banco de Bogotá | 10.50 | % | 02-02-04 | 2.18 | % | 15-03-05 | 207,091 | 16,649,142 | ||||||
| Banco de Chile | — | — | 1.85 | % | 02-01-05 | — | 3,605,027 | |||||||
| Banco de Chile N.Y. | — | — | 1.85 | % | 02-01-05 | — | 2,669,945 | |||||||
| Banco de Occidente | — | — | 1.80 | % | 01-01-05 | — | 4,376,923 | |||||||
| Banco do Brasil | 1.37 | % | 02-01-04 | 3.06 | % | 02-01-05 | 3,555,810 | 969,133 | ||||||
| Banco do Estado do Ceará | 1.37 | % | 02-01-04 | 1.47 | % | 04-01-05 | 3,095,085 | 2,033,720 | ||||||
| Banco Frances | 2.50 | % | 20-01-04 | 4.32 | % | 05-01-05 | 285,784 | 544,812 | ||||||
| Banco Holandes | 3.75 | % | 28-01-04 | 207,022 | — | |||||||||
| Banco Itau | 1.44 | % | 02-01-04 | 1.46 | % | 04-01-05 | 6,394 | 89 | ||||||
| Banco Interbank | 0.70 | % | 02-01-04 | 1,334,459 | — | |||||||||
| Banco Lloyds | — | — | 8.53 | % | 03-01-05 | — | 4,198,449 | |||||||
| Banco Nationale de Paris | 1.44 | % | 02-01-04 | 2.16 | % | 04-01-05 | 414,916 | 3,971,546 | ||||||
| Banco Pactual | 1.39 | % | 15-01-04 | 2,765,456 | — | |||||||||
| Banco Real | 0.00 | % | — | 0.99 | % | 11-01-05 | 389,437 | 82,545 | ||||||
| Banco Rio de la Plata | 1.59 | % | 28-01-04 | 3.54 | % | 15-01-05 | 2,542,817 | 2,572,288 | ||||||
| Banco Safra | 16.03 | % | 02-01-04 | 2,726,310 | — | |||||||||
| Banco Santander | 1.51 | % | 02-01-04 | 6.33 | % | 02-01-05 | 5,652,277 | 14,317,288 | ||||||
| Banco Santander Santiago | — | — | 1.20 | % | 02-01-05 | — | 91,074 | |||||||
| Banco Santos | 1.39 | % | 15-01-04 | 883,503 | — | |||||||||
| Banco Sudameris | — | — | 8.54 | % | 03-01-05 | — | 3,638,640 | |||||||
| Banco Tequendama | 8.50 | % | 02-01-04 | 9.22 | % | 03-01-05 | 770,608 | 4,409,737 | ||||||
| Banco Unión | 9.75 | % | 01-03-04 | 8.87 | % | 01-02-05 | 10,569,470 | 2,133,337 | ||||||
| Banco Votorantim | 1.39 | % | 15-01-04 | 1.47 | % | 04-01-05 | 1,006,218 | 3,760,980 | ||||||
| Bancolombia | 1.00 | % | 05-01-04 | 2.39 | % | 02-01-05 | 1,278,155 | 38,144,067 | ||||||
| Bank Boston | 0.80 | % | 02-01-04 | 2.95 | % | 02-01-05 | 451,474 | 456,676 | ||||||
| Bank of America | 0.56 | % | 05-01-04 | 1.63 | % | 02-01-05 | 16,855,765 | 8,189,878 | ||||||
| Bradesco | 1.38 | % | 15-01-04 | 7.07 | % | 02-01-05 | 877,332 | 3,411,044 | ||||||
| BTM | 0.60 | % | 02-01-04 | 668,294 | — | |||||||||
| CDT | — | — | 7.90 | % | 02-01-05 | — | 806,955 | |||||||
| Citibank N.Y. | 0.53 | % | 05-01-04 | 2.93 | % | 02-01-05 | 44,702,765 | 75,880,376 | ||||||
| Citiliquit | 0.95 | % | 02-01-04 | 6.22 | % | 03-01-05 | 3,154,884 | 435,601 | ||||||
| Corficol S.A. | 9.66 | % | 02-01-04 | 7,098,131 | — | |||||||||
| Corficolombiana | — | — | 9.03 | % | 15-03-05 | — | 8,325,719 | |||||||
| Corfinsura | 1.41 | % | 02-01-04 | 4.22 | % | 02-01-05 | 2,018,080 | 25,566,873 | ||||||
| Corfivalle | 1.70 | % | 02-01-04 | 8.38 | % | 02-01-05 | 4,626,408 | 13,251,647 | ||||||
| Corporacion las Villas | 9.95 | % | 01-03-04 | 942,035 | — | |||||||||
| Encargo Fiduciario Banco Santander | 6.51 | % | 02-01-04 | 9.00 | % | 02-01-05 | 515,610 | 1,566,442 | ||||||
| FAM Fondo Ganadero | — | — | 8.43 | % | 02-01-05 | — | 1,442,306 | |||||||
| Fiduciaria Banco de Bogotá | — | — | 5.74 | % | 03-01-05 | — | 153 | |||||||
| Fiduciaria Banco Colpatria | 7.71 | % | 02-01-04 | 6.73 | % | 03-01-05 | 1,689 | 187 | ||||||
| Fiduciaria Bancolombia | 7.37 | % | 02-01-04 | 6.61 | % | 03-01-05 | 5,448,016 | 49 | ||||||
| Fiduciaria Helm Trust | — | — | 6.74 | % | 03-01-05 | — | 70 | |||||||
| Fiducolombia | 8.14 | % | 02-01-04 | 7.17 | % | 02-01-05 | 1,123,055 | 4,116,116 | ||||||
| Fiduoccidente | — | — | 6.52 | % | 03-01-05 | — | 81 | |||||||
| Fiduvalle | 7.08 | % | 02-01-04 | 7.44 | % | 02-01-05 | 1,765,894 | 8,285,231 | ||||||
| Granahorrar | 8.90 | % | 02-01-04 | — | — | 826,413 | — | |||||||
| HSBC - Bamerindus | 1.39 | % | 15-01-04 | 1.50 | % | 02-01-05 | 18,503,537 | 3,770,473 | ||||||
| Interbolsa S.A | 9.68 | % | 02-01-04 | 7.98 | % | 02-01-05 | 10,536,885 | 6,436,913 | ||||||
| Merril lynch | 0.60 | % | 05-01-04 | 2.08 | % | 02-01-05 | 6,143,374 | 4,231,326 | ||||||
| Panamericano | — | — | 18.65 | % | 01-01-05 | — | 107,475 | |||||||
| Porvenir | 3.22 | % | 02-01-04 | 2.24 | % | 02-01-05 | 15,279,260 | 439,323 | ||||||
| Pruential Securiti | 0.20 | % | 30-01-04 | 1,055,017 | — | |||||||||
| Serfinco | 8.05 | % | 02-01-04 | 7.15 | % | 02-01-05 | 90,591 | 80,741 | ||||||
| Ford Motor | — | — | 2.26 | % | 02-01-05 | — | 5,590,056 | |||||||
| Suvalor | 9.10 | % | 02-01-04 | 8.16 | % | 02-01-05 | 1,275,652 | 29,273,086 | ||||||
| Otros | 0.00 | % | 02-01-04 | 1.45 | % | 04-01-05 | 5,690 | 2,483,888 | ||||||
| Total | 262,660,971 | 450,743,859 | ||||||||||||
F - 28
ENERSIS S.A. AND SUBSIDIARIES
Notes to the Consolidated Financial Statements – (Continued)
| Note 5. | Accounts, Notes and Other Receivables |
| (a) | Current accounts, notes and other receivables and their related allowances for doubtful accounts as of each December 31, are as follows: |
| As of December 31, | ||||||||||||||||||
| Under 90 days | 91 days to 1 year | Sub total | Current | Long term | ||||||||||||||
| Account | 2003 | 2004 | 2003 | 2004 | 2004 | 2003 | 2004 | 2003 | 2004 | |||||||||
| ThCh$ | ThCh$ | ThCh$ | ThCh$ | ThCh$ | ThCh$ | ThCh$ | ThCh$ | ThCh$ | ||||||||||
| �� | ||||||||||||||||||
| Account receivable | 509,056,859 | 540,343,007 | 63,603,984 | 80,151,615 | 620,494,622 | 572,660,843 | 528,740,129 | — | — | |||||||||
| Allowance for doubtful accounts | (33,854,656 | ) | (32,358,593 | ) | (59,956,562 | ) | (59,395,900 | ) | (91,754,493 | ) | (93,811,218 | ) | ||||||
| Notes receivables | 8,180,871 | 2,865,834 | 1,181,130 | 696,361 | 3,562,195 | 9,362,001 | 2,828,014 | — | — | |||||||||
| Allowance for doubtful accounts | (119,253 | ) | (131,782 | ) | (671,056 | ) | (602,399 | ) | (734,181 | ) | (790,309 | ) | ||||||
| Other receivables | 53,789,172 | 60,662,368 | 51,543,183 | 12,152,586 | 72,814,954 | 105,332,355 | 63,814,202 | 134,743,490 | 128,766,346 | |||||||||
| Allowance for doubtful accounts | (2,848,919 | ) | (1,386,054 | ) | (5,934,313 | ) | (7,614,698 | ) | (9,000,752 | ) | (8,783,232 | ) | (3,610,070 | ) | (2,856,257 | ) | ||
| Total | 583,970,440 | 595,382,345 | 131,133,420 | 125,910,089 | ||||||||||||||
| (b) | Current and long-term accounts receivable per country as of each December 31, are as follows: |
| As of December 31, | ||||||||||||
| Country | 2003 | 2004 | ||||||||||
| ThCh$ | % | ThCh$ | % | |||||||||
| Chile | 174,001,542 | 24.33 | % | 155,832,458 | 21.60 | % | ||||||
| Perú | 46,424,406 | 6.49 | % | 51,255,755 | 7.11 | % | ||||||
| Argentina | 48,160,770 | 6.73 | % | 58,060,262 | 8.05 | % | ||||||
| Colombia | 113,317,251 | 15.85 | % | 128,009,533 | 17.75 | % | ||||||
| Brazil | 332,896,968 | 46.55 | % | 323,506,255 | 44.85 | % | ||||||
| Panamá | 302,923 | 0.04 | % | 4,628,171 | 0.64 | % | ||||||
| Total | 715,103,860 | 100.00 | % | 721,292,434 | 100.00 | % | ||||||
| (c) | Changes in provision for accounts receivables are as follows: |
| Year ended December 31, | ||||||
| 2002 | 2003 | 2004 | ||||
| ThCh$ | ThCh$ | ThCh$ | ||||
| Balance at beginning of period | 151,536,928 | 119,415,603 | 106,994,929 | |||
| Additions charged to costs and expenses | 19,461,473 | 37,639,977 | 16,262,434 | |||
| Deductions | (50,240,068 | ) | (46,785,486 | ) | (20,647,225 | ) |
| Other | (1,342,730 | ) | (3,275,265 | ) | 1,735,645 | |
| Balance at end of period | 119,415,603 | 106,994,829 | 104,345,783 | |||
F - 29
ENERSIS S.A. AND SUBSIDIARIES
Notes to the Consolidated Financial Statements – (Continued)
| (d) | Amounts of unbilled energy sold are as follows: |
| As of December 31, | ||||||
| 2002 | 2003 | 2004 | ||||
| ThCh$ | ThCh$ | ThCh$ | ||||
| Unbilled energy sold | 147,434,219 | 160,391,143 | 177,603,778 | |||
| Note 6. | Transactions with Related Companies |
| The balances of accounts receivable and payable with related companies are as follows at December 31, 2003 and 2004: | |
| (a) | Notes and accounts receivable due from related companies: |
| As of December 31, | ||||||||
| Short-term | Long-term | |||||||
| Company | 2003 | 2004 | 2003 | 2004 | ||||
| ThCh$ | ThCh$ | ThCh$ | ThCh$ | |||||
| Aguas Santiago Poniente S.A. | 592,954 | — | — | — | ||||
| Atacama Finance Co. | 1,952,594 | 106,087,173 | 131,389,523 | — | ||||
| CGTF Fortaleza | 148,215 | 34,419 | — | — | ||||
| Cía. Interconexión Energética S.A. | 2,736,733 | 1,687,332 | 159,325 | 38 | ||||
| Com. de Energía del Mercosur S.A. | 5,185,378 | 3,311,018 | — | — | ||||
| Consorcio Energetico Punta Cana-Macao | 962 | — | — | — | ||||
| Distrilec Inversora S.A. | 6,146 | — | — | — | ||||
| Elesur S.A. | 27,996 | — | — | — | ||||
| Empresa Eléctrica de Bogotá S.A. | 35,294 | — | — | — | ||||
| Empresa Eléctrica Piura S.A. | 33,242 | 52,796 | — | — | ||||
| Endesa España | — | 543,797 | — | — | ||||
| Endesa Internacional S.A. | 1,311,402 | 352,336 | 173,476 | 122,111 | ||||
| Etevensa | 96,106 | 63,562 | — | — | ||||
| Fundación Endesa | 38,885 | 58,960 | — | — | ||||
| Consorcio Ingendesa - Minmetal Ltda. | — | 15,715 | — | 30,000 | ||||
| Gas Atacama Generación Ltda. | 30,592 | 27,967 | — | — | ||||
| Gasoducto Atacama Chile | 126,609 | 193,193 | — | — | ||||
| Gasoducto Tal Tal Ltda. | — | 75,087 | — | — | ||||
| Gas Atacama S.A. | 2,681,081 | — | — | — | ||||
| Sociedad Consorcio Ara Ltda. | — | 13,425 | — | — | ||||
| Consorcio Ara-Ingendesa Ltda. | 463,413 | 201,639 | — | — | ||||
| Inversiones Electricas Quillota S.A. | 2,050 | 2,000 | — | — | ||||
| Sacme | 90,728 | 82,739 | — | — | ||||
| Smartcom S.A. | 1,610,360 | 1,273,859 | — | — | ||||
| Soc. de Inv. Chispa Uno S.A. | 2,023 | — | — | — | ||||
| Transmisora Eléctrica de Quillota Ltda. | 313,865 | 308,746 | 609,105 | 304,097 | ||||
| Total | 17,486,628 | 114,385,763 | 132,331,429 | 456,246 | ||||
F - 30
ENERSIS S.A. AND SUBSIDIARIES
Notes to the Consolidated Financial Statements – (Continued)
| (b) | Notes and accounts payable due to related companies: |
| As of December 31, | ||||||||
| Short-term | Long-term | |||||||
| Company | 2003 | 2004 | 2003 | 2004 | ||||
| ThCh$ | ThCh$ | ThCh$ | ThCh$ | |||||
| Aguas Santiago Poniente S.A. | 6 | — | — | — | ||||
| Cía. Interconexión Energética S.A. | 21,464,496 | 8,864,648 | — | — | ||||
| Cía. de Transmisión del Mercosur S.A. | 1,033,586 | 178,592 | — | — | ||||
| CGTF Fortaleza | 3,274,017 | 14,436,127 | — | — | ||||
| Com. de Energía del Mercosur S.A. | 584,044 | 239,536 | — | — | ||||
| Electrogas S.A. | 199,325 | 207,713 | — | — | ||||
| Elesur S.A. | 136,489 | — | — | — | ||||
| Empresa Eléctrica de Bogotá S.A. | 2,930,452 | — | 86,428 | — | ||||
| Empresa Eléctrica Piura S.A. | 394,992 | 476,526 | — | — | ||||
| Endesa Internacional S.A. | 1,230,151 | 56,725,083 | — | — | ||||
| Endesa Servicios | 98,284 | — | — | — | ||||
| Sacme | 115,123 | 107,332 | — | — | ||||
| Smartcom S.A. | 32,644 | 247,699 | — | — | ||||
| Transmisora Eléctrica de Quillota Ltda. | 23,391 | 25,419 | — | — | ||||
| Total | 31,517,000 | 81,508,675 | 86,428 | — | ||||
F - 31
ENERSIS S.A. AND SUBSIDIARIES
Notes to the Consolidated Financial Statements – (Continued)
| (c) | The most significant transactions and their effects in income (expense) for each year ended December 31 are as follows: |
| 2002 | 2003 | 2004 | |||||||
| Company | Relationship | Nature of transaction | Income | Income | Income | ||||
| (Expense) | (Expense) | (Expense) | |||||||
| ThCh$ | ThCh$ | ThCh$ | |||||||
| Aguas Santiago Poniente S.A. | Affiliate | Interest | 73,252 | 22,681 | — | ||||
| Services | 33,191 | 15,538 | — | ||||||
| Atacama Finance Co. | Affiliate | Interest | 6,894,616 | 5,678,768 | 6,406,649 | ||||
| Monetary correction | 5,164,539 | 1,781,235 | 2,982,447 | ||||||
| Exchange difference | 11,499,197 | (29,716,443 | ) | (10,276,468 | ) | ||||
| CGTF Fortaleza | Affiliate | Services | 490,521 | 1,172,958 | 327,731 | ||||
| Purchase of energy | (22,398 | ) | (3,205,624 | ) | (86,270,164 | ) | |||
| Cía. Interconexión Energética S.A. | Affiliate | Sale of energy | 27,942,425 | 21,942,261 | 19,198,528 | ||||
| Purchase of energy | — | (51,820,568 | ) | (54,004,303 | ) | ||||
| Interest | — | 68,202 | 7,961 | ||||||
| Services | 282,526 | 56,239 | 63,218 | ||||||
| Exchange difference | (3,647 | ) | — | — | |||||
| Consorcio ARA-Ingendesa | Affiliate | Services | — | 2,129,021 | 2,572,199 | ||||
| Consorcio Ingendesa Minmetal Ltda. | Affiliate | Services | — | — | 61,141 | ||||
| Com. de Energía del Mercosur S.A. | Affiliate | Sale of energy | 19,827,998 | 20,487,600 | 19,487,819 | ||||
| Purchase of energy | (2,027,240 | ) | (2,178,949 | ) | (743,739 | ) | |||
| Interest | (64,723 | ) | — | — | |||||
| Services | 76,459 | 18,812 | 18,266 | ||||||
| Com. Transmisión del Mercosur S.A. | Affiliate | Purchase of energy | (1,446,965 | ) | (2,109,564 | ) | (2,166,614 | ) | |
| Empresa Eléctrica de Bogotá S.A. | Affiliate | Exchange difference | — | (2,202,686 | ) | — | |||
| Elesur S.A. | Parent company | Interest | (44,938,992 | ) | (9,499,614 | ) | — | ||
| Monetary correction | (30,107,849 | ) | (16,067,616 | ) | — | ||||
| Services | 16,480 | 36,638 | — | ||||||
| Empresa Eléctrica Piura S.A. | Member of Controling Group | Sale of energy | 1,508,755 | 500,996 | 125,823 | ||||
| Purchase of energy | (9,958,740 | ) | (4,914,658 | ) | (4,762,242 | ) | |||
| Services | 182,115 | 98,805 | 125,122 | ||||||
| Electrogas S.A. | Affiliate | Services | (3,083,701 | ) | (2,681,022 | ) | (2,674,409 | ) | |
| Endesa España | Parent company | Exchange difference | — | — | (27,935 | ) | |||
| Endesa Internacional S.A. | Parent company | Services | 189,157 | 130,312 | 71,854 | ||||
| Interest | (1,062,719 | ) | (193,724 | ) | (141,997 | ) | |||
| Endesa Servicios | Member of Controling Group | Services | — | (125,814 | ) | — | |||
| Empresa Propietaria de la Red | Affiliate | Services | 359,226 | 153,139 | — | ||||
| Etevensa | Member of Controling Group | Sale of energy | 5,960,842 | 2,269,437 | 1,520,132 | ||||
| Services | 159,032 | 131,248 | 637,234 | ||||||
| Fundación Endesa | Member of Controling Group | Services | — | — | 34,937 | ||||
| Gasoducto Atacama Generación Ltda. | Affiliate | Services | 606,530 | 80,661 | 1,727 | ||||
| Gas Atacama S.A. | Affiliate | Exchange difference | — | — | (127,613 | ) | |||
| Gasoducto Tal Tal Ltda. | Affiliate | Services | (41,921 | ) | — | — | |||
| Ingendesa do Brasil | Member of Controling Group | Services | — | (25,564 | ) | — | |||
| Ingendesa Argentina | Member of Controling Group | Services | — | — | 7,262 | ||||
| Sacme | Affiliate | Services | (377,241 | ) | (316,289 | ) | (334,279 | ) | |
| Smartcom S.A. | Member of Controling Group | Services | 3,527,399 | 3,853,485 | 3,721,375 | ||||
| Interest | — | — | 32,300 | ||||||
| Soc. de Inv. Chispa Uno S.A. | Affiliate | Services | 8,729 | 8,731 | 2,911 | ||||
| Transmisora Eléctrica de Quillota Ltda. | Affiliate | Interest | 149,128 | 109,927 | 81,104 | ||||
| Monetary correction | 45,545 | 25,351 | 57,305 | ||||||
| Services | 5,245 | 131,501 | 85,307 | ||||||
| (8,133,229 | ) | (64,154,589 | ) | (103,899,411 | ) | ||||
The transfer of short-term funds between related companies, is on the basis of a current cash account, at a variable interest rate based on market conditions. The resulting accounts receivable and accounts payable are essentially on 30 day terms, with automatic rollover for the same year and settlement in line with cash flows.
F - 32
ENERSIS S.A. AND SUBSIDIARIES
Notes to the Consolidated Financial Statements – (Continued)
Detail of the long-term payables / receivables is as follows:
| Type | Due Date | Capital in | Currency | Interestrate | ||||||
| original | ||||||||||
| Company | currency | |||||||||
| Transmisora Eléctrica de Quillota Ltda. | Account receivables | 2006 | 35,389.57 | U.F. | 9.00 | % |
Note 7. Inventories
Inventories include the following items and are presented net of an allowance for obsolescence amounting to ThCh$4,495,259, ThCh$2,750,729 and ThCh$3,017,626 as of December 31, 2002, 2003 and 2004, respectively:
| As of December 31, | ||||
| 2003 | 2004 | |||
| ThCh$ | ThCh$ | |||
| Real estate under development | 16,561,003 | 15,702,906 | ||
| Materials in transit | 138,683 | 188,414 | ||
| Operation and maintenance material | 22,602,565 | 25,375,082 | ||
| Fuel | 6,113,564 | 9,714,913 | ||
| Others | 84 | — | ||
| Total | 45,415,899 | 50,981,315 | ||
Note 8. Deferred Income Taxes
| a) | Income taxes (recoverable) payable as of each year-end are as follows: |
| As of December 31, | ||||
| 2003 | 2004 | |||
| ThCh$ | ThCh$ | |||
| Income tax provision - current | 49,036,057 | 54,418,780 | ||
| Recoverable tax credits | (62,818,496 | ) | (97,637,872 | ) |
| Total | (13,782,439 | ) | (43,219,092 | ) |
F - 33
ENERSIS S.A. AND SUBSIDIARIES
Notes to the Consolidated Financial Statements – (Continued)
| b) | Tax loss carryforwards |
As of December 31, 2003 and 2004, the Company and its subsidiaries had tax loss carryforwards of ThCh$604,571,569 and ThCh$288,057,204 respectively as follows:
| As of December 31, | ||||
| 2003 | 2004 | |||
| ThCh$ | ThCh$ | |||
| Chile | 395,518,395 | 160,432,617 | (1) | |
| Brasil | 61,438,744 | 59,170,648 | (1) | |
| Argentina | 123,976,976 | 61,985,287 | (2) | |
| Perú | 23,637,454 | 565,320 | (3) | |
| Colombia | — | 5,903,332 | (2) | |
| Total | 604,571,569 | 288,057,204 | ||
| (1) | Tax losses with an indefinite term |
| (2) | Tax losses expire in 2007 |
| (3) | Tax losses expire in 2008 |
| c) | The balance of tax retained losses and the related tax credits are as follows: |
| Amount of loss | Credit | |||
| Year | ThCh$ | ThCh$ | ||
| 2002 | 24,534,334 | 4,684,048 | ||
| 2003 | 204,685,253 | — | ||
| 2004 | 239,949,691 | — |
| d) | The net effect of recording the deferred tax expense (benefit) was ThCh$(9,392,071), ThCh$(60,662,022) and ThCh$46,529,409 during the years ended December 31, 2002, 2003 and 2004, respectively. |
F - 34
ENERSIS S.A. AND SUBSIDIARIES
Notes to the Consolidated Financial Statements – (Continued)
| e) | In accordance with BT No.60 and 69 of the Chilean Association of Accountants, and Circular No.1,466 of the SVS, the Company and its subsidiaries have recorded consolidated deferred income taxes as of December 31, 2003 and 2004 as follows: |
| As of December 31, 2003 | As of December 31, 2004 | |||||||||||||||
| Asset | Liability | Asset | Liability | |||||||||||||
| Description | Short-term | Long-term | Short-term | Long-term | Short-term | Long-term | Short-term | Long-term | ||||||||
| ThCh$ | ThCh$ | ThCh$ | ThCh$ | ThCh$ | ThCh$ | ThCh$ | ThCh$ | |||||||||
| Allowance for doubtful accounts | 9,441,712 | 19,715,261 | — | — | 8,592,885 | 20,367,584 | — | — | ||||||||
| Deferred income | 1,532,249 | 5,493,647 | — | — | 1,093,988 | 1,376,969 | — | — | ||||||||
| Vacation accrual | 789,056 | — | — | — | 902,749 | — | — | — | ||||||||
| Intangibles | 73,815 | — | 12,703 | 1,540 | — | — | — | — | ||||||||
| Fixed assets depreciation | 150 | 3,159,481 | 93,135 | 364,000,349 | — | 2,893,469 | 139,345 | 386,542,008 | ||||||||
| Severance indemnities | — | — | — | 1,953,906 | — | — | — | 1,886,652 | ||||||||
| Other | 2,898,399 | 1,000,934 | 845,581 | 5,331,865 | 925,843 | 897,198 | 258,881 | 3,041,781 | ||||||||
| Contingencies | 8,136,524 | 46,100,903 | — | — | 5,733,922 | 46,244,921 | — | — | ||||||||
| Bond discount | — | — | 112,726 | 1,789,264 | — | — | 135,394 | 1,701,307 | ||||||||
| Cost of studies | — | — | — | 8,180,400 | — | — | — | 8,107,213 | ||||||||
| Finance cost | — | — | — | 10,904,732 | — | — | — | 12,982,334 | ||||||||
| Imputed interest on construction | — | — | — | 4,664,007 | — | — | — | 4,293,140 | ||||||||
| Deferred charges | 1,900,849 | 2,800,215 | 1,799,379 | 2,805,349 | 3,209,755 | — | 619,552 | 3,384,371 | ||||||||
| Actuarial deficit (Brazil) | — | 12,070,233 | — | — | — | 12,028,415 | — | — | ||||||||
| Withholdings | — | — | 5,864 | 1,249 | — | — | — | — | ||||||||
| Obsolescence | 291,011 | 656,893 | — | — | 295,228 | 647,679 | — | — | ||||||||
| Materials used | — | — | — | 973,913 | — | — | — | 895,914 | ||||||||
| Imputed salaries on construction | — | 3,899,439 | — | — | — | 3,632,328 | — | — | ||||||||
| Tax losses | 30,731,646 | 100,373,330 | — | — | 42,778,937 | 81,877,301 | — | — | ||||||||
| Provision real state project | — | 2,944,849 | — | — | — | 2,528,523 | — | — | ||||||||
| Sie2000A project | — | — | — | 183,201 | — | — | — | 277,684 | ||||||||
| Provision for employee benefits | 1,123,988 | 3,236,528 | 540 | — | 1,478,806 | 2,689,410 | — | — | ||||||||
| Derivative contracts exchange difference | — | 312,837 | 989,222 | — | 1,615,743 | — | — | — | ||||||||
| Operating fees | 5,106,050 | — | — | — | 3,736,278 | — | — | — | ||||||||
| Energy in measurers | — | — | 2,798,986 | — | — | — | 2,419,644 | — | ||||||||
| Regulated assets | — | — | 2,282,623 | 13,555,320 | — | — | 6,785,601 | 7,873,283 | ||||||||
| Capitalized expenses | — | — | — | 637,484 | — | — | — | 556,006 | ||||||||
| Capitalized interest | — | — | — | 1,449,633 | — | — | — | 1,899,692 | ||||||||
| Complementary account-net | (62,409 | ) | (21,776,753 | ) | (1,630 | ) | (231,934,818 | ) | — | (17,495,723 | ) | — | (215,152,549 | ) | ||
| Valuation allowance | — | (2,685,345 | ) | — | — | — | (2,935,126 | ) | — | — | ||||||
| Total | 61,963,040 | 177,302,452 | 8,939,129 | 184,497,394 | 70,364,134 | 154,752,948 | 10,358,417 | 218,288,836 | ||||||||
F - 35
ENERSIS S.A. AND SUBSIDIARIES
Notes to the Consolidated Financial Statements – (Continued)
| f) | Income tax benefit (expense) for the year ended December 31, 2002, 2003 and 2004 is as follows: |
| As of December 31, | ||||||
| Item | 2002 | 2003 | 2004 | |||
| ThCh$ | ThCh$ | ThCh$ | ||||
| Current income tax expense: | ||||||
| Income tax provision | (77,210,695 | ) | (103,270,325 | ) | (91,392,576 | ) |
| Adjustment for tax expense - prior year | (525,460 | ) | (1,681 | ) | 680,778 | |
| Deferred tax expense (benefit): | ||||||
| Deferred taxes | 25,334,615 | 52,463,456 | (48,266,851 | ) | ||
| Benefits for tax losses | 5,220,957 | 29,492,226 | 16,171,969 | |||
| Amortization of complementary accounts | (16,047,636 | ) | (21,254,071 | ) | (14,395,636 | ) |
| Valuation allowance | (131,037 | ) | (39,589 | ) | (38,891 | ) |
| Other charges or credits | (4,984,828 | ) | — | — | ||
| Total | (68,344,084 | ) | (42,609,984 | ) | (137,241,207 | ) |
Note 9. Other Current Assets
Other current assets are as follows:
| As of December 31, | ||||
| 2003 | 2004 | |||
| ThCh$ | ThCh$ | |||
| Forwards contracts and swap (1) | 11,196,734 | 81,507 | ||
| Guaranties and indemnities | 2,430,634 | 208,760 | ||
| Deferred expenses | 6,779,838 | 2,617,127 | ||
| Post-retirement benefits | 886,918 | 233,837 | ||
| Deposits for commitments and guarantees | 12,976,213 | 4,023,170 | ||
| Bond discount | 740,663 | 926,826 | ||
| Recoverable - taxes | 2,413,745 | — | ||
| Fair value derivatives contracts | 1,206,465 | 159,867 | ||
| Reverse repurchase agreements (2) | 36,371,190 | 25,585,039 | ||
| Others | 774,602 | 2,281,047 | ||
| Total | 75,777,002 | 36,117,180 | ||
| (1) | See detail in Note 29. |
F - 36
ENERSIS S.A. AND SUBSIDIARIES
Notes to the Consolidated Financial Statements – (Continued)
| (2) | The detail of reverse repurchase agreements is as follows: |
| As of December 31, 2004 | |||||||||||||||||||
| Date | Interest rate | ||||||||||||||||||
| Current | |||||||||||||||||||
| Code | Start | End | Financial institution | Currency | Document | amount | Nominal | Fair value | |||||||||||
| % | ThCh$ | ThCh$ | ThCh$ | ||||||||||||||||
| CRV | 29-Dec-04 | 3-Jan-05 | BBVA C. Bolsa BHIF S.A. | U.F. | D.P.R. | 0.33 | % | 1,717,533 | 1,717,190 | 1,717,190 | |||||||||
| CRV | 29-Dec-04 | 3-Jan-05 | BBVA C. Bolsa BHIF S.A. | U.F. | D.P.F. | 0.33 | % | 202,755 | 202,710 | 202,710 | |||||||||
| CRV | 29-Dec-04 | 3-Jan-05 | BBVA C. Bolsa BHIF S.A. | U.F. | CERO | 0.33 | % | 55,192 | 55,189 | 55,189 | |||||||||
| CRV | 29-Dec-04 | 3-Jan-05 | BBVA C. Bolsa BHIF S.A. | U.F. | D.P.F. | 0.33 | % | 1,744,373 | 1,743,989 | 1,743,989 | |||||||||
| CRV | 29-Dec-04 | 3-Jan-05 | BBVA C. Bolsa BHIF S.A. | U.F. | D.P.F. | 0.33 | % | 801,429 | 801,289 | 801,289 | |||||||||
| CRV | 29-Dec-04 | 3-Jan-05 | BBVA C. Bolsa BHIF S.A. | U.F. | D.P.F. | 0.33 | % | 2,633,534 | 2,633,052 | 2,633,052 | |||||||||
| CRV | 29-Dec-04 | 3-Jan-05 | BBVA C. Bolsa BHIF S.A. | U.F. | D.P.F. | 0.33 | % | 5,029,012 | 5,027,775 | 5,027,775 | |||||||||
| CRV | 29-Dec-04 | 3-Jan-05 | BBVA C. Bolsa BHIF S.A. | U.F. | D.P.F. | 0.33 | % | 1,724,914 | 1,724,822 | 1,724,822 | |||||||||
| CRV | 29-Dec-04 | 3-Jan-05 | Valores Security S.A. C.B. | U.F. | BONO | 0.37 | % | 683,467 | 683,315 | 683,315 | |||||||||
| VRC | 29-Dec-04 | 3-Jan-05 | BBVA Banco BHIF | $ | D.P.R. | 0.33 | % | 633,722 | 633,583 | 633,932 | |||||||||
| VRC | 29-Dec-04 | 3-Jan-05 | Banco Central de Chile | $ | CERO | 0.33 | % | 8,044 | 8,043 | 8,048 | |||||||||
| VRC | 29-Dec-04 | 3-Jan-05 | BBVA Banco BHIF | $ | D.P.F. | 0.33 | % | 6,554,416 | 6,552,973 | 6,556,578 | |||||||||
| VRC | 30-Dec-04 | 3-Jan-05 | Banco Central de Chile | $ | CERO | 0.12 | % | 2,954 | 2,954 | 2,955 | |||||||||
| VRC | 30-Dec-04 | 3-Jan-05 | Scotiabank | $ | D.P.F. | 0.12 | % | 1,014,928 | 1,014,887 | 1,015,049 | |||||||||
| VRC | 30-Dec-04 | 3-Jan-05 | Banco de Chile | $ | D.P.F. | 0.12 | % | 1,609,100 | 1,609,036 | 1,609,294 | |||||||||
| VRC | 30-Dec-04 | 3-Jan-05 | Banco Crédito e Inversiones | $ | D.P.F. | 0.12 | % | 247,911 | 247,901 | 247,941 | |||||||||
| VRC | 30-Dec-04 | 3-Jan-05 | Banco Santander Santiago | $ | D.P.F. | 0.12 | % | 413,855 | 413,838 | 413,904 | |||||||||
| VRC | 30-Dec-04 | 3-Jan-05 | BBVA Banco BHIF | $ | D.P.F. | 0.12 | % | 70,887 | 70,885 | 70,895 | |||||||||
| VRC | 30-Dec-04 | 6-Jan-05 | Banco Central de Chile | $ | B.C.D. | 0.09 | % | 437,013 | 437,000 | 437,092 | |||||||||
| Total | 25,585,039 | 25,580,431 | 25,585,019 | ||||||||||||||||
| As of December 31, 2003 | |||||||||||||||||||
| Date | |||||||||||||||||||
| Interest | Current | ||||||||||||||||||
| Code | Start | End | Financial institution | Currency | Document | rate | amount | Nominal | Fair value | ||||||||||
| % | ThCh$ | ThCh$ | ThCh$ | ||||||||||||||||
| CRV | 23-Dec-03 | 5-Jan-04 | BBVA C. Bolsa BHIF S.A. | $ | Bono | 0.27 | % | 42,724 | 42,693 | 42,724 | |||||||||
| CRV | 23-Dec-03 | 5-Jan-04 | BBVA C. Bolsa BHIF S.A. | $ | CERO | 0.27 | % | 3,841 | 3,838 | 3,841 | |||||||||
| CRV | 23-Dec-03 | 5-Jan-04 | BBVA C. Bolsa BHIF S.A. | $ | D.P.F. | 0.27 | % | 421,456 | 421,153 | 421,456 | |||||||||
| CRV | 23-Dec-03 | 5-Jan-04 | BBVA C. Bolsa BHIF S.A. | $ | D.P.F. | 0.27 | % | 206,237 | 206,089 | 206,237 | |||||||||
| CRV | 23-Dec-03 | 5-Jan-04 | BBVA C. Bolsa BHIF S.A. | $ | D.P.F. | 0.27 | % | 4,741,262 | 4,737,850 | 4,741,262 | |||||||||
| CRV | 23-Dec-03 | 5-Jan-04 | BBVA C. Bolsa BHIF S.A. | $ | D.P.F. | 0.27 | % | 14,196,210 | 14,185,996 | 14,196,210 | |||||||||
| CRV | 23-Dec-03 | 5-Jan-04 | BBVA C. Bolsa BHIF S.A. | $ | D.P.R. | 0.27 | % | 615,915 | 615,473 | 615,915 | |||||||||
| CRV | 23-Dec-03 | 5-Jan-04 | BBVA C. Bolsa BHIF S.A. | $ . | D.P.R | 0.27 | % | 287,115 | 286,909 | 287,115 | |||||||||
| CRV | 30-Dec-03 | 5-Jan-04 | BBVA C. Bolsa BHIF S.A. | $ | Bono | 0.26 | % | 56,495 | 56,490 | 56,495 | |||||||||
| CRV | 30-Dec-03 | 5-Jan-04 | BBVA C. Bolsa BHIF S.A. | $ | CERO | 0.26 | % | 3,536 | 3,536 | 3,536 | |||||||||
| CRV | 30-Dec-03 | 5-Jan-04 | BBVA C. Bolsa BHIF S.A. | $ | D.P.F. | 0.26 | % | 1,321,736 | 1,321,622 | 1,321,736 | |||||||||
| CRV | 30-Dec-03 | 5-Jan-04 | BBVA C. Bolsa BHIF S.A. | $ | D.P.F. | 0.26 | % | 942,221 | 942,140 | 942,221 | |||||||||
| CRV | 30-Dec-03 | 5-Jan-04 | BBVA C. Bolsa BHIF S.A. | $ | D.P.F. | 0.26 | % | 934,593 | 934,512 | 934,593 | |||||||||
| CRV | 30-Dec-03 | 5-Jan-04 | BBVA C. Bolsa BHIF S.A. | $ | D.P.F. | 0.26 | % | 356,103 | 356,073 | 356,103 | |||||||||
| CRV | 30-Dec-03 | 5-Jan-04 | BBVA C. Bolsa BHIF S.A. | $ | D.P.F. | 0.26 | % | 1,415,315 | 1,415,192 | 1,415,315 | |||||||||
| CRV | 30-Dec-03 | 5-Jan-04 | BBVA C. Bolsa BHIF S.A. | $ | D.P.F. | 0.26 | % | 827,627 | 827,555 | 827,627 | |||||||||
| CRV | 30-Dec-03 | 5-Jan-04 | BBVA C. Bolsa BHIF S.A. | $ | D.P.R. | 0.26 | % | 212,450 | 212,431 | 212,450 | |||||||||
| CRV | 30-Dec-03 | 5-Jan-04 | BBVA C. Bolsa BHIF S.A. | $ | D.P.R. | 0.26 | % | 109,303 | 109,293 | 109,303 | |||||||||
| CRV | 30-Dec-03 | 5-Jan-04 | BBVA C. Bolsa BHIF S.A. | $ | D.P.R. | 0.26 | % | 1,434,904 | 1,434,779 | 1,434,904 | |||||||||
| CRV | 30-Dec-03 | 5-Jan-04 | BBVA C. Bolsa BHIF S.A. | $ | P.D.B.C. | 0.26 | % | 313,921 | 313,894 | 313,921 | |||||||||
| CRV | 30-Dec-03 | 5-Jan-04 | BBVA C. Bolsa BHIF S.A. | $ | CERO | 0.20 | % | 2,282 | 2,282 | 2,282 | |||||||||
| CRV | 30-Dec-03 | 5-Jan-04 | BBVA C. Bolsa BHIF S.A. | $ | D.P.F. | 0.20 | % | 276,947 | 276,928 | 276,947 | |||||||||
| CRV | 30-Dec-03 | 5-Jan-04 | BCI C. Bolsa S.A. | $ | L.H. | 0.25 | % | 412,299 | 412,265 | 412,299 | |||||||||
| CRV | 30-Dec-03 | 5-Jan-04 | BCI C. Bolsa S.A. | $ | L.H. | 0.25 | % | 4,546,358 | 4,545,979 | 4,546,358 | |||||||||
| CRV | 30-Dec-03 | 5-Jan-04 | BCI C. Bolsa S.A. | $ | L.H. | 0.25 | % | 313,226 | 313,199 | 313,226 | |||||||||
| CRV | 30-Dec-03 | 5-Jan-04 | BCI C. Bolsa S.A. | $ | L.H. | 0.25 | % | 19,404 | 19,402 | 19,404 | |||||||||
| CRV | 30-Dec-03 | 2-Jan-04 | Bancoestado S.A. C.B. | $ | L.H. | 0.27 | % | 21,198 | 21,196 | 21,198 | |||||||||
| CRV | 30-Dec-03 | 2-Jan-04 | Bancoestado S.A. C.B. | $ | D.P.R. | 0.27 | % | 405,915 | 405,878 | 405,915 | |||||||||
| CRV | 30-Dec-03 | 2-Jan-04 | Bancoestado S.A. C.B. | $ | D.P.R. | 0.27 | % | 180,590 | 180,574 | 180,590 | |||||||||
| CRV | 30-Dec-03 | 2-Jan-04 | Bancoestado S.A. C.B. | $ | D.P.R. | 0.27 | % | 1,120,153 | 1,120,051 | 1,120,153 | |||||||||
| CRV | 30-Dec-03 | 2-Jan-04 | Bancoestado S.A. C.B. | $ | D.P.R. | 0.27 | % | 612,374 | 612,321 | 612,374 | |||||||||
| CRV | 30-Dec-03 | 2-Jan-04 | Bancoestado S.A. C.B. | $ | D.P.F. | 0.27 | % | 17,480 | 17,480 | 17,480 | |||||||||
| Total | 36,371,190 | 36,355,073 | 36,371,190 | ||||||||||||||||
F - 37
ENERSIS S.A. AND SUBSIDIARIES
Notes to the Consolidated Financial Statements – (Continued)
| Note 10. | Property, Plant and Equipment |
| The composition of property, plant and equipment is as follows: | |
| As of December 31, | ||||||
| Useful life | ||||||
| 2003 | 2004 | range | ||||
| ThCh$ | ThCh$ | Years | ||||
| Land | 118,340,129 | 122,606,995 | — | |||
| Buildings and infrastructure | 5,863,335,494 | 5,643,213,439 | 20-40 | |||
| Distribution and transmission lines and public lighting | 4,481,745,419 | 4,284,173,352 | 20-50 | |||
| Less: third party contributions | (39,796,311 | ) | (62,401,125 | ) | 20-50 | |
| Sub-total | 10,305,284,602 | 9,864,985,666 | ||||
| Machinery and equipment | 1,806,292,572 | 1,721,120,263 | 4-20 | |||
| Work in progress | 162,981,726 | 180,102,817 | — | |||
| Construction materials | 52,718,519 | 44,425,890 | 4-10 | |||
| Leased assets (1) | 630,715 | 28,302,652 | 4-10 | |||
| Furniture and fixtures, tools, and computing equipment | 78,199,053 | 84,235,650 | 4-10 | |||
| Vehicles | 14,053,161 | 11,609,898 | 4-10 | |||
| Equipment in transit | 6,354,622 | 5,976,374 | 4-10 | |||
| Other assets | 41,854,140 | 44,056,038 | 4-10 | |||
| Sub-total | 356,791,936 | 398,709,319 | ||||
| Technical appraisal | ||||||
| Buildings and infrastructure | 515,562,792 | 474,816,497 | 20-50 | |||
| Machinery and equipment | 119,176,041 | 109,165,816 | 4-20 | |||
| Other assets | 219,178 | 200,725 | 4-10 | |||
| Total technical appraisal | 634,958,011 | 584,183,038 | ||||
| Total property plant and equipment | 13,221,667,250 | 12,691,605,281 | ||||
| Accumulated depreciation at beginning of year | ||||||
| Buildings and infrastructure | (3,751,141,037 | ) | (3,822,180,291 | ) | ||
| Machinery and equipment | (582,125,634 | ) | (609,407,810 | ) | ||
| Other assets | (45,503,524 | ) | (48,287,346 | ) | ||
| Accumulated depreciation at beginning of year | (4,378,770,195 | ) | (4,479,875,447 | ) | ||
| Accumulated depreciation at beginning of year technical appraisal | ||||||
| Buildings and infrastructure | (89,603,788 | ) | (96,979,993 | ) | ||
| Machinery and equipment | (47,872,874 | ) | (50,160,670 | ) | ||
| Other assets | (324,851 | ) | (276,063 | ) | ||
| Total accumulated depreciation at beginning of year technical appraisal | (137,801,513 | ) | (147,416,726 | ) | ||
| Depreciation of the year | (406,326,019 | ) | (379,491,166 | ) | ||
| Total accumulated depreciation at end of year | (4,922,897,727 | ) | (5,006,783,339 | ) | ||
| Total property, plant and equipment, net | 8,298,769,523 | 7,684,821,942 | ||||
F - 38
ENERSIS S.A. AND SUBSIDIARIES
Notes to the Consolidated Financial Statements – (Continued)
Depreciation expense of the three years ended December 31, 2004 has been allocated as follows:
| 2002 | 2003 | 2004 | ||||
| ThCh$ | ThCh$ | ThCh$ | ||||
| Cost of sales | 455,409,782 | 392,468,621 | 365,465,613 | |||
| Administrative and selling expenses | 15,081,459 | 13,857,398 | 14,025,553 | |||
| Total | 470,491,241 | 406,326,019 | 379,491,166 | |||
| (1) | Corresponds to a contract for power transmission lines and installations (Ralco-Charrúa 2X220 KV) between Empresa Nacional de Electricidad S.A. and Huepil S.A. The said contract has a 20-year validity and earns interest at a 6.5% annual rate. |
| As of December 31, 2004 the total leasing obligation amount to M$24,384,379, which respective parts are presented in other current liabilities and other long – term liabilities. |
The Company and its foreign subsidiaries have insurance contracts that include blanket, earthquake, and machinery failure policies up to a MUS$100,000 limit. This coverage includes losses due to business interruption. Premiums prepaid associated with these policies are recorded in prepaid expenses and charged to income over the life of the policy.
At December 31, 2003 and 2004 Enersis S.A. and its local subsidiaries have carried out an analysis of the book values of their property, plant and equipment and of the companies in which it has invested abroad. The analysis consisted of evaluating both the recoverability of property, plant and equipment of these companies, and the recorded goodwill and negative goodwill, in accordance with accounting principles generally accepted in Chile.
The property, plant and equipment recoverability analysis, as explained in Note 2h, was carried out considering that when there is evidence that the company’s operations do not have sufficient earnings to recover all costs, including the depreciation of property, plant and equipment taken as a whole, and when the book value of said assets exceeds its realization value, these values must be written down to recoverable amounts, charging non operating income.
The results of this analysis determined that no adjustments affecting the Company and its Subsidiaries’ book values of property, plant and equipment were required.
F - 39
ENERSIS S.A. AND SUBSIDIARIES
Notes to the Consolidated Financial Statements – (Continued)
| Note 11. | Investment in Related Companies |
| a) | Investments in related companies of December 31, 2003 and 2004 are as follows: |
| Number | Percentage | Shareholders' equity | Net income | |||||||||||||||||||||
| Related Companies | of shares | owned | of investee | of investees | Equity in income | Investment book value | ||||||||||||||||||
| 2003 | 2004 | 2003 | 2004 | 2003 | 2004 | 2002 | 2003 | 2004 | 2003 | 2004 | ||||||||||||||
| (6) | (6) | ThCh$ | ThCh$ | ThCh$ | ThCh$ | ThCh$ | ThCh$ | ThCh$ | ThCh$ | ThCh$ | ||||||||||||||
| Cía. de Interconexión Energética S.A. (2) | 128,270,106 | 45.00 | % | 45.00 | % | 124,924,385 | 117,397,915 | 25,378,061 | 14,321,278 | 7,485,566 | 11,420,128 | 6,444,575 | 56,215,972 | 52,829,062 | ||||||||||
| Gas Atacama Generación S.A. (7) | — | 0.05 | % | 0.05 | % | 60,740,108 | 54,312,421 | 3,340,051 | (1,313,660 | ) | (4,962,299 | ) | 1,670 | (657 | ) | 30,370 | 27,156 | |||||||
| Gasoducto Atacama Argentina S.A. (7) | — | 0.05 | % | 0.05 | % | 55,910,966 | 56,562,027 | 1,512,741 | 5,358,497 | 2,470,253 | 756 | 2,679 | 27,956 | 28,281 | ||||||||||
| Gasoducto Atacama Chile S.A. (7) | — | 0.05 | % | 0.05 | % | 52,736,881 | 59,830,121 | 5,425,624 | 11,533,433 | 3,325,927 | 2,713 | 5,767 | 26,368 | 29,915 | ||||||||||
| Inversiones Eléctricas Quillota S.A. | 608,676 | 50.00 | % | 50.00 | % | 22,545,505 | 26,253,719 | 6,744,947 | 7,099,149 | 1,356,310 | 3,372,471 | 3,549,575 | 11,272,753 | 13,126,860 | ||||||||||
| Inversiones Electrogas S.A. | 425 | 42.50 | % | 42.50 | % | 19,267,163 | 18,101,389 | 6,003,335 | 4,910,202 | 660,880 | 2,551,417 | 2,086,836 | 8,188,544 | 7,693,090 | ||||||||||
| Cía. de Energía del Mercosur S.A. (3) | 6,305,400 | 45.00 | % | 45.00 | % | 7,901,478 | 8,523,313 | 1,389,582 | 1,287,102 | (1,578,338 | ) | 625,312 | 579,196 | 3,555,666 | 3,835,491 | |||||||||
| Transmisora Eléctrica de Quillota Ltda. | — | 50.00 | % | 50.00 | % | 5,527,265 | 5,764,453 | 318,087 | 257,389 | 130,989 | 159,044 | 128,695 | 2,763,633 | 2,882,227 | ||||||||||
| Atacama Finance Co. (7) | 3,150,000 | 0.00 | % | 0.00 | % | — | — | — | — | (137,965 | ) | — | — | — | — | |||||||||
| Endesa Market Place (4) | — | 0.00 | % | 0.00 | % | — | — | — | — | (291,179 | ) | — | — | — | — | |||||||||
| Sacme | 12,000 | 50.00 | % | 50.00 | % | 88,275 | 80,420 | 14,637 | (52 | ) | 16,070 | 7,319 | (26 | ) | 44,138 | 40,210 | ||||||||
| Electrogas S.A. | 85 | 0.02 | % | 0.02 | % | 17,699,641 | 16,662,557 | 6,115,066 | 5,029,745 | 351 | 1,300 | 1,069 | 3,760 | 3,541 | ||||||||||
| Consorcio ARA- Ingendesa | — | 50.00 | % | 50.00 | % | 127,379 | 533,523 | 103,294 | 405,602 | 58,933 | 51,648 | 202,801 | 63,689 | 266,762 | ||||||||||
| Sociedad Consorcio Ingendesa Ara Ltda (1) | 50.00 | % | 50.00 | % | — | 10,726 | — | 9,726 | — | — | 4,863 | — | 5,363 | |||||||||||
| Consorcio Ingendesa - Minmetal Limited (1) | — | 50.00 | % | 50.00 | % | 3,409 | 82,174 | — | 80,055 | 19,583 | — | 40,028 | 1,705 | 41,087 | ||||||||||
| Gas Atacama S.A. | 1,147 | 0.00 | % | 0.00 | % | 169,074,616 | 167,326,512 | 395,459 | 12,487,171 | — | 4 | 143 | 1,940 | 1,919 | ||||||||||
| Inversiones Gas Atacama Holding Ltda. (7) | — | 50.00 | % | 50.00 | % | 169,072,670 | 167,323,954 | (487,299 | ) | 12,486,274 | — | (243,650 | ) | 6,243,137 | 84,536,335 | 83,661,977 | ||||||||
| Central Geradora Termelectrica Fortaleza S.A. (5) | 20,246,908 | 48.82 | % | 48.82 | % | 34,295,929 | 55,289,063 | — | 24,287,590 | — | — | 11,857,202 | 16,743,272 | 26,992,121 | ||||||||||
| Ingendesa do Brasil Limitada | — | 0.00 | % | 0.00 | % | — | — | — | — | — | — | — | — | — | ||||||||||
| Distrilec Inversora S.A. | 4,416,141 | 0.00 | % | 0.00 | % | 8,900 | — | 8,900 | — | — | 4,584 | — | 4,584 | — | ||||||||||
| Aguas Santiago Poniente S.A. (5) | 1,031,949 | 55.00 | % | 55.00 | % | 2,247,406 | — | — | — | — | — | — | 1,236,073 | — | ||||||||||
| Total | 8,555,081 | 17,954,716 | 31,145,883 | 184,716,758 | 191,465,062 | |||||||||||||||||||
| Equity method investee: | |
| (1) | Related companies of subsidiary Ingendesa Ltda. |
| (2) | Related companies of subsidiary Compañía Eléctrica Cono Sur S.A. |
| (3) | Related companies of subsidiary Endesa Argentina S.A. |
| (4) | Company with negative equity in 2003 and 2004. |
| (5) | These subsidiaries were in the development stage for the years shown and accordingly, were not consolidated under Chilean GAAP. |
| (6) | The ownership percentage represents the nominal interest held in the related party. |
| (7) | See Note 11(d). |
| b) | Income and (losses) recognized by Enersis S.A. based on the participation in the related companies as of December 31, 2004, amounted to ThCh$31,146,566 (ThCh$683); ThCh$18,198,366 (ThCh$243,650) in 2003 and ThCh$15,524,861 (ThCh$6,969,781) in 2002. |
F - 40
ENERSIS S.A. AND SUBSIDIARIES
Notes to the Consolidated Financial Statements – (Continued)
| c) | In accordance with Technical Bulletin No.64 of the Chilean Association of Accountants for the years ended December 31, 2002, 2003 and 2004, the Company has recorded foreign exchange gains and losses on liabilities related to net investments in foreign countries that are denominated in the same currency as the functional currency of those foreign investments. Such gains and losses are included in the cumulative translation adjustment account in shareholders’ equity, and in this way, act as a hedge of the exchange risk affecting the investments. As of December 31, 2004 the corresponding amounts are as follows: |
| Company | Country | Reporting | ||||||
| of origin | Investment | currency | Liability | |||||
| ThCh$ | ThCh$ | |||||||
| Edesur S.A. | Argentina | 180,857,743 | US$ | 134,672,035 | ||||
| Companhia de Eletricidade do Río de Janeiro | Brasil | 259,065,626 | US$ | 206,558,046 | ||||
| Investluz S.A. (Coelce) | Brasil | 27,346,437 | US$ | 14,025,863 | ||||
| Central Hidroeléctrica Betania S.A. | Colombia | 332,514,494 | US$ | 254,029,968 | ||||
| Cachoeira Dourada S.A. | Brasil | 333,881,589 | US$ | 326,329,745 | ||||
| Edegel S.A. | Perú | 165,115,398 | US$ | 97,236,037 | ||||
| Cía. Interconexión Energética S.A. | Brasil | 52,829,062 | US$ | 40,240,941 | ||||
| Hidroeléctrica El Chocón S.A. | Argentina | 167,982,348 | US$ | 77,797,288 | ||||
| Comercializadora de Energia del Mercosur S.A. | Argentina | 3,835,491 | US$ | 2,514,714 | ||||
| Central Costanera S.A. | Argentina | 92,936,967 | US$ | 56,035,228 | ||||
| Total | 1,616,365,155 | 1,209,439,865 | ||||||
| d) | The investments in related companies made by Enersis S.A. and its affiliates for the years ended December 31, 2003 and 2004, amounted to ThCh$3,061,889 and ThCh$343,959, respectively, which are detailed as follows: |
| As of December 31, | ||||
| Company | 2003 | 2004 | ||
| ThCh$ | ThCh$ | |||
| Central Eléctrica Cachoeira Dourada S.A. | 25,380 | — | ||
| Central Costanera S.A. | 3,036,509 | — | ||
| Elesur S.A. | — | 343,959 | ||
| Total | 3,061,889 | 343,959 | ||
| • | Capital increase in Cerj |
| On December 10, 2002, the Extraordinary General Shareholders’ Meeting of the Company Cerj agreed to an increase in its authorized capital for an approximate total amount of ThUS$105,000. | |
| On January 6, 2003, the companies Endesa Internacional, Endesa Internacional Energía, Chilectra S.A. assigned 100% of the rights of share subscription of the company Cerj and part of the rights of Luz de Río S.A. to Enersis, for no consideration. | |
| A capital increase was made on January 10, 2003 through the issuance and the subscription of 770,833,333,333 ordinary shares, at a value of R$0.48 by lot of thousand shares totaling the ThUS$100,000 approved by the Meeting and increasing the authorized capital of the Company to ThUS$259,085. | |
| After this capital increase, the percentage of direct and indirect participation held by Enersis S.A. and subsidiaries increased from 61.9521% to 71.8148%. | |
| On December 11, 2003, the Compañía de Electricidade do Rio de Janeiro S.A. shareholders extraordinary assembly was held, which approved a capital stock increase of an approximate value of ThUS$250,000. | |
F - 41
ENERSIS S.A. AND SUBSIDIARIES
Notes to the Consolidated Financial Statements – (Continued)
| The capital stock increase for the Compañía de Electricidade do Rio de Janeiro S.A. was entered into on February 27, 2004, for ThR$710,000 (around ThUS$243,000), at an equivalent of R$0.53 per one thousand share lot (1,000 shares). | |
| The number of shares issued was 1,339,622,641,509 of which the subsidiary Enersis Internacional S.A., through a inter-company debt equity conversion subscribed to a total of 1,339,620,447,234 shares in two stages: 1,335,849,056,604 on February 27, 2004, and 3,771,390,630 on March 24, 2004. | |
| On March 30, 2004, Enersis Internacional S.A. transferred 760,255,861,477 shares to Chilectra S.A. so that the latter could maintain its relative ownership interest in the same proportion as before the increase. | |
| With this operation, Enersis S.A. and its subsidiaries direct and indirect ownership interest percentage increased from 71.8148% to 80.4141% in Compañía de Electricidad de Río de Janeiro S.A. | |
| According to Technical Bulletin 72 of the Chilean Association of Accountants, for this transaction carried out in companies of the same group, a reserve of ThCh$11,992,130 has been recorded in equity (see Note 22 f.) | |
| • | Sale of Río Maipo |
| The contract between Enersis and Compañía General de Electricidad - Distribución was signed on April 30, 2003 to sell the entire share participation held by Enersis (356.078.645 shares) in the Company Río Maipo. | |
| The disposal of Rio Maipo to Company CGE Distribución was approved by the Board of Directors of Enersis on March 28, 2003, with a bid of US$170 million for the shares held by Enersis which was later ratified at an Extraordinary Shareholders Meeting dated March 31, 2003. The effects of the sale of the shares are detailed in Note 23. | |
| • | Sale of Infraestructura 2000 S.A. |
| On June 23, 2003, Endesa Chile S.A. sold 330,939,522 shares of the subsidiary Infraestructura 2000 S.A. in the amount of ThCh$40,074,506 and 3,741 shares of Sociedad Concesionaria Autopista del Sol S.A., in the amount of ThCh$41,151 which amounts represent 100% of its participation in these related Companies (Note 23). | |
| • | Group Reorganization |
| On December 1, 2003 the firm names of subsidiaries Gasoducto Atacama Chile Limitada, Gasoducto Atacama Argentina Limitada and Gas Atacama Generación Limitada were amended by public deeds and changed to Gasoducto Atacama Chile S.A., Gasoducto Atacama Argentina S.A. and Gas Atacama Generación S.A., respectively. | |
| On December 29, 2003 our subsidiary, Compañía Eléctrica Cono Sur S.A. transferred to our related party GasAtacama S.A. all our shares held in Atacama Finance for US$4,400,000 as part of a reorganization of our natural gas business holding (Note 23) | |
| On December 29, 2003, Compañía Eléctrica Cono Sur S.A. transferred to GasAtacama S.A. its 50% interest in Energex Co. for US$5,000 as part of the above reorganization. (Note 23) | |
| • | Merger of Inmobiliaria Manso de Velasco Limitada and Sociedad Agrícola el Gobernador Limitada, Partners of these Companies agreed by public deed dated December 31, 2003 to a merger by absorption of Inmobiliaria Manso de Velasco into Constructora el Gobernador Ltda., which, for all legal intents and purposes, became the successor, changing its name as of that date to Inmobiliaria Manso de Velasco Limitada. As a result of this merger, the predecessor Inmobiliaria Manso de Velasco Ltda. was dissolved, and its partners received rights in the continuing Company. |
| • | Dissolution of Investment Vehicles. During 2003, Companys Enersis Energía de Colombia S.A. and Enersis de Argentina S.A. were dissolved. |
F - 42
ENERSIS S.A. AND SUBSIDIARIES
Notes to the Consolidated Financial Statements – (Continued)
| • | Incorporation of Companies |
| On October 1, 2003 Inversiones Gas Atacama Holding Limitada was incorporated by public deed; Inversiones Endesa Norte S.A. contributed ThCh$700,000 in cash and 99.99% of its ownership rights in Gasoducto Atacama Chile Limitada, Gasoducto Atacama Argentina Limitada and Gas Atacama Generación Limitada, which represent 49.95% of all its rights in the aforementioned affiliates, in return of a 50% interest in the Company. The transaction was recognized at historical carrying, values as a reorganization of the group interest in its natural gas business. | |
| • | Purchase of Elesur S.A. |
| On May 27, 2004, Enersis S.A. purchased 49,207,343 shares with no par value from Endesa International S.A., equivalent to 99.9989% of Elesur S.A. partnership assets. The price agreed upon for the transaction was ThCh$55,551,601. The purchase was made at book value and no goodwill was recognized. | |
| Note 12. | Investments in Other Companies |
Investments in other companies at December 31, 2003 and 2004 are as follows:
| Company | Number of shares | Percentage owned | As of December 31, | |||||
| 2003 | 2004 | |||||||
| % | ThCh$ | ThCh$ | ||||||
| Electrificadora de la Costa | 13,590,296 | 0.19 | % | 27,137 | 24,852 | |||
| Electrificadora del Caribe | 85,568,116 | 0.06 | % | 1,376,666 | 1,331,547 | |||
| Autopista del Río Maipo S.A. | 25 | — | — | — | ||||
| CDEC-SIC Ltda. | — | 23.16 | % | 173,229 | 213,764 | |||
| CDEC-SING Ltda. | — | 7.69 | % | 103,171 | 103,171 | |||
| Club de la Banca y Comercio | 1 | 1.00 | % | 1,994 | 2,245 | |||
| Club Empresarial | 1 | 1.00 | % | 6,447 | 5,486 | |||
| Cooperativa Eléctrica de Chillán | — | — | 13,363 | 13,363 | ||||
| Emgesa S.A. | 1 | — | — | — | ||||
| Edegas | 1 | 1.00 | % | — | — | |||
| Distasa S.A. | 1 | — | — | — | ||||
| Empresa Eléctrica de Aysen S.A. | 2,516,231 | — | 2,047,755 | 2,047,755 | ||||
| Empresa Eléctrica de Bogotá S.A.(1) | 9,293,241 | 7.19 | % | 132,805,731 | 46,053,558 | |||
| Financiera Eléctrica Nacional S.A. | 4,072 | 0.10 | % | 111,723 | 115,694 | |||
| Inmobiliaria España S.A. | 1 | — | 100 | — | ||||
| Inverandes S.A. | — | — | 3,541 | — | ||||
| Menescal Produciones Artisticas | — | — | 52,730 | 52,562 | ||||
| Prod. Cinematográfica | — | — | 25,280 | 25,200 | ||||
| Saelpa | — | — | 1,980 | 1,974 | ||||
| Teleceara | — | — | 1,409 | 1,405 | ||||
| Telebras | — | — | 44,548 | 178 | ||||
| Total | 136,796,804 | 49,992,754 | ||||||
| (1) | See Note 14 (1). |
F - 43
ENERSIS S.A. AND SUBSIDIARIES
Notes to the Consolidated Financial Statements – (Continued)
| Note 13. | Goodwill |
| a) | In accordance with current standards, recognition has been given to the excess of purchase price of the proportional equity in the net assets acquired (goodwill) in the purchase of shares as of December 31, 2003 and 2004, as follows: |
| As of December 31, | ||||||||||
| Amortization | Net Balance | |||||||||
| 2002 | 2003 | 2004 | 2003 | 2004 | ||||||
| ThCh$ | ThCh$ | ThCh$ | ThCh$ | ThCh$ | ||||||
| Central Cachoeira Dourada S.A. | (72,016,694 | ) | — | — | — | — | ||||
| Central Costanera S.A. | (24,865,737 | ) | — | — | — | — | ||||
| Chilectra S.A. | (6,464,498 | ) | (6,434,838 | ) | (6,434,768 | ) | 103,587,929 | 97,153,161 | ||
| Cía. de Eletricidade do Río de Janeiro | (113,229,764 | ) | — | — | — | — | ||||
| Cía. Eléctrica del Río Maipo S.A. | (594,662 | ) | — | — | — | — | ||||
| Codensa S.A. | (1,851,025 | ) | (1,514,390 | ) | (637,605 | ) | 19,434,925 | 12,276,827 | ||
| Coelce S.A. | (221,532,583 | ) | — | — | — | — | ||||
| Distrilec Inversora S.A. | (12,052,615 | ) | — | — | — | — | ||||
| Edegel S.A. | (42,466 | ) | (34,742 | ) | (31,818 | ) | 480,607 | 408,325 | ||
| Edesur S.A. | (9,818,140 | ) | — | — | — | — | ||||
| Emgesa S.A. | (1,672,379 | ) | (1,368,842 | ) | (1,253,592 | ) | 18,933,729 | 16,086,006 | ||
| Empresa Eléctrica de Colina S.A. | (191,716 | ) | (191,714 | ) | (191,717 | ) | 2,444,373 | 2,252,656 | ||
| Empresa Eléctrica Pangue S.A. | (72,149 | ) | (173,156 | ) | (173,156 | ) | 3,217,820 | 3,044,664 | ||
| Empresa Nacional de Electricidad S.A. | (44,472,560 | ) | (44,472,559 | ) | (44,472,559 | ) | 646,704,395 | 602,231,837 | ||
| Gasoducto Atacama Chile Ltda. | (4,941 | ) | (4,941 | ) | (4,941 | ) | 74,934 | 69,992 | ||
| Hidroeléctrica El Chocón S.A. | (10,424,263 | ) | — | — | — | — | ||||
| Hidroinvest S.A. | (1,428,357 | ) | — | — | — | — | ||||
| Inversiones Distrilima S.A. | (1,553 | ) | (1,270 | ) | (1,164 | ) | 13,976 | 11,635 | ||
| Investluz S.A. | (1,133,849 | ) | — | — | — | — | ||||
| Lajas Inversora S.A. | (1,861,515 | ) | — | — | — | — | ||||
| Luz de Bogotá S.A. | (461,337 | ) | (362,491 | ) | — | 5,014,460 | — | |||
| Total | (524,192,803 | ) | (54,558,943 | ) | (53,201,320 | ) | 799,907,148 | 733,535,103 | ||
| b) | Following current standards, recognition has been given to the excess of the equity in the net assets purchased over the purchase price (negative goodwill) in the purchase of shares as of December 31, 2003 and 2004 as follows: |
| As of December 31, | ||||||||||
| Company | Amortization | Net Balance | ||||||||
| 2002 | 2003 | 2004 | 2003 | 2004 | ||||||
| ThCh$ | ThCh$ | ThCh$ | ThCh$ | ThCh$ | ||||||
| Central Cachoeira Dourada S.A. | 38,169,361 | — | — | — | — | |||||
| Central Costanera S.A. | — | 434,671 | 2,699,974 | (16,952,154 | ) | (12,824,889 | ) | |||
| Central Hidroeléctrica Betania S.A. | 36,115,750 | 6,609,649 | 5,218,912 | (14,680,338 | ) | (7,583,899 | ) | |||
| Hidroeléctrica El Chocón S.A. | 3,740,843 | — | — | — | — | |||||
| Cía. de Eletricidade do Río de Janeiro (*) | 16,434,303 | 35,380,018 | — | — | — | |||||
| Coelce S.A. | 9,500,550 | — | — | — | — | |||||
| Edegel S.A. | 10,657,031 | 8,718,901 | 7,984,811 | (44,711,106 | ) | (32,961,832 | ) | |||
| Edelnor S.A. | 1,288,017 | 1,053,773 | 965,050 | (1,228,652 | ) | (160,155 | ) | |||
| Empresa Eléctrica de Bogotá S.A. | 263,785 | 216,069 | 197,877 | (3,021,314 | ) | (2,569,614 | ) | |||
| Inversiones Distrilima S.A. | 19,014 | 26,667 | 24,423 | (491,129 | ) | (425,354 | ) | |||
| Elesur S.A. | — | — | — | — | (95,119 | ) | ||||
| Synapsis Soluciones y Servicios IT Ltda. | 15,854 | 15,855 | 15,855 | (130,805 | ) | (114,952 | ) | |||
| Total | 116,204,508 | 52,455,603 | 17,106,902 | (81,215,498 | ) | (56,735,814 | ) | |||
| (*) | According to the provisions of Circular 368 of the Superintendency of Securities and Insurance, the Company has amortized higher quarterly installments due to the revaluation of Cerj, caused by the capital increase in January 2003. |
F - 44
ENERSIS S.A. AND SUBSIDIARIES
Notes to the Consolidated Financial Statements – (Continued)
| Note 14. Other Assets | |
Other assets as of each year end are as follows:
| As of December 31, | ||||
| 2003 | 2004 | |||
| ThCh$ | ThCh$ | |||
| Bond discount | 20,072,691 | 19,358,573 | ||
| Bond issuance cost | 6,657,377 | 7,492,349 | ||
| Forward contracts and swap | 4,986,444 | — | ||
| Deferred expenses | 12,879,804 | 6,612,227 | ||
| Bank fees and interest expense | 29,198,128 | 15,033,865 | ||
| Investment fund wholesale electrical market | — | 7,338,729 | ||
| Post-retirement benefits | 2,131,172 | 1,876,825 | ||
| Security deposits for judicial obligations | 29,538,640 | 35,259,272 | ||
| Recoverable - taxes | 12,761,176 | 26,075,014 | ||
| Reimbursable contributions | 1,315,207 | 1,133,706 | ||
| Investment in Empresa Eléctrica de Bogotá S.A. (1) | — | 42,474,437 | ||
| Regulatory assets | 43,067,826 | 46,558,132 | ||
| Fair - value derivative contracts | 16,669,892 | 5,556,455 | ||
| Others | 5,847,944 | 7,534,018 | ||
| Total | 185,126,301 | 222,303,602 | ||
The debt refunding plan was completed in May 2003, which meant incurring expenditures required to obtain the loans, which are amortized over the same term as the debt. Disbursements for this item amounted to ThCh$57,503,327 classified in the statements of cash flow under “Disbursements for Financing” within cash flows for financing activities.
Continuing with the company’s refunding plan, Enersis S.A. and its subsidiary Endesa Chile prepaid US$2,045 million of the last loan obtained in May 2003. These payments were made with funds from sale of assets, capital increases, issuance and placements of bonds and obtaining new loans.
As a result of these pre-payments, accelerated amortization of deferred expenses for ThCh$40,072,596 were made and charged to financial expenses.
| (1) | Through a Memorandum of Understanding signed on October 5, 2004, the Corporación Financiera del Valle will stop being shareholder of the Central Hidroeléctrica de Betania S.A. through an asset exchange operation between the Corfivalle Group and the Endesa Group. |
| This operation will be drafted for attestation during 2005 and 2006, when the mandatory legal processes defined by both parties before the handing over of the corresponding assets ownership are executed. | |
| With this operation, the Endesa Group will hand over to Corfivalle the Betania S.A. power sub-station and 3.81% of the ownership interest in the Empresa de Eléctrica de Bogotá S.A. in exchange for the ownership interest Corfivalle has in the Central Hidroeléctrica de Betania S.A. (14.3% of the company.) | |
| The parties understand that the steps to perfect the above-mentioned Memorandum of Understanding will be gradually executed, and have agreed the economic and political right beneficial interest of the assets that will be exchanged as from January 1, 2004. According to this, the Empresa Eléctrica de Bogotá S.A. 3.81% ownership interest that is subject to this agreement is included under the Others item. |
F - 45
ENERSIS S.A. AND SUBSIDIARIES
Notes to the Consolidated Financial Statements – (Continued)
Note 15. Due to Banks and Financial Institutions
| a) | Short–term debt due to banks and financial institutions: |
| Foreign currency | ||||||||||||||||||||
| Financial Institution | US$ | Euros | Other foreign currency | Ch$ | As of December 31, | |||||||||||||||
| 2003 | 2004 | 2003 | 2004 | 2003 | 2004 | 2003 | 2004 | 2003 | 2004 | |||||||||||
| ThCh$ | ThCh$ | ThCh$ | ThCh$ | ThCh$ | ThCh$ | ThCh$ | ThCh$ | ThCh$ | ThCh$ | |||||||||||
| ABN Amro Bank | 6,103,990 | 283,175 | — | — | 14,053,807 | — | — | — | 20,157,797 | 283,175 | ||||||||||
| AV Villas | — | — | — | — | 6,673,668 | — | — | — | 6,673,668 | — | ||||||||||
| Banco Alfa | — | — | — | — | — | 4,208,267 | — | — | — | 4,208,267 | ||||||||||
| Banco ABC Brasil S.A. | — | — | — | — | — | 3,637,805 | — | — | — | 3,637,805 | ||||||||||
| Banco BBM | — | — | — | — | — | 4,246,015 | — | — | — | 4,246,015 | ||||||||||
| Banco Banrisul | — | — | — | — | 401,293 | — | — | — | 401,293 | — | ||||||||||
| Banco Bayerische Landes | 701,288 | 117,725 | — | — | — | — | — | — | 701,288 | 117,725 | ||||||||||
| Banco BBVA | — | — | — | — | 13,693,038 | — | — | — | 13,693,038 | — | ||||||||||
| Banco BBVA Bhif | — | — | — | — | — | — | 8,045 | 5 | 8,045 | 5 | ||||||||||
| Banco Beal | 471,721 | — | — | — | — | — | — | — | 471,721 | — | ||||||||||
| Banco Continental | — | 5,710,588 | — | — | 21,673,832 | 13,160,679 | — | — | 21,673,832 | 18,871,267 | ||||||||||
| Banco Crédito Perú | — | — | — | — | 13,043,218 | 9,506,572 | — | — | 13,043,218 | 9,506,572 | ||||||||||
| Banco Crédito e Inversiones | 3 | — | — | — | — | — | 179 | 4 | 182 | 4 | ||||||||||
| Banco Crédito Nacional | 2,496,919 | — | — | — | — | — | — | — | 2,496,919 | — | ||||||||||
| Banco Credit Swiss First Boston | — | — | — | — | — | 3,383,914 | — | — | — | 3,383,914 | ||||||||||
| Banco Davivienda | — | — | — | — | 3,335,822 | 3,295,130 | — | — | 3,335,822 | 3,295,130 | ||||||||||
| Banco de Bogota | — | — | — | — | 11,114,034 | 9,362,360 | — | — | 11,114,034 | 9,362,360 | ||||||||||
| Banco de Chile | 403,204 | 31,003 | — | — | — | — | 6 | 8,353 | 403,210 | 39,356 | ||||||||||
| Banco de Galicia y Buenos Aires | — | 607,566 | — | — | — | — | — | — | — | 607,566 | ||||||||||
| Banco de la Ciudad de Buenos Aires | — | 2,021,133 | — | — | — | — | — | — | — | 2,021,133 | ||||||||||
| Banco de la Nación | — | — | — | — | — | 3,131 | — | — | — | 3,131 | ||||||||||
| Banco de la Provincia de Buenos Aires | — | 557,957 | — | — | — | — | — | — | — | 557,957 | ||||||||||
| Banco de Occidente | — | — | — | — | 1,756,857 | — | — | — | 1,756,857 | — | ||||||||||
| Banco do Brasil | 5,380,440 | — | — | — | — | — | — | — | 5,380,440 | — | ||||||||||
| Banco CR2 de Investimentos | — | — | — | — | — | 96,463 | — | — | — | 96,463 | ||||||||||
| Banco Fibra | — | — | — | — | — | 1,508,146 | — | — | — | 1,508,146 | ||||||||||
| Banco Ganadero | — | 8,678,548 | — | — | 8,971,296 | 16,580,167 | — | — | 8,971,296 | 25,258,715 | ||||||||||
| Banco HBSC | 10,177,647 | — | — | — | — | — | — | — | 10,177,647 | — | ||||||||||
| Banco Hermes | 3,372,502 | — | — | — | — | — | — | — | 3,372,502 | — | ||||||||||
| Banco Itau | 15,244,402 | 8,327,069 | — | — | — | — | — | — | 15,244,402 | 8,327,069 | ||||||||||
| Banco Lloyds | 8,105,115 | 1,301,529 | — | — | 4,507,076 | — | — | — | 12,612,191 | 1,301,529 | ||||||||||
| Banco Merrill Lynch | — | 755,385 | — | — | — | — | — | — | — | 755,385 | ||||||||||
| Banco Nacional del Lavoro | 2,578,272 | — | — | — | — | 658,772 | — | — | 2,578,272 | 658,772 | ||||||||||
| Banco Nationale de Paris | — | — | — | — | 1,487,398 | — | — | — | 1,487,398 | — | ||||||||||
| Banco Popular | — | — | — | — | 4,479,117 | — | — | — | 4,479,117 | — | ||||||||||
| Banco Real | — | — | — | — | — | 46,323 | — | — | — | 46,323 | ||||||||||
| Banco Río | 3,754,355 | — | — | — | 3,098,757 | 5,491,496 | — | — | 6,853,112 | 5,491,496 | ||||||||||
| Banco Safra | 2,068,814 | 1,865,149 | — | — | — | — | — | — | 2,068,814 | 1,865,149 | ||||||||||
| Banco Santander Central Hispano | 22,801,231 | 1,158,976 | — | — | 10,618,072 | 10,794,821 | — | — | 33,419,303 | 11,953,797 | ||||||||||
| Banco Santander Santiago | 2,108,612 | 466,791 | — | — | — | — | 2,430,119 | 2,426,485 | 4,538,731 | 2,893,276 | ||||||||||
| Banco Tequendama | — | — | — | — | 1,799,483 | — | — | — | 1,799,483 | — | ||||||||||
| Banco Union | — | — | — | — | 1,124,017 | — | — | — | 1,124,017 | — | ||||||||||
| Banco Wiese Sudameris | — | — | — | — | 1,349,131 | 13,754 | — | — | 1,349,131 | 13,754 | ||||||||||
| Bancolombia | — | — | — | — | 14,355,121 | — | — | — | 14,355,121 | — | ||||||||||
| Bank Boston | 5,804,448 | 8,610,036 | — | — | 17,965,061 | 3,272,497 | — | — | 23,769,509 | 11,882,533 | ||||||||||
| Bank of Tokio – Mitsubishi | 16,681,138 | — | — | — | — | — | — | — | 16,681,138 | — | ||||||||||
| Barings | 3,735,924 | — | — | — | — | — | — | — | 3,735,924 | — | ||||||||||
| Bndes | — | — | — | — | 14,430 | 16,682,218 | — | — | 14,430 | 16,682,218 | ||||||||||
| Bnp Paribas | — | — | — | — | — | 782 | — | — | — | 782 | ||||||||||
| Brandesco | 9,375,035 | — | — | — | — | — | — | — | 9,375,035 | — | ||||||||||
| Caixa General de Depósitos | — | — | 3,588,066 | 908,779 | — | — | — | — | 3,588,066 | 908,779 | ||||||||||
| Citibank | 8,112,588 | 13,856,057 | — | — | 17,349,476 | 9,798,002 | — | — | 25,462,064 | 23,654,059 | ||||||||||
| Colpatria | — | — | — | — | 4,500,851 | — | — | — | 4,500,851 | — | ||||||||||
| Compagnie Belge de la Webstlb | — | 899,322 | — | — | — | — | — | — | — | 899,322 | ||||||||||
| Conavi | — | — | — | — | 2,911,264 | — | — | — | 2,911,264 | — | ||||||||||
| Corfinsura | — | — | — | — | 2,060,670 | — | — | — | 2,060,670 | — | ||||||||||
| Deutsche Bank | — | 3,982 | — | — | — | — | — | — | — | 3,982 | ||||||||||
| Electrobras - Brasil | — | — | — | — | 5,603 | — | — | — | 5,603 | — | ||||||||||
| Interbank | — | 2,979 | — | — | 7,401 | 2,676 | — | — | 7,401 | 5,655 | ||||||||||
| JP Morgan | — | 20,009 | — | — | — | — | — | — | — | 20,009 | ||||||||||
| Unibanco | — | — | — | — | 2,106,620 | 17,554,534 | — | — | 2,106,620 | 17,554,534 | ||||||||||
| Total | 129,477,648 | 55,274,979 | 3,588,066 | 908,779 | 184,456,413 | 133,304,524 | 2,438,349 | 2,434,847 | 319,960,476 | 191,923,129 | ||||||||||
| Total principal | 123,003,765 | 54,539,235 | 3,408,662 | 904,198 | 175,233,592 | 129,518,291 | 2,438,160 | 2,426,483 | 304,084,179 | 187,388,207 | ||||||||||
| Weighted average annual interest rate | 8.20 | % | 3.91 | % | 5.00 | % | 3.00 | % | 15.93 | % | 10.88 | % | 3.00 | % | 9.00 | % | 10.40 | % | 8.75 | % |
| As of December 31, | ||||
| 2003 | 2004 | |||
| % | % | |||
| Percentage of debt in foreign currency: | 99.24 | % | 98.73 | % |
| Percentage of debt in local currency: | 0.76 | % | 1.27 | % |
| Total | 100.00 | % | 100.00 | % |
F - 46
ENERSIS S.A. AND SUBSIDIARIES
Notes to the Consolidated Financial Statements – (Continued)
| b) | Current portion of long-term debt due to banks and financial institutions: |
| Foreign currency | ||||||||||||||||||||||||
| US$ | Euros | Yen | Other foreign currency | Ch$ | As of December 31 | |||||||||||||||||||
| Financial Institution | 2003 | 2004 | 2003 | 2004 | 2003 | 2004 | 2003 | 2004 | 2003 | 2004 | 2003 | 2004 | ||||||||||||
| ThCh$ | ThCh$ | ThCh$ | ThCh$ | ThCh$ | ThCh$ | ThCh$ | ThCh$ | ThCh$ | ThCh$ | ThCh$ | ThCh$ | |||||||||||||
| ABN Amro Bank | 1,805,481 | 4,730,550 | — | — | — | — | — | — | — | — | 1,805,481 | 4,730,550 | ||||||||||||
| Bancafe | — | — | — | — | — | — | 75,553 | 1,246,090 | — | — | 75,553 | 1,246,090 | ||||||||||||
| Banca Intesa S.P.A. London Branch | 10,760 | — | — | — | — | — | — | — | — | — | 10,760 | — | ||||||||||||
| Banco Bayerische Landes | 345,966 | 627,273 | — | — | — | — | — | — | — | — | 345,966 | 627,273 | ||||||||||||
| Banco BBVA | 219,234 | 13,645 | — | — | — | — | — | — | — | — | 219,234 | 13,645 | ||||||||||||
| Banco Beal | 10,148,062 | — | — | — | — | — | — | — | — | — | 10,148,062 | — | ||||||||||||
| Banco Colpatria | — | — | — | — | — | — | 50,369 | 830,726 | — | — | 50,369 | 830,726 | ||||||||||||
| Banco Corfinsura | — | — | — | — | — | — | 201,474 | 3,322,906 | — | — | 201,474 | 3,322,906 | ||||||||||||
| Banco Davivienda | — | — | — | — | — | — | 163,192 | 2,492,844 | — | — | 163,192 | 2,492,844 | ||||||||||||
| Banco de Sabadell | 2,139 | — | — | — | — | — | — | — | — | — | 2,139 | — | ||||||||||||
| Banco do Brasil | 329,676 | 278,506 | — | — | — | — | 1,026,287 | 1,185,779 | — | — | 1,355,963 | 1,464,285 | ||||||||||||
| Banco do Estado do Ceará | — | — | — | — | — | — | — | 191,660 | — | — | — | 191,660 | ||||||||||||
| Banco do Nordeste do Brasil | — | — | — | — | — | — | 46,241 | 47,975 | — | — | 46,241 | 47,975 | ||||||||||||
| Banco Español de Crédito | 5,364 | — | — | — | — | — | 2,250 | — | — | — | 7,614 | — | ||||||||||||
| Banco Estado | 3,964 | — | — | — | — | — | — | — | 36,941,310 | 1,700,403 | 36,945,274 | 1,700,403 | ||||||||||||
| Banco Europeo de Investimentos | 918,901 | 845,785 | — | — | — | — | — | — | — | — | 918,901 | 845,785 | ||||||||||||
| Banco HBSC | 20,244 | — | — | — | — | — | — | — | — | — | 20,244 | — | ||||||||||||
| Banco Medio Crédito | — | — | — | — | — | — | 1,865,846 | 1,787,795 | — | — | 1,865,846 | 1,787,795 | ||||||||||||
| Banco Nacionale del Lavoro | — | — | — | — | — | — | — | 637,967 | — | — | — | 637,967 | ||||||||||||
| Banco Popular Español | 7,536 | — | — | — | — | — | — | — | — | — | 7,536 | — | ||||||||||||
| Banco San Paolo | 140,774 | — | — | — | — | — | — | — | — | — | 140,774 | — | ||||||||||||
| Banco Santander Central Hispano | 202,374 | 4,510,617 | — | — | — | — | — | — | — | — | 202,374 | 4,510,617 | ||||||||||||
| Banco Santander Santiago | 83,051 | — | — | — | — | — | — | — | — | — | 83,051 | — | ||||||||||||
| Bancolombia | — | — | — | — | — | — | 304,785 | 3,322,906 | — | — | 304,785 | 3,322,906 | ||||||||||||
| Banesto | 5,220,485 | — | — | — | — | — | — | — | — | — | 5,220,485 | — | ||||||||||||
| Bank Boston | — | — | — | — | 13,510,451 | — | — | — | — | — | 13,510,451 | — | ||||||||||||
| Bank of América | 47,599,342 | 15,424,717 | — | — | — | — | — | — | — | — | 47,599,342 | 15,424,717 | ||||||||||||
| Bank of Tokio – Mitsubishi | 6,034,645 | 5,398,730 | 126,861 | 125,395 | 435,146 | 412,818 | 422,655 | 415,332 | — | — | 7,019,307 | 6,352,275 | ||||||||||||
| Banque Nationale París | 12,057,091 | — | — | — | — | — | — | — | — | — | 12,057,091 | — | ||||||||||||
| Barings Bank | — | 1,166,638 | — | — | — | — | — | — | — | — | — | 1,166,638 | ||||||||||||
| Birf | — | — | — | — | — | — | 1,144,981 | — | — | — | 1,144,981 | — | ||||||||||||
| Bnp Paribas | — | 3,768,571 | — | — | — | — | — | — | — | — | — | 3,768,571 | ||||||||||||
| Bndes | — | — | — | — | — | — | 8,451,802 | 8,933,350 | — | — | 8,451,802 | 8,933,350 | ||||||||||||
| Caja de Ahorros y Monte de Piedad de Madrid | 121,425 | 13,644 | — | — | — | — | — | — | — | — | 121,425 | 13,644 | ||||||||||||
| Citibank N.A. | 10,509,911 | 5,685 | — | — | — | — | — | — | — | — | 10,509,911 | 5,685 | ||||||||||||
| Compagnie Belge de la Webstlb | — | 823,604 | — | — | — | — | — | — | — | — | — | 823,604 | ||||||||||||
| Conavi | — | — | — | — | — | — | 125,921 | 2,076,816 | — | — | 125,921 | 2,076,816 | ||||||||||||
| Credit Lyonnais N.Y. | 10,760 | — | — | — | — | — | — | — | — | — | 10,760 | — | ||||||||||||
| Dresner B. Luxemburg | 16,859 | — | — | — | — | — | — | — | — | — | 16,859 | — | ||||||||||||
| Deutsche Bank A.G. | 57,334 | 7,959 | — | — | — | — | — | — | — | — | 57,334 | 7,959 | ||||||||||||
| Export Develop. Corp. | 1,872,924 | 1,757,221 | — | — | — | — | — | — | — | — | 1,872,924 | 1,757,221 | ||||||||||||
| Granahorrar | — | — | — | — | — | — | 75,553 | 1,246,090 | — | — | 75,553 | 1,246,090 | ||||||||||||
| ING Bank N.V. | 10,760 | — | — | — | — | — | — | — | — | — | 10,760 | — | ||||||||||||
| Israel Discount Bank N.Y. | 1,724 | — | — | — | — | — | — | — | — | — | 1,724 | — | ||||||||||||
| J.P. Morgan Chase Bank | 323,089 | 30,974,021 | — | — | — | — | — | — | — | — | 323,089 | 30,974,021 | ||||||||||||
| Kreditanstal Fur Weideraubau | 355,648 | 321,924 | — | — | — | — | — | — | — | — | 355,648 | 321,924 | ||||||||||||
| Landesbank Rheiniland-Pfalz | 9,579 | — | — | — | — | — | — | — | — | — | 9,579 | — | ||||||||||||
| Mizuho Corporate Bank Ltd. | 4,310 | — | — | — | — | — | — | — | — | — | 4,310 | — | ||||||||||||
| Royal Bank of Canada | 10,758 | — | — | — | — | — | — | — | — | — | 10,758 | — | ||||||||||||
| Santander Investment Bank Ltd. | 3,134,095 | — | — | — | — | — | — | — | — | — | 3,134,095 | — | ||||||||||||
| Skandinaviska Enskilda Banken | 2,034,805 | 1,857,431 | — | — | — | — | — | — | — | — | 2,034,805 | 1,857,431 | ||||||||||||
| Societe Generale | 1,169,498 | — | — | — | — | — | — | — | — | — | 1,169,498 | — | ||||||||||||
| Westlb A.G. N.Y. Branch | 10,761 | — | — | — | — | — | — | — | — | — | 10,761 | — | ||||||||||||
| Unibanco | — | — | — | — | — | — | 57,382 | 4,437,572 | — | — | 57,382 | 4,437,572 | ||||||||||||
| Total | 104,809,329 | 72,526,521 | 126,861 | 125,395 | 13,945,597 | 412,818 | 14,014,291 | 32,175,808 | 36,941,310 | 1,700,403 | 169,837,388 | 106,940,945 | ||||||||||||
| Total principal | 100,743,284 | 70,524,435 | 124,781 | 124,218 | 13,934,061 | 411,782 | 12,990,012 | 30,295,455 | 36,708,402 | 1,614,382 | 164,500,540 | 102,970,272 | ||||||||||||
| Weighted average annual interest rate | 4.96 | % | 7.03 | % | 3.00 | % | 3.00 | % | 3.46 | % | 0.90 | % | 16.79 | % | 12.99 | % | 4.56 | % | 9.00 | % | 5.64 | % | 8.83 | % |
| As of December 31, | ||||
| 2003 | 2004 | |||
| % | % | |||
| Percentage of debt in foreign currency: | 78.25 | % | 98.41 | % |
| Percentage of debt in local currency: | 21.75 | % | 1.59 | % |
| Total | 100.00 | % | 100.00 | % |
F - 47
ENERSIS S.A. AND SUBSIDIARIES
Notes to the Consolidated Financial Statements – (Continued)
Note 16. Long-Term Portion of Debt Due to Banks and Financial Institutions
| As of December 31, 2004 | |||||||||||||||||||
| Total | Annual | ||||||||||||||||||
| After 1 year | After 2 years | After 3 years | After 5 years | Long-term | interest | Total | |||||||||||||
| Financial | but within | but within | but within | but within | portion | rate | long-term | ||||||||||||
| Institution | Currency | 2 years | 3 years | 5 years | 10 years | After 10 years | 2004 | average | portion - 2003 | ||||||||||
| ThCh$ | ThCh$ | ThCh$ | ThCh$ | Years | ThCh$ | ThCh$ | ThCh$ | ||||||||||||
| ABN Amro Bank | US$ | 5,335,062 | — | — | — | — | — | 5,335,062 | 4.00 | % | 8,521,030 | ||||||||
| Bancafe | $ Colom | — | — | 2,332,462 | — | — | — | 2,332,462 | 12.45 | % | 3,286,172 | ||||||||
| Banca Intesa S.P.A. | US$ | — | — | — | — | — | — | — | 0.00 | % | 5,825,219 | ||||||||
| Banco ABC Brasil | Rs | 324,963 | — | — | — | — | — | 324,963 | 2.18 | % | — | ||||||||
| Banco Bayerische Landes | US$ | 8,424,362 | — | — | — | — | — | 8,424,362 | 6.47 | % | 13,258,798 | ||||||||
| Banco BBVA | US$ | — | — | 83,610,000 | — | — | — | 83,610,000 | 2.94 | % | 85,207,379 | ||||||||
| Banco Colpatria | $ Colom | — | — | 1,554,974 | — | — | — | 1,554,974 | 12.45 | % | 2,190,781 | ||||||||
| Banco Estado | $ Reaj. | — | 1,698,508 | 1,008,580 | — | — | — | 2,707,088 | 9.00 | % | 4,473,332 | ||||||||
| Banco Español de Crédito | US$ | — | — | — | — | — | — | 0.00 | % | 2,903,969 | |||||||||
| Banco Europeo de Investimentos | US$ | 4,645,000 | 4,645,000 | 9,290,000 | 9,290,000 | — | — | 27,870,000 | 14.60 | % | 30,650,642 | ||||||||
| Banco Davivienda | $ Colom | — | — | 4,665,140 | — | — | — | 4,665,140 | 12.45 | % | 6,572,620 | ||||||||
| Banco de Colombia | $ Colom | — | 313,735 | — | — | — | — | 313,735 | 9.00 | % | — | ||||||||
| Banco de Sabadell | US$ | — | — | — | — | — | — | — | 0.00 | % | 1,158,131 | ||||||||
| Banco do Brasil | Rs | 2,209,682 | 1,104,841 | 2,209,682 | 3,550,835 | — | — | 9,075,040 | 17.86 | % | 8,738,080 | ||||||||
| US$ | 442,826 | 206,593 | 340,990 | 1,995,651 | — | — | 2,986,060 | 5.18 | % | 3,313,606 | |||||||||
| Banco Lloyd's | US$ | — | — | — | — | — | — | — | 0.00 | % | 7,073,031 | ||||||||
| Banco Medio Crédito | $ Arg | 1,768,301 | 1,768,300 | 3,536,601 | 2,652,453 | — | — | 9,725,655 | 1.75 | % | 11,978,742 | ||||||||
| Banco Nacionale de Paris | US$ | 3,456,151 | 3,456,151 | 6,202,860 | 4,559,730 | — | 911,946 | 18,586,838 | 5.78 | % | 64,608,902 | ||||||||
| $ Arg | 1,347,869 | — | — | — | — | — | 1,347,869 | 7.06 | % | — | |||||||||
| Banco Nacional del Lavoro | $ Arg | 636,494 | — | — | — | — | — | 636,494 | 9.70 | % | — | ||||||||
| Banco Popular Español | US$ | — | — | — | — | — | — | — | 0.00 | % | 4,079,381 | ||||||||
| Bancolombia | $ Colom | — | — | 6,219,897 | — | — | — | 6,219,897 | 12.45 | % | 8,763,125 | ||||||||
| US$ | — | — | — | — | — | — | — | 0.00 | % | 361,513 | |||||||||
| Banco Santander Central Hispano | US$ | 3,901,800 | — | 83,610,000 | — | — | — | 87,511,800 | 4.32 | % | 121,040,257 | ||||||||
| Banesto | US$ | 1,621,643 | 1,621,643 | 3,243,286 | 4,864,927 | — | — | 11,351,499 | 6.64 | % | 17,353,151 | ||||||||
| Bank of America | US$ | 8,506,342 | — | — | — | — | — | 8,506,342 | 7.42 | % | — | ||||||||
| Bank Tokio - Mitsubishi | US$ | — | — | — | — | — | — | — | 0.00 | % | 65,830,614 | ||||||||
| Libra | — | — | — | — | — | — | — | 0.00 | % | 412,208 | |||||||||
| Yen | — | — | — | — | — | — | — | 0.00 | % | 432,999 | |||||||||
| Euros | — | — | — | — | — | — | — | 0.00 | % | 124,781 | |||||||||
| Banco do Estado de Ceará | Rs | — | — | — | — | — | — | — | 0.00 | % | 177,321 | ||||||||
| Banco do Nordeste do Brasil | Rs | 39,632 | — | — | — | — | — | 39,632 | 7.74 | % | 83,733 | ||||||||
| Barings Bank | US$ | 624,288 | — | — | — | — | — | 624,288 | 6.98 | % | — | ||||||||
| BNDES | Rs | 28,697,984 | 9,731,771 | 5,359,587 | 34,044,251 | — | — | 77,833,593 | 16.32 | % | 87,722,501 | ||||||||
| Caja de Ahorros y Monte de Piedad de Madri | US$ | — | — | 83,610,000 | — | — | — | 83,610,000 | 2.94 | % | 45,648,375 | ||||||||
| Caixa General de Depósitos | Euros | 1,808,395 | — | — | — | — | — | 1,808,395 | 3.00 | % | — | ||||||||
| Citibank N.Y. | US$ | — | — | 83,610,000 | — | — | — | 83,610,000 | 2.94 | % | 24,516,394 | ||||||||
| Compagnie Belge de la Webstlb | US$ | 2,246,322 | 4,041,150 | — | — | — | — | 6,287,472 | 5.87 | % | — | ||||||||
| Conavi | $ Colom | — | — | 3,887,436 | — | — | — | 3,887,436 | 12.45 | % | 5,476,953 | ||||||||
| Corfinsura | $ Colom | — | — | 6,219,897 | — | — | — | 6,219,897 | 12.45 | % | 8,763,125 | ||||||||
| Credit Lyonnais N.Y. | US$ | — | — | — | — | — | — | — | 0.00 | % | 5,825,219 | ||||||||
| Deutsche Bank A.G. | US$ | 3,718,211 | 5,577,317 | — | — | — | — | 9,295,528 | 6.55 | % | 24,342,879 | ||||||||
| Dresdner Bank | US$ | — | — | — | — | — | — | — | 0.00 | % | 9,126,754 | ||||||||
| Export Develop. Corp. | US$ | 1,518,028 | 1,518,028 | 3,036,056 | 4,676,332 | — | — | 10,748,444 | 2.86 | % | 13,356,162 | ||||||||
| Granahorrar | $ Colom | — | — | 2,332,463 | — | — | — | 2,332,463 | 12.45 | % | 3,286,172 | ||||||||
| HBSC Bank | US$ | — | — | — | — | — | — | — | 0.00 | % | 10,959,017 | ||||||||
| ING Bank N.V. | US$ | — | — | — | — | — | — | — | 0.00 | % | 5,825,219 | ||||||||
| Israel Discount Bank of N.Y. | US$ | — | — | — | — | — | — | — | 0.00 | % | 933,418 | ||||||||
| J.P.Morgan Chase Bank | US$ | 22,964,880 | — | — | — | — | — | 22,964,880 | 7.23 | % | 48,691,600 | ||||||||
| Kreditanstal Fur Weideraubau | US$ | 266,802 | 266,802 | 533,605 | — | — | — | 1,067,209 | 4.85 | % | 1,498,278 | ||||||||
| Landesbank Rheinland Pflaz Giroz | US$ | — | — | — | — | — | — | — | 0.00 | % | 5,185,655 | ||||||||
| Mizuho Corporate Bank Ltd. | US$ | — | — | — | — | — | — | — | 0.00 | % | 2,333,544 | ||||||||
| Royal Bank of Canadá | US$ | — | — | — | — | — | — | — | 0.00 | % | 5,825,225 | ||||||||
| San Paolo IMI S.P.A. | US$ | — | — | — | — | — | — | — | 0.00 | % | 56,123,399 | ||||||||
| Skandinaviska Enskilda Banken | US$ | 1,381,678 | 1,381,678 | — | — | — | — | 2,763,356 | 0.65 | % | 5,029,074 | ||||||||
| Westlb A.G. N.Y. Branch | US$ | — | — | — | — | — | — | — | 0.00 | % | 5,825,217 | ||||||||
| Unibanco | Rs | 11,668,915 | 8,265,483 | — | — | — | — | 19,934,398 | 12.90 | % | 28,535 | ||||||||
| Total | 117,555,630 | 45,597,000 | 396,413,516 | 65,634,179 | — | 911,946 | 626,112,271 | 854,742,232 | |||||||||||
| As of December 31, | ||||
| 2003 | 2004 | |||
| % | % | |||
| Percentage of debt in local currency: | 0.52 | % | 0.43 | % |
| Percentage of debt in foreign currency: | 99.48 | % | 99.57 | % |
| Total | 100.00 | % | 100.00 | % |
F - 48
ENERSIS S.A. AND SUBSIDIARIES
Notes to the Consolidated Financial Statements – (Continued)
On May 15, 2003, Enersis S.A. and its subsidiary Empresa Nacional de Electricidad S.A. (Endesa Chile) subscribed syndicated loans to refinance bank debts in an amount of US$2,330 million with 32 banks.
Due to this refinancing, obligations with original maturities in 2003 and 2004, now come due in 2008, with principal payments starting in 2005.
The covenants which regulate these loans do not trigger prepayment of the obligations if the Company or its subsidiary Endesa Chile’s risk rating falls below investment grade.
On July 28, 2003, Enersis S.A. prepaid US$582 million of bank debt with resources from the sale of Río Maipo and its own capital increase.
On November 24, 2003, Enersis S.A. prepaid all the subscribed loan refinancing of May 2003; this prepayment was made mainly with funds from a new loan of US$500 million subscribed with six banks on November 14, 2003 and from the issuance and placement of bonds worth US$350 million on the United States market and a further US$155 million from other cash sources. This final payment released all the securities pledged to the first thirty two syndicated banks.
Similarly, in 2004 Endesa Chile has prepaid US$458 million with resources from the sale of assets and issuance and placement of bonds issued on October 3, 2003, and a new US$250 million credit agreement signed on February 4, 2004.
The Endesa Chile subsidiary new credit agreement includes a 3.5 year term with repayment when due and a 1.15% libor spread.
The operation was carried out without warranties, endorsements, or investment or indebtedness restrictions.
On April 15, 2004, Enersis S.A. prepaid US$150 million of the syndicated loan obtained in November, 2003, for US$500 million from the banks BSCH, Banco Bilbao Viscaya Argentaria, San Paolo IMI, Bank of Tokio Mitsubishi, Caja Madrid, and Deutsche Bank.
The remaining US$350 million balance was refinanced in November, 2004, through revolving overdraft lines whose term is 4 years. It is possible to prepay and draw down funds throughout the contract period. The interest (spread) depends on the corporate rating given by S & P. Currently, at BBB, the interest spread is 0.375%.
On November 10, 2004, Endesa Chile entered into a new credit for MUS$250 million, with which it prepaid the loan entered into on February 4, 2004.
The new Endesa Chile loan matures on November 11, 2010, and has a 0.375% Libor spread.
The operation was carried out without warranties, endorsements, or investment or indebtedness restrictions.
F - 49
ENERSIS S.A. AND SUBSIDIARIES
Notes to the Consolidated Financial Statements – (Continued)
| Note 17. | Other Current Liabilities |
| Other current liabilities are as follows: | |
| As of December 31, | ||||
| 2003 | 2004 | |||
| ThCh$ | ThCh$ | |||
| Advances and guarantee on construction | 126,179 | 36,439 | ||
| Taxes payables | 1,059,432 | 1,176,375 | ||
| Contingencies - third party claims | 19,856,908 | 22,566,897 | ||
| Customer advances | 2,511,740 | 2,149,780 | ||
| Azopardo provision | 3,129,150 | 3,265,161 | ||
| Accrued employees benefits - other | 1,727,176 | 1,891,739 | ||
| Forward contracts and swaps | 26,514,722 | 4,328,056 | ||
| Fair value - derivative contracts | 7,653,454 | 159,867 | ||
| Emergency energy provision (Brazil) | 1,666,302 | 1,896,193 | ||
| Other current liabilities | 2,749,793 | 3,710,167 | ||
| Total | 66,994,856 | 41,180,674 | ||
F - 50
ENERSIS S.A. AND SUBSIDIARIES
Notes to the Consolidated Financial Statements – (Continued)
| Note 18. | Bonds Payable |
a) Details of the current portion of bonds payable is as follows:
| As of December 31, | |||||||||||||||
| Face value | Interest | ||||||||||||||
| Instrument | Series | outstanding | Currency | rate | Maturity date | 2003 | 2004 | ||||||||
| % | ThCh$ | ThCh$ | |||||||||||||
| Bonos Edelnor | One | 4,891,900 | Soles | 9.61% | 01/02/2011 | 5,150 | 5,377 | ||||||||
| Bonos Edelnor | I°Prog. | 80,000,000 | Soles | VAC* + 7.5% | 01/07/2006 | 535,812 | 538,881 | ||||||||
| Bonos Edelnor | I°Prog. | 18,570,000 | Soles | VAC* + 6.2% | 26/04/2007 | 38,337 | 38,556 | ||||||||
| Bonos Edelnor | I°Prog. | 30,000,000 | Soles | 6.50% | 01/01/2004 | 5,425,020 | — | ||||||||
| Bonos Edelnor | I°Prog. | 20,000,000 | Soles | 6.34% | 24/01/2004 | 3,557,251 | — | ||||||||
| Bonos Edelnor | I°Prog. | 100,000,000 | Soles | VAC* + 639% | 10/10/2006 | 253,288 | 254,739 | ||||||||
| Bonos Edelnor | I°Prog. | 40,000,000 | Soles | 4.47% | 11/09/2007 | 95,993 | 92,761 | ||||||||
| Bonos Edelnor | I°Prog. | 30,000,000 | Soles | 5.86% | 15/01/2008 | — | 137,460 | ||||||||
| Bonos Edelnor | I°Prog. | 20,000,000 | Soles | 8.75% | 08/06/2009 | — | 17,774 | ||||||||
| Bonos Edelnor | I°Prog. | 20,000,000 | Soles | 6.25% | 15/01/2012 | — | 97,585 | ||||||||
| Bonos Edelnor | I°Prog. | 20,000,000 | Soles | VAC* + 5.4% | 22/04/2014 | — | 36,448 | ||||||||
| Bonos Edelnor | I°Prog. | 20,000,000 | Soles | VAC* + 6.5% | 01/06/2014 | — | 13,665 | ||||||||
| Bonos Edelnor | I°Prog. | 40,000,000 | Soles | VAC* + 6.5% | 01/06/2014 | — | 8,684 | ||||||||
| Bonos Codensa | B3 | 500,000,000,000 | $ Col. | 10.91% | 15/03/2009 | — | 71,050 | ||||||||
| Bonos Codensa | B5 | 200,000,000,000 | $ Col. | 12.09% | 15/03/2011 | — | 316,497 | ||||||||
| Bonos Codensa | B8 | 250,000,000,000 | $ Col. | 12.28% | 15/03/2014 | — | 402,350 | ||||||||
| Bonos Edesur | 5 | 7,488,161 | $ Arg | 8.50% | 05/04/2006 | — | 153,456 | ||||||||
| Bonos Edesur | 6 | 14,976,323 | $ Arg | 7.00% | 05/10/2007 | — | 5,744 | ||||||||
| Bonos Cerj | Unit | 294,000,000 | Reales | 20.64% | 01/06/2007 | — | 16,521,842 | ||||||||
| Bonos Coelce | Unit | 88,500,000 | Reales | CDI + 16% | 20/02/2012 | — | 2,979,255 | ||||||||
| Yankee Bonds - Enersis | One | 300,000,000 | US$ | 6.90% | 01/12/2006 | 1,049,913 | 961,515 | ||||||||
| Yankee Bonds - Enersis | Two | 350,000,000 | US$ | 7.40% | 01/12/2016 | 949,874 | 869,899 | ||||||||
| Yankee Bonds - Enersis | Three | 858,000 | US$ | 6.60% | 01/12/2026 | 2,872 | 2,630 | ||||||||
| Yankee Bonds II - Enersis | One | 350,000,000 | US$ | 7.38% | 01/12/2014 | 1,571,066 | 6,743,476 | ||||||||
| Bono N° 269 | B-1 | 41,174 | U.F. | 5.50% | 15/06/2009 | 156,578 | 72,621 | ||||||||
| Bono N° 269 | B-2 | 1,935,000 | U.F. | 5.75% | 15/06/2022 | 79,277 | 79,158 | ||||||||
| Bonos Endesa | One | 230,000,000 | US$ | 7.88% | 01/02/2027 | 4,105,260 | 3,771,380 | ||||||||
| Bonos Endesa | Two | 220,000,000 | US$ | 7.33% | 01/02/2037 | 4,086,799 | 3,742,710 | ||||||||
| Bonos Endesa | Three | 200,000,000 | US$ | 8.13% | 01/02/2097 | 788,936 | 802,816 | ||||||||
| Bonos Endesa | One | 400,000,000 | US$ | 7.75% | 15/07/2008 | 8,647,831 | 7,919,724 | ||||||||
| Bonos Endesa | One | 400,000,000 | US$ | 8.50% | 01/04/2009 | 5,173,483 | 4,737,900 | ||||||||
| Bonos Endesa | E-1 y E-2 | 6,000,000 | U.F. | 6.20% | 01/08/2006 | 2,647,755 | 2,643,780 | ||||||||
| Bonos Endesa | C2;D1 Y D2 | 1,115,287 | U.F. | 6.80% | 01/11/2010 | 2,665,953 | 2,800,303 | ||||||||
| Bonos Endesa | F | 1,500,000 | U.F. | 6.20% | 01/08/2022 | 661,939 | 660,946 | ||||||||
| Bonos Endesa | 144A | 400,000,000 | US$ | 8.35% | 01/08/2013 | 8,865,590 | 7,757,150 | ||||||||
| Bonos Endesa | 144A | 200,000,000 | US$ | 8.63% | 01/08/2015 | 4,579,317 | 4,006,313 | ||||||||
| Bonos Endesa | G | 4,000,000 | U.F. | 4.80% | 15/10/2010 | 685,589 | 684,563 | ||||||||
| Bonos Endesa | H | 4,000,000 | U.F. | 6.20% | 15/10/2008 | 882,578 | 881,259 | ||||||||
| Bonos Betania | B | 300,000,000,000 | $ Col. | 12.04% | 10/11/2011 | — | 1,197,295 | ||||||||
| Bonos Edegel | One | 30,000,000 | US$ | 8.75% | 03/06/2006 | 126,048 | 115,423 | ||||||||
| Bonos Edegel | Two | 30,000,000 | US$ | 8.41% | 14/02/2007 | 585,137 | 535,871 | ||||||||
| Bonos Edegel | Three | 30,000,000 | US$ | 8.75% | 13/06/2007 | 82,583 | 75,622 | ||||||||
| Bonos Edegel | Four | 20,000,000 | US$ | 8.46% | 21/11/2005 | 114,631 | 11,252,968 | ||||||||
| Bonos Edegel | Five B | 35,000,000 | Soles | 6.00% | 22/02/2004 | 5,381,578 | — | ||||||||
| Bonos Edegel | One A | 100,000,000 | Soles | 6.00% | 06/06/2005 | 70,282 | 17,046,287 | ||||||||
| Bonos Edegel | Three A | 50,000,000 | Soles | 4.13% | 04/09/2006 | 116,771 | 112,835 | ||||||||
| Bonos Edegel | Three B | 50,000,000 | Soles | 4.88% | 30/10/2006 | 72,570 | 68,975 | ||||||||
| Bonos Edegel | Four A | 50,000,000 | Soles | 4.75% | 12/12/2006 | 22,915 | 20,162 | ||||||||
| Bonos Edegel | 5 A 2° issue | 10,000,000 | US$ | 3.75% | 26/01/2009 | — | 89,416 | ||||||||
| Bonos Edegel | 6 A 2° issue | 30,000,000 | Soles | 5.88% | 27/02/2008 | — | 102,242 | ||||||||
| Bonos Edegel | 6 B 2° issue | 20,000,000 | Soles | 8.50% | 18/06/2008 | — | 10,423 | ||||||||
| Bonos Edegel | 7 A 2° issue | 10,000,000 | US$ | 4.78% | 26/07/2009 | — | 88,492 | ||||||||
| Bonos Emgesa | A-1 | 15,000,000,000 | $ Col. | 9.89% | 26/07/2006 | 60,416 | 63,581 | ||||||||
| Bonos Emgesa | B-5 | 12,750,000,000 | $ Col. | 9.97% | 09/10/2004 | 2,857,948 | — | ||||||||
| Bonos Emgesa | B-7 | 19,500,000,000 | $ Col. | 10.29% | 09/10/2006 | 102,361 | 108,803 | ||||||||
| Bonos Emgesa | B-10 | 229,825,000,000 | $ Col. | 10.60% | 09/10/2009 | 1,243,574 | 1,322,078 | ||||||||
| Bonos Emgesa | B-10 | 60,000,000,000 | $ Col. | 10.57% | 10/11/2009 | 201,756 | 209,129 | ||||||||
| Bonos Emgesa | C-10 | 7,701,962,000 | $ Col. | 9.88% | 09/10/2009 | 75,532 | 85,246 | ||||||||
| Bonos Emgesa | C-10 | 19,777,918,000 | $ Col. | 10.25% | 08/10/2009 | 40,901 | 46,172 | ||||||||
| Bonos Emgesa | B-10 2° issue | 50,000,000,000 | $ Col. | 15.18% | 26/07/2006 | 1,193,394 | 1,009,389 | ||||||||
| Bonos Emgesa | B-1 | 85,000,000,000 | $ Col. | 13.95% | 26/07/2006 | 1,215,623 | 1,188,391 | ||||||||
| Endesa Chile Internacional | Unit | 150,000,000 | US$ | 7.20% | 01/04/2006 | 1,643,342 | 1,504,980 | ||||||||
| Total | 72,718,823 | 107,084,047 | |||||||||||||
F-51
ENERSIS S.A. AND SUBSIDIARIES
Notes to the Consolidated Financial Statements – (Continued)
| b) | Details of the long-term portion of bonds payable is as follows as of: |
| As of December 31, | |||||||||||||||
| Instrument | Series | Face value outstanding | Currency | Interest rate | Maturity date | 2003 | 2004 | ||||||||
| % | ThCh$ | ThCh$ | |||||||||||||
| Bonos Edelnor | One | 4,891,900 | Soles | 9.61 | % | 01/02/2011 | 859,783 | 830,818 | |||||||
| Bonos Edelnor | I°Prog. | 80,000,000 | Soles | VAC* + 7.5 | % | 01/07/2006 | 14,431,400 | 14,514,766 | |||||||
| Bonos Edelnor | I°Prog. | 18,570,000 | Soles | VAC* + 6.2 | % | 26/04/2007 | 3,379,519 | 3,398,881 | |||||||
| Bonos Edelnor | I°Prog. | 100,000,000 | Soles | VAC* + 6.9 | % | 10/10/2006 | 18,103,830 | 18,206,859 | |||||||
| Bonos Edelnor | I°Prog. | 40,000,000 | Soles | 4.47 | % | 11/09/2007 | 7,030,264 | 6,793,418 | |||||||
| Bonos Edelnor | I°Prog. | 30,000,000 | Soles | 5.86 | % | 15/01/2008 | — | 5,095,064 | |||||||
| Bonos Edelnor | I°Prog. | 20,000,000 | Soles | 8.75 | % | 08/06/2009 | — | 3,396,709 | |||||||
| Bonos Edelnor | I°Prog. | 20,000,000 | Soles | 6.25 | % | 15/01/2012 | — | 3,396,709 | |||||||
| Bonos Edelnor | I°Prog. | 20,000,000 | Soles | VAC* + 5.4 | % | 22/04/2014 | — | 3,447,326 | |||||||
| Bonos Edelnor | I°Prog. | 20,000,000 | Soles | VAC* + 6.5 | % | 01/06/2014 | — | 3,440,132 | |||||||
| Bonos Edelnor | I°Prog. | 40,000,000 | Soles | VAC* + 6.5 | % | 01/06/2014 | — | 6,868,319 | |||||||
| Bonos Codensa | B3 | 500,000,000,000 | $ Col. | 10.91 | % | 15/03/2009 | — | 11,662,308 | |||||||
| Bonos Codensa | B5 | 200,000,000,000 | $ Col. | 12.09 | % | 15/03/2011 | — | 46,649,231 | |||||||
| Bonos Codensa | B8 | 250,000,000,000 | $ Col. | 12.28 | % | 15/03/2014 | — | 58,311,539 | |||||||
| Bonos Edesur | 5 | 7,488,161 | $ Arg | 8.50 | % | 05/04/2006 | — | 7,488,161 | |||||||
| Bonos Edesur | 6 | 14,976,323 | $ Arg | 7.00 | % | 05/10/2007 | — | 14,976,323 | |||||||
| Bonos Cerj | Unit | 294,000,000 | Reales | 20.64 | % | 01/06/2007 | — | 46,303,253 | |||||||
| Bonos Coelce | Unit | 88,500,000 | Reales | CDI + 16 | % | 20/02/2012 | — | 16,846,109 | |||||||
| Yankee Bonds - Enersis | One | 300,000,000 | US$ | 6.90 | % | 01/12/2006 | 182,593,500 | 167,220,000 | |||||||
| Yankee Bonds - Enersis | Two | 350,000,000 | US$ | 7.40 | % | 01/12/2016 | 151,999,350 | 139,201,732 | |||||||
| Yankee Bonds - Enersis | Three | 858,000 | US$ | 6.60 | % | 01/12/2026 | 522,217 | 478,249 | |||||||
| Yankee Bonds II - Enersis | One | 350,000,000 | US$ | 7.38 | % | 01/12/2014 | 213,025,750 | 195,090,000 | |||||||
| Bono N° 269 | B-1 | 41,174 | U.F. | 5.50 | % | 15/06/2009 | 696,053 | 642,009 | |||||||
| Bono N° 269 | B-2 | 1,935,000 | U.F. | 5.75 | % | 15/06/2022 | 33,558,705 | 33,508,492 | |||||||
| Bonos Endesa | One | 230,000,000 | US$ | 7.88 | % | 01/02/2027 | 125,308,441 | 114,758,069 | |||||||
| Bonos Endesa | Two | 220,000,000 | US$ | 7.33 | % | 01/02/2037 | 133,901,900 | 122,628,000 | |||||||
| Bonos Endesa | Three | 200,000,000 | US$ | 8.13 | % | 01/02/2097 | 24,598,997 | 22,527,879 | |||||||
| Bonos Endesa | One | 400,000,000 | US$ | 7.75 | % | 15/07/2008 | 243,458,000 | 222,960,000 | |||||||
| Bonos Endesa | One | 400,000,000 | US$ | 8.50 | % | 01/04/2009 | 243,458,000 | 222,960,000 | |||||||
| Bonos Endesa | E-1 y E-2 | 6,000,000 | U.F. | 6.20 | % | 01/08/2006 | 104,058,000 | 103,902,300 | |||||||
| Bonos Endesa | C2; D1 Y D2 | 1,115,287 | U.F. | 6.80 | % | 01/11/2010 | 18,103,889 | 15,477,997 | |||||||
| Bonos Endesa | F | 1,500,000 | U.F. | 6.20 | % | 01/08/2022 | 26,014,500 | 25,975,575 | |||||||
| Bonos Endesa | 144A | 400,000,000 | US$ | 8.35 | % | 01/08/2013 | 243,458,000 | 222,960,000 | |||||||
| Bonos Endesa | 144A | 200,000,000 | US$ | 8.63 | % | 01/08/2015 | 121,729,000 | 111,480,000 | |||||||
| Bonos Endesa | G | 4,000,000 | U.F. | 4.80 | % | 15/10/2010 | 69,372,000 | 69,268,200 | |||||||
| Bonos Endesa | H | 4,000,000 | U.F. | 6.20 | % | 15/10/2008 | 69,372,000 | 69,268,200 | |||||||
| Bonos Betania | B | 300,000,000,000 | $ Col. | 12.04 | % | 10/11/2011 | — | 69,973,766 | |||||||
| Bonos Edegel | One | 30,000,000 | US$ | 8.75 | % | 03/06/2006 | 18,259,350 | 16,722,000 | |||||||
| Bonos Edegel | Two | 30,000,000 | US$ | 8.41 | % | 14/02/2007 | 18,259,350 | 16,722,000 | |||||||
| Bonos Edegel | Three | 30,000,000 | US$ | 8.75 | % | 13/06/2007 | 18,259,350 | 16,722,000 | |||||||
| Bonos Edegel | Four | 20,000,000 | US$ | 8.46 | % | 21/11/2005 | 12,172,900 | — | |||||||
| Bonos Edegel | One A | 100,000,000 | Soles | 6.00 | % | 06/06/2005 | 17,570,585 | — | |||||||
| Bonos Edegel | Three A | 50,000,000 | Soles | 4.13 | % | 04/09/2006 | 8,785,291 | 8,489,187 | |||||||
| Bonos Edegel | Three B | 50,000,000 | Soles | 4.88 | % | 30/10/2006 | 8,785,291 | 8,489,187 | |||||||
| Bonos Edegel | Four A | 50,000,000 | Soles | 4.75 | % | 12/12/2006 | 8,785,291 | 8,489,187 | |||||||
| Bonos Edegel | 5 A 2° issue | 10,000,000 | US$ | 3.75 | % | 26/01/2009 | — | 5,574,000 | |||||||
| Bonos Edegel | 6 A 2° issue | 30,000,000 | Soles | 5.88 | % | 27/02/2008 | — | 5,093,511 | |||||||
| Bonos Edegel | 6 B 2° issue | 20,000,000 | Soles | 8.50 | % | 18/06/2008 | — | 3,395,675 | |||||||
| Bonos Edegel | 7 A 2° issue | 10,000,000 | US$ | 4.78 | % | 26/07/2009 | — | 5,574,000 | |||||||
| Bonos Emgesa | A-1 | 15,000,000,000 | $ Col. | 9.89 | % | 26/07/2006 | 3,286,172 | 3,498,692 | |||||||
| Bonos Emgesa | B-1 | 85,000,000,000 | $ Col. | 13.95 | % | 26/06/2006 | 18,621,639 | 19,825,842 | |||||||
| Bonos Emgesa | B-7 | 19,500,000,000 | $ Col. | 10.29 | % | 09/10/2006 | 4,272,023 | 4,548,300 | |||||||
| Bonos Emgesa | B-10 | 229,825,000,000 | $ Col. | 10.60 | % | 09/10/2009 | 50,349,935 | 53,605,777 | |||||||
| Bonos Emgesa | B-10 | 60,000,000,000 | $ Col. | 10.57 | % | 10/11/2009 | 13,144,687 | 13,994,769 | |||||||
| Bonos Emgesa | C-10 | 7,701,962,000 | $ Col. | 9.88 | % | 09/10/2009 | 3,163,907 | 3,570,852 | |||||||
| Bonos Emgesa | C-10 | 19,777,918,000 | $ Col. | 10.25 | % | 08/10/2009 | 1,777,815 | 2,006,479 | |||||||
| Bonos Emgesa | B-10 2° issue | 50,000,000,000 | $ Col. | 15.18 | % | 26/07/2006 | 10,953,905 | 11,662,258 | |||||||
| Bonos Endesa Chile Internacional | Unit | 150,000,000 | US$ | 7.20 | % | 01/04/2006 | 91,296,751 | 83,610,000 | |||||||
| Total | 2,356,777,340 | 2,493,500,109 | |||||||||||||
| * | VAC (“Valor de activación constante”) is issued by the Banco Central de Reserva del Perú and calculated based in the inflation rate (represents an inflation-indexed new Peruvian Sol). |
| Year | % | |||
| 2003 | 1.87 | |||
| 2004 | 4.08 |
F - 52
ENERSIS S.A. AND SUBSIDIARIES
Notes to the Consolidated Financial Statements – (Continued)
| c) | Bonds payable consist of the following: | |
| (1) | Enersis S.A. Series B1-B2 | |
| On September 11, 2001, Enersis S.A. registered two series of bearer bonds dated June 14, 2001, as follows: | ||
| Series | Total amount In UF | No. of bonds per series | Face value in UF | |||||
| B1 | 1,000,000 | 1,000 | 1,000 | |||||
| B1 | 3,000,000 | 300 | 10,000 | |||||
| B2 | 1,000,000 | 1,000 | 1,000 | |||||
| B2 | 1,500,000 | 150 | 10,000 |
| The scheduled maturity of the Series B-1 bonds is 8 years, interest and principal payable semi-annually. Annual interest is 5.50%, compounded semi-annually. | ||
| The scheduled maturity of the Series B-2 bonds is 21 years, principal payments beginning after 5 years, interest and principal payable semi-annually. Annual interest is 5.75%, compounded semi-annually. | ||
| In November 2003, these series were voluntarily exchanged for shares in connection with Enersis’ capital increase approved on March 31, 2003. Holders converted ThCh$63,656,587 (historical) into the equivalent of 893,612,466 first issue shares; the amounts underwritten were determined by experts and the following amounts were capitalized Ch$46,964,178,894 for series B1 and Ch$7,028,065,024 (historical) for series B2. (See Note 22 (a.)) | ||
| (2) | Enersis S.A. (Yankee Bonds) | |
| On November 21, 1996, the Company, acting through its agency in the Cayman Islands, issued corporate notes (Yankee Bonds) for US$800 million in three series, as follows: |
| Series | Total amount in US$ | Years to maturity | Stated annual interest rate | |||||
| 1 | 300,000,000 | 10 | 6.9 | % | ||||
| 2 | 350,000,000 | 20 | 7.4 | % | ||||
| 3 | 150,000,000 | 30 | 6.6 | % |
| Interest is payable on a semi-annual basis and principal is due upon maturity. The Series 3 bond holders have a pre-redemption option in year seven, which was exercised by nearly all holders in November 2003 for US$149,142,000. | |||
| During the second half of 2004, debts have been re-nominated through UF/US$swap contracts for an amount of US$100,000,000 associated to the tranche 1 bond and US$250,000,000 associated to tranche 2. | |||
| Repurchase of Yankee Bonds | |||
| Enersis Internacional, a 100% subsidiary of Enersis during November 2001 made a tender offer to repurchase all or a portion of the Series 2 Yankee Bonds. The offer expired November 21, 2001 and Enersis Internacional repurchased a total of US$100,266,000 in bonds with accrued interest, at a price of US$95,536,000. | |||
F - 53
ENERSIS S.A. AND SUBSIDIARIES
Notes to the Consolidated Financial Statements – (Continued)
| (3) | International Bonds (Yankee Bonds II) | |
| On November 24, 2003, the Company, through its Cayman Islands Agency, issued and placed Yankee Bonds on the American market for US$350 million. This placement was made in a single tranche, whose features are as follows: |
| Total amount | Years to | Stated annual | ||||||
| Series | in US$ | maturity | interest rate | |||||
| 1 | 350.000.000 | 10 | 7.38 | % | ||||
| Interest is paid six-monthly and amortization of capital is a single installment at the end of the term. | ||||||||
| During 2004 second half, debts have been re-nominated through US$/UF swap contracts for the total of this issue. | ||||||||
| (4) | Bonds of Chilectra S.A. | |
| On October 13, 2003, Chilectra S.A. registered, in the Superintendency of Securities and Insurance, 2 lines of bonds corresponding to Nº 347 and 348 for a maximum line amount of UF4,200,000 and UF4,000,000 respectively; the placement has a maturity of 10 years from August 22, 2003. To date, the placement of the related bonds has not been made. | ||
| (5) | Edelnor Bonds (Subsidiary of Distrilima S.A.) |
| First issue | ||||
| Date of Issue | : | March 1, 1996 | ||
| Number of bonds subscribed | : | 49,919 | ||
| Face value | : | 100 soles each | ||
| Redemption term | : | 15 years | ||
| Interest rate | : | 9.6136% annual | ||
| Interest payment | : | Annually, on coupon maturity | ||
| Principal amortization | : | Amortization of total principal upon maturity | ||
| Second issue | ||||
| Date of Issue | : | November 10, 1998 | ||
| Number of bonds subscribed | : | 146,300 | ||
| Face value | : | 1,000 soles each | ||
| Redemption term | : | 4 years | ||
| Interest rate | : | 14.396% annual | ||
| Interest payment | : | Accrued and paid within 90 days | ||
| Anticipated redemption option | : | Early redemption option | ||
| At December 31, 2004, this issue is totally cancelled. | ||||
| Third issue | ||||
| Date of Issue | : | August 7, 1998 | ||
| Number of bonds subscribed | : | 15,000 | ||
| Face value | : | US$1,000 each | ||
| Redemption term | : | 3 years | ||
| Interest rate | : | 7.7% annual | ||
| Interest payment | : | Accrued and paid within 90 days | ||
| At December 31, 2004, this issue is totally cancelled. | ||||
F - 54
ENERSIS S.A. AND SUBSIDIARIES
Notes to the Consolidated Financial Statements – (Continued)
| First program of Corporate Bonds | |||
| First issue | |||
| Date of Issue | : | October 29, 2001 | |
| Number of bonds subscribed | : | 146,300 | |
| Face value | : | 30,000 soles each | |
| Redemption term | : | 5 years | |
| Interest rate | : | 7.5% + VAC | |
| Interest payment | : | Semi-annual | |
| Second issue | |||
| Date of Issue | : | October 19, 2001 | |
| Number of bonds subscribed | : | 20,000 | |
| Face value | : | 5,000 new soles each | |
| Redemption term | : | 5 years | |
| Interest rate | : | 6.9% annual + VAC | |
| Interest payment | : | Semi-annual | |
| Third issue | |||
| Date of issue | : | January 24, 2002 | |
| Number of bonds subscribed | : | 6,000 | |
| Face value | : | 5,000 (new soles each) | |
| Redemption term | : | 2 years | |
| Interest rate | : | 6.5 % annual | |
| Interest payment | : | Semi-annual | |
| Fourth issue | |||
| Date of issue | : | April 24, 2002 | |
| Number of bonds subscribed | : | 4,000 | |
| Face value | : | 5,000 (new soles each) | |
| Redemption term | : | 2 years | |
| Interest rate | : | 6.34 % annual | |
| Interest payment | : | Semi-annual | |
| Fifth issue | |||
| Date of issue | : | March 1, 2003 | |
| Number of bonds subscribed | : | 3,714 | |
| Face value | : | 5,000 (new soles each) | |
| Redemption term | : | 4 years | |
| Interest rate | : | 6.2 % annual + VAC | |
| Interest payment | : | Semi-annual | |
| Sixth issue | |||
| Date of issue | : | September 12, 2003 | |
| Number of bonds subscribed | : | 8,000 | |
| Face value | : | 5,000 (new soles each) | |
| Redemption term | : | 4 years | |
| Interest rate | : | 4.46875 % annual | |
| Interest payment | : | Semi-annual | |
| Seventh issue | |||
| Date of issue | : | January 16, 2004. | |
| Number of bonds subscribed | : | 6,000 bonds. | |
| Nominal value | : | 5,000 (new soles) each. | |
| Term | : | 4 years. | |
| Interest rate | : | 5.86%. | |
| Interest payment | : | Semi-annual. |
F - 55
ENERSIS S.A. AND SUBSIDIARIES
Notes to the Consolidated Financial Statements – (Continued)
| Eighth issue | |||
| Date of issue | : | January 16, 2004. | |
| Number of bonds subscribed | : | 4,000 bonds. | |
| Nominal value | : | 5,000 (new soles) each. | |
| Term | : | 8 years. | |
| Interest rate | : | 6.25%. | |
| Interest payment | : | Semi-annual. | |
| Ninth issue | |||
| Date of issue | : | April 22, 2004. | |
| Number of bonds subscribed | : | 4,000 bonds. | |
| Nominal value | : | 5,000 (new soles) each. | |
| Term | : | 10 years. | |
| Interest rate | : | VAC + 5.4375%. | |
| Interest payment | : | Semi-annual. | |
| Tenth issue | |||
| Date of issue | : | June 9, 2004. | |
| Number of bonds subscribed | : | 4,000 bonds. | |
| Nominal value | : | 5,000 (new soles) each. | |
| Term | : | 5 years. | |
| Interest rate | : | 8.75%. | |
| Interest payment | : | Semi-annual. | |
| Eleventh issue | |||
| Date of issue | : | June 9, 2004. | |
| Number of bonds subscribed | : | 4,000 bonds. | |
| Nominal value | : | 5,000 (new soles) each. | |
| Term | : | 10 years. | |
| Interest rate | : | VAC + 6.50%. | |
| Interest payment | : | Semi-annual. | |
| Twelfth issue | |||
| Date of issue | : | June 24, 2004. | |
| Number of bonds subscribed | : | 8,000 bonds. | |
| Nominal value | : | 5,000 (new soles) each. | |
| Term | : | 10 years. | |
| Interest rate | : | VAC + 6.50%. | |
| Interest payment | : | Semi-annual. | |
| (6) | Codensa S.A. | ||
| Codensa S.A. issued bonds on March 11, 2004. | |||
| First Issue | |||
| Issuer | : | Codensa. | |
| Issued securities | : | Securities negotiable in Colombian pesos. | |
| Amount issued | : | 500,000,000,000 Colombian pesos. | |
| 1st principal payment | : | maturity in 2009 for 50,000,000,000 Colombian pesos. | |
| Nominal interest rate | : | 10.91% average annual rate. | |
| Interest payment | : | Quarterly. | |
| Interest earned at the closing of the year is ThCh$71,050, and | |||
| is presented in current liabilities. | |||
| 2nd principal payment | : | Maturity in 2011 for 200,000,000,000 Colombian pesos. | |
| Nominal interest rate | : | 12.09% average annual rate. |
F - 56
ENERSIS S.A. AND SUBSIDIARIES
Notes to the Consolidated Financial Statements – (Continued)
| Interest payment | : | Quarterly. | |
| Interest earned at the closing of the year is ThCh$316,497, and is | |||
| presented in current liabilities. | |||
| 3rd principal payment | : | Maturity in 2014 for 250,000,000,000 Colombian pesos. | |
| Nominal interest rate | : | 12.28% average annual rate. | |
| Interest payment | : | Quarterly. | |
| Interest earned at the closing of the year is ThCh$402,350, and is | |||
| presented in the current liabilities. | |||
| (7) | Edesur S.A. | ||
| On October 5, 2004, under its medium-term certificate of indebtedness issue program, Edesur S.A. issued negotiable liabilities in Argentinean pesos for a total amount of ThUS$40,302 in two 18-month series (class 5) and 1-3-year series (class 6), respectively. | |||
| Issuer | : | Edesur S.A. | |
| Issued securities | : | Negotiable liabilities in Argentinean pesos. | |
| Amount issued | : | ThUS$13,434. | |
| Principal due | : | Maturity in 2006. | |
| Nominal interest rate | : | 8.5% average annual rate. | |
| Interest payment | : | Semi-annual. | |
| Issuer | : | Edesur S.A. | |
| Issued securities | : | Negotiable liabilities in Argentinean pesos. | |
| Amount issue | : | ThUS$26,868. | |
| Principal due | : | Maturity in 2007. | |
| Nominal interest rate | : | 4.0% minimum annual nominal rate. | |
| Interest payment | : | Quarterly. | |
| (8) | Compañía de Electricidade do Rio de Janeiro S.A. | ||
| On July 28, 2004, Compañía de Electricidade do Rio de Janeiro S.A. issued liabilities in reales for a total amount of R$294,000,000 in a 3-year term series. | |||
| Issuer | : | Compañía de Electricidade do Rio de Janeiro S.A. S.A. | |
| Issued securities | : | Negotiable liabilities in Brazilian reales. | |
| Amount issue | : | R$294,000,000. | |
| Principal due | : | Maturity in 2007. | |
| Nominal interest rate | : | 20.64% average annual rate. | |
| Interest payment | : | Quarterly. | |
| (9) | Coelce S.A. | ||
| On February 29, 2004, Coelce S.A. issued liabilities in reales for a total amount of MR$88,500 in a 12-year term series. | |||
| Issuer | : | Coelce S.A. | |
| Issued securities | : | Negotiable securities in Brazilian reales. | |
| Amount issued | : | ThR$88,500. | |
| Principal due | : | Maturity in 2012. | |
| Nominal interest rate | : | CDI + 16%. | |
| Interest payment | : | Semi-annual. |
F - 57
ENERSIS S.A. AND SUBSIDIARIES
Notes to the Consolidated Financial Statements – (Continued)
| (10) | Endesa Chile S.A. |
| (i) | Our Subsidiary Endesa - Chile S.A. currently has two outstanding public bond issues on the domestic market on the following dates: | |
| • | On December 7 1990, it registered the third issuance of bonds worth U.F. 4,000,000 under No. 131. U.F. 2,030,000 of this issue had been placed at December 31, 1997. The remaining balance of U.F. 1,970,000 has been cancelled, because its placement deadline has expired. | |
| • | On August 9 2001, it registered the fourth bond issuance worth U.F: 7,500,000 under No. 264; this was totally placed at December 31, 2001. | |
| • | On November 26 2002, it registered the fifth bond issuance worth U.F. 8,000,000 under Nos. 317 and 318 and then amended it on October 2, 2003; this issue was totally placed at December 31, 2003. | |
| Risk rating of the issued bonds is as follows as of December 31, 2004: | |||
| Category | |||
| – | Feller-Rate Clasificadora de Riesgo Ltda. | A+ | |
| – | Comisión Clasificadora de Riesgo | A+ | |
| – | Fitch Chile Clasificadora de Riesgo Ltda. | A+ | |
ISSUANCE TERMS
| Third Issuance | ||
| Issuer | : | Empresa Nacional de Electricidad S.A. |
| Securities issued | : | Bearer bonds in local currency, denominated in Unidades de Fomento |
| Issuance Value | : | Four million Unidades de Fomento (UF4,000,000) divided into: |
| – Series C-1: 120 bonds at UF10,000 each | ||
| – Series C-2: 800 bonds at UF1,000 each | ||
| – Series D-1: 120 bonds at UF10,000 each | ||
| – Series D-2: 800 bonds at UF1,000 each | ||
| Indexation | : | Based on variations in Unidad de Fomento index |
| Amortization period | : | Series C-1 and C-2:15 years (5-year grace year and 10 years to pay off principal). |
| Series D-1 and D-2:20 years (5-year grace year and 15 years to pay off principal). | ||
| Capital amortization | : | Series C-1 and C-2:20 consecutive installments payable semi-annually, starting April 1, 1996. Series D-1 and D-2: 30 consecutive installments payable semi-annually, starting May 1, 1996. Paydown installments are incremental |
| Early Redemption | : | As elected by the issuer, starting May 1, 1996 and only on the interest payment and amortization dates. |
| Nominal interest rate | : | 6.8% annually upon expiration, compound and actual rate per semester on outstanding principal, readjusted by the value of the Unidad de Fomento. |
| The applicable semi-annual interest rate will be equal to 3.34409%. | ||
| Interest Payments | : | Interest will be paid semi-annually each May 1 and November 1, starting May 1, 1991. |
| Accrued interest as of December 31, 2004, 2003 and 2002 amounts to ThCh$201,501, | ||
| ThCh$228,969 and ThCh$254,277 respectively, and is shown under current liabilities. | ||
| Guarantee | : | There is no specific collateralization, however, a general guarantee collateralizes all the issuer’s assets. |
| Placement period | : | 48 months from the registration date in the Chilean Securities Register of the Superintendency of Securities and Insurance. |
F - 58
ENERSIS S.A. AND SUBSIDIARIES
Notes to the Consolidated Financial Statements – (Continued)
| Fourth Issuance | ||
| Issuer | : | Empresa Nacional de Electricidad S.A. |
| Securities issued | : | Bearer bonds in local currency, denominated in Unidades de Fomento |
| Issuance Value (1) | : | Up to seven and a half million (UF7,500,000) divided into: |
| Series E-1: 1,500 bonds at UF1,000 each. | ||
| Series E-2: 600 bonds at UF10,000 each. | ||
| Series F: 200 bonds at UF10,000 each. | ||
| Readjustment base | : | Variation in the UF |
| Amortization period | : | Series E-1 and E-2: August 1, 2006. |
| Series F: August 1, 2022. | ||
| Early redemption | : | Only in the Series F case, beginning February 1, 2012. |
| Nominal interest rate | : | 6.2% annually, compounded semi-annually and effective on the outstanding principal adjusted for the value of the Unidad de fomento. The semi-annual interest rate will be 3.0534%. |
| Interest payment | : | Accrued interest as of December 31, 2003 amounts to ThCh$3,304,726 |
| (ThCh$3,309,694 in 2003 and ThCh$3,308,044 in 2002) which is shown under current liabilities. | ||
| Guarantee | : | There is no specific collateralization; however, a general guarantee covers all the issuer’s assets |
| Placement period | : | 36 months from the registration date in the Chilean Securities Register of the Superintendency of Securities and Insurance |
| (1) | Through a cross currency swap, the UF debt was exchanged for US dollar debt, leaving a net unrealized gain of ThCh$8,089,738 as of December 31, 2004 (ThCh$4,964,116 in 2003) which is included in other assets. |
| Fifth Issue | ||
| Issuer | : | Empresa Nacional de Electricidad S.A. |
| Securities issued | : | Dematerialized bearer bonds in local currency, expressed in Unidades de Fomento. |
| Amount of issue | : | Eight million Unidades de Fomento (U.F. 8,000,000) divided into: |
| - Series G: 4,000 bonds U.F. 1,000 each. | ||
| - Series H: 4,000 bonds U.F. 1,000 each. | ||
| Readjustment base | : | Variation in Unidad de Fomento. |
| Amortization period | : | Series G: October 15, 2010. |
| Series H: Six-monthly and successively as of April 16, 2010. | ||
| Pre-redemption | : | Only for series G bonds, as of October 16, 2004. |
| Nominal interest rate | : | Series G: 4.8% per year, compounded every six months and effective on the principal not fully paid adjusted by the value of the Unidad de Fomento. |
| The interest rate to be applied every six months will be 2.3719%. | ||
| Series H | : | 6.2% per year, compounded every six months and effective on the principal not fully paid adjusted by the value of the Unidad de Fomento. The interest rate to be paid everysix months will be 3.0534%. |
| Placement deadline | : | 36 months as of date of registration in Securities Register of the Superintendency of Securities and Insurance. |
| Security | : | No specific security, except for general security of all the issuer’s properties. |
| Interest payment | : | Interest will be paid semi-annually, due on April 15 and October 15 of each year starting from April 15, 2004. Interest accrued at year-end is ThCh$1,565,822 (ThCh$1,568,167in 2003) and is presented in current liabilities. |
F - 59
ENERSIS S.A. AND SUBSIDIARIES
Notes to the Consolidated Financial Statements – (Continued)
| (ii) | Endesa Chile S.A. has issued and placed four public offerings of bonds in the international market as follows: |
| First Issuance | ||
| Issuer | : | Empresa Nacional de Electricidad S.A. |
| Securities issued | : | Marketable securities denominated in US$(Yankee bonds) in the US market. |
| Issuance Value | : | Six hundred and fifty million US Dollars (US$650,000,000) divided into: |
| Series 1: US$230,000,000 | ||
| Series 2: US$220,000,000 | ||
| Series 3: US$200,000,000 | ||
| Readjustment | : | Variation in the US Dollar in relation with the Chilean peso |
| Amortization period | : | Series 1 matures on February 1, 2027: Series 2 matures on February 1, 2037 (Put Option on February 1, year 2009, on which date the holders may redeem 100% of bonds plusaccrued interest). |
| Series 3 matures on February 1, 2097. | ||
| Nominal interest rate | : | Series 1: 7.875% annually |
| Series 2: 7.325% annually | ||
| Series 3: 8.125% annually | ||
| Interest Payments | : | Interest will be paid semi-annually each February 1 and August 1 annually, starting January 27, 1997. Accrued interest as of the year end amounts to ThCh$ 11,723,401 (ThCh$12,801,201 in 2003 and ThCh$15,646,787 in 2002), which is shown under current liabilities. |
| Second Issuance | ||
| Issuer | : | Empresa Nacional de Electricidad S.A. |
| Securities issued | : | Marketable securities denominated in US$(Yankee bonds) in the US market. |
| Issuance Value | : | Four hundred million US Dollars (US$400,000,000) |
| Readjustment | : | Variation in the US Dollar in relation with the Chilean peso |
| Principal due | : | Series 1 matures on July 15, 2008 |
| Nominal interest rate | : | Series 1:7.75% annually |
| Interest Payment | : | Interest will be paid semi-annually each January 15 and July 15 annually, starting, January 15, 1999. Accrued interest as of the year end amounts to ThCh$7,919,724 (ThCh$8,647,830 in 2003 and ThCh$9,920,363 in 2002), which is shown under current liabilities. |
| Third Issuance | ||
| Issuer | : | Empresa Nacional de Electricidad S.A. |
| Securities issued | : | Marketable securities denominated in US$(Yankee bonds) in the US market. |
| Issuance Value | : | Four hundred million US Dollars (US$400,000,000) |
| Readjustment | : | Variation in the US Dollar in relation with the Chilean peso |
| Principal due | : | Series 1 matures on April 1, 2009. |
| Nominal interest rate | : | Series 1:8.502% annually |
| Interest Payment | : | Interest will be paid semi-annually each October 1 and April 1 annually, starting October 1, 1999. Accrued interest as of the year end amounts to ThCh$4,737,900, ThCh$5,173,483 and ThCh$6,323,499 in 2004, 2003 and 2002, respectively, which isshown under current liabilities. |
F - 60
ENERSIS S.A. AND SUBSIDIARIES
Notes to the Consolidated Financial Statements – (Continued)
| Fourth Issue | ||
| Issuer | : | Empresa Nacional de Electricidad S.A. |
| Securities issued | : | Electronic negotiable bonds expressed in American dollars on the American and European markets, under rules “Rule 144A” and “Regulation S”. |
| Amount of issue | : | Six hundred million US dollars (US$600,000,000) divided into: |
| Series August 1, 2013: US$400,000,000 | ||
| Series August 1, 2015: US$200,000,000 | ||
| Adjustment | : | Variation in US dollar. |
| Principal due | : | Series of ThUS$400 total maturity on August 1 2013. |
| : | Series of ThUS$200 total maturity on August 1 2015. | |
| Nominal interest rate | : | Series of ThUS$400 8.35% per year. |
| Series of ThUS$400 8.625% per year. | ||
| Payment of interest | : | Interest will be paid semi-annually on February 1 and August 1 each year starting from July 23, 2003. Interest accrued at year-end was ThCh$11,763,463 (ThCh$13,444,908 in 2003) and presented in current liabilities. |
The risk rating of these bonds is as follows as of December 31, 2004:
| Category | ||
| – Standard & Poor’s | BBB– | |
| – Moodys Investors Services | Ba 2 | |
| – Fitch | BBB– |
Repurchase of Yankee Bonds
Endesa Chile Internacional, a 100% subsidiary of Endesa, made a tender offer in November 2001, for the total or partial purchase, in cash, of the following bond issue in US dollar (Yankee Bonds) made by its parent company, Endesa.
| • | Series 1: ThCh$230,000 at 30 years, maturing in 2027. |
| • | Series 3: ThCh$200,000 at 100 years, maturing in 2097. |
As a result of the offer which expired on November 21, 2001, series 1 and series 2 bonds, for ThUS$21,324 and ThUS$134,828, respectively, were purchased, whose nominal values amounted to ThUS$24,119 and ThUS$159,584 for each series.
| (11) | Subsidiaries of Endesa Chile S.A. |
| I | Endesa Chile Internacional issued Yankee Bonds on April 1, 1996. |
Risk rating of the bond issuance is as follows as of December 31, 2004:
| Category | ||
| – Standard & Poor’s | BBB– | |
| – Moodys Investors Services | Ba 2 |
F - 61
ENERSIS S.A. AND SUBSIDIARIES
Notes to the Consolidated Financial Statements – (Continued)
| ISSUANCE TERMS | ||
| First Issuance | ||
| Issuer | : | Endesa Chile Internacional. |
| Securities issued | : | Marketable securities denominated in US$(150,000 bonds). |
| Issuance Value | : | One hundred and fifty million Dollars (US$150,000,000): |
| Principal due | : | Maturity as of April 1, 2006 |
| Nominal interest rate | : | 7.2 % annually in arrears. |
| Interest Payment | : | Interest will be paid semi-annually in arrears starting October 1, 1996. Accrued interest as of the year end amounts to ThCh$1,504,980 (ThCh$1,643,342 in 2003 and ThCh$1,885,160 in 2002) and is shown under current liabilities. |
| Guarantee | : | Guarantee from Empresa Nacional de Electricidad S.A. |
| As of July 24, 2000, the first issue of Eurobonds (European Medium Term Note Programme) was registered in England for 1,000 million Euros. | ||
| ISSUANCE TERMS | ||
| First Registration | ||
| Securities registered | : | 1,000 million Euros |
| Issuance value | : | Euros 400,000,000 (*) |
| Principal due | : | Principal due July 24, 2003 |
| Nominal interest rate | : | Euribor + 0.80% |
| Interest payment | : | Quarterly beginning October 24, 2000 in arrears. Accrued interest as of December 31, 2004, 2003 and 2002 amounts to ThCh$0, ThCh$0 and ThCh$2,391,942 respectively and is shown in current liabilities. |
| Guarantee | : | Empresa Nacional de Electricidad S.A. |
| (*) | By way of a cross-currency swap operation, the debt in Euros was exchanged for U.S. dollar debt. |
| At December 31, 2004, this issue is totally cancelled. | |
| II | Edegel S.A. issued bonds on June 4, 1999, February 15, 2000, June 14, 2000 and November 27, 2000, August 22, 2001, June 6, 2003, September 4, 2003, October 29, 2003, December 12, 2003, January 26, 2004, February 27, June 18, 2004 and July 26, 2004 as per the following: |
| First Issuance | ||
| Issuer | : | Edegel S.A. |
| Securities issued | : | Marketable securities denominated in US$(120,000 bonds). |
| Issuance value | : | US$120,000,000 |
| Principal due | : | June 3, 2007, February 14, 2007, June 13, 2006 and November 21, 2005 respectively. |
| Nominal interest rate | : | 8.75%, 8.41%, 8.75% and 8.46% annually |
| Interest payment | : | Interest will be paid semi-annually, starting December 3, 1999. Accrued interest as of December 31, 2004, 2003 and 2002 amounts to ThCh$831,884, ThCh$1,018,802 and ThCh$1,351,145 and is shown in other current liabilities. |
| Issuer | : | Edegel S.A. |
| Securities issued | : | Marketable securities denominated in new soles (20,000 bonds). |
| Issuance value | : | 100,000,000 new Peruvian soles |
| Principal due | : | Maturity as of June 6, 2005. |
| Nominal interest rate | : | 6.0% annually |
| Interest payment | : | Interest will be paid semi-annually. Accrued interest as of December 31, 2004, 2003 and2002 amounts to ThCh$67,914, ThCh$70,282 and ThCh$0 respectively and is shown in other current liabilities. |
F - 62
ENERSIS S.A. AND SUBSIDIARIES
Notes to the Consolidated Financial Statements – (Continued)
| Issuer | : | Edegel S.A. |
| Securities issued | : | Marketable securities denominated in new Peruvian soles (10,000 bonds). |
| Issuance value | : | 50,000,000 new soles |
| Principal due | : | Maturity as of May 5, 2006. |
| Nominal interest rate | : | 4.13% annually |
| Interest payment | : | Interest will be paid semi-annually. Accrued interest as of December 31, 2004, 2003 and 2002 amounts to ThCh$112,835, ThCh$116,771 and ThCh$0, respectively and is shownin other current liabilities. |
| Issuer: | : | Edegel S.A. |
| Securities issued | : | Negotiable Instruments in New Peruvian Soles (10,000 bonds) |
| Amount of issuance | : | Fifty million new Peruvian soles (NS50,000,000). |
| Principal due | : | Total maturity at October 30, 2006. |
| Nominal interest rate | : | 4.875% per year. |
| Interest payment | : | Interests will be paid semi-annually. Interests accrued at year-end is ThCh$68,975,(ThCh$72,570 in 2003) and is presented in current liabilities. |
| Issuer | : | Edegel S.A. |
| Securities issued | : | Negotiable instruments in new Peruvian soles 10,000 bonds) |
| Amount of issue | : | Fifty million new Peruvian soles (NS50,000,000). |
| Principal due | : | Total maturity at December 12, 2006. |
| Nominal interest rate | : | 4.75% per year. |
| Interest payment | : | Interests will be paid semi-annually. Interest accrued at year-end is ThCh$ 20,162(ThCh$22,915 in 2003) and is presented in current liabilities. |
| Issuer | : | Edegel S.A. |
| Issued securities | : | Negotiable securities in dollars (10,000 bonds.) |
| Amount issued | : | Ten million (US$10,000,000.) |
| Principal due | : | Total maturity on January 26, 2009. |
| Nominal interest rate | : | Due annually 3.75%. |
| Interest payment | : | Semi-annual. Interest earned at the closure of the fiscal year is ThCh$89,416 andpresented in current liabilities. |
| Issuer | : | Edegel S.A. |
| Issued securities | : | Negotiable securities in new Peruvian soles (6,000 bonds.) |
| Amount issued | : | Thirty million new Peruvian soles (NS 30,000,000.) |
| Principal due | : | Total maturity on December 12, 2006. |
| Nominal interest rate | : | Due annually 5.875%. |
| Interest payment | : | Semi-annual. Interest earned at the closing of the fiscal year is ThCh$102,242 and presented in current liabilities. |
| Issuer | : | Edegel S.A. |
| Issued securities | : | Negotiable securities in new Peruvian soles (4,000 bonds.) |
| Amount issued | : | Twenty million new Peruvian soles (NS 20,000,000.) |
| Principal due | : | Total maturity on June 18, 2008. |
| Nominal interest rate | : | Due annual 8.5%. |
| Interest payment | : | Semi-annual. Interest earned at the closing of the fiscal year is ThCh$10,423 and presented in current liabilities. |
F - 63
ENERSIS S.A. AND SUBSIDIARIES
Notes to the Consolidated Financial Statements – (Continued)
| Issuer | : | Edegel S.A. |
| Issued securities | : | Negotiable securities in dollars (10,000 bonds.) |
| Amount issued | : | Ten million dollars (US$10,000,000.) |
| Principal due | : | Total maturity on July 26, 2009. |
| Nominal interest rate | : | Due annual 4.78%. |
| Interest payment | : | Semi-annual. Interest earned at the closing of the fiscal year is M$88,492 and presented in current liabilities. |
| III | Emgesa S.A. issued bonds on October 8, 1999 and July 9, 2001, the first issuance, and on February 26, 2003, the second issuance as per the following: |
| First Issuance | ||
| Issuer | : | Emgesa S.A. |
| Securities issued | : | Marketable securities denominated in Colombian pesos |
| Issuance Value | : | $Col 530,000,000,000 |
| Principal due | : | Maturities between 2006 and 2009 amount to Col$449,554,880. |
| Interest nominal rate | : | 10.77% annual average rate |
| Interest payment | : | Interest will be paid semi-annually. Accrued interest as of December 31, 2004, 2003 and 2002 amounts to ThCh$1,771,428, ThCh$4,522,072 and ThCh$5,575,837 and is shown under current liabilities. |
| Second Issuance | ||
| Issuer | : | Emgesa S.A. |
| Securities issued | : | Marketable securities denominated in Colombian pesos |
| Issuance value | : | $Col 50,000,000,000 |
| Principal due | : | Maturity as of July 26, 2006. |
| Nominal interest rate | : | 15.18% annual average rate |
| Interest payment | : | Interest will be paid annually. Accrued interest as of December 31, 2004, 2003 and 2002 amounts to ThCh$2,261,361, ThCh$2,469,433 and ThCh$228,760 respectively and is shown in other current liabilities. |
| IV. | Central Hidroeléctrica Betania S.A. E.S.P. issued bonds on November 11, 2004, completing the first issue. |
| First issue | ||
| Issuer | : | Central Hidroeléctrica Betania S.A. E.S.P. |
| Issued securities | : | Bonds in Colombian pesos. |
| Amount issued | : | 400,000,000,000 Colombian pesos. |
| Principal due | : | Maturity between 2009 and 2011, for 300,000,000,000 Colombian pesos. |
| Nominal interest rate | : | 12.4%. |
| Interest payment | : | Quarterly and annual. Interest earned at the closing of the fiscal year is ThCh$1,197,295 and is presented in current liabilities. |
Amortized bond discounts of Enersis S.A. and its affiliates of ThCh$21,550,971, ThCh$20,072,691 and ThCh$19,358,573 as of December 31, 2002, 2003 and 2004, respectively are included in Other Assets (see Note 14).
F - 64
ENERSIS S.A. AND SUBSIDIARIES
Notes to the Consolidated Financial Statements – (Continued)
Note 19. Accrued Expenses
| (a) | Short-term accruals: |
Accrued expenses included in current liabilities are as follows:
| As of December 31, | ||||
| 2003 | 2004 | |||
| ThCh$ | ThCh$ | |||
| Bonus and other employee benefits | 24,444,587 | 26,066,606 | ||
| Litigation and other contingencies | 4,922,735 | 4,305,757 | ||
| Construction and other | 2,779,622 | – | ||
| Energy purchases from others | 6,563,565 | 2,487,185 | ||
| Pension accruals | 1,818,240 | 1,140,558 | ||
| Suppliers and services | 13,309,688 | 8,300,418 | ||
| Others | 1,208,393 | 2,032,593 | ||
| Total | 55,046,830 | 44,333,117 | ||
| (b) | Long-term accruals: |
| As of December 31, | ||||
| 2003 | 2004 | |||
| ThCh$ | ThCh$ | |||
| Advance monthly corporate and other taxes | 7,830,827 | 7,450,766 | ||
| Post-retirement benefits-Chilean subsidiaries | 11,685,741 | 16,024,333 | ||
| Post-retirement benefits (Cerj Coelce) | 61,973,808 | 53,776,105 | ||
| Severance indemnity | 10,901,982 | 11,012,537 | ||
| Legal, labor and tax contingencies (Cerj) | 162,848,093 | 152,182,968 | ||
| Post-retirement benefits-foreign subsidiaries | 65,942,279 | 68,620,416 | ||
| Others | 4,169,678 | 1,958,148 | ||
| Total | 325,352,408 | 311,025,273 | ||
Note 20. Severance Indemnities
Long-term accruals include employee severance indemnities, calculated in accordance with the policy described in Note 2n. An analysis of the changes in the accruals in each year is as follows:
| As of December 31, | ||||
| 2003 | 2004 | |||
| ThCh$ | ThCh$ | |||
| Opening balance as of January 1 | 8,610,121 | 10,636,360 | ||
| Increase in accrual | 2,871,119 | 1,963,414 | ||
| Transfer to short-term | (42,084 | ) | (95,654 | ) |
| Payments during the period | (537,174 | ) | (1,491,583 | ) |
| Total | 10,901,982 | 11,012,537 | ||
F - 65
ENERSIS S.A. AND SUBSIDIARIES
Notes to the Consolidated Financial Statements – (Continued)
Note 21. Minority Interest
| (a) | Minority shareholders’ participation in the shareholders’ equity of the Company’s subsidiaries is as follows: |
| As of December 31, 2003 | As of December 31, 2004 | |||||||||||
| Company | Equity | Participation | Total | Equity | Participation | Total | ||||||
| ThCh$ | % | ThCh$ | ThCh$ | % | ThCh$ | |||||||
| Aguas Santiago Poniente | – | 0.00 | % | – | 2,138,763 | 45.00 | % | 962,443 | ||||
| Cam Argentina S.A. | 526,322 | 0.10 | % | 526 | 490,904 | 0.10 | % | 492 | ||||
| Cam Colombia S.A. | 2,325,024 | 0.00 | % | 30 | 1,404,091 | 0.00 | % | 19 | ||||
| Capital de Energía S.A. | 476,360,496 | 49.10 | % | 233,893,003 | 433,491,652 | 49.00 | % | 212,410,909 | ||||
| Central Hidroeléctrica Betania S.A. | 438,238,156 | 14.38 | % | 63,009,005 | 396,701,579 | 14.38 | % | 57,036,960 | ||||
| Central Cachoeira Dourada | 416,599,853 | 0.39 | % | 1,641,902 | 360,922,632 | 0.39 | % | 1,422,468 | ||||
| Central Costanera S.A. | 173,721,282 | 35.74 | % | 62,079,140 | 164,571,235 | 35.74 | % | 58,809,379 | ||||
| Chilectra S.A. | 437,157,882 | 1.76 | % | 7,636,110 | 457,376,118 | 1.76 | % | 7,990,673 | ||||
| Cía. Eléctrica San Isidro S.A. | 45,055,766 | 50.00 | % | 22,527,884 | 52,472,376 | 50.00 | % | 26,236,188 | ||||
| Cía. Peruana de Electricidad S.A. | 33,824,461 | 49.00 | % | 16,573,986 | 26,694,010 | 49.00 | % | 13,080,065 | ||||
| Codensa S.A. | 847,938,214 | 51.52 | % | 436,861,205 | 805,502,466 | 78.19 | % | 629,785,730 | ||||
| Compañía de Electricidade do Rio de Janeiro S.A. | 457,564,052 | 27.46 | % | 125,649,583 | 523,890,321 | 18.77 | % | 98,358,372 | ||||
| Companhia Energetica Do Ceara - Coelce | 546,789,747 | 43.41 | % | 237,362,977 | 479,452,075 | 43.41 | % | 208,131,503 | ||||
| Constructora y Proyectos Los Maitenes S.A. | (561,663 | ) | 45.00 | % | (252,749 | ) | (1,253,478 | ) | 45.00 | % | (576,779 | ) |
| Edegel S.A. | 557,722,052 | 36.44 | % | 203,255,109 | 486,331,290 | 36.44 | % | 177,237,603 | ||||
| Edelnor S.A. | 227,179,203 | 40.00 | % | 90,871,681 | 178,099,675 | 40.00 | % | 71,239,870 | ||||
| Edesur S.A. | 590,358,954 | 34.11 | % | 201,359,739 | 523,523,726 | 34.11 | % | 178,563,568 | ||||
| Elesur S.A. | – | 0.00 | % | – | 56,688,517 | 0.00 | % | 609 | ||||
| Emgesa S.A. | 815,270,848 | 51.52 | % | 420,002,269 | 738,223,906 | 51.52 | % | 380,310,072 | ||||
| Empresa Eléctrica Pangue S.A. | 87,532,641 | 5.02 | % | 4,390,812 | 78,452,150 | 5.02 | % | 3,935,317 | ||||
| Endesa | 1,529,985,766 | 40.02 | % | 612,286,163 | 1,568,897,981 | 40.02 | % | 627,858,471 | ||||
| Endesa Argentina S.A. | 58,412,739 | 0.01 | % | 5,841 | 53,515,263 | 0.01 | % | 5,352 | ||||
| Generandes Perú S.A. | 309,802,801 | 40.37 | % | 125,064,355 | 276,210,577 | 40.37 | % | 111,503,503 | ||||
| Hidroeléctrica El Chocón S.A. | 206,365,348 | 34.81 | % | 71,835,778 | 179,753,696 | 34.81 | % | 62,572,262 | ||||
| Hidroinvest S.A. | 85,746,919 | 30.07 | % | 25,784,098 | 72,645,379 | 30.07 | % | 21,844,465 | ||||
| Ingendesa S.A. | 2,625,142 | 2.36 | % | 62,019 | 2,362,755 | 2.36 | % | 55,820 | ||||
| Inversiones Distrilima S.A. | 135,303,911 | 31.61 | % | 42,769,567 | 106,797,362 | 31.61 | % | 33,758,645 | ||||
| Investluz S.A. | 293,938,943 | 37.55 | % | 110,374,073 | 262,696,532 | 37.55 | % | 98,642,819 | ||||
| Luz de Bogotá S.A. | 499,679,635 | 55.00 | % | 274,823,805 | – | 0.00 | % | – | ||||
| Pehuenche S.A. | 199,166,284 | 7.35 | % | 14,638,722 | 190,683,185 | 7.35 | % | 14,015,214 | ||||
| Soc. Agrícola de Cameros Ltda. | 7,091,001 | 42.50 | % | 3,013,675 | 7,064,914 | 42.50 | % | 3,002,588 | ||||
| Soc. Agrícola Pastos Verdes Ltda. | 56,659,804 | 45.00 | % | 25,496,913 | 59,590,252 | 45.00 | % | 26,815,613 | ||||
| Túnel El Melón S.A. | (6,702,981 | ) | 0.05 | % | (3,352 | ) | (8,422,193 | ) | 0.05 | % | (4,211 | ) |
| Total | 3,433,013,869 | 3,125,006,002 | ||||||||||
F - 66
ENERSIS S.A. AND SUBSIDIARIES
Notes to the Consolidated Financial Statements – (Continued)
| (b) | Minority shareholders’ participation in the net (income) or loss of the Company’s subsidiaries is as follows: |
| As of December 31, 2002 | As of December 31, 2003 | As of December 31, 2004 | ||||||||||||||||
| Company | Net income | Participation | Total | Net income | Participation | Total | Net income | Participation | Total | |||||||||
| ThCh$ | % | ThCh$ | ThCh$ | % | ThCh$ | ThCh$ | % | ThCh$ | ||||||||||
| Autopista Los Libertadores | 86,726 | 0.05 | % | 43 | — | — | — | — | — | — | ||||||||
| Aguas Santiago Poniente | — | — | — | — | — | — | 108,643 | 45.00 | % | 48,889 | ||||||||
| Cam Argentina S.A. | 193,187 | 0.10 | % | 194 | (64,331 | ) | 0.10 | % | (65 | ) | 65,282 | 0.10 | % | 65 | ||||
| Cam Colombia S.A. | (737,245 | ) | 0.001 | % | (9 | ) | (745,590 | ) | 0.001 | % | (10 | ) | (907,447 | ) | 0.00 | % | (12 | ) |
| Capital de Energía S.A. | (24,505,416 | ) | 49.10 | % | (12,032,159 | ) | (8,829,230 | ) | 49.10 | % | (4,335,152 | ) | (13,373,141 | ) | 49.00 | % | (6,552,839 | ) |
| Central Hidroeléctrica Betania S.A. | 7,614,236 | 14.38 | % | 1,094,759 | 1,730,620 | 14.38 | % | 248,825 | 4,639,241 | 14.38 | % | 667,021 | ||||||
| Central Cachoeira Dourada | 36,753,279 | 0.41 | % | 149,682 | (4,422,415 | ) | 0.39 | % | (17,430 | ) | (14,818,479 | ) | 0.39 | % | (58,403 | ) | ||
| Central Costanera S.A. | (25,607,194 | ) | 48.07 | % | (12,308,728 | ) | (28,497,368 | ) | 35.74 | % | (12,560,325 | ) | (5,476,455 | ) | 35.74 | % | (1,957,006 | ) |
| Chilectra S.A. | 32,094,473 | 1.76 | % | 560,840 | (52,756,294 | ) | 1.76 | % | (922,456 | ) | (77,321,577 | ) | 1.76 | % | (1,353,288 | ) | ||
| Cía. Eléctrica San Isidro S.A. | (5,435,295 | ) | 50.00 | % | (2,717,648 | ) | (13,507,303 | ) | 50.00 | % | (6,753,652 | ) | (14,213,098 | ) | 50.00 | % | (7,106,549 | ) |
| Cía. Peruana de Electricidad S.A. | (3,372,988 | ) | 49.00 | % | (1,652,764 | ) | (2,260,699 | ) | 49.00 | % | (1,107,742 | ) | (119,602 | ) | 49.00 | % | (58,605 | ) |
| Codensa S.A. | 6,890,574 | 51.52 | % | 3,550,023 | (18,470,888 | ) | 51.52 | % | (9,516,276 | ) | (56,675,131 | ) | 78.19 | % | (44,311,706 | ) | ||
| Cía. do Electricidade do Río do Janeiro | 9,330,118 | 37.42 | % | 3,491,592 | 101,242,812 | 27.46 | % | 27,801,828 | 30,959,195 | 18.77 | % | 5,812,469 | ||||||
| Companhia Energetica Do Ceara - Coelce | (21,069,183 | ) | 43.41 | % | (9,146,192 | ) | 10,442,705 | 43.41 | % | 4,533,208 | 16,071,989 | 43.41 | % | 6,976,896 | ||||
| Compañía Eléctrica del Río Maipo S.A. | (12,140,679 | ) | 1.26 | % | (152,676 | ) | — | — | — | — | — | — | ||||||
| Constructora y Proyectos Los Maitenes S.A. | 607,522 | 45.00 | % | 273,385 | 923,958 | 45.00 | % | 415,781 | 720,068 | 45.00 | % | 324,031 | ||||||
| Edegel S.A. | (4,715,042 | ) | 36.44 | % | (1,718,340 | ) | (32,678,917 | ) | 36.44 | % | (11,909,439 | ) | (17,792,745 | ) | 36.44 | % | (6,484,352 | ) |
| Edelnor S.A. | (20,455,809 | ) | 40.00 | % | (8,182,324 | ) | (13,404,450 | ) | 40.00 | % | (5,361,780 | ) | 522,853 | 40.00 | % | 209,141 | ||
| Edesur S.A. | (8,494,372 | ) | 34.11 | % | (2,897,262 | ) | 27,778,921 | 34.11 | % | 9,474,840 | 17,129,823 | 34.11 | % | 5,842,643 | ||||
| Elesur S.A. | — | — | — | — | — | — | 1,270,758 | 0.00 | % | 14 | ||||||||
| Emgesa S.A. | (58,148,661 | ) | 51.52 | % | (29,956,388 | ) | (22,776,713 | ) | 51.52 | % | (11,733,857 | ) | (28,156,505 | ) | 51.52 | % | (14,505,359 | ) |
| Empresa Eléctrica Pangue S.A. | (19,515,334 | ) | 5.01 | % | (977,718 | ) | (38,094,663 | ) | 5.02 | % | (1,910,904 | ) | (4,839,958 | ) | 5.02 | % | (242,782 | ) |
| Endesa | 9,647,553 | 40.02 | % | 3,860,861 | (80,084,185 | ) | 40.02 | % | (32,048,951 | ) | (83,788,756 | ) | 40.02 | % | (33,531,486 | ) | ||
| Endesa Argentina S.A. | 11,161,195 | 0.01 | % | 1,116 | (39,291,822 | ) | 0.01 | % | (3,929 | ) | 452,791 | 0.01 | % | 45 | ||||
| Generandes Perú S.A. | (13,567,291 | ) | 40.37 | % | (5,476,982 | ) | (29,270,349 | ) | 40.37 | % | (11,816,153 | ) | (19,175,749 | ) | 40.37 | % | (7,741,062 | ) |
| Hidroeléctrica El Chocón S.A. | 26,680,983 | 34.81 | % | 9,287,650 | (13,950,752 | ) | 34.81 | % | (4,856,257 | ) | 3,492,111 | 34.81 | % | 1,215,604 | ||||
| Hidroinvest S.A. | 27,436,481 | 30.07 | % | 8,250,149 | (7,282,633 | ) | 30.07 | % | (2,189,888 | ) | 6,762,318 | 30.07 | % | 2,033,429 | ||||
| Inecsa 2000 S.A. | 101,789 | 2.68 | % | 2,729 | — | — | — | — | — | — | ||||||||
| Infraestructura 2000 S.A. | (427,520 | ) | 40.00 | % | (171,008 | ) | — | — | — | — | — | — | ||||||
| Ingendesa S.A. | (955,795 | ) | 2.36 | % | (22,581 | ) | (1,641,617 | ) | 2.36 | % | (38,783 | ) | (947,753 | ) | 2.36 | % | (22,391 | ) |
| Inmobiliaria Centro Nuevo Ltda. | 1,330 | 0.08 | % | 1 | — | — | — | — | 0.00 | % | — | |||||||
| Inmobiliaria y Constructora Stgo. 2000 Ltda. | (6,450 | ) | 7.50 | % | (484 | ) | — | — | — | — | 0.00 | % | — | |||||
| Inversiones Distrilima S.A. | (13,532,065 | ) | 31.61 | % | (4,277,486 | ) | (9,078,950 | ) | 31.61 | % | (2,869,857 | ) | (523,706 | ) | 31.61 | % | (165,543 | ) |
| Investluz | 205,344,137 | 37.55 | % | 77,068,236 | 8,899,063 | 37.55 | % | 3,341,598 | 6,494,157 | 37.55 | % | 2,438,563 | ||||||
| Luz de Bogotá S.A. | 4,671,051 | 55.00 | % | 2,569,079 | (4,311,603 | ) | 55.00 | % | (2,371,382 | ) | — | 0.00 | % | — | ||||
| Pehuenche S.A. | (20,717,560 | ) | 7.35 | % | (1,522,741 | ) | (46,943,144 | ) | 7.35 | % | (3,450,321 | ) | (27,870,640 | ) | 7.35 | % | (2,048,492 | ) |
| Soc. Agrícola de Cameros Ltda. | (108,304 | ) | 42.50 | % | (46,030 | ) | 89,881 | 42.50 | % | 38,200 | 26,087 | 42.50 | % | 11,087 | ||||
| Soc. Agrícola Pastos Verdes Ltda. | (101,799 | ) | 45.00 | % | (45,810 | ) | (808,321 | ) | 45.00 | % | (363,745 | ) | (1,217,491 | ) | 45.00 | % | (547,871 | ) |
| Túnel El Melón S.A. | 3,020,593 | 0.05 | % | 1,511 | 2,322,960 | 0.05 | % | 1,161 | 1,719,213 | 0.05 | % | 860 | ||||||
| Total | 16,856,520 | (80,282,913 | ) | (101,106,989 | ) | |||||||||||||
F - 67
ENERSIS S.A. AND SUBSIDIARIES
Notes to the Consolidated Financial Statements – (Continued)
Note 22.Shareholders’ Equity
(a) Paid capital
The Extraordinary General Meeting of Shareholders of Enersis held on March 31, 2003 approved a capital increase of about US$2,000 million. The issue was registered in the Securities Register on May 23, 2003 under No. 686 for Ch$1,473,225,403,563 pesos, divided into 24,382,994,488 shares. The operation was structured as follows:
| 1) | First preferential underwriting period (from May 31 to June 30), in which shareholders registered in the company register at May 26, 2003 have the option of subscribing to 2.9408 new shares for each old one at a price of Ch$60.4202 per share. |
| 2) | Voluntary redemption of local bonds (from November 1 to 15), in which holders of local 269 bonds (series B1 and B2) may exchange their bonds for Enersis shares, according to the value assigned by an independent expert and at placement price of Ch$60.4202 per share. |
| 3) | Second preferential underwriting period (from November 20 to December 20), in which all Enersis shareholders registered five working days before the start of this new period, except for the controlling partner and its members, may participate. |
In this phase, shareholders may subscribe to the remaining shares that were not underwritten at the close of the preferential underwriting period and at the conclusion of the voluntary redemption of local bonds. In this period, new issue shares may only be paid in cash at the same price of Ch$60.4202 per share.
Once the deadline for the capital increase has expired (December 30, 2003), its final amount will be the amount actually underwritten and paid in.
At June 30, 2003, end date of the first preferential underwriting period, 22,113,264,060 shares were underwritten for a sum of Ch$1,336,087,841,061 equivalent to 90.69% of the total issue. Of total shares underwritten in this preferential period, 14,406,840,511 shares were subscribed to by controlling shareholder Elesur for the equivalent of Ch$870,464,185,043 and 7,706,423,549 shares by minority shareholders for the equivalent of Ch$465,623,656,018.
Elesur underwrote and paid in its shares by capitalizing financial loans that it held with Enersis on the date of underwriting. The exchange was approved by the Extraordinary Shareholders’ Meeting on March 31, 2003, at 86.84% of its par value based on an independent expert appraisal report performed pursuant to the Chilean Company Law, with the difference being recorded as a share premium of Ch$131,912,812,936.
The second preferential underwriting period in November 2003 involved the voluntary exchange of 269 bonds, series B1 and B2. Holders converted Ch$63,656,586,836 into the equivalent of 893,612,466 first issues shares; the amounts underwritten were determined by experts; capitalization was Ch$46,964,178,894 for series B1 and Ch$7,028,065,024 for series B2, at Ch$60.4202 per share. This operation resulting in recording a share premium of Ch$6,247,821,056.
During the second preferential underwriting period, 1,244,542,758 shares equivalent to Ch$75,195,523,918 were subscribed.
The second share underwriting period concluded on December 30, 2003 yielding a capital increase, in which 99.9% of the capital authorized by the Extraordinary General Meeting of Shareholders, in other words 24,360,146,365 shares, were subscribed, leaving Enersis’ capital with a total of 32,651,166,465 subscribed and paid in shares.
| (b) | Dividends |
During the years ended December 31, 2002, 2003 and 2004 the Company no paid dividends.
F - 68
ENERSIS S.A. AND SUBSIDIARIES
Notes to the Consolidated Financial Statements – (Continued)
| (c) | Number of shares | ||||||
| As of December 31, | |||||||
| 2002 | 2003 | 2004 | |||||
| Shares | Shares | Shares | |||||
| Capital stock authorized | 8,291,020,100 | 32,651,166,465 | 32,651,166,465 | ||||
| Capital stock issued and outstanding | 8,291,020,100 | 32,651,166,465 | 32,651,166,465 | ||||
| (d) | Subscribed and paid in capital is as follows: | ||||||
| As of December 31, | ||||
| 2003 | 2004 | |||
| ThCh$ | ThCh$ | |||
| As of January 1, | 777,688,286 | 2,283,404,124 | ||
| Intercompany loan capitalization | 890,441,339 | |||
| Bond exchange | 55,176,024 | |||
| Subscribed shares | 560,098,475 | |||
| As of December 31, | 2,283,404,124 | 2,283,404,124 | ||
| (e) | Net losses from operations and accumulated net income (losses) of development-stage subsidiaries are as follows: | ||||
| As of December 31, 2004 | |||||
| Net income (loss) | Retained earnings | ||||
| Company | for the period | (accumulated deficit) | |||
| ThCh$ | ThCh$ | ||||
| Central Generadora Termoelectrica Fortaleza S.A. | — | (2,673,664) | |||
| Total | — | (2,673,664 | ) | ||
| (f) | Other reserves | ||||
Other reserves at December 31, 2004 are composed of the following:
| Initial | Final | |||||
| balance at | Reserve | balance at | ||||
| January 1, 2004 | for the period | December 31, 2004 | ||||
| ThCh$ | ThCh$ | ThCh$ | ||||
| Reserve for entities using remeasurement method | (10,499,405 | ) | (4,435,524 | ) | (14,934,929 | ) |
| Reserve for accumulated conversion differences | (15,814,072 | ) | (103,832,123 | ) | (119,646,195 | ) |
| Reserve for Technical Bulletin No. 72 (1) | — | 11,992,130 | 11,992,130 | |||
| Total | (26,313,477 | ) | (96,275,517 | ) | (122,588,994 | ) |
| (1) | Corresponds to the reserve generated by the purchase of shares of Compañía de Electricidad de Río de Janeiro S.A. in 2004. This effect has been recorded in accordance with Technical Bulletin No.72 of the Chilean Institute of Accountants. |
F - 69
ENERSIS S.A. AND SUBSIDIARIES
Notes to the Consolidated Financial Statements – (Continued)
Detail of changes in the reserve for accumulated conversion differences is as follows:
| Initial | Final | |||||||
| balance at | Reserve | Reserve for | balance at | |||||
| January 1, 2004 | for assets | liabilities | December 31, 2004 | |||||
| ThCh$ | ThCh$ | ThCh$ | ThCh$ | |||||
| Cumulative translation adjustment | (15,814,072 | ) | (109,623,996 | ) | 5,791,873 | (119,646,195 | ) | |
| Total | (15,814,072 | ) | (109,623,996 | ) | 5,791,873 | (119,646,195 | ) | |
The detail of the accumulated conversion difference reserve at December 31, 2004 is as follows:
| ThCh$ | ||
| Distrilec Inversora S.A. | (16,109,082 | ) |
| Inversiones Distrilima S.A. | (6,111,287 | ) |
| Cía. Peruana de Electricidad S.A. | (36,678 | ) |
| Edesur S.A. | (19,299,737 | ) |
| Compañía de Electricidade do Rio de Janeiro S.A. | (35,101,980 | ) |
| Luz de Bogotá S.A. | 2,361,312 | |
| Investluz S.A. | (1,981,396 | ) |
| Central Geradora Termelétrica Fortaleza S.A. | (4,131,448 | ) |
| Enersis Energía de Colombia | (561,859 | ) |
| Endesa Market Place | 376,205 | |
| Endesa Argentina S.A. | 8,772 | |
| Endesa Chile Interncional S.A. | (3,028,008 | ) |
| Codensa S.A. | (27,711,750 | ) |
| Endesa de Colombia S.A. | 70,212 | |
| Central Costanera S.A. | (307,841 | ) |
| Conosur S.A. | (8,001,621 | ) |
| Capital de Energía S.A. | (8,544 | ) |
| Ingendesa Do Brasil Ltda. | (71,465 | ) |
| Total | (119,646,195 | ) |
F - 70
ENERSIS S.A. AND SUBSIDIARIES
Notes to the Consolidated Financial Statements – (Continued)
| Note 23. | Other Income and Expenses |
| a. | The detail of other non-operating income is as follows: |
| Year ended December 31, | ||||||
| 2002 | 2003 | 2004 | ||||
| ThCh$ | ThCh$ | ThCh$ | ||||
| Adjustments to investments in related companies | 530,255 | 7,717,776 | 1,143,798 | |||
| Gain on sale of property, plant and equipment | 3,599,261 | 3,221,389 | 7,901,585 | |||
| Gain on sale of materials | 2,748,178 | 3,926,619 | 166,722 | |||
| Gain on forward contracts and swaps | 4,985,036 | — | 6,915,462 | |||
| Services - projects and inspections | 14,889,111 | 9,260,211 | 3,258,908 | |||
| Penalties charged to contractors and suppliers | 7,192,798 | 7,466,011 | 7,731,202 | |||
| CDEC-SING power settlement gain (3) | 11,546,307 | 1,644,945 | 12,047,772 | |||
| Public lighting and telephone lines | 14,002,454 | 12,296,555 | 13,220,912 | |||
| Transportation and gas service income (San Isidro) | — | — | 878,765 | |||
| Cost recoveries | 5,293,014 | 5,871,416 | 2,063,984 | |||
| Reversal of contingencies provision and other provisions (4) | 6,713,863 | 44,040,053 | ||||
| Recoverable taxes | 6,612,786 | 5,207,602 | 2,641,508 | |||
| Effect of application of BT 64 (1) | 218,244,919 | 20,169,663 | 8,551,458 | |||
| Gain on sale of subsidiaries (2) | — | 91,517,236 | — | |||
| Indemnities and commissions | 3,293,872 | 3,681,189 | 7,656,664 | |||
| Dividend from investees | 11,110,557 | 4,395,484 | 1,961,425 | |||
| Other | 14,957,410 | 12,116,692 | 13,452,664 | |||
| Total | 319,005,958 | 195,206,651 | 133,632,882 | |||
| (1) | These amounts correspond to the net adjustments related to the translation of financial statements of foreign affiliates from the respective local country currency to US Dollars. |
| (2) | Sale of Compañía Eléctrica del Rio Maipo S.A. and Infraestructura 2000 S.A. |
| (3) | The amount recorded in 2004 corresponds to the result of re-liquidations of balances of power on a firm basis corresponding to 2000 April - 2004 March period (See Note 35). The amount recorded in 2003 corresponds to interim re-liquidations of Energy and Power for transactions carried out in prior years. |
| (4) | In 2004, as the result of a change in the tax law in Brazil, the foreign exchange gains or losses generated by certain assets and liabilities were eliminated from the base upon which PIS and COFINS tax were calculated. Therefore, as the Company had accrued for these taxes in prior years including the foreign exchange gains/losses as part of the base and as, in the opinion of Company management and Company legal counsel it was appropriate to do so, the Company reversed the portion of its tax accrual for PIS and COFINS generated by the foreign exchange gains/losses. |
F - 71
ENERSIS S.A. AND SUBSIDIARIES
Notes to the Consolidated Financial Statements – (Continued)
| b. | Other non-operating expenses are as follows: |
| Year ended December 31, | ||||||
| 2002 | 2003 | 2004 | ||||
| ThCh$ | ThCh$ | ThCh$ | ||||
| Adjustments to investments in related companies | 4,313,331 | 8,392,787 | 1,909,123 | |||
| Cost of sales – materials | 1,704,123 | 3,218,384 | 841,148 | |||
| Loss on sale of fixed assets | 2,464,714 | 9,631,969 | 1,287,967 | |||
| Donations | 151,764 | — | — | |||
| Effect of application of BT 64 (1) | 31,852,327 | 89,369,131 | 65,499,071 | |||
| Contingencies and litigation | 49,995,867 | 54,298,359 | 35,399,348 | |||
| Deferred expense amortization | 3,768,394 | — | — | |||
| SIC power settlement loss | 17,576,934 | 2,743,676 | 25,696,096 | |||
| Pension plan expense | 5,947,641 | 21,310,188 | 5,127,753 | |||
| Revenue recovery | 5,283,672 | — | — | |||
| Index UFIR Brasil Cerj | — | 7,000,397 | 1,759,059 | |||
| Penalties and fines | 12,794,528 | 4,474,469 | 7,525,875 | |||
| Cost of projects, inspections and other | 5,440,435 | 4,191,139 | 2,829,797 | |||
| Other taxes Colombia | — | — | 4,487,955 | |||
| Provision for real estate projects | 17,185,352 | — | — | |||
| Provision for write-off work in progress | 47,944,428 | — | — | |||
| Other taxes Argentina and Brazil | 6,968,611 | 9,833,886 | 6,902,111 | |||
| Loss on forward contracts and swaps | — | 1,171,257 | 13,326,522 | |||
| Write-off fixed assets | 7,482,112 | 16,029,887 | 20,830,282 | |||
| Others | 23,289,355 | 20,372,871 | 13,933,392 | |||
| Total | 244,163,588 | 252,038,400 | 207,355,499 | |||
| (1) | These amounts correspond to the net adjustments related to the translation of financial statements of foreign affiliates from the respective local country currency to US Dollars. |
F - 72
ENERSIS S.A. AND SUBSIDIARIES
Notes to the Consolidated Financial Statements – (Continued)
| Note 24. | Price-level Restatement |
The (charge) credit to income for price-level restatement is as follows:
| Year ended December 31, | ||||||||
| Index | 2002 | 2003 | 2004 | |||||
| Assets | ThCh$ | ThCh$ | ThCh$ | |||||
| Inventory | I.P.C. | 1,119,934 | 332,650 | 2,607,088 | ||||
| Current assets | I.P.C. | 6,270,387 | 9,875,155 | 5,081,800 | ||||
| U.F. | 52,993 | 12,805 | 2,249,081 | |||||
| Property, plant and equipment | I.P.C. | 73,690,642 | 23,951,380 | 53,701,497 | ||||
| Accounts receivable from subsidiaries | I.P.C. | 5,210,084 | 1,806,586 | 3,039,752 | ||||
| Investment in subsidiaries | I.P.C. | 2,769,356 | 2,040,182 | 4,505,287 | ||||
| Amortization of goodwill | I.P.C. | 26,696,881 | 6,415,892 | 17,229,094 | ||||
| Other assets | I.P.C. | 23,983,333 | 34,323,162 | 97,268,124 | ||||
| U.F. | 193,896 | 70,973 | 2,850,718 | |||||
| Price-level restatement of the income statement | 18,913,144 | (67,762 | ) | 1,128,728 | ||||
| Net credits - assets | 158,900,650 | 78,761,023 | 189,661,169 | |||||
| Liabilities and Shareholders’ equity | ||||||||
| Shareholders equity | I.P.C. | (36,622,580 | ) | (7,113,470 | ) | (63,692,887 | ) | |
| Current and long-term liabilities | I.P.C. | (81,034,282 | ) | (51,656,918 | ) | (81,481,325 | ) | |
| U.F. | (8,918,954 | ) | (1,448,020 | ) | (24,293,995 | ) | ||
| Minority interest | I.P.C. | 18,150,237 | (7,809,611 | ) | (14,889,909 | ) | ||
| Accounts payable to subsidiaries | I.P.C. - U.F. | (24,897,765 | ) | (16,067,616 | ) | (218,476 | ) | |
| Non-monetary liabilities | I.P.C. | (53,783 | ) | (95,620 | ) | — | ||
| U.F. | — | (74,620 | ) | (32,896 | ) | |||
| Price-level restatement of the income statement | I.P.C. | (20,383,621 | ) | 892,976 | (5,828,559 | ) | ||
| Net charge-liabilities and shareholders’ equity accounts | (153,760,748 | ) | (83,372,899 | ) | (190,438,047 | ) | ||
| Net credits (charge) to income | 5,139,902 | (4,611,876 | ) | (776,878 | ) | |||
F - 73
ENERSIS S.A. AND SUBSIDIARIES
Notes to the Consolidated Financial Statements – (Continued)
| Note 25. | Exchange Differences |
The (charge) credit to income for foreign currency translation is as follows:
| Year ended December, 31 | Year ended December, 31 | ||||||||||||||||
| Assets | Currency | 2002 | 2003 | 2004 | Liabilities | Currency | 2002 | 2003 | 2004 | ||||||||
| ThCh$ | ThCh$ | ThCh$ | ThCh$ | ThCh$ | ThCh$ | ||||||||||||
| Cash | US$ | 2,765,666 | 2,921,829 | 333,168 | Short-term debt due to banks and financial institutions | US$ | (2,726,138 | ) | 6,819,881 | (624,260 | ) | ||||||
| Euro | — | (1,562 | ) | — | Other | — | (3 | ) | — | ||||||||
| Other | (14,181 | ) | (244,829 | ) | (6,260 | ) | Current portion of long-term debt due to banks and financial institutions | US$ | 3,677,289 | 7,559,303 | 2,222,240 | ||||||
| Time deposits | US$ | 273,434 | (26,806,295 | ) | (6,131,516 | ) | Yen | (74,235 | ) | 57,473 | 14,655 | ||||||
| Other | (32,149 | ) | (7,095 | ) | 3,637 | Other | (250,637 | ) | 171,411 | (100,925 | ) | ||||||
| Marketable securities | US$ | 506,444 | (173,259 | ) | (9,088 | ) | Current portion of bonds payable | Euro | (27,049 | ) | 89,379 | 1,206 | |||||
| Other | — | (20,035 | ) | (68,628 | ) | Current portion of bonds payable | US$ | (2,176,529 | ) | 13,663,068 | 213,448 | ||||||
| Accounts receivable, net | US$ | 225,814 | (469,991 | ) | (52,570 | ) | Current portion of notes payable | US$ | (886,926 | ) | 2,304,677 | 518,049 | |||||
| Euro | — | 33,656 | — | Accounts payable | US$ | 489,577 | 112,790 | 75,120 | |||||||||
| Other | 44,035 | (48,731 | ) | (380,587 | ) | Euro | — | (47,008 | ) | 1,929 | |||||||
| Other | (892,031 | ) | 442,993 | 725 | |||||||||||||
| Prepaid expenses | US$ | 30,479 | (64,208 | ) | 6,594 | ||||||||||||
| Other current assets | US$ | 6,956,462 | 2,605,509 | (5,402,853 | ) | Miscellaneous payables | US$ | (672,041 | ) | 1,358,404 | 817,379 | ||||||
| Other | (145,801 | ) | (1,389 | ) | (126,401 | ) | Accrued expenses | US$ | (107 | ) | 656,381 | 184,185 | |||||
| Amounts due from related companies | US$ | — | (82,475 | ) | (10,432,016 | ) | Other | — | (999 | ) | 1,748 | ||||||
| Deferred income | US$ | (375,062 | ) | 19,840 | (9,915 | ) | |||||||||||
| Other current liabilities | US$ | 86,947 | 794,511 | 77,793 | |||||||||||||
| Other | — | 647,006 | — | ||||||||||||||
| Dividends payable | Other | 1,904 | 46 | 49 | |||||||||||||
| Non-current assets | Long-term liabilities | ||||||||||||||||
| Long-term receivables | US$ | 621,092 | (12,688,930 | ) | (4,288,417 | ) | Due to banks and | US$ | (23,445,177 | ) | 111,386,102 | 19,693,149 | |||||
| Other | 209,130 | (228,007 | ) | 7,077 | financial institutions | Yen | (187,142 | ) | 40,257 | 3,748 | |||||||
| Amounts due from related companies | US$ | 11,473,157 | (29,633,969 | ) | — | Euro | (62,619 | ) | 1,033 | 450 | |||||||
| Deferred expenses | US$ | 236,099 | — | — | Other | (381,716 | ) | 14,394 | 905,122 | ||||||||
| Other assets | US$ | 6,771,609 | (209,371,894 | ) | (32,823,991 | ) | Bonds payable | US$ | (25,876,177 | ) | 114,398,645 | 44,375,245 | |||||
| Forward contracts and swaps | US$ | 16,602,886 | — | 4,997,759 | Notes payable | US$ | (2,913,598 | ) | 6,121,987 | 1,554,147 | |||||||
| Accounts payable | US$ | 370,860 | (177,377 | ) | 1,679,494 | ||||||||||||
| Other long-term liabilities | US$ | (6,881,704 | ) | 11,123,478 | (2,823,908 | ) | |||||||||||
| Other | 2 | — | — | ||||||||||||||
| Forward | US$ | — | (9,481,659 | ) | — | ||||||||||||
| Total gain (loss) | 46,524,176 | (274,281,675 | ) | (54,374,092 | ) | Total gain (loss) | (63,202,309 | ) | 268,076,013 | 68,780,873 | |||||||
| Exchange difference - net loss | (16,678,133 | ) | (6,205,662 | ) | 14,406,781 | ||||||||||||
F - 74
ENERSIS S.A. AND SUBSIDIARIES
Notes to the Consolidated Financial Statements – (Continued)
| Note 26. | Extraordinary Items |
In this item, the Company shows the net equity 1.2% tax, in accordance with decree N°1,949 of August 29, 2002 of the Republic of Colombia; a tax that will be used for said country’s democratic security.
At December 31, 2002, 2003 and 2004, the subsidiaries paying this tax and the corresponding amounts are as follows:
| As of December 31, | ||||||
| Company | 2002 | 2003 | 2004 | |||
| ThCh$ | ThCh$ | ThCh$ | ||||
| Central Hidroeléctrica de Betania S.A. | 2,096,500 | — | — | |||
| Capital de Energía S.A. | 69,490 | — | — | |||
| Emgesa S.A. | 9,149,388 | — | — | |||
| Cam Colombia S.A. | 34,722 | — | — | |||
| Codensa S.A. | 11,814,281 | — | — | |||
| Total | 23,164,381 | — | — | |||
| Note 27. | Share issuance costs |
| a. | Expenses incurred at the close of these financial statements for issuing and placing the shares, outstanding at December 30, 2003, were recorded as described in Note 2 aa) and break down as follows: |
| As of December 31 | ||||
| 2003 | 2004 | |||
| ThCh$ | ThCh$ | |||
| Appraisal services | 77,209 | 77,209 | ||
| Printing costs | 14,303 | 14,303 | ||
| Legal cost | 204,989 | 204,989 | ||
| Financial adviser | 10,637,039 | 10,734,121 | ||
| DCV commissions | 3,065 | 3,065 | ||
| Bank commissions | 1,485,095 | 1,968,639 | ||
| Risk classification services | 143,103 | 143,103 | ||
| Total | 12,564,803 | 13,145,429 | ||
During the current fiscal year expenses for bank commissions have been recorded for ThCh$469,460, and expenses for financial consulting for ThCh$94,254 regarding capital increase.
| b. | Expenses incurred for issuing and placing debt instruments incurred each year in placing bonds are as follows: |
| As of December 31 | ||||
| 2003 | 2004 | |||
| ThCh$ | ThCh$ | |||
| Taxes | 2,231,224 | — | ||
| Commissions | 2,660,768 | — | ||
| Financial adviser | 874,661 | 381,109 | ||
| Insurance issue | — | 93,708 | ||
| Others | 56,775 | |||
| Total | 5,823,428 | 474,817 | ||
F - 75
ENERSIS S.A. AND SUBSIDIARIES
Notes to the Consolidated Financial Statements – (Continued)
| Note 28. | Cash flow statement | |
| (a) | Other financing disbursements: | |
| As of December 31 | |||||
| 2003 | 2004 | ||||
| ThCh$ | ThCh$ | ||||
| Commissions on debt refinancing | 58,618,168 | 4,650,978 | |||
| Forward contract payments | 41,837,045 | 27,554,783 | |||
| Derivative contracts premiums | 5,595,667 | — | |||
| Payments to Siemens A.G. Germany | 4,668,952 | — | |||
| Payments to Santander Leasing | — | 2,008,445 | |||
| Others | 8,211,550 | 154,412 | |||
| Total | 118,931,382 | 34,368,618 | |||
| (b) | Other receipts investment: | ||||
| As of December 31 | |||||
| 2003 | 2004 | ||||
| ThCh$ | ThCh$ | ||||
| Receipts from loans granted to Infraestructura 2000 | 49,096,825 | 1,760,516 | |||
| Capital return | 1,260,879 | — | |||
| Payments from OHL | — | 38,552,256 | |||
| Others | 675,341 | 261,588 | |||
| Total | 51,033,045 | 40,574,360 | |||
| (c) | Non-Cash Financing Transactions |
| Capital increase | |
On June 2, 2003, Elesur S.A. capitalized the loan that it held with Enersis S.A. for ThCh$1,002,376,998, which transaction did not generate a cash flow. Details of this transaction are explained in Note 22a).
In November 2003 there was a voluntary exchange of bonds in connection with the capital increase of Enersis. Holders converted ThCh$63,656,587 into 893.612.466 first issue shares; this operation did not generate any cash flow. Details of this transaction are referred to in Note 22a).
ENERSIS S.A. AND SUBSIDIARIES
Notes to the Consolidated Financial Statements – (Continued)
| Note 29. | Financial Derivatives |
As of December 31, 2004 the Company and its subsidiaries held the following financial derivative contracts with financial institutions with the objective of decreasing exposure to interest rate and foreign currency risk, as follows:
| Accounts | |||||||||||||||||||||||||
| Assets/Liabilities | Income | ||||||||||||||||||||||||
| Type derivative | Type contract | Nominal amount | Date of maturity | Item | Sale / Purchase | Hedged item | Amount | Amount Hedged item | Account | Amount | Realized | Unrealized | |||||||||||||
| US$ | ThCh$ | ThCh$ | ThCh$ | ThCh$ | ThCh$ | ||||||||||||||||||||
| FR | CCTE | 3,252,177 | I quarter 05 | Exchange rate | P/S | Bank obligations | 2,005,638 | 2,005,638 | — | — | — | ||||||||||||||
| FR | CCPE | 78,000,000 | I quarter 05 | Exchange rate | P | Bonds | 43,477,200 | 43,477,200 | Other liabilities s/t | (152,911 | ) | — | 222,775 | ||||||||||||
| FR | CCTE | 3,627,103 | II quarter 05 | Exchange rate | P/S | Bank obligations | 2,243,331 | 2,243,331 | — | — | — | ||||||||||||||
| FR | CCTE | 1,414,572 | III quarter 05 | Exchange rate | P/S | Bank obligations | 874,947 | 874,947 | — | — | — | ||||||||||||||
| FR | CCTE | 1,142,676 | IV quarter 05 | Exchange rate | S | Bank obligations | 708,394 | 708,394 | — | — | — | ||||||||||||||
| OE | CCTE | 123,000,000 | I quarter 06 | Interest rate | P/S | Bank obligations | 68,560,200 | 68,560,200 | Other liabilities s/t other assets l/t | (312,040 | ) | 957,269 | 83,857 | ||||||||||||
| OE | CCTE | 500,000,000 | II quarter 06 | Interest rate | P/S | Bank obligations | 278,700,000 | 278,700,000 | Other liabilities s/t other assets l/t | (2,293,644 | ) | (2,793,325 | ) | (254,871 | ) | ||||||||||
| S | CCPE | 5,000,000 | III quarter 05 | Interest rate | P | Bank obligations | 2,787,000 | 2,787,000 | Other liabilities s/t | 40,594 | — | 37,986 | |||||||||||||
| S | CCPE | 3,297,340 | I quarter 05 | Exchange rate | P | Bank obligations | 1,837,937 | 1,837,937 | Other liabilities s/t | (189,432 | ) | — | (190,216 | ) | |||||||||||
| S | CCPE | 12,230,000 | III quarter 05 | Exchange rate | P | Bank obligations | 6,817,002 | 6,817,002 | Other liabilities s/t | (814,873 | ) | — | (818,416 | ) | |||||||||||
| S | CCPE | 100,000,000 | IV quarter 06 | Exchange rate | P | Bonds | 55,740,000 | 55,740,000 | Other liabilities l/t | (7,238,283 | ) | 341,449 | (7,238,283 | ) | |||||||||||
| S | CCPE | 10,000,000 | IV quarter 07 | Exchange rate | P | Bank obligations | 5,574,000 | 5,574,000 | Other liabilities s/t | (490,392 | ) | — | (319,440 | ) | |||||||||||
| S | CCPE | 350,000,000 | I quarter 14 | Exchange rate | P | Bonds | 195,090,000 | 195,090,000 | Other liabilities l/t | (15,541,547 | ) | 859,202 | (15,541,547 | ) | |||||||||||
| S | CCPE | 250,000,000 | IV quarter 16 | Exchange rate | P | Bonds | 139,350,000 | 139,350,000 | Other liabilities l/t | (522,520 | ) | 785,315 | (522,520 | ) | |||||||||||
| S | CCTE | 50,000,000 | II quarter 06 | Exchange rate | P | Bank obligations | 27,870,000 | 27,870,000 | Other liabilities l/t | (264,903 | ) | — | (3,576,016 | ) | |||||||||||
| S | CCTE | 3,807,000 | III quarter 08 | Exchange rate | P | Bank obligations | 2,122,022 | 2,122,022 | Other liabilities l/t | (414,821 | ) | — | (427,587 | ) | |||||||||||
| S (1) | CI | 50,000,000 | III quarter 06 | Exchange rate | S | Other liabilities l/t | (1,191,862 | ) | — | 3,756,841 | |||||||||||||||
| S (1) | CI | 50,000,000 | III quarter 06 | Exchange rate | S | Other liabilities s/t | — | 566,672 | 373,124 | ||||||||||||||||
| (1) | Fr = Forward, S = Swap |
F - 77
ENERSIS S.A. AND SUBSIDIARIES
Notes to the Consolidated Financial Statements – (Continued)
| Note 30. | Commitments and Contingencies |
| Collateral held by third parties: |
| Commited assets | |||||||||||||||||||
| Balance payable of related debt | |||||||||||||||||||
| at December 31, | Release of guarantees | ||||||||||||||||||
Book value of | |||||||||||||||||||
| Type guarantee | Type | Currency | collateral | Currency | 2003 | 2004 | 2005 | 2006 | 2007 | ||||||||||
| Mortgage and pledge | Real Estate, properties | ThCh$ | 88,395,344 | ThCh$ | 14,709,718 | 13,763,815 | 3,228,325 | 2,222,587 | 2,222,587 | ||||||||||
| Bill of exchange | ThCh$ | 50,166 | ThCh$ | 54,778 | 50,166 | — | — | — | |||||||||||
| Chattel mortgage | Facilities | ThCh$ | 84,094,299 | ThCh$ | 34,654,484 | 25,394,018 | — | — | — | ||||||||||
Pledge over 45% of income | ThCh$ | 1,481,546 | ThCh$ | 5,873,124 | 4,407,491 | — | — | — | |||||||||||
| Pledge | Shares | ThCh$ | 85,461,842 | ThCh$ | 11,978,742 | 9,725,655 | — | — | — | ||||||||||
| Pledge | Facilities | ThCh$ | 20,605,136 | ThCh$ | 12,939,793 | 20,605,136 | — | — | — | ||||||||||
| Pledge | Facilities | ThCh$ | 28,984,800 | ThCh$ | 47,599,342 | 15,424,717 | — | — | — | ||||||||||
| Pledge | Shares | ThCh$ | 52,829,062 | ThCh$ | 92,284,033 | 73,848,366 | — | — | — | ||||||||||
| Bank bond | ThCh$ | — | ThCh$ | 1,342,066 | 214,539 | — | — | — | |||||||||||
| Financial guarantee | ThCh$ | — | ThCh$ | 172,855,180 | — | — | — | — | |||||||||||
| Guarantees of subsidiary obligations (1): | |||||||||||||||||||
| Committed assets | |||||||||||||||||||||||||
| Balance payable of related debt at December 31 | Release of guarantees | ||||||||||||||||||||||||
| Type | Currency Accounting | ||||||||||||||||||||||||
| Guarantee | Subsidiary | Relation | Value | Currency | 2003 | 2004 | 2005 | 2006 | 2007 | 2008 | |||||||||||||||
| J.P. Morgan & Co. Y.C.S.F.B. | Endesa Chile Internacional | Subsidiary | Guarantor | ThCh$ | 83,610,000 | ThCh$ | 92,940,092 | 83,610,000 | — | 83,610,000 | — | — | |||||||||||||
| Mitsubishi Co. | Cía. Eléctrica San Isidro S.A. | Subsidiary | Guarantor | ThCh$ | 25,394,018 | ThCh$ | 34,654,483 | 25,394,018 | — | — | — | 25,394,018 | |||||||||||||
| Banco Español de Crédito | Cía. Eléctrica Tarapacá S.A. | Subsidiary | Guarantor | ThCh$ | 16,082,048 | ThCh$ | 22,573,634 | 16,082,048 | — | — | — | 16,082,048 | |||||||||||||
| ABN Bank | Cía. Eléctrica Tarapacá S.A. | Subsidiary | Guarantor | ThCh$ | — | ThCh$ | 1,802,879 | — | — | — | — | — | |||||||||||||
| Banco Santander Central Hispano | Cía. Eléctrica Conosur S.A. | Subsidiary | Guarantor | ThCh$ | 73,848,366 | ThCh$ | 92,284,033 | 73,848,366 | — | — | — | 73,843,366 | |||||||||||||
| (1) | Unless otherwise stated, the guarantees in the table “Guarantees of Subsidiary Obligations” were provided by a subsidiary of the Company (the “Guarantor”) to a third party creditor that had entered into a new obligation with another subsidiary (the “Subsidiary Debtor”). If the Subsidiary Debtor is unable to meet the requirements of the related obligation, the Guarantor will be required to make future payments on behalf of the Subsidiary Debtor up to the remaining amount payable. |
F - 78
ENERSIS S.A. AND SUBSIDIARIES
Notes to the Consolidated Financial Statements – (Continued)
Litigation and other legal actions:
Enersis S.A.
| Plaintiff | : | Enersis S.A., Chilectra S.A., Empresa Nacional de Electricidad S.A., Elesur S.A. |
| Defendant | : | The Republic of Argentina |
| Court | : | CIADI Arbitration Panel |
| Case/Identification | : | (CIADI Case ARB/03/21) |
Compensation for losses caused to the Plaintiff’s investment in the Republic of Argentina is requested in connection with the participation in the power distribution concessionaire Edesur S.A. on the grounds of violation of the Investment Protection and Promotion Agreement entered into by the Republics of Chile and Argentina, and the Argentinean Government behavior through the passing of Public Emergency Law 25,561, dated January 6, 2002. The said behavior has also seriously affected the economic and financial balance of the Concession Contract between Edesur S.A. and the Argentinean National State. The said Law authorized a re-negotiation process of the Concession Contracts with the purpose of re-composing the economic-financial equation affected by the conversion to pesos, at US$1 = $1, of tariff values calculated in American dollars, and the prohibition to apply biased tariff updating. In the practice, this process has not been promoted by the Government, and no measures to prevent losses for the Plaintiff have been formalized. Edesur S.A. has been deprived of receiving the tariffs indicated in the regulations and in the said Concession Contract, therefore being harmful to the investment the Plaintiff companies have made.
Amount involved: US$574,739,500
| Chilectra S.A. | |||
| Plaintiff | : | Enersis S.A., Chilectra S.A., Empresa Nacional de Electricidad S.A., Elesur S.A. | |
| Defendant | : | The Republic of Argentina | |
| Court | : | CIADI Arbitration Panel | |
| Case/Identification | : | CIADI Case ARB/03/21 | |
Compensation of losses caused to the Plaintiff’s investment in the Republic of Argentina is requested in connection with the participation in the power distribution concessionaire Edesur S.A. on the grounds of non-fulfillment of the Investment Protection and Promotion Agreement entered into by the Republics of Chile, and Argentina and the Argentinean Government behavior through the passing of Public Emergency Law 25,561, dated January 6, 2002. The said behavior has also seriously affected the economic and financial balance of the Concession Contract between Edesur S.A. and the Argentinean National State. The said Law authorized a re-negotiation process of the Concession Contracts with the purpose of re-composing the economic-financial equation affected by the conversion to pesos, at US$1 = $1, of tariff values calculated in American dollars, and the prohibition to apply biased tariff updating. In the practice, this process has not been promoted by the Government, and no measures to prevent losses for the Plaintiff have been formalized. Edesur S.A. has been deprived of receiving the tariffs indicated in the regulations and in the said Concession Contract, therefore being harmful to the investment the Plaintiff companies have made.
F - 79
ENERSIS S.A. AND SUBSIDIARIES
Notes to the Consolidated Financial Statements – (Continued)
Amount claimed by Chilectra S.A.: US$624,238,650.
| Plaintiff | : | Soto Fernandez, Magali | |
| Defendant | : | Chilectra S.A. and Ingeniería Eléctrica Azeta Ltda. | |
| Court | : | 22nd Civil Court of Santiago | |
| Case/Identification | : | 2907-2001 |
Summary of proceedings: Indemnity for losses resulting from an electrocution accident which occurred on August 26, 1997, which caused the death of Nelson Manuel Cordova Astorga and very serious injuries to Juan Francisco Bouryssieres Salazar, both Ingeniería Eléctrica Azeta Ltda. workers.
| LAWSUIT SETTLED |
Amount US$15,800,000.
| Elesur S.A. | ||
| Plaintiff | : | Enersis S.A., Chilectra S.A., Empresa Nacional de Electricidad S.A., Elesur S.A. |
| Defendant | : | The Republic of Argentina |
| Court | : | CIADI Arbitration Panel |
| Case/Identification | : | (CIADI Case ARB/03/21) |
Summary of proceedings: Compensation of losses caused to the Plaintiff’s investment in the Republic of Argentina is requested in connection with the participation in the power distribution concessionaire Edesur S.A. on the grounds of non-fulfillment of the Investment Protection and Promotion Agreement entered into by the Republics of Chile and Argentina, and the Argentinean Government behavior through the passing of Public Emergency Law 25,561, dated January 6, 2002. The said behavior has also seriously affected the economic and financial balance of the Concession Contract between Edesur S.A. and the Argentinean National State. The said Law authorized a re-negotiation process of the Concession Contracts with the purpose of re-composing the economic-financial equation affected by the conversion to pesos, at US$1 = $1, of tariff values calculated in American dollars, and the prohibition to apply biased tariff updating. In the practice, this process has not been promoted by the Government, and no measures to prevent losses for the Plaintiff have been formalized. Edesur S.A. has been deprived of receiving the tariffs indicated in the regulations and in the said Concession Contract, therefore being harmful to the investment the Plaintiff companies have made.
Amount: US$98,731,260.
| Edesur S.A. | ||
| Plaintiff | : | Asociación Coordinadora de Usuarios Consumidores y Contribuyentes – Ente Nacional Regulador de la Electricidad (ENRE). |
| Defendant | : | Edesur S.A. |
| Court | : | N°2 Federal Civil and Commercial First Instance Court, Registry of the Court N° 6, La Plata |
| Case/Identification | : | 38676/03 |
Summary of proceedings: The said institution filed a measure through which it expects ENRE and EDESUR to be ordered to suspend of cabling works in Quilmes, Province of Buenos Aires, as well as the company’s “Sobral” substation due to the damage the installations may cause to the population health.
F - 80
ENERSIS S.A. AND SUBSIDIARIES
Notes to the Consolidated Financial Statements – (Continued)
Amount: Undeterminable
| Plaintiff | : | Edesur S.A. |
| Defendant | : | Transportes Metropolitanos Gral. Roca. |
| Court | : | First Instance National Commercial Court, Registry of the Court N° 1 |
| Case/Identification | : | 87934/03 |
Summary of proceedings: Edesur promoted an action to declare settlements in public property free-of-charge, taking into consideration that the company Transportes Metropolitanos General Roca S.A. (T.M.R.) intends to charge an annual rent for every crossing or power line wiring along the rails (existing or future) over land designated as railroad service property.
Amount: Undeterminable
| Plaintiff | : | Edesur S.A. |
| Defendant | : | Dirección de Vialidad of the Buenos Aires Province. |
| Court | : | The National Supreme Court of Justice |
| Case/Identification | : | E 213/01 |
Summary of proceedings: Edesur wants prevalence and application of the rights established in its Contract to be declared precedent over the provincial regulations.
Amount: Undeterminable
| Plaintiff | : | Edesur S.A. |
| Defendant | : | Buenos Aires City Government (“GCBA”) |
| Court | : | N° 7 Administrative and Tax Court of Buenos Aires City, Registry of the Court N° 13 |
| Case/Identification | : | 2955/00 |
Summary of proceedings: The provision through which the Buenos Aires City Government tries to charge an annual rent for each underground transformation center installed by Edesur in public roads is contested. At the same time, the provision tries to force Edesur to cover the costs resulting from the removal of the said centers whenever removal is necessary. The contested provision violates the Concession Contract.
F - 81
ENERSIS S.A. AND SUBSIDIARIES
Notes to the Consolidated Financial Statements – (Continued)
| Amount: Undeterminable | |||
| Plaintiff | : | Edesur S.A. | |
| Defendant | : | Buenos Aires City Government (GCBA) | |
| Court | : | N° 7 Administrative and Tax Court of the City of Buenos Aires, Registry of the Court N° 13. | |
| Case/Identification | : | 2956/01 | |
Summary of Proceedings: To contest a GCBA provision through which payment of procedure expenses on permits requested by Edesur for the installation of its lines is demanded, as well as payment for the corresponding inspections carried out by the GCBA, in addition to a rent for using public roads with power systems for the provision of power distribution public utilities.
Process status: Submission of trial briefings. Proceedings were transferred to the Federal Administrative Court where the procedure continues.
| Amount: Undeterminable | |||
| Defendant | : | Edesur S.A. | |
| Court | : | N° 11 Federal Administrative First Instance National Court, Registry of the Court N° 21. | |
| Case/Identification | : | 142321/02 | |
Summary of proceedings: The Users and Consumers Union wants a modification of the type of rate applied to the many condominium owners consortiums existing in the City of Buenos Aires and EDESUR users. This would imply an important reduction of the values to be invoiced in future to these consortiums, as well as the obligation for retrospective reimbursement of “unduly” received amounts.
Process status: Evidence stage. The accounting expert evidence stage ended. Its transfer was ordered.
| Amount: Undeterminable | |||
| Plaintiff | : | Edesur S.A. | |
| Defendant | : | Secretaría de Energía de la Nación. | |
| Court | : | N° 3 Federal Administrative First Instance National Court, Registry of the Court N° 5. | |
| Case/Identification | : | 1856/97 | |
Summary of proceedings: In accordance with a provision in Power Law 24065, the power sector concessionaire companies must pay a significant rate to the Power Regulating National Agency with the purpose of financing its controlling and regulating activities (the rate is paid by EDESUR, among other concessionaires.)
Process status: First instance sentence was pronounced in favor of the company. The counterparty appealed against the sentence.
| Amount: Undeterminable. | |||
| Compañía de Electricidade do Rio de Janeiro S.A. | |||
| Plaintiff | : | Meridional S/A Servicios, Emprendimientos y Participaciones. | |
| Defendant | : | Compañía de Electricidade do Rio de Janeiro S.A. | |
| Court | : | 9ª Vara de Hacienda Pública de Río de Janeiro | |
| Case/Identification | : | 98.001.048296-8 | |
Summary of proceedings: Mistral and Civel, represented by Meridional, filed disputes to be creditors of the old power distribution state company CELF (Centrais Elétricas Fluminenses S.A.”) on the grounds of works contracts entered into with the said company. In its representation, Meridional demands payment of certain collectable invoices and contract fines due to the above mentioned work contracts termination for an amount of R$136,085,827.20.
F - 82
ENERSIS S.A. AND SUBSIDIARIES
Notes to the Consolidated Financial Statements – (Continued)
Process status: The procedure had been suspended until appeals against other actions of the same nature filed by CIVEL AND MISTRAL against CELF are solved (discussion on the contract anticipated termination validity), which were won by CELF. These actions are not included herein because the Compañía de Electricidade do Rio de Janeiro S.A. is not part of them. This was due to the fact that the Court considers it necessary to examine the effect the final decision on the said actions may have on the case we are facing.
| Amount: US$106,808,116.73. | |||
| Plaintiff | : | Cibrapel S/A Industria de Papel y Embalajes. | |
| Defendant | : | Compañía de Electricidade do Rio de Janeiro S.A. | |
| Court | : | Vara Única de Guapimirim | |
| Case/Identification | : | 766 | |
Summary of proceedings: 1) To sentence Compañía de Electricidade do Rio de Janeiro S.A. to indemnify for material and moral losses resulting form the poor quality of the services provided by Compañía de Electricidade do Rio de Janeiro S.A. between 1991 and 1998. 2) To sentence the Compañía de Electricidade do Rio de Janeiro S.A. to reimburse the amounts paid due to a rate increase based on administrative resolutions (portarías) 38 and 45 of 1986, which are considered illegal by the Government and the Courts.
Process status: Compañía de Electricidade do Rio de Janeiro S.A. protested and, as an expert’s appraisal is necessary to verify the alleged indemnities due to power blackouts, the expert’s appraisal production stage was started.
| Amount: US$18.206.065, 95. | |||
| Plaintiff | : | ABRACON - Associação Brasileira do Consumidor. | |
| Defendant | : | Compañía de Electricidade do Rio de Janeiro S.A. | |
| Court | : | 4ª Vara Civil de São Gonçalo/RJ | |
| Case/Identification | : | 2000.004.012307-7 | |
Summary of proceedings: Contesting of the constitutionality of the “public lighting rate” (TIP), charged by Compañía de Electricidade do Rio de Janeiro S.A. in its invoices. Compañía de Electricidade do Rio de Janeiro S.A. argues that it is just a collector of the rate, lacking passive legitimacy.
Process status: The ruling declared the Compañía de Electricidade do Rio de Janeiro S.A. passive illegitimacy and accepted the defense preliminarily. Due to this sentence, on May 28, 2004, the Attorney’s General Office filed an appeal and we are waiting for the date the trial will take place.
| Amount: US$7,089,062.82. | |||
| Plaintiff | : | Núcleo de Defesa do Consumidor-NUDECON. | |
| Defendant | : | Compañía de Electricidade do Rio de Janeiro S.A. y LIGHT. | |
| Court | : | 8ª Vara Empresarial do Rio de Janeiro. | |
| Case/Identification | : | 1999.001.168990-1 | . |
Summary of proceedings: Collective civil lawsuit filed on December 13, 1999, with the purpose of preventing suspension of power supply to consumers in arrears, as well as to consumers in irregular situations (stealing of power.) Process status: Waiting for the resolution of the appeal filed by Compañía de Electricidade do Rio de Janeiro S.A. to the Higher Court. Once the appeal is resolved, if rejected, the case file will return to first instance for hearing and sentence.
| Amount: Undeterminable. | |||
| Plaintiff | : | Compañía de Electricidade do Rio de Janeiro S.A. | |
| Defendant | : | Unión Federal | |
| Court | : | 2ª Vara Federal | |
| Case/Identification | : | Ordinary Action 96.0035653-0 | |
F - 83
ENERSIS S.A. AND SUBSIDIARIES
Notes to the Consolidated Financial Statements – (Continued)
Summary of proceedings: 1) The tax immunity declaration of Compañía de Electricidade do Rio de Janeiro S.A. regarding the tax called COFINS; and 2) The Unión Federal sentence to reimburse payments for COFINS during the last five years, corrected and increased with the legal charges based on the decision processed in Court and contained in Security Order N° 92.0113589-4.
Process status: Sentence was pronounced declaring groundless the Compañía de Electricidade do Rio de Janeiro S.A. request. An appeal filed by Compañía de Electricidade do Rio de Janeiro S.A. is still pending.
| Amount: US$10,730,000. | ||
| Plaintiff | : | Unión Federal |
| Defendant | : | Compañía de Electricidade do Rio de Janeiro S.A. |
| Court | : | TRF First Section |
| Case/Identification | : | Annulment Action N° 97.02.09655-3. |
Summary of proceedings: The Unión Federal filed an annulment action against Compañía de Electricidade do Rio de Janeiro S.A. to the Second Region TRF with the purpose of annulling the ruling (Security Order Nº 92.0113489-4) that recognized its tax immunity regarding the COFINS withholding.
Process status: On February 2, 2003, members of the TRF – 2nd Region special agency unanimously rejected the appeal of Unión Federal/Hacienda Nacional, a ruling that was appealed against. This last appeal is pending.
| Amount: US$121,496,000. | |||
| Plaintiff | : | Compañía de Electricidade do Rio de Janeiro S.A. | |
| Defendant | : | Unión Federal | |
| Court | : | 2ª Vara Federal de Niterói. | |
| Case/Identification | : | Ordinary Action 96.0035652-1. | |
Summary of proceedings : Compañía de Electricidade do Rio de Janeiro S.A. wants tax immunity to be declared regarding its collection of tax called PIS, and Unión be sentenced to reimburse the total amounts collected during the last five years, starting from August, 1996, based on § 3 of article 155 of the Federal Constitution.
Process status: Sentence unfavorable to Compañía de Electricidade do Rio de Janeiro S.A. in first instance. Appeal to the Federal Regional Court pending.
| Amount: US$21,806,000. | |||
| Plaintiff | : | Compañía de Electricidade do Rio de Janeiro S.A. | |
| Defendant | : | Unión Federal | |
| Court | : | 2ª Vara Federal de Niterói. | |
| Case/Identification | : | Preventative Action 96.0034797-2 | |
Summary of proceedings : Preventative action in lawsuit by Compañía de Electricidade do Rio de Janeiro S.A. based on § 3 of article 155 of the Federal Constitution with the purpose of suspending the tax credit suit regarding the tax called PIS which is deposited under regulation periodically.
Process status: The sentence was not appealed against by the defendant. Therefore, the authorization to continue with the legal deposits was maintained. Taking into consideration the lawsuit procedures from the petition, the possibility of swing the ruling for provisional execution and the list of legally deposited values is being studied.
Amount: US$21,806,000.
F - 84
ENERSIS S.A. AND SUBSIDIARIES
Notes to the Consolidated Financial Statements – (Continued)
| Plaintiff | : | Compañía de Electricidade do Rio de Janeiro S.A. |
| Defendant | : | Unión Federal |
| Court | : | 4a Vara Federal de Niterói y 2ª Vara Federal de Niteroi |
| Case/Identification | : | Ordinary Action 96.0035652-1 and Ordinary Action 96.0035387-5. |
Summary of proceedings: Compañía de Electricidade do Rio de Janeiro S.A. wants to obtain the declaration of nonexistence of a legal-tax relation (tax immunity) regarding payment of the tax called FINSOCIAL and affecting its gross monthly income. Also, the company wants the Unión to be sentenced to fully reimburse the amounts collected during the last five years, from October 1996 and, therefore, the Unión to be sentenced to pay the difference between the payment value according to Laws 7,787/89, 7,894/89, and 8,147/90, and the amount owed according to Decree-Law 1,940/82, during the above mentioned period.
Process status: The Compañía de Electricidade do Rio de Janeiro S.A. and Unión Federal filed and appeal against the first instance sentence. Court records were sent to the Federal Regional Court. Hearing before the said Court is pending.
| Amount: U$7,269,000. | ||
| Plaintiff | : | Compañía de Electricidade do Rio de Janeiro S.A. |
| Defendant | : | Unión Federal |
| Court | : | 3rd Group – Federal Regional Court of the 2nd Region and 2ª Vara Federal de Niteroi |
| Case/Identification | : | Ordinary Action 96.0035652-1 and Appeal against Security Order 2000.02.01.055412-5 |
Summary of proceedings: This is a preventative constitutional action (“Mandado de Segurança Preventivo”) aimed to prevent the application of the 30% taxable profit limit imposed by the Unión Federal for the calculation of the IRPJ base and the CSLL negative calculation bases recorded until December 31, 1994, (excluding 1993.)
Process status: First instance sentence fully favorable to the Compañía de Electricidade do Rio de Janeiro S.A. interests. Hearing of the appeal filed by the Unión Federal to the Federal Regional Court pending since August 7, 2001.
| Amount: Undeterminable. | |||
| Plaintiff | : | Compañía de Electricidade do Rio de Janeiro S.A. | |
| Defendant | : | Unión Federal | |
| Court | : | 5th Group – Federal Regional Court of the 2nd Region and 2ª Vara Federal de Niterói. | |
| Case/Identification | : | Ordinary Action 96.0035652-1 Appeal against Security Order 1998.51.02.207129-6 | |
Summary of proceedings: It is the same as the previous lawsuit, but for fiscal years are 1993, 1995, and 1996, with profit generated in 1998 and after.
Process status: First instance sentence fully favorable to the Compañía de Electricidade do Rio de Janeiro S.A. interests. Hearing of the appeal to the Federal Regional Court of the 2nd Region pending since October 7, 2003.
| Amount: Undeterminable. | ||
| Plaintiff | : | Compañía de Electricidade do Rio de Janeiro S.A. |
| Defendant | : | Unión Federal |
| Court | : | 2ª Vara Federal de Niteroi |
| Case/Identification | : | Ordinary Action 96.0035652-1 Lawsuit 98.0207203-6 |
Summary of proceedings: This is a preventative constitutional action (“Mandado de Segurança”) with the purpose of ensuring the company the right to immediately and fully deduct the 1990 balance sheet indexing difference effects over devaluation, depreciation, and disposal of fixed assets for determining the calculation base for the Social Contribution over Profits – CSL. (Law 7,689/88) on the 1988 and following calendar years.
Process status: On May 19, 1998, sentence was pronounced only partially accepting the Compañía de Electricidade do Rio de Janeiro S.A. allegations. We are waiting for the publication of the ruling rejecting an appeal for reconsideration. After this it is possible to resort to higher courts.
Amount: US$20,000,000.
F - 85
ENERSIS S.A. AND SUBSIDIARIES
Notes to the Consolidated Financial Statements – (Continued)
| Plaintiff | : | Compañía de Electricidade do Rio de Janeiro S.A. | |
| Defendant | : | INSS – Instituto Nacional de Seguridad Social and FNDE – Fondo Nacional de Desarrollo de la Educación. | |
| Court | : | 8ª Vara Federal de Niterói. | |
| Case/Identification | : | Lawsuit 2000.51.01.011750-5. |
Summary of proceedings: Declaration of unconstitutionality of values collected as education wages by the Instituto Nacional de Seguridad Social and the Fondo Nacional de Desarrollo de la Educación during the May 1977 to April 1988 period is requested, and the resulting recognition of the Compañía de Electricidade do Rio de Janeiro S.A. right to credit the said values with contributions about to expire and collected by the INSS for future compensations. The said payment is said to be a tax in nature and a violation of tax legality and compliance.
Process status: Sentence partially accepted; appeals were filed to the Federal Regional Court of the 2nd Region; their solution is pending.
| Amount: U$15,356,150. | ||
| Plaintiff | : | Compañía de Electricidade do Rio de Janeiro S.A. |
| Defendant | : | Fondo Nacional del Desarrollo de la Educación – FNDE, Instituto Nacional del Seguro Social – INSS and State of Río de Janeiro |
| Court | : | Vara Federal de Niterói. |
| Case/Identification | : | Lawsuit 98.0203718-4 |
Summary of proceedings: This is a action with the purpose of declaring unconstitutional the contribution called “Salario Educación” this obtaining the reimbursement of values collected by the defendant between July 14, 1988, and May 4, 1998.
Process status: The tutelary action was not accepted and an appeal “Agravo de Instrumento” was filed (interlocutory sentence appeal.) The appeal has been pending in the Federal Regional Court since May 24, 2002.
| Amount: U$11,685,150. | ||
| Plaintiff | : | Compañía de Electricidade do Rio de Janeiro S.A. |
| Defendant | : | Superintendente Estadual de Fiscalización de la Secretaría de Estado de Hacienda and Inspector de la Inspectoría de Fiscalización Estadual – Contribuyentes de Grande Porte |
| Court | : | 11ª Vara de Hacienda Pública of the Rio de Janeiro State |
| Case/Identification | : | Lawsuit 1999.200.013.062-7 (2946/1) |
Summary of proceedings: This is a preventative constitutional action (“mandado de segurança preventivo”) aimed to prevent the limitation imposed by article 2 of Law 3,188/99 that restricted the right to use the credit resulting from the tax called ICMS in connection with the purchase of fixed assets goods.
Process status: On December 14, 1999, sentence was pronounced and the petition was accepted to declare the possibility for Compañía de Electricidade do Rio de Janeiro S.A. to fully use credits resulting from the ICMS for the purchase of fixed assets. Currently, the petition “Agravo de Instrumento” filed by the Rio de Janeiro State to the Federal Supreme Court is pending.
| Amount: U$14,805,300. | ||
| Plaintiff | : | Secretaría de la Receta Federal. |
| Defendant | : | Compañía de Electricidade do Rio de Janeiro S.A. |
| Court | : | Taxpayers Council of the Ministry of Finance. |
| Case/Identification | : | Infringement Procedure 0710200/00370/02 and Administrative Lawsuit 10730.002730/2003-13. |
F - 86
ENERSIS S.A. AND SUBSIDIARIES
Notes to the Consolidated Financial Statements – (Continued)
Summary of proceedings: Tax infringement for a supposedly unpaid difference corresponding to tax called COFINS. During the mandatory verification procedures, differences between the declared values, the registered values, and the collected values and those paid in connection with COFINS were verified for the December 2001 to June 2002 period.
Process status: On August 11, 2003, Compañía de Electricidade do Rio de Janeiro S.A. filed its contest to the Infringement procedure, which was accepted by the Comisaría de la Receta Federal de Juzgamiento de Niterói/RJ. Currently, the procedures are at the Comisario de la Receta Federal de Niterói/RJ waiting to be sent to the Taxpayers Council of the Ministry of Finance for the Voluntary Appeal ruling.
| Amount: US$32,870,000. | ||
| Plaintiff | : | Engineers Union of the Rio de Janeiro State in representation of 133 employees |
| Defendant | : | Compañía de Electricidade do Rio de Janeiro S.A. |
| Court | : | Vara do Trabajo de Niterói |
| Case/Identification | : | Enforcement Action 628/1993 |
Summary of proceedings: In Collective Agreements 263/84 and 282/85, effective from November 1984 to October 1985, and from October 1985 to November 1986, respectively, wage adjustment, 4% productivity payment, and 4% semi-annual readjustment clauses were established. These are financial clauses that determine a salary adjustment for engineers in a percentage determined in the collective agreements, in addition to a productivity bonus, and semi-annual salary readjustment.
Process status: It is at credit settlement stage against Compañía de Electricidade do Rio de Janeiro S.A. Waiting for the ruling on the appeal for reconsideration filed by Compañía de Electricidade do Rio de Janeiro S.A. against the temporary settlement before the Brasilia Labor Court.
| Amount: US$11,262,798.63. | ||
| Plaintiff | : | Secretaría de la Receta Federal. |
| Defendant | : | Compañía de Electricidade do Rio de Janeiro S.A. |
| Court | : | Taxpayers Board of the Ministry of Finance. |
| Case/Identification | : | Infringement Action 0710200/00370/02 and Administrative Lawsuit 10730.002674/2003-17. |
Summary of proceedings: Tax infringement due to supposedly unpaid difference of tax called IRPJ. The Infringement Action results from the improper compensation of fiscal losses, taking into consideration that the 30% compensation limit, adjusted by additions and exclusions provided and authorized by the income tax legislation on net profits was not observed. On the contrary, the company compensated the total of its real profit under Security Order 98.0207129-3, under procedure at the 1st Vara Federal of the Rio de Janeiro Judicial Section in Niterói.
Process status : On 08/08/2003, the Compañía de Electricidade do Rio de Janeiro S.A. filed an appeal against the Infringement Action that was partially accepted, to maintain the fiscal lawsuit in the remaining value of R$18,265,719.04, in addition to the arrears charges. Because of this, on July 27, 2004, Compañía de Electricidade do Rio de Janeiro S.A. filed a petition requesting to register in the Secretaría de la Receta Federal information systems the suspension of the IRPJ remaining balance demand, on the grounds of the ruling contained in the Security Order 98.0207129-3. However, the lawsuit proceedings are currently at the First Taxpayers Board of the Ministry of Finance waiting for the ruling on the Official Appeal filed by the Receta Federal.
| Amount: US$6,750,000. | ||
| Plaintiff | : | Secretaría de la Receta Federal. |
| Defendant | : | Compañía de Electricidade do Rio de Janeiro S.A. |
| Court | : | Comisaría de la Receta Federal de Juzgamiento. |
| Case/Identification | : | Infringement Action 00218 and Administrative Lawsuit 10730.002007/99-24. |
| Summary of proceedings: Tax infringement due to possible unpaid difference on tax called CSL. | ||
F - 87
ENERSIS S.A. AND SUBSIDIARIES
Notes to the Consolidated Financial Statements – (Continued)
Amount: US$6,800,000.
| Plaintiff | : | Selma de Souza and other 122 complainants. |
| Defendant | : | Compañía de Electricidade do Rio de Janeiro S.A. |
| Court | : | Segunda Vara del Trabajo de Niterói. |
| Case/Identification | : | Labor Demand 3142/1995. |
Summary of proceedings: The complainants, discharged from the company, want to be reinstated and be applied a stability guarantee.
Amount: US$21,501,706.48.
Coelce S.A.
| Plaintiff | : | Inácio Nunes Arruda & Others. |
| Defendant | : | Coelce. |
| Court | : | 2a Vara da Fazenda Pública – Ceará |
| Case/Identification | : | 2002.02.38915-4 |
Process status: The process has been suspended for more than a year, and it may be soon dismissed.
Codensa S.A.
| Plaintiff | : | Henry Patiño and Others. |
| Defendant | : | Codensa, Bogotá Capital District and Empresa de Energía de Bogotá S.A. ESP (EEB) |
| Court | : | Cundinamarca Administrative Court, Third Section – Sub-section “B”. |
| Case/Identification | : | Case file 03-0680. |
Summary of proceedings: The plaintiffs want: i) Termination of the agreement because it was entered into without compliance with the legal requirements, as the Capital District did not select the contractor through a public bidding; ii) The rate established by Codensa and the Capital District in January, 2002, is illegal and excessive; iii) The payment agreement on debts corresponding to 1998, 1999, and 2000, entered into in 2002, were at an illegal and harmful rate; iv) Amounts collected from 1998 to today are to be re-invoiced deducting the overcharge, which CODENSA should reimburse to the Capital District; and v) Payment of 15% incentive to the plaintiff (US$4 million) and from 10 to 159 person’s minimum wages (US$20,000).
Amount: US$25,000,000.
F - 88
ENERSIS S.A. AND SUBSIDIARIES
Notes to the Consolidated Financial Statements – (Continued)
| Plaintiff | : | Users of the public lighting service in La Calera Municipality. |
| Defendant | : | Codensa and La Calera Municipality. |
| Court | : | Cundinamarca Administrative Court, Second Section – Sub-section “A”. |
| Case/Identification | : | Case file 02-1012. |
Summary of proceedings: Codensa provides public lighting service to La Calera Municipality and another 90 municipalities in the Cundinamarca Province. With some of them, there is no written contract or authorization from the corresponding agency (Municipal Council and Mayor). The plaintiffs argue that there is no written contract for the service provision and, therefore, they demand reimbursement of the amounts collected. They also argue that the service to rural areas is invoiced although these areas have no public lighting.
Amount: Undeterminable.
Edelnor S.A.
| Plaintiff | : | Edelnor S.A.A. |
| Defendant | : | Superintendencia Nacional de Administración Tributaria -SUNAT-. |
| Court | : | First Court Specialized in Administrative Procedures |
| Case/Identification | : | Case file: 426-2004 |
Summary of proceedings: Legal procedure requesting partial annulment of Resolution 00100-5-2004 and recognition of the legality of the assets re-evaluation operation carried out by the company in accordance with Law 26283.
Amount: US$60,623,123.
Endesa S.A.
| Plaintiff | : | Sociedad Punta de Lobos S.A. |
| Defendant | : | Endesa, Celta and the Treasury of Chile |
| Court | : | 30th Civil Court of Santiago |
| Case/Identification | : | 4061-2002 |
Summary of proceedings: The plaintiff demands absolute annulment of assignment and transfer of any other legal transaction by Endesa to Celta regarding real estate forming the maritime lease granted to Endesa in the Punta Patache area, First Region, and its declaration of expiration by the Court.
Amount: Undeterminable.
| Plaintiff | : | Sociedad Punta de Lobos S.A. |
| Defendant | : | Endesa, Celta and Puerto Patache S.A. Sea Terminal |
| Court | : | Eight Civil Court of Santiago |
| Case/Identification | : | 129-2003 |
Summary of proceedings: The plaintiff requested the defendants mandatory fulfillment of the so-called “Bidding Contract” called by Celta and in which the latter, Endesa, Patache S.A. Sea Terminal, and Punta de Lobos S.A. participated. The plaintiff argues that the contract was not fulfilled.
F - 89
ENERSIS S.A. AND SUBSIDIARIES
Notes to the Consolidated Financial Statements – (Continued)
Amount: Undeterminable
| Plaintiff | : | Sociedad Punta de Lobos S.A. |
| Defendant | : | Treasury of Chile (ENDESA is third party involved) |
| Court | : | 21st Civil Court of Santiago |
| Case/Identification | : | 553-2003 |
Summary of proceedings: The plaintiff demanded annulment of Supreme Decree 139 of 2002, issued by the Ministry of Defense, Navy Department, on the grounds that the said Decree was issued in contradiction to the legal provisions regarding its issuance. According to this Decree, the expansion of the Endesa maritime lease was extended for the loading of salt through Puerto Patache, in the First Region.
Amount: Undeterminable.
| Plaintiff | : | Maria Elena Teresa Sola Ruedi |
| Defendant | : | Endesa, Minister of Economy, and Superintendent of Electricity and Fuels. |
| Court | : | Santa Barbara Court of First Instance |
Summary of proceedings: The demand is to change the easement regime for expropriation, and payment for a larger flooded surface. Regarding subsidy, re-assessment of the indemnity amount paid for the easement is demanded.
Amount: Undeterminable.
Amount: Undeterminable.
Pangue S.A.
| Plaintiff | : | Empresa Eléctrica Pangue S.A. |
| Defendant | : | Chilectra S.A. |
| Court | : | 18th Civil Court of Santiago |
| Case/Identification | : | 3886-99 |
Summary of proceedings: The action demands annulment of the obligation to pay compensation to regulated price users resulting from Power Rationing Decree 287 from the Ministry of Economy.
Amount: Undeterminable.
Compañía Eléctrica de Tarapacá S.A.
| Plaintiff | : | Sociedad Punta de Lobos S.A. |
| Defendant | : | Endesa, Celta, Minera Puerto Patache S.A. Sea Terminal |
| Court | : | Eighth Civil Court of Santiago |
| Case/Identification | : | 129-2003 |
Summary of proceedings: The plaintiff demanded the defendants be ordered to mandatorily fulfill of the so-called “Bidding Contract” called by Celta and in which the latter, Endesa, Patache S.A. Sea terminal, and Punta de Lobos S.A. participated. According to the plaintiff, the contract was not fulfilled.
F - 90
ENERSIS S.A. AND SUBSIDIARIES
Notes to the Consolidated Financial Statements – (Continued)
Process status: Sentence rejected the demand. Jurisdiction on the appeal filed by the plaintiff to the Santiago Court of Appeal pending. The preventive action prohibiting entering into actions or contracts on Puerto Patache continues in effect.
| Amount: Undeterminable. | ||
| Plaintiff | : | Sociedad Punta de Lobos S.A. |
| Defendant | : | Endesa, Celta and the Treasury of Chile |
| Court | : | 30th Civil Court of Santiago |
| Case/Identification | : | 4061-2002 |
Summary of proceedings: The plaintiff demands absolute annulment of assignment and transfer of any other legal transaction by Endesa to Celta regarding real estate forming the maritime lease granted to Endesa in the Punta Patache area, First Region, and its declaration of expiration by the Court.
| Process status: The parties were summoned for sentence. | ||
| Amount: Undeterminable. | ||
| Plaintiff | : | Celta |
| Defendant | : | Empresa Constructora Belfi S.A. |
| Court | : | Arbitration Court (Raúl Varela Morgan) |
Summary of proceedings: The legal action resulted from differences regarding construction of the Puerto Patache dock, whose concrete is contaminated with chloride.
Amount: Undeterminable.
| Plaintiff | : | Celta |
| Defendant | : | Foster Weehler |
| Court | : | Arbitration Court (Vasco Costa) |
Summary of proceedings: The legal action resulted from differences regarding construction of the Tarapacá Plant powerhouse, whose concrete is contaminated with chloride.
Amount: Undeterminable.
Hidroeléctrica El Chocón S.A.
Administración Federal de Ingresos Públicos (“AFIP”) - Dirección General Impositiva (“DGI”)
On December 28, 2000, the AFIP - DGI claimed under Company Resolution 166/00 (which officially assessed an amount of ThCh$328,256 on income tax corresponding to withholdings on beneficiaries abroad) that the Company omitted withholding income tax on certain payments made abroad in order to obtain a bank loan during fiscal year 1994. Also, it ruled that the Company must pay ThCh$745,797 as compensation interests calculated to December 20, 2000. The Company did not withhold the said amounts considering them income from a foreign source not subject to taxation by the beneficiaries. The Company filed its corresponding answer to the charges and rejected the tax adjustment carried out. Finally, the AFIP - DGI decided to apply the Company a ThCh$229,779 fine on possible infringement of article 45 of Law 11,683. On February 20, 2001, the Company filed an appeal to the National Fiscal Court.
F - 91
ENERSIS S.A. AND SUBSIDIARIES
Notes to the Consolidated Financial Statements – (Continued)
On December 28, 2000, the Company was notified under Resolution 204/00 that officially been assessed the taxes and charges payables on added value tax for the December 1993 to July 1995 period, that it was to compensate the amounts to be recorded with credit amounts and pay ThCh$148,533 on compensation interest to December 11, 2000. Also, it was ruled to apply to the Company a ThCh$195,907 fine on the possible infringement of article 45 of Law 11,683. The AFIP-DGI considers inappropriate Company’s determination of when taxability occurred, as it considers provisions in article 18 of the Value Added Tax Law rules and regulations decree applicable. The Company rejected the AFIP-DGI intention to apply article 18 of the Value Added Tax Law rules and regulations decree to the taxable facts perfected before the rules and regulations publication date in the Official Gazette. It was alleged that the said regulation is unconstitutional as well as application of decree 493/95 which pertained to the interests and fines on expired obligations or infringements, or committed before July 31, 1995. On February 20, 2001, the Company filed an appeal to the National Fiscal Court.
Royalties
On June 26, 2000, the Company was notified of a legal action regarding the collection of interest on royalties supposedly paid out of term. The legal action was started in the Province of Neuquén before the National Supreme Court of Justice and it includes an initial amount of approximately ThCh$294,469.
In addition, on September 27, 2000, the Company was notified of a new legal action in the Province of Neuquén against the National State and the hydro-electric plants of Comahue in order to collect royalties on the funds accumulated in the Sales Account. The said legal action does not state amount or date from which the claimed amounts are owed, but the action tries to collect 12% of the funds it understands each generator has contributed to the said account.
Dirección Provincial de Rentas of the Buenos Aires Province
On September 10, 2001, the Company received from the Dirección Provincial de Rentas of the Buenos Aires Province notification on the start of an official assessment for ThCh$324,071 (the amount does not include interests or fines), as taxation on the gross income corresponding to fiscal years from February 1995 to December 1998. The differences claimed result from: a) non-registration of the tax in the Buenos Aires Province between February 1995 and June 1996 regarding the contracts entered into by the Company, and b) application of a rate lower than the applicable one. On October 25, 2001, the Company entered a ThCh$120,192 debt in the easy payment terms regime provided by Law 12,727. On December 28, 2001, the Dirección Provincial de Rentas notified the Company on Resolution 655/01 that (i) determined that the Company paid by default the amount of ThCh$184,045 corresponding to the tax on gross income for the fiscal years from February to December 1995, January to December 1996, January to December 1998; and (ii) applied a fine of ten percent of the supposedly unpaid amount to the Company. On January 22, 2002, the Company filed an appeal reporting that the amount included in the easy payment terms regime had not been considered, and the reasons for which the rate indicated by the Dirección Provincial de Rentas is not applicable.
Hidroinvest S.A.
On December 27, 2000, the AFIP-DGI notified Hidroinvest S.A. on Resolution 519/00 that officially determined the amount of ThCh$729,283 as income tax for the 1993 fiscal year that Hidroinvest S.A. supposedly should have paid on the difference between the purchase and transfer values of the bonds handed over to the National State on the benefits obtained from the said operation, considering that a debt was paid for an amount larger than the bonds purchase value and ThCh$1,568,687 corresponding to compensation interest. Also, the AFIP-DGI applied Hidroinvest S.A. a ThCh$510,498 fine on an alleged infringement of article 45 of Law 11,683. The agency considered that Hidroinvest S.A. should have paid the tax on the difference between the acquisition and transfer values of the bonds handed to the National State and corresponding to the benefits obtained from the operation, considering that a debt for an amount larger than the bonds purchase cost was paid. The Company appealed against the resolution of the National Fiscal Court. Sentence was pronounced on May 26, 2004, confirming the Resolution regarding the tax and its interests and annulling the fine applied. In the fist case, Hidroinvest S.A. was sentenced to pay the legal costs. The company and the Treasury appealed against the sentence.
This sentence was appealed against to the Federal Administrative National Chamber of Appeal.
F - 92
ENERSIS S.A. AND SUBSIDIARIES
Notes to the Consolidated Financial Statements – (Continued)
With the purpose of preventing the start of the fiscal execution of the supposed credit determined by the AFIP-DGI and confirmed by the National Fiscal Court, on July 30, 2004, the Company paid the amount of ThCh$729,283 fine and ThCh$2,552,286 on interests, expressly putting on record that it did not agree with the payment resulting from the petition for reconsideration and limited appeal filed against the sentence of the National Fiscal Court.
On October 15, 2004, professional fees of the legal representative and the National Treasury attorney were established at ThCh$75,833 and ThCh$252,777, respectively, for their work during the processing of the case file before the National Fiscal Court. On November 2, 2004, an appeal was filed against the regulations, for overcharging. However, it is necessary to highlight that in the petition for reconsideration and limited appeal filed against the National Fiscal Court sentence, an appeal was filed against the payment of legal costs applied to Hidroinvest S.A. in connection with the tax adjustment. For this reason, if the petition is accepted in this point, the regulated professional fees should not be paid by the Company.
On November 30, 2004, petitions of appeal filed by both parties against the professional fees regulation were granted. The resolution was notified to the parties; therefore, it only remains for the case file to be sent to the Federal Administrative National Chamber of Appeal for consideration of the petitions of appeal.
Central Costanera S.A.
On July 25, 1990, the Italian Government authorized Medio Credito Centrale to grant the Government of the Republic of Argentina a financial credit of up to US$93,995,562 to finance the purchase of goods and services of Italian origin and used in the restoration of four groups in the steam-electric power plant property of Servicios Eléctricos del Gran Buenos Aires (“SEGBA”). The said credit financed the purchase of goods and services included in Work Order 4322 (the "Order,") issued by SEGBA to a trust headed by Ansaldo S.p.A. of Italy. According to the terms in the "Agreement on Work Order 4322": (i) SEGBA mandated Central Costanera S.A. to manage the execution of the services in the Order and executed the work and services that according to the Order corresponded to SEGBA; and (ii) Central Costanera S.A. undertook to pay the National Energy Department (the "Energy Department") the capital share and interests resulting from the credit granted by Medio Credito Centrale, at a 1.75% annual rate (the "Agreement.") As a guarantee of fulfillment of the economic obligations undertaken by Central Costanera S.A., the buyers -holder of class "A" shares of Central Costanera S.A.- established a pledge on the total of class "A" shares of their property. If the agreement is not fulfilled and the guarantee is executed, the Energy Department may immediately proceed with the sale of the shares in guarantee through a public bidding, and exercise the political rights corresponding to the pledged shares.
Through the application of Law 25,561, Decree 214/02, and its rules and regulations, Central Costanera S.A. payment obligation resulting from the Agreement has been "pesified" to the exchange rate of one peso equal to an American dollar, in addition to the reference stabilization factor (“CER,”) and maintaining the obligation original interest rate. On January 10, 2003, the National Executive Branch issued Decree 53/03 that modified Decree 410/02, incorporating section j) to its article one. Through this regulation, "pesification" is excluded from the obligation applied to provincial states, municipalities, and companies from the public and private sector of providing amounts of money in foreign currency to the National Government when the amounts result from subsidiary or other nature loans and guarantees originally financed by multilateral credit agencies or originated in liabilities assumed by the National Treasury and refinanced with foreign creditors.
Central Costanera S.A. considers that the loan resulting from the Agreement does not fit in any of the provisions in Decree 53/03 and, if it did, there are solid reasons that determine that Decree 53/03 is unconstitutional because it openly violates the principle of equality and the property right established in the National Constitution. If the said provisions were complied with, the contingency would imply, to December 31, 2004, decrease of the period net profits of around US$8 million, and an indebtedness increase of around US$20 million. To this date, the Energy Department has not claimed against the “pesified” payments from Central Costanera S.A.
To December 31, 2004, the Central Costanera S.A. debt regarding the Agreement and including the interest earned reaches US$20,656,020, while at December 31, 2003, it was US$22,593,478.
F - 93
ENERSIS S.A. AND SUBSIDIARIES
Notes to the Consolidated Financial Statements – (Continued)
Edegel S.A.
| • | Edegel / Sunat |
As a result of the auditing of tax obligations compliance on income tax during the 1995 to 1999 fiscal years, on December 7, 2001, Edegel was notified by SUNAT on resolutions of assessment and fine for ThUS$90,290.17. The main objection referred to real estate, machinery, and equipment devaluation provision for every audited period.
The observation “Fiscal Year Provisions, Real Estate, Machinery, and Equipment Devaluation” corresponding to the 1999 fiscal year meant, in management’s opinion, a violation of the Tax Stability Agreement entered into with the Supreme Government, because SUNAT founds its observation on the Seventh Temporary and Final Provision of Law 27034, which modified the income tax general regime, under the said Agreement. On mutual agreement, the parties submitted the differences to the decision of an arbitration court. On April 22, 2002, the said court ruled declaring Edegel legal action unfounded and the Seventh Temporary and Final provision of Law 27034 non-applicable.
Before the arbitral award, on March 19, 2002, through Administration Resolution 015-4-14948, the Administration declared the demand filed by Edegel against the assessment and fine resolutions partially founded, and maintained the most significant observations. This resolution was appealed by Edegel to the Fiscal Court on April 10, 2002.
On November 20, 2002, the Fiscal Court issued Resolution 06619-4-2002, stating that the arbitral award must be respected and, accordingly, the Seventh Temporary and Final Provision of Law 27034 is not applicable to Edegel while its Tax Stability Agreement is in effect. However, the Fiscal Court also declared that Administration Resolution 015-4-14948 is invalid because the administrative procedure was not suspended in the first instance while the arbitration was being solved, and ordered the return of the case file to the Sunat for solution, taking into consideration the arbitral award, and for the ruling taking into consideration the applicable interpretation methods and, if necessary, qualified taxable facts in accordance with Regulation III of the Tax Code Single Text Preliminary Title.
On July 10, 2003, Edegel was notified through Administration Resolution 0150150000032, according to which the Tax Administration concluded that tax benefits regulated by Law 26283 and its rules and regulations are not applicable to the company as no real separation occurred in 1996. Also, validity of the assessment that sustained the market value attributed as accounting cost of the goods purchased during the separation process was questioned, because the methodology established in the General Assessment Rules and Regulations was not applied.
On August 1, 2004, Edegel filed a petition of appeal against the said Administration Resolution 0150150000032, attaching a series of evidence that included an assessment prepared, on its request, by the Technical Assessment Agency of Peru, which established that to November 28, 1995, the values of the fixed assets goods transferred due to the company reorganization reached a total amount of US$868,381,396.00, which, in terms of assessment engineering, virtually matches the amounts provided in the expert’s appraisal that supported the revaluation carried out due to the use of Law 26283 regime.
On the other hand, on November 14, 2003, Edegel filed a written document partially giving up the appeal filed against Administration Resolution 0150150000032, and through which it accepts the validity of a series of observations made by SUNAT (paying the omitted tax and its corresponding interests) and maintains its contents regarding the three more significant observations, such as: (i) observation on excessive devaluation as the result of ignorance of use of Law 26283 due to application of Regulation VIII of the Tax Code Preliminary Title and to an alleged invalidity of the assessment; (ii) the observation on the difference regarding liabilities exchange in foreign currency corresponding to fixed assets of 1998 and 1999 fiscal years; and (iii) the observation on the intangible depreciation and provisions for doubtful collection accounts.
F - 94
ENERSIS S.A. AND SUBSIDIARIES
Notes to the Consolidated Financial Statements – (Continued)
On September 10, 2004, through resolution 06686-4-2004, the Fiscal Court ruled the partial discontinuance of the appeal filed by EDEGEL on November 14, 2003, with the purpose of taking advantage of the SEAP. Also, the Fiscal Court ruled that application of Regulation VIII of the Tax Code lacks validity, for which the Tax Administration concluded that the split of Talleres Moyopampa was not effective and disregarded the assets transfer carried out within its framework. Regarding assets revaluation with tax purposes carried out by the company, the Tax Administration will have to determine the assets’ book cost and, if the Administration considers that this amount exceeds the market value, the corresponding adjustment will be carried out. On the other hand, the observation regarding the exchange difference for liabilities in foreign currency corresponding to fixed assets of the 1998 and 1999 fiscal years, and the observation on intangible depreciation and provisions for doubtful collection accounts was confirmed.
| • | Note on General Sales Tax for the 2000 Period |
On December 27, 2004, Edegel was notified the assessment and fine resolutions for an approximate amount of ThUS$8,226.69 (including tax as well as interests and fines). The main observation is Sunat ignorance of the economic reality corresponding to a transaction carried out in 2000 by Edegel and its controller Generandes.
Edegel and Generandes entered into a Technical Assistance Contract for the Development and Management of Projects, according to which Generandes, directly or indirectly, would provide Edegel engineering, development, consulting, technical assistance, and construction supervision services for the development and construction of the hydro-electric power generating Yanango and Chimay projects.
Generandes sub-contracted its shareholders Entergy Peru and Conosur to provide, on its behalf, the services it had undertaken. Contracts were signed with both companies and the total of the undertaken obligations was transferred to them in exchange for a fee.
Sunat questions the effective service provision based on the following arguments:
| 1. | It considers that Generandes, as well as Conosur and Entergy Peru (the companies sub-contracted by Generandes), are holdings without capacity to provide the said services. | |
| 2. | It considers that, without documentation proving that Conosur and Entergy Peru sub-contracted their shareholders (Endesa of Chile and Entergy Co. from the United States, respectively) to provide the services to Edegel, it is not possible to accept the documentation submitted by Edegel and prepared by personnel from Endesa Chile and Entergy Co. | |
| 3. | It considers that development and management of the Yanango and Chimay projects were carried out by Edegel itself through its project management, and not by a third party.Therefore, SUNAT concludes that it is not possible to apply the Sales General Tax credit right resulting from the invoices issued by Generandes because it has been established that services were not provided by Generandes. |
The company external legal advisors consider that Sunat evaluation of the supporting documentation submitted by the company is subjective and not sufficient to call the operation non-existing, as SUNAT concludes that the service existed, but was provided by officials and directors from Edegel itself. SUNAT has not taken into consideration that the said officials did not receive salaries from Edegel (they were not employees, therefore, they were not in the payroll) or fees corresponding to the said services. Also, Sunat has not taken into consideration that it is obvious that a director’s tasks do not include managing projects or carrying out their engineering.
SUNAT feels it has proved that the company received a free service from these official and from other personnel from Endesa Chile and Entergy Co. and that, at the same time, the company paid Generandes for a non-existing service. Although it admits that the projects were completed (but, according to SUNAT, under these officials free supervision and consulting,) it concludes that there is no motive between payment to Generandes and Edegel income generation, as the said payments are not connected with the services received by its own personnel (employees and directors) who worked without collecting any salary or fee whatsoever.
F - 95
ENERSIS S.A. AND SUBSIDIARIES
Notes to the Consolidated Financial Statements – (Continued)
The company will appeal against the assessment and fine resolutions in connection with this observation, rejecting the Administration arguments for considering the initially submitted evidence insufficient. The company will submit additional evidence regarding the service received. In the opinion of the company’s external legal advisors, the Court should disregard SUNAT observations to the evidence provided by the company and assess it again in order to verify whether they support the service provision.
Talleres Moyopampa / Sunat
On July 16, 1997, Talleres Moyopampa S.A. (former Empresa de Generación Eléctrica de Lima S.A.) was notified with Assessment Resolution 012-3-05475 and Fine Resolution 012-2-11085.
Through the said Assessment Resolution, SUNAT demands payment of ThUS$351 in addition to the corresponding interest for ThUS$270.47, in order to settle the payment of income tax corresponding to the 1994 fiscal year, as it wrongly considers that payment on those taxes corresponding to May and June, 1994, were not made.
On the other hand, the Fine Resolution penalizes for the company for the amount of ThUS$351, and ThUS$270.47 corresponding to interests, for allegedly having infringed section 1 of article 178 of the Tax Code in the company’s annual income tax return corresponding to 1994.
On August 15, 1997, Talleres Moyopampa S.A. filed a remedy of complaint against the said resolutions, sustaining that the Agreement signed with the Ministry of Economy and Finance within the ELECTROLIMA privatizing process established the latter as the sole entity responsible for the taxes that the Tax Administration may determine. Also, it was alleged that during the first half of the 1994 fiscal year, the period to which the observations correspond, ELECTROLIMA was in charge of managing the old Edegel S.A.A.
The remedy of complaint filed by Talleres Moyopampa S.A. was disregarded through Administration Resolution 015-4-07866, for which the company filed the corresponding appeal to the Fiscal Court (Case file 2749-98.)
Currently, the case file is with the Fiscal Court Resolution 9603-2-2001, which declares the Administration Resolution 015-4-07866 invalid and groundless and orders the Tax Administration to issue a new ruling, taking into consideration the scope of the Agreement signed with the Public Treasury General Department of the Ministry of Economy and Finance.
Secondary liability attribution to Edegel
On August 12, 1998, Edegel (a company split from Talleres Moyopampa S.A.) was notified through Administration Resolution 012-4-04453, with the alleged purpose of ensuring payment of the tax debt demanded from Talleres Moyopampa S.A. of the above-mentioned proceedings. It has been attributed secondary liability due to its purchase of a part of the assets and liabilities of the said company.
In these circumstances, and through a written document filed on September 7, 1998, Edegel supported Talleres Moyopampa S.A. contesting appeals. However, on December 14, 1998, SUNAT issued Administration Resolution 015-4-09092 declaring Edegel claim groundless.
On January 21, 1999, Edegel filed and appeal against Administration Resolution 015-4-09092, where the case file was joined with that indicated as background to this procedure.
Through Fiscal Court Resolution 9609-2-2001, this body has declared invalid and groundless Administration Resolution 015-4-09092 in the parts regarding Assessment Resolution 012-03-05475 and Fine Resolution 012-2-11085; therefore, the Tax Administration must rule again due to the same reasons stated in the previous section.
F - 96
ENERSIS S.A. AND SUBSIDIARIES
Notes to the Consolidated Financial Statements – (Continued)
Edegel / Essalud
Currently, the administrative demand filed on July 31, 1996, against the determination of the amount to be paid carried out by the IPSS based on Decree Laws 22482 (Health), 19990 (Pensions,) and 18846 (Labor Accidents) for the period between April 1994 and March 1996 is being processed.
The amount considered, regarding the three items, is ThUS$2,499.81 plus interest. The company should have a similar result to that obtained in the other two procedures that concluded one year ago on the same items. If so, the amount stated by the health regime of Decree Law 22482 of ThUS$2,161.87 plus interests would be deducted, leaving a probable amount to be paid, of ThUS$337.93 plus interest.
Emgesa S.A.
There is an environmental contingency group action against Emgesa S.A. E.S.P., the Empresa de Energía de Bogotá S.A. E.S.P., and CAR for alleged material and moral losses caused by the environmental damage in the Muña reservoir. The plaintiffs’ initial demand is for ThCh$708,695,120.
Enersis S.A. are defendants or plaintiffs in other minor legal procedures with probable or reasonably possible loss risk, and whose individual effects in the case of non-favorable rulings is not significant in the current consolidated financial statements.
Restrictions:
Enersis S.A.
The Company’s loan agreements establish an obligation to comply with the following financial ratios, on a consolidated level:
| • | Enersis’s ratio of debt and cash flow for four quarters and of its Chilean subsidiaries does not exceed 7.0; |
| • | The ratio of consolidated debt to EBITDA for four consolidated quarters, does not exceed 5.0; |
| • | The ratio of Enersis and its Chilean subsidiaries cash flow to financial expenses for four quarters, not less than 1.60; |
| • | The consolidated debt to shareholders’ equity plus minority interest does not exceed 80%; |
| • | No less than 50% of the total consolidated assets of Enersis S.A. should belong to companies whose business is regulated; |
| • | Minimum shareholders’ equity at least equal to ThCh$467,560,350 (U.F.27 million) |
As of December 31, 2004 all these obligations have been met.
Chilectra S.A.
The Company did not have any management restrictions or financial covenants during the years ended December 31, 2003 and 2004.
The Company holds long-term energy purchase contracts with Endesa, Gener S.A., Pangue S.A., Colbún Machicura S.A., Carbomet Energía S.A., Empresa Eléctrica Puyehue S.A. (formerly Pilmaiquén), Sociedad Canalistas del Maipo and Iberoamerica de Energía IBENER S.A., the terms of which extend to beyond 2004, in order to ensure its supply and corresponding cost.
F - 97
ENERSIS S.A. AND SUBSIDIARIES
Notes to the Consolidated Financial Statements – (Continued)
Endesa S.A.
On a consolidated level, Endesa must comply with financial covenants and requirements derived from loan agreements with financial institutions, among which are the following:
| • | Endesa’s ratio between debt and cash flow for four quarters and that of its Chilean subsidiaries did not exceed 9.4x; |
| • | The ratio of consolidated debt to EBITDA for four consolidated quarters, not exceeding 6.30x; |
| • | The ratio of Endesa Chile and its Chilean subsidiaries cash flow to financial expenses for four quarters, not less than 1.5x; |
| • | The ratio of consolidated debt to shareholders’ equity plus minority interest not exceeding 112.50%; |
| • | Assets corresponding to companies whose business is regulated, is not to be less than 50% of the total consolidated assets; |
| • | Minimum shareholders’ equity at least equal to ThCh$779,267,250 (U.F.45 million) |
As of December 31, 2004 all these obligations have been met.
Pehuenche S.A.
The Santander Investment Bank Ltd. and the Chase Manhattan Bank N.A., in relation to loans granted to the Company, place obligations and restrictions on Pehuenche S.A., some of which are of a financial nature, such as: long-term financial liabilities not exceeding 1.5 times the shareholders’ equity, and a minimum company equity of ThCh$164,511,975 (UF9,500,000).
As of December 31, 2004 all these obligations have been met.
Central Costanera S.A.
In virtue of the arrangement in Annex VI-A of the “Concurso Público Internacional para la Venta de las Acciones de Central Costanera Sociedad Anónima” (International Public Tender for the Sale of shares of Central Costanera Sociedad Anonima), the domain of Central Costanera S.A.’s land was transferred subject to the condition that it used as the location for an electric power plant for a term of twenty-five years as of the date of possession.
If under any circumstance whatsoever the land ceases to be used for that purpose during the indicated year, its domain shall be considered revoked due to this cause, and return of such title will be effective immediately, and as a matter of law, to SEGBA S.A. or, as applicable, to the National State.
The most demanding requirements in respect to financial coefficients are those contained in the Syndicated loan, the Agent of which is BBVA Banco Francés, and in the bilateral with JP Morgan, which are the following:
| • | The long-term debt with third parties cannot exceed US$235 million; the debt with a maximum of 30 days cannot exceed US$180 million; |
| • | Clauses that restrict change of Control; |
| • | Clauses that restrict payments to shareholders, including subordination of the related debt. |
As of December 31, 2004 these obligations have been met.
Edegel S.A.
Financial indicators originated by credit contracts, Bonds Program and Short-term instruments:
| • | Debt ratio no greater than 0.75 |
As of December 31, 2004 these obligations have been met.
F - 98
ENERSIS S.A. AND SUBSIDIARIES
Notes to the Consolidated Financial Statements – (Continued)
Hidroeléctrica Betania S.A.
Covenants include limitations on the payment of related debt and limitations on change in control and the following financial ratios:
| • | EBITDA/Senior Financial Debt no less than 1.4 |
| • | Cash Flows before Dividend Payments/Senior Financial Debt no less than 1.1 |
| • | Shareholders’ Equity/Senior Debt no less than 2.5. |
At December 31, 2004 these covenants have been fully met.
Other restrictions
As a common and habitual practice for some bank loan debts and also in capital markets, a substantial portion of Enersis S.A.’s financial indebtedness is subject to cross-failure provisions. Some failures of relevant subsidiaries, if not corrected in time (as to those specific provisions allowing a year of time to correct the problem), might result in the cross-failure at the Endesa-Chile and Enersis S.A. level., and, in this case, a significant percent of Enersis S.A.’s consolidated liabilities might eventually become due on demand.
Non-payment, after any applicable grace period, of these companies’ debts or of those corresponding to some of their most relevant subsidiaries for an individual amount exceeding the equivalent of 30 million dollars, would cause advanced payment of syndicated credits contracted in 2004. Also, non-payment, after any applicable grace period, of these companies’ debts or of those corresponding to any of their subsidiaries for individual amounts exceeding the equivalent of 30 million dollars, would cause advanced payment of Yankee bonds. In addition, some credit agreements contain provisions according to which certain events different from non-payment in these companies or in any of their most relevant subsidiaries, such as bankruptcy, insolvency, adverse executed legal sentences for amounts larger than US$ 50 million, and expropriation of assets, may cause those credit acceleration clauses to be in effect.
There are no clauses in the credit agreements through which changes in these companies corporate or debt classification by risk classification agencies may cause an obligation to make debt prepayments. However, according to the Standard & Poor (S&P) risk classification agency, a variation in the foreign currency debt risk classification produces a change in the applicable margin of syndicated credits contracted in 2004.
At December 31, 2004, these obligations and restrictions have been fully met.
The Company has subsidiaries that must abide by certain financial rations and covenants that require minimum equity levels or that contain other characteristics that restrict the transfer of assets to the parent company. The amounts of Enersis's proportionate share of restricted net assets in consolidated subsidiaries as of December 31, 2003 is ThCh$1,004,900,181.
Note 31.Sureties Obtained from Third Parties
Enersis S.A.
The Company has received certificates of deposit for ThCh$242,994 at December 31 2004 (ThCh$233,785 in 2003).
Chilectra S.A.
The Company presents among its current liabilities, deposits received in cash for the use of temporary connections by customers of the company for ThCh$49,332 and ThCh$28,237 at December 31, 2003 and 2004, respectively.
Inmobiliaria Manso de Velasco Ltda.
The Company has received guarantees from third parties to guarantee obligations incurred in the acquisition of assets of ThCh$1,738,223 as of December 31, 2004 (ThCh$3,161,818 in 2003).
F - 99
ENERSIS S.A. AND SUBSIDIARIES
Notes to the Consolidated Financial Statements – (Continued)
Compañía Americana de Multiservicios Ltda.
Endesa S.A.
San Isidro S.A.
Compañía Eléctrica de Tarapacá S.A.
Pangue S.A.
F - 100
ENERSIS S.A. AND SUBSIDIARIES
Notes to the Consolidated Financial Statements – (Continued)
| Note 32. | Foreign Currencies |
As of December 31, 2003 and 2004, foreign currency denominated assets and liabilities are as follows:
| (a) | Current assets |
| As of December 31, | |||||
| Account | Currency | 2003 | 2004 | ||
| ThCh$ | ThCh$ | ||||
| Cash | $ no Reaj. | 4,475,428 | 3,150,244 | ||
| US$ | 1,051,927 | 6,580,859 | |||
| $ Col. | 8,128,041 | 27,027,163 | |||
| Soles | 1,046,050 | 1,341,377 | |||
| $ Arg. | 4,226,021 | 2,389,222 | |||
| Reales | 8,102,021 | 16,005,549 | |||
| Time deposits | US$ | 150,656,992 | 234,366,548 | ||
| $ Col. | 64,890,182 | 177,779,349 | |||
| Soles | 1,792,199 | 1,095,113 | |||
| $ Arg. | 4,520,396 | 5,855,305 | |||
| Reales | 40,801,202 | 31,647,544 | |||
| Marketable securities | $ no Reaj. | 4,993 | 4,993 | ||
| US$ | 2,901,493 | 4,686,733 | |||
| $ Col. | 236,903 | 927,807 | |||
| $ Arg. | 8,291,246 | 6,702,004 | |||
| Accounts receivable, net | $ Reaj. | 1,072,500 | 3,539,809 | ||
| $ no Reaj. | 104,405,263 | 116,070,684 | |||
| US$ | 6,945,168 | 7,281,743 | |||
| $ Col. | 86,307,575 | 109,719,689 | |||
| Soles | 29,562,766 | 33,403,904 | |||
| $ Arg. | 44,785,076 | 49,950,207 | |||
| Reales | 205,771,276 | 208,774,093 | |||
| Notes receivable | $ Reaj. | 4,630,918 | — | ||
| $ no Reaj. | 1,333,327 | 891,218 | |||
| US$ | 647,945 | 233,126 | |||
| Soles | 23,366 | — | |||
| $ Arg. | — | 21,308 | |||
| Reales | 1,936,137 | 1,682,362 | |||
| Other receivables | $ Reaj. | 40,900,332 | 2,985,441 | ||
| $ no Reaj. | 9,938,644 | 28,429,986 | |||
| US$ | 1,335,543 | 983,456 | |||
| $ Col. | 20,255,164 | 11,449,313 | |||
| Soles | 5,377,821 | 4,926,064 | |||
| $ Arg. | 977,538 | 1,280,003 | |||
| Reales | 16,731,819 | 13,759,939 | |||
| U.C. | 1,032,262 | — | |||
F - 101
ENERSIS S.A. AND SUBSIDIARIES
Notes to the Consolidated Financial Statements – (Continued)
| As of December 31, | |||||
| Account | Currency | 2003 | 2004 | ||
| ThCh$ | ThCh$ | ||||
| Amounts due from related companies | $ no Reaj. | 5,822,947 | 2,170,591 | ||
| US$ | 3,331,840 | 106,983,306 | |||
| $ Col. | 35,294 | - | |||
| Soles | 129,348 | 116,358 | |||
| $ Arg. | 5,282,251 | 3,393,757 | |||
| Reales | 2,884,948 | 1,721,751 | |||
| Inventories, net | $ no Reaj. | 29,507,945 | 33,232,156 | ||
| $ Col. | 4,441,448 | 5,184,659 | |||
| Soles | 9,275,106 | 9,011,283 | |||
| $ Arg. | 1,648,121 | 2,338,831 | |||
| Reales | 543,279 | 1,214,386 | |||
| Income taxes recoverable | $ no Reaj. | 35,024,812 | 70,398,500 | ||
| $ Col. | 603,438 | 15,732,686 | |||
| Soles | 762,416 | 1,623,292 | |||
| $ Arg. | 4,808,109 | 2,546,982 | |||
| Reales | 21,619,721 | 7,336,412 | |||
| Prepaid expenses and other | $ no Reaj. | 1,124,828 | 1,162,558 | ||
| US$ | 1,531,917 | 1,516,852 | |||
| $ Col. | 218,488 | 1,136,210 | |||
| Soles | 252,478 | 1,010,321 | |||
| $ Arg. | 797,190 | 816,287 | |||
| Reales | 12,938,905 | 39,368,960 | |||
| Deferred income taxes | $ no Reaj. | 35,276,929 | 49,308,731 | ||
| $ Col. | 3,402,950 | 949,786 | |||
| $ Arg. | 9,352,029 | 9,573,388 | |||
| Reales | 4,992,003 | 173,812 | |||
| Other current assets | $ Reaj. | 818,261 | 151,489 | ||
| $ no Reaj. | 46,568,412 | 29,996,521 | |||
| US$ | 10,892,528 | 1,093,546 | |||
| Soles | 1,400,414 | 1,405,979 | |||
| $ Arg. | 2,262,288 | 321,522 | |||
| Reales | 13,835,099 | 3,148,123 | |||
| Total current assets | 1,156,481,276 | 1,519,081,190 | |||
F - 102
ENERSIS S.A. AND SUBSIDIARIES
Notes to the Consolidated Financial Statements – (Continued)
| (b) | Property, plant and equipment |
| Property, plant and equipment | |
| As of December 31, | |||||
| Account | Currency | 2003 | 2004 | ||
| ThCh$ | ThCh$ | ||||
| Land | $ no Reaj. | 41,777,562 | 52,338,344 | ||
| $ Col. | 29,133,766 | 26,530,812 | |||
| Soles | 8,670,485 | 7,951,724 | |||
| $ Arg. | 8,419,958 | 7,724,720 | |||
| Reales | 30,338,358 | 28,061,395 | |||
| Building, infrastructure and work in progress | $ no Reaj. | 3,538,008,367 | 3,624,231,407 | ||
| $ Col. | 2,765,131,519 | 2,537,436,134 | |||
| Soles | 1,021,951,727 | 951,907,447 | |||
| $ Arg. | 1,423,871,557 | 1,322,175,663 | |||
| Reales | 1,556,321,432 | 1,429,235,015 | |||
| Machinery and equipment | $ no Reaj. | 53,334,336 | 85,322,291 | ||
| $ Col. | 22,507,774 | 22,481,645 | |||
| Soles | 388,475,456 | 357,431,602 | |||
| $ Arg. | 665,909,330 | 623,547,755 | |||
| Reales | 676,065,676 | 632,336,970 | |||
| Other plant and equipment | $ no Reaj. | 127,322,197 | 134,019,551 | ||
| $ Col. | 9,472,574 | 17,284,629 | |||
| Soles | 36,278,327 | 32,595,808 | |||
| $ Arg. | 122,298,330 | 108,157,283 | |||
| Reales | 61,420,508 | 106,652,048 | |||
| Technical appraisal | $ no Reaj. | 29,601,418 | 29,794,577 | ||
| $ Col. | 62,173,087 | 56,938,410 | |||
| Soles | 428,561,045 | 392,478,253 | |||
| Reales | 114,622,461 | 104,971,798 | |||
| Accumulated depreciation | $ no Reaj. | (1,602,279,713 | ) | (1,685,445,219 | ) |
| $ Col. | (690,224,493 | ) | (711,423,578 | ) | |
| Soles | (859,351,499 | ) | (822,014,062 | ) | |
| $ Arg. | (969,733,183 | ) | (963,750,414 | ) | |
| Reales | (801,308,839 | ) | (824,150,066 | ) | |
| Total property, plant and equipment | 8,298,769,523 | 7,684,821,942 | |||
F - 103
ENERSIS S.A. AND SUBSIDIARIES
Notes to the Consolidated Financial Statements – (Continued)
| (c) | Other assets |
| Other assets | |
| As of December 31, | |||||
| Account | Currency | 2003 | 2004 | ||
| ThCh$ | ThCh$ | ||||
| Investments in related companies | $ no Reaj. | 108,073,015 | 107,682,826 | ||
| US$ | 76,643,743 | 83,782,236 | |||
| Investments in other companies | $ no Reaj. | 2,341,160 | 2,378,053 | ||
| US$ | — | 27,213,438 | |||
| $ Col. | 134,321,257 | 20,312,213 | |||
| Soles | 8,441 | 7,731 | |||
| Reales | 125,946 | 81,319 | |||
| Goodwill, net | $ no Reaj. | 756,029,451 | 704,752,310 | ||
| US$ | 5,509,044 | 12,696,787 | |||
| $ Col. | 38,368,653 | 16,086,006 | |||
| Negative goodwill, net | $ no Reaj. | (17,082,960 | ) | (12,939,841 | ) |
| US$ | (13,518,672 | ) | (8,104,372 | ) | |
| $ Col. | (4,674,109 | ) | (2,569,614 | ) | |
| Soles | (45,939,757 | ) | (33,121,987 | ) | |
| Long-term accounts receivable | $ Reaj. | 3,577,465 | 1,488,725 | ||
| $ no Reaj. | 1,954,002 | 1,273,568 | |||
| US$ | 4,661,886 | 3,509,615 | |||
| $ Col. | 7,814,513 | 6,687,455 | |||
| Soles | 2,103,001 | 2,216,011 | |||
| $ Arg. | 2,504,339 | 6,487,025 | |||
| Reales | 108,518,214 | 104,247,690 | |||
| Amounts due from related companies | $ no Reaj. | 609,105 | 334,097 | ||
| US$ | 131,562,999 | 122,111 | |||
| Reales | 159,325 | 38 | |||
| Other assets | $ Reaj. | 5,425,595 | — | ||
| $ no Reaj. | 63,941,140 | 52,469,411 | |||
| US$ | 21,239,485 | 23,071,340 | |||
| $ Col. | 25,374,006 | 46,128,153 | |||
| Soles | 3,548,541 | 2,828,521 | |||
| $ Arg. | 16,568,392 | 27,509,762 | |||
| Reales | 87,875,268 | 106,991,380 | |||
| Total other assets | 1,527,642,488 | 1,303,622,007 | |||
F - 104
ENERSIS S.A. AND SUBSIDIARIES
Notes to the Consolidated Financial Statements – (Continued)
| (d) | Total assets |
| As of December 31, | |||||
| Account | Currency | 2003 | 2004 | ||
| ThCh$ | ThCh$ | ||||
| Total assets by currency | $ Reaj. | 56,425,071 | 8,165,464 | ||
| $ no Reaj. | 3,377,112,608 | 3,431,027,557 | |||
| US$ | 405,393,838 | 506,017,324 | |||
| $ Col. | 2,587,918,030 | 2,385,798,927 | |||
| Soles | 1,033,927,731 | 946,214,739 | |||
| $ Arg. | 1,356,788,988 | 1,217,040,610 | |||
| Reales | 2,164,294,759 | 2,013,260,518 | |||
| U.C. | 1,032,262 | — | |||
| Total assets by currency | 10,982,893,287 | 10,507,525,139 | |||
| (e) | Current liabilities |
| Within 90 days | 91 day to 1 year | ||||||||||||||||
| As of December 31, 2003 | As of December 31, 2004 | As of December 31, 2003 | As of December 31, 2004 | ||||||||||||||
| Average | Average | Average | Average | ||||||||||||||
| Account | Currency | Amount | Rate | Amount | Rate | Amount | Rate | Amount | Rate | ||||||||
| ThCh$ | ThCh$ | ThCh$ | ThCh$ | ||||||||||||||
| Short-term debt due to banks and | $ no Reaj. | 2,438,349 | 2.99 | % | 2,434,847 | 3.00 | % | — | 0.00 | % | — | 0.00 | % | ||||
| financial institutions | US$ | 84,814,231 | 12.71 | % | 54,848,068 | 3.92 | % | 44,663,417 | 12.71 | % | 426,911 | 5.87 | % | ||||
| Euro | 3,588,066 | 5.00 | % | 908,779 | 3.00 | % | — | 0.00 | % | — | 0.00 | % | |||||
| $ Col. | 117,353,815 | 15.93 | % | 49,065,716 | 7.31 | % | — | 0.00 | % | — | 0.00 | % | |||||
| Soles | 28,458,882 | 15.93 | % | 23,369,915 | 5.85 | % | 11,666,373 | 15.93 | % | — | 0.00 | % | |||||
| $ Arg. | 10,516,380 | 15.93 | % | 6,151,050 | 8.99 | % | — | 0.00 | % | 2,589,394 | 9.25 | % | |||||
| Reales | 239,979 | 15.93 | % | 52,128,449 | 16.76 | % | — | 0.00 | % | — | 0.00 | % | |||||
| Others | 16,220,984 | 15.93 | % | — | 0.00 | % | — | 0.00 | % | — | 0.00 | % | |||||
| Current portion of long-term debt | $ Reaj. | 1,479,491 | 4.56 | % | — | 0.00 | % | 35,461,819 | 4.56 | % | 1,700,403 | 9.00 | % | ||||
| due to banks and financial | US$ | 22,379,370 | 4.96 | % | 5,173,030 | 5.60 | % | 82,429,959 | 4.96 | % | 67,353,491 | 7.05 | % | ||||
| institutions | Euro | — | 0.00 | % | — | 0.00 | % | 126,861 | 3.00 | % | 125,395 | 3.00 | % | ||||
| Yen | 13,510,451 | 3.46 | % | — | 0.00 | % | 435,146 | 3.46 | % | 412,818 | 0.90 | % | |||||
| $ Arg. | — | 0.00 | % | 20,194 | 9.70 | % | — | 0.00 | % | 2,405,568 | 3.79 | % | |||||
| $ Col. | 984,760 | 16.79 | % | — | 0.00 | % | — | 0.00 | % | 14,538,378 | 12.45 | % | |||||
| Reales | 3,854,757 | 16.79 | % | 4,716,740 | 15.81 | % | 5,741,290 | 16.79 | % | 10,079,596 | 14.93 | % | |||||
| U.P. | — | 0.00 | % | — | 0.00 | % | 1,144,981 | 16.79 | % | — | 0.00 | % | |||||
| Others | 944,426 | 16.79 | % | — | 0.00 | % | 1,344,077 | 16.79 | % | 415,332 | 5.88 | % | |||||
| Current portion of bonds payable | $ Reaj. | 235,855 | 5.88 | % | 151,779 | 5.80 | % | 7,543,814 | 5.88 | % | 7,670,851 | 6.00 | % | ||||
| US$ | 4,482,124 | 7.87 | % | 22,240,292 | 8.10 | % | 37,890,558 | 7.87 | % | 32,737,993 | 8.00 | % | |||||
| $ Arg. | — | 0.00 | % | 5,744 | 7.00 | % | — | 0.00 | % | 153,456 | 8.50 | % | |||||
| $ Col. | 6,991,505 | 11.25 | % | 6,019,981 | 11.16 | % | — | 0.00 | % | — | 0.00 | % | |||||
| Soles | 6,787,140 | 4.94 | % | 18,602,854 | 6.23 | % | 8,787,827 | 4.94 | % | — | 0.00 | % | |||||
| Reales | — | 0.00 | % | 19,501,097 | 20.31 | % | — | 0.00 | % | — | 0.00 | % | |||||
| Current portion of long-term | US$ | 8,176,632 | 0.00 | % | 6,567,034 | 0.00 | % | 13,793,078 | 0.00 | % | 18,174,027 | 0.00 | % | ||||
| notes payable | Reales | — | 2,008,600 | 0.00 | % | — | — | 0.00 | % | ||||||||
| Dividends payable | $ no Reaj. | 1,006,694 | 0.00 | % | 722,922 | 0.00 | % | 734,392 | 0.00 | % | — | 0.00 | % | ||||
| $ Col. | 2 | 0.00 | % | 2 | 0.00 | % | — | 0.00 | % | — | 0.00 | % | |||||
| Soles | 82,109 | 0.00 | % | 18,179 | 0.00 | % | — | 0.00 | % | — | 0.00 | % | |||||
| $ Arg. | 749 | 0.00 | % | 1,566 | 0.00 | % | — | 0.00 | % | — | 0.00 | % | |||||
| Reales | 1,413,566 | 0.00 | % | 2,656,832 | 0.00 | % | — | 0.00 | % | — | 0.00 | % | |||||
| Accounts payable | $ no Reaj. | 66,370,396 | 0.00 | % | 84,313,435 | 0.00 | % | — | 0.00 | % | — | 0.00 | % | ||||
| US$ | 861,067 | 0.00 | % | 4,351,182 | 0.00 | % | 349 | 0.00 | % | 1,653 | 0.00 | % | |||||
| Euro | 156,741 | 0.00 | % | 258,353 | 0.00 | % | — | 0.00 | % | — | 0.00 | % | |||||
| $ Col. | 28,960,109 | 0.00 | % | 31,241,735 | 0.00 | % | — | 0.00 | % | — | 0.00 | % | |||||
| Soles | 17,360,048 | 0.00 | % | 19,585,347 | 0.00 | % | — | 0.00 | % | — | 0.00 | % | |||||
| $ Arg. | 29,090,974 | 0.00 | % | 45,782,706 | 0.00 | % | — | 0.00 | % | — | 0.00 | % | |||||
| Reales | 78,030,649 | 0.00 | % | 67,468,092 | 0.00 | % | — | 0.00 | % | — | 0.00 | % | |||||
F - 105
ENERSIS S.A. AND SUBSIDIARIES
Notes to the Consolidated Financial Statements – (Continued)
| Within 90 daysm | 91 day to 1 year | |||||||||||||||||
| As of December 31, 2003 | As of December 31, 2004 | As of December 31, 2003 | As of December 31, 2004 | |||||||||||||||
| Average | Average | Average | Average | |||||||||||||||
| Account | Currency | Amount | Rate | Amount | Rate | Amount | Rate | Amount | Rate | |||||||||
| ThCh$ | ThCh$ | ThCh$ | ThCh$ | |||||||||||||||
| Short-term notes payables | $ no Reaj. | 18,809 | 0.00 | % | 559 | 0.00 | % | — | 0.00 | % | — | 0.00 | % | |||||
| US$ | — | 0.00 | % | — | 0.00 | % | — | 0.00 | % | 6,227,405 | 0.00 | % | ||||||
| Reales | 21,577,819 | 0.00 | % | 7,181,201 | 0.00 | % | — | 0.00 | % | — | 0.00 | % | ||||||
| Miscellaneous payables | $ no Reaj. | 5,400,636 | 0.00 | % | 2,871,840 | 0.00 | % | 5,636,239 | 0.00 | % | 5,947,717 | 0.00 | % | |||||
| US$ | 6,876,299 | 0.00 | % | 959,372 | 0.00 | % | 63,908 | 0.00 | % | 721,873 | 0.00 | % | ||||||
| $ Col. | 11,010,389 | 0.00 | % | 9,887,281 | 0.00 | % | — | 0.00 | % | — | 0.00 | % | ||||||
| Soles | 8,821,069 | 0.00 | % | 4,672,384 | 0.00 | % | — | 0.00 | % | 2,078,438 | 0.00 | % | ||||||
| $ Arg. | 2,583 | 0.00 | % | 3,505 | 0.00 | % | — | 0.00 | % | — | 0.00 | % | ||||||
| Reales | 7,203,285 | 0.00 | % | 11,464,093 | 0.00 | % | — | 0.00 | % | — | 0.00 | % | ||||||
| Amounts payable to related companies | $ no Reaj. | 255,365 | 0.00 | % | 480,831 | 0.00 | % | — | 0.00 | % | — | 0.00 | % | |||||
| US$ | 1,464,924 | 0.00 | % | 56,725,083 | 0.00 | % | — | 0.00 | % | — | 0.00 | % | ||||||
| $ Col. | 2,923,148 | 0.00 | % | — | 0.00 | % | — | 0.00 | % | — | 0.00 | % | ||||||
| Soles | 394,992 | 0.00 | % | 476,526 | 0.00 | % | — | 0.00 | % | — | 0.00 | % | ||||||
| $ Arg. | 1,732,753 | 0.00 | % | 525,460 | 0.00 | % | — | 0.00 | % | — | 0.00 | % | ||||||
| Reales | 24,745,818 | 0.00 | % | 23,300,775 | 0.00 | % | — | 0.00 | % | — | 0.00 | % | ||||||
| Accrued expenses | $ Reaj. | 30,095 | 0.00 | % | 69,517 | 0.00 | % | 84,878 | 0.00 | % | 75,770 | 0.00 | % | |||||
| $ no Reaj. | 7,194,918 | 0.00 | % | 10,791,076 | 0.00 | % | 29,393,686 | 0.00 | % | 11,935,030 | 0.00 | % | ||||||
| US$ | 1,050 | 0.00 | % | — | 0.00 | % | 69,574 | 0.00 | % | 180,402 | 0.00 | % | ||||||
| $ Col. | 5,712,516 | 0.00 | % | 7,578,841 | 0.00 | % | — | 0.00 | % | — | 0.00 | % | ||||||
| Soles | 1,566,538 | 0.00 | % | 2,872,127 | 0.00 | % | 2,536,430 | 0.00 | % | — | 0.00 | % | ||||||
| $ Arg. | 2,939,181 | 0.00 | % | 3,179,885 | 0.00 | % | — | 0.00 | % | — | 0.00 | % | ||||||
| Reales | 5,506,856 | 0.00 | % | 7,650,469 | 0.00 | % | 11,108 | 0.00 | % | — | 0.00 | % | ||||||
| Withholdings | $ no Reaj. | 8,026,256 | 0.00 | % | 10,793,064 | 0.00 | % | 161,356 | 0.00 | % | — | 0.00 | % | |||||
| $ Col. | 2,265,795 | 0.00 | % | 2,753,830 | 0.00 | % | — | 0.00 | % | — | 0.00 | % | ||||||
| Soles | 5,155,760 | 0.00 | % | 6,105,833 | 0.00 | % | — | 0.00 | % | — | 0.00 | % | ||||||
| $ Arg. | 17,274,242 | 0.00 | % | 12,493,955 | 0.00 | % | — | 0.00 | % | 51,320 | 0.00 | % | ||||||
| Reales | 32,411,616 | 0.00 | % | 17,551,516 | 0.00 | % | — | 0.00 | % | — | 0.00 | % | ||||||
| Income tax payable | $ no Reaj. | 16,822,260 | 0.00 | % | 394,297 | 0.00 | % | — | 0.00 | % | 479,246 | 0.00 | % | |||||
| $ Col. | 23,507,327 | 0.00 | % | 42,420,816 | 0.00 | % | 2,229,391 | 0.00 | % | — | 0.00 | % | ||||||
| Soles | 19,809 | 0.00 | % | 2,790,566 | 0.00 | % | 3,007,496 | 0.00 | % | — | 0.00 | % | ||||||
| $ Arg. | — | 0.00 | % | 1,187,223 | 0.00 | % | — | 0.00 | % | — | 0.00 | % | ||||||
| Reales | 3,449,774 | 0.00 | % | 7,146,632 | 0.00 | % | — | 0.00 | % | — | 0.00 | % | ||||||
| Deferred income | $ Reaj. | — | 0.00 | % | 8,659 | 0.00 | % | — | 0.00 | % | — | 0.00 | % | |||||
| $ no Reaj. | 6,127,909 | 0.00 | % | 4,872,530 | 0.00 | % | 1,972,547 | 0.00 | % | 1,623,507 | 0.00 | % | ||||||
| $ Col. | 4,174,302 | 0.00 | % | — | 0.00 | % | — | 0.00 | % | — | 0.00 | % | ||||||
| Other current liabilities | $ Reaj. | 10,242 | 0.00 | % | 1,121 | 0.00 | % | 6,084 | 0.00 | % | 376,487 | 0.00 | % | |||||
| $ no Reaj. | 10,919 | 0.00 | % | 464,355 | 0.00 | % | 2,865,946 | 0.00 | % | 2,258,422 | 0.00 | % | ||||||
| US$ | 9,380,424 | 0.00 | % | 98,023 | 0.00 | % | 1,236,032 | 0.00 | % | 748,752 | 0.00 | % | ||||||
| $ Col. | 1,497,109 | 0.00 | % | 2,525,483 | 0.00 | % | — | 0.00 | % | — | 0.00 | % | ||||||
| Soles | 45,669 | 0.00 | % | 46,868 | 0.00 | % | — | 0.00 | % | — | 0.00 | % | ||||||
| $ Arg. | 21,369,668 | 0.00 | % | 24,119,118 | 0.00 | % | — | 0.00 | % | — | 0.00 | % | ||||||
| Reales | 30,572,763 | 0.00 | % | 10,542,045 | 0.00 | % | — | 0.00 | % | — | 0.00 | % | ||||||
| Total current liabilities by currency | $ Reaj. | 1,755,683 | 231,076 | 43,096,595 | 9,823,511 | |||||||||||||
| $ no Reaj. | 113,672,511 | 118,139,756 | 40,764,166 | 22,243,922 | ||||||||||||||
| US$ | 138,436,121 | 150,962,084 | 180,146,875 | 126,572,507 | ||||||||||||||
| Euro | 3,744,807 | 1,167,132 | 126,861 | 125,395 | ||||||||||||||
| Yen | 13,510,451 | — | 435,146 | 412,818 | ||||||||||||||
| $ Col. | 205,380,777 | 151,493,685 | 2,229,391 | 14,538,378 | ||||||||||||||
| Soles | 68,692,016 | 78,540,599 | 25,998,126 | 2,078,438 | ||||||||||||||
| Reales | 209,006,882 | 233,316,541 | 5,752,398 | 10,079,596 | ||||||||||||||
| $ Arg. | 82,926,530 | 93,470,406 | — | 5,199,738 | ||||||||||||||
| U.P. | — | — | 1,144,981 | — | ||||||||||||||
| Others | 17,165,410 | — | 1,344,077 | 415,332 | ||||||||||||||
| Total current liabilities | 854,291,188 | 827,321,279 | 301,038,616 | 191,489,635 | ||||||||||||||
F - 106
ENERSIS S.A. AND SUBSIDIARIES
Notes to the Consolidated Financial Statements – (Continued)
| (f) | Long-term liabilities as of December 31, 2004 |
| 1 to 3 years | 3 to 5 years | 5 to 10 years | More than 10 years | |||||||||||||||
| Average | Average | Average | Average | |||||||||||||||
| Account | Currency | Amount | Rate | Amount | Rate | Amount | Rate | Amount | Rate | |||||||||
| ThCh$ | ThCh$ | ThCh$ | ThCh$ | |||||||||||||||
| Due to banks and financial | $ Reaj. | 1,698,508 | 9.00 | % | 1,008,580 | 9.00 | % | — | 0.00 | % | — | 0.00 | % | |||||
| institutions | US$ | 91,767,757 | 6.95 | % | 357,086,797 | 3.65 | % | 25,386,640 | 8.59 | % | 911,946 | 5.78 | % | |||||
| Euro | 1,808,395 | 3.00 | % | — | 0.00 | % | — | 0.00 | % | — | 0.00 | % | ||||||
| $ Arg. | 5,520,964 | 3.96 | % | 3,536,601 | 1.75 | % | 2,652,453 | 1.75 | % | — | 0.00 | % | ||||||
| $ Col. | 313,735 | 9.00 | % | 27,212,269 | 12.45 | % | — | 0.00 | % | — | 0.00 | % | ||||||
| Reales | 62,043,271 | 15.22 | % | 7,569,269 | 16.77 | % | 37,595,086 | 16.47 | % | — | 0.00 | % | ||||||
| Bonds payable | $ Reaj. | 103,902,300 | 6.20 | % | 69,910,209 | 6.19 | % | 84,746,197 | 5.17 | % | 59,484,067 | 5.95 | % | |||||
| US$ | 300,996,000 | 7.27 | % | 457,068,000 | 8.03 | % | 418,050,000 | 7.90 | % | 511,073,929 | 7.79 | % | ||||||
| $ Col. | 39,535,092 | 15.53 | % | 84,840,185 | 10.60 | % | 174,934,536 | 12.13 | % | |||||||||
| Soles | 68,381,485 | 7.58 | % | 16,980,959 | 6.97 | % | 17,983,304 | 8.83 | % | |||||||||
| $ Arg. | 22,464,484 | 7.50 | % | — | 0.00 | % | — | 0.00 | % | |||||||||
| Reales | 46,303,253 | 20.64 | % | — | 0.00 | % | 16,846,109 | 16.00 | % | |||||||||
| Long-term notes payable | US$ | 47,953,491 | 7.22 | % | 32,006,890 | 7.28 | % | 19,926,002 | 7.42 | % | — | 0.00 | % | |||||
| Reales | 27,355,685 | 10.92 | % | 5,763,842 | 10.92 | % | 10,221,301 | 10.92 | % | 26,857 | 10.92 | % | ||||||
| Miscellaneous payable | $ Reaj. | — | 0.00 | % | — | 0.00 | % | — | 0.00 | % | 167,268 | 0.00 | % | |||||
| $ no Reaj. | 727,204 | 0.00 | % | — | 0.00 | % | — | 0.00 | % | — | 0.00 | % | ||||||
| US$ | 15,040,244 | 4.14 | % | 1,795,204 | 6.50 | % | 5,614,137 | 6.50 | % | 14,672,591 | 6.50 | % | ||||||
| Reales | 12,567,061 | 0.00 | % | — | 0.00 | % | — | 0.00 | % | — | 0.00 | % | ||||||
| Accrued expenses | $ Reaj. | 121,124 | 0.00 | % | — | 0.00 | % | — | 0.00 | % | — | 0.00 | % | |||||
| $ no Reaj. | 3,442,268 | 0.00 | % | 2,972,036 | 0.00 | % | 7,316,529 | 0.00 | % | 13,680,660 | 0.00 | % | ||||||
| $ Col. | 70,078,692 | 0.00 | % | — | 0.00 | % | — | 0.00 | % | — | 0.00 | % | ||||||
| Reales | 207,120,842 | 0.00 | % | 1,157,644 | 0.00 | % | 5,135,478 | 0.00 | % | — | 0.00 | % | ||||||
| Deferred income taxes | $ no Reaj. | 16,295,211 | 0.00 | % | 2,447,289 | 0.00 | % | 2,907,066 | 0.00 | % | 14,694,590 | 0.00 | % | |||||
| Soles | 27,191,732 | 0.00 | % | — | 0.00 | % | — | 0.00 | % | — | 0.00 | % | ||||||
| Other long-term liabilities | $ Reaj. | 66,693,221 | 0.00 | % | 12,534 | 0.00 | % | — | 0.00 | % | — | 0.00 | % | |||||
| $ no Reaj. | 15,186,054 | 0.00 | % | 1,361,106 | 0.00 | % | 1,573,672 | 0.00 | % | 13,213 | 0.00 | % | ||||||
| US$ | 1,994,962 | 0.00 | % | — | 0.00 | % | — | 0.00 | % | — | 0.00 | % | ||||||
| Soles | 925,586 | 0.00 | % | 639,812 | 0.00 | % | 1,151,537 | 0.00 | % | — | 0.00 | % | ||||||
| $ Arg. | 7,969,587 | 0.00 | % | — | 0.00 | % | — | 0.00 | % | — | 0.00 | % | ||||||
| Reales | 18,622,479 | 0.00 | % | — | 0.00 | % | — | 0.00 | % | — | 0.00 | % | ||||||
| Total long-term liabilities | $ Reaj. | 172,415,153 | 70,931,323 | 84,746,197 | 59,651,335 | |||||||||||||
| by currency | $ no Reaj. | 35,650,737 | 6,780,431 | 11,797,267 | 28,388,463 | |||||||||||||
| US$ | 457,752,454 | 847,956,891 | 468,976,779 | 526,658,466 | ||||||||||||||
| Euro | 1,808,395 | — | — | — | ||||||||||||||
| $ Col. | 109,927,519 | 112,052,454 | 174,934,536 | — | ||||||||||||||
| Soles | 96,498,803 | 17,620,771 | 19,134,841 | — | ||||||||||||||
| $ Arg. | 35,955,035 | 3,536,601 | 2,652,453 | — | ||||||||||||||
| Reales | 374,012,591 | 14,490,755 | 69,797,974 | 26,857 | ||||||||||||||
| Total long-term liabilities | 1,284,020,687 | 1,073,369,226 | 832,040,047 | 614,725,121 | ||||||||||||||
F - 107
ENERSIS S.A. AND SUBSIDIARIES
Notes to the Consolidated Financial Statements – (Continued)
| (g) | Long-term liabilities as of December 31, 2003 |
| 1 to 3 years | 3 to 5 years | 5 to 10 years | More than 10 years | |||||||||||||||
| Average | Average | Average | Average | |||||||||||||||
| Account | Currency | Amount | Rate | Amount | Rate | Amount | Rate | Amount | Rate | |||||||||
| ThCh$ | ThCh$ | ThCh$ | ThCh$ | |||||||||||||||
| Due to banks and financial | $ Reaj. | 3,167,804 | 9.00 | % | 1,305,528 | 9.00 | % | — | 0.00 | % | — | 0.00 | % | |||||
| institutions | US$ | 205,570,231 | 4.77 | % | 448,913,335 | 3.83 | % | 45,212,332 | 3.36 | % | 2,535,154 | 3.89 | % | |||||
| Euro | 124,781 | 3.00 | % | — | 0.00 | % | — | 0.00 | % | — | 0.00 | % | ||||||
| Yen | 432,999 | 0.89 | % | — | 0.00 | % | — | 0.00 | % | — | 0.00 | % | ||||||
| $ Arg. | 3,685,689 | 1.75 | % | 1,842,844 | 1.75 | % | 6,450,209 | 1.75 | % | — | 0.00 | % | ||||||
| $ Col. | — | 0.00 | % | 38,338,946 | 12.55 | % | — | 0.00 | % | — | 0.00 | % | ||||||
| Reales | 82,677,254 | 22.50 | % | 4,887,591 | 20.81 | % | 8,653,443 | 20.06 | % | 531,883 | 17.74 | % | ||||||
| Pound | 412,209 | 4.63 | % | — | 0.00 | % | — | 0.00 | % | — | 0.00 | % | ||||||
| Bonds payable | $ Reaj. | 6,263,066 | 5.88 | % | 113,188,072 | 5.88 | % | 104,378,205 | 5.88 | % | 97,345,804 | 5.88 | % | |||||
| US$ | 121,729,000 | 7.91 | % | 219,112,200 | 7.91 | % | 486,916,000 | 7.91 | % | 1,014,543,656 | 7.91 | % | ||||||
| $ Col. | 105,570,083 | 10.50 | % | — | 0.00 | % | — | 0.00 | % | — | 0.00 | % | ||||||
| Soles | 76,461,688 | 4.39 | % | 10,409,782 | 4.39 | % | 859,784 | 4.39 | % | — | 0.00 | % | ||||||
| Long-term notes payable | US$ | 41,482,653 | 7.42 | % | 49,425,883 | 7.42 | % | 32,636,810 | 7.42 | % | — | 0.00 | % | |||||
| Reales | 11,611,380 | 14.46 | % | 4,696,312 | 14.46 | % | 9,123,707 | 14.46 | % | — | 0.00 | % | ||||||
| Miscellaneous payable | $ Reaj. | — | 0.00 | % | — | 0.00 | % | — | 0.00 | % | 167,520 | 0.00 | % | |||||
| $ no Reaj. | 884,934 | 0.00 | % | — | 0.00 | % | — | 0.00 | % | 18,013 | 0.00 | % | ||||||
| US$ | 5,357,366 | 0.00 | % | — | 0.00 | % | — | 0.00 | % | 9,128,388 | 3.26 | % | ||||||
| Reales | 8,692,608 | 0.00 | % | 3,223,970 | 0.00 | % | — | 0.00 | % | — | 0.00 | % | ||||||
| Amounts payable to related companies | $ Col. | 86,428 | 0.00 | % | — | 0.00 | % | — | 0.00 | % | — | 0.00 | % | |||||
| Accrued expenses | $ no Reaj. | 2,511,857 | 0.00 | % | 2,674,905 | 0.00 | % | 6,391,560 | 0.00 | % | 10,692,906 | 0.00 | % | |||||
| US$ | — | 0.00 | % | 3,045,975 | 0.00 | % | — | 0.00 | % | — | 0.00 | % | ||||||
| $ Col. | 21,219,190 | 0.00 | % | 46,218,706 | 0.00 | % | — | 0.00 | % | — | 0.00 | % | ||||||
| Reales | 232,597,309 | 0.00 | % | — | 0.00 | % | — | 0.00 | % | — | 0.00 | % | ||||||
| Deferred income taxes | $ no Reaj. | 118,323 | 0.00 | % | 7,076,619 | 0.00 | % | — | 0.00 | % | — | 0.00 | % | |||||
| Other long-term liabilities | $ Reaj. | 9,430 | 0.00 | % | 11,800 | 0.00 | % | 6,575 | 0.00 | % | — | 0.00 | % | |||||
| $ no Reaj. | 3,542,274 | 0.00 | % | 998,700 | 0.00 | % | 1,171,374 | 0.00 | % | 1,682,754 | 0.00 | % | ||||||
| US$ | 13,099,358 | 0.00 | % | 5,284,063 | 0.00 | % | — | 0.00 | % | — | 0.00 | % | ||||||
| Soles | 2,109,649 | 0.00 | % | 715,703 | 0.00 | % | 1,218,766 | 0.00 | % | — | 0.00 | % | ||||||
| $ Arg. | 8,171,645 | 0.00 | % | — | 0.00 | % | — | 0.00 | % | — | 0.00 | % | ||||||
| Reales | 23,822,941 | 0.00 | % | — | 0.00 | % | — | 0.00 | % | — | 0.00 | % | ||||||
| Total long-term liabilities | $ Reaj. | 9,440,300 | 114,505,400 | 104,384,780 | 97,513,324 | |||||||||||||
| by currency | $ no Reaj. | 7,057,388 | 10,750,224 | 7,562,934 | 12,393,673 | |||||||||||||
| U$S | 387,238,608 | 725,781,456 | 564,765,142 | 1,026,207,198 | ||||||||||||||
| Euro | 124,781 | — | — | — | ||||||||||||||
| Yen | 432,999 | — | — | — | ||||||||||||||
| $ Col. | 126,875,701 | 84,557,652 | — | — | ||||||||||||||
| Soles | 78,571,337 | 11,125,485 | 2,078,550 | — | ||||||||||||||
| $ Arg. | 11,857,334 | 1,842,844 | 6,450,209 | — | ||||||||||||||
| Reales | 359,401,492 | 12,807,873 | 17,777,150 | 531,883 | ||||||||||||||
| Pound | 412,209 | — | — | — | ||||||||||||||
| Total long-term liabilities | 981,412,149 | �� | 961,370,934 | 703,018,765 | 1,136,646,078 | |||||||||||||
Note 33. Sanctions
Chilectra S.A.
On April 27, 2004, through Exempt resolution 814, the Superintendence of Electricity and Fuel (S.E.C.) penalized the Company for a total amount of 1,830 UTA (ThCh$665,564), as a result of the blackout which occurred in January 13, 2003, that affected the area between Tal Tal and Santiago. On May 7, 2004, the Company filed an appeal whose jurisdiction and solution belongs to the Superintendency of Electricity and Fuel (S.E.C.). The appeal is still pending for resolution. Against the resolution solving the petition of appeal, the company could file a claim petition whose jurisdiction and resolution’s jurisdiction is Santiago Court of Appeal. To this date, the Corporation cannot exactly forecast the effects the final resolution will have on its financial statements.
The Company and its directors has not been the subject to sanctions by the SVS nor by any other administrative authorities.
F - 108
ENERSIS S.A. AND SUBSIDIARIES
Notes to the Consolidated Financial Statements – (Continued)
Note 34. Environment
Chilectra S.A.
The Company has made disbursements during the year of ThCh$1,475,427 (ThCh$1,600,026 in 2003), mainly for the following items:
| Investments: | |
| • | Implementation of Environmental Management System, ISO Standard 14.001 |
| • | Reforestation |
| • | Pre-assembling. |
| Expenses: | |
| • | Pruning |
| • | Cutting. |
Endesa S.A.
During the year from January 1 to December 31, 2004, the Company and its subsidiaries have made disbursements for a value of ThCh$3,521,010 (ThCh$12,449,554 in 2003), which mainly correspond to:
Operation expenses: They correspond to laboratory studies, monitoring, follow-up and analysis, which resulted in expenses of the fiscal year ThCh $527,033. Cachoeira Dourada S.A. environmental commitment and cooperation activities equivalent to ThCh $107,095. Environmental protection at Central Costanera (cleaning of fuel tanks, screen chamber construction, medication of gas fumes and other), was equivalent to ThCh$73,577.
Muña environmental lawsuit in Emgesa for ThCh$521,680.
Investment related to the following projects, which are activated, ThCh$2,291,625:
| • | Ralco Power Plant - Environmental Program. |
| • | Pehuenche, Loma Alta, and Curillinque Power Plants - Standardization of sewerage and drinking water systems. |
| • | Sauzalito Power Plant - Standardization of sewerage and drinking water systems. |
| • | Antuco Power Plant - Implementation of the Environmental Management System in accordance with ISO Standard 14,001 and liabilities resolution. |
| • | Rapel Power Plant - Environmental Circuit. |
| • | San Isidro Power Plant - Environmental Circuit. |
| • | Pangue Power Plant - Landscape recuperation, former Queuco deposit. |
| • | Isla Power Plant - Construction of spillway buckets in power transformers. |
| • | Sauzal Power Plant - Works in service transformers spillway bucket and SGA certification in ISO Standard 14,001. |
F - 109
ENERSIS S.A. AND SUBSIDIARIES
Notes to the Consolidated Financial Statements – (Continued)
Note 35. Subsequent Events
Endesa S.A.
On January 21, 2005, Endesa S.A. communicated to the Superintendency of Securities and Insurance the following relevant fact:
“During December, 2004, the Experts’ Panel provided in the Power Service Basic Law resolved a series of differences filed by power companies, members of the CDEC-SIC in connection with the firm power calculation inside the said agency.
Considering the resolutions issued by the said Experts’ Panel on December 9, 2004, the Operation Department of the CDEC-SIC informed the power generating companies in the system, during this week, on the results of the readjustment of firm power balance corresponding to the April 2000 to March 2004 period, as well as on the result of the said readjustments for the April 2004 to November 2004 period.
As a result of the said readjustments carried out by the CDEC-SIC, and their subsequent payment, the consolidated financial statements of Empresa Nacional de Electricidad S.A. will be negatively affected in an amount of Ch$14,522,772,161 for the April 2000 to March 2004 period, and in an amount of Ch$3,665,377,677 during the April 2004 to November 2004 period.
Empresa Nacional de Electricidad S.A. considers it necessary to inform the market that, notwithstanding the fact that the company will carry out the payments resulting from the said readjustment, this does not mean that it approves them. In fact, Empresa Nacional de Electricidad S.A. reserves the right to exhaust every legal means for contesting, considering that the fundamental guarantees protected by the State Political Constitution were affected in the said resolutions by the Experts’ Panel and Ministry Resolution 35 of the Ministry of Economy. Furthermore, and according to the information provided to the market, on December 28, 2004, Empresa Nacional de Electricidad S.A. filed a Public Law Invalidity appeal against Ministry Resolution 35 of the Ministry of Economy, which untimely and with no competence opened power readjustments between the system power generating companies for the 2000-2003 period.
In this sense, we consider it our duty to inform the market that last January 20, the Empresa Nacional de Electricidad S.A. requested the CDEC-SIC to call an extraordinary board of directors meeting in order to take a stand regarding the representation the CDEC-SIC made of the Laja and Rapel reservoirs in the calculation of firm power, which will probably generate new differences to be resolved by the Experts’ Panel”.
The amounts indicated in the previous relevant fact have been provisioned in the companies’ financial statements to December 31, 2004.
In the period between January 1, 2005, and to the date of issue of these financial statements, no other significant facts have occurred that may affect their submission.
F - 110
ENERSIS S.A. AND SUBSIDIARIES
Notes to the Consolidated Financial Statements – (Continued)
Note 36. Differences between Chilean and United States Generally Accepted Accounting Principles
Chilean GAAP varies in certain important respects from U.S. GAAP. Such differences involve certain methods for measuring the amounts shown in the financial statements.
| I. | Differences in Measurement Methods |
The principal differences between Chilean GAAP and U.S. GAAP are described below together with an explanation, where appropriate, of the method used in the determination of the adjustments that affect net income and total stockholders’ equity. References below to “SFAS” are to Statements of Financial Accounting Standards issued by the Financial Accounting Standards Board in the United States.
| (a) | Inflation accounting |
The cumulative inflation rate in Chile as measured by the Consumer Price Index for the three-year period ended December 31, 2004 was approximately 6.52%. Pursuant to Chilean GAAP, the Company’s financial statements recognize certain effects of inflation. The inclusion of price-level adjustments in the accompanying consolidated financial statements is considered appropriate under the prolonged inflationary conditions affecting the Chilean economy even though the cumulative inflation rate for the last three years does not exceed 100%. As allowed pursuant to Item 17 c (iv) of Form-20-F the reconciliation included herein of consolidated net income, comprehensive income and shareholders’ equity, as determined in accordance with U.S. GAAP, excludes adjustments attributable to the effect of differences between the accounting for inflation under Chilean GAAP versus U.S. GAAP.
| (b) | Reversal of revaluation of property, plant and equipment |
In accordance with standards issued by the SVS., certain property, plant and equipment are recorded in the financial statements at amounts determined in accordance with a technical appraisal. The difference between the carrying value and the revalued amount is included in shareholders’ equity, beginning in 1989, in “Other reserves”, and is subject to adjustments for price-level restatement and depreciation. Revaluation of property, plant and equipment is an accounting principle not generally accepted under U.S. GAAP, therefore, the effects of the reversal of this revaluation, as well as of the related accumulated depreciation and depreciation expense are included in paragraph (gg) below.
| (c) | Depreciation of property, plant and equipment |
Under Chilean GAAP, certain costs related to the cost of acquisition of Edesur S.A., at the time of the acquisitions in 1992 and 1994 by Distrilec Inversora S.A., were charged to earnings as incurred. Under U.S. GAAP, these costs would have been included in the purchase price and would have been allocated to the net assets acquired based upon fair values. For purposes of the reconciliation to U.S. GAAP, these costs were considered to be of part of property, plant, and equipment, the primary assets of Edesur S.A.
As discussed in paragraph (i), under Chilean GAAP, assets acquired and liabilities assumed are recorded at their carrying value, and the excess of the purchase price over the carrying value is recorded as goodwill. Under U.S. GAAP, assets acquired and liabilities assumed are recorded at their estimated fair values, and the excess of the purchase price over the estimated fair value of the net identifiable assets and liabilities acquired is recorded as goodwill. As part of the purchase of the majority ownership interest in Endesa-Chile, under U.S. GAAP, the cost of the purchase price would have been allocated to the fair value of property, plant and equipment.
The effect on shareholders’ equity and net income for the years presented is included in paragraph (gg) below.
F - 111
ENERSIS S.A. AND SUBSIDIARIES
Notes to the Consolidated Financial Statements – (Continued)
| (d) | Intangibles |
Under Chilean GAAP, the intangible assets correspond mainly of rights of way. Additionally the Company has recorded intangible asset relating to the transfer of revalued assets which originate in the predecessor company, “Compañía Chilena de Distribución Eléctrica S.A.” at the time of the Company’s formation. Under U.S. GAAP, the balance of this intangible asset would have been recorded at the Predecessor Company’s carrying value which was zero. In 2004, this intangible asset was charged to income under Chile GAAP thereby zeroing out the adjustment for this item between U.S. GAAP and Chile GAAP.
The estimated amortization expense for the intangible assets which, mainly consist of rights of way, for US GAAP purposes (which is equivalent under Chile GAAP) for each of the five succeeding fiscal years is as follows:
| Year | Amortization | |
| ThCh$ | ||
| 2005 | 5,477,874 | |
| 2006 | 4,459,668 | |
| 2007 | 3,295,044 | |
| 2008 | 1,855,711 | |
| 2009 | 1,217,734 |
The effects of adjusting shareholders’ equity for this intangible asset net of accumulated amortization, inclusive of accumulated price-level restatement, and net income for the annual amortization expense and the write-off of the intangible asset in 2004 are included in paragraph (gg) below.
| (e) | Deferred income taxes |
Under Chilean GAAP, until December 31, 1999, deferred income taxes were recorded based on non-recurring timing differences between the recognition of income and expense items for financial statement and tax purposes. Accordingly, there was an orientation toward the income statement focusing on differences in the timing of recognition of revenues and expenses in pre-tax accounting income and taxable income. Chilean GAAP also permitted not providing for deferred income taxes where a deferred tax asset or liability, was either offsetting or not expected to be realized. Starting January 1, 2000, the Company recorded income taxes in accordance with Technical Bulletin No. 60 of the Chilean Association of Accountants, recognizing, using the liability method, the deferred tax effects of temporary differences between the financial and tax values of assets and liabilities. As a transitional provision, a contra (referred to as “complementary”) asset or liability has been recorded offsetting the effects of the deferred tax assets and liabilities not recorded prior to January 1, 2000. Such complementary asset or liability are being amortized to income over the estimated average reversal periods corresponding to the underlying temporary differences to which the deferred tax asset or liability relates.
Under U.S. GAAP, companies must account for deferred taxes in accordance with SFAS No. 109, which requires an asset and liability approach for financial accounting and reporting of income taxes, under the following basic principles:
| i. | A deferred tax liability or asset is recognized for the estimated future tax effects attributable to temporary differences and tax loss carryforwards. |
| ii. | The measurement of deferred tax liabilities and assets is based on the provisions of the enacted tax law. The effects of future changes in tax laws or rates are not anticipated. |
| iii. | The measurement of deferred tax assets are reduced by a valuation allowance, if, based on the weight of available evidence, it is more likely than not that some portion of the deferred tax assets will not be realized. |
F - 112
ENERSIS S.A. AND SUBSIDIARIES
Notes to the Consolidated Financial Statements – (Continued)
Temporary differences are defined as any difference between the financial reporting basis and the tax basis of an asset and liability that at some future date will reverse, thereby resulting in taxable income or expense. Temporary differences ordinarily become taxable or deductible when the related asset is recovered or the related liability is settled. A deferred tax liability or asset represents the amount of taxes payable or refundable in future years as a result of temporary differences at the end of the current year.
The principal difference between U.S. GAAP and Chile GAAP relates to the reversal of the complementary assets and liabilities recorded as a transitional provision for unrecorded deferred taxes as of January 1, 2000 and their corresponding amortization into income. Additionally, under U.S. GAAP, temporary differences arising in connection with fair value adjustments on business combinations result in deferred taxes and a corresponding adjustment to goodwill. An adjustment is required in the reconciliation to U.S. GAAP to record goodwill arising from deferred tax liabilities related to past business combinations. When required, the income tax effects of U.S. GAAP adjustments are recorded in our reconciliations to U.S. GAAP. The effect of these differences on the net income and shareholders’ equity of the Company is included in paragraph (gg) below.
| (f) | Severance indemnity |
As described in Note 2 n, under the Company's employment contracts, it has committed to provide a lump sum payment to each employee in its Chilean entities at the end of their employment, whether due to death, termination, resignation or retirement. Until December 31, 2003, those obligations are calculated based on the present value of the liability determined at each year-end based on the current salary and average service life of each employee. The Company and its Chilean subsidiaries used a discount rate of 9.5% for the years ended December 31, 2002 and 2003. As described in Note 3, starting January 1, 2004 the Company changed certain of its underlying assumptions related to its severance indemnities changing the discount rate of 6.5% and modifying the turnover rate.
Under US GAAP, this arrangement is considered to be a termination indemnity plan and should therefore be accounted for in accordance with SFAS No. 87, “Employers’ Accounting for Pensions”. The liability would be measured at the actuarial present value as of the balance sheet of all benefits attributed by the severance indemnity benefit formula to employee service rendered prior to the balance sheet. The vested benefit obligation is measured using assumptions as to future compensation levels. For U.S. GAAP purposes, the discount rate has to be reassessed every year, to the relevant discount rate for the period between the date and the expected date of payment. In 2003, the Company, for US GAAP purposes, used a 6.5% discount rate in according with the above guidance. The impact of using the appropriate discount rates under US GAAP for 2002 and 2003 would not have resulted in a material difference from the obligation recorded at the rate in use in accordance with Chilean GAAP.
Therefore, in 2004, the accounting assumptions underlying the calculation of the obligation for staff severance indemnities were the same under Chile GAAP and US GAAP.
The Company recognizes actuarial gains and losses immediately for severance indemnity plans for both Chilean GAAP and U.S. GAAP.
The effects of accounting for severance indemnity benefits under US GAAP have been presented in paragraph (gg).
F - 113
ENERSIS S.A. AND SUBSIDIARIES
Notes to the Consolidated Financial Statements – (Continued)
| (g) | Pension and post-retirement benefits accounting |
The Company has obligations related to post-retirement benefits as stipulated in collective bargaining agreements and pension obligations as stipulated by contract for its subsidiaries in Brazil, Colombia and Chile under U.S. GAAP, post-retirement benefits are accounted for under SFAS 106 and pension obligations are accounted for under SFAS 87 which results in the following differences:
| i. | In 2000, the Company recorded its obligation for post-retirement benefits at our consolidated subsidiaries, Cerj and Coelce under Chilean GAAP. Technical Bulletin 8 allows the Company to record a transition asset for post-retirement benefits and pension obligations, as calculated under Chilean GAAP, and to amortize the amount, on a straight-line basis, for up to five years. The Company is amortizing this amount over a period of three years. Cerj and Coelce had adopted U.S. GAAP for external reporting purposes prior to 2000 and there was no remaining unamortized transition obligation. Therefore, the amortization that is appropriately being recorded under Chilean GAAP for the transition asset related to post-retirement benefits and pensions is reversed in our reconciliation to U.S. GAAP. |
| ii. | Under both Chilean GAAP and US GAAP, actuarial gains/losses are deferred over the average remaining service period when the cumulative amount of deferred actuarial gains and losses are less than 10% of the higher of the projected benefit obligation or fair value of plan assets. |
| Chilean GAAP recognizes an additional minimum liability, similar to that defined under SFAS 87, through the income statement. Under US GAAP, if the amount of the additional minimum liability required to be recognized exceeds the unrecognized prior service costs, the excess shall be reported as a separate component within other comprehensive income net of any tax benefits; if no excess exists, the additional minimum liability is recorded against an offsetting intangible asset. | |
| iii. | The changes effected for the discount rate in Chile GAAP and US GAAP and their timing as described in (f) were also instituted for post-retirement benefits. |
The effects of accounting for post-retirement benefits under US GAAP have been presented in paragraph (gg).
| (h) | Investments in related companies |
Under Chilean GAAP, until December 31, 2003 for all investments accounted for by the equity method, the proportionate net book value of the investee company was recorded as an investment and the difference between the cost of investment and the proportionate net book value of the investee was recorded as goodwill. The goodwill is to be amortized to income over a maximum period of twenty years. The investment account is adjusted to recognize the investor’s share of the earnings or losses of the investee determined under Chilean GAAP subsequent to the date of the purchase. Technical Bulletin No. 72 issued by Chilean Association of Accountants requires using fair value of acquired assets and liabilities for the accounting for all acquisitions after January 1, 2004 and recording the differential between the cost and the fair value as goodwill/negative goodwill as well as prospectively designating all investments of 20% to 50% as having significant influence rather than the 10% to 50% level previously defined as having significant influence in Chilean GAAP. No retroactive changes or cumulative effects of changes in accounting principles were required under Technical Bulletin No. 72.
Under US GAAP, in accordance with Accounting Principles Board Opinion No. 18, “the Equity Method for accounting for Investment in Common Stock” (“APB No. 18”), the carrying amount of an investment accounted for under the equity method is initially recorded at cost and shown as a single amount in the balance sheet of the investor. It is adjusted to recognize the investor’s share of the earnings or losses of the investee determined under US GAAP subsequent to the date of investment. The investment reflects adjustments similar to those made in preparing consolidated financial statements, including adjustments to eliminate inter-company gains and losses and to account for the differences, if any, between the investor’s cost and the underlying equity in net assets of the investee at the date of investment. The investment is also adjusted to reflect the investor’s share of change in the investee capital accounts.
F - 114
ENERSIS S.A. AND SUBSIDIARIES
Notes to the Consolidated Financial Statements – (Continued)
The Company’s equity share of the effect of the adjustments from Chilean GAAP to U.S. GAAP of equity accounted investees is included in paragraph (gg) below. The principal U.S. GAAP adjustments affecting the Company’s equity investees are as follows:
| (i) | Reversal of capitalized foreign currency exchange differences related to capitalized interest. | |
| (ii) | Reversal of complementary accounts (asset or liability) recorded as a transitional provision as of January 1, 2000. | |
| (iii) | Organizational costs deferred under Chilean GAAP that, under U.S. GAAP, should have been included in income. | |
| (iv) | The recording of derivative instruments in accordance with SFAS No. 133. | |
| (v) | The deferred income tax effects of adjustments (i), (iii) and (iv). | |
| (i) | Goodwill and long-lived assets | |
| (i) | Under Chilean GAAP, for acquisitions completed through December 31, 2003 assets acquired and liabilities assumed are recorded at their carrying value, and the excess of the purchase price over the carrying value are recorded as goodwill. Circular No. 1358, dated December 3, 1997 issued by the SVS, extended the maximum amortization period of goodwill to 20 years from the previous 10 years. | |
| Under U.S. GAAP, assets acquired and liabilities assumed are recorded at their estimated fair values, and the excess of the purchase price over the estimated fair value of the net identifiable assets and liabilities acquired are recorded as goodwill. Up until December 31, 2001, the Company amortized goodwill on a straight-line basis over the estimated useful lives of the assets, ranging from 20 to 40 years. Goodwill acquired after June 30, 2001 is not amortized. In accordance with SFAS No. 142, the Company discontinued amortizing goodwill on January 1, 2002. The effects of recording the different amortization periods and reversing the amortization of goodwill are included in paragraph (gg) below. | ||
| Technical Bulletin No. 72 issued by Chilean Association of Accountants requires using fair value of acquired assets and liabilities for the accounting for all acquisitions after January 1, 2004, and consequently after that date difference in accounting treatment related to the allocation of purchase consideration over assets acquired and liabilities assumed between Chilean GAAP and US GAAP no longer exists. | ||
| (ii) | Under Chilean GAAP, the Company evaluated, during 2002, the carrying amount of goodwill net of negative goodwill for impairment. The measurement of the impairment loss was based on the fair value of the investment which the Company determined using a discounted cash flow approach and recent comparable transactions in the market. In order to estimate fair value, the Company made assumptions about future events that were highly uncertain at the time of estimation. The results of this analysis showed that the goodwill and negative goodwill associated with investments in Argentina and Brazil were impaired because estimated future discounted cash flows were not sufficient to recover goodwill and negative goodwill. During 2002, under Chilean GAAP the Company recorded a net charge related to its investments in Central Costanera S.A., Hidroeléctrica El Chocón S.A., Hidroinvest S.A., Lajas Inversora S.A., Central Eléctrica Cachoeira Dourada S.A., Cía. de Electricidade do Rio de Janeiro S.A., Coelce S.A., Distrelec Inversora S.A., Edesur S.A., and Investluz S.A., in the amount of ThCh$244,768,877 net of minority interest, to write-off all amounts of goodwill and negative goodwill in a accordance with the results of impairment analyses performed for these companies. | |
| In accordance with U.S. GAAP, the Company adopted SFAS No. 142 “Goodwill and Other Intangible Assets”, (SFAS No. 142) as of January 1, 2002. SFAS 142 applies to all goodwill and intangible assets acquired in a business combination. Under the new standard, all goodwill, including that was acquired before initial application of the standard and indefinite-lived intangible assets are not amortized as of the effective date but must be tested for impairment at least annually. The transitional impairment test required by the standard was performed and no adjustment for impairment was required. However, based on subsequent testing of the Company’s investments in Argentina and Brazil performed as of December 31, 2002, it was determined that these investments were impaired. | ||
F - 115
ENERSIS S.A. AND SUBSIDIARIES
Notes to the Consolidated Financial Statements – (Continued)
The following net effects are included in the net income (loss) and shareholders’ equity reconciliation to U.S. GAAP under paragraph (gg) below:
| (a) | reversal of goodwill amortization recorded under Chilean GAAP | |
| (b) | the adjustment to record the reversal of the impairment recorded under Chilean GAAP during 2002, which is different in amount from that in U.S. GAAP because of goodwill basis differences, | |
| (c) | the adjustment to record the impairment under US GAAP from investment in Argentina and Brazil in 2002 |
The adjustment as of each year are as follows:
| As of December 31, | |||||||
| 2002 | 2003 | 2004 | |||||
| ThCh$ | ThCh$ | ThCh$ | |||||
| Reversal of goodwill amortization | 55,829,283 | 52,416,632 | 53,776,148 | ||||
| Reversal of impairment recorded under Chilean GAAP | 468,363,520 | — | — | ||||
| Impairment of goodwill under US GAAP | (621,543,408 | ) | — | — | |||
| Totals | (97,350,605 | ) | 52,416,632 | 53,776,148 | |||
| (iii) | The company has considered the factors which could be considered changes in circumstances which would trigger an impairment review and, in accordance with SFAS No. 144, “Accounting for the Impairment or Disposa1 of Long-Lived Assets” beginning in 2002, the Company eva1uates the carrying amount of property, plant and equipment and other long-lived assets, in relation to the operating performance and future undiscounted cash flows of the underlying business. These standards require that an impairment loss be recognized in the event that facts and circumstances indicate that the carrying amount of an asset may not be fully recoverable. Impairment is recorded based on an estimate of future discounted cash flows, as compared to current carrying amounts. There were no differences between impairment charges recorded under Chilean GAAP and U.S. GAAP except for the reclassification of impairment charges in 2002 related to the subsidiaries Centrais Electrica Cachoeira Dourada S.A. and Inmobiliaria Manso de Velasco Limitada from non-operating expenses as they were reported under Chilean GAAP (see Note 23b), to operating income under U.S. GAAP. |
| (j) | Negative Goodwill |
Under Chilean GAAP, until December 31, 2003 the excess of the carrying value of the assets assumed in a business combination over the purchase price is recorded as negative goodwill. Circular No. 1358, dated December 3, 1997 issued by the SVS, extended the maximum amortization period of negative goodwill to 20 years from the previous 5 years. Technical Bulletin No. 72 issued by Chilean Association of Accountants requires using fair value accounting for all acquired assets and liabilities for all acquisitions after January 1, 2004
Under U.S. GAAP, the fair values of the assets acquired less the fair values of the liabilities assumed in excess of the purchase price is allocated proportionately to reduce the values assigned to long-lived assets. If the allocation reduces the long-lived assets to zero, the remainder of the excess is recorded as an extraordinary gain to income.
The effect of reduced depreciation expense on the long-lived assets (for which no circumstances changed requiring an impairment test under SFAS No. 144) to which negative goodwill had been allocated under U.S. GAAP net against the reversals of both amortization and write-offs of negative goodwill recorded in Chile GAAP (over the appropriate useful lives as defined in the first paragraph) are included in paragraph (gg) below.
F - 116
ENERSIS S.A. AND SUBSIDIARIES
Notes to the Consolidated Financial Statements – (Continued)
| (k) | Capitalized interest and exchange differences |
In accordance with Chilean GAAP, the Company has capitalized both interest on debt directly related to property, plant and equipment under construction and finance costs corresponding to exchange differences generated by the loans associated with such assets. The capitalization of interest costs associated with projects under construction is optional when incurred on debt that is not directly related to such projects. The Company has optioned for not capitalizing indirect interest cost under Chilean GAAP.
Under U.S. GAAP, the capitalization of interest on qualifying assets under construction is required, regardless of whether interest is associated with debt directly related to a project to the extent that interest cost would have been available if the project had not been done. In addition, under U.S. GAAP, foreign translation exchange differences may not be capitalized. The accounting differences between Chilean and U.S. GAAP for financing costs and the related depreciation expense are included in the reconciliation to U.S. GAAP under paragraph (gg) below.
| (l) | Accumulated deficit during the development stage |
Under Chilean GAAP, the losses incurred during the development stage of subsidiary companies is recorded directly in the parent company’s equity. Under U.S. GAAP, such costs must be charged to income as incurred. As of December 31, 2004, no company was classified as development stage company. For the years ended December 31, 2002 and 2003, the effects of the adjustment are included in paragraph (gg) below
| (m) | Minimum dividend |
As required by the Chilean Companies Act, unless otherwise decided by the unanimous vote of the holders of issued and subscribed shares, the Company must distribute a cash dividend in an amount equal to at least 30% of its net income for each year as determined in accordance with Chilean GAAP, unless and except to the extent the Company has unabsorbed prior year losses. Net income related to the amortization of negative goodwill can only be distributed as an additional dividend by the approval of the shareholders, and accordingly, is not included in the calculation of the minimum dividend to be distributed. Since the payment of the 30% dividend out of each year’s income is required by Chilean law, an accrual was made in the reconciliation in paragraph (gg) below to reflect the unrecorded dividend liability for 2004.
| (n) | Capitalized general and administrative expenses |
Until 1993, under Chile GAAP Endesa-Chile capitalized a portion of its administrative and selling expenses as part of the cost of construction in progress because a substantial portion of the efforts of management were involved in the administration of major projects. Under U.S. GAAP, general and administrative expenses are charged to expense unless they can be directly identified with the supervision of the construction of specific projects. Under Chilean GAAP the Company has also capitalized other administrative expenses into other long-term assets, which under US GAAP would not be allowed. The effects of eliminating capitalized general and administrative expenses and the related depreciation for U.S. GAAP purposes are shown below under paragraph (gg).
| (o) | Involuntary employee termination benefits |
Under Chilean GAAP, the Argentine subsidiaries, Central Costanera and Hidroelectricidad, recorded an accrual of certain involuntary employee termination benefits related to the restructuring plan announced in 1997. Since that date employees have continued to be made redundant pursuant to this plan. Additionally, during 2003 the Company increased the amount of the accrual recorded under Chilean GAAP. In accordance with U.S. GAAP, at that time in order to recognize a liability at the balance sheet date for the cost to terminate employees involuntarily, there must be a plan that specifically includes notification to employees prior to the balance sheet date. As of December 31, 2002, 2003 and 2004, this requirement had not been met.
The net effect of eliminating the accrued liability recognized under Chile GAAP is presented in paragraph (gg) below.
F - 117
ENERSIS S.A. AND SUBSIDIARIES
Notes to the Consolidated Financial Statements – (Continued)
| (p) | Adjustment in selling price of investment |
Under Chilean GAAP, pursuant to the share transaction contract entered into in 1995 between Endesa-Chile and Endesa Overseas Co. with Enersis Intemational Limited, Chilectra S.A. and Chilectra IntemationaI Limited, Endesa Argentina recognized income related to an adjustment of the share purchase price. Under U.S. GAAP, the contingent price adjustment would be considered a part of the purchase price, and would therefore be offset against the amount of goodwill that was originally determined. As described in paragraph (i), the Company determined goodwill amounts recorded in investments in Argentina were impaired as of December 31, 2002, thus the adjustment in selling price of investment is a basis difference between Chilean and U.S. GAAP that was eliminated after the impairment charge recorded in 2002.
The effects of the adjustments to conform to U.S. GAAP are included under paragraph (gg) below.
| (q) | Elimination of capitalized interest in Brazil |
Until 1999, under Chilean GAAP, the Company capitalized interest to property, plant and equipment as a result of the creation of a legal reserve specifically permitted in Brazil for the electricity industry by crediting interest expense. Under U.S. GAAP, interest capitalized must be based on actual interest incurred, and as such the effects of the elimination of the interest capitalized to property, plant and equipment and the effects on depreciation expense are included in paragraph (gg) below.
| (r) | Organizational and start-up costs |
Certain costs related to the organization and creation of certain subsidiaries of the Company are deferred and capitalized under Chilean GAAP and amortized.
Under U.S. GAAP, such organizational and start-up costs may not be deferred and must be included in income as incurred.The effects of the difference are included in paragraph (gg) below.
| (s) | Translation of Financial Statements of Investments Outside of Chile |
Under Chilean GAAP, in accordance with Technical Bulletin 64 (“B.T. 64”) the financial statements of foreign subsidiaries that operate in countries exposed to significant risks (“unstable” countries), and that are not considered to be an extension of the parent company’s operations, are remeasured into US dollars. The Company’s foreign subsidiaries in Argentina, Perú, Brazil, and Colombia all meet the criteria of foreign subsidiaries that operate in countries exposed to significant risks under BT 64, and are remeasured into US dollars. The Company has remeasured its foreign subsidiaries into US dollars under this requirement as follows:
| • | Monetary assets and liabilities are translated at year-end rates of exchange between the US dollar and the local currency. |
| • | All non-monetary assets and liabilities and shareholder’s equity are translated at historical rates of exchange between the US dollar and the local currency. |
| • | Income and expense accounts are translated at average rates of exchange between the US dollar and local currency. |
| • | The effects of any exchange rate fluctuations between the local currency and the US dollar are included in the results of operations for the period. |
Under BT 64, the investment in the foreign subsidiary is price-level restated, the effects of which are reflected in income, while the effects of the foreign exchange gains or losses between the Chilean Peso and the US dollar on the foreign investment measured in US dollars, are reflected in equity in the account “Cumulative Translation Adjustment”.
The amount of foreign exchange gain (loss) included in income that is attributable to operations in unstable countries because these amounts have been remeasured into US dollars was ThCh$186,392,592, ThCh$(69,199,468) and ThCh$(56,947,613) for the years ended December 31, 2002, 2003 and 2004, respectively (See Note 23).F - 118
ENERSIS S.A. AND SUBSIDIARIES
Notes to the Consolidated Financial Statements – (Continued)
Company’s Management believes that, foreign currency translation procedures described above are part of the comprehensive basis of preparation of price-level adjusted financial statements required by Chilean GAAP. Inclusion of inflation and translation effects in the financial statements is considered appropriate under the inflationary conditions that have historically affected the Chilean economy, and accordingly, are not eliminated in the reconciliation to U.S. GAAP as permitted by Form 20-F.
| (t) | Derivative instruments |
The Company engages in derivative activity for hedging purposes. These derivatives are considered accounting hedges under Chilean GAAP. Under Chilean GAAP the accounting treatment of hedging activity is similar to the accounting treatment of fair value hedges and cash flow hedges under SFAS 133. The documentation and hedge effectiveness requirements under Chilean GAAP though are not as burdensome as under SFAS 133. Under SFAS 133 to qualify for hedge accounting strict requirements need to be met, including hedge documentation and effectiveness tests. The Company does not have the documentation and hedge effectiveness requirements to qualify for hedge accounting. Therefore, all derivative instruments have been accounted at fair value with changes in fair value recognized in earnings for US GAAP purposes.
The Company has designated under Chilean GAAP certain non-derivative financial instruments as hedges of the foreign currency exposure of net investments in foreign operations. The gain or loss on the non-derivative financial instrument that is designated as a hedge is reported as a translation adjustment to the extent it is effective as a hedge, any ineffectiveness is recorded in earnings. This accounting treatment is consistent with SFAS 133.SFAS 133 also requires that certain embedded derivatives be separated and reported on the balance sheet at fair value and be subject to the same rules as other derivative instruments. Current Chilean accounting rules do not consider the existence of derivative instruments embedded in other contracts and therefore they are not reflected in the financial statements under Chilean GAAP.
The effects of the adjustment with respect to financial derivatives, commodity derivatives, and embedded derivatives for the years ended December 31, 2002, 2003 and 2004 is included in the net income and shareholders’ equity reconciliation to US GAAP under paragraph (gg) below.
| (u) | Fair value of long-term debt assumed |
As discussed in paragraph (i), under Chilean GAAP, assets acquired and liabilities assumed are recorded at their carrying value, and the excess of the purchased price over the carrying value are recorded as goodwill. Under U.S. GAAP, assets acquired and liabilities assumed are recorded at their estimated fair values, and the excess of the purchased price over the estimated fair value of the net identifiable assets and liabilities acquired are recorded as goodwill. As part of the purchase of the majority ownership interest in Endesa-Chile, under U.S. GAAP, the cost of the purchase price would have been allocated to the fair value of long-term debt.
The effect on shareholder’s equity and net income for the years presented is included in paragraph (gg) below.
| (v) | Effects on US GAAP of sale of subsidiary Río Maipo |
The adjustment of the net gain obtained from the sale of the subsidiary Compañía Eléctrica del Río Maipo S.A results from the reversal of the accumulated US GAAP adjustment at December 31, 2002. As explained in Note 11d) this subsidiary was sold in April 2003. The reversal of these adjustment increased by ThCh$501,587 the gain obtained from the sale of this subsidiary.
The operating income generated by Río Maipo until disposal date amounted to ThCh$2,828,342 (sales amounted to ThCh$14,824,196 less cost of sales amounted to ThCh$11,087,968 and administrative and selling expenses amounted to ThCh$907,886) was reclassified from non-operating income to operating income in accordance with US GAAP (see Note 36 II (k)).The sales of subsidiaries Infraestructura 2000 S.A. and Canutillar Plan did not result in any US GAAP difference adjustment.
F - 119
ENERSIS S.A. AND SUBSIDIARIES
Notes to the Consolidated Financial Statements – (Continued)
| (w) | Deferred income |
During 2000, fiber optic cable was contributed to the Company in return for granting the contributing company access to the fiber optic network after installation in the Company’s electricity distribution system. Under Chilean GAAP, the contributed assets were recorded at their fair market value, with a corresponding credit recognized as income in 2000. Under U.S. GAAP, the amount was deferred and amortize over the life of the related service contract. This adjustment reverses the gain under Chile GAAP and records the amortization of the deferred income recognized under U.S. GAAP.
The effect on shareholders’ equity and net income for the years presented is included in (gg) below.
| (x) | Regulated assets and deferred costs |
The electricity sector in Chile and other countries of operation in Latin America is regulated pursuant to the Chilean and other country electricity laws. Most of the Company’s sales are subject to node price regulation, which is designed to ensure an adequate supply of energy at reasonable, determined prices, which considers a variety of factors. The marginal cost pricing model is not solely based upon costs incurred by the Company, and as a result, the requirements of U.S. GAAP under SFAS No.71, “Accounting for the Effects of Certain Types of Regulation”, related to a businesses whose rates are regulated are not applicable to the Company’s financial statements, except for the Company’s operations in Brazil as described below.
As a result of changes in Brazilian Electricity Laws and Regulations, the Company’s distribution subsidiaries in Brazil, Companhia de Electricidad do Rio de Janeiro (Cerj) and Companhia Energética do Ceará (Coelce), are subject to the provisions of SFAS No. 71 beginning on January 1, 2001. With the new regulations issued by the National Agency of Electric Energy (ANEEL), the rate-setting structure in Brazil is now designed to provide recovery for allowable costs incurred, which will be recovered through future increases in energy tariffs in order to recover losses experienced during the period of Brazilian Federal Government mandated energy rationing from June 1, 2001 to December 31, 2001. The Company estimates remaining costs will be recovered over a period of three years, from the balance date.Accordingly, the Company capitalizes incurred costs as deferred regulatory assets when there is a probable expectation that future revenue equal to the costs incurred will be billed and collected as a direct result of the inclusion of the costs in an increased rate set by the regulator. The deferred regulatory asset is eliminated when the Company collects the related costs through billings to customers. ANEEL perform a rate review on an annual basis. If ANEEL excludes all or part of a cost from recovery, that portion of the deferred regulatory assets is impaired and is accordingly reduced to the extent of the excluded cost. The Company has recorded deferred regulatory assets, which it expects to pass on to its customers in accordance with and subject to regulatory provisions.
The regulations also included certain VPA costs, which each distribution company is permitted to defer and pass on to their customers using future rate adjustments. VPA costs are limited by concession contracts to the cost of purchased power and certain other costs and taxes. Due to uncertainty in the Brazilian economy, ANEEL delayed the approval of such VPA rate increases. An Executive Order in October 2001 created a tracking account mechanism, in order to calculate the variation in the VPA costs for future rate adjustment calculation purposes. The Company has not recognized any regulatory assets for VPA costs incurred prior to 2001, because costs incurred prior to January 1, 2001, are not recoverable through the tracking account.Under Chilean GAAP, the Company recognized revenue and deferred costs related to the regulated assets. Under U.S. GAAP, in accordance with Emerging Issues Taskforce (EITF) No. 92-7, “Accounting by Rate Regulated Utilities for the Effects of Certain Alternate Revenue Programs”, revenue amounts not expected to be collected within 24 months, have been deferred.
The effect of deferring revenues expected to be collected after two years is included in (gg) below.F - 120
ENERSIS S.A. AND SUBSIDIARIES
Notes to the Consolidated Financial Statements – (Continued)
| (y) | Reorganization of subsidiaries |
This adjustment corresponds to the reorganization of the Company's subsidiaries Central Costanera S.A. and Central Buenos Aires (CBA) during 2001, in which Central Costanera acquired the minority interest in CBA from third parties and exchanged shares with Endesa Argentina S.A. Under Chilean GAAP, the Company recorded the transactions under the pooling method, using the book values of the net assets acquired under merger accounting.
Under US GAAP the exchange of shares between entities under common control is recorded at book values. However, to the extent that shares in CBA were acquired from third parties, the identifiable assets acquired and liabilities assumed are recorded at fair value using purchase accounting together with the shares issued by the subsidiary Central Costanera S.A. The difference in property, plant and equipment basis between Chilean GAAP and US GAAP results in a greater depreciation expense to be recorded under US GAAP over the remaining estimated useful life of 20 years.
The effect of this adjustment is included in the net income and shareholders' equity reconciliation to US GAAP under paragraph (gg) below.
| (z) | Assets held for sale |
Under Chilean GAAP the Company records divestitures of investments or assets in the year in which they occur. Under U.S. GAAP, in accordance with SFAS No. 144, long-lived assets for which there is a plan to sell the assets within the following year, shall be disclosed separately from the Company’s other assets, provided all the criteria are met. Additionally, long-lived assets classified as held for sale must be measured at the lower of their carrying amount or fair value less cost to sell. Long-lived assets shall not be depreciated while they are classified as held for sale, while interest and other expenses attributable to the liabilities of a disposal group classified as held for sale shall continue to be accrued.
The Company’s Board of Directors approved a plan to sell a number of the Company’s assets during October 2002. The following assets to be sold meet the definition of, reporting units or long-lived assets held for sale:
| • | Compañía Eléctrica del Río Maipo S.A. | |
| • | Central Canutillar power plant | |
| • | Gas Atacama transmission lines | |
| • | CELTA transmission lines | |
| • | Infraestructura 2000 S.A. |
The Company evaluated the carrying values of all assets held for sale, recording a loss to the extent that one of the assets’ fair values less cost to sell was lower than the carrying value of those assets. Additionally, the Company ceased recording depreciation expense once the assets met the qualification criteria of held for sale, which occurred over various dates from October to December 2002.
During 2003, all of the designated assets had been sold therefore eliminating this difference in 2003.
The effect of these adjustments is included in the net income and shareholders' equity reconciliation to U.S. GAAP under paragraph (gg) below.
| (aa) | Elimination of discontinued operations |
Under Chilean GAAP, no restatement to the financial statement information presented in previous years is required after a divestiture has occurred. Under US GAAP, in accordance with SFAS No. 144, the discontinued operations of a component must be retroactively separated from the continuing operations of an entity, when the operations and cash flows of a component which will be eliminated from the ongoing operations of an entity as a result of a disposal transaction will not have any significant continuing involvement in the operations of a component after the disposal transaction.
F - 121
Notes to the Consolidated Financial Statements – (Continued)
The Company evaluated whether any of the assets held for sale met either criteria, noting that the transmission lines and power plant are not components, as they are included as a part of larger cash flow generating groups, and the operations of these assets cannot be separated from their respective groups. Additionally, Endesa-Chile plans to continue generating revenues from Canutillar through a purchase power agreement, management agreement, and a transmission leasing arrangement with the future buyer. Infraestructura 2000 S.A. met the conditions for being classified as a discontinued operation, because it has distinct and separable financial results from operations and cash flows. As a result of the disposal the results of operations of the reporting unit have been eliminated from the ongoing operations of Enersis, as Enersis will not have any continuing involvement in the operations of Infraestructura 2000 S.A. after its was sold. The Rio Maipo facility was classified as “held for sale” on December 31, 2002. In April, 2003, the Company sold the facility. In accordance with SFAS 144, the Company determined that the Rio Maipo did not meet the criteria to be classified as a discontinued operations as Enersis will have a significant continuing involvement through continuing sales to Rio Maipo’ though its subsidiary Endesa - Chile.
The effect of reclassifying discontinued operations is included in the net income reconciliation to U.S. GAAP under paragraph (gg) below.
| (bb) | Effects of minority interest on the U.S. GAAP adjustments |
The net income and shareholders’ equity under Chilean GAAP is adjusted in the U.S. GAAP footnote for the impact of the U.S. GAAP reconciling items on the allocation of income and loss to minority interests. The sum of this adjustment and the minority interest reflected in our consolidated income statement and balance sheet for each period presented under Chilean GAAP represents the allocation of our results and shareholders’ equity to our minority shareholders under U.S. GAAP.
The effect of this adjustment is included in net income and shareholders’ equity reconciliation to US GAAP under paragraph (gg) below.
| (cc) | Extraordinary Items |
In 2002, the Company incurred a Chilean GAAP extraordinary charge in accordance with Decree No. 1,949 of the Republic of Colombia for a tax that will be used for Colombia’s democratic security, as disclosed in Note 26 Extraordinary Items.
Under U.S. GAAP, this charge is classified as income tax expense in accordance with SFAS 109, Accounting for Income Taxes (SFAS 109), as discussed in Note 36 II k) Reclassification to U.S. GAAP.
| (dd) | Negative Goodwill CERJ |
In January 2003, CERJ, one of our Brazilian subsidiaries approved a capital increase as a result of which our ownership interest in CERJ increased, as certain minority shareholders, including certain wholly owned subsidiaries of Endesa-Spain, Enersis ultimate parent company did not participate.
Under Chile GAAP in accordance with BT No 42 and SVS Circular 368 the company recognized the value of the difference between the amount contributed and the underlying net book in the company was as negative goodwill, to be amortized over a 20 year period. In accordance with the appropriate guidance, Enersis is allowed to fully amortize into income the amount of any negative goodwill, if during the first year subsequent to the capital increase the amount of the losses incurred by the subsidiary is in excess the amount of negative goodwill. During 2003, CERJ incurred losses consequently Enersis fully amortized into income the negative goodwill originally recognized.
Under US GAAP, the transaction would be considered a transaction between entities under common control in which the minority interest did not participate, consequently similar to the guidance in FTB No. 85-5, Issues Relating to Accounting for Business Combinations the transaction is accounted for as a capital transaction. Consequently the amount of the negative goodwill amortized into income in Chile GAAP is recorded directly as an increase to consolidated equity under US GAAP.
The effects in net income of the US GAAP adjustment are presented in note (gg) below.
F - 122
ENERSIS S.A. AND SUBSIDIARIES
Notes to the Consolidated Financial Statements – (Continued)
| (ee) | Extinguishment of debt |
In March 2003, certain bondholders were granted an option to exchange between November 1, and 15, 2003 their bonds in exchange for shares of the Company at a fixed price of Ch$60.4202. Under Chile GAAP the transaction was accounted for as an exchange of debt for equity with the difference between the carrying amount of the debt and the strike price of the conversion recognized directly in equity a share premium.
Under US GAAP the transaction should be recognized as an extinguishment of debt in accordance with APB No. 14, using as reacquisition price of the extinguished debt the value of the common issued or the value of the debt whichever is more clearly evident, as Enersis stock is publicly trade the fair value of the shares is being considered to be more clearly evident. The average conversion price during November 2003, the conversion period was Ch$78 per share.
The effects in net income and shareholders’ equity of the US GAAP adjustment are presented in note (gg) below.
| (ff) | Asset retirement obligations |
Under Chilean GAAP, there is no requirement to record obligations associated with the retirement of tangible long-lived assets. Under U.S. GAAP, the Company adopted SFAS No. 143, “Accounting for Asset Retirement Obligations” effective January 1, 2003. Previously, the Company had not been recognizing amounts related to asset retirement obligations under U.S. GAAP.
This standard requires the Company to record the fair value of the legal obligation it has to make certain environmental restorations upon closure of its facilities. The fair value of the liability is estimated by discounting the future estimated expenditures related to the restoration. The Company then measures changes in the liability due to passage of time by applying an interest method of allocation to the amount of the liability at the beginning of the period. The interest rate used to measure that change is the credit-adjusted risk-free rate that existed when the liability, or portion thereof, was initially measured. That amount is recognized as an increase in the carrying amount of the liability and the expense is classified as an operating item in the statement of income, referred to as accretion expense.
At the same time the standard requires the Company to capitalize the new costs arising as the result of additional liabilities incurred, such as the activation of a new generation facility, and subsequently allocate that asset retirement cost to expense over the life of the plant based on the useful life of the plant. The accumulated effect of adopting SFAS 143 as of January 1, 2003 is presented in paragraph (gg) below, net of taxes of ThCh$287,502 and minority interest of ThCh$154,377. At December 31, 2003 and 2004, the adjustment to US GAAP income from continuing operations represents the accreted interest expense and depreciation of the costs capitalized for the asset retirement obligations.
In Peru, where we have eight hydroelectric plants and one thermoelectric plant, existing legislation includes the requirement for entities with electrical assets to conduct retirement activities when operations cease. In Chile, under certain concession decrees governing four distribution lines, we are similarly required to conduct retirement activities upon cessation of operations.
The effects of this U.S. GAAP adjustment on net income and shareholders’ equity are presented in note (gg) below.
At December 31, 2003 and 2004, the adjustment to US GAAP income from continuing operations represents the accreted interest expense and depreciation of the costs capitalized for the asset retirement obligations.
F - 123
ENERSIS S.A. AND SUBSIDIARIES
Notes to the Consolidated Financial Statements – (Continued)
| (gg) | Effect of conforming to U.S. GAAP |
The reconciliation of reported net income required to conform with U.S. GAAP is as follows:
| As of December 31, | ||||||
| 2002 | 2003 | 2004 | ||||
| ThCh$ | ThCh$ | ThCh$ | ||||
| Net income (loss) in accordance with Chilean GAAP | (231,635,207 | ) | 12,779,560 | 44,307,596 | ||
| Reversal of amortization of revaluation of property, plant and equipment (paragraph b) | 3,454,430 | 1,653,213 | 1,848,514 | |||
| Depreciation of property, plant and equipment and difference in fixed assets value at acquisition date (paragraph c) | (5,647,997 | ) | (2,465,204 | ) | (2,196,372 | ) |
| Amortization of intangibles (paragraph d) | 126,135 | 126,134 | 1,009,079 | |||
| Deferred income taxes (paragraph e) | (21,894,635 | ) | 9,411,217 | 11,923,907 | ||
| Pension and post-retirement benefits (paragraph g) | 23,945,360 | 12,152,640 | (5,423,472 | ) | ||
| Investments in related companies (paragraph h) | 21,596,283 | 28,083,920 | 1,464 | |||
| Amortization and impairment of goodwill (paragraph i) | (97,350,605 | ) | 52,416,632 | 53,776,148 | ||
| Amortization of negative goodwill (paragraph j) | (85,215,878 | ) | (13,665,702 | ) | 1,197,823 | |
| Capitalized interest (paragraph k) | (26,166,717 | ) | 10,623,041 | 7,893,086 | ||
| Depreciation capitalized interest (paragraph k) | 2,515,596 | (3,088,013 | ) | (2,167,296 | ) | |
| Difference foreign exchange capitalized (paragraph k) | (10,285,379 | ) | 30,001,749 | (5,844,604 | ) | |
| Depreciation difference foreign exchange capitalized (paragraph k) | 260,422 | 71,020 | 247,149 | |||
| Accumulated deficit during the development stage (paragraph l) | (6,036,038 | ) | (1,335,234 | ) | — | |
| Capitalized general and administrative expenses (paragraph n) | 2,027,459 | (2,308,448 | ) | 2,791,871 | ||
| Involuntary employee termination benefits (paragraph o) | (359,324 | ) | 12,173 | (1,673 | ) | |
| Adjustment in selling price of investment (paragraph p) | 4,649,632 | — | — | |||
| Elimination of amortization of capitalized legal reserve (paragraph q) | 935,211 | 533,782 | 490,048 | |||
| Amortization of organizational and start-up costs (paragraph r) | 5,554,202 | 3,573,964 | 462,821 | |||
| Derivative instruments operating income (paragraph t) | (53,175,173 | ) | (167,791,585 | ) | (6,727,187 | ) |
| Derivative instruments non-operating income (paragraph t) | (27,653,343 | ) | 24,953,033 | 15,798,123 | ||
| Fair value of long-term debt assumed (paragraph u) | (94,786 | ) | (66,299 | ) | (138,246 | ) |
| Sale of subsidiaries (paragraph v) | — | 501,587 | — | |||
| Deferred income (paragraph w) | 284,517 | 122,715 | 229,506 | |||
| Regulated assets (paragraph x) | (53,044,069 | ) | 58,955,925 | 11,398,114 | ||
| Reorganization of subsidiaries (paragraph y) | (331,053 | ) | (270,848 | ) | (248,043 | ) |
| Asset held for sale (paragraph z) | (918,516 | ) | 918,516 | — | ||
| Reclassification of discontinued operations (paragraph aa) | (153,856 | ) | (303,472 | ) | — | |
| Effects of minority interest on the U.S. GAAP adjustments (paragraph bb) | 132,128,313 | 22,316,179 | 22,098,316 | |||
| Deferred tax effects on the U.S. GAAP adjustments | 80,774,318 | 5,698,558 | (671,673 | ) | ||
| Extinguishment of debt (paragraph ee) | -— | (18,146,247 | ) | — | ||
| Reversal amortization of negative goodwill Cerj. (paragraph dd) | — | (35,380,018 | ) | — | ||
| Staff severance indemnities (paragraph f) | — | 178,745 | (178,745 | ) | ||
| Asset retirement cost - (paragraph ff) | — | (1,489 | ) | 535,211 | ||
| Asset retirement obligations - liabilities (paragraph ff) | — | (44,474 | ) | (637,297 | ) | |
| Net income (loss) in accordance with U.S. GAAP before effect of discontinuedoperations, and cumulative effect of change in accounting principle | (341,710,698 | ) | 30,217,270 | 151,774,169 | ||
| Income from discontinued operations net of taxes and minority interest (paragraph aa) | 170,939 | 70,835 | — | |||
| Net income (loss) in accordance with U.S. GAAP before effect of cumulative effectof change in accounting principle | (341,539,759 | ) | 30,288,105 | 151,774,169 | ||
| Cumulative effect of change in accounting principle, net of the tax and minority interest | — | (287,502 | ) | — | ||
| Net income (loss) in accordance with U.S. GAAP | (341,539,759 | ) | 30,000,603 | 151,774,169 | ||
| Other comprehensive income (loss): | ||||||
| Cumulative translation adjustment determined under Chilean GAAP net of minority interest | 21,322,955 | (74,845,570 | ) | (96,275,517 | ) | |
| Cumulative translation adjustment related to U.S GAAP adjustments net of minority interest | (12,582,928 | ) | 52,450,844 | 12,452,098 | ||
| Comprehensive income (loss) in accordance with U.S.GAAP | (332,799,732 | ) | 7,605,877 | 67,950,750 | ||
F - 124
ENERSIS S.A. AND SUBSIDIARIES
Notes to the Consolidated Financial Statements – (Continued)
The reconciliation to conform shareholders’ equity amounts to U.S. GAAP is as follows:
| As of December 31, | ||||
| 2003 | 2004 | |||
| ThCh$ | ThCh$ | |||
| Shareholders' equity in accordance with Chilean GAAP | 2,612,101,688 | 2,559,553,142 | ||
| Reversal of revaluation of property, plant and equipment net of accumulated amortization revaluation of property, plant and equipment (paragraph b) | (12,464,109 | ) | (10,686,076 | ) |
| Depreciation of property, plant and equipment and difference in fixed asset valueat acquisition date (paragraph c) | (8,017,038 | ) | (10,845,548 | ) |
| Intangibles (paragraph d) | (1,009,079 | ) | — | |
| Deferred income taxes (paragraph e) | (247,951,919 | ) | (302,433,018 | ) |
| Pension and post-retirement benefits liabilities long term (paragraph g) | (13,009,204 | ) | (17,437,701 | ) |
| Investments in related companies (paragraph h and paragraph z) | 31,714,485 | 29,443,314 | ||
| Goodwill (paragraph i) | 303,693,155 | 353,200,284 | ||
| Goodwill gross amount (paragraph i) | 4,520,451 | 82,154,857 | ||
| Negative goodwill (paragraph j) | (405,222,235 | ) | (372,929,343 | ) |
| Capitalized interest (paragraph k) | 61,575,186 | 62,124,455 | ||
| Exchange diference (paragraph k) | (14,808,381 | ) | (19,849,732 | ) |
| Minimum dividend (paragraph m) | — | (8,160,208 | ) | |
| Capitalized general and administrative expenses (paragraph n) | (26,953,282 | ) | (23,175,518 | ) |
| Reversal of accrual of certain involuntary employee termination benefits (paragraph o) | 90,688 | 81,380 | ||
| Elimination of capitalized legal reserve (paragraph q) | (7,395,646 | ) | (6,282,920 | ) |
| Amortization organizational and start-up costs (paragraph r) | (28,341,554 | ) | (14,628,965 | ) |
| Derivative instruments (paragraph t) | (25,541,256 | ) | (16,495,956 | ) |
| Fair value of long-term debt assumed (paragraph u) | 1,244,204 | 1,105,960 | ||
| Reorganization of subsidiaries (paragraph y) | 4,870,378 | 4,212,272 | ||
| Deferred income (paragraph w) | (2,788,439 | ) | (2,324,155 | ) |
| Regulated assets (paragraph x) | (23,290,784 | ) | (9,931,912 | ) |
| Effects of minority interest on the U.S. GAAP adjustments (paragraph bb) | 227,074,831 | 223,852,306 | ||
| Deferred tax effects on the U.S. GAAP adjustments | 145,536,506 | 134,534,591 | ||
| Staff severance indemnities (paragraph f) | 178,745 | — | ||
| Asset retirement cost (paragraph ff) | 64,263 | 598,306 | ||
| Asset retirement obligations - liabilities (paragraph ff) | (537,670 | ) | (1,135,913 | ) |
| Shareholders' equity in accordance with U.S. GAAP | 2,575,333,984 | 2,634,543,902 | ||
F - 125
ENERSIS S.A. AND SUBSIDIARIES
Notes to the Consolidated Financial Statements – (Continued)
The changes in shareholders’ equity in U.S. GAAP as of each year-end are as follows:
| 2002 | 2003 | 2004 | ||||
| ThCh$ | ThCh$ | ThCh$ | ||||
| Shareholders equity in accordance with U.S. GAAP - January 1 | 1,199,433,654 | 879,725,912 | 2,575,333,984 | |||
| Minimum dividend payable (paragraph m) | 13,091,990 | — | (8,160,208 | ) | ||
| Negative goodwill Cerj (paragraph dd) | — | 35,380,018 | — | |||
| Extinguishment of debt (paragraph ee) | — | 18,146,247 | — | |||
| Cumulative translation adjustment | 8,740,027 | (22,394,726 | ) | (83,823,419 | ) | |
| Capital increase | — | 1,634,475,930 | (580,624 | ) | ||
| Net income (loss) in accordance with U.S. GAAP for the year | (341,539,759 | ) | 30,000,603 | 151,774,169 | ||
| Shareholders equity in accordance with U.S.GAAP - December 31 | 879,725,912 | 2,575,333,984 | 2,634,543,902 | |||
II. Additional disclosure requirements:
| (a) | Goodwill and negative goodwill |
The following is an analysis of goodwill and negative goodwill, determined on Chilean GAAP basis, as of December 31, 2003 and 2004, respectively:
| As of December 31, | ||||
| 2003 | 2004 | |||
| ThCh$ | ThCh$ | |||
| Goodwill | 1,724,462,233 | 1,711,291,508 | ||
| Less: accumulated amortization | (924,555,085 | ) | (977,756,405 | ) |
| Goodwill, net | 799,907,148 | 733,535,103 | ||
| Negative goodwill | (457,889,564 | ) | (450,516,782 | ) |
| Less: accumulated amortization | 376,674,066 | 393,780,968 | ||
| Negative goodwill, net | (81,215,498 | ) | (56,735,814 | ) |
Amortization expense under Chile GAAP is disclosed in Note 13.
F - 126
Notes to the Consolidated Financial Statements – (Continued)
| (b) | Basic and diluted earnings per share: |
| For the year ended December 31, | ||||||
| 2002 | 2003 | 2004 | ||||
| Ch$ | Ch$ | Ch$ | ||||
| Chilean GAAP (loss) earnings per share | (27.94 | ) | 0.62 | 1.36 | ||
| U.S. GAAP (loss) earnings per share: | ||||||
| U.S. GAAP (loss) earnings per share before effect of | ||||||
| discontinued operations and cumulative | ||||||
| effect of change in accounting principle | (41.21 | ) | 1.48 | 4.65 | ||
| Discontinued operations (net of tax) | 0.02 | 0.00 | — | |||
| U.S. GAAP (loss) earnings per share before effect of | ||||||
| cumulative effect of change in accounting principle | (41.19 | ) | 1.48 | 4.65 | ||
| Cumulative effect of change in accounting principle (net of tax) | — | (0.01 | ) | — | ||
| Basic and diluted U.S. GAAP (loss) earnings per share | (41.19 | ) | 1.47 | 4.65 | ||
| Total number of common outstanding shares at December 31, | 8,291,020 | 32,651,166 | 32,651,166 | |||
| Weighted average number of common shares outstanding (000's) | 8,291,020 | 20,471,093 | 32,651,166 | |||
| (1) | The earnings per share figures for both U.S. GAAP and Chilean GAAP purposes have been calculated by dividing the respective earnings (loss) amounts in accordance with U.S. GAAP and Chilean GAAP, respectively, by the weighted average number of common shares outstanding during the year. The Company has not issued convertible debt or contingent equity securities. Consequently, there are no potentially dilutive effects on the earnings per share of the Company. |
F - 127
ENERSIS S.A. AND SUBSIDIARIES
Notes to the Consolidated Financial Statements – (Continued)
| (c) | Income taxes: |
The provision (benefit) for income taxes charged to the results of operations determined in accordance with U.S. GAAP is as follows:
| 2002 | ||||||||||||
| Chile | Argentina | Perú | Brazil | Colombia | Total | |||||||
| ThCh$ | ThCh$ | ThCh$ | ThCh$ | ThCh$ | ThCh$ | |||||||
| Income tax provision under Chilean GAAP | ||||||||||||
| Current income taxes as determined under Chilean GAAP | (13,760,757 | ) | 64,313 | (13,107,651 | ) | (2,694,635 | ) | (46,843,142 | ) | (76,341,872 | ) | |
| Deferred income taxes as determined under Chilean GAAP | (3,328,058 | ) | 35,277,074 | (31,391,274 | ) | 6,086,915 | 1,353,131 | 7,997,788 | ||||
| Total income tax provision under Chilean GAAP | (17,088,815 | ) | 35,341,387 | (44,498,925 | ) | 3,392,280 | (45,490,011 | ) | (68,344,084 | ) | ||
| U.S. GAAP adjustments: | ||||||||||||
| Deferred tax effect of applying SFAS No. 109 | (2,379,812 | ) | 31,498,902 | (22,246,395 | ) | (25,156,270 | ) | (3,611,060 | ) | (21,894,635 | ) | |
| Deferred tax effect of adjustments to U.S. GAAP | 13,683,708 | (14,272,973 | ) | 22,346,301 | 21,081,175 | 37,936,107 | 80,774,318 | |||||
| Total U.S. GAAP adjustments: | 11,303,896 | 17,225,929 | 99,906 | (4,075,095 | ) | 34,325,047 | 58,879,683 | |||||
| US GAAP reclassifications (1) | 303,892 | 6,308,893 | (23,164,381 | ) | (16,551,596 | ) | ||||||
| Total Income tax provision under U.S. GAAP | (5,481,027 | ) | 52,567,316 | (44,399,019 | ) | 5,626,078 | (34,329,345 | ) | (26,015,997 | ) | ||
| 2003 | ||||||||||||
| Chile | Argentina | Perú | Brazil | Colombia | Total | |||||||
| ThCh$ | ThCh$ | ThCh$ | ThCh$ | ThCh$ | ThCh$ | |||||||
| Income tax provision under Chilean GAAP | ||||||||||||
| Current income taxes as determined under Chilean GAAP | (29,057,652 | ) | (15,015,433 | ) | (9,161,547 | ) | (50,037,373 | ) | (103,272,005 | ) | ||
| Deferred income taxes as determined under Chilean GAAP | 24,329,322 | 21,113,119 | (16,018,315 | ) | 30,618,264 | 619,631 | 60,662,021 | |||||
| Total income tax provision under Chilean GAAP | (4,728,330 | ) | 21,113,119 | (31,033,748 | ) | 21,456,717 | (49,417,742 | ) | (42,609,984 | ) | ||
| U.S. GAAP adjustments: | ||||||||||||
| Deferred tax effect of applying SFAS No. 109 | 5,839,435 | (1,937,830 | ) | 5,456,339 | 53,272 | 9,411,216 | ||||||
| Deferred tax effect of adjustments to U.S. GAAP | (4,784,364 | ) | 59,296,937 | (19,007,947 | ) | (26,947,779 | ) | (2,858,289 | ) | 5,698,558 | ||
| U.S. GAAP reclassifications (1) | 99,979 | 5,107,623 | 5,207,602 | |||||||||
| Total U.S. GAAP adjustments: | 1,155,050 | 57,359,107 | (13,551,608 | ) | (21,786,884 | ) | (2,858,289 | ) | 20,317,376 | |||
| Total Income tax provision under U.S. GAAP | (3,573,280 | ) | 78,472,226 | (44,585,356 | ) | (330,167 | ) | (52,276,031 | ) | (22,292,608 | ) | |
| 2004 | ||||||||||||
| Chile | Argentina | Perú | Brazil | Colombia | Total | |||||||
| ThCh$ | ThCh$ | ThCh$ | ThCh$ | ThCh$ | ThCh$ | |||||||
| Income tax provision under Chilean GAAP | ||||||||||||
| Current income taxes as determined under Chilean GAAP | (991,273 | ) | (1,281,754 | ) | (17,736,313 | ) | (5,115,035 | ) | (66,498,093 | ) | (91,622,468 | ) |
| Deferred income taxes as determined under Chilean GAAP | 7,287,617 | (21,829,716 | ) | (26,065,776 | ) | (2,314,880 | ) | (2,695,984 | ) | (45,618,739 | ) | |
| Total income tax provision under Chilean GAAP | 6,296,344 | (23,111,470 | ) | (43,802,089 | ) | (7,429,915 | ) | (69,194,077 | ) | (137,241,207 | ) | |
| U.S. GAAP adjustments: | ||||||||||||
| Deferred tax effect of applying SFAS No. 109 | 1,452,593 | 8,338,704 | 2,660,478 | (527,868 | ) | 11,923,907 | ||||||
| Deferred tax effect of adjustments to U.S. GAAP | (314,014 | ) | 1,484,975 | 2,857,880 | (3,308,529 | ) | (1,391,985 | ) | (671,673 | ) | ||
| U.S. GAAP reclassifications (1) | (1,846,447 | ) | (1,846,447 | ) | ||||||||
| Total U.S. GAAP adjustments: | 1,138,579 | 9,823,679 | 5,518,358 | (3,836,397 | ) | (3,238,432 | ) | 9,405,787 | ||||
| Total Income tax provision under U.S. GAAP | 7,434,923 | (13,287,791 | ) | (38,283,731 | ) | (11,266,312 | ) | (72,432,509 | ) | (127,835,420 | ) | |
| (1) | Certain tax-related expenses under Chilean GAAP are classified as non-operating, but under US GAAP would be classified as income taxes. |
F - 128
ENERSIS S.A. AND SUBSIDIARIES
Notes to the Consolidated Financial Statements – (Continued)
Deferred tax assets (liabilities) as of balance sheet dates are summarized s follows:
| 2003 | 2004 | |||||||||||
| SFAS No. 109 | SFAS No. 109 | |||||||||||
| Applied to | SFAS No. | Total | Applied to | SFAS No. | Total | |||||||
| Chilean | 109 applied | Deferred | Chilean | 109 applied | Deferred | |||||||
| GAAP | to U.S. GAAP | Taxes under | GAAP | to U.S. GAAP | Taxes under | |||||||
| Balances | Adjustments | SFAS No. 109 | Balances | Adjustments | SFAS No. 109 | |||||||
| ThCh$ | ThCh$ | ThCh$ | ThCh$ | ThCh$ | ThCh$ | |||||||
| Deferred income tax assets: | ||||||||||||
| Property, plant and equipment | 3,159,631 | 138,722,121 | 141,881,752 | 2,893,469 | 144,917,275 | 147,810,744 | ||||||
| Regulated assets and related deferred | ||||||||||||
| cost (conpanies in Brazil) | — | 7,918,866 | 7,918,866 | — | 3,376,851 | 3,376,851 | ||||||
| Negative goodwill | — | 9,753,529 | 9,753,529 | — | — | — | ||||||
| Allowance for doubtful accounts | 29,156,973 | — | 29,156,973 | 28,960,469 | — | 28,960,469 | ||||||
| Actuarial deficit (companies in Brazil) | 12,070,233 | — | 12,070,233 | 12,028,415 | — | 12,028,415 | ||||||
| Deferred income | 7,025,896 | 948,068 | 7,973,964 | 2,470,957 | — | 2,470,957 | ||||||
| Provision real estate projects | 2,944,849 | — | 2,944,849 | 2,528,523 | — | 2,528,523 | ||||||
| Derivative contracts | 312,837 | 4,388,443 | 4,701,280 | 1,615,743 | 3,290,991 | 4,906,734 | ||||||
| Vacation accrual | 789,056 | — | 789,056 | 902,749 | — | 902,749 | ||||||
| Post retirement benefits | — | 5,553,836 | 5,553,836 | — | 5,928,818 | 5,928,818 | ||||||
| Tax loss carryforwards (1) | 131,104,976 | — | 131,104,976 | 124,656,238 | — | 124,656,238 | ||||||
| Contingencies | 54,237,427 | — | 54,237,427 | 51,978,843 | — | 51,978,843 | ||||||
| Salaries for construction-in progress | 3,899,439 | 1,613,700 | 5,513,139 | 3,632,328 | — | 3,632,328 | ||||||
| Valuation allowance | (2,685,345 | ) | (1,052,390 | ) | (3,737,735 | ) | (2,935,126 | ) | (2,919,991 | ) | (5,855,117 | ) |
| Others | 10,027,102 | 139,381 | 10,166,483 | 6,502,226 | 1,579,806 | 8,082,032 | ||||||
| Provision for employee benefits | 4,360,516 | — | 4,360,516 | 4,168,216 | — | 4,168,216 | ||||||
| Total deferred income tax assets | 256,403,590 | 167,985,554 | 424,389,144 | 239,403,050 | 156,173,750 | 395,576,800 | ||||||
| Deferred income tax liabilities: | ||||||||||||
| Property, plant and equipment (2) | 364,093,484 | 37,854,634 | 401,948,118 | 386,681,353 | 105,043,048 | 491,724,401 | ||||||
| Severance indemnities | 1,953,906 | 30,387 | 1,984,293 | 1,886,652 | — | 1,886,652 | ||||||
| Regulated assets | 15,837,943 | — | 15,837,943 | 14,658,884 | — | 14,658,884 | ||||||
| Finance costs | 10,904,732 | — | 10,904,732 | 12,982,334 | — | 12,982,334 | ||||||
| Derivative contracts | 989,222 | 319,064 | 1,308,286 | — | — | — | ||||||
| Bond discount | 1,901,990 | — | 1,901,990 | 1,836,701 | — | 1,836,701 | ||||||
| Cost of studies | 8,180,400 | — | 8,180,400 | 8,107,213 | — | 8,107,213 | ||||||
| Imputed interest on construction | 4,664,007 | — | 4,664,007 | 4,293,140 | — | 4,293,140 | ||||||
| With-holdings | 7,113 | — | 7,113 | — | — | — | ||||||
| Materials used | 973,913 | — | 973,913 | 895,914 | — | 895,914 | ||||||
| Capitalized expenses | 637,484 | — | 637,484 | 556,006 | — | 556,006 | ||||||
| Capitalized interest | 1,449,633 | 19,948,860 | 21,398,493 | 1,899,692 | 21,111,245 | 23,010,937 | ||||||
| Post retirement benefits | — | 1,358,349 | 1,358,349 | — | — | — | ||||||
| Others | 9,078,080 | 792,387 | 9,870,467 | 6,792,158 | 261,058 | 7,053,216 | ||||||
| Total deferred income tax liabilities | 420,671,907 | 60,303,681 | 480,975,588 | 440,590,047 | 126,415,351 | 567,005,398 | ||||||
| Net deferred assets (liabilities) | (164,268,317 | ) | 107,681,873 | (56,586,444 | ) | (201,186,997 | ) | 29,758,399 | (171,428,598 | ) | ||
| Complementary Account | 210,097,286 | (210,097,286 | ) | — | 197,656,826 | (197,656,826 | ) | — | ||||
| Net deferred assets (liabilities) | 45,828,969 | (102,415,413 | ) | (56,586,444 | ) | (3,530,171 | ) | (167,898,427 | ) | (171,428,598 | ) | |
| (1) | Tax loss carryforwards relate primarily to Peruvian, Chilean and Brazilian entities. In accordance with the current enacted tax law in Chile and Brazil, such tax losses may be carried-forward indefinitely, however Peruvian tax carryforwards expire after five years. |
| (2) | In September 2004, the Peruvian tax court ruled invalid the tax basis of certain assets held by Edegel S.A. Based on this ruling, the Company has increased the long-term deferred tax liability ThCh$77,634,406, in order to reflect the write-off of the corresponding tax-basis assets held in Peru. As such estimate of future deductible amounts was determined prior to the acquisition of Edegel in connection with the acquisition of Endesa-Chile in 1999, the Company has adjusted goodwill by a corresponding amount in accordance with SFAS No. 109 "Accounting for Income Taxes" ("SFAS No. 109") and EITF 93-7 “Uncertainties Related to Income Taxes in a business Combination". |
F - 129
ENERSIS S.A. AND SUBSIDIARIES
Notes to the Consolidated Financial Statements – (Continued)
A reconciliation of the U.S. GAAP Statutory Income Tax rate to the Company’s effective tax rate on net income is as follows:
| 2002 | ||||||||||||
| Chile | Argentina | Perú | Brazil | Colombia | Total | |||||||
| ThCh$ | ThCh$ | ThCh$ | ThCh$ | ThCh$ | ThCh$ | |||||||
| Statutory US GAAP tax | 68,847,523 | (171,618 | ) | (13,442,787 | ) | 76,620,358 | (7,005,029 | ) | 124,848,447 | |||
| Effect of higher foreign tax rates | (441,306 | ) | (203,795 | ) | (14,703,049 | ) | 59,796,061 | 7,143,521 | 51,591,432 | |||
| Increase (decrease) in rates resulting from: | ||||||||||||
| Price-level restatement not accepted for tax purposes | (7,069,748 | ) | 24,178,055 | (585,481 | ) | (2,000,668 | ) | (14,020,488 | ) | 501,670 | ||
| Non-taxable items | 1,313,507 | (8,104,518 | ) | (8,605,036 | ) | (45,526,623 | ) | 206 | (60,922,464 | ) | ||
| Non-deductible items (2) | (67,141,281 | ) | 36,530,588 | (7,233,598 | ) | (90,343,074 | ) | 4,200,976 | (123,986,389 | ) | ||
| Prior years income tax | (2,763,901 | ) | — | (1,402,329 | ) | — | 527,617 | (3,638,613 | ) | |||
| Other | 1,470,287 | 338,604 | 1,573,261 | 771,131 | (2,011,767 | ) | 2,141,516 | |||||
| US GAAP reclassifications (1) | 303,892 | — | — | 6,308,893 | (23,164,381 | ) | (16,551,596 | ) | ||||
| Tax (benefit) expense at effective tax rate | (5,481,027 | ) | 52,567,316 | (44,399,019 | ) | 5,626,078 | (34,329,345 | ) | (26,015,997 | ) | ||
| 2003 | ||||||||||||
| Chile | Argentina | Perú | Brazil | Colombia | Total | |||||||
| ThCh$ | ThCh$ | ThCh$ | ThCh$ | ThCh$ | ThCh$ | |||||||
| Statutory US GAAP tax | (55,973,625 | ) | 28,949,060 | (13,034,547 | ) | 8,394,468 | (12,859,850 | ) | (44,524,494 | ) | ||
| Effect of higher foreign tax rates | (1,259,732 | ) | 32,816,456 | (13,417,384 | ) | 14,757,804 | (17,146,468 | ) | 15,750,676 | |||
| Increase (decrease) in rates resulting from: | ||||||||||||
| Price-level restatement not acceptedfor tax purposes | 7,991,348 | (16,638,288 | ) | (1,432,392 | ) | (1,980,860 | ) | 149,849 | (11,910,343 | ) | ||
| Non-taxable items | 22,489,830 | 36,635,088 | 5,291,050 | (1,189,035 | ) | 17,386,812 | 80,613,745 | |||||
| Non-deductible items (2) | 25,986,780 | (2,368,383 | ) | (20,096,695 | ) | (24,471,898 | ) | (36,983,894 | ) | (57,934,090 | ) | |
| Prior years income tax | (1,416,251 | ) | — | (364,578 | ) | — | — | (1,780,829 | ) | |||
| Other | (1,491,609 | ) | (921,707 | ) | (1,530,810 | ) | (948,269 | ) | (2,822,480 | ) | (7,714,875 | ) |
| US GAAP reclassifications (1) | 99,979 | — | — | 5,107,623 | — | 5,207,602 | ||||||
| Tax (benefit) expense at effective tax rate | (3,573,280 | ) | 78,472,226 | (44,585,356 | ) | (330,167 | ) | (52,276,031 | ) | (22,292,608 | ) | |
| 2004 | ||||||||||||
| Chile | Argentina | Perú | Brazil | Colombia | Total | |||||||
| ThCh$ | ThCh$ | ThCh$ | ThCh$ | ThCh$ | ThCh$ | |||||||
| Statutory US GAAP tax | (52,921,771 | ) | 2,078,660 | (19,086,279 | ) | (167,358 | ) | (24,617,977 | ) | (94,714,725 | ) | |
| Effect of higher foreign tax rates | — | 3,333,513 | (18,326,510 | ) | 9,964,750 | (30,024,799 | ) | (35,053,046 | ) | |||
| Increase (decrease) in rates resulting from: | ||||||||||||
| Price-level restatement not acceptedfor tax purposes | (150,058 | ) | (3,082,286 | ) | (8,635,786 | ) | — | (7,372,806 | ) | (19,240,936 | ) | |
| Non-taxable items | 33,175,388 | (13,869,938 | ) | (8,193,977 | ) | (18,189,941 | ) | (6,023,497 | ) | (13,101,965 | ) | |
| Non-deductible items (2) | 25,718,937 | 1,229,903 | 1,071,166 | (3,163,785 | ) | 1,511,300 | 26,367,521 | |||||
| Prior years income tax | (1,210,217 | ) | — | — | — | — | (1,210,217 | ) | ||||
| Other | 2,822,644 | (2,977,643 | ) | 14,887,655 | 290,022 | (4,058,283 | ) | 10,964,395 | ||||
| US GAAP reclassifications (1) | — | — | — | — | (1,846,447 | ) | (1,846,447 | ) | ||||
| Tax (benefit) expense at effective tax rate | 7,434,923 | (13,287,791 | ) | (38,283,731 | ) | (11,266,312 | ) | (72,432,509 | ) | (127,835,420 | ) | |
| (1) | US GAAP reclassifications are tax related expenses that under Chilean GAAP are classified as non-operating expenses, but under US GAAP would be classified as income taxes. |
| (2) | This represents mainly deductible temporary differences related to investments in subsidiaries that are permanent in nature for which deferred tax asset are not recognized. |
F - 130
ENERSIS S.A. AND SUBSIDIARIES
Notes to the Consolidated Financial Statements – (Continued)
| (d) | Segment disclosures |
The Company is primarily engaged in the distribution and generation of electricity in Chile, Argentina, Brazil, Colombia and Perú. Enersis provides these and other services through four business segments:
| • | Generation |
| • | Distribution |
| • | Engineering Services and Real Estate |
| • | Corporate and other |
Generation involves the generation of electricity primarily through its subsidiary Endesa-Chile. Distribution involves the supply of electricity to regulated and unregulated customers. Engineering Services and Real Estate includes engineering services and real estate development. Corporate and other includes computer-related data processing services and the sale of electricity-related supplies and equipment. The Company’s reportable segments are strategic business units that offer different products and services and are managed separately. The methods of revenue recognition by segment are as follows:
| • | Generation |
Revenue is recognized when energy and power output is delivered and capacity is provided at rates specified under contract terms or prevailing market rates.
| • | Distribution – Operating Revenues |
Revenue is recognized when energy and power is provided at rates specified under contract terms or prevailing market rates.
| • | Distribution – Non Operating Revenues |
Revenue is recognized as services are provided, such as public light posts, telephone poles, and other services related to distribution services.
| • | Engineering Services and Real Estate |
Revenue is recognized as services are provided, or when projects are sold.
| • | Corporate and Other |
Revenue is recognized as services are provided, or when supplies or equipment are sold.
F - 131
ENERSIS S.A. AND SUBSIDIARIES
Notes to the Consolidated Financial Statements – (Continued)
The following segment information has been disclosed in accordance with U.S. reporting requirements, however, the information presented has been determined in accordance with Chilean GAAP:
| Engineering services and | Corporate | |||||||||||
| 2002 | Generation | Distribution | real estate | and other | Eliminations | Consolidated | ||||||
| ThCh$ | ThCh$ | ThCh$ | ThCh$ | ThCh$ | ThCh$ | |||||||
| Sales to unaffiliated customers | 750,254,737 | 1,772,402,691 | 35,361,635 | 15,481,188 | — | 2,573,500,251 | ||||||
| Intersegment sales | 220,912,410 | 51,822,277 | 73,674,941 | 44,370,385 | (390,780,013 | ) | — | |||||
| Total revenues | 971,167,147 | 1,824,224,968 | 109,036,576 | 59,851,573 | (390,780,013 | ) | 2,573,500,251 | |||||
| Operating income | 348,487,932 | 189,963,327 | 13,850,922 | (114,958 | ) | (767,148 | ) | 551,420,075 | ||||
Participation in net income ofaffiliate companies | 8,842,841 | — | — | (287,761 | ) | — | 8,555,080 | |||||
| Depreciation and amortization | 229,162,303 | 530,614,762 | 1,460,962 | 114,728,646 | 13,268,373 | 889,235,046 | ||||||
Identifiable assets includinginvestment in related companies | 6,754,179,495 | 6,271,267,215 | 145,749,287 | 4,446,283,439 | (4,561,173,325 | ) | 13,056,306,111 | |||||
| Capital expenditures | 139,611,864 | 188,269,772 | 781,709 | 458,617 | — | 329,121,962 | ||||||
| 2003 | ||||||||||||
| Corporate | ||||||||||||
| Engineering | ||||||||||||
| services and | ||||||||||||
| Generation | Distribution | real estate | and other | Eliminations | Consolidated | |||||||
| ThCh$ | ThCh$ | ThCh$ | ThCh$ | ThCh$ | ThCh$ | |||||||
| Sales to unaffiliated customers | 659,643,635 | 1,638,545,568 | 39,316,467 | 10,849,788 | — | 2,348,355,458 | ||||||
| Intersegment sales | 283,644,798 | 12,707,695 | 66,311,802 | 40,005,698 | (332,574,181 | ) | 70,095,812 | |||||
| Total revenues | 943,288,433 | 1,651,253,263 | 105,628,269 | 50,855,486 | (332,574,181 | ) | 2,418,451,270 | |||||
| Operating income | 346,973,669 | 193,877,213 | 13,202,873 | (5,205,540 | ) | 649,579 | 549,497,794 | |||||
Participation in net income ofaffiliate companies | 17,803,955 | — | — | 150,761 | — | 17,954,716 | ||||||
| Depreciation and amortization | 171,258,122 | 213,378,872 | 1,502,687 | 31,087,735 | — | 417,227,416 | ||||||
Identifiable assets includinginvestment in related companies | 5,601,969,236 | 5,318,737,230 | 151,128,970 | 3,995,294,083 | (4,084,236,232 | ) | 10,982,893,287 | |||||
| Capital expenditures | 134,418,313 | 130,100,950 | 540,738 | 195,288 | — | 265,255,289 | ||||||
| 2004 | Generation | Distribution | Engineering services and real estate | Corporate and other | Eliminations | Consolidated | ||||||
| ThCh$ | ThCh$ | ThCh$ | ThCh$ | ThCh$ | ThCh$ | |||||||
| Sales to unaffiliated customers | 750,035,825 | 1,844,311,022 | 8,883,757 | 43,937,779 | — | 2,647,168,383 | ||||||
| Intersegment sales | 282,626,259 | 14,549,335 | 1,470,641 | 106,381,890 | (343,271,164 | ) | 61,756,961 | |||||
| Total revenues | 1,032,662,084 | 1,858,860,357 | 10,354,398 | 150,319,669 | (343,271,164 | ) | 2,708,925,344 | |||||
| Operating income | 369,025,170 | 261,413,749 | (85,351 | ) | 1,047,420 | 2,800,643 | 634,201,631 | |||||
| Participation in net income of affiliate companies | 19,203,023 | (19,060,445 | ) | 8,669 | 131,864,436 | (100,869,800 | ) | 31,145,883 | ||||
| Depreciation and amortization | 157,553,743 | 209,967,876 | 2,507,494 | 52,357,839 | — | 422,386,952 | ||||||
| Identifiable assets including investment in related companies | 5,317,659,366 | 5,106,142,327 | 78,281,860 | 4,080,676,106 | (4,075,234,520 | ) | 10,507,525,139 | |||||
| Capital expenditures | 96,135,574 | 164,655,280 | 19,789 | 4,413,083 | 710,627 | 265,934,353 | ||||||
F - 132
ENERSIS S.A. AND SUBSIDIARIES
Notes to the Consolidated Financial Statements – (Continued)
A summary of activities by geographic area is as follows:
| Chile | Argentina | Perú | Brazil | Colombia | Total | |||||||
| ThCh$ | ThCh$ | ThCh$ | ThCh$ | ThCh$ | ThCh$ | |||||||
| 2002 | ||||||||||||
| Total revenues | 827,643,118 | 308,125,605 | 302,735,183 | 646,296,230 | 488,700,115 | 2,573,500,251 | ||||||
| Long lived assets (net) (1) | 2,458,443,985 | 1,606,522,993 | 1,279,353,913 | 2,111,528,359 | 2,771,859,833 | 10,227,709,083 | ||||||
| 2003 | ||||||||||||
| Total revenues | 875,783,391 | 299,650,596 | 255,971,660 | 564,368,715 | 415,367,353 | 2,411,141,715 | ||||||
| Long lived assets (net) (1) | 2,189,534,487 | 1,250,382,874 | 1,024,269,997 | 1,636,909,696 | 2,197,672,469 | 8,298,769,523 | ||||||
| 2004 | ||||||||||||
| Total revenues | 884,309,131 | 328,721,018 | 287,398,792 | 668,872,239 | 539,624,164 | 2,708,925,344 | ||||||
| Long lived assets (net) (1) | 2,240,290,819 | 1,097,975,979 | 919,907,082 | 1,476,956,320 | 1,949,691,742 | 7,684,821,942 | ||||||
| (1) | Long-lived assets include property, plant and equipment. |
| (e) | Concentration of risk: |
The Company does not believe that it is exposed to any unusual credit risk from any single customer. The Company’s debtors are dependent on the economy in Latin America, which could make them vulnerable to downturns in the economic activity in the countries in which the Company operates.
No single customers accounted for more than 10% of revenues for the years ending December 31, 2002, 2003 and 2004.
| (f) | Schedule of debt maturity: |
Following is a schedule of debt maturity in each of the next five years and thereafter:
| ThCh$ | ||
| 2005 | 432,697,782 | |
| 2006 | 635,432,193 | |
| 2007 | 201,103,409 | |
| 2008 | 511,403,165 | |
| 2009 | 489,848,777 | |
| Thereafter | 1,424,978,904 | |
| Total | 3,695,464,230 | |
F - 133
ENERSIS S.A. AND SUBSIDIARIES
Notes to the Consolidated Financial Statements – (Continued)
| (g) | Disclosure regarding interest capitalization: |
| Year ended December 31, | ||||||
| 2002 | 2003 | 2004 | ||||
| ThCh$ | ThCh$ | ThCh$ | ||||
| Interest expense incurred | 460,565,169 | 430,943,444 | 360,140,223 | |||
| Interest capitalized under Chilean GAAP | 62,310,644 | 10,741,338 | 7,203,684 | |||
| Interest capitalized under U.S. GAAP | 36,413,927 | 21,364,379 | 15,096,770 | |||
| (h) | Cash flow information: | |
| (i) | The statement of cash flows under Chile GAAP differs in certain respects from the presentation of a statement of cash flow under U.S. GAAP as follows: | |
| Year ended December 31, | ||||||||
| 2002 | 2003 | 2004 | ||||||
| ThCh$ | ThCh$ | ThCh$ | ||||||
| Cash provided by operating activities under Chilean GAAP | 649,911,662 | 588,838,896 | 618,005,504 | |||||
| Cash provided by operating activities under U.S. GAAP | 649,911,662 | 588,838,896 | 618,005,504 | |||||
| Cash used in financing activities under Chilean GAAP | (295,087,517 | ) | (446,651,514 | ) | (189,124,246 | ) | ||
| Cash used in financing activities under U.S. GAAP | (295,087,517 | ) | (446,651,514 | ) | (189,124,246 | ) | ||
| Cash provided by (used in) investing activities under Chilean GAAP | (348,753,732 | ) | 90,584,783 | (193,905,575 | ) | |||
| Time deposits (1) | (10,535,580 | ) | — | — | ||||
| Cash provided by (used in) investing activities under U.S. GAAP | (359,289,312 | ) | 90,584,783 | (193,905,575 | ) | |||
| (1) Time deposits with maturities longer than 90 days | ||||||||
F - 134
ENERSIS S.A. AND SUBSIDIARIES
Notes to the Consolidated Financial Statements – (Continued)
| (ii) | Cash and cash equivalents includes all highly liquid debt instruments purchased with an original maturity of three months or less: | |
| Year ended December 31, | ||||||||
| 2002 | 2003 | 2004 | ||||||
| ThCh$ | ThCh$ | ThCh$ | ||||||
| Cash | 49,883,395 | 27,029,488 | 56,494,414 | |||||
| Time deposits | 150,760,242 | 262,660,971 | 450,743,859 | |||||
| Marketable securities | 1,597,691 | 11,434,635 | 12,321,537 | |||||
| Other current assets | 26,747,365 | 38,150,754 | 27,677,527 | |||||
| Total cash and cash equivalents under Chilean GAAP | 228,988,693 | 339,275,848 | 547,237,337 | |||||
| Time deposits with original maturities longer than 90 days | (10,535,580 | ) | — | — | ||||
| Total cash and cash equivalents under US GAAP | 218,453,113 | 339,275,848 | 547,237,337 | |||||
| (iii) | Additional disclosures required under U.S. GAAP are as follows: | |||||||
| Years ended December 31, | ||||||||
| 2002 | 2003 | 2004 | ||||||
| ThCh$ | ThCh$ | ThCh$ | ||||||
| Interest paid during the year | 471,608,186 | 402,812,319 | 314,856,910 | |||||
| Income taxes paid during the year | 141,222,264 | 406,298,084 | 538,426,126 | |||||
| Assets acquired under capital leases | — | — | 27,496,261 | |||||
| (i) | Disclosures about fair value of financial instruments |
The following methods and assumption were used to estimate the fair value of each class of financial instruments as of December 31, 2003 and 2004 for which it is practicable to estimate that value:
| • | Cash |
| The fair value of the Company’s cash is equal to its carrying value. | |
| • | Time deposits |
| The fair value of time deposits approximates carrying value due to the relatively short-term nature. | |
| • | Marketable securities |
| The fair value of marketable securities is based on quoted market prices of the mutual money market funds held and approximates carrying value. | |
| • | Long-term accounts receivable |
| The fair value of long-term accounts receivable was estimated using the interest rates that are currently offered for loans with similar terms and remaining maturities. | |
| • | Long-term debt |
| The fair value of long-term debt was based on rates currently available to the Company for debt with similar terms and remaining maturities. |
F - 135
ENERSIS S.A. AND SUBSIDIARIES
Notes to the Consolidated Financial Statements – (Continued)
| • | Derivative instruments |
| Estimates of fair values of derivative instruments for which no quoted prices or secondary market exists have been made using valuation techniques such as forward pricing models, present value of estimated future cash flows, and other modeling techniques. These estimates of fair value include assumptions made by the Company about market variables that may change in the future. Changes in assumptions could have a significant impact on the estimate of fair values disclosed. As a result such fair value amounts are subject to significant volatility and are highly dependent on the quality of the assumptions used. | |
| The estimated fair values of the Company’s financial instruments compared to Chilean GAAP carrying amounts are as follows: | |
| 2003 | 2004 | ||||||||
| Carrying | Fair | Carrying | Fair | ||||||
| amount | Value | amount | Value | ||||||
| ThCh$ | ThCh$ | ThCh$ | ThCh$ | ||||||
| Cash | 27,029,488 | 27,029,488 | 56,494,414 | 56,494,414 | |||||
| Time deposits | 262,660,971 | 262,660,971 | 450,743,859 | 450,743,859 | |||||
| Marketable securities | 11,434,635 | 11,434,635 | 12,321,537 | 12,321,537 | |||||
| Accounts receivable | 478,849,624 | 478,849,624 | 528,740,129 | 528,740,129 | |||||
| Notes receivable, net | 8,571,693 | 8,571,693 | 2,828,014 | 2,828,014 | |||||
| Other accounts receivable, net | 96,549,123 | 96,549,123 | 63,814,202 | 63,814,202 | |||||
| Amounts due from related companies | 149,818,057 | 149,818,057 | 114,385,763 | 114,385,763 | |||||
| Long-term accounts receivable | 131,133,420 | 131,133,420 | 125,910,089 | 125,910,089 | |||||
| Accounts payable and other | (224,067,844 | ) | (224,067,844 | ) | (256,402,004 | ) | (256,402,004 | ) | |
| Notes payable | (170,573,373 | ) | (170,573,373 | ) | (190,517,294 | ) | (190,517,294 | ) | |
| Long-term debt | (3,899,870,860 | ) | (4,033,070,487 | ) | (3,710,586,142 | ) | (3,924,465,446 | ) | |
| Derivatives instruments | 5,913,202 | 5,913,202 | (65,211,933 | ) | (65,211,933 | ) | |||
| (j) | Derivative instruments |
The Company is exposed to the impact of market fluctuations in the price of electricity, primary materials such as natural gas, petroleum, coal, and other energy-related products, interest rates, and foreign exchange rates. The Company employs policies and procedures to manage its risks associated with these market fluctuation on a global basis through strategic contract selection, fixed-rate and variable-rate portfolio targets, net investment hedges, and financial derivatives. All derivatives that do not qualify for the normal purchase and sales exemption under SFAS No. 133 are recorded at their fair value. On the date that swaps, futures, forwards or option contracts are entered into, the Company designates the derivatives as a “hedge”, if the documentation is not appropriate to designate as a “hedge”, the derivative’s mark-to-market adjustment flows through the income statement. The Company does not have the appropriate documentation in place to designate contracts as hedges of a forecasted transaction or future cash flows (cash flow hedge) or as a hedge of a recognized assets, liability or firm commitment (fair value hedge).
The Company has classified its derivatives into the following general categories: commodity derivatives, embedded derivatives, and financial derivatives. Certain energy and other contracts for the Company’s operations in Chile are denominated in the US dollar. According to SFAS No. 133, an embedded foreign currency derivative should be separated from the host contract because none of the applicable exclusions are met (See Embedded Derivative Contracts below). For purposes of evaluating the functional currency of the Company’s subsidiaries in Argentina, Perú, Brazil, and Colombia, the Company applied BT 64, consistent with the methodology described in Note 36 I paragraph (s), thus the functional currency of these subsidiaries was the US dollar as these subsidiaries were remeasured into US dollars because foreign subsidiaries operate in countries exposed to significant risks as determined under BT 64.
F - 136
ENERSIS S.A. AND SUBSIDIARIES
Notes to the Consolidated Financial Statements – (Continued)
The following is a summary of the Company’s derivative contracts as of December 31, 2003 and 2004.
| 2003 | ||||||
| Distribution | Generation | Total | ||||
| ThCh$ | ThCh$ | ThCh$ | ||||
| Embedded derivatives | (1,518,999 | ) | (7,273,304 | ) | (8,792,303 | ) |
| Financial derivatives | (7,840,514 | ) | (2,995,237 | ) | (10,835,751 | ) |
| (9,359,513 | ) | (10,268,541 | ) | (19,628,054 | ) | |
| Investment in related companies | — | 37,786,158 | 37,786,158 | |||
| Derivative instruments U.S.GAAP Shareholders equity adjustment | (9,359,513 | ) | 27,517,617 | 18,158,104 | ||
| 2004 | ||||||
| Distribution | Generation | Total | ||||
| ThCh$ | ThCh$ | ThCh$ | ||||
| Embedded derivatives | 2,108,644 | (20,441,709 | ) | (18,333,065 | ) | |
| Financial derivatives | (54,316,141 | ) | (9,058,683 | ) | (63,374,824 | ) |
| (52,207,497 | ) | (29,500,392 | ) | (81,707,889 | ) | |
| Investment in related companies | — | 31,909,042 | 31,909,042 | |||
| Derivative instruments U.S.GAAPShareholders equity adjustment | (52,207,497 | ) | 2,408,650 | (49,798,847 | ) | |
The following is the reconciliation of the Company's derivative contracts from Chile GAAP to US GAAP:
| 2003 | ||||||
| Chile | ||||||
| GAAP | Adjustment | US GAAP | ||||
| ThCh$ | ThCh$ | ThCh$ | ||||
| Embedded derivatives | — | (8,792,303 | ) | (8,792,303 | ) | |
| Financial derivatives | 5,913,202 | (16,748,953 | ) | (10,835,751 | ) | |
| Total | 5,913,202 | (25,541,256 | ) | (19,628,054 | ) | |
| 2004 | ||||||
| Chile | ||||||
| GAAP | Adjustment | US GAAP | ||||
| ThCh$ | ThCh$ | ThCh$ | ||||
| Embedded derivatives | — | (18,333,065 | ) | (18,333,065 | ) | |
| Financial derivatives | (65,211,933 | ) | 1,837,109 | (63,374,824 | ) | |
| Shareholders equity adjustment | (65,211,933 | ) | (16,495,956 | ) | (81,707,889 | ) |
F - 137
ENERSIS S.A. AND SUBSIDIARIES
Notes to the Consolidated Financial Statements – (Continued)
Certain Company’s generation and distribution commodity contracts could be seen as contracts that meet the definition of a derivative under SFAS No. 133 and would be required to be accounted for at fair value. These conditions are (i) have an underlying, which is the market price of power at the delivery location and a notional amount specified in the contract; (ii) have no initial payment on entering into the contract; and (iii) have a net settlement provision or have the characteristic of net settlement because power is readily convertible to cash, as it is both fungible and actively traded in the country of generation or country of distribution.
The Company assessed that its commodity contracts that are requirements contracts do not meet the above definition because the contracts do not have notional amounts, as they only have maximum amounts or no specified amounts, and do not include an implicit or explicit minimum amount in a settlement or a default clause. A requirements contract allows the purchaser to use as many units of power as required to satisfy its actual needs for power during the period of the contract, and the party is not permitted to buy more than its actual needs.
The Company concluded that all of its power is readily convertible to cash as energy is actively traded, or the Company has access, to markets where energy is actively traded. However, only certain electricity generators or distributors have access to the energy markets, thus determination as to whether energy could be considered readily convertible to cash was analyzed on a country by country basis. Currently, Chilean distributors do not have access to the Chilean spot market, however this could change in the future if energy regulations are changed. The Company has also concluded that multiple-delivery long-term power contracts meet the net settlement characteristic. Management multiple-delivery long-term power contracts are readily convertible to cash because the Company operates in countries with active spot markets, that, although they contain varying levels of liquidity, can rapidly absorb the contract’s quantities at each delivery date without significantly affecting the price, and thus meet the definition of net settlement, consequently these contracts are accounted for as derivatives that under SFAS No.133.
Because both the purchases and sales interconnection contracts are for periods up to 20 years in complex markets, where no similar term forward market information is available, the Company has estimated such values based on the best information available, including using modeling and other valuation techniques. The Company has recorded the best estimate of fair value, however with different assumptions such as interest rates, inflation rates, exchange rates, electricity rates, and increases in cost trends, materially different fair values could result. As a result such estimates are highly volatile and dependent upon the assumptions used. The assumption to measure the fair value of these interconnection related contracts using the Argentine market prices may have a significant effect on the Company’s net income and shareholders’ equity.
Such values are included in the reconciliation to U.S. GAAP in Note 36 paragraph (gg).
Embedded Derivative Contracts
The Company enters into certain contracts that have embedded features that are not clearly and closely related to the host contract. As specified in SFAS No. 133, bifurcation analysis focuses on whether the economic characteristics and risks of the embedded derivative are clearly and closely related to the economic characteristics and risks of the host contract. In certain identified contracts, the host service contract and the embedded feature are not indexed to the same underlying and changes in the price or value of service will not always correspond to changes in the price of the commodity to which the contract is indexed. U.S. GAAP requires embedded features to be measured at fair value as freestanding instruments. Unless the embedded contracts are remeasured at fair value under otherwise applicable GAAP, the embedded feature must be valued at fair value with changes in fair value reported in earnings as they occur.
Embedded foreign currency derivative instruments are not separated from the host contract and considered a derivative instrument if the host contract is not a financia1 instrument and it requires payments denominated in either: (1) the currency of any substantial patty to the contract. (2) the local currency of any substantial party to the contract, (3) the currency used because the primary economic environment is highly inflationary, or (4) the currency in which the good or service is routinely denominated in international commerce.
F - 138
ENERSIS S.A. AND SUBSIDIARIES
Notes to the Consolidated Financial Statements – (Continued)
Financial Derivatives
Changes in interest rates expose the Company to risk as a result of its portfolio of fixed-rate and variable rate debt. The Company manages interest rate risk exposure on a global basis by limiting its variable rate and fixed-rate exposures to certain variable/fixed mixes set by policy.
The Company manages interest rate risk through the use of interest rate swaps and collars and cross-currency swaps. The Company does not enter into financia1 instruments for trading or speculative purposes.
The Company also uses short duration forward foreign currency contracts and swaps, and cross-currency swaps, where possible, to manage its risk related to foreign currency fluctuations. These contracts are considered “cover” contracts under Chilean GAAP. In accordance with Chilean GAAP the gain and losses on these contracts are deferred until realized as assets or liabilities.
For U.S. GAAP purposes, as the Company has not met the requirements for designating these derivatives contracts as “hedges”, the contracts are recorded at fair value in the balance sheet with any unrealized gain and/or losses being directly recorded in the income statement.
Net lnvestment Hedges
The Company is also exposed to foreign currency risk arising from long-term debt denominated in foreign currencies, the majority of which is the US dollar. This risk is mitigated, as a substantial portion of the Company’s revenues are either directly or indirectly linked to the US dollar. Additionally, the Company records the foreign exchange gains and losses on liabilities related to net investments in foreign countries which are denominated in the same currency as the functional currency of those foreign investments. Such unrealized gains and losses are included in the cumulative translation adjustment account in shareholders equity, and in this way act as a net investment hedge of the exchange risk affecting the investments (see Note ll (c) and Note 22 (f) for further detail).
The accounting treatment for such operations is the same under Chile GAAP and U.S. GAAP.
| (k) | Reclassification to U.S. GAAP |
Certain reclassifications would be made to the Chilean GAAP income statement in order to present Chilean GAAP amounts in accordance with presentation requirements under U.S. GAAP. Amortization of negative goodwill, amortization of goodwill, and certain other non-operating income and expense, would be included in operating income. Recovered taxes included in other non-operating revenues would be recorded as part of income tax expense under U.S. GAAP. Colombian equity tax included in non-operating expenses in 2004 would be recorded as part of income tax expense under U.S. GAAP. Equity participation in income or losses of related companies included in non-operating income would be presented after income taxes and minority interest in accordance with U.S. GAAP.
Additionally, the extraordinary loss recognized under Chilean GAAP in 2002 would be reclassified to income taxes as the Colombian democracy tax does not meet the definition of extraordinary in accordance with US GAAP. Under Chilean GAAP a company is permitted to classify as extraordinary any items that are considered unusual in their nature or infrequent in occurrence. US GAAP is much more stringent than Chilean GAAP in allowing items to be considered extraordinary and the extraordinary loss recognized under Chilean GAAP in 2002 would be reclassified to income taxes as the Colombian democracy tax does not meet the definition of extraordinary in accordance with US GAAP.
The following reclassifications included in the column labeled “Reclassifications” disclose amounts using a U.S. GAAP presentation, although the amounts displayed have been determined in accordance with Chilean GAAP:
F - 139
ENERSIS S.A. AND SUBSIDIARIES
Notes to the Consolidated Financial Statements – (Continued)
| 2002 | ||||||
| Chilean | ||||||
| GAAP | Reclassification | U.S. GAAP | ||||
| ThCh$ | ThCh$ $ | ThCh | ||||
| Operating income | 551,420,075 | (458,618,194 | ) | 92,801,881 | ||
| Non-operating expense, net | (824,607,845 | ) | 559,654,833 | (264,953,012 | ) | |
| Income taxes | (68,344,084 | ) | (16,551,594 | ) | (84,895,678 | ) |
| Minority interest | 16,856,520 | — | 16,856,520 | |||
| Equity participation in income of related companies, net | — | 8,555,082 | 8,555,082 | |||
| Amortization of negative goodwill | 116,204,508 | (116,204,508 | ) | — | ||
| Net loss before extraordinary items | (208,470,826 | ) | (23,164,381 | ) | (231,635,207 | ) |
| Extraordinary items | (23,164,381 | ) | 23,164,381 | — | ||
| Net loss | (231,635,207 | ) | — | (231,635,207 | ) | |
| 2003 | ||||||
| Chilean | ||||||
| GAAP | Reclassification | U.S. GAAP | ||||
| ThCh$ | ThCh$ | ThCh$ | ||||
| Operating income | 549,497,794 | 24,199,788 | 573,697,582 | |||
| Non-operating expense, net | (466,280,940 | ) | 5,093,497 | (461,187,443 | ) | |
| Income taxes | (42,609,984 | ) | 5,207,602 | (37,402,382 | ) | |
| Minority interest | (80,282,913 | ) | — | (80,282,913 | ) | |
| Equity participation in income of related companies, net | — | 17,954,716 | 17,954,716 | |||
| Amortization of negative goodwill | 52,455,603 | (52,455,603 | ) | — | ||
| Net income | 12,779,560 | — | 12,779,560 | |||
| 2004 | ||||||
| Chilean | ||||||
| GAAP | Reclassification | U.S. GAAP | ||||
| ThCh$ | ThCh$ | ThCh$ | ||||
| Operating income | 634,201,631 | (67,123,350 | ) | 567,078,281 | ||
| Non-operating expense, net | (368,652,741 | ) | 54,930,816 | (313,721,925 | ) | |
| Income taxes | (137,241,207 | ) | (1,846,447 | ) | (139,087,654 | ) |
| Minority interest | (101,106,989 | ) | — | (101,106,989 | ) | |
| Equity participation in income of related companies, net | — | 31,145,883 | 31,145,883 | |||
| Amortization of negative goodwill | 17,106,902 | (17,106,902 | ) | — | ||
| Net income | 44,307,596 | — | 44,307,596 | |||
Certain reclassifications would be made to the Chilean GAAP balance sheet in order to present Chilean GAAP amounts in accordance with presentation requirements under U.S. GAAP. Deferred taxes from depreciation differences that are recorded as short-term under Chilean GAAP would be recorded as long-term under U.S. GAAP. Real estate properties under development and construction-in-progress are included in current assets as inventory in Chilean GAAP and under U.S. GAAP such assets would have been included as property, plant and equipment. Additionally, the regulated asset recorded during 2001 by Coelce and Cerj, Brazilian subsidiaries, has been partially recorded in trade receivables and an additional component was recorded in current assets by Coelce under Chilean GAAP. However, under U.S. GAAP the presentation of these regulated assets should be classified as non-current assets as the recovery of these assets is not expected in the short term. The amounts receivable and payable related to financial derivatives have been recorded in the balance sheet at their gross amounts, whereas, these amounts would have been recorded at their net amounts by financial institution under US GAAP, provided the contracts have net settlement provisions. Negative goodwill would be presented as a deduction to property, plant, and equipment instead of a separate line-item in other assets. These reclassifications exclude consolidation of development stage companies, the effect of which is immaterial.
F - 140
ENERSIS S.A. AND SUBSIDIARIES
Notes to the Consolidated Financial Statements – (Continued)
The effect of the following reclassifications included in the column labeled “Reclassifications” discloses amounts using a U.S. GAAP presentation although the amounts displayed have been determined in accordance with Chilean GAAP:
| 2003 | ||||||
| Chilean GAAP | Reclassification | U.S. GAAP | ||||
| ThCh$ $ | ThCh | ThCh$ | ||||
| Current assets | 1,156,481,276 | (51,265,586 | ) | 1,105,215,690 | ||
| Property, plant an equipment, net | 8,298,769,523 | (64,654,495 | ) | 8,234,115,028 | ||
| Other assets | 1,527,642,488 | 62,433,606 | 1,590,076,094 | |||
| Total assets | 10,982,893,287 | (53,486,475 | ) | 10,929,406,812 | ||
| Current liabilities | 1,155,329,804 | (11,757,449 | ) | 1,143,572,355 | ||
| Long-term liabilities | 3,782,447,926 | (41,729,026 | ) | 3,740,718,900 | ||
| Minority interest | 3,433,013,869 | — | 3,433,013,869 | |||
| Shareholder's equity | 2,612,101,688 | — | 2,612,101,688 | |||
| Total liabilities and shareholders' equity | 10,982,893,287 | (53,486,475 | ) | 10,929,406,812 | ||
| 2004 | ||||||
| Chilean GAAP | Reclassification | U.S. GAAP | ||||
| ThCh$ $ | ThCh | ThCh$ | ||||
| Current assets | 1,519,081,190 | (53,518,614 | ) | 1,465,562,576 | ||
| Property, plant an equipment, net | 7,684,821,942 | (41,032,908 | ) | 7,643,789,034 | ||
| Other assets | 1,303,622,007 | 80,508,030 | 1,384,130,037 | |||
| Total assets | 10,507,525,139 | (14,043,492 | ) | 10,493,481,647 | ||
| Current liabilities | 1,018,810,914 | (241,374 | ) | 1,018,569,540 | ||
| Long-term liabilities | 3,804,155,081 | (13,802,118 | ) | 3,790,352,963 | ||
| Minority interest | 3,125,006,002 | — | 3,125,006,002 | |||
| Shareholder's equity | 2,559,553,142 | — | 2,559,553,142 | |||
| Total liabilities and shareholders' equity | 10,507,525,139 | (14,043,492 | ) | 10,493,481,647 | ||
F - 141
ENERSIS S.A. AND SUBSIDIARIES
Notes to the Consolidated Financial Statements – (Continued)
| (l) | Employee Benefit Plans |
Enersis S.A. and its subsidiaries sponsor various benefit plans for its current and retired employees. A description of such’ benefits follows:
The provision for severance indemnities, included in the account “Accrued expenses” short and long-term is calculated in accordance with the policy set forth in Note 2 (n), using the current salary levels of all employees covered under the severance indemnities agreement, an assumed discount rate of 9.5% for the years ended December 31, 2002, 2003 and 2004, and an estimated average service period based on the years of services for the Company.
Benefits for Retired Personnel
Other benefits provided to certain retired personnel of Enersis include electrical service rate subsidies, additional medical insurance and additional post-retirement benefits. Descriptions of these benefits for retired personnel are as follows:
| i) | Electrical rate service |
This benefit is extended only to certain retired personnel of Enersis. These electric rate subsidies result in the eligible retired employees paying a percentage of their total monthly electricity costs, with Enersis paying the difference.
| ii) | Medical benefits |
This benefit provides supplementary health insurance, which covers a portion of health benefits not covered under the institutional health benefits maintained by employees of Enersis. This benefit expires at the time of death of the pensioner.
| iii) | Supplementary pension benefits |
Eligible employees are able to receive a monthly amount designed to cover a portion of the difference between their salary at the point of retirement and the theoretical pension that would have been received had the employee reached the legal retirement age of theInstitucióndePrevisión Social(Institute of Social Welfare). This benefit expires upon the death of the pensioner for the Enersis employee, however, continues to cover the surviving-spouse in the case of employees of the subsidiary Endesa-Chile.
| iv) | Worker’s compensation benefits |
Employees that were entitled to Worker’s compensation insurance in prior years for work related injuries receive benefits from the Company when that insurance expires. This benefit continues at the time of death of the pensioner, to cover the surviving-spouse.
The Company has recognized liabilities related to complementary pension plan benefits and other postretirement benefits as stipulated in collective bargaining agreements. Under U.S. GAAP, post-retirement employee benefits have been accounted for in accordance with SFAS No. 87 and SFAS No. 106, with inclusion of prior-period amounts in current year’s income as the amounts are not considered significant to the overall financial statement presentation. The effects of accounting for post-retirement benefits under U.S. GAAP have been presented in paragraph (gg), above. The following data represents Chile GAAP amounts presented under FAS N°132 Revised 2003 Employers’ Disclosures about Pensions and other postretirement Benefits, for Company’s post-retirement benefit plans.
F - 142
ENERSIS S.A. AND SUBSIDIARIES
Notes to the Consolidated Financial Statements – (Continued)
Followings is a schedule of estimated pay–out of pension benefits in each of the next five years:
| As of December 31, | ||
| 2004 | ||
| ThCh$ | ||
| 2005 | 25,040,759 | |
| 2006 | 25,350,622 | |
| 2007 | 26,205,461 | |
| 2008 | 26,789,273 | |
| 2009 | 27,555,039 | |
| Thereafter | 108,176,149 | |
| Total | 239,117,303 | |
F - 143
ENERSIS S.A. AND SUBSIDIARIES
Notes to the Consolidated Financial Statements – (Continued)
| At December 31, 2003 | ||||||||
| Pension Benefits | Other Benefits | |||||||
| Unfunfed | Funded | Total | Total | |||||
| ThCh$ | ThCh$ | ThCh$ | ThCh$ | |||||
| Assets and obligations | ||||||||
| Accumulated benefit obligation | (37,809,722 | ) | (177,171,124 | ) | (214,980,846 | ) | (30,332,309 | ) |
| Plan assets at fair value | — | 122,072,571 | 122,072,571 | — | ||||
| Unfunded accumulated benefit | (37,809,722 | ) | (55,098,553 | ) | (92,908,276 | ) | (30,332,309 | ) |
| Changes in benefit (obligations) | ||||||||
| Benefit (obligations) at January 1 | (59,613,434 | ) | (68,737,172 | ) | (128,350,607 | ) | (35,726,334 | ) |
| Price-level restatement | 420,320 | 680,566 | 1,100,886 | 269,465 | ||||
| Foreign exchange effect | 8,560,762 | 11,820,243 | 20,381,005 | 4,136,709 | ||||
| Net periodic expense | (11,936,422 | ) | (17,491,053 | ) | (29,427,475 | ) | 1,453,111 | |
| Benefits paid | 2,403,135 | 10,658,355 | 13,061,490 | 50,387 | ||||
| Company contributions | — | 293,417 | 293,417 | (1,788,775 | ) | |||
| Benefit (obligations) at December 31 | (60,165,640 | ) | (62,775,645 | ) | (122,941,285 | ) | (31,605,436 | ) |
| Funded Status of the Plans | ||||||||
| Proyected Benefits Obligation | (58,992,700 | ) | (178,727,451 | ) | (237,720,151 | ) | (30,885,705 | ) |
| Fair value of the plans assets | — | 122,072,571 | 122,072,571 | — | ||||
| Funded Status | (58,992,700 | ) | (56,654,880 | ) | (115,647,581 | ) | (30,885,705 | ) |
| Unrecognized loss (gain) | (1,792,630 | ) | (16,333,965 | ) | (18,126,595 | ) | (12,519,943 | ) |
| Unrecognized net prior service cost | 619,690 | 10,213,200 | 10,832,891 | 11,800,212 | ||||
| Net liability recorded under U.S. GAAP | (60,165,640 | ) | (62,775,645 | ) | (122,941,285 | ) | (31,605,436 | ) |
| Change in the plan assets | ||||||||
| Fair value of plans assets, beginning | — | 96,482,018 | 96,482,018 | — | ||||
| Foreign exchange effect | — | (11,325,944 | ) | (11,325,944 | ) | — | ||
| Actual return on the plan assets | — | 36,509,808 | 36,509,808 | — | ||||
| Employer contributions | — | 9,257,830 | 9,257,830 | — | ||||
| Plan participant contributions | — | 3,922,852 | 3,922,852 | — | ||||
| Benefits paid | — | (12,773,994 | ) | (12,773,994 | ) | — | ||
| Fair value of plans assets, ending | — | 122,072,571 | 122,072,571 | — | ||||
| Components of net periodic | ||||||||
| Benefits expenses | ||||||||
| Service cost | (27,663 | ) | (1,358,526 | ) | (1,386,188 | ) | 759,480 | |
| Interest cost | (7,633,161 | ) | (16,654,126 | ) | (24,287,287 | ) | 235,724 | |
| Expected return on assets | — | 25,672,370 | 25,672,370 | — | ||||
| Amortization gain (loss) | (3,645,636 | ) | (23,119,488 | ) | (26,765,124 | ) | (360,131 | ) |
| Amortization of transition asset | (629,963 | ) | (2,031,282 | ) | (2,661,245 | ) | 818,037 | |
| Net periodic expenses | (11,936,422 | ) | (17,491,052 | ) | (29,427,474 | ) | 1,453,111 | |
| Pension Benefits | Other Benefits | |||||||||||
| Assumptions as of December 31 | Chile | Colombia | Brazil | Chile | Brazil | Colombia | ||||||
| Weighted - discount rate (1) | 9.5 | % | 12.8 | % | 11.3 | % | 9.5 | % | 11.3 | % | 12.8 | % |
| Weighted - salary increase | 3.0 | % | 7.5 | % | 5.5 | % | – | – | – | |||
| Weighted - return on plan assets (1) | – | – | 11.3 | % | – | – | – | |||||
| Weighted - long term inflation (2) | 3.0 | % | 7.5 | % | 4.5 | % | 3.0 | % | 4.5 | % | 7.5 | % |
| (1) | Includes fixed long term inflation assumption detail in (2) |
F - 144
ENERSIS S.A. AND SUBSIDIARIES
Notes to the Consolidated Financial Statements – (Continued)
| At December 31, 2004 | ||||||||
| Pension Benefits | Other Benefits | |||||||
| Non | ||||||||
| Contributory | Contributory | Total | Total | |||||
| Assets and obligations | ||||||||
| Accumulated benefit obligation | (56,999,482 | ) | (192,477,205 | ) | (249,476,687 | ) | (35,747,958 | ) |
| Plan assets at fair value | — | 128,088,182 | 128,088,182 | — | ||||
| Unfunded accumulated benefit | (56,999,482 | ) | (64,389,023 | ) | (121,388,506 | ) | (35,747,958 | ) |
| Changes in benefit (obligations) | ||||||||
| Benefit (obligations) at January 1 | (60,165,640 | ) | (62,775,645 | ) | (122,941,285 | ) | (31,605,436 | ) |
| Price-level restatement | (924,751 | ) | 1,951,985 | 1,027,234 | (473,971 | ) | ||
| Foreign exchange effect | 8,181,886 | 1,908,253 | 10,090,139 | (284,233 | ) | |||
| Net periodic expense | (2,799,071 | ) | (16,782,199 | ) | (19,581,270 | ) | (3,451,452 | ) |
| Benefits paid | 721,624 | 16,267,061 | 16,988,685 | 4,122,302 | ||||
| Company contributions | — | (41,248 | ) | (41,248 | ) | (8,034,793 | ) | |
| Benefit (obligations) at December 31 | (54,985,952 | ) | (59,471,793 | ) | (114,457,745 | ) | (39,727,584 | ) |
| Funded Status of the Plans | ||||||||
| Projected Benefits Obligation | (56,999,482 | ) | (180,867,381 | ) | (237,866,863 | ) | (38,719,674 | ) |
| Fair value of the plans assets | — | 128,088,182 | 128,088,182 | — | ||||
| Funded Status | (56,999,482 | ) | (52,779,199 | ) | (109,778,681 | ) | (38,719,674 | ) |
| Unrecognized loss (gain) | — | (17,340,605 | ) | (17,340,605 | ) | 9,174,116 | ||
| Unrecognized net prior service cost | 2,013,530 | 10,648,011 | 12,661,541 | (10,182,026 | ) | |||
| Net liability recorded under U.S. GAAP | (54,985,952 | ) | (59,471,793 | ) | (114,457,745 | ) | (39,727,584 | ) |
| Change in the plan assets | ||||||||
| Fair value of plans assets, beginning | — | 122,072,571 | 122,072,571 | — | ||||
| Foreign exchange effect | — | (12,737,533 | ) | (12,737,533 | ) | — | ||
| Actual return on the plan assets | — | 12,601,408 | 12,601,408 | — | ||||
| Employer contributions | — | 7,373,920 | 7,373,920 | — | ||||
| Plan participant contributions | — | 2,624,397 | 2,624,397 | — | ||||
| Benefits paid | — | (3,846,581 | ) | (3,846,581 | ) | — | ||
| Fair value of plans assets, ending | — | 128,088,182 | 128,088,182 | — | ||||
| Service cost | (638,721 | ) | (1,395,438 | ) | (2,034,159 | ) | (497,147 | ) |
| Interest cost | (7,199,307 | ) | (18,539,098 | ) | (25,738,405 | ) | (985,671 | ) |
| Expected return on assets | — | 26,441,379 | 26,441,379 | (1,201,637 | ) | |||
| Amortization gain (loss) | 5,038,957 | (15,412,512 | ) | (10,373,555 | ) | (766,997 | ) | |
| Amortization of transition asset | — | (7,876,530 | ) | (7,876,530 | ) | — | ||
| Net periodic expenses | (2,799,071 | ) | (16,782,199 | ) | (19,581,270 | ) | (3,451,452 | ) |
| Pension Benefits | Other Benefits | |||||||||||
| Assumptions as of December 31 | Chile | Colombia | Brazil | Chile | Brazil | Colombia | ||||||
| Weighted - discount rate (1) | 6.5 | % | 11.9 | % | 10.2 | % | 6.5 | % | 10.2 | % | 11.9 | % |
| Weighted - salary increase | 4.0 | % | 6.8 | % | 5.2 | % | 4.0 | % | 5.2 | % | 6.8 | % |
| Weighted - return on plan assets (1) | — | — | 10.2 | % | — | — | — | |||||
| Weighted - long term inflation (2) | 2.5 | % | 6.8 | % | 4.0 | % | 2.5 | % | 4.0 | % | 6.8 | % |
| (1) | Includes fixed long term inflation assumption detail in (2) |
F - 145
ENERSIS S.A. AND SUBSIDIARIES
Notes to the Consolidated Financial Statements – (Continued)
| (m) | Comprehensive income (loss) |
In accordance with U.S. GAAP, the Company reports a measure of all changes in shareholders’ equity that result from transactions and other economic events of the period other-than transactions with owners (“comprehensive income”). Comprehensive income is the total of net income and other non-owner equity transactions that result in changes in net shareholders’ equity.
The following represents accumulated other comprehensive income balances as of December 31, 2002, 2003 and 2004 (in thousands of constant Chilean pesos as of December 31, 2004).
| 2002 | ||||||
| Chilean GAAP cumulative translation adjustment | Effect of U.S. GAAP adjustments on cumulative translation adjustment | Accumulated other comprehensive income (loss) | ||||
| ThCh$ | ThCh$ | ThCh$ | ||||
| Beginning balance | 30,282,154 | (2,216,472 | ) | 28,065,682 | ||
| Credit (charge) for the period | 21,322,955 | (12,582,928 | ) | 8,740,027 | ||
| Ending balance | 51,605,109 | (14,799,400 | ) | 36,805,709 | ||
| 2003 | ||||||
| Chilean GAAP cumulative translation adjustment | Effect of U.S. GAAP adjustments on cumulative translation adjustment | Accumulated other comprehensive income (loss) | ||||
| ThCh$ | ThCh$ | ThCh$ | ||||
| Beginning balance | 51,605,109 | (14,799,400 | ) | 36,805,709 | ||
| Credit (charge) for the period | (74,845,570 | ) | 52,450,844 | (22,394,726 | ) | |
| Ending balance | (23,240,461 | ) | 37,651,444 | 14,410,983 | ||
| 2004 | ||||||
| Chilean GAAP cumulative translation adjustment | Effect of U.S. GAAP adjustments on cumulative translation adjustment | Accumulated other comprehensive income (loss) | ||||
| ThCh$ | ThCh$ | ThCh$ | ||||
| Beginning balance | (23,240,461 | ) | 37,651,444 | 14,410,983 | ||
| Credit (charge) for the period | (96,275,517 | ) | 12,452,098 | (83,823,419 | ) | |
| Ending balance | (119,515,978 | ) | 50,103,542 | (69,412,436 | ) | |
The Company does not recognize deferred tax assets associated to cumulative translation adjustment as the investment they are associated with are permanent in nature.
F - 146
ENERSIS S.A. AND SUBSIDIARIES
Notes to the Consolidated Financial Statements – (Continued)
| (n) | Discontinued operations |
In October of 2001, the FASB issued SFAS No. 144 which is effective for fiscal years beginning after December 15, 2001. SFAS No. 144 establishes accounting and reporting standards for the impairment and disposal of long-lived assets and discontinued operations. The Company adopted SFAS No. 144 in 2002. The application of this statement resulted in the classification, and separate financial presentation of certain entities as discontinued operations, the results of which are not included in continuing operations. There was no impairment of assets related to discontinued operations, as their fair value exceeded their carrying value. Fair values used in these calculations has been determined by using the agreed upon sales prices.
The major classes of discontinued consolidated assets, consolidated liabilities and minority interest included in the Chilean GAAP Endesa Chile consolidated Balance Sheet are as follows:
| As of December 31, | ||
| 2002 | ||
| ThCh$ | ||
| Assets: | ||
| Cash | 196,765 | |
| Account receivable, net | 15,290,034 | |
| Other current assets | 36,601,387 | |
| Property, plant and equipment, net | 174,435,826 | |
| Intangibles | 35,633 | |
| Other assets | 18,692,185 | |
| Total assets of discontinued operations | 245,251,830 | |
| Liabilities: | ||
| Current liabilities | 76,792,885 | |
| Long term liabilities | 100,581,027 | |
| Income taxes payable (including deferred) | 864,514 | |
| Minority interest | 754,838 | |
| Total liabilities and minority interest of discontinued operations | 178,993,264 | |
F - 147
ENERSIS S.A. AND SUBSIDIARIES
Notes to the Consolidated Financial Statements – (Continued)
The major classes of consolidated revenues and expenses included in the US GAAP Enersis consolidated Income Statement are as follows:
| As of December 31, | |||||
| 2002 | 2003 | 2004 | |||
| ThCh$ | ThCh$ | ThCh$ | |||
| Sales | 20,914,128 | — | — | ||
| Costs of sales | (10,312,883 | ) | — | — | |
| Gross profit | 10,601,245 | — | — | ||
| Administrative and selling expenses | (1,355,803 | ) | — | — | |
| Operating income | 9,245,442 | — | — | ||
| Non operating (loss) income | (7,765,412 | ) | — | — | |
| Income before taxes and minority interest | 1,480,030 | — | — | ||
| Income tax | (1,006,734 | ) | — | — | |
| Minority interest | (302,357 | ) | — | — | |
| Net income for the year | 170,939 | — | — | ||
| (o) | Goodwill and intangible assets |
As discussed in Note 36 paragraph (i), Enersis S.A. adopted SFAS 142, which requires companies to stop amortizing goodwill and certain intangible assets with an indefinite useful life. Instead, FAS 142 requires that goodwill and intangible assets deemed to have an indefinite useful life be reviewed for impairment upon adoption of SFAS 142, effective January 1, 2002 and annually thereafter. Under SFAS 142, goodwill impairment is deemed to exist if the net book value of a reporting unit exceeds its estimated fair value. The Company's reporting units are at the operating subsidiary level. This methodology differs from Enersis’s previous policy, as provided under accounting standards existing at that time of using undiscounted cash flows on an enterprise-wide basis to determine if goodwill was recoverable. Subsequent to adoption in 2002 of SFAS No. 142, due to changes in circunstances, the Company recognized a non-cash charge of ThCh$615,389,513 to reduce the carrying value of goodwill.
In calculating the impairment charge, the fair value of the impaired reporting units underlying the segments were estimated using discounted cash flow methodology. The ThCh$615,389,513 goodwill impairment is associated entirely with goodwill associated with investments in Argentina and Brazil. The impairment reflects the decline in the Company's revenues and forecasted cash flows in their Argentina and Brazilian subsidiaries and the increase in inflation and interest rates and decreasing expectations of the currencies in Argentina and Brazil. Prior to performing the review for impairment, SFAS 142 required that all goodwill deemed to be related to the entity as a whole be assigned to all of the Company's reporting units, including the reporting units of the acquirer.
A summary of the changes in the Company's goodwill under U.S. GAAP during the year ended December 31, 2003 and 2004, by country of operation and segment is as follows:
F - 148
ENERSIS S.A. AND SUBSIDIARIES
Notes to the Consolidated Financial Statements – (Continued)
| 2003: | ||||||||||
| 2003 | ||||||||||
| Acquisitions | Translation | |||||||||
| Goodwill by Country | January 1, | (Disposals) | adjustment | Impairment | December 31, | |||||
| ThCh$ | ThCh$ | ThCh$ | ThCh$ | ThCh$ | ||||||
| Chile | 1,035,214,601 | (11,216,517 | ) | — | — | 1,023,998,084 | ||||
| Colombia | 75,058,126 | — | (16,371,275 | ) | — | 58,686,851 | ||||
| Perú | 22,054,183 | — | (4,010,358 | ) | — | 18,043,825 | ||||
| Total | 1,132,326,910 | (11,216,517 | ) | (20,381,633 | ) | — | 1,100,728,760 | |||
| 2003 | ||||||||||
| Acquisitions | Translation | |||||||||
| Goodwill by Segment | January 1, | (Disposals) | adjustment | Impairment | December 31, | |||||
| ThCh$ | ThCh$ | ThCh$ | ThCh$ | ThCh$ | ||||||
| Generation | 948,462,530 | 76,503 | (9,455,368 | ) | — | 939,083,665 | ||||
| Distribution | 183,799,541 | (11,293,020 | ) | (10,926,265 | ) | — | 161,580,256 | |||
| Other | 64,839 | — | — | — | 64,839 | |||||
| Total | 1,132,326,910 | (11,216,517 | ) | (20,381,633 | ) | — | 1,100,728,760 | |||
| 2004: | 2004 | |||||||||
| Acquisitions | Translation | |||||||||
| Goodwill by Country | January 1, | (Disposals) | adjustment | Impairment | December 31, | |||||
| ThCh$ | ThCh$ | ThCh$ | ThCh$ | ThCh$ | ||||||
| Chile | 1,023,998,084 | 77,634,406 | — | — | 1,101,632,490 | |||||
| Colombia | 58,686,851 | (12,042,932 | ) | (3,927,317 | ) | — | 42,716,602 | |||
| Perú | 18,043,825 | — | (1,519,204 | ) | — | 16,524,621 | ||||
| Total | 1,100,728,760 | 65,591,474 | (5,446,521 | ) | — | 1,160,873,713 | ||||
| 2004 | ||||||||||
| Acquisitions | Translation | |||||||||
| Goodwill by Segment | January 1, | (Disposals) | adjustment | Impairment | December 31, | |||||
| ThCh$ | ThCh$ | ThCh$ | ThCh$ | ThCh$ | ||||||
| Generation | 939,083,665 | 77,634,406 | (3,581,620 | ) | — | 1,013,136,451 | ||||
| Distribution | 161,580,256 | (12,042,932 | ) | (1,864,901 | ) | — | 147,672,423 | |||
| Other | 64,839 | — | — | — | 64,839 | |||||
| Total | 1,100,728,760 | 65,591,474 | (5,446,521 | ) | — | 1,160,873,713 | ||||
The Company's intangible assets were ThCh$79,100,256 and ThCh$80,708,810 and related accumulated amortization were ThCh$40,254,130 and ThCh$44,013,845 as of December 31, 2003 and 2004, respectively. There is no difference between Chilean and U.S. GAAP in the amortization of intangible assets because all of the Company’s intangible assets are subject to amortization, since they relate to finite contracts or concessions.
F - 149
ENERSIS S.A. AND SUBSIDIARIES
Notes to the Consolidated Financial Statements – (Continued)
| (p) | Asset retirement obligations |
As discussed in Note 36 paragraph (ff), the Company adopted SFAS No. 143 effective January 1, 2003. The following table describes all changes to the Company’s U.S. GAAP asset retirement obligation during the year ended December 31, 2003 and 2004:
| As of December 31, | ||||
| 2003 | 2004 | |||
| ThCh$ | ThCh$ | |||
| Balance as of January 1, | (602,829 | ) | (537,670 | ) |
| Cumulative Translation Adjustment | 109,633 | 39,054 | ||
| Liabilities incurred in the period | — | — | ||
| Accretion expense | (44,474 | ) | (637,297 | ) |
| Balance as of December 31, | (537,670 | ) | (1,135,913 | ) |
The pro forma effects of the application of SFAS No. 143 as if the Statement had been adopted on January 1, 2001 (rather than January 1, 2003) are as follows (on a U.S. GAAP basis):
| As of | ||
| December 31, | ||
| 2002 | ||
| ThCh$ | ||
| Pro forma amounts assuming the accounting change is applied retroactively net-of-tax: | ||
| Net income (loss) | (341,592,536 | ) |
| Net income (loss) per common share – basic and diluted | (41.20 | ) |
| (q) | Recent accounting pronouncements |
The following new accounting standards have been adopted by the Company during the year-ended December 31, 2004 and the impact of such adoption, if applicable, has been presented in the accompanying consolidated financial statements.
| i. | In January 2003, the Financial Accounting Standards Board ("FASB") issued Interpretation No. 46, Consolidation of Variable Interest Entities ("FIN 46"),an interpretation of Accounting Research bulletin No. 51, "Consolidated Financial Statement", which requires the consolidation by a business enterprise of variable interest entities, if the business enterprise is the primary beneficiary. The FASB has amended FIN 46, now known as FIN 46 Revised December 2003 ("FIN 46(R)"). For the purpose of analyzing investments in potential variable entities formed after January 31, 2003, the Company has applied the provisions of FIN 46 and FIN 46(R) as of January 1, 2004. For the purpose of analyzing potential variable interest entities previously defined as special purpose entities ("SPE's") created before February 1, 2003; the Company has applied the provisions of FIN 46 and FIN 46(R) for the period beginning January 1, 2004. The Company has also applied the provisions of FIN 46 and FIN 46(R) in determining whether the Company holds potential interest in variable interest entities not previously defined as SPE's for the period ended December 31, 2004. The adoption of FIN 46(R) did not have a material impact on the Company's consolidating financial position, results of operations or cash flows. |
F - 150
ENERSIS S.A. AND SUBSIDIARIES
Notes to the Consolidated Financial Statements – (Continued)
| ii. | In December 2004, the FASB deferred the issuance of their final standard on earnings per share SFAS No. 128R, Earnings per Share, an amendment to FAS 128. The final standard is expected to be effective in 2005 and will require retrospective application for all prior periods presented. The significant proposed changes to the EPS computation are changes to the treasury stock method and contingent share guidance for computing year-to-date diluted EPS, removal of the ability to overcome the presumption of share settlement when computing diluted EPS when there is a choice of share or cash settlement and inclusion of mandatorily convertible securities in basic EPS. The Company is currently evaluating the proposed provisions of this amendment to determine the impact on its consolidated financial statements. |
| iii. | In December 2004, the FASB issued SFAS No. 153, Exchanges of Nonmonetary Assets, an amendment of APB Opinion No. 29. APB Opinion No. 29, Accounting for Nonmonetary Transactions, provided an exception to its basic measurement principle (fair value) for exchanges of similar productive assets. Under APB Opinion No. 29, an exchange of a productive asset for a similar productive asset was based on the recorded amount of the asset relinquished. SFAS No. 153 eliminates this exception and replaces it with an exception for exchanges of nonmonetary assets that do not have commercial substance. SFAS No. 153 is effective prospectively for nonmonetary asset exchanges occurring in fiscal years beginning January 1, 2006 for the Company. |
| iv. | In November 2004, the FASB issued SFAS No. 151, Inventory Costs, an amendment of ARB No. 43, Chapter 4 (SFAS No. 151), to clarify the accounting for abnormal amounts of idle facility expense, freight, handling costs and wasted material (spoilage) relating to inventory pricing. SFAS No. 151 requires that such items be recognized as current-period charges regardless of whether they meet the criterion of “so abnormal” and requires that the allocation of fixed production overheads to inventory be based on the normal capacity of the production facilities. The guidance is effective for inventory costs incurred during fiscal years beginning after June 15, 2005. The Company is currently evaluating the provisions of this pronouncement to determine the effects on its financial condition, statements of operations, and cash flows. |
| v. | In March 2005, the FASB issued FASB Interpretation (“FIN”) No. 47, “Accounting for Conditional Asset Retirement Obligations,” which clarifies the term conditional asset retirement obligation as used in SFAS No. 143, “Accounting for Asset Retirement Obligations,” as a legal obligation to perform an asset retirement activity in which the timing and/or method of settlement are conditional on a future event that may or may not be within the control of the Company. FIN No. 47 is effective no later than the end of fiscal years ending after December 15, 2005. The Company is currently evaluating the impact of adopting this interpretation. |
| (r) | Subsequent events |
On May 24, 2005, the Board of Directors of Enersis S. A. approved the plan to reorganize its subsidiaries in Brazil, which seeks to simplify the shareholding structure of our Brazilian companies by having all of them become subsidiaries of a new Brazilian holding company, Endesa Brasil S.A.. Our Brazilian companies are currently owned by Endesa Internacional (our parent company, and a subsidiary of ENDESA, S.A.), Endesa-Chile, Chilectra and Enersis (the “Contributing Shareholders”). The initial intention is for Endesa-Brasil to be ultimately owned approximately as follows: Endesa-Chile, Endesa Internacional and Chilectra would have voting interests of 33.6%, 23.7% and 19.2%, respectively. Enersis on a stand-alone basis, would have a 23.5% interest. Because of Enersis’ interests in both Endesa-Chile and Chilectra, Enersis would hold majority control over Endesa-Brasil, and would consolidate the company.
Completion of the Brazilian reorganization is subject to receipt of regulatory approvals in Brazil
* * * * * *
F - 151
SCHEDULE I
ENERSIS S.A.
BALANCE SHEETS
(Restated for general price-level changes and expressed in thousands of constant
Chilean pesos as of December 31, 2004 and thousands of US dollars)
| ASSETS | As of December 31, | |||||
| 2003 | 2004 | 2004 | ||||
| ThCh$ | ThCh$ | ThUS$ | ||||
| CURRENT ASSETS: | ||||||
| Cash | 341,241 | 82,267 | 148 | |||
| Time deposits | 1,181,114 | 9,176,155 | 16,462 | |||
| Notes receivable, net | 755 | 737 | 1 | |||
| Other accounts receivable, net | 1,774,192 | 2,227,626 | 3,996 | |||
| Amounts due from related companies | 128,562,558 | 26,874,285 | 48,214 | |||
| Income taxes recoverable | 14,843,891 | — | — | |||
| Prepaid expenses | 55,432 | — | — | |||
| Deferred income taxes | 28,516,072 | 42,802,273 | 76,789 | |||
| Other current assets | 17,303,424 | 18,136,958 | 32,538 | |||
| Total current assets | 192,578,679 | 99,300,301 | 178,148 | |||
| PROPERTY, PLANT AND EQUIPMENT: | ||||||
| Buildings and infraestructure | 21,318,189 | 21,318,134 | 38,246 | |||
| Machinery and equipment | 2,359,443 | 2,196,587 | 3,941 | |||
| Other assets | 818,188 | 1,158,196 | 2,078 | |||
| Technical appraisal | 34,005 | 33,988 | 61 | |||
| Sub - total | 24,529,825 | 24,706,905 | 44,326 | |||
| Less: accumulated depreciation | (11,919,198 | ) | (12,530,600 | ) | (22,480 | ) |
| Total property, plant and equipment, net | 12,610,627 | 12,176,305 | 21,846 | |||
| OTHER ASSETS: | ||||||
| Investments in related companies | 2,226,881,670 | 2,250,223,210 | 4,036,999 | |||
| Investment in other companies | — | 15,508,173 | 27,822 | |||
| Goodwill, net | 753,106,535 | 706,355,890 | 1,267,233 | |||
| Negative goodwill, net | (621,934 | ) | (635,425 | ) | (1,140 | ) |
| Long-term receivables | 487,265 | — | — | |||
| Amounts due from related companies | 451,554,968 | 434,047,535 | 778,700 | |||
| Intangibles | 1,473,876 | 1,473,876 | 2,644 | |||
| Accumulated amortization | (434,208 | ) | (508,041 | ) | (911 | ) |
| Other assets | 27,395,174 | 12,327,667 | 22,115 | |||
| Total other assets | 3,459,843,346 | 3,418,792,885 | 6,133,462 | |||
| TOTAL ASSETS | 3,665,032,652 | 3,530,269,491 | 6,333,456 | |||
F - 152
SCHEDULE I
ENERSIS S.A.
BALANCE SHEETS
(Restated for general price-level changes and expressed in thousands of constant
Chilean pesos as of December 31, 2004 and thousands of US dollars)
| LIABILITIES AND SHAREHOLDERS’ EQUITY | As of December 31, | |||||
| 2003 | 2004 | 2004 | ||||
| ThCh$ | ThCh$ | ThUS$ | ||||
| CURRENT LIABILITIES: | ||||||
| Current portion of long-term debt due to banks and financial institutions | 809,498 | 31,837 | 57 | |||
| Current portion of bonds payable | 4,173,363 | 9,062,455 | 16,258 | |||
| Dividends payable | 114,402 | 53,507 | 96 | |||
| Accounts payable | 177,329 | 187,258 | 336 | |||
| Miscellaneous payables | 247,085 | 94,604 | 170 | |||
| Amounts payable to related companies | 34,809,445 | 76,122,916 | 136,568 | |||
| Accrued expenses | 22,183,350 | 18,012,095 | 32,314 | |||
| Withholdings | 136,704 | 193,498 | 347 | |||
| Income taxes payable | 16,691,677 | — | — | |||
| Unearned income | 139,111 | 31,379 | 56 | |||
| Other current liabilities | 8,680,005 | 544,059 | 976 | |||
| Total current liabilities | 88,161,969 | 104,333,608 | 187,178 | |||
| LONG -TERM LIABILITIES: | ||||||
| Due to baks and financial institutions | 304,322,500 | 195,090,000 | 350,000 | |||
| Bonds payable | 643,421,975 | 592,028,750 | 1,062,125 | |||
| Accrued expenses | 2,565,412 | 2,565,071 | 4,602 | |||
| Deferred income taxes | 4,818,080 | 3,520,749 | 6,316 | |||
| Other long-term liabilities | 9,641,028 | 73,178,171 | 131,285 | |||
| Total long-term liabilities | 964,768,995 | 866,382,741 | 1,554,328 | |||
| SHAREHOLDERS´ EQUITY: | ||||||
| Paid-in capital, no par value shares | 2,283,404,124 | 2,283,404,124 | 4,096,527 | |||
| Additional paid-in capital | 163,306,446 | 162,725,821 | 291,937 | |||
| Other reserves | (26,313,477 | ) | (122,588,994 | ) | (219,930 | ) |
| Retained earnings | 180,417,144 | 194,378,259 | 348,723 | |||
| Net income for the year | 12,779,560 | 44,307,596 | 79,490 | |||
| Deficit of subsidiaries in development stage | (1,492,109 | ) | (2,673,664 | ) | (4,797 | ) |
| Total shareholders´ equity | 2,612,101,688 | 2,559,553,142 | 4,591,950 | |||
| TOTAL LIABILITIES AND SHAREHOLDERS’ EQUITY | 3,665,032,652 | 3,530,269,491 | 6,333,456 | |||
F - 153
SCHEDULE I
ENERSIS S.A.
INCOME STATEMENT
(Restated for general price-level changes and expressed in thousands of constant
Chilean pesos as of December 31, 2004 and thousands of US dollars)
| Years ended December 31, | ||||||||
| 2002 | 2003 | 2004 | 2004 | |||||
| ThCh$ | ThCh$ | ThCh$ | ThUS$ | |||||
| OPERATING INCOME: | ||||||||
| SALES | 4,432,444 | 4,440,316 | 4,432,912 | 7,953 | ||||
| COST OF SALES | (1,124,232 | ) | (1,158,548 | ) | (1,101,472 | ) | (1,976 | ) |
| GROSS PROFIT | 3,308,212 | 3,281,768 | 3,331,440 | 5,977 | ||||
| ADMINISTRATIVE AND SELLING EXPENSES | (22,599,057 | ) | (17,443,744 | ) | (17,314,877 | ) | (31,064 | ) |
| OPERATING LOSS | (19,290,844 | ) | (14,161,976 | ) | (13,983,437 | ) | (25,087 | ) |
| NON-OPERATING INCOME SELLING EXPENSES: | ||||||||
| Interest income | 59,106,740 | 40,618,484 | 30,514,861 | 54,745 | ||||
| Equity in income of related companies | 74,421,764 | 116,577,629 | 157,530,500 | 282,617 | ||||
| Other non-operating income | 23,167,461 | 102,226,101 | 9,995,020 | 17,932 | ||||
| Equity in losses of related companies | (83,162,915 | ) | (73,440,467 | ) | (20,852,813 | ) | (37,411 | ) |
| Amortization of goodwill | (111,691,802 | ) | (51,110,145 | ) | (51,264,529 | ) | (91,971 | ) |
| Interest expense | (149,236,223 | ) | (146,131,051 | ) | (71,623,008 | ) | (128,495 | ) |
| Other non-operating expenses | (18,705,372 | ) | (23,686,725 | ) | (15,960,008 | ) | (28,633 | ) |
| Price-level restatements, net | 1,636,419 | (4,536,852 | ) | (2,131,915 | ) | (3,825 | ) | |
| Exchange difference, net | (18,781,275 | ) | 31,296,475 | 5,096,826 | 9,144 | |||
| NON-OPERATING RESULT | (223,245,203 | ) | (8,186,551 | ) | 41,304,934 | 74,103 | ||
| INCOME (LOSS) BEFORE INCOME TAXES AND AMORTIZATION OF NEGATIVE GOODWILL | (242,536,047 | ) | (22,348,527) | 27,321,497 | 49,016 | |||
| INCOME TAX | 9,821,030 | 12,951,801 | 16,945,821 | 30,402 | ||||
| INCOME (LOSS) BEFORE AMORTIZATIONOF NEGATIVE GOODWILL | (232,715,017 | ) | (9,396,726 | ) | 44,267,318 | 79,418 | ||
| AMORTIZATION OF NEGATIVE GOODWILL | 1,079,810 | 22,176,286 | 40,278 | 72 | ||||
| NET INCOME FOR THE YEAR | (231,635,207 | ) | 12,779,560 | 44,307,596 | 79,490 | |||
F - 154
SCHEDULE I
ENERSIS S.A.
STATEMENTS OF CASH FLOWS
(Restated for general price-level changes and expressed in thousands of constant
Chilean pesos as of December 31, 2004 and thousands of US dollars)