Table of Contents
| o | REGISTRATION STATEMENT PURSUANT TO SECTION 12(b) OR 12(g) OF THE SECURITIES EXCHANGE ACT OF 1934 |
| þ | ANNUAL REPORT PURSUANT TO SECTION 13 OR 15(d) OF THE SECURITIES EXCHANGE ACT OF 1934 |
| o | TRANSITION REPORT PURSUANT TO SECTION 13 OR 15(d) OF THE SECURITIES EXCHANGE ACT OF 1934 |
| o | SHELL COMPANY REPORT PURSUANT TO SECTION 23 OR 15(d) OF THE SECURITIES EXCHANGE ACT OF 1934 |
| ENERSIS S.A. | CHILE | |
| (Translation of Registrant’s name into English) | (Jurisdiction of incorporation or organization) |
Santiago, Chile
| Title of Each Class | Name of Each Exchange on Which Registered | |
| American Depositary Shares representing Common Stock | New York Stock Exchange | |
| Common Stock, no par value * | New York Stock Exchange | |
| $ 350,000,000 7.40% Notes due December 1, 2016 | New York Stock Exchange | |
| $ 150,000,000 6.60% Notes due December 1, 2026 | New York Stock Exchange |
| * | Listed, not for trading, but only in connection with the registration of American Depositary Shares, pursuant to the requirements of the Securities and Exchange Commission. |
Securities for which there is a reporting obligation pursuant to Section 15(d) of the Act:
$ 350,000,000 7.375% Notes due January 15, 2014
| Large accelerated filerþ | Accelerated filero | Non-accelerated filero |
o U.S. GAAP | o | International Financial Reporting Standards as issued by the International Accounting Standards Board | þ Other |
| Page | ||||||||
| 3 | ||||||||
| 6 | ||||||||
| 6 | ||||||||
| 7 | ||||||||
| 7 | ||||||||
| 8 | ||||||||
| 9 | ||||||||
| 9 | ||||||||
| 9 | ||||||||
| 9 | ||||||||
| 21 | ||||||||
| 71 | ||||||||
| 71 | ||||||||
| 114 | ||||||||
| 122 | ||||||||
| 124 | ||||||||
| 125 | ||||||||
| 128 | ||||||||
| 143 | ||||||||
| 148 | ||||||||
| 148 | ||||||||
| 148 | ||||||||
| 148 | ||||||||
| 149 | ||||||||
| 149 | ||||||||
| 149 | ||||||||
| 149 | ||||||||
| 151 | ||||||||
| 151 | ||||||||
| 152 | ||||||||
| 152 | ||||||||
| 152 | ||||||||
| 153 | ||||||||
| Exhibit 8.1 | ||||||||
| Exhibit 12.1 | ||||||||
| Exhibit 12.2 | ||||||||
| Exhibit 13.1 | ||||||||
2
Table of Contents
| Acciona | ACCIONA, S.A. | Spanish construction holding company. | ||
| AESGener | AES Gener S.A. | Chilean generation company that competes with us in Chile, Argentina, Brazil and Colombia. | ||
| AFP | Administradora de Fondos de Pensiones | Chilean private pension funds. | ||
| Ampla | Ampla Energía e Serviços S.A. | Brazilian distribution company operating in Rio do Janeiro, owned by Endesa Brasil, a subsidiary of Enersis. | ||
| ANEEL | Agéncia Nacional de Energia Elétrica | Brazilian governmental agency for electric energy. | ||
| Betania | Central Hidroeléctrica de Betania S.A. E.S.P. | Endesa Chile’s Colombian subsidiary which merged with Emgesa in 2007. | ||
| Bureau Veritas | Bureau Veritas | International independent certification company. | ||
| Cachoeira Dourada | Centrais Elétricas Cachoeira Dourada S.A. | Brazilian generating company owned by Endesa Brasil, a subsidiary of Enersis. | ||
| CAM | Compañía Americana de Multiservicios Ltda. | Enersis’ subsidiary engaged in the electrical parts procurement business. | ||
| Cammesa | Compañía Administradora del Mercado Mayorista Eléctrico S.A. | Argentine autonomous entity in charge of the operation of theMercado Eléctrico Mayorista(Wholesale Electricity Market), or MEM. Cammesa’s stockholders are generation, transmission and distribution companies, large users and the Secretariat of Energy. | ||
| CDEC | Centro de Despacho Económico de Carga | Autonomous entity in two Chilean electric systems in charge of coordinating the efficient operation and dispatch of units to satisfy the demand at any time. | ||
| CELTA | Compañía Eléctrica Tarapacá S.A. | Endesa Chile’s subsidiary that operates in the SING with thermal plants. | ||
| CEMSA | Compañía de Energía del Mercosur S.A. | Energy trading company with operations in Argentina, a subsidiary of Endesa Chile. | ||
| Chilectra | Chilectra S.A. | Chilean electricity distribution company operating in the Santiago metropolitan area owned by Enersis. | ||
| CIEN | Companhia de Interconexão Energética S.A. | Brazilian transmission company wholly-owned by Endesa Brasil, Enersis’ subsidiary. | ||
| CNE | Comisión Nacional de Energía | Chilean National Energy Commission; governmental entity with responsibilities under the Chilean regulatory framework. | ||
| Codensa | Codensa S.A. E.S.P. | Colombian distribution company controlled by Enersis that operates mainly in Bogotá and Cundinamarca. |
3
Table of Contents
| Coelce | Companhia Energética do Ceará S.A. | Brazilian distribution company operating in the state of Ceará; Coelce is controlled by Endesa Brasil, a subsidiary of Enersis. | ||
| CREG | Comisión de Regulación de Energía y Gas | Colombian Commission for the Regulation of Energy and Gas. | ||
| CTM | Compañía de Transmisión del Mercosur | Endesa Brasil’s subsidiary transmission company with operations in Argentina. | ||
| Edegel | Edegel S.A.A. | Peruvian generation company, a subsidiary of Endesa Chile. | ||
| Edelnor | Empresa de Distribución Eléctrica de Lima Norte S.A.A. | Peruvian distribution company with concession area in the northern part of Lima. | ||
| Edesur | Empresa Distribuidora Sur S.A. | Argentine distribution company with concession area in the south of the Buenos Aires larger metropolitan area. | ||
| El Chocón | Central Hidroeléctrica El Chocón S.A. | Endesa Chile’s subsidiary with two hydroelectric plants, El Chocón and Arroyito, both located in the Limay River, Argentina. | ||
| Elesur | Elesur S.A. | A former Chilean subsidiary of Enersis that absorbed Chilectra, and later changed its name to Chilectra. | ||
| Emgesa | Emgesa S.A. E.S.P. | Colombian generation company controlled by Endesa Chile. | ||
| Endesa Brasil | Endesa Brasil, S.A. | Brazilian holding company, a subsidiary of Enersis, created in 2005. | ||
| Endesa Chile | Empresa Nacional de Electricidad S.A. | Our generation subsidiary with operations in four countries in South America. | ||
| Endesa Costanera | Endesa Costanera S.A. | Argentine generation company controlled by Endesa Chile. | ||
| Endesa Fortaleza | Central Geradora Termelétrica Fortaleza S.A. | Endesa Fortaleza owns a combined cycle generating plant, located in the state of Ceará. Endesa Fortaleza is fully owned by Endesa Brasil, a subsidiary of Enersis. | ||
| Endesa Internacional | Endesa Internacional S.A. | A subsidiary of Endesa Spain and our direct controller. | ||
| Endesa Spain | ENDESA, S.A. | A Spanish electricity generation and distribution company with a 60.6% beneficial interest in Enersis. | ||
| Enel | ENEL S.p.A. | A large power company in Italy. | ||
| ENRE | Ente Nacional Regulatorio de la Energía | Argentine national regulatory authority of the energy sector. | ||
| GasAtacama | GasAtacama S.A. | Company involved in gas transportation and electricity generation in the north of Chile, an affiliate of Endesa Chile. | ||
| IFRS | International Financial Reporting Standards | Reporting standards that the company will adopt starting on January 1, 2009. |
4
Table of Contents
| IMV | Inmobiliaria Manso de Velasco Limitada | Enersis’ wholly-owned subsidiary dedicated to the real estate business. | ||
| MEM | Mercado Eléctrico Mayorista | Wholesale Electricity Market in Argentina. | ||
| MME | Ministério de Minas e Energia | Ministry of Mines and Energy of Brazil. | ||
| NIS | Sistema Interconectado Nacional | National interconnected electric system. There are such systems in Argentina, Brazil and Colombia. | ||
| ONS | Operador Nacional do Sistema Elétrico | Electric System National Operator. Brazilian non-profit private entity responsible for the planning and coordination of operations in interconnected systems. | ||
| Osinergmin | Organismo Supervisor de la Inversión en Energía y Minería | Energy and Mining Investment Supervisor Authority, or the Osinergmin, the Peruvian regulatory electricity authority. | ||
| Pangue | Empresa Eléctrica Pangue S.A. | Chilean electricity company, owner of the Pangue power station. Pangue is an Endesa Chile subsidiary. | ||
| Pehuenche | Empresa Eléctrica Pehuenche S.A. | Chilean electricity company, owner of three power stations in the Maule basin. Pehuenche is an Endesa Chile subsidiary. | ||
| San Isidro | Compañía Eléctrica San Isidro S.A. | Chilean electricity company, owner of a thermal power station. San Isidro is wholly-owned by Endesa Chile. | ||
| SEF | Superintendencia de Electricidad y Combustible | Governmental entity in charge of supervising the Chilean electricity industry. | ||
| SEIN | Sistema Eléctrico Interconectado Nacional | Peruvian interconnected electric system. | ||
| SIC | Sistema Interconectado Central | Chilean central interconnected electric system. | ||
| SING | Sistema Interconectado del Norte Grande | Electric system operating in northern Chile. | ||
| SVS | Superintendencia de Valores y Seguros | Chilean authority in charge of supervising public companies, securities and insurance. | ||
| Synapsis | Synapsis Soluciones y Servicios IT Ltda. | Wholly-owned subsidiary of Enersis engaged in the computer services business. | ||
| TESA | Transportadora del Energía de Mercosur S.A. | Endesa Brasil’s transmission company subsidiary with operations in Argentina. | ||
| UNIREN | Unidad de Renegociación y Análisis de Contratos de Servicios Públicos | Argentine institution in charge of renegotiating public service contracts. | ||
| UTA | Unidad Tributaria Anual | Chilean annual tax unit. One UTA equals 12 UTM. | ||
| UTM | Unidad Tributaria Mensual | Chilean monthly tax unit used to define fines, among other purposes. | ||
| VAD | Valued Added Distribution | Value added from distribution of electricity. | ||
| VNR | Valor Nuevo de Reemplazo | The net replacement value, in its Spanish acronym. |
5
Table of Contents
6
Table of Contents
| • | subtracting the number of GWh of energy sold from the number of GWh of energy purchased and self-generated within a given period; and | ||
| • | calculating the percentage that the resulting quantity bears to the aggregate number of GWh of energy purchased and self-generated within the same period. |
7
Table of Contents
| • | our capital investment program; | ||
| • | trends affecting our financial condition or results from operations; | ||
| • | our dividend policy; | ||
| • | the future impact of competition and regulation; | ||
| • | political and economic conditions in the countries in which we or our affiliates operate or may operate in the future; | ||
| • | any statements preceded by, followed by or that include the words “believes,” “expects,” “predicts,” “anticipates,” “intends,” “estimates,” “should,” “may” or similar expressions; and | ||
| • | other statements contained or incorporated by reference in this annual report regarding matters that are not historical facts. |
| • | changes in the regulatory framework of the electric industry in one or more of the countries in which we operate; | ||
| • | our ability to implement proposed capital expenditures, including our ability to arrange financing where required; | ||
| • | the nature and extent of future competition in our principal markets; | ||
| • | political, economic and demographic developments in the emerging market countries of South America where we conduct our business; and | ||
| • | the factors discussed below under “Risk Factors.” |
8
Table of Contents
9
Table of Contents
| As of and for the year ended December 31, | ||||||||||||||||||||||||
| 2003 | 2004 | 2005 | 2006 | 2007 | 2007(1) | |||||||||||||||||||
| (constant Ch$ millions as of December 31, 2007, | (Millions of $) | |||||||||||||||||||||||
| except Share and ADS data) | ||||||||||||||||||||||||
CONSOLIDATED INCOME STATEMENT DATA | ||||||||||||||||||||||||
Chilean GAAP | ||||||||||||||||||||||||
| Revenues from Operations | 2,766,712 | 3,101,986 | 3,533,450 | 4,155,845 | 4,686,676 | 9,432 | ||||||||||||||||||
| Cost of Sales | (1,929,243 | ) | (2,158,247 | ) | (2,399,516 | ) | (2,782,687 | ) | (3,163,865 | ) | (6,367 | ) | ||||||||||||
| Administrative and Selling Expenses | (197,499 | ) | (200,855 | ) | (243,971 | ) | (241,527 | ) | (267,244 | ) | (538 | ) | ||||||||||||
Operating Income | 639,970 | 742,884 | 889,963 | 1,131,631 | 1,255,567 | 2,527 | ||||||||||||||||||
| Equity in Income of Related Companies | 20,397 | 35,383 | 7,397 | 5,412 | (54,761 | ) | (110 | ) | ||||||||||||||||
| Goodwill Amortization | (61,981 | ) | (60,437 | ) | (60,515 | ) | (60,045 | ) | (59,814 | ) | (120 | ) | ||||||||||||
| Interest (Expense), net | (411,014 | ) | (327,072 | ) | (290,075 | ) | (280,336 | ) | (290,878 | ) | (585 | ) | ||||||||||||
| Price Level Adjustment | (12,289 | ) | 15,485 | (12,267 | ) | 7,029 | (4,017 | ) | (8 | ) | ||||||||||||||
| Other Non-Operating Income (loss), net | (80,546 | ) | (104,570 | ) | (100,050 | ) | (111,089 | ) | (149,389 | ) | (301 | ) | ||||||||||||
Income (loss) before Income Taxes, Minority Interest and Amortization of Negative Goodwill | 94,537 | 301,673 | 434,453 | 692,602 | 696,708 | 1,403 | ||||||||||||||||||
| Income taxes | (48,406 | ) | (155,910 | ) | (190,984 | ) | (102,257 | ) | (253,148 | ) | (509 | ) | ||||||||||||
| Extraordinary Items | — | — | — | — | — | — | ||||||||||||||||||
| Minority Interest | (91,204 | ) | (114,861 | ) | (185,879 | ) | (289,750 | ) | (259,606 | ) | (522 | ) | ||||||||||||
| Amortization of Negative Goodwill | 59,591 | 19,434 | 16,993 | 6,527 | 4,422 | 9 | ||||||||||||||||||
Net Income (loss) | 14,518 | 50,336 | 74,583 | 307,122 | 188,376 | 381 | ||||||||||||||||||
| Net Income (loss) $ per Share | 0.66 | 1.54 | 2.28 | 9.41 | 5.77 | — | ||||||||||||||||||
| Net Income (loss) $ per ADS | 20.70 | 77.08 | 114.21 | 470.31 | 288.47 | 1 | ||||||||||||||||||
U.S. GAAP | ||||||||||||||||||||||||
| Operating Income | 525,528 | 754,842 | 904,496 | 1,093,538 | 1,015,880 | 2,044 | ||||||||||||||||||
| Equity in Income (loss) of Related Companies | 50,784 | 35,384 | (28,929 | ) | 10,213 | (52,620 | ) | (106 | ) | |||||||||||||||
| Income taxes | (25,326 | ) | (140,834 | ) | (199,330 | ) | (109,426 | ) | (250,415 | ) | (504 | ) | ||||||||||||
| Net Income (loss) from continuing operations | 34,327 | 172,420 | 134,162 | 388,951 | 188,054 | 378 | ||||||||||||||||||
| Income (loss) from discontinued operations net of tax and minority interest | 82 | — | — | — | — | — | ||||||||||||||||||
| Net Income (loss) | 34,409 | 172,420 | 134,162 | 388,951 | 188,054 | 378 | ||||||||||||||||||
| Net Income (loss) from continuing operations per Share | 1.68 | 5.18 | 4.11 | 11.91 | 5.76 | — | ||||||||||||||||||
| Net Income (loss) from continuing operations per ADS | 83.85 | 75.49 | 205.45 | 595.62 | 287.97 | 1 | ||||||||||||||||||
| Net Income (loss) per Share | 1.66 | 5.18 | 4.11 | 11.91 | 5.76 | — | ||||||||||||||||||
| Net Income (loss) per ADS | 83.26 | 75.49 | 205.45 | 595.62 | 287.97 | 1 | ||||||||||||||||||
| Cash Dividends per Share | — | — | 0.47 | 2.29 | 5.72 | — | ||||||||||||||||||
| Cash Dividends per ADS | — | — | 23.55 | 114.55 | 285.91 | 1 | ||||||||||||||||||
| Capital stock | 2,778,877 | 2,778,877 | 2,778,877 | 2,778,877 | 2,778,877 | 5,593 | ||||||||||||||||||
| Number of shares of common stock (thousands) | 32,651,166 | 32,651,166 | 32,651,166 | 32,651,166 | 32,651,166 | — | ||||||||||||||||||
| Number of American Depository Shares (thousands) | 55,111 | 66,345 | 61,384 | 61,384 | 61,384 | — | ||||||||||||||||||
CONSOLIDATED BALANCE SHEET DATA | ||||||||||||||||||||||||
CHILEAN GAAP | ||||||||||||||||||||||||
| Total Assets | 12,476,895 | 11,918,028 | 11,256,598 | 11,884,104 | 11,437,767 | 23,019 | ||||||||||||||||||
| Long-Term Debt | 4,296,974 | 4,324,529 | 3,707,065 | 4,213,035 | 4,052,531 | 8,156 | ||||||||||||||||||
| Minority Interest | 3,900,008 | 3,550,101 | 3,070,395 | 3,082,340 | 2,741,767 | 5,518 | ||||||||||||||||||
| Stockholders’ Equity | 2,967,427 | 2,907,729 | 2,846,513 | 3,082,253 | 2,903,210 | 5,843 | ||||||||||||||||||
U.S. GAAP | ||||||||||||||||||||||||
| Total Assets | 12,299,246 | 11,992,938 | 11,386,446 | 12,051,650 | 11,741,381 | 23,630 | ||||||||||||||||||
| Long-Term Debt | 4,432,414 | 4,537,823 | 3,898,130 | 4,415,885 | 4,324,556 | 8,703 | ||||||||||||||||||
| Minority Interest | 3,642,042 | 3,295,797 | 2,850,938 | 2,877,075 | 2,469,074 | 4,969 | ||||||||||||||||||
| Stockholders’ Equity | 2,925,657 | 2,992,920 | 3,006,539 | 3,258,858 | 3,157,633 | 6,355 | ||||||||||||||||||
10
Table of Contents
| As of and for the year ended December 31, | ||||||||||||||||||||||||
| 2003 | 2004 | 2005 | 2006 | 2007 | 2007(1) | |||||||||||||||||||
| (constant Ch$ millions as of December 31, 2007, | (Millions of $) | |||||||||||||||||||||||
| except Share and ADS data) | ||||||||||||||||||||||||
OTHER CONSOLIDATED FINANCIAL DATA | ||||||||||||||||||||||||
CHILEAN GAAP | ||||||||||||||||||||||||
| Capital Expenditures | 301,339 | 302,110 | 348,101 | 556,083 | 594,055 | 1,196 | ||||||||||||||||||
| Depreciation and amortization of intangibles(2) | 471,593 | 438,840 | 412,234 | 453,739 | 425,427 | 856 | ||||||||||||||||||
U.S. GAAP | ||||||||||||||||||||||||
| Capital Expenditures | 301,339 | 302,110 | 348,101 | 556,083 | 594,055 | 1,196 | ||||||||||||||||||
| Depreciation and amortization | 470,933 | 416,640 | 394,869 | 428,970 | 407,555 | 820 | ||||||||||||||||||
| (1) | Solely for the convenience of the reader, peso amounts have been translated into dollars at the rate of Ch$496.89 per dollar, the Observed Exchange Rate as of December 31, 2007. | |
| (2) | Does not include goodwill and negative goodwill amortization. |
11
Table of Contents
| As of and for the year ended December 31, | ||||||||||||||||||||
| 2003 | 2004 | 2005 | 2006 | 2007 | ||||||||||||||||
OPERATING DATA OF SUBSIDIARIES | ||||||||||||||||||||
Chilectra | ||||||||||||||||||||
| Electricity Sold (GWh)(1) | 10,518 | 11,317 | 11,851 | 12,377 | 12,923 | |||||||||||||||
| Number of Customers (thousands) | 1,341 | 1,371 | 1,404 | 1,437 | 1,483 | |||||||||||||||
| Total Energy Losses (%)(2) | 5.6 | % | 5.2 | % | 5.5 | % | 5.4 | % | 5.9 | % | ||||||||||
Edesur | ||||||||||||||||||||
| Electricity Sold (GWh) | 12,656 | 13,322 | 14,018 | 14,837 | 15,833 | |||||||||||||||
| Number of Customers (thousands) | 2,117 | 2,139 | 2,165 | 2,196 | 2,228 | |||||||||||||||
| Total Energy Losses (%)(2) | 11.8 | % | 11.8 | % | 11.4 | % | 10.5 | % | 10.7 | % | ||||||||||
Ampla | ||||||||||||||||||||
| Electricity Sold (GWh) | 7,276 | 7,628 | 8,174 | 8,668 | 8,985 | |||||||||||||||
| Number of Customers (thousands) | 2,012 | 2,115 | 2,216 | 2,316 | 2,379 | |||||||||||||||
| Total Energy Losses (%)(2) | 23.6 | % | 22.8 | % | 22.4 | % | 21.9 | % | 21.4 | % | ||||||||||
Coelce | ||||||||||||||||||||
| Electricity Sold (GWh) | 5,905 | 6,141 | 6,580 | 6,769 | 7,227 | |||||||||||||||
| Number of Customers (thousands) | 2,109 | 2,334 | 2,438 | 2,543 | 2,689 | |||||||||||||||
| Total Energy Losses (%)(2) | 13.5 | % | 13.9 | % | 14.0 | % | 13.0 | % | 12.5 | % | ||||||||||
Codensa | ||||||||||||||||||||
| Electricity Sold (GWh) | 9,254 | 9,656 | 10,094 | 10,755 | 11,441 | |||||||||||||||
| Number of Customers (thousands) | 1,972 | 2,015 | 2,073 | 2,138 | 2,209 | |||||||||||||||
| Total Energy Losses (%)(2) | 10.2 | % | 9.7 | % | 9.4 | % | 8.9 | % | 8.7 | % | ||||||||||
Edelnor | ||||||||||||||||||||
| Electricity Sold (GWh) | 3,968 | 4,250 | 4,530 | 4,874 | 5,201 | |||||||||||||||
| Number of Customers (thousands) | 892 | 912 | 925 | 952 | 986 | |||||||||||||||
| Total Energy Losses (%)(2) | 8.4 | % | 8.4 | % | 8.6 | % | 8.2 | % | 8.1 | % | ||||||||||
Endesa Chile | ||||||||||||||||||||
| Installed capacity in Chile (MW) | 3,763 | 4,477 | 4,477 | 4,477 | 4,779 | |||||||||||||||
| Installed capacity in Argentina (MW) | 3,622 | 3,623 | 3,623 | 3,639 | 3,644 | |||||||||||||||
| Installed capacity in Colombia (MW) | 2,589 | 2,609 | 2,657 | 2,779 | 2,829 | |||||||||||||||
| Installed capacity in Brazil (MW) | 658 | 658 | — | — | — | |||||||||||||||
| Installed capacity in Peru (MW) | 967 | 967 | 969 | 1,426 | 1,468 | |||||||||||||||
| Production in Chile (GWh)(4) | 16,524 | 16,797 | 18,764 | 19,973 | 18,773 | |||||||||||||||
| Production in Argentina (GWh)(4) | 7,997 | 11,290 | 12,333 | 13,750 | 12,117 | |||||||||||||||
| Production in Colombia (GWh)(4) | 10,794 | 11,881 | 11,864 | 12,564 | 11,942 | |||||||||||||||
| Production in Brazil (GWh)(4)(5) | 3,024 | 3,262 | 2,645 | 0 | — | |||||||||||||||
| Production in Peru (GWh)(4) | 4,287 | 4,136 | 4,516 | 6,662 | 7,654 | |||||||||||||||
Endesa Brasil | ||||||||||||||||||||
| Installed capacity in Brazil (MW)(3) | — | — | 1,039 | 980 | 987 | |||||||||||||||
| Production in Brazil (GWh)(4) | — | — | 3,954 | 4,489 | 3,954 | |||||||||||||||
| (1) | Energy sold by Chilectra includes sales to Río Maipo in 2003, when we sold this distribution company. | |
| (2) | Energy losses are calculated by (a) subtracting the number of GWh of energy sold from the aggregate GWh of energy purchased and self-generated within a period and (b) calculating the percentage that the resulting sum bears to the aggregate number of GWh of energy purchased and self-generated within the same period. Energy losses arise from illegally tapped energy as well as technical failures. | |
| (3) | As a result of the creation of Endesa Brasil, Cachoeira Dourada became a subsidiary of Enersis as of October 2005. As of the same date, Enersis also started to consolidate Endesa Fortaleza. Ampla had generation facilities which were sold in 2006. | |
| (4) | Energy production is defined as total generation minus energy consumption and technical losses within our own power plants. | |
| (5) | Endesa Chile consolidated Cachoeira Dourada’s generation only through September 2005. |
12
Table of Contents
| Observed Exchange Rate(1) | ||||||||||||||||
| (Ch$ per U.S.$) | ||||||||||||||||
| Period- | ||||||||||||||||
| Year | Low(2) | High(2) | Average(3) | end | ||||||||||||
| 2003 | 593.10 | 758.21 | 686.89 | 593.80 | ||||||||||||
| 2004 | 557.40 | 649.45 | 611.11 | 557.40 | ||||||||||||
| 2005 | 509.70 | 592.75 | 558.06 | 512.50 | ||||||||||||
| 2006 | 511.44 | 549.63 | 529.64 | 532.39 | ||||||||||||
| 2007 | 493.14 | 548.67 | 521.06 | 496.89 | ||||||||||||
13
Table of Contents
| Observed Exchange Rate(1) | ||||||||||||||||
| (Ch$ per U.S.$) | ||||||||||||||||
| Period- | ||||||||||||||||
| Last six months | Low(2) | High(2) | Average(3) | end | ||||||||||||
| 2007 | ||||||||||||||||
| December | 495.49 | 506.79 | — | 496.89 | ||||||||||||
| 2008 | ||||||||||||||||
| January | 463.58 | 498.05 | — | 465.34 | ||||||||||||
| February | 453.95 | 476.44 | — | 453.95 | ||||||||||||
| March | 431.22 | 454.94 | — | 437.71 | ||||||||||||
| April | 433.98 | 461.49 | — | 461.49 | ||||||||||||
| May | 464.83 | 479.66 | — | 479.54 | ||||||||||||
| Source: Chilean Central Bank. | ||
| (1) | Reflects pesos at historical values rather than in constant pesos. | |
| (2) | Exchange rates are the actual high and low, on a day-by-day basis, for each period. | |
| (3) | The average of the exchange rates on the last day of each month during the period. This is not applicable to monthly data. | |
14
Table of Contents
15
Table of Contents
16
Table of Contents
17
Table of Contents
18
Table of Contents
19
Table of Contents
20
Table of Contents
| Main office: | Avenida Santa Rosa 76, Santiago, Chile | |
| Mailing Address: | Casilla 1392 | |
| Telephone: | (562) 353-4400 | |
| Fax: | (562) 378-4789 | |
| Web Site: | www.enersis.cl |
21
Table of Contents
| Main office: | 850 Library Avenue, Suite 204, Newark, Delaware | |
| Mailing Address: | P.O. Box 885, Newark, Delaware 19711 | |
| Telephone: | (302) 738-6680 | |
| Fax: | (302) 738-7210 |
22
Table of Contents
23
Table of Contents
24
Table of Contents
| Capital Expenditure | ||||||||||||||||
| (in billion of Ch$) | ||||||||||||||||
| (expected) | ||||||||||||||||
| 2005 | 2006 | 2007 | 2008-2011 | |||||||||||||
| Electricity Generation/Transmission(1) | 60 | 219 | 217 | 2,454 | ||||||||||||
| Electricity Distribution | 266 | 360 | 385 | 2,033 | ||||||||||||
| Other Businesses | 6 | 6 | 5 | 38 | ||||||||||||
| Total | 332 | 586 | 608 | 4,524 | ||||||||||||
| (1) | Since October 2005, we include investments corresponding to Endesa Fortaleza and CIEN. These companies are subsidiaries of Endesa Brasil, which, in turn, is consolidated by Enersis. |
25
Table of Contents
| Distribution company | 2007 Capex (Ch$ billion) | |||
| Chilectra | 59.5 | |||
| Edesur | 42.0 | |||
| Ampla | 111.2 | |||
| Coelce | 102.1 | |||
| Codensa | 48.8 | |||
| Edelnor | 21.6 | |||
26
Table of Contents
| • | enhance earnings through expansion of our unregulated client base; | ||
| • | reduce our exposure to hydrological risk with commercial policies that reduce contracted sales to a level that may be satisfied with a 95% of hydrological certainty, thus increasing sales in the spot markets; | ||
| • | improve our operating margins by reducing the operating costs of our existing businesses; and | ||
| • | take advantage of the continued demographic growth in the regions where we operate. |
| • | reducing energy losses associated with distribution businesses over the long term; | ||
| • | building and operating efficient generation facilities; | ||
| • | implementing proprietary billing and accounts receivable management systems; | ||
| • | increasing workforce productivity while maintaining good labor relations; | ||
| • | operating under a range of tariff and regulatory frameworks that reward efficient operations; and | ||
| • | maximizing our return on actively managed subsidiaries. |
27
Table of Contents
| Year ended December 31, | ||||||||||||||||||||||||
| 2005 | 2006 | 2007 | ||||||||||||||||||||||
| (GWh) | % | (GWh) | % | GWh | % | |||||||||||||||||||
| Hydroelectric generation | 41,675 | 77.07 | 42,858 | 74.61 | 36,575 | 67.18 | ||||||||||||||||||
| Thermal generation | 12,401 | 23.93 | 14,581 | 25.39 | 17,862 | 32.81 | ||||||||||||||||||
| Other Sources (wind) | 0 | 0 | 0 | 0 | 3 | 0.01 | ||||||||||||||||||
Total generation | 54,076 | 100 | 57,439 | 100 | 54,440 | 100 | ||||||||||||||||||
28
Table of Contents
| Year ended December 31, | ||||||||||||
| 2005 | 2006 | 2007 | ||||||||||
| Endesa | 2,754 | 2,754 | 3,034 | |||||||||
| Pehuenche(1) | 695 | 695 | 699 | |||||||||
| Pangue | 467 | 467 | 467 | |||||||||
| San Isidro | 379 | 379 | 379 | |||||||||
| Celta | 182 | 182 | 182 | |||||||||
| Eco | — | — | 18 | |||||||||
| Total | 4,477 | 4,477 | 4,779 | |||||||||
| (1) | The installed capacity was certified during 2007 by Bureau Veritas, according to Norm 038 of Endesa Chile. |
| Year ended December 31, | ||||||||||||
| 2005 | 2006 | 2007 | ||||||||||
| Endesa | 10,903 | 11,642 | 11,093 | |||||||||
| Pehuenche | 4,060 | 4,345 | 3,437 | |||||||||
| Pangue | 2,241 | 2,432 | 1,351 | |||||||||
| San Isidro | 1,178 | 802 | 1,956 | |||||||||
| Celta | 383 | 751 | 933 | |||||||||
| Eco | 3 | |||||||||||
| Total | 18,765 | 19,973 | 18,773 | |||||||||
| Year ended December 31, | ||||||||||||
| 2006 | 2007 | |||||||||||
| Reservoir | Reservoir | Change | ||||||||||
| (GWh) | (GWh) | % | ||||||||||
| Laja | 4,754 | 3,028 | (36.3 | ) | ||||||||
| Maule | 1,573 | 1,307 | (16.9 | ) | ||||||||
| Chapo | 577 | 119 | (79.3 | ) | ||||||||
| Colbún | 533 | 283 | (46.9 | ) | ||||||||
| Invernada | 315 | 116 | (63.1 | ) | ||||||||
| Rapel | 72 | 53 | (26.3 | ) | ||||||||
| Melado | 15 | 6 | (60.0 | ) | ||||||||
| Ralco | 531 | 147 | 72.3 | |||||||||
| Total Reservoir | 8,370 | 5,059 | (39.6 | ) | ||||||||
29
Table of Contents
| Year ended December 31, | ||||||||||||||||||||||||
| 2005 | 2006 | 2007 | ||||||||||||||||||||||
| Generation | Generation | Generation | ||||||||||||||||||||||
| (GWh) | % | (GWh) | % | (GWh) | % | |||||||||||||||||||
| Hydroelectric generation | 15,762 | 84.0 | 17,148 | 85.9 | 13,179 | 70.2 | ||||||||||||||||||
| Thermal generation | 3,003 | 16.0 | 2,825 | 14.1 | 5,591 | 29.8 | ||||||||||||||||||
| Other sources (wind) | 0 | 0.0 | 0 | 0.0 | 3 | 0.0 | ||||||||||||||||||
| Total generation | 18,765 | 100.0 | 19,973 | 100.0 | 18,773 | 100.0 | ||||||||||||||||||
30
Table of Contents
| System | 2005 | 2006 | 2007 | Change % | ||||||||||||
| SIC | 35,900 | 38,259 | 39,982 | 4.5 | % | |||||||||||
| SING | 11,546 | 12,027 | 12,674 | 5.4 | % | |||||||||||
| Years ended December 31, | ||||||||||||||||||||||||
| 2005 | 2006 | 2007 | ||||||||||||||||||||||
| Sales | % | Sales | % | Sales | % | |||||||||||||||||||
| (GWh) | of Volume | (GWh) | of Volume | (GWh) | of Volume | |||||||||||||||||||
| Electricity production | 18,764 | 89.2 | 19,973 | 93.8 | 18,773 | 94.7 | ||||||||||||||||||
| Electricity purchases | 2,268 | 10.8 | 1,317 | 6.2 | 1,042 | 5.3 | ||||||||||||||||||
Total(1) | 21,032 | 100.0 | 21,290 | 100.0 | 19,815 | 100.0 | ||||||||||||||||||
| (1) | Total GWh production plus purchases differs from GWh sales due to transmission losses, as power plant consumption and technical losses have already been deducted. |
31
Table of Contents
| Years ended December 31 | ||||||||||||||||||||||||
| 2005 | 2006 | 2007 | ||||||||||||||||||||||
| Sales | % of Sales | Sales | % of Sales | Sales | % of Sales | |||||||||||||||||||
| (GWh) | Volume | (GWh) | Volume | (GWh) | Volume | |||||||||||||||||||
| Regulated customers(1) | 10,575 | 51.0 | 10,756 | 51.4 | 11,502 | 59.9 | ||||||||||||||||||
| Non-Regulated customers | 4,797 | 23.1 | 5,176 | 24.7 | 5,281 | 27.5 | ||||||||||||||||||
| Electricity pool market sales | 5,358 | 25.8 | 4,991 | 23.9 | 2,430 | 12.6 | ||||||||||||||||||
| Total electricity sales | 20,731 | 100.0 | 20,923 | 100.0 | 19,212 | 100.0 | ||||||||||||||||||
| (1) | Includes sales to distribution companies due to Resolution 88. |
| % of energy | ||||||||||||||||||||
| Chilectra B1 | Chilectra B2 | Chilectra B3 | Total | allocated | ||||||||||||||||
| Endesa Chile | 1,700 | — | 1,500 | 3,200 | 56.1 | % | ||||||||||||||
| Colbún | 500 | 1,000 | 1,000 | 2,500 | 43.9 | % | ||||||||||||||
| Total | 2,200 | 1,000 | 2,500 | 5,700 | 100.0 | % | ||||||||||||||
32
Table of Contents
| As of December 31, | ||||||||||||
| 2005 | 2006(1) | 2007 | ||||||||||
Endesa Costanera | ||||||||||||
| Costanera (steam turbine) | 1,131 | 1,138 | 1,138 | |||||||||
| Costanera (combined cycle II) | 851 | 859 | 859 | |||||||||
| Central Termoélectrica Buenos Aires (combined cycle I) | 322 | 322 | 327 | |||||||||
El Chocón | ||||||||||||
| El Chocón (hydroelectric) | 1,200 | 1,200 | 1,200 | |||||||||
| Arroyito (hydroelectric) | 120 | 120 | 120 | |||||||||
| Total installed capacity | 3,624 | 3,639 | 3,644 | |||||||||
| (1) | The installed capacity was certified by Bureau Veritas, according to Norm 038 of Endesa Chile. |
33
Table of Contents
| Year ended December 31, | ||||||||||||||||||||||||
| 2005 | 2006 | 2007 | ||||||||||||||||||||||
| (GWh) | % | (GWh) | % | (GWh) | % | |||||||||||||||||||
| Hydroelectric generation (El Chocón) | 3,931 | 31.9 | 5,041 | 36.7 | �� | 3,696 | 30.5 | |||||||||||||||||
| Thermal generation (Endesa Costanera) | 8,402 | 68.1 | 8,709 | 63.3 | 8,421 | 69.5 | ||||||||||||||||||
| Total generation | 12,333 | 100.0 | 13,750 | 100.0 | 12,117 | 100.0 | ||||||||||||||||||
| 2005 | 2006 | 2007 | ||||||||||||||||||||||
| (GWh) | % | (GWh) | % | (GWh) | % | |||||||||||||||||||
| Electricity generation | 12,333 | 97.6 | 13,750 | 98.2 | 12,117 | 97.1 | ||||||||||||||||||
| Electricity purchases | 308 | 2.4 | 256 | 1.8 | 367 | 2.9 | ||||||||||||||||||
| Total(1) | 12,640 | 100.0 | 14,006 | 100.0 | 12,484 | 100.0 | ||||||||||||||||||
| (1) | Energy generation plus energy purchases differ from electricity sales due to power plant consumption. |
34
Table of Contents
| Years ended December 31, | ||||||||||||||||||||||||
| 2005 | 2006 | 2007 | ||||||||||||||||||||||
| % of Sales | % of Sales | % of Sales | ||||||||||||||||||||||
| (GWh) | Volume | (GWh) | Volume | (GWh) | Volume | |||||||||||||||||||
| Contracted sales | 2,328 | 18.5 | 2,116 | 15.2 | 2,364 | 19.1 | ||||||||||||||||||
| Non-contracted | 10,251 | 81.5 | 11,810 | 84.8 | 10,042 | 80.9 | ||||||||||||||||||
| Total electricity sales | 12,579 | 100.0 | 13,926 | 100.0 | 12,406 | 100.0 | ||||||||||||||||||
35
Table of Contents
| (MW) | ||||||||||||
| 2005 | 2006 | 2007 | ||||||||||
| Cachoeira Dourada | 658 | 658 | 665 | |||||||||
| Endesa Fortaleza | 319 | 322 | 322 | |||||||||
Total installed capacity | 977 | 980 | 987 | |||||||||
| Years ended December 31, | ||||||||||||||||||||||||
| 2005 | 2006 | 2007 | ||||||||||||||||||||||
| (GWh) | % | (GWh) | % | (GWh) | % | |||||||||||||||||||
| Cachoeira Dourada | 3,559 | 91.1 | 4,241 | 94.5 | 3,888 | 98.3 | ||||||||||||||||||
| Endesa Fortaleza | 347 | 8.9 | 248 | 5.5 | 66 | 1.7 | ||||||||||||||||||
Total | 3,906 | 100.0 | 4,489 | 100.0 | 3,954 | 100.0 | ||||||||||||||||||
| Years ended December 31, | ||||||||||||||||||||||||
| 2005 | 2006 | 2007 | ||||||||||||||||||||||
| % of Sales | % of Sales | % of Sales | ||||||||||||||||||||||
| (GWh) | Volume | (GWh) | Volume | (GWh) | Volume | |||||||||||||||||||
| Contracted sales | 3,494.0 | 90.3 | 3,284.9 | 78.6 | 3,884 | 83.6 | ||||||||||||||||||
| Non-contracted sales | 373.0 | 9.7 | 892.3 | 21.4 | 760 | 16.4 | ||||||||||||||||||
| Total electricity sales | 3,867.0 | 100.0 | 4,177.2 | 100.0 | 4,644 | 100.0 | ||||||||||||||||||
36
Table of Contents
| Years ended December 31, | ||||||||||||
| 2005 | 2006 | 2007 | ||||||||||
| Installed capacity (MW) | 319 | 322 | 322 | |||||||||
| Electricity sales (GWh) | 2,690 | 2,690 | 2,705 | |||||||||
| Years ended December 31, | ||||||||||||||||||||||||
| 2005 | 2006 | 2007 | ||||||||||||||||||||||
| % of Sales | % of Sales | % of Sales | ||||||||||||||||||||||
| (GWh) | Volume | (GWh) | Volume | (GWh) | Volume | |||||||||||||||||||
| Contracted sales | 2,690.0 | 100.0 | 2,690.0 | 100.0 | 2,690.0 | 99.4 | ||||||||||||||||||
| Non-contracted sales | 0.0 | 0.0 | 0.0 | 0.0 | 15.0 | 0.6 | ||||||||||||||||||
| Total electricity sales | 2,690.0 | 100.0 | 2,690.0 | 100.0 | 2,705.0 | 100.0 | ||||||||||||||||||
| Years ended December 31, | ||||||||||||
| 2005 | 2006 | 2007 | ||||||||||
| (MW) | ||||||||||||
| Emgesa | ||||||||||||
| Guavio (hydro) | 1,164 | 1,163 | 1,213 | |||||||||
| Cadena Nueva (hydro) | 601 | 601 | 601 | |||||||||
| Betania (hydro) | 541 | 541 | 541 | |||||||||
| Termozipa (thermal) | 236 | 236 | 236 | |||||||||
| Cartagena (thermal) | 0 | 142 | 142 | |||||||||
| Minor Plants (hydro)(1) | 116 | 96 | 96 | |||||||||
| Total installed capacity | 2,657 | 2,779 | 2,829 | |||||||||
| (1) | As of December 31, 2007 Emgesa owned and operated five minor plants:Charquito, El Limonar, La Tinta, Tequendama and La Junca. |
37
Table of Contents
| (GWh) | ||||||||||||
| 2005 | 2006 | 2007 | ||||||||||
| Emgesa | 9,763 | 10,360 | 11,942 | |||||||||
| Betania(1) | 2,101 | 2,204 | 0 | |||||||||
| Total | 11,864 | 12,564 | 11,942 | |||||||||
| (1) | Since September 2007, Betania and Emgesa were merged into Betania. |
| Year ended December 31, | ||||||||||||||||||||||||
| 2005 | 2006 | 2007 | ||||||||||||||||||||||
| (GWh) | % | (GWh) | % | (GWh) | % | |||||||||||||||||||
| Electricity production | 11,864 | 78.1 | 12,564 | 81.3 | 11,942 | 75.8 | ||||||||||||||||||
| Electricity purchases | 3,321 | 21.9 | 2,883 | 18.7 | 3,814 | 24.2 | ||||||||||||||||||
| Total(1) | 15,185 | 100.0 | 15,447 | 100.0 | 15,756 | 100.0 | ||||||||||||||||||
| (1) | Energy production plus energy purchases exceed electricity sales due to power plant pump consumption. |
38
Table of Contents
| Years ended December 31, | ||||||||||||||||||||||||
| 2005 | 2006 | 2007 | ||||||||||||||||||||||
| Sales | % of Sales | Sales | % of Sales | Sales | % of Sales | |||||||||||||||||||
| (GWh) | Volume | (GWh) | Volume | (GWh) | Volume | |||||||||||||||||||
| Contracted sales | 9,800 | 65.0 | 9,687 | 63.2 | 10,539 | 67.5 | ||||||||||||||||||
| Non-contracted sales | 5,277 | 35.0 | 5,640 | 36.8 | 5,074 | 32.5 | ||||||||||||||||||
| Total electricity sales | 15,077 | 100.0 | 15,327 | 100.0 | 15,613 | 100.0 | ||||||||||||||||||
| Years ended December 31, | ||||||||||||
| 2005 | 2006 | 2007 | ||||||||||
| (MW) | ||||||||||||
Edegel S.A. | ||||||||||||
| Huinco (hydroelectric) | 247 | 247 | 247 | |||||||||
| Matucana (hydroelectric) | 129 | 129 | 129 | |||||||||
| Callahuanca (hydroelectric) | 75 | 75 | 80 | |||||||||
| Moyopampa (hydroelectric) | 65 | 65 | 65 | |||||||||
| Huampani (hydroelectric) | 30 | 30 | 30 | |||||||||
| Yanango (hydroelectric) | 43 | 43 | 43 | |||||||||
| Chimay (hydroelectric) | 151 | 151 | 151 | |||||||||
| Santa Rosa (thermal) | 229 | 229 | 231 | |||||||||
| Ventanilla (thermal)(2) | 0 | 457 | 493 | |||||||||
| Total installed capacity | 969 | 1,426 | 1,468 | |||||||||
| (1) | During 2007 Ventanilla increased in 36 MW its installed capacity due to the control of energy losses. | |
| (2) | Edegel includes Ventanilla’s generation since January 2006. |
39
Table of Contents
| Years ended December 31, | ||||||||||||||||||||||||
| 2005 | 2006 | 2007 | ||||||||||||||||||||||
| (GWh) | % | (GWh) | % | (GWh) | % | |||||||||||||||||||
| Hydroelectric generation | 4,095 | 90.7 | 4,197 | 63.0 | 4,385 | 57.3 | ||||||||||||||||||
| Thermal generation(1) | 422 | 9.3 | 2,465 | 37.0 | 3,270 | 42.7 | ||||||||||||||||||
| Total generation | 4,516 | 100.0 | 6,662 | 100.0 | 7,654 | 100.0 | ||||||||||||||||||
| (1) | Since 2006 includes Ventanilla’s generation. |
| Years ended December 31, | ||||||||||||||||||||||||
| 2005 | 2006 | 2007 | ||||||||||||||||||||||
| (GWh) | % | (GWh) | % | (GWh) | % | |||||||||||||||||||
| Electricity generation | 4,516 | 94.8 | 6,662 | 96.1 | 7,654 | 93.9 | ||||||||||||||||||
| Electricity purchases | 246 | 5.2 | 274 | 3.9 | 499 | 6.1 | ||||||||||||||||||
| Total(1) | 4,762 | 100.0 | 6,935 | 100.0 | 8,153 | 100.0 | ||||||||||||||||||
| (1) | Since 2006 includes Ventanilla’s generation. |
| Year ended December 31, | ||||||||||||||||||||||||
| 2005 | 2006 | 2007 | ||||||||||||||||||||||
| Sales | % of Sales | Sales | % of Sales | Sales | % of Sales | |||||||||||||||||||
| (GWh) | Volume | (GWh) | Volume | (GWh) | Volume | |||||||||||||||||||
| Contracted sales(2) | 3,766 | 81.9 | 6,145 | 90.8 | 7,569 | 94.7 | ||||||||||||||||||
| Non-contracted sales | 834 | 18.1 | 621 | 9.2 | 424 | 5.3 | ||||||||||||||||||
| Total electricity sales | 4,600 | 100.0 | 6,766 | 100.0 | 7,994 | 100.0 | ||||||||||||||||||
| (1) | Since 2006 figures include Ventanilla’s sales. | |
| (2) | Includes the sales to distributors without contract. |
40
Table of Contents
41
Table of Contents
42
Table of Contents
43
Table of Contents
44
Table of Contents
| • | installing their own lines directly from a generation company; |
| • | arranging a supply contract with a generation company, which pays a toll to a transmission company and a distribution company; |
| • | negotiating a contract with a distribution company; and |
| • | generating their own electricity. |
45
Table of Contents
46
Table of Contents
47
Table of Contents
48
Table of Contents
49
Table of Contents
50
Table of Contents
51
Table of Contents
52
Table of Contents
53
Table of Contents
54
Table of Contents
55
Table of Contents
56
Table of Contents
57
Table of Contents
58
Table of Contents
59
Table of Contents
60
Table of Contents
61
Table of Contents
62
Table of Contents
63
Table of Contents
64
Table of Contents
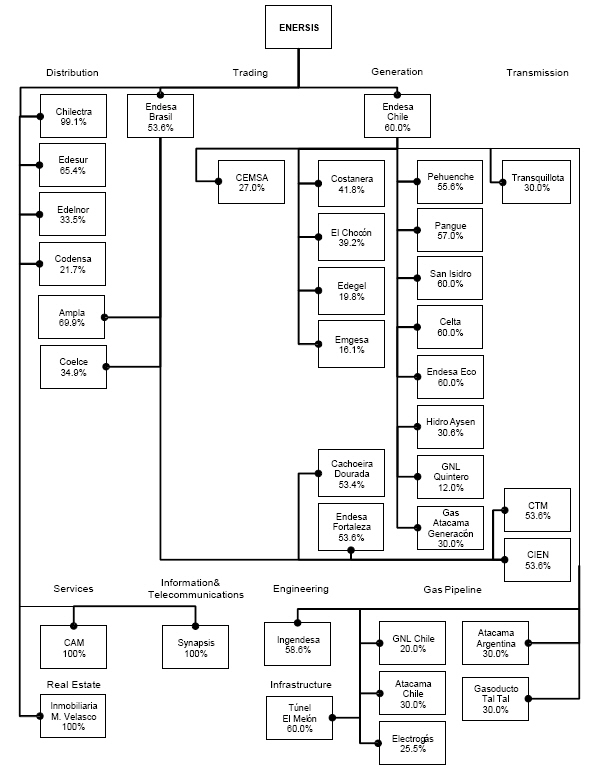
| Consolidated | ||||||||||||
| % Economic | Assets of Each | Operating Income | ||||||||||
| Ownership of | Main Subsidiary | of Each Main | ||||||||||
| Main Subsidiaries | on a Stand-alone | Subsidiary on a | ||||||||||
| Principal Subsidiaries and Country of Operations | by Enersis | Basis | Stand-alone Basis | |||||||||
| (in billions of Ch $ except percentages) | ||||||||||||
Electricity Generation | ||||||||||||
| Endesa Chile (Chile), on a consolidated basis | 60.0 | % | 5,387.4 | 570.8 | ||||||||
Electricity Distribution | ||||||||||||
| Chilectra (Chile) | 99.1 | % | 1,244.5 | 122.1 | ||||||||
| Edesur (Argentina) | 65.4 | % | 630.5 | 29.2 | ||||||||
| Edelnor (Peru) | 33.5 | % | 321.7 | 42.5 | ||||||||
| Codensa (Colombia) | 21.7 | % | 991.6 | 155.8 | ||||||||
Endesa Brasil, Electricity distribution, generation and transmission | ||||||||||||
| Endesa Brasil Consolidated (Brazil) | 53.6 | % | 3,167.6 | 326.8 | ||||||||
| Coelce (Brazil) | 34.9 | % | 827.4 | 77.7 | ||||||||
| Ampla (Brazil) | 69.9 | % | 1,321.0 | 135.5 | ||||||||
| Cachoeira Dourada (Brazil) | 53.4 | % | 369.7 | 50.8 | ||||||||
| Endesa Fortaleza (Brazil) | 53.6 | % | 248.9 | 44.4 | ||||||||
| CIEN (Brazil) | 53.6 | % | 407.6 | 23.2 | ||||||||
Other Businesses | ||||||||||||
| IMV (Chile) | 100.0 | % | 83.1 | 4.5 | ||||||||
| Synapsis (Chile) | 100.0 | % | 29.3 | 4.6 | ||||||||
| CAM (Chile) | 100.0 | % | 102.9 | 12.1 | ||||||||
65
Table of Contents
66
Table of Contents
67
Table of Contents
| Country/Company | Power Plant Name | Power Plant Type(1) | 2006 | 2007 | ||||||||
| MW(2) | ||||||||||||
Argentina | ||||||||||||
| Endesa Costanera | Total | 2,319 | 2,324 | |||||||||
| Costanera Steam Turbine | Steam Turbine/Natural Gas + Fuel Oil(3) | 1,138 | 1,138 | |||||||||
| Costanera Combined Cycle | Combined Cycle/Natural Gas + Diesel Oil(3) | 859 | 859 | |||||||||
| Central Buenos Aires | Combined Cycle/Natural Gas(3) | 322 | 327 | |||||||||
| El Chocón | Total | 1,320 | 1,320 | |||||||||
| Chocón | Reservoir | 1,200 | 1,200 | |||||||||
| Arroyito | Pass Through | 120 | 120 | |||||||||
Total Capacity in Argentina | 3,639 | 3,644 | ||||||||||
Brazil | ||||||||||||
| Cachoeira Dourada | Cachoeira Dourada | Pass Through | 658 | 665 | ||||||||
| Endesa Fortaleza | CGTF | Combined Cycle/Natural Gas | 322 | 322 | ||||||||
Total Capacity in Brazil | 980 | 987 | ||||||||||
Chile | ||||||||||||
| Endesa Chile | Total | 2,754 | 3,034 | |||||||||
| Total Hydroelectric | 2,254 | 2,286 | ||||||||||
| Rapel | Reservoir | 377 | 377 | |||||||||
| Cipreses | Reservoir | 106 | 106 | |||||||||
| El Toro | Reservoir | 450 | 450 | |||||||||
| Los Molles | Pass Through | 18 | 18 | |||||||||
| Sauzal | Pass Through | 77 | 77 | |||||||||
| Sauzalito | Pass Through | 12 | 12 | |||||||||
| Isla | Pass Through | 68 | 68 | |||||||||
| Antuco | Pass Through | 320 | 320 | |||||||||
| Abanico | Pass Through | 136 | 136 | |||||||||
| Ralco | Reservoir | 690 | 690 | |||||||||
| Palmucho | Pass Through(4) | — | 32 | |||||||||
| Total Thermal | 500 | 748 | ||||||||||
| Huasco | Steam Turbine/Coal | 16 | 16 | |||||||||
| Bocamina | Steam Turbine/Coal | 128 | 128 | |||||||||
| Diego de Almagro(5) | Gas Turbine/ Diesel Oil | 47 | 47 | |||||||||
| Huasco | Gas Turbine/IFO 180 Oil | 64 | 64 | |||||||||
| Taltal | Gas Turbine/Natural Gas/Diesel Oil | 245 | 245 | |||||||||
| San Isidro II | Gas Turbine/ Diesel Oil(6) | — | 248 | |||||||||
| Pehuenche | Total | 695 | 699 | |||||||||
| Pehuenche | Reservoir(3) | 566 | 570 | |||||||||
| Curillinque | Pass Through | 89 | 89 | |||||||||
| Loma Alta | Pass Through | 40 | 40 | |||||||||
| Pangue | Pangue | Reservoir | 467 | 467 | ||||||||
| San Isidro | San Isidro | Combined Cycle /Natural Gas+Diesel Oil | 379 | 379 | ||||||||
| Celta | Total | 182 | 182 | |||||||||
| Tarapacá | Steam Turbine/Coal | 158 | 158 | |||||||||
| Tarapacá | Gas Turbine/Diesel Oil | 24 | 24 | |||||||||
| Endesa Eco | Canela | Wind Farm(7) | — | 18 | ||||||||
Total Capacity in Chile | 4,477 | 4,779 | ||||||||||
68
Table of Contents
| Country/Company | Power Plant Name | Power Plant Type(1) | 2006 | 2007 | |||||||||
| MW(2) | |||||||||||||
Colombia | |||||||||||||
| Emgesa | Total | 2,238 | 2,829 | ||||||||||
| Guavio(9) | Reservoir | 1,163 | 1,213 | ||||||||||
| Paraíso | Reservoir | 276 | 276 | ||||||||||
| La Guaca | Pass Through | 325 | 325 | ||||||||||
| Termozipa | Steam Turbine/Coal | 236 | 236 | ||||||||||
| Cartagena(14) | Steam Turbine/ Natural Gas + Diesel Oil | 142 | 142 | ||||||||||
| Minor plants(10) | Pass Through | 96 | 96 | ||||||||||
| Betania(8) | Reservoir | 541 | |||||||||||
| Betania(8) | Betania | Reservoir | 541 | ||||||||||
Total Capacity in Colombia | 2,779 | 2,829 | |||||||||||
Peru | |||||||||||||
| Edegel | Total | 1,426 | 1,469 | ||||||||||
| Huinco | Pass Through | 247 | 247 | ||||||||||
| Matucana | Pass Through | 129 | 129 | ||||||||||
| Callahuanca (16) | Pass Through | 75 | 80 | ||||||||||
| Moyopampa | Pass Through | 65 | 65 | ||||||||||
| Huampani | Pass Through | 30 | 30 | ||||||||||
| Yanango | Pass Through | 43 | 43 | ||||||||||
| Chimay | Pass Through | 151 | 151 | ||||||||||
| Santa Rosa | Gas Turbine/Diesel Oil(3) | 229 | 231 | ||||||||||
| Ventanilla(11)(12) | Combined Cycle/Natural Gas | 457 | 493 | ||||||||||
Total Capacity in Peru | 1,426 | 1,469 | |||||||||||
Total Enersis | 13,302 | 13,708 | |||||||||||
| (1) | “Reservoir” and “pass-through” refer to a hydroelectric plant that uses a dam or a river, respectively, to move the turbines which generate electricity. “Steam” refers to the technology of a thermal power plant that uses natural gas, coal, diesel or fuel oil to produce steam which moves the turbines to generate electricity. “Gas Turbine” (TG) or “Open Cycle” refers to the technology of a thermal power plant that uses either diesel or natural gas to produce gas that moves the turbines to generate electricity. “Combined Cycle” refers to the technology of a thermal power plant that uses natural gas, diesel oil or fuel oil to generate gas that moves the turbines to generate electricity and then recuperates the gas that escapes from that process to generate steam to move another turbine. “Wind Farm” refers to the technology that transforms the kinetic energy of wind into electricity. | |
| (2) | Installed capacity is defined as the maximum MW capacity of generation units, under specific technical conditions and characteristics, in most cases confirmed by satisfaction guarantee tests performed by equipment suppliers certified during 2006 and 2007 by Bureau Veritas according to the Norm 038 of Endesa Chile, “Definition of the maximum power in Hydroelectric and Thermoelectric plants of Endesa Chile.” Figures may differ from installed capacity declared to regulating authorities and customers in each country, according to criteria defined by each authority and corresponding contractual frameworks. | |
| (3) | Certified by Bureau Veritas. | |
| (4) | Palmucho plant began commercial operations on November 28, 2007. | |
| (5) | Includes one additional unit of Diego de Almagro (23 MW), which Endesa Chile rents from Codelco since 2001. | |
| (6) | San Isidro II plant began commercial operations in open cycle on April 23, 2007. | |
| (7) | Canela plant (wind farm) began its commercial operation on December 27, 2007. | |
| (8) | During 2007, Emgesa was merged into Betania, which further changed its name to Emgesa. | |
| (9) | In 2007 the 5 units of the Guavio plant were repowered (240 MW each). | |
| (10) | At December 31, 2007 Emgesa owned and operated five minor plants:Charquito, El Limonar, La Tinta, TequendamaandLa Junta. | |
| (11) | During 2006, Edegel and Etevensa merged and Edegel added Ventanilla to its generation assets. | |
| (12) | In 2007, the regulator notified new maximum capacity with additional fire of the Ventanilla plant. |
69
Table of Contents
| Concession Area | Transmission | |||||||||||||
| Location | (km2) | Lines (km)(1) | ||||||||||||
| 2006 | 2007 | |||||||||||||
| Chilectra | Chile | 2,118 | 355 | 355 | ||||||||||
| Edesur | Argentina | 3,309 | 1,173 | 1,185 | ||||||||||
| Edelnor | Peru | 2,440 | 419 | 419 | ||||||||||
| Ampla | Brazil | 32,615 | 2,303 | 2,303 | ||||||||||
| Coelce | Brazil | 146,817 | 3,879 | 3,979 | ||||||||||
| Codensa | Colombia | 14,087 | 1,149 | 1,262 | ||||||||||
Total | 201,386 | 9,277 | 9,503 | |||||||||||
| (1) | The transmission lines consists of circuits, with voltages in the range of 27 kV - 220 kV. |
| 2006 | 2007 | |||||||||||||||||||||||
| Number of | Number of | Capacity | Number of | Number of | Capacity | |||||||||||||||||||
| Sub-stations | Transformers | (MVA) | Sub-stations | Transformers | (MVA) | |||||||||||||||||||
| Chilectra | 53 | 143 | 6,330 | 53 | 143 | 6,402 | ||||||||||||||||||
| Edesur | 63 | 164 | 10,442 | 64 | 170 | 11,222 | ||||||||||||||||||
| Edelnor | 28 | 61 | 2,127 | 28 | 60 | 2,197 | ||||||||||||||||||
| Ampla | 115 | 225 | 4,199 | 115 | 227 | 4,349 | ||||||||||||||||||
| Coelce | 93 | 148 | 2,065 | 94 | 150 | 2,101 | ||||||||||||||||||
| Codensa | 60 | 198 | 6,534 | 61 | 206 | 7,347 | ||||||||||||||||||
Total | 412 | 939 | 31,697 | 415 | 956 | 33,618 | ||||||||||||||||||
| (2) | Voltage of these transformers is in the range of 500 kV (high voltage) and 7 kV (low voltage). |
| 2006 | 2007 | |||||||||||||||
| Medium | Low | Medium | Low | |||||||||||||
| Voltage | Voltage | Voltage | Voltage | |||||||||||||
| (km) | (km) | (km) | (km) | |||||||||||||
| Chilectra | 4,614 | 9,396 | 4,681 | 9,637 | ||||||||||||
| Edesur | 6,885 | 15,549 | 6,841 | 15,639 | ||||||||||||
| Edelnor | 3,289 | 17,116 | 3,355 | 17,611 | ||||||||||||
| Ampla | 28,996 | 16,142 | 30,097 | 16,526 | ||||||||||||
| Coelce | 57,558 | 34,587 | 62,597 | 39,564 | ||||||||||||
| Codensa | 17,711 | 21,912 | 18,013 | 21,987 | ||||||||||||
Total | 119,053 | 114,702 | 125,584 | 120,964 | ||||||||||||
| (3) | Medium voltage lines: 7,000 V – 34,500 V; Low voltage lines: 380V-110 V. |
70
Table of Contents
| 2006 | 2007 | |||||||||||||||
| Number of | Capacity | Number of | Capacity | |||||||||||||
| Transformers | (MVA) | Transformers | (MVA) | |||||||||||||
| Chilectra | 26,822 | 5,260 | 27,315 | 5,627 | ||||||||||||
| Edesur | 23,254 | 4,801 | 23,587 | 4,935 | ||||||||||||
| Edelnor | 9,216 | 1,149 | 9,326 | 1,226 | ||||||||||||
| Ampla | 93,293 | 3,235 | 98,001 | 3,390 | ||||||||||||
| Coelce | 97,529 | 3,681 | 105,887 | 3,736 | ||||||||||||
| Codensa | 60,168 | 7,145 | 61,339 | 7,323 | ||||||||||||
Total | 310,282 | 25,271 | 325,455 | 26,236 | ||||||||||||
| (4) | Voltage of these transformers ranges between 34,500 V (high voltage) and 110 V (low voltage). |
71
Table of Contents
72
Table of Contents
73
Table of Contents
| • | the foreseeable life of the business and the expectation of future benefits associated with the business or with unidentifiable assets; | ||
| • | expected actions by competitors and potential competitors; and | ||
| • | legal, regulatory, or contractual provisions affecting the useful life. |
74
Table of Contents
| Year ended December 31, | ||||||||
| 2006 | 2007 | |||||||
| (in million of Ch$) | ||||||||
| Model using internal data(1) | 10,293.7 | 6,108.4 | ||||||
| Model using external data only | 0 | 0 | ||||||
| (1) | The model using internal data also relies on external data. |
75
Table of Contents
| Year ended December 31, | ||||||||
| 2006 | 2007 | |||||||
| (increase in millions of Ch$) | ||||||||
| Projected benefit obligation | 32,973 | 36,781 | ||||||
| Year ended December 31, | ||||||||
| 2006 | 2007 | |||||||
| (increase in millions of Ch$) | ||||||||
| Accumulated postretirement benefit obligation | 4,623 | 5,019 | ||||||
76
Table of Contents
77
Table of Contents
December 31, 2006 and December 31, 2007
| • | Operating income rose by Ch$123.9 billion, or 11.0%, to Ch$1,255.6 billion in 2007. | ||
| • | Energy demand increased in 2007 by the following percentages in the countries where our subsidiaries operate: |
| Chile | 4.0 | % | ||
| Argentina | 5.2 | % | ||
| Brazil | 4.8 | % | ||
| Colombia | 4.0 | % | ||
| Peru | 10.7 | % |
| • | Physical sales and the number of customers continued to increase in the distribution business, by 5.7% and 3.4%, respectively, in 2007. Aggregate energy losses remained at 11.2%. |
| Years ended December 31, | ||||||||||||||||
| 2006 | 2007 | Change | % Change | |||||||||||||
| (in millions of Ch$) | ||||||||||||||||
Distribution Business | ||||||||||||||||
| Chilectra and Subsidiaries (Chile) | 125,806 | 122,105 | -3,701 | -2.9 | % | |||||||||||
| Edesur (Argentina) | -4,378 | 29,179 | 33,557 | n.a. | ||||||||||||
| Distrilima/Edelnor (Peru) | 41,434 | 42,482 | 1,048 | 2.5 | % | |||||||||||
| Ampla (Brazil) | 102,701 | 135,536 | 32,835 | 32.0 | % | |||||||||||
| Investluz/Coelce (Brazil) | 92,954 | 77,673 | -15,281 | -16.4 | % | |||||||||||
| Codensa (Colombia) | 145,368 | 155,820 | 10,452 | 7.2 | % | |||||||||||
Total operating income from distribution business | 503,885 | 562,795 | 58,910 | 11.7 | % | |||||||||||
Generation Business | ||||||||||||||||
| Endesa and subsidiaries (Chile) | 309,807 | 333,642 | 23,835 | 7.7 | % | |||||||||||
| Endesa Costanera (Argentina) | 5,254 | 387 | -4,867 | -92.6 | % | |||||||||||
| El Chocón (Argentina) | 32,552 | 25,304 | -7,248 | -22.3 | % | |||||||||||
| Cachoeira Dourada (Brazil) | 31,733 | 50,815 | 19,082 | 60.1 | % | |||||||||||
| Endesa Fortaleza (Brazil) | 56,418 | 44,424 | -11,994 | -21.3 | % | |||||||||||
| Emgesa (Colombia) | 130,309 | 160,271 | 29,962 | 23.0 | % | |||||||||||
| Edegel (Peru) | 59,646 | 46,153 | -13,493 | -22.6 | % | |||||||||||
Total operating income from generation business | 625,719 | 660,996 | 35,277 | 5.6 | % | |||||||||||
Transmission Business | ||||||||||||||||
| CIEN (Brazil) | -814 | 23,180 | 23,994 | n.a. | ||||||||||||
Total operating income from transmission business | -814 | 23,180 | 23,994 | n.a. | ||||||||||||
78
Table of Contents
| Years ended December 31, | ||||||||||||||||
| 2006 | 2007 | Change | % Change | |||||||||||||
| (in millions of Ch$) | ||||||||||||||||
| Non-electricity subsidiaries(1) | 182 | 3,465 | 3,283 | 1,803.8 | % | |||||||||||
Total operating income from non-electricity subsidiaries in Chile | 182 | 3,465 | 3,283 | 1,803.8 | % | |||||||||||
| Less: intercompany transactions | 2,659 | 5,131 | 2,472 | 93.0 | % | |||||||||||
Total operating income | 1,131,631 | 1,255,567 | 123,936 | 11.0 | % | |||||||||||
| (1) | Includes Operating Income for CAM, Synapsis, IMV, Túnel El Melón, Ingendesa, Enigesa, Enersis holding and investment vehicles. |
| Years ended December 31, | ||||||||||||||||||||||||||||||||||||||||||||||||
| (in millions of Ch$) | ||||||||||||||||||||||||||||||||||||||||||||||||
| Generation | Transmission | Distribution | Other | Interc. Transactions | Total | |||||||||||||||||||||||||||||||||||||||||||
| 2006 | 2007 | 2006 | 2007 | 2006 | 2007 | 2006 | 2007 | 2006 | 2007 | 2006 | 2007 | |||||||||||||||||||||||||||||||||||||
| Operating revenues | 1,580,736 | 1,914,801 | 154,549 | 261,370 | 2,717,257 | 2,822,626 | 268,300 | 257,558 | -564,997 | -569,679 | 4,155,845 | 4,686,676 | ||||||||||||||||||||||||||||||||||||
| Operating costs | -909,910 | -1,213,783 | -149,363 | -233,816 | -2,033,790 | -2,051,844 | -220,672 | -203,883 | 531,048 | 539,461 | -2,782,687 | -3,163,865 | ||||||||||||||||||||||||||||||||||||
| Selling and administrative expenses | -45,107 | -40,022 | -6,000 | -4,374 | -179,583 | -207,987 | -47,446 | -50,212 | 36,609 | 35,351 | -241,527 | -267,244 | ||||||||||||||||||||||||||||||||||||
Operating income | 625,719 | 660,996 | -814 | 23,180 | 503,884 | 562,795 | 182 | 3,463 | 2,660 | 5,133 | 1,131,631 | 1,255,567 | ||||||||||||||||||||||||||||||||||||
| Physical sales during | ||||||||||||||||
| Years ended December 31, | ||||||||||||||||
| 2006 | 2007 | Change | % Change | |||||||||||||
| (GWh) | ||||||||||||||||
| Endesa Chile (Chile) | 20,923 | 19,212 | -1,711 | -8.2 | % | |||||||||||
| Endesa Costanera (Argentina) | 8,736 | 8,450 | -286 | -3.3 | % | |||||||||||
| El Chocón (Argentina) | 5,191 | 3,956 | -1,235 | -23.8 | % | |||||||||||
| Edegel (Peru) | 6,766 | 7,994 | 1,228 | 18.1 | % | |||||||||||
| Emgesa (Colombia) | 15,327 | 15,613 | 286 | 1.9 | % | |||||||||||
| Cachoeira Dourada (Brazil) | 4,177 | 4,643 | 466 | 11.2 | % | |||||||||||
| Endesa Fortaleza (Brazil) | 2,690 | 2,705 | 15 | 0.6 | % | |||||||||||
| Cien (Brazil) | 6,394 | 6,232 | -162 | -2.5 | % | |||||||||||
Total | 70,204 | 68,805 | -1,399 | -2.0 | % | |||||||||||
79
Table of Contents
| Physical sales during | ||||||||||||||||
| Years ended December 31, | ||||||||||||||||
| 2006 | 2007 | Change | % Change | |||||||||||||
| (GWh) | ||||||||||||||||
| Chilectra (Chile) | 12,377 | 12,923 | 546 | 4.4 | % | |||||||||||
| Edesur (Argentina)(1) | 14,837 | 15,833 | 996 | 6.7 | % | |||||||||||
| Edelnor (Peru) | 4,874 | 5,201 | 327 | 6.7 | % | |||||||||||
| Ampla (Brazil) | 8,668 | 8,985 | 317 | 3.7 | % | |||||||||||
| Coelce (Brazil) | 6,769 | 7,227 | 458 | 6.8 | % | |||||||||||
| Codensa (Colombia)(1) | 10,755 | 11,441 | 686 | 6.4 | % | |||||||||||
Total | 58,280 | 61,610 | 3,330 | 5.7 | % | |||||||||||
| (1) | Includes toll revenues. |
| Year ended December 31, | ||||||||||||||||
| 2006 | 2007 | Change | % Change | |||||||||||||
| (in millions of Ch$) | ||||||||||||||||
Distribution Business | ||||||||||||||||
| Chilectra and Subsidiaries (Chile) | 714,164 | 801,817 | 87,653 | 12.3 | % | |||||||||||
| Edesur (Argentina) | 266,775 | 293,374 | 26,599 | 10.0 | % | |||||||||||
| Distrilima/Edelnor (Peru) | 230,127 | 214,530 | -15,597 | -6.8 | % | |||||||||||
| Ampla (Brazil) | 573,827 | 551,394 | -22,433 | -3.9 | % | |||||||||||
| Investluz/Coelce (Brazil) | 449,269 | 439,785 | -9,484 | -2.1 | % | |||||||||||
| Codensa (Colombia) | 483,097 | 521,726 | 38,629 | 8.0 | % | |||||||||||
Total operating revenues from distribution business | 2,717,259 | 2,822,626 | 105,367 | 3.9 | % | |||||||||||
Generation Business | ||||||||||||||||
| Endesa and subsidiaries (Chile) | 678,319 | 945,658 | 267,339 | 39.4 | % | |||||||||||
| Endesa Costanera (Argentina) | 186,588 | 209,224 | 22,636 | 12.1 | % | |||||||||||
| El Chocón (Argentina) | 66,248 | 55,716 | -10,532 | -15.9 | % | |||||||||||
| Cachoeira Dourada (Brazil) | 67,258 | 115,325 | 48,067 | 71.5 | % | |||||||||||
| Endesa Fortaleza (Brazil) | 107,607 | 103,414 | -4,193 | -3.9 | % | |||||||||||
| Emgesa (Colombia) | 294,088 | 318,085 | 23,997 | 8.2 | % | |||||||||||
| Edegel (Peru) | 180,628 | 167,379 | -13,249 | -7.3 | % | |||||||||||
Total operating revenues from generation business | 1,580,736 | 1,914,801 | 334,065 | 21.1 | % | |||||||||||
80
Table of Contents
| Year ended December 31, | ||||||||||||||||
| 2006 | 2007 | Change | % Change | |||||||||||||
| (in millions of Ch$) | ||||||||||||||||
Transmission Business | ||||||||||||||||
| CIEN (Brazil) | 154,549 | 261,370 | 106,821 | 69.1 | % | |||||||||||
Total operating revenues from transmission business | 154,549 | 261,370 | 106,821 | 69.1 | % | |||||||||||
| Non-electricity subsidiaries(1) | 268,298 | 257,559 | -10,739 | -4.0 | % | |||||||||||
Total operating revenues from non-electricity subsidiaries in Chile | 268,298 | 257,559 | -10,739 | -4.0 | % | |||||||||||
| Less: intercompany transactions | -564,997 | -569,680 | -4,683 | 0.8 | % | |||||||||||
Total operating revenues | 4,155,845 | 4,686,676 | 530,831 | 12.8 | % | |||||||||||
| (1) | Includes operating revenues for CAM, Synapsis, IMV, Túnel El Melón, Ingendesa, Enigesa, Enersis holding and investment vehicles. |
81
Table of Contents
82
Table of Contents
| Years ended December 31, | ||||||||
| 2006 | 2007 | |||||||
| (percentage of total costs of | ||||||||
| operations) | ||||||||
| Electricity purchases | 45.8 | % | 46.7 | % | ||||
| Depreciation and amortization | 15.7 | % | 13.0 | % | ||||
| Fuel purchases | 10.9 | % | 17.5 | % | ||||
| Operating cost and maintenance | 8.7 | % | 6.0 | % | ||||
| Transmission tolls | 5.9 | % | 5.5 | % | ||||
| Salaries | 5.4 | % | 4.9 | % | ||||
| Other expenses | 7.6 | % | 6.4 | % | ||||
| 100.0 | % | 100.0 | % | |||||
83
Table of Contents
| Years ended December 31, | ||||||||||||||||
| 2006 | 2007 | Change | % Change | |||||||||||||
| (in millions of Ch$) | ||||||||||||||||
Distribution Business | ||||||||||||||||
| Chilectra and subsidiaries (Chile) | 537,874 | 630,573 | 92,699 | 17.2 | % | |||||||||||
| Edesur (Argentina) | 232,947 | 223,049 | -9,898 | -4.2 | % | |||||||||||
| Distrilima/Edelnor (Peru) | 167,251 | 152,111 | -15,140 | -9.1 | % | |||||||||||
| Ampla (Brazil) | 452,665 | 380,606 | -72,059 | -15.9 | % | |||||||||||
| Investluz/Coelce (Brazil) | 319,503 | 315,228 | -4,275 | -1.3 | % | |||||||||||
| Codensa (Colombia) | 323,551 | 350,277 | 26,726 | 8.3 | % | |||||||||||
Total operating costs from distribution business | 2,033,791 | 2,051,844 | 18,053 | 0.9 | % | |||||||||||
Generation Business | ||||||||||||||||
| Endesa and subsidiaries (Chile) | 348,492 | 593,798 | 245,306 | 70.4 | % | |||||||||||
| Endesa Costanera (Argentina) | 178,946 | 206,331 | 27,385 | 15.3 | % | |||||||||||
| El Chocón (Argentina) | 32,568 | 29,189 | -3,379 | -10.4 | % | |||||||||||
| Cachoeira Dourada (Brazil) | 33,285 | 61,960 | 28,675 | 86.1 | % | |||||||||||
| Endesa Fortaleza (Brazil) | 49,502 | 57,384 | 7,882 | 15.9 | % | |||||||||||
| Emgesa (Colombia) | 158,854 | 152,793 | -6,061 | -3.8 | % | |||||||||||
| Edegel (Peru) | 108,263 | 112,328 | 4,065 | 3.8 | % | |||||||||||
Total operating costs from generation business | 909,910 | 1,213,783 | 303,873 | 33.4 | % | |||||||||||
Transmission Business | ||||||||||||||||
| CIEN (Brazil) | 149,363 | 233,816 | 84,453 | 56.5 | % | |||||||||||
Total operating costs from transmission business | 149,363 | 233,816 | 84,453 | 56.5 | % | |||||||||||
| Non-electricity subsidiaries(1) | 220,670 | 203,882 | -16,788 | -7.6 | % | |||||||||||
Total operating costs from non-electricity subsidiaries (Chile) | 220,670 | 203,882 | -16,788 | -7.6 | % | |||||||||||
| Less: intercompany transactions | -531,047 | -539,460 | -8,413 | 1.6 | % | |||||||||||
Total operating costs | 2,782,687 | 3,163,865 | 296,725 | 10.7 | % | |||||||||||
| (1) | Includes the operating costs of CAM, Synapsis, IMV, Túnel El Melón, Ingendesa, Enigesa, Enersis holding and the investment vehicles. |
84
Table of Contents
85
Table of Contents
| Years ended December 31, | ||||||||
| 2006 | 2007 | |||||||
| (percentage of total costs of selling and administrative expenses) | ||||||||
| General administrative expenses | 43.3 | % | 38.4 | % | ||||
| Salaries | 40.9 | % | 38.1 | % | ||||
| Uncollectible accounts | 7.7 | % | 17.3 | % | ||||
| Depreciation and amortization | 7.5 | % | 5.6 | % | ||||
| Materials and office supplies | 0.6 | % | 0.5 | % | ||||
| 100.0 | % | 100.0 | % | |||||
86
Table of Contents
| Years ended December 31, | ||||||||||||||||
| 2006 | 2007 | Change | % Change | |||||||||||||
| (in millions of Ch$) | ||||||||||||||||
Distribution Business | ||||||||||||||||
| Chilectra and subsidiaries (Chile) | 50,484 | 49,139 | -1,345 | -2.7 | % | |||||||||||
| Edesur (Argentina) | 38,206 | 41,146 | 2,940 | 7.7 | % | |||||||||||
| Distrilima/Edelnor (Peru) | 21,442 | 19,937 | -1,505 | -7.0 | % | |||||||||||
| Ampla (Brazil) | 18,461 | 35,252 | 16,791 | 91.0 | % | |||||||||||
| Investluz/Coelce (Brazil) | 36,812 | 46,884 | 10,072 | 27.4 | % | |||||||||||
| Codensa (Colombia) | 14,178 | 15,629 | 1,451 | 10.2 | % | |||||||||||
Total selling and administrative expenses from distribution business | 179,583 | 207,987 | 28,404 | 15.8 | % | |||||||||||
Generation Business | ||||||||||||||||
| Endesa and subsidiaries (Chile) | 20,020 | 18,218 | -1,802 | -9.0 | % | |||||||||||
| Endesa Costanera (Argentina) | 2,388 | 2,506 | 118 | 4.9 | % | |||||||||||
| El Chocón (Argentina) | 1,128 | 1,223 | 95 | 8.4 | % | |||||||||||
| Cachoeira Dourada (Brazil) | 2,240 | 2,550 | 310 | 13.8 | % | |||||||||||
| Endesa Fortaleza (Brazil) | 1,687 | 1,606 | -81 | -4.8 | % | |||||||||||
| Emgesa (Colombia) | 4,925 | 5,021 | 96 | 1.9 | % | |||||||||||
| Edegel (Peru) | 12,719 | 8,898 | -3,821 | -30.0 | % | |||||||||||
Total selling and administrative expenses from generation business | 45,107 | 40,022 | -5,085 | -11.3 | % | |||||||||||
Transmission Business | ||||||||||||||||
| CIEN (Brazil) | 6,000 | 4,374 | -1,626 | -27.1 | % | |||||||||||
Total selling and administrative expenses from transmission business | 6,000 | 4,374 | -1,626 | -27.1 | % | |||||||||||
| Non-electricity subsidiaries(1) | 47,446 | 50,212 | 2,766 | 5.8 | % | |||||||||||
Total operating costs from non-electricity subsidiaries (Chile) | 47,446 | 50,212 | 2,766 | 5.8 | % | |||||||||||
| Less: intercompany transactions | -36,609 | -35,351 | 1,258 | -3.4 | % | |||||||||||
Total selling and administrative expenses | 241,527 | 267,244 | 25,717 | 10.6 | % | |||||||||||
| (1) | Includes the selling and administrative expenses of CAM, Synapsis, IMV, Túnel el Melón, Ingendesa, Enigesa, Enersis holding and the investment vehicles. |
87
Table of Contents
| Years ended December 31, | ||||||||||||||||
| 2006 | 2007 | Change | % Change | |||||||||||||
| (in millions of Ch$) | ||||||||||||||||
| Net interest expense | -280,336 | -290,878 | -10,542 | 3.8 | % | |||||||||||
| Net income from related companies | 5,412 | -54,761 | -60,173 | n.a. | ||||||||||||
| Net other non-operating income (expense) | -111,089 | -149,389 | -38,300 | 34.5 | % | |||||||||||
| Net monetary exposure | 7,029 | -4,017 | -11,046 | n.a. | ||||||||||||
| Goodwill amortization | -60,045 | -59,814 | 231 | -0.4 | % | |||||||||||
Non-operating expense | -439,029 | -558,859 | -119,830 | -27.3 | % | |||||||||||
| • | Net losses of Ch$114.5 billion from the conversion adjustment according to Chilean regulations as contained in BT 64, principally of the subsidiaries in Brazil, Colombia and Peru (Ch$35.8 billion, net of minorities); and | ||
| • | Reduced gain on sales of fixed assets of Ch$21.1 billion, which relates to the sale made in 2006 by Ampla of former generation assets and a higher equity tax charge in Colombia of Ch$18.6 billion. |
| • | Reduced write-off of receivables in CIEN made in 2006 on the renegotiation of the contract with Copel for Ch$32.8 billion; | ||
| • | Income from previous years’ tariff adjustment in Edesur for Ch$27.8 billion; | ||
| • | Reduced provisions for contingencies and litigation of Ch$21.1 billion, principally in Ampla, Coelce and CIEN; | ||
| • | Reduced expenses, related to energy efficiency programs of Brazilian subsidiaries, of Ch$11.9 billion; | ||
| • | Gain in CIEN for settlement of contract with Cemsa for Ch$8.1 billion; and | ||
| • | Reduced allowance for obsolescence and write-offs of fixed assets for Ch$6.5 billion. |
88
Table of Contents
| Years ended December 31, | ||||||||||||||||
| 2006 | 2007 | Change | % Change | |||||||||||||
| (in millions of Ch$) | ||||||||||||||||
| Operating income | 1,131,631 | 1,255,567 | 123,936 | 11.0 | % | |||||||||||
| Non-operating income | -439,029 | -558,859 | -119,830 | 27.3 | % | |||||||||||
Net income before taxes, minority interest and negative goodwill amortization | 692,602 | 696,708 | 4,106 | 0.6 | % | |||||||||||
| Current tax (expense) benefit | -102,257 | -253,148 | -150,891 | 147.6 | % | |||||||||||
| Minority interest | -289,750 | -259,606 | 30,144 | -10.4 | % | |||||||||||
| Amortization of negative goodwill | 6,527 | 4,422 | -2,105 | -32.3 | % | |||||||||||
Net income | 307,122 | 188,376 | -118,746 | -38.7 | % | |||||||||||
| Years ended December 31, | ||||||||||||||||
| 2006 | 2007 | Change | % Change | |||||||||||||
| (in million of Ch$) | ||||||||||||||||
| Current tax (expense) benefit | -254,849 | -206,547 | 48,302 | -19.0 | % | |||||||||||
| Deferred tax (expense) benefit | 152,592 | -46,601 | -199,193 | n.a. | ||||||||||||
Income tax expense | -102,257 | -253,148 | -150,891 | 147.6 | % | |||||||||||
89
Table of Contents
December 31, 2005 and December 31, 2006
90
Table of Contents
| Years ended December 31, | ||||||||||||||||
| 2005 | 2006 | Change | % Change | |||||||||||||
| (in millions of Ch$) | ||||||||||||||||
Distribution Business | ||||||||||||||||
| Chilectra and subsidiaries (Chile) | 126,299 | 125,806 | -493 | -0.4 | % | |||||||||||
| Edesur (Argentina) | 4,015 | -4,378 | -8,393 | n.a. | ||||||||||||
| Distrilima/Edelnor (Peru) | 31,931 | 41,434 | 9,503 | 29.8 | % | |||||||||||
| Ampla (Brazil) | 87,849 | 102,701 | 14,852 | 16.9 | % | |||||||||||
| Investluz/Coelce (Brazil) | 52,828 | 92,954 | 40,126 | 76.0 | % | |||||||||||
| Codensa (Colombia) | 118,141 | 145,368 | 27,227 | 23.0 | % | |||||||||||
Total operating income from distribution business | 421,063 | 503,885 | 82,822 | 19.7 | % | |||||||||||
Generation Business | ||||||||||||||||
| Endesa and subsidiaries (Chile) | 205,902 | 309,807 | 103,905 | 50.5 | % | |||||||||||
| Endesa Costanera (Argentina) | -2,290 | 5,254 | 7,544 | n.a. | ||||||||||||
| El Chocón (Argentina) | 15,537 | 32,552 | 17,015 | 109.5 | % | |||||||||||
| Cachoeira Dourada (Brazil) | 25,665 | 31,733 | 6,068 | 23.6 | % | |||||||||||
| Endesa Fortaleza (Brazil)(1) | 16,845 | 56,418 | 39,573 | 234.9 | % | |||||||||||
| Emgesa (Colombia) | 114,008 | 117,149 | 3,141 | 2.8 | % | |||||||||||
| Betania (Colombia) | 18,179 | 13,160 | -5,019 | -27.6 | % | |||||||||||
| Edegel (Peru) | 59,021 | 59,646 | 625 | 1.1 | % | |||||||||||
Total operating income from generation business | 452,867 | 625,719 | 172,852 | 38.2 | % | |||||||||||
Transmission Business | ||||||||||||||||
| CIEN (Brazil)(1) | 14,325 | -814 | -15,139 | n.a. | ||||||||||||
Total operating income from transmission business | 14,325 | -814 | -15,139 | n.a. | ||||||||||||
| Non-electricity subsidiaries(2) | 3,246 | 182 | -3,064 | -94.4 | % | |||||||||||
Total operating income from non-electricity subsidiaries (Chile) | 3,246 | 182 | -3,064 | -94.4 | % | |||||||||||
| Less: intercompany transactions | -1,538 | 2,659 | 4,197 | n.a. | ||||||||||||
Total operating income | 889,963 | 1,131,631 | 241,668 | 27.2 | % | |||||||||||
| (1) | Corresponds to operating income for the last quarter of 2005 in which Enersis consolidated Endesa Brasil. | |
| (2) | Includes operating income for CAM, Synapsis, IMV, Túnel El Melón, Ingendesa, Enigesa, Enersis Holding and investment vehicles. |
91
Table of Contents
| Years ended December 31, | ||||||||||||||||||||||||||||||||||||||||||||||||
| (in million of Ch$) | ||||||||||||||||||||||||||||||||||||||||||||||||
| Interco. | ||||||||||||||||||||||||||||||||||||||||||||||||
| Generation | Transmission | Distribution | Other | Transactions | Total | |||||||||||||||||||||||||||||||||||||||||||
| 2005 | 2006 | 2005 | 2006 | 2005 | 2006 | 2005 | 2006 | 2005 | 2006 | 2005 | 2006 | |||||||||||||||||||||||||||||||||||||
| Operating revenues | 1,257,582 | 1,580,736 | 30,731 | 154,549 | 2,451,089 | 2,717,257 | 228,832 | 268,300 | -434,784 | -564,997 | 3,533,450 | 4,155,845 | ||||||||||||||||||||||||||||||||||||
| Operating costs | -760,978 | -909,910 | -14,990 | -149,363 | -1,831,412 | -2,033,790 | -186,458 | -220,672 | 394,322 | 531,048 | -2,399,516 | -2,782,687 | ||||||||||||||||||||||||||||||||||||
| Selling and administrative expenses | -43,737 | -45,107 | -1,416 | -6,000 | -198,613 | -179,583 | -39,128 | -47,446 | 38,923 | 36,609 | -243,971 | -241,527 | ||||||||||||||||||||||||||||||||||||
Operating income | 452,867 | 625,719 | 14,325 | -814 | 421,064 | 503,884 | 3,246 | 182 | -1,539 | 2,660 | 889,963 | 1,131,631 | ||||||||||||||||||||||||||||||||||||
92
Table of Contents
| Physical sales during | ||||||||||||||||
| years ended December 31, | ||||||||||||||||
| 2005 | 2006 | Change | % Change | |||||||||||||
| (GWh) | ||||||||||||||||
| Endesa Chile (Chile) | 20,731 | 20,923 | 192 | 0.9 | % | |||||||||||
| Endesa Costanera (Argentina) | 8,466 | 8,736 | 270 | 3.2 | % | |||||||||||
| El Chocón (Argentina) | 4,113 | 5,191 | 1,078 | 26.2 | % | |||||||||||
| Edegel (Peru) | 4,600 | 6,766 | 2,166 | 47.1 | % | |||||||||||
| Emgesa (Colombia)(1) | 12,358 | 12,273 | -85 | -0.7 | % | |||||||||||
| Betania (Colombia) | 2,737 | 3,054 | 317 | 11.6 | % | |||||||||||
| Cachoeira Dourada (Brazil) | 3,867 | 4,177 | 310 | 8.0 | % | |||||||||||
| Endesa Fortaleza (Brazil)(2) | 678 | 2,690 | 2,012 | 296.8 | % | |||||||||||
| Cien (Brazil)(2) | 1,467 | 6,394 | 4,927 | 335.9 | % | |||||||||||
Total | 59,017 | 70,204 | 11,187 | 19.0 | % | |||||||||||
| (1) | In 2005, 18 GWh of inter-company sales are included. | |
| (2) | Corresponds to sales for the last quarter of 2005 in which Enersis consolidated Endesa Brasil. |
| Physical sales during | ||||||||||||||||
| years ended December 31, | ||||||||||||||||
| 2005 | 2006 | Change | % Change | |||||||||||||
| (GWh) | ||||||||||||||||
| Chilectra (Chile) | 11,851 | 12,377 | 526 | 4.4 | % | |||||||||||
| Edesur (Argentina)(1) | 14,018 | 14,837 | 819 | 5.8 | % | |||||||||||
| Edelnor (Peru) | 4,530 | 4,874 | 344 | 7.6 | % | |||||||||||
| Ampla (Brazil) | 8,175 | 8,668 | 493 | 6.0 | % | |||||||||||
| Coelce (Brazil) | 6,580 | 6,769 | 189 | 2.9 | % | |||||||||||
| Codensa (Colombia)(1) | 10,094 | 10,755 | 661 | 6.5 | % | |||||||||||
Total | 55,248 | 58,280 | 3,032 | 5.5 | % | |||||||||||
| (1) | Includes toll revenues. |
93
Table of Contents
| Years ended December 31, | ||||||||||||||||
| 2005 | 2006 | Change | % Change | |||||||||||||
| (in millions of Ch$) | ||||||||||||||||
Distribution Business | ||||||||||||||||
| Chilectra and subsidiaries (Chile) | 650,860 | 714,164 | 63,304 | 9.7 | % | |||||||||||
| Edesur (Argentina) | 257,190 | 266,775 | 9,585 | 3.7 | % | |||||||||||
| Distrilima/Edelnor (Peru) | 212,102 | 230,127 | 18,025 | 8.5 | % | |||||||||||
| Ampla (Brazil) | 521,740 | 573,827 | 52,087 | 10.0 | % | |||||||||||
| Investluz/Coelce (Brazil) | 368,909 | 449,269 | 80,360 | 21.8 | % | |||||||||||
| Codensa (Colombia) | 440,288 | 483,097 | 42,809 | 9.7 | % | |||||||||||
Total operating revenues from distribution business | 2,451,089 | 2,717,259 | 266,170 | 10.9 | % | |||||||||||
Generation Business | ||||||||||||||||
| Endesa and subsidiaries (Chile) | 583,467 | 678,319 | 94,852 | 16.3 | % | |||||||||||
| Endesa Costanera (Argentina) | 128,592 | 186,588 | 57,996 | 45.1 | % | |||||||||||
| El Chocón (Argentina) | 43,342 | 66,248 | 22,906 | 52.8 | % | |||||||||||
| Cachoeira Dourada (Brazil) | 55,970 | 67,258 | 11,288 | 20.2 | % | |||||||||||
| Endesa Fortaleza (Brazil)(1) | 33,211 | 107,607 | 74,396 | 224.0 | % | |||||||||||
| Emgesa (Colombia) | 241,100 | 254,649 | 13,549 | 5.6 | % | |||||||||||
| Betania (Colombia) | 42,876 | 39,439 | -3,437 | -8.0 | % | |||||||||||
| Edegel (Peru) | 129,024 | 180,628 | 51,604 | 40.0 | % | |||||||||||
Total operating revenues from generation business | 1,257,582 | 1,580,736 | 323,154 | 25.7 | % | |||||||||||
Transmission Business | ||||||||||||||||
| CIEN (Brazil)(1) | 30,731 | 154,549 | 123,818 | 402.9 | % | |||||||||||
Total operating revenues from transmission business | 30,731 | 154,549 | 123,818 | 402.9 | % | |||||||||||
| Non-electricity subsidiaries(2) | 228,832 | 268,298 | 39,466 | 17.2 | % | |||||||||||
Total operating revenues from non-electricity subsidiaries (Chile) | 228,832 | 268,298 | 39,466 | 17.2 | % | |||||||||||
| Less: intercompany transactions | -434,784 | -564,997 | -130,213 | 29.9 | % | |||||||||||
Total operating revenues | 3,533,450 | 4,155,845 | 622,395 | 17.6 | % | |||||||||||
| (1) | Corresponds to operating revenues for the last quarter of 2005 in which Enersis consolidated Endesa Brasil. | |
| (2) | Includes operating revenues for CAM, Synapsis, IMV, Túnel El Melón, Ingendesa, Enigesa, Enersis Holding and investment vehicles. |
94
Table of Contents
95
Table of Contents
96
Table of Contents
| Years ended December 31, | ||||||||
| 2005 | 2006 | |||||||
| (percentage of total costs of | ||||||||
| operations) | ||||||||
| Electricity purchases | 47.7 | % | 45.8 | % | ||||
| Depreciation and amortization | 16.3 | % | 15.7 | % | ||||
| Fuel purchases | 9.8 | % | 10.9 | % | ||||
| Operating cost and maintenance | 9.2 | % | 8.7 | % | ||||
| Transmission tolls | 6.0 | % | 5.9 | % | ||||
| Salaries | 5.7 | % | 5.4 | % | ||||
| Other expenses | 5.3 | % | 7.6 | % | ||||
| 100.0 | % | 100.0 | % | |||||
97
Table of Contents
| Years ended December 31, | ||||||||||||||||
| 2005 | 2006 | Change | % Change | |||||||||||||
| (in millions of Ch$) | ||||||||||||||||
Distribution Business | ||||||||||||||||
| Chilectra and subsidiaries (Chile) | 477,713 | 537,874 | 60,161 | 12.6 | % | |||||||||||
| Edesur (Argentina) | 221,155 | 232,947 | 11,792 | 5.3 | % | |||||||||||
| Distrilima/Edelnor (Peru) | 160,669 | 167,251 | 6,582 | 4.1 | % | |||||||||||
| Ampla (Brazil) | 409,647 | 452,665 | 43,018 | 10.5 | % | |||||||||||
| Investluz/Coelce (Brazil) | 260,236 | 319,503 | 59,267 | 22.8 | % | |||||||||||
| Codensa (Colombia) | 301,993 | 323,551 | 21,558 | 7.1 | % | |||||||||||
Total operating costs from distribution business | 1,831,413 | 2,033,791 | 202,378 | 11.1 | % | |||||||||||
Generation Business | ||||||||||||||||
| Endesa and subsidiaries (Chile) | 354,112 | 348,492 | -5,620 | -1.6 | % | |||||||||||
| Endesa Costanera (Argentina) | 128,833 | 178,946 | 50,113 | 38.9 | % | |||||||||||
| El Chocón (Argentina) | 26,870 | 32,568 | 5,698 | 21.2 | % | |||||||||||
| Cachoeira Dourada (Brazil) | 28,451 | 33,285 | 4,834 | 17.0 | % | |||||||||||
| Endesa Fortaleza (Brazil)(1) | 15,850 | 49,502 | 33,652 | 212.3 | % | |||||||||||
| Emgesa (Colombia) | 121,912 | 133,337 | 11,425 | 9.4 | % | |||||||||||
| Betania (Colombia) | 24,195 | 25,517 | 1,322 | 5.5 | % | |||||||||||
| Edegel (Peru) | 60,755 | 108,263 | 47,508 | 78.2 | % | |||||||||||
Total operating costs from generation business | 760,978 | 909,910 | 148,932 | 19.6 | % | |||||||||||
Transmission Business | ||||||||||||||||
| CIEN (Brazil)(1) | 14,990 | 149,363 | 134,373 | 896.4 | % | |||||||||||
Total operating costs from transmission business | 14,990 | 149,363 | 134,373 | 896.4 | % | |||||||||||
| Non-electricity subsidiaries(2) | 186,458 | 220,670 | 34,212 | 18.3 | % | |||||||||||
Total operating costs from non-electricity subsidiaries (Chile) | 186,458 | 220,670 | 34,212 | 18.3 | % | |||||||||||
| Less: intercompany transactions | -394,323 | -531,047 | -136,724 | 34.7 | % | |||||||||||
Total operating costs | 2,399,516 | 2,782,687 | 248,798 | 10.4 | % | |||||||||||
| (1) | Corresponds to operating costs for the last quarter of 2005 in which Enersis consolidated Endesa Brasil. | |
| (2) | Includes operating costs for CAM, Synapsis, IMV, Túnel el Melón, Ingendesa, Enigesa, Enersis Holding and investment vehicles. |
98
Table of Contents
99
Table of Contents
100
Table of Contents
| Years ended December 31, | ||||||||
| 2005 | 2006 | |||||||
| (percentage of total costs of | ||||||||
| operations) | ||||||||
| General administrative expenses | 35.3 | % | 43.3 | % | ||||
| Salaries | 35.1 | % | 40.9 | % | ||||
| Uncollectible accounts | 20.7 | % | 7.7 | % | ||||
| Depreciation and amortization | 8.3 | % | 7.5 | % | ||||
| Materials and office supplies | 0.6 | % | 0.6 | % | ||||
| 100.0 | % | 100.0 | % | |||||
101
Table of Contents
| Years ended December 31, | ||||||||||||||||
| 2005 | 2006 | Change | % Change | |||||||||||||
| (in millions of Ch$) | ||||||||||||||||
Distribution Business | ||||||||||||||||
| Chilectra and subsidiaries (Chile) | 46,848 | 50,484 | 3,636 | 7.8 | % | |||||||||||
| Edesur (Argentina) | 32,020 | 38,206 | 6,186 | 19.3 | % | |||||||||||
| Distrilima/Edelnor (Peru) | 19,502 | 21,442 | 1,940 | 9.9 | % | |||||||||||
| Ampla (Brazil) | 24,244 | 18,461 | -5,783 | -23.9 | % | |||||||||||
| Investluz/Coelce (Brazil) | 55,845 | 36,812 | -19,033 | -34.1 | % | |||||||||||
| Codensa (Colombia) | 20,154 | 14,178 | -5,976 | -29.7 | % | |||||||||||
Total selling and administrative expenses from distribution business | 198,613 | 179,583 | -19,030 | -9.6 | % | |||||||||||
Generation Business | ||||||||||||||||
| Endesa and subsidiaries (Chile) | 23,453 | 20,020 | -3,433 | -14.6 | % | |||||||||||
| Endesa Costanera (Argentina) | 2,049 | 2,388 | 339 | 16.5 | % | |||||||||||
| El Chocón (Argentina) | 935 | 1,128 | 193 | 20.6 | % | |||||||||||
| Cachoeira Dourada (Brazil) | 1,854 | 2,240 | 386 | 20.8 | % | |||||||||||
| Endesa Fortaleza (Brazil)(1) | 516 | 1,687 | 1,171 | 226.9 | % | |||||||||||
| Emgesa (Colombia) | 5,180 | 4,163 | -1,017 | -19.6 | % | |||||||||||
| Betania (Colombia) | 502 | 762 | 260 | 51.8 | % | |||||||||||
| Edegel (Peru) | 9,248 | 12,719 | 3,471 | 37.5 | % | |||||||||||
Total selling and administrative expenses from generation business | 43,737 | 45,107 | 1,370 | 3.1 | % | |||||||||||
Transmission Business | ||||||||||||||||
| CIEN (Brazil)(1) | 1,416 | 6,000 | 4,584 | 323.7 | % | |||||||||||
Total selling and administrative expenses from transmission business | 1,416 | 6,000 | 4,584 | 323.7 | % | |||||||||||
| Non-electricity subsidiaries(2) | 39,128 | 47,446 | 8,318 | 21.3 | % | |||||||||||
Total operating costs from non-electricity subsidiaries (Chile) | 39,128 | 47,446 | 8,318 | 21.3 | % | |||||||||||
| Less: intercompany transactions | -38,923 | -36,609 | 2,314 | -5.9 | % | |||||||||||
Total selling and administrative expenses | 243,971 | 241,527 | -2,444 | -1.0 | % | |||||||||||
| (1) | Corresponds to selling and administrative expenses for the last quarter of 2005 in which Enersis consolidated Endesa Brasil. | |
| (2) | Includes selling and administrative expenses for CAM, Synapsis, IMV, Túnel el Melón, Ingendesa, Enigesa, Enersis Holding and investment vehicles. |
102
Table of Contents
| Year ended December 31, | ||||||||||||||||
| 2005 | 2006 | Change | % Change | |||||||||||||
| (in millions of Ch$) | ||||||||||||||||
| Net interest expense | -290,075 | -280,336 | 9,739 | -3.4 | % | |||||||||||
| Net income from related companies | 7,397 | 5,412 | -1,985 | -26.8 | % | |||||||||||
| Net other non-operating income (expense) | -100,050 | -111,089 | -11,039 | 11.0 | % | |||||||||||
| Net monetary exposure | -12,267 | 7,029 | 19,296 | n.a. | ||||||||||||
| Goodwill amortization | -60,515 | -60,045 | 470 | -0.8 | % | |||||||||||
Non-operating expense | -455,510 | -439,029 | 16,481 | -3.6 | % | |||||||||||
| • | Other non-operating expenses presents a reduction of Ch$11.0 billion, which contributed to a change in net loss from Ch$100.1 billion in 2005 to a net loss of Ch$111.1 billion in 2006. The primary reasons for this change are detailed below: | ||
| • | Write-off in accounts receivable from CIEN due to contract a renegotiation of Ch$32.8 billion with Copel in 2006. | ||
| • | Higher expenses due of Ch$13.1 billion to an energy efficiency program promoted by the authorities that affect all the distribution companies in Brazil. | ||
| • | Net loss of Ch$10.8 billion due to an accounting adjustment under Chilean GAAP, with the application of the BT 64, mainly from our subsidiaries from Colombia, Brazil and Peru. | ||
| • | The aforementioned points were partially compensated by: |
| • | Higher gains arising from the sales of fixed assets for Ch$20.6 billion, mainly because of the generation asset sales of Ampla. | ||
| • | Lower expenses for provisions and contingencies of Ch$17.9 billion. |
103
Table of Contents
| Years ended December 31, | ||||||||||||||||
| 2005 | 2006 | Change | % Change | |||||||||||||
| (in millions of Ch$) | ||||||||||||||||
| Operating income | 889,963 | 1,131,631 | 241,668 | 27.2 | % | |||||||||||
| Non-operating income | -455,510 | -439,029 | 16,481 | -3.6 | % | |||||||||||
Net income before taxes, minority interest and negative goodwill amortization | 434,453 | 692,602 | 258,149 | 59.4 | % | |||||||||||
| Current tax (expense) benefit | -190,984 | -102,257 | 88,727 | -46.5 | % | |||||||||||
| Minority interest | -185,879 | -289,750 | -103,871 | 55.9 | % | |||||||||||
| Amortization of negative goodwill | 16,993 | 6,527 | -10,466 | -61.6 | % | |||||||||||
Net income | 74,583 | 307,122 | 232,539 | 311.8 | % | |||||||||||
| Years ended December 31, | ||||||||||||||||
| 2005 | 2006 | Change | % Change | |||||||||||||
| (in millions of Ch$) | ||||||||||||||||
| Current tax (expense) benefit | -140,222 | -254,849 | -114,627 | 81.7 | % | |||||||||||
| Deferred tax (expense) benefit | -50,762 | 152,592 | 203,354 | n.a. | ||||||||||||
Income tax expense | -190,984 | -102,257 | 88,727 | -46.5 | % | |||||||||||
104
Table of Contents
| 2006 | 2007 | |||||||
| (figures in $ millions) | ||||||||
INITIAL CASH (A) | 0.7 | 25.3 | ||||||
SOURCES (B) + (C) | 684.3 | 876.9 | ||||||
Cash Inflows from Chile (B) | 580.3 | 744.3 | ||||||
| Cash Inflows from Operations | 348.2 | 325.1 | ||||||
| Interest Income from Chilean Subsidiaries | 43.4 | 43.7 | ||||||
| Dividends from Chilean Subs | 141.3 | 266.1 | ||||||
| Amortization of Intercompany Loans from Chilean Subsidiaries | 47.4 | 109.4 | ||||||
| Other Income from non-operating activities | — | — | ||||||
Cash Inflows from foreign subsidiaries (C) | 104.0 | 132.6 | ||||||
| Interest Income from Foreign Subs | 3.1 | |||||||
| Dividends from Foreign Subs | 17.4 | 80.2 | ||||||
| Capital Reductions | 21.3 | 5.8 | ||||||
| Management Fee and Others | 0.1 | 0.2 | ||||||
| Intercompany debt amortizations | 62.2 | 46.4 | ||||||
105
Table of Contents
| 2006 | 2007 | |||||||
| (figures in $ millions) | ||||||||
USES (D) + (E) | 659.7 | 833.1 | ||||||
Cash Outflows from Operations (D) | 329.3 | 281.2 | ||||||
| Cash Outflows from Operations | 297.1 | 253.5 | ||||||
| Taxes | 32.2 | 27.7 | ||||||
Cash Outflows from non-Operating Activities (E) | 330.4 | 551.9 | ||||||
| Interest Expenses and Derivative Contracts | 84.6 | 123.5 | ||||||
| Dividend Payment | 133.4 | 352.9 | ||||||
| Debt Amortization | 85.2 | 75.5 | ||||||
| Others | 27.2 | |||||||
FINAL CASH (A)+(B)+(C)-(D)-(E) | 25.3 | 69.1 | ||||||
| • | $325.1 million of cash inflows from operating revenues of our wholly-owned subsidiaries; | ||
| • | $43.7 million of interest payments from non-wholly-owned Chilean subsidiaries; | ||
| • | $266.1 million of dividends from Chilean subsidiaries, which includes $56.0 million from Chilectra; | ||
| • | $109.4 million of intercompany loan payment from Chilean subsidiaries, which includes $90.1 million from Chilectra; | ||
| • | $80.2 million from dividends, which includes $47.4 million from our Brazilian subsidiaries and $32.8 million from our Colombian subsidiaries; | ||
| • | $5.8 million from capital reductions from our Colombian subsidiaries; and | ||
| • | $46.4 million from amortization of intercompany loans from our Brazilian subsidiary Coelce. |
| • | $253.5 million from operating expenses of our wholly-owned subsidiaries, including investments and capital expenditures; | ||
| • | $27.7 million in taxes paid by Enersis and its wholly-owned subsidiaries; | ||
| • | $123.5 million in net interest expense (net of derivatives contracts); | ||
| • | $352.9 million dividend payments by Enersis; and | ||
| • | $75.5 million of net financial debt amortization (discounting new debt used for refinancing purposes). |
| • | $348.2 million of cash inflows from operating revenues of our wholly-owned subsidiaries; | ||
| • | $43.4 million of interest payments from non-wholly-owned Chilean subsidiaries; | ||
| • | $141.3 million of dividends from Chilean subsidiaries, which includes $62.2 million from Chilectra; | ||
| • | $47.4 million of intercompany loan payment from Chilean subsidiaries, which includes $41.1 million from Chilectra; |
106
Table of Contents
| • | $3.1 million on interest income from intercompany debt with our Brazilian subsidiaries; | ||
| • | $17.4 million from dividends, which includes $13.9 million from our Brazilian subsidiaries and $3.5 million from our Colombian subsidiaries; | ||
| • | $21.3 million from capital reductions, which includes $20.8 million from our Colombian subsidiaries; and | ||
| • | $62.2 from amortization of intercompany loans from our Brazilian subsidiary Coelce; |
| • | $297.1 million from operating expenses of our wholly-owned subsidiaries, including investments and capital expenditures; | ||
| • | $32.2 million in taxes paid by Enersis and its wholly-owned subsidiaries; | ||
| • | $84.6 million in net interest expenses (net of derivative contracts); | ||
| • | $133.4 million dividend payments by Enersis; | ||
| • | $85.2 million of net financial debt amortization (discounting new debt used for refinancing purposes); and | ||
| • | $27.2 million of payment to Endesa Internacional related to the purchase of Elesur. |
107
Table of Contents
| Aggregate | ||||||||||||
| Principal | ||||||||||||
| Issuer | Maturity | Coupon | Amount Issued | |||||||||
| (as a percentage) | (in millions) | |||||||||||
| Endesa Chile through its Cayman Islands Branch | July 15, 2008 | 7.750 | 400 | |||||||||
| Endesa Chile | April 1, 2009 | 8.500 | 400 | |||||||||
| Endesa Chile through its Cayman Islands Branch | August 1, 2013 | 8.350 | 400 | |||||||||
| Endesa Chile through its Cayman Islands Branch | August 1, 2015 | 8.625 | 200 | |||||||||
| Endesa Chile(3) through its Cayman Islands Branch | February 1, 2027 | 7.875 | 230 | |||||||||
| Endesa Chile(1) through its Cayman Islands Branch | February 1, 2037 | 7.325 | 220 | |||||||||
| Endesa Chile(3) | February 1, 2097 | 8.125 | 200 | |||||||||
| Enersis through its Cayman Islands Branch | January 15, 2014 | 7.375 | 350 | |||||||||
| Enersis(3) through its Cayman Islands Branch | December 1, 2016 | 7.400 | 350 | |||||||||
| Enersis(2) through its Cayman Islands Branch | December 1, 2026 | 6.600 | 150 | |||||||||
| (1) | Holders of these Yankee Bonds can exercise a put option against Endesa Chile on February 1, 2009. | |
| (2) | Holders of these Yankee Bonds exercised a put option against Enersis on December 1, 2003 for an aggregate principal amount of $149.1 million, leaving only $0.9 million outstanding. | |
| (3) | In 2001, Enersis and Endesa Chile repurchased an aggregate of $284 million of these Yankee Bonds. |
108
Table of Contents
109
Table of Contents
| • | Edegel: loan agreements for $50 million for the short and the long term. Edegel also made bond issuances in the Peruvian market for approximately $71 million, with maturities ranging from 4 to 15 years, which were used to refinance and prepay debt, improving contractual conditions and debt maturity. | ||
| • | Edelnor: local bonds for approximately $53 million equivalent in local currency with maturities between 5 years and 8 years, which were used to refinance debt. Also, Edelnor signed short-term loans for $195 million, including renovations and new debt, taking advantage of low interest rates. | ||
| • | Endesa Costanera: debt refinancing for $70 million with bank loans with medium-term maturity and supplier financing with maturity of 5 years. | ||
| • | Edesur: debt prepayment for $65 million with a local bond issuance for approximately $50 million with maturity of 5 years and a medium-term bilateral loan for $15 million. Edesur extended its debt duration and improved interest rate terms. Likewise, in November the company signed an interest rate swap for $15 million to fix the rate of the medium-term bilateral loan. | ||
| • | Ampla: 3-year bank loans for $135 million and debt refinancing for $40 million, extending debt maturity from 2 to 5 years and lowering interest rate by 15 basis points. In December, Ampla signed bank loans to refinance bonds due in March 2008, for $163 million with maturities of 5 and 6 years. |
110
Table of Contents
| • | Endesa Fortaleza: cross currency swap for $25 million, redenominating part of its debt from dollars to reais, reducing currency mismatch between debt and revenues generation. | ||
| • | Coelce: bank loans for a total of approximately $71 million and swaps to hedge the interest and exchange rate risks of these debts for approximately $60 million. | ||
| • | Emgesa: bank loans for $57 million with short-term maturity and debt refinancings in February 2007 with local bond issuances for $77 million with a maturity of 10 years. | ||
| • | Codensa: bank loans for $511 million with short-term maturity and short term debt refinancings with local bond issuances for approximately $323 million with maturities of 3 and 10 years. |
| • | Edegel: loan agreement for $20 million for a 3-year term entered into in July. Two bond issuances on the Peruvian market in October 2006 for $25 million soles each ($16 million) for 7 years. Bank note refinancing for $50 million soles for a 2-year term. Finally, new loan with a foreign bank for $24 million for 3 years to refinance short-term loans. | ||
| • | Edelnor: local bonds for approximately $53 million equivalent in local currency with maturities between 3 years and 10 years. | ||
| • | Edesur: bank loan refinancings for Ar$150 million with a 3-year syndicated loan. | ||
| • | CIEN: $280 million debt refinancing with a syndicated loan of R$600 million on a 6-year term (with a grace period of three years). | ||
| • | Ampla: local debentures in Brazil for R$370 million (approximately $173 million) on a 6-year term loan to prepay bank loans. Also, a 5-year loan with BNDES for R$300 million ($140 million) to finance Ampla’s investment plan. | ||
| • | Endesa Fortaleza: syndicated loan led by IFC for $130 million with an average maturity of approximately 7 years to refinance short-term debt. | ||
| • | Coelce: two loans for a total of approximately $90 million equivalent in local currency to finance investments. | ||
| • | El Chocón: bank loan for $100 million for a 5-year term and its proceeds were used to prepay commercial papers maturing in 2007. | ||
| • | Betania: bond in the Colombian market for $100 billion CPs ($44 million), 7-year maturity. Also, a structured loan for $305 billion CPs ($123 million), maturing in April 2012. | ||
| • | Emgesa: local bond for CPs 40,000 million ($17.5 million), 10-year maturity. Also, three 180-day facilities with local banks in the equivalent of $62 million, refinanced during February 2007 (see above). |
111
Table of Contents
| 2005 | 2006 | |||||||
| (in millions of Ch$) | ||||||||
| Operating Income | 889,963 | 1,131,631 | ||||||
| Consolidation CIEN and Endesa Fortaleza year 2005 | 63,209 | — | ||||||
| Operating income included above | 953,172 | 1,131,631 | ||||||
112
Table of Contents
| Jan 2008 | Jan 2009 | Jan 2010 | Jan 2011 | |||||||||||||||||||||
| As of December 31, 2007 | to | to | to | to | After | |||||||||||||||||||
| Ch$ billion | Total | Dec 2008 | Dec 2009 | Dec 2010 | Dec 2011 | 2011 | ||||||||||||||||||
| Bank Debt | 1.139 | 233 | 321 | 162 | 186 | 237 | ||||||||||||||||||
| Local Bonds(1) | 1.224 | 105 | 127 | 122 | 237 | 633 | ||||||||||||||||||
| Yankee Bonds(2) | 1.367 | 203 | 308 | — | — | 856 | ||||||||||||||||||
| Other Debt(3) | 421 | 85 | 72 | 74 | 67 | 123 | ||||||||||||||||||
| Interest Expenses | 1.884 | 297 | 267 | 212 | 188 | 920 | ||||||||||||||||||
| Pension and post-retirement obligations(4) | 300 | 36 | 36 | 37 | 38 | 152 | ||||||||||||||||||
| Purchase Obligations(5) | 31.621 | 2.529 | 2.484 | 2.290 | 1.856 | 22.462 | ||||||||||||||||||
| Financial Leases | 86 | 11 | 9 | 11 | 9 | 45 | ||||||||||||||||||
Total Contractual Obligations | 37.956 | 3.488 | 3.616 | 2.897 | 2.572 | 25.383 | ||||||||||||||||||
| (1) | Includes net payment from Endesa Chile’s Currency Swap of Ch$4,101.3 million. | |
| (2) | Includes net payment of Enersis’ Currency Swaps for a total of Ch$137,296.3 million. | |
| (3) | Includes Endesa Chile’s capital lease obligations for a total of Ch$22,265.9 million. | |
| (4) | We have funded and unfunded pension and post-retirement benefit plans. Our funded plans have contractual annual commitments for contributions which do not change based on funding status. Cash flow estimates in the table are based on such annual contractual commitments including certain estimable variable factors such as interest. Cash flow estimates in the table relating to our unfunded plans are based on future undiscounted payments necessary to meet all of our pension and post-retirement obligations. | |
| (5) | Includes generation and distribution business purchase obligations comprised mainly of energy purchases, operating and maintenance contracts and other services. |
113
Table of Contents
| Directors | Position | Held Since | ||
| Pablo Yrarrázaval V.(1) | Chairman | 2002 | ||
| Rafael Miranda R. | Vice Chairman | 1999 | ||
| Pedro Larrea P. | Director | 2007 | ||
| Patricio Claro G.(1)(2) | Director | 2006 | ||
| Juan Ignacio de la Mata G.(2) | Director | 2005 | ||
| Eugenio Tironi B. | Director | 2000 | ||
| Hernán Somerville S.(1)(2) | Director | 1999 |
| (1) | Member of the Directors’ Committee. | |
| (2) | Member of the Audit Committee. |
114
Table of Contents
115
Table of Contents
| Position | Current Position Held Since | |||
| Ignacio Antoñanzas A. | Chief Executive Officer | 2006 | ||
| José Luis Domínguez C. | Communications Officer | 2003 | ||
| Alfredo Ergas S. | Chief Financial Officer | 2003 | ||
| Antonio Zorrilla O. | Auditing Officer | 2007 | ||
| Fernando Isac C. | Accounting Officer | 2003 | ||
| Ramiro Alfonsín B. | Planning and Control Officer | 2007 | ||
| Francisco Silva B. | Human Resources Officer | 2003 | ||
| Domingo Valdés P. | General Counsel | 1999 |
116
Table of Contents
| Year Ended December 31, 2007 | ||||
| (in thousands of Ch$) | ||||
| Pablo Yrarrázaval V. | 75,591 | |||
| Rafael Miranda R. | 49,530 | |||
| Pedro Larrea P. | 10,484 | |||
| Hernán Somerville S. | 44,627 | |||
| Patricio Claro G. | 40,781 | |||
| Juan Ignacio de la Mata G. | 36,411 | |||
| Rafael Español N.(1) | 25,221 | |||
| Eugenio Tironi B. | 33,688 | |||
| Total | 316,333 | |||
| (1) | Mr. Español ceased to be a Director of Enersis in July 2007. |
117
Table of Contents
118
Table of Contents
119
Table of Contents
| • | examination of Annual Report, Financial Statements and the Reports of the External Auditors and Inspectors of the Accounts; | ||
| • | formulation of the proposal to the Board of Directors for the selection of external auditors and private rating agencies; | ||
| • | examination of information related to operations by the Company with related parties and/or related to operations in which the Company board members or relevant executive officers may have personal interest; | ||
| • | examination of the compensation framework and plans for managers and executive officers; and | ||
| • | any other function mandated to the committee by theestatutos, the Board of Directors or the shareholders of the Company. |
July 31, 2002. The other members are Hernán Somerville and Patricio Claro.
| • | submits a proposal for the appointment and compensation of independent auditors at the Shareholders’ Meeting; | ||
| • | oversees the work of independent auditors; | ||
| • | pre-approves audit and non-audit services provided by the independent auditors; and | ||
| • | establishes procedures for receiving and dealing with complaints regarding accounting, internal control and auditing matters. |
120
Table of Contents
| Years ended December 31, | ||||||||||||
| 2005 | 2006 | 2007 | ||||||||||
| Enersis (Chile) | 215 | 220 | 222 | |||||||||
| Endesa Chile(1) | 1,560 | 2,028 | 2,230 | |||||||||
| Endesa Brasil(2) | 2,842 | 2,938 | 2,905 | |||||||||
| Chilectra (Chile) | 712 | 708 | 728 | |||||||||
| Edesur (Argentina) | 2,338 | 2,407 | 2,534 | |||||||||
| Edelnor (Peru) | 536 | 548 | 544 | |||||||||
| Codensa (Colombia) | 926 | 934 | 931 | |||||||||
| Other Businesses(3) | 2,524 | 2,001 | 2,035 | |||||||||
| Total | 11,653 | 11,784 | 12,129 | |||||||||
| (1) | Includes Chilean operations and subsidiaries in Argentina, Colombia and Peru. | |
| (2) | Endesa Brasil includes Ampla, Coelce, Cachoeira Dourada, Endesa Fortaleza, CIEN, CTM and TESA. | |
| (3) | Includes CAM, Synapsis and IMV. |
121
Table of Contents
| Percentage of | ||||||||
| Number of | Shares | |||||||
| Shares Owned | Outstanding | |||||||
| Endesa Spain(1) | 19,794,583,473 | 60.6 | % | |||||
| AFP Provida(2) | 1,741,527,434 | 5.3 | % | |||||
| (1) | Endesa Spain’s 60.6% beneficial interest is held throughEndesa Internacional. | |
| (2) | The beneficial interest of AFP Provida is held through four different investment funds. |
122
Table of Contents
123
Table of Contents
124
Table of Contents
| Nominal | $ per | |||||||
| Year | Ch$(1) | ADS(2) | ||||||
| (Ch$ per share) | ||||||||
| 2002 | — | — | ||||||
| 2003 | — | — | ||||||
| 2004 | — | — | ||||||
| 2005 | 0.42 | 0.04 | ||||||
| 2006 | 2.11 | 0.21 | ||||||
| 2007 | 5.42 | 0.55 | ||||||
| (1) | Amounts shown are in historical pesos and reflect all the dividends paid in a given year. These dividends may have been accrued the prior year, or the same year in which they were paid. | |
| (2) | The dollar per ADS amount has been calculated by applying the exchange rate of Ch$496.89 = $1.00, the Observed Exchange Rate prevailing on December 31, 2007, to the constant peso amount. |
125
Table of Contents
| Chilean Pesos Per Share(1) | U.S.$ per ADS(2) | |||||||||||||||||||
| Share Volume | High | Low | High | Low | ||||||||||||||||
| 2008 | ||||||||||||||||||||
| May | 610,304,619 | 189.00 | 163.99 | 19 | 5/6 | 17 | 4/7 | |||||||||||||
| April | 1,282,543,671 | 184.00 | 156.50 | 20 | 1/4 | 17 | 3/4 | |||||||||||||
| March | 756,857,502 | 155.70 | 136.00 | 17 | 7/8 | 15 | ||||||||||||||
| February | 546,881,794 | 151.00 | 130.00 | 16 | 1/2 | 13 | 1/3 | |||||||||||||
| January | 1,326,228,078 | 161.89 | 110.00 | 16 | 11 | 5/6 | ||||||||||||||
| 2007 | ||||||||||||||||||||
| December | 1,318,759,385 | 182.50 | 157.00 | 18 | 5/8 | 15 | 5/6 | |||||||||||||
| November | 954,272,189 | 195.00 | 167.40 | 19 | 3/4 | 16 | ||||||||||||||
4th quarter | 3,104,262,960 | 199.00 | 157.00 | 20 | 1/5 | 15 | 5/6 | |||||||||||||
3rd quarter | 2,623,759,573 | 213.80 | 159.00 | 20 | 1/2 | 15 | ||||||||||||||
2nd quarter | 2,281,519,210 | 215.00 | 175.50 | 20 | 2/5 | 16 | 1/5 | |||||||||||||
1st quarter | 2,326,545,937 | 185.50 | 163.00 | 17 | 2/7 | 14 | 1/3 | |||||||||||||
| 2006 | ||||||||||||||||||||
| December | 1,473,086,846 | 173.00 | 158.16 | 16 | 2/5 | 15 | ||||||||||||||
| November | 983,312,375 | 164.00 | 143.00 | 15 | 4/9 | 13 | 1/2 | |||||||||||||
4th quarter | 2,935,194,633 | 173.00 | 140.00 | 16 | 2/5 | 13 | ||||||||||||||
3rd quarter | 1,424,604,249 | 147.99 | 117.99 | 13 | 6/7 | 10 | 3/4 | |||||||||||||
2nd quarter | 1,391,561,107 | 129.90 | 112.40 | 12 | 2/3 | 10 | 1/7 | |||||||||||||
1st quarter | 1,963,504,194 | 129.49 | 108.50 | 12 | 2/3 | 10 | 3/5 | |||||||||||||
| 2005 | ||||||||||||||||||||
| December | 618,835,548 | 122.00 | 109.00 | 8 | 2/3 | 7 | 1/3 | |||||||||||||
4th quarter | 2,212,992,708 | 130.00 | 109.00 | 12 | 1/3 | 10 | 1/2 | |||||||||||||
3rd quarter | 1,840,936,792 | 123.00 | 111.00 | 11 | 1/2 | 9 | 7/8 | |||||||||||||
2nd quarter | 2,112,530,098 | 126.00 | 97.00 | 10 | 6/7 | 8 | 1/4 | |||||||||||||
1st quarter | 1,348,339,507 | 103.50 | 87.00 | 9 | 7 | 1/3 | ||||||||||||||
| 2004 | ||||||||||||||||||||
| December | 568,896,414 | 97.00 | 87.00 | 8 | 5/8 | 7 | 2/5 | |||||||||||||
4th quarter | 2,248,285,905 | 97.00 | 84.00 | 8 | 5/8 | 6 | 4/5 | |||||||||||||
3rd quarter | 2,236,312,231 | 89.51 | 73.00 | 7 | 1/2 | 5 | 2/3 | |||||||||||||
2nd quarter | 1,032,271,059 | 82.01 | 70.00 | 6 | 5/6 | 5 | 1/2 | |||||||||||||
1st quarter | 1,413,791,567 | 87.50 | 73.00 | 7 | 3/4 | 5 | 7/8 | |||||||||||||
| 2003 | ||||||||||||||||||||
4th quarter | 2,949,415,326 | 88.00 | 72.01 | 7 | 2/5 | 5 | 7/9 | |||||||||||||
3rd quarter | 2,615,141,119 | 76.50 | 60.80 | 6 | 4 | 1/2 | ||||||||||||||
2nd quarter | 2,037,701,115 | 73.00 | 56.00 | 5 | 1/4 | 3 | 6/7 | |||||||||||||
1st quarter | 435,639,838 | 67.00 | 55.00 | 4 | 5/7 | 3 | 5/8 | |||||||||||||
| (1) | As reported by the Santiago Stock Exchange. Pesos per share reflect the nominal price as of the trade date. The price has not been restated in constant pesos. | |
| (2) | As reported by the NYSE. One ADS = 50 Shares |
126
Table of Contents
127
Table of Contents
| • | any direct or indirect acquisition or sale of shares or options to buy or sell shares that results in the holder’s acquiring or disposing, directly or indirectly, of 10% or more of a publicly held limited liability stock company’s subscribed capital; and | ||
| • | any direct or indirect acquisition or sale of shares or options to buy or sell shares, in any amount, if made by a holder of 10% or more of a publicly held limited liability stock company’s subscribed capital. |
128
Table of Contents
129
Table of Contents
130
Table of Contents
131
Table of Contents
132
Table of Contents
133
Table of Contents
| • | the prior Central Bank authorization requirement for the entry of capital associated with foreign loans, investments, capital contributions, bonds and ADRs; | ||
| • | the prior Central Bank authorization for capital remittances associated with returns of capital, dividends, and other benefits related to capital contributions, investments and prepayment of foreign loans; | ||
| • | the prior Central Bank authorization for the return of capital, profits and other benefits associated with investments made by Chilean residents abroad; | ||
| • | the limitations to the special prepayment and acceleration clauses contained in foreign loans; |
134
Table of Contents
| • | the restrictions of minimum risk classification and the weighted duration for the issuance of bonds; | ||
| • | the limitations with respect to the currencies in which external debt can be issued or contracted; | ||
| • | the restrictions to the issue of ADRs; and | ||
| • | the reserve requirement on funds coming from abroad (which was already 0%). |
135
Table of Contents
| • | cash dividends; | ||
| • | proceeds from the sale in Chile of Withdrawn Shares subject to receipt by the Central Bank of a certificate from the holder of the Withdrawn Shares (or from an institution authorized by the Central Bank) that such holder’s residence and domicile are outside Chile and a certificate from a Chilean stock exchange (or from a brokerage or securities firm established in Chile) that such Withdrawn Shares were sold on a Chilean stock exchange; | ||
| • | proceeds from the sale in Chile of rights to subscribe for additional shares of Common Stock; | ||
| • | proceeds from the liquidation, merger or consolidation of our Company; and | ||
| • | other distributions, including, without limitation, those resulting from any recapitalization, as a result of holding shares of Common Stock represented by ADSs or Withdrawn Shares. |
136
Table of Contents
137
Table of Contents
| • | in the case of an individual, a person who is not a resident in Chile; for purposes of Chilean taxation, an individual holder is resident in Chile if he or she has resided in Chile for more than six months in one calendar year, or a total of more than six months in two consecutive fiscal years; or | ||
| • | in the case of a legal entity, an entity that is not organized under the laws of Chile, unless the shares or ADSs are assigned to a branch, agent, representative or permanent establishment of such entity in Chile. |
| Company taxable income | 100.00 | |||
| Chilean corporate income tax (17% of Ch$100) | (17 | ) | ||
| Net distributable income | 83 | |||
| Dividend distributed (50% of net distributable income) | 41.5 | |||
| Withholding tax (35% of the sum of Ch$41.50 dividend plus Ch$8.50 credit) | (17.5 | ) | ||
| Credit for 50% of Chilean corporate income tax | 8.5 | |||
| Net withholding tax | (9 | ) | ||
| Net dividend received | 32.5 | |||
| Effective dividend withholding rate | 21.69 | % |
| Effective Dividend | = | (Withholding tax rate) – (Chilean corporate income tax rate) | ||
| Withholding Tax Rate | 1 – (Chilean corporate income tax rate) |
138
Table of Contents
| • | has held the shares for less than one year since exchanging ADSs for the shares; or | ||
| • | acquired and disposed of the shares in the ordinary course of its business or as a habitual trader of shares. |
139
Table of Contents
| • | certain financial institutions; | ||
| • | insurance companies; | ||
| • | dealers and traders in securities; | ||
| • | persons holding shares or ADSs as part of a hedge, “straddle,” integrated transaction or similar transaction; | ||
| • | persons whose functional currency for U.S. federal income tax purposes is not the U.S. dollar; | ||
| • | partnerships or other entities classified as partnerships for U.S. federal income tax purposes; | ||
| • | persons liable for the alternative minimum tax; | ||
| • | tax-exempt organizations; | ||
| • | persons holding shares or ADSs that own or are deemed to own ten percent or more of our voting stock; or | ||
| • | persons who acquired our shares or ADSs pursuant to the exercise of any employee stock option or otherwise as compensation. |
| • | a citizen or individual resident of the United States; | ||
| • | a corporation, or other entity taxable as a corporation, created or organized in or under the laws of the United States or any political subdivision thereof; or | ||
| • | an estate or trust the income of which is subject to U.S. federal income taxation regardless of its source. |
140
Table of Contents
141
Table of Contents
142
Table of Contents
143
Table of Contents
| Contract Terms | ||||||||||||||||||||||||||||||||
| As of December 31, | 2008 | 2009 | 2010 | 2011 | 2012 | Thereafter | Total | Fair Value(1) | ||||||||||||||||||||||||
| (in millions of constant Ch$) | ||||||||||||||||||||||||||||||||
Long-term Debt | ||||||||||||||||||||||||||||||||
Fixed rate: | ||||||||||||||||||||||||||||||||
| Ch$- and UF-denominated | 2,422 | 2,425 | 6,506 | 6,612 | 6,723 | 197,692 | 222,380 | 237,354 | ||||||||||||||||||||||||
| Weighted average interest rate | 5.3 | % | 5.3 | % | 5.3 | % | 5.2 | % | 5.2 | % | 5.2 | % | 5.3 | % | — | |||||||||||||||||
| $-denominated | 246,633 | 337,500 | 22,028 | 29,505 | 28,741 | 758,026 | 1,422,434 | 1,819,835 | ||||||||||||||||||||||||
| Weighted average interest rate | 7.7 | % | 7.8 | % | 7.8 | % | 7.8 | % | 7.8 | % | 7.9 | % | 7.7 | % | ||||||||||||||||||
| Other currencies(2) | 73,716 | 107,077 | 100,653 | 192,754 | 44,828 | 360,760 | 879,789 | 963,421 | ||||||||||||||||||||||||
| Weighted average interest rate | 6.0 | % | 6.0 | % | 6.3 | % | 6.4 | % | 6.2 | % | 6.0 | % | 6.0 | % | — | |||||||||||||||||
Variable rate: | ||||||||||||||||||||||||||||||||
| Ch$- and UF-denominated | — | — | — | — | — | — | — | — | ||||||||||||||||||||||||
| Weighted average interest rate | — | — | — | — | — | — | — | — | ||||||||||||||||||||||||
| $-denominated | 48,573 | 238,861 | 77,209 | 105,876 | 31,298 | 18,946 | 520,763 | 418,817 | ||||||||||||||||||||||||
| Weighted average interest rate | 6.9 | % | 6.9 | % | 7.3 | % | 7.4 | % | 8.0 | % | 7.5 | % | 6.9 | % | — | |||||||||||||||||
| Other currencies(2) | 245,455 | 141,799 | 150,504 | 153,594 | 228,120 | 35,865 | 955,338 | 848,848 | ||||||||||||||||||||||||
| Weighted average interest rate | 13.1 | % | 12.9 | % | 12.3 | % | 11.5 | % | 11.1 | % | 11.7 | % | 13.1 | % | — | |||||||||||||||||
| Total | 616,799 | 827,662 | 356,901 | 488,341 | 339,711 | 1,371,289 | 4,000,703 | 4,288,275 | ||||||||||||||||||||||||
| (1) | As of December 31, 2007, fair values were calculated based on the discounted value of future cash flows expected to be paid (or received), considering current discount rates that reflect the different risks involved. | |
| (2) | “Other currencies” includes the Euro, the Brazilian real, the Colombian peso and the Peruvian sol, among others. |
144
Table of Contents
| Contract Terms | ||||||||||||||||||||||||||||||||
| As of December 31, | 2007 | 2008 | 2009 | 2010 | 2011 | Thereafter | Total | Fair Value(1) | ||||||||||||||||||||||||
| (in millions of constant Ch$) | ||||||||||||||||||||||||||||||||
Long-term Debt | ||||||||||||||||||||||||||||||||
Fixed rate: | ||||||||||||||||||||||||||||||||
| Ch$- and UF-denominated | 2,461 | 2,271 | 2,254 | 79,425 | 6,178 | 117,670 | 210,259 | 241,226 | ||||||||||||||||||||||||
| Weighted average interest rate | 5.6 | % | 5.6 | % | 5.6 | % | 5.6 | % | 6.1 | % | 6.1 | % | 5.6 | % | — | |||||||||||||||||
| $-denominated | 91,029 | 268,215 | 392,065 | 44,331 | 18,160 | 857,785 | 1,671,585 | 1,849,024 | ||||||||||||||||||||||||
| Weighted average interest rate | 7.7 | % | 7.7 | % | 7.7 | % | 7.7 | % | 7.8 | % | 7.8 | % | 7.7 | % | — | |||||||||||||||||
| Other currencies(2) | 73,451 | 66,669 | 82,811 | 67,510 | 129,931 | 174,061 | 594,433 | 584,264 | ||||||||||||||||||||||||
| Weighted average interest rate | 5.9 | % | 5.6 | % | 5.4 | % | 5.6 | % | 5.2 | % | 5.8 | % | 5.9 | % | — | |||||||||||||||||
Variable rate: | ||||||||||||||||||||||||||||||||
| Ch$- and UF-denominated | — | — | — | — | — | — | — | — | ||||||||||||||||||||||||
| Weighted average interest rate | — | — | — | — | — | — | — | — | ||||||||||||||||||||||||
| $-denominated | 28,229 | 216,059 | 29,777 | 54,729 | 44,537 | 29,891 | 403,222 | 432,646 | ||||||||||||||||||||||||
| Weighted average interest rate | 5.9 | % | 5.9 | % | 7.2 | % | 6.4 | % | 6.8 | % | 7.3 | % | 5.9 | % | — | |||||||||||||||||
| Other currencies(2) | 128,596 | 102,425 | 145,355 | 112,979 | 100,955 | 168,383 | 758,693 | 833,624 | ||||||||||||||||||||||||
| Weighted average interest rate | 13.3 | % | 13.2 | % | 12.4 | % | 12.2 | % | 11.9 | % | 11.5 | % | 13.3 | % | — | |||||||||||||||||
| Total | 323,765 | 655,638 | 652,263 | 358,974 | 299,762 | 1,347,790 | 3,638,192 | 3,940,785 | ||||||||||||||||||||||||
| (1) | As of December 31, 2006, fair values were calculated based on the discounted value of future cash flows expected to be paid (or received), considering current discount rates that reflect the different risks involved. | |
| (2) | “Other currencies” includes the Euro, the Brazilian real, the Colombian peso and the Peruvian sol, among others. |
145
Table of Contents
| Contract Terms | ||||||||||||||||||||||||||||||||
| As of December 31, | 2008 | 2009 | 2010 | 2011 | 2012 | Thereafter | Total | Fair Value(1) | ||||||||||||||||||||||||
| (in millions of constant Ch$) | ||||||||||||||||||||||||||||||||
Long-term Debt | ||||||||||||||||||||||||||||||||
Fixed rate: | ||||||||||||||||||||||||||||||||
| $-denominated | 246,633 | 337,500 | 22,028 | 29,505 | 28,741 | 758,026 | 1,422,434 | 1,819,835 | ||||||||||||||||||||||||
| Other currencies(2) | 73,716 | 107,077 | 100,653 | 192,754 | 44,828 | 360,760 | 879,789 | 963,421 | ||||||||||||||||||||||||
Variable rate: | ||||||||||||||||||||||||||||||||
| $-denominated | 48,573 | 238,861 | 77,209 | 105,876 | 31,298 | 18,946 | 520,763 | 418,817 | ||||||||||||||||||||||||
| Other currencies(2) | 245,455 | 141,799 | 150,504 | 153,594 | 228,120 | 35,865 | 955,338 | 848,848 | ||||||||||||||||||||||||
| Other instruments(3) | ||||||||||||||||||||||||||||||||
| $-denominated assets | 229,891 | — | — | — | — | — | 229,891 | 229,891 | ||||||||||||||||||||||||
| Assets in other currencies(2) | 1,594,747 | 58,847 | 31,175 | 16,668 | 12,812 | 76,662 | 1,790,911 | 1,790,911 | ||||||||||||||||||||||||
| Forward contracts (receive U.S.$/Pay Ch$)(1) | — | — | — | — | — | — | — | — | ||||||||||||||||||||||||
| Swap contracts (receive U.S.$/Pay Ch$) | 62,111 | 298,134 | 360,245 | -196,730 | ||||||||||||||||||||||||||||
| Other foreign currency derivatives(2) | 79,442 | 54,658 | 19,876 | 7,453 | 62,492 | 34,695 | 258,616 | -18,989 | ||||||||||||||||||||||||
| (1) | Calculated based on the Observed Exchange Rate as of December 31, 2007, which was Ch$496.89 = $1.00. Fair values were calculated based on the discounted value of future cash flows expected to paid (or received), considering current discount rates that reflect the different risks involved. | |
| (2) | “Other currencies” includes the Euro, Brazilian real, the Colombian pesos, Peruvian soles, Argentine and Chilean pesos. | |
| (3) | “Other instruments” include cash, time deposits and short-term accounts receivables. See note 29 to financial statements. |
146
Table of Contents
| Contract Terms | ||||||||||||||||||||||||||||||||
| As of December 31, | 2007 | 2008 | 2009 | 2010 | 2011 | Thereafter | Total | Fair Value(1) | ||||||||||||||||||||||||
| (in millions of constant Ch$) | ||||||||||||||||||||||||||||||||
Long-term Debt | ||||||||||||||||||||||||||||||||
Fixed rate: | ||||||||||||||||||||||||||||||||
| $-denominated | 91,029 | 268,215 | 392,065 | 44,331 | 18,160 | 857,785 | 1,671,585 | 1,849,024 | ||||||||||||||||||||||||
| Other currencies(2) | 73,451 | 66,669 | 82,811 | 67,510 | 129,931 | 174,061 | 594,433 | 584,264 | ||||||||||||||||||||||||
Variable rate: | ||||||||||||||||||||||||||||||||
| $-denominated | 28,229 | 216,059 | 29,777 | 54,729 | 44,537 | 29,891 | 403,222 | 432,646 | ||||||||||||||||||||||||
| Other currencies(2) | 128,596 | 102,425 | 145,355 | 112,979 | 100,955 | 168,383 | 758,693 | 833,624 | ||||||||||||||||||||||||
| Other instruments(3) | ||||||||||||||||||||||||||||||||
| $-denominated assets | 81,683 | 90,524 | 2,049 | — | — | — | 174,256 | 174,256 | ||||||||||||||||||||||||
| Assets in other currencies(2) | 1,320,719 | 55,508 | 19,110 | 8,464 | 9,535 | 42,813 | 1,456,149 | 1,456,149 | ||||||||||||||||||||||||
| Forward contracts (receive $/Pay Ch$)(1) | — | — | — | — | — | — | — | — | ||||||||||||||||||||||||
| Swap contracts (receive $/Pay Ch$) | — | 66,549 | — | — | — | 319,434 | 385,983 | -142,193 | ||||||||||||||||||||||||
| Other foreign currency derivatives(2) | — | 1,314 | — | — | — | 26,620 | 27,934 | -4,219 | ||||||||||||||||||||||||
| (1) | Calculated based on the Observed Exchange Rate as of December 31, 2006, which was Ch$532.39 = $1.00. Fair values were calculated based on the discounted value of future cash flows expected to paid (or received), considering current discount rates that reflect the different risks involved. | |
| (2) | “Other currencies” includes the Euro, Brazilian real, the Colombian pesos and Peruvian soles among others. | |
| (3) | “Other instruments” include cash, time deposits and short-term accounts receivables. See note 29 to financial statements. |
147
Table of Contents
148
Table of Contents
Attention: Investor Relations Department
Santa Rosa 76
Santiago, Chile
(56-2) 353-4682
149
Table of Contents
| Services Rendered | 2006 | 2007 | ||||||
| (millions of $) | ||||||||
| Audit Fees | 3.7 | 3.3 | ||||||
| Audit-Related Fees(1) | 0.2 | — | ||||||
| Tax Fees(2) | 0.1 | 0.3 | ||||||
| All Other Fees(3) | 0.1 | — | ||||||
| Total | 4.1 | 3.6 | ||||||
| (1) | In 2006, includes fees paid for assistance services rendered in relation with Enersis’ readiness plan to comply with Sarbanes-Oxley’s section 404 requirements ($122,200) and other audit-related services ($47,380). | |
| (2) | Figure for 2007 includes mainly fees paid for tax advisory work in Colombia and Chile ($177,939;and $43,600 respectively). In 2006, includes fees paid for tax advisory work in Argentina, Colombia and Chile ($56,250, $50,288, and $10,158 respectively). | |
| (3) | In 2006, includes fees for collaboration in a rules and procedures program project ($80,000) and other minor services in Peru and Chile ($31,062). |
150
Table of Contents
| • | The business unit that has requested the service and the audit firm requested to perform the service must request that the corporate audit manager review the nature of the service to be provided. | ||
| • | At that point, the corporate audit department analyzes the request and requires the audit firm that has been requested to provide the service to issue a certificate signed by the partner responsible for the audit of our consolidated financial statements confirming such audit firm’s independence. | ||
| • | Finally, the proposal is submitted to the Audit Committee for approval or denial. |
151
Table of Contents
Report of Independent Accountants: | ||||
| F-2 | ||||
| F-4 | ||||
| F-6 | ||||
| F-7 | ||||
| F-8 | ||||
| F-9 | ||||
| F-10 | ||||
| F-12 | ||||
| F-13 | ||||
| F-14 | ||||
| F-15 | ||||
| F-16 | ||||
| F-17 | ||||
| F-19 | ||||
| F-20 | ||||
Consolidated Financial Statements: | ||||
| F-21 | ||||
| F-23 | ||||
| F-24 | ||||
| F-25 | ||||
| F-26 | ||||
| F-186 |
| Ch$ | Chilean pesos | |
| US$ | United States dollars | |
| UF | The UF is a Chilean inflation-indexed, peso-denominated monetary unit that is set daily in advance based on the previous month’s inflation rate (See Note 2(c)). | |
| ThCh$ | Thousand of Chilean pesos | |
| ThUS$ | Thousand of United States dollars. |
152
Table of Contents
| Exhibit | Description | |
| 1.1 | By-laws (Estatutos) of Enersis, as amended.* | |
| 1.2 | By-laws (Estatutos) of ENERSIS S.A., as amended (English translation).* | |
| 4.1 | Assignment of Rights Contract, dated January 27, 2004, between Endesa Internacional S.A. and Enersis (Spanish version).** | |
| 4.2 | Assignment of Rights Contract, dated January 27, 2004, between Endesa Internacional S.A. and Enersis (English version).** | |
| 8.1 | List of Subsidiaries as of December 31, 2006. | |
| 12.1 | Certification of Chief Executive Officer pursuant to Section 302 of the Sarbanes-Oxley Act. | |
| 12.2 | Certification of Chief Financial Officer pursuant to Section 302 of the Sarbanes-Oxley Act. | |
| 13.1 | Certification of Chief Executive Officer and Chief Financial Officer pursuant to Section 906 of the Sarbanes-Oxley Act. |
| * | Incorporated by reference to Enersis annual report on Form 20-F for the year ended December 31, 2006 filed with the Securities and Exchange Commission on May 14, 2007. | |
| ** | Incorporated by reference to Enersis annual report on Form 20-F for the year ended December 31, 2004 filed with the Securities and Exchange Commission on June 10, 2005. |
153
Table of Contents
| ENERSIS S.A. | ||||
| By: | /s/ Ignacio Antoñanzas A. | |||
| Name: | Ignacio Antoñanzas A. | |||
| Title: | Chief Executive Officer | |||
Table of Contents
Report of Independent Accountants: | ||||
| F-2 | ||||
| F-4 | ||||
| F-6 | ||||
| F-7 | ||||
| F-8 | ||||
| F-9 | ||||
| F-10 | ||||
| F-12 | ||||
| F-13 | ||||
| F-14 | ||||
| F-15 | ||||
| F-16 | ||||
| F-17 | ||||
| F-19 | ||||
| F-20 | ||||
Consolidated Financial Statements: | ||||
| F-21 | ||||
| F-23 | ||||
| F-24 | ||||
| F-25 | ||||
| F-26 | ||||
| F-185 |
| Ch$ | Chilean pesos | |
| US$ | United States dollars | |
| UF | The UF is a Chilean inflation-indexed, peso-denominated monetary unit that is set daily in advance based on the previous month’s inflation rate (See Note 2 (c)). | |
| ThCh$ | Thousand of Chilean pesos | |
| ThUS$ | Thousand of United States dollars |
F - 1
Table of Contents
 | Deloitte Auditores y Consultores Ltda. RUT: 80.276.200-3 Av. Providencia 1760 Pisos 6, 7, 8, 9 y 13 Providencia, Santiago Chile Fono: (56-2) 729 7000 Fax: (56-2) 374 9177 e-mail: deloittechile@deloitte.com www.deloitte.cl |
Enersis S.A.:
| Una firma miembro de Deloitte Touche Tohmatsu |
F - 2
Table of Contents
April 30, 2008
| Una firma miembro de Deloitte Touche Tohmatsu |
F - 3
Table of Contents
| Deloitte Auditores y Consultores Ltda. RUT: 80.276.200-3 Av. Providencia 1760 Pisos 6, 7, 8, 9 y 13 Providencia, Santiago Chile Fono: (56-2) 729 7000 Fax: (56-2) 374 9177 e-mail: deloittechile@deloitte.com www.deloitte.cl |
Enersis S.A.:
| Una firma miembro de Deloitte Touche Tohmatsu |
F - 4
Table of Contents
April 30, 2008
| Una firma miembro de Deloitte Touche Tohmatsu |
F - 5
Table of Contents
 | ||||||||||||||
| • | Huérfanos 770, 5° Piso | • | Teléfono | : | (56-2) 676 1000 | |||||||||
| Santiago, Chile | Fax | : | (56-2) 676 1010 | |||||||||||
| Casilla | : | 2823 | ||||||||||||
| ERNST & YOUNG LTDA. | /s/ Ernst & Young |
February 19, 2008
(except for Notes 30 and 32 for which the date is April 30, 2008)
F - 6
Table of Contents
| ||||||||||||||
| • | Huérfanos 770, 5° Piso | • | Teléfono | : | (56-2) 676 1000 | |||||||||
| Santiago, Chile | Fax | : | (56-2) 676 1010 | |||||||||||
| Casilla | : | 2823 | ||||||||||||
| ERNST & YOUNG LTDA. | /s/ Ernst & Young |
February 19, 2008
(except for Notes 30 and 32 for which the date is April 30, 2008)
F - 7
Table of Contents
| Deloitte & Touche Ltda. Cra. 7 N° 74 - 09 AA 075874 Nit. 860.005.813-4 Bogotá D.C. Colombia Tel: +57(1) 5461810 - 5461815 Fax: +57(1) 2178088 www.deloitte.com/co |
Emgesa S.A. E.S.P. (before Central Hidroelectrica de Betania S.A. E.S.P. and its subsidiary)
Bogotá, Colombia, March 7, 2008
DELOITTE & TOUCHE LTDA.
| Auditoría.lmpuestos.Consultoría.Finanzas Corporativas. | Una firma miembro de | |
| Deloitte Touche Tohmatsu |
F - 8
Table of Contents
| Deloitte & Touche S.R.L Florida 234, Piso 5° C1005AAF Ciudad Autónoma de Buenos Aires Argentina Tel: (54-11) 4320-2700 Fax: (54-11) 4325-8081/4326-7340 www.deloitte.com |
Endesa Argentina S.A.:
Buenos Aires, Argentina
March 27, 2008
F - 9
Table of Contents
| Deloitte Auditores y Consultores Ltda. RUT: 80.276.200-3 Av. Providencia 1760 Pisos 6, 7, 8, 9 y 13 Providencia, Santiago Chile Fono: (56-2) 729 7000 Fax: (56-2) 374 9177 e-mail: deloittechile@deloitte.com www.deloitte.cl |
Endesa Brasil S.A.
| Una firma miembro de | ||
| Deloitte Touche Tohmatsu |
F - 10
Table of Contents
Santiago, Chile
March 27, 2008
| Una firma miembro de | ||
| Deloitte Touche Tohmatsu |
F - 11
Table of Contents
| ||||||||
| • Praia de Botafogo, 300 - 13° andar | • | Fone: | (55) (21) 2109-1400 | |||||
| 22250-040 – Rio de Janeiro, RJ Brasil | Fax: | (55) (21) 2109-1400 | ||||||
| www.ey.com.br | ||||||||
Centrais Elétricas Cachoeira Dourada S.A. — CDSA
Auditores Independentes S.S.
Partner
F - 12
Table of Contents
| ||||||||
| • Praia de Botafogo, 300 - 13° andar | • | Fone: | (55) (21) 2109-1400 | |||||
| 22250-040 – Rio de Janeiro, RJ Brasil | Fax: | (55) (21) 2109-1400 | ||||||
| www.ey.com.br | ||||||||
Central Geradora Termelétrica Fortaleza — CGTF
Auditores Independentes S.S.
Partner
F - 13
Table of Contents
| ||||||||
| • Praia de Botafogo, 300 - 13° andar | • | Fone: | (55) (21) 2109-1400 | |||||
| 22250-040 – Rio de Janeiro, RJ Brasil | Fax: | (55) (21) 2109-1400 | ||||||
| www.ey.com.br | ||||||||
CIEN—Companhia de Interconexão Energética
CIEN—Companhia de Interconexão Energética at December 31, 2005, and the results of its operations and its cash flows for the three-month period ended December 31, 2005 in conformity with accounting principles generally accepted in Chile, which differ in certain respects from accounting principles generally accepted in the United States of America (see Note 24 to the financial statements).
Auditores Independentes S.S.
Partner
F - 14
Table of Contents
| ||||||||
| • Praia de Botafogo, 300 - 13° andar | • | Fone: | (55) (21) 2109-1400 | |||||
| 22250-040 – Rio de Janeiro, RJ Brasil | Fax: | (55) (21) 2109-1400 | ||||||
| www.ey.com.br | ||||||||
Centrais Elétricas Cachoeira Dourada — CDSA
Auditores Independentes S.S.
Partner
F - 15
Table of Contents
| ||||||||
| • Praia de Botafogo, 300 - 13° andar | • | Fone: | (55) (21) 2109-1400 | |||||
| 22250-040 – Rio de Janeiro, RJ Brasil | Fax: | (55) (21) 2109-1400 | ||||||
| www.ey.com.br | ||||||||
Central Geradora Termelétrica Fortaleza — CGTF
Auditores Independentes S.S.
Partner
F - 16
Table of Contents
| ||||||||
| • Praia de Botafogo, 300 - 13° andar | • | Fone: | (55) (21) 2109-1400 | |||||
| 22250-040 – Rio de Janeiro, RJ Brasil | Fax: | (55) (21) 2109-1400 | ||||||
| www.ey.com.br | ||||||||
CIEN — Companhia de Interconexão Energética
F - 17
Table of Contents
Auditores Independentes S.S.
Partner
F - 18
Table of Contents
| Deloitte & Touche S.R.L Florida 234, Piso 5° C1005AAF Ciudad Autónoma de Buenos Aires Argentina Tel: (54-11) 4320-2700 Fax: (54-11) 4325-8081/4326-7340 www.deloitte.com |
Transportadora de Energía S.A.:
Buenos Aires, Argentina
March 27, 2008
F - 19
Table of Contents
| Deloitte & Touche S.R.L Florida 234, Piso 5° C1005AAF Ciudad Autónoma de Buenos Aires Argentina Tel: (54-11) 4320-2700 Fax: (54-11) 4325-8081/4326-7340 www.deloitte.com |
Compañía de Transmisión del Mercosur S.A.:
Buenos Aires, Argentina
March 27, 2008
F - 20
Table of Contents
Chilean pesos of December 31, 2007, and thousands of US dollars)
| As of December 31, | ||||||||||||
| 2006 | 2007 | 2007 | ||||||||||
| ThCh$ | ThCh$ | ThUS$ | ||||||||||
ASSETS | ||||||||||||
| CURRENT ASSETS | ||||||||||||
| Cash | 107,178,991 | 81,979,611 | 164,985 | |||||||||
| Time deposits | 303,002,428 | 404,583,941 | 814,232 | |||||||||
| Marketable securities | 9,788,358 | 11,797,463 | 23,743 | |||||||||
| Accounts receivable, net | 901,208,837 | 987,383,472 | 1,987,127 | |||||||||
| Notes receivable, net | 8,020,849 | 11,839,116 | 23,826 | |||||||||
| Other accounts receivable, net | 108,526,853 | 99,770,021 | 200,789 | |||||||||
| Amounts due from related companies | 14,568,778 | 152,384,020 | 306,676 | |||||||||
| Inventories | 71,789,477 | 105,439,534 | 212,199 | |||||||||
| Taxes recoverable | 76,630,339 | 144,712,085 | 291,235 | |||||||||
| Prepaid expenses | 55,250,232 | 50,356,678 | 101,344 | |||||||||
| Deferred taxes | 66,111,520 | 68,409,142 | 137,675 | |||||||||
| Other current assets | 71,588,880 | 142,032,393 | 285,843 | |||||||||
| Total current assets | 1,793,665,542 | 2,260,687,476 | 4,549,674 | |||||||||
| PROPERTY, PLANT AND EQUIPMENT | ||||||||||||
| Land | 142,417,227 | 138,136,415 | 278,002 | |||||||||
| Buildings and infrastructure and works in progress | 11,772,969,596 | 11,269,879,056 | 22,680,833 | |||||||||
| Machinery and equipment | 2,134,240,240 | 1,984,794,585 | 3,994,435 | |||||||||
| Other plant and equipment | 674,281,014 | 533,413,209 | 1,073,504 | |||||||||
| Technical appraisal | 141,422,764 | 126,858,094 | 255,304 | |||||||||
| Accumulated depreciation | (6,179,423,073 | ) | (6,045,735,243 | ) | (12,167,150 | ) | ||||||
| Total property, plant and equipment, net | 8,685,907,768 | 8,007,346,116 | 16,114,928 | |||||||||
| OTHER ASSETS | ||||||||||||
| Investments in related companies | 123,445,231 | 59,195,644 | 119,132 | |||||||||
| Investments in other companies | 25,874,450 | 22,976,929 | 46,242 | |||||||||
| Goodwill, net | 703,536,585 | 641,178,413 | 1,290,383 | |||||||||
| Negative goodwill, net | (39,755,524 | ) | (37,394,320 | ) | (75,257 | ) | ||||||
| Long-term receivables | 147,653,188 | 195,537,843 | 393,524 | |||||||||
| Amounts due from related companies | 97,222,765 | 626,547 | 1,261 | |||||||||
| Deferred taxes | 13,155,686 | — | — | |||||||||
| Intangibles | 97,475,614 | 95,326,429 | 191,846 | |||||||||
| Accumulated amortization | (58,856,697 | ) | (59,911,980 | ) | (120,574 | ) | ||||||
| Other assets | 294,779,113 | 252,197,547 | 507,552 | |||||||||
| Total other assets | 1,404,530,411 | 1,169,733,052 | 2,354,109 | |||||||||
| TOTAL ASSETS | 11,884,103,721 | 11,437,766,644 | 23,018,711 | |||||||||
F - 21
Table of Contents
CONSOLIDATED BALANCE SHEETS
Chilean pesos of December 31, 2007, and thousands of US dollars)
| As of December 31, | ||||||||||||
| 2006 | 2007 | 2007 | ||||||||||
| ThCh$ | ThCh$ | ThUS$ | ||||||||||
LIABILITIES AND SHAREHOLDERS’ EQUITY | ||||||||||||
| CURRENT LIABILITIES: | ||||||||||||
| Short-term debt due to banks and financial institutions | 144,194,111 | 169,694,879 | 341,514 | |||||||||
| Current portion of long-term debt due to banks and financial Institutions | 105,769,447 | 129,310,857 | 260,241 | |||||||||
| Current portion of bonds payable | 121,584,960 | 366,034,697 | 736,652 | |||||||||
| Current portion of long-term notes payable | 36,540,686 | 24,183,692 | 48,670 | |||||||||
| Dividends payable | 80,213,385 | 32,885,815 | 66,183 | |||||||||
| Accounts payable | 397,090,406 | 514,755,846 | 1,035,955 | |||||||||
| Short-term notes payable | 16,890,479 | 15,961,727 | 32,123 | |||||||||
| Miscellaneous payables | 119,630,007 | 106,100,650 | 213,530 | |||||||||
| Amounts payable to related companies | 32,072,346 | 31,851,119 | 64,101 | |||||||||
| Accrued expenses | 85,222,581 | 85,055,952 | 171,177 | |||||||||
| Withholdings | 107,385,626 | 106,033,166 | 213,394 | |||||||||
| Income taxes payable | 156,915,030 | 18,343,075 | 36,916 | |||||||||
| Deferred income | 5,391,968 | 7,829,528 | 15,757 | |||||||||
| Other current liabilities | 97,574,529 | 132,218,175 | 266,091 | |||||||||
| Total current liabilities | 1,506,475,561 | 1,740,259,178 | 3,502,304 | |||||||||
| LONG-TERM LIABILITIES: | ||||||||||||
| Due to banks and financial institutions | 972,982,285 | 1,024,723,413 | 2,062,274 | |||||||||
| Bonds payable | 2,357,989,334 | 2,146,924,098 | 4,320,723 | |||||||||
| Long-term notes payable | 120,705,276 | 122,967,653 | 247,475 | |||||||||
| Miscellaneous payables | 165,166,253 | 143,948,640 | 289,699 | |||||||||
| Amounts payable to related companies | 12,082,887 | 8,161,792 | 16,426 | |||||||||
| Accrued expenses | 348,993,080 | 328,299,704 | 660,709 | |||||||||
| Deferred income taxes | — | 22,440,908 | 45,163 | |||||||||
| Other long-term liabilities | 235,115,670 | 255,064,580 | 513,322 | |||||||||
| Total long-term liabilities | 4,213,034,785 | 4,052,530,788 | 8,155,791 | |||||||||
| MINORITY INTEREST | 3,082,340,206 | 2,741,767,047 | 5,517,855 | |||||||||
| SHAREHOLDERS’ EQUITY: | ||||||||||||
| Paid-in capital, no par value | 2,594,015,458 | 2,594,015,458 | 5,220,502 | |||||||||
| Additional paid-in capital | 184,861,405 | 184,861,405 | 372,037 | |||||||||
| Other reserves | (255,979,636 | ) | (435,491,419 | ) | (876,434 | ) | ||||||
| Retained earnings | 291,354,472 | 388,982,534 | 782,834 | |||||||||
| Net income for the year | 307,121,433 | 188,376,410 | 379,111 | |||||||||
| Interim dividends | (38,924,762 | ) | (17,534,757 | ) | (35,289 | ) | ||||||
| Deficit of subsidiaries in development stage | (195,201 | ) | — | — | ||||||||
| �� | ||||||||||||
| Total shareholders’ equity | 3,082,253,169 | 2,903,209,631 | 5,842,761 | |||||||||
| TOTAL LIABILITIES AND SHAREHOLDERS’ EQUITY | 11,884,103,721 | 11,437,766,644 | 23,018,711 | |||||||||
F - 22
Table of Contents
Chilean pesos of December 31, 2007, and thousands of US dollars)
| For the years ended December 31, | ||||||||||||||||
| 2005 | 2006 | 2007 | 2007 | |||||||||||||
| ThCh$ | ThCh$ | ThCh$ | ThUS$ | |||||||||||||
| OPERATING INCOME: | ||||||||||||||||
| SALES | 3,533,450,059 | 4,155,844,703 | 4,686,675,559 | 9,432,018 | ||||||||||||
| COST OF SALES | (2,399,515,599 | ) | (2,782,687,091 | ) | (3,163,865,117 | ) | (6,367,335 | ) | ||||||||
| GROSS PROFIT | 1,133,934,460 | 1,373,157,612 | 1,522,810,442 | 3,064,683 | ||||||||||||
| ADMINISTRATIVE AND SELLING EXPENSES | (243,970,734 | ) | (241,526,970 | ) | (267,243,749 | ) | (537,833 | ) | ||||||||
| OPERATING INCOME | 889,963,726 | 1,131,630,642 | 1,255,566,693 | 2,526,850 | ||||||||||||
| NON-OPERATING INCOME AND EXPENSE: | ||||||||||||||||
| Interest income | 94,452,404 | 139,286,384 | 116,407,766 | 234,273 | ||||||||||||
| Equity in income of related companies | 15,860,236 | 5,546,450 | 2,732,317 | 5,499 | ||||||||||||
| Other non-operating income | 73,286,949 | 113,673,478 | 199,327,497 | 401,150 | ||||||||||||
| Equity in loss of related companies | (8,463,062 | ) | (134,628 | ) | (57,493,370 | ) | (115,707 | ) | ||||||||
| Amortization of goodwill | (60,514,060 | ) | (60,045,277 | ) | (59,814,172 | ) | (120,377 | ) | ||||||||
| Interest expense | (384,527,149 | ) | (419,622,162 | ) | (407,285,992 | ) | (819,670 | ) | ||||||||
| Other non-operating expenses | (173,337,268 | ) | (224,762,650 | ) | (348,716,130 | ) | (701,798 | ) | ||||||||
| Price-level restatement, net | (5,422,442 | ) | 1,306,844 | (10,803,572 | ) | (21,742 | ) | |||||||||
| Exchange difference, net | (6,844,633 | ) | 5,721,747 | 6,786,479 | 13,658 | |||||||||||
| NON-OPERATING EXPENSE, NET | (455,509,025 | ) | (439,029,814 | ) | (558,859,177 | ) | (1,124,714 | ) | ||||||||
| INCOME BEFORE INCOME TAXES, MINORITY INTEREST AND AMORTIZATION OF NEGATIVE GOODWILL | 434,454,701 | 692,600,828 | 696,707,516 | 1,402,136 | ||||||||||||
| INCOME TAXES | (190,983,412 | ) | (102,256,730 | ) | (253,147,436 | ) | (509,463 | ) | ||||||||
| INCOME (LOSS) BEFORE MINORITY INTEREST AND AMORTIZATION OF NEGATIVE GOODWILL | 243,471,289 | 590,344,098 | 443,560,080 | 892,673 | ||||||||||||
| MINORITY INTEREST | (185,879,944 | ) | (289,749,961 | ) | (259,605,529 | ) | (522,461 | ) | ||||||||
| INCOME (LOSS) BEFORE AMORTIZATION OF NEGATIVE GOODWILL | 57,591,345 | 300,594,137 | 183,954,551 | 370,212 | ||||||||||||
| AMORTIZATION OF NEGATIVE GOODWILL | 16,992,820 | 6,527,296 | 4,421,859 | 8,899 | ||||||||||||
| NET INCOME FOR THE YEAR | 74,584,165 | 307,121,433 | 188,376,410 | 379,111 | ||||||||||||
F - 23
Table of Contents
Chilean pesos of December 31, 2007, and thousands of US dollars)
| For the years ended December 31, | ||||||||||||||||
| 2005 | 2006 | 2007 | 2007 | |||||||||||||
| ThCh$ | ThCh$ | ThCh$ | ThUS$ | |||||||||||||
| Net income for the year | 74,584,165 | 307,121,433 | 188,376,410 | 379,111 | ||||||||||||
| GAIN (LOSSES) FROM SALES OF ASSETS: | ||||||||||||||||
| Losses (gain) on sale of property, plant and equipment | 1,192,666 | (19,947,183 | ) | (562,731 | ) | (1,133 | ) | |||||||||
| Gain on sale of investments | — | — | (3,077,984 | ) | (6,194 | ) | ||||||||||
| Gain on sale of other assets | (289,801 | ) | (290,967 | ) | (568,995 | ) | (1,145 | ) | ||||||||
| Charges (credits) to income which do not represent cash flows: | ||||||||||||||||
| Depreciation | 403,119,542 | 445,298,395 | 416,692,881 | 838,602 | ||||||||||||
| Amortization of intangibles | 9,114,585 | 8,440,982 | 8,733,850 | 17,577 | ||||||||||||
| Write-offs and accrued expenses | 61,153,232 | 27,992,780 | 52,431,844 | 105,520 | ||||||||||||
| Equity in income of related companies | (15,860,236 | ) | (5,546,450 | ) | (2,732,317 | ) | (5,499 | ) | ||||||||
| Equity in loss of related companies | 8,463,062 | 134,628 | 57,493,370 | 115,707 | ||||||||||||
| Amortization of goodwill | 60,514,060 | 60,045,277 | 59,814,172 | 120,377 | ||||||||||||
| Amortization of negative goodwill | (16,992,819 | ) | (6,527,296 | ) | (4,421,859 | ) | (8,899 | ) | ||||||||
| Price-level restatement, net | 5,422,442 | (1,306,844 | ) | 10,803,572 | 21,742 | |||||||||||
| Exchange difference, net | 6,844,633 | (5,721,747 | ) | (6,786,479 | ) | (13,658 | ) | |||||||||
| Other credits to income which do not represent cash flows | (29,098,526 | ) | (16,315,444 | ) | (53,730,500 | ) | (108,133 | ) | ||||||||
| Other charges to income which do not represent cash flows | 94,015,314 | 73,902,631 | 204,009,880 | 410,572 | ||||||||||||
| Changes in assets which affect operating cash flows: | ||||||||||||||||
| Decrease (increase) in trade receivables | (85,128,384 | ) | (193,956,180 | ) | (216,050,555 | ) | (434,806 | ) | ||||||||
| Decrease (increase) in inventory | (21,797,219 | ) | 5,011,884 | (30,585,338 | ) | (61,554 | ) | |||||||||
| Decrease (increase) in other assets | 29,691,002 | (104,362,820 | ) | (66,934,474 | ) | (134,707 | ) | |||||||||
| Changes in liabilities which affect operating cash flows: | ||||||||||||||||
| Increase (decrease) in accounts payable associated with operating results | 19,477,150 | 156,946,384 | 233,699,604 | 470,325 | ||||||||||||
| Increase (decrease) in interest payable | 39,649,652 | 29,991,724 | 30,089,971 | 60,557 | ||||||||||||
| Increase (decrease) in income tax payable | 49,099,925 | (32,879,227 | ) | (96,770,840 | ) | (194,753 | ) | |||||||||
| Increase (decrease) in other accounts payable associated with operating results | 45,612,435 | (39,663,944 | ) | (15,723,876 | ) | (31,645 | ) | |||||||||
| Net (increase) in value added tax and other similar taxes payable | (25,569,761 | ) | (51,891,419 | ) | (69,370,824 | ) | (139,610 | ) | ||||||||
| Income attributable to minority interest | 185,879,944 | 289,749,961 | 259,605,529 | 522,461 | ||||||||||||
| Net cash flows provided by operating activities | 899,097,063 | 926,226,558 | 954,434,311 | 1,920,815 | ||||||||||||
| CASH FLOWS FROM FINANCING ACTIVITIES: | ||||||||||||||||
| Proceeds from the issuance of debt | 439,489,161 | — | 2,820,189 | 5,676 | ||||||||||||
| Proceeds from bond issuances | 183,206,329 | 1,368,499,397 | 869,561,904 | 1,750,009 | ||||||||||||
| Other sources of financing | 742,515 | 178,976,706 | 363,114,713 | 730,775 | ||||||||||||
| Distribution of capital in subsidiary | (133,133,252 | ) | (91,851,542 | ) | (14,339,987 | ) | (28,859 | ) | ||||||||
| Dividends paid | (302,553,363 | ) | (191,825,479 | ) | (553,116,614 | ) | (1,113,157 | ) | ||||||||
| Payment of debt | (864,519,052 | ) | (1,062,289,729 | ) | (713,170,383 | ) | (1,435,269 | ) | ||||||||
| Payment of bonds | (121,226,128 | ) | (503,548,490 | ) | (129,596,682 | ) | (260,816 | ) | ||||||||
| Payment of loans obtained from related companies | (2,828,287 | ) | (8,675,671 | ) | (2,374,719 | ) | (4,779 | ) | ||||||||
| Payment of bond issuance costs | (984,335 | ) | (537,063 | ) | — | — | ||||||||||
| Other disbursements for financing | (19,010,186 | ) | (7,822,642 | ) | (1,380,797 | ) | (2,779 | ) | ||||||||
| Net cash used in financing activities | (820,816,598 | ) | (319,074,513 | ) | (178,482,376 | ) | (359,199 | ) | ||||||||
| CASH FLOWS FROM INVESTING ACTIVITIES: | ||||||||||||||||
| Proceeds from sales of property, plant and equipment | 6,682,050 | 47,847,295 | 3,755,584 | 7,558 | ||||||||||||
| Sales of investment in related companies | 1,829,591 | 53,049 | 8,373,539 | 16,852 | ||||||||||||
| Payments received from notes receivable from related companies | 8,633,163 | 2,997,252 | — | — | ||||||||||||
| Other receipts from investments | 7,778,683 | 2,053,906 | 44,102,997 | 88,758 | ||||||||||||
| Liquidation of subsidiary (see note 11 h) iv)) | — | (4,425,890 | ) | — | — | |||||||||||
| Additions to property, plant and equipment | (348,100,160 | ) | (556,083,204 | ) | (594,055,321 | ) | (1,195,547 | ) | ||||||||
| Long-term investments in related companies | (36,341,503 | ) | (24,219,165 | ) | (38,182,150 | ) | (76,842 | ) | ||||||||
| Documented loans to related companies | — | — | (4,441,474 | ) | (8,939 | ) | ||||||||||
| Other loans to related companies | — | — | (38,730,510 | ) | (77,946 | ) | ||||||||||
| Other investment disbursements | (3,136,265 | ) | (13,472,337 | ) | (72,360,024 | ) | (145,626 | ) | ||||||||
| Net cash used in investing activities | (362,654,441 | ) | (545,249,094 | ) | (691,537,359 | ) | (1,391,732 | ) | ||||||||
| POSITIVE (NEGATIVE) NET CASH FLOW FOR THE PERIOD | (284,373,976 | ) | 61,902,951 | 84,414,576 | 169,886 | |||||||||||
| EFFECT OF PRICE-LEVEL RESTATEMENT ON CASH AND CASH EQUIVALENTS | (22,990,227 | ) | 15,657,549 | 19,449,757 | 39,143 | |||||||||||
| NET INCREASE (DECREASE) IN CASH AND CASH EQUIVALENTS | (307,364,203 | ) | 77,560,500 | 103,864,333 | 209,029 | |||||||||||
| CASH AND CASH EQUIVALENTS AT BEGINNING OF THE YEAR | 621,678,000 | 395,096,571 | 472,657,071 | 951,231 | ||||||||||||
| Additional cash resulting from creation of Endesa Brasil (see note 11 (f) i) | 80,782,774 | — | — | — | ||||||||||||
| CASH AND CASH EQUIVALENTS AT END OF THE YEAR | 395,096,571 | 472,657,071 | 576,521,404 | 1,160,260 | ||||||||||||
F - 24
Table of Contents
| Additional | Deficit of | |||||||||||||||||||||||||||||||
| Paid-in | paid-in | Other | Retained | subsidiaries in | Interim | Net income | ||||||||||||||||||||||||||
| capital | capital | reserves | earnings | development stage | dividends | for the year | Total | |||||||||||||||||||||||||
| ThCh$ | ThCh$ | ThCh$ | ThCh$ | ThCh$ | ThCh$ | ThCh$ | ThCh$ | |||||||||||||||||||||||||
| As of January 1, 2005 | 2,283,404,124 | 162,725,820 | (122,588,994 | ) | 194,378,259 | (2,673,664 | ) | — | 44,307,596 | 2,559,553,142 | ||||||||||||||||||||||
| Transfer of prior year income to retained earnings | — | — | — | 41,633,932 | 2,673,664 | — | (44,307,596 | ) | — | |||||||||||||||||||||||
| Investment equity variations | — | — | (5,851,418 | ) | — | — | — | — | (5,851,418 | ) | ||||||||||||||||||||||
| Dividend paid | — | — | — | (13,600,517 | ) | — | — | — | (13,600,517 | ) | ||||||||||||||||||||||
| Cumulative translation adjustment | — | — | (97,676,664 | ) | — | — | — | — | (97,676,664 | ) | ||||||||||||||||||||||
| Reserve Technical Bulletin No. 72 | — | — | (6,197,072 | ) | — | — | — | — | (6,197,072 | ) | ||||||||||||||||||||||
| Price-level restatement | 82,202,548 | 5,858,130 | (4,413,203 | ) | 7,979,618 | — | — | — | 91,627,092 | |||||||||||||||||||||||
| Net income for the year | — | — | — | — | — | — | 68,016,865 | 68,016,865 | ||||||||||||||||||||||||
| As of December 31, 2005 | 2,365,606,672 | 168,583,950 | (236,727,351 | ) | 230,391,292 | — | — | 68,016,865 | 2,595,871,428 | |||||||||||||||||||||||
| As of December 31, 2005(1) | 2,594,015,458 | 184,861,406 | (259,584,324 | ) | 252,636,493 | — | — | 74,584,165 | 2,846,513,198 | |||||||||||||||||||||||
| As of January 1, 2006 | 2,365,606,672 | 168,583,950 | (236,727,351 | ) | 230,391,292 | — | — | 68,016,865 | 2,595,871,428 | |||||||||||||||||||||||
| Transfer of prior year income to retained earnings | — | — | — | 68,016,865 | — | — | (68,016,865 | ) | — | |||||||||||||||||||||||
| Investment equity variations | — | — | (10,585,093 | ) | — | — | — | — | (10,585,093 | ) | ||||||||||||||||||||||
| Accumulated deficit of subsidiaries in development stage | — | — | — | — | (181,751 | ) | — | — | (181,751 | ) | ||||||||||||||||||||||
| Final dividend 2005 | — | — | — | (32,651,166 | ) | — | — | — | (32,651,166 | ) | ||||||||||||||||||||||
| Cumulative translation adjustment | — | — | 14,766,794 | — | — | — | — | 14,766,794 | ||||||||||||||||||||||||
| Reserve Technical Bulletin No. 72 | — | — | (825,381 | ) | — | — | — | — | (825,381 | ) | ||||||||||||||||||||||
| Price-level restatement | 49,677,740 | 3,540,263 | (4,971,274 | ) | 5,522,778 | — | — | — | 53,769,507 | |||||||||||||||||||||||
| Interim dividend | — | — | — | — | — | (36,242,795 | ) | — | (36,242,795 | ) | ||||||||||||||||||||||
| Net income for the year | — | — | — | — | — | — | 285,960,366 | 285,960,366 | ||||||||||||||||||||||||
| As of December 31, 2006 | 2,415,284,412 | 172,124,213 | (238,342,305 | ) | 271,279,769 | (181,751 | ) | (36,242,795 | ) | 285,960,366 | 2,869,881,909 | |||||||||||||||||||||
| As of December 31, 2006 (1) | 2,594,015,458 | 184,861,405 | (255,979,636 | ) | 291,354,472 | (195,201 | ) | (38,924,762 | ) | 307,121,433 | 3,082,253,169 | |||||||||||||||||||||
| As of January 1, 2007 | 2,415,284,412 | 172,124,213 | (238,342,305 | ) | 271,279,769 | (181,751 | ) | (36,242,795 | ) | 285,960,366 | 2,869,881,909 | |||||||||||||||||||||
| Transfer of prior year income to retained earnings | — | — | — | 249,535,820 | 181,751 | 36,242,795 | (285,960,366 | ) | — | |||||||||||||||||||||||
| Investment equity variations | — | — | (7,702,898 | ) | — | — | — | — | (7,702,898 | ) | ||||||||||||||||||||||
| Final dividend 2006 | — | — | — | (159,675,172 | ) | — | — | — | (159,675,172 | ) | ||||||||||||||||||||||
| Reserve Technical Bulletin No. 72 | — | — | (56,695,443 | ) | — | — | — | — | (56,695,443 | ) | ||||||||||||||||||||||
| Cumulative translation adjustment | — | — | (115,113,442 | ) | — | — | — | — | (115,113,442 | ) | ||||||||||||||||||||||
| Price-level restatement | 178,731,046 | 12,737,192 | (17,637,331 | ) | 27,842,117 | — | (190,784 | ) | — | 201,482,240 | ||||||||||||||||||||||
| Interim dividend | — | — | — | — | — | (17,343,973 | ) | — | (17,343,973 | ) | ||||||||||||||||||||||
| Net income for the year | — | — | — | — | — | — | 188,376,410 | 188,376,410 | ||||||||||||||||||||||||
| As of December 31, 2007 | 2,594,015,458 | 184,861,405 | (435,491,419 | ) | 388,982,534 | — | (17,534,757 | ) | 188,376,410 | 2,903,209,631 | ||||||||||||||||||||||
| As of December 31, 2007 (2) | 5,220,502 | 372,037 | (876,434 | ) | 782,834 | — | (35,289 | ) | 379,111 | 5,842,761 | ||||||||||||||||||||||
| (1) | Restated in thousands of constant Chilean pesos as of December 31, 2007. | |
| (2) | Expressed in thousands of US$ as of December 31, 2007 | |
| The accompanying notes are an integral part of these consolidated financial statements. | ||
F - 25
Table of Contents
Chilean pesos of December 31, 2007, except as stated)
As of and for the years ended December 31, 2005, 2006 and 2007
| a) | General | |
| (i) | The consolidated financial statements of the Company have been prepared in accordance with generally accepted accounting principles in Chile and the regulations established by the SVS (collectively “Chilean GAAP”), and the specific corporate regulations of Law No.18,046, related to the formation, registration and liquidation of Chilean corporations, among others. Certain amounts in the prior year’s financial statements have been reclassified to conform to the current year’s presentation. | |
| The preparation of financial statements in conformity with Chilean GAAP requires management to make estimates and assumptions that affect the reported amounts of assets and liabilities, disclosures of contingent assets and liabilities as of the date of the financial statements, and the reported amounts of revenues and expenses during the reporting year. Actual results could differ from those estimates. | ||
| In certain cases generally accepted accounting principles in Chile require that assets or liabilities be recorded or disclosed at their fair values. The fair value is the amount at which an asset could be bought or sold or the amount at which a liability could be incurred or settled in a current transaction between willing parties, other than in a forced or liquidation sale. Where available, quoted market prices in active markets have been used as the basis for the measurement; however, where quoted market prices in active markets are not available, the Company has estimated such values based on the best information available, including using modeling and other valuation techniques. |
F - 26
Table of Contents
| (ii) | Reclassifications —For purposes of comparison, the following reclassifications were made in the 2005 and 2006 financial statements: |
| 2005 Statement of operations reclassifications | ||||||||||
| Charges | Credits | |||||||||
| ThCh$ | ThCh$ | |||||||||
| Sales | 3,385,164 | Administrative and selling expenses | 3,385,164 | |||||||
| Other non-operating expenses | 4,539,012 | Income taxes | 4,539,012 | |||||||
| 2006 Balance sheet reclassifications | ||||||||||
| Charges | Credits | |||||||||
| ThCh$ | ThCh$ | |||||||||
| Inventories | 1,003,656 | Other accounts receivable, net | 1,395,571 | |||||||
| Investments in related companies | 352,011 | Other long term liabilities | 352,011 | |||||||
| Income tax recoverable | 31,229,752 | Other long term assets | 27,409,678 | |||||||
| Buildings and infrastructure | 27,745,609 | Income tax payables | 3,428,159 | |||||||
| Other fixed assets | 21,840,519 | Technical appraisal | 58,408,028 | |||||||
| Accumulated depreciation | 8,821,900 | |||||||||
| 2006 Statement of income reclassifications | ||||||||||
| Charges | Credits | |||||||||
| ThCh$ | ThCh$ | |||||||||
| Interest income | 5,260,636 | Sales | 24,232,820 | |||||||
| Income tax | 15,247,327 | Other non-operating income | 5,060,041 | |||||||
| Cost of sales | 3,745,825 | Interest expenses | 971 | |||||||
| Administrative and selling expenses | 5,040,044 | |||||||||
F - 27
Table of Contents
| (iii) | The accompanying financial statements reflect the consolidated results of operations of Enersis S.A. and its subsidiaries. All significant intercompany transactions have been eliminated in consolidation. Investments in companies in the development stage are accounted for using the equity method, except that income or losses are included directly in equity instead of being reflected in the Company’s consolidated statement of operations. The Company consolidates the financial statements of companies in which it controls over 50% of the voting shares, provided there are no substantive minority participating rights that prevent control, as detailed as follows: |
| Percentage participation in voting rights as of December 31, | ||||||||||||||||||||||||
| 2005 | 2006 | 2007 | ||||||||||||||||||||||
| Company | Economic | Voting | Economic | Voting | Economic | Voting | ||||||||||||||||||
| Chilectra S.A. (1) | 98.24 | 98.24 | — | — | — | — | ||||||||||||||||||
| Synapsis Soluciones y Servicios IT Ltda. | 100.00 | 100.00 | 100.00 | 100.00 | 100.00 | 100.00 | ||||||||||||||||||
| Inmobiliaria Manso de Velasco Ltda. | 100.00 | 100.00 | 100.00 | 100.00 | 100.00 | 100.00 | ||||||||||||||||||
| Cía. Americana de Multiservicios Ltda. | 100.00 | 100.00 | 100.00 | 100.00 | 100.00 | 100.00 | ||||||||||||||||||
| Endesa Chile | 59.98 | 59.98 | 59.98 | 59.98 | 59.98 | 59.98 | ||||||||||||||||||
| Chilectra S.A. (former Elesur) (1) | 100.00 | 100.00 | 99.09 | 99.09 | 99.09 | 99.09 | ||||||||||||||||||
| Enersis Internacional Ltda. (5) | 100.00 | 100.00 | — | — | — | — | ||||||||||||||||||
| Inversiones Distrilima S.A. | 55.68 | 68.39 | 55.91 | 68.39 | 55.90 | 68.39 | ||||||||||||||||||
| Empresa Distribuidora Sur S.A. (Edesur) | 65.09 | 65.88 | 65.39 | 65.88 | 65.39 | 65.88 | ||||||||||||||||||
| Codensa S.A. (2) | 21.66 | 25.71 | 21.73 | 25.71 | 21.73 | 25.71 | ||||||||||||||||||
| Investluz (3) | 59.45 | 100.00 | 59.51 | 100.00 | 59.51 | 100.00 | ||||||||||||||||||
| Ampla Energía e Serviços S.A. | 69.64 | 91.93 | 69.88 | 91.93 | 69.88 | 91.93 | ||||||||||||||||||
| Ampla Investimentos e Serviços S.A. | 69.64 | 91.93 | 69.88 | 91.93 | 69.88 | 91.93 | ||||||||||||||||||
| Compañía de Interconexión Energética S.A. (Cien) (4) | 53.61 | 100.00 | 53.57 | 100.00 | 53.57 | 100.00 | ||||||||||||||||||
| Central Geradora Termeléctrica Fortaleza S.A. (4) | 53.61 | 100.00 | 53.57 | 100.00 | 53.57 | 100.00 | ||||||||||||||||||
| Endesa Brasil S.A. (4) | 53.61 | 71.52 | 53.57 | 71.52 | 53.57 | 71.52 | ||||||||||||||||||
| Cachoeira Dourada S.A. | 53.61 | 99.61 | 53.36 | 99.61 | 53.36 | 99.61 | ||||||||||||||||||
| (1) | In the extraordinary meeting of Elesur S.A., held on March 31, 2006, shareholders approved the name change. The merger of Chilectra (formerly Elesur) and Chilectra S.A., approved in general meetings of their shareholders held on March 31, 2006, became effective on April 1, 2006. | |
| On May 27, 2004, 99.9989% of Elesur S.A. was purchased, therefore, as from that date it is consolidated into Enersis S.A. financial statements. | ||
| (2) | Codensa S.A. is consolidated because of the majority presence on the board of directors, obtained through the shareholders’ agreement of January 27, 2004, between Endesa Internacional and Enersis S.A. | |
| (3) | Investluz is Parent Company of Companhia Energética do Céará S.A. Coelce. | |
| (4) | As a result of the creation of the Brazilian holding company, Endesa Brasil S.A. (“Endesa Brasil”) (see Note 11.(f) i, this company and its subsidiaries were included in the consolidated financial statements of Enersis S.A. | |
| The following pro forma income statement information for the year ended December 31, 2005 gives effect to the acquisition of additional shareholding in these subsidiaries as if it took place on January 1, 2005. The pro forma information is not necessarily indicative of what would have occurred if the acquisitions had been in effect for the periods presented, nor is it intended to be a projection of future results. | ||
| (5) | On September 21, 2006, Enersis Internacional ceased to exist. Its assets and liabilities were awarded to Agencia Enersis. Due to the above, the following investments in related companies were awarded to Agencia Enersis: 33,336,890 shares of Distrilec Inversora S.A., equivalent to 6.76%; 56,008,787 shares of Inversiones Distrilima S.A., equivalent to 12.21%; 98,539 shares of Compañía Peruana de Electricidad S.A., equivalent to 0.1%; 536,591,907,867 shares of Ampla Energia e Serviços S.A., equivalent to 13.68%; 1,641,574,700 shares of Ampla Investimentos e Serviços S.A., equivalent to 13.68%, and 450 rights of Synapsis Argentina S.R.L, equivalent to 0.12%. |
F - 28
Table of Contents
| As of December 31, | ||||||||||||
| 2005 | 2006 | 2007 | ||||||||||
| (Proforma) | ||||||||||||
| ThCh$ | ThCh$ | ThCh$ | ||||||||||
| OPERATING INCOME | ||||||||||||
| Sales | 3,619,354,175 | 4,155,844,703 | 4,686,675,559 | |||||||||
| Cost of sales | (2,418,598,200 | ) | (2,782,687,091 | ) | (3,163,865,117 | ) | ||||||
| Gross profit | 1,200,755,975 | 1,373,157,612 | 1,522,810,442 | |||||||||
| Administrative and selling expenses | (247,583,473 | ) | (241,526,970 | ) | (267,243,749 | ) | ||||||
| Operating income | 953,172,502 | 1,131,630,642 | 1,255,566,693 | |||||||||
| Non operating expenses-net | (499,630,983 | ) | (439,029,814 | ) | (558,859,177 | ) | ||||||
| Income before income taxes | 453,541,519 | 692,600,828 | 696,707,516 | |||||||||
| Income taxes | (213,617,291 | ) | (102,256,730 | ) | (253,147,436 | ) | ||||||
| Income before minority interest | 239,924,228 | 590,344,098 | 443,560,080 | |||||||||
| Minority interest | (182,332,882 | ) | (289,749,961 | ) | (259,605,529 | ) | ||||||
| Income before amortization of negative goodwill | 57,591,346 | 300,594,137 | 183,954,551 | |||||||||
| Amortization of negative goodwill | 16,992,819 | 6,527,296 | 4,421,859 | |||||||||
| Net income of the year | 74,584,165 | 307,121,433 | 188,376,410 | |||||||||
| (1) | To allow comparison with the years 2007 and 2006, results for the entire year 2005 is presented. |
F - 29
Table of Contents
| (iv) | Consolidated subsidiaries of Endesa Chile. are detailed as follows: |
| Percentage participation in voting | ||||||||||||||||||||||
| rights as of December 31, | ||||||||||||||||||||||
| Company name | Country | 2005 | 2006 | 2007 | ||||||||||||||||||
| Total | Total | Direct | Indirect | Total | ||||||||||||||||||
| % | % | % | % | % | ||||||||||||||||||
| Enigesa S.A. | Chile | 100.00 | 100.00 | 99.51 | 0.49 | 100.00 | ||||||||||||||||
| Ingendesa S.A. (1) | Chile | 100.00 | 100.00 | 98.75 | 1.25 | 100.00 | ||||||||||||||||
| Pehuenche S.A. | Chile | 92.65 | 92.65 | 92.65 | — | 92.65 | ||||||||||||||||
| Endesa Argentina S.A. | Argentina | 99.99 | 99.99 | 99.66 | 0.33 | 99.99 | ||||||||||||||||
| Endesa Chile Internacional (2) | Chile | 100.00 | 100.00 | — | — | — | ||||||||||||||||
| Pangue S.A.(3) | Chile | 94.99 | 94.99 | 94.98 | 0.01 | 94.99 | ||||||||||||||||
| Hidroinvest S.A. (11) | Argentina | 69.93 | 69.93 | 41.94 | 54.15 | 96.09 | ||||||||||||||||
| Hidroeléctrica El Chocón S.A. (12) | Argentina | 65.19 | 65.19 | 2.48 | 65.19 | 67.67 | ||||||||||||||||
| Endesa Costanera S.A. (13) | Argentina | 64.26 | 64.26 | 12.33 | 57.44 | 69.77 | ||||||||||||||||
| Endesa Brasil Participacoes Ltda. | Brazil | 100.00 | 100.00 | 5.00 | 95.00 | 100.00 | ||||||||||||||||
| Túnel El Melón S.A. (16) | Chile | 99.96 | 99.99 | 99.99 | 0.01 | 100.00 | ||||||||||||||||
| Compañía Eléctrica Cono Sur S.A. | Panama | 100.00 | 100.00 | 100.00 | — | 100.00 | ||||||||||||||||
| Central Hidroeléctrica Betania S.A. (4) | Colombia | 85.62 | 99.99 | — | — | — | ||||||||||||||||
| Capital de Energía S.A. (5) | Colombia | 51.00 | — | — | — | — | ||||||||||||||||
| Emgesa S.A. (6), (8) | Colombia | 51.32 | 23.45 | 1.44 | 25.43 | 26.87 | ||||||||||||||||
| Edegel S.A. (9) | Peru | 63.56 | 55.44 | — | 55.44 | 55.44 | ||||||||||||||||
| Generandes Perú S.A. | Peru | 59.63 | 59.63 | — | 59.63 | 59.63 | ||||||||||||||||
| Compañía Eléctrica San Isidro S.A. (7) | Chile | 100.00 | 100.00 | 100.00 | — | 100.00 | ||||||||||||||||
| Compañía Eléctrica Tarapacá S.A. | Chile | 100.00 | 100.00 | 99.94 | 0.06 | 100.00 | ||||||||||||||||
| Inversiones Endesa Norte S.A. | Chile | 100.00 | 100.00 | 99.99 | 0.01 | 100.00 | ||||||||||||||||
| Ingendesa Do Brasil Limitada | Brazil | 100.00 | 100.00 | — | 100.00 | 100.00 | ||||||||||||||||
| Endesa Eco S.A. (10) | Chile | 100.00 | 100.00 | 99.99 | 0.01 | 100.00 | ||||||||||||||||
| Southern Cone Power Argentina S.A.(14) | Argentina | — | — | 98.00 | 2.00 | 100.00 | ||||||||||||||||
| Central Eólica Canela S.A.(15) | Chile | — | — | — | 75.00 | 75.00 | ||||||||||||||||
| (1) | See Note 11 (f) ii | |
| (2) | See Note 11 (f) v | |
| (3) | See Note 11 (g) ii | |
| (4) | See Note 11 (f) vi, Note 11 (g) iv | |
| (5) | See Note 11 (h) iv | |
| (6) | Endesa Chile exercises control over this company pursuant to a shareholders’ agreement. | |
| (7) | See Note 11(f) iii, Note 11 (g) i, Note 11 (h) ii | |
| (8) | See Note 11 (f) vi, Note 11 (g) iv, Note 11 (h) iv | |
| (9) | See Note 11 (g) iii | |
| (10) | See Note 11 (e) i | |
| (11) | See Note 11 (g) vi | |
| (12) | See Note 11 (g) vi | |
| (13) | See Note 11 (g) v | |
| (14) | See Note 11 (g) v | |
| (15) | See Note 11 (e) iv | |
| (16) | See Note 11 (g) vii |
F - 30
Table of Contents
| Percentage of economic | ||||||||||||
| participation as of December 31, | ||||||||||||
| 2005 | 2006 | 2007 | ||||||||||
| % | % | �� | % | |||||||||
| Emgesa S.A. (1) | 22.36 | 23.45 | 26.87 | |||||||||
| Edegel S.A. (2) | 37.90 | 33.06 | 33.06 | |||||||||
| Capital de Energía S.A. (3) | 43.59 | — | — | |||||||||
| Hidroeléctrica El Chocón S.A. (4) | 47.45 | 47.45 | 65.37 | |||||||||
| (1) | See Note 11 (f) vi, Note 11 (g) iv, Note 11 (h) iv, subsequent to the mergers in 2007, voting rights are equal to economic interest. | |
| (2) | See Note 11 (g) iii. | |
| (3) | See Note 11 (h) iv. | |
| (4) | See Note 11 (g) vi |
| b) | Years covered |
| c) | Constant currency restatement |
F - 31
Table of Contents
| Change over | ||||||||
| Previous | ||||||||
| Index | November 30, | |||||||
| November 30, 2005 | 100.00 | 3.6 | % | |||||
| November 30, 2006 | 102.10 | 2.1 | % | |||||
| November 30, 2007 | 109.67 | 7.4 | % | |||||
| Change over | ||||||||
| Previous | ||||||||
| Index | December 31, | |||||||
| December 31, 2005 | 100.00 | 3.7 | % | |||||
| December 31, 2006 | 103.67 | 2.6 | % | |||||
| December 31, 2007 | 111.76 | 7.8 | % | |||||
| Ch$ | ||||
| December 31, 2005 | 17,974.81 | |||
| December 31, 2006 | 18,336.38 | |||
| December 31, 2007 | 19.622,66 | |||
F - 32
Table of Contents
| d) | Assets and liabilities in foreign currencies |
| Symbol | As of December 31, | |||||||||||||
| Currency | Used | 2005 | 2006 | 2007 | ||||||||||
| Ch$ | Ch$ | Ch$ | ||||||||||||
| United States dollar | US$ | 512.50 | 532.39 | 496.89 | ||||||||||
| British pound sterling | £ | 880.43 | 1,041.86 | 989.43 | ||||||||||
| Colombian peso | $Col | 0.22 | 0.24 | 0.25 | ||||||||||
| New Peruvian sol | Soles | 149.42 | 166.58 | 165.96 | ||||||||||
| Brazilian real | Rs | 219.02 | 249.01 | 280.32 | ||||||||||
| Japanese yen | ¥ | 4.34 | 4.47 | 4.41 | ||||||||||
| Euro | € | 606.08 | 702.08 | 730.94 | ||||||||||
| Unidad de Fomento (UF) | UF | 17,974.81 | 18,336.38 | 19,622.66 | ||||||||||
| Argentine peso | $Arg | 181.92 | 173.87 | 157.79 | ||||||||||
| e) | Time deposits and marketable securities |
| f) | Allowance for doubtful accounts |
F - 33
Table of Contents
| g) | Inventories |
| h) | Property, plant and equipment |
| i) | Depreciation |
| Useful life | ||||
| Table | in years | |||
| Distribution and transmission lines network | 20 - 50 | |||
| Substations | 20 - 40 | |||
| Public lighting | 20 - 50 | |||
| Generator and turbines | 20 - 40 | |||
| Combined cycle | 20 - 40 | |||
| j) | Leased assets |
F - 34
Table of Contents
| k) | Power installations financed by third parties |
| l) | Investments in related companies |
| m) | Intangibles, other than goodwill |
| n) | Severance indemnities |
| o) | Revenue recognition |
F - 35
Table of Contents
| p) | Cost of sales and Administrative and selling expenses |
| q) | Income tax and deferred income taxes |
| r) | Accrued vacation expense |
| s) | Purchase with resale agreements |
| t) | Statements of cash flows |
| u) | Financial derivative contracts |
F - 36
Table of Contents
| v) | Goodwill and negative goodwill |
| 1. | The first step is to compare each CGU’s fair value with its carrying amount, including goodwill. The CGU’s fair value is determined using market prices, or, if not available, valuation techniques including discounted cash flow approaches. If a CGU’s carrying amount exceeds its fair value, an indicator for goodwill impairment exists and step two is performed. | ||
| 2. | The second step is to compare the implied fair value of goodwill with its carrying amount. The implied fair value represents the excess of the CGU’s net identifiable assets over the CGU’s net assets at fair value. Any excess of the carrying amount of goodwill over its implied fair value is recorded as impairment loss, writing down the carrying amount of goodwill to its implied fair value. |
| w) | Pension and post-retirement benefits |
| x) | Bonds |
| y) | Investments in other companies |
F - 37
Table of Contents
| z) | Research and development costs |
| aa) | Cost of share issue |
| ab) | Litigation and other legal action |
F - 38
Table of Contents
| a) | On November 14, 2006 the SVS issued Circular 1819 with instructions on treating organization and start-up expenses, which superseded Circular 981, in force until December 31, 2006. This change meant that the subsidiary Endesa Chile recorded the effects of the losses of its investee companies in a development and start-up stage charging it to income for the period as of January 1, 2007 and absorbed the accumulated deficit in the period of development. As a consequence of the adoption of Circular 1819 amounts of gains or losses which had been previously accumulated in this special component of equity were reclassified to the retained earnings balance as of January 1, 2007. The amount reclassified as of January 1, 2007 amounted to ThCh$ 325,438. Pursuant to the transitory provision of Circular 1819, prior year income statement and balance sheet were not restated. |
F - 39
Table of Contents
| 2006 | 2007 | |||||||||||||||||||||||||
| Annual | Scheduled | Annual | Scheduled | |||||||||||||||||||||||
| Tax Payer Number | Financial Institution | Rate % | Maturity | ThCh$ | Rate % | Maturity | ThCh$ | |||||||||||||||||||
| Foreign | Alfa mix | 1.11 | % | 02.01.07 | 2,692,712 | — | — | — | ||||||||||||||||||
| Foreign | Alianza Valores | 8.10 | % | 02.01.07 | 1,396,215 | — | — | — | ||||||||||||||||||
| Foreign | AFIN S.A. | — | — | — | 9.67 | % | 03.01.08 | 4.047,845 | ||||||||||||||||||
| Foreign | Banco Bilbao Vizcaya | 7.45 | % | 02.01.07 | 112,931 | 7.50 | % | 02.01.08 | 1,982 | |||||||||||||||||
| Foreign | Banco Colpatria | 1.24 | % | 02.01.07 | 3,858 | 1.26 | % | 02.01.08 | 9,086 | |||||||||||||||||
| Foreign | Banco Continental | 4.97 | % | 02.01.07 | 9,031,979 | — | — | — | ||||||||||||||||||
| Foreign | Banco Crédito | 4.43 | % | 02.01.07 | 1,262,835 | 4.83 | % | 02.01.08 | 1,832,612 | |||||||||||||||||
| Foreign | Banco Davivienda | 1.00 | % | 02.01.07 | 146 | 9.71 | % | 14.01.08 | 20,128,614 | |||||||||||||||||
| Foreign | Banco de Galicia | 6.34 | % | 02.01.07 | 2,040,457 | 1.54 | % | 02.01.08 | 1,809,212 | |||||||||||||||||
| Foreign | Banco Frances | 4.08 | % | 02.01.07 | 4,226,924 | 1.13 | % | 02.01.08 | 969,407 | |||||||||||||||||
| Foreign | Banco Hipotecario | — | — | — | 0.00 | % | 02.01.08 | 1,719,812 | ||||||||||||||||||
| Foreign | Banco Itau | 4.09 | % | 02.01.07 | 14,133,250 | 0.96 | % | 02.01.08 | 60,873,430 | |||||||||||||||||
| Foreign | Banco Lloyds | 5.65 | % | 02.01.07 | 242 | — | — | — | ||||||||||||||||||
| Foreign | Banco Mellon Brascan | 1.60 | % | 02.01.07 | 4,424,863 | — | — | — | ||||||||||||||||||
| Foreign | Banco Merrill Linch | 3.34 | % | 02.01.07 | 63,491 | 4.83 | % | 14.01.08 | 3,693,436 | |||||||||||||||||
| Foreign | Banco Nordeste | 1.17 | % | 02.01.07 | 156,426 | 1.06 | % | 02.01.08 | 144,981 | |||||||||||||||||
| Foreign | Banco Pactual | 1.10 | % | 31.01.07 | 67,469 | 0.93 | % | 31.01.08 | 1,511,540 | |||||||||||||||||
| Foreign | Banco Paribas Luxembourg | 6.67 | % | 02.01.07 | 4,652,499 | 4.09 | % | 02.01.08 | 3,775,051 | |||||||||||||||||
| Foreign | Banco Real | 0.10 | % | 02.01.07 | 1,893,835 | — | — | — | ||||||||||||||||||
| Foreign | Banco Rio de la Plata | 8.74 | % | 02.01.07 | 12,446,715 | 1.81 | % | 02.01.08 | 3,820,049 | |||||||||||||||||
| Foreign | Banco Santander Central Hispano | 2.76 | % | 02.01.07 | 15,619,248 | 2.69 | % | 02.01.08 | 18,169,448 | |||||||||||||||||
| Foreign | Banco Sudameris | 7.80 | % | 02.01.07 | 6,729,078 | 9.65 | % | 02.01.08 | 18,515,423 | |||||||||||||||||
| Foreign | Banco Votorantim | 1.17 | % | 02.01.07 | 17,900,189 | 0.87 | % | 02.01.08 | 24,919,321 | |||||||||||||||||
| Foreign | Bancolombia | 6.58 | % | 02.01.07 | 77 | 8.46 | % | 02.01.08 | 80 | |||||||||||||||||
| Foreign | Banistmo Colombia S.A. | 7.00 | % | 02.01.07 | 752,811 | — | — | — | ||||||||||||||||||
| Foreign | Bank Boston | 5.14 | % | 02.01.07 | 2,331,870 | 0.93 | % | 02.01.08 | 109,321 | |||||||||||||||||
| Foreign | Bank of America | 4.76 | % | 02.01.07 | 10,813,619 | 2.85 | % | 02.01.08 | 3,269,537 | |||||||||||||||||
| Foreign | BNY | 1.18 | % | 02.01.07 | 6,414,232 | — | — | — | ||||||||||||||||||
| Foreign | Bradesco | 7.06 | % | 02.01.07 | 71,079,327 | 0.86 | % | 02.01.08 | 73,267,958 | |||||||||||||||||
| Foreign | Caixa Economica | — | — | — | 0.93 | % | 31.01.08 | 1,471,426 | ||||||||||||||||||
| Foreign | Certifacates of post to terms | 8.68 | % | 02.01.07 | 259,389 | — | — | — | ||||||||||||||||||
| Foreign | Citibank N.Y. | 4.19 | % | 02.01.07 | 45,376,154 | 3.59 | % | 02.01.08 | 56,615,174 | |||||||||||||||||
| Foreign | Colmena | — | — | — | 9.80 | % | 02.01.08 | 17,904,026 | ||||||||||||||||||
| Foreign | Comafi | 9.97 | % | 02.01.07 | 1,071,346 | 1.19 | % | 02.01.08 | 1,689,769 | |||||||||||||||||
| Foreign | Corficolombiana | 6.39 | % | 02.01.07 | 12,313,019 | 7.45 | % | 02.01.08 | 773,371 | |||||||||||||||||
| Foreign | Correval | 7.99 | % | 02.01.07 | 925,081 | — | — | — | ||||||||||||||||||
| Foreign | Corredores Asociados | 7.85 | % | 02.01.07 | 783,065 | — | — | — | ||||||||||||||||||
| Foreign | Encargo Fiduciario Banco Santander | 7.00 | % | 02.01.07 | 279,889 | 6.19 | % | 02.01.08 | 1,595,808 | |||||||||||||||||
| Foreign | FAM Fondo Ganadero | 6.72 | % | 02.01.07 | 851 | 7.66 | % | 02.01.08 | 87 | |||||||||||||||||
| Foreign | Fiduciaria Helm Trust | 6.01 | % | 02.01.07 | 85 | 7.85 | % | 02.01.08 | 87 | |||||||||||||||||
| Foreign | Fiducolombia | 6.80 | % | 02.01.07 | 7,120,679 | 8.44 | % | 02.01.08 | 6,102 | |||||||||||||||||
| Foreign | Fiducomercio | 5.46 | % | 02.01.07 | 55 | — | — | — | ||||||||||||||||||
| Foreign | Fiduoccidente | 5.93 | % | 02.01.07 | 251,322 | 8.07 | % | 02.01.08 | 205 | |||||||||||||||||
| Foreign | Fiduvalle | 5.99 | % | 02.01.07 | 1,583,470 | — | — | — | ||||||||||||||||||
| Foreign | Fiduciaria Banco de Bogotá | — | — | — | 6.98 | % | 02.01.08 | 21,595 | ||||||||||||||||||
| Foreign | Fondeos | 7.32 | % | 02.01.07 | 3,155,144 | — | — | — | ||||||||||||||||||
| Foreign | Fondo Sumar | 6.48 | % | 02.01.07 | 239,732 | 6.98 | % | 02.01.08 | 61 | |||||||||||||||||
| Foreign | Fondo Surgir | 5.09 | % | 02.01.07 | 2,356,562 | 7.53 | % | 02.01.08 | 118 | |||||||||||||||||
| Foreign | Fondo Surenta | 6.90 | % | 02.01.07 | 2,816,788 | — | — | — | ||||||||||||||||||
| Foreign | HSBC - Bamerindus | 1.27 | % | 02.01.07 | 5,352,652 | 0.95 | % | 02.01.08 | 45,414,832 | |||||||||||||||||
| Foreign | Panamericano | 1.10 | % | 02.01.07 | 182,264 | — | — | — | ||||||||||||||||||
| Foreign | SAFRA | — | — | — | 0.85 | % | 02.01.08 | 1,406,202 | ||||||||||||||||||
| Foreign | Serfinco | 7.89 | % | 02.01.07 | 689,082 | — | — | — | ||||||||||||||||||
| Foreign | Standard Bank London | 5.29 | % | 17.01.07 | 3,566,339 | 1.16 | % | 02.01.08 | 1,035,120 | |||||||||||||||||
| Foreign | Suvalor | 7.32 | % | 02.01.07 | 14,317,239 | — | — | — | ||||||||||||||||||
| Foreign | Unibanco | 8.83 | % | 02.01.07 | 10,114,923 | 0.88 | % | 02.01.08 | 34,061,813 | |||||||||||||||||
| Total | 303,002,428 | 404,583,941 | ||||||||||||||||||||||||
F - 40
Table of Contents
| (a) | Current accounts, notes and other receivables and their related allowances for doubtful accounts as of each December 31, are as follows: |
| As of December 31, | ||||||||||||||||||||||||||||||||||||
| Under 90 days | 91 days to 1 year | Sub total | Current | Long term | ||||||||||||||||||||||||||||||||
| Account | 2006 | 2007 | 2006 | 2007 | 2007 | 2006 | 2007 | 2006 | 2007 | |||||||||||||||||||||||||||
| ThCh$ | ThCh$ | ThCh$ | ThCh$ | ThCh$ | ThCh$ | ThCh$ | ThCh$ | ThCh$ | ||||||||||||||||||||||||||||
| Accounts receivable | 933,806,606 | 1,031,985,273 | 97,238,464 | 130,242,547 | 1,162,227,820 | 1,031,045,070 | 987,383,472 | — | — | |||||||||||||||||||||||||||
| Allowance for doubtful accounts | (54,153,397 | ) | (93,762,655 | ) | (75,682,836 | ) | (81,081,693 | ) | (174,844,348 | ) | (129,836,233 | ) | — | — | — | |||||||||||||||||||||
| Notes receivable | 7,719,233 | 11,443,638 | 844,524 | 920,801 | 12,364,439 | 8,563,757 | 11,839,116 | — | — | |||||||||||||||||||||||||||
| Allowance for doubtful accounts | (380,491 | ) | (153,787 | ) | (162,417 | ) | (371,536 | ) | (525,323 | ) | (542,908 | ) | — | — | — | |||||||||||||||||||||
| Other receivable (1) (2) | 102,950,685 | 97,600,900 | 12,830,082 | 12,253,895 | 109,854,795 | 115,780,767 | 99,770,021 | 154,859,353 | 197,122,798 | |||||||||||||||||||||||||||
| Allowance for doubtful accounts | (4,306,732 | ) | (1,446,819 | ) | (2,947,182 | ) | (8,637,955 | ) | (10,084,774 | ) | (7,253,914 | ) | — | (7,206,165 | ) | (1,584,955 | ) | |||||||||||||||||||
| Total | 1,017,756,539 | 1,098,992,609 | 147,653,188 | 195,537,843 | ||||||||||||||||||||||||||||||||
| (1) | Includes ThCh$ 29,980,100, which is the balance due from the rate increase pursuant to the Agreement signed in February, 2007 by the Argentine government and the subsidiary Edesur S.A. in Argentina. This agreement generated income of ThCh$ 37,513,207 ($Arg 237,000,000 approximately) which will be collected in equal installments over 55 months starting from February, 2007. | |
| (2) | This includes ThCh$ 31,241,992, ThCh$ 29,343,531 in 2006 and 2007 relating to other generating companies debt payable to Endesa Chile. and generating subsidiaries, as a result of the collection of tolls due to the application, since March 13, 2004, of Law No.19,940. |
| (b) | Current and long-term accounts receivable per country as of each December 31, are as follows: |
| As of December 31, | ||||||||||||||||
| Country | 2006 | 2007 | ||||||||||||||
| ThCh$ | % | ThCh$ | % | |||||||||||||
| Chile | 256,797,683 | 22.03 | % | 280,723,013 | 21.69 | % | ||||||||||
| Peru | 67,159,968 | 5.76 | % | 57,048,906 | 4.41 | % | ||||||||||
| Argentina | 145,084,968 | 12.45 | % | 195,460,802 | 15.10 | % | ||||||||||
| Colombia | 247,006,296 | 21.19 | % | 284,714,598 | 21.99 | % | ||||||||||
| Brazil | 449,360,812 | 38.56 | % | 466,045,865 | 36.00 | % | ||||||||||
| Panama | — | — | 10,537,268 | 0.81 | % | |||||||||||
| Total | 1,165,409,727 | 100.00 | % | 1,294,530,452 | 100.00 | % | ||||||||||
| (c) | Changes in provision for accounts receivables are as follows: |
| Year ended December 31, | ||||||||||||
| 2005 | 2006 | 2007 | ||||||||||
| ThCh$ | ThCh$ | ThCh$ | ||||||||||
| Balance at beginning of period | 118,539,819 | 143,297,058 | 144,839,220 | |||||||||
| Additions charged to costs and expenses | 36,757,988 | 33,201,444 | 81,443,200 | |||||||||
| Deductions | (15,173,012 | ) | (33,872,053 | ) | (27,752,712 | ) | ||||||
| Price-level restatement and conversion adjustment | 3,172,263 | 2,212,771 | (11,490,308 | ) | ||||||||
| Balance at end of period | 143,297,058 | 144,839,220 | 187,039,400 | |||||||||
F - 41
Table of Contents
| (d) | Amounts of unbilled energy sold are as follows: |
| As of December 31, | ||||||||||||
| 2005 | 2006 | 2007 | ||||||||||
| ThCh$ | ThCh$ | ThCh$ | ||||||||||
| Unbilled energy sold | 206,942,348 | 253,547,417 | 304,226,945 | |||||||||
| (a) | Notes and accounts receivable due from related companies: |
| As of December 31, | ||||||||||||||||
| Short-term | Long-term | |||||||||||||||
| Company | 2006 | 2007 | 2006 | 2007 | ||||||||||||
| ThCh$ | ThCh$ | ThCh$ | ThCh$ | |||||||||||||
| Atacama Finance Co. (1) | 66,117 | 89,682,080 | 97,222,765 | — | ||||||||||||
| Com. de Energía del Mercosur S.A. | 6,651,990 | 9,061,690 | — | — | ||||||||||||
| Empresa Eléctrica Piura S.A. | 141,986 | 147,889 | — | — | ||||||||||||
| Endesa, S.A. | 295,375 | 272,825 | — | — | ||||||||||||
| Endesa Europa | 943 | — | — | — | ||||||||||||
| Endesa Servicios | — | 699,239 | — | — | ||||||||||||
| Endesa Internacional S.A. | 368,445 | 225,192 | — | — | ||||||||||||
| Gas Atacama Generación S.A. | 65,906 | 18,421 | — | — | ||||||||||||
| Gasoducto Atacama Chile S.A. | 304,823 | 13,096 | — | — | ||||||||||||
| Gasoducto Tal Tal Ltda. | 2,119 | 180 | — | — | ||||||||||||
| Sociedad Consorcio Ara Ltda. | 8,515 | 723 | — | — | ||||||||||||
| Consorcio Ara-Ingendesa Ltda. | 158,496 | 50,423 | — | — | ||||||||||||
| Sacme | 1,661 | 772 | — | — | ||||||||||||
| Sistemas Sec S.A. | 6,499,305 | 7,451,623 | — | 121,521 | ||||||||||||
| Centrales Hidroeléctricas de Aysén S.A. | — | 777,623 | — | — | ||||||||||||
| GNL Quinteros S.A. (2) | — | 40,175,603 | — | — | ||||||||||||
| GNL Chile S.A. | — | 1,873,672 | — | — | ||||||||||||
| Konecta Chile S.A. | — | 77,445 | — | 505,026 | ||||||||||||
| Transmisora Eléctrica de Quillota Ltda. | 3,097 | 1,855,524 | — | — | ||||||||||||
| Total | 14,568,778 | 152,384,020 | 97,222,765 | 626,547 | ||||||||||||
| (1) | The balance receivable from Atacama Finance Co. relates to the loans granted by Compañía Eléctrica Cono Sur S.A. to finance the work in construction of Gasoducto Atacama Argentina S.A., Gasoducto Atacama Chile S.A. and Gas Atacama Generación S.A. The loans are expressed in US dollars, accrue interest at a rate of 7.5% per annum and are due in September 2008. | |
| (2) | The balance receivable from GNL Quintero S.A. relates to financing operations. It is US dollars, accrues interest at rate of 5.56% per annum and is due in 2008. |
F - 42
Table of Contents
| (b) | Notes and accounts payable due to related companies: |
| As of December 31, | ||||||||||||||||
| Short-term | Long-term | |||||||||||||||
| Company | 2006 | 2007 | 2006 | 2007 | ||||||||||||
| ThCh$ | ThCh$ | ThCh$ | ThCh$ | |||||||||||||
| Com. de Energía del Mercosur S.A. | 26,442,638 | 28,071,361 | — | — | ||||||||||||
| Consorcio Ara-Ingendesa Ltda. | 164,338 | 333 | — | — | ||||||||||||
| Electrogas S.A. | 239,557 | 209,417 | — | — | ||||||||||||
| Endesa Servicios | — | 386,482 | — | — | ||||||||||||
| Empresa Eléctrica Piura S.A. | 1,431,079 | 383,347 | — | — | ||||||||||||
| Endesa Internacional S.A. (1) | 3,039,973 | 2,619,592 | 12,082,887 | 8,161,792 | ||||||||||||
| Gas Tal-Tal Ltda. | — | 46,585 | — | — | ||||||||||||
| Gas Atacama Generación S.A. | 692,060 | 31,224 | — | — | ||||||||||||
| Sacme | 62,701 | 68,693 | — | — | ||||||||||||
| Transmisora Eléctrica de Quillota Ltda. | — | 32,184 | — | — | ||||||||||||
| Konecta Chile S.A. | — | 1,901 | — | — | ||||||||||||
| Total | 32,072,346 | 31,851,119 | 12,082,887 | 8,161,792 | ||||||||||||
| (1) | The balance payable correspond to financing granted to Cien (Compañía Interconexcao Energética S.A.) to purchase machinery and equipment necessary to complete the construction of the second transmission line. The loan is denominated in US dollars accrues interest at rate 8.08% per annum an are due in May, 2012. |
F - 43
Table of Contents
| (c) | The most significant transactions and their effects in income (expense) for each year ended December 31 are as follows: |
| 2005 | 2006 | 2007 | ||||||||||||||
| Income | Income | Income | ||||||||||||||
| Company | Relationship | Nature of transaction | (Expense) | (Expense) | (Expense) | |||||||||||
| ThCh$ | ThCh$ | ThCh$ | ||||||||||||||
| Atacama Finance Co. | Affiliate | Interest | 5,288,647 | 6,976,594 | 7,103,591 | |||||||||||
| Monetary correction | 4,149,796 | 2,025,889 | 6,772,234 | |||||||||||||
| Exchange difference | (13,542,589 | ) | 1,764,710 | 12,992,064 | ||||||||||||
| Consorcio ARA-Ingendesa | Affiliate | Services | 2,068,892 | 859,252 | 30,155 | |||||||||||
| Consorcio Ingendesa Minmetal Ltda. | Affiliate | Services | 114,316 | 67,725 | — | |||||||||||
| Com. de Energía del Mercosur S.A. | Affiliate | Sale of energy | 12,093,332 | 6,275,933 | 9,317,681 | |||||||||||
| Purchase of energy | (7,632,768 | ) | (5,391,304 | ) | (4,478,394 | ) | ||||||||||
| Purchase of gas | — | — | (15,725,078 | ) | ||||||||||||
| Services | 1,296,308 | 6,348,132 | (13,360,951 | ) | ||||||||||||
| Empresa Eléctrica Piura S.A. | Member of Controlling Group | Sale of energy | 776,121 | 728,503 | 261,641 | |||||||||||
| Purchase of energy | (5,646,346 | ) | (12,668,622 | ) | (5,210,267 | ) | ||||||||||
| Services | 142,539 | 220,679 | 197,043 | |||||||||||||
| Electrogas S.A. | Affiliate | Purchase of gas | (1,702,881 | ) | (2,112,880 | ) | (2,740,516 | ) | ||||||||
| Endesa, S.A. | Parent company | Interest | — | (3,435,483 | ) | (29,485 | ) | |||||||||
| Exchange difference | — | 49,933 | 1,087 | |||||||||||||
| Endesa Servicios | Member of Controlling Group | Exchange difference | — | 157 | (9,720 | ) | ||||||||||
| Monetary correction | — | (156 | ) | — | ||||||||||||
| Services | — | — | 812,886 | |||||||||||||
| Endesa Internacional S.A. | Parent company | Interest | (660,217 | ) | (2,290,623 | ) | (983,934 | ) | ||||||||
| Services | — | (4,427,229 | ) | 490 | ||||||||||||
| Exchange difference | — | (13,632 | ) | (122,566 | ) | |||||||||||
| Monetary correction | — | (64,736 | ) | (3,119,538 | ) | |||||||||||
| Etevensa | Member of Controlling Group | Sale of energy | 1,101,957 | — | — | |||||||||||
| Purchase of energy | (184,606 | ) | — | — | ||||||||||||
| Services | 1,026,182 | — | — | |||||||||||||
| Fundación Endesa | Member of Controlling Group | Services | 109,020 | 101,721 | 46,328 | |||||||||||
| Gas Atacama Generación S.A. | Affiliate | Services | 158,166 | 1,042,030 | 353,218 | |||||||||||
| Sacme | Affiliate | Services | (391,166 | ) | (428,536 | ) | (530,956 | ) | ||||||||
| Sistema SEC S.A | Affiliate | Services | (8,133 | ) | 504,166 | 4,479,552 | ||||||||||
| Interest | — | — | 59,251 | |||||||||||||
| Soc. Consorcio Ingendesa ARA Ltda. | Affiliate | Services | 235,305 | 176,960 | 620,673 | |||||||||||
| Konecta Chile S.A. | Affiliate | Exchange difference | — | — | 23,873 | |||||||||||
| Services | — | — | 136,530 | |||||||||||||
| Transmisora Eléctrica de Quillota Ltda. | Affiliate | Interest | 66,506 | 28,879 | — | |||||||||||
| Monetary correction | — | — | — | |||||||||||||
| Services | 5,264 | 5,497 | — | |||||||||||||
| Centrales Hidroeléctricas de Aysén S.A. | Affiliate | Services | — | — | 3,145,649 | |||||||||||
| Monetary correction | — | — | 23,844 | |||||||||||||
| Interest | — | — | 5,675 | |||||||||||||
| GNL Quinteros S.A. | Affiliate | Interest | — | — | 802,022 | |||||||||||
| Monetary correction | — | — | 1,310,042 | |||||||||||||
| Exchange difference | — | — | (3,114,788 | ) | ||||||||||||
F - 44
Table of Contents
| As of December 31, | ||||||||
| 2006 | 2007 | |||||||
| ThCh$ | ThCh$ | |||||||
| Real estate under development | 14,080,995 | 12,521,544 | ||||||
| Materials in transit | 2,604,926 | 494,721 | ||||||
| Operation and maintenance material | 42,127,671 | 51,263,206 | ||||||
| Fuel | 12,975,885 | 41,160,063 | ||||||
| Total | 71,789,477 | 105,439,534 | ||||||
| a) | Income taxes (recoverable) payable as of each year-end are as follows: |
| As of December 31, | ||||||||
| 2006 | 2007 | |||||||
| ThCh$ | ThCh$ | |||||||
| Income tax provision – current | 263,056,470 | 218,772,960 | ||||||
| Recoverable tax credits | (106,141,440 | ) | (200,429,885 | ) | ||||
| Total | 156,915,030 | 18,343,075 | ||||||
| b) | Tax loss carryforwards- As of December 31, 2006 and 2007, the Company had tax loss carryforwards of ThCh$ 349,267,668 and ThCh$ 288,381,386, respectively. |
| c) | The net effect of recording the deferred tax expense (benefit) was ThCh$ 35,746,636, ThCh$ (152,592,410) and ThCh$ 46,550,372 during the years ended December 31, 2005, 2006 and 2007, respectively. |
F - 45
Table of Contents
| d) | In accordance with BT No.60 and 69 of the Chilean Association of Accountants, and Circular No.1,466 of the SVS, the Company and its subsidiaries have recorded consolidated deferred income taxes as of December 31, 2006 and 2007 as follows: |
| As of December 31, 2006 | As of December 31, 2007 | |||||||||||||||||||||||||||||||
| Asset | Liability | Asset | Liability | |||||||||||||||||||||||||||||
| Description | Short-term | Long-term | Short-term | Long-term | Short-term | Long-term | Short-term | Long-term | ||||||||||||||||||||||||
| ThCh$ | ThCh$ | ThCh$ | ThCh$ | ThCh$ | ThCh$ | ThCh$ | ThCh$ | |||||||||||||||||||||||||
| Allowance for doubtful accounts | 17,862,101 | 54,683,790 | — | — | 30,361,777 | 48,273,005 | — | — | ||||||||||||||||||||||||
| Deferred income | 745,055 | 1,656,641 | — | 1,156,534 | 1,265,004 | 1,108,332 | 2,637,219 | 6,925,008 | ||||||||||||||||||||||||
| Vacation accrual | 1,232,038 | — | — | — | 1,247,119 | 17,155 | — | — | ||||||||||||||||||||||||
| Leased assets | — | — | — | 498,992 | — | — | — | 1,058,920 | ||||||||||||||||||||||||
| Fixed assets depreciation | — | 2,941,948 | 847,577 | 441,198,613 | — | 2,579,361 | 683,056 | 424,955,762 | ||||||||||||||||||||||||
| Severance indemnities | — | 686 | — | 1,801,981 | — | 7,548 | — | 1,701,576 | ||||||||||||||||||||||||
| Other | 6,187,147 | 5,738,352 | 2,466,375 | 3,304,601 | 5,882,834 | 3,557,093 | 1,561,515 | 4,430,015 | ||||||||||||||||||||||||
| Contingencies | 9,269,507 | 82,318,172 | — | — | 16,042,437 | 63,062,629 | — | — | ||||||||||||||||||||||||
| Bond discount | — | — | 151,909 | 1,436,000 | — | — | 149,319 | 1,162,405 | ||||||||||||||||||||||||
| Cost of studies | — | — | — | 9,043,752 | — | — | — | 8,960,610 | ||||||||||||||||||||||||
| Finance cost | — | — | — | 16,490,104 | — | 893,075 | — | 19,427,055 | ||||||||||||||||||||||||
| Imputed interest on construction | — | — | — | 4,034,502 | 1,772 | — | — | 3,959,224 | ||||||||||||||||||||||||
| Deferred charges | 754,583 | — | 603,823 | 3,623,416 | 638,534 | — | 1,646,651 | 2,313,433 | ||||||||||||||||||||||||
| Actuarial deficit (Brazil) | — | 11,277,352 | — | — | — | 12,297,971 | — | — | ||||||||||||||||||||||||
| Obsolescence | 377,614 | 2,353,317 | — | — | 587,954 | 1,472,713 | — | — | ||||||||||||||||||||||||
| Materials used | — | — | — | 871,574 | — | — | — | 806,387 | ||||||||||||||||||||||||
| Imputed salaries on construction | — | 4,310,885 | — | — | — | 4,291,425 | — | — | ||||||||||||||||||||||||
| Tax losses | 57,625,464 | 202,087,224 | — | — | 24,832,066 | 170,877,538 | — | — | ||||||||||||||||||||||||
| Provision real state project | — | 2,543,050 | — | — | 295,526 | 2,134,677 | — | — | ||||||||||||||||||||||||
| Sie 2000A project | — | — | — | 509,235 | — | — | — | 487,855 | ||||||||||||||||||||||||
| Provision for employee benefits | 2,666,877 | 3,291,938 | — | — | 2,599,987 | 1,556,802 | — | — | ||||||||||||||||||||||||
| Energy in measurers | — | — | 2,489,140 | — | — | — | — | — | ||||||||||||||||||||||||
| Deferred assets | — | — | 11,333,148 | 19,784,907 | — | — | 16,581,950 | 9,108,453 | ||||||||||||||||||||||||
| Capitalized expenses | — | — | — | 2,288,007 | — | — | — | 2,352,113 | ||||||||||||||||||||||||
| Allowance for tariff decree (Chilectra) | — | — | — | — | 6,897,750 | — | — | — | ||||||||||||||||||||||||
| Exchange difference | — | — | — | 20,060,608 | — | — | — | 6,798,246 | ||||||||||||||||||||||||
| Intangible | — | — | — | — | 1,016,092 | — | — | — | ||||||||||||||||||||||||
| Complementary account-net | — | (11,599,970 | ) | — | (207,896,363 | ) | — | (10,877,871 | ) | — | (186,864,460 | ) | ||||||||||||||||||||
| Valuation allowance | (12,716,894 | ) | (30,241,236 | ) | — | — | — | (16,109,759 | ) | — | — | |||||||||||||||||||||
| Total | 84,003,492 | 331,362,149 | 17,891,972 | 318,206,463 | 91,668,852 | 285,141,694 | 23,259,710 | 307,582,602 | ||||||||||||||||||||||||
| e) | Income tax benefit (expense) for the year ended December 31, 2005, 2006 and 2007 is as follows: |
| As of December 31, | ||||||||||||
| Item | 2005 | 2006 | 2007 | |||||||||
| ThCh$ | ThCh$ | ThCh$ | ||||||||||
Current income tax (expense) benefit: | ||||||||||||
| Income tax provision | (160,613,952 | ) | (263,056,470 | ) | (218,772,960 | ) | ||||||
| Adjustment for tax expense – prior year | 838,164 | 6,509,183 | 1,996,665 | |||||||||
Deferred tax (expense) benefit: | ||||||||||||
| Deferred taxes | (24,049,714 | ) | 24,630,271 | (58,881,158 | ) | |||||||
| Benefits for tax losses | 15,014,329 | 1,698,147 | 10,179,231 | |||||||||
| Amortization of complementary accounts | (6,385,846 | ) | (12,756,498 | ) | (12,460,703 | ) | ||||||
| Valuation allowance (*) | (19,036,965 | ) | 140,718,637 | 24,791,489 | ||||||||
| Other charges or credits | (1,288,440 | ) | — | — | ||||||||
| Total | (195,522,424 | ) | (102,256,730 | ) | (253,147,436 | ) | ||||||
| (*) | During 2006, the valuation provision has been reversed as a consequence of the merger approved in Extraordinary Shareholders’ Meetings of Chilectra S.A. (formerly Elesur S.A.) and Chilectra S.A. and the sale of the offices of the former Elesur S.A., whose proceeds, ThCh$140,835,232 were credited to net income as a reduction in the allowance for valuation. | |
| In 2007, the valuation provision has been reversed as a consequence of the merger of Emgesa S.A. and Betania S.A. The amount credited to income in income tax expense was ThCh$ 25,352,804. |
F - 46
Table of Contents
| As of December 31, | ||||||||
| 2006 | 2007 | |||||||
| ThCh$ | ThCh$ | |||||||
| Guarantees and indemnities | 245,850 | 328,705 | ||||||
| Deferred expenses | 189,115 | 199,334 | ||||||
| Post-retirement benefits | 265,873 | 264,864 | ||||||
| Deposits for commitments and guarantees (1) | 8,608,242 | 34,562,538 | ||||||
| Deferred expenses for bond placement | 193,322 | 359,984 | ||||||
| Assets available for sale | 5,088,286 | 1,276,755 | ||||||
| Electricity for all project (Coelce) (2) | — | 21,800,111 | ||||||
| Bond discount | 1,045,668 | 1,007,009 | ||||||
| Fair value derivatives contracts | 2,110,604 | 457,414 | ||||||
| Purchase with resale agreements (3) | 52,488,635 | 77,914,807 | ||||||
| Others | 1,353,285 | 3,860,872 | ||||||
| Total | 71,588,880 | 142,032,393 | ||||||
| (1) | See detail in Note 30 (a) | |
| (2) | This is a subsidy to be collected from the Brazilian Government for investments in the rural area of the state of Ceará. | |
| (3) | The detail of reverse repurchase agreements is as follows: |
F - 47
Table of Contents
| As of December 31, 2006 | ||||||||||||||||||||||||
| Date | Interest | Current | ||||||||||||||||||||||
| Code | Start | End | Financial institution | Currency | Document | rate | amount | Nominal | Fair value | |||||||||||||||
| % | ThCh$ | ThCh$ | ThCh$ | |||||||||||||||||||||
| VRC | 12-26-2006 | 01-02-2007 | CorpBanca | $ | D.P.F. | 0.50% | 2,370,614 | 2,368,641 | 2,370,614 | |||||||||||||||
| VRC | 12-26-2006 | 01-02-2007 | Banco Central de Chile | $ | CERO | 0.50% | 3,047 | 3,045 | 3,047 | |||||||||||||||
| VRC | 12-26-2006 | 01-02-2007 | Banco Estado | $ | D.P.F. | 0.50% | 4,817,834 | 4,813,822 | 4,817,834 | |||||||||||||||
| VRC | 12-26-2006 | 01-02-2007 | Citibank | $ | D.P.F. | 0.50% | 2,768,427 | 2,766,122 | 2,768,427 | |||||||||||||||
| VRC | 12-26-2006 | 01-02-2007 | Banco Crédito e Inversiones | $ | D.P.F. | 0.50% | 3,654,675 | 3,651,632 | 3,654,675 | |||||||||||||||
| VRC | 12-26-2006 | 01-02-2007 | Banco Santander Santiago | $ | D.P.F. | 0.50% | 1,485,456 | 1,484,219 | 1,485,456 | |||||||||||||||
| VRC | 12-26-2006 | 01-02-2007 | Banco Chile | $ | D.P.F. | 0.50% | 2,244,764 | 2,242,895 | 2,244,764 | |||||||||||||||
| VRC | 12-29-2006 | 01-02-2007 | BBVA Banco BHIF | $ | D.P.R. | 0.51% | 3,114 | 3,112 | 3,114 | |||||||||||||||
| VRC | 12-29-2006 | 01-02-2007 | Banco Central de Chile | $ | CERO | 0.51% | 174 | 173 | 174 | |||||||||||||||
| VRC | 12-29-2006 | 01-02-2007 | Banco Santander Santiago | $ | D.P.F. | 0.51% | 2,090,097 | 2,089,387 | 2,090,097 | |||||||||||||||
| VRC | 12-29-2006 | 01-02-2007 | Banco Crédito e Inversiones | $ | D.P.F. | 0.51% | 70,602 | 70,578 | 70,602 | |||||||||||||||
| VRC | 12-27-2006 | 01-03-2007 | Banco Central de Chile | $ | CERO | 0.53% | 3,048 | 3,046 | 3,048 | |||||||||||||||
| VRC | 12-27-2006 | 01-03-2007 | BBVA Banco BHIF | $ | D.P.F. | 0.53% | 7,987,044 | 7,981,404 | 7,987,044 | |||||||||||||||
| VRC | 12-27-2006 | 01-03-2007 | BBVA Banco BHIF | $ | D.P.R. | 0.53% | 119,298 | 119,213 | 119,298 | |||||||||||||||
| VRC | 12-28-2006 | 01-04-2007 | Banco Chile | $ | L.H. | 0.52% | 4,190,322 | 4,188,144 | 4,190,322 | |||||||||||||||
| VRC | 12-28-2006 | 01-04-2007 | Banco Santander Santiago | $ | L.H. | 0.52% | 3,143 | 3,141 | 3,143 | |||||||||||||||
| VRC | 12-28-2006 | 01-04-2007 | Banco Central de Chile | $ | CERO | 0.54% | 11,993 | 11,987 | 11,993 | |||||||||||||||
| VRC | 12-28-2006 | 01-04-2007 | Banco Boston | $ | D.P.F. | 0.54% | 75,041 | 75,001 | 75,041 | |||||||||||||||
| VRC | 12-28-2006 | 01-04-2007 | Banco Santander Santiago | $ | D.P.F. | 0.54% | 5,811,794 | 5,808,657 | 5,811,794 | |||||||||||||||
| VRC | 12-28-2006 | 01-04-2007 | Banco Crédito e Inversiones | $ | D.P.F. | 0.54% | 1,623,231 | 1,622,355 | 1,623,231 | |||||||||||||||
| VRC | 12-28-2006 | 01-02-2007 | Banchile C. de B. | $ | L.H. | 0.52% | 114,372 | 114,313 | 114,372 | |||||||||||||||
| VRC | 12-28-2006 | 01-02-2007 | Banchile C. de B. | $ | L.H. | 0.52% | 1,094,493 | 1,093,924 | 1,094,493 | |||||||||||||||
| VRC | 12-28-2006 | 01-02-2007 | Banchile C. de B. | $ | L.H. | 0.52% | 430,223 | 430,000 | 430,223 | |||||||||||||||
| VRC | 12-28-2006 | 01-02-2007 | Banchile C. de B. | $ | L.H. | 0.52% | 206,402 | 206,295 | 206,402 | |||||||||||||||
| VRC | 12-29-2006 | 01-02-2007 | Banchile C. de B. | $ | BOND | 0.35% | 123,939 | 123,910 | 123,939 | |||||||||||||||
| VRC | 12-29-2006 | 01-02-2007 | Banchile C. de B. | $ | L.H. | 0.35% | 273,696 | 273,632 | 273,696 | |||||||||||||||
| VRC | 12-29-2006 | 01-02-2007 | Banchile C. de B. | $ | L.H. | 0.35% | 218,142 | 218,092 | 218,142 | |||||||||||||||
| VRC | 12-29-2006 | 01-02-2007 | Inv. Boston C. de B. | $ | D.P.F. | 0.48% | 161,429 | 161,377 | 161,429 | |||||||||||||||
| VRC | 12-29-2006 | 01-02-2007 | Inv. Boston C. de B. | $ | CERO | 0.48% | 41,469 | 41,456 | 41,469 | |||||||||||||||
| VRC | 12-29-2006 | 01-02-2007 | Inv. Boston C. de B. | $ | D.P.F. | 0.48% | 300,150 | 300,054 | 300,150 | |||||||||||||||
| VRC | 12-29-2006 | 01-02-2007 | Inv. Boston C. de B. | $ | D.P.F. | 0.48% | 541,213 | 541,040 | 541,213 | |||||||||||||||
| VRC | 12-29-2006 | 01-02-2007 | BBVA BHIF C. de B. | $ | CERO | 0.51% | 946 | 946 | 946 | |||||||||||||||
| VRC | 12-29-2006 | 01-02-2007 | BBVA BHIF C. de B. | $ | D.P.F. | 0.51% | 2,015,903 | 2,015,218 | 2,015,903 | |||||||||||||||
| VRC | 12-29-2006 | 01-02-2007 | BBVA BHIF C. de B. | $ | D.P.F. | 0.51% | 215,969 | 215,894 | 215,969 | |||||||||||||||
| VRC | 12-29-2006 | 01-02-2007 | BBVA BHIF C. de B. | $ | D.P.F. | 0.51% | 157,819 | 157,765 | 157,819 | |||||||||||||||
| VRC | 12-29-2006 | 01-02-2007 | BBVA BHIF C. de B. | $ | D.P.F. | 0.51% | 320,230 | 320,122 | 320,230 | |||||||||||||||
| VRC | 12-29-2006 | 01-02-2007 | BBVA BHIF C. de B. | $ | D.P.F. | 0.51% | 27,375 | 27,366 | 27,375 | |||||||||||||||
| VRC | 12-29-2006 | 01-02-2007 | BBVA BHIF C. de B. | $ | D.P.R. | 0.51% | 170,165 | 170,107 | 170,165 | |||||||||||||||
| VRC | 12-29-2006 | 01-02-2007 | BBVA BHIF C. de B. | $ | D.P.R. | 0.51% | 221,735 | 221,660 | 221,735 | |||||||||||||||
| VRC | 12-29-2006 | 01-02-2007 | BBVA Banco BHIF | UF | D.P.R. | 0.51% | 6,795 | 6,793 | 6,795 | |||||||||||||||
| VRC | 12-29-2006 | 01-02-2007 | Banco Santander Santiago | UF | D.P.F. | 0.51% | 2,241,409 | 2,240,648 | 2,241,409 | |||||||||||||||
| VRC | 12-29-2006 | 01-02-2007 | Banco Chile | UF | D.P.F. | 0.51% | 550,204 | 550,017 | 550,204 | |||||||||||||||
| VRC | 12-29-2006 | 01-02-2007 | Banco Estado | UF | D.P.F. | 0.51% | 542,837 | 542,652 | 542,837 | |||||||||||||||
| VRC | 12-29-2006 | 01-02-2007 | Banco Crédito e Inversiones | UF | D.P.F. | 0.51% | 1,168,059 | 1,167,661 | 1,168,059 | |||||||||||||||
| VRC | 12-29-2006 | 01-02-2007 | BBVA Banco BHIF | UF | D.P.R. | 0.51% | 783,823 | 783,557 | 783,823 | |||||||||||||||
| VRC | 12-29-2006 | 01-02-2007 | Security | UF | D.P.R. | 0.51% | 675,547 | 675,317 | 675,547 | |||||||||||||||
| VRC | 12-29-2006 | 01-02-2007 | Scotiabank | UF | D.P.R. | 0.51% | 550,573 | 550,386 | 550,573 | |||||||||||||||
| Total | 52,488,635 | 52,456,776 | 52,488,635 | |||||||||||||||||||||
F - 48
Table of Contents
| As of December 31, 2007 | ||||||||||||||||||||||||
| Date | Interest | Current | ||||||||||||||||||||||
| Code | Start | End | Financial institution | Currency | Document | rate | amount | Nominal | Fair value | |||||||||||||||
| % | ThCh$ | ThCh$ | ThCh$ | |||||||||||||||||||||
| VRC | 12-27-2007 | 01-02-2008 | Banco Central de Chile | $ | CERO | 0.58% | 228 | 228 | 228 | |||||||||||||||
| VRC | 12-27-2007 | 01-03-2008 | Banco Central de Chile | $ | CERO | 0.59% | 495 | 495 | 495 | |||||||||||||||
| VRC | 12-28-2007 | 01-02-2008 | Banco Central de Chile | UF | CERO | 0.46% | 1,724 | 1,724 | 1,724 | |||||||||||||||
| VRC | 12-27-2007 | 01-03-2008 | Banco Central de Chile | UF | CERO | 0.46% | 2,441 | 2,442 | 2,441 | |||||||||||||||
| VRC | 12-28-2007 | 01-07-2008 | Banco Estado | UF | L.H. | 0.46% | 2,898 | 2,901 | 2,898 | |||||||||||||||
| VRC | 12-27-2007 | 01-02-2008 | CorpBanca | $ | D.P.F. | 0.58% | 5,806 | 5,802 | 5,806 | |||||||||||||||
| VRC | 12-28-2007 | 01-07-2008 | Banco Estado | $ | L.H. | 0.58% | 7,867 | 7,877 | 7,867 | |||||||||||||||
| VRC | 12-28-2007 | 01-07-2008 | Banco Chile | $ | L.H. | 0.58% | 11,053 | 11,046 | 11,053 | |||||||||||||||
| VRC | 12-27-2007 | 01-03-2008 | CorpBanca | $ | L.H. | 0.59% | 16,028 | 16,015 | 16,028 | |||||||||||||||
| VRC | 12-27-2007 | 01-03-2008 | CorpBanca | UF | L.H. | 0.46% | 17,419 | 17,429 | 17,419 | |||||||||||||||
| VRC | 12-27-2007 | 01-03-2008 | Banco Central de Chile | UF | CERO | 0.46% | 31,472 | 31,490 | 31,472 | |||||||||||||||
| VRC | 12-27-2007 | 01-03-2008 | Banco Santander Santiago | UF | L.H. | 0.46% | 38,823 | 38,845 | 38,823 | |||||||||||||||
| VRC | 12-28-2007 | 01-07-2008 | Banco Central de Chile | $ | CERO | 0.59% | 39,750 | 39,727 | 39,750 | |||||||||||||||
| VRC | 12-28-2007 | 01-07-2008 | BBVA Banco BHIF | $ | L.H. | 0.58% | 102,623 | 102,564 | 102,623 | |||||||||||||||
| VRC | 12-28-2007 | 01-07-2008 | Banco Crédito e Inversiones | $ | L.H. | 0.58% | 103,061 | 103,001 | 103,061 | |||||||||||||||
| VRC | 12-28-2007 | 01-07-2008 | Banco Santander Santiago | UF | L.H. | 0.46% | 181,172 | 181,415 | 181,172 | |||||||||||||||
| VRC | 12-28-2007 | 01-07-2008 | Banco Chile | $ | L.H. | 0.58% | 304,554 | 304,378 | 304,554 | |||||||||||||||
| VRC | 12-27-2007 | 01-02-2008 | BBVA Banco BHIF | $ | D.P.R. | 0.58% | 338,170 | 337,908 | 338,170 | |||||||||||||||
| VRC | 12-28-2007 | 01-07-2008 | Banco Crédito e Inversiones | $ | L.H. | 0.58% | 402,103 | 402,647 | 402,103 | |||||||||||||||
| VRC | 12-28-2007 | 01-07-2008 | Banco Itaú Chile | $ | L.H. | 0.59% | 432,524 | 432,269 | 432,524 | |||||||||||||||
| VRC | 12-28-2007 | 01-07-2008 | Banco Crédito e Inversiones | UF | L.H. | 0.46% | 812,733 | 813,831 | 812,733 | |||||||||||||||
| VRC | 12-27-2007 | 01-03-2008 | CorpBanca | UF | D.P.F. | 0.46% | 880,200 | 880,710 | 880,200 | |||||||||||||||
| VRC | 12-27-2007 | 01-03-2008 | Banco Chile | UF | D.P.F. | 0.46% | 1,014,792 | 1,015,380 | 1,014,792 | |||||||||||||||
| VRC | 12-27-2007 | 01-03-2008 | Banco Chile | UF | D.P.R. | 0.46% | 1,076,820 | 1,077,443 | 1,076,820 | |||||||||||||||
| VRC | 12-28-2007 | 01-07-2008 | BBVA Banco BHIF | $ | L.H. | 0.58% | 1,076,715 | 1,078,171 | 1,076,715 | |||||||||||||||
| VRC | 12-28-2007 | 01-07-2008 | Banco Estado | $ | L.H. | 0.59% | 1,222,809 | 1,222,088 | 1,222,809 | |||||||||||||||
| VRC | 12-27-2007 | 01-03-2008 | Banco Santander Santiago | UF | D.P.F. | 0.46% | 1,979,624 | 1,980,771 | 1,979,624 | |||||||||||||||
| VRC | 12-27-2007 | 01-03-2008 | Banco Crédito e Inversiones | UF | D.P.F. | 0.46% | 2,022,504 | 2,023,676 | 2,022,504 | |||||||||||||||
| VRC | 12-28-2007 | 01-07-2008 | BBVA Banco BHIF | $ | L.H. | 0.59% | 2,032,233 | 2,031,035 | 2,032,233 | |||||||||||||||
| VRC | 12-28-2007 | 01-07-2008 | Banco Santander Santiago | $ | L.H. | 0.58% | 2,208,292 | 2,207,010 | 2,208,292 | |||||||||||||||
| VRC | 12-27-2007 | 01-03-2008 | Banco Estado | UF | L.H. | 0.46% | 2,647,879 | 2,649,414 | 2,647,879 | |||||||||||||||
| VRC | 12-28-2007 | 01-07-2008 | Banco Chile | $ | L.H. | 0.58% | 2,680,621 | 2,684,247 | 2,680,621 | |||||||||||||||
| VRC | 12-28-2007 | 01-07-2008 | Banco Chile | $ | L.H. | 0.59% | 2,776,518 | 2,774,881 | 2,776,518 | |||||||||||||||
| VRC | 12-28-2007 | 01-07-2008 | Banco Chile | UF | L.H. | 0.46% | 3,502,917 | 3,507,655 | 3,502,917 | |||||||||||||||
| VRC | 12-27-2007 | 01-02-2008 | BBVA Banco BHIF | $ | D.P.F. | 0.58% | 4,659,663 | 4,656,062 | 4,659,663 | |||||||||||||||
| VRC | 12-28-2007 | 01-02-2008 | Banco Central de Chile | UF | BOND | 0.46% | 5,001,226 | 5,003,191 | 5,001,226 | |||||||||||||||
| VRC | 12-27-2007 | 01-03-2008 | Banco Crédito e Inversiones | UF | L.H. | 0.46% | 7,622,401 | 7,626,819 | 7,622,401 | |||||||||||||||
| VRC | 12-27-2007 | 01-03-2008 | Banco Chile | UF | L.H. | 0.46% | 9,706,363 | 9,711,988 | 9,706,363 | |||||||||||||||
| VRC | 12-27-2007 | 01-03-2008 | BBVA Banco BHIF | UF | D.P.F. | 0.46% | 10,188,164 | 10,194,170 | 10,188,164 | |||||||||||||||
| VRC | 12-27-2007 | 01-03-2008 | BBVA Banco BHIF | $ | D.P.F. | 0.59% | 12,762,122 | 12,752,090 | 12,762,122 | |||||||||||||||
| Total | 77,914,807 | 77,930,835 | 77,914,807 | |||||||||||||||||||||
F - 49
Table of Contents
| As of December 31, | Useful life | |||||||||||
| 2006 | 2007 | range | ||||||||||
| ThCh$ | ThCh$ | Years | ||||||||||
| Land | 142,417,227 | 138,136,415 | ||||||||||
| Buildings and infrastructure | 7,088,886,496 | 6,803,456,467 | 20-40 | |||||||||
| Distribution and transmission lines and public lighting | 4,797,370,988 | 4,604,970,885 | 20-50 | |||||||||
| Less: third party contributions | (113,287,888 | ) | (138,548,296 | ) | 20-50 | |||||||
| Sub-total | 11,772,969,596 | 11,269,879,056 | ||||||||||
| Machinery and equipment | 2,134,240,240 | 1,984,794,585 | 4-20 | |||||||||
| Work in progress | 325,780,367 | 247,008,085 | — | |||||||||
| Construction materials | 54,720,857 | 34,775,543 | 4-10 | |||||||||
| Leased assets (1) | 106,463,451 | 80,139,028 | 4-10 | |||||||||
| Furniture and fixtures, tools, and computing equipment | 86,347,144 | 77,716,227 | 4-10 | |||||||||
| Vehicles | 7,816,606 | 6,744,819 | 4-10 | |||||||||
| Equipment in transit | 14,205,374 | 7,158,458 | 4-10 | |||||||||
| Other assets | 78,947,215 | 79,871,049 | 4-10 | |||||||||
| Sub-total | 674,281,014 | 533,413,209 | ||||||||||
| Technical appraisal | 141,101,386 | — | ||||||||||
| Buildings and infrastructure | 321,378 | 126,536,716 | 20-50 | |||||||||
| Machinery and equipment | — | 321,378 | 4-20 | |||||||||
| Total technical appraisal | 141,422,764 | 126,858,094 | ||||||||||
| Total property plant and equipment | 14,865,330,841 | 14,053,081,359 | ||||||||||
| Accumulated depreciation at beginning of year | ||||||||||||
| Buildings and infrastructure | (4,754,590,323 | ) | (4,678,944,782 | ) | ||||||||
| Machinery and equipment | (842,536,014 | ) | (820,941,974 | ) | ||||||||
| Other assets | (86,563,740 | ) | (80,987,171 | ) | ||||||||
| Accumulated depreciation at beginning of year | (5,683,690,077 | ) | (5,580,873,927 | ) | ||||||||
| Accumulated depreciation at beginning of year technical appraisal | ||||||||||||
| Buildings and infrastructure | (49,995,470 | ) | (47,556,001 | ) | ||||||||
| Machinery and equipment | (313,602 | ) | (315,682 | ) | ||||||||
| Other assets | (125,529 | ) | (296,752 | ) | ||||||||
| Total accumulated depreciation at beginning of year technical appraisal | (50,434,601 | ) | (48,168,435 | ) | ||||||||
| Depreciation of the year | (445,298,395 | ) | (416,692,881 | ) | ||||||||
| Total accumulated depreciation at end of year | (6,179,423,073 | ) | (6,045,735,243 | ) | ||||||||
| Total property, plant and equipment, net | 8,685,907,768 | 8,007,346,116 | ||||||||||
F - 50
Table of Contents
| 2005 | 2006 | 2007 | ||||||||||
| ThCh$ | ThCh$ | ThCh$ | ||||||||||
| Cost of sales | (388,883,649 | ) | (432,664,256 | ) | (407.388.420 | ) | ||||||
| Administrative and selling expenses | (14,235,893 | ) | (12,634,139 | ) | (9.304.461 | ) | ||||||
| Total | (403,119,542 | ) | (445,298,395 | ) | (416.692.881 | ) | ||||||
| a. | In Endesa Chile the amount of ThCh$ 31,536,927 corresponds to a contract for power transmission lines and installations (Ralco-Charrúa 2X220KV) between Empresa Nacional de Electricidad S.A. and Huepil S.A. This contract has a 20-year maturity and earns interest at a 6.5% annual rate. | |
| b. | In the Peruvian subsidiary Edegel S.A. the amount of ThCh$ 46,660,579 relates to contracts to finance the project of converting the thermo-electric plant to combination cycle (former Etevensa), being carried out by the Company and the financial institutions Banco de Crédito del Perú BBVA — Banco Continental and Citibank. These contracts have a life of eight years and accrue interest at an annual rate of Libor +2.5%. |
| a) | Investments in related companies of December 31, 2006 and 2007 are as follows: |
| Percentage | Shareholders’ equity | Net income | ||||||||||||||||||||||||||||||||||||||||||||||
| Number | owned | of investee | of investees | Equity in income | Investment book value | |||||||||||||||||||||||||||||||||||||||||||
| Related Companies | of shares | 2006 | 2007 | 2006 | 2007 | 2006 | 2007 | 2005 | 2006 | 2007 | 2006 | 2007 | ||||||||||||||||||||||||||||||||||||
| % | % | ThCh$ | ThCh$ | ThCh$ | ThCh$ | ThCh$ | ThCh$ | ThCh$ | ThCh$ | ThCh$ | ||||||||||||||||||||||||||||||||||||||
| Cía. de Interconexión Energética S.A. (5) | — | — | — | — | — | — | — | (8,456,356 | ) | — | — | — | — | |||||||||||||||||||||||||||||||||||
| Gas Atacama Generación S.A. | — | 0.050 | % | 0.050 | % | 27,916,295 | (5,006,882 | ) | (16,557,908 | ) | (29,266,495 | ) | (5,524 | ) | (8,279 | ) | (14,633 | ) | 13,958 | (2,504 | ) | |||||||||||||||||||||||||||
| Gasoducto Atacama Argentina S.A. | — | 0.050 | % | 0.050 | % | 78,726,403 | 117,961,103 | 11,325,225 | �� | (1,456,134 | ) | 4,643 | 5,663 | (437 | ) | 39,363 | 35,388 | |||||||||||||||||||||||||||||||
| Gasoducto Atacama Chile S.A. | — | 0.050 | % | 0.050 | % | 86,919,214 | 93,723,709 | 12,141,320 | 18,867,054 | 6,552 | 6,071 | 9,434 | 43,459 | 46,862 | ||||||||||||||||||||||||||||||||||
| Inversiones Electrogas S.A. | 425 | 42.500 | % | 42.500 | % | 18,429,720 | 17,260,328 | 4,718,427 | 5,286,673 | 1,918,728 | 2,005,331 | 2,246,836 | 7,832,630 | 7,335,639 | ||||||||||||||||||||||||||||||||||
| Cía. de Energía del Mercosur S.A. (2) | 6,305,400 | 45.000 | % | 45.000 | % | 8,868,705 | 7,588,668 | 1,878 | (118,348 | ) | 54,631 | 845 | (53,257 | ) | 3,990,917 | 3,414,901 | ||||||||||||||||||||||||||||||||
| Transmisora Eléctrica de Quillota Ltda. | — | 50.000 | % | 50.000 | % | 7,411,771 | 8,075,084 | 459,913 | 663,312 | 188,156 | 229,956 | 331,656 | 3,705,885 | 4,037,542 | ||||||||||||||||||||||||||||||||||
| Sacme | 12,000 | 50.000 | % | 50.000 | % | 82,316 | 73,170 | 3,811 | 3,986 | (1,182 | ) | 1,906 | 1,993 | 41,159 | 36,585 | |||||||||||||||||||||||||||||||||
| Electrogas S.A. | 85 | 0.021 | % | 0.021 | % | 17,026,601 | 16,028,805 | 4,866,893 | 5,461,865 | 985 | 1,034 | 1,161 | 3,618 | 3,406 | ||||||||||||||||||||||||||||||||||
| Consorcio ARA- Ingendesa | — | 50.000 | % | 50.000 | % | 347,488 | 212,273 | 199,917 | 280,982 | 160,729 | 99,958 | 140,491 | 173,744 | 106,137 | ||||||||||||||||||||||||||||||||||
| Sociedad Consorcio Ingendesa Ara Ltda (1) | — | 50.000 | % | 50.000 | % | 166,062 | 23,820 | 126,045 | (27,931 | ) | 67,401 | 63,022 | (13,966 | ) | 83,031 | 11,910 | ||||||||||||||||||||||||||||||||
| Consorcio Ingendesa - - Minmetal Limited (1) | — | 50.000 | % | 50.000 | % | 31,311 | 32,800 | 157,880 | 1,492 | 117,903 | 78,940 | 746 | 15,656 | 16,400 | ||||||||||||||||||||||||||||||||||
| Gas Atacama S.A. | 1,147 | 0.00115 | % | 0.00115 | % | 192,636,990 | 157,594,012 | 6,845,363 | (9,809,964 | ) | 153 | 78 | (113 | ) | 2,209 | 1,808 | ||||||||||||||||||||||||||||||||
| Inversiones Gas Atacama Holding Ltda. (7) | — | 50.000 | % | 50.000 | % | 191,715,200 | 152,292,311 | 6,107,289 | (14,310,417 | ) | 6,818,420 | 3,053,646 | (56,045,596 | ) | 95,857,601 | 27,255,769 | ||||||||||||||||||||||||||||||||
| Central Geradora Termelectrica Fortaleza S.A. (5) | 20,246,908 | 0.000 | % | 0.000 | % | — | — | — | — | 6,475,405 | — | — | — | — | ||||||||||||||||||||||||||||||||||
| Konecta Chile S.A. (6) | 262 | 26.200 | % | — | 1,056 | — | — | — | — | — | — | 277 | ||||||||||||||||||||||||||||||||||||
| Sistemas SEC S.A. (3) | 56,350 | 49.000 | % | 49.000 | % | 2,072,767 | 1,882,101 | (257,855 | ) | 190,667 | 46,530 | (126,349 | ) | (93,427 | ) | 1,015,656 | 922,229 | |||||||||||||||||||||||||||||||
| Termoeléctrica José de San Martín S.A. (4) | 500,006 | 23.100 | % | 23.100 | % | 84,163 | 70,987 | — | — | — | — | — | 19,442 | 16,398 | ||||||||||||||||||||||||||||||||||
| Termoeléctrica Manuel Belgrano S.A. (4) | 500,006 | 23.100 | % | 23.100 | % | 84,158 | 70,983 | — | — | — | — | — | 19,440 | 16,397 | ||||||||||||||||||||||||||||||||||
| GNL Chile S.A. (5) | 3,023,642 | 23.57 | % | 33.330 | % | (1,493,484 | ) | (1,708,857 | ) | — | (412,488 | ) | — | — | (137,496 | ) | (352.011 | ) | (569,619 | ) | ||||||||||||||||||||||||||||
| Centrales Hidroeléctricas de Aysén S.A. (5) | 1,702,124 | 51.000 | % | 51.000 | % | 21,449,949 | 29,258,515 | — | (1,931,804 | ) | — | — | (985,219 | ) | 10,939,474 | 14,921,838 | ||||||||||||||||||||||||||||||||
| GNL Quintero S.A. (5) | 200 | — | 20.00 | % | — | 7,950,210 | — | (735,660 | ) | — | — | (147,132 | ) | — | 1,590,042 | |||||||||||||||||||||||||||||||||
| Consorcio Ara- Ingendesa Sener (1) | — | — | 33..33 | % | — | (5,283 | ) | — | (6,282 | ) | — | — | (2,094 | ) | — | (1,761 | ) | |||||||||||||||||||||||||||||||
| Total | 7,397,174 | 5,411,822 | (54,761,053 | ) | 123,445,231 | 59,195,644 | ||||||||||||||||||||||||||||||||||||||||||
F - 51
Table of Contents
| (1) | Related companies of subsidiary Ingendesa Ltda. that cannot be consolidated. | ||
| (2) | Related company of subsidiary Endesa Argentina S.A. that cannot be consolidated. | ||
| (3) | Related company of subsidiary of CAM Chile Ltda. that cannot be consolidated. | ||
| (4) | Related companies of subsidiaries Endesa Costanera S.A. and Hidroeléctrica El Chocón S.A. that cannot be consolidated. | ||
| (5) | Companies of Endesa Chile that cannot be consolidated (in organization of start-up in 2006). | ||
| (6) | Related company of subsidiary Synapsis Ltda. that cannot be consolidated | ||
| (7) | Included an allowance for impairment ascending ThCh$ 48,890,387 (see Note 2 l). |
| b) | Income and (losses) recognized by Enersis S.A. based on the participation in the related companies as of December 31, 2005, amounted to ThCh$ 15,860,236 (ThCh$ 8,463,062); ThCh$ 5,546,450 (ThCh$ (134,628)) in 2006 and ThCh$ 2,732,317 (ThCh$ (57,493,370)) in 2007. |
| c) | In accordance with Technical Bulletin No.64 of the Chilean Association of Accountants for the years ended December 31, 2005, 2006 and 2007, the Company has recorded foreign exchange gains and losses on liabilities related to net investments in foreign countries that are denominated in the same currency as the functional currency of those foreign investments. Such gains and losses are included in the cumulative translation adjustment account in shareholders’ equity, and in this way, act as a hedge of the exchange risk affecting the investments. As of December 31, 2007 the corresponding amounts are as follows: |
| Country | Reporting | |||||||||||||||
| Company | of origin | Investment | currency | Liability | ||||||||||||
| ThCh$ | ThCh$ | |||||||||||||||
| Edesur S.A. | Argentina | 154,877,795 | US$ | 53,275,201 | ||||||||||||
| Ampla Energía e Servicos S.A. | Brazil | 139,554,346 | US$ | 130,222,037 | ||||||||||||
| Emgesa S.A. | Colombia | 178,159,768 | US$ | 227,962,660 | ||||||||||||
| Edegel S.A. | Peru | 123,522,245 | US$ | 105,048,701 | ||||||||||||
| Hidroeléctrica El Chocón S.A. | Argentina | 209,430,225 | US$ | 70,068,527 | ||||||||||||
| Comercializadora de Energía del Mercosur S.A. | Argentina | 3,414,901 | US$ | 2,328,177 | ||||||||||||
| Endesa Brasil S.A. | Brazil | 447,199,840 | US$ | 378,631,505 | ||||||||||||
| Endesa Costanera S.A. | Argentina | 76,640,125 | US$ | 42,241,091 | ||||||||||||
| Total | 1,332,799,245 | 1,009,777,899 | ||||||||||||||
| Country | Reporting | |||||||||||||||
| Company | of origin | Investment | currency | Liability | ||||||||||||
| ThCh$ | ThCh$ | |||||||||||||||
| Edesur S.A. | Argentina | 170,072,007 | US$ | 61,305,441 | ||||||||||||
| Ampla Energía e Servicos S.A. | Brazil | 162,345,326 | US$ | 149,850,571 | ||||||||||||
| Emgesa S.A. | Colombia | 355,604,911 | US$ | 262,323,761 | ||||||||||||
| Edegel S.A. | Peru | 150,895,239 | US$ | 120,882,825 | ||||||||||||
| Hidroeléctrica El Chocón S.A. | Argentina | 189,228,513 | US$ | 84,283,253 | ||||||||||||
| Comercializadora de Energía del Mercosur S.A. | Argentina | 3,990,917 | US$ | 2,674,710 | ||||||||||||
| Endesa Brasil S.A. | Brazil | 505,152,941 | US$ | 433,600,545 | ||||||||||||
| Endesa Costanera S.A. | Argentina | 88,845,906 | US$ | 52,242,841 | ||||||||||||
| Total | 1,626,135,760 | 1,167,163,947 | ||||||||||||||
F - 52
Table of Contents
| d) | The investments in related companies made by Enersis S.A. and its affiliates for the years ended December 31, 2006 and 2007, amounted to ThCh$ 24,219,165 and ThCh$ 38,182,150, respectively, which are detailed as follows: |
| As of December 31, | ||||||||
| Company | 2006 | 2007 | ||||||
| ThCh$ | ThCh$ | |||||||
| Centrales Hidroeléctricas de Aysén S.A. (Endesa Chile) (2) | 10,910,981 | 3,848,089 | ||||||
| Pangue (Endesa Chile) | 9,829 | — | ||||||
| Sistemas Sec S.A. (Cam) | 277,492 | — | ||||||
| Chilectra S.A. (formerly Elesur S.A.) (1) | 13,020,863 | — | ||||||
| Endesa Costanera S.A. | — | 5,505,301 | ||||||
| Central Hidroeléctrica El Chocón S.A. | — | 28,828,760 | ||||||
| Total | 24,219,165 | 38,182,150 | ||||||
| As of December 31, | ||||||||
Company | 2006 | 2007 | ||||||
| ThCh$ | ThCh$ | |||||||
| Centrales Hidroeléctricas de Aysén S.A. (Endesa Chile) | 10,910,981 | 3,848,089 | ||||||
| Pangue (Endesa Chile) | 9,829 | — | ||||||
| Sistemas Sec S.A. (Cam) | 277,492 | — | ||||||
| Chilectra S.A. (formerly Elesur S.A.) (1) | 13,020,863 | — | ||||||
| Endesa Costanera S.A. | — | 5,505,301 | ||||||
| Central Hidroeléctrica El Chocón S.A. | — | 28,828,760 | ||||||
| Total | 24,219,165 | 38,182,150 | ||||||
| (1) | These are partial disbursements made by Endesa Internacional for the purchase of Chilectra S.A. (Ex-Elesur). | |
| (2) | The total investment was ThCh$ 4,967,589 , of wich ThCh$ 1,119,500 correspond a capitalization of an intercompany receible between Endesa Chile and Aysén. |
| e) | Constitution of companies |
| i. | On April 18, 2005, Endesa Chile and its subsidiary Enigesa executed the incorporation deed of a new subsidiary, bearing the corporate name of Endesa Eco S.A. and whose purpose will be to promote and develop projects associated with renewable energies. Endesa Eco S.A.’s capital amounts to ThCh$ 636,001, and is divided into 5,800,000 nominal, no par value shares. Endesa Chile subscribed to 5,799,420 shares, representing 99.99% of the corporate capital and paid in ThCh$ 197,360, representing 1,799,820 shares while Enigesa subscribed to 580 shares, representing 0.01% of the corporate capital and paid in ThCh$ 20, representing 180 shares. Each shareholder will pay in its part of the balance of the capital over three years as from the date of incorporation. | ||
| ii. | On September 4, 2006, Endesa Chile and its subsidiary Endesa Inversiones Generales S.A. executed the incorporation deed that gave birth to a new subsidiary, whose name is Centrales Hidroeléctricas de Aysén S.A. and whose objective is the development, financing, ownership and operation of a hydroelectric project in the 11th Region (Aysén). The capital of the company is one million Chilean pesos divided into 100 ordinary, single-series, nominal, equivalent, no par-value shares. Endesa Chile subscribed 99 shares, representing 99% of the capital, and paid the total amount, a sum of ThCh$ 1.059, while Endesa Inversiones Generales S.A. subscribed one share, representing 1% of the capital, and paid in ThCh$ 11 for it. |
F - 53
Table of Contents
| On September 21, 2006 the First General Extraordinary Shareholders’ Meeting of Centrales Hidroeléctricas de Aysén S.A. was held and in it the increase in the paid-in capital of the Company to the new sum of ThCh20,000,000 divided into 2 million nominal, single-series, no par value shares, was approved. This will be subscribed to and paid in within three years of the date of the above mentioned First Extraordinary General Shareholders’ Meeting. In this way, of the 1,999,900 shares corresponding to the increase in paid-in capital, Endesa Chile would subscribe to 1,019,900 shares, representing 51% of the increase in capital and 50.99995% of the new capital of the Company, while the new shareholder Colbún S.A. would subscribe to 980,000 shares, representing 49% of the increase in paid-in capital and 49% of the new paid-in capital. Endesa Inversiones Generales S.A. will not exercise its preferential subscription right, and therefore its interest in the paid-in capital of the Company will be 0.00005%. | |||
| On October 10, 2006, Endesa Chile subscribed to 1,019,899 shares, paying in a total of ThCh$ 10,909,900 for them, or $ 10,000 per share, a sum equivalent to the placement value agreed to in the First General Shareholders’ Meeting of Centrales Hidroeléctricas de Aysén S.A.. At the same time, it subscribed to an additional 1 share, paying in a total of $ 10,000 for it, equivalent to the placement value agreed to in the First General Extraordinary Shareholders’ Meeting of Centrales Hidroeléctricas de Aysén S.A. However, the payment for this share was made in accordance with the terms set out in the public deed of “Payment of Shares Subscribed to for Transfer of Title and the Constitution of Usufruct on the Rights to Use the Water”, which was executed by the parties as of the same date, and according to which Ch$ 11 were paid in cash, plus a contribution for the ownership of the title to the rights to use the water that are identified in the above deed. | |||
| On October 16, 2007, the Extraordinary Shareholders’ Meeting of Centrales Hidroeléctricas de Aysén S.A. was held. The shareholders increased its capital by ThCh$ 13,375,000 representing 1,337,500 single series, no par value shares, which shall be subscribed and paid in within 3 years after the date of the Shareholders’ Meeting. At the same time, Empresa Nacional de Electricidad S.A. subscribed 682,125 shares for a total of ThCh$ 6,821,250, of which it paid ThCh$ 1,119,500 by capitalizing credits and ThCh$ 1,934,569 in cash. On December 17, 2007, Empresa Nacional de Electricidad S.A. paid in ThCh$ 1,913,520 by means of a cash payment to the account of this capital increase. | |||
| iii. | On March 9, 2007, Empresa Nacional de Electricidad S.A. subscribed 200 of the 1,000 registered shares issued by public deed of the Company GNL Quintero S.A.. It paid for them by assigning, transferring and capitalizing in the Company accounts receivable of ThCh$ 2,011,863 from its investee GNL Chile S.A.. The ownership interest of Endesa Chile in GNL Quintero S.A. is 20%. On May 31, 2007 the pending contribution of ThCh$ 708 in GNL Chile S.A. was paid by capitalizing the account receivable. | ||
| iv. | On October 29, 2007, the company Central Eólica Canela S.A. was incorporated. Its shareholders are the subsidiary Endesa Eco S.A., which owns 75%, and Centinela S.A., which owns 25%. As of this date, this subsidiary forms part of the consolidated financial statements of the company. | ||
| By means of a shareholders’ agreement of November 23, 2007, Endesa Eco S.A. and Centinela S.A. stipulated the terms and conditions for the latter’s withdrawal 5 years after signing such agreement. The above agreement stipulates that Centinela S.A. will have the option of withdrawing from the company by selling its ownership interest to Endesa Eco S.A.. As a result of the above, minority interest has been recorded in sundry long-term creditors. |
| f) | Reorganization of entities under common control |
| i. | On June 10, 2005, Endesa Brasil S.A. was incorporated; its purpose is to acquire paid-in capital in other companies operating, or that may be incorporated to operate, directly or indirectly, in any segment of the electrical sector, transmission, distribution, generation and marketing of electrical energy, in Brazil and other countries. Endesa Brasil S.A. was created as an energy holding concentrating all the electrical assets of Endesa, S.A. Group’s in Brazil. | ||
| Endesa Brasil S.A. holds ownership percentages in the following companies: Compañía de Interconexión Energética S.A. (CIEN), Central Generadora Termeléctrica Fortaleza S.A. (CGTF), Companhia Energetica Do Ceara (COELCE), Ampla Energia e Servicos S.A. (formerly, Cerj), Ampla Investimentos e Servicos S.A., Ampla Generación S.A., Investluz and Cetrais Eléctricas Cachoeira Dourada S.A. (CDSA). | |||
| Endesa Brasil’s interest in these investees were contributed on October 25, 26 and 27, 2005 by Enersis S.A., Endesa Chile., Chilectra S.A. and Endesa Internacional. |
F - 54
Table of Contents
| Contributions made by Enersis S.A. and its subsidiaries are detailed as follows: |
| • | Endesa Chile, through its subsidiaries Edegel S.A. and Compañía Eléctrica Cono Sur S.A., contributed its investment in Centrais Eléctricas Cachoeira Dourada S.A. (99.61%) and Compañía de Interconexión Energética S.A. (Cien) (45.00%), receiving in exchange an interest in Endesa Brasil S.A.: 4.18% for Edegel S.A. and 36.27% for Compañia Eléctrica Cono Sur S.A. | ||
| • | Chilectra S.A., through its subsidiaries Chilectra Inversud S.A. and Luz de Río S.A., contributed its investments as follows: |
| • | Chilectra S.A. contributed 10.33% of its investment in Ampla Energia e Servicos S.A., receiving in exchange a 4.65% interest in Endesa Brasil S.A. | ||
| • | Chilectra Inversud S.A. contributed 10.42% of its investment in Investluz S.A., receiving in exchange a 2.37% interest in Endesa Brasil S.A. | ||
| • | Luz de Río S.A. contributed 7.76% of its investment in Ampla Energia e Servicos S.A., receiving in exchange a 3.49% interest in Endesa Brasil S.A. | ||
| • | Enersis S.A., contributed to Endesa Brasil S.A. the following investments: | ||
| • | Its 48.82% interest in Central Generadora Termeléctrica Fortaleza S.A., receiving in exchange an 8.84% interest in Endesa Brasil S.A. | ||
| • | Its 15.61% interest in Investluz S.A., receiving in exchange a 3.55% interest in Endesa Brasil S.A. | ||
| • | Its 18.10% interest in Ampla Energia e Servicos S.A., receiving in exchange an 8.15% interest in Endesa Brasil S.A. |
| To summarize the above, Enersis S.A. has a direct and indirect interest in Endesa Brasil S.A. amounting to 53.61%. |
| The transaction described above resulted in ThCh$ 6,795,534 equity decrease as a result of the application of Technical Bulletin No. 72 of the Chilean Association of Accountants, for a business combination under the pooling of interest method (see note 22 e). |
| ii. | On September 6, 2005, the Company acquired 189,000 shares of Ingendesa S.A. for ThCh$ 66,458, increasing its direct participation in that company to 98.75%. |
| iii. | On November 22, 2005, the Company sold 1 share of Compañía Eléctrica San Isidro S.A. to Endesa Inversiones Generales S.A., for the amount of ThCh$ 15 |
| iv. | On April 1, 2006, the subsidiaries Chilectra S.A. (formerly Elesur S.A.) and Chilectra S.A. merged, as was approved in a Meeting of Shareholders held on March 31, 2006. As a result of the merger and according to Technical Bulletin N°72 of the Chilean Institute of Accountants, this business combination subject to common control was recorded under the pooling of interests methodology, causing an increase of ThCh$ 3,242,987 in shareholders’ equity (see note 22e). |
| v. | On August 3, 2007, Endesa Chile Internacional S.A. was subject to a takeover merger by Sociedad Compañía Eléctrica Cono Sur S.A., with the latter subsisting as the company making the takeover. This merger was approved and ratified in the Extraordinary Shareholders’ Meetings of both companies on August 7, 2007. |
F - 55
Table of Contents
| This merger had no effect, since Endesa Chile was the main 100% shareholder of both companies |
| vi. | On September 1, 2007, the merger of the Colombian companies Emgesa S.A. and Central Hidroeléctrica Betania S.A., approved by the Shareholders’ Meetings of both companies of February 21, 2007, took place by Betania taking over Emgesa, with the former subsisting as the company making the take over and changing its name Emgesa S.A. | ||
| The above transaction has been recorded as stipulated in Technical Bulleting 72 of the Chilean Institute of Accountants as a combination of companies under common control based on the methodology of the unification of interests. | |||
| As a result of this merger Endesa Chile and its subsidiary Compañía Eléctrica Cono Sur S.A. hold a direct 26.87% (1.45% and 25.43%, respectively) share of this new company. This ownership interest eliminates the 99.99% previously held in Betania S.A.. Before the merger, Betania S.A. held a 23.45% ownership interest in Emgesa S.A. | |||
| As a result of the above, an equity reduction of reserves of ThCh$ 56,695,443 has been recognized (See note 22e). |
| g) | Acquisitions |
| i. | On August 11, 2005, the Company and its subsidiary Endesa Inversiones Generales S.A. acquired 99.999% and 0.001% of Inversiones Lo Venecia Ltda., for amounts of ThCh$ 9,167,709 and ThCh$ 90, respectively. Lo Venecia Ltda was the owner of 25.001% of the paid-in capital of Compañía Eléctrica San Isidro S.A. As a result, Endesa Chile now directly and indirectly owns 100% of the shares of Compañía Eléctrica San Isidro S.A. | ||
| In accordance with Technical Bulletin No.72 of Chilean Association of Accountants and the standards established in the Circular No.1697 of the Chilean Superintendence of Securities and Insurance, the Company recorded the acquisition under the purchase method, valuing the proportion of all assets and liabilities acquired of Compañía Eléctrica San Isidro S.A. from third parties as of July 31, 2005 at their respective fair values. | |||
| The difference determined by the Company between the fair value and the carrying value of Compañía Eléctrica San Isidro S.A. shareholders’ equity as of the acquisition date amounted to ThCh$ 7,287,452, and it is due to the higher economic value of property, plant and equipment compared to their carrying value. This amount assigned to the property, plant and equipment will be depreciated over 18 years, which was the estimated remaining useful life of these assets at the time of acquisition. | |||
| ii. | On January 13, 2006, the Company purchased 5,500 shares in Empresa Eléctrica Pangue S.A. for ThCh$ 6,055, increasing it direct ownership interest in such company to 94.97%. | ||
| On July 20, 2006, the Company acquired 3,500 shares of Empresa Eléctrica Pangue S.A. for ThCh$ 3,774, increasing its direct ownership interest in that company to 94.975189%. | |||
| iii. | In Peru, on June 1, 2006, Empresa de Generación Termoeléctrica Ventanilla S.A. (Etevensa) was upstream merged into the subsidiary Edegel S.A. | ||
| As a result of the merger and in accordance with Technical Bulletin N° 72 of the Chilean Institute of Accountants, this business combination subject to common control was recorded under the pooling of interests methodology and led to decreasing the interest in Edegel S.A. to 55.44% and recognizing a reduction in other reserves, under shareholders’ equity, by ThCh$ 6,183,922 (See note 22e). | |||
| iv. | Through a Memorandum of Understanding signed on October 5, 2004, the Corporación Financiera del Valle will stop being shareholder of the Central Hidroeléctrica de Betania S.A. through an asset exchange operation which will take place between the Corfivalle Group and Endesa Chile when the legal processes defined by both parties prior to the delivery of the titles to the assets involved are completed. On December 29, 2006 the writ of the splitting of Betania was protocolized, and with that the transfer of ownership of the assets forming part of the Corfivalle group was formalized. |
F - 56
Table of Contents
| With this operation, the Endesa Chile Group gave to Corfivalle the electricity Sub-station of Betania S.A. E.S.P. and 3.81% of the ownership in Empresa de Energía de Bogotá S.A. E.S.P., in exchange for a 14.3% interest in Central Hidroeléctrica de Betania S.A. E.S.P which at that date was owned by Corfivalle; thus Endesa Chile Group increased its interest in Central Hidroeléctrica de Betania S.A. E.S.P from 85.62% to 99.99%. | |||
| In accordance with Technical Bulletin N° 72 of the Chilean Institute of Accountants and Circular N°1697 of the Superintendence of Securities and Insurance, the Company evaluated the assets and liabilities acquired from Central Hidroeléctrica de Betania S.A. at their respective fair market values. As a result of this evaluation it was concluded that the fair market values do not differ substantially from the book values. | |||
| As a result, the above mentioned purchase of the minority interest was recorded in conformity with Technical Bulletin No. 72 of the Chilean Institute of Accountants and involved recognizing negative goodwill amounting to ThCh$7, 855.746. (See note 13b). | |||
| v. | On February 27, 2007, Empresa Nacional de Electricidad S.A. proceeded to acquire 19,574,798 ordinary, registered, non-endorsable shares of Southern Cone Power Argentina S.A. for ThCh$ 5,505,301. These shares represent 100% of the capital of Southern Cone Power Argentina S.A., which is the holder of 8,081,160 class A shares of Endesa Costanera S.A., representatives of 5.5% of this Company’s capital stock, which is the only asset of Southern Cone Power Argentina S.A.. As a result of the above, Endesa Chile now directly and indirectly owns 69.77% of the stock of Endesa Costanera S.A.. | ||
| vi. | On March 08, 2007, Empresa Nacional de Electricidad S.A. finalized signature of a contract to purchase all the shares of Central Hidroeléctrica El Chocón S.A., held directly or indirectly by CMS Generation S.R.L.. Endesa Chile made use of its “first refusal” option giving it the preferential purchase option under a shareholders’ agreement. The operation meant acquiring 2,734,110 class R shares and 1,733,390 class L shares equivalent to 25% of the stock capital of Hidroinvest S.A., the company which controls 59% of Hidroeléctrica El Chocón S.A., as well as 7,405,768 shares of Central Hidroeléctrica El Chocón S.A., equivalent to 2.4803% of the stock capital of the Company, which gave it the preferential purchase option under a shareholders’ agreement, for US$ 50,000,000 (ThCh$ 28,828,760). As a result of the above, Endesa Chile now directly and indirectly owns 67.67% of the stock capital of Central Hidroeléctrica El Chocón S.A. | ||
| According to the provisions of Technical Bulletin 72 of the Chilean Institute of Accountants and the standards stipulated in 1.697 of the Superintendence of Securities and Insurance, the Company evaluated the assets and liabilities acquired from Endesa Costanera S.A. and Central Hidroeléctrica El Chocón S.A. at their respective fair values. This evaluation showed that the fair values do not differ significantly from book values. | |||
| As a result of the above, the above minority interest was recorded as stipulated in Technical Bulletin 72 of the Chilean Institute of Accountants and a negative goodwill of ThCh$ 2,035,385 was recognized in Endesa Costanera S.A. and ThCh$ 5,356,840 in Central Hidroeléctrica El Chocón S.A. (See note 13b). | |||
| vii. | On March 27, 2007, Sociedad Concesionaria Túnel el Melón S.A. increased its paid-in capital by issuing 3,169,614,306 shares at a total amount of ThCh$ 32,042,220, with the Company concurring 100%, through a cash payment of ThCh$ 16,927,339 and capitalization of loans in the amount of ThCh$ 15,114,821, thereby increasing the Company’s participation in that company by 0.01% to 100% |
F - 57
Table of Contents
| h) | Dissolution of related parties: |
| i. | As of October 3, 2005 Sociedad Lajas Inversoras S.A., owner of 99.61% of the Brazilian company Cachoeira Dourada S.A. was dissolved and liquidated. The assets of the company were allocated among all shareholders proportionally to their participation, meaning that the Company’s indirect subsidiary Edegel S.A. received 11.47% of these assets and the Company’s subsidiary Compañía Eléctrica Cono Sur S.A. received 88.53% of these assets. | ||
| ii. | On November 29, 2005, the Company acquired 0.001% of Inversiones Lo Venecia Ltda. for the amount of ThCh$ 91. As a result of this purchase, Inversiones Lo Venecia Ltda. ceased to exist as a separate legal entity, given that the Company already owned the remaining 99.999% of its shares. All assets and liabilities owned by Lo Venecia Ltda. were transferred to Endesa Chile. | ||
| iii. | On November 29, 2005, the Company transferred the assets of Inversiones Eléctricas Quillota S.A. to Endesa Chile (individual entity) through the dissolution of Inversiones Eléctricas Quillota | ||
| iv. | As a company restructuring in Colombia, on January 30, 2006 Capital de Energía S.A. (Cesa), owner of 48.48% of Emgesa S.A. was liquidated. 51.00% of Cesa, in turn, was controlled by Central Hidroeléctrica Betania S.A. | ||
| As a result of such restructuring, as stipulated in Technical Bulletin 72 of the Chilean Institute of Accountants, this transaction by companies under common control was booked using the pooling of interests methodology, which meant reducing the ownership interest of Emgesa S.A. to 23.45% and recognizing an equity increase in reserves of ThCh$ 2,054,422 (see note 22e). |
| i) | Business Structure |
| As a result of the reduction of available capacity for power generation and the physical guarantee of energy and associated wattage, Companhia de Interconexão Energética (CIEN) is struggling to focus its business on a different compensation structure which would not be dependent on the energy coming from Argentina and Brazil for purchases and sales of power across borders. In this regard, CIEN is renegotiating its existing contracts for supplying energy while seeking at the same time a compensation that would be compatible with its position of transporter of energy across countries. CIEN expects to define its new business structure in the course of 2008. |
| j) | Impairment of investment accounted for under the equity-method |
| During the year ended December 31, 2007, the Company recorded an impairment charge of its investment in Inversiones Gas Atacama Holding Limitada and subsidiaries, as the Company believes that the investment is other-than-temporary impaired. | |||
| Gas Atacama Holding Limitada and its subsidiaries operate gas pipelines between Argentina and Chile, as well as power generating thermoelectrical plants in the north of Chile. | |||
| Gas Atacama’s subsidiary GasAtacama Generación S.A. (GAG), has been notified of the arbitration sentence in its dispute with the electricity distribution companies Empresa Eléctrica de Arica S.A., Empresa Eléctrica de Iquique S.A. and Empresa Eléctrica de Antofagasta S.A., before the arbitrator Ricardo Peralta, in which GAG demanded the termination of the electricity supply contracts signed with those distributors. | |||
| The result of the arbitration has been unfavorable for GAG, thus further aggravating the entities’s delicate operative and financial situation. | |||
| Due to the facts and circumstances described above, the Company believes that the impairment of its investment in Gas Atacama is other-than-temporary as it is rather influenced by changes in the economical environment, situation of raw material supply and other circumstances which are not deemed to be temporary in nature. |
F - 58
Table of Contents
| The Company performed an impairment test by comparing the fair value of the investment in Gas Atacama (determined using a discounted cash-flow approach as no market value is available) to the respective carrying amount (including goodwill), resulting in the investment (including goodwill) being impaired. |
| Thus, as of December 31, 2007, the Company recorded a total impairment charge of ThCh$ 48,953,062 in its Consolidated Statements of Income, which is comprised of ThCh$ 62,675 of impairment charge of goodwill recorded over the investment in Inversiones Gas Atacama Holding and ThCh$ 48,890,387 related to the impairment of the investment accounted for under the equity method. These amounts were recorded within the lines “Amortization of goodwill” and “Equity participation in losses of related companies”, respectively in the Consolidated Statement of Income. |
F - 59
Table of Contents
| Number | Percentage | As of December 31, | ||||||||||||||
| Company | of shares | owned | 2006 | 2007 | ||||||||||||
| % | ThCh$ | ThCh$ | ||||||||||||||
| CDEC-SIC Ltda. | — | 14.36 | % | 146,315 | 175,836 | |||||||||||
| CDEC-SING Ltda. | — | 7.69 | % | 164,009 | 278,359 | |||||||||||
| Club de la Banca y Comercio | 1 | — | 2,212 | 1,892 | ||||||||||||
| Club Empresarial | 1 | 1.00 | % | 24,749 | 21,538 | |||||||||||
| Cooperativa Eléctrica de Chillán Ltda. | — | — | 15,180 | 15,180 | ||||||||||||
| Electrificadora de la Costa Atlántica | 6,795,148 | 0.14 | % | 98,271 | 85,398 | |||||||||||
| Electrificadora del Caribe | 42,784,058 | 0.10 | % | 1,293,404 | 1,123,983 | |||||||||||
| Empresa Eléctrica de Aysén S.A. | 2,516,231 | — | 2,326,312 | 2,326,312 | ||||||||||||
| Empresa Eléctrica de Bogotá S.A. | 2,124,047 | 2.10 | % | 21,682,909 | 18,842,721 | |||||||||||
| Financiera Eléctrica Nacional S.A. | 4,098 | 0.10 | % | 118,415 | 102,905 | |||||||||||
| Dardanelos Participaçóes S.A. | — | — | 2,674 | 2,805 | ||||||||||||
| Total | 25,874,450 | 22,976,929 | ||||||||||||||
| a) | In accordance with current standards, recognition has been given to the excess of purchase price of the proportional equity in the net assets acquired (goodwill) in the purchase of shares as of December 31, 2006 and 2007, as follows: |
| As of December 31, | ||||||||||||||||||||
| Amortization | Net Balance | |||||||||||||||||||
| 2005 | 2006 | 2007 | 2006 | 2007 | ||||||||||||||||
| ThCh$ | ThCh$ | ThCh$ | ThCh$ | ThCh$ | ||||||||||||||||
| Chilectra S.A. (formerly Elesur S.A.) | (7,310,127 | ) | (7,310,211 | ) | (7,310,303 | ) | 95,748,564 | 88,438,262 | ||||||||||||
| Codensa S.A. | (964,502 | ) | (981,328 | ) | (852,786 | ) | 10,631,045 | 8,385,727 | ||||||||||||
| Edegel S.A. | (32,079 | ) | (32,639 | ) | (25,967 | ) | 353,587 | 281,305 | ||||||||||||
| Emgesa S.A. | (1,263,904 | ) | (777,630 | ) | (619,125 | ) | 8,427,566 | 6,704,537 | ||||||||||||
| Empresa Eléctrica de Colina S.A. | (217,794 | ) | (217,794 | ) | (217,796 | ) | 2,123,497 | 1,905,701 | ||||||||||||
| Empresa Eléctrica Pangue S.A. | (196,710 | ) | (196,711 | ) | (196,711 | ) | 3,065,409 | 2,868,698 | ||||||||||||
| Empresa Nacional de Electricidad S.A. | (50,522,158 | ) | (50,522,158 | ) | (50,522,159 | ) | 583,109,080 | 532,586,922 | ||||||||||||
| Gasoducto Atacama Chile S.A. (1) | (5,613 | ) | (5,613 | ) | (68,288 | ) | 68,288 | — | ||||||||||||
| Inversiones Distrilima S.A. | (1,173 | ) | (1,193 | ) | (1,037 | ) | 9,549 | 7,261 | ||||||||||||
| Total | (60,514,060 | ) | (60,045,277 | ) | (59,814,172 | ) | 703,536,585 | 641,178,413 | ||||||||||||
| (1) | During the year ended December 31, 2007, in addition to ordinary annual amortization of ThCh$ 5,613, the Company recorded goodwill impairment amounting to ThCh$ 62,675, resulting in a complete impairment of goodwill recorded over this investment. See Note 11 j) for details. |
F - 60
Table of Contents
| b) | Following current standards, recognition has been given to the excess of the equity in the net assets purchased over the purchase price (negative goodwill) in the purchase of shares as of December 31, 2006 and 2007 as follows: |
| As of December 31, | ||||||||||||||||||||
| Company | Amortization | Net Balance | ||||||||||||||||||
| 2005 | 2006 | 2007 | 2006 | 2007 | ||||||||||||||||
| ThCh$ | ThCh$ | ThCh$ | ThCh$ | ThCh$ | ||||||||||||||||
| Endesa Costanera S.A. (1) | 2,722,177 | 2,769,662 | 2,495,374 | (7,616,584 | ) | (6,247,414 | ) | |||||||||||||
| Edegel S.A. | 8,050,476 | 1,819,292 | 1,580,988 | (23,802,401 | ) | (19,103,601 | ) | |||||||||||||
| Hidroeléctrica El Chocón (1) | — | — | 208,709 | — | (5,356,840 | ) | ||||||||||||||
| Emgesa S.A. (2) | 6,016,058 | 1,895,278 | 97,005 | (7,855,746 | ) | (6,296,047 | ) | |||||||||||||
| Inversiones Distrilima S.A. | 24,624 | 25,052 | 21,771 | (386,228 | ) | (313,866 | ) | |||||||||||||
| Synapsis Soluciones y Servicios IT Ltda. | 18,012 | 18,012 | 18,012 | (94,565 | ) | (76,552 | ) | |||||||||||||
| Edelnor S.A. | 161,473 | — | — | — | — | |||||||||||||||
| Total | 16,992,820 | 6,527,296 | 4,421,859 | (39,755,524 | ) | (37,394,320 | ) | |||||||||||||
| (1) | See Note 11 (g) vi | |
| (2) | See Note 11 (g) iv |
| As of December 31, | ||||||||
| 2006 | 2007 | |||||||
| ThCh$ | ThCh$ | |||||||
| Bond discount (Note 18) | 15,921,224 | 13,082,799 | ||||||
| Bond issuance cost | 5,554,818 | 3,913,279 | ||||||
| Deferred expenses | 4,819,179 | 913,773 | ||||||
| Bank fees and interest expense | 8,341,972 | 6,591,406 | ||||||
| Post-retirement benefits | 3,107,649 | 2,911,612 | ||||||
| Security deposits for judicial obligations | 63,301,022 | 62,703,989 | ||||||
| Recoverable taxes | 61,624,228 | 56,205,735 | ||||||
| Reimbursable contributions | 875,556 | 669,369 | ||||||
| Deferred assets (Brazil) | 76,304,778 | 59,537,262 | ||||||
| Fair value derivative contracts | 51,146,164 | 42,065,143 | ||||||
| Others | 3,782,523 | 3,603,180 | ||||||
| Total | 294,779,113 | 252,197,547 | ||||||
F - 61
Table of Contents
| Note 15. Due to Banks and Financial Institutions |
| a) | Short-term debt due to banks and financial institutions: |
| Foreign currency | ||||||||||||||||||||||||||||||||||||||||
| US$ | Other foreign currency | $ Readjusted | Ch$ | As of December 31, | ||||||||||||||||||||||||||||||||||||
| Financial Institution | 2006 | 2007 | 2006 | 2007 | 2006 | 2007 | 2006 | 2007 | 2006 | 2007 | ||||||||||||||||||||||||||||||
| ThCh$ | ThCh$ | ThCh$ | ThCh$ | ThCh$ | ThCh$ | ThCh$ | ThCh$ | ThCh$ | ThCh$ | |||||||||||||||||||||||||||||||
| ABN Amro Bank | — | — | 7,273,626 | 5,843,483 | — | — | — | — | 7,273,626 | 5,843,483 | ||||||||||||||||||||||||||||||
| Banco Av Villas | — | — | 8,250,424 | 9,906,699 | — | — | — | — | 8,250,424 | 9,906,699 | ||||||||||||||||||||||||||||||
| Banco Bayerische Landes | 15,805 | 14,031 | — | — | — | — | — | — | 15,805 | 14,031 | ||||||||||||||||||||||||||||||
| Banco BBVA | — | — | 25,895,982 | 46,791,820 | — | — | — | — | 25,895,982 | 46,791,820 | ||||||||||||||||||||||||||||||
| Banco BBVA Bhif | — | — | — | — | — | — | 1 | 5 | 1 | 5 | ||||||||||||||||||||||||||||||
| Banco Continental | 2,346 | — | 14,948,572 | 12,309,942 | — | — | — | — | 14,950,918 | 12,309,942 | ||||||||||||||||||||||||||||||
| Banco Credicoop | — | — | 185,005 | — | — | — | — | — | 185,005 | — | ||||||||||||||||||||||||||||||
| Banco Crédito Perú | — | 4,532,854 | 10,809,829 | 11,230,996 | — | — | — | — | 10,809,829 | 15,763,850 | ||||||||||||||||||||||||||||||
| Banco Crédito e Inversiones | 158,702 | — | — | — | — | — | 843 | 8 | 159,545 | 8 | ||||||||||||||||||||||||||||||
| Banco de Bogotá | — | — | 21,171,496 | 4,446,466 | — | — | — | 21,171,496 | 4,446,466 | |||||||||||||||||||||||||||||||
| Banco de Chile | — | — | — | — | — | — | 215,239 | 10 | 215,239 | 10 | ||||||||||||||||||||||||||||||
| Banco de Galicia y Buenos Aires | 634,838 | 885,686 | — | — | — | — | — | — | 634,838 | 885,686 | ||||||||||||||||||||||||||||||
| Banco de la Ciudad de Buenos Aires | — | — | 2,258,158 | — | — | — | — | — | 2,258,158 | — | ||||||||||||||||||||||||||||||
| Banco de la Nación | — | — | 24,323 | 33,167 | — | — | — | — | 24,323 | 33,167 | ||||||||||||||||||||||||||||||
| Banco de la Provincia de Buenos Aires | 1,447,296 | — | — | — | — | — | — | — | 1,447,296 | — | ||||||||||||||||||||||||||||||
| Banco do Brasil | 2,719,872 | — | — | 6,356,253 | — | — | — | — | 2,719,872 | 6,356,253 | ||||||||||||||||||||||||||||||
| Banco do Nordeste do Brasil | — | — | 101,049 | 185,227 | — | — | — | — | 101,049 | 185,227 | ||||||||||||||||||||||||||||||
| Banco Estado | 76,548 | 314,130 | — | — | — | — | — | 2,305 | 76,548 | 316,435 | ||||||||||||||||||||||||||||||
| Banco Hipotecario | — | — | 75,009 | — | — | — | — | — | 75,009 | — | ||||||||||||||||||||||||||||||
| Banco Itau | 1,099,429 | 1,219,637 | 736,453 | 1,114,970 | — | — | — | — | 1,835,882 | 2,334,607 | ||||||||||||||||||||||||||||||
| Banco Popular | — | — | 7,769,057 | — | — | — | — | — | 7,769,057 | — | ||||||||||||||||||||||||||||||
| Banco Real | — | — | 25,355 | — | — | — | — | — | 25,355 | — | ||||||||||||||||||||||||||||||
| Banco Río de la Plata | — | — | 12,571 | 1,082,368 | — | — | — | — | 12,571 | 1,082,368 | ||||||||||||||||||||||||||||||
| Banco Safra | — | — | 264,118 | — | — | — | — | — | 264,118 | — | ||||||||||||||||||||||||||||||
| Banco Santander Central Hispano | — | — | 786,680 | 892,315 | — | — | — | — | 786,680 | 892,315 | ||||||||||||||||||||||||||||||
| Banco Santander Santiago | 124,334 | — | 4,904,556 | 2,288,410 | — | — | — | — | 5,028,890 | 2,288,410 | ||||||||||||||||||||||||||||||
| Banco Security | 149 | 7 | — | — | 2,244 | 4,089 | 2,403 | 4,294 | 4,796 | 8,390 | ||||||||||||||||||||||||||||||
| Bank Boston | — | — | — | — | — | — | 3,945 | 1 | 3,945 | 1 | ||||||||||||||||||||||||||||||
| Bancolombia | — | — | 42,699 | — | — | — | — | — | 42,699 | — | ||||||||||||||||||||||||||||||
| Barings | — | — | 13,069,750 | — | — | — | — | — | 13,069,750 | — | ||||||||||||||||||||||||||||||
| Bladex | 2,620,087 | 2,415,322 | — | — | — | — | — | — | 2,620,087 | 2,415,322 | ||||||||||||||||||||||||||||||
| Citibank N.A. | 5,317 | — | 10,651,409 | 10,322,832 | — | — | — | — | 10,656,726 | 10,322,832 | ||||||||||||||||||||||||||||||
| Citibank (Agencia Chile) | — | — | — | — | — | — | 1 | — | 1 | — | ||||||||||||||||||||||||||||||
| Colmena | — | — | — | 4,984,892 | — | — | — | — | — | 4,984,892 | ||||||||||||||||||||||||||||||
| Comafi | — | 158 | 21,077 | — | — | — | — | — | 21,077 | 158 | ||||||||||||||||||||||||||||||
| Deutsche Bank | 7,958 | 6,516 | — | — | — | — | — | — | 7,958 | 6,516 | ||||||||||||||||||||||||||||||
| Interbank | — | — | 1,434,031 | 1,363,321 | — | — | — | — | 1,434,031 | 1,363,321 | ||||||||||||||||||||||||||||||
| JP Morgan | — | — | 110,930 | — | — | — | — | — | 110,930 | — | ||||||||||||||||||||||||||||||
| Standard Bank | 37,319 | 528 | — | — | — | — | — | — | 37,319 | 528 | ||||||||||||||||||||||||||||||
| Scotiabank — Perú | — | — | 4,197,276 | 13,422,455 | — | — | — | — | 4,197,276 | 13,422,455 | ||||||||||||||||||||||||||||||
| Scotiabank — Chile | — | 2,032,414 | — | — | — | — | — | 4 | — | 2,032,418 | ||||||||||||||||||||||||||||||
| Unibanco | — | 20,213,661 | — | 5,473,603 | — | — | — | — | — | 25,687,264 | ||||||||||||||||||||||||||||||
| Total | 8,950,000 | 31,634,944 | 135,019,435 | 138,049,219 | 2,244 | 4,089 | 222,432 | 6,627 | 144,194,111 | 169,694,879 | ||||||||||||||||||||||||||||||
| Total principal | 5,729,150 | 24,931,364 | 132,676,559 | 131,407,184 | — | — | — | — | 138,405,709 | 156,338,548 | ||||||||||||||||||||||||||||||
| Weighted average annual interest rate | 6.80 | % | 9.20 | % | 3.00 | % | 9.94 | % | 0.30 | % | 0.30 | % | — | — | 7.85 | % | 9.73 | % | ||||||||||||||||||||||
| As of December 31, | ||||||||
| 2006 | 2007 | |||||||
| % | % | |||||||
| Percentage of debt in foreign currency: | 99.84 | % | 96.25 | % | ||||
| Percentage of debt in local currency: | 0.16 | % | 3.75 | % | ||||
| Total | 100.00 | % | 100.00 | % | ||||
F - 62
Table of Contents
| b) | Current portion of long-term debt due to banks and financial institutions: |
| Foreign currency | ||||||||||||||||||||||||||||||||||||||||||||||||
| US$ | Euros | Other foreign currency | Ch$ | $ no Readjusted | As of December 31 | |||||||||||||||||||||||||||||||||||||||||||
| Financial Institution | 2006 | 2007 | 2006 | 2007 | 2006 | 2007 | 2006 | 2007 | 2006 | 2007 | 2006 | 2007 | ||||||||||||||||||||||||||||||||||||
| ThCh$ | ThCh$ | ThCh$ | ThCh$ | ThCh$ | ThCh$ | ThCh$ | ThCh$ | ThCh$ | ThCh$ | ThCh$ | ThCh$ | |||||||||||||||||||||||||||||||||||||
| Bancafe | — | — | — | — | 1,315,277 | — | — | — | — | — | 1,315,277 | — | ||||||||||||||||||||||||||||||||||||
| ABN Amro Bank | 38,928 | 35,024 | — | — | — | — | — | — | — | — | 38,928 | 35,024 | ||||||||||||||||||||||||||||||||||||
| Banco Alfa | — | — | — | — | — | 332,402 | — | — | — | — | — | 332,402 | ||||||||||||||||||||||||||||||||||||
| Banco Bayerische Landes | 710,376 | 617,908 | — | — | — | — | — | — | — | — | 710,376 | 617,908 | ||||||||||||||||||||||||||||||||||||
| Banco BBVA | 123,641 | 111,076 | — | — | 1,087,464 | 2,453,214 | — | — | — | — | 1,211,105 | 2,564,290 | ||||||||||||||||||||||||||||||||||||
| Bnp Paribas | 3,767,729 | 3,208,466 | — | — | — | — | — | — | — | — | 3,767,729 | 3,208,466 | ||||||||||||||||||||||||||||||||||||
| Banco Colpatria | — | — | — | — | 876,944 | — | — | — | — | — | 876,944 | — | ||||||||||||||||||||||||||||||||||||
| Banco Continental | 1,425,122 | 1,486,139 | — | — | 10,556,713 | 9,784,862 | — | — | — | — | 11,981,835 | 11,271,001 | ||||||||||||||||||||||||||||||||||||
| Banco de Crédito (Perú) | — | — | — | — | 10,874 | 10,045,982 | — | — | — | — | 10,874 | 10,045,982 | ||||||||||||||||||||||||||||||||||||
| Banco Corfinsura | — | — | — | — | 3,507,407 | — | — | — | — | — | 3,507,407 | — | ||||||||||||||||||||||||||||||||||||
| Banco Davivienda | — | — | — | — | 3,046,376 | 938,051 | — | — | — | — | 3,046,376 | 938,051 | ||||||||||||||||||||||||||||||||||||
| Banco do Brasil | — | — | — | — | 1,704,099 | 2,190,699 | — | — | — | — | 1,704,099 | 2,190,699 | ||||||||||||||||||||||||||||||||||||
| Banco do Nordeste do Brasil | — | — | — | — | — | 3,972,149 | — | — | — | — | — | 3,972,149 | ||||||||||||||||||||||||||||||||||||
| Banco Estado | — | — | — | — | — | — | 415,497 | — | — | — | 415,497 | — | ||||||||||||||||||||||||||||||||||||
| Banco Europeo de Investimentos | 7,438,498 | 4,976,289 | — | — | — | — | — | — | — | — | 7,438,498 | 4,976,289 | ||||||||||||||||||||||||||||||||||||
| Banco Itau | — | 19,213 | — | — | — | — | — | — | — | — | — | 19,213 | ||||||||||||||||||||||||||||||||||||
| Banco Medio Crédito | — | — | — | — | 2,178,467 | 2,003,678 | — | — | — | — | 2,178,467 | 2,003,678 | ||||||||||||||||||||||||||||||||||||
| Banco Monte Paschi | 13,347 | 12,008 | — | — | — | — | — | — | — | — | 13,347 | 12,008 | ||||||||||||||||||||||||||||||||||||
| Banco Pactual | — | — | — | — | 453,528 | 522,209 | — | — | — | — | 453,528 | 522,209 | ||||||||||||||||||||||||||||||||||||
| Banco Santander Central Hispano | 121,096 | 149,336 | — | — | 1,238,237 | 2,793,017 | — | — | — | — | 1,359,333 | 2,942,353 | ||||||||||||||||||||||||||||||||||||
| Bancolombia | — | — | — | — | 4,786,166 | 2,884,954 | — | — | — | — | 4,786,166 | 2,884,954 | ||||||||||||||||||||||||||||||||||||
| Banesto | 4,739,978 | 2,047,648 | — | — | — | — | — | — | — | — | 4,739,978 | 2,047,648 | ||||||||||||||||||||||||||||||||||||
| Bank of Tokyo — Mitsubishi | 96,131 | 102,425 | — | — | — | — | — | — | — | — | 96,131 | 102,425 | ||||||||||||||||||||||||||||||||||||
| BNDES | — | 1,152,278 | — | — | 9,317,863 | 35,513,066 | — | — | — | — | 9,317,863 | 36,665,344 | ||||||||||||||||||||||||||||||||||||
| Bradesco | — | — | — | — | 30,866 | 1,079,868 | — | — | — | — | 30,866 | 1,079,868 | ||||||||||||||||||||||||||||||||||||
| Caja de ahorros de Galicia | 26,692 | 24,016 | — | — | — | — | — | — | — | — | 26,692 | 24,016 | ||||||||||||||||||||||||||||||||||||
| Caja de Ahorros y Monte de Piedad de Madrid | 139,167 | 111,076 | — | — | — | — | — | — | — | — | 139,167 | 111,076 | ||||||||||||||||||||||||||||||||||||
| Caixa General de Depósitos | — | — | 884,787 | — | — | — | — | — | — | — | 884,787 | — | ||||||||||||||||||||||||||||||||||||
| Citibank N.A. | 2,416,303 | 5,083,979 | — | — | — | — | — | — | — | — | 2,416,303 | 5,083,979 | ||||||||||||||||||||||||||||||||||||
| Citibank (Agencia en Chile) | — | — | — | — | — | — | — | — | 32 | 32 | 32 | 32 | ||||||||||||||||||||||||||||||||||||
| Comafi | — | — | — | — | 660,408 | — | — | — | — | — | 660,408 | — | ||||||||||||||||||||||||||||||||||||
| Compagnie Belge de la Webstlb | 4,149,596 | — | — | — | — | — | — | — | — | — | 4,149,596 | — | ||||||||||||||||||||||||||||||||||||
| Conavi | — | — | — | — | 2,192,130 | — | — | — | — | — | 2,192,130 | — | ||||||||||||||||||||||||||||||||||||
| Credit Suisse First Boston | 12,048 | 4,278,999 | — | — | — | — | — | — | — | — | 12,048 | 4,278,999 | ||||||||||||||||||||||||||||||||||||
| Deutsche Bank A.G. | 256,296 | 5,088,107 | — | — | — | — | — | — | — | — | 256,296 | 5,088,107 | ||||||||||||||||||||||||||||||||||||
| Dresdner | 26,693 | 24,016 | — | — | — | — | — | — | — | — | 26,693 | 24,016 | ||||||||||||||||||||||||||||||||||||
| Export Develop. Corp. | 1,933,960 | 1,681,779 | — | — | — | — | — | — | — | — | 1,933,960 | 1,681,779 | ||||||||||||||||||||||||||||||||||||
| Granahorrar | — | — | — | — | 1,315,277 | — | — | — | — | — | 1,315,277 | — | ||||||||||||||||||||||||||||||||||||
| HSBC | 77,856 | 70,048 | — | — | — | 343,970 | — | — | — | — | 77,856 | 414,018 | ||||||||||||||||||||||||||||||||||||
| Instituto Crédito Oficial | 38,928 | 35,024 | — | — | — | — | — | — | — | — | 38,928 | 35,024 | ||||||||||||||||||||||||||||||||||||
| International Finance Corporation | 5,075,181 | 4,144,063 | — | — | — | — | — | — | — | — | 5,075,181 | 4,144,063 | ||||||||||||||||||||||||||||||||||||
| J.P. Morgan Chase Bank | 14,397,116 | — | — | — | — | — | — | — | — | — | 14,397,116 | — | ||||||||||||||||||||||||||||||||||||
| Kreditanstal Fur Weideraubau | 322,269 | 276,815 | — | — | — | — | — | — | — | — | 322,269 | 276,815 | ||||||||||||||||||||||||||||||||||||
| San Pedro IMI S.p.A. | 93,427 | 84,057 | — | — | — | — | — | — | — | — | 93,427 | 84,057 | ||||||||||||||||||||||||||||||||||||
| Scotiabank | — | 3,639,187 | — | — | 98,246 | 8,380,864 | — | — | — | — | 98,246 | 12,020,051 | ||||||||||||||||||||||||||||||||||||
| Skandinaviska Enskilda Banken | 947,920 | — | — | — | — | — | — | — | — | — | 947,920 | — | ||||||||||||||||||||||||||||||||||||
| Standard Bank | 132,655 | 2,986,309 | — | — | — | — | — | — | — | — | 132,655 | 2,986,309 | ||||||||||||||||||||||||||||||||||||
| The Bank of Nova Scotia | — | 24,016 | — | — | — | — | — | — | — | — | — | 24,016 | ||||||||||||||||||||||||||||||||||||
| Unibanco | — | — | — | — | 9,092,762 | 861,177 | — | — | — | — | 9,092,762 | 861,177 | ||||||||||||||||||||||||||||||||||||
| Votorantim | — | — | — | — | — | 3,610,197 | — | — | — | — | — | 3,610,197 | ||||||||||||||||||||||||||||||||||||
| West LB | 2,479,074 | 131,165 | — | — | — | — | — | — | — | — | 2,479,074 | 131,165 | ||||||||||||||||||||||||||||||||||||
| Total | 51,000,027 | 41,600,466 | 884,787 | — | 53,469,104 | 87,710,359 | 415,497 | — | 32 | 32 | 105,769,447 | 129,310,857 | ||||||||||||||||||||||||||||||||||||
| Total principal | 39,417,434 | 40,498,614 | 882,636 | — | 53,469,104 | 80,014,889 | 415,497 | — | — | — | 94,184,671 | 120,513,503 | ||||||||||||||||||||||||||||||||||||
| Weighted average annual interest rate | 7.85 | % | 8.44 | % | 4.03 | % | 0.00 | % | 10.92 | % | 9.93 | % | 9.00 | % | 0.00 | % | 0.30 | % | 0.30 | % | 9.37 | % | 9.45 | % | ||||||||||||||||||||||||
| As of December 31, | ||||||||
| 2006 | 2007 | |||||||
| % | % | |||||||
| Percentage of debt in foreign currency: | 99.61 | % | 100.00 | % | ||||
| Percentage of debt in local currency: | 0.39 | % | 0.00 | % | ||||
| Total | 100.00 | % | 100.00 | % | ||||
Table of Contents
| Note 16. Long-Term Portion of Debt Due to Banks and Financial Institutions |
| As of December 31, 2007 | ||||||||||||||||||||||||||||||||||||||
| After 1 year | After 2 years | After 3 years | After 5 years | Total Long-term | Annual interest | Total long-term | ||||||||||||||||||||||||||||||||
| Financial | but within | but within | but within | but within | portion | rate | portion - | |||||||||||||||||||||||||||||||
| Institution | Currency | 2 years | 3 years | 5 years | 10 years | After 10 years | 2007 | average | 2006 | |||||||||||||||||||||||||||||
| ThCh$ | ThCh$ | ThCh$ | ThCh$ | Years | ThCh$ | ThCh$ | ThCh$ | |||||||||||||||||||||||||||||||
| ABN Amro Bank | US$ | 7,246,312 | 1,759,819 | — | — | — | — | 9,006,131 | 5.39 | % | 9,410,659 | |||||||||||||||||||||||||||
| $ Arg | — | — | — | — | — | — | — | 0.00 | % | 1,867,059 | ||||||||||||||||||||||||||||
| Banco Alfa | Rs | — | — | 19,636,453 | — | — | — | 19,636,453 | 12.18 | % | — | |||||||||||||||||||||||||||
| Banco Bayerische Landes | US$ | 2,869,540 | — | — | — | — | — | 2,869,540 | 8.31 | % | 4,009,655 | |||||||||||||||||||||||||||
| Banco BBVA | US$ | 22,981,162 | 5,279,456 | — | — | — | — | 28,260,618 | 5.39 | % | 30,069,863 | |||||||||||||||||||||||||||
| $ Colom | — | — | 20,348,091 | — | — | — | 20,348,091 | 12.19 | % | 21,072,211 | ||||||||||||||||||||||||||||
| Banco Continental | US$ | 2,829,541 | 7,663,038 | — | — | — | — | 10,492,579 | 7.33 | % | 20,314,028 | |||||||||||||||||||||||||||
| Banco Crédito Perú | Soles | — | — | — | — | — | — | — | 0.00 | % | 18,247,278 | |||||||||||||||||||||||||||
| Banco Estado | US$ | — | — | 4,475,116 | — | — | — | 4,475,116 | 5.18 | % | 589,655 | |||||||||||||||||||||||||||
| Banco Europeo de Investimentos | US$ | 4,140,750 | 4,140,750 | 8,281,500 | — | — | — | 16,563,000 | 18.33 | % | 23,824,454 | |||||||||||||||||||||||||||
| Banco Davivienda | $ Colom | — | — | 7,780,630 | — | — | — | 7,780,630 | 12.19 | % | 8,057,469 | |||||||||||||||||||||||||||
| Banco do Brasil | US$ | 166,994 | 146,439 | 254,194 | 103,609 | 16 | 1,379,633 | 2,050,869 | 4.31 | % | 2,596,089 | |||||||||||||||||||||||||||
| Rs | 1,860,559 | 2,786,689 | 5,943,830 | 31,674,356 | — | — | 42,265,434 | 13.56 | % | 9,980,391 | ||||||||||||||||||||||||||||
| Banco do Nordeste do Brasil | Rs | 5,350,038 | 9,585,340 | 19,834,978 | 9,882,372 | — | — | 44,652,728 | 7.68 | % | 4,403,437 | |||||||||||||||||||||||||||
| Banco Hipotecario | $ Arg | — | — | — | — | — | — | — | 0.00 | % | 3,976,836 | |||||||||||||||||||||||||||
| Banco Itau | US$ | 1,490,670 | 2,981,340 | 2,981,340 | — | — | — | 7,453,350 | 7.63 | % | — | |||||||||||||||||||||||||||
| Rs | — | — | 3,744,952 | — | — | — | 3,744,952 | 12.40 | % | — | ||||||||||||||||||||||||||||
| Banco Itau Chile | US$ | 3,975,122 | — | — | — | — | — | 3,975,122 | 5.44 | % | — | |||||||||||||||||||||||||||
| Banco Medio Crédito | $ Arg | 1,990,992 | 1,990,992 | 995,577 | — | — | — | 4,977,561 | 1.75 | % | 7,601,335 | |||||||||||||||||||||||||||
| Banco Monte Paschi | US$ | 2,484,450 | — | — | — | — | — | 2,484,450 | 5.44 | % | 2,532,199 | |||||||||||||||||||||||||||
| Banco Nacionale de Paris | US$ | 2,448,533 | 812,948 | 8,135,155 | 2,438,844 | — | — | 13,835,480 | 5.58 | % | 12,833,546 | |||||||||||||||||||||||||||
| $ Arg | — | — | — | — | — | — | — | 0.00 | % | 1,344,283 | ||||||||||||||||||||||||||||
| Banco Pactual | Rs | 9,389,506 | — | — | — | — | — | 9,389,506 | 19.93 | % | 8,295,048 | |||||||||||||||||||||||||||
| Banco Río de la Plata | $ Arg | — | — | — | — | — | — | — | 0.00 | % | 14,002,944 | |||||||||||||||||||||||||||
| Bancolombia | $ Colom | — | — | 23,927,531 | — | — | — | 23,927,531 | 12.19 | % | 24,778,886 | |||||||||||||||||||||||||||
| Banco Santander Central Hispano | US$ | 14,101,209 | 3,590,030 | 10,984,374 | — | — | — | 28,675,613 | 5.30 | % | 22,579,625 | |||||||||||||||||||||||||||
| $ Colom | — | — | 23,166,434 | — | — | — | 23,166,434 | 12.19 | % | 23,990,533 | ||||||||||||||||||||||||||||
| Rs | — | 56,104,512 | 112,209,025 | — | — | — | 168,313,537 | 14.84 | % | 160,463,977 | ||||||||||||||||||||||||||||
| Banco Votorantim | Rs | — | 28,052,075 | — | — | — | — | 28,052,075 | 12.65 | % | — | |||||||||||||||||||||||||||
| Banesto | US$ | — | — | 3,254,630 | — | — | — | 3,254,630 | 5.18 | % | 2,757,739 | |||||||||||||||||||||||||||
| Bank Boston | $ Arg | — | — | — | — | — | — | — | 0.00 | % | 8,401,767 | |||||||||||||||||||||||||||
| Bank Tokio — Mitsubishi | US$ | 17,391,150 | 4,223,565 | 10,984,374 | — | — | — | 32,599,089 | 5.32 | % | 24,032,914 | |||||||||||||||||||||||||||
| BNDES | US$ | — | — | — | — | — | — | — | 0.00 | % | 8,926,074 | |||||||||||||||||||||||||||
| Rs | — | 1,705,532 | 64,281,184 | — | — | — | 65,986,716 | 12.30 | % | 76,949,295 | ||||||||||||||||||||||||||||
| Bradesco | Rs | 18,566,326 | — | 3,744,952 | — | — | — | 22,311,278 | 12.39 | % | 11,460,398 | |||||||||||||||||||||||||||
| Caja de Ahorro de Galicia | US$ | 4,968,901 | — | — | — | — | — | 4,968,901 | 5.44 | % | 5,064,400 | |||||||||||||||||||||||||||
| Caja de Ahorros y Monte de Piedad de Madrid | US$ | 22,981,162 | 2,745,317 | — | — | — | — | 25,726,479 | 5.41 | % | 27,153,750 | |||||||||||||||||||||||||||
| Citibank N.Y. | US$ | 27,950,062 | 5,279,456 | 10,984,374 | — | — | — | 44,213,892 | 5.41 | % | 42,952,935 | |||||||||||||||||||||||||||
| Comafi | $ Arg | — | — | — | — | — | — | — | 0.00 | % | 1,260,265 | |||||||||||||||||||||||||||
| Credit Swiss First Boston | US$ | 4,259,057 | 6,388,585 | — | — | — | — | 10,647,642 | 10.95 | % | 17,153,606 | |||||||||||||||||||||||||||
| Deutsche Bank A.G. | US$ | 17,808,837 | 7,204,822 | 10,351,958 | — | — | — | 35,365,617 | 8.30 | % | 63,739,482 | |||||||||||||||||||||||||||
| Dresdner | US$ | 4,968,900 | — | — | — | — | — | 4,968,900 | 5.44 | % | 5,064,398 | |||||||||||||||||||||||||||
| Export Develop. Corp. | US$ | 1,432,928 | 1,072,162 | 9,559,372 | 1,422,799 | — | — | 13,487,261 | 5.70 | % | 8,878,213 | |||||||||||||||||||||||||||
| HBSC | US$ | 14,492,624 | 3,519,638 | — | — | — | — | 18,012,262 | 5.39 | % | 18,821,317 | |||||||||||||||||||||||||||
| Rs | — | — | 42,078,113 | — | — | — | 42,078,113 | 12.09 | % | — | ||||||||||||||||||||||||||||
| ING Bank | US$ | — | 6,757,704 | — | — | — | — | 6,757,704 | 5.18 | % | 7,776,301 | |||||||||||||||||||||||||||
| Instituto de Crédito Oficial | US$ | 7,246,312 | 1,759,819 | 6,509,259 | — | — | — | 15,515,390 | 5.30 | % | 10,268,340 | |||||||||||||||||||||||||||
| International Finance Corporation | US$ | 5,356,008 | 5,179,780 | 11,514,111 | 28,530,517 | 11 | 1,926,447 | 52,506,863 | 7.83 | % | 64,997,300 | |||||||||||||||||||||||||||
| J.P.Morgan Chase Bank | $ Arg | — | — | — | — | — | — | — | 0.00 | % | 5,881,236 | |||||||||||||||||||||||||||
| Kreditanstal Fur Weideraubau | US$ | 135,908 | — | — | — | — | — | 135,908 | 4.85 | % | 469,180 | |||||||||||||||||||||||||||
| San Pablo IMI S.P.A. | US$ | 17,391,150 | 4,223,565 | — | — | — | — | 21,614,715 | 5.39 | % | 22,585,581 | |||||||||||||||||||||||||||
| Scotiabank | US$ | 7,155,216 | 5,366,412 | — | — | — | — | 12,521,628 | 6.70 | % | — | |||||||||||||||||||||||||||
| Soles | — | — | — | — | — | — | — | 0.00 | % | 8,942,554 | ||||||||||||||||||||||||||||
| Standard Bank | US$ | 5,796,967 | 5,796,967 | 10,351,958 | — | — | — | 21,945,892 | 9.19 | % | 40,025,079 | |||||||||||||||||||||||||||
| The Royal Bank of Scotiand | US$ | — | — | 3,254,630 | — | — | — | 3,254,630 | 5.18 | % | 428,840 | |||||||||||||||||||||||||||
| The Bank of Nova Scotia | US$ | 4,968,901 | 1,689,426 | — | — | — | — | 6,658,327 | 5.18 | % | — | |||||||||||||||||||||||||||
| Unibanco | Rs | 22,113,610 | — | 3,730,926 | — | — | — | 25,844,536 | 12.52 | % | 43,001,272 | |||||||||||||||||||||||||||
| West LB | US$ | 7,950,240 | — | — | — | — | — | 7,950,240 | 6.83 | % | 9,148,589 | |||||||||||||||||||||||||||
| Totals | 296,259,637 | 187,806,178 | 463,299,021 | 74,052,497 | 3,306,080 | 1,024,723,413 | 972,982,285 | |||||||||||||||||||||||||||||||
| As of December 31, | ||||||||
| 2006 | 2007 | |||||||
| % | % | |||||||
| Percentage of debt in foreign currency: | 100.00 | % | 100.00 | % | ||||
| Percentage of debt in local currency: | 0.00 | % | 0.00 | % | ||||
| Total | 100.00 | % | 100.00 | % | ||||
F - 64
Table of Contents
| As of December 31, | ||||||||
| 2006 | 2007 | |||||||
| ThCh$ | ThCh$ | |||||||
| Advances and guarantee on construction | 50,901 | 79,972 | ||||||
| Taxes payables | 2,733,491 | 2,982,582 | ||||||
| Contingencies — third party claims | 25,139,075 | 51,968,781 | ||||||
| Reimbursable contributions | 1,126,772 | 1,126,772 | ||||||
| Energy efficiency program (Brazil) | 30,183,048 | 32,107,184 | ||||||
| Azopardo provision | 3,044,643 | 840,384 | ||||||
| Accrued employees benefits — other | 2,917,001 | 2,653,051 | ||||||
| Derivative contracts | 4,490,119 | 10,886,369 | ||||||
| Fair value — derivative contracts | 2,110,604 | 4,451,629 | ||||||
| Emergency energy provision (Brazil and Argentina) | 8,445,192 | 19,969,795 | ||||||
| Obligations of payment to third parties | 11,772,142 | 1,182,542 | ||||||
| Advances from clients | 1,686,543 | 1,680,420 | ||||||
| Other current liabilities | 3,874.998 | 2,288,694 | ||||||
| Total | 97,574,529 | 132,218,175 | ||||||
F - 65
Table of Contents
| a) | Details of the short-term portion of bonds payable is as follows: |
| Face value | Interest | Maturity | As of December 31, | |||||||||||||||||
| Instrument | Series | outstanding | Currency | rate | date | 2006 | 2007 | |||||||||||||
| % | ThCh$ | ThCh$ | ||||||||||||||||||
| Bond N°269 – Enersis | B-1 | 19,529 | UF | 5.50% | 06-15-2009 | 183,272 | 192,188 | |||||||||||||
| Bond N°269 – Enersis | B-2 | 1,858,064 | UF | 5.75% | 06-15-2022 | 1,646,336 | 1,726,036 | |||||||||||||
| Yankee Bonds – Enersis | Two | 350,000,000 | US$ | 7.40% | 12-01-2016 | 1,101,122 | 765,224 | |||||||||||||
| Yankee Bonds – Enersis | Three | 858,000 | US$ | 6.60% | 12-01-2026 | 2,698 | 2,345 | |||||||||||||
| Yankee Bonds II – Enersis | One | 350,000,000 | US$ | 7.38% | 12-01-2014 | 6,764,656 | 5,878,571 | |||||||||||||
| Bonds Edelnor | One | 4,981,900 | Soles | 9.61% | 02-01-2011 | 7,281 | 6,433 | |||||||||||||
| Bonds Edelnor | I° Prog. | 18,570,000 | Soles | VAC + 6.2% | 04-26-2007 | 3,714,517 | — | |||||||||||||
| Bonds Edelnor | I° Prog. | 40,000,000 | Soles | 4.47% | 09-11-2007 | 7,252,219 | — | |||||||||||||
| Bonds Edelnor | I° Prog. | 30,000,000 | Soles | 5.86% | 01-15-2008 | 141,356 | 5,106,572 | |||||||||||||
| Bonds Edelnor | I° Prog. | 20,000,000 | Soles | 6.25% | 01-15-2012 | 100,349 | 93,026 | |||||||||||||
| Bonds Edelnor | I° Prog. | 20,000,000 | Soles | VAC + 5.4% | 04-22-2014 | 38,274 | 36,718 | |||||||||||||
| Bonds Edelnor | I° Prog. | 20,000,000 | Soles | 8.56% | 06-01-2009 | 17,872 | 16,568 | |||||||||||||
| Bonds Edelnor | I° Prog. | 20,000,000 | Soles | VAC + 6.5% | 06-01-2014 | 14,101 | 13,527 | |||||||||||||
| Bonds Edelnor | I° Prog. | 40,000,000 | Soles | VAC + 6.5% | 06-01-2014 | 8,043 | 7,716 | |||||||||||||
| Bonds Edelnor | I° Prog. | 30,000,000 | Soles | 7.38% | 06-10-2010 | 21,991 | 20,386 | |||||||||||||
| Bonds Edelnor | I° Prog. | 30,000,000 | Soles | 8.75% | 06-08-2009 | 26,091 | 24,187 | |||||||||||||
| Bonds Edelnor | II° Prog. | 20,000,000 | Soles | 7.31% | 01-05-2011 | 127,192 | 117,910 | |||||||||||||
| Bonds Edelnor | II° Prog. | 4,000,000 | Soles | 7.84% | 01-05-2013 | 27,286 | 25,295 | |||||||||||||
| Bonds Edelnor | II° Prog. | 18,000,000 | Soles | 8.16% | 01-05-2016 | 127,681 | 118,363 | |||||||||||||
| Bonds Edelnor | II° Prog. | 20,000,000 | Soles | 7.06% | 02-01-2011 | 104,593 | 96,960 | |||||||||||||
| Bonds Edelnor | II° Prog. | 27,200,000 | Soles | 8.00% | 02-01-2016 | 161,129 | 149,369 | |||||||||||||
| Bonds Edelnor | II° Prog. | 19,250,000 | Soles | 6.63% | 03-17-2009 | 65,280 | 60,516 | |||||||||||||
| Bonds Edelnor | II° Prog. | 15,000,000 | Soles | 6.75% | 05-22-2009 | 19,120 | 17,726 | |||||||||||||
| Bonds Edelnor | II° Prog. | 15,000,000 | Soles | 7.56% | 05-22-2013 | 21,422 | 19,859 | |||||||||||||
| Bonds Edelnor | II° Prog. | 15,000,000 | Soles | 6.66% | 10-06-2013 | 41,680 | 38,638 | |||||||||||||
| Bonds Edelnor | II° Prog. | 20,000,000 | Soles | 5.69% | 04-19-2012 | — | 37,207 | |||||||||||||
| Bonds Edelnor | II° Prog. | 20,000,000 | Soles | 5.91% | 04-19-2015 | — | 38,638 | |||||||||||||
| Bonds Edelnor | II° Prog. | 15,000,000 | Soles | 7.22% | 08-31-2016 | 64,574 | 59,862 | |||||||||||||
| Bonds Edelnor | II° Prog. | 40,000,000 | Soles | 5.97% | 07-06-2012 | — | 191,385 | |||||||||||||
| Bonds Edelnor | III° Prog. | 40,000,000 | Soles | 6.94% | 08-29-2015 | — | 154,691 | |||||||||||||
| Bonds Edelnor | III° Prog. | 30,000,000 | Soles | 6.56% | 09-12-2012 | — | 97,956 | |||||||||||||
| Bonds Codensa | B3 | 50,000,000,000 | $ Col. | 9.99% | 03-15-2009 | 62,573 | 71,521 | |||||||||||||
| Bonds Codensa | B5 | 200,000,000,000 | $ Col. | 11.20% | 03-15-2011 | 286,047 | 320,612 | |||||||||||||
| Bonds Codensa | B8 | 250,000,000,000 | $ Col. | 11.40% | 03-15-2014 | 363,945 | 406,931 | |||||||||||||
| Bonds Codensa | A | 13,980,000,000 | $ Col. | 10.06% | 03-14-2010 | — | 277,803 | |||||||||||||
| Bonds Codensa | B | 391,500,000,000 | $ Col. | 10.80% | 03-14-2017 | — | 503,334 | |||||||||||||
| Bonds Codensa | C | 33,720,000 | $ Col. | 10.94% | 03-14-2012 | — | 44,867 | |||||||||||||
| Bonds Edesur | Six | 20,000,000 | $ Arg. | 10.41% | 10-05-2007 | 11,208,759 | — | |||||||||||||
| Bonds Edesur | Seven | 165,000,000 | $ Arg. | 11.75% | 06-19-2012 | — | 101,860 | |||||||||||||
| Bonds Ampla | 1° serie | 290,000,000 | Reales | CDI+1.2% aa | 03-01-2008 | 3,531,772 | 84,400,949 | |||||||||||||
| Bonds Ampla | 2° serie | 110,000,000 | Reales | IGP-M+11.4% | 03-01-2010 | 2,861,015 | 3,247,611 | |||||||||||||
| Bonds Ampla | Unit | 370,000,000 | Reales | DI + 0.85% aa | 08-01-2012 | 5,766,376 | 4,920,086 | |||||||||||||
| Bonds Endesa Chile | F | 1,500,000 | UF | 6.20% | 08-01-2022 | 751,639 | 1,337,624 | |||||||||||||
| Bonds Endesa Chile | H | 4,000,000 | UF | 6.20% | 10-15-2028 | 1,002,184 | 998,591 | |||||||||||||
| Bonds Endesa Chile | K | 4,000,000 | UF | 3.80% | 04-15-2027 | — | 615,596 | |||||||||||||
| Bonds Endesa Chile | One | 230,000,000 | US$ | 7.88% | 02-01-2027 | 3,871,740 | 3,369,834 | |||||||||||||
| Bonds Endesa Chile | Two | 220,000,000 | US$ | 7.33% | 02-01-2037 | 3,839,312 | 3,336,409 | |||||||||||||
| Bonds Endesa Chile | Three | 200,000,000 | US$ | 8.13% | 02-01-2097 | 844,131 | 769,352 | |||||||||||||
| Bonds Endesa Chile | One | 400,000,000 | US$ | 7.75% | 07-15-2008 | 8,124,138 | 205,815,978 | |||||||||||||
| Bonds Endesa Chile | One | 400,000,000 | US$ | 8.50% | 04-01-2009 | 4,860,188 | 4,223,565 | |||||||||||||
| Bonds Endesa Chile | G | 4,000,000 | U.F. | 4.80% | 10-15-2010 | 778,497 | — | |||||||||||||
| Bonds Endesa Chile | 144A | 400,000,000 | US$ | 8.35% | 08-01-2013 | 7,957,367 | 6,915,053 | |||||||||||||
| Bonds Endesa Chile | 144A | 200,000,000 | US$ | 8.63% | 08-01-2015 | 4,109,718 | 3,571,397 | |||||||||||||
| Bonds Edegel | Two | 30,000,000 | US$ | 8.41% | 02-14-2007 | 17,700,586 | — | |||||||||||||
| Bonds Edegel | Three | 30,000,000 | US$ | 8.75% | 06-13-2007 | 17,229,716 | — | |||||||||||||
| Bonds Edegel | 5 A 2° issue | 10,000,000 | US$ | 3.75% | 01-26-2009 | 91,724 | 79,710 | |||||||||||||
| Bonds Edegel | 6 A 2° issue | 30,000,000 | Soles | 5.88% | 02-27-2008 | 107,702 | 5,073,714 | |||||||||||||
| Bonds Edegel | 6 B 2° issue | 20,000,000 | Soles | 8.50% | 06-18-2008 | 10,980 | 3,325,311 | |||||||||||||
| Bonds Edegel | 7 A 2° issue | 10,000,000 | US$ | 7.16% | 07-26-2009 | 179,519 | 152,092 | |||||||||||||
| Bonds Edegel | 8 A 2° issue | 22,370,000 | Soles | 6.00% | 03-10-2008 | 73,350 | 3,776,847 | |||||||||||||
| Bonds Edegel | 8 B 2° issue | 25,700,000 | Soles | 6.47% | 03-30-2008 | 74,334 | 4,329,860 | |||||||||||||
| Bonds Edegel | 9 A 2° issue | 70,000,000 | Soles | 6.91% | 06-01-2009 | 72,053 | 66,793 | |||||||||||||
| Bonds Edegel | 10 A 2° issue | 35,000,000 | Soles | 6.72% | 10-21-2010 | 80,611 | 74,727 | |||||||||||||
| Bonds Edegel | 11 A 2° issue | 20,000,000 | US$ | 6.06% | 11-18-2012 | 80,884 | 70,289 | |||||||||||||
| Bonds Edegel | 13 A 2° issue | 25,000,000 | Soles | 6.47% | 10-20-2013 | 56,240 | 52,135 | |||||||||||||
| Bonds Edegel | 14 A 2° issue | 25,000,000 | Soles | 6.09% | 10-21-2010 | 47,682 | 44,201 | |||||||||||||
| Bonds Edegel | 15 A 2° issue | 30,000,000 | Soles | 6.16% | 11-27-2011 | 30,278 | 28,069 | |||||||||||||
| Bonds Edegel | 13 B 2° issue | 25,000,000 | Soles | 6.16% | 01-15-2014 | — | 116,953 | |||||||||||||
| Bonds Edegel | 14 B 2° issue | 25,000,000 | Soles | 5.91% | 02-22-2011 | — | 87,043 | |||||||||||||
| Bonds Edegel | 1 A 3° issue | 25,000,000 | Soles | 6.31% | 06-21-2022 | — | 6,541 | |||||||||||||
| Bonds Edegel | 2 A 3° issue | 8,000,000 | US$ | 5.97% | 07-18-2011 | — | 106,769 | |||||||||||||
| Bonds Edegel | 3 A 3° issue | 25,000,000 | Soles | 6.28% | 03-07-2019 | — | 128,006 | |||||||||||||
| Bonds Edegel | 4 A 3° issue | 25,000,000 | Soles | 6.75% | 08-31-2014 | — | 74,608 | |||||||||||||
| Bonds Edegel | 5 A 3° issue | 25,000,000 | Soles | 6.50% | 03-18-2013 | — | 77,084 | |||||||||||||
| Bonds Edegel | 6 A 3° issue | 25,000,000 | Soles | 6.44% | 05-21-2013 | — | 29,647 | |||||||||||||
| Bonds Edegel | 7 A 3° issue | 25,000,000 | Soles | 6.63% | 06-13-2013 | — | 13,730 | |||||||||||||
| Bonds Emgesa | B-10 1° issue | 229,825,000,000 | $ Col. | 11.31% | 10-09-2009 | 1,242,288 | 1,475,623 | |||||||||||||
| Bonds Emgesa | B-10 | 60,000,000,000 | $ Col. | 11.43% | 11-10-2009 | 204,277 | 226,963 | |||||||||||||
| Bonds Emgesa | C-10 | 9,684,517,481 | $ Col. | 9.88% | 10-09-2009 | 101,125 | 102,994 | |||||||||||||
| Bonds Emgesa | C-10 | 17,235,158,229 | $ Col. | 10.25% | 10-09-2009 | 54,765 | 55,771 | |||||||||||||
| Bonds Emgesa | A-10 | 210,000,000,000 | $ Col. | 10.32% | 02-23-2015 | 622,367 | 570,961 | |||||||||||||
| Bonds Emgesa | A-10 1° issue | 40,000,000,000 | $ Col. | 10.32% | 02-23-2015 | — | 108,755 | |||||||||||||
| Bonds Emgesa | A-10 4° issue | 170,000,000,000 | $ Col. | 10.84% | 02-20-2017 | — | 3,921,727 | |||||||||||||
| Bonds Emgesa (Before Betania) | B | 400,000,000,000 | $ Col. | 11.29% | 11-10-2011 | 1,504,943 | 1,494,929 | |||||||||||||
| Total | 121,584,960 | 366,034,697 | ||||||||||||||||||
F - 66
Table of Contents
| Face value | Interest | Maturity | As of December 31, | |||||||||||||||||
| Instrument | Series | outstanding | Currency | rate | date | 2006 | 2007 | |||||||||||||
| ThCh$ | ThCh$ | |||||||||||||||||||
| Bond N°269 – Enersis | B-1 | 19,529 | UF | 5.50% | 06-15-2009 | 292,263 | 99,684 | |||||||||||||
| Bond N°269 – Enersis | B-2 | 1,858,064 | UF | 5.75% | 06-15-2022 | 35,801,421 | 34,031,290 | |||||||||||||
| Yankee Bonds – Enersis | Two | 350,000,000 | US$ | 7.40% | 12-01-2016 | 142,794,622 | 124,090,327 | |||||||||||||
| Yankee Bonds – Enersis | Three | 858,000 | US$ | 6.60% | 12-01-2026 | 490,594 | 426,332 | |||||||||||||
| Yankee Bonds II – Enersis | One | 350,000,000 | US$ | 7.38% | 12-01-2014 | 200,125,401 | 173,911,500 | |||||||||||||
| Bonds Edelnor | One | 4,891,900 | Soles | 9.61% | 02-01-2011 | 875,195 | 811,327 | |||||||||||||
| Bonds Edelnor | I° Prog. | 30,000,000 | Soles | 5.86% | 01-15-2008 | 5,367,211 | — | |||||||||||||
| Bonds Edelnor | I° Prog. | 20,000,000 | Soles | 6.25% | 01-15-2012 | 3,578,141 | 3,317,022 | |||||||||||||
| Bonds Edelnor | I° Prog. | 20,000,000 | Soles | VAC + 5,4% | 04-22-2014 | 3,726,471 | 3,574,937 | |||||||||||||
| Bonds Edelnor | I° Prog. | 20,000,000 | Soles | 8.56% | 06-01-2009 | 5,367,211 | 4,975,535 | |||||||||||||
| Bonds Edelnor | I° Prog. | 20,000,000 | Soles | VAC + 6,5% | 06-01-2014 | 3,718,694 | 3,567,477 | |||||||||||||
| Bonds Edelnor | I° Prog. | 40,000,000 | Soles | VAC + 6,5% | 06-01-2014 | 7,424,472 | 7,122,566 | |||||||||||||
| Bonds Edelnor | I° Prog. | 30,000,000 | Soles | 7.38% | 06-10-2010 | 5,367,211 | 4,975,535 | |||||||||||||
| Bonds Edelnor | I° Prog. | 30,000,000 | Soles | 8.75% | 06-08-2015 | 3,578,141 | 3,317,022 | |||||||||||||
| Bonds Edelnor | II° Prog. | 20,000,000 | Soles | 7.31% | 01-05-2011 | 3,578,141 | 3,317,022 | |||||||||||||
| Bonds Edelnor | II° Prog. | 4,000,000 | Soles | 7.84% | 01-05-2013 | 715,628 | 663,404 | |||||||||||||
| Bonds Edelnor | II° Prog. | 18,000,000 | Soles | 8.16% | 01-05-2016 | 3,220,327 | 2,985,321 | |||||||||||||
| Bonds Edelnor | II° Prog. | 20,000,000 | Soles | 7.06% | 02-01-2011 | 3,578,141 | 3,317,022 | |||||||||||||
| Bonds Edelnor | II° Prog. | 27,200,000 | Soles | 8.00% | 02-01-2016 | 4,866,271 | 4,511,151 | |||||||||||||
| Bonds Edelnor | II° Prog. | 19,250,000 | Soles | 6.63% | 03-17-2009 | 3,443,960 | 3,192,635 | |||||||||||||
| Bonds Edelnor | II° Prog. | 15,000,000 | Soles | 6.75% | 05-22-2009 | 2,683,606 | 2,487,767 | |||||||||||||
| Bonds Edelnor | II° Prog. | 15,000,000 | Soles | 7.56% | 05-22-2013 | 2,683,606 | 2,487,767 | |||||||||||||
| Bonds Edelnor | II° Prog. | 15,000,000 | Soles | 6.66% | 10-06-2013 | 2,683,606 | 2,487,767 | |||||||||||||
| Bonds Edelnor | II° Prog. | 20,000,000 | Soles | 5.69% | 04-19-2012 | — | 3,317,022 | |||||||||||||
| Bonds Edelnor | II° Prog. | 20,000,000 | Soles | 5.91% | 04-19-2015 | — | 3,317,022 | |||||||||||||
| Bonds Edelnor | II° Prog. | 15,000,000 | Soles | 7.22% | 08-31-2013 | 2,683,606 | 2,487,767 | |||||||||||||
| Bonds Edelnor | II° Prog. | 40,000,000 | Soles | 5.97% | 07-06-2012 | — | 6,634,046 | |||||||||||||
| Bonds Edelnor | III° Prog. | 40,000,000 | Soles | 6.94% | 08-29-2015 | — | 6,634,046 | |||||||||||||
| Bonds Edelnor | III° Prog. | 30,000,000 | Soles | 6.56% | 09-12-2012 | — | 4,975,535 | |||||||||||||
| Bonds Codensa | B3 | 50,000,000,000 | $ Col. | 9.99% | 03-15-2009 | 12,769,997 | 12,331,245 | |||||||||||||
| Bonds Codensa | B5 | 200,000,000,000 | $ Col. | 11.20% | 03-15-2011 | 51,079,991 | 49,324,982 | |||||||||||||
| Bonds Codensa | B8 | 250,000,000,000 | $ Col. | 11.40% | 03-15-2014 | 63,849,986 | 61,656,227 | |||||||||||||
| Bonds Codensa | A | 139,800,000,000 | $ Col. | 10.06% | 03-14-2010 | — | 55,436,347 | |||||||||||||
| Bonds Codensa | B | 391,500,000,000 | $ Col. | 10.80% | 03-14-2017 | — | 96,553,652 | |||||||||||||
| Bonds Codensa | C | 33,720,000 | $ Col. | 10.94% | 03-14-2012 | — | 8,316,192 | |||||||||||||
| Bonds Edesur | Seven | 165,000,000 | $ Arg. | 11.75% | 06-19-2012 | — | 26,006,931 | |||||||||||||
| Bonds Ampla | 1° serie | 290,000,000 | Reales | CDI + 1,2% aa | 03-01-2008 | 30,698,199 | 34,672,030 | |||||||||||||
| Bonds Ampla | 2° serie | 110,000,000 | Reales | IGP-M+11,4% aa | 03-01-2010 | 77,557,618 | — | |||||||||||||
| Bonds Ampla | Unit | 370,000,000 | Reales | DI + 0,85% aa | 08-01-2012 | 98,952,825 | 103,793,429 | |||||||||||||
| Bonds Endesa Chile | F | 1,500,000 | UF | 6.20% | 08-01-2022 | 29,539,908 | 28,845,310 | |||||||||||||
| Bonds Endesa Chile | H | 4,000,000 | UF | 6.20% | 10-15-2028 | 78,773,088 | 78,490,640 | |||||||||||||
| Bonds Endesa Chile | K | 4,000,000 | UF | 3.80% | 04-15-2027 | — | 78,490,640 | |||||||||||||
| Bonds Endesa Chile | One | 230,000,000 | US$ | 3.80% | 02-01-2027 | 117,720,051 | 102,300,210 | |||||||||||||
| Bonds Endesa Chile | Two | 220,000,000 | US$ | 7.33% | 02-01-2037 | 125,793,109 | 109,315,800 | |||||||||||||
| Bonds Endesa Chile | Three | 200,000,000 | US$ | 8.13% | 02-01-2097 | 23,109,337 | 20,082,306 | |||||||||||||
| Bonds Endesa Chile | One | 400,000,000 | US$ | 7.75% | 07-15-2008 | 228,714,744 | — | |||||||||||||
| Bonds Endesa Chile | Unit | 400,000,000 | US$ | 8.50% | 04-01-2009 | 228,714,744 | 198,756,000 | |||||||||||||
| Bonds Endesa Chile | G | 4,000,000 | U.F. | 4.80% | 10-15-2010 | 78,773,088 | — | |||||||||||||
| Bonds Endesa Chile | 144A | 400,000,000 | US$ | 8.35% | 08-01-2013 | 228,714,744 | 198,756,000 | |||||||||||||
| Bonds Endesa Chile | 144A | 200,000,000 | US$ | 8.63% | 08-01-2015 | 114,357,372 | 99,378,000 | |||||||||||||
| Bonds Edegel | 5 A 2° issue | 10,000,000 | US$ | 3.75% | 01-26-2009 | 5,717,869 | 4,968,900 | |||||||||||||
| Bonds Edegel | 6 A 2° issue | 30,000,000 | Soles | 5.88% | 02-27-2008 | 5,365,532 | — | |||||||||||||
| Bonds Edegel | 6 B 2° issue | 20,000,000 | Soles | 8.50% | 06-18-2008 | 3,577,021 | — | |||||||||||||
| Bonds Edegel | 7 A 2° issue | 10,000,000 | US$ | 7.16% | 07-26-2009 | 5,717,869 | 4,968,900 | |||||||||||||
| Bonds Edegel | 8 A 2° issue | 22,370,000 | Soles | 6.00% | 03-10-2008 | 4,000,897 | — | |||||||||||||
| Bonds Edegel | 8 B 2° issue | 25,700,000 | Soles | 6.47% | 03-30-2008 | 4,596,472 | — | |||||||||||||
| Bonds Edegel | 9 A 2° issue | 70,000,000 | Soles | 6.91% | 06-01-2009 | 12,519,575 | 11,605,706 | |||||||||||||
| Bonds Edegel | 10 A 2° issue | 35,000,000 | Soles | 6.72% | 10-21-2010 | 6,259,788 | 5,802,853 | |||||||||||||
| Bonds Edegel | 11 A 2° issue | 20,000,000 | US$ | 6.06% | 11-18-2012 | 11,435,737 | 9,937,800 | |||||||||||||
| Bonds Edegel | 13 A 2° issue | 25,000,000 | Soles | 6.47% | 10-20-2013 | 4,471,277 | 4,144,895 | |||||||||||||
| Bonds Edegel | 14 A 2° issue | 25,000,000 | Soles | 6.09% | 10-21-2013 | 4,471,277 | 4,144,895 | |||||||||||||
| Bonds Edegel | 15 A 2° issue | 30,000,000 | Soles | 6.16% | 11-27-2011 | 5,365,533 | 4,973,874 | |||||||||||||
| Bonds Edegel | 13 B 2° issue | 25,000,000 | Soles | 6.16% | 01-15-2014 | — | 4,144,895 | |||||||||||||
| Bonds Edegel | 14 B 2° issue | 25,000,000 | Soles | 5.91% | 02-22-2011 | — | 4,144,895 | |||||||||||||
| Bonds Edegel | 1 A 3° issue | 25,000,000 | Soles | 6.31% | 06-21-2022 | — | 4,144,895 | |||||||||||||
| Bonds Edegel | 2 A 3° issue | 8,000,000 | US$ | 5.97% | 07-18-2011 | — | 3,975,118 | |||||||||||||
| Bonds Edegel | 3 A 3° issue | 25,000,000 | Soles | 6.28% | 03-07-2019 | — | 4,144,895 | |||||||||||||
| Bonds Edegel | 4 A 3° issue | 25,000,000 | Soles | 6.75% | 08-31-2014 | — | 3,315,916 | |||||||||||||
| Bonds Edegel | 5 A 3° issue | 25,000,000 | Soles | 6.50% | 03-18-2013 | — | 4,144,895 | |||||||||||||
| Bonds Edegel | 6 A 3° issue | 25,000,000 | Soles | 6.44% | 05-21-2013 | — | 4,144,895 | |||||||||||||
| Bonds Edegel | 7 A 3° issue | 25,000,000 | Soles | 6.63% | 06-13-2013 | — | 4,144,895 | |||||||||||||
| Bonds Emgesa | B-10 | 229,825,000,000 | $ Col. | 11.31% | 10-09-2009 | 58,697,031 | 56,680,570 | |||||||||||||
| Bonds Emgesa | B-10 | 60,000,000,000 | $ Col. | 11.43% | 11-10-2009 | 15,323,997 | 14,797,494 | |||||||||||||
| Bonds Emgesa | C-10 | 9,684,517,481 | $ Col. | 9.88% | 10-09-2009 | 2,409,167 | 2,485,162 | |||||||||||||
| Bonds Emgesa | C-10 | 17,235,158,229 | $ Col. | 10.05% | 10-09-2009 | 4,287,499 | 4,333,425 | |||||||||||||
| Bonds Emgesa | A-10 | 210,000,000 | $ Col. | 10.32% | 02-23-2015 | 63,850,037 | 51,791,231 | |||||||||||||
| Bonds Emgesa | A-10 2° issue | 40,000,000,000 | $ Col. | 10.32% | 02-23-2015 | — | 9,864,996 | |||||||||||||
| Bonds Emgesa | B-10 3° issue | 170,000,000,000 | $ Col. | 10.84% | 02-20-2017 | — | 41,926,234 | |||||||||||||
| Bonds Emgesa (Before Betania) | B | 400,000,000,000 | $ Col. | 11.29% | 11-10-2011 | 102,160,015 | 98,650,075 | |||||||||||||
| Total | 2,357,989,334 | 2,146,924,098 | ||||||||||||||||||
| * | VAC (“Valor de activación constante”) is issued by the Banco Central de Reserva del Perú and calculated based in the inflation rate (represents an inflation — indexed new Peruvian Sol). |
| Year | % | |||
| 2006 | 1.56 | |||
| 2007 | 3.44 | |||
F - 67
Table of Contents
| b) | Bonds payable consist of the following: |
| Total amount | No. of bonds | Face value | ||||||||||
| Series | In UF | per series | In UF | |||||||||
| B1 | 1,000,000 | 1,000 | 1,000 | |||||||||
| B1 | 3,000,000 | 300 | 10,000 | |||||||||
| B2 | 1,000,000 | 1,000 | 1,000 | |||||||||
| B2 | 1,500,000 | 150 | 10,000 | |||||||||
| Total amount | Years to | Stated annual | ||||||||||
| Series | in US$ | maturity | interest rate | |||||||||
| 1 | 300,000,000 | 10 | 6.90 | % | ||||||||
| 2 | 350,000,000 | 20 | 7.40 | % | ||||||||
| 3 | 150,000,000 | 30 | 6.60 | % | ||||||||
F - 68
Table of Contents
ThUS$ 95,536, with a face value of ThUS$ 100,266, were bought.
| Total amount | Years to | Stated annual | ||||||||||
| Series | in US$ | Maturity | interest rate | |||||||||
| 1 | 350,000,000 | 10 | 7.375 | % | ||||||||
First issue | ||||
| Date of Issue | : | March 1, 1996 | ||
| Number of bonds subscribed | : | 48,919 bonds. | ||
| Face value | : | S/. 100 (100 new soles) each | ||
| Redemption term | : | 15 years | ||
| Interest rate | : | 9.61% annual | ||
| Interest payment | : | Annually, on coupon maturity | ||
| Principal amortization | : | Amortization of total principal upon maturity | ||
Seventh issue | ||||
| Date of issue | : | January 16, 2004. | ||
| Number of bonds subscribed | : | 6,000 bonds. | ||
| Nominal value | : | 5,000 (new soles) each. | ||
| Term | : | 4 years. | ||
| Interest rate | : | 5.86%. | ||
| Interest payment | : | Semi-annual. | ||
F - 69
Table of Contents
Eighth issue | ||||
| Date of issue | : | January 16, 2004. | ||
| Number of bonds subscribed | : | 4,000 bonds. | ||
| Nominal value | : | 5,000 (new soles) each. | ||
| Term | : | 8 years. | ||
| Interest rate | : | 6.25%. | ||
| Interest payment | : | Semi-annual. | ||
Ninth issue | ||||
| Date of issue | : | April 22, 2004. | ||
| Number of bonds subscribed | : | 4,000 bonds. | ||
| Nominal value | : | 5,000 (new soles) each. | ||
| Term | : | 10 years. | ||
| Interest rate | : | VAC + 5.4%. | ||
| Interest payment | : | Semi-annual. | ||
Tenth issue | ||||
| Date of issue | : | June 9, 2004. | ||
| Number of bonds subscribed | : | 4,000 bonds. | ||
| Nominal value | : | 5,000 (new soles) each. | ||
| Term | : | 5 years. | ||
| Interest rate | : | 8.56%. | ||
| Interest payment | : | Semi-annual. | ||
Eleventh issue | ||||
| Date of issue | : | June 9, 2004. | ||
| Number of bonds subscribed | : | 4,000 bonds. | ||
| Nominal value | : | 5,000 (new soles) each. | ||
| Term | : | 10 years. | ||
| Interest rate | : | VAC + 6.50%. | ||
| Interest payment | : | Semi-annual. | ||
Twelfth issue | ||||
| Date of issue | : | June 24, 2004. | ||
| Number of bonds subscribed | : | 8,000 bonds. | ||
| Nominal value | : | 5,000 (new soles) each. | ||
| Term | : | 10 years. | ||
| Interest rate | : | VAC + 6.50%. | ||
| Interest payment | : | Semi-annual. | ||
Thirteenth issue | ||||
| Date of issue | : | June 10, 2005. | ||
| Number of bonds subscribed | : | 6,000 bonds. | ||
| Nominal value | : | 5,000 (new soles) each. | ||
| Term | : | 10 years. | ||
| Interest rate | : | 7.38%. | ||
| Interest payment | : | Semi-annual. | ||
Fourteenth issue | ||||
| Date of issue | : | June 10, 2005. | ||
| Number of bonds subscribed | : | 6,000 bonds. | ||
| Nominal value | : | 5,000 (new soles) each. | ||
| Term | : | 15 years. | ||
| Interest rate | : | 8.75%. | ||
| Interest payment | : | Semi-annual. | ||
F - 70
Table of Contents
First issue | ||||
| Date of Issue | : | January 5, 2006 | ||
| Number of bonds subscribed | : | 4,000 bonds | ||
| Face value | : | 5,000 (new soles) each | ||
| Redemption term | : | 5 years | ||
| Interest rate | : | 7.31% | ||
| Interest payment | : | Semi-annual | ||
Second issue | ||||
| Date of Issue | : | January 5, 2006 | ||
| Number of bonds subscribed | : | 800 bonds | ||
| Face value | : | 5,000 (new soles) each | ||
| Redemption term | : | 7 years | ||
| Interest rate | : | 7.84% | ||
| Interest payment | : | Semi-annual | ||
Third issue | ||||
| Date of issue | : | January 5, 2006 | ||
| Number of bonds subscribed | : | 3,600 bonds | ||
| Face value | : | 5,000 (new soles) each | ||
| Redemption term | : | 10 years | ||
| Interest rate | : | 8.16% | ||
| Interest payment | : | Semi-annual | ||
Fourth issue | ||||
| Date of issue | : | February 1, 2006 | ||
| Number of bonds subscribed | : | 4,000 bonds | ||
| Face value | : | 5,000 (new soles) each | ||
| Redemption term | : | 5 years | ||
| Interest rate | : | 7.06% | ||
| Interest payment | : | Semi-annual | ||
Fifth issue | ||||
| Date of issue | : | February 1, 2006. | ||
| Number of bonds subscribed | : | 5,440 bonds. | ||
| Nominal value | : | 5,000 (new soles) each. | ||
| Term | : | 10 years. | ||
| Interest rate | : | 8.00%. | ||
| Interest payment | : | Semi-annual. | ||
Sixth issue | ||||
| Date of issue | : | March 17, 2006. | ||
| Number of bonds subscribed | : | 3,850 bonds. | ||
| Nominal value | : | 5,000 (new soles) each. | ||
| Term | : | 3 years. | ||
| Interest rate | : | 6.63% | ||
| Interest payment | : | Semi-annual. | ||
Seventh issue | ||||
| Date of issue | : | May 22, 2006. | ||
| Number of bonds subscribed | : | 3,000 bonds. | ||
| Nominal value | : | 5,000 (new soles) each. | ||
| Term | : | 3 years. | ||
| Interest rate | : | 6.75%. | ||
| Interest payment | : | Semi-annual. | ||
F - 71
Table of Contents
Eight issue | ||||
| Date of issue | : | May 22, 2006. | ||
| Number of bonds subscribed | : | 3,000 bonds. | ||
| Nominal value | : | 5,000 (new soles) each. | ||
| Term | : | 7 years. | ||
| Interest rate | : | 7.56%. | ||
| Interest payment | : | Semi-annual. | ||
Third issue — Series B | ||||
| Date of issue | : | August 31, 2006. | ||
| Number of bonds subscribed | : | 3,000 bonds. | ||
| Nominal value | : | 5,000 (new soles) each. | ||
| Term | : | 9 years. | ||
| Interest rate | : | 7.22%. | ||
| Interest payment | : | Semi-annual. | ||
Tenth issue — Series B | ||||
| Date of issue | : | October 6, 2006. | ||
| Number of bonds subscribed | : | 3,000 bonds. | ||
| Nominal value | : | 5,000 (new soles) each. | ||
| Term | : | 7 years. | ||
| Interest rate | : | 6.66%. | ||
| Interest payment | : | Semi-annual. | ||
Twelfth Issue — Series A | ||||
| Date of Issue | : | April 19, 2007 | ||
| Issuer | : | Edelnor S.A.A. | ||
| Bonds issued | : | Marketable Securities in thousands of new soles (4,000 bonds of S/. 5,000.00 each) | ||
| Number of bonds subscribed | : | S/. 30,000,000 | ||
| Number of bonds placed | : | S/. 20,000,000 | ||
| Principal due | : | All due on April 19, 2012 | ||
| Interest rate | : | 5.69% | ||
| Interest payment | : | Semi-annual. | ||
Seventeenth Issue | ||||
| Date of issue | : | July 6, 2007 | ||
| Number of bonds subscribed | : | 8,000 | ||
| Nominal value | : | 5,000 (new soles) each | ||
| Term | : | 5 yean | ||
| Interest rate | : | 5.97% | ||
| Interest payment | : | Semi-annual | ||
Eighteenth Issue — Series A | ||||
| Date of Issue | : | April 19, 2007 | ||
| Issuer | : | Edelnor S.A.A. | ||
| Bonds issued | : | Marketable Securities in thousands of new soles (4,000 bonds of S/. 5,000.00 each) | ||
| Number of bonds subscribed | : | S/. 40,000,000 | ||
| Number of bonds placed | : | S/. 20,000,000 | ||
| Principal due | : | All due on April 19, 2015 | ||
| Interest rate | : | 5.91% | ||
| Interest payment | : | Semi-annual. | ||
F - 72
Table of Contents
First Issue | ||||
| Date of issue | : | August 29, 2007 | ||
| Number of bonds subscribed | : | 8,000 | ||
| Nominal value | : | 5,000 (new soles) each | ||
| Term | : | 8 years | ||
| Interest rate | : | 6.94% | ||
| Interest payment | : | Semi-annual | ||
Second Issue | ||||
| Date of issue | : | September 12, 2007 | ||
| Number of bonds subscribed | : | 6,000 | ||
| Nominal value | : | 5,000 (new soles) each | ||
| Term | : | 5 years | ||
| Interest rate | : | 6.56% | ||
| Interest payment | : | Semi-annual | ||
First Issue | ||||
| Issuer | : | Codensa. | ||
| Issued securities | : | Securities negotiable in Colombian pesos. | ||
| Amount issued | : | 500,000,000,000 Colombian pesos. | ||
| 1st principal payment | : | Maturity in 2009 for 50,000,000,000 Colombian pesos. | ||
| Nominal interest rate | : | 9.99% average annual rate. | ||
| Interest payment | : | Quarterly. | ||
| Interest accrued at year end is ThCh$ 71,521 (ThCh$ 62,573 in 2006), and it is presented in current liabilities. | ||||
| 2nd principal payment | : | Maturity in 2011 for 200,000,000,000 Colombian pesos. | ||
| Nominal interest rate | : | 11.20% average annual rate. | ||
| Interest payment | : | Quarterly. | ||
| Interest accrued at year end is ThCh$ 320,612 (ThCh$ 286,047 in 2006), and it is presented in current liabilities. | ||||
| 3rd principal payment | : | Maturity in 2014 for 250,000,000,000 Colombian pesos. | ||
| Nominal interest rate | : | 11.40% average annual rate. | ||
| Interest payment | : | Quarterly. | ||
| Interest accrued at year-end is ThCh$ 406,931 (ThCh$ 363,945 in 2006), and it is presented in the current liabilities. | ||||
1st principal payment | : | Maturity in 2010 for 139,800,000,000 Colombian pesos. | ||
| Nominal interest rate | : | 10.06% average annual rate | ||
| Interest payment | : | Quarterly. | ||
| Year-end interest is ThCh$ 168,150 in 2007, and it is presented in current liabilities. | ||||
F - 73
Table of Contents
2nd principal payment | : | Maturity in 2017 for 391,500,000,000 Colombian pesos. | ||
| Nominal interest rate | : | 10.80°/o average annual interest rate | ||
| Interest payment | : | Quarterly. | ||
| Year-end interest is ThCh$ 503,344 in 2007, and it is presented in current liabilities. | ||||
3rd principal payment | : | Maturity in 2017 for 84,980,000 Colombian pesos and 33,720,000 Colombian pesos | ||
| Nominal interest rate | : | 10.06% average annual interest rate | ||
| Nominal interest rate | : | 10.94% average annual interest rate | ||
| Interest payment | : | Quarterly. | ||
| Year-end interest is ThCh$ 109,653 and ThCh$ 44,866 in 2007, respectively, and it is presented in current liabilities | ||||
| Issuer | : | Edesur S.A. | ||
| Issued securities | : | Negotiable bonds in Argentinean pesos. | ||
| Amount issued | : | ThUS$ 6,464. | ||
| Principal due | : | Maturity in 2007. | ||
| Nominal interest rate | : | 10.41% average annual rate. | ||
| Interest payment | : | Quartely. | ||
| Issuer | : | Edesur S.A. | ||
| Issued securities | : | Negotiable bonds in Argentinean pesos. | ||
| Amount issued | : | ThUS$ 52,339. | ||
| Principal due | : | Maturity in 2012. | ||
| Nominal interest rate | : | 11.75% minimum annual nominal rate. | ||
| Interest payment | : | Quarterly. | ||
First Series | ||||
| Issuer | : | Ampla Energía e Servicos S.A. | ||
| Issued securities | : | Negotiable bonds in Brazilian reales. | ||
| Amount issued | : | R$ 290,000,000. | ||
| Principal due | : | Maturity in 2008. | ||
| Nominal interest rate | : | CDI + 1.2% per annum | ||
| Interest payment | : | Semi-annual. | ||
| Principal due | : | Maturity in 2008. | ||
F - 74
Table of Contents
Second Series | ||||
| Issuer | : | Ampla Energía e Servicos S.A. | ||
| Issued securities | : | Negotiable bonds in Brazilian reales. | ||
| Amount issued | : | R$ 110,000,000. | ||
| Principal due | : | Maturity in 2010. | ||
| Nominal interest rate | : | IGP - M + 11.4% per annum | ||
| Interest payment | : | Annual. | ||
| Principal due | : | Maturity in 2010 | ||
| Issuer | : | Ampla Energía e Servicos S.A. | ||
| Issued securities | : | Negotiable bonds in Brazilian reales. | ||
| Amount issued | : | R$ 370,000,000. | ||
| Principal due | : | Maturity in 2012 | ||
| Nominal interest rate | : | DI + 0.85% per annum | ||
| Interest payment | : | Semi-annual. | ||
| • | On August 9, 2001, it registered the fourth bond issue of U.F. 7,500,000 under No.264; this was totally placed at December 31, 2001. | ||
| Series E-1 and E-2 were totally redeemed through payment at July 31, 2006. | |||
| • | On November 26, 2002, it registered the fifth bond issue of U.F. 8,000,000 under Nos. 317 and 318 and then amended it on October 2, 2003; this issue was totally placed at December 31, 2003. | ||
| • | On April 15, 2007, it redeemed series G for U.F. 4,000,0000 (U.F. = Inflation index-linked unit of account) in advance, refinancing it by placing series K for the same amount; both series were registered under No.318 of November 26, 2002. |
| Category | ||
• Feller-Rate Clasificadora de Riesgo Ltda. | AA- | |
• Comisión Clasificadora de Riesgo | A+ | |
• Fitch Chile Clasificadora de Riesgo Ltda. | AA- |
F - 75
Table of Contents
Fourth Issue | ||||
| Issuer | : | Empresa Nacional de Electricidad S.A. | ||
| Securities issued | : | Bearer bonds in local currency, denominated in Unidades de Fomento (UF-Inflation Index-linked Units of Account) | ||
| Issuance Value (1) | : | Up to seven and a half million (UF 7,500,000) divided into: | ||
| Series F: 150 bonds at UF 10,000 each. | ||||
| Adjustment base | : | Variation in the UF | ||
| Amortization period | : | Series F: August 1, 2022. | ||
| Early redemption | : | Beginning February 1, 2012. | ||
| Nominal interest rate | : | 6.20% annually, compounded semi-annually and effective on the outstanding principal adjusted for the value of the Unidad de fomento. The semi-annual interest rate will be 3.0534%. | ||
| Placement period | : | 36 months from the registration date in the Chilean Securities Register of the Superintendence of Securities and Insurance | ||
| Security | : | There is no specific security, other than the general security of all the issuer’s properties | ||
| Interest payment | : | Interest will be paid semi-annually each August 1 and February 1, starting August 1, 2001. Accrued interest at year end is ThCh$ 748,944 (ThCh$ 751,639 in 2006) and it is presented in current liabilities. | ||
Fifth Issue | ||||
| Issuer | : | Empresa Nacional de Electricidad S.A. | ||
| Securities issued | : | Dematerialized bearer bonds in local currency, expressed in Unidades de Fomento (UF-Inflation Index-linked Units of Account) | ||
| Amount of issue | : | Eight million Unidades de Fomento (U.F. 8,000,000) divided into: | ||
| • | Series H: 4,000 bonds U.F. 1,000 each. | |||
| • | Series K: 4,000 bonds U.F. 1,000 each. | |||
| Adjustment base | : | Variation in Unidad de Fomento. | ||
| Amortization period | : | Series H: Semi-annually and successively as of April 15, 2010. Series K: As of April 15, 2027. | ||
| Early redemption | : | Only for series K bonds, as of October 16, 2011. | ||
| Nominal interest rate | : | Series K: 3.8% per year, compounded every six months and effective on the principal not fully paid adjusted by the value of the Unidad de Fomento. The interest rate to be applied every six months will be 1.8823%. | ||
| : | Series H: 6.2% per year, compounded every six months and effective on the principal not fully paid adjusted by the value of the Unidad de Fomento. The interest rate to be paid every six months will be 3.0534%. | |||
| Placement deadline | : | 36 months as of date of registration in Securities Register of the Superintendence of Securities and Insurance. | ||
| Security | : | No specific security, except for general security of all the issuer’s properties. | ||
| Interest payment | : | Interest will be paid semi-annually, due on April 15 and October 15 of each year starting from April 15, 2007. Interest accrued at year-end is ThCh$ 1,614,187 (ThCh$ 1,780,681 in 2006) an it is presented in current liabilities. | ||
| Rating entity | Category | |
• Standard & Poor’s | BBB | |
• Moodys Investors Services | Baa3 | |
• Fitch | BBB |
F - 76
Table of Contents
First Issue | ||||
| Issuer | : | Empresa Nacional de Electricidad S.A. | ||
| Securities issued | : | Marketable bonds denominated in US$ (Yankee bonds) in the US market. | ||
| Issuance Value | : | Six hundred and fifty million US Dollars (US$ 650,000,000) divided into: | ||
| Series 1: US$ 230,000,000 | ||||
| Series 2: US$ 220,000,000 | ||||
| Series 3: US$ 200,000,000 | ||||
| Adjustment | : | Variation in the US Dollar in relation to the Chilean peso | ||
| Amortization period | : | Series 1 matures on February 1, 2027: Series 2 matures on February 1, 2037 (Put Option on February 1, 2009, on which date the holders may redeem 100% of bonds plus accrued interest). | ||
| Series 3 matures on February 1, 2097. | ||||
| Nominal interest rate | : | Series 1: 7.88% annually | ||
| Series 2: 7.33% annually | ||||
| Series 3: 8.13% annually | ||||
| Interest Payments | : | Interest will be paid semi-annually on February 1 and August 1 every year, starting January 27, 1997. Accrued interest at year end is ThCh$ 10,450,735 (ThCh$ 12,025,990 in 2006), and it is presented in current liabilities. | ||
Second Issue | ||||
| Issuer | : | Empresa Nacional de Electricidad S.A. | ||
| Securities issued | : | Marketable bonds denominated in US$ (Yankee bonds) in the US market. | ||
| Issuance Value | : | Four hundred million US Dollars (US$ 400,000,000) | ||
| Adjustment | : | Variation in the US Dollar in relation to the Chilean peso | ||
| Principal due | : | Series 1 matures on July 15, 2008 | ||
| Nominal interest rate | : | Series 1: 7.75% annually | ||
| Interest Payment | : | Interest will be paid semi-annually on January 15 and July 15 of each year, starting January 15, 1999. Accrued interest at year end is ThCh$ 7,059,978 (ThCh$ 8,124,138 in 2006), and it is presented in current liabilities. | ||
Third Issue | ||||
| Issuer | : | Empresa Nacional de Electricidad S.A. | ||
| Securities issued | : | Marketable bonds denominated in US$ (Yankee bonds) in the US market. | ||
| Issuance Value | : | Four hundred million US Dollars (US$ 400,000,000). | ||
| Adjustment | : | Variation in the US Dollar in relation to the Chilean peso | ||
| Principal due | : | Series 1 matures on April 1, 2009. | ||
| Nominal interest rate | : | Series 1: 8.50% annually | ||
| Interest Payment | : | Interest will be paid semi-annually on October 1 and April 1 of each year, starting October 1, 1999. Accrued interest at year end is ThCh$ 4,223,565 (ThCh$ 4,860,188 in 2006), and it is presented in current liabilities. | ||
Fourth Issue | ||||
| Issuer | : | Empresa Nacional de Electricidad S.A. | ||
| Securities issued | : | Electronic bonds expressed in US dollars on the American and European markets, under “Rule 144A” and “Regulation S”. | ||
| Amount of issue | : | Six hundred million US dollars (US$ 600,000,000) divided into: | ||
| Series August 1, 2013: US$ 400,000,000 | ||||
| Series August 1, 2015: US$ 200,000,000 | ||||
| Adjustment | : | Variation in US dollar. | ||
| Principal due | : | Series of US$ 400 millions total maturity on August 1, 2013. | ||
| : | Series of US$ 200 millions total maturity on August 1, 2015. | |||
| Nominal interest rate | : | Series of US$ 400 millions 8.35% per year. | ||
| Series of US$ 400 millions 8.63% per year. | ||||
| Payment of interest | : | Interest will be paid semi-annually on February 1 and August 1 each year starting from July 23, 2003. Interest accrued at year-end was ThCh$ 10,486,450 (ThCh$ 12,067,085 in 2006) and it is presented in current liabilities. | ||
F - 77
Table of Contents
| • | Series 1: US$ 230 million at 30 years, maturing in 2027. | ||
| • | Series 3: US$ 200 million at 100 years, maturing in 2097. |
ThUS$ 134,828, respectively, were purchased, whose nominal values amounted to ThUS$ 24,119 and ThUS$ 159,584 for each series.
| Issuer | : | Edegel S.A. | ||
| Securities issued | : | Marketable bonds in US$ (110,000 bonds). | ||
| Issuance value | : | One hundred and ten million US dollars (US$ 110,000,000) | ||
| Principal due | : | June 3, 2006, February 14, 2007, June 13, 2007, and November 21, 2005, respectively. | ||
| Nominal interest rate | : | 8.75%, 8.41%, 8.75% and 8.44% per year | ||
| Interest payment | : | Interest will be paid semi-annually. Accrued interest at year end is ThCh$ 708,922 (ThCh$ 708,922), and it is presented in current liabilities. | ||
| Issuer | : | Edegel S.A. | ||
| Securities issued | : | Marketable securities denominated Peruvian Soles (5,000 bonds). | ||
| Issuance Value | : | Twenty Five million Peruvian Soles (Peruvian Soles 25,000,000) | ||
| Capital amortization | : | Full expiration as of January 15, 2014. | ||
| Nominal interest rate | : | 6.16% annually. | ||
| Interest Payments | : | Interest will be paid semi-annually. Accrued interest as of December 31, 2007 amounts to ThCh$ 116,953 (ThCh$ 0 in 2006) and is shown under other current liabilities. | ||
| Issuer | : | Edegel S.A. | ||
| Securities issued | : | Marketable Bonds in Soles (5,000 bonds) | ||
| Amount issued | : | Twenty five million soles (S/.25,000,000) | ||
| Principal due | : | Total maturity at February 22, 2011 | ||
| Nominal interest rate | : | 5.91% | ||
| Interest payment | : | Semi-annual. Interest accrued at year end is ThCh$ 87,043 and it is presented in current liabilities. | ||
F - 78
Table of Contents
| Issuer | : | Edegel S.A. | ||
| Securities issued | : | Marketable Bonds in Soles (5,000 bonds) | ||
| Amount issued | : | Twenty five million soles (S/.25,000,000) | ||
| Principal due | : | Total maturity at June 21, 2022 | ||
| Nominal interest rate | : | 6.31% | ||
| Interest payment | : | Semi-annual. Interest accrued at year end is ThCh$ 6,541 and it is presented in current liabilities. | ||
| Issuer | : | Edegel S.A. | ||
| Securities issued | : | Marketable Bonds in Soles (8,000 bonds) | ||
| Amount issued | : | Eight million dollars (US$ 8,000,000) | ||
| Principal due | : | Total maturity at July 18, 2011 | ||
| Nominal interest rate | : | 5.97% per year | ||
| Interest payment | : | Semi-annual. Interest accrued at year end is ThCh$ 106,769 and it is presented in current liabilities. | ||
| Issuer | : | Edegel S.A. | ||
| Securities issued | : | Marketable Bonds in Soles (5,000 bonds) | ||
| Amount issued | : | Twenty five million soles (S/.25,000,000) | ||
| Principal due | : | Total maturity at July 3, 2019 | ||
| Nominal interest rate | : | 6.28% per year | ||
| Interest payment | : | Semi-annual. Interest accrued at year end is ThCh$ 128,006 and it is presented in current liabilities. | ||
| Issuer | : | Edegel S.A. | ||
| Securities issued | : | Marketable Bonds in Soles (4,000 bonds) | ||
| Amount issued | : | Twenty five million soles (S/.20,000,000) | ||
| Principal due | : | Total maturity at August 31, 2014 | ||
| Nominal interest rate | : | 6.75% per year | ||
| Interest payment | : | Semi-annual. Interest accrued at year end is ThCh$ 74,608 and it is presented in current liabilities. | ||
| Issuer | : | Edegel S.A. | ||
| Securities issued | : | Marketable Bonds in Soles (5,000 bonds) | ||
| Amount issued | : | Twenty five million soles (S/.25,000,000) | ||
| Principal due | : | Total maturity at March 18, 2013 | ||
| Nominal interest rate | : | 6.50% per year | ||
| Interest payment | : | Semi-annual. Interest accrued at year end is ThCh$ 77,084 and it is presented in current liabilities. | ||
| Issuer | : | Edegel S.A. | ||
| Securities issued | : | Marketable Bonds in Soles (5,000 bonds) | ||
| Amount issued | : | Twenty five million soles (S/.25,000,000) | ||
| Principal due | : | Total maturity at May 21, 2013 | ||
| Nominal interest rate | : | 6.44% per year | ||
| Interest payment | : | Semi-annual. Interest accrued at year end is ThCh$ 29,647 and it is presented in current liabilities. | ||
| Issuer | : | Edegel S.A. | ||
| Securities issued | : | Marketable Bonds in Soles (5,000 bonds) | ||
| Amount issued | : | Twenty five million soles (S/.25,000,000) | ||
| Principal due | : | Total maturity at June 13, 2013 | ||
| Nominal interest rate | : | 6.63% per year | ||
| Interest payment | : | Semi-annual. Interest accrued at year end is ThCh$ 13,730 and it is presented in current liabilities. | ||
F - 79
Table of Contents
| Issuer | : | Edegel S.A. | ||
| Issued securities | : | Negotiable bonds in US dollars (10,000 bonds). | ||
| Amount issued | : | Ten million US dollars (US$ 10,000,000). | ||
| Principal due | : | Total maturity on January 26, 2009. | ||
| Nominal interest rate | : | 3.75% per year | ||
| Interest payment | : | Semi-annual. Interest accrued at year end is ThCh$ 79,710 (ThCh$ 91,724 in 2006) and it is presented in current liabilities. | ||
| Issuer | : | Edegel S.A. | ||
| Issued securities | : | Negotiable bonds in new Peruvian soles (6,000 bonds). | ||
| Amount issued | : | Thirty million new Peruvian soles (NS 30,000,000). | ||
| Principal due | : | Total maturity on February 27, 2008. | ||
| Nominal interest rate | : | 5.88% per year | ||
| Interest payment | : | Semi-annual. Interest accrued at year end is ThCh$ 99,840 (ThCh$ 107,702 in 2006) and it is presented in current liabilities. | ||
| Issuer | : | Edegel S.A. | ||
| Issued securities | : | Negotiable bonds in new Peruvian soles (4,000 bonds). | ||
| Amount issued | : | Twenty million new Peruvian soles (NS 20,000,000). | ||
| Principal due | : | Total maturity on June 18, 2008. | ||
| Nominal interest rate | : | 8.5% per year. | ||
| Interest payment | : | Semi-annual. Interest accrued at year end is ThCh$ 9,395 (ThCh$ 10,980 in 2006) and it is presented in current liabilities. | ||
| Issuer | : | Edegel S.A. | ||
| Issued securities | : | Negotiable bonds in US dollars (10,000 bonds). | ||
| Amount issued | : | Ten million US dollars (US$ 10,000,000). | ||
| Principal due | : | Total maturity on July 26, 2009. | ||
| Nominal interest rate | : | 7,16% per year. | ||
| Interest payment | : | Semi-annual. Interest accrued at year end is ThCh$ 152,092 (ThCh$ 179,519 in 2006) and it is presented in current liabilities. | ||
| Issuer | : | Edegel S.A. | ||
| Securities issued | : | Marketable bonds in new Peruvian soles (4,474 bonds) | ||
| Amount of issue | : | Twenty two million three hundred seventy thousand new Peruvian soles (NS22,370,000). | ||
| Principal due | : | Total maturity on March 10, 2008. | ||
| Nominal interest rate | : | 6.00% per year. | ||
| Interest payment | : | Semi-annual. Interest accrued at year-end is ThCh$ 67,995 (ThCh$ 73,350 in 2006) and it is presented in current liabilities. | ||
| Issuer | : | Edegel S.A. | ||
| Securities issued | : | Marketable bonds in new Peruvian soles (5,140 bonds) | ||
| Amount of issue | : | Twenty five million seven hundred thousand new Peruvian soles (NS25,700,000). | ||
| Principal due | : | Total maturity on March 30, 2008. | ||
| Nominal interest rate | : | 6.47% | ||
| Interest payment | : | Semi-annual. Interest accrued at year-end is ThCh$ 68,908 (ThCh$ 74,334 in 2006) and it is presented in current liabilities. | ||
| Issuer | : | Edegel S.A. | ||
| Securities issued | : | Marketable bonds in new Peruvian soles (14,000 bonds) | ||
| Amount of issue | : | Seventy million new Peruvian soles (NS70,000,000). | ||
| Principal due | : | Total maturity on June 1, 2009. | ||
| Nominal interest rate | : | 6.91% | ||
| Interest payment | : | Semi-annual. Interest accrued at year-end is ThCh$ 66,793 (ThCh$ 72,053 in 2006) and it is presented in current liabilities. | ||
F - 80
Table of Contents
| Issuer | : | Edegel S.A. | ||
| Securities issued | : | Marketable bonds in new Peruvian soles (7,000 bonds) | ||
| Amount of issue | : | Thirty five million new Peruvian soles (NS35,000,000). | ||
| Principal due | : | Total maturity on October 21, 2010. | ||
| Nominal interest rate | : | 6.72% | ||
| Interest payment | : | Semi-annual. Interest accrued at year-end is ThCh$ 74,727 (ThCh$ 80,611 in 2006) and it is presented in current liabilities. | ||
| Issuer | : | Edegel S.A. | ||
| Securities issued | : | Marketable bonds in US dollars (20,000 bonds) | ||
| Amount of issue | : | Twenty million US dollars (US$ 20,000,000). | ||
| Principal due | : | Total maturity on November 18, 2012. | ||
| Nominal interest rate | : | 6.06% | ||
| Interest payment | : | Semi-annual. Interest accrued at year-end is ThCh$ 70,289 (ThCh$ 80,884 in 2006) and it is presented in current liabilities. | ||
| Issuer | : | Edegel S.A. | ||
| Securities issued | : | Marketable bonds in new Peruvian soles (5,000 bonds) | ||
| Amount of issue | : | Twenty Five million new Peruvian soles (NS25,000,000). | ||
| Principal due | : | Total maturity on October 20, 2013. | ||
| Nominal interest rate | : | 6.47% | ||
| Interest payment | : | Semi-annual. Interest accrued at year-end is ThCh$ 52,135 (ThCh$ 56,240 in 2006) and it is presented in current liabilities. | ||
| Issuer | : | Edegel S.A. | ||
| Securities issued | : | Marketable bonds in new Peruvian soles (5,000 bonds) | ||
| Amount of issue | : | Twenty five million new Peruvian soles (NS25,000,000). | ||
| Principal due | : | Total maturity on October 21, 2010. | ||
| Nominal interest rate | : | 6.09% | ||
| Interest payment | : | Semi-annual. Interest accrued at year-end is ThCh$ 44,201 (ThCh$ 47,682 in 2006) and it is presented in current liabilities. | ||
| Issuer | : | Edegel S.A. | ||
| Securities issued | : | Marketable bonds in Peruvian Soles (6,000 bonds) | ||
| Amount of issue | : | Twenty five million Peruvian Soles (S/. 30,000,000). | ||
| Principal due | : | Total maturity on November 27, 2011. | ||
| Nominal interest rate | : | 6.16% | ||
| Interest payment | : | Semi-annual. Interest accrued at year-end is ThCh$ 28,069 (ThCh$ 30,279 in 2006) and it is presented in current liabilities. | ||
First Issue | ||||
| Issuer | : | Emgesa S.A. | ||
| Securities issued | : | Marketable bonds in Colombian pesos | ||
| Issuance Value | : | $Col 530,000,000,000 | ||
| Principal due | : | Maturities between 2004 and 2009 amounting to Col$ 316,744,675,710 | ||
| Interest nominal rate | : | 10,72% per year average rate | ||
| Interest payment | : | Interest will be paid on a quarterly and yearly basis. Accrued interest at year end is ThCh$ 1,861,351 (ThCh$ 1,602,445 in 2006) and it is presented in current liabilities. | ||
F - 81
Table of Contents
Third Issue | ||||
| Issuer | : | Emgesa S.A. | ||
| Securities issued | : | Marketable bonds in Colombian pesos | ||
| Issuance value | : | $Col 250,000,000,000 | ||
| Principal due | : | Maturity at February 23, 2015. | ||
| Nominal interest rate | : | 10.32% | ||
| Interest payment | : | Annual. Accrued interest at year end is ThCh$ 679,716 (ThCh$ 622,367 in 2006) and it is presented in current liabilities. | ||
Fourth Issue | ||||
| Issuer | : | Emgesa S.A. | ||
| Securities issued | : | Marketable bonds in Colombian pesos | ||
| Issuance value | : | $Col 170,000,000,000 | ||
| Principal due | : | Maturity at February 20, 2017. | ||
| Nominal interest rate | : | 10.84% per year | ||
| Interest payment | : | Interest will be paid annually. Accrued interest at year end is ThCh$ 3,921,727 and it is presented in current liabilities. | ||
First issue | ||||
| Issuer | : | Central Hidroeléctrica Betania S.A. E.S.P. | ||
| Issued securities | : | Bonds in Colombian pesos. | ||
| Amount issued | : | 400,000,000,000 Colombian pesos. | ||
| Principal due | : | Maturity between 2009 and 2011, for 400,000,000,000 Colombian pesos. | ||
| Nominal interest rate | : | 11,29% per year | ||
| Interest payment | : | Quarterly. Interest accrued at year end is ThCh$ 1,494,929 (ThCh$ 1,504,943 in 2006) and it is presented in current liabilities. | ||
F - 82
Table of Contents
| As of December 31, | ||||||||
| 2006 | 2007 | |||||||
| ThCh$ | ThCh$ | |||||||
| Bonus and other employee benefits | 42,353,181 | 42,188,329 | ||||||
| Litigation and other contingencies | 12,826,438 | 11,202,426 | ||||||
| Post-retirement benefits foreign subsidiaries | 9,728,468 | 12,470,086 | ||||||
| Post-retirement benefits local subsidiaries | 1,192,086 | 1,162,643 | ||||||
| Suppliers and services | 17,151,569 | 15,744,703 | ||||||
| Others | 1,970,839 | 2,287,765 | ||||||
| Total | 85,222,581 | 85,055,952 | ||||||
| As of December 31, | ||||||||
| 2006 | 2007 | |||||||
| ThCh$ | ThCh$ | |||||||
| Post-retirement benefits-local subsidiaries | 17,094,367 | 15,540,220 | ||||||
| Employee and retired personnel benefits (Ampla-Coelce) | 35,223,590 | 33,470,014 | ||||||
| Severance indemnity (Note 20) | 15,700,343 | 15,965,230 | ||||||
| Legal, labor and tax contingencies (Ampla, Coelce and Cien) | 179,286,307 | 160,444,874 | ||||||
| Post-retirement benefits-foreign subsidiaries | 77,071,460 | 70,361,582 | ||||||
| Regulatory contingencies (Brazil) | 23,369,570 | 30,828,546 | ||||||
| Other | 1,247,443 | 1,689,238 | ||||||
| Total | 348,993,080 | 328,299,704 | ||||||
F - 83
Table of Contents
| Note 20. | Severance Indemnities |
| As of December 31, | ||||||||
| 2006 | 2007 | |||||||
| ThCh$ | ThCh$ | |||||||
| Opening balance as of January 1 | 14,445,331 | 15,700,343 | ||||||
| Increase in accrual | 3,647,409 | 2,097,948 | ||||||
| Transfer to short-term | (200,093 | ) | (238,664 | ) | ||||
| Payments during the period | (2,192,304 | ) | (1,594,397 | ) | ||||
| Total | 15,700,343 | 15,965,230 | ||||||
| (a) | Minority shareholders’ participation in the shareholders’ equity of the Company’s subsidiaries is as follows: |
| As of December 31, 2006 | As of December 31, 2007 | |||||||||||||||||||||||
| Company | Equity | Participation | Total | Equity | Participation | Total | ||||||||||||||||||
| ThCh$ | % | ThCh$ | ThCh$ | % | ThCh$ | |||||||||||||||||||
| Soc. Agrícola Pastos Verdes Ltda. | 75,051,973 | 45.00 | % | 33,773,388 | 76,759,777 | 45.00 | % | 34,541,899 | ||||||||||||||||
| Aguas Santiago Poniente S.A. | 4,795,854 | 21.12 | % | 1,013,103 | 4,856,358 | 21.12 | % | 1,025,884 | ||||||||||||||||
| Ampla Energía e Servicios S.A. | 517,566,929 | 8.07 | % | 41,751,639 | 444,907,878 | 8.07 | % | 35,890,302 | ||||||||||||||||
| Ampla Investimentos | 43,824,715 | 8.07 | % | 3,535,298 | 38,539,151 | 8.07 | % | 3,108,917 | ||||||||||||||||
| Cam Argentina S.A. | 341,390 | 0.001 | % | 4 | 285,292 | 0.001 | % | 4 | ||||||||||||||||
| Cam Brasil S.A. | 3,550,857 | 0.0001 | % | 5 | — | — | — | |||||||||||||||||
| Cam Colombia S.A. | 3,184,278 | 0.001 | % | 43 | 3,655,123 | 0.001 | % | 2 | ||||||||||||||||
| Cam Perú S.A. | — | — | — | 5,246,695 | 0.0001 | % | 4 | |||||||||||||||||
| Central Hidroeléctrica Betania S.A. | 363,482,619 | 0.01 | % | 21,961 | — | — | — | |||||||||||||||||
| Chilectra S.A. (ex Elesur S.A.) | 740,198,338 | 0.92 | % | 6,734,658 | 759,014,600 | 0.92 | % | 6,902,320 | ||||||||||||||||
| Cía. Peruana de Electricidad S.A. | 22,932,626 | 49.00 | % | 11,236,986 | 16,777,538 | 49.00 | % | 8,220,993 | ||||||||||||||||
| Codensa S.A. | 563,056,451 | 78.19 | % | 440,227,954 | 445,351,089 | 78.19 | % | 348,199,548 | ||||||||||||||||
| Companhia Energetica Do Ceara – Coelce | 489,745,614 | 41.14 | % | 201,465,843 | 413,535,909 | 41.14 | % | 170,115,582 | ||||||||||||||||
| Compañía de Transmisión del Mercosur S.A. | 11,888,281 | 0.01 | % | 1,093 | 11,564,172 | 0.01 | % | 1,012 | ||||||||||||||||
| Constructora y Proyectos Los Maitenes S.A. | (1,587,080 | ) | 45.00 | % | (722,131 | ) | (1,522,263 | ) | 45.00 | % | (685,019 | ) | ||||||||||||
| Edegel S.A. | 498,365,151 | 44.56 | % | 222,058,918 | 407,048,817 | 44.56 | % | 181,370,667 | ||||||||||||||||
| Edelnor S.A. | 152,041,634 | 40.00 | % | 60,816,654 | 111,739,732 | 40.00 | % | 44,695,893 | ||||||||||||||||
| Edesur S.A. | 492,345,362 | 34.11 | % | 167,905,959 | 448,357,338 | 34.11 | % | 152,928,429 | ||||||||||||||||
| Emgesa S.A. | 664,042,954 | 76.55 | % | 508,304,296 | 686,373,037 | 73.13 | % | 501,937,249 | ||||||||||||||||
| Empresa Eléctrica Pangue S.A. | 125,430,647 | 5.01 | % | 6,291,852 | 118,093,601 | 5.01 | % | 5,923,811 | ||||||||||||||||
| Endesa Chile | 1,927,088,780 | 40.02 | % | 771,203,118 | 1,884,226,640 | 40.02 | % | 754,049,950 | ||||||||||||||||
| Endesa Argentina S.A. | 42,737,894 | 0.01 | % | 4,273 | 134,393,664 | 0.01 | % | 13,439 | ||||||||||||||||
| Endesa Brasil S.A. | 1,079,738,211 | 28.48 | % | 307,536,005 | 948,146,991 | 28.48 | % | 270,055,452 | ||||||||||||||||
| Endesa Cachoeira S.A. | 355,072,779 | 0.39 | % | 1,399,412 | 338,480,971 | 0.39 | % | 1,334,021 | ||||||||||||||||
| Endesa Costanera S.A. | 150,100,911 | 35.74 | % | 53,638,422 | 119,304,734 | 30.23 | % | 36,071,676 | ||||||||||||||||
| Generandes Perú S.A. | 252,455,436 | 40.37 | % | 101,913,786 | 206,672,674 | 40.37 | % | 83,431,733 | ||||||||||||||||
| Hidroeléctrica El Chocón S.A. | 202,116,934 | 34.81 | % | 70,356,904 | 170,188,801 | 32.33 | % | 55,015,232 | ||||||||||||||||
| Hidroinvest S.A. | 82,180,015 | 30.07 | % | 24,711,531 | 103,672,237 | 3.91 | % | 4,048,816 | ||||||||||||||||
| Inversiones Distrilima S.A. | 84,486,888 | 31.61 | % | 26,706,305 | 67,065,126 | 31.61 | % | 21,199,286 | ||||||||||||||||
| Pehuenche S.A. | 232,588,570 | 7.35 | % | 17,095,261 | 259,455,281 | 7.35 | % | 19,069,963 | ||||||||||||||||
| Soc. Agrícola de Cameros Ltda. | 7,911,719 | 42.50 | % | 3,362,481 | 7,764,663 | 42.50 | % | 3,299,982 | ||||||||||||||||
| Túnel El Melón S.A. | (9,629,565 | ) | 0.05 | % | (4,815 | ) | — | — | — | |||||||||||||||
| Total | 3,082,340,206 | 2,741,767,047 | ||||||||||||||||||||||
F - 84
Table of Contents
| (b) | Minority shareholders’ participation in the net (income) or loss of the Company’s subsidiaries is as follows: |
| As of December 31, 2005 | As of December 31, 2006 | As of December 31, 2007 | ||||||||||||||||||||||||||||||||||
| Company | Net income | Participation | Total | Net income | Participation | Total | Net income | Participation | Total | |||||||||||||||||||||||||||
| ThCh$ | % | ThCh$ | ThCh$ | % | ThCh$ | ThCh$ | % | ThCh$ | ||||||||||||||||||||||||||||
| Soc. Agrícola Pastos Verdes Ltda. | (1,656,818 | ) | 45.00 | % | (745,569 | ) | (5,272,789 | ) | 45.00 | % | (2,372,755 | ) | (6,227,268 | ) | 45.00 | % | (2,802,271 | ) | ||||||||||||||||||
| Aguas Santiago Poniente S.A. | 93,566 | 45.00 | % | 42,104 | 107,570 | 41.70 | % | 44,858 | (60,504 | ) | 21.12 | % | (12,781 | ) | ||||||||||||||||||||||
| Ampla Energía e Servicios S.A. | 8,866,946 | 37.50 | % | 3,325,242 | (27,002,236 | ) | 8.07 | % | (2,178,246 | ) | (6,224,959 | ) | 8.07 | % | (502,162 | ) | ||||||||||||||||||||
| Ampla Investimentos | (1,507,291 | ) | 8.07 | % | (121,593 | ) | (4,465,169 | ) | 8.07 | % | (360,201 | ) | (2,588,340 | ) | 8.07 | % | (208,800 | ) | ||||||||||||||||||
| Cam Argentina S.A. | 136,583 | 0.00 | % | 1 | 23,219 | 0.001 | % | — | 11,380 | 0.001 | % | — | ||||||||||||||||||||||||
| Cam Brasil S.A. | — | — | — | 711,001 | 0.0001 | % | 1 | (17,725 | ) | 0.0002 | % | — | ||||||||||||||||||||||||
| Cam Colombia S.A. | (914,349 | ) | 0.00 | % | (12 | ) | (813,650 | ) | 0.001 | % | (11 | ) | (887,942 | ) | 0.001 | % | (1 | ) | ||||||||||||||||||
| Cam Perú S.A. | — | — | — | — | — | — | (1,205,347 | ) | 0.0001 | % | (1 | ) | ||||||||||||||||||||||||
| Capital de Energía S.A. | (21,247,487 | ) | 49.00 | % | (10,411,268 | ) | — | — | — | — | — | — | ||||||||||||||||||||||||
| Central Hidroeléctrica Betania S.A. | (2,663,802 | ) | 14.38 | % | (382,997 | ) | (1,088,685 | ) | 0.01 | % | (66 | ) | — | — | — | |||||||||||||||||||||
| Chilectra S.A. (ex Elesur S.A.) | (85,400,916 | ) | 1.76 | % | (1,491,891 | ) | (249,208,722 | ) | 0.92 | % | (1,418,260 | ) | (122,314,926 | ) | 0.92 | % | (1,112,306 | ) | ||||||||||||||||||
| Cía. Peruana de Electricidad S.A. | (2,989,681 | ) | 49.00 | % | (1,464,944 | ) | (1,343,977 | ) | 49.00 | % | (658,549 | ) | (1,501,954 | ) | 49.00 | % | (735,957 | ) | ||||||||||||||||||
| Codensa S.A. | (73,240,681 | ) | 78.19 | % | (57,263,522 | ) | (93,599,914 | ) | 78.19 | % | (73,181,470 | ) | (67,811,187 | ) | 78.19 | % | (53,018,451 | ) | ||||||||||||||||||
| Compañía de Transmisión del Mercosur S.A. | 229,182 | 0.02 | % | 217 | (2,085,994 | ) | 0.01 | % | (363 | ) | (1,233,106 | ) | 0.01 | % | (62 | ) | ||||||||||||||||||||
| Companhia Energetica Do Ceara - Coelce | (14,592,179 | ) | 40.96 | % | (5,976,760 | ) | (78,209,142 | ) | 41.14 | % | (32,172,765 | ) | (43,167,349 | ) | 41.14 | % | (17,757,682 | ) | ||||||||||||||||||
| Constructora y Proyectos Los Maitenes S.A. | 459,738 | 45.00 | % | 206,882 | (311,091 | ) | 45.00 | % | (139,991 | ) | (82,471 | ) | 45.00 | % | (37,112 | ) | ||||||||||||||||||||
| Edegel S.A. | (37,855,704 | ) | 36.44 | % | (13,796,057 | ) | (9,277,188 | ) | 44.56 | % | (4,133,681 | ) | (3,803,113 | ) | 44.56 | % | (1,694,571 | ) | ||||||||||||||||||
| Edelnor S.A. | (19,779,365 | ) | 40.00 | % | (7,911,746 | ) | (9,096,431 | ) | 40.00 | % | (3,638,572 | ) | (10,711,550 | ) | 40.00 | % | (4,284,620 | ) | ||||||||||||||||||
| Edesur S.A. | 19,233,791 | 34.11 | % | 6,559,475 | 25,121,561 | 34.11 | % | 8,567,279 | (20,503,003 | ) | 34.11 | % | (6,991,928 | ) | ||||||||||||||||||||||
| Chilectra S.A. | 4,886,905 | 0.001 | % | 53 | — | — | — | — | — | — | ||||||||||||||||||||||||||
| Emgesa S.A. | (44,287,702 | ) | 51.52 | % | (22,815,651 | ) | (67,282,159 | ) | 76.55 | % | (51,502,407 | ) | (51,012,220 | ) | 73.13 | % | (46,295,004 | ) | ||||||||||||||||||
| Empresa Eléctrica Pangue S.A. | (21,247,201 | ) | 5.02 | % | (1,065,802 | ) | (41,830,532 | ) | 5.01 | % | (2,098,303 | ) | (34,138,191 | ) | 5.01 | % | (1,712,440 | ) | ||||||||||||||||||
| Endesa Chile | (121,304,086 | ) | 40.02 | % | (48,544,773 | ) | (203,567,376 | ) | 40.02 | % | (81,465,783 | ) | (192,439,270 | ) | 40.02 | % | (77,012,403 | ) | ||||||||||||||||||
| Endesa Argentina S.A. | 10,435,679 | 0.01 | % | 1,044 | 2,592,233 | 0.01 | % | 259 | (38,363,392 | ) | 0.01 | % | (3,836 | ) | ||||||||||||||||||||||
| Endesa Brasil S.A. | (34,853,976 | ) | 28.48 | % | (9,927,270 | ) | (99,049,397 | ) | 28.48 | % | (28,211,705 | ) | (109,050,767 | ) | 28.48 | % | (31,060,324 | ) | ||||||||||||||||||
| Endesa Cachoeira S.A. | (27,424,816 | ) | 0.39 | % | (108,086 | ) | (37,239,907 | ) | 0.39 | % | (146,770 | ) | (62,023,300 | ) | 0.39 | % | (244,446 | ) | ||||||||||||||||||
| Endesa Costanera S.A. | 11,866,291 | 35.74 | % | 4,240,409 | 6,644,735 | 35.74 | % | 2,374,489 | 11,134,854 | 30.23 | % | 3,366,613 | ||||||||||||||||||||||||
| Generandes Perú S.A. | (32,011,576 | ) | 40.37 | % | (12,922,760 | ) | (6,844,543 | ) | 40.37 | % | (2,763,074 | ) | (3,514,474 | ) | 40.37 | % | (1,418,759 | ) | ||||||||||||||||||
| Hidroeléctrica El Chocón S.A. | (2,833,523 | ) | 34.81 | % | (986,349 | ) | (14,840,727 | ) | 34.81 | % | (5,166,057 | ) | (8,814,829 | ) | 32.33 | % | (2,860,563 | ) | ||||||||||||||||||
| Hidroinvest S.A. | 131,228 | 30.07 | % | 39,461 | (7,174,042 | ) | 30.07 | % | (2,157,234 | ) | (20,907,848 | ) | 3.91 | % | (1,058,126 | ) | ||||||||||||||||||||
| Inversiones Distrilima S.A. | (12,001,368 | ) | 31.61 | % | (3,793,633 | ) | (5,209,454 | ) | 31.61 | % | (1,646,708 | ) | (6,366,811 | ) | 31.61 | % | (2,012,549 | ) | ||||||||||||||||||
| Investluz | (9,206,258 | ) | 13.68 | % | (1,259,115 | ) | — | — | — | — | — | — | ||||||||||||||||||||||||
| Inversiones Eléctricas Quillota S.A. | 11,028,656 | 50.00 | % | 5,514,328 | — | — | — | — | — | — | ||||||||||||||||||||||||||
| Pehuenche S.A. | (65,995,226 | ) | 7.35 | % | (4,850,649 | ) | (72,668,962 | ) | 7.35 | % | (5,341,169 | ) | (138,741,293 | ) | 7.35 | % | (10,197,485 | ) | ||||||||||||||||||
| Soc. Agrícola de Cameros Ltda. | 71,316 | 42.50 | % | 30,308 | 42,919 | 42.50 | % | 18,241 | 147,055 | 42.50 | % | 62,498 | ||||||||||||||||||||||||
| Túnel El Melón S.A. | 1,958,659 | 0.05 | % | 979 | (1,896,959 | ) | 0.05 | % | (948 | ) | — | — | — | |||||||||||||||||||||||
| Total | (185,879,944 | ) | (289,749,961 | ) | (259,605,529 | ) | ||||||||||||||||||||||||||||||
F - 85
Table of Contents
| Note 22. Shareholders’ Equity |
| (a) | Paid capital |
| (b) | Dividends |
| Dividend | Payment | Historical | Type of | |||||
| Number | Date | value ($) | dividend | |||||
| 73 | March 2006 | 1.000 | Final 2005 | |||||
| 74 | December 2006 | 1.110 | Interim 2006 | |||||
| 75 | May 2007 | 4.890 | Final 2006 | |||||
| 76 | December 2007 | 0.530 | Interim 2007 | |||||
| (c) | Number of shares |
| As of December 31, | ||||||||||||
| 2005 | 2006 | 2007 | ||||||||||
| Shares | Shares | Shares | ||||||||||
| Capital stock authorized | 32,651,166,465 | 32,651,166,465 | 32,651,166,465 | |||||||||
| (d) | Subscribed and paid in capital is as follows: |
| As of December 31, | ||||||||
| 2006 | 2007 | |||||||
| ThCh$ | ThCh$ | |||||||
| 2,594,015,458 | 2,594,015,458 | |||||||
| (e) | Other reserves |
| Initial balance | Final balance at | |||||||||||
| at January 1, | Reserve for | December 31, | ||||||||||
| 2007 | the period | 2007 | ||||||||||
| ThCh$ | ThCh$ | ThCh$ | ||||||||||
| Reserve for entities using remeasurement method | (34,751,311 | ) | (7,702,898 | ) | (42,454,209 | ) | ||||||
| Reserve for accumulated conversion differences | (227,169,859 | ) | (115,113,442 | ) | (342,283,301 | ) | ||||||
| Reserve for Technical Bulletin No. 72 (1) | 5,941,534 | (56,695,443 | ) | (50,753,909 | ) | |||||||
| Total | (255,979,636 | ) | (179,511,783 | ) | (435,491,419 | ) | ||||||
| (1) | Decrease in other reserves in 2007 due to the merger of the Colombian subsidiaries Emgesa S.A. and Betania S.A. (see Note 11(f) vi). | |
| In 2006, other reserves diminished owing to the corporate restructuring conducted by generation companies subject to common control in Colombia and Perú, which had a net effect of ThCh$ 3,844,972, offset by ThCh$ 3,019,541 (see Note 11 (g) iii-iv), offset by Th$ 3,019,591 resulting from the Chilectra S.A. merger. |
F - 86
Table of Contents
| Initial | Final | |||||||||||||||||||
| balance at | Reserve | Reserve for | Reserve for | balance at | ||||||||||||||||
| January 1, 2007 | for assets | liabilities | the period | December 31, 2007 | ||||||||||||||||
| ThCh$ | ThCh$ | ThCh$ | ThCh$ | ThCh$ | ||||||||||||||||
| Cumulative translation adjustment | (227,169,859 | ) | (214,590,405 | ) | 99,476,963 | (115,113,442 | ) | (342,283,301 | ) | |||||||||||
| Total | (227,169,859 | ) | (214,590,405 | ) | 99,476,963 | (115,113,442 | ) | (342,283,301 | ) | |||||||||||
| Initial | Final | |||||||||||||||||||
| balance at | Reserve | Reserve for | Reserve for | balance at | ||||||||||||||||
| January 1, 2006 | for assets | liabilities | the period | December 31, 2006 | ||||||||||||||||
| ThCh$ | ThCh$ | ThCh$ | ThCh$ | ThCh$ | ||||||||||||||||
| Cumulative translation adjustment | (243,029,396 | ) | 20,117,934 | (4,258,397 | ) | (15,859,537 | ) | (227,169,859 | ) | |||||||||||
| Total | (243,029,396 | ) | 20,117,934 | (4,258,397 | ) | (15,859,537 | ) | (227,169,859 | ) | |||||||||||
| As of December 31, | ||||||||
| 2006 | 2007 | |||||||
| ThCh$ | ThCh$ | |||||||
| Edesur S.A. | (38,958,027 | ) | (62,330,178 | ) | ||||
| Distrilec Inversora S.A. | (28,443,644 | ) | (39,343,811 | ) | ||||
| Inversiones Distrilima S.A. | (11,856,206 | ) | (16,458,393 | ) | ||||
| Cía. Peruana de Electricidad S.A. | (1,463,576 | ) | (2,856,029 | ) | ||||
| Ampla Energia e Servicios S.A. | (51,625,860 | ) | (63,417,051 | ) | ||||
| Ampla Investimentos e Servicios S.A. | 3,029,420 | 575,883 | ||||||
| Endesa Brasil S.A. | (21,009,568 | ) | (57,469,692 | ) | ||||
| Codensa S.A. | (42,000,881 | ) | (56,108,490 | ) | ||||
| Investluz S.A. | (6,723,652 | ) | (6,723,652 | ) | ||||
| Central Geradora Termelétrica Fortaleza S.A. | (6,901,247 | ) | (6,901,247 | ) | ||||
| Synapsis de Colombia S.A. | (1,035,087 | ) | (2,171,006 | ) | ||||
| Endesa Market Place, S.S. | 427,380 | 427,380 | ||||||
| Endesa Argentina S.A. | (2,945,926 | ) | (6,911,186 | ) | ||||
| Ingendesa Do Brasil Ltda. | (149,567 | ) | (249,213 | ) | ||||
| Endesa Costanera S.A. | (830,454 | ) | (1,686,422 | ) | ||||
| Cía. Eléctrica Cono Sur S.A. | (13,218,257 | ) | (17,361,846 | ) | ||||
| Emgesa S.A. E.S.P. | (24,799 | ) | (890,605 | ) | ||||
| Endesa Chile Internacional S.A. | (3,439,908 | ) | — | |||||
| Gasatacama S.A. | — | (173 | ) | |||||
| Electrogas S.A. | — | (284 | ) | |||||
| Inversiones Electrogas S.A. | — | (408,128 | ) | |||||
| Hidroeléctrica El Chocón S.A. | — | 107,804 | ||||||
| Hidroinvest S.A. | — | (1,684,495 | ) | |||||
| Southern Cone Power Arg. S.A. | — | (397,162 | ) | |||||
| Synapsis Argentina Ltda. | — | (25,305 | ) | |||||
| Total | (227,169,859 | ) | (342,283,301 | ) | ||||
F - 87
Table of Contents
| a. | The detail of other non-operating income is as follows: |
| Year ended December 31, | ||||||||||||
| 2005 | 2006 | 2007 | ||||||||||
| ThCh$ | ThCh$ | ThCh$ | ||||||||||
| Gain on sale of property, plant and equipment and materials | 10,438,340 | 25,273,662 | 3,304,230 | |||||||||
| Gain on investments sales | — | — | 3,077,984 | |||||||||
| Received compensations | 5,014,788 | — | — | |||||||||
| Services — projects and inspections | 2,015,215 | 541,928 | 212,788 | |||||||||
| Penalties charged to contractors and suppliers | 3,380,790 | 3,356,397 | 4,465,481 | |||||||||
| CDEC-SING power settlement gain | 8,264,845 | 9,708,919 | 6,884,768 | |||||||||
| Cost recoveries | 3,722,310 | 5,328,007 | 9,156,815 | |||||||||
| Reversal of contingencies provision and other provisions | 7,268,160 | 32,109,418 | 77,084,233 | |||||||||
| Index UFIR Brazilian subsidiaries | — | 5,796,233 | 8,190,229 | |||||||||
| Effect of application of BT 64 | 21,911,220 | 12,558,699 | 39,426,083 | |||||||||
| Cemsa contract liquidation | — | — | 8,144,524 | |||||||||
| Edesur’s tariff adjustment (1) | — | — | 27,804,434 | |||||||||
| Indemnities and commissions | 1,289,950 | 9,568,701 | 2,627,468 | |||||||||
| Dividend from investees | 2,433,119 | 990,303 | 1,368,495 | |||||||||
| Other | 7,548,212 | 8,441,211 | 7,579,965 | |||||||||
| Total | 73,286,949 | 113,673,478 | 199,327,497 | |||||||||
| (1) | See Note 5 (1) |
F - 88
Table of Contents
Notes to the Consolidated Financial Statements — (Continued)
| b. | Other non-operating expenses are as follows: |
| Year ended December 31, | ||||||||||||
| 2005 | 2006 | 2007 | ||||||||||
| ThCh$ | ThCh$ | ThCh$ | ||||||||||
| Loss on sale of fixed assets and materials | (7,764,875 | ) | (1,999,747 | ) | (1,172,300 | ) | ||||||
| Obsolescence provision and write-off of fixed assets | (11,989,569 | ) | (13,788,047 | ) | (7,330,758 | ) | ||||||
| Effect of application of BT 64 (1) | (49,182,176 | ) | (50,645,523 | ) | (192,035,740 | ) | ||||||
| Contingencies and litigation | (38,782,998 | ) | (36,791,894 | ) | (60,680,663 | ) | ||||||
| SIC power settlement loss | (9,334,646 | ) | (11,300,155 | ) | (8,505,833 | ) | ||||||
| Pension plan expense | (3,519,305 | ) | (4,630,499 | ) | (6,375,473 | ) | ||||||
| Index UFIR Brazilian subsidiaries | (3,400,489 | ) | (3,504,739 | ) | (2,225,761 | ) | ||||||
| Penalties and fines | (8,192,358 | ) | (22,556,529 | ) | (17,556,721 | ) | ||||||
| Other taxes Colombia | (7,326,590 | ) | (5,318,897 | ) | (23,894,975 | ) | ||||||
| Other taxes Argentina and Brazil | (11,181,753 | ) | (9,845,648 | ) | (9,202,124 | ) | ||||||
| Other taxes Peru | (1,091,773 | ) | (3,452,989 | ) | (1,010,684 | ) | ||||||
| Energy efficiency Brazilian subsidiaries | — | (13,151,051 | ) | (1,231,974 | ) | |||||||
| Write-off of Copel and other contracts (Brazil) | — | (32,776,508 | ) | — | ||||||||
| Other | (15,790,934 | ) | (15,000,424 | ) | (17,493,124 | ) | ||||||
| Total | (173,337,268 | ) | (224,762,650 | ) | (348,716,130 | ) | ||||||
| (1) | These amounts correspond to the net adjustments related to the translation of financial statements of foreign affiliates from the respective local country currency to US Dollars. |
F - 89
Table of Contents
Notes to the Consolidated Financial Statements — (Continued)
| Year ended December 31, | ||||||||||||||||
| Index | 2005 | 2006 | 2007 | |||||||||||||
| ThCh$ | ThCh$ | ThCh$ | ||||||||||||||
Assets | ||||||||||||||||
| Inventory | I.P.C. | 2,687,219 | 2,566,657 | 4,977,957 | ||||||||||||
| Current assets | I.P.C. | 11,547,225 | 9,786,684 | 14,991,941 | ||||||||||||
| U.F. | 485,461 | 498,012 | 180,547 | |||||||||||||
| Property, plant and equipment | I.P.C. | 89,972,923 | 51,988,282 | 186,012,200 | ||||||||||||
| Accounts receivable from subsidiaries | I.P.C. | 4,149,796 | 1,960,997 | 4,986,582 | ||||||||||||
| Investment in subsidiaries | I.P.C. | 7,558,264 | 2,230,396 | 8,529,791 | ||||||||||||
| Amortization of goodwill | I.P.C. | 26,577,117 | 14,912,576 | 44,564,484 | ||||||||||||
| Other assets | I.P.C. | 129,043,050 | 57,653,769 | 205,424,618 | ||||||||||||
| U.F. | 6,777,916 | 5,130,963 | 16,160,075 | |||||||||||||
| Price-level restatement of the income statement | I.P.C. | 1,455,413 | 11,625,079 | 73,361,895 | ||||||||||||
| Net credits — assets | 280,254,384 | 158,353,415 | 559,190,090 | |||||||||||||
Liabilities and Shareholders’ equity | ||||||||||||||||
| Shareholders equity | I.P.C. | (100,474,054 | ) | (57,748,451 | ) | (201,482,240 | ) | |||||||||
| Current and long-term liabilities | I.P.C. | (109,615,299 | ) | (46,017,162 | ) | (161,207,878 | ) | |||||||||
| U.F. | (39,960,139 | ) | (21,916,955 | ) | (58,703,888 | ) | ||||||||||
| Minority interest | I.P.C. | (24,526,720 | ) | (14,425,570 | ) | (51,133,776 | ) | |||||||||
| Accounts payable to subsidiaries | I.P.C. | (900,903 | ) | (369,663 | ) | (1,363,468 | ) | |||||||||
| Non-monetary liabilities | U.F. | (72,387 | ) | — | — | |||||||||||
| Price-level restatement of the income statement | I.P.C. | (10,127,324 | ) | (16,568,770 | ) | (96,102,412 | ) | |||||||||
| Net charge-liabilities and shareholders’ equity accounts | (285,676,826 | ) | (157,046,571 | ) | (569,993,662 | ) | ||||||||||
Net credits (charge) to income | (5,422,442 | ) | 1,306,844 | (10,803,572 | ) | |||||||||||
F - 90
Table of Contents
Notes to the Consolidated Financial Statements — (Continued)
| Year ended December, 31 | ||||||||||||||||
| Currency | 2005 | 2006 | 2007 | |||||||||||||
| ThCh$ | ThCh$ | ThCh$ | ||||||||||||||
Assets | ||||||||||||||||
| Cash | US$ | 2,217,126 | 458,360 | 79,481 | ||||||||||||
| Other | (252,114 | ) | (2,767 | ) | (49,732 | ) | ||||||||||
| Time deposits | US$ | (1,032,316 | ) | 78,362 | (5,492 | ) | ||||||||||
| Marketable securities | US$ | (24,199 | ) | 74,670 | (14,913 | ) | ||||||||||
| Other | — | 12,457 | (277,529 | ) | ||||||||||||
| Accounts receivable, net | US$ | (804,992 | ) | 270,592 | (2,101,944 | ) | ||||||||||
| Other | (24,054 | ) | (9,730 | ) | — | |||||||||||
| Prepaid expenses | US$ | — | 616 | — | ||||||||||||
| Other current assets | US$ | (7,125,945 | ) | 267,803 | (2,208,995 | ) | ||||||||||
| Other | (24,631 | ) | (2,655 | ) | (881 | ) | ||||||||||
| Amounts due from related companies | US$ | (168,015 | ) | 1,801,168 | (16,214,178 | ) | ||||||||||
Non-current assets | ||||||||||||||||
| Long-term receivables | US$ | (3,073,885 | ) | 6,682,910 | 10,472,598 | |||||||||||
| Amounts due from related companies | US$ | (13,380,594 | ) | — | — | |||||||||||
| Other assets | US$ | (25,328,078 | ) | 224,869 | — | |||||||||||
| Forward contracts and swaps | US$ | — | 23,660 | (4,697,085 | ) | |||||||||||
Total gain (loss) | (49,021,697 | ) | 9,880,315 | (15,018,670 | ) | |||||||||||
Liabilities | ||||||||||||||||
| Short-term debt due to banks and financial institutions | US$ | 5,446 | (25,040 | ) | 99,722 | |||||||||||
| Current portion of long-term debt due to banks and financial institutions | US$ | (3,486,004 | ) | 21,580 | 1,480,231 | |||||||||||
| Yen | (55,078 | ) | — | — | ||||||||||||
| Other | (33,210 | ) | — | — | ||||||||||||
| Current portion of bonds payable | Euro | 1,358 | — | — | ||||||||||||
| Current portion of bonds payable | US$ | 10,685,875 | (1,895,142 | ) | 1,999,966 | |||||||||||
| Current portion of notes payable | US$ | (535,298 | ) | — | — | |||||||||||
| Accounts payable | US$ | (2,015,036 | ) | (204,866 | ) | 634,672 | ||||||||||
| Other | 129 | 1,989 | (12,747 | ) | ||||||||||||
| Dividends payable | US$ | — | — | (347,933 | ) | |||||||||||
| Other | 24,999 | |||||||||||||||
| Miscellaneous payables | US$ | (10,754 | ) | (170,399 | ) | 856,623 | ||||||||||
| Accrued expenses | US$ | 22,042 | (5,829 | ) | — | |||||||||||
| Other | 17,414 | — | — | |||||||||||||
| Deferred income | US$ | 1,356,515 | (588,811 | ) | (188 | ) | ||||||||||
| Other current liabilities | US$ | 3,693 | (11,824 | ) | (6,549 | ) | ||||||||||
| Dividends payable | US$ | — | — | — | ||||||||||||
| Amounts due to related companies | US$ | 57 | — | — | ||||||||||||
Long-term liabilities | ||||||||||||||||
| Due to banks and financial institutions | US$ | 16,858,508 | 344,702 | 11,865,032 | ||||||||||||
| Yen | 70,636 | — | — | |||||||||||||
| Euro | 5,789 | — | — | |||||||||||||
| Notes payable | Other | 45,214 | — | — | ||||||||||||
| Bonds payable | US$ | 20,810,444 | (1,114,871 | ) | 2,676,818 | |||||||||||
| Accounts payable | US$ | 3,361,878 | — | 1,556,418 | ||||||||||||
| Other long-term liabilities | US$ | (255,957 | ) | (510,057 | ) | 978,085 | ||||||||||
| Forward | US$ | (4,676,597 | ) | — | — | |||||||||||
Total gain (loss) | 42,177,064 | (4,158,568 | ) | 21,805,149 | ||||||||||||
Exchange difference | (6,844,633 | ) | 5,721,747 | 6,786,479 | ||||||||||||
| As of December 31 | ||||||||
| 2006 | 2007 | |||||||
| ThCh$ | ThCh$ | |||||||
| Bank commissions | 537,063 | — | ||||||
| Total | 537,063 | — | ||||||
F - 91
Table of Contents
Notes to the Consolidated Financial Statements — (Continued)
| (a) | Other disbursements for financing: |
| As of December 31 | ||||||||||||
| 2005 | 2006 | 2007 | ||||||||||
| ThCh$ | ThCh$ | ThCh$ | ||||||||||
| Commissions on debt refinancing | — | (636,449 | ) | — | ||||||||
| Forward contract payments | (17,839,280 | ) | (6,628,444 | ) | (576,888 | ) | ||||||
| Reimbursable contributions | (1,154,451 | ) | (508,124 | ) | (787,571 | ) | ||||||
| Others | (16,455 | ) | (49,625 | ) | (16,338 | ) | ||||||
| Total | (19,010,186 | ) | (7,822,642 | ) | (1,380,797 | ) | ||||||
| (b) | Other receipts from investments: |
| As of December 31 | ||||||||||||
| 2005 | 2006 | 2007 | ||||||||||
| ThCh$ | ThCh$ | ThCh$ | ||||||||||
| Receipts from loans granted to former subsidiary | 2,262,691 | 583,012 | — | |||||||||
| Margin call premiums | — | 435,556 | — | |||||||||
| Capital reduction in Compañía Eléctrica de Bogotá S.A. | 5,515,992 | 490,175 | — | |||||||||
| Sale of participation in Gas Atacama to Southern Cross (1) | — | — | 43,172,429 | |||||||||
| Others | — | 545,163 | 930,568 | |||||||||
| Total | 7,778,683 | 2,053,906 | 44,102,997 | |||||||||
| (c) | Other investment disbursements: |
| As of December 31 | ||||||||||||
| 2005 | 2006 | 2007 | ||||||||||
| ThCh$ | ThCh$ | ThCh$ | ||||||||||
| Payments associated with derivative contracts | — | (11,642,495 | ) | — | ||||||||
| Payment Deutsche Bank Margin Call | — | — | (22,368,439 | ) | ||||||||
| Intangible assets | (3,136,265 | ) | (1,285,594 | ) | (1,245,930 | ) | ||||||
| Purchase of participation in Gas Atacama from CMS (1) | — | — | (43,342,838 | ) | ||||||||
| License software | — | — | (2,771,517 | ) | ||||||||
| Other | — | (544,248 | ) | (2,631,300 | ) | |||||||
| Total | (3,136,265 | ) | (13,472,337 | ) | (72,360,024 | ) | ||||||
| (1) | On June 30, 2007, Endesa Chile notified CMS Enterprises Company (the entity controlling 50% of Inversiones Gas Atacama Holding and subsidiaries) of its decision to exercise its right of first offer to purchase the interest held by CMS Enterprises Company in Inversiones Gas Atacama Holding for US$ 80 million. Included in this amount was the purchase of a sponser loan that CMS had grants to Inversiones Gas Atacama Holding and its subsidiaries. |
| On the same date, Endesa Chile and Southern Cross Latin America Private Equity Fund III L.P. (“Southern Cross”) subscribed a sale and purchase agreement for 50% of Endesa Chile’s participation in Inversiones Gas Atacama Holding S.A. and its subsidiaries and in its sponsor loans to Southern Cross for the amount of US$ 80 million. | ||
| Endesa Chile, by exercising its right of first offer to purchase from CMS and selling this participation on the same date and in a linked transaction to Southern Cross acted as an agent and thus did not record any gains or losses related to the sale and purchase of the participation. |
F - 92
Table of Contents
Notes to the Consolidated Financial Statements — (Continued)
| Description of contracts | ||||||||||||||||||||||||||||||||||||
| Purchase | Amount | Accounts | ||||||||||||||||||||||||||||||||||
| Type | Type | Nominal | Date of | sale | Hedged | Assets / Liabilities | Income | |||||||||||||||||||||||||||||
| Derivative | Contract | Amount | Maturity | Item | position | Hedged Item | Amount | item | Account | Amount | Realized | Unrealized | ||||||||||||||||||||||||
| US$ | ThCh$ | ThCh$ | ThCh$ | ThCh$ | ThCh$ | |||||||||||||||||||||||||||||||
| S | CCTE | 15,000,000 | III quarter 11 | Interest rate | P | Bank obligations | 7,453,350 | 7,453,350 | Other assets l/t | 64,067 | — | (1,450 | ) | |||||||||||||||||||||||
| S | CCTE | 84,100,000 | IV quarter 12 | Interest rate | P | Bank obligations | 41,788,449 | 41,788,449 | Other liabilities l/t | (715,522 | ) | 278,258 | (715,522 | ) | ||||||||||||||||||||||
| S | CCTE | 27,810,797 | II quarter 14 | Interest rate | P | Bonds | 13,818,907 | 14,264,980 | Other assets l/t | 646,954 | 415,276 | 7,566 | ||||||||||||||||||||||||
| S | CCTE | 19,615,085 | IV quarter 15 | Interest rate | P | Bank obligations | 9,746,540 | 9,746,540 | Other liabilities s/t | (462,433 | ) | — | (462,433 | ) | ||||||||||||||||||||||
| S | CCTE | 13,313,609 | II quarter 08 | Exchange rate | P | Bank obligations | 6,615,399 | 6,615,399 | Other liabilities s/t | (1,520,230 | ) | — | (1,520,230 | ) | ||||||||||||||||||||||
| S | CCTE | 45,502,728 | III quarter 08 | Exchange rate | P | Bank obligations | 22,609,851 | 22,609,851 | Other liabilities s/t | (3,212,183 | ) | — | (3,212,183 | ) | ||||||||||||||||||||||
| S | CCTE | 125,000,000 | III quarter 08 | Exchange rate | P | Bonds | 62,111,250 | 62,111,250 | Other liabilities s/t | (3,877,756 | ) | (119,440 | ) | (4,645,735 | ) | |||||||||||||||||||||
| S | CCTE | 1,062,000 | IV quarter 08 | Exchange rate | P | Bank obligations | 527,697 | 527,697 | Other liabilities s/t | (626,901 | ) | — | (626,901 | ) | ||||||||||||||||||||||
| S | CCTE | 41,666,667 | II quarter 12 | Exchange rate | P | Bank obligations | 20,703,750 | 20,703,750 | Other liabilities l/t | (8,856,504 | ) | — | (8,856,504 | ) | ||||||||||||||||||||||
| S | CCTE | 350,000,000 | I quarter 14 | Exchange rate | P | Bonds | 173,911,500 | 173,911,500 | Other liabilities l/t | (105,889,080 | ) | (1,345,816 | ) | (228,878 | ) | |||||||||||||||||||||
| S | CCTE | 22,398,035 | IV quarter 15 | Exchange rate | P | Bank obligations | 11,129,360 | 11,129,360 | Other liabilities s/t | (3,100,150 | ) | — | (3,100,150 | ) | ||||||||||||||||||||||
| S | CCTE | 250,000,000 | IV quarter 16 | Exchange rate | P | Bonds | 124,222,500 | 124,222,500 | Other liabilities l/t | (86,963,364 | ) | (1,870,943 | ) | (1,845,129 | ) | |||||||||||||||||||||
| OE | CCTE | 100,000,000 | IV quarter 08 | Interest rate | P | Bank obligations | 49,689,000 | 49,689,000 | Other liabilities s/t | (109,386 | ) | — | — | |||||||||||||||||||||||
| OE | CCTE | 50,000,000 | IV quarter 09 | Interest rate | P | Bank obligations | 24,844,500 | 24,844,500 | Other liabilities s/t | (279,191 | ) | — | — | |||||||||||||||||||||||
| OE | CCTE | 40,000,000 | III quarter 10 | Interest rate | P/S | Bank obligations | 19,875,600 | 19,875,600 | Other liab.l/t-Other assets l/t | (410,586 | ) | — | — | |||||||||||||||||||||||
| OE | CCTE | 60,000,000 | III quarter 09 | Interest rate | P/S | Bank obligations | 29,813,400 | 29,813,400 | Other liab.l/t-Other assets l/t | (279,291 | ) | — | — | |||||||||||||||||||||||
| FR | CCTE | 24,000,000 | III quarter 07 | Exchange rate | P | Bank obligations | — | — | Other liabilities s/t | — | (262,700 | ) | — | |||||||||||||||||||||||
F - 93
Table of Contents
Notes to the Consolidated Financial Statements — (Continued)
| Committed assets | Balance payable of related debt | Release of | ||||||||||||||||||||||||
| Type | Book value | at December 31. | guarantees | |||||||||||||||||||||||
| Guarantee | Subsidiary | guarantee | Type | Currency | of collateral | Currency | 2007 | 2006 | 2008 | |||||||||||||||||
| Creditors banks | Pangue S.A. | Mortgage and pledge | Real estate, properties | ThCh$ | 97,970,495 | ThCh$ | 2,267,573 | 4,729,610 | — | |||||||||||||||||
| Sociedad de Energía de la República Argentina | Endesa Argentina - Endesa Costanera S.A. | Pledge | Shares | ThCh$ | 61,957,977 | ThCh$ | 6,981,239 | 9,779,802 | — | |||||||||||||||||
| Mitsubishi | Endesa Costanera S.A. | Pledge | Combined cycle | ThCh$ | 75,093,649 | ThCh$ | 34,039,097 | 32,359,706 | — | |||||||||||||||||
| Credit Suisse First Boston | Endesa Costanera S.A. | Pledge | Combined cycle | ThCh$ | 26,627,410 | ThCh$ | 19,875,600 | 22,871,474 | — | |||||||||||||||||
| Other creditors | Endesa Chile | Bank bond | ThCh$ | — | ThCh$ | 3,024,438 | 6,025,483 | — | ||||||||||||||||||
| Other creditors | Edegel S.A. | Pledge | Real estate, properties | ThCh$ | 121,287,624 | ThCh$ | 52,634,012 | 90,536,732 | — | |||||||||||||||||
| Deutsche Bank | Enersis S.A. | Deposits accounts | Deposits accounts | ThCh$ | 25,291,701 | ThCh$ | 52,542,585 | 42,332,013 | — | |||||||||||||||||
| Other creditors | Ampla S.A. | Pledge over collections and others | ThCh$ | 25,711,300 | ThCh$ | 134,723,938 | 26,284,050 | — | ||||||||||||||||||
| Other creditors | Coelce S.A. | Pledge over collections and others | ThCh$ | 6,420,434 | ThCh$ | 60,995,368 | 84,079,749 | — | ||||||||||||||||||
| International Finance Corporation | CGT Fortaleza S.A. | Mortgage and pledge | Real estate, properties | ThCh$ | 231,150,771 | ThCh$ | 56,637,549 | 70,068,426 | — | |||||||||||||||||
| Bndes | Cachoeira Dourada S.A. | Pledge | ThCh$ | 785,764 | ThCh$ | 617,150 | 3,877,832 | — | ||||||||||||||||||
| Committed assets | Balance payable of related debt | |||||||||||||||||||||||||||||||||||
| Type | Book value | as of December 31. | Release of guarantees | |||||||||||||||||||||||||||||||||
| Guarantee | Subsidiary | guarantee | Type | of collateral | Currency | 2007 | 2006 | 2007 | 2008 | 2009 | 2010 | |||||||||||||||||||||||||
2nd civil court of Quillota | Cía. Eléctrica San Isidro | Guarantees | ThCh$ | 10,000 | ThCh$ | 10,000 | 10,740 | — | 10,000 | — | — | |||||||||||||||||||||||||
| Vestas Eólicas S.A.U. | Endesa Eco S.A. | Guarantees | ThCh$ | 7,468,361 | ThCh$ | 7,468,361 | 7,704,323 | — | 7,468,361 | — | — | |||||||||||||||||||||||||
| Banco Español de Crédito | Cía. Eléctrica Tarapacá S.A. | Guarantees | ThCh$ | 2,047,648 | ThCh$ | 2,047,648 | 7,068,876 | — | 2,047,648 | — | — | |||||||||||||||||||||||||
| Cédulas de crédito bancario | Cien | Guarantees | ThCh$ | 168,313,537 | ThCh$ | 168,313,537 | 160,463,977 | — | — | — | — | |||||||||||||||||||||||||
| (1) | Unless otherwise stated, the guarantees in the table “Guarantees of Subsidiary Obligations” were provided by a subsidiary of the Company (the “Guarantor”) to a third party creditor that had entered into a new obligation with another subsidiary (the “Subsidiary Debtor”). If the Subsidiary Debtor is unable to meet the requirements of the related obligation, the Guarantor will be required to make future payments on behalf of the Subsidiary Debtor up to the remaining amount payable. |
F - 94
Table of Contents
| a. | Litigation and other legal actions |
| Plaintiff | : | Enersis S.A., Chilectra S.A., Empresa Nacional de Electricidad S.A. | ||
| Defendant | : | The Republic of Argentina | ||
| Court | : | CIADI Arbitration Panel | ||
| Case/Identification | : | (CIADI Case ARB/03/21) |
F - 95
Table of Contents
| Plaintiff | : | Omaira Cely Vargas and Rosa Elvira Viracachá Tunarosa, through lawyer Martha Teresa Briceño de Valencia | ||
| Demanded | : | Cámara de Comercio de Bogotá, Mr. Alvaro Pérez (liquidator of Luz de Bogotá), Endesa Internacional S.A., Enersis S.A., Agencia Islas Cayman, Chilectra S.A., Agencia Islas Caymán y Enersis Internacional (shareholders of Luz de Bogotá) | ||
| Tribunal | : | Third Civil Court of Bogota Circuit | ||
| Case/Identification | : | Case file No. 2006-0315 |
F - 96
Table of Contents
Plaintiff | : | Internal Revenue Service | ||
Defendant | : | Enersis S.A. | ||
Court | : | Tax Court | ||
Case/Identification | : | 10.825-07RR |
| Plaintiff | : | Enersis S.A., Elesur S.A. (now Chilectra S.A.), Empresa Nacional de Electricidad S.A. | ||
| Defendant | : | The Republic of Argentina | ||
| Court | : | CIADI Arbitration Panel | ||
| Case/Identification | : | CIADI Case ARB/03/21 |
F - 97
Table of Contents
F - 98
Table of Contents
| Plaintiff | : | Gladys Calderón Rojas | ||
| Defendant | : | Chilectra S.A. | ||
| Court | : | 19th Civil Court of Santiago | ||
| Case/Identification | : | Case No. 5540-2000 |
| Plaintiff | : | Municipality of Pedro Aguirre Cerda | ||
| Defendant | : | Chilectra S.A. | ||
| Court | : | 1st Civil Court of San Miguel. | ||
| Case/Identification | : | 15.050-2006. |
F - 99
Table of Contents
| Plaintiff | : | Rosendo Andrés Contesso Beltra and María Elena Concha Camaño | ||
| Defendant | : | Chilectra S.A. | ||
| Court | : | 4th Civil Court of Santiago. | ||
| Case/Identification | : | 2571-2007. |
| Plaintiff | : | Siderúrgica AZA S.A. | ||
| Defendant | : | Chilectra S.A. | ||
| Court | : | Arbitrator Ramón Cifuentes Ovalle. | ||
| Case/Identification | : | N/A |
| Plaintiff | : | Asociación Coordinadora de Usuarios Consumidores y Contribuyentes — Ente Nacional Regulador de la Electricidad (ENRE). | ||
| Defendant | : | Edesur S.A. | ||
| Court | : | N°2 Federal Civil and Commercial First Instance Court, Registry of the Court N° 6, La Plata | ||
| Case/Identification | : | 38676/03 |
F - 100
Table of Contents
| Plaintiff | : | Users affected by a mass power outage in Buenos Aires | ||
| Defendant | : | Edesur S.A. | ||
| Court | : | Courts and Civil and Commercial Courts of the Federal Capital of Buenos Aires | ||
| Case/Identification | : | (Various processes) |
| Plaintiff | : | Edesur S.A. | ||
| Defendant | : | Transportes Metropolitanos Gral. Roca. | ||
| Court | : | First Instance National Commercial Court, Registry of the Court N° 1 | ||
| Case/Identification | : | 87934/03 |
| Plaintiff | : | Users and Consumers Union. | ||
| Defendant | : | Edesur S.A. | ||
| Court | : | N° 11 Federal Administrative First Instance National Court, Registry of the Court N° 21. | ||
| Case/Identification | : | 142321/02 |
| Plaintiff | : | Edesur S.A. | ||
| Defendant | : | National State (Ministry of Economy) | ||
| Court | : | N° 3 Federal Administrative First Instance National Court, Registry of the Court N° 5. | ||
| Case/Identification | : | 1856/97 |
F - 101
Table of Contents
| Plaintiff | : | Edesur S.A. | ||
| Defendant | : | Municipality of Berazategui | ||
| Court | : | N° 2 Federal Administrative First Instance Court for Civil, Commercial and Administrative Trials, Registry of the Court N° 5. in La Plata | ||
| Case/Identification | : | 11,859/05 |
| Plaintiff | : | Edesur S.A. | ||
| Defendant | : | Municipalidad de Berazategui. | ||
| Court | : | N° 2 Federal Civil, Commercial and Administrative First Instance National Court, Registry of the Court N° 5, La Plata. | ||
| Case/Identification | : | 11.893/05 |
| Plaintiff | : | Edesur S.A. | ||
| Defendant | : | Government of the Town of Buenos Aires (GCBA) | ||
| Court | : | N° 8 Administrative and Tax Court of the City of Buenos Aires, Registry of the Court N° 15 | ||
| Case/Identification | : | 25442/07 |
F - 102
Table of Contents
| Plaintiff | : | Consumidores del Sur Asociación Civil sin fines de lucro | ||
| Defendant | : | The State and Edesur S.A. | ||
| Court | : | N° 5 Administrative and Tax Court of the City of Buenos Aires, Registry of the Court N° 9 | ||
| Case/Identification | : | 8803/07 |
| Plaintiff | : | Edesur S.A. | ||
| Defendant | : | Buenos Aires City Government (“GCBA”) | ||
| Court | : | N° 7 Administrative and Tax Court of Buenos Aires City, Registry of the Court N° 13 | ||
| Case/Identification | : | 2955/00 — 6262/99 |
| Plaintiff | : | Edesur S.A. | ||
| Defendant | : | Buenos Aires City Government (GCBA) | ||
| Court | : | N° 7 Administrative and Tax Court of the City of Buenos Aires, Registry of the Court N° 13. | ||
| Case/Identification | : | 2956/01 |
F - 103
Table of Contents
| Plaintiff | : | Meridional S/A Servicios, Emprendimientos y Participaciones | ||
| Defendant | : | Ampla | ||
| Court | : | 9th Chamber of Rio de Janeiro Public Finance | ||
| Case/Identification | : | 98.001.048296-8 |
| Plaintiff | : | Enertrade — Comercializadora de Energía S.A | ||
| Defendant | : | Ampla | ||
| Court | : | Getulio Vargas Foundation Chamber for Conciliation and Arbitration | ||
| Case/Identification | : | Arbitration procedure No. 03/2005 |
F - 104
Table of Contents
| Plaintiff | : | Ampla | ||
| Defendant | : | Enertrade — Comercializadora de Energía S.A | ||
| Court | : | Getulio Vargas Foundation Chamber for Conciliation and Arbitration | ||
| Case/Identification | : | Arbitration procedure No. 04/2006 |
| Plaintiff | : | Cibrapel S/A Industria de Papel y Embalajes | ||
| Defendant | : | Ampla | ||
| Court | : | Single Chamber of Guapimirim County | ||
| Case/Identification | : | 1998.073.000018-6 |
F - 105
Table of Contents
| Plaintiff | : | Qualita’s Tecnología y Servicios Ltda and Symon de Souza Coury | ||
| Defendant | : | Ampla | ||
| Court | : | 4th Civil Court of Niteroi County | ||
| Case/Identification | : | 2005.002.024695-9 |
| Plaintiff | : | Electrovidro S.A | ||
| Defendant | : | Ampla | ||
| Court | : | 8th Tax Court of the County of Río de Janeiro | ||
| Case/Identification | : | 1995.001.065045-7 |
| Plaintiff | : | Municipality of Teresópolis | ||
| Defendant | : | Ampla | ||
| Court | : | 11th Tax Court | ||
| Case/Identification | : | 2002.001.080661-4 |
F - 106
Table of Contents
| Plaintiff | : | Compañía Brasileña de Antibióticos — CIBRAN. | ||
| Defendant | : | Ampla | ||
| Court | : | 1st Civil Court of the County of Itaboraí and 13th Civil Court of the State of Río de Janeiro. | ||
| Case/Identification | : | Action to Annul Debit No. 2001.023.000549-6 and Civil Appeal No. 2005.001.26130. |
| Plaintiff | : | Brazilian Consumer Defense Association (ADCON) | ||
| Defendant | : | Ampla | ||
| Court | : | 8th Business chamber of the County of Brasilia | ||
| Case/Identification | : | 2004.001.017223-0 |
| Plaintiff: | : | Consumer Defence Commission of the Legislative Assembly of the State of Rio de Janeiro | ||
| Defendant | : | Ampla | ||
| Court | : | 7th Business chamber of the State of Rio de Janeiro | ||
| Case/Identification | : | 2005.001.084370-8 |
F - 107
Table of Contents
| Plaintiff | : | State Attorney General’s Office | ||
| Defendant | : | Ampla | ||
| Court | : | 2nd Civil Chamber of Town of Saint Gonzalo | ||
| Case/Identification | : | 2003.004.034117-9 |
| Plaintiff | : | Town of Itaborai | ||
| Defendant | : | Ampla | ||
| Court | : | 2nd Civil Chamber of County of Itaborai | ||
| Case/Identification | : | 2003.023.041682-7 |
F - 108
Table of Contents
| Plaintiff | : | Macao Consumer and Worker Defense Association — AMADECONT | ||
| Defendant | : | Ampla | ||
| Court | : | Single Chamber of the County of Río das Ostras | ||
| Case/Identification | : | 2004.068.001287-1 |
| Plaintiff | : | General Attorney’s Office of the State of Rio do Janeiro | ||
| Defendant | : | Ampla and Municipality of Paraty | ||
| Court | : | Single Court of Paraty County | ||
| Case/Identification | : | 2005.041.001008-9 |
| Plaintiff | : | Municipality of Paraty | ||
| Defendant | : | Ampla | ||
| Court | : | Single Court of Paraty County | ||
| Case/Identification | : | 2005.041.001124-0 |
F - 109
Table of Contents
| Plaintiff | : | ASOBRAEE — Brazilian Association of Consumers of Water and Electricity | ||
| Defendant | : | Ampla | ||
| Court | : | 5th Civil Court of Niteroi County | ||
| Case/Identification | : | 2006.002.002621-4 |
| Plaintiff | : | Union of Workers in the Niterói Electrical Energy Industry representing a class action suit by 2841 employees | ||
| Defendant | : | Ampla | ||
| Court | : | Niterói Work Chamber | ||
| Case/Identification | : | Labour Complaint 884/1989 |
| Plaintiff | : | Selma de Souza and 122 other plaintiffs | ||
| Defendant | : | Ampla | ||
| Court | : | 2nd Employment Chamber of Niterói | ||
| ID Number | : | Work Complaint No.3142/1995 |
F - 110
Table of Contents
| Plaintiff | : | Secretary of Federal Collection Tax (SRF) (Brazilian IRS) | ||
| Defendant | : | Ampla | ||
| Court | : | Commissariat of the Niterói Federal Collection Tax | ||
| ID Number | : | Infraction Proceeding 0710200/00112/05 and Administrative Trial 10730.003110/2005-55 (d.38) |
| Plaintiff | : | Unión Federal | ||
| Defendant | : | Ampla |
| Plaintiff | : | Secretaria de Receita Federal (SRF) (Brazilian IRS) | ||
| Defendant | : | Ampla |
F - 111
Table of Contents
| Plaintiff | : | Ampla | ||
| Defendant | : | State of Rio de Janeiro | ||
| Court | : | Superior Court of Justice — STJ | ||
| Case/Identification | : | Trial No.2002.001.110494-9 (d.46) |
| Plaintiff | : | Ampla | ||
| Defendant | : | Federal Union | ||
| Court | : | 4th Federal Chamber of Niterói and 4th Group of the TRF of the 2nd Region | ||
| Case/Identification | : | Ordinary Action No.96.0035387-5 and Civil Appeal No.1999.02.01.047064-8 (d.4) |
| Plaintiff | : | Ampla | ||
| Defendant | : | Unión Federal | ||
| Court | : | 2nd Federal Court of Niterói. | ||
| Case/Identification | : | Ordinary Proceeding 96.0035652-1 and Civil Appeal 98.02.09149-9. (d.3) |
F - 112
Table of Contents
| Plaintiff | : | Inácio Nunes Arruda & Others. | ||
| Defendant | : | Coelce. | ||
| Court | : | 2nd Court of Public Finance — Ceará | ||
| Case/Identification | : | 2000.0122.6248-0/0 |
| Plaintiff | : | Libra — Ligas Do Brasil S/A. | ||
| Defendant | : | Coelce. | ||
| Court | : | Court of Ceara State, in Brazil | ||
| Case/Identification | : | 2000.0013.4212-7 (Court of appeals) — 1997.02.22643-0 (lower court) |
F - 113
Table of Contents
| Plaintiff | : | Sindicato da Indústria de Fiação e Tecelagem | ||
| Defendant | : | Coelce | ||
| Court | : | 1st Federal Court of Ceará. | ||
| Case/Identification | : | 2003.81.00.014020-7 |
| Plaintiff | : | Bar of Lawyers of Brazil and Others | ||
| Defendant | : | Coelce. | ||
| Court | : | Supreme Court of Justice | ||
| Case/Identification | : | None |
| Plaintiff | : | State Deputy Luiz Carlos Andrade Moraes and Federal Deputy Francisco Lopes da Silva | ||
| Defendant | : | COELCE, CGTF, ANEEL AND UNION FEDERAL | ||
| Court | : | 10th Federal Court of Ceará | ||
| Case/Identification | : | 2007.81.00.006310-3 |
F - 114
Table of Contents
| Plaintiff | : | Romério Moreira de Deus | ||
| Defendant | : | Coelce | ||
| Court | : | Court of the State of Ceará (TJCE) | ||
| Case/Identification | : | 2000.0161.6981-7. |
| Plaintiff | : | Cooperativa de Eletrificação Rural do Vale do Acaraú Ltda. | ||
| Defendant | : | Coelce | ||
| Court | : | 1st Federal Court of the Ceará Judicial Section | ||
| Casel/Identification | : | 2001.81.00.008007-0 |
| Plaintiff | : | CIEN | ||
| Defendant | : | Federal Union | ||
| Court | : | 21st Federal Court of the Rio de Janeiro Judicial Section | ||
| Case/Identification | : | 2005.5101.011614-6 |
F - 115
Table of Contents
| Plaintiff | : | Municipality of Itá | ||
| Defendant | : | CIEN | ||
| Court | : | Single Court County of Itá (SC) | ||
| Case/Identification | : | 068.03.000397-8 |
| Plaintiff | : | Federal Treasury of Rio de Janeiro — MF | ||
| Defendant | : | CIEN — COMPANHIA DE INTERCONEXÃO ENERGÉTICA | ||
| Court | : | National Tax Court of Rio de Janeiro | ||
| Case/Identification | : | 18471.000814/2007-48 |
| Plaintiff | : | Wildson Sebastiao Fraga Guimaraes (shareholder of Centrais Elétricas de Goias (CELG) and chairman of the “Sindicato dos Trabalhadores nas Industrias Urbanas no Estado de Goias”. | ||
| Defendant | : | State of Goias, Centrais Elétricas de Goias (CELG), Centrais Elétricas Cachoeira Dourada S/A (CDSA). | ||
| Court | : | 3rd Court of Public Finance of the County of Goiania | ||
| Case/Identification | : | 97.00904507-3 |
F - 116
Table of Contents
| Plaintiff | : | Municipality of Cachoeira Dourada | ||
| Defendant | : | Centrais Elétricas Cachoeira Dourada S.A. — CDSA | ||
| Court | : | Public Finance Court of Itumbiara County | ||
| Case/Identification | : | 200503342330 |
| Plaintiff | : | Municipality of Cachoeira Dourada | ||
| Defendant | : | Centrais Elétricas Cachoeira Dourada S.A. — CDSA | ||
| Court | : | Municipal Secretary of Finance |
F - 117
Table of Contents
| Plaintiff | : | CGTF — Central Geradora Termelétrica Fortaleza S.A. | ||
| Defendant | : | Federal Union | ||
| Court | : | 1st Federal Court of Ceará | ||
| Case/Identification | : | 2002.81.00.020687-1 |
| Plaintiff | : | Treasury | ||
| Defendant | : | CGTF — Central Geradora Termelétrica Fortaleza S.A |
| Plaintiff | : | State Deputy Luiz Carlos Andrade Moraes and Federal Deputy Francisco Lopes da Silva | ||
| Defendant | : | COELCE, CGTF, ANEEL AND UNION FEDERAL | ||
| Court | : | 10th Federal Court of Ceará | ||
| Case/Identification | : | 2007.81.00.006310-3 |
F - 118
Table of Contents
| Plaintiff | : | Central Piedra Buena S.A. | ||
| Defendant | : | CEMSA | ||
| Court | : | Court of Arbitration of the Buenos Aires Stock Exchange | ||
| Case/Identification | : | 718/06 |
| Plaintiff | : | Transportadora de Energía S.A. (Tesa) | ||
| Defendant | : | Province of Corrientes | ||
| Court | : | Supreme Court of the Nation | ||
| Case/Identification | : | T-53/03 |
| (i) | That it was competent to see the cause; | |
| (ii) | Notify the Province of Corrientes of proceedings; |
F - 119
Table of Contents
| (iii) | Issue the injunction requested by Tesa (to not innovate) in relation to the payment of the gross business income tax included in the Fiscal Code of the Province of Corrientes with regard to the activity carried our by Tesa, in the following terms: “Decree the injunction requested, and consequently, orders the Province of Corrientes to abstain from pursuing the fiscal execution of the gross business income tax regarding the contract signed on July 12, 2002 between the National State and Transportadora de Energía S.A. for the construction, operation and maintenance of the second circuit for electric energy transport of the Nodo Rincón de Santa María-Nodo Frontera Garabí section (Province of Corrientes). |
| Plaintiff | : | Compañía de Transmisión del Mercosur S.A. (Ctm) | ||
| Defendant | : | Province of Corrientes (in Argentina) | ||
| Court | : | Supreme Court of the Nation | ||
| Case/Identification | : | C-222/03 |
| (i) | That it was competent to see the cause; | |
| (ii) | Notify the Province of Corrientes of proceedings; | |
| (iii) | Issue the injunction requested by Ctm (to not innovate) in relation to the payment of the gross business income tax included in the Fiscal Code of the Province of Corrientes with regard to the activity carried our by Ctm, in the following terms: “Decree the injunction requested, and consequently, orders the Province of Corrientes to abstain from pursuing the fiscal execution of the gross business income tax regarding the contract signed on June 14, 2000 between the National State and Compañía de Transmisión del Mercosur S.A. for the construction, operation and maintenance of the second circuit for electric energy transport of the Nodo Rincón de Santa María-Nodo Frontera Garabí section (Province of Corrientes). The Province of Corrientes was notified of the demand and answered stating that there was no current and concrete requirement for the payment of the gross business income tax. |
F - 120
Table of Contents
| Plaintiff | : | Electroenergía S.A. | ||
| Defendant | : | Codensa. | ||
| Court | : | 12th Civil Court of the Bogota Circuit. | ||
| Case/Identification | : | Case records No.11001310302120040037901. |
F - 121
Table of Contents
| Plaintiff | : | Roberto Ramírez Rojas (Class action lawsuit). | ||
| Defendant | : | Codensa, Bogotá Capital District and Alcaldía Zonal de San Cristóbal. | ||
| Court | : | Cundinamarca Administrative Court, Third Section — Sub-section “B”. | ||
| Case/Identification | : | Case file 03-1473. |
| Plaintiff | : | Conjunto Residencial Iguazú (Class action lawsuit). | ||
| Defendant | : | Codensa and Soacha City Government. | ||
| Court | : | Cundinamarca Administrative Court, Fourth Section — Sub-section “B”. | ||
| Case/Identification | : | Case file 03-01342. |
| Plaintiff | : | Jorge Ernesto Salamanca Cortés y Luis Alejandro Montero. | ||
| Defendant | : | Codensa, Nación — Ministerio de Minas — Unidad de Planeación Minero Energética. | ||
| Court | : | 3rd Administrative Court of Bogotá Circuit | ||
| Case/Identification | : | Case file 05-2357 |
F - 122
Table of Contents
| Plaintiff | : | Sonia Andrea Ramírez Lamy | ||
| Defendant | : | Ministry of the Environment, Housing and Territorial Development; Autonomous Regional Corporation of Cundinamarca — CAR; Technical Administrative Department of the Environment — DAMA; Administrative Department of District Planning, and others. | ||
| Court | : | Administrative Court of Cundinamarca, Section Two, Sub-section “B”. | ||
| Case/Identification | : | Case file No. 2005-00662. |
| Plaintiff | : | Jaime Arrieta Correa and others | ||
| Defendant | : | Treasury of Chile, General Direction of Water and EndesaChile. | ||
| Court | : | First Civil Court of Valdivia | ||
| Case/Identification | : | Case file 198-2005 |
| Plaintiff | : | Inversiones M.D. Ltda. and others | ||
| Defendant | : | Treasury of Chile, General Direction of Water and Endesa Chile. | ||
| Court | : | 24th Civil Court of Santiago | ||
| Case Identification | : | Case file 7957-2005 |
F - 123
Table of Contents
| Plaintiff | : | José Manuel Jordán Barahona and others | ||
| Defendant | : | Treasury of Chile, General Direction of Water and Endesa Chile | ||
| Court | : | 10th Civil Court of Santiago | ||
| Case Identification | : | Case file 1608-2005 |
| Plaintiff | : | Endesa Chile, Pangue S.A. and Pehuenche S.A. | ||
| Defendant | : | Treasury of Chile | ||
| Court | : | Ninth Civil Court of Santiago | ||
| Case Identification | : | Case file 13084-04 |
| Plaintiff | : | Luis Danús Covian and other fifteen people | ||
| Defendant | : | Endesa Chile and Pangue S.A. | ||
| Court | : | Santa Bárbara lower court | ||
| Case/Identification | : | Case file 4563 |
| Plaintiff | : | Endesa Chile | ||
| Defendant | : | CMPC Celulosa S.A | ||
| Case/Identification | : | 2144-J | ||
| Court | : | Court of Arbitration |
F - 124
Table of Contents
| Plaintiff | : | Endesa Chile | ||
| Defendant | : | General Water Board | ||
| Case/Identification | : | 6746-2007 | ||
| Court | : | Santiago Court of Appeal |
| Plaintiff | : | Endesa Chile | ||
| Defendant | : | Chilean Treasury | ||
| Case/Identification | : | 26.499-2007 | ||
| Court | : | Third Civil Court of Santiago |
| Plaintiff | : | Endesa Chile, Pangue S.A. and Pehuenche S.A. | ||
| Defendant | : | Treasury of Chile | ||
| Court | : | Ninth Civil Court of Santiago | ||
| Case Identification | : | Case file 13084-04 |
| Plaintiff | : | Luis Danús Covian and other fifteen people | ||
| Defendant | : | Endesa Chile and Pangue S.A. | ||
| Court | : | Santa Bárbara lower court | ||
| Case/Identification | : | Case file 4563 |
F - 125
Table of Contents
| Plaintiff | : | Municipality of Nacimiento | ||
| Defendant | : | PANGUE S.A | ||
| Court | : | Lower Court of Nacimiento | ||
| Case/Identification | : | 16.757-2007 |
| Plaintiff | : | Endesa Chile, Pangue S.A. and Pehuenche S.A. | ||
| Defendant | : | Treasury of Chile | ||
| Court | : | Ninth Civil Court of Santiago | ||
| Case Identification | : | Case file 13084-04 |
| Plaintiff/Tax Creditor | : | Sunat | ||
| Defendant/Taxpayer | : | Edegel | ||
| Court | : | Sunat |
F - 126
Table of Contents
| Plaintiff | : | SUNAT | ||
| Defendant | : | Generandes Perú S.A. | ||
| Court | : | SUNAT | ||
| Case/Identification | : | 0260340031172 |
| Plaintiff | : | Fariel San Juan | ||
| Defendant | : | Emgesa S.A. (Formerly Central Hidroeléctrica de Betania S.A. E.S.P.) | ||
| Court | : | 3rd and 4th Civil Courts of Neiva Circuit | ||
| Case/Identification | : | Class action motivated by the impact that the construction of the dam will have on the economy of the region. |
| Plaintiff | : | Emgesa (Formerly Central Hidroeléctrica de Betania S.A. ESP) | ||
| Defendant | : | Municipality of Yaguará | ||
| Court | : | Administrative Court of Huila | ||
| Case/Identification | : | 2004-1328 |
F - 127
Table of Contents
| Plaintiff | : | Orlando Enrique Guaqueta and Inhabitants of Sibaté | ||
| Defendant | : | Emgesa S.A. ESP. Empresa de Energía de Bogotá S.A. ESP.- EEB- Corporación Autónoma Regional — CAR - | ||
| Court | : | Administrative Court of Cundinamarca — First Section | ||
| Case/Identification | : | Class Action |
| Plaintiff | : | Gustavo Moya | ||
| Defendant | : | Emgesa S.A. ESP, Empresa de Energía de Bogotá S.A. ESP, the Capital District of Bogotá, Empresa de Acueducto y Alcantarillado de Bogotá, the City Hall of Sibaté and other plants and government agencies that presumably contribute to the pollution of the river Bogotá by action or omission. | ||
| Court | : | Administrative Court of Cundinamarca — Fourth Section | ||
| Case/Identification | : | 2001-479 |
| Plaintiff/Tax Creditor | : | Emgesa S.A. ESP. | ||
| Defendant/Taxpayer | : | Corporación Autónoma Regional de Cundinamarca — CAR | ||
| Court | : | Administrative Court of Cundinamarca — First Section | ||
| Case/Identification | : | 2005-1476 |
F - 128
Table of Contents
F - 129
Table of Contents
| • | Ratio of debt and cash flow for four quarters of Enersis and its Chilean subsidiaries does not exceed 6.5 in 2007, ending at 6.00 in 2009; |
| • | The ratio of consolidated debt to consolidated EBITDA for four consolidated quarters, does not exceed 4.0 in 2007, ending at 3.00 in 2009; |
| • | The ratio of Enersis and its Chilean subsidiaries cash flow to financial expenses for four quarters, not less than 2.10 in 2007, ending at 2.20 in 2009; |
| • | The consolidated debt to shareholders’ equity plus minority interest does not exceed 100%; |
| • | No less than 50% of the total consolidated assets of Enersis S.A., steadily until 2009, should belong to companies whose business is regulated; |
| • | Minimum shareholders’ equity plus minority interest at least equal to U.F.27 million (UF = Inflation index-linked units of account |
| • | Ratio between debt and cash flow for four quarters of Endesa Chile and its Chilean subsidiaries does not exceed 8.40 in 2007, which evolves up to 7.50 in 2010; |
| • | The ratio of consolidated debt to consolidated EBITDA for four consolidated quarters, not exceeding 5.00 in 2007, which evolves up to 4.20 time in 2010; |
| • | The ratio of Endesa Chile and its Chilean subsidiaries cash flow to financial expenses for four quarters, not less than 1.70 in 2007, which evolves up to 2.00 times in 2010; |
| • | The ratio of consolidated debt to shareholders’ equity plus minority interest not exceeding 102% in 2007, which evolves up to 100% in 2010; |
| • | Not less than 50% of Endesa Chile’s total consolidated assets must be devoted to activities involving the generation, transmission and selling of electrical energy: |
| • | Minimum shareholders’ equity at least equal to U.F.45 million. |
F - 130
Table of Contents
F - 131
Table of Contents
| • | Restrictions on changes of controller, under these circumstances. |
F - 132
Table of Contents
| As of December 31, | ||||||||||||
| Account | Currency | 2006 | 2007 | |||||||||
| ThCh$ | ThCh$ | |||||||||||
| Cash and banks | $ no Reaj. | 2,354,162 | 2,893,987 | |||||||||
| US$ | 3,866,720 | 8,396,302 | ||||||||||
| Euro | 6,946 | 3,475 | ||||||||||
| Yen | 243 | 225 | ||||||||||
| $ Col. | 25,091,123 | 21,313,555 | ||||||||||
| Soles | 7,964,917 | 6,279,420 | ||||||||||
| $ Arg. | 2,393,314 | 2,833,888 | ||||||||||
| Real | 65,501,566 | 40,258,759 | ||||||||||
| Time deposits | US$ | 64,291,303 | 71,942,208 | |||||||||
| $ Col. | 57,597,837 | 64,647,410 | ||||||||||
| Soles | 10,720,537 | 1,658,511 | ||||||||||
| $ Arg. | 23,838,520 | 15,190,337 | ||||||||||
| Real | 146,554,231 | 251,145,475 | ||||||||||
| Marketable securities | $ no Reaj. | 4,189 | 5,498 | |||||||||
| US$ | 2,257,140 | 275,098 | ||||||||||
| $ Col. | 4,724,898 | 10,302,981 | ||||||||||
| Soles | 894,255 | — | ||||||||||
| $ Arg. | 1,907,876 | 1,213,886 | ||||||||||
| Accounts receivable, net | $ no Reaj. | 189,337,670 | 224,064,233 | |||||||||
| US$ | 2,496,976 | 6,665,624 | ||||||||||
| Euro | — | 92,970 | ||||||||||
| $ Col. | 216,646,461 | 211,529,800 | ||||||||||
| Soles | 57,581,020 | 44,351,663 | ||||||||||
| $ Arg. | 76,056,387 | 96,590,032 | ||||||||||
| Real | 359,090,323 | 404,089,150 | ||||||||||
| Notes receivable | $ no Reaj. | 2,712,947 | 4,191,613 | |||||||||
| US$ | 141,469 | 32,783 | ||||||||||
| Soles | 52,812 | — | ||||||||||
| $ Arg. | 21,250 | — | ||||||||||
| Real | 5,092,371 | 7,614,720 | ||||||||||
| Other receivables | $ Reaj. | 116,292 | 2,801,441 | |||||||||
| $ no Reaj. | 33,775,426 | 36,262,666 | ||||||||||
| US$ | 13,876,861 | 11,524,012 | ||||||||||
| $ Col. | 23,388,787 | 13,659,977 | ||||||||||
| Soles | 6,231,535 | 5,868,565 | ||||||||||
| $ Arg. | 927,703 | 1,127,557 | ||||||||||
| Real | 30,210,249 | 28,525,803 | ||||||||||
F - 133
Table of Contents
| As of December 31, | ||||||||||||
| Account | Currency | 2006 | 2007 | |||||||||
| ThCh$ | ThCh$ | |||||||||||
| Amounts due from related companies | $ no Reaj. | 6,976,355 | 12,118,730 | |||||||||
| US$ | 796,786 | 131,054,939 | ||||||||||
| Soles | 141,986 | 147,889 | ||||||||||
| $ Arg. | 6,653,651 | 9,062,462 | ||||||||||
| Inventories, net | $ no Reaj. | 40,052,843 | 75,056,392 | |||||||||
| US$ | 1,956,158 | — | ||||||||||
| $ Col. | 10,398,138 | 12,397,422 | ||||||||||
| Soles | 16,275,855 | 13,872,977 | ||||||||||
| $ Arg. | 1,662,244 | 1,885,013 | ||||||||||
| Real | 1,444,239 | 2,227,730 | ||||||||||
| Income taxes recoverable | $ no Reaj. | 24,500,576 | 67,409,343 | |||||||||
| US$ | 657,664 | — | ||||||||||
| $ Col. | 642,256 | 2,807,941 | ||||||||||
| Soles | 160,037 | 1,082,757 | ||||||||||
| $ Arg. | 1,026,255 | 3,145,100 | ||||||||||
| Real | 49,643,551 | 70,266,944 | ||||||||||
| Prepaid expenses and other | $ no Reaj. | 981,216 | 848,917 | |||||||||
| US$ | 898,802 | 703,947 | ||||||||||
| $ Col. | 1,826,607 | 1,575,185 | ||||||||||
| Soles | 2,740,699 | 1,899,227 | ||||||||||
| $ Arg. | 957,136 | 1,648,106 | ||||||||||
| Real | 47,845,772 | 43,681,296 | ||||||||||
| Deferred income taxes | $ no Reaj. | 47,612,290 | 34,518,793 | |||||||||
| $ Col. | 187,632 | 656,392 | ||||||||||
| $ Arg. | 7,430,119 | 7,935,531 | ||||||||||
| Real | 10,881,479 | 25,298,426 | ||||||||||
| Other current assets | $ Reaj. | 6,718,391 | 4,250,194 | |||||||||
| $ no Reaj. | 47,794,808 | 75,578,181 | ||||||||||
| US$ | 4,305,173 | 25,356,635 | ||||||||||
| $ Col. | — | 619,493 | ||||||||||
| Soles | 250,922 | 174,957 | ||||||||||
| $ Arg. | 198,783 | 131,276 | ||||||||||
| Real | 12,320,803 | 35,921,657 | ||||||||||
Total current assets | 1,793,665,542 | 2,260,687,476 | ||||||||||
F - 134
Table of Contents
| As of December 31, | ||||||||||||
| Account | Currency | 2006 | 2007 | |||||||||
| ThCh$ | ThCh$ | |||||||||||
| Land | $ no Reaj. | 58,594,852 | 59,138,906 | |||||||||
| $ Col. | 28,269,000 | 32,818,487 | ||||||||||
| Soles | 11,951,065 | 3,805,902 | ||||||||||
| $ Arg. | 7,762,198 | 6,745,447 | ||||||||||
| Real | 35,840,112 | 35,627,673 | ||||||||||
| Building, infrastructure and work in progress | $ no Reaj. | 4,366,632,325 | 4,589,067,895 | |||||||||
| $ Col. | 2,683,158,045 | 2,436,182,558 | ||||||||||
| Soles | 1,310,188,066 | 1,171,005,047 | ||||||||||
| $ Arg. | 1,461,806,708 | 1,297,240,798 | ||||||||||
| Real | 1,951,184,452 | 1,776,382,758 | ||||||||||
| Machinery and equipment | $ no Reaj. | 71,746,863 | 73,827,317 | |||||||||
| $ Col. | 32,926,985 | 31,912,537 | ||||||||||
| Soles | 600,927,484 | 550,379,735 | ||||||||||
| $ Arg. | 679,922,955 | 608,669,965 | ||||||||||
| Real | 748,715,953 | 720,005,031 | ||||||||||
| Other plant and equipment | $ no Reaj. | 189,278,271 | 187,533,805 | |||||||||
| $ Col. | 9,797,352 | 9,627,217 | ||||||||||
| Soles | 127,346,938 | 83,396,760 | ||||||||||
| $ Arg. | 101,008,914 | 95,638,729 | ||||||||||
| Real | 246,849,539 | 157,216,698 | ||||||||||
| Technical appraisal | $ no Reaj. | 33,741,576 | 33,693,703 | |||||||||
| Real | 107,681,188 | 93,164,391 | ||||||||||
| Accumulated depreciation | $ no Reaj. | (2,126,444,664 | ) | (2,245,033,722 | ) | |||||||
| $ Col. | (888,950,985 | ) | (845,008,549 | ) | ||||||||
| Soles | (975,993,483 | ) | (896,750,095 | ) | ||||||||
| $ Arg. | (1,160,016,222 | ) | (1,079,372,828 | ) | ||||||||
| Real | (1,028,017,719 | ) | (979,570,049 | ) | ||||||||
Total property, plant and equipment | 8,685,907,768 | 8,007,346,116 | ||||||||||
F - 135
Table of Contents
| As of December 31, | ||||||||||||
| Account | Currency | 2006 | 2007 | |||||||||
| ThCh$ | ThCh$ | |||||||||||
| Investments in related companies | $ no Reaj. | 81,687,494 | 55,631,617 | |||||||||
| US$ | 41,757,737 | 3,564,027 | ||||||||||
| Investments in other companies | $ no Reaj. | 2,651,817 | 2,795,686 | |||||||||
| US$ | 21,682,898 | 18,842,721 | ||||||||||
| $ Col. | 1,510,100 | 1,312,286 | ||||||||||
| Soles | 26,962 | 23,431 | ||||||||||
| Real | 2,673 | 2,805 | ||||||||||
| Goodwill, net | $ no Reaj. | 684,114,838 | 625,799,583 | |||||||||
| US$ | 10,994,180 | 8,674,293 | ||||||||||
| $ Col. | 8,427,567 | 6,704,537 | ||||||||||
| Negative goodwill, net | $ no Reaj. | (7,711,148 | ) | (12,017,963 | ) | |||||||
| US$ | (8,241,974 | ) | (6,272,756 | ) | ||||||||
| Soles | (23,802,402 | ) | (19,103,601 | ) | ||||||||
| Long-term accounts receivable | $ Reaj. | 9,950,282 | 5,960,919 | |||||||||
| $ no Reaj. | 953,209 | 732,467 | ||||||||||
| US$ | 2,200,940 | — | ||||||||||
| $ Col. | 6,890,342 | 59,460,267 | ||||||||||
| Soles | 162,464 | 65,662 | ||||||||||
| $ Arg. | 67,763,155 | 99,616,044 | ||||||||||
| Real | 59,732,796 | 29,702,484 | ||||||||||
| Amounts due from related companies | $ no Reaj. | — | 626,547 | |||||||||
| US$ | 97,222,765 | — | ||||||||||
| Deferred taxes | Real | 13,155,686 | — | |||||||||
| Other long-term assets | $ Reaj. | 242,777 | 1,346,395 | |||||||||
| $ no Reaj. | 99,696,320 | 29,957,885 | ||||||||||
| US$ | 117,740 | 55,220,674 | ||||||||||
| $ Col. | 21,205,966 | 19,399,101 | ||||||||||
| Soles | 4,068,785 | 3,754,498 | ||||||||||
| $ Arg. | 28,660,732 | 15,152,751 | ||||||||||
| Real | 179,405,710 | 162,780,692 | ||||||||||
Total other assets | 1,404,530,411 | 1,169,733,052 | ||||||||||
| Total assets by currency | $ Reaj. | 17,027,742 | 14,358,949 | |||||||||
| $ no Reaj. | 3,851,044,235 | 3,934,702,079 | ||||||||||
| US$ | 261,279,338 | 335,980,507 | ||||||||||
| Euro | 6,946 | 96,445 | ||||||||||
| Yen | 243 | 225 | ||||||||||
| $ Col. | 2,243,738,111 | 2,091,918,597 | ||||||||||
| Soles | 1,157,890,454 | 971,913,305 | ||||||||||
| $ Arg. | 1,309,981,678 | 1,184,454,094 | ||||||||||
| Real | 3,043,134,974 | 2,904,342,443 | ||||||||||
Total assets by currency | 11,884,103,721 | 11,437,766,644 | ||||||||||
F - 136
Table of Contents
| Within 90 days | 91 day to 1 year | |||||||||||||||||||||||||||||||||||
| As of December 31, 2006 | As of December 31, 2007 | As of December 31, 2006 | As of December 31, 2007 | |||||||||||||||||||||||||||||||||
| Average | Average | Average | Average | |||||||||||||||||||||||||||||||||
| Account | Currency | Amount | Rate | Amount | Rate | Amount | Rate | Amount | Rate | |||||||||||||||||||||||||||
| ThCh$ | ThCh$ | ThCh$ | ThCh$ | |||||||||||||||||||||||||||||||||
| Short-term debt due to banks and | $ Reaj. | 2,244 | 0.30 | % | 4,089 | 0.30 | % | — | — | — | — | |||||||||||||||||||||||||
| financial institutions | $ no Reaj. | 222,432 | 0.96 | % | 6,627 | 0.00 | % | — | — | — | — | |||||||||||||||||||||||||
| US$ | 7,427,503 | 10.49 | % | 8,218,800 | 6.03 | % | 1,522,497 | 6.94 | % | 23,416,144 | 10.30 | % | ||||||||||||||||||||||||
| Yen | — | — | 57,386 | 12.75 | % | — | — | 6,298,867 | 12.75 | % | ||||||||||||||||||||||||||
| $ Col. | 98,951,084 | 8.35 | % | 83,609,969 | 12.01 | % | — | — | — | — | ||||||||||||||||||||||||||
| Soles | 31,414,031 | 5.62 | % | 38,359,881 | 5.55 | % | — | — | — | — | ||||||||||||||||||||||||||
| $ Arg. | 591,727 | 13.70 | % | 1,114,970 | 7.90 | % | 2,240,837 | 8.72 | % | — | — | |||||||||||||||||||||||||
| Reales | 1,284,987 | 16.58 | % | 5,774,621 | 8.10 | % | — | — | 2,833,525 | 5.58 | % | |||||||||||||||||||||||||
| Others | 536,769 | 2.80 | % | — | 0.00 | % | — | — | — | — | ||||||||||||||||||||||||||
| Current portion of long-term debt | $ no Reaj. | 32 | — | 32 | 0.30 | % | — | — | — | — | ||||||||||||||||||||||||||
| due to banks and financial institutions | $ Reaj. | — | — | — | — | 415,497 | 9.00 | % | — | — | ||||||||||||||||||||||||||
| US$ | 19,150,148 | 11.05 | % | 18,227,924 | 7.73 | % | 31,849,879 | 8.68 | % | 23,372,542 | 9.41 | % | ||||||||||||||||||||||||
| Euro | — | — | — | — | 884,787 | 4.23 | % | — | — | |||||||||||||||||||||||||||
| $ Col. | 19,365,278 | 9.85 | % | 9,069,236 | 12.19 | % | — | — | — | — | ||||||||||||||||||||||||||
| Soles | 10,665,834 | 5.00 | % | 28,211,708 | 5.96 | % | — | — | — | — | ||||||||||||||||||||||||||
| $ Arg. | 333,672 | 12.11 | % | — | 0.00 | % | 2,505,203 | 3.10 | % | 2,003,678 | 1.75 | % | ||||||||||||||||||||||||
| Reales | 4,069,981 | 17.86 | % | 780,784 | 12.75 | % | 16,529,136 | 15.45 | % | 47,644,953 | 13.52 | % | ||||||||||||||||||||||||
| Current portion of bonds payable | $ Reaj. | 1,829,608 | 5.63 | % | 1,918,224 | 5.71 | % | 2,532,320 | 5.61 | % | 2,951,811 | 5.71 | % | |||||||||||||||||||||||
| US$ | 43,150,904 | 5.38 | % | 6,287,431 | 7.78 | % | 33,606,595 | 8.22 | % | 228,769,157 | 7.78 | % | ||||||||||||||||||||||||
| $ Col. | 4,442,330 | 10.15 | % | 9,582,791 | 10.95 | % | — | — | — | |||||||||||||||||||||||||||
| Soles | 1,824,899 | 6.55 | % | 18,879,245 | 6.07 | % | 10,830,382 | 7.19 | % | 4,975,532 | 6.07 | % | ||||||||||||||||||||||||
| $ Arg. | 3,740,523 | 10.43 | % | 101,860 | 11.75 | % | 7,468,236 | 10.43 | % | — | ||||||||||||||||||||||||||
| Reales | — | — | — | — | 12,159,163 | 14.53 | % | 92,568,646 | 13.23 | % | ||||||||||||||||||||||||||
| Current portion of long-term | $ no Reaj. | 1,693 | — | — | — | — | — | — | ||||||||||||||||||||||||||||
| notes payable | US$ | 21,914,304 | 7.42 | % | 12,224,280 | 7.42 | % | 11,662,164 | 7.42 | % | 7,205,899 | 7.42 | % | |||||||||||||||||||||||
| $ Arg. | — | — | 1,063,998 | 13.10 | % | — | — | 2,920,274 | 13.10 | % | ||||||||||||||||||||||||||
| Reales | — | — | — | — | 2,962,525 | — | 769,241 | 5.00 | % | |||||||||||||||||||||||||||
| Dividends payable | $ no Reaj. | 1,668,202 | — | 4,142,562 | — | — | — | — | — | |||||||||||||||||||||||||||
| $ Col. | 63,055,251 | — | 14,194,394 | — | — | — | — | — | ||||||||||||||||||||||||||||
| Soles | 2,255,472 | — | 18,402 | — | — | — | — | — | ||||||||||||||||||||||||||||
| $ Arg. | 2,127 | — | — | — | — | — | — | — | ||||||||||||||||||||||||||||
| Reales | 13,232,333 | — | 14,530,457 | — | — | — | — | — | ||||||||||||||||||||||||||||
| Accounts payable | $ Reaj. | 38,103 | — | 112,058 | — | — | — | — | — | |||||||||||||||||||||||||||
| $ no Reaj. | 95,114,000 | — | 167,648,213 | — | — | — | — | — | ||||||||||||||||||||||||||||
| US$ | 12,573,019 | — | 33,623,137 | — | 532,187 | — | 8,194,660 | — | ||||||||||||||||||||||||||||
| Euro | 1,153,194 | — | 1,025,690 | — | — | — | — | — | ||||||||||||||||||||||||||||
| $ Col. | 57,380,444 | — | 61,943,498 | — | — | — | — | — | ||||||||||||||||||||||||||||
| Soles | 33,005,936 | — | 25,970,113 | — | 2,199,029 | — | 1,344,926 | — | ||||||||||||||||||||||||||||
| $ Arg. | 62,637,722 | — | 61,367,588 | — | — | — | — | — | ||||||||||||||||||||||||||||
| Reales | 86,527,665 | — | 109,124,490 | — | 45,929,107 | — | 44,401,473 | — | ||||||||||||||||||||||||||||
| Short-term notes payables | Reales | 3,253,625 | — | 6,526,529 | — | 13,636,854 | — | 9,435,198 | — | |||||||||||||||||||||||||||
| Miscellaneous payables | $ no Reaj. | 5,744,671 | — | 9,511,986 | — | — | — | — | — | |||||||||||||||||||||||||||
| US$ | 15,104,101 | — | 551,597 | — | 837,358 | — | 6,981,468 | — | ||||||||||||||||||||||||||||
| Euro | 610 | — | — | — | — | — | — | — | ||||||||||||||||||||||||||||
| $ Col. | 15,453,115 | — | 24,943,812 | — | — | — | — | — | ||||||||||||||||||||||||||||
| Soles | 18,816,805 | — | 6,859,649 | — | 216,775 | — | 2,183,671 | — | ||||||||||||||||||||||||||||
| $ Arg. | 80,831 | — | 41,077 | — | — | — | 201,647 | — | ||||||||||||||||||||||||||||
| Reales | 28,092,534 | — | 19,894,017 | — | 35,275,963 | — | 34,924,981 | — | ||||||||||||||||||||||||||||
| Others | 7,244 | ��� | 6,745 | — | — | — | — | — | ||||||||||||||||||||||||||||
| Amounts payable to related | $ no Reaj. | 1,095,955 | — | 321,644 | — | — | — | — | — | |||||||||||||||||||||||||||
| companies | US$ | 3,039,973 | — | 3,006,074 | — | — | — | — | — | |||||||||||||||||||||||||||
| Soles | 1,431,079 | — | 383,347 | — | — | — | — | — | ||||||||||||||||||||||||||||
| $ Arg. | 26,505,339 | — | 28,140,054 | — | — | — | — | — | ||||||||||||||||||||||||||||
| Accrued expenses | $ Reaj. | — | — | — | — | 1,336,697 | — | 2,463,021 | — | |||||||||||||||||||||||||||
| $ no Reaj. | 14,567,202 | — | 12,150,816 | — | 19,232,520 | — | 20,552,346 | — | ||||||||||||||||||||||||||||
| US$ | 2,421,289 | — | 6,630 | — | 37,078 | — | 77,915 | — | ||||||||||||||||||||||||||||
| $ Col. | 13,118,853 | — | 15,922,583 | — | — | — | — | — | ||||||||||||||||||||||||||||
| Soles | 7,085,207 | — | 5,167,546 | — | 260,427 | — | 938,180 | — | ||||||||||||||||||||||||||||
| $ Arg. | 5,388,567 | — | 5,879,657 | — | — | — | — | — | ||||||||||||||||||||||||||||
| Reales | 8,557,241 | — | 8,834,674 | — | 13,217,500 | — | 13,062,584 | — | ||||||||||||||||||||||||||||
| Withholdings | $ no Reaj. | 11,166,123 | — | 21,662,709 | — | — | — | — | — | |||||||||||||||||||||||||||
| $ Col. | 3,214,796 | — | 5,463,809 | — | — | — | — | — | ||||||||||||||||||||||||||||
| Soles | 6,818,513 | — | 5,144,901 | — | 144,470 | — | 227,112 | — | ||||||||||||||||||||||||||||
| $ Arg. | 14,396,065 | — | 16,533,702 | — | — | — | — | — | ||||||||||||||||||||||||||||
| Reales | 36,384,853 | — | 25,359,740 | — | 35,260,806 | — | 31,641,193 | — | ||||||||||||||||||||||||||||
| Income tax payable | $ no Reaj. | 338,827 | — | — | — | 38,409,552 | — | 121,265 | — | |||||||||||||||||||||||||||
| $ Col. | 33,147,732 | — | — | — | — | — | — | — | ||||||||||||||||||||||||||||
| Soles | 12,013,445 | — | — | — | — | — | — | — | ||||||||||||||||||||||||||||
| $ Arg. | 4,252,372 | — | 14,722,948 | — | 759,904 | — | 91,243 | — | ||||||||||||||||||||||||||||
| Reales | 16,129,535 | — | 2,490,801 | — | 51,863,663 | — | 916,818 | — | ||||||||||||||||||||||||||||
| Reimbursable financial contributions | $ no Reaj. | 3,661,246 | — | 4,907,779 | — | 757,744 | — | 2,552,735 | — | |||||||||||||||||||||||||||
| $ Col. | 972,978 | — | 369,014 | — | — | — | — | — | ||||||||||||||||||||||||||||
| $ Reaj. | 1,542 | — | 1,691 | — | 4,628 | — | 5,071 | — | ||||||||||||||||||||||||||||
| $ no Reaj. | 8,017 | — | 8,062 | — | 1,112,585 | — | 1,325,255 | — | ||||||||||||||||||||||||||||
F - 137
Table of Contents
| Within 90 days | 91 day to 1 year | |||||||||||||||||||||||||||||||||||
| As of December 31, 2006 | As of December 31, 2007 | As of December 31, 2006 | As of December 31, 2007 | |||||||||||||||||||||||||||||||||
| Average | Average | Average | Average | |||||||||||||||||||||||||||||||||
| Account | Currency | Amount | Rate | Amount | Rate | Amount | Rate | Amount | Rate | |||||||||||||||||||||||||||
| ThCh$ | ThCh$ | ThCh$ | ThCh$ | |||||||||||||||||||||||||||||||||
| Other current liabilities | $ Reaj. | — | — | — | — | 65,846 | — | — | — | |||||||||||||||||||||||||||
| $ no Reaj. | 17,382 | — | 9,460 | — | 85,798 | — | 107,564 | — | ||||||||||||||||||||||||||||
| US$ | 1,167,359 | — | 2,150,224 | — | — | — | 4,309,486 | — | ||||||||||||||||||||||||||||
| $ Col. | 16,275,624 | — | 5,444,461 | — | — | — | — | — | ||||||||||||||||||||||||||||
| Soles | 583,319 | — | 1,043,626 | — | — | — | — | — | ||||||||||||||||||||||||||||
| $ Arg. | 31,176,603 | — | 57,215,594 | — | — | — | — | — | ||||||||||||||||||||||||||||
| Reales | 30,011,605 | — | 42,519,118 | — | 17,064,223 | — | 18,078,563 | — | ||||||||||||||||||||||||||||
| Total current liabilities by currency | $ Reaj. | 1,871,497 | 2,036,062 | 4,354,988 | 5,419,903 | |||||||||||||||||||||||||||||||
| $ no Reaj. | 133,605,782 | 220,369,890 | 59,598,199 | 24,659,165 | ||||||||||||||||||||||||||||||||
| US$ | 125,948,600 | 84,296,097 | 80,047,758 | 302,327,271 | ||||||||||||||||||||||||||||||||
| Euro | 1,153,804 | 1,025,690 | 884,787 | — | ||||||||||||||||||||||||||||||||
| Yen | — | 57,386 | — | 6,298,867 | ||||||||||||||||||||||||||||||||
| $ Col. | 325,377,485 | 230,543,567 | — | — | ||||||||||||||||||||||||||||||||
| Soles | 125,914,540 | 130,038,418 | 13,651,083 | 9,669,421 | ||||||||||||||||||||||||||||||||
| Reales | 227,544,357 | 235,835,231 | 243,898,940 | 296,277,175 | ||||||||||||||||||||||||||||||||
| $ Arg. | 149,105,548 | 186,181,448 | 12,974,180 | 5,216,842 | ||||||||||||||||||||||||||||||||
| Others | 544,013 | 6,745 | — | — | ||||||||||||||||||||||||||||||||
| Total current liabilities | 1,091,065,626 | 1,090,390,534 | 415,409,935 | 649,868,644 | ||||||||||||||||||||||||||||||||
F - 138
Table of Contents
| 1 to 3 years | 3 to 5 years | 5 to 10 years | More than 10 years | |||||||||||||||||||||||||||||||||
| Average | Average | Average | ||||||||||||||||||||||||||||||||||
| Average | Rate | Rate | Rate | |||||||||||||||||||||||||||||||||
| Rubro | Currency | Amount | Rate | Amount | anual | Amount | anual | Amount | anual | |||||||||||||||||||||||||||
| ThCh$ | ThCh$ | ThCh$ | ThCh$ | |||||||||||||||||||||||||||||||||
| Due to bank and financial | US$ | 308,377,641 | 7.34 | % | 141,153,408 | 7.75 | % | 50,923,749 | 7.90 | % | 8,549,013 | 8.66 | % | |||||||||||||||||||||||
| institucions | $ Arg. | 31,742,485 | 12.14 | % | 12,593,240 | 10.18 | % | — | — | — | — | |||||||||||||||||||||||||
| $ Col. | 77,899,099 | 9.16 | % | — | — | — | — | — | — | |||||||||||||||||||||||||||
| Soles | 27,189,832 | 4.00 | % | — | — | — | — | — | — | |||||||||||||||||||||||||||
| Reales | 76,187,005 | 13.25 | % | 58,861,461 | 14.75 | % | 179,505,352 | 12.06 | % | — | — | |||||||||||||||||||||||||
| Bonds payable | $ Reaj. | 79,247,549 | 6.20 | % | 78,773,088 | 4.80 | % | — | — | 65,159,131 | 5.95 | % | ||||||||||||||||||||||||
| US$ | 468,865,225 | 8.08 | % | — | — | 697,427,876 | 7.96 | % | 267,113,092 | 7.56 | % | |||||||||||||||||||||||||
| $ Col. | 93,487,692 | 8.84 | % | 153,240,006 | 10.16 | % | 127,700,022 | 10.47 | % | — | — | |||||||||||||||||||||||||
| Soles | 46,921,486 | 6.54 | % | 25,024,007 | 7.20 | % | 47,821,518 | 8.21 | % | — | — | |||||||||||||||||||||||||
| Reales | 30,698,200 | 17.71 | % | 77,557,619 | 11.63 | % | 98,952,823 | 11.63 | % | — | — | |||||||||||||||||||||||||
| Long-term notes payable | US$ | 32,008,627 | 7.42 | % | 25,191,665 | 7.42 | % | — | — | — | — | |||||||||||||||||||||||||
| $ Arg. | 4,171,878 | — | — | — | — | — | — | — | ||||||||||||||||||||||||||||
| Reales | 40,599,400 | 10.61 | % | 9,033,548 | 10.61 | % | 8,042,343 | 10.61 | % | 1,657,815 | 10.61 | % | ||||||||||||||||||||||||
| Miscellaneous payable | $ Reaj. | — | — | — | — | — | — | 140,457 | — | |||||||||||||||||||||||||||
| $ no Reaj. | 8,251,163 | — | — | — | — | — | — | — | ||||||||||||||||||||||||||||
| US$ | 32,967,048 | 0.58 | % | 39,107,921 | 0.18 | % | 36,224,581 | 6.50 | % | 15,159,777 | 6.50 | % | ||||||||||||||||||||||||
| $ Arg. | 234,839 | — | 17,260 | — | — | — | — | — | ||||||||||||||||||||||||||||
| Reales | 18,607,777 | — | 4,579,241 | — | 9,876,189 | — | — | — | ||||||||||||||||||||||||||||
| Amounts payable to related companies | US$ | 12,082,887 | — | — | — | — | — | — | — | |||||||||||||||||||||||||||
| Accrued expenses | $ Reaj. | 137,735 | — | — | — | — | — | — | — | |||||||||||||||||||||||||||
| $ no Reaj. | 3,764,289 | — | 3,607,093 | — | 8,924,645 | — | 16,498,685 | — | ||||||||||||||||||||||||||||
| $ Col. | 78,175,913 | — | — | — | — | — | — | — | ||||||||||||||||||||||||||||
| Reales | 237,884,720 | — | — | — | — | — | — | — | ||||||||||||||||||||||||||||
| Reimbursable financial contributions | $ Reaj. | 14,254 | — | — | — | — | — | — | — | |||||||||||||||||||||||||||
| $ no Reaj. | 1,329,353 | — | 661,677 | — | 502,560 | — | — | — | ||||||||||||||||||||||||||||
| Soles | 556,931 | — | 39,754 | — | 66,258 | — | — | — | ||||||||||||||||||||||||||||
| Other long-term liabilities | $ Reaj. | 2,480,808 | — | 1,653,872 | — | 3,652,284 | — | — | — | |||||||||||||||||||||||||||
| $ no Reaj. | 169,215,213 | — | 780,961 | — | 32,531 | — | — | — | ||||||||||||||||||||||||||||
| US$ | 326,615 | — | 636,337 | — | — | — | — | — | ||||||||||||||||||||||||||||
| $ Col. | 5,920,854 | — | — | — | — | — | — | — | ||||||||||||||||||||||||||||
| $ Arg. | 19,364,959 | — | 3,943,803 | — | 7,776,433 | — | — | — | ||||||||||||||||||||||||||||
| Reales | 16,160,213 | — | — | — | — | — | — | — | ||||||||||||||||||||||||||||
| Total long-term liabilities by currency | $ Reaj. | 81,880,346 | 80,426,960 | 3,652,284 | 65,299,588 | |||||||||||||||||||||||||||||||
| $ no Reaj. | 182,560,018 | 5,049,731 | 9,459,736 | 16,498,685 | ||||||||||||||||||||||||||||||||
| US$ | 854,628,043 | 206,089,331 | 784,576,206 | 290,821,882 | ||||||||||||||||||||||||||||||||
| $ Col. | 255,483,558 | 153,240,006 | 127,700,022 | — | ||||||||||||||||||||||||||||||||
| Soles | 74,668,249 | 25,063,761 | 47,887,776 | — | ||||||||||||||||||||||||||||||||
| $ Arg. | 55,514,161 | 16,554,303 | 7,776,433 | — | ||||||||||||||||||||||||||||||||
| Reales | 420,137,315 | 150,031,869 | 296,376,707 | 1,657,815 | ||||||||||||||||||||||||||||||||
| Total long-term liabilities | 1,924,871,690 | 636,455,961 | 1,277,429,164 | 374,277,970 | ||||||||||||||||||||||||||||||||
F - 139
Table of Contents
| 1 to 3 years | 3 to 5 years | 5 to 10 years | More than 10 years | |||||||||||||||||||||||||||||||||
| Average | Average | Average | Average | |||||||||||||||||||||||||||||||||
| Account | Currency | Amount | Rate | Amount | Rate | Amount | Rate | Amount | Rate | |||||||||||||||||||||||||||
| ThCh$ | ThCh$ | ThCh$ | ThCh$ | |||||||||||||||||||||||||||||||||
| Due to banks and financial institutions | US$ | 324,569,644 | 6.71 | % | 111,876,345 | 6.30 | % | 32,495,769 | 8.63 | % | 3,306,080 | 10.43 | % | |||||||||||||||||||||||
| $ Arg. | 3,981,984 | 1.75 | % | 995,577 | 1.75 | % | — | — | — | — | ||||||||||||||||||||||||||
| $ Col. | — | — | 75,222,686 | 12.19 | % | — | — | — | — | |||||||||||||||||||||||||||
| Reales | 155,514,187 | 13.81 | % | 275,204,413 | 13.80 | % | 41,556,728 | 13.65 | % | — | — | |||||||||||||||||||||||||
| Bonds payable | $ Reaj. | 99,684 | 5.50 | % | — | — | — | — | 219,857,880 | 5.27 | % | |||||||||||||||||||||||||
| US$ | 310,994,010 | 8.22 | % | 13,912,918 | 4.36 | % | 596,135,827 | 7.92 | % | 129,824,438 | 7.45 | % | ||||||||||||||||||||||||
| $ Col. | 146,064,243 | 10.69 | % | 156,291,249 | 11.24 | % | 261,792,340 | 10.83 | % | — | — | |||||||||||||||||||||||||
| Soles | 38,843,435 | 6.90 | % | 27,345,848 | 6.38 | % | 73,000,046 | 6.80 | % | 8,289,790 | 6.30 | % | ||||||||||||||||||||||||
| $ Arg. | — | 0.00 | % | 26,006,931 | 11.75 | % | — | — | — | — | ||||||||||||||||||||||||||
| Reales | 34,672,030 | 14.70 | % | 103,793,429 | 12.80 | % | — | — | — | — | ||||||||||||||||||||||||||
| Long-term notes payable | US$ | 29,099,369 | 7.42 | % | 27,888,796 | 7.42 | % | — | — | — | — | |||||||||||||||||||||||||
| $ Arg. | 6,059,723 | 13.10 | % | — | 0.00 | % | — | — | — | — | ||||||||||||||||||||||||||
| Reales | 35,600,085 | 10.61 | % | 15,044,209 | 10.61 | % | 9,275,471 | 10.61 | % | — | — | |||||||||||||||||||||||||
| Miscellaneous payable | $ Reaj. | — | — | — | — | — | — | 157,111 | — | |||||||||||||||||||||||||||
| $ no Reaj. | 9,577,891 | 0.00 | % | 2,832,747 | — | — | — | — | — | |||||||||||||||||||||||||||
| US$ | 12,862,368 | 11.50 | % | 29,595,608 | 11.50 | % | 46,849,488 | 6.50 | % | 11,808,090 | 6.50 | % | ||||||||||||||||||||||||
| $ Arg. | 650,185 | — | 473,626 | — | — | — | — | — | ||||||||||||||||||||||||||||
| Reales | 13,942,945 | — | 5,323,307 | — | 9,875,274 | — | — | — | ||||||||||||||||||||||||||||
| Amounts payable to related companies | US$ | — | — | 8,161,792 | — | — | — | — | — | |||||||||||||||||||||||||||
| Accrued expenses | $ no Reaj. | 3,529,014 | — | 3,475,280 | — | 9,578,252 | — | 14,941,681 | — | |||||||||||||||||||||||||||
| $ Col. | 71,951,638 | — | — | — | — | — | — | — | ||||||||||||||||||||||||||||
| Reales | 224,748,944 | — | — | — | 74,895 | — | — | — | ||||||||||||||||||||||||||||
| Deferred taxes | $ no Reaj. | — | — | — | — | 22,440,908 | — | — | — | |||||||||||||||||||||||||||
| Reimbursable financial contributions | $ Reaj. | 7,439 | — | — | — | — | — | — | — | |||||||||||||||||||||||||||
| $ no Reaj. | 1,857,133 | — | 924,411 | — | 672,401 | — | — | — | ||||||||||||||||||||||||||||
| Soles | 290,345 | — | 72,260 | — | — | — | — | — | ||||||||||||||||||||||||||||
| Other long-term liabilities | $ Reaj. | — | — | — | — | 7,063,927 | — | — | — | |||||||||||||||||||||||||||
| US$ | 689,877 | — | 718,987 | — | 204,462,123 | — | — | — | ||||||||||||||||||||||||||||
| $ Col. | 4,663,840 | — | �� | — | — | — | — | — | — | |||||||||||||||||||||||||||
| Soles | 268,393 | — | 15,554 | — | 646,954 | — | — | — | ||||||||||||||||||||||||||||
| $ Arg. | 19,063,473 | — | 397,881 | — | 774,996 | — | — | — | ||||||||||||||||||||||||||||
| Reales | 12,474,586 | — | — | — | — | — | — | — | ||||||||||||||||||||||||||||
| Total long-term liabilities by currency | $ Reaj. | 107,123 | — | 7,063,927 | 220,014,991 | |||||||||||||||||||||||||||||||
| $ no Reaj. | 14,964,038 | 7,232,438 | 32,691,561 | 14,941,681 | ||||||||||||||||||||||||||||||||
| US$ | 678,215,268 | 192,154,446 | 879,943,207 | 144,938,608 | ||||||||||||||||||||||||||||||||
| $ Col. | 222,679,721 | 231,513,935 | 261,792,340 | — | ||||||||||||||||||||||||||||||||
| Soles | 39,402,173 | 27,433,662 | 73,647,000 | 8,289,790 | ||||||||||||||||||||||||||||||||
| $ Arg. | 29,755,365 | 27,874,015 | 774,996 | — | ||||||||||||||||||||||||||||||||
| Reales | 476,952,777 | 399,365,358 | 60,782,368 | — | ||||||||||||||||||||||||||||||||
| Total long-term liabilities | 1,462,076,465 | 885,573,854 | 1,316,695,399 | 388,185,070 | ||||||||||||||||||||||||||||||||
| a. | On April 27, 2004, through Exempt resolution 814, the Superintendence of Electricity and Fuel (S.E.F.) penalized the Company for a total amount of 1,830 UTA, as a result of the blackout which occurred on January 13, 2003, that affected the area between Tal Tal and Santiago. On May 7, 2004, the Company filed an appeal whose jurisdiction and solution belongs to the Superintendence of Electricity and Fuel (S.E.F.). The S.E.F. rejected the appeal and a claim petition was filed with the Santiago Court of Appeals. Waiting for the case to be put on the weekly list of cases to be heard by that Court. | |
| The resolution issued by the Santiago Court of Appeal can be appealed against in the Supreme Court. | ||
| To this date, the Company cannot exactly forecast the effects the final resolution will have on its financial statements. |
F - 140
Table of Contents
| b. | Summary trial to complain about the fine imposed by the Superintendence of Securities and Insurance, 10 thCivil Court of Santiago (Case No. 4394-97). This summary trial was brought by Chilectra S.A. (formerly Elesur S.A.) according to the regulations of Statutory Decree 3538 (Basic Law on the Superintendence of Securities and Insurance) against such Superintendence, and its purpose is to petition for the line imposed by such inspection agency via exempt resolution No. 337 of October 31, 1997 (U.F. 100,000 — 100,000 inflation index-linked units of account) to be declared null and void. On November 17, 2000, the court ruled an appealable judgment endorsing the claim by Chilectra S.A. (formerly Elesur S.A.), declaring the fine imposed by the Superintendence null and void. The ruling states, in sum, that there was no use of privileged information since it was one of the parties to the contract’s own information. The Superintendence lodged an appeal for annulment of the ruling (case number 82-2001). On June 6, 2006, the Santiago Court of Appeals revoked the ruling, maintaining al1 parts of Exempt Resolution 337 of the Superintendence. On June 23, 2006, appeals for annulment in form and substance were lodged with the Supreme Court. On May 8, 2007, the pleas were raised in the Supreme Court. On July 26, the Supreme Court rejected the appeals for annulment in form and substance, stating, with regard to the latter remedy, that “the judgment issued by the Court of Appeal established as a fact of the case that, given its position, ELESUR had access to privileged information and that it used this information to its benefit, which cannot be reviewed by an appeal for annulment or review by a higher court on the grounds of an error of law or breach of procedural rights because there has not been any breach or infringement of the regulations regulating evidence. In point of fact, there has been no alteration of the burden of proof.” (whereas clause 19). On August 16, 2007, an interest rebate was applied for to the Treasury, which, via Official Letter 1773, endorsed the request made by Chilectra S.A., reducing interest by 50%. On August 31, 2007, Chilectra S.A. deposited Ch$ 3,562,253,019 in the Treasury, thereby concluding the proceeding. | |
| The Company and the Board of Directors have not been the target of any other sanctions by the SVS or by any other administrative authorities. |
| • | “Space cape” and pre-assembling for maintenance and improvement of installations. |
| • | Associated with handing dangerous waste controlled via the Management System | |
| • | Environmental to comply with current legislation. | |
| • | Pruning and felling associated with the need to keep the lines clear. |
F - 141
Table of Contents
| • | Tarapacá — Performance of works promised in its SGA under ISO 14,001. | |
| • | Los Molles — Resolution of environmental liabilities. | |
| • | Cipreses — Performance of environment works promised in River Maule. | |
| • | Sauzal — Performance of environment works promised in River Cachapoal and the power station, by its Environmental Management System (SGA). | |
| • | San Isidro — Performance of works promised in its SGA under ISO 14,001. | |
| • | Bocamina — Development and execution of a project to abate noise levels, which involves the power station’s noisiest equipment, as part of its SGA under ISO 14,001. | |
| • | Rapel — Resolution of environment liabilities and replacement and disposal of condensators with PCB. | |
| • | Sausalito — Replacement and disposal of condensators with PCB. | |
| • | Isla — Replacement and disposal of condensators with PCB. | |
| • | Pehuenche — Resolution of environment liabilities and landscape restoration in dome of them. | |
| • | Abanico — Performance of works associated with contaminated water traps. | |
| • | El Toro — Performance of works associated with contaminated water traps and measuring ecological flow. | |
| • | Pangue — Construction of containment spillways for oil spills from transformers. | |
| • | Ralco — Construction of containment spillways for oil spills from transformers. | |
| • | Tal Tal — Performance of works promised in its SGA under ISO 14,001. | |
| • | Diego de Almagro — Performance of works promised in its SGA under ISO 14,001. |
F - 142
Table of Contents
F - 143
Table of Contents
F - 144
Table of Contents
Under Chilean GAAP, regulatory accounting described in FAS No 71, does not apply and therefore the adjustment above mentioned has not been recorded.
| i. | A deferred tax liability or asset is recognized for the estimated future tax effects attributable to temporary differences and tax loss carryforwards. | |
| ii. | The measurement of deferred tax liabilities and assets is based on the provisions of the enacted tax law. The effects of future changes in tax laws or rates are not recognized prior to the period in which such changes are enacted into law. | |
| iii. | Deferred tax assets are reduced by a valuation allowance, to the extent that, based on the weight of available evidence, it is deemed more likely than not that the deferred tax assets will not be realized. |
F - 145
Table of Contents
F - 146
Table of Contents
| (i) | Reversal of capitalized foreign currency exchange differences related to capitalized interest. | |
| (ii) | Reversal of complementary accounts (asset or liability) recorded as a transitional provision in connection with the adoption of Technical Bulletin N°60 as of January 1, 2000. | |
| (iii) | Organizational costs deferred under Chilean GAAP that, under U.S. GAAP, should have been included in income. | |
| (iv) | The recording of derivative instruments in accordance with SFAS No. 133. | |
| (v) | The deferred income tax effects of adjustments (i), (iii) and (iv). |
| (i) | Under Chilean GAAP, for acquisitions that occurred until December 31, 2003 assets acquired and liabilities assumed were recorded at their carrying value and the excess of the purchase price over the carrying value is recorded as goodwill. Circular No. 1358, dated December 3, 1997 issued by the SVS, extended the maximum amortization period of goodwill to 20 years from the previous 10 years. | |
| Under US GAAP, assets acquired and liabilities assumed are recorded at their estimated fair values, and the excess of the purchase price over the estimated fair value of the net identifiable assets and liabilities acquired are recorded as goodwill. Prior to January 1, 2002 under US GAAP, the Company amortized goodwill on a straight-line basis over the estimated useful lives of the assets, ranging from 20 to 40 years. | ||
| On January 1, 2002, the Company adopted SFAS 142 and thus ceased amortizing goodwill under US GAAP. Instead, impairment tests are preformed at least annually on the level of reporting units. | ||
| Technical Bulletin No. 72 issued by Chilean Association of Accountants requires using fair value of acquired assets and liabilities assumed for the accounting for all acquisitions after January 1, 2004, and consequently after that date difference in accounting treatment related to the recognition of assets acquired and liabilities assumed between Chilean GAAP and US GAAP no longer exists. | ||
| (ii) | Under Chilean GAAP, the Company evaluates the carrying amount of goodwill for impairment on the level of cash-generating units. The Company determines the impairment losses using a discounted cash flow approach and recent comparable transactions in the market. In order to estimate recoverable value, the Company makes assumptions about future events that are highly uncertain at the time of estimation. The results of this analysis showed no impairment of goodwill for the years ended December 31, 2006 and 2007, apart from the impairment of goodwill over the Company’s equity method investee Gas Atacama Holding. See Note 11(j). |
F - 147
Table of Contents
| Under US GAAP, goodwill is tested for impairment at least annually on the level of reporting units, which the Company defined to be as operation units. In addition, goodwill is evaluated for impairment between these annual tests if events or changes in circumstances indicate that goodwill might be impaired. The impairment test is performed based on a two-step approach: |
| 1. | The first step is to compare each reporting unit’s fair value with its carrying amount including goodwill. If a reporting units carrying amount (including goodwill) exceeds its fair value, goodwill might be impaired and the second step is required |
| 2. | The second step is to compare the implied fair value of the reporting unit’s goodwill with the carrying amount of goodwill. The implied fair value is computed by allocating the reporting unit’s fair value to all of its assets and liabilities in a manner that is similar to a purchase price allocation in a business combination accounted for in accordance with SFAS 141. The difference between the fair value of the reporting unit and the fair value of its net assets is the implied fair value of goodwill. If the implied fair value of goodwill is less than its carrying amount, the carrying amount is written-down against income to the implied fair value of goodwill. |
| The Company carried out the required annual impairment test of goodwill in the fourth quarter of each year. | |||
| The following effects are included in the net income and shareholders’ equity reconciliation to US GAAP under paragraph (ee) below: |
| (i) | differences in the amount of goodwill under US GAAP related to basis differences in the original determination and subsequent amortization methodology between Chilean GAAP and US GAAP; | ||
| (ii) | the reversal of negative goodwill impairment under Chilean GAAP, as under US GAAP negative goodwill is treated as an adjustment to the net book value of the related fixed assets to their fair value; | ||
| (iii) | the reversal of goodwill amortization recorded under Chilean GAAP. |
| • | The reversal of negative goodwill amortization and write-offs described in paragraph (i) above, which did not meet the US GAAP impairment criteria for long-lived assets under SFAS 144 and the reversal of negative goodwill amortization recorded under Chilean GAAP; | ||
| • | The effects of reducing depreciation expense, due to the proportionate allocation of the excess purchase price to property, plant and equipment and other effects on income. |
F - 148
Table of Contents
F - 149
Table of Contents
| • | Management, having the authority to approve the action, commits to a plan of termination | ||
| • | The plan identifies the number of employees to be terminated, their job classifications or functions and their locations, and the expected completion date | ||
| • | The plan establishes the terms of the benefit arrangement, including the benefits that employees will receive upon termination (including but not limited to cash payments), in sufficient detail to enable employees to determine the type and amount of benefits they will receive if they are involuntarily terminated, and | ||
| • | Actions required to complete the plan indicate that it is unlikely that significant changes to the plan will be made or that the plan will be withdrawn. |
F - 150
Table of Contents
| • | Monetary assets and liabilities are translated at year-end rates of exchange between the US dollar and the local currency. | |
| • | All non-monetary assets and liabilities and shareholder’s equity are translated at historical rates of exchange between the US dollar and the local currency. | |
| • | Income and expense accounts are translated at average rates of exchange between the US dollar and local currency. | |
| • | The effects of any exchange rate fluctuations between the local currency and the US dollar are included in the results of operations for the period. |
F - 151
Table of Contents
F - 152
Table of Contents
| • | Endesa Costanera S.A. and Central Buenos Aires (CBA) during 2001, in which Endesa Costanera acquired the minority interest in CBA from third parties and exchanged shares with Endesa Argentina S.A. | ||
| • | During 2006, the Company’s subsidiary Edegel was merged with Etevensa, an entity which was controlled by Endesa Internacional S.A., the Company’s parent company. This reorganization included a purchase of a minority interest portion in exchange for shares of Edegel and cash. | ||
| • | On April 1, 2006 the Company’s subsidiaries Chilectra S.A. was merged with Elesur S.A. (currently Chilectra S.A.) which is 99.09% owned by Enersis S.A. This reorganization included a purchase of a minority interest portion by cash. | ||
| • | During 2007, the Company’s subsidiaries Betania and Emgesa were merged into a new entity Emgesa (merged entity). (See note 11 (f) vi). The merger was materialized through a stock exchange where the Company exchanged the shares it owned in Betania and Emgesa for shares issued by the new entity Emgesa (merged entity). In addition, as a result of the share-exchange, the Company purchased a portion of minority interest from a third party. |
F - 153
Table of Contents
F - 154
Table of Contents
| a. | The exchange of the participation in Betania against participation of Emgesa (merged entity) was accounted for as an exchange of financial assets, realizing a loss to the extent the transaction did not represent a common control transaction | ||
| b. | To the extent that minority interest was purchased from third parties, the transaction was accounted for under the purchase method pursuant to SFAS 141, with any excess of the purchase price consideration over the fair value of identifiable net assets acquired being accounted for as goodwill. | ||
| c. | To the extent third parties were involved, the disposal of a portion of participation of Emgesa (merged entity) was accounted for as a partial disposal of investments, affecting net income of the period to the extent the fair value of consideration received exceeded the book value of the investment together with the pro-rata portion of goodwill, fair value increment to net assets and accumulated other comprehensive income previously accounted for. |
F - 155
Table of Contents
| As of December 31, | ||||||||||||
| 2005 | 2006 | 2007 | ||||||||||
| ThCh$ | ThCh$ | ThCh$ | ||||||||||
Net income in accordance with Chilean GAAP | 74,584,165 | 307,121,433 | 188,376,410 | |||||||||
| Reversal of amortization of revaluation of property, plant and equipment (paragraph b) | 1,206,772 | 1,009,653 | 1,008,914 | |||||||||
| Depreciation of property, plant and equipment and difference in fixed assets value at acquisition date (paragraph c) | (1,172,796 | ) | (1,208,247 | ) | (941,192 | ) | ||||||
| Special Obligations (paragraph d) | — | — | (128,867,428 | ) | ||||||||
| Deferred income taxes (paragraph e) | 6,385,846 | 12,756,498 | 12,460,703 | |||||||||
| PIS — COFIN (paragraph f) | — | — | (13,498,514 | ) | ||||||||
| Pension and post-retirement benefits (paragraph g) | 1,646 | 167,004 | 915,409 | |||||||||
| Investments in related companies (paragraph h) | (36,326,106 | ) | 5,126,657 | 2,141,201 | ||||||||
| Amortization and impairment of goodwill (paragraph i) | 59,884,018 | 59,418,178 | 59,160,536 | |||||||||
| Amortization of negative goodwill (paragraph j) | 966,615 | 19,067,114 | 14,035,838 | |||||||||
| Capitalized interest (paragraph k) | 12,379,696 | 12,783,397 | 8,302,776 | |||||||||
| Depreciation capitalized interest (paragraph k) | (1,814,000 | ) | (2,188,351 | ) | (1,461,799 | ) | ||||||
| Difference foreign exchange capitalized (paragraph k) | 7,152 | 33,735 | 28,819 | |||||||||
| Depreciation difference foreign exchange capitalized (paragraph k) | 530,125 | 532,415 | 514,936 | |||||||||
| Accumulated deficit during the development stage (paragraph l) | — | (325,438 | ) | — | ||||||||
| Capitalized general and administrative expenses (paragraph n) | (3,216,816 | ) | (3,147,648 | ) | (9,756,672 | ) | ||||||
| Involuntary employee termination benefits (paragraph o) | (18,546 | ) | (22,871 | ) | (18,385 | ) | ||||||
| Revenue recognition in Edesur (paragraph p) | (4,277,821 | ) | 4,373,242 | — | ||||||||
| Elimination of amortization of capitalized interest in Brazil (paragraph q) | 493,421 | 501,458 | 436,268 | |||||||||
| Amortization of organizational and start-up costs (paragraph r) | 3,969,110 | 2,561,453 | 1,818,152 | |||||||||
| Derivative instruments operating income (paragraph t) | 36,185,238 | 1,137,349 | 1,933,724 | |||||||||
| Derivative instruments non operating income (paragraph t) | (2,061,584 | ) | (91,411 | ) | (2,114 | ) | ||||||
| Fair value of long-term debt assumed (paragraph u) | (1,050,635 | ) | (29,396 | ) | (29,395 | ) | ||||||
| Deferred income (paragraph v) | 137,839 | 140,244 | 121,784 | |||||||||
| Regulated assets and deferred cost (paragraph w) | 13,231,912 | (3,826,352 | ) | 479,460 | ||||||||
| Reorganization of subsidiaries (paragraph x) | (250,083 | ) | (254,446 | ) | (936,438 | ) | ||||||
| Effects of minority interest on the U.S. GAAP adjustments (paragraph y) | (7,505,287 | ) | (7,745,228 | ) | 62,097,447 | |||||||
| Deferred tax effects on the U.S. GAAP adjustments | (18,198,488 | ) | (20,213,677 | ) | (9,727,849 | ) | ||||||
| Amotization of bond discount and deferred debt issuance cost (paragraph z) | — | 2,511,606 | (494,011 | ) | ||||||||
| Asset retirement cost — (paragraph aa) | (69,240 | ) | (12,985 | ) | (25,048 | ) | ||||||
| Asset retirement obligations — liabilities (paragraph aa) | 159,403 | (1,224,564 | ) | (19,889 | ) | |||||||
Net income in accordance with U.S. GAAP | 134,161,556 | 388,950,822 | 188,053,643 | |||||||||
Net income in accordance with U.S. GAAP | 134,161,556 | 388,950,822 | 188,053,643 | |||||||||
| Other comprehensive income (loss): | ||||||||||||
| Cumulative translation adjustment determined under Chilean GAAP net of minority interest | (113,524,133 | ) | 16,948,488 | (122,816,340 | ) | |||||||
| Cumulative translation adjustment related to U.S GAAP adjustments net of minority interest | 22,703,029 | (3,581,052 | ) | 4,597,060 | ||||||||
| Fair value change of hedging instruments used in cash flow hedges | 1,414,993 | (48,057,287 | ) | 1,987,463 | ||||||||
| Application of FAS 158 | — | — | (481,754 | ) | ||||||||
| Comprehensive income in accordance with U.S.GAAP | 44,755,445 | 354,260,971 | 71,340,072 | |||||||||
F - 156
Table of Contents
| 2006 | 2007 | |||||||
| ThCh$ | ThCh$ | |||||||
Shareholders’ equity in accordance with Chilean GAAP | 3,082,253,169 | 2,903,209,631 | ||||||
| Reversal of revaluation of property, plant and equipment net of accumulated amortization revaluation of property, plant and equipment (paragraph b) | (9,921,971 | ) | (8,899,184 | ) | ||||
| Depreciation of property, plant and equipment and difference in fixed asset value at acquisition date (paragraph c) | (10,749,051 | ) | (12,267,623 | ) | ||||
| Special Obligations (paragraph d) | — | (128,867,428 | ) | |||||
| Deferred income taxes (paragraph e) | (196,296,393 | ) | (175,986,589 | ) | ||||
| PIS — COFIN (paragraph f) | — | (13,498,514 | ) | |||||
| Pension and post-retirement benefits (paragraph g) | 8,653,946 | 2,900,844 | ||||||
| Investments in related companies (paragraph h) | (2,463,392 | ) | (19,365 | ) | ||||
| Goodwill (paragraph i) | 515,047,345 | 568,247,561 | ||||||
| Goodwill gross amount (paragraph i) | 94,960,410 | 95,336,070 | ||||||
| Negative goodwill (paragraph j) | (364,500,726 | ) | (306,250,170 | ) | ||||
| Capitalized interest (paragraph k) | 85,072,971 | 80,770,462 | ||||||
| Exchange difference (paragraph k) | (21,378,757 | ) | (20,003,141 | ) | ||||
| Minimum dividend (paragraph m) | (51,240,560 | ) | (37,842,392 | ) | ||||
| Capitalized general and administrative expenses (paragraph n) | (31,546,887 | ) | (39,130,341 | ) | ||||
| Involuntary employee termination benefits (paragraph o) | 41,741 | 17,888 | ||||||
| Elimination of capitalized interest in Brazil (paragraph q) | (5,441,695 | ) | (4,292,633 | ) | ||||
| Organizational and start-up costs (paragraph r) | (8,406,751 | ) | (5,487,421 | ) | ||||
| Derivative instruments (paragraph t) | (35,814,533 | ) | (30,543,260 | ) | ||||
| Fair value of long-term debt assumed (paragraph u) | 176,373 | 146,978 | ||||||
| Deferred income (paragraph v) | (2,103,656 | ) | (1,706,320 | ) | ||||
| Regulated assets and deferred cost (paragraph w) | (551,729 | ) | — | |||||
| Reorganization of subsidiaries (paragraph x) | 14,838,595 | 30,276,263 | ||||||
| Effects of minority interest on the U.S. GAAP adjustments (paragraph y) | 205,265,271 | 272,692,694 | ||||||
| Deferred tax effects on the U.S. GAAP adjustments | (7,837,957 | ) | (11,624,865 | ) | ||||
| Amotization of bond discount and deferred debt issuance cost (paragraph z) | 2,511,606 | 2,017,595 | ||||||
| Asset retirement cost (paragraph aa) | 587,644 | 1,020,950 | ||||||
| Asset retirement obligations — liabilities (paragraph aa) | (2,297,416 | ) | (2,584,425 | ) | ||||
Shareholders’ equity in accordance with U.S. GAAP | 3,258,857,597 | 3,157,633,265 | ||||||
F - 157
Table of Contents
| As of December 31, | ||||||||||||
| 2005 | 2006 | 2007 | ||||||||||
| ThCh$ | ThCh$ | ThCh$ | ||||||||||
| Shareholders equity in accordance with U.S. GAAP — January 1 | 2,992,920,758 | 3,006,539,862 | 3,258,857,597 | |||||||||
| Dividends paid during the year | (14,913,701 | ) | (73,992,114 | ) | (177,019,145 | ) | ||||||
| Reversal of dividends payable as of previous balance sheet date | 9,270,240 | 17,277,401 | 51,240,560 | |||||||||
| Minimum dividend payable (paragraph m) | (17,277,401 | ) | (51,240,560 | ) | (37,842,392 | ) | ||||||
| Reorganization under common control (paragraph x and bb) | (8,215,479 | ) | (5,150,688 | ) | (8,943,427 | ) | ||||||
| Fair value change of hedging instruments used in cash flow hedges, net of deferred tax | 1,414,993 | (48,057,287 | ) | 1,987,463 | ||||||||
| Adoption of FAS 158, Brazilian subsidiaries, net of deferred tax | — | 11,162,725 | (481,754 | ) | ||||||||
| Cumulative translation adjustment | (90,821,104 | ) | 13,367,436 | (118,219,280 | ) | |||||||
| Net income in accordance with U.S. GAAP for the year | 134,161,556 | 388,950,822 | 188,053,643 | |||||||||
| Shareholders equity in accordance with U.S.GAAP — December 31 | 3,006,539,862 | 3,258,857,597 | 3,157,633,265 | |||||||||
| As of December 31, | ||||||||
| 2006 | 2007 | |||||||
| ThCh$ | ThCh$ | |||||||
| Goodwill | 1,934,856,476 | 1,932,312,476 | ||||||
| Less: accumulated amortization | (1,231,319,891 | ) | (1,291,134,063 | ) | ||||
| Goodwill, net | 703,536,585 | 641,178,413 | ||||||
| Negative goodwill | (510,622,612 | ) | (512,683,267 | ) | ||||
| Less: accumulated amortization | 470,867,088 | 475,288,947 | ||||||
| Negative goodwill, net | (39,755,524 | ) | (37,394,320 | ) | ||||
F - 158
Table of Contents
| For the year ended December 31, | ||||||||||||
| 2005 | 2006 | 2007 | ||||||||||
| Ch$ | Ch$ | Ch$ | ||||||||||
| Chilean GAAP earnings per share | 2.28 | 9.41 | 5.77 | |||||||||
| Basic and diluted U.S. GAAP earnings per share | 4.11 | 11.91 | 5.76 | |||||||||
| Total number of common outstanding shares at December 31, | 32,651,166 | 32,651,166 | 32.651.166 | |||||||||
| Weighted average number of common shares outstanding (000’s) | 32,651,166 | 32,651,166 | 32.651.166 | |||||||||
F - 159
Table of Contents
| 2005 | ||||||||||||||||||||||||
| Chile | Argentina | Peru | Brazil | Colombia | Total | |||||||||||||||||||
| ThCh$ | ThCh$ | ThCh$ | ThCh$ | ThCh$ | ThCh$ | |||||||||||||||||||
| Income tax provision under Chilean GAAP | ||||||||||||||||||||||||
| Current income taxes as determined under Chilean GAAP | (13,701,386 | ) | (6,531,384 | ) | (26,415,914 | ) | (27,948,702 | ) | (80,639,390 | ) | (155,236,776 | ) | ||||||||||||
| Deferred income taxes as determined under Chilean GAAP | (30,218,063 | ) | (6,508,785 | ) | (2,296,864 | ) | 2,768,480 | 508,596 | (35,746,636 | ) | ||||||||||||||
| Total income tax provision under Chilean GAAP | (43,919,449 | ) | (13,040,169 | ) | (28,712,778 | ) | (25,180,222 | ) | (80,130,794 | ) | (190,983,412 | ) | ||||||||||||
| U.S. GAAP adjustments: | ||||||||||||||||||||||||
| Deferred tax effect of applying SFAS No. 109 | 256,721 | 138,476 | 5,990,649 | — | — | 6,385,846 | ||||||||||||||||||
| Deferred tax effect of adjustments to U.S. GAAP | (11,178,775 | ) | 1,877,464 | (1,137,897 | ) | (7,672,408 | ) | (86,873 | ) | (18,198,489 | ) | |||||||||||||
| U.S. GAAP reclassifications (1) | 1,747,136 | — | — | — | 1,719,123 | 3,466,259 | ||||||||||||||||||
| Total U.S. GAAP adjustments: | (9,174,918 | ) | 2,015,940 | 4,852,752 | (7,672,408 | ) | 1,632,250 | (8,346,384 | ) | |||||||||||||||
| Total Income tax provision under U.S. GAAP | (53,094,367 | ) | (11,024,229 | ) | (23,860,026 | ) | (32,852,630 | ) | (78,498,544 | ) | (199,329,796 | ) | ||||||||||||
| 2006 | ||||||||||||||||||||||||
| Chile | Argentina | Peru | Brazil | Colombia | Total | |||||||||||||||||||
| ThCh$ | ThCh$ | ThCh$ | ThCh$ | ThCh$ | ThCh$ | |||||||||||||||||||
| Income tax provision under Chilean GAAP | ||||||||||||||||||||||||
| Current income taxes as determined under Chilean GAAP | (52,091,521 | ) | (4,841,426 | ) | (36,242,876 | ) | (71,858,002 | ) | (91,513,462 | ) | (256,547,287 | ) | ||||||||||||
| Deferred income taxes as determined under Chilean GAAP | 89,843,031 | (11,685,157 | ) | (8,792,806 | ) | 59,784,655 | 25,140,834 | 154,290,557 | ||||||||||||||||
| Total income tax provision under Chilean GAAP | 37,751,510 | (16,526,583 | ) | (45,035,682 | ) | (12,073,347 | ) | (66,372,628 | ) | (102,256,730 | ) | |||||||||||||
| U.S. GAAP adjustments: | ||||||||||||||||||||||||
| Deferred tax effect of applying SFAS No. 109 | 6,267,246 | 134,009 | 6,355,243 | — | — | 12,756,498 | ||||||||||||||||||
| Deferred tax effect of adjustments to U.S. GAAP | (7,609,644 | ) | (3,842,324 | ) | (8,024,614 | ) | 1,830,848 | (2,567,942 | ) | (20,213,676 | ) | |||||||||||||
| U.S. GAAP reclassifications (1) | 92,404 | — | — | — | 195,709 | 288,113 | ||||||||||||||||||
| Total U.S. GAAP adjustments: | (1,249,994 | ) | (3,708,315 | ) | (1,669,371 | ) | 1,830,848 | (2,372,233 | ) | (7,169,065 | ) | |||||||||||||
| Total Income tax provision under U.S. GAAP | 36,501,516 | (20,234,898 | ) | (46,705,053 | ) | (10,242,499 | ) | (68,744,861 | ) | (109,425,795 | ) | |||||||||||||
| 2007 | ||||||||||||||||||||||||
| Chile | Argentina | Peru | Brazil | Colombia | Total | |||||||||||||||||||
| ThCh$ | ThCh$ | ThCh$ | ThCh$ | ThCh$ | ThCh$ | |||||||||||||||||||
| Income tax provision under Chilean GAAP | ||||||||||||||||||||||||
| Current income taxes as determined under Chilean GAAP | (38,247,208 | ) | (26,513,785 | ) | (34,017,695 | ) | (61,188,995 | ) | (56,808,612 | ) | (216,776,295 | ) | ||||||||||||
| Deferred income taxes as determined under Chilean GAAP | (33,827,978 | ) | (6,759,289 | ) | 33,297 | 6,259,829 | (2,077,000 | ) | (36,371,141 | ) | ||||||||||||||
| Total income tax provision under Chilean GAAP | (72,075,186 | ) | (33,273,074 | ) | (33,984,398 | ) | (54,929,166 | ) | (58,885,612 | ) | (253,147,436 | ) | ||||||||||||
| U.S. GAAP adjustments: | ||||||||||||||||||||||||
| Deferred tax effect of applying SFAS No. 109 | 6,415,518 | 114,733 | 5,930,452 | — | — | 12,460,703 | ||||||||||||||||||
| Deferred tax effect of adjustments to U.S. GAAP | (8,167,573 | ) | 537,798 | (7,977,720 | ) | 5,537,104 | 342,542 | (9,727,849 | ) | |||||||||||||||
| Total U.S. GAAP adjustments: | (1,752,055 | ) | 652,531 | (2,047,268 | ) | 5,537,104 | 342,542 | 2,732,854 | ||||||||||||||||
| Total Income tax provision under U.S. GAAP | (73,827,241 | ) | (32,620,543 | ) | (36,031,666 | ) | (49,392,062 | ) | (58,543,070 | ) | (250,414,582 | ) | ||||||||||||
| (1) | Certain tax-related income under Chilean GAAP are classified as non-operating, but under US GAAP would be classified as income taxes. |
F - 160
Table of Contents
| 2006 | 2007 | |||||||||||||||||||||||
| SFAS No. 109 | SFAS No. 109 | |||||||||||||||||||||||
| Applied to | SFAS No. | Total | Applied to | SFAS No. | Total | |||||||||||||||||||
| Chilean | 109 applied | Deferred | Chilean | 109 applied | Deferred | |||||||||||||||||||
| GAAP | to U.S. GAAP | Taxes under | GAAP | to U.S. GAAP | Taxes under | |||||||||||||||||||
| Balances | Adjustments | SFAS No. 109 | Balances | Adjustments | SFAS No. 109 | |||||||||||||||||||
| ThCh$ | ThCh$ | ThCh$ | ThCh$ | ThCh$ | ThCh$ | |||||||||||||||||||
Deferred income tax assets: | ||||||||||||||||||||||||
| Property, plant and equipment | 2,941,948 | 109,536,827 | 112,478,775 | 2,579,361 | 120,457,544 | 123,036,905 | ||||||||||||||||||
| Allowance for doubtful accounts | 72,545,891 | — | 72,545,891 | 78,634,782 | — | 78,634,782 | ||||||||||||||||||
| Actuarial deficit (companies in Brazil) | 11,277,352 | — | 11,277,352 | 12,297,971 | — | 12,297,971 | ||||||||||||||||||
| Deferred income | 2,401,696 | — | 2,401,696 | 2,373,336 | — | 2,373,336 | ||||||||||||||||||
| Provision real estate projects | 2,543,050 | — | 2,543,050 | 2,430,203 | — | 2,430,203 | ||||||||||||||||||
| Derivative contracts | — | 9,864,280 | 9,864,280 | — | 9,313,092 | 9,313,092 | ||||||||||||||||||
| Vacation accrual | 1,232,038 | — | 1,232,038 | 1,264,274 | — | 1,264,274 | ||||||||||||||||||
| Tax loss carryforwards (1) | 259,712,688 | — | 259,712,688 | 195,709,604 | — | 195,709,604 | ||||||||||||||||||
| Contingencies | 91,587,680 | — | 91,587,680 | 79,105,066 | 4,589,495 | 83,694,561 | ||||||||||||||||||
| Salaries for construction-in progress | 4,310,885 | — | 4,310,885 | 4,291,425 | — | 4,291,425 | ||||||||||||||||||
| Allowance for tariff decree | — | — | — | 6,897,750 | — | 6,897,750 | ||||||||||||||||||
| Intangible | — | — | — | 1,016,092 | — | 1,016,092 | ||||||||||||||||||
| Valuation allowance | (42,958,129 | ) | (1,186,363 | ) | (44,144,492 | ) | (16,109,759 | ) | (3,477,139 | ) | (19,586,898 | ) | ||||||||||||
| Others | 15,411,698 | 1,339,636 | 16,751,334 | 13,041,523 | 735,864 | 13,777,387 | ||||||||||||||||||
| Provision for employee benefits | 5,958,815 | (2,942,342 | ) | 3,016,473 | 4,156,789 | (986,287 | ) | 3,170,502 | ||||||||||||||||
| Total deferred income tax assets | 426,965,612 | 116,612,038 | 543,577,650 | 387,688,417 | 130,632,569 | 518,320,986 | ||||||||||||||||||
Deferred income tax liabilities: | ||||||||||||||||||||||||
| Property, plant and equipment (2) | 442,046,191 | 90,014,428 | 532,060,619 | 425,638,818 | 110,984,264 | 536,623,082 | ||||||||||||||||||
| Severance indemnities | 1,801,981 | — | 1,801,981 | 1,701,576 | — | 1,701,576 | ||||||||||||||||||
| Regulated assets | 31,118,055 | (187,588 | ) | 30,930,467 | 25,690,403 | — | 25,690,403 | |||||||||||||||||
| Finance costs | 16,490,104 | — | 16,490,104 | 19,427,055 | — | 19,427,055 | ||||||||||||||||||
| Derivative contracts | — | 5,251,174 | 5,251,174 | — | 3,444,913 | 3,444,913 | ||||||||||||||||||
| Bond discount | 1,587,909 | 426,973 | 2,014,882 | 1,311,724 | 342,991 | 1,654,715 | ||||||||||||||||||
| Cost of studies | 9,043,752 | — | 9,043,752 | 8,960,610 | — | 8,960,610 | ||||||||||||||||||
| Imputed interest on construction | 4,034,502 | — | 4,034,502 | 3,959,224 | — | 3,959,224 | ||||||||||||||||||
| Materials used | 871,574 | — | 871,574 | 806,387 | — | 806,387 | ||||||||||||||||||
| Exchange difference | 20,060,608 | — | 20,060,608 | 6,798,246 | — | 6,798,246 | ||||||||||||||||||
| Capitalized expenses | 2,288,007 | — | 2,288,007 | 2,352,113 | — | 2,352,113 | ||||||||||||||||||
| Capitalized interest | — | 28,915,023 | 28,915,023 | — | 27,454,019 | 27,454,019 | ||||||||||||||||||
| Others | 14,652,117 | 29,983 | 14,682,100 | 21,060,616 | 31,247 | 21,091,863 | ||||||||||||||||||
| Total deferred income tax liabilities | 543,994,800 | 124,449,993 | 668,444,793 | 517,706,772 | 142,257,434 | 659,964,206 | ||||||||||||||||||
| Net deferred assets (liabilities) | (117,029,188 | ) | (7,837,955 | ) | (124,867,143 | ) | (130,018,355 | ) | (11,624,865 | ) | (141,643,220 | ) | ||||||||||||
| Complementary Account | 196,296,393 | (196,296,393 | ) | — | 175,986,589 | (175,986,589 | ) | - | ||||||||||||||||
| Net deferred assets (liabilities) | 79,267,205 | (204,134,348 | ) | (124,867,143 | ) | 45,968,234 | (187,611,454 | ) | (141,643,220 | ) | ||||||||||||||
| (1) | Tax loss carryforwards relate primarily to Chilean and Brazilian entities. In accordance with the current enacted tax law in Chile such tax losses may be carried-forward indefinitely. | |
| (2) | In September 2004, the Peruvian tax court ruled invalid the tax basis of certain assets held by Edegel S.A. Based on this ruling, the Company has increased the long-term deferred tax liability ThCh$ 80,429,245, in order to reflect the write-off of the corresponding tax-basis assets held in Peru. As such estimate of future deductible amounts was determined prior to the acquisition of Edegel in connection with the acquisition of Endesa Chile in 1999, the Company has adjusted goodwill by a corresponding amount in accordance with SFAS No. 109 “Accounting for Income Taxes” (“SFAS No. 109”) and EITF 93-7 “Uncertainties Related to Income Taxes in a Business Combination”. |
F - 161
Table of Contents
| December 31, 2006 | December 31, 2007 | |||||||||||||||
| Year of | Year of | |||||||||||||||
| Amount | expiration | Amount | expiration | |||||||||||||
| ThCh$ | ThCh$ | |||||||||||||||
| Chile | 1,181,387,591 | Do not expire | 998,365,867 | Do not expire | ||||||||||||
| Argentina | 10,812,910 | 2007/2008 | 143,333,455 | 2008/2012 | ||||||||||||
| Colombia (a) | 77,220,205 | 2007 | — | — | ||||||||||||
| Brazil | 211,058,851 | 2007/2012 | 182,723,059 | 2012 | ||||||||||||
| Total | 1,480,479,557 | 1,324,422,381 | ||||||||||||||
| (a) | During the years ended December 31, 2005 and 2006, management did not expect that the subsidiaries in Colombia will be able to recover deferred tax assets related to tax loss carry forwards. Thus, as of December 31, 2006, a valuation allowance has been recorded, which covered the whole amount of the deferred tax asset related to tax loss carryforwards. However, due to the merger of the Company’s Colombian Subsidiaries, the tax loss carryforwards were applied against income during the year ended December 31, 2007. |
| 2005 | ||||||||||||||||||||||||
| Chile | Argentina | Peru | Brazil | Colombia | Total | |||||||||||||||||||
| ThCh$ | ThCh$ | ThCh$ | ThCh$ | ThCh$ | ThCh$ | |||||||||||||||||||
| Statutory US GAAP tax | (33,125,972 | ) | 7,771,672 | (15,296,579 | ) | (17,237,282 | ) | (33,041,753 | ) | (90,929,914 | ) | |||||||||||||
| Effect of higher foreign tax rates | — | 8,228,830 | (14,846,679 | ) | (15,706,840 | ) | (39,018,124 | ) | (61,342,813 | ) | ||||||||||||||
| Increase (decrease) in rates resulting from: | ||||||||||||||||||||||||
| for tax purposes | 4,895,231 | (7,175,270 | ) | — | — | 122,679 | (2,157,360 | ) | ||||||||||||||||
| Non-taxable items | 14,586,454 | 2,128,394 | 10,135,640 | 18,215,005 | 9,591,781 | 54,657,274 | ||||||||||||||||||
| Non-deductible items | (40,376,479 | ) | (20,487,565 | ) | (2,502,421 | ) | (18,101,813 | ) | (16,083,300 | ) | (97,551,578 | ) | ||||||||||||
| Effect of change in valuation allowance | (673,630 | ) | — | — | — | 1,447,967 | 774,337 | |||||||||||||||||
| Prior years income tax | 838,164 | — | — | — | — | 838,164 | ||||||||||||||||||
| Other | (985,271 | ) | (1,490,290 | ) | (1,349,987 | ) | (21,700 | ) | (3,236,917 | ) | (7,084,165 | ) | ||||||||||||
| US GAAP reclassifications (1) | 1,747,136 | — | — | — | 1,719,123 | 3,466,259 | ||||||||||||||||||
| Tax (benefit) expense at effective tax rate | (53,094,367 | ) | (11,024,229 | ) | (23,860,026 | ) | (32,852,630 | ) | (78,498,544 | ) | (199,329,796 | ) | ||||||||||||
| 2006 | ||||||||||||||||||||||||
| Chile | Argentina | Peru | Brazil | Colombia | Total | |||||||||||||||||||
| ThCh$ | ThCh$ | ThCh$ | ThCh$ | ThCh$ | ThCh$ | |||||||||||||||||||
| Statutory US GAAP tax | (58,205,735 | ) | (2,417,482 | ) | (11,249,822 | ) | (28,977,913 | ) | (37,038,593 | ) | (137,889,545 | ) | ||||||||||||
| Effect of higher foreign tax rates | — | (2,559,686 | ) | (10,918,944 | ) | (28,977,912 | ) | (46,842,928 | ) | (89,299,470 | ) | |||||||||||||
| Increase (decrease) in rates resulting from: | ||||||||||||||||||||||||
| for tax purposes | (5,699,395 | ) | (6,541,127 | ) | — | — | 25,582,390 | 13,341,868 | ||||||||||||||||
| Non-taxable items | 17,762,225 | 5,932,875 | 1,723,076 | 58,367,613 | 4,184,675 | 87,970,464 | ||||||||||||||||||
| Non-deductible items | (67,774,434 | ) | (14,634,403 | ) | (26,354,807 | ) | (16,600,274 | ) | (16,017,548 | ) | (141,381,466 | ) | ||||||||||||
| Effect of change in valuation allowance | 140,610,577 | — | — | — | (62,458 | ) | 140,548,119 | |||||||||||||||||
| Prior years income tax | 6,509,183 | — | — | — | — | 6,509,183 | ||||||||||||||||||
| Other | 3,206,691 | (15,075 | ) | 95,444 | 5,945,987 | 1,253,892 | 10,486,939 | |||||||||||||||||
| US GAAP reclassifications (1) | 92,404 | — | — | — | 195,709 | 288,113 | ||||||||||||||||||
| Tax (benefit) expense at effective tax rate | 36,501,516 | (20,234,898 | ) | (46,705,053 | ) | (10,242,499 | ) | (68,744,861 | ) | (109,425,795 | ) | |||||||||||||
| 2007 | ||||||||||||||||||||||||
| Chile | Argentina | Peru | Brazil | Colombia | Total | |||||||||||||||||||
| ThCh$ | ThCh$ | ThCh$ | ThCh$ | ThCh$ | ThCh$ | |||||||||||||||||||
| Statutory US GAAP tax | (41,950,759 | ) | (16,113,212 | ) | (7,775,767 | ) | (6,303,694 | ) | (30,519,420 | ) | (102,662,851 | ) | ||||||||||||
| Effect of higher foreign tax rates | — | (17,686,209 | ) | (6,803,359 | ) | (6,303,694 | ) | (30,365,782 | ) | (61,159,044 | ) | |||||||||||||
| Increase (decrease) in rates resulting from: | ||||||||||||||||||||||||
| for tax purposes | (21,163,460 | ) | 1,097,453 | (14,337 | ) | — | — | (20,080,344 | ) | |||||||||||||||
| Non-taxable items | 97,632,701 | 22,271,833 | 4,847,780 | 63,859,533 | 13,083,912 | 201,695,758 | ||||||||||||||||||
| Non-deductible items | (104,811,652 | ) | (22,190,408 | ) | (25,504,480 | ) | (102,252,106 | ) | (36,504,252 | ) | (291,262,898 | ) | ||||||||||||
| Effect of change in valuation allowance | (4,038,454 | ) | — | — | — | 25,352,804 | 21,314,350 | |||||||||||||||||
| Prior years income tax | 1,996,665 | — | — | — | — | 1,996,665 | ||||||||||||||||||
| Other | (1,492,282 | ) | — | (781,503 | ) | 1,607,899 | 409,668 | (256,218 | ) | |||||||||||||||
| Tax (benefit) expense at effective tax rate | (73,827,241 | ) | (32,620,543 | ) | (36,031,666 | ) | (49,392,062 | ) | (58,543,070 | ) | (250,414,582 | ) | ||||||||||||
| (1) | US GAAP reclassifications are tax related income that under Chilean GAAP are classified as non-operating income, but under US GAAP would be classified as income taxes. |
F-162
Table of Contents
| Jurisdiction | Tax Years Subject to Examination | |||
| Chile | 2003-2007 | |||
| Argentina | 2002-2007 | |||
| Brazil | 2003-2007 | |||
| Colombia | 2005-2007 | |||
| Peru | 2003-2007 | |||
F - 163
Table of Contents
Distribution
Transmission
Engineering Services and Real Estate
Corporate and other
F - 164
Table of Contents
| Engineering | ||||||||||||||||||||||||||||
| services and | Corporate | |||||||||||||||||||||||||||
| 2005 | Generation | Transmission | Distribution | real estate | and other | Eliminations | Consolidated | |||||||||||||||||||||
| ThCh$ | ThCh$ | ThCh$ | ThCh$ | ThCh$ | ThCh$ | ThCh$ | ||||||||||||||||||||||
| Sales to unaffiliated customers | 947,742,300 | 14,056,856 | 2,432,503,410 | 22,633,334 | 69,574,227 | 414,183 | 3,486,924,310 | |||||||||||||||||||||
| Intersegment sales | 306,514,148 | 16,673,990 | 18,585,396 | 13,937,630 | 122,686,858 | (431,872,273 | ) | 46,525,749 | ||||||||||||||||||||
| Total revenues | 1,254,256,448 | 30,730,846 | 2,451,088,806 | 36,570,964 | 192,261,085 | (431,458,090 | ) | 3,533,450,059 | ||||||||||||||||||||
| Operating income | 452,810,056 | 14,326,046 | 421,409,513 | 3,405,471 | (505,819 | ) | (1,481,541 | ) | 889,963,726 | |||||||||||||||||||
| Participation in net income of affiliate companies | 14,724,108 | — | 3,408,393 | 166,880 | 164,747,114 | (175,649,321 | ) | 7,397,174 | ||||||||||||||||||||
| Depreciation and amortization | 175,993,345 | 2,966,483 | 212,312,699 | 2,198,904 | 62,283,939 | — | 455,755,370 | |||||||||||||||||||||
| Identifiable assets including investment in related companies | 5,938,310,259 | 536,874,481 | 5,195,639,865 | 116,488,706 | 5,276,402,995 | (5,820,098,656 | ) | 11,243,617,650 | ||||||||||||||||||||
| Capital expenditures | 65,846,330 | 352,780 | 275,010,348 | 1,543,585 | 5,347,116 | — | 348,100,159 | |||||||||||||||||||||
| Engineering | ||||||||||||||||||||||||||||
| services and | Corporate | |||||||||||||||||||||||||||
| 2006 | Generation | Transmission | Distribution | real estate | and other | Eliminations | Consolidated | |||||||||||||||||||||
| ThCh$ | ThCh$ | ThCh$ | ThCh$ | ThCh$ | ThCh$ | ThCh$ | ||||||||||||||||||||||
| Sales to unaffiliated customers | 1,228,746,687 | 85,946,998 | 2,696,892,920 | 36,413,907 | 71,404,808 | — | 4,119,405,320 | |||||||||||||||||||||
| Intersegment sales | 355,255,370 | 68,601,502 | 20,363,576 | 17,045,631 | 143,436,094 | (568,262,790 | ) | 36,439,383 | ||||||||||||||||||||
| Total revenues | 1,584,002,057 | 154,548,500 | 2,717,256,496 | 53,459,538 | 214,840,902 | (568,262,790 | ) | 4,155,844,703 | ||||||||||||||||||||
| Operating income | 627,179,827 | (814,646 | ) | 503,791,673 | 10,596,057 | (10,322,791 | ) | 1,200,522 | 1,131,630,642 | |||||||||||||||||||
| Participation in net income of affiliate companies | 45,256,636 | — | 22,464,422 | 126,273 | 419,403,570 | (481,839,080 | ) | 5,411,821 | ||||||||||||||||||||
| Depreciation and amortization | 203,770,406 | 14,559,129 | 221,967,138 | 2,422,318 | 64,538,367 | — | 507,257,358 | |||||||||||||||||||||
| Identifiable assets including investment in related companies | 6,248,239,898 | 494,745,281 | 5,727,091,588 | 127,625,355 | 5,237,344,916 | (5,954,019,468 | ) | 11,881,027,570 | ||||||||||||||||||||
| Capital expenditures | 186,351,958 | 2,033,816 | 360,721,841 | 1,752,111 | 5,223,478 | — | 556,083,204 | |||||||||||||||||||||
| Engineering | ||||||||||||||||||||||||||||
| services and | Corporate | |||||||||||||||||||||||||||
| 2007 | Generation | Transmission | Distribution | real estate | and other | Eliminations | Consolidated | |||||||||||||||||||||
| ThCh$ | ThCh$ | ThCh$ | ThCh$ | ThCh$ | ThCh$ | ThCh$ | ||||||||||||||||||||||
| Sales to unaffiliated customers | 1,519,129,481 | 209,542,985 | 2,805,878,497 | 35,442,673 | 60,612,108 | — | 4,630,605,744 | |||||||||||||||||||||
| Intersegment sales | 395,673,119 | 51,827,205 | 16,747,611 | 19,302,084 | 142,200,614 | (569,680,818 | ) | 56,069,815 | ||||||||||||||||||||
| Total revenues | 1,914,802,600 | 261,370,190 | 2,822,626,108 | 54,744,757 | 202,812,722 | (569,680,818 | ) | 4,686,675,559 | ||||||||||||||||||||
| Operating income | 662,072,640 | 23,180,273 | 562,686,523 | 8,452,765 | (4,585,296 | ) | 3,759,788 | 1,255,566,693 | ||||||||||||||||||||
| Participation in net income of affiliate companies | (10,699,853 | ) | — | 29,990,247 | 262,095 | 291,009,242 | (365,322,784 | ) | (54,761,053 | ) | ||||||||||||||||||
| Depreciation and amortization | 204,838,817 | 12,391,572 | 196,841,035 | 2,562,866 | 64,184,754 | — | 480,819,044 | |||||||||||||||||||||
| Identifiable assets including investment in related companies | 6,005,952,696 | 424,670,546 | 5,529,312,433 | 83,146,627 | 4,935,684,441 | (5,541,000,099 | ) | 11,437,766,644 | ||||||||||||||||||||
| Capital expenditures | 210,021,708 | 162,528 | 378,287,983 | 1,430,656 | 4,152,446 | — | 594,055,321 | |||||||||||||||||||||
F - 165
Table of Contents
| Chile | Argentina | Peru | Brazil | Colombia | Total | |||||||||||||||||||
| ThCh$ | ThCh$ | ThCh$ | ThCh$ | ThCh$ | ThCh$ | |||||||||||||||||||
2005 | ||||||||||||||||||||||||
| Total revenues | 1,169,994,549 | 432,381,788 | 322,484,538 | 964,421,327 | 644,167,857 | 3,533,450,059 | ||||||||||||||||||
2006 | ||||||||||||||||||||||||
| Total revenues | 1,329,850,962 | 529,308,911 | 394,823,067 | 1,187,880,330 | 713,981,433 | 4,155,844,703 | ||||||||||||||||||
| Long lived assets (net) (1) | 2,601,413,450 | 1,089,978,390 | 1,073,768,221 | 1,999,399,701 | 1,921,348,006 | 8,685,907,768 | ||||||||||||||||||
| Total assets | 3,655,331,862 | 1,409,448,181 | 1,197,079,103 | 3,218,526,524 | 2,403,718,051 | 11,884,103,721 | ||||||||||||||||||
2007 | ||||||||||||||||||||||||
| Total revenues | 1,672,000,731 | 564,779,021 | 359,779,927 | 1,311,140,787 | 778,975,093 | 4,686,675,559 | ||||||||||||||||||
| Long lived assets (net) (1) | 2,705,339,585 | 928,594,019 | 919,360,304 | 1,798,513,681 | 1,655,538,527 | 8,007,346,116 | ||||||||||||||||||
| Total assets | 3,812,322,629 | 1,295,898,049 | 1,018,879,010 | 3,130,195,643 | 2,180,471,313 | 11,437,766,644 | ||||||||||||||||||
| (1) | Long-lived assets include property, plant and equipment. |
| As of | ||||
| December 31, 2007 | ||||
| ThCh$ | ||||
| 2008 | 689,224,125 | |||
| 2009 | 697,315,381 | |||
| 2010 | 345,274,845 | |||
| 2011 | 493,478,977 | |||
| 2012 | 321,564,335 | |||
| Thereafter | 1,436,981,624 | |||
| Total | 3,983,839,287 | |||
| Year ended December 31, | ||||||||||||
| 2005 | 2006 | 2007 | ||||||||||
| ThCh$ | ThCh$ | ThCh$ | ||||||||||
| Interest expense incurred | 384,527,149 | 419,622,162 | 407,285,992 | |||||||||
| Interest capitalized under Chilean GAAP | — | 6,211,632 | 5,220,177 | |||||||||
| Interest capitalized under U.S. GAAP | 12,379,696 | 18,995,028 | 13,522,953 | |||||||||
F - 166
Table of Contents
| (i) | The statement of cash flows under Chile GAAP differs in certain respects from the presentation of a statement of cash flow under U.S. GAAP. Marketable securities under Chile GAAP qualify as cash flow equivalent, whereas under U.S. GAAP they are classified as available — for -sale securities (See note 36 II (q)) |
| As of December 31, | ||||||||||||
| 2005 | 2006 | 2007 | ||||||||||
| ThCh$ | ThCh$ | ThCh$ | ||||||||||
| Cash flow from operating activities — Chile GAAP and US GAAP | 899,097,063 | 926,226,558 | 954,434,311 | |||||||||
| Cash flow from financing activities — Chile GAAP and US GAAP | (820,816,598 | ) | (319,074,513 | ) | (178,482,376 | ) | ||||||
| Cash flow investing activities Chile GAAP | (362,654,441 | ) | (545,249,093 | ) | (691,537,359 | ) | ||||||
| Differences between Chilean GAAP and US GAAP: | ||||||||||||
| Purchase of marketable securities during period | (5,823,226 | ) | (9,687,242 | ) | (10,299,039 | ) | ||||||
| Sale of marketable securities during period | 13,997,635 | 5,823,226 | 9,687,242 | |||||||||
| Cash flow investing activities US GAAP | (354,480,032 | ) | (549,113,109 | ) | (692,149,156 | ) | ||||||
| Net cash flow | (276,199,567 | ) | 58,038,936 | 83,802,779 | ||||||||
| Effect of price-level restatement and foreign exchange differences | (22,990,227 | ) | 15,657,548 | 19,449,757 | ||||||||
| Net increase (decrease) in cash and cash equivalent | (299,189,794 | ) | 73,696,484 | 103,252,536 | ||||||||
| Cash and cash equivalent at beginning of the year | 607,680,365 | 389,273,345 | 462,969,829 | |||||||||
| Additional cash resulting from creation of Endesa Brasil | 80,782,774 | — | — | |||||||||
| Cash and cash equivalent at end of the year | 389,273,345 | 462,969,829 | 566,222,365 | |||||||||
| (ii) | The reconciliation of cash and cash equivalents from Chilean GAAP to U.S. GAAP as of December 31, 2005, 2006 and 2007 is as follows: |
| Year ended December 31, | ||||||||||||
| 2005 | 2006 | 2007 | ||||||||||
| ThCh$ | ThCh$ | ThCh$ | ||||||||||
| Cash and cash equivalent under Chilean GAAP | 395,096,571 | 472,657,071 | 576,521,404 | |||||||||
| Elimination of marketable securities | (5,823,226 | ) | (9,687,242 | ) | (10,299,039 | ) | ||||||
| Total cash and cash equivalents under US GAAP | 389,273,345 | 462,969,829 | 566,222,365 | |||||||||
| (iii) | Additional disclosures required under U.S. GAAP are as follows: |
| Years ended December 31, | ||||||||||||
| 2005 | 2006 | 2007 | ||||||||||
| ThCh$ | ThCh$ | ThCh$ | ||||||||||
| Interest paid during the year | 316,999,583 | 321,298,206 | 326,615,508 | |||||||||
| Income taxes paid during the year | 107,426,016 | 167,453,325 | 151,919,528 | |||||||||
F - 167
Table of Contents
| (iv) | Under US GAAP, cash and cash equivalents includes all highly liquid debt instruments purchased with a maturity of three months or less: |
| Years ended December 31, | ||||||||||||
| 2005 | 2006 | 2007 | ||||||||||
| ThCh$ | ThCh$ | ThCh$ | ||||||||||
| Cash | 78,266,397 | 107,178,991 | 81,979,611 | |||||||||
| Time deposits and repurchase agreements | 311,006,948 | 355,790,838 | 484,242,754 | |||||||||
| Total cash and cash equivalents under US GAAP | 389,273,345 | 462,969,829 | 566,222,365 | |||||||||
F - 168
Table of Contents
| 2006 | 2007 | |||||||||||||||
| Carrying | Fair | Carrying | Fair | |||||||||||||
| amount | Value | amount | Value | |||||||||||||
| ThCh$ | ThCh$ | ThCh$ | ThCh$ | |||||||||||||
| Cash | 107,178,991 | 107,178,991 | 81,979,611 | 81,979,611 | ||||||||||||
| Time deposits | 303,002,428 | 303,002,428 | 404,583,941 | 404,583,941 | ||||||||||||
| Marketable securities | 9,788,358 | 9,788,358 | 11,797,463 | 11,797,463 | ||||||||||||
| Accounts receivable | 901,208,837 | 901,208,837 | 987,383,472 | 987,383,472 | ||||||||||||
| Notes receivable, net | 8,020,849 | 8,020,849 | 11,839,116 | 11,839,116 | ||||||||||||
| Other accounts receivable, net | 108,526,853 | 108,526,853 | 99,770,021 | 99,770,021 | ||||||||||||
| Amounts due from related companies | 14,568,778 | 14,568,778 | 152,384,020 | 152,384,020 | ||||||||||||
| Long-term accounts receivable | 147,653,188 | 147,653,188 | 195,537,843 | 195,537,843 | ||||||||||||
| Accounts payable and other | (634,218,821 | ) | (634,218,821 | ) | (565,984,736 | ) | (565,984,736 | ) | ||||||||
| Notes payable | (146,537,354 | ) | (146,537,354 | ) | (180,031,021 | ) | (180,031,021 | ) | ||||||||
| Long-term debt | (3,859,766,099 | ) | (4,232,403,090 | ) | (3,983,839,289 | ) | (4,174,128,168 | ) | ||||||||
| Derivative instruments | (156,922,494 | ) | (156,922,494 | ) | (215,719,609 | ) | (215,719,609 | ) | ||||||||
F - 169
Table of Contents
| 2006 | ||||||||||||
| Distribution | Generation | Total | ||||||||||
| ThCh$ | ThCh$ | ThCh$ | ||||||||||
| Embedded derivatives | 5,549,209 | 24,821,508 | 30,370,717 | |||||||||
| Commodity derivatives | — | (8,303,771 | ) | (8,303,771 | ) | |||||||
| Financial derivatives | (157,341,520 | ) | 419,026 | (156,922,494 | ) | |||||||
| Derivative instruments U.S.GAAP | ||||||||||||
| Shareholders equity adjustment | (151,792,311 | ) | 16,936,763 | (134,855,548 | ) | |||||||
| 2007 | ||||||||||||
| Distribution | Generation | Total | ||||||||||
| ThCh$ | ThCh$ | ThCh$ | ||||||||||
| Embedded derivatives | 4,026,797 | 19,247,459 | 23,274,256 | |||||||||
| Financial derivatives | (206,873,883 | ) | (8,845,726 | ) | (215,719,609 | ) | ||||||
| Derivative instruments U.S.GAAP | ||||||||||||
| Shareholders equity adjustment | (202,847,086 | ) | 10,401,733 | (192,445,353 | ) | |||||||
| 2006 | ||||||||||||
| Chile | ||||||||||||
| GAAP | Adjustment | US GAAP | ||||||||||
| ThCh$ | ThCh$ | ThCh$ | ||||||||||
| Embedded derivatives | — | 30,370,717 | 30,370,717 | |||||||||
| Commodity derivatives | — | (8,303,771 | ) | (8,303,771 | ) | |||||||
| Financial derivatives | (99,041,015 | ) | (57,881,479 | ) | (156,922,494 | ) | ||||||
| Shareholders equity adjustment | (99,041,015 | ) | (35,814,533 | ) | (134,855,548 | ) | ||||||
| 2007 | ||||||||||||
| Chile | ||||||||||||
| GAAP | Adjustment | US GAAP | ||||||||||
| ThCh$ | ThCh$ | ThCh$ | ||||||||||
| Embedded derivatives | — | 23,274,256 | 23,274,256 | |||||||||
| Financial derivatives | (161,902,093 | ) | (53,817,516 | ) | (215,719,609 | ) | ||||||
| Shareholders equity adjustment | (161,902,093 | ) | (30,543,260 | ) | (192,445,353 | ) | ||||||
F - 170
Table of Contents
F - 171
Table of Contents
| Year ended December 31, | |||||||||||||||||||||||||||||||||
| (thousands Ch$) | |||||||||||||||||||||||||||||||||
| 2005 | 2006 | 2007 | |||||||||||||||||||||||||||||||
| Accounting | Risk | Derivative | Notional | Fair | Notional | Fair | Notional | Fair | |||||||||||||||||||||||||
| Classification | Hedged | Instrument | Value | Value | Value | Value | Value | Value | |||||||||||||||||||||||||
| Cash Flow | Exchange | CCS | 393,388,748 | (108,856,286 | ) | 414,545,474 | (152,724,270 | ) | 360,245,250 | (196,718,751 | ) | ||||||||||||||||||||||
| Rate | Forward | 168,595 | — | — | — | — | — | ||||||||||||||||||||||||||
| Interest | Collar | 56,198,393 | (168,595 | ) | 182,971,795 | — | 124,222,500 | (1,093,158 | ) | ||||||||||||||||||||||||
| Rate | Swap | 9,385,132 | 56,198 | 84,338,562 | 285,893 | 72,807,246 | (596,268 | ) | |||||||||||||||||||||||||
| Fair Value | Exchange | CCS | — | — | 28,589,343 | (3,545,079 | ) | 61,058,360 | (16,695,504 | ) | |||||||||||||||||||||||
| Hedge | Rate | Forward | — | — | — | — | — | — | |||||||||||||||||||||||||
| Interest | Collar | — | — | — | — | — | — | ||||||||||||||||||||||||||
| Rate | Swap | — | — | — | — | — | — | ||||||||||||||||||||||||||
| Investment | Exchange | CCS | 70,809,975 | (26,469,443 | ) | 1,429,467 | (937,791 | ) | 527,697 | (596,268 | ) | ||||||||||||||||||||||
| Rate | Forward | — | — | — | — | — | — | ||||||||||||||||||||||||||
| Interest | Collar | 47,768,634 | — | — | — | — | — | ||||||||||||||||||||||||||
| Rate | Swap | — | — | — | — | — | — | ||||||||||||||||||||||||||
| Total | 577,719,477 | (135,438,126 | ) | 711,874,641 | (156,921,247 | ) | 618,861,053 | (215,699,949 | ) | ||||||||||||||||||||||||
F - 172
Table of Contents
| • | Losses arising from contingencies and litigation, and reversals thereof | ||
| • | Gains and losses from disposals of fixed assets | ||
| • | Taxes, other than income taxes | ||
| • | Penalties and fines |
F - 173
Table of Contents
| 2005 | ||||||||||||||||||||
| Chilean | U.S. GAAP | U.S. GAAP | ||||||||||||||||||
| GAAP | Reclassification | Sub-total | Adjustments | U.S. GAAP | ||||||||||||||||
| ThCh$ | ThCh$ | ThCh$ | ThCh$ | ThCh$ | ||||||||||||||||
| Operating income | 889,963,726 | (103,514,322 | ) | 786,449,404 | 118,046,451 | 904,495,855 | ||||||||||||||
| Non-operating expense, net | (455,509,025 | ) | 109,643,710 | (345,865,315 | ) | (2,825,025 | ) | (348,690,340 | ) | |||||||||||
| Income taxes | (190,983,412 | ) | 3,466,258 | (187,517,154 | ) | (11,812,642 | ) | (199,329,796 | ) | |||||||||||
| Minority interest | (185,879,944 | ) | — | (185,879,944 | ) | (7,505,287 | ) | (193,385,231 | ) | |||||||||||
| Equity participation in income of related companies, net | — | 7,397,174 | 7,397,174 | (36,326,106 | ) | (28,928,932 | ) | |||||||||||||
| Amortization of negative goodwill | 16,992,820 | (16,992,820 | ) | — | — | — | ||||||||||||||
| Net income | 74,584,165 | — | 74,584,165 | 59,577,391 | 134,161,556 | |||||||||||||||
| 2006 | ||||||||||||||||||||
| Chilean | U.S. GAAP | U.S. GAAP | ||||||||||||||||||
| GAAP | Reclassification | Sub-total | Adjustments | U.S. GAAP | ||||||||||||||||
| ThCh$ | ThCh$ | ThCh$ | ThCh$ | ThCh$ | ||||||||||||||||
| Operating income | 1,131,630,642 | (127,620,432 | ) | 1,004,010,210 | 89,528,074 | 1,093,538,284 | ||||||||||||||
| Non-operating expense, net | (439,029,814 | ) | 128,447,793 | (310,582,021 | ) | 2,702,503 | (307,879,518 | ) | ||||||||||||
| Income taxes | (102,256,730 | ) | 288,113 | (101,968,617 | ) | (7,457,178 | ) | (109,425,795 | ) | |||||||||||
| Minority interest | (289,749,961 | ) | — | (289,749,961 | ) | (7,745,229 | ) | (297,495,190 | ) | |||||||||||
| Equity participation in income of related companies, net | — | 5,411,822 | 5,411,822 | 4,801,219 | 10,213,041 | |||||||||||||||
| Amortization of negative goodwill | 6,527,296 | (6,527,296 | ) | — | — | — | ||||||||||||||
| Net income | 307,121,433 | — | 307,121,433 | 81,829,389 | 388,950,822 | |||||||||||||||
| 2007 | ||||||||||||||||||||
| Chilean | U.S. GAAP | U.S. GAAP | ||||||||||||||||||
| GAAP | Reclassification | Sub-total | Adjustments | U.S. GAAP | ||||||||||||||||
| ThCh$ | ThCh$ | ThCh$ | ThCh$ | ThCh$ | ||||||||||||||||
| Operating income | 1,255,566,693 | (186,416,555 | ) | 1,069,150,138 | (53,270,235 | ) | 1,015,879,903 | |||||||||||||
| Non-operating expense, net | (558,859,177 | ) | 245,599,467 | (313,259,710 | ) | (14,024,034 | ) | (327,283,744 | ) | |||||||||||
| Income taxes | (253,147,436 | ) | — | (253,147,436 | ) | 2,732,854 | (250,414,582 | ) | ||||||||||||
| Minority interest | (259,605,529 | ) | — | (259,605,529 | ) | 62,097,447 | (197,508,082 | ) | ||||||||||||
| Equity participation in income of related companies, net | — | (54,761,053 | ) | (54,761,053 | ) | 2,141,201 | (52,619,852 | ) | ||||||||||||
| Amortization of negative goodwill | 4,421,859 | (4,421,859 | ) | — | — | — | ||||||||||||||
| Net income | 188,376,410 | — | 188,376,410 | (322,767 | ) | 188,053,643 | ||||||||||||||
F - 174
Table of Contents
| 2006 | ||||||||||||||||||||
| Chilean | U.S. GAAP | U.S. GAAP | ||||||||||||||||||
| GAAP | Reclassification | Sub-total | Adjustments | U.S. GAAP | ||||||||||||||||
| ThCh$ | ThCh$ | ThCh$ | ThCh$ | ThCh$ | ||||||||||||||||
| Current assets | 1,793,665,542 | (56,831,048 | ) | 1,736,834,494 | — | 1,736,834,494 | ||||||||||||||
| Property, plant and equipment, net | 8,685,907,768 | (39,755,524 | ) | 8,646,152,244 | 6,622,254 | 8,652,774,498 | ||||||||||||||
| Other assets | 1,404,530,411 | 8,586,979 | 1,413,117,390 | 248,923,751 | 1,662,041,141 | |||||||||||||||
| Total assets | 11,884,103,721 | (87,999,593 | ) | 11,796,104,128 | 255,546,005 | 12,051,650,133 | ||||||||||||||
| Current liabilities | 1,506,475,561 | (3,156,272 | ) | 1,503,319,289 | (3,486,708 | ) | 1,499,832,581 | |||||||||||||
| Long-term liabilities | 4,213,034,785 | (84,843,321 | ) | 4,128,191,464 | 287,693,556 | 4,415,885,020 | ||||||||||||||
| Minority interest | 3,082,340,206 | — | 3,082,340,206 | (205,265,271 | ) | 2,877,074,935 | ||||||||||||||
| Shareholder’s equity | 3,082,253,169 | — | 3,082,253,169 | 176,604,428 | 3,258,857,597 | |||||||||||||||
| Total liabilities and shareholders’ equity | 11,884,103,721 | (87,999,593 | ) | 11,796,104,128 | 255,546,005 | 12,051,650,133 | ||||||||||||||
| 2007 | ||||||||||||||||||||
| Chilean | U.S. GAAP | U.S. GAAP | ||||||||||||||||||
| GAAP | Reclassification | Sub-total | Adjustments | U.S. GAAP | ||||||||||||||||
| ThCh$ | ThCh$ | ThCh$ | ThCh$ | ThCh$ | ||||||||||||||||
| Current assets | 2,260,687,476 | (52,222,233 | ) | 2,208,465,243 | — | 2,208,465,243 | ||||||||||||||
| Property, plant and equipment, net | 8,007,346,116 | (37,394,320 | ) | 7,969,951,796 | (2,801,513 | ) | 7,967,150,283 | |||||||||||||
| Other assets | 1,169,733,052 | 13,929,790 | 1,183,662,842 | 382,102,938 | 1,565,765,780 | |||||||||||||||
| Total assets | 11,437,766,644 | (75,686,763 | ) | 11,362,079,881 | 379,301,425 | 11,741,381,306 | ||||||||||||||
| Current liabilities | 1,740,259,178 | (1,464,423 | ) | 1,738,794,755 | 51,323,018 | 1,790,117,773 | ||||||||||||||
| Long-term liabilities | 4,052,530,788 | (74,222,340 | ) | 3,978,308,448 | 346,247,467 | 4,324,555,915 | ||||||||||||||
| Minority interest | 2,741,767,047 | — | 2,741,767,047 | (272,692,694 | ) | 2,469,074,353 | ||||||||||||||
| Shareholder’s equity | 2,903,209,631 | — | 2,903,209,631 | 254,423,634 | 3,157,633,265 | |||||||||||||||
| Total liabilities and shareholders’ equity | 11,437,766,644 | (75,686,763 | ) | 11,362,079,881 | 379,301,425 | 11,741,381,306 | ||||||||||||||
F - 175
Table of Contents
F - 176
Table of Contents
| At December 31, 2006 | ||||||||||||||||
| Pension Benefits | Other Benefits | |||||||||||||||
| Non | ||||||||||||||||
| Contributory | Contributory | Total | Total | |||||||||||||
| ThCh$ | ThCh$ | ThCh$ | ThCh$ | |||||||||||||
| Assets and obligations | ||||||||||||||||
| Accumulated benefit obligation | (65,291,460 | ) | (269,922,100 | ) | (335,213,560 | ) | (60,341,708 | ) | ||||||||
| Plan assets at fair value | — | 258,563,955 | 258,563,955 | — | ||||||||||||
| Unfunded accumulated benefit | (65,291,460 | ) | (11,358,145 | ) | (76,649,605 | ) | (60,341,708 | ) | ||||||||
| Changes in benefit (obligations) | ||||||||||||||||
| Benefit (obligations) at January 1 | (62,361,916 | ) | (56,737,896 | ) | (119,099,812 | ) | (55,665,179 | ) | ||||||||
| Foreign exchange effect | (2,771,585 | ) | (989,134 | ) | (3,760,719 | ) | 212,793 | |||||||||
| Net periodic expense | (7,158,898 | ) | (370,425 | ) | (7,529,323 | ) | (9,428,661 | ) | ||||||||
| Benefits paid | 6,823,032 | (7,957,679 | ) | (1,134,647 | ) | 3,898,044 | ||||||||||
| Company contributions | — | 20,999,472 | 20,999,472 | 1,776,542 | ||||||||||||
| Effect of exchange adjustment | — | (2,761,157 | ) | (2,761,157 | ) | (1,230,485 | ) | |||||||||
| Recognized net prior service cost (application SFAS 158) | — | 29,735,157 | 29,735,157 | (3,368,396 | ) | |||||||||||
| Benefit (obligations) at December 31 | (65,469,367 | ) | (18,081,662 | ) | (83,551,029 | ) | (63,805,342 | ) | ||||||||
| Funded Status of the Plans | ||||||||||||||||
| Projected Benefit Obligation | (65,469,367 | ) | (276,645,617 | ) | (342,114,984 | ) | (63,805,342 | ) | ||||||||
| Fair value of the plans assets | — | 258,563,955 | 258,563,955 | — | ||||||||||||
| Funded Status | (65,469,367 | ) | (18,081,662 | ) | (83,551,029 | ) | (63,805,342 | ) | ||||||||
| Net liability recorded under U.S. GAAP | (65,469,367 | ) | (18,081,662 | ) | (83,551,029 | ) | (63,805,342 | ) | ||||||||
| Change in the plan assets | ||||||||||||||||
| Fair value of the plan assets, beginning | — | 195,199,826 | 195,199,826 | — | ||||||||||||
| Foreign exchange effect | — | 22,888,510 | 22,888,510 | — | ||||||||||||
| Actual return on the plan assets | — | 40,991,175 | 40,991,175 | — | ||||||||||||
| Employer contributions | — | 17,190,994 | 17,190,994 | — | ||||||||||||
| Plan participant contributions | — | 3,667,536 | 3,667,536 | — | ||||||||||||
| Benefits paid | — | (21,374,086 | ) | (21,374,086 | ) | — | ||||||||||
| Fair value of plans assets, ending | — | 258,563,955 | 258,563,955 | — | ||||||||||||
| Service cost | (415,682 | ) | 1,054,478 | 638,796 | (23,865 | ) | ||||||||||
| Interest cost | (6,904,460 | ) | (4,293,870 | ) | (11,198,330 | ) | (6,426,597 | ) | ||||||||
| Expected return on assets | — | 3,586,473 | 3,586,473 | — | ||||||||||||
| Amortization gain (loss) | 161,244 | 6,973,673 | 7,134,917 | (2,978,199 | ) | |||||||||||
| Amortization of transition asset | — | (7,691,179 | ) | (7,691,179 | ) | — | ||||||||||
| Net periodic expenses | (7,158,898 | ) | (370,425 | ) | (7,529,323 | ) | (9,428,661 | ) | ||||||||
| Pension Benefits | Other Benefits | |||||||||||||||||||
| Assumptions as of December 31, 2006 | Brazil | Colombia | Chile | Brazil | Colombia | |||||||||||||||
| Weighted — discount rate (1) | 12.0 | % | 10.4 | % | 6.5 | % | 10.4 | % | 12.3 | % | ||||||||||
| Weighted — salary increase | 5.8 | % | 5.3 | % | 3.5 | % | — | — | ||||||||||||
| Weighted — return on plan assets (1) | 14.1 | % | — | — | — | — | ||||||||||||||
| Weighted — long term inflation (2) | 4.7 | % | 5.3 | % | 3.0 | % | 4.5 | % | 5.3 | % | ||||||||||
| (1) | Includes fixed long term inflation assumption detail in (2) |
F - 177
Table of Contents
| At December 31, 2007 | ||||||||||||||||
| Pension Benefits | Other Benefits | |||||||||||||||
| Non | ||||||||||||||||
| Contributory | Contributory | Total | Total | |||||||||||||
| ThCh$ | ThCh$ | ThCh$ | ThCh$ | |||||||||||||
| Assets and obligations | ||||||||||||||||
| Accumulated benefit obligation | (62,065,477 | ) | (315,518,838 | ) | (377,584,315 | ) | (62,088,313 | ) | ||||||||
| Plan assets at fair value | — | 310,739,614 | 310,739,614 | — | ||||||||||||
| Unfunded accumulated benefit | (62,065,477 | ) | (4,779,224 | ) | (66,844,701 | ) | (62,088,313 | ) | ||||||||
| Changes in benefit (obligations) | ||||||||||||||||
| Benefit (obligations) at January 1 | (65,469,367 | ) | (18,081,662 | ) | (83,551,029 | ) | (63,805,342 | ) | ||||||||
| Foreign exchange effect | 2,421,427 | (890,183 | ) | 1,531,244 | 1,837,302 | |||||||||||
| Net periodic expense | (5,857,433 | ) | (652,968 | ) | (6,510,401 | ) | (11,764,440 | ) | ||||||||
| Benefits paid | 6,717,299 | (9,388,536 | ) | (2,671,237 | ) | 6,327,314 | ||||||||||
| Company contributions | — | 10,522,129 | 10,522,129 | 1,875,295 | ||||||||||||
| Benefit (obligations) at December 31 | (62,188,074 | ) | (18,491,220 | ) | (80,679,294 | ) | (65,529,871 | ) | ||||||||
| Funded Status of the Plans | ||||||||||||||||
| Projected Benefit Obligation | (62,188,074 | ) | (329,230,834 | ) | (391,418,908 | ) | (65,529,871 | ) | ||||||||
| Fair value of the plans assets | — | 310,739,614 | 310,739,614 | — | ||||||||||||
| Funded Status | (62,188,074 | ) | (18,491,220 | ) | (80,679,294 | ) | (65,529,871 | ) | ||||||||
| Net liability recorded under U.S. GAAP | (62,188,074 | ) | (18,491,220 | ) | (80,679,294 | ) | (65,529,871 | ) | ||||||||
| Change in the plan assets | ||||||||||||||||
| Fair value of the plan assets, beginning | — | 240,748,561 | 240,748,561 | — | ||||||||||||
| Foreign exchange effect | — | 30,463,667 | 30,463,667 | — | ||||||||||||
| Actual return on the plan assets | — | 53,055,877 | 53,055,877 | — | ||||||||||||
| Employer contributions | — | 6,432,948 | 6,432,948 | — | ||||||||||||
| Plan participant contributions | — | 4,068,703 | 4,068,703 | — | ||||||||||||
| Benefits paid | — | (24,030,142 | ) | (24,030,142 | ) | — | ||||||||||
| Fair value of plans assets, ending | — | 310,739,614 | 310,739,614 | — | ||||||||||||
| Service cost | (398,286 | ) | 651,298 | 253,012 | 107,751 | |||||||||||
| Interest cost | (6,185,964 | ) | (7,501,481 | ) | (13,687,445 | ) | (4,704,967 | ) | ||||||||
| Expected return on assets | — | 9,650,128 | 9,650,128 | — | ||||||||||||
| Amortization gain (loss) | 726,817 | (6,143,241 | ) | (5,416,424 | ) | (7,167,224 | ) | |||||||||
| Amortization of transition asset | — | 2,690,328 | 2,690,328 | — | ||||||||||||
| Net periodic expenses | (5,857,433 | ) | (652,968 | ) | (6,510,401 | ) | (11,764,440 | ) | ||||||||
| Pension Benefits | Other Benefits | |||||||||||||||||||
| Assumptions as of December 31, 2007 | Brazil | Colombia | Chile | Brazil | Colombia | |||||||||||||||
| Weighted — discount rate (1) | 11.2 | % | 9.8 | % | 6.5 | % | 12.1 | % | 9.8 | % | ||||||||||
| Weighted — salary increase | 6.1 | % | 4.8 | % | 3.5 | % | — | — | ||||||||||||
| Weighted — return on plan assets (1) | 12.8 | % | — | — | — | — | ||||||||||||||
| Weighted — long term inflation (2) | 4.7 | % | 4.8 | % | 3.0 | % | 5.0 | % | 4.8 | % | ||||||||||
| (1) | Includes fixed long term inflation assumption detail in (2) |
F - 178
Table of Contents
| Before | Adjustment | After | ||||||||||
| Liabilities and Equity: | SFAS 158 | SFAS 158 | SFAS 158 | |||||||||
| ThCh$ | ThCh$ | ThCh$ | ||||||||||
| Accrued Pension Cost | (113,286,184 | ) | 29,735,155 | (83,551,029 | ) | |||||||
| Other Benefits Cost | (60,436,946 | ) | (3,368,396 | ) | (63,805,342 | ) | ||||||
| Deferred taxes – long term | (115,902,445 | ) | (8,964,698 | ) | (124,867,143 | ) | ||||||
| Accumulated Other Comprehensive Income, net of tax | (209,189,905 | ) | 17,402,063 | (191,787,842 | ) | |||||||
| As of December 31, | ||||
| 2007 | ||||
| ThCh$ | ||||
| 2008 | 13,632,729 | |||
| 2009 | 34,920,387 | |||
| 2010 | 33,572,787 | |||
| 2011 | 32,143,422 | |||
| 2012 | 30,891,801 | |||
| Thereafter | 81,153,010 | |||
| Total | 226,314,136 | |||
| 2006 | 2007 | |||||||
| Asset Category | Plan asset | Plan asset | ||||||
| Equity securities | 22.11 | % | 25.84 | % | ||||
| Debt securities | 70.75 | % | 67.55 | % | ||||
| Real estate | 4.80 | % | 5.76 | % | ||||
| Other | 2.34 | % | 0.86 | % | ||||
F - 179
Table of Contents
| 2005 | ||||||||||||||||
| Chilean GAAP | Fair value | |||||||||||||||
| cumulative | Effect of U.S. GAAP | of financial | Accumulated other | |||||||||||||
| translation | adjustments on cumulative | instruments used in | comprehensive | |||||||||||||
| adjustment | translation adjustment | cash flow hedge | income (loss) | |||||||||||||
| ThCh$ | ThCh$ | ThCh$ | ThCh$ | |||||||||||||
| Beginning balance | (135,773,731 | ) | 56,919,125 | — | (78,854,606 | ) | ||||||||||
| Credit (charge) for the period | (113,524,133 | ) | 22,703,029 | 1,414,993 | (89,406,111 | ) | ||||||||||
| Ending balance | (249,297,864 | ) | 79,622,154 | 1,414,993 | (168,260,717 | ) | ||||||||||
| 2006 | ||||||||||||||||||||
| Chilean GAAP | Effect of U.S. GAAP | Application | Fair value | |||||||||||||||||
| cumulative | adjustments on | of SFAS 158 in | of financial | Accumulated other | ||||||||||||||||
| translation | cumulative | Ampla and Coelce | instruments used | comprehensive | ||||||||||||||||
| adjustment | translation adjustment | see Note 36 I g | in cash flow hedge | income (loss) | ||||||||||||||||
| ThCh$ | ThCh$ | ThCh$ | ThCh$ | ThCh$ | ||||||||||||||||
| Beginning balance | (249,297,864 | ) | 79,622,154 | — | 1,414,993 | (168,260,717 | ) | |||||||||||||
| Credit (charge) for the period | 16,948,488 | (3,581,052 | ) | 11,162,725 | (48,057,287 | ) | (23,527,126 | ) | ||||||||||||
| Ending balance | (232,349,376 | ) | 76,041,102 | 11,162,725 | (46,642,294 | ) | (191,787,843 | ) | ||||||||||||
| 2007 | ||||||||||||||||||||
| Chilean GAAP | Effect of U.S. GAAP | Application | Fair value | |||||||||||||||||
| cumulative | adjustments on | of SFAS 158 in | of financial | Accumulated other | ||||||||||||||||
| translation | cumulative | Ampla and Coelce | instruments used | comprehensive | ||||||||||||||||
| adjustment | translation adjustment | see Note 36 I g | in cash flow hedge | income (loss) | ||||||||||||||||
| ThCh$ | ThCh$ | ThCh$ | ThCh$ | ThCh$ | ||||||||||||||||
| Beginning balance | (232,349,376 | ) | 76,041,102 | 11,162,725 | (46,642,294 | ) | (191,787,843 | ) | ||||||||||||
| Credit (charge) for the period | (122,816,340 | ) | 4,597,060 | (481,754 | ) | 1,987,463 | (116,713,571 | ) | ||||||||||||
| Ending balance | (355,165,716 | ) | 80,638,162 | 10,680,971 | (44,654,831 | ) | (308,501,414 | ) | ||||||||||||
F - 180
Table of Contents
| 2006 | ||||||||||||||||||||||||
| Acquisitions | Translation | Reclassification | ||||||||||||||||||||||
| Goodwill by Country | January 1, | (Disposals) | adjustment | Impairment | (1) | December 31, | ||||||||||||||||||
| ThCh$ | ThCh$ | ThCh$ | ThCh$ | ThCh$ | ThCh$ | |||||||||||||||||||
| Chile | 1,251,487,495 | — | — | — | — | 1,251,487,495 | ||||||||||||||||||
| Colombia | 43,067,893 | — | 751,252 | — | (9,100,166 | ) | 34,718,979 | |||||||||||||||||
| Peru | 16,660,517 | 3,430,721 | 290,168 | — | — | 20,381,406 | ||||||||||||||||||
| Total | 1,311,215,905 | 3,430,721 | 1,041,420 | — | (9,100,166 | ) | 1,306,587,880 | |||||||||||||||||
| 2006 | ||||||||||||||||||||||||
| Acquisitions | Translation | |||||||||||||||||||||||
| Goodwill by Segment | January 1, | (Disposals) | adjustment | Impairment | Reclassification | December 31, | ||||||||||||||||||
| ThCh$ | ThCh$ | ThCh$ | ThCh$ | ThCh$ | ThCh$ | |||||||||||||||||||
| Generation | 1,145,974,443 | 3,430,721 | 684,605 | — | (9,100,166 | ) | 1,140,989,603 | |||||||||||||||||
| Distribution | 165,167,803 | — | 356,816 | — | — | 165,524,619 | ||||||||||||||||||
| Other | 73,658 | — | — | — | — | 73,658 | ||||||||||||||||||
| Total | 1,311,215,904 | 3,430,721 | 1,041,421 | — | (9,100,166 | ) | 1,306,587,880 | |||||||||||||||||
| 2007 | ||||||||||||||||||||||||
| Acquisitions | Translation | Impairment | ||||||||||||||||||||||
| Goodwill by Country | January 1, | (Disposals) | adjustment | (2) | Reclasification | December 31, | ||||||||||||||||||
| ThCh$ | ThCh$ | ThCh$ | ThCh$ | ThCh$ | ThCh$ | |||||||||||||||||||
| Chile | 1,251,487,495 | — | — | (96,353 | ) | — | 1,251,391,142 | |||||||||||||||||
| Colombia | 34,718,979 | — | (4,547,526 | ) | — | — | 30,171,453 | |||||||||||||||||
| Peru | 20,381,406 | — | (2,669,324 | ) | — | — | 17,712,082 | |||||||||||||||||
| Total | 1,306,587,880 | — | (7,216,850 | ) | (96,353 | ) | — | 1,299,274,677 | ||||||||||||||||
| 2007 | ||||||||||||||||||||||||
| Acquisitions | Translation | Impairment | ||||||||||||||||||||||
| Goodwill by Segment | January 1, | (Disposals) | adjustment | (2) | Reclasification | December 31, | ||||||||||||||||||
| ThCh$ | ThCh$ | ThCh$ | ThCh$ | ThCh$ | ThCh$ | |||||||||||||||||||
| Generation | 1,140,989,603 | — | (4,491,100 | ) | (96,353 | ) | — | 1,136,402,150 | ||||||||||||||||
| Distribution | 165,524,619 | — | (2,725,750 | ) | — | — | 162,798,869 | |||||||||||||||||
| Other | 73,658 | — | — | — | — | 73,658 | ||||||||||||||||||
| Total | 1,306,587,880 | — | (7,216,850 | ) | (96,353 | ) | — | 1,299,274,677 | ||||||||||||||||
| i. | See Note 11 h) iv | |
| ii. | See Note 11 a) (7) |
F - 181
Table of Contents
| Year | Amortization | |||
| ThCh$ | ||||
| 2008 | 5,998,383 | |||
| 2009 | 5,907,071 | |||
| 2010 | 3,770,772 | |||
| 2011 | 2,109,776 | |||
| 2012 | 1,834,160 | |||
| (o) | Asset retirement obligations |
| As of December 31, | ||||||||
| 2006 | 2007 | |||||||
| ThCh$ | ThCh$ | |||||||
| Balance as of January 1, | (1,072,591 | ) | (2,297,416 | ) | ||||
| Cumulative Translation Adjustment | (261 | ) | 191,576 | |||||
| Liabilities incurred in the period | (879,946 | ) | (458,696 | ) | ||||
| Accretion expense | (344,618 | ) | (19,889 | ) | ||||
| Balance as of December 31, | (2,297,416 | ) | (2,584,425 | ) | ||||
| (p) | Capital lease obligations |
| Year ended December 31, | ||||||||
| 2006 | 2007 | |||||||
| ThCh$ | ThCh$ | |||||||
| Short-term: | ||||||||
| Lease obligations | 16,491,226 | 11,368,008 | ||||||
| Less: interest expense | (10,253,751 | ) | (4,134,550 | ) | ||||
| Net short-term lease obligations | 6,237,475 | 7,233,458 | ||||||
| Long-term: | ||||||||
| Lease obligations | 132,415,674 | 74,737,287 | ||||||
| Less: interest expense | (43,679,563 | ) | (17,138,727 | ) | ||||
| Net long-term lease obligations | 88,736,111 | 57,598,560 | ||||||
| Weighted-average interest rate | 8.47 | % | 7.18 | % | ||||
F - 182
Table of Contents
| Year ended | ||||
| December 31, 2007 | ||||
| ThCh$ | ||||
| 2008 | 11,368,008 | |||
| 2009 | 9,448,674 | |||
| 2010 | 10,782,271 | |||
| 2011 | 9,137,991 | |||
| 2012 | 21,354,469 | |||
| 2013 and thereafter | 23,413,882 | |||
| Total | 85,505,295 | |||
| (q) | Available for sale securities |
| Gross | ||||||||||||
| unrealized | Fair | |||||||||||
| Cost | gains | value | ||||||||||
| ThCh$ | ThCh$ | ThCh$ | ||||||||||
| Securities available for sale at December 31, 2005 | 5,823,226 | — | 5,823,226 | |||||||||
| Securities available for sale at December 31, 2006 | 9,687,242 | — | 9,687,242 | |||||||||
| Securities available for sale at December 31, 2007 | 10,299,039 | — | 10,299,039 | |||||||||
| 2005 | 2006 | 2007 | ||||||||||
| ThCh$ | ThCh$ | ThCh$ | ||||||||||
| Proceeds from sales | 13,997,635 | 5,823,226 | 9,687,242 | |||||||||
| (r) | Recent accounting pronouncements |
F - 183
Table of Contents
F - 184
Table of Contents
BALANCE SHEETS
Chilean pesos as of December 31, 2007 and thousands of US dollars)
| As of December 31, | ||||||||||||
| 2006 | 2007 | 2007 | ||||||||||
| ThCh$ | ThCh$ | ThUS$ | ||||||||||
ASSETS | ||||||||||||
| CURRENT ASSETS: | ||||||||||||
| Cash | 174,992 | 179,342 | 361 | |||||||||
| Time deposits | 7,463,806 | 13,292,082 | 26,751 | |||||||||
| Notes receivable, net | 792 | — | — | |||||||||
| Other accounts receivable, net | 8,772,327 | 1,650,327 | 3,321 | |||||||||
| Amounts due from related companies | 102,349,384 | 188,220,255 | 378,797 | |||||||||
| Income taxes recoverable | 4,204,604 | 12,215,173 | 24,583 | |||||||||
| Prepaid expenses | 22,635 | 6,432 | 13 | |||||||||
| Deferred income taxes | 38,921,808 | 19,231,570 | 38,704 | |||||||||
| Other current assets | 11,922,391 | 73,040,942 | 146,996 | |||||||||
| Total current assets | 173,832,739 | 307,836,123 | 619,526 | |||||||||
| PROPERTY, PLANT AND EQUIPMENT: | ||||||||||||
| Buildings and infrastructure | 24,222,977 | 24,222,818 | 48,749 | |||||||||
| Machinery and equipment | 3,176,763 | 3,309,052 | 6,660 | |||||||||
| Other assets | 803,902 | 861,640 | 1,734 | |||||||||
| Technical appraisal | 38,573 | 38,528 | 78 | |||||||||
| Sub — total | 28,242,215 | 28,432,038 | 57,221 | |||||||||
| Less: accumulated depreciation | (16,235,387 | ) | (17,372,491 | ) | (34,962 | ) | ||||||
| Total property, plant and equipment, net | 12,006,828 | 11,059,547 | 22,259 | |||||||||
| OTHER ASSETS: | ||||||||||||
| Investments in related companies | 2,531,675,829 | 2,460,391,657 | 4,951,582 | |||||||||
| Investment in other companies | 13,326,869 | 11,581,217 | 23,307 | |||||||||
| Goodwill, net | 684,890,775 | 625,779,400 | 1,259,392 | |||||||||
| Negative goodwill, net | (480,792 | ) | (390,418 | ) | (786 | ) | ||||||
| Amounts due from related companies | 518,365,497 | 327,695,685 | 659,493 | |||||||||
| Deferred income taxes long-term | — | 8,209,361 | 16,521 | |||||||||
| Intangibles | 1,674,368 | 1,674,368 | 3,370 | |||||||||
| Accumulated amortization | (744,904 | ) | (828,780 | ) | (1,668 | ) | ||||||
| Other assets | 64,240,088 | 59,299,872 | 119,342 | |||||||||
| Total other assets | 3,812,947,730 | 3,493,412,362 | 7,030,553 | |||||||||
| TOTAL ASSETS | 3,998,787,297 | 3,812,308,032 | 7,672,338 | |||||||||
F - 185
Table of Contents
BALANCE SHEETS
Chilean pesos as of December 31, 2007 and thousands of US dollars)
| As of December 31, | ||||||||||||
| 2006 | 2007 | 2007 | ||||||||||
| ThCh$ | ThCh$ | ThUS$ | ||||||||||
| �� | ||||||||||||
LIABILITIES AND SHAREHOLDERS’ EQUITY | ||||||||||||
| CURRENT LIABILITIES: | ||||||||||||
| Current portion of long-term debt due to banks and financial institutions | 935,221 | 840,604 | 1,692 | |||||||||
| Current portion of bonds payable | 9,698,084 | 8,564,364 | 17,236 | |||||||||
| Dividends payable | 16,715 | 387,478 | 780 | |||||||||
| Accounts payable | 397,032 | 205,287 | 413 | |||||||||
| Miscellaneous payables | 167,090 | 348,244 | 701 | |||||||||
| Amounts payable to related companies | 38,543,585 | 162,240,863 | 326,513 | |||||||||
| Accrued expenses | 5,651,885 | 5,040,586 | 10,144 | |||||||||
| Withholdings | 64,546 | 316,385 | 637 | |||||||||
| Income tax | — | 121,265 | 244 | |||||||||
| Other current liabilities | 1,167,359 | 2,150,224 | 4,327 | |||||||||
| Total current liabilities | 56,641,517 | 180,215,300 | 362,687 | |||||||||
| LONG -TERM LIABILITIES: | ||||||||||||
| Due to banks and financial institutions | 180,112,861 | 173,911,500 | 350,000 | |||||||||
| Bonds payable | 379,504,301 | 332,559,133 | 669,281 | |||||||||
| Amounts payable to related companies | 108,433,809 | — | — | |||||||||
| Accrued expenses | 22,992,104 | 17,950,345 | 36,125 | |||||||||
| Deferred income taxes | 2,758,006 | — | — | |||||||||
| Other long-term liabilities | 166,091,530 | 204,462,123 | 411,484 | |||||||||
| Total long-term liabilities | 859,892,611 | 728,883,101 | 1,466,890 | |||||||||
| SHAREHOLDERS’ EQUITY: | ||||||||||||
| Paid-in capital, no par value shares | 2,594,015,458 | 2,594,015,458 | 5,220,502 | |||||||||
| Additional paid-in capital | 184,861,405 | 184,861,405 | 372,037 | |||||||||
| Other reserves | (255,979,636 | ) | (435,491,419 | ) | (876,434 | ) | ||||||
| Retained earnings | 291,354,472 | 388,982,534 | 782,834 | |||||||||
| Net income for the year | 307,121,433 | 188,376,410 | 379,111 | |||||||||
| Provisional dividends | (38,924,762 | ) | (17,534,757 | ) | (35,289 | ) | ||||||
| Deficit of subsidiaries in development stage | (195,201 | ) | — | — | ||||||||
| Total shareholders’ equity | 3,082,253,169 | 2,903,209,631 | 5,842,761 | |||||||||
| TOTAL LIABILITIES AND SHAREHOLDERS’ EQUITY | 3,998,787,297 | 3,812,308,032 | 7,672,338 | |||||||||
F - 186
Table of Contents
INCOME STATEMENT
Chilean pesos as of December 31, 2007 and thousands of US dollars)
| Years ended December 31, | ||||||||||||||||
| 2005 | 2006 | 2007 | 2007 | |||||||||||||
| ThCh$ | ThCh$ | ThCh$ | ThUS$ | |||||||||||||
| OPERATING INCOME: | ||||||||||||||||
| SALES | 5,031,087 | 5,043,877 | 5,010,645 | 10,084 | ||||||||||||
| COST OF SALES | (1,254,845 | ) | (1,418,416 | ) | (1,500,984 | ) | (3,021 | ) | ||||||||
| GROSS PROFIT | 3,776,242 | 3,625,461 | 3,509,661 | 7,063 | ||||||||||||
| ADMINISTRATIVE AND SELLING EXPENSES | (18,694,028 | ) | (18,099,914 | ) | (20,083,426 | ) | (40,418 | ) | ||||||||
| OPERATING LOSS | (14,917,786 | ) | (14,474,453 | ) | (16,573,765 | ) | (33,355 | ) | ||||||||
| NON-OPERATING INCOME AND EXPENSES: | ||||||||||||||||
| Interest income | 27,817,661 | 28,473,502 | 35,975,390 | 72,401 | ||||||||||||
| Equity in income of related companies | 190,014,375 | 427,222,877 | 291,111,546 | 585,867 | ||||||||||||
| Other non-operating income | 13,502,877 | 7,066,726 | 12,481,103 | 25,118 | ||||||||||||
| Equity in losses of related companies | (25,283,292 | ) | (10,384,222 | ) | (9,789 | ) | (20 | ) | ||||||||
| Amortization of goodwill | (58,378,541 | ) | (58,388,173 | ) | (58,314,582 | ) | (117,359 | ) | ||||||||
| Interest expense | (62,002,468 | ) | (52,920,897 | ) | (54,591,866 | ) | (109,867 | ) | ||||||||
| Other non-operating expenses | (3,136,364 | ) | (3,221,075 | ) | (878,026 | ) | (1,766 | ) | ||||||||
| Price-level restatements, net | (1,775,690 | ) | (811,507 | ) | (6,331,550 | ) | (12,742 | ) | ||||||||
| Exchange difference, net | (7,169,771 | ) | (4,764,421 | ) | (19,551,085 | ) | (39,347 | ) | ||||||||
| NON-OPERATING RESULT | 73,588,787 | 332,272,810 | 199,891,141 | 402,285 | ||||||||||||
| INCOME BEFORE INCOME TAXES AND AMORTIZATION OF NEGATIVE GOODWILL | 58,671,001 | 317,798,357 | 183,317,376 | 368,930 | ||||||||||||
| INCOME TAX | 15,870,528 | (10,719,988 | ) | 5,019,251 | 10,101 | |||||||||||
| INCOME BEFORE AMORTIZATION OF NEGATIVE GOODWILL | 74,541,529 | 307,078,369 | 188,336,627 | 379,031 | ||||||||||||
| AMORTIZATION OF NEGATIVE GOODWILL | 42,636 | 43,064 | 39,783 | 80 | ||||||||||||
| NET INCOME FOR THE YEAR | 74,584,165 | 307,121,433 | 188,376,410 | 379,111 | ||||||||||||
F - 187
Table of Contents
STATEMENTS OF CASH FLOWS
Chilean pesos as of December 31, 2007 and thousands of US dollars)
| As of December 31, | ||||||||||||||||
| 2005 | 2006 | 2007 | 2007 | |||||||||||||
| ThCh$ | ThCh$ | ThCh$ | ThUS$ | |||||||||||||
| CASH FLOWS FROM OPERATING ACTIVITIES : | ||||||||||||||||
| Net income for the year | 74,584,165 | 307,121,433 | 188,376,410 | 379,111 | ||||||||||||
| Charges (credits) to income which do not represent cash flows: | ||||||||||||||||
| Depreciation | 1,201,309 | 1,364,542 | 1,446,589 | 2,911 | ||||||||||||
| Amortization of intangibles | 83,876 | 83,876 | 83,876 | 169 | ||||||||||||
| Equity in income of related companies | (190,014,375 | ) | (427,222,877 | ) | (291,111,546 | ) | (585,867 | ) | ||||||||
| Equity in losses of related companies | 25,283,292 | 10,384,222 | 9,789 | 20 | ||||||||||||
| Amortization of goodwill | 58,378,541 | 58,388,173 | 58,314,582 | 117,359 | ||||||||||||
| Amortization of negative goodwill | (42,636 | ) | (43,064 | ) | (39,783 | ) | (80 | ) | ||||||||
| Price-level restatement, net | 1,775,690 | 811,507 | 6,331,550 | 12,742 | ||||||||||||
| Exchange difference, net | 7,169,771 | 4,764,421 | 19,551,085 | 39,347 | ||||||||||||
| Other credits to income which do not represent cash flows | (5,114,908 | ) | (134,960 | ) | (5,061,638 | ) | (10,187 | ) | ||||||||
| Other charges to income which do not represent cash flows | 7,853,872 | 3,012,956 | 956,226 | 1,925 | ||||||||||||
| Changes in assets which affect cash flows: | ||||||||||||||||
| Decrease in dividends receipts | 94,349,840 | — | — | — | ||||||||||||
| Decrease in other assets | (2,740,381 | ) | 124,314,098 | 166,654,589 | 335,395 | |||||||||||
| Changes in liabilities which affect cash flows: | ||||||||||||||||
| Increase (decrease) in accounts payable associated with operating results | (4,721,766 | ) | (13,425,606 | ) | (2,512,921 | ) | (5,057 | ) | ||||||||
| Increase in interest payable | (1,038,372 | ) | 6,536,088 | 11,932,377 | 24,014 | |||||||||||
| Decrease in income tax payable | (10,105,968 | ) | 12,039,833 | (2,511,756 | ) | (5,055 | ) | |||||||||
| Increase in other accounts payable associated with non-operating results | (41,338 | ) | (21,280,817 | ) | (4,627,170 | ) | (9,312 | ) | ||||||||
| Net decrease in value added tax and other similar taxes payable | (330,443 | ) | 45,717 | 1,005,149 | 2,023 | |||||||||||
| Net cash flows provided by operating activities | 56,530,169 | 66,759,542 | 148,797,408 | 299,458 | ||||||||||||
| CASH FLOWS FROM FINANCING ACTIVITIES: | ||||||||||||||||
| Loans obtained | — | 175,972,374 | 19,912,551 | 40,074 | ||||||||||||
| Other loans obtained from related companies | 1,265,737 | 35,964,282 | 41,299,507 | 83,116 | ||||||||||||
| Loans obtained from related companies | 27,669,499 | 10,012,887 | — | — | ||||||||||||
| Other sources of financing | 487,066 | — | — | — | ||||||||||||
| Dividends paid by related company | (9,276,422 | ) | — | — | — | |||||||||||
| Dividends paid | (6,129,286 | ) | (74,720,123 | ) | (186,375,808 | ) | (375,085 | ) | ||||||||
| Payment of loans | (163,916,186 | ) | (46,059,269 | ) | — | — | ||||||||||
| Payment of bonds | (158,830 | ) | (171,391,836 | ) | (1,538,137 | ) | (3,094 | ) | ||||||||
| Payment of loans granted by related companies | — | (12,544,422 | ) | — | — | |||||||||||
| Payment of other loans obtained from related companies | (42,405,920 | ) | — | — | — | |||||||||||
| Other disbursements for financing | (6,409,172 | ) | — | — | — | |||||||||||
| Net cash used in financing activities | (198,873,514 | ) | (82,766,107 | ) | (126,701,887 | ) | (254,989 | ) | ||||||||
| CASH FLOWS FROM INVESTING ACTIVITIES: | ||||||||||||||||
| Sales of property, plant and equipment | — | 201,356 | — | — | ||||||||||||
| Other receipts from investment | 61,320,751 | 25,806,797 | 2,901,695 | 5,840 | ||||||||||||
| Proceeds from loans granted to related companies | 238,196,180 | 24,585,175 | 67,433,082 | 135,710 | ||||||||||||
| Long-term investments | (26,646,364 | ) | (13,020,863 | ) | (260,834 | ) | (525 | ) | ||||||||
| Loans granted to relates companies | (148,166,158 | ) | (220,746 | ) | — | — | ||||||||||
| Other loans to related companies | (10,133,728 | ) | (6,609,226 | ) | (22,312,422 | ) | (44,904 | ) | ||||||||
| Sales of other investment | 1,188,192 | — | — | — | ||||||||||||
| Additions to property, plant and equipment | (159,421 | ) | (194,572 | ) | (564,366 | ) | (1,136 | ) | ||||||||
| Other disbursement for investments | — | (539,592 | ) | 22,368,439 | (45,017 | ) | ||||||||||
| Net cash provided by investing activities | 115,599,452 | 30,008,329 | 24,828,716 | 49,968 | ||||||||||||
| NET CASH FLOW FOR THE YEAR | (26,743,893 | ) | 14,001,764 | 46,924,237 | 94,437 | |||||||||||
| EFECT OF PRICE-LEVEL RESTATEMENT ON CASH AND CASH EQUIVALENTS | (221,065 | ) | 26,209 | (879,288 | ) | (1,770 | ) | |||||||||
| NET INCREASE IN CASH AND CASH EQUIVALENTS | (26,964,958 | ) | 14,027,973 | 46,044,949 | 92,667 | |||||||||||
| CASH AND CASH EQUIVALENTS AT BEGINNING OF THE YEAR | 27,095,032 | 130,074 | 14,158,047 | 28,493 | ||||||||||||
| CASH AND CASH EQUIVALENTS AT END OF THE YEAR | 130,074 | 14,158,047 | 60,202,996 | 121,160 | ||||||||||||
F - 188
Table of Contents
STATEMENTS OF CHANGES IN SHAREHOLDERS’ EQUITY
| Deficit of | ||||||||||||||||||||||||||||||||
| Additional | subsidiaries in | |||||||||||||||||||||||||||||||
| Paid-in | paid-in | Other | Retained | development | Interim | Net income | ||||||||||||||||||||||||||
| capital | capital | reserves | earnings | stage | dividends | for the year | Total | |||||||||||||||||||||||||
| ThCh$ | ThCh$ | ThCh$ | ThCh$ | ThCh$ | ThCh$ | ThCh$ | ThCh$ | |||||||||||||||||||||||||
| As of January 1, 2005 | 2,283,404,124 | 162,725,820 | (122,588,994 | ) | 194,378,259 | (2,673,664 | ) | — | 44,307,596 | 2,559,553,142 | ||||||||||||||||||||||
| Transfer of prior year income to retained earnings | — | — | — | 41,633,932 | 2,673,664 | — | (44,307,596 | ) | — | |||||||||||||||||||||||
| Changes in equity of affiliates | — | — | (5,851,418 | ) | — | — | — | — | (5,851,418 | ) | ||||||||||||||||||||||
| Dividend paid | — | — | — | (13,600,517 | ) | — | — | — | (13,600,517 | ) | ||||||||||||||||||||||
| Cumulative translation adjustment | — | — | (97,676,664 | ) | — | — | — | — | (97,676,664 | ) | ||||||||||||||||||||||
| Reserve Technical Bulletin No. 72 | — | — | (6,197,072 | ) | — | — | — | — | (6,197,072 | ) | ||||||||||||||||||||||
| Price-level restatement of capital | 82,202,548 | 5,858,130 | (4,413,203 | ) | 7,979,618 | — | — | — | 91,627,092 | |||||||||||||||||||||||
| Net income for the year | — | — | — | — | — | — | 68,016,865 | 68,016,865 | ||||||||||||||||||||||||
| As of December 31, 2005 | 2,365,606,672 | 168,583,950 | (236,727,351 | ) | 230,391,292 | — | — | 68,016,865 | 2,595,871,428 | |||||||||||||||||||||||
| As of December 31, 2005(1) | 2,594,015,458 | 184,861,406 | (259,584,324 | ) | 252,636,493 | — | — | 74,584,165 | 2,846,513,198 | |||||||||||||||||||||||
| As of January 1, 2006 | 2,365,606,672 | 168,583,950 | (236,727,351 | ) | 230,391,292 | — | — | 68,016,865 | 2,595,871,429 | |||||||||||||||||||||||
| Transfer of prior year income to retained earnings | — | — | — | 68,016,865 | — | — | (68,016,865 | ) | — | |||||||||||||||||||||||
| Investment equity variations | — | — | (10,585,093 | ) | — | — | — | — | (10,585,093 | ) | ||||||||||||||||||||||
| Accumulated deficit of subsidiaries in development stage | — | — | — | — | (181,751 | ) | — | — | (181,751 | ) | ||||||||||||||||||||||
| Final dividend 2005 | — | — | — | (32,651,166 | ) | — | — | — | (32,651,166 | ) | ||||||||||||||||||||||
| Cumulative translation adjustment | — | — | 14,766,794 | — | — | — | — | 14,766,794 | ||||||||||||||||||||||||
| Reserve Technical Bulletin No. 72 | — | — | (825,381 | ) | — | — | — | — | (825,381 | ) | ||||||||||||||||||||||
| Price-level restatement | 49,677,740 | 3,540,263 | (4,971,274 | ) | 5,522,778 | — | — | — | 53,769,506 | |||||||||||||||||||||||
| Interim dividend | — | — | — | — | — | (36,242,795 | ) | — | (36,242,795 | ) | ||||||||||||||||||||||
| Net income for the year | — | — | — | — | — | — | 285,960,366 | 285,960,366 | ||||||||||||||||||||||||
| As of December 31, 2006 | 2,415,284,412 | 172,124,213 | (238,342,305 | ) | 271,279,769 | (181,751 | ) | (36,242,795 | ) | 285,960,366 | 2,869,881,909 | |||||||||||||||||||||
| As of December 31, 2006 (1) | 2,594,015,458 | 184,861,405 | (255,979,636 | ) | 291,354,472 | (195,201 | ) | (38,924,762 | ) | 307,121,433 | 3,082,253,169 | |||||||||||||||||||||
| As of January 1, 2007 | 2,415,284,412 | 172,124,213 | (238,342,305 | ) | 271,279,769 | (181,751 | ) | (36,242,795 | ) | 285,960,366 | 2,869,881,909 | |||||||||||||||||||||
| Transfer of prior year income to retained earnings | — | — | — | 249,535,820 | 181,751 | 36,242,795 | (285,960,366 | ) | — | |||||||||||||||||||||||
| Investment equity variations | — | — | (7,702,898 | ) | — | — | — | — | (7,702,898 | ) | ||||||||||||||||||||||
| Final dividend 2006 | — | — | — | (159,675,172 | ) | — | — | — | (159,675,172 | ) | ||||||||||||||||||||||
| Reserve Technical Bulletin No. 72 | — | — | (56,695,443 | ) | — | — | — | — | (56,695,443 | ) | ||||||||||||||||||||||
| Cumulative translation adjustment | — | — | (115,113,442 | ) | — | — | — | — | (115,113,442 | ) | ||||||||||||||||||||||
| Price-level restatement | 178,731,046 | 12,737,192 | (17,637,331 | ) | 27,842,117 | — | (190,784 | ) | — | 201,482,240 | ||||||||||||||||||||||
| Interim dividend | — | — | — | — | — | (17,343,973 | ) | — | (17,343,973 | ) | ||||||||||||||||||||||
| Net income for the year | — | — | — | — | — | — | 188,376,410 | 188,376,410 | ||||||||||||||||||||||||
| As of December 31, 2007 | 2,594,015,458 | 184,861,405 | (435,491,419 | ) | 388,982,534 | — | (17,534,757 | ) | 188,376,410 | 2,903,209,631 | ||||||||||||||||||||||
| As of December 31, 2007 (2) | 5,220,502 | 372,037 | (876,434 | ) | 782,834 | — | (35,289 | ) | 379,111 | 5,842,761 | ||||||||||||||||||||||
| (1) | Restated in thousands of constant Chilean pesos as of December 31, 2007. | |
| (2) | Expressed in thousands of US$ as of December 31, 2007 |
| Years ended December 31, | ||||||||||||
| 2005 | 2006 | 2007 | ||||||||||
| ThCh$ | ThCh$ | ThCh$ | ||||||||||
| Dividends received | 94,343,388 | 136,940,476 | 188,142,044 | |||||||||
ThCh$ 1,171,236,566.
F - 189
Table of Contents
| Exhibit | Description | |
| 1.1 | By-laws (Estatutos) of Enersis, as amended.* | |
| 1.2 | By-laws (Estatutos) of ENERSIS S.A., as amended (English translation).* | |
| 4.1 | Assignment of Rights Contract, dated January 27, 2004, between Endesa Internacional S.A. and Enersis (Spanish version).** | |
| 4.2 | Assignment of Rights Contract, dated January 27, 2004, between Endesa Internacional S.A. and Enersis (English version).** | |
| 8.1 | List of Subsidiaries as of December 31, 2006. | |
| 12.1 | Certification of Chief Executive Officer pursuant to Section 302 of the Sarbanes-Oxley Act. | |
| 12.2 | Certification of Chief Financial Officer pursuant to Section 302 of the Sarbanes-Oxley Act. | |
| 13.1 | Certification of Chief Executive Officer and Chief Financial Officer pursuant to Section 906 of the Sarbanes-Oxley Act. |
| * | Incorporated by reference to Enersis annual report on Form 20-F for the year ended December 31, 2006 filed with the Securities and Exchange Commission on May 14, 2007. | |
| ** | Incorporated by reference to Enersis annual report on Form 20-F for the year ended December 31, 2004 filed with the Securities and Exchange Commission on June 10, 2005. |